Ambient air quality report 2019-2020 - Yara Australia
33
Ambient Air Quality Monitoring Report 2020-2021 EPBC 2008/45546 Yara Pilbara Nitrates Lot 564 and 3017 Village Road Burrup WA 6714 Australia 30 September 2021 61744/140,508 (Rev 0) JBS&G Australia Pty Ltd T/A Strategen-JBS&G
-
Upload
khangminh22 -
Category
Documents
-
view
0 -
download
0
Transcript of Ambient air quality report 2019-2020 - Yara Australia
Ambient Air Quality Monitoring Report 2020-2021
EPBC 2008/45546
Yara Pilbara Nitrates Lot 564 and 3017 Village Road
Burrup WA 6714 Australia
30 September 2021
61744/140,508 (Rev 0)
JBS&G Australia Pty Ltd T/A Strategen-JBS&G
©JBS&G Australia Pty Ltd T/A Strategen-JBS&G | 61744/140,508 (Rev 0) ii
Table of Contents
Abbreviations and definitions ................................................................................................. iv
1. Introduction ................................................................................................................... 1
2. Scope of monitoring program ....................................................................................... 1
3. TAN Plant operation 2020-2021 .................................................................................... 3
4. Air quality monitoring program ..................................................................................... 3
4.1 Gases (NH3, NO2, SO2 and HNO3) ...................................................................... 3
4.1.1 Results of NH3, NO2, SO2 and HNO3 monitoring ................................ 3
4.1.2 Analysis of NH3, NO2 and SO2 data ..................................................... 5
4.1.3 Dry deposition rates - gases ................................................................. 7
4.2 Total suspended particulates .............................................................................. 9
4.2.1 Results of TSP monitoring 2020-2021 .................................................. 9
4.3 Dust deposition ................................................................................................. 12
4.3.1 Results from monitoring deposited dust for 2020-2021 ................... 12
4.3.2 Analysis of dust deposition data ........................................................ 12
5. Dry deposition rate investigation and actions ............................................................. 15
5.1 Investigation ...................................................................................................... 15
6. Concluding remarks ..................................................................................................... 19
7. References ................................................................................................................... 21
List of Tables Table 1: Descriptive statistics for NH3 concentrations (2020-2021 and baseline) ................. 5
Table 2: Descriptive statistics for NO2 monitoring (2020-2021 and baseline) ....................... 5
Table 3: Descriptive statistics for SO2 monitoring (2020-2021 and baseline) ........................ 5
Table 4: Descriptive statistics for HNO3 monitoring (2020-2021 and baseline) .................... 6
Table 5: T-test results for comparison of 2020-2021 and baseline NH3, NO2, SO2 and HNO3 concentration data ................................................................................. 6
Table 6: Analysis of NH3, NO2, SO2 and HNO3 concentration data ....................................... 6
Table 7: Annual dry deposition rates ....................................................................................... 8
Table 8: Descriptive statistics for TSP monitoring 2018 to 2021 – all sites .......................... 11
Table 9: Results of dust deposition monitoring 2020-2021 .................................................. 12
Table 10: Descriptive statistics for dust deposition monitoring 2020-2021 and baseline study ............................................................................................................... 12
Table 11: Findings from investigation into elevated deposition rates .................................. 18
List of Figures Figure 1: Condition 9A of EPBC Approval 2008/4546 (as varied 12 September 2017)
Figure 2: Measured NH3 concentrations for 1 July 2020 to 30 June 2021
Figure 3: Measured NO2 concentrations for 1 July 2020 to 30 June 2021
Figure 4: Measured SO2 concentrations for 1 July 2020 to 30 June 2021
Figure 5: Measured HNO3 concentrations for 1 July 2020 to 30 June 2021
Figure 6: Annual deposition rates from measured gases (2013-2021)
Figure 7: Burrup Road dry deposition composition
Figure 8: Water Tanks dry deposition rates
Figure 9: Deep Gorge dry deposition rates
Figure 10: Measured TSP concentrations for 2020-2021
Figure 11: Comparison of average TSP concentrations for 2020 to 2021 with previous years’ and baseline data
Figure 12: Deposited dust average insoluble fraction 2020-2021
Figure 13: Deposited dust insoluble fraction 2020-2021
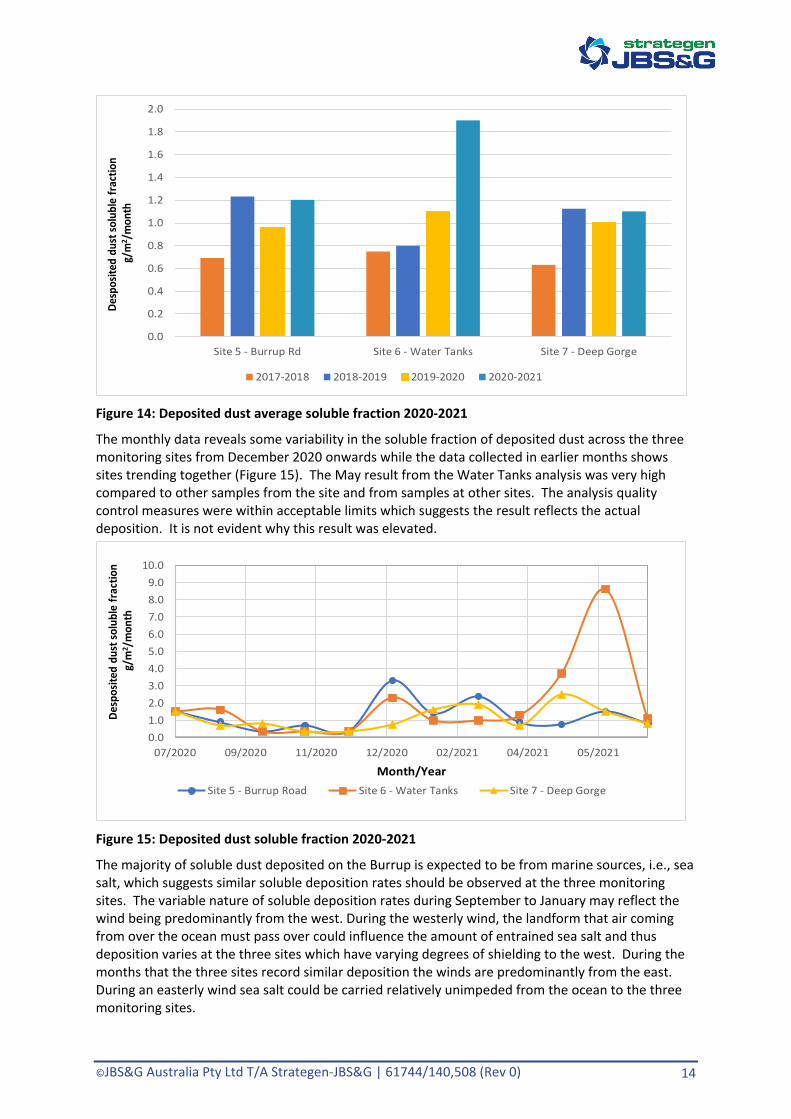
Figure 14: Deposited dust average soluble fraction 2020-2021
Figure 15: Deposited dust soluble fraction 2020-2021
Figure 16: Monthly rolling annual total and individual gas dry deposition rates – Burrup Road
Figure 17: Monthly total and individual gas dry deposition rates – Burrup Road
Figure 18: Monthly rolling annual total and individual gas dry deposition rates – Water Tanks
Figure 19: Monthly rolling annual total and individual gas dry deposition rates – Deep Gorge
Figure 20: Monthly total and individual gas dry deposition rates – Deep Gorge
Appendices Appendix A Results from monitoring of gases for 2020-2021
Appendix B Results from monitoring of TSP for 2020-2021
Appendix C Results from dust deposition monitoring 2020-2021

©JBS&G Australia Pty Ltd T/A Strategen-JBS&G | 61744/140,508 (Rev 0) iv
Abbreviations and definitions
Term Definition Description and context for this report µm Micrometre One millionth (0.000001) of a metre CSIRO The Commonwealth Scientific and
Industrial Research Organisation The Commonwealth Scientific and Industrial Research Organisation is an independent Australian federal government agency responsible for scientific research.
EPBC Environment Protection and Biodiversity Conservation
Refers to the Australian Government EPBC Act of 1999
Insoluble fraction Component of deposited dust that is not soluble in water
Deposited dust can comprise of aqueous soluble and insoluble materials depending on mechanisms and sources of dust emissions. The insoluble fraction is typically derived from crustal materials.
MicroVol MicroVol 1100 low volume sampler
Low volume air sampling instrument for sampling of TSP, manufactured by Ecotech
NH3 Ammonia Gaseous air pollutant from natural sources and industrial sources (including YPN TAN Plant)
NO2 Nitrogen dioxide Gaseous air pollutant from combustion sources OEMP Operational Environmental
Management Plan Management plan prepared by YPN in accordance with Condition 7 of the EPBC Approval (as varied on 12 September 2017)
Passive sampling Ambient air sampling for gaseous substances involving passive samplers
Sampling technique whereby airborne gaseous pollutants are extracted from the air column onto an adsorbent material via a diffusive mechanism
PM10 Particulate matter (10 micrometre)
Dust particles which are present in ambient air with equivalent aerodynamic diameter of 10 micrometres (µm)
Radiello® passive sampler
Sampler for gaseous substances in ambient air
Sampling devices manufactured by Sigma Aldrich under licence from Fondazione Salvatore Maugeri IRCCS for passively monitoring airborne concentrations of gases
SO2 Sulfur dioxide Gaseous air pollutant from oxidation (combustion) of sulfur containing substances
Soluble fraction Component of deposited dust that is soluble in water
Deposited dust can comprise of aqueous soluble and insoluble materials depending on mechanisms and sources of dust emissions. The soluble fraction is typically derived from marine aerosols
TAN Plant Technical Ammonium Nitrate Plant
YPN plant on the Burrup for production of ammonium nitrate
TSP Total suspended particulates Dust particles which are present in ambient air with equivalent aerodynamic diameter of 50 micrometres (µm)
YPN Yara Pilbara Nitrates The operator of the TAN Plant
©JBS&G Australia Pty Ltd T/A Strategen-JBS&G | 61744/140,508 (Rev 0) 1
1. Introduction
Conditions 9 and 9A of EPBC Approval 2008/4546 (as varied on 12 September 2017) for the Yara Pilbara Nitrates Pty Ltd (YPN) Technical Ammonium Nitrate (TAN) Plant require monitoring of various air quality parameters. Condition 3 of the EPBC Approval outlines reporting requirements, including an analysis of monitoring data from the monitoring program conducted under condition 9A. This report is provided in response to Condition 3(a) of the EPBC Approval for the reporting period 1 July 2020 to 30 June 2021.
2. Scope of monitoring program
EPBC Approval 2008/4546 required baseline monitoring to be conducted for a period of not less than 24 months from commencement of construction of the TAN Plant. YPN issued a report to the Department of the Environment and Energy on 16 June 2017 in compliance with requirements of Conditions 9(a), (b), (c) and (d) (YPN 2017).
Condition 9A of EPBC Approval 2008/4546 (as varied 12 September 2017) informed the scope of the ongoing monitoring program and is reproduced below (Figure 1).
9A. To protect the values of the Dampier Archipelago (including Burrup Peninsula) National Heritage Place, particularly the rock art sites, the person taking the action must ensure:
a) Ongoing air quality monitoring is undertaken within 30 days after this condition comes into effect (the date the relevant variation to conditions notice is signed) and until expiry of the approval.
b) Air quality monitoring parameters are monitored at the rock art sites: Site 5 (Burrup Road), Site 6 (Water tanks site) and Site 7 (Deep Gorge site) as shown in Attachment 2.
c) Monitoring of air quality at rock art sites is undertaken by a suitably qualified person (Air Quality)
The air quality monitoring parameters in the table below must be monitored at the frequencies indicated in the table below:
Element of air quality to be monitored
Specific air quality parameter to be sampled
Minimum frequency of monitoring
Ambient air concentration of gases
NH3 (ammonia) Continuous monitoring for at least 14 consecutive days, every month
NO2 (nitrogen oxide) SO2 (sulfur oxide)
Airborne particulate concentration
Total suspended particulates up to 50 µm (TSP)
Every 6 days
Deposited dust
Total dust deposition per month (Insoluble Fraction) Quarterly
Total dust deposition per month (Soluble Fraction)
Figure 1: Condition 9A of EPBC Approval 2008/4546 (as varied 12 September 2017)
Condition 3(a)i of EPBC Approval 2008/4546 (as varied 12 September 2017) requires (in part) publication of a report that includes “...an analysis of monitoring data required under Condition 9A…”.
Note that earlier studies carried out by CSIRO included monitoring of gaseous nitric acid (HNO3). The EPBC Approval does not require monitoring of this substance. However, as described in the Operational Environmental Management Plan (OEMP) prepared by YPN for the EPBC Approval, YPN

©JBS&G Australia Pty Ltd T/A Strategen-JBS&G | 61744/140,508 (Rev 0) 2
has continued monitoring of HNO3 since the CSIRO studies concluded. This allows for direct comparisons of current deposition rates with the rates determined since 2003.
The initial report for analysis of the monitoring data as required by the EPBC Approval was issued in October 2018 for the period 2017-2018 (Strategen 2018), a report for the period 2018-2019 was issued in October 2019 (Strategen-JBS&G 2019) and for the period 2019-2020 was issued in October 2020 (Strategen-JBS&G 2020). This report presents an analysis of monitoring data obtained for the monitoring period 1 July 2020 to 30 June 2021 (referred to herein as 2020-2021).
©JBS&G Australia Pty Ltd T/A Strategen-JBS&G | 61744/140,508 (Rev 0) 3
3. TAN Plant operation 2020-2021
The TAN Plant operated between the start of reporting period to 22 July 2020, 28 July to 12 September 2020, 27 September 2020 to the 26 January 2021, 5 February 2021 to the 13 March 2021, 24 March 2021 to the 1 June 2021 and was restarted on the 13 June 2021 and then remained online to the end of the reporting period. No air emissions from the plant were recorded outside those operating periods.
4. Air quality monitoring program
4.1 Gases (NH3, NO2, SO2 and HNO3)
4.1.1 Results of NH3, NO2, SO2 and HNO3 monitoring
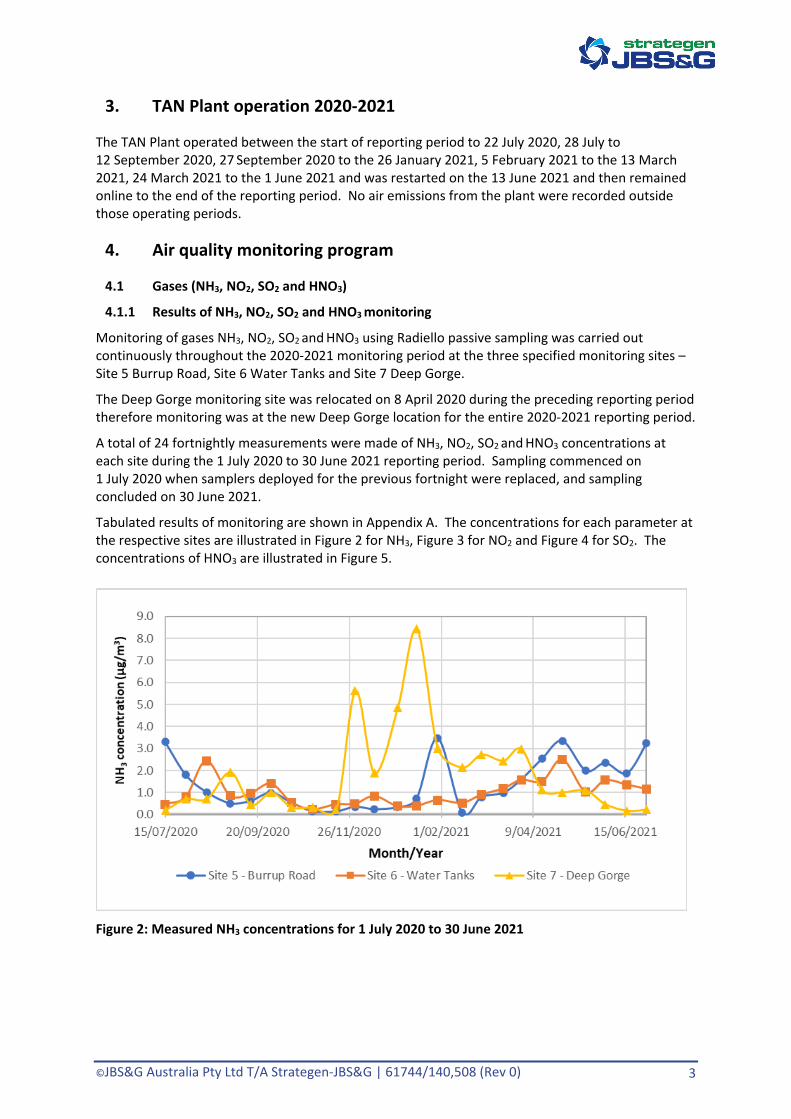
Monitoring of gases NH3, NO2, SO2 and HNO3 using Radiello passive sampling was carried out continuously throughout the 2020-2021 monitoring period at the three specified monitoring sites – Site 5 Burrup Road, Site 6 Water Tanks and Site 7 Deep Gorge.
The Deep Gorge monitoring site was relocated on 8 April 2020 during the preceding reporting period therefore monitoring was at the new Deep Gorge location for the entire 2020-2021 reporting period.
A total of 24 fortnightly measurements were made of NH3, NO2, SO2 and HNO3 concentrations at each site during the 1 July 2020 to 30 June 2021 reporting period. Sampling commenced on 1 July 2020 when samplers deployed for the previous fortnight were replaced, and sampling concluded on 30 June 2021.
Tabulated results of monitoring are shown in Appendix A. The concentrations for each parameter at the respective sites are illustrated in Figure 2 for NH3, Figure 3 for NO2 and Figure 4 for SO2. The concentrations of HNO3 are illustrated in Figure 5.
Figure 2: Measured NH3 concentrations for 1 July 2020 to 30 June 2021
©JBS&G Australia Pty Ltd T/A Strategen-JBS&G | 61744/140,508 (Rev 0) 4
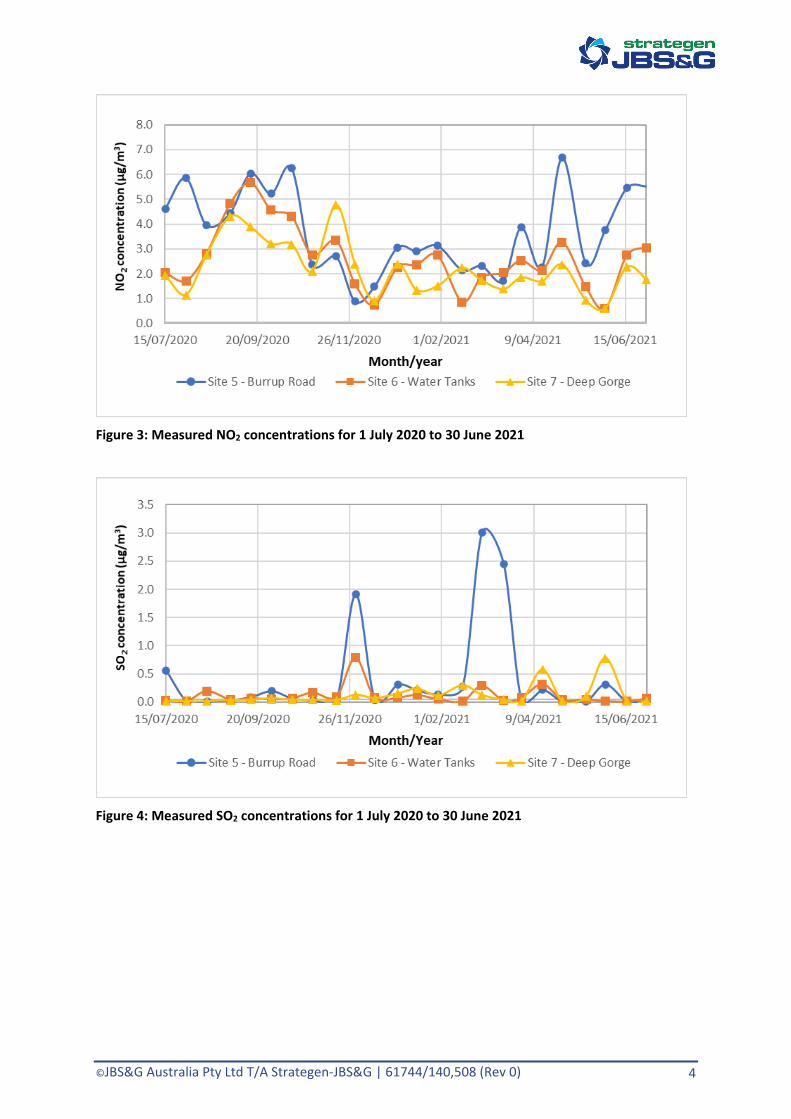
Figure 3: Measured NO2 concentrations for 1 July 2020 to 30 June 2021
Figure 4: Measured SO2 concentrations for 1 July 2020 to 30 June 2021
©JBS&G Australia Pty Ltd T/A Strategen-JBS&G | 61744/140,508 (Rev 0) 5
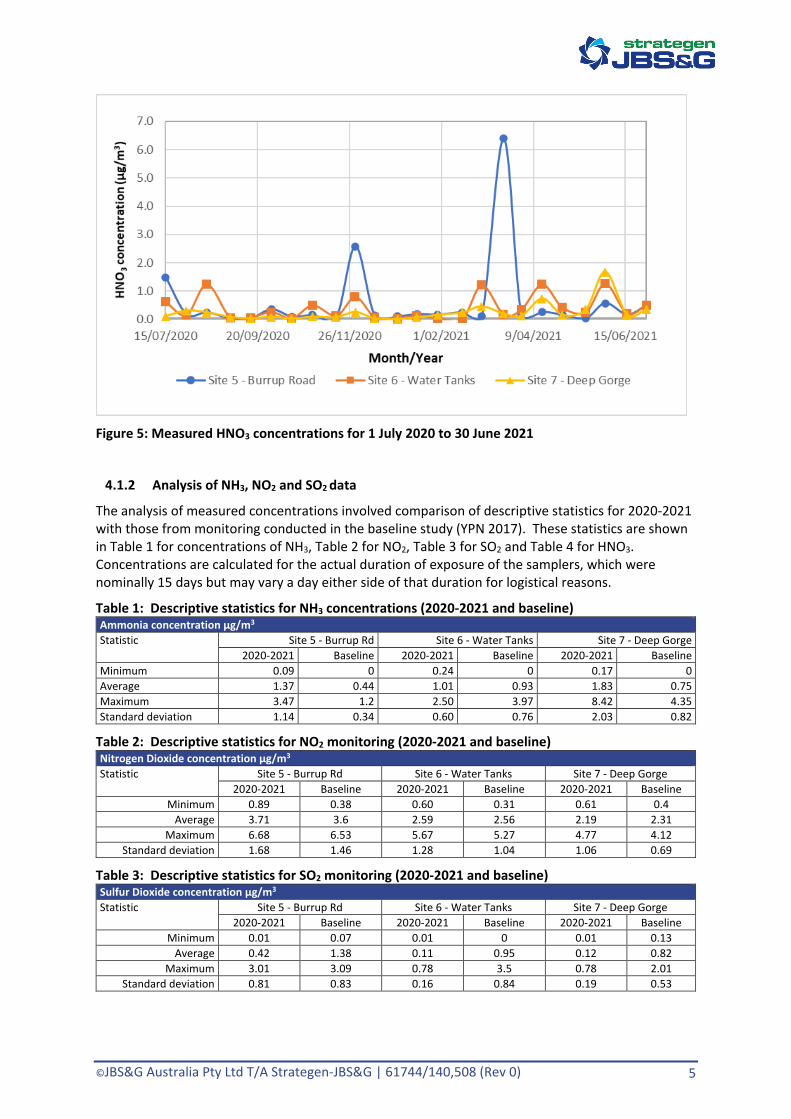
Figure 5: Measured HNO3 concentrations for 1 July 2020 to 30 June 2021
4.1.2 Analysis of NH3, NO2 and SO2 data
The analysis of measured concentrations involved comparison of descriptive statistics for 2020-2021 with those from monitoring conducted in the baseline study (YPN 2017). These statistics are shown in Table 1 for concentrations of NH3, Table 2 for NO2, Table 3 for SO2 and Table 4 for HNO3. Concentrations are calculated for the actual duration of exposure of the samplers, which were nominally 15 days but may vary a day either side of that duration for logistical reasons.
Table 1: Descriptive statistics for NH3 concentrations (2020-2021 and baseline) Ammonia concentration µg/m3 Statistic Site 5 - Burrup Rd Site 6 - Water Tanks Site 7 - Deep Gorge
2020-2021 Baseline 2020-2021 Baseline 2020-2021 Baseline Minimum 0.09 0 0.24 0 0.17 0 Average 1.37 0.44 1.01 0.93 1.83 0.75 Maximum 3.47 1.2 2.50 3.97 8.42 4.35 Standard deviation 1.14 0.34 0.60 0.76 2.03 0.82
Table 2: Descriptive statistics for NO2 monitoring (2020-2021 and baseline) Nitrogen Dioxide concentration µg/m3 Statistic Site 5 - Burrup Rd Site 6 - Water Tanks Site 7 - Deep Gorge
2020-2021 Baseline 2020-2021 Baseline 2020-2021 Baseline Minimum 0.89 0.38 0.60 0.31 0.61 0.4
Average 3.71 3.6 2.59 2.56 2.19 2.31 Maximum 6.68 6.53 5.67 5.27 4.77 4.12
Standard deviation 1.68 1.46 1.28 1.04 1.06 0.69
Table 3: Descriptive statistics for SO2 monitoring (2020-2021 and baseline) Sulfur Dioxide concentration µg/m3 Statistic Site 5 - Burrup Rd Site 6 - Water Tanks Site 7 - Deep Gorge
2020-2021 Baseline 2020-2021 Baseline 2020-2021 Baseline Minimum 0.01 0.07 0.01 0 0.01 0.13
Average 0.42 1.38 0.11 0.95 0.12 0.82 Maximum 3.01 3.09 0.78 3.5 0.78 2.01
Standard deviation 0.81 0.83 0.16 0.84 0.19 0.53
©JBS&G Australia Pty Ltd T/A Strategen-JBS&G | 61744/140,508 (Rev 0) 6
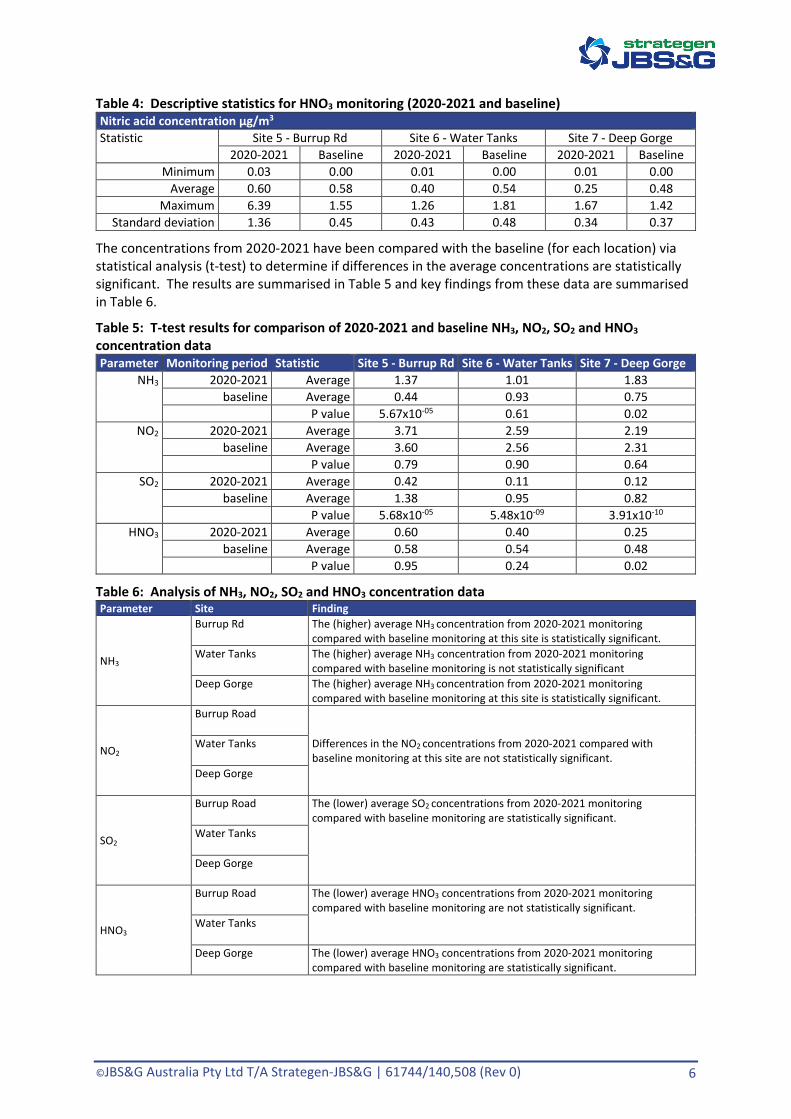
Table 4: Descriptive statistics for HNO3 monitoring (2020-2021 and baseline) Nitric acid concentration µg/m3 Statistic Site 5 - Burrup Rd Site 6 - Water Tanks Site 7 - Deep Gorge
2020-2021 Baseline 2020-2021 Baseline 2020-2021 Baseline Minimum 0.03 0.00 0.01 0.00 0.01 0.00
Average 0.60 0.58 0.40 0.54 0.25 0.48 Maximum 6.39 1.55 1.26 1.81 1.67 1.42
Standard deviation 1.36 0.45 0.43 0.48 0.34 0.37
The concentrations from 2020-2021 have been compared with the baseline (for each location) via statistical analysis (t-test) to determine if differences in the average concentrations are statistically significant. The results are summarised in Table 5 and key findings from these data are summarised in Table 6.
Table 5: T-test results for comparison of 2020-2021 and baseline NH3, NO2, SO2 and HNO3 concentration data Parameter Monitoring period Statistic Site 5 - Burrup Rd Site 6 - Water Tanks Site 7 - Deep Gorge
NH3 2020-2021 Average 1.37 1.01 1.83 baseline Average 0.44 0.93 0.75
P value 5.67x10-05 0.61 0.02 NO2 2020-2021 Average 3.71 2.59 2.19
baseline Average 3.60 2.56 2.31 P value 0.79 0.90 0.64
SO2 2020-2021 Average 0.42 0.11 0.12 baseline Average 1.38 0.95 0.82
P value 5.68x10-05 5.48x10-09 3.91x10⁻¹⁰ HNO3 2020-2021 Average 0.60 0.40 0.25
baseline Average 0.58 0.54 0.48 P value 0.95 0.24 0.02
Table 6: Analysis of NH3, NO2, SO2 and HNO3 concentration data Parameter Site Finding
NH3
Burrup Rd The (higher) average NH3 concentration from 2020-2021 monitoring compared with baseline monitoring at this site is statistically significant.
Water Tanks The (higher) average NH3 concentration from 2020-2021 monitoring compared with baseline monitoring is not statistically significant
Deep Gorge The (higher) average NH3 concentration from 2020-2021 monitoring compared with baseline monitoring at this site is statistically significant.
NO2
Burrup Road
Differences in the NO2 concentrations from 2020-2021 compared with baseline monitoring at this site are not statistically significant.
Water Tanks
Deep Gorge
SO2
Burrup Road The (lower) average SO2 concentrations from 2020-2021 monitoring compared with baseline monitoring are statistically significant.
Water Tanks
Deep Gorge
HNO3
Burrup Road The (lower) average HNO3 concentrations from 2020-2021 monitoring compared with baseline monitoring are not statistically significant.
Water Tanks
Deep Gorge The (lower) average HNO3 concentrations from 2020-2021 monitoring compared with baseline monitoring are statistically significant.
©JBS&G Australia Pty Ltd T/A Strategen-JBS&G | 61744/140,508 (Rev 0) 7
The average concentrations of NH3 detected at Water Tanks during 2020-2021 were determined to be statistically insignificant from the baseline dataset. The higher NH3 levels measured at Burrup Road and Deep Gorge, however, were determined to be statistically significant. Elevated NH3 levels detected in November and January did not coincide with TAN Plant start up periods when elevated emissions may occur, suggesting other source(s) of ammonia may have contributed to the ambient concentrations.
The differences in average concentrations of NO2 at all three sites recorded during 2020-2021 and baseline were not statistically significant.
Continuing from previous years statistically significant decreases in the SO2 concentrations recorded during the 2020-2021 monitoring period compared with the baseline study were determined for all three monitoring sites (Table 5). The reasons for the apparent decrease in average SO2 concentrations since the baseline data was recorded is not known but may reflect a reduced frequency of flaring at the gas plants on the Burrup Peninsula or use of lower sulfur fuels in ships that visit the Dampier port.
The reason for a statistically significant decrease in the HNO3 concentrations recorded at Deep Gorge during the 2020-2021 monitoring period relative to the baseline study is unknown (Table 5).
4.1.3 Dry deposition rates - gases
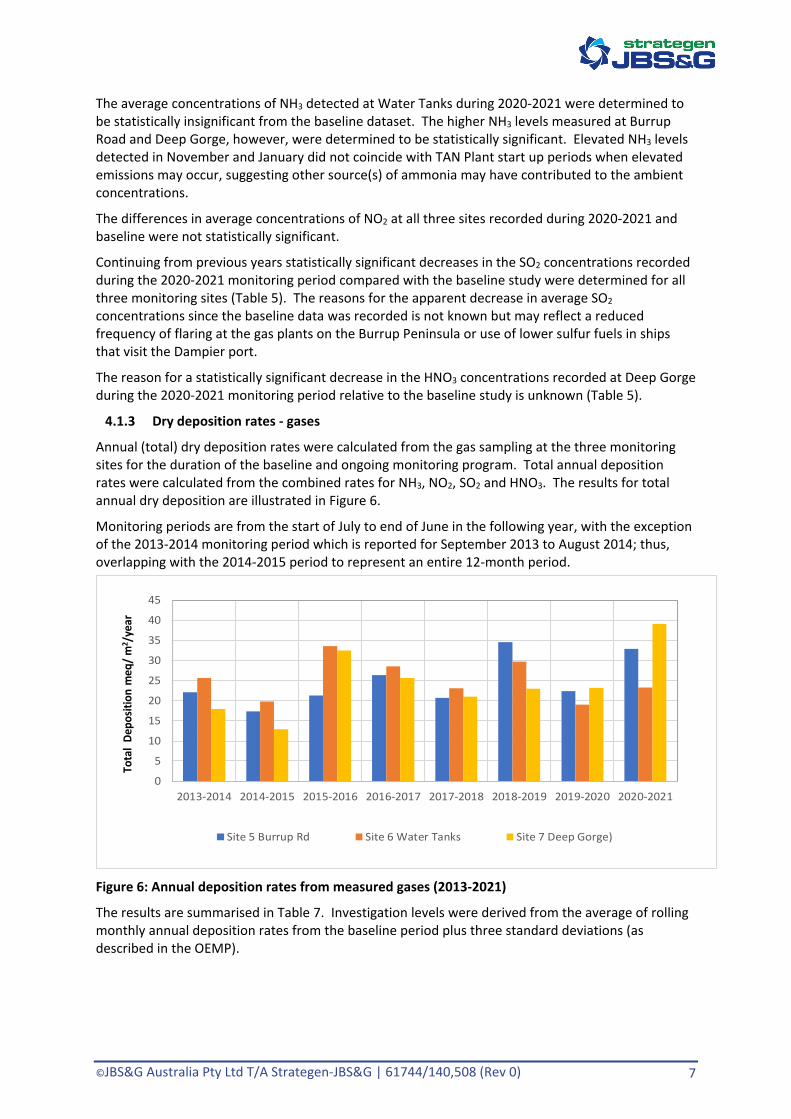
Annual (total) dry deposition rates were calculated from the gas sampling at the three monitoring sites for the duration of the baseline and ongoing monitoring program. Total annual deposition rates were calculated from the combined rates for NH3, NO2, SO2 and HNO3. The results for total annual dry deposition are illustrated in Figure 6.
Monitoring periods are from the start of July to end of June in the following year, with the exception of the 2013-2014 monitoring period which is reported for September 2013 to August 2014; thus, overlapping with the 2014-2015 period to represent an entire 12-month period.
0
5
10
15
20
25
30
35
40
45
2013-2014 2014-2015 2015-2016 2016-2017 2017-2018 2018-2019 2019-2020 2020-2021
Tota
l De
posit
ion
meq
/ m
2 /ye
ar
Site 5 Burrup Rd Site 6 Water Tanks Site 7 Deep Gorge)
Figure 6: Annual deposition rates from measured gases (2013-2021)
The results are summarised in Table 7. Investigation levels were derived from the average of rolling monthly annual deposition rates from the baseline period plus three standard deviations (as described in the OEMP).
©JBS&G Australia Pty Ltd T/A Strategen-JBS&G | 61744/140,508 (Rev 0) 8
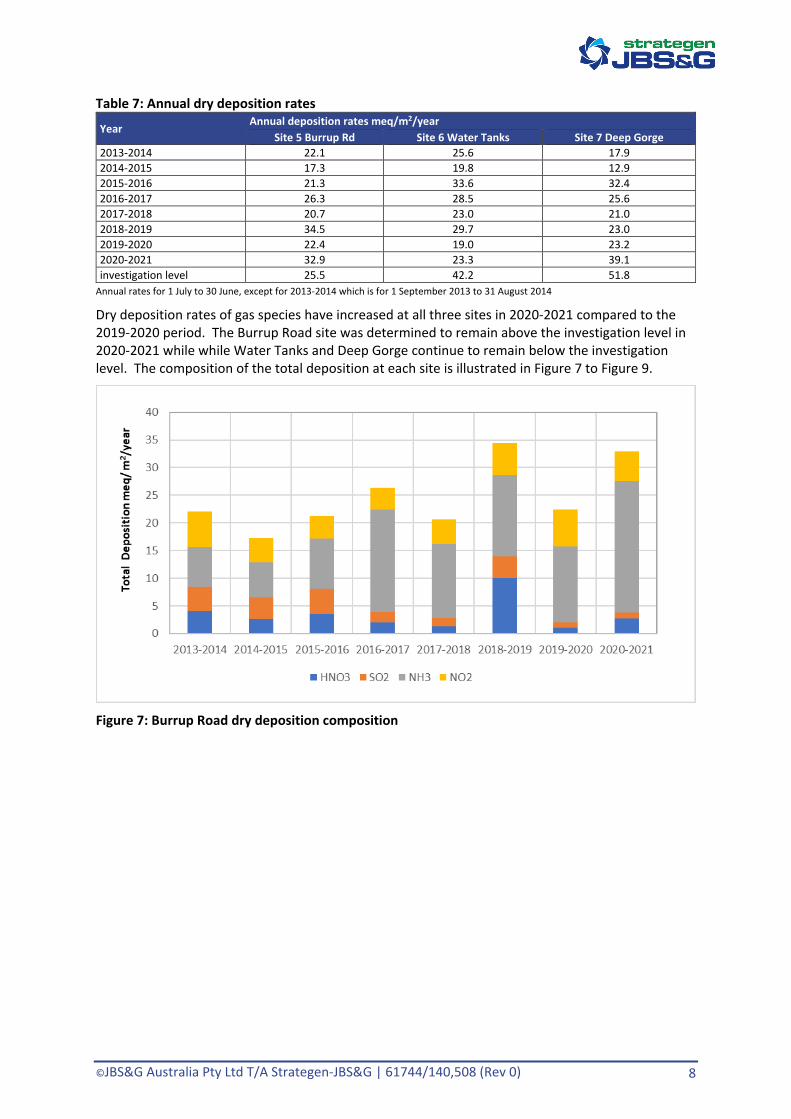
Table 7: Annual dry deposition rates
Year Annual deposition rates meq/m2/year
Site 5 Burrup Rd Site 6 Water Tanks Site 7 Deep Gorge 2013-2014 22.1 25.6 17.9 2014-2015 17.3 19.8 12.9 2015-2016 21.3 33.6 32.4 2016-2017 26.3 28.5 25.6 2017-2018 20.7 23.0 21.0 2018-2019 34.5 29.7 23.0 2019-2020 22.4 19.0 23.2 2020-2021 32.9 23.3 39.1 investigation level 25.5 42.2 51.8
Annual rates for 1 July to 30 June, except for 2013-2014 which is for 1 September 2013 to 31 August 2014
Dry deposition rates of gas species have increased at all three sites in 2020-2021 compared to the 2019-2020 period. The Burrup Road site was determined to remain above the investigation level in 2020-2021 while while Water Tanks and Deep Gorge continue to remain below the investigation level. The composition of the total deposition at each site is illustrated in Figure 7 to Figure 9.
Figure 7: Burrup Road dry deposition composition
©JBS&G Australia Pty Ltd T/A Strategen-JBS&G | 61744/140,508 (Rev 0) 9
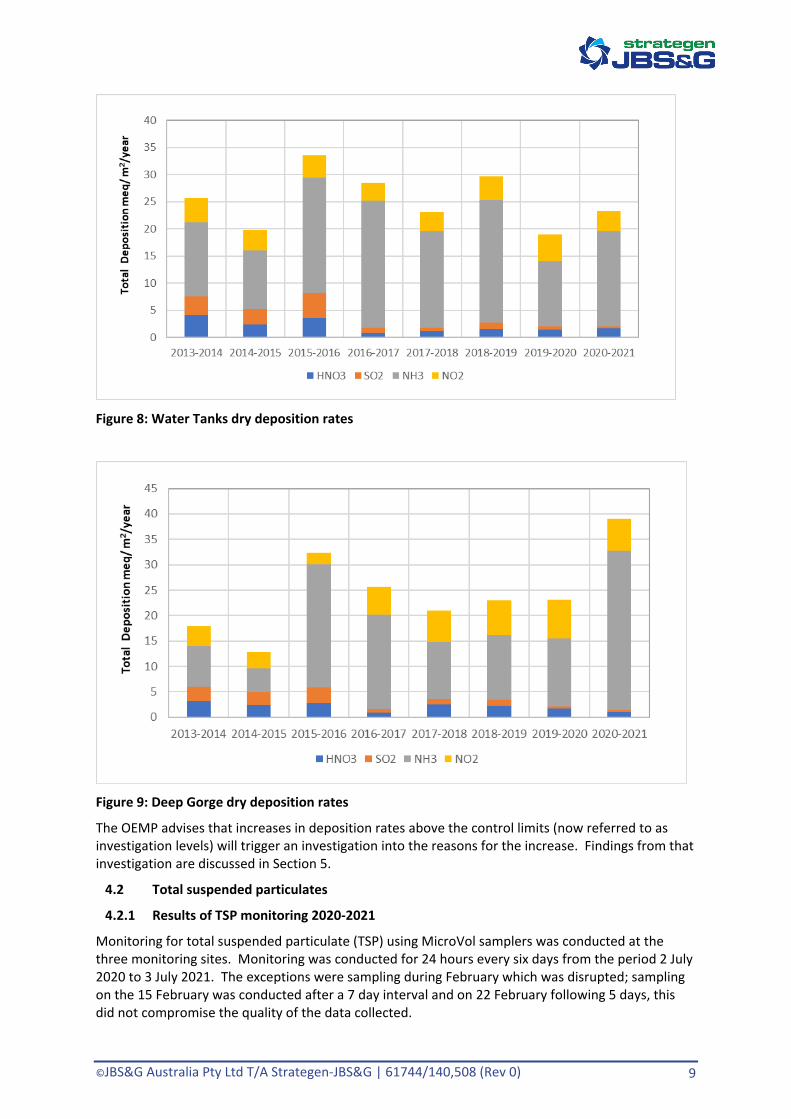
Figure 8: Water Tanks dry deposition rates
Figure 9: Deep Gorge dry deposition rates
The OEMP advises that increases in deposition rates above the control limits (now referred to as investigation levels) will trigger an investigation into the reasons for the increase. Findings from that investigation are discussed in Section 5.
4.2 Total suspended particulates
4.2.1 Results of TSP monitoring 2020-2021
Monitoring for total suspended particulate (TSP) using MicroVol samplers was conducted at the three monitoring sites. Monitoring was conducted for 24 hours every six days from the period 2 July 2020 to 3 July 2021. The exceptions were sampling during February which was disrupted; sampling on the 15 February was conducted after a 7 day interval and on 22 February following 5 days, this did not compromise the quality of the data collected.
©JBS&G Australia Pty Ltd T/A Strategen-JBS&G | 61744/140,508 (Rev 0) 10
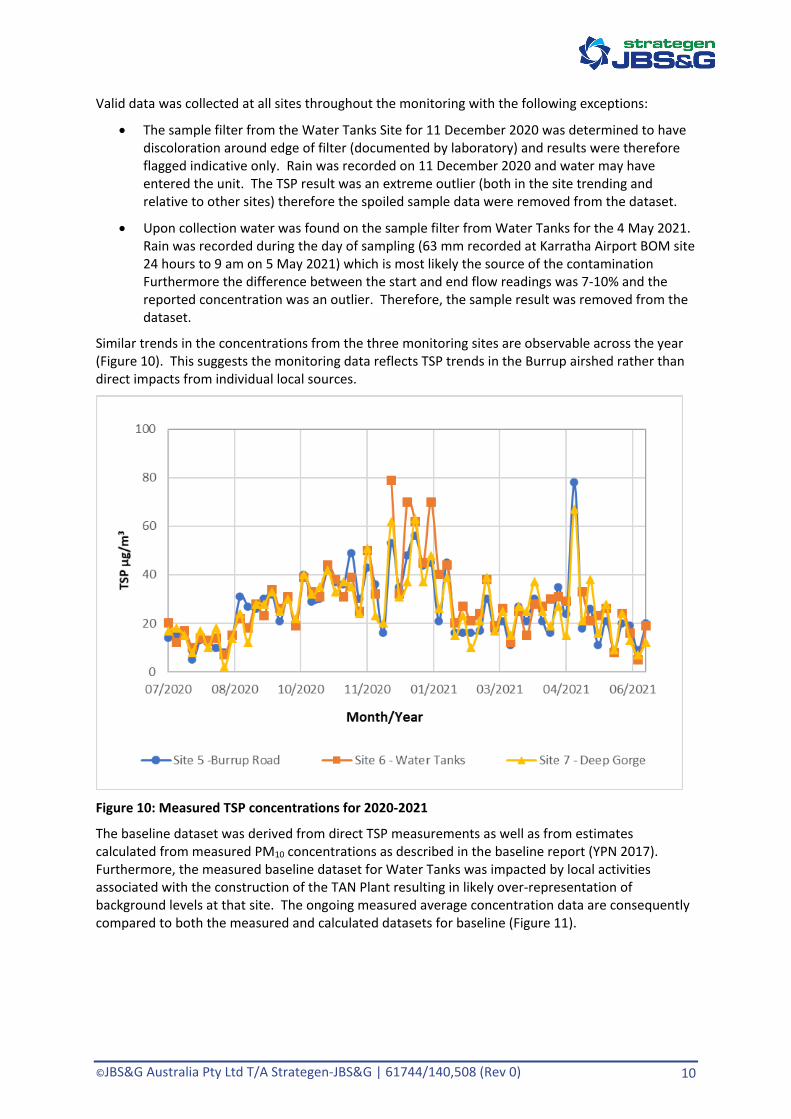
Valid data was collected at all sites throughout the monitoring with the following exceptions:
• The sample filter from the Water Tanks Site for 11 December 2020 was determined to have discoloration around edge of filter (documented by laboratory) and results were therefore flagged indicative only. Rain was recorded on 11 December 2020 and water may have entered the unit. The TSP result was an extreme outlier (both in the site trending and relative to other sites) therefore the spoiled sample data were removed from the dataset.
• Upon collection water was found on the sample filter from Water Tanks for the 4 May 2021. Rain was recorded during the day of sampling (63 mm recorded at Karratha Airport BOM site 24 hours to 9 am on 5 May 2021) which is most likely the source of the contamination Furthermore the difference between the start and end flow readings was 7-10% and the reported concentration was an outlier. Therefore, the sample result was removed from the dataset.
Similar trends in the concentrations from the three monitoring sites are observable across the year (Figure 10). This suggests the monitoring data reflects TSP trends in the Burrup airshed rather than direct impacts from individual local sources.
Figure 10: Measured TSP concentrations for 2020-2021
The baseline dataset was derived from direct TSP measurements as well as from estimates calculated from measured PM10 concentrations as described in the baseline report (YPN 2017). Furthermore, the measured baseline dataset for Water Tanks was impacted by local activities associated with the construction of the TAN Plant resulting in likely over-representation of background levels at that site. The ongoing measured average concentration data are consequently compared to both the measured and calculated datasets for baseline (Figure 11).
©JBS&G Australia Pty Ltd T/A Strategen-JBS&G | 61744/140,508 (Rev 0) 11
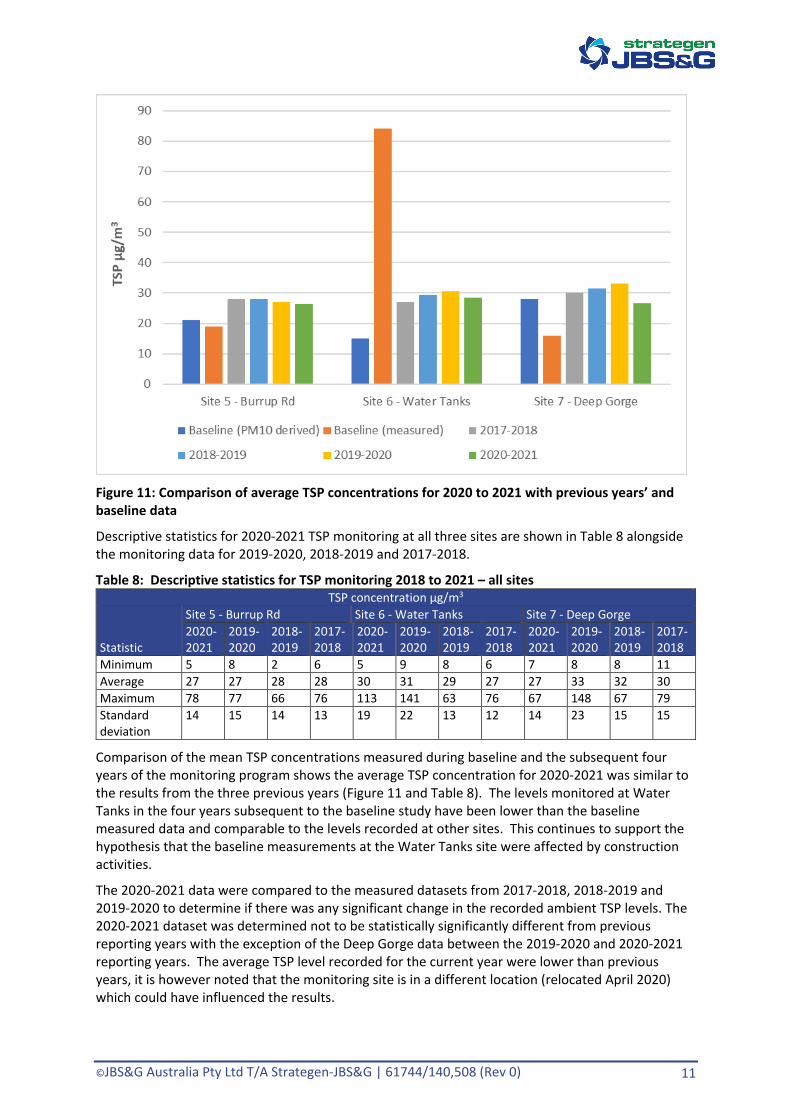
Figure 11: Comparison of average TSP concentrations for 2020 to 2021 with previous years’ and baseline data
Descriptive statistics for 2020-2021 TSP monitoring at all three sites are shown in Table 8 alongside the monitoring data for 2019-2020, 2018-2019 and 2017-2018.
Table 8: Descriptive statistics for TSP monitoring 2018 to 2021 – all sites TSP concentration µg/m3
Statistic
Site 5 - Burrup Rd Site 6 - Water Tanks Site 7 - Deep Gorge 2020-2021
2019-2020
2018-2019
2017-2018
2020-2021
2019-2020
2018-2019
2017-2018
2020-2021
2019-2020
2018-2019
2017-2018
Minimum 5 8 2 6 5 9 8 6 7 8 8 11 Average 27 27 28 28 30 31 29 27 27 33 32 30 Maximum 78 77 66 76 113 141 63 76 67 148 67 79 Standard deviation
14 15 14 13 19 22 13 12 14 23 15 15
Comparison of the mean TSP concentrations measured during baseline and the subsequent four years of the monitoring program shows the average TSP concentration for 2020-2021 was similar to the results from the three previous years (Figure 11 and Table 8). The levels monitored at Water Tanks in the four years subsequent to the baseline study have been lower than the baseline measured data and comparable to the levels recorded at other sites. This continues to support the hypothesis that the baseline measurements at the Water Tanks site were affected by construction activities.
The 2020-2021 data were compared to the measured datasets from 2017-2018, 2018-2019 and 2019-2020 to determine if there was any significant change in the recorded ambient TSP levels. The 2020-2021 dataset was determined not to be statistically significantly different from previous reporting years with the exception of the Deep Gorge data between the 2019-2020 and 2020-2021 reporting years. The average TSP level recorded for the current year were lower than previous years, it is however noted that the monitoring site is in a different location (relocated April 2020) which could have influenced the results.
©JBS&G Australia Pty Ltd T/A Strategen-JBS&G | 61744/140,508 (Rev 0) 12
4.3 Dust deposition
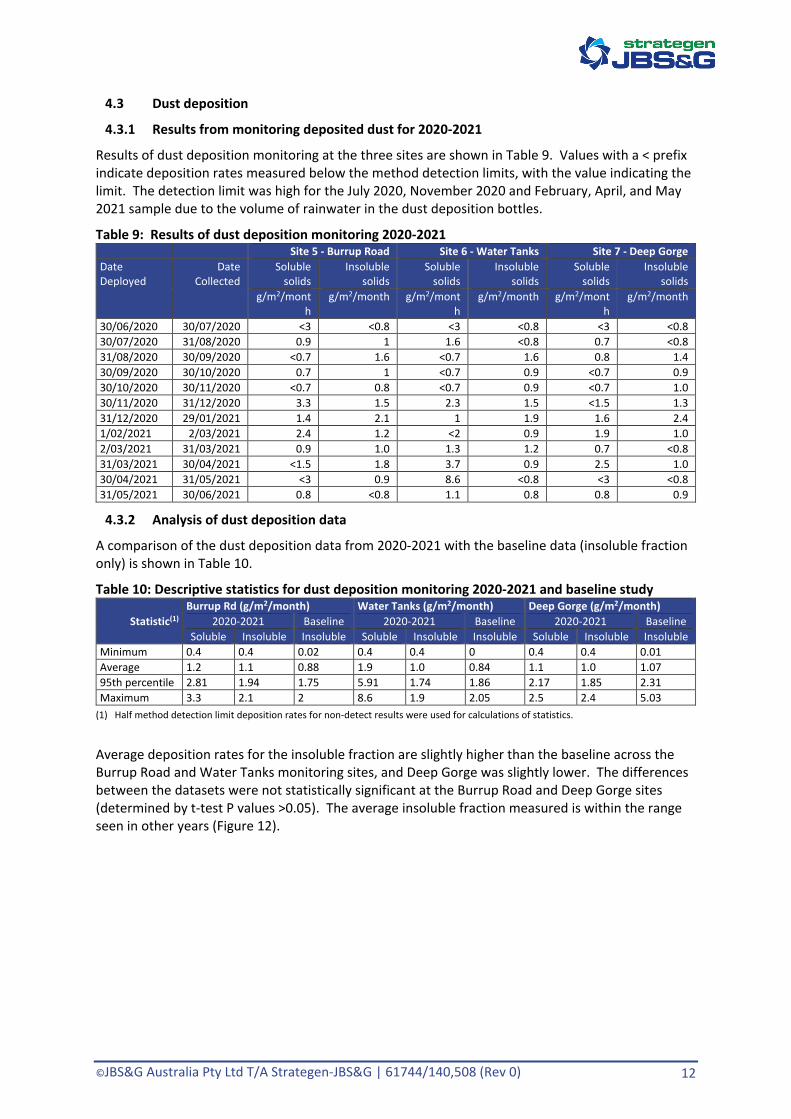
4.3.1 Results from monitoring deposited dust for 2020-2021
Results of dust deposition monitoring at the three sites are shown in Table 9. Values with a < prefix indicate deposition rates measured below the method detection limits, with the value indicating the limit. The detection limit was high for the July 2020, November 2020 and February, April, and May 2021 sample due to the volume of rainwater in the dust deposition bottles.
Table 9: Results of dust deposition monitoring 2020-2021 Site 5 - Burrup Road Site 6 - Water Tanks Site 7 - Deep Gorge Date Deployed
Date Collected
Soluble solids
Insoluble solids
Soluble solids
Insoluble solids
Soluble solids
Insoluble solids
g/m2/month
g/m2/month g/m2/month
g/m2/month g/m2/month
g/m2/month
30/06/2020 30/07/2020 <3 <0.8 <3 <0.8 <3 <0.8 30/07/2020 31/08/2020 0.9 1 1.6 <0.8 0.7 <0.8 31/08/2020 30/09/2020 <0.7 1.6 <0.7 1.6 0.8 1.4 30/09/2020 30/10/2020 0.7 1 <0.7 0.9 <0.7 0.9 30/10/2020 30/11/2020 <0.7 0.8 <0.7 0.9 <0.7 1.0 30/11/2020 31/12/2020 3.3 1.5 2.3 1.5 <1.5 1.3 31/12/2020 29/01/2021 1.4 2.1 1 1.9 1.6 2.4 1/02/2021 2/03/2021 2.4 1.2 <2 0.9 1.9 1.0 2/03/2021 31/03/2021 0.9 1.0 1.3 1.2 0.7 <0.8 31/03/2021 30/04/2021 <1.5 1.8 3.7 0.9 2.5 1.0 30/04/2021 31/05/2021 <3 0.9 8.6 <0.8 <3 <0.8 31/05/2021 30/06/2021 0.8 <0.8 1.1 0.8 0.8 0.9
4.3.2 Analysis of dust deposition data
A comparison of the dust deposition data from 2020-2021 with the baseline data (insoluble fraction only) is shown in Table 10.
Table 10: Descriptive statistics for dust deposition monitoring 2020-2021 and baseline study
Statistic(1) Burrup Rd (g/m2/month) Water Tanks (g/m2/month) Deep Gorge (g/m2/month)
2020-2021 Baseline 2020-2021 Baseline 2020-2021 Baseline Soluble Insoluble Insoluble Soluble Insoluble Insoluble Soluble Insoluble Insoluble
Minimum 0.4 0.4 0.02 0.4 0.4 0 0.4 0.4 0.01 Average 1.2 1.1 0.88 1.9 1.0 0.84 1.1 1.0 1.07 95th percentile 2.81 1.94 1.75 5.91 1.74 1.86 2.17 1.85 2.31 Maximum 3.3 2.1 2 8.6 1.9 2.05 2.5 2.4 5.03
(1) Half method detection limit deposition rates for non-detect results were used for calculations of statistics.
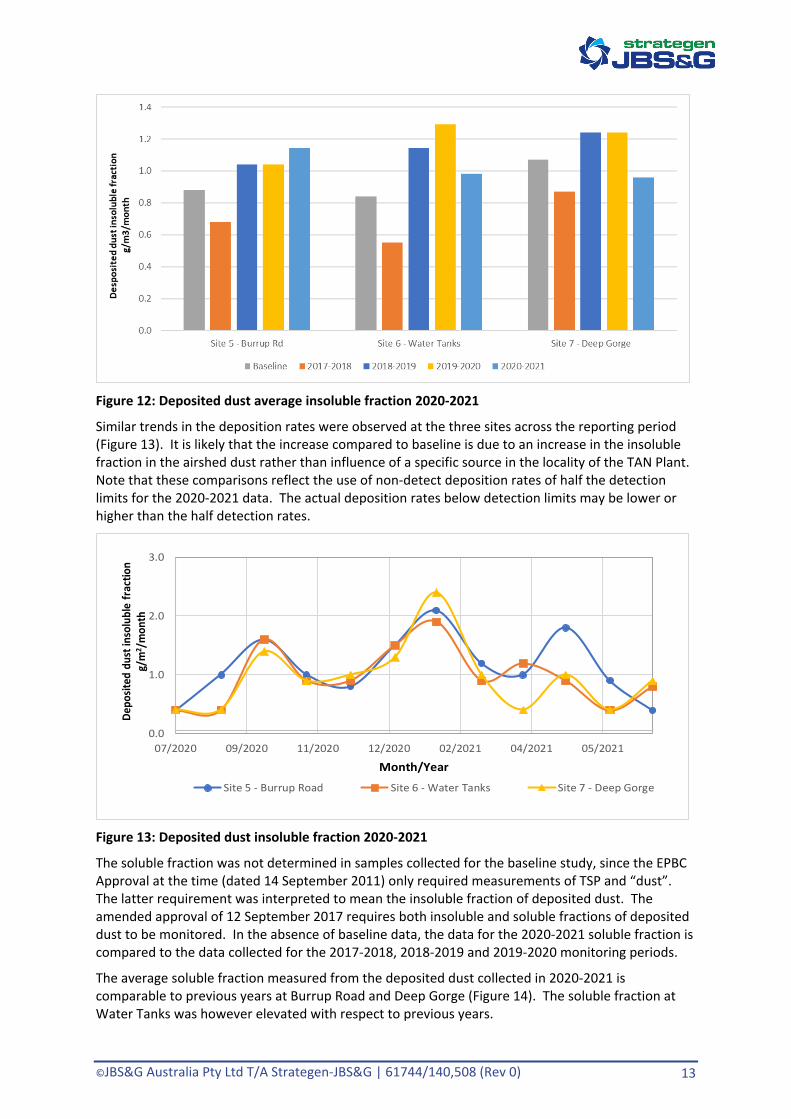
Average deposition rates for the insoluble fraction are slightly higher than the baseline across the Burrup Road and Water Tanks monitoring sites, and Deep Gorge was slightly lower. The differences between the datasets were not statistically significant at the Burrup Road and Deep Gorge sites (determined by t-test P values >0.05). The average insoluble fraction measured is within the range seen in other years (Figure 12).
©JBS&G Australia Pty Ltd T/A Strategen-JBS&G | 61744/140,508 (Rev 0) 13
Figure 12: Deposited dust average insoluble fraction 2020-2021
Similar trends in the deposition rates were observed at the three sites across the reporting period (Figure 13). It is likely that the increase compared to baseline is due to an increase in the insoluble fraction in the airshed dust rather than influence of a specific source in the locality of the TAN Plant. Note that these comparisons reflect the use of non-detect deposition rates of half the detection limits for the 2020-2021 data. The actual deposition rates below detection limits may be lower or higher than the half detection rates.
0.0
1.0
2.0
3.0
07/2020 09/2020 11/2020 12/2020 02/2021 04/2021 05/2021
Depo
sited
dus
t ins
olub
le fr
actio
n g/
m2 /m
onth
Month/Year
Site 5 - Burrup Road Site 6 - Water Tanks Site 7 - Deep Gorge
Figure 13: Deposited dust insoluble fraction 2020-2021
The soluble fraction was not determined in samples collected for the baseline study, since the EPBC Approval at the time (dated 14 September 2011) only required measurements of TSP and “dust”. The latter requirement was interpreted to mean the insoluble fraction of deposited dust. The amended approval of 12 September 2017 requires both insoluble and soluble fractions of deposited dust to be monitored. In the absence of baseline data, the data for the 2020-2021 soluble fraction is compared to the data collected for the 2017-2018, 2018-2019 and 2019-2020 monitoring periods.
The average soluble fraction measured from the deposited dust collected in 2020-2021 is comparable to previous years at Burrup Road and Deep Gorge (Figure 14). The soluble fraction at Water Tanks was however elevated with respect to previous years.
©JBS&G Australia Pty Ltd T/A Strategen-JBS&G | 61744/140,508 (Rev 0) 14
0.0
0.2
0.4
0.6
0.8
1.0
1.2
1.4
1.6
1.8
2.0
Site 5 - Burrup Rd Site 6 - Water Tanks Site 7 - Deep Gorge
Desp
osite
d du
st so
lubl
e fr
actio
ng/
m2 /m
onth
2017-2018 2018-2019 2019-2020 2020-2021
Figure 14: Deposited dust average soluble fraction 2020-2021
The monthly data reveals some variability in the soluble fraction of deposited dust across the three monitoring sites from December 2020 onwards while the data collected in earlier months shows sites trending together (Figure 15). The May result from the Water Tanks analysis was very high compared to other samples from the site and from samples at other sites. The analysis quality control measures were within acceptable limits which suggests the result reflects the actual deposition. It is not evident why this result was elevated.
0.01.02.03.04.05.06.07.08.09.0
10.0
07/2020 09/2020 11/2020 12/2020 02/2021 04/2021 05/2021
Desp
osite
d du
st so
lubl
e fr
actio
ng/
m2 /
mon
th
Month/YearSite 5 - Burrup Road Site 6 - Water Tanks Site 7 - Deep Gorge
Figure 15: Deposited dust soluble fraction 2020-2021
The majority of soluble dust deposited on the Burrup is expected to be from marine sources, i.e., sea salt, which suggests similar soluble deposition rates should be observed at the three monitoring sites. The variable nature of soluble deposition rates during September to January may reflect the wind being predominantly from the west. During the westerly wind, the landform that air coming from over the ocean must pass over could influence the amount of entrained sea salt and thus deposition varies at the three sites which have varying degrees of shielding to the west. During the months that the three sites record similar deposition the winds are predominantly from the east. During an easterly wind sea salt could be carried relatively unimpeded from the ocean to the three monitoring sites.
©JBS&G Australia Pty Ltd T/A Strategen-JBS&G | 61744/140,508 (Rev 0) 15
A confounding factor for soluble deposition at the three sites is the potential for aerosol emissions from the sea-water cooling tower at the adjacent Ammonia Plant and the (smaller) sea-water cooling tower on the NW corner of the TAN Plant. Aerosol emissions (known as “drift”) may occur from the top of the towers if the mist eliminator efficiency declines in the cooling towers or if strong cross-winds occur that mobilise droplets from the sides of the cooling towers. The water in the aerosols is likely to evaporate leaving behind particulate matter (salt) that will deposit in the immediate surrounds of the towers depending on the particle size. If salt particles persist in the air column then they can report to the soluble deposition fraction at the monitoring sites for relevant wind directions.
Note that sea salt deposition is accounted for in the calculation of total deposition rates to facilitate the identification of other sources of particulate matter that can deposit on surfaces in the vicinity of the Ammonia Plant and TAN Plant.
Overall, the levels of dust deposited at the monitoring sites are largely consistent with those observed from the baseline study.
5. Dry deposition rate investigation and actions
5.1 Investigation
As described in Section 4.1.3, the monitoring conducted for 2020-2021 showed dry deposition rates at Burrup Road (32.9 meq/m2/y) that exceeded the investigation levels (25.5 meq/m2/y) established from the baseline study. This outcome has triggered an investigation as per the OEMP.
Key factors examined include trends and contributions of individual gases to the total deposition rates and TAN Plant availability and operation.
Trends in deposition rates since 2014 (as monthly rolling annual total rates) are illustrated in Figure 16. The TAN Plant 2020-2021 operating period is indicated in the graph. Ammonia was the dominant contributor to dry deposition at Burrup Road (Figure 16). Ammonia annual deposition in the seond half of the reporting period exceeded annual deposition rates previously recorded. Monthly deposition rates were comparable to peak deposition rates, typically occuring during May -June, from previous years at Burrup Road (Figure 17).

©JBS&G Australia Pty Ltd T/A Strategen-JBS&G | 61744/140,508 (Rev 0) 16
Figure 16: Monthly rolling annual total and individual gas dry deposition rates – Burrup Road
Figure 17: Monthly total and individual gas dry deposition rates – Burrup Road
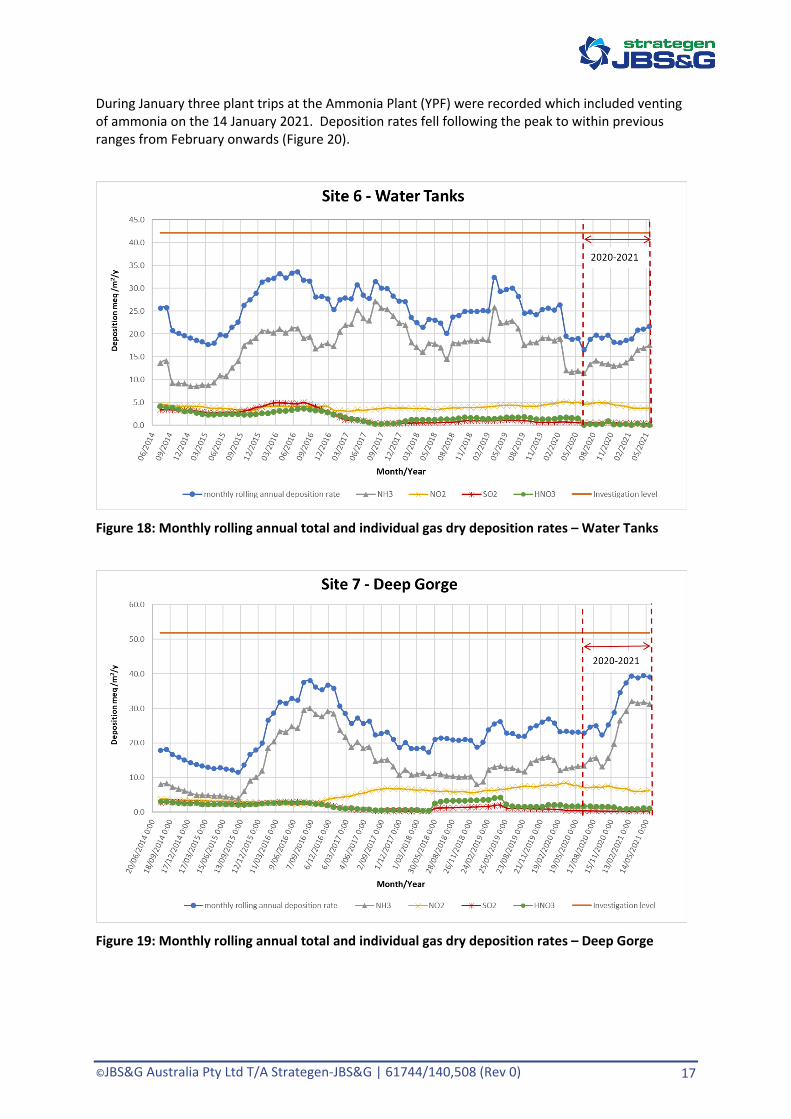
Deposition at the Water Tanks site was within levels previously measured at the site (Figure 18).
Deep Gorge exhibited an increasing trend in the rolling average during the middle of the monitroing period (November through January) however large peaks of NH3 deposition in November and January (maximun of 7.87 meq m-2 for January) were the dominant contributors to the cumulative annual deposition exceeding previous peak annual deposition in February 2016 (6.93 meq m-2).
©JBS&G Australia Pty Ltd T/A Strategen-JBS&G | 61744/140,508 (Rev 0) 17
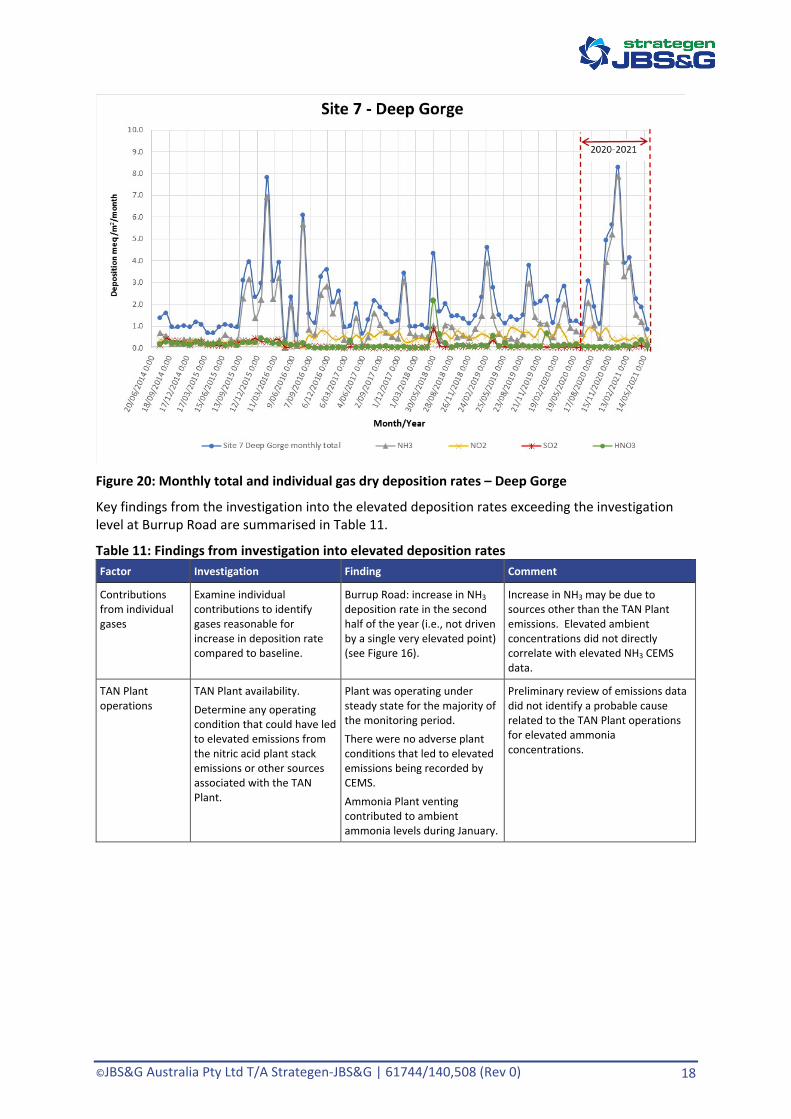
During January three plant trips at the Ammonia Plant (YPF) were recorded which included venting of ammonia on the 14 January 2021. Deposition rates fell following the peak to within previous ranges from February onwards (Figure 20).
Figure 18: Monthly rolling annual total and individual gas dry deposition rates – Water Tanks
Figure 19: Monthly rolling annual total and individual gas dry deposition rates – Deep Gorge
©JBS&G Australia Pty Ltd T/A Strategen-JBS&G | 61744/140,508 (Rev 0) 18
Figure 20: Monthly total and individual gas dry deposition rates – Deep Gorge
Key findings from the investigation into the elevated deposition rates exceeding the investigation level at Burrup Road are summarised in Table 11.
Table 11: Findings from investigation into elevated deposition rates Factor Investigation Finding Comment
Contributions from individual gases
Examine individual contributions to identify gases reasonable for increase in deposition rate compared to baseline.
Burrup Road: increase in NH3 deposition rate in the second half of the year (i.e., not driven by a single very elevated point) (see Figure 16).
Increase in NH3 may be due to sources other than the TAN Plant emissions. Elevated ambient concentrations did not directly correlate with elevated NH3 CEMS data.
TAN Plant operations
TAN Plant availability. Determine any operating condition that could have led to elevated emissions from the nitric acid plant stack emissions or other sources associated with the TAN Plant.
Plant was operating under steady state for the majority of the monitoring period. There were no adverse plant conditions that led to elevated emissions being recorded by CEMS. Ammonia Plant venting contributed to ambient ammonia levels during January.
Preliminary review of emissions data did not identify a probable cause related to the TAN Plant operations for elevated ammonia concentrations.
©JBS&G Australia Pty Ltd T/A Strategen-JBS&G | 61744/140,508 (Rev 0) 19
6. Concluding remarks
Monitoring data are reported for all parameters specified in EPBC Approval 2008/4546 of 12 September 2017.
Analysis of data for gases shows the following:
• The average NH3 concentrations at Burrup Road and Deep Gorge were found to be statistically significantly different (higher) to the baseline.
• The average NH3 concentration at Water Tanks was higher than baseline but the difference was not statistically significant.
• The average NO2 concentrations at all three monitoring locations were comparable to the baseline concentrations; the differences were found not to be statistically significant.
• The average SO2 concentrations at all three monitoring locations in 2020-2021 are lower than the baseline concentrations, with differences in the averages being statistically significant.
The TAN Plant was operating at steady state for the majority of the reported period. Plant start-ups, when potentially higher NH3 emissions may occur, did not correlate with elevated ambient concentrations.
Overall, there is no evidence to show that operation of the TAN Plant has resulted in significant increases in the NO2 and levels over the 12-month monitoring period.
Analysis of annual dry deposition rates of gas species show the following:
• Dry deposition rates increased at Burrup Road and Deep Gorge in 2020-2021 compared to baseline.
• The Burrup Road dry deposition rate was above the investigation level derived from baseline measurements.
• NH3 is the dominant contributor to dry deposition at all monitoring sites.
The exceedance of the investigation level triggered an investigation as per the requirements of the OEMP. That investigation did not support a hypothesis that the emissions from TAN Plant operations were responsible for exceedances of the investigation level.
Analysis of the TSP data shows the following:
• Concentrations of TSP measured in 2020-2021 continue to be reasonably consistent across the three sites suggesting reflection of air shed background concentrations as seen in previous reporting periods.
• Average TSP concentrations at all three monitoring sites are very similar to the 2019-2020 dataset.
Overall, there is no evidence to show that operation of the TAN Plant has resulted in significant increase in ambient TSP concentrations in 2020-2021.
Analysis of dust deposition data shows the following:
• Similar average insoluble deposition rates were observed at all three sites.
• Average insoluble deposition at all sites was not statistically significantly different to those concentrations measured in the baseline study for all sites.

©JBS&G Australia Pty Ltd T/A Strategen-JBS&G | 61744/140,508 (Rev 0) 20
• The soluble fraction of the deposited dust from 2020-2021 was comparable to 2019-2020 dataset at Burrup Road and Deep Gorge.
• The average soluble fraction of the deposited dust at Water Tanks during 2020-2021 was higher than the 2019-2020 dataset and other sites. This was driven by one very high result in May, the source of this elevated result has not been determined.
Overall, there is no evidence to suggest that the operation of the TAN Plant has resulted in materially significant increases in insoluble dust deposition rates.
©JBS&G Australia Pty Ltd T/A Strategen-JBS&G | 61744/140,508 (Rev 0) 21
7. References
Strategen (2018). Yara Pilbara Nitrates, EPBC Approval 2008/4546. Ambient air quality report 2017-2018. Document 650-200-rep-sec-0004, issued October 2018.
Strategen (2019). Yara Pilbara Nitrates, EPBC Approval 2008/4546. Ambient air quality report 2018-2019. Document 650-200-rep-sec-0006, issued October 2019.
Strategen (2020). Yara Pilbara Nitrates, EPBC Approval 2008/4546. Ambient air quality report 2019-2020. 650-200-rep-sec-0007, issued October 2020.
YPN (2017). Yara Pilbara Nitrates, EPBC Approval 2008/4546. Baseline Air Quality Monitoring Report. Document 250-200-rep-ypf-0002, issued 16 June 2017.

©JBS&G Australia Pty Ltd T/A Strategen-JBS&G | 61744/140,508 (Rev 0) 22
Limitations
Scope of services
This report (“the report”) has been prepared by Strategen-JBS&G in accordance with the scope of services set out in the contract, or as otherwise agreed, between the Client and Strategen-JBS&G. In some circumstances, a range of factors such as time, budget, access and/or site disturbance constraints may have limited the scope of services. This report is strictly limited to the matters stated in it and is not to be read as extending, by implication, to any other matter in connection with the matters addressed in it.
Reliance on data
In preparing the report, Strategen-JBS&G has relied upon data and other information provided by the Client and other individuals and organisations, most of which are referred to in the report (“the data”). Except as otherwise expressly stated in the report, Strategen-JBS&G has not verified the accuracy or completeness of the data. To the extent that the statements, opinions, facts, information, conclusions and/or recommendations in the report (“conclusions”) are based in whole or part on the data, those conclusions are contingent upon the accuracy and completeness of the data. Strategen-JBS&G has also not attempted to determine whether any material matter has been omitted from the data. Strategen-JBS&G will not be liable in relation to incorrect conclusions should any data, information or condition be incorrect or have been concealed, withheld, misrepresented, or otherwise not fully disclosed to Strategen-JBS&G. The making of any assumption does not imply that Strategen-JBS&G has made any enquiry to verify the correctness of that assumption.
The report is based information received at the time of preparation of this report. Strategen-JBS&G disclaims responsibility for any changes that may have occurred after this time. This report and any legal issues arising from it are governed by and construed in accordance with the law of Western Australia as at the date of this report.
Environmental conclusions
Within the limitations imposed by the scope of services, the preparation of this report has been undertaken and performed in a professional manner, in accordance with generally accepted environmental consulting practices. No other warranty, whether express or implied, is made.
The advice herein relates only to this project and all results conclusions and recommendations made should be reviewed by a competent person with experience in environmental investigations, before being used for any other purpose.
Strategen-JBS&G accepts no liability for use or interpretation by any person or body other than the client who commissioned the works. This report should not be reproduced without prior approval by the client, or amended in any way without prior approval by Strategen-JBS&G.
©JBS&G Australia Pty Ltd T/A Strategen-JBS&G | 61744/140,508 (Rev 0)
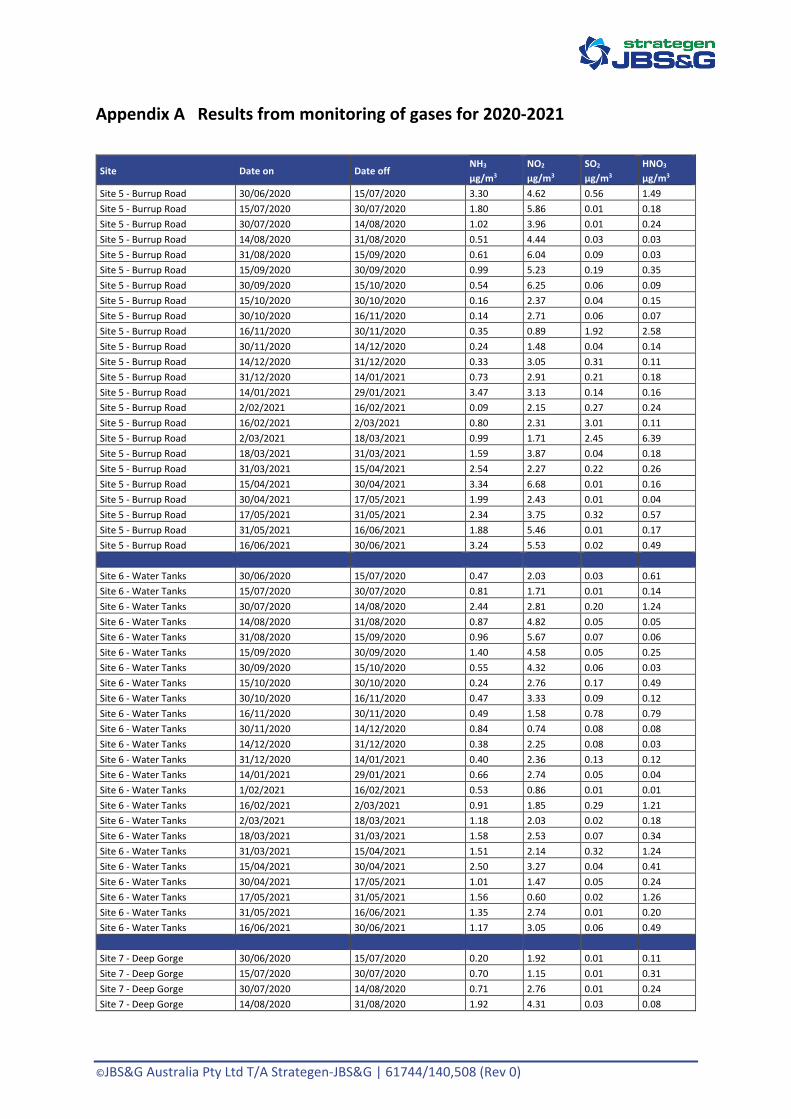
Appendix A Results from monitoring of gases for 2020-2021
Site Date on Date off NH3 µg/m3
NO2 µg/m3
SO2 µg/m3
HNO3 µg/m3
Site 5 - Burrup Road 30/06/2020 15/07/2020 3.30 4.62 0.56 1.49 Site 5 - Burrup Road 15/07/2020 30/07/2020 1.80 5.86 0.01 0.18 Site 5 - Burrup Road 30/07/2020 14/08/2020 1.02 3.96 0.01 0.24 Site 5 - Burrup Road 14/08/2020 31/08/2020 0.51 4.44 0.03 0.03 Site 5 - Burrup Road 31/08/2020 15/09/2020 0.61 6.04 0.09 0.03 Site 5 - Burrup Road 15/09/2020 30/09/2020 0.99 5.23 0.19 0.35 Site 5 - Burrup Road 30/09/2020 15/10/2020 0.54 6.25 0.06 0.09 Site 5 - Burrup Road 15/10/2020 30/10/2020 0.16 2.37 0.04 0.15 Site 5 - Burrup Road 30/10/2020 16/11/2020 0.14 2.71 0.06 0.07 Site 5 - Burrup Road 16/11/2020 30/11/2020 0.35 0.89 1.92 2.58 Site 5 - Burrup Road 30/11/2020 14/12/2020 0.24 1.48 0.04 0.14 Site 5 - Burrup Road 14/12/2020 31/12/2020 0.33 3.05 0.31 0.11 Site 5 - Burrup Road 31/12/2020 14/01/2021 0.73 2.91 0.21 0.18 Site 5 - Burrup Road 14/01/2021 29/01/2021 3.47 3.13 0.14 0.16 Site 5 - Burrup Road 2/02/2021 16/02/2021 0.09 2.15 0.27 0.24 Site 5 - Burrup Road 16/02/2021 2/03/2021 0.80 2.31 3.01 0.11 Site 5 - Burrup Road 2/03/2021 18/03/2021 0.99 1.71 2.45 6.39 Site 5 - Burrup Road 18/03/2021 31/03/2021 1.59 3.87 0.04 0.18 Site 5 - Burrup Road 31/03/2021 15/04/2021 2.54 2.27 0.22 0.26 Site 5 - Burrup Road 15/04/2021 30/04/2021 3.34 6.68 0.01 0.16 Site 5 - Burrup Road 30/04/2021 17/05/2021 1.99 2.43 0.01 0.04 Site 5 - Burrup Road 17/05/2021 31/05/2021 2.34 3.75 0.32 0.57 Site 5 - Burrup Road 31/05/2021 16/06/2021 1.88 5.46 0.01 0.17 Site 5 - Burrup Road 16/06/2021 30/06/2021 3.24 5.53 0.02 0.49 Site 6 - Water Tanks 30/06/2020 15/07/2020 0.47 2.03 0.03 0.61 Site 6 - Water Tanks 15/07/2020 30/07/2020 0.81 1.71 0.01 0.14 Site 6 - Water Tanks 30/07/2020 14/08/2020 2.44 2.81 0.20 1.24 Site 6 - Water Tanks 14/08/2020 31/08/2020 0.87 4.82 0.05 0.05 Site 6 - Water Tanks 31/08/2020 15/09/2020 0.96 5.67 0.07 0.06 Site 6 - Water Tanks 15/09/2020 30/09/2020 1.40 4.58 0.05 0.25 Site 6 - Water Tanks 30/09/2020 15/10/2020 0.55 4.32 0.06 0.03 Site 6 - Water Tanks 15/10/2020 30/10/2020 0.24 2.76 0.17 0.49 Site 6 - Water Tanks 30/10/2020 16/11/2020 0.47 3.33 0.09 0.12 Site 6 - Water Tanks 16/11/2020 30/11/2020 0.49 1.58 0.78 0.79 Site 6 - Water Tanks 30/11/2020 14/12/2020 0.84 0.74 0.08 0.08 Site 6 - Water Tanks 14/12/2020 31/12/2020 0.38 2.25 0.08 0.03 Site 6 - Water Tanks 31/12/2020 14/01/2021 0.40 2.36 0.13 0.12 Site 6 - Water Tanks 14/01/2021 29/01/2021 0.66 2.74 0.05 0.04 Site 6 - Water Tanks 1/02/2021 16/02/2021 0.53 0.86 0.01 0.01 Site 6 - Water Tanks 16/02/2021 2/03/2021 0.91 1.85 0.29 1.21 Site 6 - Water Tanks 2/03/2021 18/03/2021 1.18 2.03 0.02 0.18 Site 6 - Water Tanks 18/03/2021 31/03/2021 1.58 2.53 0.07 0.34 Site 6 - Water Tanks 31/03/2021 15/04/2021 1.51 2.14 0.32 1.24 Site 6 - Water Tanks 15/04/2021 30/04/2021 2.50 3.27 0.04 0.41 Site 6 - Water Tanks 30/04/2021 17/05/2021 1.01 1.47 0.05 0.24 Site 6 - Water Tanks 17/05/2021 31/05/2021 1.56 0.60 0.02 1.26 Site 6 - Water Tanks 31/05/2021 16/06/2021 1.35 2.74 0.01 0.20 Site 6 - Water Tanks 16/06/2021 30/06/2021 1.17 3.05 0.06 0.49 Site 7 - Deep Gorge 30/06/2020 15/07/2020 0.20 1.92 0.01 0.11 Site 7 - Deep Gorge 15/07/2020 30/07/2020 0.70 1.15 0.01 0.31 Site 7 - Deep Gorge 30/07/2020 14/08/2020 0.71 2.76 0.01 0.24 Site 7 - Deep Gorge 14/08/2020 31/08/2020 1.92 4.31 0.03 0.08

©JBS&G Australia Pty Ltd T/A Strategen-JBS&G | 61744/140,508 (Rev 0)
Site Date on Date off NH3 µg/m3
NO2 µg/m3
SO2 µg/m3
HNO3 µg/m3
Site 7 - Deep Gorge 31/08/2020 15/09/2020 0.45 3.89 0.04 0.03 Site 7 - Deep Gorge 15/09/2020 30/09/2020 0.99 3.21 0.06 0.09 Site 7 - Deep Gorge 30/09/2020 15/10/2020 0.32 3.19 0.04 0.03 Site 7 - Deep Gorge 15/10/2020 30/10/2020 0.32 2.10 0.04 0.09 Site 7 - Deep Gorge 30/10/2020 16/11/2020 0.22 4.77 0.03 0.07 Site 7 - Deep Gorge 16/11/2020 30/11/2020 5.61 2.39 0.13 0.26 Site 7 - Deep Gorge 30/11/2020 14/12/2020 1.88 0.92 0.07 0.03 Site 7 - Deep Gorge 14/12/2020 31/12/2020 4.85 2.37 0.15 0.01 Site 7 - Deep Gorge 31/12/2020 14/01/2021 8.42 1.34 0.24 0.07 Site 7 - Deep Gorge 14/01/2021 29/01/2021 3.00 1.51 0.11 0.16 Site 7 - Deep Gorge 2/02/2021 16/02/2021 2.14 2.23 0.30 0.25 Site 7 - Deep Gorge 16/02/2021 2/03/2021 2.72 1.73 0.12 0.45 Site 7 - Deep Gorge 2/03/2021 18/03/2021 2.44 1.38 0.04 0.20 Site 7 - Deep Gorge 18/03/2021 31/03/2021 2.97 1.84 0.01 0.12 Site 7 - Deep Gorge 31/03/2021 15/04/2021 1.12 1.70 0.57 0.73 Site 7 - Deep Gorge 15/04/2021 30/04/2021 1.01 2.36 0.01 0.16 Site 7 - Deep Gorge 30/04/2021 17/05/2021 1.09 0.93 0.10 0.35 Site 7 - Deep Gorge 17/05/2021 31/05/2021 0.47 0.61 0.78 1.67 Site 7 - Deep Gorge 31/05/2021 16/06/2021 0.17 2.27 0.01 0.16 Site 7 - Deep Gorge 16/06/2021 30/06/2021 0.22 1.75 0.02 0.34

©JBS&G Australia Pty Ltd T/A Strategen-JBS&G | 61744/140,508 (Rev 0)
Appendix B Results from monitoring of TSP for 2020-2021
Period start date Site 5 -Burrup Road TSP µg/m3
Site 6 - Water Tanks TSP µg/m3
Site 7 - Deep Gorge TSP µg/m3
02-Jul-20 14 20 17 08-Jul-20 15 12 18 14-Jul-20 17 17 15 20-Jul-20 5 10 8 26-Jul-20 13 14 17
01-Aug-20 12 13 10 07-Aug-20 10 14 18 13-Aug-20 8 7 2 19-Aug-20 14 15 14 25-Aug-20 31 22 24 31-Aug-20 27 18 12 06-Sep-20 26 28 28 12-Sep-20 30 23 28 18-Sep-20 32 34 33 24-Sep-20 21 26 25 30-Sep-20 31 31 30 06-Oct-20 19 19 22 12-Oct-20 40 39 40 18-Oct-20 29 33 32 24-Oct-20 30 31 35 30-Oct-20 42 44 42 05-Nov-20 37 38 33 11-Nov-20 36 31 37 17-Nov-20 49 39 35 23-Nov-20 30 25 24 29-Nov-20 43 50 51 05-Dec-20 36 32 23 11-Dec-20 16 - 20 17-Dec-20 53 79 62 23-Dec-20 35 32 31 29-Dec-20 48 70 37 04-Jan-21 56 62 63 10-Jan-21 44 45 37 16-Jan-21 45 70 48 22-Jan-21 21 40 26 28-Jan-21 45 44 39 03-Feb-21 16 20 15 09-Feb-21 16 27 23 15-Feb-21 16 21 10 22-Feb-21 17 24 21 27-Feb-21 30 38 39 05-Mar-21 17 19 17 11-Mar-21 21 26 25 17-Mar-21 11 12 15 23-Mar-21 27 25 27 29-Mar-21 21 15 25 04-Apr-21 30 28 37 10-Apr-21 21 27 25 16-Apr-21 16 30 19 22-Apr-21 35 31 27 28-Apr-21 24 29 15 04-May-21 78 Spoiled sample 67 10-May-21 18 33 21 16-May-21 26 21 38 22-May-21 11 23 16

©JBS&G Australia Pty Ltd T/A Strategen-JBS&G | 61744/140,508 (Rev 0)
Period start date Site 5 -Burrup Road TSP µg/m3
Site 6 - Water Tanks TSP µg/m3
Site 7 - Deep Gorge TSP µg/m3
28-May-21 21 26 28 03-Jun-21 9 8 9 09-Jun-21 20 24 24 15-Jun-21 19 16 13 21-Jun-21 9 5 7 27-Jun-21 20 19 12
©JBS&G Australia Pty Ltd T/A Strategen-JBS&G | 61744/140,508 (Rev 0)
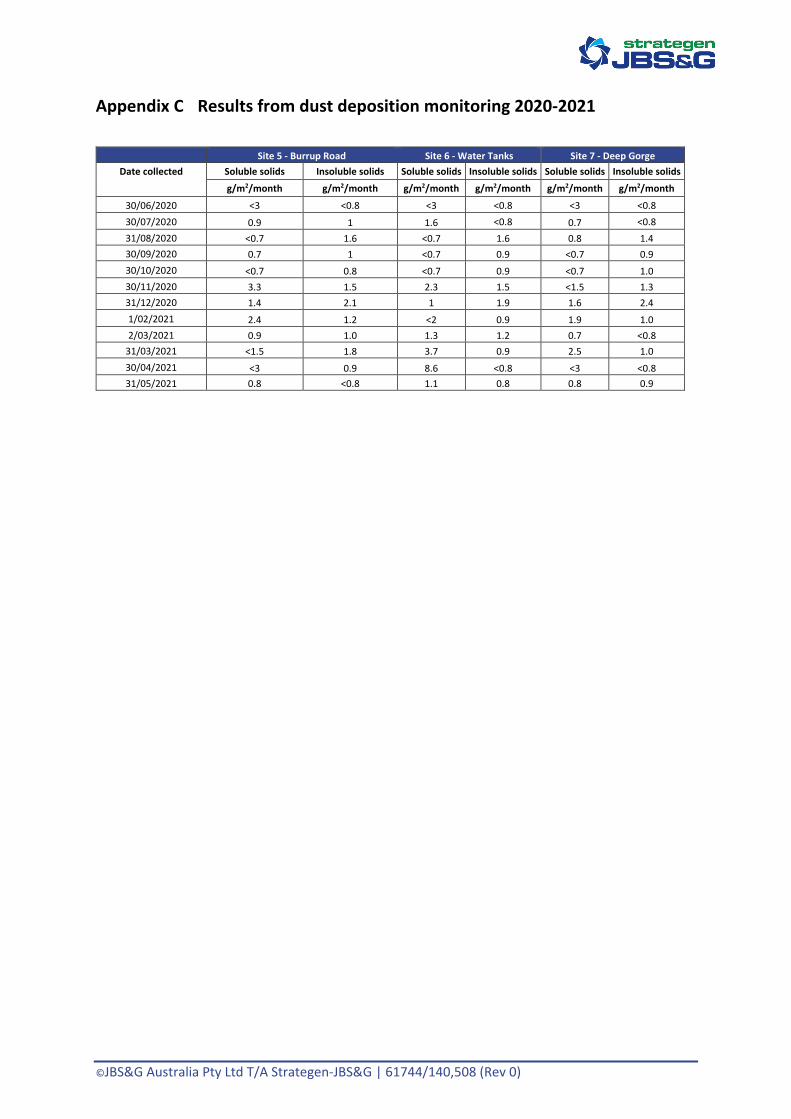
Appendix C Results from dust deposition monitoring 2020-2021 Site 5 - Burrup Road Site 6 - Water Tanks Site 7 - Deep Gorge
Date collected Soluble solids Insoluble solids Soluble solids Insoluble solids Soluble solids Insoluble solids
g/m2/month g/m2/month g/m2/month g/m2/month g/m2/month g/m2/month
30/06/2020 <3 <0.8 <3 <0.8 <3 <0.8 30/07/2020 0.9 1 1.6 <0.8 0.7 <0.8 31/08/2020 <0.7 1.6 <0.7 1.6 0.8 1.4 30/09/2020 0.7 1 <0.7 0.9 <0.7 0.9 30/10/2020 <0.7 0.8 <0.7 0.9 <0.7 1.0 30/11/2020 3.3 1.5 2.3 1.5 <1.5 1.3 31/12/2020 1.4 2.1 1 1.9 1.6 2.4 1/02/2021 2.4 1.2 <2 0.9 1.9 1.0 2/03/2021 0.9 1.0 1.3 1.2 0.7 <0.8
31/03/2021 <1.5 1.8 3.7 0.9 2.5 1.0 30/04/2021 <3 0.9 8.6 <0.8 <3 <0.8 31/05/2021 0.8 <0.8 1.1 0.8 0.8 0.9
©JBS&G Australia Pty Ltd T/A Strategen-JBS&G | 61744/140,508 (Rev 0)
© JBS&G Australia Pty Ltd T/A Strategen-JBS&G
This document is and shall remain the property of Strategen-JBS&G. The document may only be used for the purposes for which it was commissioned and in accordance with the Terms of Engagement for the commission. Unauthorised use of this document in any form whatsoever is prohibited.
Document Distribution
Rev No. Copies Recipient Date
0 Final report (electronic) Yara Pilbara Nitrates 30 September 2021
Document Status
Rev No. Author Reviewer Approved for Issue
Name Name Signature Date
A C. Ingram P. Forster P. Forster
23 September 2021
0 C. Ingram J. Bailes J. Bailes 30 September 2021

©JBS&G Australia Pty Ltd T/A Strategen-JBS&G | 61744/140,508 (Rev 0)