Similarities and differences among the chromosomes of the ...
Upload
independentCategory
view
1download
0
Alu and LINE1 Distributions in the Human Chromosomes: Evidence ofGlobal Genomic Organization Expressed in the Form of Power Laws
Diamantis Sellis,* Astero Provata,� and Yannis Almirantis**National Center for Scientific Research ‘‘Demokritos,’’ Institute of Biology, Athens, Greece; and �National Center forScientific Research ‘‘Demokritos,’’ Institute of Physical Chemistry, Athens, Greece
Spatial distribution and clustering of repetitive elements are extensively studied during the last years, as well as theircolocalization with other genomic components. Here we investigate the large-scale features of Alu and LINE1 spatialarrangement in the human genome by studying the size distribution of interrepeat distances. In most cases, we havefound power-law size distributions extending in several orders of magnitude. We have also studied the correlations of theextent of the power law (linear region in double-logarithmic scale) and of the corresponding exponent (slope) with othergenomic properties. A model has been formulated to explain the formation of the observed power laws. According to themodel, 2 kinds of events occur repetitively in evolutionary time: random insertion of several types of intruding sequencesand occasional loss of repeats belonging to the initial population due to ‘‘elimination’’ events. This simple mechanism isshown to reproduce the observed power-law size distributions and is compatible with our present knowledge on thedynamics of repeat proliferation in the genome.
Introduction
About 45% of the human genome consists of trans-posable elements (TEs) (Deininger and Batzer 2002;Makalowski 2003), their majority being retroelements.Most of them are members of the Alu and LINE1 families.Alu belongs to the ‘‘short interspersed elements’’ (SINEs)and is found in the human genome in a number of;1,100,000 copies, covering ;10% of its total length.Alu typical sequence is ;300 nt long and is CG andCpG rich. LINE1 belongs to the ‘‘long interspersed ele-ments’’ (LINEs). The number of LINE1 copies in the hu-man genome is ;700,000. Intact LINE1s have a length of;6 � 103 nt, but most copies are considerably truncated.LINE1 repeats are AT rich and are present in all studiedmammalian genomes (Smit et al. 1995). Their evolutionaryhistory is long, dating to the beginnings of eukaryotic ex-istence (Ostertag and Kazazian 2001). LINE1 uses a retro-transposase encoded in its sequence, whereas Alupropagates by means of the retrotransposition machineryof active LINE1 elements (Dewannieux et al. 2003). Bothrepeat families are divided into subfamilies. Elements be-longing to each subfamily share high similarity in somecharacteristic (diagnostic) positions and common ancestry.Alu proliferation has a shorter history than that of LINE1sand probably began in a common ancestor of primates androdents (Ullu and Tschudi 1984). About 112 MYA, trans-posons named FLA evolved from 7SL RNA, and ;81MYA, an FLA dimerization led to the formation of 2 sub-families (Jo and Jb) of the J family of Alu elements. The nextmain Alu subfamilies, S, Sx, and Y, have arisen 48, 37, and19 MYA, respectively (Kapitonov and Jurka 1996; for no-menclature conventions, see also Batzer et al. 1999). Evenyounger subfamilies (Ya5, age: 4 Myr; Yb8, age: 3 Myr)have arisen after hominization, and the human genome ispolymorphic for a considerable number of their members.
The distribution of most classes of repeat elements inthe genome usually deviates from randomness. LINE1s arefound with a higher probability in the AT-rich genomic
compartments. Alus have a clear preference for the GC-richgenomic compartments, and this tendency is most pro-nounced in the older subfamilies (about genomic patchinesswith respect to GC content, see Bernardi 2000a, 2000b).However, the very young subfamilies do not follow thispattern, sharing the preference for the AT-rich regions ofLINE1 elements. This peculiarity in the genomic distribu-tion of Alu elements is not yet completely understood(Brookfield 2001; Pavlicek et al. 2001; Deininger and Batzer2002; Medstrand et al. 2002; Jurka et al. 2004; Belle et al.2005; Hackenberg et al. 2005).
TEs were initially considered as selfish entities propa-gating in the host genome as ‘‘junk DNA,’’ as long as thisproliferation is tolerated without causing severe damages.Now, it becomes more and more accepted that the evolutionof TEs interacts in a complex way with other aspects of thewhole genomic dynamics. It has been reported that 5% of allalternatively spliced internal exons include parts of Alu in-sertions (Sorek et al. 2002). However, this view is questionedby other authors (Pavlicek, Clay, and Bernardi 2002). Theimpact of Alus and of other TEs in the modification ofthe expression pattern of existing genes is not doubted(for Alus, see e.g., Deininger and Batzer 1999; Daganet al. 2004; for LINE1, see e.g., Ostertag and Kazazian2001). It is very probable that the proliferation of Alu,LINE1, and other TE families has provided a variety of ad-vantages to the host genome in the long evolutionary time(not necessarily reflected into positive selection of newlytransposed copies).
In the present work, we study the large-scale pattern ofdistribution for several repeat families in the human ge-nome. This is done examining the size distribution of dis-tances between consecutive repeats belonging to the samefamily. Furthermore, attempting to explain the findingsconcerning repeat distribution at chromosomal level, we in-troduce a minimal model (named ‘‘insertion–eliminationmodel’’) based on well-established events of genomic dy-namics. These are i) eliminations of repeats of a specificrepeat family and ii) insertions of sequences of various ori-gins. Both are well-known molecular events occurring reg-ularly in the long evolutionary time. It is shown that theproposed model reproduces the general distribution pattern,which prevails in human chromosomes. Also, all the exam-ined relations between genomic quantities and quantities
Key words: Alu, LINE1, power laws, repeat distributions.
E-mail: [email protected].
Mol. Biol. Evol. 24(11):2385–2399. 2007doi:10.1093/molbev/msm181Advance Access publication August 29, 2007
� The Author 2007. Published by Oxford University Press on behalf ofthe Society for Molecular Biology and Evolution. All rights reserved.For permissions, please e-mail: [email protected]
by guest on July 6, 2015http://m
be.oxfordjournals.org/D
ownloaded from
characterizing the interrepeat distances’ distributions arecompatible with the proposed model.
The article is organized as follows: In Methods, wepresent technical aspects of the subsequent analysis. Inthe beginning of Results and Discussion, the statisticalconcepts, which will be used in the sequel, are briefly re-viewed. Then, the proposed insertion–elimination model isintroduced in order to compare its features with the prop-erties of repeat distributions in the human genome. In thenext subsection, evidence is presented about the regular oc-currence of repeat elimination events during genomic evo-lution (which is a prerequisite of the proposed model).Continuing, the properties of Alu and LINE1 repeat ele-ments’ distribution are systematically presented and the val-idity of the insertion–elimination model is assessed. Ina final section, some conclusions and perspectives of thiswork are drawn.
Methods
The sequences of the assembled human chromosomesbuild 35.1 were downloaded from National Center for Bio-technology Information genomic biology (ftp://ftp.ncbi.nih.gov/genomes/H_sapiens/Assembled_chromosomes/).The existence of gaps in human-assembled chromosomesalways poses a problem when measuring distances betweenany types of localizations (here repeats) at whole chromo-some scale. We have chosen to remove gaps longer than50,000 nt. This strategy has been followed after some initialtests because these gaps could affect the shape of the inter-repeat size distributions, whose linear part (in double-logscale) starts around this order of magnitude. The shortergaps (which are more common) were retained in ordernot to disturb the chromosomal architecture. Moreover,their length is not expected to affect considerably the linearpart of the studied distributions. This was verified in trialswhere all gaps were removed and figures were left practi-cally unchanged. Notice that chromosomal coordinates in-cluded in tables 3 and 6 refer to human chromosomes afterthe elimination of gaps longer than 50,000 nt.
We have used RepeatMasker (Smit et al. 1996–2004;www.repeatmasker.org), version 3.1.2, combined with li-braries (release 20051025) derived from RepBase (Jurka2000; www.girinst.org/) and WU-Blast v.2.0_10/05/2005(Gish 2003; http://blast.wustl.edu). The data for several re-peat populations in human chromosomes were extracted af-ter a suitable parsing of the standard RepeatMasker output.
Throughout this work, we present the size distribu-tions of spacers separating the repeats of a given class inthe form of cumulative distributions for reasons describedin Results and Discussion. The analysis of chromosomalregions has been done using the same values of ‘‘maximumdivergence’’ and ‘‘minimum length’’ as in the whole chro-mosome analysis (see supplementary material, Supplemen-tary Material online). Cumulative distribution plots ofinterrepeat distances, as well as a simple linear regressionanalysis in log–log scale, were made with Grace-5.1.14.The values of extent (E), slope (l), r2, and slope standarddeviation for all the effectuated genomic size distributioncomputations are presented in supplementary material (ex-
tended table 1, Supplementary Material online). The samevalues for the simulation examples are given in figure 10.
Scatterplots depicting the correlation between E or land GC or SI (quantity of ‘‘subsequently inserted’’ genomicmaterial after the proliferation period of a repeat class orsubfamily) content were made using STATISTICA version6.0. The names of chromosomes are depicted in the plots,whereas the values of the associated square correlationcoefficient (r2) and probability (P) are given in the corre-sponding tables.
There are some inherent difficulties in isolating chro-mosomal regions suitable for the comparison between highand lowGC% or SI% sequence properties (figs. 7 and 9 andtables 3 and 6). This is the reason why we did not includeexamples of all TE classes. However, even in cases not in-cluded because of low repeat population numbers and thusforming rudimentary distributions, the results were similarto the presented ones. One difficulty is due to the necessarysequence length for this kind of analysis. Moreover, in thecase of the GC-dependence study, if the GC% contrast ishigh between pairs of regions (necessary prerequisite in or-der to obtain unambiguous results), the density of the stud-ied repeat populations is always very low in one of the twoexamined regions (in the GC rich for LINE1s and in the ATrich for Alus). Several difficulties are also inherent in thesearch for power laws in low/high-SI regions: Some exam-ples are a) SI (L1P) is uniformly low, depending only onAluY insertions. b) The main components of the SI mate-rial for AluSx populations (SI[AluSx]) are L1P popula-tions, resulting in the same conflict met in the search oflarge GC%-poor or rich regions. Additionally, the SI%value is relatively homogeneous along each chromosome(with the exception of chromosome X and partially of 19),thus making very rare the cases of large low- or high-SIregions.
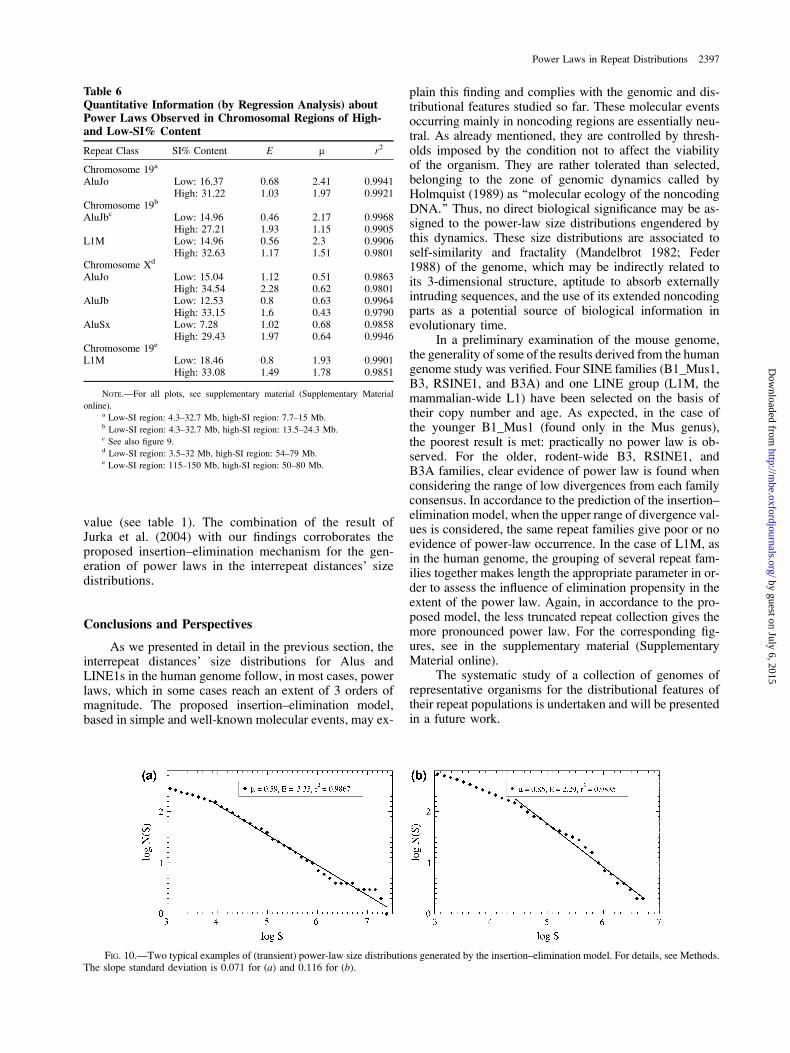
Examples of simulations using the insertion–eliminationmodel are given in figure 10. In these cases, in an artificialchromosome 2,000,000 nt long, 20,000 delimiters (simulat-ing a repeat population) are randomly distributed. Afterconsecutive rounds of delimiter eliminations and influxof external sequence segments (here of 100 nt long), a rel-atively small fraction of the initial number of delimiters isleft. Their distances form well-shaped power-law distribu-tions. In case (a), 40 influx (insertion) events follow eachdelimiter elimination (spacers’ merging) event until a pop-ulation of 500 delimiters is left. In case (b), the insertion–elimination ratio equals to 20 and the remaining delimitersare 1,000. Both cases, as well as results of other simulationsnot presented here, demonstrate power-law formation fora long (transient) time interval before the asymptotic limitis reached.
In the presented simulations, the insertion of a repeatelement close to another one of the same family at inverseorientation and the subsequent elimination of both (includ-ing the spacer between them) are modeled as a single repeatelimination occurring randomly. It is well documented thatthe scarceness of nearby repeats is very pronounced in thesmall distances, thus making obvious that the lost interre-peat spacers are practically all below the threshold influenc-ing our analysis (Lobachev et al. 2000; Stenger et al. 2001).A concrete example is provided in CSAC (2005), where for
2386 Sellis et al.
by guest on July 6, 2015http://m
be.oxfordjournals.org/D
ownloaded from

;600 deletions of Alus in the chimp genome 2 Mnt werelost. So in each couple of inverted repeat elimination;3,500 nt are lost, supposing equidistribution. Simpleinspection of figures 1 and 3 and related supplementarymaterial (Supplementary Material online) reveals that inalmost all cases of reported power-law–like distributions,the linear part of the distribution lies clearly in a rangeof lengths higher than 10,000 nt, well above 3,500 nt. Ev-idence, presented in CSAC (2005), about a power law in thedistribution of the eliminated genomic segments’ lengths(CSAC [2005], p.74 see also) makes the number of deletedspacers longer than 10,000 nt statistically insignificant (;6out of 612).
Scripts in PERL and programs in FORTRAN used forparsing RepeatMasker output files and producing the pre-sented results, as well as STATISTICA and EXCELspreadsheets with repeat population data in human chromo-somes, are available upon request.
Results and DiscussionPreliminaries
The distributional features of TEs have been the sub-ject of intense research during the last years. In most cases,substantially nonrandom distributions have been observed.Major factors related to the uneven distribution of repeatsare the local GC abundance, the underlying genes’ distri-bution, mutual avoidance of different repeat populations,and intrafamily repeat coclustering. Here we perform a sys-
tematic investigation of the size distribution of the spacers(distances) separating consecutive repeats of the major Aluand LINE1 classes in the human genome. When clusteringappears only in short-length scales, clusters with sizes rang-ing around a mean value are formed. In such cases, for largevalues of length S, these short-range distributions have anexponentially decaying tail of the form:
PðSÞ � e�aS; 0, a:
When the clustering is scale free, long-range correla-tions extend in a self-similar way for several length scales(and ideally for the whole examined genomic length) andthe corresponding spacers’ size distributions follow ‘‘powerlaws,’’ which correspond to linear graphs in a double-log-arithmic scale:
PðSÞ � S�f5S�1�l; 0, l:
High values of the extent of linearity in log–log plots(E) means that self-similarity spans many orders of magni-tude, whereas low absolute values of the slope (l) are con-nected to an abundance of relatively long spacers in everylength scale.
More interesting are power laws with 0,l � 2;whichimplies that the distribution has infinite mean square. Thismeans that for large data sets, standard deviation is un-bounded (i.e., the larger the data set is the higher getsthe computed standard deviation). Several power lawsfound in the real world have values of l around 2 (Newman2005). For higher values of l, the distribution becomes
Table 1Quantitative Information (by Regression Analysis) about Power Laws Observed in All Human Chromosomes for theConsidered Repeat Categories
ChromosomeNumber
AluJb AluJo AluSx L1M L1P
E l E l E l E l E l
1 1.40 1.22 1.06 1.31 1.03 1.80 1.27 1.93 0.93 1.662 1.37 0.92 1.28 1.17 1.15 0.89 — — 0.80 1.693 1.16 0.95 1.04 0.84 1.40 0.51 — — 1.35 1.944 1.49 0.89 1.37 0.82 1.24 0.64 — — 1.02 2.585 1.25 0.97 1.15 0.89 1.05 0.67 — — 1.03 1.876 1.15 0.82 1.38 1.04 1.38 0.58 — — 1.22 2.177 1.30 1.07 1.93 0.67 1.27 0.76 1.13 2.36 1.83 1.608 1.25 0.52 1.25 0.66 1.46 0.50 — — 0.70 2.259 1.15 1.34 1.75 1.03 1.27 1.15 1.39 1.88 1.48 1.5910 1.16 1.70 1.40 1.52 0.92 1.21 0.80 1.85 1.25 1.7611 1.50 1.06 1.50 1.06 1.37 0.89 1.40 2.40 1.60 1.7212 1.36 1.18 1.83 1.05 1.38 0.99 0.92 2.38 1.15 1.8413 1.28 0.71 1.70 1.06 0.68 1.50 0.70 3.22 — —14 1.87 1.14 1.62 1.21 0.92 1.41 — — 1.25 1.1715 1.03 1.78 1.16 1.79 0.92 1.93 — — 0.92 2.0916 1.50 1.44 1.73 1.70 1.38 1.22 — — 1.14 0.9517 1.60 1.55 1.50 1.76 1.72 2.05 1.14 0.91 1.60 0.7618 1.40 1.17 1.62 0.75 0.70 1.46 — — — —19 1.86 1.77 2.05 1.56 2.06 1.67 1.50 1.08 1.70 0.8420 1.40 1.03 1.20 1.02 1.27 1.16 0.80 1.49 1.50 1.1321 1.28 1.03 1.72 0.81 1.36 1.34 — — 0.80 1.1722 1.18 1.79 1.52 1.62 1.14 1.78 1.39 0.62 1.70 0.38X 1.25 0.81 1.84 0.71 1.26 0.75 1.70 1.96 1.15 2.36Y 1.27 0.72 2.51 0.50 3.06 0.60 2.08 0.74 1.03 1.27
NOTE.—Blanc cells mean that no power law (linearity in double-logarithmic scale) is found. Chromosome length, GC%, and regression coefficients (r2) are included in
the supplementary material (Supplementary Material online), as well as the complete set of the corresponding plots. Notice that all r2 values are higher than 0.97 while their
mean is higher than 0.99.
Power Laws in Repeat Distributions 2387
by guest on July 6, 2015http://m
be.oxfordjournals.org/D
ownloaded from

progressively similar to a short-ranged one, that is, random-ness tends to prevail in the large length scales (large valuesof S).
Power laws in size distributions are in general associ-ated with the geometrical features of self-similarity andfractality (Mandelbrot 1982; Feder 1988), that is, the dis-tribution (in our case) of a given repeat family in the ge-nome looks similar when examined at several length scales.
In the subsequent analysis, we use the ‘‘cumulativesize distribution’’ defined as follows:
PðSÞ5ZN
S
pðrÞdr;
where p(r) is the original spacers’ size distribution. The cu-mulative form of the distribution has in general better sta-tistical properties as it forms smoother ‘‘tails,’’ less affectedby fluctuations. For reviews on power-law size distribu-tions, their properties, and alternative forms, see, for exam-ple, Adamic and Huberman (2002); Li (2002); andNewman (2005).
The cumulative form of a power-law size distributionis again a power law characterized by an exponent (slope)equal to that of the original distribution minus 1: ifpðrÞ � r�1�l, then
PðSÞ �Z
ðr�1�lÞdr � S�l:
In the sequel, plots depicting cumulative size distribu-tions of interrepeat distances are presented. The logarithmsof interrepeat distances (S) are shown in the horizontal axis,whereas in the vertical one are the logarithms of the numberN(S) of all the spacers longer or equal to S. For genomic andfor model-generated size distributions, circles and rhombsare used, respectively. Additionally, to genomic size distri-butions, figures include also a bundle of 10 size distribu-tions where repeats are positioned randomly (continuouslines). The number of the randomly positioned repeats istaken to be equal to the number of repeats of the associatedgenomic sequence, and the length of the (computer gener-ated) artificial sequence is equal to the length of the consid-ered genomic region. The inclusion of these random datasets in the figures, using the same scale with the genomicdata sets, gives pictorially the measure of the divergence inshape and form between the observed genomic distributionpatterns and the expected ones on the grounds of purelyrandom repeat positioning.
Power laws have already been reported in several as-pects of the genome structure, as in the finding of long-range correlations in noncoding sequences (Li and Kaneko1992; Peng et al. 1992; Voss 1992), the size distribution ofpurine and pyrimidine islands in the noncoding (Provataand Almirantis 1997), the size distribution of noncodingsegments between exons in higher eukaryotes (Almirantisand Provata 1999), the detection of ‘‘Zipf-like laws’’ (foundprincipally in the noncoding) in rank diagrams when the nnucleotides (n5 6, 7, . . .) are considered as ‘‘words’’ of thegenomic text (Mantegna et al. 1994), through wavelet anal-ysis of genomic sequences in Arneodo et al. (1995) andAudit et al. (2001), etc. More recently, the existence of a
genome-wide power-law size distribution for several geno-mic compartments on the basis of their GC content (puta-tive isochors) has been reported in Cohen et al. (2005).
The ‘‘Insertion–Elimination Model’’
There is a wide corpus of literature aiming to explainthe appearance of power-law size distributions in severalphenomena, ranging from physics to biology, social scien-ces, and linguistics (see e.g., Mandelbrot 1982; Feder1988). Various types of aggregative growth have beenproven, both theoretically and through simulations, to beat the basis of power-law distributions (Jullien and Botet1987; Vicsek 1989). Genomic dynamics includes severaltypes of events, which may be modeled as ‘‘aggregative’’(i.e., a chromosome incorporates newmaterial and becomeslarger), like transport and integration of genomic materialfrom different organisms (leading occasionally to ‘‘genetransfer’’), insertions of sequences of viral origin, retropo-sitions, incorporations of other nonretroelement sequences,etc. Aggregative phenomena (being extremely abundantduring the evolutionary history of genomes) seem to formthe most solid basis for the understanding of the appearanceof long-range features and power-law size distributions.
For 1-dimensional models, it may be shown analyti-cally (Takayasu et al. 1991) that the combination of i) ag-gregation (fusion together) events of neighboring‘‘particles,’’ and ii) events of intrusion of new particles fromoutside that eventually aggregate with internal particlesmay lead asymptotically to the appearance of power lawsin the particles’ size distributions. The simultaneous actionof both types of events is necessary for the emergence ofpower-law size distributions. The model is solvable, andthe exponent �f of the power law may be determined an-alytically to be �f5� l� 15� 4=3; provided that anexternal particle, which intrudes from outside in the1-dimensional system, ‘‘fuses’’ with a particle inside thesystem with a constant probability (i.e., independently ofthe size of the internal particle), whereas there is also thepossibility that the inserted particle may stand alone. Thismeans that insertion events may either enlarge already ex-isting particles or give rise to new particles into the system,thus compensating for the constant decrease of the numberof internal particles due to fusions of nearby particles(Takayasu et al. 1991).
The structure and dynamics of the genome pose seri-ous restrictions to aggregative models, which try to explainthe generation of power laws in the interrepeat distances’size distribution. Let us consider the ‘‘spacers’’ between re-peats of a given family as particles characterized by theirlength and constrained to the 1-dimensional topology in-duced by the structure of the DNA molecule. Any elimina-tion of one of the repeats of the considered population leadsto the aggregation (merging) of 2 adjacent spacers. Insertionof sequence segments, either genuinely of external (e.g., vi-ral) origin or processed copies of genomic origin (which arereincorporated near randomly, like subsequent repeat fam-ilies, processed pseudogenes, etc.), may be seen as influx ofexternal particles aggregating with one of the particles(spacers) already belonging to the 1-dimension system(the ‘‘thread’’ of the DNA molecule).
2388 Sellis et al.
by guest on July 6, 2015http://m
be.oxfordjournals.org/D
ownloaded from
Here, 2 main differences from the exactly solvablemodel of Takayasu et al. (1991) may be recognized asfollows:
A. In our model, the probability of an insertion intoa given spacer is obviously proportional to the lengthof that spacer: this feature poses particular difficultiesin the analytical treatment of the problem as it causesthe procedures of 1) aggregation (adjacent particles)and 2) insertion (i.e., aggregation of intruding se-quences with existing spacers) to depend mutually (tobe coupled). This dependence poses severe mathemat-ical difficulties in the search of an analytical solution,which are not met in mechanisms with no suchcoupling. However, the fact that long spacers becomemore easily longer (if the probability of absorption ofexternally inserted material increases with size) isobviously in accordance with the emergence of a powerlaw. This may be understood because the tail of thedistribution, formed by the longer spacers, ‘‘fattens’’more drastically in the case of coupled procedures.
B. A more fundamental divergence of our problem fromsolvable aggregation models is the following: Theevolution of any given TE family that has ceased toproliferate into the genome and is exposed to a nonzerorate of eliminations in the evolutionary time alwaysresults asymptotically to the trivial situation where thewhole DNA molecule becomes a unique spacer afterthe disappearance of the last member of this TE family.
As a consequence, the size distribution of spacers be-tween consecutive repeats of a given family in a chromo-some cannot be studied by means of asymptotic solutions ofany (solvable or not) aggregative model because we have totake into account repeat eliminations. The power lawsfound so far have to be treated as ‘‘transient in the long evo-lutionary time’’ because, inevitably, the only asymptotic so-lution is the trivial one. In such cases, in order to test theexplanatory power of a model, we use simulations for finitetime intervals and comparisons of snapshots of the pro-duced spacers’ distributions with the ones found in thestudy of real chromosomes.
Simulating the insertion–elimination model, we haveproduced power-law size distributions of spacers between‘‘delimiters’’ (which correspond to repeats of a given fam-ily), see figure 10. The detailed procedure is described inMethods. The extent and the slope of the linear part ofthe distributions in double-log scale are within the rangemet in genomic distributions (see figs. 1 and 3 and supple-mentary material, Supplementary Material online).
In different cases of natural phenomena, which followsimilar mathematical descriptions, the value of the expo-nent (slope) of a power law is the same and is often foundto be in very good accordance with theoretical predictions.In some of these cases, especially in material sciences, ge-ography, astrophysics, etc., the underlying dynamics is usu-ally working uniformly for a considerable range of lengths,thus generating self-similarity and a unique exponent valuefor all these orders of magnitude. In biology too, whena fractal geometry on the phenotype is functionally advan-tageous, the range of the produced power laws is often ex-pected to cover sizes between tissues and cells, as occurs in
the blood vessel network in a tissue, the bronchial architec-ture of the lung, etc. (Mandelbrot 1982; Feder 1988). On theother hand, genome dynamics includes a variety of differ-ent, simultaneously working procedures. Different genomicdynamical procedures could provide a simple and well-defined size distribution power law each if envisaged toact independently. These power laws could have differentexponents and would reach stability in different time-scales. Moreover, the probability of occurrence of severaltypes of aggregative events is not homogeneous within thegenome (for viral insertions, see Rynditch et al. 1998, forrepeat insertions, see the literature cited herein, etc.). Ob-viously, in real genomic evolution, we always observe thecombined action of all these procedures. Additionally,thresholds, or rather filters of tolerance, are imposed tothese phenomena (due to their impact onto the phenotype)when genomic architecture and functionality are disturbedbeyond some extent. As a general consequence, the rangeand the perfection of the observed power laws are ex-pected to be conditioned by all the above considerations.More specifically, absence of universality in the values ofthe determined exponents, cutoffs in the linearity found indouble-logarithmic scale, and juxtapositions of more thanone linear regions with different exponents for differentranges of length scales (see e.g., figs. 1d and 3d) may be at-tributed to one ormore of the above limitations, justified bythe complexity of genomic evolution. Notice that all thesefeatures can be found in the figures presented herein.
The value of idealized models like the one proposedhere (see also Li 1992; Li and Kaneko 1992; Buldyrev et al.1993; Nikolaou and Almirantis 2005), which may be solvedor simulated producing features qualitatively similar to theobserved genomic regularities, lies in their use as roadmapsto form plausible scenarios for the causal explanation of thegenomic structure and function.
In the following, we shall investigate the possibilitythat the described simple insertion–elimination mechanismmay explain our findings about the distributional features ofAlu and LINE1 repeats. The insertion of external segmentsinto the genome is well established, thus it will not be fur-ther discussed, whereas evidence (based upon the relatedliterature) about the occasional loss of repeats of a givenpopulation, allowing adjacent spacers to merge, is pre-sented in the next subsection.
Regular Occurrence of Repeat Elimination Events duringGenomic Evolution
Eliminations of initially retroposed elements, either bygradual corruption or by several types of recombinationevents, are extensively discussed in the literature. A consid-erable part of that discussion is devoted to the possibilitythat preferential elimination of Alu elements from theAT-rich regions may have resulted into the observed shiftof the old Alu distribution, as briefly discussed in the In-troduction. For the purposes of our search, no such massiveoccurrence of elimination events is necessary. As simula-tions verify, a moderated elimination activity (events of‘‘type i’’), alongside with the insertion of ‘‘next genera-tions’’ of repeat families (events of ‘‘type ii’’) in the genome,
Power Laws in Repeat Distributions 2389
by guest on July 6, 2015http://m
be.oxfordjournals.org/D
ownloaded from
would be sufficient to produce power-law type interrepeatdistances’ distributions.
As discussed by several authors (see e.g., Pavliceket al. 2001; Deininger and Batzer 2002; Hackenberget al. 2005), long-term negative selection may have actedon Alus in the AT-rich regions. One reason for the selec-tional pressure for their elimination may be the severe al-teration of local composition of AT-rich regions when Alusare inserted, whereas the same may apply in the case ofLINE1s inserted in GC-rich regions. Probably this is thecause why severely truncated LINE1s survive relativelylonger in the genome in comparison with intact ones.
Webster et al. (2003) and Belle et al. (2005) havefound, comparing human and chimpanzee genomic sequen-ces, that the rate of decomposition due to single nucleotidesubstitutions or indel events does not depend on the GCcontent of the surrounding region. Thus, they concludedthat the scarceness of Alus in AT-rich regions could notbe explained in terms of composition divergence betweenrepeats and surrounding sequence. However, these resultsare derived only from the recent evolutionary past afterthe human–chimpanzee divergence. We know that duringthe time of rapid Alu propagation in the primate genome, thefrequency of insertion events was about 100 times the pres-ent frequency (Shen et al. 1991). Possibly, for sufficientlyhigh values of Alu abundance, unequal homologous Alu–Alu recombination events lead to deletions, reducing theAlu number in AT-rich compartments. Moreover, whena tolerance threshold in the Alu abundance is crossed,the chromatin structure may be severely altered, resultinginto counterselection of further Alu accumulation in theseregions (Deininger and Batzer 2002). Evidence for the needof constitutional similarity between the intruding sequenceand the position of insertion in retroviral integration is givenby Rynditch et al. (1998). As it was pointed out (Filipskiet al. 1989; see also Gu et al. 2000), Alu sequences can un-dergo compositional matching to their surrounding region.The literature cited above seems to indicate that simple deg-radation and indel events cannot make repeats to disappear,at least in relatively short evolutionary time intervals. Onthe other hand, a selective pressure may favor the elimina-tion of Alu and other TEs, mainly by recombination events,when the genomic architecture and function are disturbed.Moreover, neutral (not selection driven) eliminations mayalso occur.
One way of systematic repeat deletion based on re-combination is found to be the elimination of nearby lo-cated inverted repeats. As extensively studied in the caseof Alu elements, pairs of closely interspersed Alus of in-verse orientation are considerably underrepresented inthe human genome (Stenger et al. 2001). The probabilityof elimination of these pairs of nearby inverted repeats de-pends inversely on their distance and on their percentage ofsimilarity. However, very close similarity is not required:pairs of inverse Alus only 86% similar can efficiently stim-ulate recombination (Lobachev et al. 2000). So, the inser-tion of a repeat closely enough to an older one of the samesubfamily (but not necessarily a transpositionally activeone) may trigger their mutual elimination. In this case,the spacer between the repeats is removed while the 2 sur-rounding spacers ‘‘merge.’’ More recent evidence on the
occurrence of this type of repeat elimination events is pro-vided by the comparison of the initial sequence of the chim-panzee genome with the human genome (CSAC 2005). Itwas found that in the short evolutionary time after the di-vergence of human and chimpanzee genomes, several hun-dred eliminations of adjacent pairs of Alu, LINE1, andretroviral repeats (present in their common ancestor) haveoccurred in both genomes. In the same study, it is specifiedthat such recombination events have occurred even whenthe divergence between adjacent Alus was .25%. Thus,recombination-driven elimination may occur even betweenmembers of different Alu subfamilies.
Power Laws in Alu and LINE1 Distributions: Propertiesand Features
The principal finding about genomic organization ofthis study is the existence of power laws in the size distri-butions of the distances between consecutive repeats ofmost Alu and LINE1 repeat classes in human chromo-somes. In this subsection, these power-law distributionsare systematically studied and relations between genomeproperties and distribution parameters are set forward whilethe validity of the proposed insertion–elimination model isassessed on the basis of these relations.
The Role of Divergence for Alus and of Length forLINE1s
Let us first present the main results of our work for Aluelements. The considered classes of Alu elements are the 4high-population subfamilies of Alus: Jo, Jb, Sx, and Y,which are the only groups with sufficient numbers ofAlu elements in all chromosomes for a reliable statisticalanalysis. Preliminary work with the data provided by theapplication of RepeatMasker (see Methods) has shown thatthe most pronounced power laws are observed when onlya fraction of Alu repeats of a given subfamily in each chro-mosome is considered. These repeats are always those thatdo not diverge from the subfamily consensus beyond a cer-tain limit. This divergence is measured as defined inRepeatMasker (Smit et al. 1996–2004; www.repeatmasker.org). The limit taken in each case is denoted by maximumdivergence in the presented figures. We consider that theoptimum for a power law is reached when the extent ofthe linear region of the curve in double-logarithmic scaleis maximized, provided a sufficiently high value of r2 whenapplying linear regression (in all accepted cases r2 . 0.97).In all chromosomes, the 3 older families (Jo, Jb, and Sx)present power-law behavior. The extent (E) of these powerlaws ranges up to 3 orders of magnitude, whereas l is lessthan 2 in all Alu distributions with one exception (wherel 5 2.05). Some examples are included in figure 1, andthe full set of our results is given in table 1. In the supple-mentary material (Supplementary Material online), an ex-tended version of table 1 is provided. Figure 1d isrepresentative of a few cases of graphs showing 2 extendedlinear regions with different slopes. Interestingly, consider-ing the (much younger) AluY subfamily, a power-law sizedistribution of interrepeat distances is formed in no more
2390 Sellis et al.
by guest on July 6, 2015http://m
be.oxfordjournals.org/D
ownloaded from
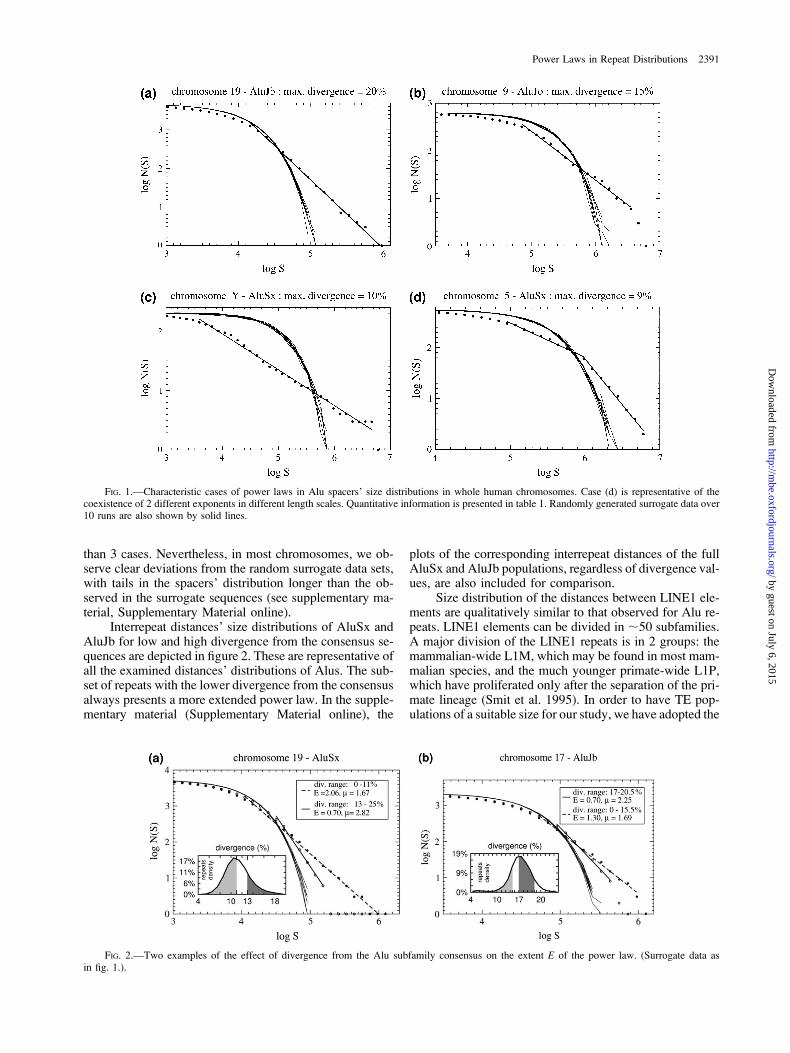
than 3 cases. Nevertheless, in most chromosomes, we ob-serve clear deviations from the random surrogate data sets,with tails in the spacers’ distribution longer than the ob-served in the surrogate sequences (see supplementary ma-terial, Supplementary Material online).
Interrepeat distances’ size distributions of AluSx andAluJb for low and high divergence from the consensus se-quences are depicted in figure 2. These are representative ofall the examined distances’ distributions of Alus. The sub-set of repeats with the lower divergence from the consensusalways presents a more extended power law. In the supple-mentary material (Supplementary Material online), the
plots of the corresponding interrepeat distances of the fullAluSx and AluJb populations, regardless of divergence val-ues, are also included for comparison.
Size distribution of the distances between LINE1 ele-ments are qualitatively similar to that observed for Alu re-peats. LINE1 elements can be divided in ;50 subfamilies.A major division of the LINE1 repeats is in 2 groups: themammalian-wide L1M, which may be found in most mam-malian species, and the much younger primate-wide L1P,which have proliferated only after the separation of the pri-mate lineage (Smit et al. 1995). In order to have TE pop-ulations of a suitable size for our study, we have adopted the
FIG. 1.—Characteristic cases of power laws in Alu spacers’ size distributions in whole human chromosomes. Case (d) is representative of thecoexistence of 2 different exponents in different length scales. Quantitative information is presented in table 1. Randomly generated surrogate data over10 runs are also shown by solid lines.
FIG. 2.—Two examples of the effect of divergence from the Alu subfamily consensus on the extent E of the power law. (Surrogate data asin fig. 1.).
Power Laws in Repeat Distributions 2391
by guest on July 6, 2015http://m
be.oxfordjournals.org/D
ownloaded from
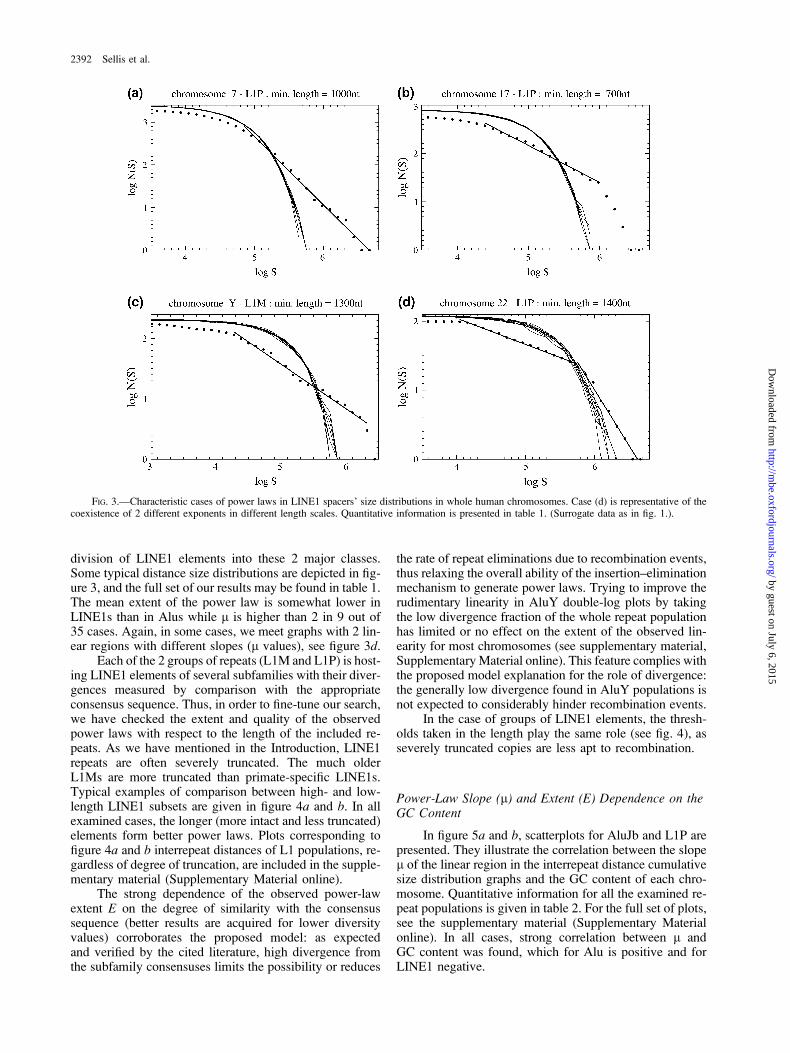
division of LINE1 elements into these 2 major classes.Some typical distance size distributions are depicted in fig-ure 3, and the full set of our results may be found in table 1.The mean extent of the power law is somewhat lower inLINE1s than in Alus while l is higher than 2 in 9 out of35 cases. Again, in some cases, we meet graphs with 2 lin-ear regions with different slopes (l values), see figure 3d.
Each of the 2 groups of repeats (L1M and L1P) is host-ing LINE1 elements of several subfamilies with their diver-gences measured by comparison with the appropriateconsensus sequence. Thus, in order to fine-tune our search,we have checked the extent and quality of the observedpower laws with respect to the length of the included re-peats. As we have mentioned in the Introduction, LINE1repeats are often severely truncated. The much olderL1Ms are more truncated than primate-specific LINE1s.Typical examples of comparison between high- and low-length LINE1 subsets are given in figure 4a and b. In allexamined cases, the longer (more intact and less truncated)elements form better power laws. Plots corresponding tofigure 4a and b interrepeat distances of L1 populations, re-gardless of degree of truncation, are included in the supple-mentary material (Supplementary Material online).
The strong dependence of the observed power-lawextent E on the degree of similarity with the consensussequence (better results are acquired for lower diversityvalues) corroborates the proposed model: as expectedand verified by the cited literature, high divergence fromthe subfamily consensuses limits the possibility or reduces
the rate of repeat eliminations due to recombination events,thus relaxing the overall ability of the insertion–eliminationmechanism to generate power laws. Trying to improve therudimentary linearity in AluY double-log plots by takingthe low divergence fraction of the whole repeat populationhas limited or no effect on the extent of the observed lin-earity for most chromosomes (see supplementary material,SupplementaryMaterial online). This feature complies withthe proposed model explanation for the role of divergence:the generally low divergence found in AluY populations isnot expected to considerably hinder recombination events.
In the case of groups of LINE1 elements, the thresh-olds taken in the length play the same role (see fig. 4), asseverely truncated copies are less apt to recombination.
Power-Law Slope (l) and Extent (E) Dependence on theGC Content
In figure 5a and b, scatterplots for AluJb and L1P arepresented. They illustrate the correlation between the slopel of the linear region in the interrepeat distance cumulativesize distribution graphs and the GC content of each chro-mosome. Quantitative information for all the examined re-peat populations is given in table 2. For the full set of plots,see the supplementary material (Supplementary Materialonline). In all cases, strong correlation between l andGC content was found, which for Alu is positive and forLINE1 negative.
FIG. 3.—Characteristic cases of power laws in LINE1 spacers’ size distributions in whole human chromosomes. Case (d) is representative of thecoexistence of 2 different exponents in different length scales. Quantitative information is presented in table 1. (Surrogate data as in fig. 1.).
2392 Sellis et al.
by guest on July 6, 2015http://m
be.oxfordjournals.org/D
ownloaded from

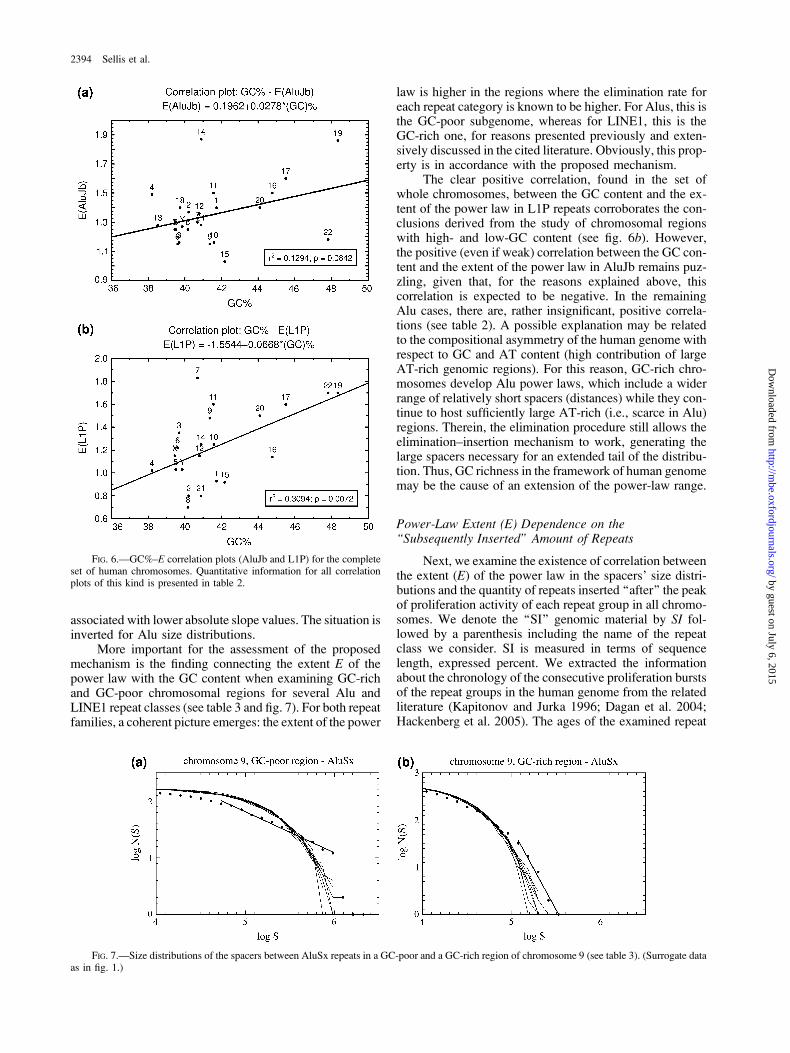
No such clear correlation has been found between Eand GC content for whole chromosomes. In most cases,correlation is weak or absent (see table 2, fig. 6a), whereasa clear positive correlation is found only for L1P (fig. 6b).
Taking into account the isochore structure of humangenome (Pavlicek, Paces, et al. 2002), we have examined(in each chromosome) pairs of regions, one with high- and
one with low-GC content. Here a coherent picture emerges.The extent of linearity (power-law behavior, measured byE) clearly depends on the GC content: inter-Alu spacers’size distributions present high E values in the GC-poor re-gions and low E values (or even absence of power law) inthe GC-rich regions. For LINE1s, the situation is com-pletely inverted. Examples are presented in figure 7a andb, whereas a quantitative account for 2 pairs of chromo-somal regions is given in table 3. Notice that the resultsof the analysis for chromosomal regions totally complywith the type of dependence between l and GC contentfound for complete chromosomes.
The correlation between GC content and l value(positive for LINE1 and negative for Alu) may be easilyexplained on the grounds of relative preference for GC-and AT-rich regions of these 2 repeat classes, in combina-tion with the patchy chromosome structure with respect toGC/AT constitution. GC-rich chromosomes have a signifi-cant contribution of regions with high-GC content, the Hisochores, in their structure (i.e., large regions with reducedLINE1 populations) and are consequently characterized byan abundance of large spacers. Assuming a linear size dis-tribution of spacers between LINE1 elements in double-logscale, a ‘‘fatter’’ tail is formed. Such a distribution is
FIG. 4.—Two examples of the effect of the length of truncated LINE1 repeats on the extent E of the power law. (Surrogate data as in fig. 1.).
FIG. 5.—GC%–l correlation plots (AluJb and L1P) for the completeset of human chromosomes. Quantitative information for all correlationplots of this kind is presented in table 2.
Table 2Correlation between i) GC Content and Slope (m) and ii) GCContent and the Extent (E) of the Power Law for SeveralRepeat Classes in All Human Chromosomes
Repeat Class Regression Line Slope r2 P Value
GC%–l correlationsAluJo 0.1008 0.5136 0.00008AluJb (fig. 5a) 0.1029 0.5870 0.00001AluSx 0.1104 0.3884 0.0011L1M �0.1715 0.4874 0.008L1P (fig. 5b) �0.1713 0.6704 0.000003GC%–E correlationsAluJo 0.0137 0.0112 0.6219AluJb (fig. 6a) 0.0278 0.1294 0.0842AluSx 0.0378 0.0452 0.3187L1M 0.0057 0.0020 0.8843L1P (fig. 6b) 0.0668 0.3094 0.0072
NOTE.—For all plots, see supplementary material (Supplementary Material
online).
Power Laws in Repeat Distributions 2393
by guest on July 6, 2015http://m
be.oxfordjournals.org/D
ownloaded from
associated with lower absolute slope values. The situation isinverted for Alu size distributions.
More important for the assessment of the proposedmechanism is the finding connecting the extent E of thepower law with the GC content when examining GC-richand GC-poor chromosomal regions for several Alu andLINE1 repeat classes (see table 3 and fig. 7). For both repeatfamilies, a coherent picture emerges: the extent of the power
law is higher in the regions where the elimination rate foreach repeat category is known to be higher. For Alus, this isthe GC-poor subgenome, whereas for LINE1, this is theGC-rich one, for reasons presented previously and exten-sively discussed in the cited literature. Obviously, this prop-erty is in accordance with the proposed mechanism.
The clear positive correlation, found in the set ofwhole chromosomes, between the GC content and the ex-tent of the power law in L1P repeats corroborates the con-clusions derived from the study of chromosomal regionswith high- and low-GC content (see fig. 6b). However,the positive (even if weak) correlation between the GC con-tent and the extent of the power law in AluJb remains puz-zling, given that, for the reasons explained above, thiscorrelation is expected to be negative. In the remainingAlu cases, there are, rather insignificant, positive correla-tions (see table 2). A possible explanation may be relatedto the compositional asymmetry of the human genome withrespect to GC and AT content (high contribution of largeAT-rich genomic regions). For this reason, GC-rich chro-mosomes develop Alu power laws, which include a widerrange of relatively short spacers (distances) while they con-tinue to host sufficiently large AT-rich (i.e., scarce in Alu)regions. Therein, the elimination procedure still allows theelimination–insertion mechanism to work, generating thelarge spacers necessary for an extended tail of the distribu-tion. Thus, GC richness in the framework of human genomemay be the cause of an extension of the power-law range.
Power-Law Extent (E) Dependence on the‘‘Subsequently Inserted’’ Amount of Repeats
Next, we examine the existence of correlation betweenthe extent (E) of the power law in the spacers’ size distri-butions and the quantity of repeats inserted ‘‘after’’ the peakof proliferation activity of each repeat group in all chromo-somes. We denote the ‘‘SI’’ genomic material by SI fol-lowed by a parenthesis including the name of the repeatclass we consider. SI is measured in terms of sequencelength, expressed percent. We extracted the informationabout the chronology of the consecutive proliferation burstsof the repeat groups in the human genome from the relatedliterature (Kapitonov and Jurka 1996; Dagan et al. 2004;Hackenberg et al. 2005). The ages of the examined repeat
FIG. 6.—GC%–E correlation plots (AluJb and L1P) for the completeset of human chromosomes. Quantitative information for all correlationplots of this kind is presented in table 2.
FIG. 7.—Size distributions of the spacers between AluSx repeats in a GC-poor and a GC-rich region of chromosome 9 (see table 3). (Surrogate dataas in fig. 1.)
2394 Sellis et al.
by guest on July 6, 2015http://m
be.oxfordjournals.org/D
ownloaded from

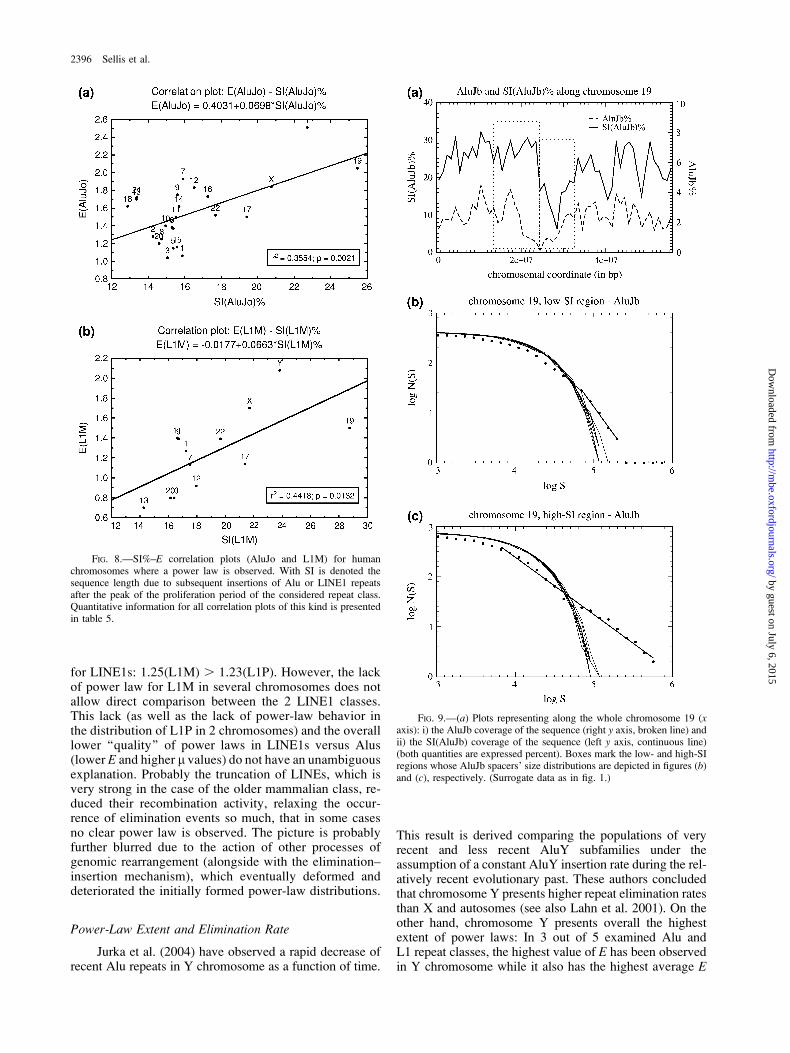
families generate the following order: L1M . AluJo .AluJb . AluSx . L1P . AluY (see table 4). This orderdoes not exclude some retroposing activity of a group,whereas the next one has started to proliferate. It seems thatespecially AluSx has continued to retropose during much ofthe time of the LINE1P proliferation activity. However, thepeak of the AluSx proliferation has preceded that of L1P(Ohshima et al. 2003; Hackenberg et al. 2005). Notice thatSI, as defined here, does not include the totality of the in-serted material, such as simple repeats, minor Alu subfami-lies, and other retroelements. In table 5, the quantitativeinformation from this study is given, whereas in figure8a and b, correlation diagrams for AluJo and L1M are de-picted. In all cases, positive correlation is found between theextent of the power-law behavior and the amount of repeatsinserted into the chromosome after the peak of the activeproliferation of the examined repeat population. We note thatin the case of AluJb, the values of P and r2 indicate a mar-ginally low correlation.
In order to further corroborate and extend the resultsacquired for whole chromosomes, we attempted a genome-wide search for pairs of sequence regions in each chromo-some with a significant difference in the mean amount ofinserted sequence length after the active proliferation periodof a given repeat family. Then we compared the extent ofthe power law in these 2 regions (same methodology withthe one followed for high and low GC%). For a typical ex-ample, see figure 9b and c, where AluJb spacers’ distribu-tions for a pair of SI(AluJb)-low/SI(AluJb)-high regions ofchromosome 19 are compared, and figure 9a, where theSI(AluJb) profile is given for the whole chromosome 19.See table 6 for the results of all the examined cases. In re-
gions with high contrast in the SI material for a given repeatclass, the differences in the extent of the correspondingpower law are impressive. In most cases, one may observe2- to 3-fold increase of the E value in the SI-rich region.These results are in accordance with the findings derivedfrom the study of entire chromosomes. See in the supple-mentary material (Supplementary Material online) for thefull set of plots and in Methods about the difficulties to lo-cate many chromosomal regions with SI contrast suitablefor our study.
The (always) positive E–SI correlation reflects theneed, on the basis of the proposedmechanism, of a sufficientamount of inserted material in order for a power-law distri-bution to be formed (see fig. 10). This result is corroboratedby the clearly contrasting behavior of pairs of chromosomalregions within the same chromosome, which significantlydiffer in their relative amount of SI sequences (see table 6and for examples fig. 9).
Correlation of the Extent of the Observed Power Lawswith Repeats’ Ages
The scarceness of power-law behavior in the case ofthe ‘‘young’’ AluY elements is compatible with the pro-posed mechanism, when taking into account that no con-siderable amount of more recent insertions has occurred.The mean extent of the observed power law for the olderAlu subfamilies increases with age (see table 1). Age isa measure for both the amount of more recently insertedmaterial and the total number of elimination events foreach subfamily. Mean values of E are 1.55(AluJo) .1.35(AluJb) . 1.31(AluSx). The same is marginally true
Table 3Quantitative Information (by Regression Analysis) aboutPower Laws Observed in Chromosomal Regions of High-and Low-GC Content
Repeat Class GC Content E l r2
Chromosome 1a
AluJb Poor 1.60 0.80 0.9961Rich 1.25 1.77 0.9967
AluJo Poor 1.14 0.71 0.9910Rich 1.04 1.75 0.9880
L1M Poor 0.80 1.68 0.9951Rich 1.35 1.08 0.9917
L1P Poor 0.56 2.11 0.9933Rich 1.09 1.60 0.9537
Chromosome 9b
AluJb Poor 1.14 1.04 0.9877Rich 0.80 2.19 0.9710
AluJo Poor 1.48 0.68 0.9753Rich 0.70 2.49 0.9869
AluSx (fig. 7) Poor 1.25 0.72 0.9898Rich 0.44 3.46 0.9815
L1M Poor 0.80 2.14 0.9926Rich 1.25 1.14 0.9617
L1P Poor 0.96 1.97 0.9894Rich 1.13 0.78 0.9861
NOTE.—For all plots, see supplementary material (Supplementary Material
online).a GC-poor region: 68–105 Mb (GC% 5 37.4), GC-rich region: 0–37 Mb
(GC% 5 48.2).b GC-poor region: 2–32 Mb (GC% 5 37.7), GC-rich region: 100–117.7 Mb
(GC% 5 49.3).
Table 4Detailed List of the Repeat Classes Included in the SIGenomic Fraction Associated to the Repeat Families StudiedHerein
Repeat Class Subsequently Inserted Repeats (SI) of a Repeat Class
L1M SI(L1M) 5 L1P þ AluAluJo SI(AluJo) 5 L1P þ Alu � AluJoAluJb SI(AluJb) 5 L1P þ Alu � AluJo � AluJbAluSx SI(AluSx) 5 L1P þ AluYL1P SI(L1P) 5 AluY
NOTE.—These quantities are computed using data from the standard output of
RepeatMasker. Here with ‘‘Alu,’’ we denote the total sequence length expressed
percent of Alu repeats in a given chromosome or genomic region.
Table 5Correlation between SI Content and the Extent (E) of thePower Law for Several Repeat Classes
Correlation Regression Line Slope r2 P Value
SI(AluJo)%–E(AluJo)a 0.0698 0.3554 0.0021SI(AluJb)%–E(AluJb) 0.0242 0.1058 0.1210SI(AluSx)%–E(AluSx) 0.0844 0.2215 0.0203SI(L1M)%–E(L1M)b 0.0663 0.4418 0.0132SI(L1P)%–E(L1P) 0.3360 0.2632 0.0146
NOTE.—For all plots, see supplementary material (Supplementary Material
online).a See also figure8a.b See also figure 8b.
Power Laws in Repeat Distributions 2395
by guest on July 6, 2015http://m
be.oxfordjournals.org/D
ownloaded from
for LINE1s: 1.25(L1M) . 1.23(L1P). However, the lackof power law for L1M in several chromosomes does notallow direct comparison between the 2 LINE1 classes.This lack (as well as the lack of power-law behavior inthe distribution of L1P in 2 chromosomes) and the overalllower ‘‘quality’’ of power laws in LINE1s versus Alus(lower E and higher l values) do not have an unambiguousexplanation. Probably the truncation of LINEs, which isvery strong in the case of the older mammalian class, re-duced their recombination activity, relaxing the occur-rence of elimination events so much, that in some casesno clear power law is observed. The picture is probablyfurther blurred due to the action of other processes ofgenomic rearrangement (alongside with the elimination–insertion mechanism), which eventually deformed anddeteriorated the initially formed power-law distributions.
Power-Law Extent and Elimination Rate
Jurka et al. (2004) have observed a rapid decrease ofrecent Alu repeats in Y chromosome as a function of time.
This result is derived comparing the populations of veryrecent and less recent AluY subfamilies under theassumption of a constant AluY insertion rate during the rel-atively recent evolutionary past. These authors concludedthat chromosome Y presents higher repeat elimination ratesthan X and autosomes (see also Lahn et al. 2001). On theother hand, chromosome Y presents overall the highestextent of power laws: In 3 out of 5 examined Alu andL1 repeat classes, the highest value of E has been observedin Y chromosome while it also has the highest average E
FIG. 8.—SI%–E correlation plots (AluJo and L1M) for humanchromosomes where a power law is observed. With SI is denoted thesequence length due to subsequent insertions of Alu or LINE1 repeatsafter the peak of the proliferation period of the considered repeat class.Quantitative information for all correlation plots of this kind is presentedin table 5.
FIG. 9.—(a) Plots representing along the whole chromosome 19 (xaxis): i) the AluJb coverage of the sequence (right y axis, broken line) andii) the SI(AluJb) coverage of the sequence (left y axis, continuous line)(both quantities are expressed percent). Boxes mark the low- and high-SIregions whose AluJb spacers’ size distributions are depicted in figures (b)and (c), respectively. (Surrogate data as in fig. 1.)
2396 Sellis et al.
by guest on July 6, 2015http://m
be.oxfordjournals.org/D
ownloaded from
value (see table 1). The combination of the result ofJurka et al. (2004) with our findings corroborates theproposed insertion–elimination mechanism for the gen-eration of power laws in the interrepeat distances’ sizedistributions.
Conclusions and Perspectives
As we presented in detail in the previous section, theinterrepeat distances’ size distributions for Alus andLINE1s in the human genome follow, in most cases, powerlaws, which in some cases reach an extent of 3 orders ofmagnitude. The proposed insertion–elimination model,based in simple and well-known molecular events, may ex-
plain this finding and complies with the genomic and dis-tributional features studied so far. These molecular eventsoccurring mainly in noncoding regions are essentially neu-tral. As already mentioned, they are controlled by thresh-olds imposed by the condition not to affect the viabilityof the organism. They are rather tolerated than selected,belonging to the zone of genomic dynamics called byHolmquist (1989) as ‘‘molecular ecology of the noncodingDNA.’’ Thus, no direct biological significance may be as-signed to the power-law size distributions engendered bythis dynamics. These size distributions are associated toself-similarity and fractality (Mandelbrot 1982; Feder1988) of the genome, which may be indirectly related toits 3-dimensional structure, aptitude to absorb externallyintruding sequences, and the use of its extended noncodingparts as a potential source of biological information inevolutionary time.
In a preliminary examination of the mouse genome,the generality of some of the results derived from the humangenome study was verified. Four SINE families (B1_Mus1,B3, RSINE1, and B3A) and one LINE group (L1M, themammalian-wide L1) have been selected on the basis oftheir copy number and age. As expected, in the case ofthe younger B1_Mus1 (found only in the Mus genus),the poorest result is met: practically no power law is ob-served. For the older, rodent-wide B3, RSINE1, andB3A families, clear evidence of power law is found whenconsidering the range of low divergences from each familyconsensus. In accordance to the prediction of the insertion–elimination model, when the upper range of divergence val-ues is considered, the same repeat families give poor or noevidence of power-law occurrence. In the case of L1M, asin the human genome, the grouping of several repeat fam-ilies together makes length the appropriate parameter in or-der to assess the influence of elimination propensity in theextent of the power law. Again, in accordance to the pro-posed model, the less truncated repeat collection gives themore pronounced power law. For the corresponding fig-ures, see in the supplementary material (SupplementaryMaterial online).
The systematic study of a collection of genomes ofrepresentative organisms for the distributional features oftheir repeat populations is undertaken and will be presentedin a future work.
Table 6Quantitative Information (by Regression Analysis) aboutPower Laws Observed in Chromosomal Regions of High-and Low-SI% Content
Repeat Class SI% Content E l r2
Chromosome 19a
AluJo Low: 16.37 0.68 2.41 0.9941High: 31.22 1.03 1.97 0.9921
Chromosome 19b
AluJbc Low: 14.96 0.46 2.17 0.9968High: 27.21 1.93 1.15 0.9905
L1M Low: 14.96 0.56 2.3 0.9906High: 32.63 1.17 1.51 0.9801
Chromosome Xd
AluJo Low: 15.04 1.12 0.51 0.9863High: 34.54 2.28 0.62 0.9801
AluJb Low: 12.53 0.8 0.63 0.9964High: 33.15 1.6 0.43 0.9790
AluSx Low: 7.28 1.02 0.68 0.9858High: 29.43 1.97 0.64 0.9946
Chromosome 19e
L1M Low: 18.46 0.8 1.93 0.9901High: 33.08 1.49 1.78 0.9851
NOTE.—For all plots, see supplementary material (Supplementary Material
online).a Low-SI region: 4.3–32.7 Mb, high-SI region: 7.7–15 Mb.b Low-SI region: 4.3–32.7 Mb, high-SI region: 13.5–24.3 Mb.c See also figure 9.d Low-SI region: 3.5–32 Mb, high-SI region: 54–79 Mb.e Low-SI region: 115–150 Mb, high-SI region: 50–80 Mb.
FIG. 10.—Two typical examples of (transient) power-law size distributions generated by the insertion–elimination model. For details, see Methods.The slope standard deviation is 0.071 for (a) and 0.116 for (b).
Power Laws in Repeat Distributions 2397
by guest on July 6, 2015http://m
be.oxfordjournals.org/D
ownloaded from

Supplementary Material
Supplementary material and extended table 1 areavailable at Molecular Biology and Evolution online(http://www.mbe.oxfordjournals.org/).
Acknowledgments
We would like to thank the RepeatMasker and Re-pBase teams for allowing us to install and use the necessaryprograms and databases for the study of repeats in humanchromosomes. We are grateful to Dr L. Peristeras and DrTh. Georgomanolis for their helpful assistance in the instal-lation and configuration of Linux and RepeatMasker and toMrs N. Chousou-Polydouri for her valuable suggestionsduring the final preparation of the manuscript. We wouldalso like to thank the 2 anonymous referees whose com-ments have considerably improved the present work. Wethank National Center for Scientific Research ‘‘Demokritos’’for financial support.
Literature Cited
Adamic LA, Huberman BA. 2002. Zipf’s law and the internet.Glottometrics. 3:143–150.
Almirantis Y, Provata A. 1999. A long- and short-rangecorrelations in genome organization. J Stat Phys. 97:233–262.
Arneodo A, Bacry E, Graves PV, Muzy JF. 1995. Characterizinglong-range correlations in DNA-sequences from waveletanalysis. Phys Rev Lett. 74:3293–3296.
Audit B, Thermes C, Vaillant C, D’aubenton-Carafa Y, Muzy JF,Ameodo A. 2001. Long-range correlations in genomic DNA:a signature of the nucleosomal structure. Phys Rev Lett.86:2471–2474.
Batzer MA, Deininger PL, Hellmann-Blumberg U, Jurka J,Labuda D, Rubin CM, Schmid CW, Zietkiewicz E,Zuckerkandl E. 1999. Standardized nomenclature for Alurepeats. J Mol Evol. 42:3–6.
Belle EMS, Webster MT, Eyre-Walker A. 2005. Why are youngand old repetitive elements distributed differently in thehuman genome? J Mol Evol. 60:290–296.
Bernardi G. 2000a. The compositional evolution of vertebrategenomes. Gene. 251:31–43.
Bernardi G. 2000b. Isochores and the evolutionary genomics ofvertebrates. Gene. 241:3–17.
Brookfield JFY. 2001. Selection on Alu sequences? Curr Biol.11:R900–R901.
Buldyrev SV, Goldberger AL, Havlin S, Peng CK, Stanley HE,Stanley MHR, Simons M. 1993. Fractal landscapes andmolecular evolution: modeling the myosin heavy-chain genefamily. Biophys J. 65:2673–2679.
[CSAC] The Chimpanzee Sequencing and Analysis Consortium.2005. Initial sequence of the chimpanzee genome andcomparison with the human genome. Nature. 437:69–87.
Cohen N, Dagan T, Stone L, Graur D. 2005. GC composition ofthe human genome: in search of isochores. Mol Biol Evol.22:1260–1272.
Dagan T, Sorek R, Sharon E, Ast G, Graur D. 2004. AluGene:a database of Alu elements incorporated within protein-codinggenes. Nucleic Acids Res. 32:D489–D492 Sp. Iss. SI.
Deininger PL, Batzer MA. 1999. Alu repeats and human disease.Mol Genet Metab. 67:183–193.
Deininger PL, Batzer MA. 2002. Mammalian retroelements.Genome Res. 12:1455–1465.
DewannieuxM,EsnaultC,HeidmannT.2003.LINE-mediated retro-transposition of marked Alu sequences. Nat Genet. 35:41–48.
Feder J. 1988. Fractals. New York: Plenum Press.Filipski J, Salinas J, Rodier F. 1989. Chromosome localization-
dependent compositional bias of point mutations in Alurepetitive sequences. J Mol Biol. 206:563–566.
Gish W. 2003. WU-BLAST 2.0. [Internet]. [cited 2007 Novem-ber]; Available from http://blast.wustl.edu.
Gu Z, Wang H, Nekrutenko A, Li W-H. 2000. Densities, lengthproportions, and other distributional features of repetitivesequences in the human genome estimated from 430megabases of genomic sequence. Gene. 259:81–88.
Hackenberg M, Bernaola-Galvan P, Carpena P, Oliver JL. 2005.The biased distribution of Alus in human isochores might bedriven by recombination. J Mol Evol. 60:365–377.
Holmquist G. 1989. Evolution of chromosomal bands: molecularecology of noncoding DNA. J Mol Evol. 28:469–486.
Jullien R, Botet R. 1987. Aggregation and fractal aggregates.Singapore: World Scientific.
Jurka J. 2000. Repbase update: a database and an electronicjournal of repetitive elements. Trends Genet. 16:418–420.
Jurka J, Kohany O, Pavlicek A, Kapitonov VV, Jurka MV. 2004.Duplication, co-clustering, and selection of human Aluretrotransposons. Proc Natl Acad Sci USA. 101:1268–1272.
Kapitonov V, Jurka J. 1996. The age of Alu subfamilies. J MolEvol. 42:59–65.
Lahn BT, Pearson NM, Jegalian K. 2001. The human Y chromo-some, in the light of evolution. Nat Rev Genet. 2:207–216.
Li W. 1992. Generating nontrivial long-range correlations and 1/fspectra by replication and mutation. Int J Bifurcat Chaos.2:137–154.
Li W. 2002. Zipf’s law everywhere. Glottometrics. 5:14–21.Li W, Kaneko K. 1992. Long-range correlation and partial 1/f-
alpha spectrum in a noncoding DNA-sequence. EurophysLett. 17:655–660.
Lobachev KS, Stenger JE, Kozyreva OG, Jurka J, Gordenin DA,Resnick MA. 2000. Inverted Alu repeats unstable in yeast areexcluded from the human genome. EMBO J. 19:3822–3830.
Makalowski W. 2003. Not junk after all. Science. 300:1246–1247.Mandelbrot BB. 1982. The fractal geometry of nature. San
Francisco, CA: W.H. Freeman.Mantegna RN, Buldyrev SN, Goldberger AL, Havlin S,
Peng CK, Simons M, Stanley HE. 1994. Linguistic featuresof noncoding DNA-sequences. Phys Rev Lett. 73:3169–3172.
Medstrand P, van de Lagemaat LN, Mager DL. 2002. Retroele-ment distributions in the human genome: variations associatedwith age and proximity to genes. Genome Res. 12:1483–1495.
Newman MEJ. 2005. Power laws, Pareto distributions and Zipf’slaw. Contemp Phys. 46:323–351.
NikolaouC,AlmirantisY. 2005. ‘‘Word’’ preference in the genomictext and genome evolution: different modes of n-tuplet usage incoding and noncoding sequences. J Mol Evol. 61:23–35.
Ohshima K, Hattori M, Yada T, Gojobori T, Sakaki Y, Okada N.2003. Whole-genome screening indicates a possible burst offormation of processed pseudogenes andAlu repeats by particularL1 subfamilies in ancestral primates.GenomeBiol. 4:ArtNo.R74.
Ostertag EM, Kazazian HH. 2001. Biology of mammalian L1retrotransposons. Annu Rev Genet. 35:501–538.
Pavlicek A, Clay O, Bernardi G. 2002. Transposable elementsencoding functional proteins: pitfalls in unprocessed genomicdata? FEBS Lett. 523:252–253.
Pavlicek A, Jabbari K, Paces J, Paces V, Hejnar J, Bernardi G.2001. Similar integration but different stability of Alus andLINEs in the human genome. Gene. 276:39–45.
Pavlicek A, Paces J, Clay O, Bernardi G. 2002. A compact viewof isochores in the draft human genome sequence. FEBS Lett.511:165–169.
2398 Sellis et al.
by guest on July 6, 2015http://m
be.oxfordjournals.org/D
ownloaded from
Peng CK, Buldyrev SV, Goldberger AL, Havlin S, Sciortino F,Simons M, Stanley HE. 1992. Long-range correlations innucleotide-sequences. Nature. 356:168–170.
Provata A, Almirantis Y. 1997. Scaling properties of coding andnon-coding DNA sequences. Physica A. 247:482–496.
RynditchAV,ZoubakS,TsybaL,Tryapitsina-GuleyN,BernardiG.1998. The regional integration of retroviral sequences into themosaic genomes of mammals. Gene. 222:1–16.
Shen MR, Batzer MA, Deininger PL. 1991. Evolution of themaster Alu gene(s). J Mol Evol. 33:311–320.
Smit AFA, Hubley R, Green P. 1996-2004. RepeatMasker Open-3.0. [Internet]. [cited 2007 November]; Available from: http://www.repeatmasker.org].
Smit AFA, Toth G, Riggs AD, Jurka J. 1995. Ancestral,mammalian-wide subfamilies of line-1 repetitive sequences. JMol Biol. 246:401–417.
Sorek R, Ast G, Graur D. 2002. Alu-containing exons arealternatively spliced. Genome Res. 12:1060–1067.
Stenger JE, Lobachev KS, Gordenin D, Darden TA, Jurka J,Resnick MA. 2001. Biased distribution of inverted and direct
Alus in the human genome: implications for insertion,exclusion, and genome stability. Genome Res. 11:12–27.
Sverdlov ED. 2000. Retroviruses and primate evolution.Bioessays. 22:161–171.
Takayasu H, Takayasu M, Provata A, Huber G. 1991. Statisticalproperties of aggregation with injection. J Stat Phys.65:725–745.
Ullu E, Tschudi C. 1984. Alu sequences are processed 7SL RNAgenes. Nature. 312:171–172.
Vicsek T. 1989. Fractal growth phenomena. Singapore: WorldScientific.
Voss RF. 1992. Evolution of long-range fractal correlations and 1/fnoise in DNA-base sequences. Phys Rev Lett. 68:3805–3808.
Webster MT, Smith NGC, Ellegren H. 2003. Compositionalevolution of noncoding DNA in the human and chimpanzeegenomes. Mol Biol Evol. 20:278–286.
Aoife McLysaght, Associate Editor
Accepted August 9, 2007
Power Laws in Repeat Distributions 2399
by guest on July 6, 2015http://m
be.oxfordjournals.org/D
ownloaded from
Copyright © 2022 FDOKUMEN