Detonation Characteristics of a NOx-Free Mining Explosive ...
Upload
khangminh22Category
view
2download
0
EPA-453/R-94-023
Alternative Control
Technologies Document
NOx Emissions from Utility Boilers
Emission Standards Division
U. S. Environmental Protection AgencyOffice of Air and Radiation
Office of Air Quality Planning and StandardsResearch Triangle Park, North Carolina 27711
March 1994

ii
TABLE OF CONTENTS
Page
1.0 INTRODUCTION . . . . . . . . . . . . . . . . . . 1-1
2.0 SUMMARY . . . . . . . . . . . . . . . . . . . . . 2-1
2.1 Summary of Fuel Use in Utility Boilers . . . . . 2-12.2 Overview of NOx Formation . . . . . . . . . . . . 2-22.3 Description of Boiler Types and Uncontrolled
NOx Emissions . . . . . . . . . . . . . . . . . 2-32.4 Overview of Alternative Control Techniques . . . 2-82.5 Summary of Performance and Costs of NOx
Controls for Coal-Fired Utility Boilers . . . . 2-14
2.5.1 Performance of NOx Controls . . . . . . . 2-142.5.2 Costs of NOx Controls . . . . . . . . . . 2-20
2.6 Summary of Performance and Costs of NOx Controls for Natural Gas- and Oil-Fired Utility Boilers . . . . . . . . . . . . . . . . 2-28
2.6.1 Performance of NOx Controls . . . . . . . 2-282.6.2 Costs of NOx Controls . . . . . . . . . . 2-33
2.7 Summary of Impacts of NOx Controls . . . . . . . 2-36
2.7.1 Impacts from Combustion NOx Controls . . . 2-362.7.2 Impacts from Flue Gas Treatment
Controls . . . . . . . . . . . . . . . . . 2-41
3.0 OVERVIEW AND CHARACTERIZATION OF UTILITY BOILERS 3-1
3.1 Utility Boiler Fuel Use in the United States . . 3-13.2 Fossil Fuel Characteristics . . . . . . . . . . . 3-6
3.2.1 Coal . . . . . . . . . . . . . . . . . . . 3-63.2.2 Oil . . . . . . . . . . . . . . . . . . . 3-113.2.3 Natural Gas . . . . . . . . . . . . . . . 3-14
3.3 Utility Boiler Designs . . . . . . . . . . . . . 3-14
3.3.1 Fundamentals of Boiler Design and Operation . . . . . . . . . . . . . 3-16
3.3.2 Furnace Configurations and Burner Types . 3-193.3.3 Other Boiler Components . . . . . . . . . 3-40

TABLE OF CONTENTS (Continued)
Page
iii
3.4 Impact of Fuel Properties on Boiler Design . . . 3-45
3.4.1 Coal . . . . . . . . . . . . . . . . . . . 3-453.4.2 Oil/Gas . . . . . . . . . . . . . . . . . 3-46
3.5 References . . . . . . . . . . . . . . . . . . . 3-51
4.0 CHARACTERIZATION OF NOx EMISSIONS . . . . . . . . 4-1
4.1 NOx Formation . . . . . . . . . . . . . . . . . . 4-1
4.1.1 Thermal NOx Formation . . . . . . . . . . 4-14.1.2 Prompt NOx Formation . . . . . . . . . . . 4-44.1.3 Fuel NOx Formation . . . . . . . . . . . . 4-5
4.2 Factors that Affect NOx Formation . . . . . . . . 4-10
4.2.1 Boiler Design Characteristics . . . . . . 4-104.2.2 Fuel Characteristics . . . . . . . . . . . 4-134.2.3 Boiler Operating Conditions . . . . . . . 4-15
4.3 Uncontrolled/Baseline Emission Levels . . . . . . 4-18
4.3.1 Conventional Boilers . . . . . . . . . . . 4-184.3.2 Fluidized Bed Boilers . . . . . . . . . . 4-21
4.4 References . . . . . . . . . . . . . . . . . . . 4-26
5.0 NOx EMISSION CONTROL TECHNIQUES . . . . . . . . . 5-1
5.1 Combustion Controls for Coal-Fired Utility Boilers . . . . . . . . . . . . . . . . . . . . . 5-3
5.1.1 Operational Modifications . . . . . . . . 5-35.1.2 Overfire Air . . . . . . . . . . . . . . . 5-85.1.3 Low NOx Burners . . . . . . . . . . . . . 5-165.1.4 Low NOx Burners and Overfire Air . . . . . 5-465.1.5 Reburn . . . . . . . . . . . . . . . . . . 5-575.1.6 Low NOx Burners and Reburn . . . . . . . . 5-68
5.2 Combustion Controls for Natural Gas- and Oil-Fired Utility Boilers . . . . . . . . . 5-70
5.2.1 Operational Modifications . . . . . . . . 5-705.2.2 Flue Gas Recirculation . . . . . . . . . . 5-745.2.3 Overfire Air . . . . . . . . . . . . . . . 5-78
TABLE OF CONTENTS (Continued)
Page
iv
5.2.4 Low NOx Burners . . . . . . . . . . . . . 5-785.2.5 Reburn . . . . . . . . . . . . . . . . . . 5-925.2.6 Combinations of Combustion Controls . . . 5-93
5.3 Flue Gas Treatment Controls . . . . . . . . . . . 5-96
5.3.1 Selective Noncatalytic Reduction . . . . . 5-975.3.2 Selective Catalytic Reduction . . . . . 5-1175.3.3 Selective Noncatalytic Reduction and
Combustion Controls . . . . . . . . . 5-1345.3.4 Selective Catalytic Reduction and
Combustion Controls . . . . . . . . . 5-140
5.4 References . . . . . . . . . . . . . . . . . . 5-141
6.0 NOx TECHNOLOGY CONTROL COSTS . . . . . . . . . . . . . 6-1
6.1 Costing Methodology . . . . . . . . . . . . . . . 6-1
6.1.1 Total Capital Cost . . . . . . . . . . . . 6-36.1.2 Operating and Maintenance Costs . . . . . 6-76.1.3 Calculation of Busbar Cost and Cost
Effectiveness . . . . . . . . . . . . . 6-9
6.2 Model Plant Development . . . . . . . . . . . . . 6-9
6.2.1 Model Boiler Design and Operating Specifications . . . . . . . . . . . . . 6-10
6.2.2 NOx Control Alternatives . . . . . . . . . 6-106.2.3 Sensitivity Analysis . . . . . . . . . . . 6-13
6.3 Combustion Modifications for Coal-Fired Boilers . 6-18
6.3.1 Low NOx Burners . . . . . . . . . . . . . 6-186.3.2 Low NOx Burners with Advanced Overfire
Air . . . . . . . . . . . . . . . . . . 6-276.3.3 Natural Gas Reburn . . . . . . . . . . . . 6-32
6.4 Combustion Modifications for Natural Gas- And Oil-Fired Boilers . . . . . . . . . . . . . . . 6-43
6.4.1 Operational Modifications . . . . . . . . 6-436.4.2 Low NOx Burners . . . . . . . . . . . . . 6-536.4.3 Low NOx Burners with Advanced Overfire
Air . . . . . . . . . . . . . . . . . . 6-586.4.4 Natural Gas Reburn . . . . . . . . . . . . 6-67

TABLE OF CONTENTS (Continued)
Page
v
6.5 Flue Gas Treatment Controls . . . . . . . . . . . 6-74
6.5.1 Selective Noncatalytic Reduction . . . . . 6-746.5.2 SCR . . . . . . . . . . . . . . . . . . . 6-916.5.3 Low NOx Burners with Selective
Non-Catalytic Reduction . . . . . . . 6-1196.5.4 Low NOx Burners with Advanced Overfire
Air and Selective Catalytic Reduction 6-131
6.6 References . . . . . . . . . . . . . . . . . . 6-155
7.0 ENVIRONMENTAL AND ENERGY IMPACTS OF NOx CONTROLS 7-1
7.1 Effects from Combustion Controls on Coal-Fired Utility Boilers . . . . . . . . . . . . . . . . 7-1
7.1.1 Retrofit Applications . . . . . . . . . . 7-27.1.2 New Applications . . . . . . . . . . . . . 7-15
7.2 Effects from Combustion Controls on Natural Gas- and Oil-Fired Boilers . . . . . . . . . 7-17
7.3 Effects from Flue Gas Treatment Controls . . . . 7-20
7.3.1 Results from SNCR Noncatalytic Reduction . . . . . . . . . . . . . . . . 7-22
7.3.2 Results for SCR Reduction . . . . . . . . 7-25
7.4 References . . . . . . . . . . . . . . . . . . . 7-29
Appendix A Costing Procedures

vi
LIST OF TABLES
Page
2-1 Uncontrolled/Baseline NOx Emission Levels fromConventional Fossil Fuel-Fired Utility Boilers . 2-5
2-2 NOx Emission Levels from Fluidized Bed Combustion Boilers . . . . . . . . . . . . . . . 2-9
2-3 Expected NOx Emissions from Coal-Fired Boilerswith Combustion Controls . . . . . . . . . . . . 2-15
2-4 Expected NOx Emissions from Coal-Fired UtilityBoilers with Flue Gas Treatment Controls . . . . 2-18
2-5 Summary of NOx Control Cost Effectiveness forCoal-Fired Utility Boilers (1991 Dollars) . . . . 2-22
2-6 Summary of NOx Control Cost Effectiveness forFBC Boilers (1991 Dollars) . . . . . . . . . . . 2-27
2-7 Expected NOx Emissions from Natural Gas- and Oil-Fired Utility Boilers with Combustion Controls . . . . . . . . . . . . . . . . . . . . 2-29
2-8 Expected NOx Emissions from Natural Gas- and Oil-Fired Utility Boilers with Flue Gas Treatment Controls . . . . . . . . . . . . . . . 2-32
2-9 Summary of NOx Control Cost Effectiveness for Natural Gas- and Oil-Fired Utility Boilers(1991 Dollars) . . . . . . . . . . . . . . . . . 2-34
2-10 Summary of Impacts from Combustion NOx Controls on Fossil Fuel-Fired Utility Boilers . . . . . . 2-40
2-11 Summary of Impacts from Flue Gas Treatment Controls on Fossil Fuel-Fired Utility Boilers . . 2-42
3-1 Classification of Coals by Rank . . . . . . . . . 3-7
3-2 Sources and Typical Analyses of Various Ranks of Coal . . . . . . . . . . . . . . . . . . . . . 3-9
3-3 ASTM Standard Specifications for Fuel Oils . . . 3-12
3-4 Typical Analyses and Properties of Fuel Oils . . 3-13
3-5 Characteristics of Selected Samples of Natural GasFrom U. S. Fields . . . . . . . . . . . . . . . . 3-15

LIST OF TABLES (Continued)
Page
vii
4-1 Typical Fuel Nitrogen Contents of Fossil Fuels . 4-14
4-2 Uncontrolled/Baseline NOx Emission Levels forCoal-Fired Boilers . . . . . . . . . . . . . . . 4-20
4-3 Uncontrolled/Baseline NOx Emission Levels for Natural Gas Boilers . . . . . . . . . . . . . . . 4-22
4-4 Uncontrolled/Baseline NOx Emission Levels forOil-Fired Boilers . . . . . . . . . . . . . . . . 4-23
4-5 NOx Emission Levels for Fluidized Bed Combustion Boilers . . . . . . . . . . . . . . . 4-25
5-1 NOx Emission Control Technologies for Fossil FuelUtility Boilers . . . . . . . . . . . . . . . . . 5-2
5-2 Performance of Operational Modifications on U. S. Coal-Fired Utility Boilers . . . . . . . . . . . 5-7
5-3 Performance of OFA on U. S. Coal-Fired Utility Boilers . . . . . . . . . . . . . . . . . . . . . 5-15
5-4 Performance of LNB Retrofit on U. S. Coal-Fired Utility Boilers . . . . . . . . . . . . . . . . . 5-34
5-5 Performance of LNB on New U. S. Coal-Fired Utility Boilers . . . . . . . . . . . . . . . . . 5-42
5-6 Performance of LNB + OFA Retrofit on U. S. Coal-FiredUtility Boilers . . . . . . . . . . . . . . . . . 5-51
5-7 Performance of LNB + OFA on New U. S. Coal-Fired Utility Boilers . . . . . . . . . . . . . . . . . 5-58
5-8 Performance of Reburn and Co-Firing on U. S. Coal-Fired Utility Boilers . . . . . . . . . . . 5-67
5-9 Performance of BOOS + LEA on U. S. Natural Gas- and Oil-Fired Utility Boilers . . . . . . . . . . . . 5-73
5-10 Performance of FGR on U. S. Natural Gas- and Oil-Fired Boilers . . . . . . . . . . . . . . . . 5-77
5-11 Performance of OFA + LEA on U. S. Natural Gas- and Oil-Fired Boilers . . . . . . . . . . . . . . . . 5-79
LIST OF TABLES (Continued)
Page
viii
5-12 Performance of LNB on U. S. Natural Gas- and Oil-Fired Boilers . . . . . . . . . . . . . . . . 5-91
5-13 Performance of Combinations of Combustion Controlson U. S. Natural Gas- and Oil-Fired Utility Boilers . . . . . . . . . . . . . . . . . 5-94
5-14 Performance of SNCR on Conventional U. S. Utility Boilers . . . . . . . . . . . . . . . . 5-109
5-15 Performance of NH3 SNCR on U. S. Fluidized Bed Combustion Boilers . . . . . . . . . . . . . . 5-118
5-16 Performance of SCR on U. S. Utility Boilers . . 5-133
5-17 Performance of LNB + AOFA + SNCR on ConventionalU.S. Utility Boilers . . . . . . . . . . . . . 5-139
6-1 Capital and Operating Cost Components . . . . . . 6-2
6-2 Possible Scope Adders for Retrofit of Combustion Controls . . . . . . . . . . . . . . . . . . . . 6-5
6-3 Fixed and Variable O&M Unit Cost . . . . . . . . 6-8
6-4 Design and Operating Characteristics of Model Boilers . . . . . . . . . . . . . . . . . . . . . 6-11
6-5 NOx Control Alternatives Evaluated . . . . . . . 6-14
6-6 Costs for LNB Applied to Coal-Fired Boilers . . . 6-20
6-7 Costs for LNB + AOFA Applied to Coal-Fired Boilers 6-29
6-8 Costs for NGR Applied to Coal-Fired Boilers . . . 6-36
6-9 Costs for LEA + BOOS Applied to Natural Gas- and Oil-Fired Boilers . . . . . . . . . . . . . . . . 6-47
6-10 Costs for LNB Applied to Natural Gas- and Oil-Fired Boilers . . . . . . . . . . . . . . . . 6-55
6-11 Costs for LNB + AOFA Burners Applied To Natural Gas- and Oil-Fired Boilers . . . . . . . . . . . 6-62
6-12 Costs for NGR Applied to Oil-Fired Boilers . . . 6-69

LIST OF TABLES (Continued)
Page
ix
6-13 Costs for SNCR Applied to Coal-Fired Boilers . . 6-77
6-14 Costs for SNCR Applied to Natural Gas- and Oil-Fired Boilers . . . . . . . . . . . . . . . . 6-80
6-15 Costs for SCR Applied to Coal-Fired Boilers . . . 6-98
6-16 Costs for SCR Applied to Natural Gas-Fired Boilers .6-100
6-17 Costs for SCR Applied to Oil-Fired Boilers . . 6-101
6-18 Costs for LNB + SNCR Applied to Coal-Fired Boilers .6-120
6-19 Costs for LNB + SNCR Applied to Natural Gas- and Oil-Fired Boilers . . . . . . . . . . . . . . . 6-122
6-20 Costs for LNB + AOFA + SCR Applied to Coal-Fired Boilers . . . . . . . . . . . . . . 6-135
6-21 Costs for LNB + AOFA + SCR Applied to Gas-Fired Boilers . . . . . . . . . . . . . . . 6-136
6-22 Costs for LNB + AOFA + SCR Applied to Oil-Fired Boilers . . . . . . . . . . . . . . . . . . . . 6-137
7-1 Summary of Carbon Monoxide Emissions from Coal-Fired Boilers with Combustion NOx Controls . . . 7-3
7-2 Summary of Unburned Carbon and Boiler EfficiencyData from Coal-Fired Boilers with CombustionNOx Controls . . . . . . . . . . . . . . . . . . 7-10
7-3 Summary of Total Hydrocarbon and Particulate MatterData from Coal-Fired Boilers with Combustion NOx Controls . . . . . . . . . . . . . . . . . . 7-14
7-4 Summary of Carbon Monoxide, Unburned Carbon, andParticulate Matter Data from New Coal-Fired Units With Combustion NOx Controls . . . . . . . 7-16
7-5 Summary of Carbon Monoxide Data from Natural Gas- and Oil-Fired Boilers with Combustion NOx Controls . . . . . . . . . . . . . . . . . . 7-18
7-6 Summary of Potential Impacts Due to SCR Systems . 7-23

LIST OF TABLES (Continued)
Page
x
7-7 Summary of Carbon Monoxide, Ammonia Slip, and Nitrous Oxide Emissions from Conventional Boilers With SNCR . . . . . . . . . . . . . . . . 7-24
7-8 Summary of Carbon Monoxide, Ammonia Slip, and TotalHydrocarbon Emissions from Fluidized Bed Boilers with SNCR . . . . . . . . . . . . . . . . 7-26
7-9 Summary of Ammonia Slip from U.S. Selective Catalytic Reduction Applications . . . . . . . . 7-27

xi
LIST OF FIGURES
Page
2-1 NOx Control Cost Effectiveness for Coal-Fired Tangential Boilers . . . . . . . . . . . . . . . 2-23
2-2 NOx Control Cost Effectiveness for Coal-Fired Wall Boilers . . . . . . . . . . . . . . . . . . 2-25
2-3 NOx Control Cost Effectiveness for Coal-FiredCyclone Boilers . . . . . . . . . . . . . . . . . 2-26
2-4 NOx Control Cost Effectiveness for Natural Gas-and Oil-Fired Tangential Boilers . . . . . . . . 2-37
2-5 NOx Control Cost Effectiveness for Natural Gas-and Oil-Fired Wall Boilers . . . . . . . . . . . 2-38
3-1 Percent Generating Capability by Energy Source,as of December 31, 1990 . . . . . . . . . . . . . 3-2
3-2 Coal-Fired Generating Capability, as of December 31, 1990 . . . . . . . . . . . . . . . . 3-3
3-3 Gas-Fired Generating Capability, as of December 31, 1990 . . . . . . . . . . . . . . . . 3-4
3-4 Oil-Fired Generating Capability, as of December 31, 1990 . . . . . . . . . . . . . . . . 3-5
3-5 Simplified Boiler Schematic . . . . . . . . . . . 3-17
3-6 Firing Pattern in a Tangentially-Fired Boiler . . 3-20
3-7 Burner Assembly of a Tangentially-Fired Boiler . 3-21
3-8 Single Wall-Fired Boiler . . . . . . . . . . . . 3-24
3-9 Circular-Type Burner for Pulverized Coal, Oil, or Gas . . . . . . . . . . . . . . . . . . . . . 3-25
3-10 Opposed Wall-Fired Boiler . . . . . . . . . . . . 3-27
3-11 Cell Burner for Natural Gas-firing . . . . . . . 3-28
3-12 Flow Pattern in an Arch-Fired Boiler . . . . . . 3-30
3-13 Cross Section of Turbo-Fired Boiler . . . . . . . 3-31
3-14 Cyclone Burner . . . . . . . . . . . . . . . . . 3-33

LIST OF FIGURES (Continued)
Page
xii
3-15 Firing Arrangements Used with Cyclone-Fired Boilers . . . . . . . . . . . . . . . . . . . . . 3-34
3-16 Spreader type Stoker-Fired Boiler - Continuous AshDischarge Grate . . . . . . . . . . . . . . . . . 3-35
3-17 Simplified AFBC Process Flow Diagram . . . . . . 3-37
3-18 Effect of Coal Rank on Furnace Sizing . . . . . . 3-47
3-19 Comparative Physical Sizes of Utility Boilers Firing Different Fuels . . . . . . . . . . . . . 3-49
4-1 Variation of Flame Temperature with Equivalence Ratio . . . . . . . . . . . . . . . . . . . . . . 4-3
4-2a Comparison of Fuel NOx to Fuel Nitrogen . . . . . 4-7
4-2b Percent Conversion of Nitrogen to Fuel NOx . . . 4-7
4-3 Fuel Nitrogen Oxide to Fuel Nitrogen Content-Pulverized Coal, Premixed . . . . . . . . . . . . 4-8
4-4 Fuel-Bound Nitrogen-to-Nitrogen Oxide inPulverized-Coal Combustion . . . . . . . . . . . 4-9
4-5 Comparative Physical Sizes of Utility BoilersFiring Different Fuels . . . . . . . . . . . . . 4-16
4-6 Effect of Mill Pattern Usage on NOx Emissions . . 4-17
5-1a Typical Opposed Wall-Fired Boiler . . . . . . . . 5-9
5-1b Opposed Wall-Fired Boiler with Overfire Air . . . 5-9
5-2a Conventional Overfire Air on an Opposed Wall-FiredBoiler . . . . . . . . . . . . . . . . . . . . . 5-11
5-2b Advanced Overfire Air on an Opposed Wall-FiredBoiler . . . . . . . . . . . . . . . . . . . . . 5-11
5-3 Tangential Boiler Windbox/Burner ArrangementWith Overfire Air Systems . . . . . . . . . . . . 5-13
5-4 Controlled Flow/Split Flame Low NOx Burner . . . 5-18
5-5 Internal Fuel Staged Low NOx Burner . . . . . . . 5-20

LIST OF FIGURES (Continued)
Page
xiii
5-6 Dual Register Burner-Axial Control FlowLow NOx Burner . . . . . . . . . . . . . . . . . 5-21
5-7 Isometric Drawing of RO-II Low NOx Burner . . . . 5-23
5-8 Controlled Combustion VenturiTM Low NOx Burner . . 5-24
5-9 Low NOx Cell Burner . . . . . . . . . . . . . . . 5-25
5-10 Low NOx Tertiary Staged Venturi Burner . . . . . 5-27
5-11a Typical Fuel and Air Compartment Arrangement fora Tangentially-Fired Boiler . . . . . . . . . . . 5-28
5-11b Plan View of Fuel and Air Streams in a TypicalTangentially-Fired Boiler . . . . . . . . . . . . 5-28
5-12a Low NOx Concentric Firing System Fuel and AirCompartment Arrangement . . . . . . . . . . . . . 5-29
5-12b Plan View of Low NOx Concentric Firing System . . . 5-29
5-13 Low NOx Pollution MinimumTM Burner . . . . . . . . 5-31
5-14 Short-Term Controlled NOx Emissions from Wall-FiredBoilers With Retrofit LNB . . . . . . . . . . . . 5-38
5-15 NOx Emissions From New Tangentially-Fired BoilersWith LNB + CCOFA . . . . . . . . . . . . . . . . 5-45
5-16 NOx Emissions From New Wall-Fired Boilers With LNB 5-47
5-17 Advanced OFA System with LNB . . . . . . . . . . 5-48
5-18 Low NOx Concentric Firing System . . . . . . . . 5-49
5-19 NOx Emissions from Tangentially-Fired BoilersWith Retrofit LNB + OFA . . . . . . . . . . . . . 5-55
5-20 Application of Natural Gas Reburn on a Wall-FiredBoiler . . . . . . . . . . . . . . . . . . . . . 5-59
5-21 Application of Reburn on a Cyclone Furnace . . . 5-62
5-22 Gas Co-firing Applied to a Wall-Fired Boiler . . 5-64

LIST OF FIGURES (Continued)
Page
xiv
5-23 Controlled NOx Emissions from Coal-Fired Boilers With Retrofit Reburn Systems . . . . . . . . . . 5-69
5-24 Flue Gas Recirculation System . . . . . . . . . . 5-75
5-25 ROPMTM Burner for Natural Gas- and Oil-FiredBoilers . . . . . . . . . . . . . . . . . . . . . 5-81
5-26 Dynaswirl Low NOx Burner . . . . . . . . . . . . 5-82
5-27 Internal Staged Combustion on Low NOx Burner . . 5-84
5-28 Primary Gas-Dual Register Low NOx Burner . . . . 5-85
5-29 Axial Control Flow Low NOx Burner for Gas and Oil . . . . . . . . . . . . . . . . . . . 5-86
5-30 Low NOx Swirl Tertiary Separation Low NOx Burner 5-88
5-31 Pollution Minimum™ Burner for Natural Gas- and Oil-Fired Boilers . . . . . . . . . . . . . . 5-89
5-32 Ammonia-Based SNCR . . . . . . . . . . . . . . . 5-98
5-33 Urea-Based SNCR . . . . . . . . . . . . . . . . 5-100
5-34 High-Energy SNCR Process . . . . . . . . . . . 5-101
5-35 General Effects of Temperature on NOx Removal . 5-014
5-36 General Effect of NH3:NOx Mole Ratio on NOxRemoval . . . . . . . . . . . . . . . . . . . . 5-106
5-37 Ammonia Salt Formation as a Function of Temperatureand NH3 and SO3 Concentration . . . . . . . . . 5-107
5-38 NOx Reduction vs. Molar N/NO Ratio for Conventional U. S. Coal-Fired Boilers with SNCR . . . . . . 5-115
5-39 NOx Reduction vs. Molar N/NO Ratio for ConventionalU. S. Natural Gas- and Oil-Fired Boilers with SNCR . . . . . . . . . . . . . . . . . . . 5-116
5-40 Relative Effect of Temperature on NOx Reduction 5-120
5-41 Possible Configurations for SCR . . . . . . . . 5-121

LIST OF FIGURES (Continued)
Page
xv
5-42 Ljungstrom Air Heater With Catalyst Coated Elements . . . . . . . . . . . . . . . . . . . 5-122
5-43 Typical Configuration for a Catalyst Reactor . 5-124
5-44 Example of Optimum Temperature Range for Different Types of Catalysts . . . . . . . . . 5-125
5-45 Configuration of Parallel Flow Catalyst . . . . 5-127
5-46 Effect of Temperature on Conversion of SO2 to SO3 . . . . . . . . . . . . . . . . . . . . . . 5-129
5-47a Extruded Catalyst NOx Conversion and Residual NH3 versus NH3-to-NOx Ratio . . . . . . . . . . . . 5-135
5-47b Replacement Composite Catalyst NOx Conversion andResidual NH3 versus NH3-to-NOx Ratio . . . . . 5-135
5-48a V/Ti Catalyst Ammonia Slip and NOx Removal VersusAmmonia-to-NOx Ratio . . . . . . . . . . . . . 5-136
5-48b Zeolite Catalyst Ammonia Slip and NOx Removal VersusAmmonia-to-NOx Ratio . . . . . . . . . . . . . 5-136
5-49a T1O2 Corrugated Plate Catalyst NOx Conversion and Residual NH3 Versus NH3-to-NOx Ratio . . . . . 5-137
5-49b Vanadium Titanium Extruded Catalyst NOx Conversion and Residual NH3 Versus NH3-to-NOx Ratio . . . 5-137
6-1 Impact of Plant Characteristics on LNB Cost Effectiveness and Busbar Cost for Coal-FiredTangential Boilers . . . . . . . . . . . . . . . 6-16
6-2 Impact of NOx Emission Characteristics and Heat Rate on LNB Cost Effectiveness for Coal-Fired Tangential Boilers . . . . . . . . . . . . . . . 6-17
6-3 Impact of Plant Characteristics on LNB Cost Effectiveness and Busbar Cost for Coal-Fired Wall Boilers . . . . . . . . . . . . . . . . . . 6-22
6-4 Impact of NOx Emission Characteristics and Heat Rate on LNB Cost Effectiveness for Coal-Fired Wall Boilers . . . . . . . . . . . . . . . . . . . . . 6-23
LIST OF FIGURES (Continued)
Page
xvi
6-5 Impact of Plant Characteristics on LNB Cost Effectiveness and Busbar Cost for Coal-Fired
Tangential Boilers . . . . . . . . . . . . . . . . . . 6-25
6-6 Impact of NOx Emission Characteristics and Heat Rate on LNB Cost Effectiveness for Coal-Fired Tangential Boilers . . . . . . . . . . . . . . . 6-26
6-7 Impact of Plant Characteristics on LNB + AOFA Cost Effectiveness and Busbar Cost for Coal-Fired Wall Boilers . . . . . . . . . . . . . . . . . . 6-30
6-8 Impact of NOx Emission Characteristics and Heat Rate on LNB + AOFA Cost Effectiveness for Coal-Fired Wall Boilers . . . . . . . . . . . . . . . . . . 6-31
6-9 Impact of Plant Characteristics on LNB + AOFA CostEffectiveness and Busbar Cost for Coal-Fired
Tangential Boilers . . . . . . . . . . . . . . . . . . 6-33
6-10 Impact of NOx Emission Characteristics and Heat Rate on LNB + AOFA Cost Effectiveness for Coal-Fired
Tangential Boilers . . . . . . . . . . . . . . . . . . 6-34
6-11 Impact of Plant Characteristics on NGR Cost Effectiveness and Busbar Cost for Coal-Fired Wall Boilers . . . . . . . . . . . . . . . . . . 6-38
6-12 Impact of NOx Emission Characteristics and Heat Rate on NGR Cost Effectiveness for Coal-Fired Wall
Boilers . . . . . . . . . . . . . . . . . . . . . . . 6-39
6-13 Impact of Plant Characteristics on NGR Cost Effectiveness and Busbar Cost for Coal-Fired
Tangential Boilers . . . . . . . . . . . . . . . . . . 6-41
6-14 Impact of NOx Emission Characteristics and Heat Rate on NGR Cost Effectiveness for Coal-Fired Tangential Boilers . . . . . . . . . . . . . . . 6-42
6-15 Impact of Plant Characteristics on NGR Cost Effectiveness and Busbar Cost for Coal-Fired Cyclone Boilers . . . . . . . . . . . . . . . . . 6-44
6-16 Impact of NOx Emission Characteristics and Heat Rate on NGR Cost Effectiveness for Coal-Fired Cyclone Boilers . . . . . . . . . . . . . . . . . 6-45

LIST OF FIGURES (Continued)
Page
xvii
6-17 Impact of Plant Characteristics on LEA + BOOS CostEffectiveness and Busbar Cost for Natural Gas- and Oil-Fired Wall Boilers . . . . . . . . . 6-48
6-18 Impact of NOx Emission Characteristics and Heat Rate on LEA + BOOS Cost Effectiveness for Natural Gas- and Oil-Fired Wall Boilers . . . . . 6-49
6-19 Impact of Plant Characteristics on LEA + BOOS CostEffectiveness and Busbar Cost for Natural Gas- and Oil-Fired Tangential Boilers . . . . . . . . 6-51
6-20 Impact of NOx Emission Characteristics and Heat Rate on LEA + BOOS Cost Effectiveness for Natural Gas- and Oil-Fired Boilers . . . . . . . 6-52
6-21 Impact of Plant Characteristics on LNB Cost Effectiveness and Busbar Cost for Natural Gas- and Oil-Fired Wall Boilers . . . . . . . . . . . 6-56
6-22 Impact of NOx Emission Characteristics and Heat Rate on LNB Cost Effectiveness for Natural Gas- and Oil-Fired Wall Boilers . . . . . . . . . 6-57
6-23 Impact of Plant Characteristics on LNB Cost Effectiveness and Busbar Cost for Natural Gas- and Oil-Fired Tangential Boilers . . . . . . 6-59
6-24 Impact of NOx Emission Characteristics and Heat Rate on LNB Cost Effectiveness for Natural Gas- and Oil-Fired Tangential Boilers . . . . . . 6-59
6-25 Impact of Plant Characteristics on LNB + AOFA Cost Effectiveness and Busbar Cost for Natural Gas- and Oil-Fired Wall Boilers . . . . . . . . . 6-63
6-26 Impact of NOx Emission Characteristics and Heat Rate on LNB + AOFA Cost Effectiveness for Natural Gas- and Oil-Fired Wall Boilers . . . . . 6-64
6-27 Impact of Plant Characteristics on LNB + AOFA Cost Effectiveness and Busbar Cost for Natural Gas- and Oil-Fired Tangential Boilers . . . . . . 6-65
6-28 Impact of NOx Emission Characteristics and Heat Rate on LNB + AOFA Cost Effectiveness for Natural Gas- and Oil-Fired Tangential Boilers . . 6-66
LIST OF FIGURES (Continued)
Page
xviii
6-29 Impact of Plant Characteristics on NGR Cost Effectiveness and Busbar Cost for Oil-Fired Wall Boilers . . . . . . . . . . . . . . . . . . 6-70
6-30 Impact of NOx Emission Characteristics and HeatRate on NGR Cost Effectiveness for Oil-Fired Wall Boilers . . . . . . . . . . . . . . . . . . 6-71
6-31 Impact of Plant Characteristics on NGR Cost Effectiveness and Busbar Cost for Oil-Fired Tangential Boilers . . . . . . . . . . . . . . . 6-72
6-32 Impact of NOx Emission Characteristics and HeatRate on NGR Cost Effectiveness for Oil-FiredTangential Boilers . . . . . . . . . . . . . . . 6-73
6-33 Impact of Plant Characteristics on SNCR Cost Effectiveness and Busbar Cost for Coal-Fired Wall Boilers . . . . . . . . . . . . . . . . . . 6-81
6-34 Impact of NOx Emission Characteristics and Heat Rate on SNCR Cost Effectiveness for Coal-Fired Wall Boilers . . . . . . . . . . . . . . . . . . 6-82
6-35 Impact of Plant Characteristics on SNCR Cost Effectiveness and Busbar Cost for Coal-Fired Tangential Boilers . . . . . . . . . . . . . . . 6-84
6-36 Impact of NOx Emission Characteristics and Heat Rate on SNCR Cost Effectiveness for Coal-Fired Tangential Boilers . . . . . . . . . . . . 6-85
6-37 Impact of Plant Characteristics on SNCR CostEffectiveness and Busbar Cost for Coal-Fired Cyclone Boilers . . . . . . . . . . . 6-87
6-38 Impact of NOx Emission Characteristics and Heat Rate on SNCR Cost Effectiveness for Coal-Fired Cyclone Boilers . . . . . . . . . . . . . . 6-88
6-39 Impact of Plant Characteristics on SNCR Cost Effectiveness and Busbar Cost for Coal-Fired FBC Boilers . . . . . . . . . . . . . . . . . . . 6-89
6-40 Impact of NOx Emission Characteristics and Heat Rate on SNCR Cost Effectiveness for Coal-Fired FBC Boilers . . . . . . . . . . . . . . . . . . . 6-90

LIST OF FIGURES (Continued)
Page
xix
6-41 Impact of Plant Characteristics on SNCR Cost Effectiveness and Busbar Cost for Natural Gas-and Oil-Fired Wall Boilers . . . . . . . . . . . 6-92
6-42 Impact of NOx Emission Characteristics and Heat Rate on SNCR Cost Effectiveness for Natural Gas- and Oil-Fired Wall Boilers . . . . . . . . . 6-93
6-43 Impact of Plant Characteristics on SNCR Cost Effectiveness and Busbar Cost for Natural Gas- and Oil-Fired Tangential Boilers . . . . . . . . 6-94
6-44 Impact of NOx Emission Characteristics and Heat Rate on SNCR Cost Effectiveness for Natural Gas- and Oil-Fired Tangential Boilers . . . . . . . . 6-95
6-45 Impact of Plant Characteristics on SCR Cost Effectiveness and Busbar Cost for Coal-Fired Wall Boilers . . . . . . . . . . . . . . . . . 6-102
6-46 Impact of NOx Emission Characteristics and Heat Rate on SCR Cost Effectiveness for Coal-Fired Wall Boilers . . . . . . . . . . . . . . . . . . . . 6-103
6-47 Impact of Plant Characteristics on SCR Cost Effectiveness and Busbar Cost for Coal-Fired Tangential Boilers . . . . . . . . . . . . . . 6-106
6-48 Impact of NOx Emission Characteristics and Heat Rate on SCR Cost Effectiveness for Coal-Fired Tangential Boilers . . . . . . . . . . . . . . 6-107
6-49 Impact of Plant Characteristics on SCR Cost Effectiveness and Busbar Cost for Coal-Fired Cyclone Boilers . . . . . . . . . . . . . . . . 6-108
6-50 Impact of NOx Emission Characteristics and Heat Rate on SCR Cost Effectiveness for Coal-Fired Cyclone Boilers . . . . . . . . . . . . . . . . 6-109
6-51 Impact of Plant Characteristics on SCR Cost Effectiveness and Busbar Cost for Natural Gas-Fired Wall Boilers . . . . . . . . . . . . 6-111
6-52 Impact of Plant Characteristics on SCR Cost Effectiveness and Busbar Cost for Oil-Fired Wall Boilers . . . . . . . . . . . . 6-112

LIST OF FIGURES (Continued)
Page
xx
6-53 Impact of NOx Emission Characteristics and Heat Rate on SCR Cost Effectiveness for Natural Gas-Fired Boilers . . . . . . . . . . . . . . . 6-113
6-54 Impact of NOx Emission Characteristics and Heat Rate on SCR Cost Effectiveness for Oil-Fired Boilers . . . . . . . . . . . . . . . 6-114
6-55 Impact of Plant Characteristics on SCR Cost Effectiveness and Busbar Cost for Natural Gas-Fired Tangential Boilers . . . . . . . . . 6-115
6-56 Impact of Plant Characteristics on SCR Cost Effectiveness and Busbar Cost for Natural Gas-Fired Tangential Boilers . . . . . . . . . 6-116
6-57 Impact of NOx Emission Characteristics and Heat Rate on SCR Cost Effectiveness for Natural Gas-Fired Tangential Boilers . . . . . . . . . 6-117
6-58 Impact of NOx Emission Characteristics and Heat Rate on SCR Cost Effectiveness for Oil-Fired Tangential Boilers . . . . . . . . . 6-118
6-59 Impact of Plant Characteristics on LNB + SNCR CostEffectiveness and Busbar Cost for Coal-Fired Wall Boilers . . . . . . . . . . . . . . . . . 6-123
6-60 Impact of NOx Emission Characteristics and Heat Rate on LNB + SNCR Cost Effectiveness for Coal-Fired Boilers . . . . . . . . . . . . . . 6-124
6-61 Impact of Plant Characteristics on LNB + SNCR Cost Effectiveness and Busbar Cost for Coal-Fired Tangential Boilers . . . . . . . . . 6-127
6-62 Impact of NOx Emission Characteristics and Heat Rate on LNB + SNCR Cost Effectiveness for Coal-Fired Tangential Boilers . . . . . . . . . 6-128
6-63 Impact of Plant Characteristics on LNB + SNCR CostEffectiveness and Busbar Cost for Natural Gas- and Oil-Fired Wall Boilers . . . . . . . . . . 6-129
6-64 Impact of NOx Emission Characteristics and Heat Rate on LNB + SNCR Cost Effectiveness for Natural Gas- and Oil-Fired Wall Boilers . . . . 6-130

LIST OF FIGURES (Continued)
Page
xxi
6-65 Impact of Plant Characteristics on LNB + SNCR CostEffectiveness and Busbar Cost for Natural Gas- and Oil-Fired Tangential Boilers . . . . . . . 6-132
6-66 Impact of NOx Emission Characteristics and Heat Rate on LNB + SNCR Cost Effectiveness for Natural Gas- and Oil-Fired Tangential Boilers . 6-133
6-67 Impact of Plant Characteristics on LNB + AOFA + SCR Cost Effectiveness and Busbar Cost for Coal-Fired Wall Boilers . . . . . . . . . . . . 6-139
6-68 Impact of NOx Emission Characteristics and Heat Rate on LNB + AOFA + SCR Cost Effectiveness for Coal-Fired Wall Boilers . . . . . . . . . . 6-140
6-69 Impact of Plant Characteristics on LNB + AOFA + SCR Cost Effectiveness and Busbar Cost for Coal-Fired Tangential Boilers . . . . . . . . . 6-143
6-70 Impact of NOx Emission Characteristics and Heat Rate on LNB + AOFA + SCR Cost Effectiveness for Coal-Fired Tangential Boilers . . . . . . . 6-144
6-71 Impact of Plant Characteristics on LNB + AOFA + SCR Cost Effectiveness and Busbar Cost for Natural Gas-Fired Wall Boilers . . . . . . . . 6-145
6-72 Impact of Plant Characteristics on LNB + AOFA + SCR Cost Effectiveness and Busbar Cost for Natural Gas-Fired Wall Boilers . . . . . . . . 6-146
6-73 Impact of NOx Emission Characteristics and Heat Rate on LNB + AOFA + SCR Cost Effectiveness for Natural Gas-Fired Wall Boilers . . . . . . 6-147
6-74 Impact of NOx Emission Characteristics and Heat Rate on LNB + AOFA + SCR Cost Effectiveness for Oil-Fired Wall Boilers . . . . . . . . . . 6-148
6-75 Impact of Plant Characteristics on LNB + AOFA +SCR Cost Effectiveness and Busbar Cost for Natural Gas-Fired Tangential Boilers . . . . . 6-150
6-76 Impact of Plant Characteristics on LNB + AOFA +SCR Cost Effectiveness and Busbar Cost for Oil-Fired Tangential Boilers . . . . . . . . . 6-151

LIST OF FIGURES (Continued)
Page
xxii
6-77 Impact of NOx Emission Characteristics and Heat Rate on LNB + AOFA + SCR Cost Effectiveness for Natural Gas-Fired Tangential Boilers . . . 6-152
6-78 Impact of NOx Emission Characteristics and Heat Rate on LNB + AOFA + SCR Cost Effectiveness for Oil-Fired Tangential Boilers . . . . . . . 6-153

1-1
1.0 INTRODUCTION
The 1990 Amendments (1990 Amendments) to the Clean Air Act
amended title I of the Clean Air Act (ACT) by adding a new
subpart 2 to part D of section 103. The new subpart 2
addresses ozone nonattainment areas. Section 183 (c) of the
new subpart 2 provides that:
[w]ithin 3 years after the date of theenactment of the [CAAA], the Administratorshall issue technical documents which identifyalternative controls for all categories ofstationary sources of...oxides of nitrogenwhich emit, or have the potential to emit25 tons per year or more of such pollutant.
These documents are to be subsequently revised and updated as
the Administrator deems necessary.
Fossil fuel-fired utility boilers have been identified as a
category of stationary sources that emit more than 25 tons of
nitrogen oxides (NOx) per year. This alternative control
techniques (ACT) document provides technical information for
State and local agencies to use in developing and implementing
regulatory programs to control NOx emissions from fossil
fuel-fired utility boilers. Additional ACT documents are
being or have been developed for other stationary source
categories.
The information provided in this ACT document has been
compiled from previous EPA documents, literature searches, and
contacts with utility boiler manufacturers, individual utility
companies, engineering and construction firms, control

1-2
equipment vendors, and Federal, State, and local regulatory
agencies. A summary of the findings from this study is
presented in chapter 2.0. Descriptions of fossil fuel-fired
utility boilers are given in chapter 3.0. A discussion of
uncontrolled and baseline NOx emissions from utility boilers
is presented in chapter 4.0. Alternative NOx control
techniques and expected levels of performance are discussed in
chapter 5.0. Chapter 6.0 discusses costs and cost
effectiveness of each NOx control technique. Chapter 7.0
discusses the environmental and energy impacts associated with
NOx control techniques. Information used to derive the costs
of each NOx control technology is contained in appendix A.

2-1
2.0 SUMMARY
The purpose of this document is to provide technical
information that State and local agencies can use to develop
strategies for reducing nitrogen oxides (NOx) emissions from
fossil fuel-fired utility boilers. This chapter presents a
summary of the information contained in this document,
including uncontrolled and controlled NOx emissions data,
alternative control techniques (ACT's), capital and annual
costs, cost effectiveness, and secondary environmental and
energy impacts associated with the various NOx control
techniques. Section 2.1 presents a summary of fuel use in
utility boilers, section 2.2 presents an overview of NOx
formation, and section 2.3 describes utility boiler types and
uncontrolled NOx emission levels. Section 2.4 gives an
overview of ACT's. The performance and costs of NOx controls
for coal-fired boilers is presented in section 2.5. The
performance and costs of NOx controls for natural gas- and
oil-fired boilers is given in section 2.6. Secondary
environmental impacts of NOx controls are summarized in
section 2.7.
2.1 SUMMARY OF FUEL USE IN UTILITY BOILERS
As of year-end 1990, the operable capacity of U. S. electric
power plants totaled approximately 690,000 megawatts (MW). Of
this, coal-fired generating capacity accounted for
approximately 43 percent, or 300,000 MW. Coal that is fired
in utility boilers can be classified by different ranks, i.e.,
anthracite, bituminous, subbituminous, and lignite. Each rank
of coal has specific characteristics which can influence NOx

2-2
emissions. These characteristics include heating value,
volatile matter, and nitrogen content.
As of year-end 1990, natural gas- and oil-fired boilers
accounted for approximately 28 percent of the total U. S.
generating capacity. Of this, natural gas-fired generating
capacity accounted for about 17 percent (120,000 MW) and oil-
fired units, the remaining 11 percent (77,000 MW). The term
"fuel oil" covers a broad range of petroleum products--from a
light petroleum fraction (similar to kerosene) to a heavy
residue. However, utility boilers typically fire No. 6 oil
(residual oil).
2.2 OVERVIEW OF NOx FORMATION
The formation of NOx from a specific combustion device is
determined by the interaction of chemical and physical
processes occurring within the furnace. The three principal
NOx forms are "thermal" NOx, "prompt" NOx, and "fuel" NOx.
Thermal and fuel NOx account for the majority of the NOx
formed in coal- and oil-fired utility boilers; however, the
relative contribution of each of the total NOx formed depends
on the combustion process and fuel characteristics. Natural
gas contains virtually no fuel nitrogen; therefore, the
majority of the NOx in these boilers is thermal NOx.
Thermal NOx results from the oxidation of atmospheric
nitrogen in the high-temperature, post-flame region of a
combustion system. The major factors that influence thermal
NOx formation are temperature, concentrations of oxygen and
nitrogen, and residence time. If the temperature or the
concentration of oxygen or nitrogen can be reduced quickly
after combustion, thermal NOx formation can be suppressed or
quenched.
Prompt NOx is formed in the combustion system through the
reaction of hydrocarbon fragments and atmospheric nitrogen.
As opposed to the slower formation of thermal NOx, prompt NOx
is formed rapidly and occurs on a time scale comparable to the
energy release reactions (i.e., within the flame). Thus, it
is not possible to quench prompt NOx formation as it is for

2-3
thermal NOx formation. However, the contribution of prompt
NOx to the total NOx emissions of a system is rarely large.
The oxidation of fuel-bound nitrogen (fuel NOx) is the
principal source of NOx emissions from combustion of coal and
some oils. All indications are that the oxidation of fuel-
bound nitrogen compounds to NOx is rapid and occurs on a time
scale comparable to the energy release reactions during
combustion. The primary technique for controlling the
formation of fuel NOx is delayed mixing of fuel and air so as
to promote conversion of fuel-bound nitrogen to N2 rather than
NOx. As with prompt NOx, fuel NOx formation cannot be
quenched as can thermal NOx.
The formation of thermal, prompt, and fuel NOx in combustion
systems is controlled by modifying the combustion gas
temperature, residence time, and turbulence (sometimes
referred to as the "three T's"). Of primary importance are
the localized conditions within and immediately following the
flame zone where most combustion reactions occur. In utility
boilers, the "three T's" are determined by factors associated
with boiler and burner design, fuel characteristics, and
boiler operating conditions.
2.3 DESCRIPTION OF BOILER TYPES AND UNCONTROLLED NOx
EMISSIONS
The various types of fossil fuel-fired utility boilers
include tangentially-fired, single and opposed wall-fired,
cell burner, cyclone, stoker, and fluidized bed combustion
(FBC). Each type of furnace has specific design
characteristics which can influence NOx emissions levels.
These include heat release rate, combustion temperatures,
residence times, combustion turbulence, and oxygen levels.
As mentioned, NOx emission rates are a function of various
design and operating factors. Pre-new source performance
standards (NSPS) boilers were not designed to minimize NOx
emission rates; therefore, their NOx emissions are indicative
of uncontrolled emission levels. Boilers subject to the
subpart D or Da NSPS have some type of NOx control and their
2-4
NOx emissions are considered to be baseline emissions. To
define uncontrolled NOx emissions for the pre-NSPS boilers,
emissions data from various databases and utility retrofit
applications were examined. To define baseline NOx emissions
for the subpart D and Da boilers, the NSPS limits as well as
emissions data from various databases were examined.

2-5
Table

2-6
EMISSION LEVELS FROM CONVENTIONAL
FOSSIL FUEL-FIRED UTILITY BOILERS
(lb/MMBtu)
0.3-0.5 (0.5)
0.3-0.6 (0.5)
NA
NA
NA
NA
0.3-0.6 (0.5)
0.2-0.3 (0.25)
0.2-0.3 (0.25)
NA
0.1-0.2 (0.2)
0.1-0.2 (0.2)
0.1-0.2 (0.2)
level is shown in parentheses.
emissions.
level is shown in parentheses.
NA = Not applicable since there are no boilers in this category.
Data not available.

2-7
2-1 summarizes the uncontrolled and baseline NOx emission
levels from conventional utility boilers. The NOx levels are
presented as a range and a typical level. The typical level
reflects the mode, or most common value, of the NOx emissions
data in the various databases for the different types of
boilers.
The range reflects the NOx emissions expected on a short-
term basis for most boilers of a given fuel and boiler type.
However, the actual NOx emissions from a specific boiler may
be outside this range due to unit-specific design and
operating conditions. Additionally, averaging time has an
important impact on defining NOx levels. The achievable
emission limit for a boiler increases as the averaging time
decreases. For example, a boiler that can achieve a
particular NOx limit on a 30-day basis may not be able to
achieve that same limit on a 24-hour basis.
The tangential boilers are designed with vertically stacked
nozzles in the furnace corners that inject stratified layers
of fuel and air into relatively low-turbulence areas. This
creates fuel-rich regions in an overall fuel-lean environment.
The fuel ignites in the fuel-rich region before the layers are
mixed in the highly turbulent center fireball. Local peak
temperatures and thermal NOx are lowered by the off-
stoichiometric combustion conditions. Fuel NOx formation is
suppressed by the delayed mixing of fuel and air, which allows
fuel-nitrogen compounds a greater residence time in a fuel-
rich environment.
Tangential boilers typically have the lowest NOx emissions
of all conventional utility boiler types. As shown in
table 2-1, the coal-fired, pre-NSPS tangential boilers have
2-8
NOx emissions in the range of 0.4 to 1.0 pound per million
British thermal unit (lb/MMBtu), with typical NOx emissions of
0.7 lb/MMBtu. For the tangential boilers subject to subpart D
standards, the NOx emissions are in the range of 0.3 to
0.7 lb/MMBtu with typical NOx emissions of 0.6 lb/MMBtu. The
NOx emissions for the subpart Da boilers are in the range of
0.3 to 0.5 lb/MMBtu, with typical NOx emissions of
0.5 lb/MMBtu.
The oil-fired, pre-NSPS tangential boilers have NOx
emissions in the range of 0.2 to 0.4 lb/MMBtu (0.3 lb/MMBtu
typical). For the boilers subject to subpart D and Da
standards, the NOx emissions are in the range of 0.2 to
0.3 lb/MMBtu with typical emissions of 0.25 lb/MMBtu. The NOx
emissions from the natural gas-fired, pre-NSPS tangential
boilers range from 0.1 to 0.9 lb/MMBtu (0.3 lb/MMBtu typical).
For the boilers subject to subpart D and Da standards, the NOx
emissions are in the range of 0.1 to 0.2 lb/MMBtu with typical
emissions of 0.2 lb/MMBtu.
The various types of wall-fired boilers include single,
opposed, and cell burner. Single wall-fired boilers have
several rows of burners mounted on one wall of the boiler,
while opposed wall-fired boilers have multiple rows of burners
mounted on the two opposing walls. Cell-burner units have two
or three vertically-aligned, closely-spaced burners, mounted
on opposing walls of the furnace. Single, opposed, and cell
burners boilers all have burners that inject a fuel-rich
mixture of fuel and air into the furnace through a central
nozzle. Additional air is supplied to the burner through
surrounding air registers. Of these types of wall-fired
boilers, the cell burner is the most turbulent and has the
highest NOx emissions.
Table 2-1 presents the ranges and typical NOx emissions for
wall-fired boilers. For the pre-NSPS, dry-bottom, wall-fired
boilers firing coal, the NOx emissions are in the range of 0.6
to 1.2 lb/MMBtu with typical NOx emissions of 0.9 lb/MMBtu.
The range of NOx emissions for these boilers subject to

2-9
subpart D and subpart Da are in the range of 0.3 to
0.7 lb/MMBtu and 0.3 to 0.6 lb/MMBtu, respectively. The
typical NOx emissions for the subpart D, wall-fired boilers
are 0.6 lb/MMBtu, while 0.5 lb/MMBtu is typical for the
subpart Da boilers.
The pre-NSPS, wet-bottom, wall-fired boilers firing coal
have NOx emissions in the range of 0.8 to 1.6 lb/MMBtu with
typical NOx emissions of 1.2 lb/MMBtu. The pre-NSPS cell-type
boiler has NOx emissions in the range of 0.8 to 1.8 lb/MMBtu
with typical NOx emissions of 1.0 lb/MMBtu.
The NOx emissions for the oil-fired pre-NSPS wall boilers
are in the range of 0.2 to 0.8 lb/MMBtu with typical NOx
emissions of 0.5 lb/MMBtu. The natural gas-fired pre-NSPS
single wall-fired boilers have NOx emissions in the range of
0.1 to 1.0 lb/MMBtu with typical NOx levels of 0.5 lb/MMBtu.
The opposed wall, pre-NSPS boilers firing natural gas ranged
from 0.4 to 1.8 lb/MMBtu with typical NOx of 0.9 lb/MMBtu.
Vertical-fired boilers have burners that are oriented
downward from the top, or roof, of the furnace. They are
usually designed to burn solid fuels that are difficult to
ignite. The NOx emissions from these boilers are shown on
table 2-1 and range from 0.6 to 1.2 lb/MMBtu. The typical NOx
emissions from these boilers are 0.9 lb/MMBtu. The vertical
oil-fired boilers have NOx emissions in the range of 0.5 to
1.0 lb/MMBtu with typical NOx level of 0.75 lb/MMBtu.
Another type of utility boiler is the cyclone furnace.
Cyclone furnaces are wet-bottom and fire the fuel in a highly
turbulent combustion cylinder. Table 2-1 shows the range (0.8
to 2.0 lb/MMBtu) and typical NOx level (1.5 lb/MMBtu) for
these boilers. There have not been any wet-bottom wall-fired,
cell, cyclone, or vertical boilers built since the subpart D
or subpart Da standards were established.
Stoker boilers are designed to feed solid fuel on a grate
within the furnace and remove the ash residual. The NOx
emissions from these boilers are in the range of 0.3 to
0.6 lb/MMBtu with typical NOx levels of 0.5 lb/MMBtu.

2-10
Fluidized bed combustion is an integrated technology for
reducing both sulfur dioxide (SO2) and NOx during the
combustion of coal. These furnaces operate at much lower
temperatures and have lower NOx emissions than conventional
types of utility boilers. While larger FBC units may be
feasible, at this time the largest operating unit is 203 MW.
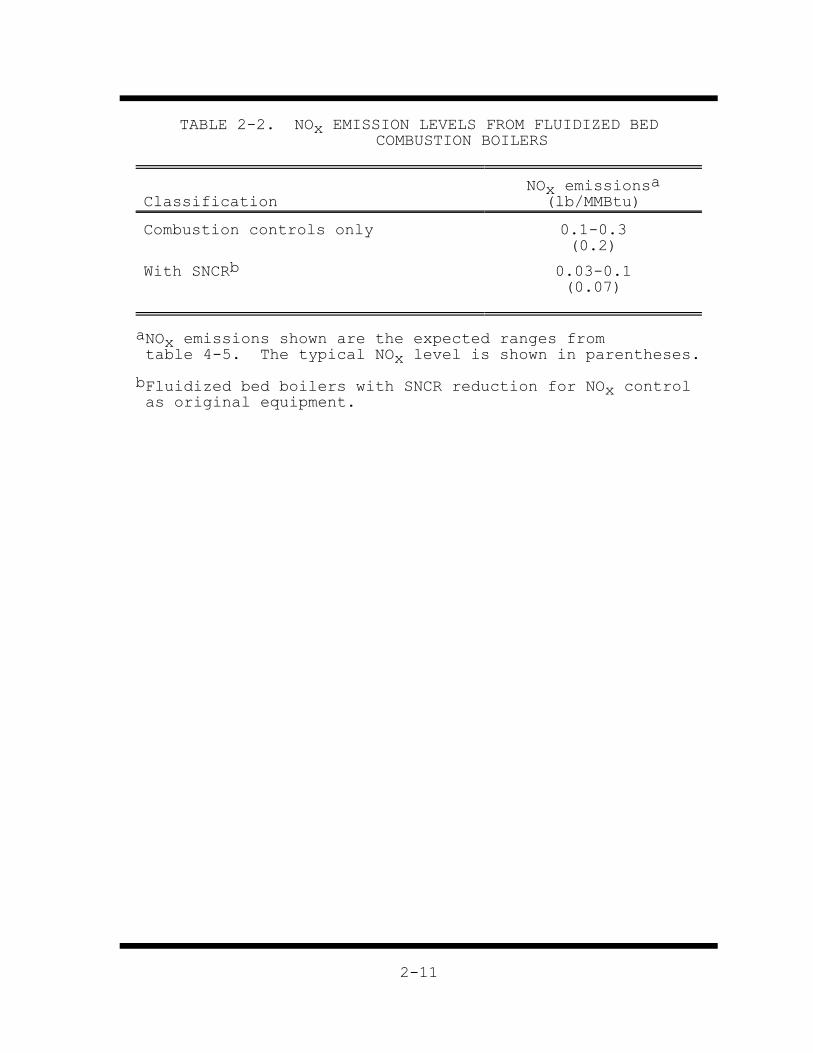
Table 2-2
2-11
TABLE 2-2. NOx EMISSION LEVELS FROM FLUIDIZED BED COMBUSTION BOILERS
ClassificationNOx emissionsa
(lb/MMBtu)
Combustion controls only 0.1-0.3(0.2)
With SNCRb 0.03-0.1(0.07)
aNOx emissions shown are the expected ranges from table 4-5. The typical NOx level is shown in parentheses.
bFluidized bed boilers with SNCR reduction for NOx control as original equipment.

2-12
gives the NOx emissions for the FBC using combustion controls
to limit NOx formation, and also when using selective
noncatalytic reduction (SNCR). The NOx emissions from FBC
without SNCR are in the range of 0.1 to 0.3 lb/MMBtu with
typical NOx levels of 0.2 lb/MMBtu. The NOx emissions from
FBC with SNCR are in the range of 0.03 to 0.1 lb/MMBtu with
typical NOx levels of 0.07 lb/MMBtu.
2.4 OVERVIEW OF ALTERNATIVE CONTROL TECHNIQUES
Alternative control techniques for reducing NOx emissions
from new or existing fossil fuel-fired utility boilers can be
grouped into one of two fundamentally different methods--
combustion controls and post-combustion controls (flue gas
treatment). Combustion controls reduce NOx formation during
the combustion process and include methods such as operational
modifications, flue gas recirculation (FGR), overfire air
(OFA), low NOx burners (LNB), and reburn. The retrofit
feasibility, NOx reduction potential, and costs of combustion
controls are largely influenced by boiler design and operating
characteristics such as firing configuration, furnace size,
heat release rate, fuel type, capacity factor, and the
condition of existing equipment. Flue gas treatment controls
reduce NOx emissions after its formation and include SNCR and
selective catalytic reduction (SCR).
Operational modifications involve changing certain boiler
operational parameters to create conditions in the furnace
that will lower NOx emissions. Burners-out-of-service (BOOS)
consists of removing individual burners from service by
stopping the fuel flow. The air flow is maintained through
the idle burners to create a staged-combustion atmosphere
within the furnace. Low excess air (LEA) involves operating

2-13
the boiler at the lowest level of excess air possible without
jeopardizing good combustion. And, biased firing (BF)
involves injecting more fuel to some burners and reducing the
amount of fuel to other burners to create a staged-combustion
environment. To implement these operational modifications,
the boiler must have the flexibility to change combustion
conditions and have excess pulverizer capacity (for coal
firing). Due to their original design type or fuel
characteristics, some boilers may not be amenable to the
distortion of the fuel/air mixing pattern imposed by BOOS and
BF. Also, some boilers may already be operating at the lowest
excess air level.
Flue gas recirculation is a flame-quenching strategy in
which the recirculated flue gas acts as a diluent to reduce
combustion temperatures and oxygen concentrations in the
combustion zone. This method is effective for reducing
thermal NOx and is used on natural gas- and oil-fired boilers.
Flue gas recirculation can also be combined with operational
modifications or other types of combustion controls on natural
gas- and oil-fired boilers to further reduce NOx emissions.
Flue gas recirculation is used on coal-fired boilers for steam
temperature control but is not effective for NOx control on
these boilers.
Overfire air is another technique for staging the combustion
process to reduce the formation of NOx. Overfire air ports
are installed above the top row of burners on wall and
tangential boilers. The two types of OFA for tangential
boilers are close-coupled overfire air (CCOFA) and separated
overfire air (SOFA). The CCOFA ports are incorporated into
the main windbox whereas the SOFA ports are installed above
the main windbox using separate ducting. The two types of OFA
for wall-fired boilers are analogous to the tangential units.
Conventional OFA has ports above the burners and utilizes the
air from the main windbox. Advanced OFA has separate ductwork
above the main windbox and, in some cases, separate fans to
provide more penetration of OFA into the furnace.

2-14
Low NOx burners are designed to delay and control the mixing
of fuel and air in the main combustion zone. Lower combustion
temperatures and reducing zones are created by the LNB which
lower thermal and fuel NOx. Low NOx burners can sometimes be
fitted directly into the existing burner opening; however,
there may be instances where changes to the high-pressure
waterwall components may be required. Low NOx burners have
been applied to both tangentially- and wall-fired boilers in
new and retrofit applications. While tangential boilers have
"coal and air nozzles" rather than "burners" as in wall-fired
boilers, the term "LNB" is used in this document for both
tangential and wall applications.
Retrofit applications must have compatible and adequate
ancillary equipment, such as pulverizers and combustion
control systems, to minimize carbon monoxide and unburned
carbon emissions and to optimize the performance of the LNB.
The NSPS subpart D and subpart Da standards have been met with
LNB on new boilers; however, they tend to have larger furnace
volumes than pre-NSPS boilers which results in lower NOx
emissions.
Low NOx burners and OFA can be combined in some retrofit
applications provided there is sufficient height above the top
row of burners. However, there is limited retrofit experience
with combining LNB and OFA in wall-fired boilers in the United
States. There is more experience in retrofitting LNB and OFA
in tangential boilers since most LNB for these boilers use
some type of OFA (either CCOFA or SOFA). Some new boilers
subject to subpart Da standards have used a combination of LNB
and OFA to meet the NOx limits. Low NOx burners can also be
combined with operational modifications and flue gas treatment
controls to further reduce NOx emissions.
Reburn is a NOx control technology that involves diverting a
portion of the fuel from the burners to a second combustion
area (reburn zone) above the main combustion zone. Completion
air (or OFA) is then added above the reburn zone to complete
fuel burnout. The reburn fuel can be either natural gas, oil,

2-15
or pulverized coal; however, most of the experience is with
natural gas reburning. There are many technical issues in
applying reburn, such as maintaining acceptable boiler
performance when a large amount of heat input is moved from
the main combustion zone to a different area of the furnace.
Utilizing all the carbon in the fuel is also an issue when
pulverized coal is the reburn fuel.
Reburn can be applied to most boiler types and is the only
known combustion NOx control technique for cyclone boilers
although flue gas treatment controls may be effective on these
boilers. There are only four full-scale demonstrations of
reburn retrofit on coal-fired boilers in the United States,
two of which have been on cyclone boilers, one on a
tangentially-fired boiler, and one on a wall-fired boiler.
All of these installations are on boilers smaller than 200 MW.
There is one full-scale reburn + LNB project on a 150 MW wall-
fired boiler. To date, there have not been any reburn
installations on new boilers.
A similar technology is natural gas co-firing which consists
of injecting and combusting natural gas near or concurrently
with the main fuel (coal, oil, or natural gas). There is one
full-scale application of natural gas co-firing on a 400 MW
tangential, coal-fired boiler reported in this document.
Two commercially available flue gas treatment technologies
for reducing NOx emissions from existing fossil fuel utility
boilers are SNCR and SCR. Selective noncatalytic reduction
involves injecting ammonia (NH3) or urea into the flue gas to
yield elemental nitrogen and water. By-product emissions of
SNCR are N2O and NH3 slip. The NH3 or urea must be injected
into specific high-temperature zones in the upper furnace or
convective pass for this method to be effective. If the flue
gas temperature at the point of NH3 or urea injection is above
the SNCR operating range, the injected reagent will oxidize to
form NOx. If the flue gas temperature is below the SNCR
operating range, the reagent does not react with NOx and is
emitted to the atmosphere as NH3. Ammonia emissions must be
2-16
minimized because NH3 is a pollutant and can also react with
sulfur oxides in the flue gas to form ammonium salts, which
can deposit on downstream equipment such as air heaters.
The other flue gas treatment method, SCR, involves injecting
NH3 into the flue gas in the presence of a catalyst.
Selective catalytic reduction promotes the reactions by which
NOx is converted to elemental nitrogen and water at lower
temperatures than required for SNCR. The SCR reactor can be
placed before the air preheater (hot-side SCR) or after the
air preheater (cold-side SCR). The catalyst may be made of
precious metals (platinum or palladium), base metal oxides
(vanadium/titanium are most common), or zeolites (crystalline
aluminosilicate compounds). The performance of the SCR system
is influenced by the flue gas temperature and moisture, fuel
sulfur and ash content, NH3/NOx ratio, NOx concentration at
the SCR inlet, oxygen level, flue gas flow rate, space
velocity, and catalyst condition. While SCR has been applied
to some natural gas- and oil-fired boilers in the United
States (primarily California), its use in the United States on
coal has been limited to slip-stream applications. Several
full-scale utility coal-fired SCR systems are currently under
construction on new boilers.
Flue gas treatment controls can be combined with combustion
controls to achieve additional NOx reduction. Conceivably,
either SNCR or SCR could be used with LNB; however, there is
only one application of SNCR + LNB in the United States on a
coal-fired boiler and it is in the early stages of
demonstration. When combining LNB with SCR or SNCR, the
design of the system is critical if the two NOx control
technologies are to achieve maximum reduction. In some cases,
LNB can be designed to achieve the majority of the NOx
reduction, with SNCR or SCR used to "trim" the NOx to the
desired level.

2-17
2.5 SUMMARY OF PERFORMANCE AND COSTS OF NOx CONTROLS FOR
COAL-FIRED UTILITY BOILERS
2.5.1 Performance of NOx Controls
A summary of NOx emissions from coal-fired boilers with
combustion NOx controls is given in table 2-3
2-18
EMISSIONS FROM COAL-FIRED BOILERS WITH COMBUSTION CONTROLS
Control technology
reduction
Pre-NSPS boilers
level (lb/MMBtu)
NSPS boilers
levels
(lb/MMBtu)
Applicable boiler designs
Typical
Expected
Typical baseline
Operational
Modifications (BOOS,
LEA, BF)
T=0.70
W=0.90
T=0.55-0.65
--
Some wall and tangential
boilers that have operational
flexibility.
T=0.70
W=0.90
T=0.50-0.55
--
Some wall and tangential
boilers with sufficient
furnace height above top row
of burners.
T=35-45
W=40-50
Ce=50-55
T=0.70
W=0.90
Ce=1.0
T=0.40-0.45
W=0.45-0.55
Ce=0.45-0.50
Most wall and tangential
boilers, except slagging
units.
T=40-50
W=50-60
Ce=50-60
T=0.70
W=0.90
Ce=1.0
T=0.35-0.40
W=0.35-0.45
Ce=0.40-0.50
Some wall and tangential
boilers with sufficient
furnace height above top row
of burners.
T=0.70
W=0.90
Cy = 1.5
T=0.30-0.35
W=0.35-0.45
Cy=0.60-0.75
--
Most boiler types with
sufficient furnace height
above top row of burners.
reduction potential based on data presented in Chapter 5.0.
Typical levels based on data presented in Chapter 4.0. T = tangential, W = wall, Ce = cell, and Cy = cyclone.
emissions should be adjusted according
reduction potential.
burners incorporate close-coupled overfire air.
controls as original or retrofit equipment.
burners incorporate separated overfire air.
-- = Not applicable.
2-19
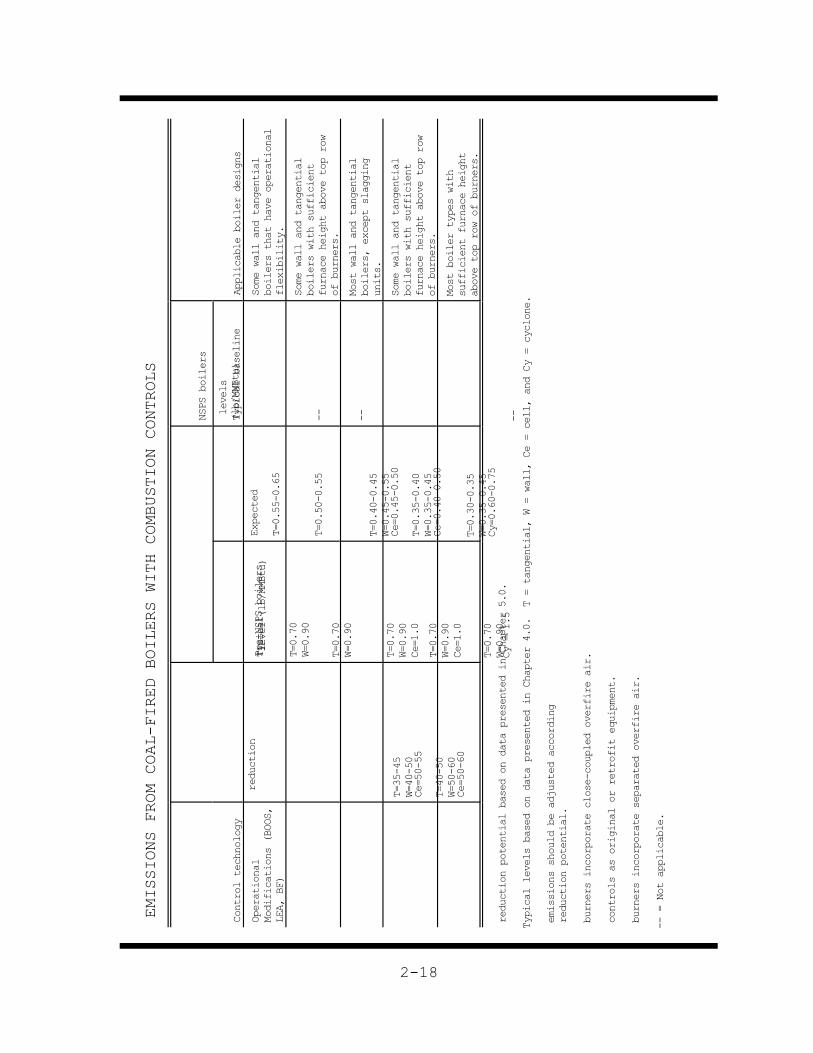
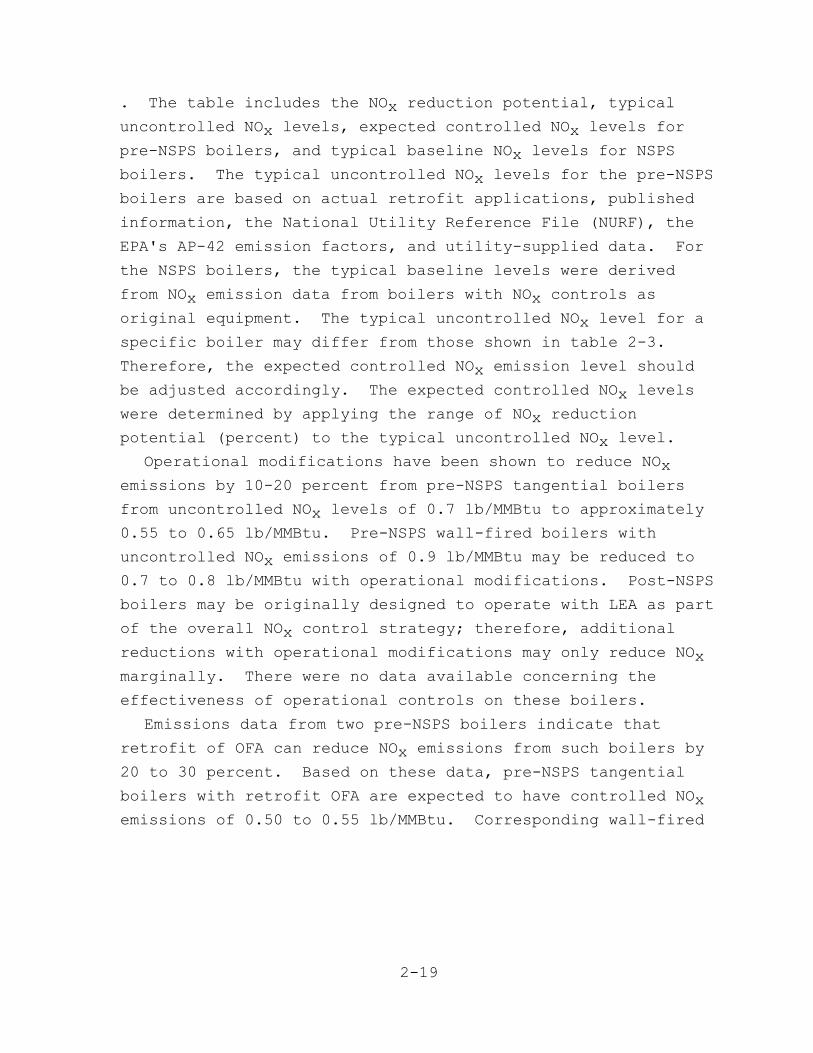
. The table includes the NOx reduction potential, typical
uncontrolled NOx levels, expected controlled NOx levels for
pre-NSPS boilers, and typical baseline NOx levels for NSPS
boilers. The typical uncontrolled NOx levels for the pre-NSPS
boilers are based on actual retrofit applications, published
information, the National Utility Reference File (NURF), the
EPA's AP-42 emission factors, and utility-supplied data. For
the NSPS boilers, the typical baseline levels were derived
from NOx emission data from boilers with NOx controls as
original equipment. The typical uncontrolled NOx level for a
specific boiler may differ from those shown in table 2-3.
Therefore, the expected controlled NOx emission level should
be adjusted accordingly. The expected controlled NOx levels
were determined by applying the range of NOx reduction
potential (percent) to the typical uncontrolled NOx level.
Operational modifications have been shown to reduce NOx
emissions by 10-20 percent from pre-NSPS tangential boilers
from uncontrolled NOx levels of 0.7 lb/MMBtu to approximately
0.55 to 0.65 lb/MMBtu. Pre-NSPS wall-fired boilers with
uncontrolled NOx emissions of 0.9 lb/MMBtu may be reduced to
0.7 to 0.8 lb/MMBtu with operational modifications. Post-NSPS
boilers may be originally designed to operate with LEA as part
of the overall NOx control strategy; therefore, additional
reductions with operational modifications may only reduce NOx
marginally. There were no data available concerning the
effectiveness of operational controls on these boilers.
Emissions data from two pre-NSPS boilers indicate that
retrofit of OFA can reduce NOx emissions from such boilers by
20 to 30 percent. Based on these data, pre-NSPS tangential
boilers with retrofit OFA are expected to have controlled NOx
emissions of 0.50 to 0.55 lb/MMBtu. Corresponding wall-fired

2-20
boilers with uncontrolled NOx levels of 0.9 lb/MMBtu are
expected to have controlled NOx emissions of 0.60 to
0.70 lb/MMBtu with OFA. However, not all pre-NSPS boilers
have enough furnace height above the top row of burners to
accommodate OFA ports.
Some NSPS boilers have OFA as part of the original NOx
control equipment. One application of OFA on a subpart Da
boiler was shown to reduce NOx by approximately 25 percent;
however, OFA and the original LNB did not reduce NOx to the
NSPS limit and the LNB had to be replaced. Another
application of OFA on a subpart D boiler reduced NOx by
approximately 20 percent to the NSPS limit. There are no data
available concerning the effectiveness of retrofitting OFA on
a NSPS boiler.
With retrofit LNB (including CCOFA) on pre-NSPS tangential
boilers, the controlled NOx emissions are expected to be
reduced by 35 to 45 percent to 0.40 to 0.45 lb/MMBtu from an
uncontrolled level of 0.7 lb/MMBtu. With LNB on wall-fired
boilers, the NOx emissions are expected to be reduced by 40 to
50 percent to 0.45 to 0.55 lb/MMBtu from an uncontrolled level
of 0.9 lb/MMBtu. The cell boilers are also expected to
average 0.45 to 0.50 lb/MMBtu with LNB (50 to 55 percent
reduction) from an uncontrolled level of 1.0 lb/MMBtu.
Results from 18 retrofit applications were used to estimate
the effectiveness of LNB.
Some post-NSPS boilers were designed with LNB to meet the
subpart D and subpart Da standards and the NOx emissions are
in the range of 0.35 to 0.50 lb/MMBtu for tangential boilers
and 0.25 to 0.50 lb/MMBtu for wall boilers. Results from 22
new applications were used to estimate the effectiveness of
LNB.
For the pre-NSPS tangential boilers with retrofit LNB + OFA,
the controlled NOx emissions are expected to be reduced by 40
to 50 percent to 0.35 to 0.40 lb/MMBtu from an uncontrolled
level of 0.7 lb/MMBtu. Wall-fired boilers with uncontrolled
NOx of 0.9 lb/MMBtu are expected to be reduced to 0.35 to

2-21
0.45 lb/MMBtu (50 to 60 percent reduction) with LNB + AOFA.
Cell-fired boilers are expected to average 0.40 to
0.50 lb/MMBtu (50 to 60 percent reduction) from an
uncontrolled level of 1.0 lb/MMBtu. The effectiveness of
LNB + OFA is based on 11 retrofit applications.
Some post-NSPS boilers were designed with LNB + AOFA to meet
the subpart D and subpart Da standards and the NOx emissions
range from 0.25 to 0.50 lb/MMBtu for tangential and 0.40 to
0.55 lb/MMBtu for wall boilers. As a retrofit control, the
combination of LNB + AOFA may be applicable to only the
boilers with sufficient furnace height and volume to
accommodate the additional air ports. The effectiveness of
LNB + AOFA on new boilers is based on results from two
applications.
With reburn retrofit on pre-NSPS tangential boilers, the NOx
emissions are expected to be 0.30 to 0.35 lb/MMBtu. For the
wall-fired boilers, the NOx emissions are expected to be 0.35
to 0.45 lb/MMBtu, whereas the NOx emissions are is expected to
be 0.6 to 0.75 lb/MMBtu for cyclone boilers. These emission
rates are based on limited data from four reburn retrofit
projects on pre-NSPS boilers less than 200 MW in size. Based
on these data, 50 to 60 percent reduction is estimated for all
boiler types. One natural gas co-firing application on a
450 mw coal-fired boiler yielded only 20 to 30 percent NOx
reduction. There are no NSPS boilers in operation with reburn
as original or retrofit equipment. However, it is estimated
that these boilers can achieve approximately the same
reduction (50 to 60 percent) as pre-NSPS boilers since they
may have large furnace volumes and should be able to
accommodate the reburn and completion air ports above the top
row of burners.

2-22
As shown in table 2-4

2-23
EMISSIONS FROM COAL-FIRED UTILITY BOILERS
WITH FLUE GAS TREATMENT CONTROLS
Control technology
reduction
(%)
Pre-NSPS boilers
level (lb/MMBtu)
NSPS boilers
levels
(lb/MMBtu)
Applicable boiler designs
Typical
Expected
Expected controlled
T=0.70
W=0.90
Ce=1.0
Cy=1.5
T=0.30-0.50
W=0.35-0.65
Ce=0.40-0.70
Cy=0.6-1.10
T=0.20-0.35
W=0.25-0.40
FBC=0.03-0.10
Applicable to most boiler
designs. Must have
sufficient residence time at
correct temperature (870-
C).
T=0.70
W=0.90
Ce=1.0
Cy=1.5
T=0.10-0.20
W=0.15-0.25
Ce=0.15-0.25
Cy=0.25-0.40
T=0.10-0.15
W=0.10-0.15
Applicable to most boiler
designs. Hot-side SCR best
used on low sulfur fuel and
low fly ash applications.
Cold-side SCR can be used on
high sulfur, high ash
applications if equipped
with upstream FGD.
T=0.70
W=0.90
Ce=1.0
T=0.15-0.35
W=0.20-0.45
Ce=0.20-0.50
T=0.20-0.35
W=0.25-0.40
Same as SNCR and LNB alone
T=0.70
W=0.90
Ce=1.0
T=0.05-0.10
W=0.05-0.10
Ce=0.05-0.15
T=0.10-0.15
W=0.10-0.15
Same as SCR and LNB + AOFA
alone
reduction based on data presented in Chapter 5.0.
Typical uncontrolled levels based upon data presented in Chapter 4.0. T = tangential, W = wall, Ce = cell, Cy = cyclone, and
FBC = fluidized bed combustion.
emissions should be adjusted
reduction potential.
Controlled levels for flue gas treatment as original or retrofit equipment.
2-24
, applying SNCR to pre-NSPS tangential boilers is expected to
reduce NOx emissions by 30 to 60 percent to 0.30 to
0.50 lb/MMBtu. For wall-fired boilers, the NOx emissions are
expected to average 0.35 to 0.65 lb/MMBtu with SNCR. It is
estimated that the range of

2-25
controlled NOx emissions from the cell and cyclone boilers
retrofit with SNCR would be 0.40 to 0.70 lb/MMBtu and 0.60 to
1.10 lb/MMBtu, respectively. However, SNCR has not been
applied to any cell and cyclone boilers at this time. The
predicted effectiveness of SNCR for pre-NSPS boilers is based
on three full-scale applications on coal-fired boilers (two
wall-fired and one vertical-fired). There are no data
available from any conventional NSPS utility boilers with SNCR
as original or retrofit equipment. However, the same NOx
reduction (30 to 60 percent) is expected on these boilers as
on pre-NSPS boilers.
The FBC boilers designed with SNCR as original equipment
have NOx emissions 50 to 80 percent lower than FBC boilers
without SNCR and have emissions in the range of 0.03 to
0.10 lb/MMBtu. This is based on results from seven original
applications of SNCR on FBC boilers.
The remaining flue gas treatment control, SCR, has had very
limited application on coal firing in the United States.
However, SCR is being used in Japan and Germany on a number of
coal-fired utility boilers. Primary concerns associated with
transfer of foreign SCR performance data to the U.S. are the
higher sulfur and alkali contents in many U.S. coals, both of
which may act as catalyst poisons and thereby reduce catalyst
activity and lifetime. The predicted effectiveness of SCR is
75 to 85 percent, which is based on data from three pilot-
scale applications in the U.S. By retrofitting SCR on
pre-NSPS boilers, the estimated NOx emissions from tangential
and wall boilers would be 0.10 to 0.20 lb/MMBtu and 0.15 to
0.25 lb/MMBtu, respectively. Predicted emissions from cell
and cyclone boilers would be 0.15 to 0.25 lb/MMBtu and 0.25 to
0.40 lb/MMBtu, respectively. Since there are no full-scale
applications on coal in the United States, the expected ranges
of NOx reduction and NOx emissions are estimated.
The combination of LNB + SNCR is estimated to reduce NOx
emissions by 50 to 80 percent; however, this combination of
controls has only been applied to one coal-fired boiler and

2-26
the results indicate approximately 70 percent reduction. For
the pre-NSPS tangential boilers, the NOx emissions are
expected to be in the range of 0.15 to 0.35 lb/MMBtu. The NOx
emissions from the pre-NSPS wall boilers are expected to be in
the range of 0.20 to 0.45 lb/MMBtu. For the cell boilers, the
NOx emissions are expected to be in the range of 0.20 to
0.50 lb/MMBtu. For the NSPS boilers, the NOx reduction from
LNB + SNCR is expected to be the same as SNCR alone (30 to
60 percent from the NSPS levels) since these boilers already
have LNB as original equipment. However, there are no
applications of LNB + SNCR as original equipment on new
boilers yet.
By combining LNB + AOFA + SCR, it is estimated that 85 to
95 percent NOx reduction can be achieved on pre-NSPS boilers.
For these boilers, the NOx emissions are expected to be in the
range of 0.05 to 0.15 lb/MMBtu, depending on boiler type. For
the NSPS boilers, the NOx reduction are expected to be the
same as for SCR alone (75 to 85 percent from NSPS levels),
since these boilers may already have LNB + AOFA as original
equipment. However, there are no applications of LNB + AOFA +
SCR as original equipment in operation on new boilers at this
time. This combination of controls has not been applied to
existing pre-NSPS boilers either; therefore, these reductions
and controlled levels are estimates only and have not been
demonstrated.
2.5.2 Costs of NOx Controls
The estimated costs for controlling NOx emissions are based
on data from utilities, technology vendors, and published
literature. The actual costs for both new and retrofit cases
depend on a number of boiler-specific factors, and a
particular NOx control technology may not be applicable to
some individual boilers. The costs presented here are meant
to provide general guidance for determining costs for similar
situations. The costs are presented in 1991 dollars.
However, cost indices for 1992 dollars are only 0.85 percent

2-27
lower than 1991 dollars; therefore, the values in this section
are indicative of the 1991-1992 timeframe.

2-28
Table 2-5

2-29
CONTROL COST EFFECTIVENESS FOR COAL-FIRED
UTILITY BOILERS (1991 DOLLARS)
Boiler
firing type
control
technology
100 MW
100 MW
300 MW
300 MW
(baseload)
600 MW
(baseload)
100-170
170-260
620-2,680
600-910
1,580-2,100
340-450
LNB + AOFA +
SCR
1,500-1,970
180-280
270-430
480-2,080
560-870
1,270-1,670
370-480
LNB + AOFA +
SCR
1,300-1,600
290-1,250
510-820
810-1,050
Cost effectiveness based on data presented in Chapter 6.0.
Peaking = 10% capacity factor.
Baseload = 65% capacity factor.

2-30
presents a summary of the cost effectiveness of various NOx
controls applied to coal-fired utility boilers. The costs
presented are for LNB, LNB + AOFA, reburn, SNCR, SCR, LNB +
SNCR, and LNB + AOFA + SCR applied to both tangential and wall
boilers. Costs for reburn, SNCR, and SCR are given for
cyclone boilers, and costs for SNCR are given for FBC boilers.
The costs are based on various factors as described in chapter
6. The cost estimates for SNCR are for a low-energy, urea-
based SNCR system as they were found to be comparable in cost
to a high-energy NH3-based SNCR system.
For tangential boilers, the cost effectiveness ranges from a
low of $100 per ton for LNB (a new 600 MW baseload boiler) to
a high of $12,400 per ton for LNB + AOFA + SCR (a 100 MW
peaking boiler and a 2-year catalyst life). The retrofit of
LNB or LNB + AOFA is estimated to result in the least cost per
ton of NOx removed for the tangential boilers. The cost
effectiveness for LNB ranges from $100 to $1,800 per ton. The
cost effectiveness for LNB + AOFA ranges from $170 to $3,300
per ton. The primary cause of the higher cost effectiveness
values is boiler duty cycle (i.e., capacity factor). The
retrofit of SCR or LNB + AOFA + SCR is estimated to be the
highest cost per ton of NOx removed. The cost effectiveness
for SCR ranges from $1,580 to $12,200 per ton. The cost
effectiveness for LNB + AOFA + SCR ranges from $1,500 to
$12,400 per ton.

2-31
Figure 2-1

2-32
control cost effectiveness for coal-fired
tangential boilers.

2-33
shows the NOx control cost effectiveness for a 300 MW
baseload tangential boiler. As shown, LNB and LNB + AOFA have
the lowest cost effectiveness for controlled NOx levels of
0.35 to 0.45 lb/MMBtu. The large variation in reburn cost
effectiveness (on this and other figures in the section) is
driven primarily by the fuel price differential between
natural gas and coal ($0.50 to $2.50/MMBtu). The cost
effectiveness of individual control techniques increases as
the controlled NOx emissions decrease.

2-34

2-35
For wall boilers, the cost effectiveness ranges from a low
of $180 per ton for LNB (a new 600 MW baseload boiler) to a
high of $11,100 for LNB + AOFA + SCR (a 100 MW peaking boiler
and a 2-year catalyst life). Typically, the retrofit of LNB
or LNB + AOFA is estimated to result in the lowest cost per
ton of NOx removed for the wall boilers. The cost
effectiveness for LNB ranges from $180 to $3,200 per ton. The
cost effectiveness for LNB + AOFA ranges from $270 to $5,470
per ton. The retrofit of SCR or LNB + AOFA + SCR is estimated
to have the highest cost per ton of NOx removed. The cost
effectiveness of SCR ranges from $1,290 to $9,650 per ton.
The cost effectiveness of LNB + AOFA + SCR ranges from $1,300
to $11,100 per ton.

2-36
Figure 2-2

2-37
control cost effectiveness for coal-fired wall boilers

2-38
shows the NOx control cost effectiveness for a 300 MW
baseload wall boiler. As shown, LNB and LNB + AOFA have the
lowest cost effectiveness for controlled NOx levels of 0.35 to
0.55 lb/MMBtu. Reburn is also cost effective if the price of
the reburn fuel is economical.
Estimated cost effectiveness for reburn, SNCR, and SCR for
cyclone boilers are also shown in table 2-5. The retrofit of
reburn and SNCR has the lowest estimated cost per ton of NOx
removed whereas retrofitting SCR has the highest. The cost
effectiveness of reburn ranges from $290 to $2,770 per ton and
the cost effectiveness of SNCR ranges from $510 to $1,780 per
ton. The cost effectiveness of SCR ranges from $810 to $5,940
per ton. Figure 2-3

2-39
control cost effectiveness for coal-fired cyclone boilers.

2-40
shows the NOx control cost effectiveness for a 300 MW
baseload cyclone boiler. The large variation in SNCR cost
effectiveness is driven primarily by the variability in
chemical costs and NOx reductions among individual boilers.
The cost effectiveness for SNCR applied to FBC boilers is
given in table 2-6

2-41
CONTROL COST EFFECTIVENESS FOR FBC BOILERS
(1991 DOLLARS)
Boiler
firing
type
control
technology
50 MW
50 MW
100 MW
(cycling)
100 MW
(baseload)
200 MW
(baseload)
1,500-1,800
Cost effectiveness based on data presented in Chapter 6.0.
Cycling = 30% capacity factor.
Baseload = 65% capacity factor.

2-42
and ranges from a low of $1,500 per ton (200 MW baseload) to
a high of $5,400 per ton (50 MW cycling). In all cases,
the factor having the greatest potential impact on the cost
effectiveness of NOx controls is boiler capacity factor.
Depending on the control technology, the cost effectiveness
associated with reducing NOx emission from

2-43

2-44

2-45
a peaking-duty boiler (10 percent capacity factor) is 2 to 5
times higher than for a baseload boiler (65 percent capacity
factor). Other significant factors influencing control
technology cost effectiveness are the economic life of the
control system, the boiler size, and the uncontrolled NOx
level.
2.6 SUMMARY OF PERFORMANCE AND COSTS OF NOx CONTROLS FOR
NATURAL GAS- AND OIL-FIRED UTILITY BOILERS
2.6.1 Performance of NOx Controls
A summary of NOx emissions from natural gas- and oil-fired
boilers with retrofit combustion controls is given in
table 2-7

2-46
EMISSIONS FROM NATURAL GAS- AND
OIL-FIRED UTILITY BOILERS WITH COMBUSTION CONTROLS
Control
reduction
(%)
Pre-NSPS Boilers
level (lb/MMBtu)
NSPS Boilers
level (lb/MMBtu)
Applicable boiler designs
Typical
uncontrolled
Expected controlled
Typical baseline
Operational
Modifications
(LEA + BOOS)
Gas and oil:
T=0.3
W=0.5
Gas and Oil:
T=0.15-0.20
W=0.25-0.35
Oil: T,W=0.15-0.25
Gas: T,W=0.10-0.20
Most boilers that have operational
flexibility.
Gas and Oil:
T=0.3
W=0.5
Gas and Oil:
T=0.15-0.20
W=0.25-0.30
Oil: T,W=0.10-0.25
Gas: T,W=0.10-0.20
Most wall and tangential boilers.
Gas and Oil:
T=0.3
W=0.5
Gas and Oil:
T=0.20-0.30
W=0.30-0.45
Oil: T,W=0.15-0.25
Gas: T,W=0.10-0.20
Most wall and tangential boilers.
Gas and Oil:
T=0.3
W=0.5
Gas and Oil:
T=0.15-0.20
W=0.25-0.35
Oil: T,W=0.10-0.25
Gas: T,W=0.10-0.20
Most wall and tangential boilers.
LNB + OFA (or
BOOS)
Gas and Oil:
T=0.3
W=0.5
Gas and Oil
T=0.15-0.20
W=0.25-0.30
Oil: T,W=0.10-0.25
Gas: T,W=0.10-0.20
Most wall and tangential boilers with
sufficient furnace height.
Combination
Gas and Oil:
T=0.3
W=0.5
Gas and Oil:
T=0.05-0.15
W=0.05-0.20
Oil: T,W=0.05-0.25
Gas: T,W=0.05-0.20
Most wall and tangential boilers.
Oil:
T=0.3
W=0.5
Oil: T=0.10-0.20
W=0.20-0.25
Oil: T=0.10-0.25
W=0.10-0.25
Some boiler designs with large furnace
volumes and sufficient furnace height.
BOOS = burners-out-of-service, LEA = low excess air, FGR = flue gas recirculation, OFA = overfire air,
burners.
reduction based on data presented in chapter 5.
Typical uncontrolled levels based on data presented in chapter 4. T = tangential and W = wall.
level for a specific boiler.
controls as original or retrofit equipment.
Combination of FGR + BOOS or OFA; LNB + FGR + BOOS (or OFA).
Limited experience abroad on gas/oil and nonexistent experience in U. S. Percent reduction based on
coal-fired experience.
2-47
. The table includes the NOx reduction potential for each
technology, typical uncontrolled NOx levels, and expected
controlled NOx levels. These data are based on actual
retrofit applications, published literature, NURF, the EPA's
AP-42 emission factors, and information obtained from
utilities. The typical uncontrolled NOx level for a specific
boiler may differ from those shown in table 2-7. Therefore,
the expected controlled NOx emission level should be adjusted
accordingly. The expected controlled NOx levels were
determined by applying the range of NOx reduction potential
(percent) to the typical uncontrolled NOx level.
For pre-NSPS tangential boilers, the uncontrolled NOx level
of 0.30 lb/MMBtu is expected to be reduced to 0.15 to
0.20 lb/MMBtu (30 to 50 percent reduction) with operational
modifications such as BOOS + LEA. Corresponding pre-NSPS
wall-fired boilers with uncontrolled NOx emissions of
0.50 lb/MMBtu are expected to be reduced to 0.25 to
0.35 lb/MMBtu with operational modifications. Data was not
available for operational controls on boilers subject to
subpart D and subpart Da standards; however, it is estimated
that these boilers may achieve approximately the same
reduction (30 to 50 percent) as the pre-NSPS boilers. The
effectiveness of operational controls are based on eight
retrofit applications.
2-48
The pre-NSPS tangential boilers are expected to reduce NOx
from an uncontrolled level of 0.30 lb/MMBtu to a controlled
NOx level of 0.15 to 0.20 lb/MMBtu with FGR (45 to 55 percent
reduction). Corresponding wall-fired boilers are expected to
have controlled NOx emissions of 0.25 to 0.30 lb/MMBtu with
FGR. The post-NSPS boilers are expected to achieve the same
percent reduction as the pre-NSPS boilers (45 to 55 percent).
The effectiveness of FGR is based on two retrofit
applications.
With retrofit OFA on pre-NSPS tangential boilers, the
controlled NOx emissions are expected to be 0.15 to
0.30 lb/MMBtu and the wall-fired boilers are expected to be
0.30 to 0.45 lb/MMBtu. Some post-NSPS boilers may be designed
or retrofitted with OFA to meet the subpart D and subpart Da
standards and are expected to be in the range of 0.10 to
0.25 lb/MMBtu depending on fuel. However, OFA is typically
combined with other combustion modifications such as LEA
rather than used alone. The estimated percent reduction is
based on four applications of OFA + LEA on pre-NSPS boilers.
With retrofit LNB on pre-NSPS tangential boilers, the
controlled NOx emissions are expected to be 0.15 to
0.20 lb/MMBtu and the wall-fired boilers are expected to be
0.25 to 0.35 lb/MMBtu (30 to 50 percent reduction). Some
post-NSPS wall and tangential boilers may be designed with LNB
to meet the subpart D and subpart Da standards and are in the
range of 0.10 to 0.25 lb/MMBtu depending on fuel. Results
from six pre-NSPS retrofit applications were used to estimate
the effectiveness of LNB.
By combining FGR + BOOS (or OFA) + LNB on pre-NSPS
tangential and wall boilers, the controlled NOx emissions are
expected to be 0.05 to 0.20 lb/MMBtu. Some post-NSPS boilers
may be designed with FGR + BOOS + LNB that meet the subpart D
and subpart Da standards and are in the range of 0.05 to
0.25 lb/MMBtu. These results are based on two pre-NSPS
boilers.

2-49
With reburn on pre-NSPS tangential and wall boilers firing
oil, the NOx emissions are estimated to be 0.10 to
0.20 lb/MMBtu and 0.20 to 0.25 lb/MMBtu, respectively.
However, reburn experience on oil-fired boilers is very
limited and the expected controlled emissions are estimated.
There are no post-NSPS oil-fired boilers with reburn as
original equipment. The effectiveness of reburn on oil-fired
boilers is based on the coal-fired experience and is estimated
to be 50 to 60 percent reduction.

2-50
Table 2-8

2-51
EMISSIONS FROM NATURAL GAS- AND OIL-FIRED UTILITY
BOILERS WITH FLUE GAS TREATMENT CONTROLS
reduction
(%)
Pre-NSPS boilers
level (lb/MMBtu)
NSPS boilers
level (lb/MMBtu)
Applicable boiler designs
Typical
uncontrolled
Expected controlled
Expected controlled
Gas and Oil:
T=0.30
W=0.50
Gas and Oil:
T=0.20-0.25
W=0.30-0.40
Oil:
T,W=0.15-0.25
Gas:
T,W=0.10-0.20
Applicable to most boiler
designs; however, must
have sufficient residence
time in convective pass at
correct temperature.
Gas and Oil:
T=0.30
W=0.50
Gas and Oil:
T=0.03-0.10
W=0.05-0.10
Oil:
T,W=0.05-0.25
Gas:
T,W=0.03-0.20
Applicable to most boiler
designs. Hot-side SCR
best used on low sulfur
fuel and low fly ash
applications. Cold-side
SCR can be used on high
sulfur, high ash
applications, if equipped
with upstream FGD.
Gas and Oil:
T=0.30
W=0.50
Gas and Oil:
T=0.05-0.10
W=0.10-0.15
Oil:
T,W=0.10-0.25
Gas:
T,W=0.05-0.20
Same as SNCR and LNB's
alone.
Gas and Oil:
T=0.30
W=0.50
Gas and Oil:
T=0.02-0.10
W=0.03-0.10
Oil:
T,W=0.05-0.25
Gas:
T,W=0.05-0.20
Same as SCR and LNB + AOFA
alone.
burners, and AOFA = Advanced overfire air.
reduction based upon data presented in chapter 5.0.
Typical uncontrolled levels based on data presented in chapter 4.0. T = tangential, W = wall.
emissions should be adjusted
reduction potential.
Controlled levels for flue gas treatment controls as original or retrofit equipment.
No SNCR applications on boilers above 200 MW.
Limited or no full-scale installations in U. S.; therefore, these are estimated reduction levels.

2-52
presents a summary of expected NOx emissions from natural
gas- and oil-fired boilers with flue gas treatment alone and
combined with combustion controls. For pre-NSPS tangential
boilers with SNCR, the expected controlled NOx level is
expected to be 0.20 to 0.25 lb/MMBtu, whereas the range for
wall-fired boilers is 0.30 to 0.40 lb/MMBtu (25 to
40 percent). These results are based on two SNCR application
on oil boilers and ten SNCR applications on natural gas
boilers. For post-NSPS boilers with SNCR, the expected
controlled NOx level is 0.10 to 0.25 lb/MMBtu retrofit
depending on boiler type. However, there are no data from
post-NSPS boilers with SNCR, nor are there data from post-NSPS
boilers designed with SNCR as original equipment. Therefore,
these reductions and controlled levels are estimated.
For pre-NSPS tangential boilers, the expected controlled NOx
is 0.03 to 0.10 lb/MMBtu with retrofit SCR. The expected
controlled NOx for wall-fired boilers is 0.05 to
0.10 lb/MMBtu. For post-NSPS boilers, the expected controlled
NOx levels is 0.05 to 0.25 lb/MMBtu depending on boiler type.
These results are based on one pilot-scale and one full-scale
application. There are no data from post-NSPS boilers with
retrofit SCR, nor are there data from post-NSPS boilers
designed with SCR as original equipment. Therefore, these
reductions and controlled levels are estimates only.
The combination of LNB + SNCR is estimated to reduce NOx
emissions by 70 to 80 percent and data from one application of
LNB + OFA + SNCR on a coal-fired boiler shows 70-85 percent

2-53
reduction across the load range. For pre-NSPS tangential
boilers, the NOx emissions are expected to be in the range of
0.05 to 0.10 lb/MMBtu. For pre-NSPS wall-fired boilers, the
NOx emissions are expected to be 0.01 to 0.15 lb/MMBtu. There
are no data from post-NSPS boilers with LNB + SNCR as original
or retrofit equipment; therefore, these reductions and are
estimated controlled levels.
By combining LNB + AOFA + SCR, it is estimated that 85 to
95 percent NOx reduction can be achieved. The NOx emissions
are expected to be in the range of 0.02 to 0.1 lb/MMBtu and
the post-NSPS boilers are expected to be in the range of 0.05
to 0.25 lb/MMBtu. This control technology combination has not
yet been applied to existing or new boilers; therefore, these
reductions and controlled levels are estimates.
2.6.2 Costs of NOx Controls

2-54
Table 2-9
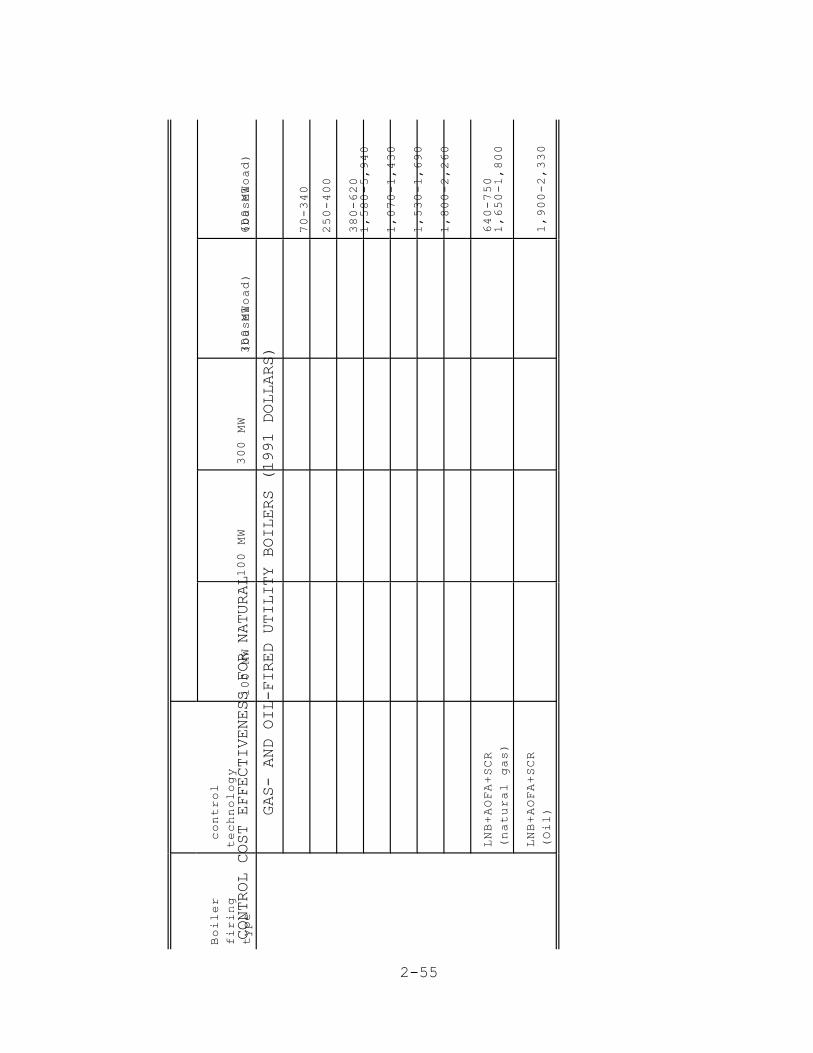
2-55
CONTROL COST EFFECTIVENESS FOR NATURAL
GAS- AND OIL-FIRED UTILITY BOILERS (1991 DOLLARS)
Boiler
firing
type
control
technology
100 MW
100 MW
300 MW
300 MW
(baseload)
600 MW
(baseload)
70-340
250-400
380-620
1,580-5,940
1,070-1,430
1,530-1,690
1,800-2,260
640-750
LNB+AOFA+SCR
(natural gas)
1,650-1,800
LNB+AOFA+SCR
(Oil)
1,900-2,330

2-56
CONTROL COST EFFECTIVENESS FOR NATURAL
GAS- AND OIL-FIRED UTILITY BOILERS (1991 DOLLARS)
(CONCLUDED)
Boiler
firing
type
control
technology
100 MW
100 MW
300 MW
300 MW
(baseload)
600 MW
(baseload)
Wall
Firing
40-200
310-500
480-770
946-3,560
860-1,240
970-1,070
1,130-1,410
590-700
LNB+AOFA+SCR
(natural gas)
1,200-1,290
LNB+AOFA+SCR
(oil)
1,350-1,610
Peaking = 10% capacity factor.
Baseload = 65% capacity factor.
Cycling = 30% capacity factor.

2-57
presents a summary of the cost effectiveness of various NOx
controls applied to natural gas- and oil-fired utility
boilers. The costs presented are for LEA + BOOS, LNB, LNB +
AOFA, reburn, SNCR, SCR, LNB + SNCR, and LNB + AOFA + SCR
applied to both tangential and wall boilers. The costs are
based on the various factors described in chapter 6.
For tangential boilers, the cost effectiveness ranges from a
low of $70 per ton for LEA + BOOS (a new 600 MW baseload
boiler) to a high of $16,900 per ton for LNB + AOFA + SCR
(100 MW oil-fired peaking boiler and a 3-year catalyst life).
The retrofit of LEA + BOOS or LNB is estimated to have the
lowest cost per ton of NOx removed for the tangential boilers.
The cost effectiveness value of LEA + BOOS ranges from $70 to
$500 per ton. The cost effectiveness value for LNB ranges
from $250 to $4,200 per ton. The retrofit of SCR or LNB +
AOFA + SCR is estimated to have the highest cost per ton of
NOx removed. The cost effectiveness value of SCR ranges from
$1,530 to $11,700 per ton for natural gas-fired units and from
$1,800 to $14,700 per ton for oil-fired units. The cost
effectiveness of LNB + AOFA + SCR ranges from $1,650 to

2-58

2-59

2-60
$14,200 per ton for natural gas-fired units and from $1,900 to
$16,900 per ton for oil-fired units. Figure 2-4

2-61
control cost effectiveness for natural gas- and oil-fired
tangential boilers.

2-62
shows the NOx control cost effectiveness for a 300 MW
baseload tangential boiler. As shown, LEA + BOOS and LNB have
the lowest cost effectiveness value for controlled NOx
emissions of 0.1 to 0.2 lb/MMBtu. For controlled NOx
emissions of less than 0.1 lb/MMBtu the cost effectiveness
increases.
For the wall boilers, the cost effectiveness ranges from a
low of $40 per ton for LEA + BOOS (a new 600 MW baseload
boiler) to a high of $12,700 per ton for LNB + AOFA + SCR
(100 MW oil-fired peaking boiler and a 3-year catalyst life).
The retrofit of LEA + BOOS or LNB is estimated to have the
lowest cost per ton of NOx removed for the wall boilers. The
cost effectiveness of LEA + BOOS ranges from $40 to $300 per
ton. The cost effectiveness of LNB ranges from $300 to $5,800
per ton. The retrofit of SCR or SCR + LNB + AOFA is estimated
to be the highest cost per ton of NOx removed. The cost
effectiveness of SCR ranges from $970 to $7,200 per ton for
natural gas-fired units and from $1,130 to $8,940 per ton for
oil-fired units. Figure 2-5

2-63
control cost effectiveness for natural gas- and oil-fired
wall boilers.

2-64
shows the NOx control cost effectiveness for a 300 MW
baseload wall boiler. As shown, LEA + BOOS and LNB have the
lowest cost effectiveness for controlled NOx emissions of 0.25
to 0.35 lb/MMBtu. For controlled NOx emissions of less than
0.25 lb/MMBtu, the cost effectiveness increases.
The effects of various plant parameters (e.g., capacity
factor, economic life, boiler size, uncontrolled NOx levels)
on the cost effectiveness of individual NOx controls are
similar to those for coal-fired boilers. Due to lower
uncontrolled NOx levels, the cost effectiveness of applying
controls to oil- and natural gas-fired boilers is higher than
for coal-fired boilers.
2.7 SUMMARY OF IMPACTS OF NOx CONTROLS
2.7.1 Impacts from Combustion NOx Controls
Combustion NOx controls suppress both thermal and fuel NOx
formation by reducing the peak flame temperature and by

2-65

2-66
delaying the mixing of fuel with the combustion air. However,
this can result in a decrease in boiler efficiency for several
reasons. For coal-fired boilers, an increase in carbon
monoxide (CO) emissions and unburned carbon (UBC) levels, as
well as changes in the thermal profile and heat transfer
characteristics of the boiler, may result from combustion
controls. For natural gas- and oil-fired boilers, CO
emissions could also increase, although adverse effects are
infrequently reported from these boilers. The effects from
combustion NOx controls are influenced by boiler design and
operational characteristics such as furnace type, fuel type,
condition of existing equipment, and age.

2-67
Table 2-10

2-68
CONTROLS
ON FOSSIL FUEL-FIRED UTILITY BOILERS
Control
Boiler efficiency
BOOS, LEA,
BF
One application showed
increase of 40-250 ppm.
No reported
effects.
No reported
effects.
2 applications showed
decreases of 100-150 ppm.
No reported effects
for oil-firing.
No reported
effects.
One application showed
decrease of 5-85 ppm.
Range increased
from 2.3-5.2% to
7.1-10.2%.
Decreased by 0.4-
0.7 percentage
points.
Controlled levels of 26-
830 ppm.
No reported effects
for oil-firing.
No reported
effects.
Ranged increased from 12-
60 ppm to 15-86 ppm.
Range increased
from 1-7.4% to 1.6-
9.0%.
Decreased by 0.5-
1.5 percentage
points.
Controlled levels of 1-
220 ppm.
No reported effects
for oil-firing.
No reported
effects.
Range increased from 12-
30 ppm to 20-45 ppm.
Range increased
from 0.4-5% to 0.3-
6.8%.
Decreased by 0.2-
0.9 percentage
points.
No reported effects
for oil-firing.
No reported
effects.
Range increased from 60-
94 ppm to 50-132 ppm
Range increased
from 2.5-23% to
1.5-28%.
Decreased by 0.5-
1.5 percentage
points
No data

2-69
summarizes the impacts from combustion NOx controls on fossil
fuel-fired utility boilers. Based on limited data, the CO
emissions increase on most installations with use of
operational modifications on coal-fired boilers and decrease
on natural gas and oil boilers. There were no reported
effects on UBC levels or boiler efficiency with the use of
operational modifications.
Overfire air on one coal-fired boiler resulted in a 5 to
85 parts per million (ppm) decrease in CO emissions from
uncontrolled levels. The level of CO emissions with OFA on
the natural gas- and oil-fired boilers ranged from 26-830 ppm.
The UBC level for coal-fired boilers increased approximately
two- to three-fold with OFA and the boiler efficiency
decreased by 0.4 to 0.7 percentage points.
Low NOx burners retrofit on coal-fired boilers resulted in
an increase of both CO and UBC for most applications, and the
boiler efficiency decreased by 0.5 to 1.5 percentage points.
For natural gas- and oil-fired boilers, the controlled level
of CO was 1 to 220 ppm. There were no reported effects on
boiler efficiency for these boilers.
The combination of LNB and OFA on coal-fired boilers
resulted in a slight increase in both CO and UBC. The boiler
efficiency decreased by 0.2 to 0.9 percentage points. There

2-70

2-71
were no reported effects on the natural gas- and oil-fired
boilers with LNB and OFA.
With reburn applied to coal-fired boilers, both CO and UBC
increased and the boiler efficiency decreased by 0.5 to
1.5 percentage points. There were no data available for
reburn applied to oil-fired boilers.
2.7.2 Impacts from Flue Gas Treatment Controls
Flue gas treatment controls remove NOx by a reaction of
injected NH3 or urea in the upper furnace or the convective
pass or by a reaction of NH3 in the presence of a catalyst at
lower temperatures. These controls can produce unreacted
reagents in the form of NH3 slip which can be emitted into the
atmosphere or can be adsorbed onto the fly ash. The NH3 slip
can also react with sulfur trioxide (SO3) from firing coal or
oil and deposit as ammonium sulfate compounds in downstream
equipment. Nitrous oxide (N2O) emissions are typically higher
on boilers with urea-based SNCR systems. Very limited data
are available; however, NH3-based SNCR may yield N2O levels
equal to 4 percent of the NOx reduced and urea-based SNCR may
yield N2O levels of 7 to 25 percent of the NOx reduced. Flue
gas treatment controls also require additional energy to run
pumps, heaters, auxiliary process equipment, and to overcome
any additional pressure drop due to the catalyst beds or from
downstream equipment that may be plugged. The additional
pressure drop from downstream equipment plugging could
ultimately affect unit availability.

2-72
Table 2-11

2-73
TABLE 2-11. SUMMARY OF IMPACTS FROM FLUE GAS TREATMENT CONTROLS ON
FOSSIL FUEL-FIRED UTILITY BOILERS
Ammonia
slip
Other possible effects
Conventional
utility boiler
Little or no
effect.
Nitrous oxide is a possible by-
product.
Possible
Ammonium sulfate compounds may
deposit in downstream equipment
causing air heater pluggage
that degrades unit performance
and corrodes air heater
baskets.
Fluidized bed
combustion
Minor energy losses due to
pumps, heaters, and control
systems.
Fluidized Bed
Combustion
Data not
available.
Data not
available.
in
the fly ash and scrubber by-
products, creating disposal
slip level
above 2 ppm.
Coal & Oil Pilot-
Scale
Data not
available.
Ammonium sulfate compounds may
deposit in downstream
equipment.
Data not
available.
Losses due to energy required
to overcome catalyst bed
pressure drop.
in
the fly ash, creating disposal
problems.

2-74
summarizes the impacts from SNCR and SCR systems. Increases
of CO emissions due to the urea-based SNCR system have been
reported since urea (NH2CONH2) has CO bound in each molecule
injected. If that CO is not oxidized to CO2, then CO will
pass through to the stack. Ammonia-based SNCR does not
contain bound CO, so use of NH3 as an SNCR reagent would not
increase stack emissions of either CO or CO2. The NH3 slip
for these fossil fuel-fired boilers ranged from 10 to 110 ppm.
For FBC, the CO emissions were in the range of 10 to 110 ppm
and NH3 slip was in the range of 20 to 30 ppm.

2-75
Limited data were available for installation of SCR in the
United States. There were no data for SCR on CO emissions
from the pilot- or full-scale applications. The NH3 slip for
the pilot-scale SCR application on coal and oil was less than
20 ppm. The NH3 slip for one full-scale SCR application on
natural gas and oil was in the range of 10 to 40 ppm.

3-76
3.0 OVERVIEW AND CHARACTERIZATION OF UTILITY BOILERS
This chapter presents an overview and characterization of
utility boilers. The chapter is divided into four main
sections: utility boiler fuel use in the United States,
fossil fuel characteristics, utility boiler designs, and the
impact of fuel properties on boiler design.
3.1 UTILITY BOILER FUEL USE IN THE UNITED STATES
Approximately 71 percent of the generating capability of
electrical power plants in the United States is based on
fossil fuels, as shown in figure 3-1

3-77
Figure 3-1.
Percent Generating Capability by Energy Source,
as of December 31, 1990

3-78
.1 Generating capability is the actual electrical generating
performance of the unit. The primary fossil fuels burned in
electric utility boilers are coal, oil, and natural gas. Of
these fuels, coal is the most widely used, accounting for
43 percent of the total U. S. generating capability and
60 percent of the fossil fuel generating capability. Coal
generating capacity is followed by natural gas, which
represents 17 percent of the total generating capability and
24 percent of the fossil fuel generating capability. Oil
represents 11 percent of the total and 15 percent of the
fossil fuel generating capability.

3-79
As shown in figure 3-2

3-80
Figure 3-2.
Coal-Fired Generating Capability, as of
December 31, 1990

3-81
, most of the coal-firing capability is east of the
Mississippi River, with the significant remainder being in
Texas and the Rocky Mountain region.2 Natural gas is used
primarily in the South Central States and California as shown
in figure 3-3

3-82
Figure 3-3.
Gas-Fired Generating Capability, as of
December 31, 1990

3-83
.3 Oil is predominantly used in Florida and the Northeast as
shown in figure 3-4

3-84
Figure 3-4.
Oil-Fired Generating Capability, as of
December 31, 1990
3-85
.4 Fuel economics and environmental regulations

3-86

3-87

3-88

3-89

3-90
frequently affect regional use patterns. For example, coal is
not used in California because of stringent air quality
limitations.
3.2 FOSSIL FUEL CHARACTERISTICS
This section contains information on the three fossil
fuels used for electric power generation: coal, oil, and
natural gas.
3.2.1 Coal
Coals are classified by rank, i.e., according to their
progressive alteration in the natural metamorphosis from
lignite to anthracite. Volatile matter, fixed carbon,
inherent moisture and oxygen are all indicative of rank, but
no one item completely defines it. The American Society for
Testing and Materials (ASTM) classified coals by rank,
according to fixed carbon and volatile matter content, or
heating (calorific) value. Calorific value is calculated on a
moist, mineral-matter-free basis and shown in table 3-1

3-91
Table 3-1
3-92
.5 The ASTM classification for high rank (older) coals uses
volatile matter and fixed carbon contents. The coal rank
increases as the amount of fixed carbon increases and the
amounts of volatile matter and moisture decrease. Moisture
and volatile matter are driven from the coal during its
metamorphism by pressure and heat, thus raising the fraction
of fixed carbon. These values are not suitable for ranking
low rank coals. Lower ranking (younger) coals are classified
by calorific (heating) value and caking (agglomerating)
properties which vary little for high rank coals but
appreciably and systematically for low rank coals.
The components of a coal are customarily reported in two
different analyses, known as "proximate" and "ultimate."
Proximate analysis separates coal into four fractions:
(1) water or moisture; (2) volatile matter, consisting of
gases and vapors driven off when coal is heated; (3) fixed
carbon, the coke-like residue that burns at higher
temperatures after the volatile matter has been driven off;

3-93

3-94
and (4) mineral impurities, or coal ash, left when the coal is
completely combusted.
In addition to proximate analysis, which gives
information on the behavior of coal when it is heated,
"ultimate analysis" identifies the primary elements in coal.
These elements include carbon, hydrogen, nitrogen, oxygen, and
sulfur. Ultimate analyses may be given on several bases,
according to the application. For coal classification, the
moist, mineral-matter-free basis is generally used. For
combustion calculations, coal is analyzed as-received,
including moisture and mineral matter. Table 3-2

3-95
TABLE 3-2

3-96
presents sources and analyses of various ranks of as-received
coals.6,7 The nitrogen contents of these coals are generally
less than 2 percent and does not vary systematically with coal
rank.
Various physical properties of coal such as the type and
distribution of mineral matter in the coal and the coal's
"slagging" tendencies are of importance when burning coal.
Mineral matter influences options for washing the coal to
remove ash and sulfur before combustion, the performance of
air pollution control equipment, and the disposal
characteristics of ash collected from the boiler and air
pollution control equipment. Slagging properties influence
the selection of boiler operating conditions, such as furnace
operating temperature and excess air levels, and the rate and
efficiency of coal conversion to usable thermal energy.
3.2.1.1 Anthracite Coal. Anthracite is a hard,
slow-burning coal characterized by a high percentage of fixed
carbon, and a low percentage of volatile matter. Anthracite
coals typically contain 0.8 to 1.0 weight-percent nitrogen.8
Because of its low volatile matter, anthracite is difficult to
ignite and is not commonly burned in utility boilers.
Specific characteristics of anthracitic coals are shown in
tables 3-1 and 3-2. In the United States, commercial
anthracite production occurs almost exclusively in
Pennsylvania.

3-97
3.2.1.2 Bituminous Coal. By far the largest group,
bituminous coals are characterized as having a lower
fixed-carbon content, and higher volatile matter content than
anthracite. Typical nitrogen levels are 0.9 to 1.8 weight-
percent.8 Specific characteristics of bituminous coals are
shown in tables 3-1 and 3-2. Bituminous coals are the primary
coal type found in the United States, occurring throughout
much of the Appalachian, Midwest, and Rocky Mountain regions.
Key distinguishing characteristics of bituminous coal are its
relative volatile matter and sulfur content, and its slagging
and agglomerating characteristics. As a general rule, low-
volatile-matter and low-sulfur-content bituminous coals are
found in the Southern Appalachian and the Rocky Mountain
regions. Although the amount of volatile matter and sulfur in
coal are independent of each other, coals in the northern and
central Appalachian region and the Midwest frequently have
medium to high contents of both.
3.2.1.3 Subbituminous Coal. Subbituminous coals have
still higher moisture and volatile matter contents. Found
primarily in the Rocky Mountain region, U. S. subbituminous
coals generally have low sulfur content and little tendency to
agglomerate. The nitrogen content typically ranges from 0.6
to 1.4 weight-percent.8 Specific characteristics of
subbituminous coals are shown in tables 3-1 and 3-2. Because
of the low sulfur content in many subbituminous coals, their
use by electric utilities grew rapidly in the 1970's and
1980's when lower sulfur dioxide (SO2) emissions were
mandated. Their higher moisture content and resulting lower
heating value, however, influence the economics of shipping
and their use as an alternate fuel in boilers originally
designed to burn bituminous coals.
3.2.1.4 Lignite. Lignites are the least metamorphesized
coals and have a moisture content of up to 45 percent,
resulting in lower heating values than higher ranking coals.
The nitrogen content of lignites generally range from 0.5
to 0.8 weight-percent.8 Specific characteristics of lignite

3-98
are shown in tables 3-1 and 3-2. Commercial lignite
production occurs primarily in Texas and North Dakota.
Because of its high moisture content and low heating value,
lignite is generally used in power plants located near the
producing mine.
3.2.2 Oil
Fuel oils produced from crude oil are used as fuels in
the electric utility industry. The term "fuel oil" covers a
broad range of petroleum products, from a light petroleum
fraction similar to kerosene or gas oil, to a heavy residue
left after distilling off fixed gases, gasoline, gas oil, and
other lighter hydrocarbon streams.
To provide commercial standards for petroleum refining,
specifications have been established by the ASTM for several
grades of fuel oil and are shown in table 3-3

3-99
9Grade
offuel
oil
Flash
point,
F C)
Pour
point,
F C)
Water
and
sediment
, % by
volume
Carbon
residue
on 10%
bottoms,
%
Ash, %
byweight
Distillation
C)
Kinematic Viscosity,
centistokes
Gravit
y, deg
API
Copper
strip
corrosio
n
10%
90% point
Universal at
C)
Furol at
F C)
F C)
Max.
100
(38)
420
(215)
550
(288)
No. 3
100
(38)
20(-7)
540
(282
)
640
(338)
(32.6
)
(37.9
3)
--
130
(55)
20(-7)
--
No. 5
(Light
)
130
(55)
--
No. 5
(Heavy
)
130
(55)
--
150
(65)
(9000
)--
-- = Data not provided in Reference table.

3-100
.9 Fuel oils are graded according to specific gravity and
viscosity, the lightest being No. 1 and the heaviest No. 6.
Typical properties of the standard grades of fuel oils are
given in table 3-4

3-101
10,11
No. 1 fuel
oil
No. 2 fuel
oil
No. 4 fuel
oil
No. 5 fuel
oil
No. 6 fuel
oil
Type
Distillate
Distillate
Very light
residual
Light
Residual
Black
12
0.9861
8.212
Viscosity, Centistokes
F360.0
65
15
(minimum)
35
(minimum)
100
25
(minimum)
200
12.0
2.0
(maximum)
2.8
(maximum)
0.1-0.5
10.5
85.70
0.5
(maximum)
1.0
(maximum)
2.0
(maximum)
0.08
150,000

3-102
.10,11
Compared to coal, fuel oils are relatively easy to burn.
Preheating is not required for the lighter oils, and most
heavier oils are also relatively simple to handle. Ash
content is minimal compared to coal, and the amount of
particulate matter (PM) in the flue gas is correspondingly
small.
Because of the relatively low cost of No. 6 residual oil
compared with that of lighter oils, it is the most common fuel
oil burned in the electric utility industry. Distillate oils
are also burned, but because of higher cost are generally
limited to startup operations, peaking units, or applications
where low PM and SO2 emissions are required.
The U. S. supply of fuel oils comes from both domestic
and foreign production. The composition of individual fuel
oils will vary depending on the source of the crude oil and
the extent of refining operations. Because of these factors
and the economics of oil transportation, fuel oil supplies

3-103
3-104
vary in composition across the United States, but are
relatively uniform with the exception of sulfur content. In
general, ash content varies from nil to 0.5 percent, and the
nitrogen content is typically below 0.4 weight-percent for
grades 1 through 5 and 0.4 to 1.0 weight- percent for
grade 6.8
3.2.3 Natural Gas
Natural gas is a desirable fuel for steam generation
because it is practically free of noncombustible gases and
residual ash. When burned, it mixes very efficiently with
air, providing complete combustion at low excess air levels
and eliminating the need for particulate control systems.
The analyses of selected samples of as-collected natural
gas from U. S. fields are shown in table 3-5

3-105
12 Characteristics
1 PA
2So. CA
3 OH
4 LA
5 OK
Analyses
Constituents, % by vol
Hydrogen
Methane
Ethylene
Ethane
Carbon monoxide
Carbon dioxide
Nitrogen
Oxygen
Hydrogen sulfide
Nil
83.40
Nil
15.80
Nil
Nil
0.80
Nil
Nil
Nil
84.00
Nil
14.80
Nil
0.70
0.50
Nil
Nil
1.82
93.33
0.25
Nil
0.45
0.22
3.40
0.35
0.18
Nil
90.00
Nil
5.00
Nil
Nil
5.00
Nil
Nil
Nil
84.10
Nil
6.70
Nil
0.80
8.40
Nil
Nil
Ultimate, % by wt
Sulfur
Hydrogen
Carbon
Nitrogen
Oxygen
Nil
23.53
75.25
1.22
Nil
Nil
23.30
74.72
0.76
1.22
0.34
23.20
69.12
5.76
1.58
Nil
22.68
69.26
8.06
Nil
Nil
20.85
64.84
12.90
1.41
0.630
Higher heat value
F & 30 in. Hg
Btu/lb of fuel
1,129
23,170
1,116
22,904
964
22,077
1,002
21,824
974
20,160
Samples as "as-collected," prior to processing.

3-106
.12 Prior to distribution, however, most of the inerts (carbon
dioxide [CO2] and nitrogen), sulfur compounds, and liquid
petroleum gas (LPG) fractions are removed during purification
processes. As a result, natural gas supplies burned by
utilities are generally in excess of 90 percent methane, with
nitrogen contents and typically ranging from 0.4 to
0.6 percent.13,14,15
Although the free (molecular) hydrogen content of natural
gas is low, the total hydrogen content is high. Because of
the high hydrogen content of natural gas relative to that of
oil or coal, more water vapor is formed during combustion.
Because of the latent heat of water, the efficiency of the
steam generation is lowered. This decrease in efficiency must
be taken into account in the design of the boiler and when
evaluating the use of natural gas versus other fuels.
3.3 UTILITY BOILER DESIGNS
The basic purpose of a utility boiler is to convert the
chemical energy in a fuel into thermal energy that can be used
by a steam turbine. To achieve this objective, two
fundamental processes are necessary: combustion of the fuel
by mixing with oxygen, and the transfer of the thermal energy
from the resulting combustion gases to working fluids such as

3-107
hot water and steam. The physics and chemistry of combustion,
and how they relate to nitrogen oxides (NOx) formation, are
discussed in chapter 4 of this document. The objective of
this section is to provide background information on the basic
physical components found in utility boilers and how they work
together to produce steam.
3.3.1 Fundamentals of Boiler Design and Operation
A utility boiler consists of several major subassemblies
as shown in figure 3-5

3-108
Figure 3-5. Simplified boiler schematic.

3-109
. These subassemblies include the fuel preparation system,
air supply system, burners, the furnace, and the convective
heat transfer system. The fuel preparation system, air
supply, and burners are primarily involved in converting fuel
into thermal energy in the form of hot combustion gases. The
last two subassemblies are involved in the transfer of the
thermal energy in the combustion gases to the superheated
steam required to operate the steam turbine and produce
electricity.
The NOx formation potential of a boiler is determined by
the design and operation of the fuel preparation equipment,
air supply, burner, and furnace subassemblies. The potential
for reducing NOx after it forms is primarily determined by the
design of the furnace and convective heat transfer system and,
in some cases, by the operation of the air supply system.
Three key thermal processes occur in the furnace and
convective sections of a boiler. First, thermal energy is
released during controlled mixing and combustion of fuel and
oxygen in the burners and furnace. Oxygen is typically
supplied in two, and sometimes three, separate air streams.
Primary air is mixed with the fuel before introducing the fuel
into the burners. In a coal-fired boiler, primary air is also
used to dry and transport the coal from the fuel preparation
system (e.g., the pulverizers) to the burners. Secondary air
is supplied through a windbox surrounding the burners, and is
mixed with the fuel after the fuel is injected into the burner
zone. Finally, some boilers are equipped with tertiary air
(sometimes called "overfire air"), which is used to complete

3-110
combustion in boilers having staged combustion burners. A
detailed discussion of the importance of each of these air
supplies as it relates to NOx formation and control is
presented in chapter 4.
Utility boiler furnace walls are formed by multiple,
closely-spaced tubes filled with high-pressure water. Water
flows into these "water tubes" at the bottom of the furnace
and rises to the steam drum located at the top of the boiler.
In the second key thermal process, a portion of the thermal
energy formed by combustion is absorbed as radiant energy by
the furnace walls. During the transit of water through the
water tubes, the water absorbs this radiant energy from the
furnace. Although the temperature of the water within these
tubes can exceed 540 oC (1,000 oF) at the furnace exit, the
pressure within the tubes is sufficient to maintain the water
as a liquid rather than gaseous steam.
At the exit to the furnace, typical gas temperatures are
1,100 to 1,300 oC (2,000 to 2,400 oF), depending on fuel type
and boiler design. At this point, in the third key process,
the gases enter the convective pass of the boiler, and the
balance of the energy retained by the high-temperature gases
is absorbed as convective energy by the convective heat
transfer system (superheater, reheater, economizer, and air
preheater). In the convective pass, the combustion gases are
typically cooled to 135 to 180 oC (275 to 350 oF).
The fraction of the total energy that is emitted as
radiant energy depends on the type of fuel fired and the
temperature within the flame zone of the burner. Because of
its ash content, coal emits a significant amount of radiant
energy, whereas a flame produced from burning gas is
relatively transparent and produces less radiant flux. As a
result, coal-fired boilers are designed to recover a
significant amount of the total thermal energy formed by
combustion through radiant heat transfer to the furnace walls,
while gas-fired boilers are designed to recover most of the
total thermal energy through convection.

3-111
The design and operating conditions within the convective
pass of the boiler are important in assessing NOx control
options because two of these options--selective noncatalytic
reduction (SNCR) and selective catalytic reduction (SCR)--are
designed to operate at temperatures found in and following the
convective pass.
3.3.2 Furnace Configurations and Burner Types
There are a number of different furnace configurations
used in utility boilers. For purposes of presentation, these
configurations have been divided into four groups:
tangentially-fired, wall-fired, cyclone-fired, and
stoker-fired. Wall-fired boilers are further subdivided based
on the design and location of the burners.
3.3.2.1 Tangentially-Fired. The tangentially-fired
boiler is based on the concept of a single flame zone within
the furnace. As shown in figure 3-6

3-112
Figure 3-6.
Firing Pattern in a Tangentially-Fired Boiler

3-113
, the fuel-air mixture in a tangentially-fired boiler projects
from the four corners of the furnace along a line tangential
to an imaginary cylinder located along the furnace
centerline.16 As shown in figure 3-7

3-114
Figure 3-7.
Burner Assembly of a Tangentially-Fired Boiler
3-115
, the burners in this furnace design are in a stacked assembly
that includes the windbox, primary fuel supply nozzles, and
secondary air supply nozzles.16
As fuel and air are fed to the burners of a
tangentially-fired boiler and the fuel is combusted, a
rotating "fireball" is formed. The turbulence and air-fuel
mixing that take place during the initial stages of combustion
in a tangentially-fired burner are low compared to other types
of boilers. However, as the flames impinge upon each other in
the center of the furnace during the intermediate stages of
combustion, there is sufficient turbulence for effective
mixing and carbon burnout.17 Primarily because of their
tangential firing pattern, uncontrolled tangentially-fired

3-116

3-117

3-118
boilers generally emit relatively lower NOx than other
uncontrolled boiler designs.
The entire windbox, including both the fuel and air
nozzles, tilts uniformly. This allows the fireball to be
moved up and down within the furnace in order to control the
furnace exit gas temperature and provide steam temperature
control during variations in load. In addition, the tilts on
coal-fired units automatically compensate for the decreases in
furnace-wall heat absorption due to ash deposits. As the
surfaces of the furnace accumulate ash, the heat absorbed from
the combustion products decreases. The burners are then
tilted upwards to increase the temperature of the flue gas
entering the convective pass of the boiler. Furnace wall
fouling will cause the heat to rise in the furnace normally
resulting in downward tilts, while fouling in the convective
sections can cause the reverse. Also, when convective tube
fouling becomes severe, soot blowers are used to remove the
coating on the tubes. The sudden increase in heat absorption
by the clean tubes necessitates tilting the burners down to
their original position. As the fouling of the tubes resumes,
the tilting cycle repeats itself.
Tangentially-fired boilers commonly burn coal. However,
oil or gas are also burned in tangential burners by inserting
additional fuel injectors in the secondary air components
adjacent to the pulverized-coal nozzles as shown in
figure 3-7.
Approximately 10 percent of the tangentially-fired
boilers are twin-furnace design. These boilers, which are
generally larger than 400 megawatts (MW), include separate
identical furnace and convective pass components physically
joined side by side in a single unit. The flue gas streams
from each furnace remain separate until joined at the stack.
3.3.2.2 Wall-Fired. Wall-fired boilers are
characterized by multiple individual burners located on a
single wall or on opposing walls of the furnace. In contrast
to tangentially-fired boilers that produce a single flame

3-119
envelope, or fireball, each of the burners in a wall-fired
boiler has a relatively distinct flame zone. Depending on the
design and location of the burners, wall-fired boilers can be
subcategorized as single-wall, opposed-wall, cell, vertical,
arch, or turbo.
3.3.2.2.1 Single wall. The single-wall design consists
of several rows of circular-type burners mounted on either the
front or rear wall of the furnace. Figure 3-8

3-120
Figure 3-8. Single wall-fired boiler.18
3-121
shows the burner arrangement of a typical single-wall-fired
boiler.18
In circular burners, the fuel and primary air are
introduced into the burner through a central nozzle that
imparts the turbulence needed to produce short, compact
flames. Adjustable inlet vanes located between the windbox
and burner impart a rotation to the preheated secondary air
from the windbox. The degree of air swirl, in conjunction
with the flow-shaping contour of the burner throat,
establishes a recirculation pattern extending into the
furnace. After the fuel is ignited, this recirculation of hot
combustion gases back towards the burner nozzle provides
thermal energy needed for stable combustion.
Circular burners are used for firing coal, oil, or
natural gas, with some designs featuring multi-fuel
capability. A circular burner for pulverized coal, oil, and
natural gas firing is shown in figure 3-9

3-122
Figure 3-9. Circular-type burner for pulverized coal, oil, or gas.19

3-123
.19 To burn fuel oil at the high rates demanded in a modern
boiler, circular burners must be equipped with oil atomizers.
Atomization provides high oil surface area for contact with
combustion air. The oil can be atomized by the fuel pressure
or by a compressed gas, usually steam or air. Atomizers that
use fuel pressure are generally referred to as uniflow or
return flow mechanical atomizers. Steam- and air-type
atomizers provide efficient atomization over a wide load
range, and are the most commonly used.
In natural gas-fired burners, the fuel can be supplied
through a perforated ring, a centrally located nozzle, or

3-124

3-125

3-126
radial spuds that consist of a gas pipe with multiple holes at
the end.
Unlike tangentially-fired boiler designs, the burners in
wall-fired boilers do not tilt. Superheated steam
temperatures are instead controlled by excess air levels, heat
input, flue gas recirculation, and/or steam attemperation
(water spray). In general, wall-fired boilers do not
incorporate the twin-furnace design.
3.3.2.2.2 Opposed-wall. Opposed-wall-fired boilers are
similar in design to single wall-fired units, differing only
in that two furnace walls are equipped with burners and the
furnace is deeper. The opposed-wall design consists of
several rows of circular-type burners mounted on both the
front and rear walls of the furnace as shown in figure 3-10

3-127
Figure 3-10. Opposed Wall-Fired Boiler

3-128
.
3.3.2.2.3 Cell. Cell-type wall-fired boilers consist of
two or three closely-spaced burners, i.e., the cell, mounted
on opposed walls of the furnace. Furnaces equipped with cell
burners fire coal, oil, and natural gas. Figure 3-11

3-129
Figure 3-11. Cell Burner for Natural Gas-firing

3-130
shows a natural gas-fired cell burner employing spud-type
firing elements.20 The close spacing of these fuel nozzles
generates hotter, more turbulent flames than the flames in
circular-type burners, resulting in a higher heat release rate
and higher NOx emission levels than with circular burners.
Cell-type boilers typically have relatively small furnace
sizes with high heat input.
3.3.2.2.4 Vertical-, arch- and turbo-fired.
Vertically-fired boilers use circular burners that are
oriented downward, rather than horizontally as with wall-fired
boilers. Several vertical-fired furnace designs exist,
including roof-fired boilers, and arch-fired and turbo-fired
boilers, in which the burners are installed on a sloped
section of furnace wall and are fired at a downward angle.
Vertically-fired boilers are used primarily to burn solid
fuels that are difficult to ignite, such as anthracite. They
require less supplementary fuel than the horizontal wall- or

3-131

3-132

3-133
tangentially-fired systems, but have more complex firing and
operating characteristics.

3-134
Figure 3-12

3-135
Figure 3-12. Flow Pattern in an Arch-Fired Boiler

3-136
shows an arch-fired boiler where pulverized coal is
introduced through the nozzles, with heated combustion air
discharged around the fuel nozzles and through adjacent
secondary ports.21 Tertiary air ports are located in rows
along the front and rear walls of the lower section of the
furnace.
This firing mode generates a long, looping flame in the
lower furnace, with the hot combustion products discharging up
through the center. Delayed introduction of the tertiary air
provides the turbulence needed to complete combustion. The
flame pattern ensures that the largest entrained solid fuel
particles (i.e., those with the lowest surface area-to-weight
ratio) have the longest residence time in the furnace.
Roof-fired boilers are somewhat similar in design, having
the burners mounted on the roof of the furnace, but discharge
combustion gases through a superheater section located at the
bottom of the furnace, rather than through an opening at the
top of the boiler. In a coal-fired boiler design, the flames
from individual burners do not impinge on each other as in an
arch-fired boiler, and residence times in the furnace are
shorter.
Turbo-fired boilers are unique because of their
venturi-shaped cross-section and directional flame burners as
shown in Figure 3-13

3-137
Figure 3-13. Cross Section of Turbo-Fired Boiler
3-138
.22 In turbo-fired boilers, air and coal are injected downward
toward the furnace bottom. Like arch-fired boilers, turbo-
fired boilers generate flames that penetrate into the lower
furnace, turn, and curl upward. Hot combustion products
recirculate from the lower furnace and flow upward past the
burner level to the upper furnace, where they mix with the
remaining fuel and air. This type of firing system produces
long, turbulent flames.

3-139

3-140

3-141
3.3.2.3 Cyclone-Fired. Cyclone-fired boilers burn
crushed, rather than pulverized, coal. As shown in
figure 3-14

3-142
Figure 3-14. Cyclone Burner

3-143
, fuel and air are burned in horizontal cylinders, producing a
spinning, high-temperature flame.23 Only a small amount of
wall surface is present in the cylinder and this surface is
partially insulated by the covering slag layer. Thus,
cyclone-fired boilers have a combination of high heat release
rate and low heat absorption rates, which results in very high
flame temperatures and conversion of ash in the coal into a
molten slag. This slag collects on the cylinder walls and
then flows down the furnace walls into a slag tank located
below the furnace. As a result of the high heat release rate,
the cyclone-fired boilers are characterized by high thermal
NOx formation.
Because of their slagging design, cyclone-fired boilers
are almost exclusively coal-fired. However, some units are
also able to fire oil and natural gas. Figure 3-15

3-144
Figure 3-15. Firing arrangements used with cyclone-fired boilers.24

3-145
shows the single-wall firing and opposed-wall firing
arrangements used for cyclone firing.24 For smaller boilers,
sufficient firing capacity is usually attained with cyclone
burners located in only one wall. For large units, furnace
width can often be reduced by using opposed firing.
3.3.2.4 Stoker-Fired. There are several types of
stoker-fired boilers used by utilities. The most common
stoker type is the spreader stoker. Spreader stokers are
designed to feed solid fuel onto a grate within the furnace
and remove the ash residue.
Spreader stokers burn finely crushed coal particles in
suspension, and larger fuel particles in a fuel bed on a grate
as shown in figure 3-16

3-146
Figure 3-16. Spreader type Stoker-Fired Boiler -Continuous Ash Discharge Grate
3-147
.25 The thin bed of fuel on the grate is fuel-burning and
responsive to variations in load. However, relatively low
combustion gas velocities through the boiler are necessary to
prevent fly ash erosion, which results from high flue-gas ash
loadings.
Spreader stokers use continuous-ash-discharge traveling
grates, intermittent-cleaning dump grates, or reciprocating

3-148

3-149

3-150
continuous-cleaning grates. They are capable of burning all
types of bituminous and lignitic coals. Because of material
handling limitations, the largest stokers used by utilities
are roughly 50 MW or less.
3.3.2.5 Fluidized Bed Combustion Boilers. Fluidized bed
combustion (FBC) is an integrated technology for reducing
sulfur dioxide (SO2) and NOx emissions during the combustion
of coal and is an option for repowering or for a new boiler.
In a typical FBC boiler, crushed coal in combination with
inert material (sand, silica, alumina, or ash) and/or a
sorbent (limestone) are maintained in a highly turbulent
suspended state by the upward flow of primary air from the
windbox located directly below the combustion floor. This
fluidized state provides a large amount of surface contact
between the air and solid particles, which promotes uniform
and efficient combustion at lower furnace temperatures,
between 860 and 900 oC (1,575 and 1,650 oF) compared to 1,370
and 1,540 oC (2,500 and 2,800 oF) for conventional coal-fired
boilers. Furnace internals include fluidizing air nozzles,
fuel-feed ports, secondary air ports, and waterwalls lined at
the bottom with refractory. Once the hot gases leave the
combustion chamber, they pass through the convective sections
of the boiler which are similar or identical to components
used in conventional boilers. Fluidized bed combustion
boilers are capable of burning low grade fuels. Unit sizes,
as offered by manufacturers, range between 25 and 400 MW. The
largest FBC boilers installed are typically closer to 200 MW.
Fluidized bed combustion technologies based on operation
at atmospheric and pressurized conditions have been developed.

3-151
The atmospheric FBC (AFBC) system shown in figure 3-17

3-152
Figure 3-17. Simplified AFBC process flow diagram.26

3-153
is similar to a conventional utility boiler in that the
furnace operates at near atmospheric pressure and depends upon
heat transfer of a working fluid (i.e., water) to recover the
heat released during combustion.26 Pressurized FBC (PFBC)
operates at pressures greater than atmospheric pressure and
recovers

3-154

3-155
energy through both heat transfer to a working fluid and the
use of the pressurized gas to power a gas turbine.
3.3.2.5.1 Atmospheric fluidized bed combustion. There
are two major categories of AFBC boilers: the bubbling bed,
and the circulating bed designs. In the bubbling bed design,
coal and limestone are continuously fed into the boiler from
over or under the bed. The bed materials, consisting of
unreacted, calcined, and sulfated limestone, coal, and ash,
are suspended by the combustion air blowing upwards through
the fluidizing air nozzles. The desired depth of the
fluidized-bed is maintained by draining material from the bed.
Some bed material is entrained in the upflowing flue gas and
escapes the combustion chamber. Approximately 80 to
90 percent of this fly ash is collected in the cyclone and is
then either discarded or reinjected into the bed. Reinjection
of ash increases combustion efficiency and limestone
utilization. In general, combustion efficiency increases with
longer freeboard residence times and greater ash recycle
rates. Fly ash not collected in the cyclone is removed from
the flue gas by an electrostatic precipitator (ESP) or fabric
filter.
The circulating fluidized bed design is a more recent
development in AFBC technology. The two major differences
between circulating and bubbling AFBC's are the size of the
limestone particles fed to the system, and the velocity of the
fluidizing air stream. Limestone feed to a bubbling bed is
generally less than 0.1 inches in size, whereas circulating
beds use much finer limestone particles, generally less than
0.01 inches. The bubbling bed also incorporates relatively
low air velocities through the unit, ranging from 4 to
12 feet per second (ft/sec).26 This creates a relatively
stable fluidized bed of solid particles with a well-defined
upper surface. Circulating beds employ velocities as high as
30 ft/sec.27 As a result, a physically well-defined bed is not
formed; instead, solid particles (coal, limestone, ash,
sulfated limestone, etc.) are entrained in the transport

3-156
air/combustion gas stream. These solids are then separated
from the combustion gases by a cyclone or other separating
device and circulated back into the combustion region, along
with fresh coal and limestone. A portion of the collected
solids are continuously removed from the system to maintain
material balances. Circulating beds are characterized by very
high recirculated solids flow rates, up to three orders of
magnitude higher than the combined coal/limestone feed rate.26
Circulating AFBC's are dominating new FBC installation,
in part due to their improved performance and enhanced fuel
flexibility.28 Some specific advantages of circulating bed
over bubbling bed designs include:
C Higher combustion efficiency, exceeding 90 percent;
C Greater limestone utilization, due to high recycle
of unreacted sorbent and small limestone feed size
(greater than 85 percent SO2 removal efficiency is
projected with a Ca/S ratio of about 1.5, with the
potential for greater than 95 percent SO2 removal
efficiency);
C Potentially fewer corrosion and erosion problems,
compared to bubbling bed designs with in-bed heat
transfer surfaces;
C Less dependence on limestone type, since reactivity
is improved with the fine particle sizes; and
C Reduced solid waste generation rates, because of
lower limestone requirements.
3.3.2.5.2 Pressurized fluidized bed combustion.
Pressurized FBC is similar to AFBC with the exception that
combustion occurs under pressure. By operating at pressure,
it is possible to reduce the size of the combustion chamber
and to develop a combined-cycle or turbocharged boiler capable
of operation at higher efficiencies than atmospheric systems.
The turbocharged boiler approach recovers most of the heat
from the boiler through a conventional steam cycle, leaving
only sufficient energy in the gas to drive a gas turbine to
pressurize the combustion air. The combined cycle system
3-157
extracts most of the system's energy through a gas turbine
followed by a heat recovery steam generator and steam turbine.
3.3.3 Other Boiler Components
This section discuses additional boiler components
including pulverizers (fuel preparation system), air supply
system, and superheaters/reheaters, economizers, and air
heaters (heat transfer system).
3.3.3.1 Pulverizers. Cyclone-fired or stoker-fired
boilers use crushed coal, but most other boilers use
pulverized coal. The only fuel preparation system discussed
here is the pulverizer. Pulverized coal is favored over other
forms of coal because pulverized coal mixes more intimately
with the combustion air and burns more rapidly. Pulverized
coal also burns efficiently at lower excess air levels and is
more easily lit and controlled.29
To achieve the particle size reduction required for
proper combustion in pulverized coal-fired boilers, machines
known as pulverizers (also referred to as "mills") are used to
grind the fuel. Coal pulverizers are classified according to
their operating speed. Low-speed pulverizers consist of a
rotating drum containing tumbling steel balls. This
pulverizer type can be used with all types of coal, but is
particularly useful for very abrasive coals having a high
silica content.
Most medium-speed pulverizers are ring-roll and ball-race
mill designs, and are used for all grades of bituminous coal.
Their low power requirements and quick response to changing
boiler loads make them well-suited for utility boiler
applications. They comprise the largest number of
medium-speed pulverizers, and the largest number of coal
pulverizers overall. High-speed pulverizers include impact or
hammer mills and attrition mills and are also used for all
grades of bituminous coal.
The capacity of a pulverizer is affected by the
grindability of the coal and the required fineness. The
required fineness of pulverization varies with the type of
3-158
coal and with the size and type of furnace, and usually ranges
from 60 to 75 weight-percent passing through a 200 mesh
(74 micrometers [:m]) screen. To ensure minimum carbon loss
from the furnace, high-rank coals are frequently pulverized to
a finer size than coals of lower rank. When firing certain
low-volatile coals in small pulverized coal furnaces, the
fineness may be as high as 80 weight-percent through a
200 mesh screen in order to reduce carbon loss to acceptable
levels.30
Coal enters the pulverizer with air that has been heated
to 150 to 400 oC (300 to 750 oF), depending on the amount of
moisture in the coal. The pulverizer provides the mixing
necessary for drying, and the pulverized coal and air mixture
then leaves the pulverizer at a temperature ranging from
55 to 80 oC (130 to 180 oF).31
The two basic methods used for moving pulverized coal to
the burners are the storage or bin-and-feeder system, and the
direct-fired system. In the storage system, the pulverized
coal and air (or flue gas) are separated in cyclones and the
coal is then stored in bins and fed to the burners as needed.
In direct-fired systems, the coal and air pass directly from
the pulverizers to the burners and the desired firing rate is
regulated by the rate of pulverizing.
3.3.3.2 Air Supply System. Key air supply system
components are fans and windboxes. The purpose of these
components are to supply the required volumes of air to the
pulverizers and burners, and to transport the combustion gases
from the furnace, through the convective sections, and on to
the air pollution control equipment and stack.
The fans determine the static pressure of the boiler,
which can be characterized as forced-draft, balanced-draft, or
induced draft. A forced-draft boiler operates at static
pressures greater than atmospheric, a balanced-draft boiler
operates with static pressures at or slightly below
atmospheric, and an induced-draft boiler operates at less than
atmospheric pressure. Four types of fans are used:

3-159
forced-draft, primary-air, induced-draft, and
gas-recirculation.
Forced-draft fans are located at the inlet to the
secondary air supply duct. These fans supply the secondary or
tertiary air used for combustion. The air is typically routed
through the air preheater and then to the windbox. Forced-
draft fans are used on both forced-draft and balanced-draft
boilers.
Primary air fans are located before or after the fuel
preparation systems, and provide primary air to the burners.
In pulverized coal boilers, primary air fans are used to
supply air to the pulverizers and then to transport the
coal/air mixture to the burners. There are two types of
primary air fans: mill exhauster fans and cold air fans. A
mill exhauster fan is located between the pulverizer and the
windbox and pulls preheated combustion air from the secondary
air supply duct through the pulverizers. Cold air fans are
located before the pulverizers and provide ambient air to the
pulverizers through a separate ducting system. Primary air
fans are used in all boilers.
Induced-draft fans are generally located just before the
stack. These fans pull the combustion gases through the
furnace, convective sections, and air pollution control
equipment. Induced draft fans are used on balanced-draft
boilers to maintain a slightly negative pressure in the
furnace. Induced draft fans are used on induced-draft boilers
to maintain negative static pressure. In this arrangement,
the induced-draft fan are also designed with sufficient static
head to pull secondary air through the air preheater and
windbox.
Gas recirculation fans are used to transport partially
cooled combustion gases from the economizer outlet back to the
furnace. Gas recirculation can be used for several purposes,
including control of steam temperatures, heat absorption
rates, and slagging. It is also sometimes used to control

3-160
flame temperatures, and thereby reduce NOx formation on gas-
and oil-fired boilers.
The second part of the air supply system is the windbox.
A windbox is essentially an air plenum used for distributing
secondary air to each of the burners. The flow of air to
individual burners is controlled by adjustable air dampers.
By opening or closing these dampers, the relative flow of air
to individual burners can be changed. To increase or decrease
the total air flow to the furnace, the differential pressure
between the windbox and furnace is changed by adjusting the
fans. In boilers having tertiary air injection, tertiary air
can be supplied from the windbox supplying secondary air or by
a separate windbox. Separate windboxes allow greater control
of the tertiary air supply rate.
3.3.3.3 Superheaters/Reheaters. To produce electricity,
a steam turbine converts thermal energy (superheated steam)
into mechanical energy (rotation of the turbine and electrical
generator shaft). The amount of electricity that can be
produced by the turbine-generator system is directly related
to the amount of superheat in the steam. If saturated steam
is utilized in a steam turbine, the work done results in a
loss of energy by the steam and subsequent condensation of a
portion of the steam. This moisture, in the form of condensed
water droplets, can cause excessive wear of the turbine
blades. If, however, the steam is heated above the saturation
temperature level (superheated), more useful energy is
available prior to the point of excessive steam condensation
in the turbine exhaust.32
To provide the additional heat needed to superheat the
steam recovered from the boiler steam drum, a superheater is
installed in the upper section of the boiler. In this area of
the boiler, flue gas temperatures generally exceed 1,100 oC
(2,000 oF). The superheater transfers this thermal energy to
the steam, superheating it. The steam is then supplied to the
turbine. In some turbine designs, steam recovered from the
turbine after part of its available energy has been used is

3-161
routed to a reheater located in the convective pass just after
the superheater. The reheater transfers additional thermal
energy from the flue gas to the stream, which is supplied to a
second turbine.
Superheaters and reheaters are broadly classified as
convective or radiant, depending on the predominate mechanism
of heat transfer to the absorbing surfaces. Radiant
superheaters usually are arranged for direct exposure to the
furnace gases and in some designs form a part of the furnace
enclosure. In other designs, the surface is arranged in the
form of tubular loops or platens of wide lateral spacing that
extend into the furnace. These surfaces are exposed to
high-temperature furnace gases traveling at relatively low
speeds, and the transfer of heat is principally by radiation.
Convective-type superheaters are more common than the
radiant type. They are installed beyond the furnace exit in
the convection pass of the boiler, where the gas temperatures
are lower than those in the furnace. Tubes in convective
superheaters are usually arranged in closely-spaced tube banks
that extend partially or completely across the width of the
gas stream, with the gases flowing through the relatively
narrow spaces between the tubes. The principal mechanism of
heat transfer is by convection.33
The spacing of the tubes in the superheater and reheater
is governed primarily by the type of fuel fired. In the
high-gas-temperature zones of coal-fired boilers, the
adherence and accumulation of ash deposits can reduce the gas
flow area and, in some cases, may completely bridge the space
between the tubes. Thus, in coal-fired boilers, the spaces
between tubes in the tube banks are increased to avoid excess
pressure drops and to ease ash removal.33 However, because the
combustion of oil and natural gas produces relatively clean
flue gases that are free of ash, the tubes of the superheaters
and reheaters can be more closely spaced in coal- and natural
gas-fired boilers and the superheaters and reheaters
themselves are more compact.
3-162
3.3.3.4 Economizers. Economizers improve boiler
efficiency by recovering heat from the moderate-temperature
combustion gases after the gases leave the superheater and
reheater.
Economizers are vertical or horizontal tube banks that
heat the water feeding the furnace walls of the boiler.
Economizers receive water from the boiler feed pumps at a
temperature appreciably lower than that of saturated steam.
Economizers are used instead of additional steam-generating
surface because the flue gas at the economizer is at a
temperature below that of saturated steam. Although there is
not enough heat remaining in the flue gases for steam
generation at the economizer, the gas can be cooled to lower
temperatures for greater heat recovery and economy.
3.3.3.5 Air Preheaters. Air preheaters are installed
following the economizer to further improve boiler efficiency
by transferring residual heat in the flue gas to the incoming
combustion air. Heated combustion air accelerates flame
ignition in the furnace and accelerates coal drying in
coal-fired units.
In large pulverized coal boilers, air heaters reduce the
temperature of the flue gas from 320 to 430 oC (600 to 800 oF)
at the economizer exit. Air preheaters reduce the temperature
to 135 to 180 oC (275 to 350 oF). This energy heats the
combustion air from about 25 oC (80 oF) to between 260 and
400 oC (500 and 750 oF).34
3.4 IMPACT OF FUEL PROPERTIES ON BOILER DESIGN
3.4.1 Coal
Regardless of the fineness of pulverization, coal fed to
the boiler essentially retains its as received mineral content
(ash). In a dry-ash or dry-bottom furnace, nearly all of the
ash particles are formed in suspension, and roughly 80 percent
leave the furnace entrained in the flue gas. Slag-tap or
wet-bottom furnaces operate at higher temperatures and
heat-release rates and, as a result, a portion of the ash
particles become molten, coalesce on the furnace walls, and
3-163
drain to the furnace bottom. In this case, approximately
50 percent of the ash may be retained in the furnace, with the
other 50 percent leaving the unit entrained in the flue gas.35
Because of their high heat release rates, wet-bottom furnaces
generally have higher thermal NOx formation than dry-bottom
furnaces.
Because longer reaction time is required for the
combustion of coal, furnaces for firing coal are generally
larger than those used for burning oil or natural gas. The
characteristics of the coal, which varies with rank,
determines the relative increase in furnace size shown in
figure 3-18

3-164
36

3-165
.36 Furnaces firing coals with low volatile contents or high
moisture or ash levels are larger than those firing high
volatile content coals. In addition, the characteristics of
the coal ash and the desired operating temperature of the
furnace will influence furnace size. The furnace must be
large enough to provide the furnace retention time required to
burn the fuel completely and cool the combustion products.
This is to ensure that the gas temperature at the entrance to
the convective pass is well below the ash-softening
temperature of the coal and the metalurigical limits of the
superheater tubes.
3.4.2 Oil/Gas
Oil-fired boilers do not require as large a furnace
volume as coal-fired boilers to ensure complete burning.
Because atomization of oil provides a greater amount of fuel
reaction surface for combustion than pulverization of coal,
furnace residence times can be shorter. In addition, the
relatively low ash content of oil essentially eliminates the
slagging problems that can occur in a small coal-fired
furnace.37
Similarly, because the combustion gases contain less
entrained ash, the convective pass of oil-fired boilers can be
more compact, with more closely spaced tubes in the
superheater and reheater sections. In addition, oil-fired
units operate at lower excess air levels than coal-fired

3-166
boilers; up to 20 percent less air volume per unit heat input
is required for oil firing.37
The more compact design of oil-burning furnaces has an
effect on NOx emissions from oil-fired units. Even though the
nitrogen content of the oil is generally lower than that of
coal, higher flame temperatures result in increased formation
of thermal NOx. This thermal NOx contribution can more than
offset the lower fuel NOx contribution from the oil.37
Gas-fired boilers are similar in design to oil-fired
boilers, as many gas-fired boilers were intended to fire oil
as a supplementary fuel. Boilers that are strictly gas-fired
have the smallest furnace volumes of all utility boilers,
because of the rapid combustion, low flame luminosity, and ash
free content of natural gas. Because the nitrogen content of
natural gas is low, its combustion produces minimal fuel NOx.
However, the compact furnaces and resulting high heat release
rates of gas-fired boilers can generate high levels of thermal
NOx.38
Some furnaces were originally designed and operated as
coal-fired furnaces and then converted to oil- and gas-fired
furnaces. Furnaces designed to burn coal have larger volumes
than furnaces originally designed to burn oil and/or natural
gas fuel. As a result, the furnace heat release rate is
lower, and NOx emissions from the converted furnaces may be
lower.

3-167
Figure 3-19

3-168
39

3-169
shows the comparative sizes of coal, oil, and natural gas
utility boilers of the same generation rating.39 The
differences in the designs are attributed to the heat transfer
characteristics of the fuels. The type of fuel being burned
directly influences the furnace dimensions, distance above the
top row of burners and the convective pass, furnace bottom
design, location of burners in relation to the furnace bottom,
and design of the convective pass all are influenced by the
type of fuel being burned.40

3-170

3-171
1. Energy Information Administration. Inventory of PowerPlants in the United States 1990. DOE/EIA-0095(90). Washington, D.C. October 1991. p. 5.
2. Ref. 1, p. 6.
3. Ref. 1, p. 7.
4. Ref. 1, p. 8.
5. Singer, J. G. (ed.). Combustion, Fossil Power Systems,Third Edition. Combustion Engineering, Inc. 1981. p. 2-3.
6. Baumeister, T., E. A. Avallone, and T. Baumeister, III(eds.). Mark's Standard Handbook for MechanicalEngineers, Eighth Edition. McGraw-Hill Book Company. 1978. p. 7-4.
7. Energy Information Administration. Coal Data - AReference. DOE/E14-0064. Washington, D.C. September,1978. p. 6.
8. Bartok, B., Sarofim, A. F. (eds.) Fossil Fuel Combustion,A Source Book. John Wiley & Sons, Inc. 1991. p. 239.
9. Steam, Its Generation and Use. Babcock & Wilcox. NewYork, NY. 1975. p. 5-17.
10. Ref. 5, p. 2-31.
11. Control Techniques for Nitrogen Oxides Emissions fromStationary Sources - 2nd Edition. Prepared for theU. S. Environmental Protection Agency. Publication No.EPA-450/1-78-001. January 1978. p. 3-8.
12. Ref. 9, p. 5-20.
13. Radian Corporation. Eagle Point Cogeneration FacilityWest Deptford Township, New Jersey Compliance Test Report- Unit B, July 1992. p. 2-20.
14. Radian Corporation. Atlantic Electric Sherman AvenueGenerating Station Combustion Turbine Unit 1, Vineland,New Jersey Compliance Test Report. Appendix A, pp. 2through 5. July 1992.
3.5 REFERENCES

3-172
15. Telecon. Rosa, J., Tenneco Gas, with Quincey, K. RadianCorporation. September 29, 1992. Typical nitrogencontent of piping quality natural gas-ACT document on NOxemissions.
16. Ref. 5, p. 13-4.
17. Ref. 5, pp. 13-4 and 13-5.
18. Ref. 5, p. 13-3.
19. Ref. 6, p. 9-12.
20. Ref. 9, p. 7-4.
21. Ref. 5, p. 13-6.
22. Peterson, C. A., Controlling NOx Emissions to Meet the1990 Clean Air Act. Presented at International JointPower Generation Conference. San Diego, CA. October 6-10, 1991. 15 pp.
23. Farzen, R. A., et al., Reburning Scale-Up Methodology forNOx Control from Cyclone Boilers. Presented at theInternational Joint Power Generation Conference. San Diego, CA. October 6-10, 1991. 12 pp.
24. Ref. 9, p. 10-2.
25. Ref. 5, p. 13-19.
26. White, D. M., and M. Maibodi. "Assessment of ControlTechnologies for Reducing Emissions of SO2 and NOx fromExisting Coal-Fired Boilers." Prepared for theU. S. Environmental Protection Agency. Air and EnergyEngineering Research Laboratory. EPA ReportNo. 600/7-90-018. pp. 3-13 through 3-15.
27. Makansi, J. and R. Schwieger. "Fluidized-bed Boilers." Power. May 1987. pp. S-1 through S-16.
28. State-of-the-Art Analysis of NOx/N2O Control forFluidized Bed Combustion Power Plants. AcurexCorporation. Mountain View, CA. Acurex FinalReport 90-102/ESD. July 1990.
29. Ref. 9, p. 9-1.
30. Ref. 5, p. 12-7.
31. Ref. 6, p. 9-11.
32. Ref. 9, p. 12-8.
3-173
33. Ref. 6, p. 9-20.
34. Ref. 5, p. 5-11.
35. Ref. 9, p. 15-7.
36. Ref. 5, p. 7-3.
37. U. S. Environmental Protection Agency. EnvironmentalAssessment of Utility Boiler Combustion Modification NOxControls: Volume 1, Technical Results. Publication No.EPA-600/7-80-075a. April 1980. p. 3-35.
38. Ref. 35, p. 3-42.
39. Letter and attachments from Smith, J. R., HoustonLighting & Power, to Neuffer, W., U. S. EnvironmentalProtection Agency. December 15, 1992. Discussion of NOxRACT. p. II-7.
40. Ref. 38, p. II-5.

TABLE 3-1. CLASSIFICATION OF COALS BY RANK5
Class and group
Fixed carbon limits, %(dry, mineral-matter-free basis)
Volatile matter limits, %(dry, mineral-matter-free basis)
Calorific value limits, Btu/lb (moist, mineral-matter-free basis)
Equal orgreater than Less than
Equal orgreater than Less than
Equal orgreater than Less than
Agglomeratingcharacter
I. Anthracitic
1. Meta-anthracite
2. Anthracite
3. Semianthracite
98
92
86
--
98
92
--
2
8
2
8
14
--
--
--
--
--
--
nonagglomerating
II. Bituminous
1. Low-volatile bituminous coal
2. Mediumvolatilebituminouscoal
3. High-volatileA bituminous coal
4. High-volatileB bituminous coal
5. High-volatileC bituminous coal
78
69
--
--
--
86
78
69
--
--
14
22
31
--
--
22
31
--
--
--
--
--
14,000
13,000
11,50010,500
--
--
--
14,000
13,00011,500
commonlyagglomerating
agglomerating
III. Subbituminous
1. Subbituminous A coal
2. Subbituminous B coal
3. SubbituminousC coal
--
--
--
--
--
--
--
--
--
--
--
--
10,500
9,500
8,300
11,500
10,500
9,500
nonagglomerating
IV. Lignitic
1. Lignite A
2. Lignite B
--
--
--
--
--
--
--
--
6,300
--
8,300
6,300
nonagglomerating
-- = Not applicable.

TABLE 3-2. SOURCES AND TYPICAL ANALYSES OF VARIOUS RANKS OF COAL6,7
Classification byrank
State
County Bed Basisa
Proximate, % Ultimate, % Calorific value,Btu/lb
Moisture
Volatile
matter
Fixedcarbon Ash Sulfur Hydroge
nCarbon Nitrog
enOxygen
Meta-anthracite RI Newport Middle AR 13.2 2.6 65.3 18.9 0.3 1.9 64.2 0.2 14.5 9,310
DMMF -- 3.8 96.2 -- 0.4 0.6 94.7 0.3 4.0 13,720
Anthracite PA Lackawanna
Clark AR 4.3 5.1 81.0 9.6 0.8 2.9 79.7 0.9 6.1 12,880
DMMF -- 5.9 94.1 -- 0.9 2.8 92.5 1.0 2.8 14,980
Semianthracite AK Johnson LowerHartshorne
AR 2.6 10.6 79.3 7.5 1.7 3.8 81.4 1.6 4.0 13,880
DMMF -- 11.7 88.3 -- 1.9 3.9 90.6 1.8 1.8 15,430
Low-volatilebituminous
WVa Wyoming PocahontasNo. 3
AR 2.9 17.7 74.0 5.4 0.8 4.6 83.2 1.3 4.7 14,400
DMMF -- 19.3 80.7 -- 0.8 4.6 90.7 1.4 2.5 15,690
Medium-volatilebituminous
PA Clearfield
UpperKittanning
AR 2.1 24.4 67.4 6.1 1.0 5.0 81.6 1.4 4.9 14,310
DMMF - 26.5 73.5 -- 1.1 5.2 88.9 1.6 3.2 15,590
High-volatile Abituminous
WVa Marion Pittsburgh AR 2.3 36.5 56.0 5.2 0.8 5.5 78.4 1.6 8.5 14,040
DMMF -- 39.5 60.5 -- 0.8 5.7 84.8 1.7 7.0 15,180
High-volatile Bbituminous
KY Muhlenburg
No. 9 AR 8.5 36.4 44.3 10.8 2.8 5.4 65.1 1.3 14.6 11,680
DMMF -- 45.0 55.0 -- 3.4 5.5 80.6 1.7 8.8 14,460
High-volatile Cbituminous
IL Sangamon No. 5 AR 14.4 35.4 40.6 9.6 3.8 5.8 59.7 1.0 20.1 10,810
DMMF -- 46.6 53.4 -- 5.0 5.6 78.6 1.3 9.5 14,230
Subbituminous A WY Sweetwater
No. 3 AR 16.9 34.8 44.7 3.6 1.4 6.0 60.4 1.2 27.4 10,650
DMMF -- 43.7 56.3 -- 1.8 5.2 76.0 1.5 15.5 13,390
Subbituminous B WY Sheridan Monarch AR 22.2 33.2 40.3 4.3 0.5 6.9 53.9 1.0 33.4 9,610
DMMF -- 45.2 54.8 -- 0.6 6.0 73.4 1.3 18.7 13,080
Subbituminous C CO El Paso Fox Hill AR 25.1 30.4 37.7 6.8 0.3 6.2 50.5 0.7 35.5 8,560
DMMF -- 44.6 55.4 -- 0.5 5.0 74.1 1.1 19.3 12,560
Lignite ND McLean Unnamed AR 36.8 27.8 29.5 5.9 0.9 6.9 40.6 0.6 45.1 7,000
DMMF -- 48.4 51.6 -- 1.6 5.0 70.9 1.1 21.4 12,230
aAR = as-received DMMF = Dry mineral-matter-free basis.
4-176
4.0 CHARACTERIZATION OF NOx EMISSIONS
Nitrogen oxide (NOx) emissions from combustion devices are
comprised of nitric oxide (NO) and nitrogen dioxide (NO2).
For most combustion systems, NO is the predominant NOx
species. This chapter discusses how differences in boiler
design, fuel characteristics, and operating characteristics
can affect NOx emissions. Additionally, this chapter presents
uncontrolled/baseline NOx emission levels from various utility
boilers.
4.1 NOx FORMATION
The formation of NOx from a specific combustion device is
determined by the interaction of chemical and physical
processes occurring within the furnace. This section
discusses the three principal chemical processes for NOx
formation. These are: (1) "thermal" NOx, which is the
oxidation of atmospheric nitrogen; (2) "prompt" NOx, which is
formed by chemical reactions between hydrocarbon fragments and
atmospheric nitrogen; and (3) "fuel" NOx, which is formed from
chemical reactions involving nitrogen atoms chemically bound
within the fuel.
4.1.1 Thermal NOx Formation
"Thermal" NOx results from the oxidation of atmospheric
nitrogen in the high-temperature post-flame region of a
combustion system. During combustion, oxygen radicals are
formed and attack atmospheric nitrogen molecules to start the
reactions that comprise the thermal NOx formation mechanism:
O + N2 W NO + N (4-1)
N + O2 W NO + O (4-2)
N + OH W NO + H (4-3)

aEquivalence ratio is defined as the fuel/oxidizer ratio divided by the stoichiometric fuel/oxidizer ratio. The equivalence ratio is given the symbol N.
4-177
The first reaction (equation 4-1) is generally assumed to
determine the rate of thermal NOx formation because of its
high activation energy of 76.5 kcal/mole. Because of this
reaction's high activation energy, NOx formation is slower
than other combustion reactions causing large amounts of NO to
form only after the energy release reactions have equilibrated
(i.e., after combustion is "complete"). Thus, NO formation
can be approximated in the post-combustion flame region by:
[NO] = ke-K/T [N2] [O2]1/2 t (4-4)
where:
[ ] are mole fractions,
k and K are reaction constants,
T is temperature, and t is time.
The major factors that influence thermal NOx formation are
temperature, oxygen and nitrogen concentrations, and residence
time. If temperature, oxygen concentrations, or nitrogen
concentrations can be reduced quickly after combustion,
thermal NOx formation is suppressed or "quenched".
Of these four factors, temperature is the most important.
Thermal NOx formation is an exponential function of
temperature (equation 4-4). One of the fundamental parameters
affecting temperature is the local equivalence ratioa. Flame
temperature peaks at equivalence ratios near one as shown in
figure 4-1

4-178
Figure 4-1. Variation of flame temperature withequivalence ratio.1
bA premixed flame exists when the reactants are mixed prior to chemical reaction.
4-179
.41 If the system is fuel-rich, then there is not sufficient
oxygen to burn all the fuel, the energy release is not
maximized, and peak temperatures decrease. If the system is
fuel-lean, there are additional combustion gases to absorb
heat from the combustion reactions, thus decreasing peak
temperatures. A premixed flameb may exist in a wide range of

4-180
cA non-premixed flame exists where the reactants must diffuse into each other during chemical reaction.
4-181
equivalence ratios, and thus premixed flames have a wide range
of peak temperatures. However, a non-premixed flamec will
generally react near an equivalence ratio of one, causing high
peak temperatures.
For utility boilers, the temperature is also related to the
heat release per unit of burner zone volume. Units with large
heat release rates per unit volume, may experience higher
temperatures, creating higher NOx levels.
4.1.2 Prompt NOx Formation
Prompt NOx formation is the formation of NOx in the
combustion system through the reactions of hydrocarbon
fragments and atmospheric nitrogen. As opposed to the slower
thermal NOx formation, prompt NOx formation is rapid and
occurs on a time scale comparable to the energy release
reactions (i.e., within the flame). Thus, it is not possible
to quench prompt NOx formation in the manner by which thermal
NOx formation is quenched. However, the contribution of
prompt NOx to the total NOx emissions of a system is rarely
large.42
Although there is some uncertainty in the detailed mechanisms
for prompt NOx formation, it is generally believed that the
principal product of the initial reactions is hydrogen cyanide
(HCN) or CN radicals, and that the presence of hydrocarbon
species is essential for the reactions to take place.43 The
following reactions are the most likely initiating steps for
prompt NOx:44
CH + N2 W HCN + N (4-5)
CH2 + N2 W HCN + NH (4-6)
The HCN radical is then further reduced to form NO and other
nitrogen oxides.
Measured levels of prompt NOx for a number of hydrocarbon
compounds in a premixed flame show that the maximum prompt NOx
is reached on the fuel-rich side of stoichiometry.45 On the

4-182
fuel-lean side of stoichiometry, few hydrocarbon fragments are
free to react with atmospheric nitrogen to form HCN, the
precursor to prompt NOx. With increasingly fuel-rich
conditions, an increasing amount of HCN is formed, creating
more NOx. However, above an equivalence ratio of
approximately 1.4, there are not enough O radicals present to
react with HCN and form NO, so NO levels decrease.
4.1.3 Fuel NOx Formation
The oxidation of fuel-bound nitrogen is the principal source
of NOx emissions in combustion of coal and some oils. All
indications are that the oxidation of fuel-bound nitrogen
compounds to NO is rapid and occurs on a time scale comparable
to the energy release reactions during combustion. Thus, as
with prompt NOx, the reaction system cannot be quenched as it
can be for thermal NOx.
Although some details of the kinetic mechanism for conversion
of fuel nitrogen to NOx are unresolved at the present time,
the sequence of kinetic processes is believed to be a rapid
thermal decomposition of the parent fuel-nitrogen species,
such as pyridine, picoline, nicotine, and quinoline, to low
molecular weight compounds, such as HCN, and subsequent decay
of these intermediates to NO or nitrogen (N2). In
stoichiometric or fuel-lean situations, the intermediates will
generally react to form NO over N2, whereas in fuel-rich
systems, there is evidence that the formation of N2 is
competitive with the formation of NO. This may, in part, be
the cause of high NOx emissions in fuel-lean and
stoichiometric mixtures and lower NOx emissions in fuel-rich
systems.
Several studies have been conducted to determine factors that
affect fuel NOx emissions. One study on coal combustion found
that under pyrolysis conditions, 65 percent of the fuel
nitrogen remained in the coal after heating to 750 oC
(1,380 oF) but only 10 percent remained at 1,320 oC
(2,400 oF).46 This suggests that the formation of NOx may
depend upon the availability of oxygen to react with the

4-183
nitrogen during coal devolitization and the initial stages of
combustion. If the mixture is fuel-rich, the formation of N2
may compete with the formation of NO, thus reducing NOx
emissions. If the mixture is fuel-lean, the formation of NO
will be dominant, resulting in greater NOx emissions than
under fuel-rich conditions. This also implies that the
subsequent burning of the devolatilized coal char will have
little effect on the formation of NO.
Although the combustion study was for coal, it is probable
that the formation of fuel NOx from oil is also related to the
vaporous reactions of nitrogen compounds. Although the
nitrogen-containing compounds in coal vaporize at varying
rates prior to completing combustion, the nitrogen-containing
compounds in oil are of similar molecular weight to other
compounds in the oil, and thus vaporize at rates similar to
the other species in the oil.
The nitrogen content of the fuel affects the formation of
fuel NOx. Tests of burning fuel oils in a mixture of oxygen
and carbon dioxide (to exclude thermal NOx) show a strong
correlation between the percentage of nitrogen in the oil and
fuel NOx formation as shown in figure 4-2a

4-184
Figure 4-2a. Comparison of fuel NOx to fuel nitrogen.7
Figure 4-2b. Percent conversion of nitrogen to fuel NOx.7

4-185
.47 However, the percentage of fuel nitrogen converted to NOx
is not constant, but decreases with increasing fuel nitrogen
as shown in figure 4-2b.7 For coal, there is no readily
apparent correlation between the quantity of fuel nitrogen and
fuel NOx as shown in figure 4-3

4-186
Figure 4-3. Fuel nitrogen oxide to fuel nitrogencontent-pulverized coal, premixed.8

4-187
.48 Note, however, that most of the tested coals contained
approximately 1.0 percent nitrogen or higher, whereas many
oils contain less than 1.0 percent nitrogen. The differences
in the rates of conversion of fuel nitrogen to NOx may be due
to the different nitrogen levels in oil and coal.
During another study, fuel NOx was measured in a large
tangentially-fired coal utility boiler. Figure 4-4

4-188
Figure 4-4. Fuel-bound nitrogen-to-nitrogen oxide inpulverized-coal combustion.9

4-189
shows that fuel NOx formation correlated well with the fuel
oxygen/ nitrogen ratio), which suggests that fuel oxygen (or
some

4-190

4-191
4-192
other fuel property that correlates well with fuel oxygen)
influences the percentage of fuel nitrogen converted to fuel
NOx.49 This corresponds to previous observations that greater
levels of NOx are found in fuel-lean combustion environments.
4.2 Factors that Affect NOx Emissions
The formation of thermal, prompt, and fuel NOx in combustion
systems is controlled by the interplay of equivalence ratio
with combustion gas temperature, residence time, and
turbulence (sometimes referred to as the "three Ts"). Of
primary importance are the localized conditions within and
immediately following the flame zone where most combustion
reactions occur. In utility boilers, the equivalence ratio
and the three Ts are determined by factors associated with
burner and boiler design, fuel characteristics, and boiler
operating conditions. This section discusses how boiler
design, fuel characteristics, and boiler operating
characteristics, can influence baseline (or uncontrolled) NOx
emission rates.
4.2.1. Boiler Design Characteristics
There are a number of different furnace configurations used
in utility boilers. These include tangential, wall, cyclone,
and stoker designs. Background information on each of these
boiler designs is presented in chapter 3. Each configuration
has design characteristics that partially determine the
uncontrolled NOx emissions of the boiler.
4.2.1.1 Tangentially-Fired. The burners in
tangentially-fired furnaces are incorporated into stacked
assemblies that include several levels of primary fuel nozzles
interspersed with secondary air supply nozzles and warmup
guns. The burners inject stratified layers of fuel and
secondary air into a relatively low turbulence environment.
The stratification of fuel and air creates fuel-rich regions
in an overall fuel-lean environment. Before the layers are
mixed, ignition is initiated in the fuel-rich region. Near
the highly turbulent center fireball, cooler secondary air is

4-193
quickly mixed with the burning fuel-rich region, insuring
complete combustion.
The off-stoichiometric combustion reduces local peak
temperatures and thermal NOx formation. In addition, the
delayed mixing of fuel and air provides the fuel-nitrogen
compounds a greater residence time in the fuel-rich
environment, thus reducing fuel NOx formation.
4.2.1.2 Wall Units. There are several types of dry-bottom
and wet-bottom wall-fired units, including single, opposed,
cell, vertical, arch, and turbo. In general, wet-bottom units
will have higher NOx emissions than corresponding dry-bottom
units because of higher operating temperatures, although other
factors, such as fuel type and furnace operating conditions,
may affect individual unit NOx emission levels.
4.2.1.2.1 Single and opposed. Single-wall units consist of
several rows of circular burners mounted on either the front
or rear wall of the furnace. Opposed-wall units also use
circular burners, but have burners on two opposing furnace
walls and have a greater furnace depth.
Circular burners introduce a fuel-rich mixture of fuel and
primary air into the furnace through a central nozzle.
Secondary air is supplied to the burner through separate
adjustable inlet air vanes. In most circular burners, these
air vanes are positioned tangentially to the burner centerline
and impart rotation and turbulence to the secondary air. The
degree of air swirl, in conjunction with the flow-shaping
contour of the burner throat, establishes a recirculation
pattern extending several burner throat diameters into the
furnace. The high levels of turbulence between the fuel and
secondary air streams creates a nearly stoichiometric
combustion mixture. Under these conditions, combustion gas
temperatures are high and contribute to thermal NOx formation.
In addition, the high level of turbulence causes the amount of
time available for fuel reactions under reducing conditions to
be relatively short, thus increasing the potential for
formation of fuel NOx.

4-194
4.2.1.2.2 Cell. Cell-type units consist of two or three
vertically-aligned, closely-spaced burners, mounted on opposed
walls of the furnace. Cell-type furnaces have highly
turbulent, compact combustion regions. This turbulence
promotes fuel-air mixing and creates a near stoichiometric
combustion mixture. As described above, the mixing
facilitates the formation of both fuel and thermal NOx. In
addition, the relative compactness of the combustion region
creates a high heat release rate per unit volume. This will
cause local temperatures to increase even further, causing
thermal NOx to increase due to its exponential dependency on
local temperature (equation 4-4).
4.2.1.2.3 Vertical-, arch-, and turbo-fired. Vertical and
arch-fired boilers have burners that are oriented downward.
Typically, these units are used to burn solid fuels that are
difficult to ignite, such as anthracite. Pulverized coal is
introduced through nozzles and pre-heated secondary air is
discharged through secondary ports. The units have long,
looping flames directed into the lower furnace. Delayed
introduction of the tertiary air provides the necessary air to
complete combustion. The long flames allow the heat release
to be spread out over a greater volume of the furnace,
resulting in locally lower temperatures. The lower turbulence
allows the initial stages of combustion to occur in fuel-rich
environments. As a result, fuel NOx and thermal NOx are
reduced.
Turbo-fired units have burners on opposing furnace walls and
have a furnace depth similar to opposed-wall units. The turbo
burners are angled downward and typically are less turbulent
than the circular burners in opposed-wall units. The lower
turbulence delays the mixing of the fuel and air streams,
allowing the combustion products a greater residence time in
reducing conditions, thus potentially reducing fuel NOx.50
4.2.1.3 Cyclone-Firing. Cyclones are wet-bottom furnaces,
in which fuel and air are introduced into a small, highly
turbulent combustion chamber. Because of the design of the

dThe nitrogen present in natural gas exists almostexclusively as elemental nitrogen and not as organic nitrogencompounds.
4-195
burner assembly, heat transfer to cooler boiler surfaces is
delayed, resulting in very high burner operating temperatures.
The combination of high temperatures and near stoichiometric
to slightly lean mixtures encourages both thermal and fuel NOx
formation.
4.2.1.4 Stoker-Firing. Stokers are generally low capacity
boilers which burn crushed coal particles in suspension, while
larger particles are burned in a fuel bed on a grate. They
typically have low gas velocities through the boiler in order
to prevent fly ash erosion and are operated with high levels
of excess air to insure complete combustion and to maintain
relatively low grate temperatures. The low NOx emissions are
believed to be a function of the lower furnace temperatures
[~1,090 oC (~2,000 oF), compared to 1,370 to 1,570 oC (2,500
to 2,800 oF)] in other boiler types.
4.2.2 Fuel Characteristics
In the combustion of "clean" fuels (fuels not containing
nitrogen compounds, such as natural gas)d, the thermal
mechanism is typically the principal source of nitrogen oxide
emissions. However, as the nitrogen content of the fuel
increases (table 4-1)

4-196
TABLE 4-1. TYPICAL FUEL NITROGEN CONTENTS OF FOSSIL FUELS11
Fuel Nitrogen (wt. %)
Natural gas 0 - 0.2
Light distillate oils (#1, 2) 0 - 0.4
Heavy distillate oils (#3 - 5) 0.3 - 1.4
Residual oils 0.3 - 2.2
Subbituminous coals 0.8 - 1.4
Bituminous coals 1.1 - 1.7

4-197
, significant contributions from the fuel nitrogen mechanism
to total nitrogen oxide occur.51 Thus, the nitrogen content
of the fuel is a partial indicator of NOx emission potential.
Obviously, design characteristics may dictate the type of
fuel used in a given boiler. Natural gas is a vapor, oil is a
liquid, and coal a solid. The injection methods of the three
types of fuels are fundamentally different due to their
different physical states. However, some units have multifuel
capability. Boilers originally designed for coal have larger

4-198

4-199
furnace volumes than boilers originally designed for oil or
gas as shown in figure 4-5

4-200
Note: Same Btu input.
Figure 4-5. Comparative physical sizes of utilityboilers firing different fuels.12

4-201
.52 As a result, less thermal NOx is formed during oil or gas
combustion in multifuel boilers and these boilers are more
amenable for NOx controls due to the larger furnace volumes.
4.2.3 Boiler Operating Conditions
During the normal operation of a utility boiler, factors that
affect NOx continuously change as the boiler goes through its
daily operating cycle. During a daily operating cycle, the
following factors may change and affect NOx formation:
C Operating load,
C Excess oxygen,
C Burner secondary air register settings, and
C Mill operation.
All these parameters either directly or indirectly influence
the NOx emissions from utility boilers. For the most part,
these parameters are within the control of the boiler
operator. Sometimes they are controlled based on individual
operator preference or operating practices, and at other times
are dictated by boiler operating constraints. While operating
load influences NOx emissions, it is obviously not a practical
method of NOx control except in severe instances.
The effect of excess oxygen or burner secondary air register
settings on NOx emissions can vary. Altering the excess
oxygen levels may change flame stoichiometry. Increasing
secondary air flow may increase entrainment of cooler
secondary air into the combustion regime, lowering local
temperatures, and increase fuel and air mixing, altering
equivalence ratio. The net result of both actions may be
either to raise or lower NOx emissions, depending on other
unit-specific parameters.
A frequently overlooked influence on NOx emissions for coal
units is the mill pattern usage. Figure 4-6

4-202
Figure 4-6. Effect of mill pattern usage onnitrogen oxide emissions.13

4-203
illustrates the impact of operating with various mill-out-of-
service patterns
on NOx emissions.53 This data is from a 365 megawatt (MW)
single-wall coal-fired unit, operating at 250 MW (68 percent

4-204

4-205
load), and firing subbituminous coal. The NOx emission level
varies by as much as 25 percent depending upon which mills are
operational. This is because when operating at a fixed load
and with the top mill out-of-service, the lower mills operate
at a higher coal-to-air ratio, creating fuel-rich regions.
The secondary air from the top mill insures complete
combustion. If the bottom mill is out-of-service, the
advantages of stratified combustion using overfire air to
insure complete combustion are reduced, resulting in increased
NOx formation. Biasing fuel to the lower mills can also be
used to create a similar combustion environment.
4.3 UNCONTROLLED/BASELINE EMISSION LEVELS
4.3.1 Conventional Boilers
As discussed in section 4.2, NOx emission rates are a
function of burner and boiler design, operating conditions,
and fuel type. Because pre-NSPS boilers were not designed to
minimize NOx emissions, their NOx emission rates are
indicative of uncontrolled emission levels. Boilers covered
by subpart D54 (boilers that commenced construction between
August 17, 1971 and September 17, 1978) or subpart Da55
(boilers that commenced construction on or after September 18,
1978) were required to install NOx control equipment to meet
these NSPS. To define baseline emissions from these units,
the NSPS limit and emissions data from NURF were examined.
Data for uncontrolled NOx emissions received through
questionnaires to utilities are presented in chapter 5.
The tables in the following subsections summarize typical,
low, and high NOx emission rates on a lb/MMBtu basis for each
of the principal boiler types used to combust coal, oil, and
gas. Emissions data from the National Utility Reference File
(NURF),56 AP-4257, and the EPA58 were examined to estimate
uncontrolled NOx emission rates for pre-NSPS boilers. The
typical uncontrolled levels reflect the mode, or most typical
value, for the NOx emissions data in NURF and the EPA, and are
generally consistent with AP-42 values when assuming a heating
value for coal of 11,000 Btu/lb, for oil of 140,000 Btu/gal,

4-206
for natural gas of 1,000 Btu/scf. Also, data obtained from
numerous utilities and reported in chapter 5 was used for
comparison purposes. The low and high estimates reflect the
upper and lower range of emissions expected on a short-term
basis for most units of a given fuel and boiler type. Based
on unit-specific design and operating conditions; however,
actual NOx emissions from individual boilers may be outside
this range. Averaging time can also influence NOx emission
rates. For example, a boiler that can achieve a particulate
NOx limit on a rolling 30-day basis may not be able to achieve
the same NOx limit on a 24-hour basis.

4-207
4.3.1.1 Coal-Fired Boilers. Table

4-208
TABLE 4-2. UNCONTROLLED/BASELINE NOx EMISSION LEVELS FOR COAL-FIRED BOILERSa
NOx Emission Levels (lb NOx/MMBtu)
Boiler Type Typicalb Low High Standard
Pre-NSPS
Tangential 0.7 0.4 1.0 N/A
Wall, dry 0.9 0.6 1.2 N/A
Wall, wet 1.2 0.8 2.1 N/A
Cell 1.0 0.8 1.8 N/A
Cyclone 1.5 0.8 2.0 N/A
Vertical, dry 0.9 0.6 1.2 N/A
Subpart D
Tangential 0.5 0.3 0.7 0.7
Wall, dry 0.6 0.3 0.7 0.7
Subpart Da
Tangential 0.45 0.35 0.6 0.6/0.5c
Wall, dry 0.45 0.35 0.6 0.6/0.5c
Stoker 0.50 0.3 0.6 0.6/0.5c
aNOx emission rates for pre-NSPS units are classified as "Uncontrolled", because these units were not designed to minimize NOx emissions. The NOx emission rates listed for subpart D and Da units are classified as "Baseline", because many of these units include the use of NOx control techniques.
bTypical level is based on the mode, or most typical, NOx emission rate of boilers as reported in NURF, the EPA, AP-42, and utilities.
cNSPS subpart Da standard of 0.6 lb NOx/MMBtu is applicable to bituminous and anthracite coal-fired boilers, a standard of 0.5 lb NOx/MMBtu is applicable to subbituminous coal-fired boilers.
N/A = not applicable.

4-209
4-2 shows typical, low, and high uncontrolled/baseline NOx
emission rates for pre-NSPS, subpart D, and subpart Da coal-
fired utility boilers. The applicable subpart D and subpart
Da standards are also listed in the table.
The pre-NSPS units are subdivided into tangential, dry-bottom
wall, wet-bottom wall, cell, and cyclone units. The emission
rates shown are generally consistent with corresponding AP-42
emission rates. The tangential units generally have the
lowest emissions (0.7 lb/MMBtu typical), and the cyclone units
have the highest (1.5 lb/MMBtu typical). Pre-NSPS units
account for approximately 80 percent of the total number of
coal-fired utility boilers in the United States.
Following proposal of subpart D, essentially all new
coal-fired utility boilers were tangential-fired or wall-
fired. The subpart D units are subdivided into these two
categories. The tangential units generally have lower NOx
emission rates than the wall units. The typical emission
rates for the tangential units is 0.5 lb/MMBtu and the typical
emission rates for the wall units is 0.6 lb/MMBtu, both of
which are below the subpart D standard of 0.7 lb/MMBtu.
The subpart Da units are also subdivided into tangential,
wall, and stoker units. As with the subpart D units, the
tangential units generally exhibit lower emission rates than

4-210
the wall units and the typical emission rates of both type
units (approximately 0.45 lb/MMBtu) meet the subpart Da
standard. The stoker units have a typical emission rate of
0.50 lb/MMBtu and also meet the subpart Da standard.59

4-211
4.3.1.2 Natural Gas-Fired Boilers. Table

4-212
TABLE 4-3. UNCONTROLLED/BASELINE NOx EMISSION LEVELSFOR NATURAL GAS BOILERSa
NOx Emission Levels (lb NOx/MMBtu)
Boiler Type Typicalb Low High Standard
Pre-NSPS
Tangential 0.3 0.1 0.5 N/A
Wall, single 0.5 0.1 1.0 N/A
Wall, opposed 0.9 0.4 1.8 N/A
Subpart D
All boiler types 0.2 0.1 0.2 0.2
Subpart Da
All boiler types 0.2 0.1 0.2 0.2
aNOx emission rates for pre-NSPS units are classified as "Uncontrolled", because these units were not designed to minimize NOx emissions. The NOx emission rates listed for subpart D and Da units are classified as "Baseline", because many of these units include the use of NOx control techniques.
bTypical level is based on the mode, or most typical, NOx emission rate of boilers are reported in NURF, the EPA, AP-42, and utilities.
N/A = not applicable.
4-213
4-3 shows typical, low, and high uncontrolled/baseline NOx
emission rates for pre-NSPS, subpart D, and subpart Da natural
gas-fired utility boilers. The applicable subpart D and
subpart Da standards are also listed in the table.
The pre-NSPS units are subdivided into tangential and wall
units. The emission rates shown are generally consistent with
corresponding AP-42 emission rates. The tangential units
generally have the lowest emissions (0.3 lb/MMBtu), and the
wall units are slightly higher (0.5 lb/MMBtu).
The subpart D and subpart Da units are not subdivided into
specific unit types. The typical emission rates of the units
meet the applicable NSPS standard of 0.2 lb/MMBtu.

4-214
4.3.1.3 Oil-Fired Boilers. Table 4-4

4-215
TABLE 4-4. UNCONTROLLED/BASELINE NOx EMISSION LEVELSFOR OIL-FIRED BOILERSa
NOx Emission Levels(lb NOx/MMBtu)
Boiler Type Typicalb Low High Standard
Pre-NSPS
Tangential 0.3 0.2 0.4 N/A
Wall 0.5 0.2 0.8 N/A
Vertical 0.75 0.5 1.0 N/A
Subpart D
All boiler types 0.25 0.2 0.3 0.3
Subpart Da
All boiler types 0.25 0.2 0.3 0.3
aNOx emission rates for pre-NSPS units are classified as "Uncontrolled", because these units were not designed to minimize NOx emissions. The NOx emission rates listed for subpart D and Da units are classified as "Baseline", because many of these units include the use of NOx control techniques.
bTypical level is based on the mode, or most typical, NOx emission rate of boilers are reported in NURF, the EPA, AP-42, and utilities.
N/A = not applicable.

4-216
shows typical, low, and high uncontrolled/baseline NOx
emission rates for pre-NSPS, subpart D, and subpart Da oil-
fired utility boilers. The applicable subpart D and subpart
Da standards are also listed in the table.
The pre-NSPS units are subdivided into tangential, vertical,
and wall units. The emission rates shown are generally
consistent with corresponding AP-42 emission rates. The
tangential units generally have the lowest emissions
(0.3 lb/MMBtu), and the vertical units are the highest
(0.75 lb/MMBtu).
The subpart D and subpart Da units are not subdivided into
specific unit types. The typical emission rates of the
subpart D units are 0.25 lb/MMBtu and the typical emission
rates of the subpart Da units are also 0.25 lb/MMBtu which
meet, or are below, the applicable NSPS standard.
4.3.2 Fluidized Bed Boilers
Fluidized bed combustion boilers are inherently low NOx
emitters due to the relatively low combustion temperatures.

4-217

4-218
Table 4-5 shows typical, low, and high NOx emission rates for
fluidized bed combustion (FBC) boilers with and without
selective noncatalytic reduction (SNCR) for NOx control. The
typical NOx emissions from an FBC without SNCR is
0.19 lb/MMBtu whereas the typical NOx emissions from an FBC
with SNCR as original equipment is 0.07 lb/MMBtu. An
influential factor on the NOx emissions of an FBC boiler is
the quantity of calcium oxide, used for SO2 emissions control,
present in the bed material. Higher quantities of calcium
oxide result in higher base emissions of NOx. Therefore, as
SO2 removal requirements increase, base NOx production will
increase. This linkage between SO2 removal and base NOx
production is important in understanding NOx formation in FBC
boilers.

4-219
TABLE 4-5. NOx EMISSION LEVELS FOR FLUIDIZED BEDCOMBUSTION BOILERS
NOx Emission Levels(lb NOx/MMBtu)
Classification Typicala Low High
Combustion controlsonly
0.19 0.1 0.26
With SNCRb 0.07 0.03 0.1
aTypical level is based on the mode, or most typical, NOx emission rate of FBC boilers reporting data.
bFluidized bed combustion boilers with SNCR for NOx control as original equipment.

4-220

4-221
41. Glassman, I., Combustion, 2nd ed., Academic Press,Orlando, Florida (1987). p. 20.
42. Bartok, W., and A.. F. Sarofim (eds.), Fossil FuelCombustion, Chapter 4, John Wiley & Sons, Inc., NewYork (1991). p. 231.
43. Ref. 1, pp. 330 through 337.
44. Ref. 1, p. 331.
45. Ref. 1, pp. 333 through 334.
46. Singer, J. G. Combustion, Fossil Power Systems. Combustion Engineering, Inc. Windsor, CT. 1981. p. 4-34.
47. Ref. 6, p. 4-34.
48. Ref. 6, p. 4-34.
49. Ref. 6, p. 4-35.
50. Lisauskas, R. A. and A. H. Rawdon. Status of NOxControls for Riley Stoker Wall-Fired and Turbo-FiredBoilers. Presented at the 1982 EPA-EPRI JointSymposium on Stationary Combustion NOx Control. November 1-4, 1982.
51. Ref. 2, pp. 230 through 231.
52. Letter and attachments from Smith J. R., HoustonLighting & Power, to Neuffer, W., U. S. EnvironmentalProtection Agency. December 15, 1992. Discussion ofNOx RACT.
53. Kanary, D. A. and L. L. Smith. Effects of BoilerCycling on NOx Emissions. Presented at 1990 EPRIFossil Plant Cycling Conference. Washington, DC. December 4-6, 1990. 15 pp.
54. U. S. Environmental Protection Agency. 40 Code ofFederal Regulations. Chapter 1. Subpart D. July 1,1992.
55. U. S. Environmental Protection Agency. 40 Code ofFederal Regulations. Chapter 1. Subpart Da. July 1,1992.
4.4 REFERENCES

5-222
56. Wagner, J. K., Rothschild, S. S., and D. A. Istvan. The 1985 NAPAP Emissions Inventory (Version 2): Development of the National Utility Reference File. U.S. Environmental Protection Agency, Office of Researchand Development, Air and Energy Engineering ResearchLaboratory. Research Triangle Park, NC. Report No.EPA-600/7-89-013a. November 1989.
57. Joyner, W. M. (ed.), Compilation of Air PollutantEmission Factors, Volume 1: Stationary Point and AreaSources. AP-42, 4th Edition. U. S. EnvironmentalProtection Agency, Office of Air Quality and PlanningStandards, Research Triangle Park, NC. October 1986. p. 1.1-2
58. Stamey-Hall, S. Radian Corporation. Evaluation ofNitrogen Oxide Emissions Data from TVA Coal-FiredBoilers. Prepared for the U. S. EnvironmentalProtection Agency, Engineering Research Laboratory. Research Triangle Park, NC. Report No. EPA-600/R-92-242. December 1992. p. 4 through 6.
59. Letter and attachments from Welsh, M. A., ElectricGeneration Association, to Eddinger, J. A., U. S.Environmental Protection Agency. November 18, 1993. NOx emission data from stoker units.
5.0 NOx EMISSION CONTROL TECHNIQUES
This chapter describes the methods of reducing nitrogen
oxide (NOx) emissions from new and existing fossil fuel-fired
utility boilers. All of the methods can be grouped into one
of two fundamentally different techniques--combustion controls
and post-combustion controls (flue gas treatment).
Combustion controls reduce NOx emissions by suppressing
NOx formation during the combustion process while post-
combustion controls reduce NOx emissions after its formation.
Combustion controls are the most widely used method of
controlling NOx formation in utility boilers. Several

5-223
combustion controls can be used simultaneously to further
reduce NOx emissions. Flue gas treatment methods can often
achieve greater NOx control than combustion controls, but have
not been applied to many utility boilers in the United States.
Combinations of flue gas treatment controls and combustion
controls can be applied to maximize NOx reduction; however,
there are even fewer U. S. applications of this type. The
types of NOx controls currently available for fossil fuel-
fired utility boilers are presented in table 5-1.

5-224
TABLE 5-1. NOx EMISSION CONTROL TECHNOLOGIES FOR FOSSIL FUEL UTILITY BOILERS
NOx control options Fuel applicability
Combustion Modifications
Operational Modifications
- Low excess air - Burners-out-of-service - Biased burner firing
Overfire Air
Low NOx Burners (except cyclone furnaces)
Low NOx burners and overfire air
Reburn
Flue gas recirculation
Postcombustion Flue Gas Treatment Controls
Selective noncatalytic reduction
Selective catalytic reduction
Coal, natural gas, oil
Coal, natural gas, oil
Coal, natural gas, oil
Coal, natural gas, oil
Coal, natural gas, oil
Natural gas, oil
Coal, natural gas, oil
Coal, natural gas, oil

5-225
This chapter describes NOx control technologies for
fossil fuel-fired utility boilers, factors affecting the
performance of these controls, and levels of performance for
these controls. Section 5.1 presents controls for coal-fired
boilers. Section 5.2 presents combustion controls for natural
gas- and oil-fired boilers. Section 5.3 presents
post-combustion flue gas treatment controls.

5-226

5-227
5.1 COMBUSTION CONTROLS FOR COAL-FIRED UTILITY BOILERS
There are several combustion control techniques for
reducing NOx emissions from coal-fired boilers:
C Operational Modifications
- Low excess air (LEA);
- Burners-out-of-service (BOOS); and
- Biased burner firing (BF);
C Overfire air (OFA);
C Low NOx burners (LNB); and
C Reburn.
Operational modifications such as LEA, BOOS, and BF are all
relatively simple and inexpensive techniques to achieve some
NOx reduction because they only require changing certain
boiler operation parameters rather than making hardware
modifications. These controls are discussed in more detail in
section 5.1.1.
Overfire air and LNB are combustion controls that are
gaining more acceptance in the utility industry due to
increased experience with these controls. There are numerous
ongoing LNB demonstrations and retrofit projects on large
coal-fired boilers; however, there are only a couple of
projects in which LNB and OFA are used as a retrofit
combination control. Both OFA and LNB require hardware
changes which may be as simple as replacing burners or may be
more complex such as modifying boiler pressure parts. These
techniques are applicable to most coal-fired boilers except
for cyclone furnaces. Overfire air and LNB will be discussed
in sections 5.1.2 and 5.1.3, respectively.
Reburn is another combustion hardware modification for
controlling NOx emissions. There are four full-scale retrofit
demonstrations on U. S. coal-fired utility boilers. Reburn
will be discussed in section 5.1.5.
5.1.1 Operational Modifications
5.1.1.1 Process Description. Several changes can be
made to the operation of some boilers which can reduce NOx
emissions. These include LEA, BOOS, and BF. While these

5-228
changes may be rather easily implemented, their applicability
and effectiveness in reducing NOx may be very unit-specific.
For example, some boilers may already be operating at the
lowest excess air level possible or may not have excess
pulverizer capacity to bias fuel or take burners out of
service. Also, implementing these changes may reduce the
operating flexibility of the boiler, particularly during load
fluctuations.
Operating at LEA involves reducing the amount of
combustion air to the lowest possible level while maintaining
efficient and environmentally compliant boiler operation.
With less oxygen (O2) available in the combustion zone, both
thermal and fuel NOx formation are inhibited. A range of
optimum O2 levels exist for each boiler and is inversely
proportional to the unit load. Even at stable loads, there
are small variations in the O2 percentages which depend upon
overall equipment condition, flame stability, and carbon
monoxide (CO) levels. If the O2 level is reduced too low,
upsets can occur such as smoking or high CO levels.1
Burners-out-of-service involves withholding fuel flow to
all or part of the top row of burners so that only air is
allowed to pass through. This is accomplished by removing the
pulverizer (or mill) that provides fuel to the upper row of
burners from service and keeping the air registers open. The
balance of the fuel is redirected to the lower burners,
creating fuel-rich conditions in those burners. The remaining
air required to complete combustion is introduced through the
upper burners. This method simulates air staging, or overfire
air conditions, and limits NOx formation by lowering the O2
level in the burner area.
Burners-out-of-service can reduce the operating
flexibility of the boiler and can largely reduce the options
available to a coal-fired utility during load fluctuations.
Also, if BOOS is improperly implemented, stack opacity and CO
levels may increase. The success of BOOS depends on the

5-229
initial NOx level; therefore, higher initial NOx levels
promote higher NOx reduction.2
Biased burner firing consists of firing the lower rows of
burners more fuel-rich than the upper row of burners. This
may be accomplished by maintaining normal air distribution in
all the burners and injecting more fuel through the lower
burners than through the upper burners. This can only be
accomplished for units that have excess mill capacity;
otherwise, a unit derate (i.e., reduction in unit load) would
occur. This method provides a form of air staging and limits
fuel and thermal NOx formation by limiting the O2 available in
the firing zone.
5.1.1.2 Factors Affecting Performance. Implementation
of LEA, BOOS, and BF technologies involve changes to the
normal operation of the boiler. Operation of the boiler
outside the "normal range" may result in undesirable
conditions in the furnace (i.e., slagging in the upper
furnace), reduced boiler efficiency (i.e., high levels of CO
and unburned carbon [UBC]), or reductions in unit load.
The appropriate level of LEA is unit-specific. Usually
at a given load, NOx emissions decrease as excess air is
decreased. Lower than normal excess air levels may be
achievable for short periods of time; however, slagging in the
upper furnace or high CO levels may result with longer periods
of LEA. Therefore, the minimum excess air level is generally
defined by the acceptable upper limit of CO emissions and high
emissions of UBC, which signal a decrease in boiler
efficiency. Flame instability and slag deposits in the upper
furnace may also define the minimum excess air level.3
The applicability and appropriate configuration of BOOS
are unit-specific and load dependent. The mills must have
excess capacity to process more fuel to the lower burners.
Some boilers do not have excess mill capacity; therefore, full
load may not be achievable with a mill out of service. Also,
the upper mill and corresponding burners would be required to
operate at full capacity during maintenance periods for mills

5-230
that serve the lower burners. The BOOS pattern may not be
constant. For example, a BOOS pattern at low load may be very
different than that at high load.1
The same factors affecting BOOS also applies to BF, but
to a lesser degree. Because all mills and burners remain in
service for BF, it is not necessary to have as much excess
mill capacity as with BOOS. Local reducing conditions in the
lower burner region caused by the fuel-rich environment
associated with BOOS and BF may cause increased tube wastage.
Additionally, increased upper furnace slagging may occur
because of the lower ash fusion temperature associated with
reducing conditions.
5.1.1.3 Performance of Operational Modifications.
Table 5-2

5-231
TABLE 5-2. PERFORMANCE OF OPERATIONAL MODIFICATIONS ON
U. S. COAL-FIRED UTILITY BOILERS
Utility
Unit
Rated
capacity
Control
Length
Capacity
tested
(%)
Uncontrolled
emissions
(lb/MMBtu)
Controlled
emissions
(lb/MMBtu)
Reduction
emissions
Reference
TANGENTIALLY-FIRED BOILERS, BITUMINOUS COAL
Potomac
Electric Power
Co.
Potomac River 4
(Pre)
100
60
0.62
0.59
0.39
0.34
3742
4Tenn. Valley
Authority
Johnsonville
(1-6)
(Pre)
LEA
BOOS
Short
Short
83
0.5-0.55
0.5-0.55
0.43-0.5
0.34-0.4
10-15
20-35
5Columbus
Southern Power
Co.
Conesville 5
(D)
6Utah Power and
Light Co.
Hunter 2
(Da)
7Tenn Valley
Authority
Johnsonville
(1-6)
5
WALL-FIRED BOILERS, BITUMINOUS COAL
Louisville Gas
and Electric
Co.
Mill Creek 3
(D)
6
Crist 7
(Pre)
6
= Pre-NSPS
OEM = Original equipment manufacturer; ABB-CE = Asea Brown Boveri-Combustion Engineering; B&W = Babcock & Wilcox; and FW = Foster
Wheeler
Type Control: LEA = Low Excess Air; BOOS = Burners-Out-Of-Service; BF = Biased Burner Firing; and Tuned = Boiler tuning.
Short = Short-term test data, i.e., hours.
UNK = Unknown.
reductions are from lowering boiler oxygen levels from 5.0 percent to 3.5 percent.

5-232
presents data from four utility boilers that use operational
modifications to reduce NOx emissions. Three of the boilers,
(Crist 7, Potomac River 4, and Johnsonville) are not subject
to new source performance standards (NSPS) and do not have any
NOx controls; Mill Creek 3 and Conesville 5 are subject to
subpart D standards; and Hunter 2 is subject to subpart Da
standards. Mill Creek 3 has dual-register burners (early
LNB), Conesville 5 has OFA ports, and Hunter 2 has OFA and LNB
in order to meet the NSPS NOx limits. The data presented show
only the effect of reducing the excess air level on three of
these units. On one unit (Crist 7), the fuel was biased in
addition to lowering the excess air.
As shown in table 5-2, LEA reduced NOx emissions by as
much as 21 percent from baseline levels for the subpart D and
subpart Da units. These three units had uncontrolled NOx
levels of 0.63 to 0.69 pound per million British thermal unit
(lb/MMBtu) and were reduced to 0.53 to 0.56 lb/MMBtu with LEA.
For several units at the Johnsonville plant, LEA reduced the
NOx levels to 0.4-0.5 lb/MMBtu, or 10-15 percent while BOOS
reduced the NOx to 0.3-0.4 lb/MMBtu or 20-35 percent. A
boiler tuning program at Potomac River 4 reduced NOx by

5-233
approximately 40 percent and consisted of a combination of
lowering the excess air, improving mill performance,
optimizing burner tilt, and biasing the fuel and air.
A combination of BF and LEA on Crist 7 shows
approximately 21 percent reduction in NOx emissions. This
unit had high uncontrolled NOx emissions of 1.27 lb/MMBtu;
therefore, the NOx level was only reduced to 1.0 lb/MMBtu with
BF and LEA. The baseline or uncontrolled NOx level did not
seem to influence the percent NOx reduction; however, all
these units are less than 20 years old and may be more
amenable to changing operating conditions than older boilers
that have smaller furnace volumes and outdated control systems
and equipment.
5.1.2 Overfire Air
5.1.2.1 Process Description. Overfire air is a
combustion control technique whereby a percentage of the total
combustion air is diverted from the burners and injected
through ports above the top burner level. The total amount of
combustion air fed to the furnace remains unchanged. In the
typical boiler shown in figure 5-1a,

5-234
Figure 5-1a. Typical opposed wall-fired boiler.8
Figure 5-1b. Opposed wall-fired boiler with overfire air.8

5-235
all the air and fuel are introduced into the furnace through
the burners, which form the main combustion zone. For an OFA
system such as in figure 5-1b, approximately 5 to 20 percent
of the combustion air is injected above the main combustion
zone to form the combustion completion zone.8 Since OFA
introduces combustion air at two different locations in the
furnace, this combustion hardware modification is also called
air staging.
Overfire air limits NOx emissions by two mechanisms:
(1) suppressing thermal NOx formation by partially delaying
and extending the combustion process, resulting in less
intense combustion and cooler flame temperatures, and
(2) suppressing fuel NOx formation by lowering the
concentration of air in the burner combustion zone where
volatile fuel nitrogen is evolved.8
5-236
Overfire air can be applied to tangentially-fired,
wall-fired, turbo, and stoker boilers. However, OFA is not
used on cyclone boilers and other slag-tapping furnaces
because it can alter the heat release profile of the furnace,
which can greatly change the slagging characteristics of the
boiler. Overfire air was incorporated into boiler designs as
a NOx control to meet the subpart D and subpart Da standards.
The OFA was used in both wall and tangential designs.
Many pre-NSPS boilers were designed with small furnaces
and limited space between the top row of burners and the
convective pass, thus precluding installation of OFA on these
units. Overfire air retrofits are often unfeasible for these
boilers because overfire air mixing and carbon burnout must be
completed within this limited space. For units where
retrofitting is feasible, the structural integrity of the
burner wall, interference with other existing equipment, the
level of NOx reduction required, and economics determine the
number and arrangement of OFA ports.
5.1.2.1.1 Wall-fired boilers. There are two types of
OFA for wall-fired boilers which are typically referred to as
conventional OFA and advanced OFA (AOFA). Conventional OFA
systems such as in figure 5-2a

5-237
Figure 5-2a. Conventional overfire air on an opposed wall-fired boiler.9
Figure 5-2b. Advanced overfire air on an opposed wall-fired boiler.9
5-238
direct a percentage of the total combustion air--less than
20 percent--from the burners to ports located above the top
burners.9 Because air for conventional OFA systems is taken
from the same windbox, ability to control air flow to the OFA
ports may be limited.
Advanced OFA systems have separate windboxes and ducting,
and the OFA ports can be optimally placed to achieve better
air mixing with the fuel-rich combustion products. The AOFA
systems as shown in figure 5-2b usually inject more air at
greater velocities than conventional OFA systems, giving
improved penetration of air across the furnace width and
greater NOx reduction.9

5-239

5-240
5.1.2.1.2 Tangentially-fired boilers. Overfire air
systems for tangentially-fired boilers are shown in figure 5-3

5-241
Figure 5-3. Tangential boiler windbox/burner arrangement with overfire air systems.

5-242
and are typically referred to as close-coupled OFA (CCOFA) and
separated OFA (SOFA). The CCOFA, analogous to conventional
OFA for wall-fired boilers, directs a portion of the total
combustion air from the burners to ports located above the top
burner in each corner. The SOFA systems are analogous to AOFA
for wall-fired boilers and have a separate windbox and
ducting. In some cases, the close-coupled OFA may be used in
combination with separated OFA as described in section 5.1.4.
5.1.2.2 Factors Affecting Performance. Some OFA systems
cause an increase of incomplete combustion products (UBC, CO,
and organic compounds), tube corrosion, and upper furnace ash
deposits (slagging and fouling). The number, size, and
location of the OFA ports as well as the OFA jet velocity must
be adequate to ensure complete combustion.
To have effective NOx reduction, AOFA and SOFA systems
must have adequate separation between the top burner row and
the OFA ports. However, efficient boiler operation requires
maximizing the residence time available for carbon burnout
between the OFA ports and the furnace exit, which means
locating the AOFA or SOFA ports as close to the burners as
practical.10 These conflicting requirements must be considered
when retrofitting and operating boilers with these types of
OFA systems.
Increasing the amount of OFA, can reduce NOx emissions;
however, this means that less air (O2) is available in the
primary combustion zone. The resulting reducing atmosphere in
the lower furnace can lead to increased corrosion and change
furnace heat release rates and flue gas exit temperature.

5-243
5-244
5.1.2.3 Performance of Overfire Air. The performance of
several OFA systems is shown in table 5-3.

5-245
TABLE 5-3. PERFORMANCE OF OFA ON U. S. COAL-FIRED UTILITY BOILERS
Utility
Unit
Rated
capacity
Control
Length
Capacity
tested
(%)
Uncontrolled
emissions
(lb/MMBtu)
Controlled
emissions
(lb/MMBtu)
Reduction
emissions
Reference
TANGENTIALLY-FIRED BOILERS, BITUMINOUS COAL
Illinois Power
Co.
Hennepin 1
(Pre)
(EERC)
11
Utah Power &
Light Co.
Hunter 2
(D)
CCOFA
(ABB-CE)
7
WALL-FIRED BOILERS, BITUMINOUS COAL
Georgia Power
Co.
Hammond 4
(Pre)
AOFA
(FW)
Short
Short
Short
100
8060
1.20
1.00
1.00
0.90
0.90
0.90
251010
12
Long
Long
Long
100
8060
1.23
1.09
0.98
0.94
0.90
0.87
241711
13
Monongahela
Power Co.
Pleasants 2
(Da)
(FW)
14
Standard: D = Subpart D; Da = Subpart Da; and Pre = Pre-NSPS
OEM = Original Equipment Manufacturer; ABB-CE = Asea Brown Boveri-Combustion Engineering; FW = Foster Wheeler
Type Control: AOFA = Advanced Overfire Air; CCOFA = Close-coupled Overfire Air; OFA = Overfire Air; and SOFA = Separated Overfire Air
control. EERC = Energy and Environmental Research Corporation. Refer to note "b" for others.
Long = Long-term CEM data, i.e., mean hourly average for 4-5 month period; and Short = Short-term test data, i.e., hours.
OFA part of natural gas reburn system and are located higher above burners than typical OFA ports.
OFA ports were original equipment and are no longer in use.

5-246
The table contains two tangentially-fired boilers (one pre-
NSPS with SOFA and one subpart Da with CCOFA) and two wall-
fired boilers (one pre-NSPS with AOFA and one subpart Da with
OFA).
Hennepin 1 is a 75 megawatt (MW) pre-NSPS boiler that has
a retrofit natural gas reburn system. The OFA ports are part
of the reburn system and are located higher above the top row
of burners than a typical OFA system retrofit. The gas reburn
system was not in operation when this data was collected.11
Hunter 2 is a 446 MW subpart Da boiler that has CCOFA ports
that are typical of OFA systems for this vintage boiler.7
Both of the tangential boilers had similar uncontrolled NOx
levels in the range of 0.58 to 0.64 lb/MMBtu. With the SOFA
and CCOFA systems, the NOx was reduced by approximately
20 percent, to 0.46 to 0.50 lb/MMBtu.
The OFA applications on wall-fired boilers include a
retrofit of AOFA on Hammond 4 and an original installation on
Pleasants 2. Both short-term and long-term data are shown for
Hammond 4. The short-term emission levels for any boiler can
be very different from the corresponding long-term levels;
however, for Hammond 4, the short-term and long-term emissions
are similar. Normally, the differences in long-term and
short-term data may be the result of the boiler being operated
at a specific test condition with a number of variables (i.e.,
load, boiler O2, mill pattern) held constant. The long-term
data represents the "typical" day-to-day variations in NOx
emissions under normal operating conditions.
The short-term data for Hammond 4 show controlled NOx
emissions of 0.9 lb/MMBtu across the load range, representing
a 10 to 25 percent NOx reduction. The long-term data for
Hammond 4 show similar reductions of 11 to 24 percent across
the load range. The controlled NOx emission level for the
pre-NSPS wall-fired boilers is nearly twice as high as the NOx

5-247
5-248
levels for tangential boilers due to the higher uncontrolled
NOx level and burner/boiler design.
The OFA system at Pleasants 2 reduced NOx to
approximately 0.7 lb/MMBtu (representing 26 percent NOx
reduction) at full load. Pleasants 2 is a subpart Da boiler
with the OFA system as original equipment. The furnace volume
for this boiler is much larger than that in pre-NSPS boilers.
The controlled level is higher than for tangential boilers due
to the higher uncontrolled NOx level and burner/boiler design.
The uncontrolled data represents operation when the OFA system
was closed. The OFA system alone did not reduce NOx to the
required NSPS levels and was subsequently closed off when the
LNB were upgraded.12
5.1.3 Low NOx Burners
5.1.3.1 Process Description. Low NOx burners have been
developed by many boiler and burner manufacturers for both new
and retrofit applications. Low NOx burners limit NOx
formation by controlling both the stoichiometric and
temperature profiles of the combustion process in each burner
flame envelope. This control is achieved with design features
that regulate the aerodynamic distribution and mixing of the
fuel and air, yielding one or more of the following
conditions:
1. Reduced O2 in the primary combustion zone, which
limits fuel NOx formation;
2. Reduced flame temperature, which limits thermal NOx
formation; and
3. Reduced residence time at peak temperature, which
limits thermal NOx formation.
While tangential boilers have "coal and air nozzles"
rather than "burners" as in wall-fired boilers, the term "LNB"
is used for both tangential and wall applications in this
document. Low NOx burner designs can be divided into two
general categories: "delayed combustion" and "internal
staged." Delayed combustion LNB are designed to decrease
flame turbulence (thus delaying fuel/air mixing) in the

5-249
primary combustion zone, thereby establishing a fuel-rich
condition in the initial stages of combustion. This design
departs from traditional burner designs, which promote rapid
combustion in turbulent, high-intensity flames. The longer,
less intense flames produced with delayed combustion LNB
inhibit thermal NOx generation because of lower flame
temperatures. Furthermore, the decreased availability of O2
in the primary combustion zone inhibits fuel NOx conversion.
Thus, delayed combustion LNB control both thermal and fuel
NOx.
Internally staged LNB are designed to create stratified
fuel-rich and fuel-lean conditions in or near the burner. In
the fuel-rich regions, combustion occurs under reducing
conditions, promoting the conversion of fuel nitrogen (N2) to
N2 and inhibiting fuel NOx formation. In the fuel-lean
regions, combustion is completed at lower temperatures, thus
inhibiting thermal NOx formation.
Low NOx burners are widely used in both wall- and
tangentially fired utility boilers and are custom-designed for
each boiler application. In many cases, the LNB and air
register will have the same dimensions as the existing burner
system and can be inserted into the existing windbox and
furnace wall openings. However, in other cases, waterwall and
windbox modifications require pressure part changes to obtain
the desired NOx reductions.
5.1.3.1.1 Wall-fired boilers. A number of different LNB
designs have been developed by burner manufacturers for use
with wall-fired boilers. Several of these designs are
discussed below.
The Controlled Flow/Split FlameTM (CF/SF) burner shown in
figure 5-4

5-250
Figure 5-4. Controlled Flow/Split FlameTM low NOx burner.10

5-251
is an internally-staged design which stages the secondary air
and primary air and fuel flow within the burner's throat.10
The burner name is derived from the operating functions of the
burner: (1) controlled flow is

5-252
achieved by the dual register design, which provides for the
control of the inner and outer air swirl, allowing independent
control of the quantity of secondary air to each burner, and
(2) the split-flame is accomplished in the coal injection
nozzle, which segregates the coal into four concentrated
streams. The result is that volatiles in the coal are
released and burned under more reducing conditions than would
otherwise occur without the split flame nozzle. Combustion
under these conditions converts the nitrogen species contained
in the volatiles to N2, thus reducing NOx formation.10
The Internal Fuel StagedTM (IFS) burner, shown in
figure 5-5

5-253
Figure 5-5. Internal Fuel StagedTM low NOx burner.10

5-254
, is similar to the CF/SF burner.10 The two designs are nearly
identical, except that the split-flame nozzle has been
replaced by the IFS nozzle, which generates a coaxial flame
surrounded by split flames.
The Dual Register Burner - Axial Control FlowTM (DRB-XCL)
wall-fired LNB operates on the principle of delayed
combustion. The burner diverts air from the central core of
the flame and reduces local stoichiometry during coal
devolatization to minimize initial NOx formation. The DRB-XCL
is designed for use without compartmented windboxes, and the
flame shape can be tuned to fit the furnace by use of
impellers. As shown in figure 5-6

5-255
Figure 5-6. Dual Register Burner-Axial Control FlowTM
low NOx burner.15

5-256
, the burner is equipped with fixed spin vanes in the outer
air zone that move secondary air to the periphery of the
burner.15 Also, adjustable spin vanes are located in the
outer- and inner-air zones of the burner. The inner spin vane
adjusts the shape of the flame, which is typically long. The
outer spin vane imparts swirl to the flame pattern. The flame
stabilizing ring at the exit of the coal nozzle enhances
turbulence and promotes rapid devolatization of the fuel. An
air-flow measuring device located in the air sleeve of each
burner provides a relative indication of air flow through each
burner and is used to detect burner-to-burner flow imbalances
within the windbox.15

5-257

5-258
The RO-II burner consists of a single air inlet, dual-
zone air register, tangential inlet coal nozzle, and a flame-
stabilizing nozzle tip. Figure 5-7

5-259
16

5-260
shows the key components of the burner.16 Combustion air is
admitted to both zones of the air register and the tangential
inlet produces a swirling action. The swirling air produces a
"forced vortex" air flow pattern and around the coat jet.
This pattern creates local staging of combustion by
controlling the coal/air mixing, thus reducing NOx formation.16
The Controlled Combustion VenturiTM (CCV) burner for
wall-fired boilers is shown in figure 5-8.

5-261
17

5-262
17 Nitrogen oxide control is achieved through the venturi coal
nozzle and low swirl coal spreader located in the center of
the burner. The venturi nozzle concentrates the fuel and air
in the center of the coal nozzle, creating a very fuel-rich
mixture. As this mixture passes over the coal spreader, the
blades divide the coal stream into four distinct streams,
which then enter the furnace in a helical pattern. Secondary
air is introduced to the furnace through the air register and
burner barrel. The coal is devolatized at the burner exit in
an fuel-rich primary combustion zone, resulting in lower fuel
NOx conversion. Peak flame temperature is also lowered, thus
suppressing the thermal NOx formation.17
The Low NOx Cell BurnerTM (LNCB), developed for wall-fired
boilers equipped with cell burners, is shown in figure 5-9.

5-26315

5-264
15 Typically, in the LNCB design, the original two coal nozzles
are replaced with a single enlarged injection nozzle in the
lower throat and a secondary air injection port in the upper
throat, which essentially acts as OFA. However, in some
cases, it may be reversed with some of the fuel-rich burners
in the upper throat and some of the air ports in the lower
throat to prevent high CO and hydrogen sulfide (H2S) levels.
The exact configuration depends on the boiler. The flame
shape is controlled by an impeller at the exit of the fuel
nozzle and by adjustable spin vanes in the secondary air

5-265

5-266
5-267
zone. During firing, the lower fuel nozzle operates in a
fuel-rich condition, with the additional air entering through
the upper air port. Sliding dampers mounted in the upper and
lower throats balance the secondary air flow.15
The Tertiary Staged VenturiTM (TSV) burner shown in
figure 5-10

5-268
17

5-269
was designed for turbo, down-fired, and arch-fired boilers.17
Similar to the CCV design, the TSV burner features a venturi
shaped coal nozzle and low swirl coal spreader, but uses
additional tertiary air and an advanced air staging system.
The principles used to reduce NOx are the same used with the
CCV burner.17
5.1.3.1.2 Tangentially-fired boilers. A number of
different LNB designs have been developed by burner
manufacturers for use in tangentially-fired boilers. Several
of these designs are discussed in this section. The
traditional burner arrangement in tangentially-fired boilers
consists of corner-mounted vertical burner assemblies from
which fuel and air are injected into the furnace as shown in
figure 5-11a
5-270
Figure 5-11a. Typical fuel and air compartment arrangement for a tangentially- fired boiler.18
Figure 5-11b. Plan view of fuel and air streams in a typical tangentially-fired boiler.18

5-271
.18 The fuel and air nozzles are directed tangent to an
imaginary circle in the center of the furnace, generating a
rotating fireball in the center of the boiler as shown in
figure 5-11b.18 Each corner has its own windbox that supplies
primary air through the air compartments located above and
below each fuel compartment.
In the early 1980's, the low NOx concentric firing
technique was introduced for tangentially-fired boilers and is
shown in figure 5-12a

5-272
Figure 5-12a. Low NOx Concentric Firing SystemTM fuel and air compartment arrangement.18
Figure 5-12b. Plan view of low NOx Concentric Firing SystemTM.18
5-273
.18 This technique changes the air flow through the windbox;
however, the primary air is not affected. A portion of the
secondary air is directed away from the fireball and toward
the furnace wall as shown in figure 5-12b.18 The existing coal
nozzles in the burner compartments are replaced with "flame
attachment" nozzle tips that accelerate the devolitization of
the coal. This configuration suppresses NOx emissions by
providing an O2 richer environment along the furnace walls.
This can also

5-274

5-275
5-276
reduce the slagging and tube corrosion problems often
associated with combustion slagging.
To retrofit existing tangentially-fired boilers with
concentric firing, all of the air and fuel nozzles must be
replaced. However, structural, windbox, or waterwall changes
may not be required. Several systems are available that use
the concentric firing technique in combination with OFA.
These systems are classified as a family of technologies
called the Low NOx Concentric Firing SystemTM (LNCFS) and are
discussed in section 5.1.4 (LNB + OFA)
The Pollution MinimumTM (PM) burner has also been
developed for tangentially-fired boilers. Although a PM
burner system has been retrofitted in one boiler, this burner
will probably only be used for new applications in the future
because of the extensive modifications required to the fuel
piping. As shown in figure 5-13

5-277
18
5-278
, the PM burner system uses a coal separator that
aerodynamically divides the primary air and coal into two
streams, one fuel-rich and the other fuel-lean.18 Thus, NOx
emissions are reduced through controlling the local
stoichiometry in the near-burner zone.
The retrofit of a PM burner involves installing new
windboxes and auxiliary firing equipment, upgrading the
existing control system, and modifying the waterwall and coal
piping. The PM burner is used with conventional and advanced
OFA systems.18 These systems are discussed in section 5.1.5.1.
5.1.3.1.3 Cyclone-fired boilers. There are currently no
LNB available for cyclone-fired boilers. As discussed in
chapter 3, cyclones boilers are slag-tapping furnaces, in
which the fuel is fired in cylindrical chambers rather than
with conventional burners. In addition, cyclone boilers are
inflexible to modification because of rigid operating
specifications. Proper furnace temperature and high heat
release rates are required to maintain effective slag-tapping
in the furnace. Operating experiences suggest that these

5-279

5-280
parameters cannot be altered in a cyclone boiler to the degree
required for adequate NOx control.11
5.1.3.2 Factors Affecting Performance. The
effectiveness of LNB, especially for retrofit cases, depends
on a number of site-specific parameters. Low NOx burners are
generally larger than conventional burners and require more
precise control of fuel/air distribution. Their performance
depends partially on increasing the size of the combustion
zone to accommodate longer flames. Because of this, LNB are
expected to be less effective when retrofit on relatively
small furnaces.
In order to retrofit LNB in wall-fired boilers, the
existing burners must be removed and replaced. In some cases,
some of the waterwall tubes may have to be bent in order to
install the larger LNB. Also, the LNB may have longer flames
that could impinge on the opposite furnace wall and
superheater tubes which can be a problem for boilers with
small furnace depths. Potential solutions to flame
impingement include adjusting velocities of the coal or
primary air, adjusting secondary air, and/or relocating some
superheater tubes. Boilers with very small furnaces may have
to be derated in order to prevent flame impingement at full
load.
To retrofit a tangentially-fired boiler, the existing
fuel and air nozzles must be removed and replaced. For some
tangentially-fired LNB systems, the new air and fuel nozzles
and CCOFA can be placed in the existing windbox opening. To
retrofit SOFA, new openings must be made above the existing
windbox.
The fuel-rich operating conditions of LNB generate
localized reducing conditions in the lower furnace region and
can increase the slagging tendency of the coal. To reduce
this potential for slagging, some combustion air can be
diverted from the burner and passed over the furnace wall
surfaces, providing a boundary air layer that maintains an
oxidizing atmosphere close to the tube walls. The generally

5-281
longer flames of some LNB will tend to increase furnace exit
and superheat/reheat tube temperatures. Some LNB operate with
a higher pressure drop or may require slightly higher excess
air levels in the furnace at full load to ensure good carbon
burnout, thus increasing fan requirements.
Another consideration in retrofitting LNB is modifying
the windbox. Modifications may include the addition of
dampers and baffles for better control of combustion air flow
to burner rows and combustion air distribution to burners
within a row. Also, the windbox must be large enough to
accommodate the LNB. If the existing windbox requires
substantial modifications to structural components, major
re-piping, and/or windbox replacement, retrofitting LNB may
not be feasible.
5.1.3.3 Performance of Low NOx Burners
5.1.3.3.1 Retrofit applications. The performance of
retrofit LNB is presented in table 5-4.

5-282
Table 5-4

5-283
Table 5-4 continued

5-284
Table 5-4 continued

5-285
There are two tangentially-fired units listed that have
retrofit LNCFS I technology which incorporates CCOFA within
the original windbox opening. For this reason, the LNCFS I
technology is included in the LNB section. One tangential
unit, Lansing Smith 2, is a pre-NSPS unit while the other,
Hunter 2, is a subpart Da unit. Both of these boilers fire
bituminous coal.
Short-term controlled data for Lansing Smith 2 ranged
from 0.39 to 0.43 lb/MMBtu across the load range. Long-term
controlled NOx emissions (mean values of hourly averages for 2
to 3 months) for Lansing Smith 2 were similar to short-term
data and averaged 0.41 lb/MMBtu at near full-load conditions
with LNCFS I as compared to an uncontrolled level of
0.64 lb/MMBtu. At 70 percent load, the controlled NOx level
decreased slightly to 0.4 lb/MMBtu.
The long-term data from Lansing Smith 2 shows 36 to
37 percent NOx reduction, whereas the short-term data shows 41
to 48 percent reduction. The long-term data is probably more
representative of actual day-to-day NOx emission levels during

5-286

5-287

5-288
normal boiler operation than the short-term data taken during
specific test conditions. Lansing Smith 2 is also evaluating
LNCFS II and III as part of a U.S. Department of Energy (DOE)
Innovative Clean Coal Technology project. The results from
the LNCFS II and III demonstrations are presented in
section 5.1.4.3.1.
For Hunter 2, the uncontrolled level of 0.64 lb/MMBtu
represents operation with original burners but without the
OFA. The LNCFS I system reduced the NOx to 0.35 lb/MMBtu at
full-load during short-term tests (45 percent NOx reduction).
The long-term data (4 sets of 30-day rolling averages) taken
during normal low NOx operation indicates an emission level of
0.41 lb/MMBtu at an average 70 percent load. The average NOx
reduction for these units was 35 to 45 percent with LNCFS I
technology which is similar to the results at Lansing Smith.
There are eight wall-fired boilers noted on table 5-4
that fire bituminous coal. Of these, two pre-NSPS boilers
have been retrofit with the XCLTM burner. Edgewater 4 and
Gaston 2 had uncontrolled NOx emissions in the range of 0.76
to 0.85 lb/MMBtu at full-load and were reduced to 0.4 to
0.52 lb/MMBtu with the XCLTM burner (39 to 47 percent).
Figure 5-14

5-289
Figure 5-14. Short-term controlled NOx emissions from wall-fired boilers with retrofit LNB.

5-290
shows trends in controlled NOx levels for Edgewater 4,
Gaston 2, Four Corners 3 and 4, Hammond 4, and Pleasants 2 as
a function of boiler load. Typically, at higher loads the
controlled NOx is higher. The short-term controlled NOx
emissions from both Edgewater and Gaston reduced as the load
decreased. The CCVTM burner reduced uncontrolled NOx emissions
of 1.1 lb/MMBtu by 50 percent to 0.55 lb/MMBtu (Duck Creek 1).
For the two units with the IFSTM burner, the NOx emissions
were reduced 48 to 55 percent. One of these boilers
(Johnsonville 8) had an uncontrolled NOx level of 1.0 lb/MMBtu
and was reduced by 55 percent whereas the other (Colbert 3)
had a lower uncontrolled NOx level of 0.77 lb/MMBtu and was
reduced by only 48 percent.

5-291
For the pre-NSPS boiler retrofit with the CF/SFTM burner
(Hammond 4), the NOx was reduced from uncontrolled levels of
approximately 1.2 lb/MMBtu by 45 to 50 percent to 0.6 lb/MMBtu
(short-term test data) and 0.7 lb/MMBtu (long-term test data).
The subpart Da unit (Pleasants 2) had uncontrolled NOx
emissions of 0.95 lb/MMBtu and was reduced to 0.45 lb/MMBtu
with the CF/SFTM burner (53 percent reduction). This unit was
also originally equipped with OFA ports which were closed off
when the new LNB were installed. The uncontrolled NOx level
of 0.95 lb/MMBtu is from a short-term test without OFA. As
figure 5-3 shows, the NOx emissions from Hammond and Pleasants
decreased as the load decreased.
One boiler, Quindaro 2, was retrofitted with the RO-II
LNB. Testing was conducted with both a bituminous and a
subbituminous coal. Uncontrolled NOx levels were not measured
and the controlled NOx levels at full-load while firing
bituminous coal was 0.53 lb/MMBtu and 0.45 lb/MMBtu at half-
load.
There are seven boilers on table 5-4 that fire
subbituminous coal, five of which have been retrofitted with
the CF/SFTM burner, one with the IFS burner, and one with the
RO-II burner. Two of the units, Four Corners 4 and 5, were
originally 3-nozzle cell units and the burner pattern was
changed to a "standard" opposed-wall configuration during the
retrofit. Therefore, these units are not typical of a direct
plug-in LNB retrofit.
The NOx emissions at Cherokee 3 were reduced from
0.73 lb/MMBtu with the IFS burner to 0.5 lb/MMBtu, or
31 percent. This boiler also has a natural gas reburn system;
however, this data is without reburn. The NOx emissions at
Four Corners 3 were reduced to approximately 0.6 lb/MMBtu with
the CF/SFTM burner. Neither the uncontrolled level nor the
percent reduction were reported.
The San Juan 1 unit was designed to meet an emission
limit of 0.7 lb/MMBtu but was unable to meet this level with
OFA alone. The NOx was reduced from 0.95 lb/MMBtu (with OFA)

5-292
to a controlled level of 0.4 lb/MMBtu (with LNB), or
58 percent reduction. San Juan 1 had fairly high uncontrolled
NOx levels which may be a factor in attaining the high percent
reduction.
The short-term controlled NOx emissions for the subpart D
unit (J.H. Campbell 3) was 0.39 to 0.46 lb/MMBtu at full-load
with the CF/SFTM burner. This unit was originally equipped
with OFA ports which were subsequently closed off when the new
LNB were installed. The uncontrolled NOx emissions are with
the OFA in service. By installing LNB on this unit and
closing the existing OFA ports, approximately 30-40 percent
NOx reduction was achieved.
At Four Corners 4 and 5, the NOx was reduced from an
uncontrolled level of 1.15 lb/MMBtu to controlled levels of
0.49 to 0.57 lb/MMBtu (short-term) and 0.5 to 0.65 lb/MMBtu
(long-term). This corresponds to 50 to 57 percent reduction.
Since these units were originally cell boilers, they had
higher uncontrolled NOx emissions than the standard wall-fired
boiler configuration, and subsequently higher controlled NOx
emissions.
Quindaro 2 was retrofitted with the RO-II LNB and tested
with both bituminous and subbituminous coal. On subbituminous
coal, the NOx emissions were reduced to 0.35 lb/MMBtu at full-
load and to 0.28 lb/MMBtu at half-load. The one cell-fired
boiler (JM Stuart 4) shown on table 5-4 fires bituminous coal
and had high (short-term) uncontrolled NOx emissions of 0.70
to 1.22 lb/MMBtu across the load range. After retrofitting
the LNCB, the NOx was reduced to 0.37 to 0.55 lb/MMBtu (47 to
55 percent). The LNCB is a direct burner replacement and the
boiler remains in a cell unit configuration.
To summarize, the tangentially-fired boilers that fire
bituminous coal had uncontrolled NOx emissions in the range of
0.62 to 0.64 lb/MMBtu and were reduced by 35 to 45 percent
with the LNCFS I technology to controlled levels of 0.35 to
0.4 lb/MMBtu (long-term data). The wall-fired boilers that
fire bituminous coal had uncontrolled NOx emissions in the

5-293
range of 0.75 to 1.2 lb/MMBtu and were reduced by 40 to
50 percent with LNB to controlled levels of 0.4 to
0.7 lb/MMBtu (long-term data). The wide range of NOx
emissions is due to factors such as boiler age, boiler and
burner design, heat release rates, and furnace volume. And,
the wall-fired boilers that fire subbituminous coal had
uncontrolled NOx emissions of 0.6 to 1.2 lb/MMBtu and were
reduced by 40 to 60 percent to controlled levels of 0.4 to
0.6 lb/MMBtu. The wide range of uncontrolled NOx emissions is
due to the original cell configuration of two boilers (high
uncontrolled NOx levels), boiler and burner design, heat
release rates, and furnace volume.
5.1.3.3.2 New units. This section provides information
on NOx emissions from new boilers subject to NSPS subpart Da
standards with LNB as original equipment. The performance of
original LNB on 9 new tangentially-fired and 12 new wall-fired
boilers is presented in table 5-5.

5-294
Table 5-5

5-295
Table 5-5 continued

5-296
Table 5-5 continued
5-297
The tangentially-fired boilers have CCOFA within the main
windbox opening and for this reason, it is included in the LNB
section. The wall-fired boilers have LNB only.
Short-term averages of NOx emissions from the tangential
units firing bituminous coal and operating at near full-load
range from 0.41 to 0.51 lb/MMBtu at near full-load conditions.
For the subbituminous coal-fired tangential boilers, the NOx
emissions ranged from 0.35 to 0.42 lb/MMBtu. And, the NOx
emissions from the lignite-fired boilers ranged from 0.46 to
0.48 lb/MMBtu. As shown in figure 5-15

5-298
Figure 5-15. NOx emissions from new tangentially-fired boilers with LNB + CCOFA.

5-299
, the NOx emissions for three tangential units increased when
operated at low loads. Short-term averages of NOx emissions
from the wall-fired units firing bituminous coal range from
0.28 to 0.52 lb/MMBtu at near full-load conditions. For the
subbituminous coal-fired wall boilers, the NOx emissions
ranged from 0.26 to 0.47 lb/MMBtu whereas the lignite-fired
boiler was

5-300

5-301

5-302

5-303

5-304
0.39 lb/MMBtu. Two wall units reported NOx at lower loads and
as shown in figure 5-16

5-305
Figure 5-16. NOx emissions from new wall-fired boilers with LNB.

5-306
, the NOx decreased as load decreased. 5.1.4 Low NOx Burners
and Overfire Air
5.1.4.1 Process Description. Low NOx burners and OFA
are complementary combustion modifications for NOx control
that incorporate both the localized staging process inherent
in LNB designs and the bulk-furnace air staging of OFA. When
OFA is used with LNB, a portion of the air supplied to the
burners is diverted to OFA ports located above the top burner
row. This reduces the amount of air in the burner zone to an
amount below that required for complete combustion. The final
burn-out of the fuel-rich combustion gases is delayed until
the OFA is injected into the furnace. Using OFA with LNB
decreases the rate of combustion, and a less intense, cooler
flame results, which suppresses the formation of thermal NOx.
In wall-fired boilers, LNB can be coupled with either OFA
or AOFA. Figure 5-17

5-307
Figure 5-17. Advanced OFA system with LNB.54

5-308
shows a schematic of a wall-fired boiler with AOFA combined
with LNB.54 Section 5.1.2 describes both OFA and AOFA systems.
In tangentially-fired boilers, OFA is incorporated into
the LNB design, forming a LNB and OFA system. These systems
use CCOFA and/or SOFA and are classified as a family of
technologies called LNCFS. There are three possible LNCFS
arrangements shown in figure 5-18

5-309
Figure 5-18. Low NOx concentric firing systems.55
5-310
.55 For LNCFS Level I, CCOFA is integrated directly into the
existing windbox by exchanging the highest coal nozzle with
the air nozzle immediately below it. This configuration
requires no major modifications to the boiler or windbox
geometry. In LNCFS Level II, SOFA is used above the windbox.
The air supply ductwork for the SOFA is taken from the
secondary air duct and routed to the corner of the furnace
above the existing windbox. The inlet pressure of the SOFA
system can be increased above the primary windbox pressure
using dampers downstream of the takeoff in the secondary air
duct. The quantity and velocity of the SOFA injected into the
furnace can be higher than those levels

5-311

5-312
5-313
possible with CCOFA, providing better mixing. The LNCFS
Level III uses both CCOFA and SOFA for maximum control and
flexibility of the staging process. Process descriptions of
OFA and LNB are discussed in detail in sections 5.1.2.1 and
5.1.3.1 of this document.
5.1.4.2 Factors Affecting Performance. Design and
operational factors affecting the NOx emission control
performance of combined LNB + OFA are the same as those
discussed in sections 5.1.2.3 and 5.1.3.2, for the individual
controls.
5.1.4.3 Performance of Low NOx Burners and Overfire Air.
5.1.4.3.1 Retrofit applications. The results from
several different types of retrofit LNB + OFA systems
presented in table 5-6.

5-314
Table 5-6

5-315
Table 5-6 continued

5-316
Table 5-6 continued
5-317
The uncontrolled and controlled NOx emission data presented
in this table are averages from short-term tests (i.e., hours)
or from longer periods (i.e., 2 to 4 months). All the boilers
shown but one are pre-NSPS units. The LNCFS II system
incorporates SOFA while the LNCFS III incorporates both CCOFA
and SOFA. The PM system incorporates SOFA. The dual register
LNB (DRB-XCL) and the CF/SF LNB on the wall-fired boilers also
incorporate OFA.
For the three boilers with LNCFS II systems firing
bituminous coal, the short-term controlled NOx emissions range
from 0.28 lb/MMBtu (Cherokee 4) to 0.4 lb/MMBtu (Lansing
Smith 2) at full-load conditions. Long-term data for Lansing
Smith 2 show 0.41 lb/MMBtu at full-load. At lower loads, the
short-term controlled NOx emissions range from a low of 0.33
(Cherokee 4) to a high of 0.75 lb/MMBtu (Valmont 5). Long-
term data at reduced load for Lansing Smith 2 shows NOx
emissions of approximately 0.4 lb/MMBtu. The range of NOx
reduction for LNCFS II technology was approximately 35 to
50 percent at full-load.
For the boiler firing bituminous coal with LNCFS III
systems (Lansing Smith 2), the short-term controlled NOx
emissions were 0.36 lb/MMBtu at full-load conditions while the
long-term NOx emissions for Lansing Smith 2 were

5-318

5-319

5-320
0.34 lb/MMBtu. At lower loads, the short-term NOx emissions
ranged from 0.32 to 0.45 lb/MMBtu while long-term data ranged
from 0.34 to 0.37 lb/MMBtu. The range of NOx reduction for
the LNCFS III technology on bituminous coal was approximately
50 percent at full-load.
One boiler with LNCFS III technology (Labadie 4) burned a
blend of bituminous and subbituminous coal. The short-term
uncontrolled NOx emissions were 0.54 to 0.69 lb/MMBtu across
the load range and were reduced to 0.45 lb/MMBtu, or 10 to
35 percent. The LNCFS III system on Labadie 4 is still being
tuned and long-term data are not yet available.
For the one boiler with the PMTM burner system firing
subbituminous coal, the short-term controlled NOx emissions at
near full-load were 0.25 lb/MMBtu (49 percent NOx reduction)
and 0.14 to 0.19 lb/MMBtu (60 to 71 percent NOx reduction) at
lower loads. However, the baseline and post-retrofit coals
are very different and the 49 percent reduction may not be an
accurate depiction of the capabilities of the retrofit. The
uncontrolled NOx for Lawrence 5 was relatively consistent at
0.47 to 0.49 lb/MMBtu across the load range. However, the
controlled NOx was much less at the lower loads. This was
due to the operators becoming familiar with the operation of
the PM system and being able to greatly reduce excess air
levels at the lower loads.59
Two similar tangentially-fired boilers (Gibson 1 and 3)
have been retrofitted with the Atlas LNB with OFA. For both
cases, the NOx was reduced approximately 40 percent.
Figure 5-19

5-321
Figure 5-19. NOx emissions from tangentially-fired boilers with retrofit LNB + OFA

5-322
shows that short-term controlled NOx emissions across the
load range for the tangential units with retrofit LNB + OFA.
Several boilers (Labadie 4, Lansing Smith 2, and Cherokee 4)
had NOx emissions that increased or decreased slightly over
the load range. However, one unit, Valmont 5, had
substantially higher uncontrolled and controlled NOx emissions
at the lower loads. This may be due to the need for higher
excess air levels at lower loads to maintain reheat and

5-323
superheat steam temperatures. To maintain the steam
temperatures, the main coal and air nozzles tilt upward and
this may contribute to the higher NOx emissions at the lower
loads. As previously mentioned, the NOx decreased for the PM
burner applications.
The wall-fired unit firing bituminous coal, W.H.
Sammis 6, was originally a two-nozzle cell unit. The burner
pattern was changed to a conventional opposed wall pattern
during the installation of the LNB + SOFA system. The
uncontrolled NOx emissions at near full-load ranged from 1.1
to 1.4 lb/MMBtu, which is typical of cell boilers. With the
DRB-XCL + SOFA, the NOx emissions were reduced to
approximately 0.35 lb/MMBtu, or 60 to 70 percent reduction.
At reduced load, the uncontrolled NOx level of 0.49 lb/MMBtu
was reduced by 37 percent to 0.31 lb/MMBtu.
One roof-fired boiler is shown in table 5-6. Arapahoe 4
has completed an extensive retrofit of an DRB-XCL + OFA
system. The uncontrolled NOx level of 1.1 lb/MMBtu was
reduced to 0.35 lb/MMBtu (68 percent) at full-load. At lower
loads, the NOx reduction was 60-70 percent. This boiler is
also demonstrating SNCR as part of the U.S. DOE Innovative
Clean Coal Technology program. The results of the combined
control is presented in section 5.3.3.3.
To summarize, the LNCFS II technology reduced NOx
emissions by 40 to 50 percent and the LNCFS III technology
reduced NOx by 50 percent on bituminous coal-fired boilers.
The LNCFS III technology reduced NOx by 10 to 35 percent on a
boiler firing a blend of bituminous and subbituminous coal.
The PMTM burner reduced NOx by 50 to 60 percent at full-load on
subbituminous coal. And the combination of DRB-XCL + SOFA
reduced NOx by 65 to 70 percent on a wall-fired boiler firing
bituminous coal. The Atlas LNB + OFA reduced NOx by
approximately 40 percent on a wall-fired boiler firing
subbituminous coal.
5.1.4.3.2 New units. This section provides information
on NOx emissions from relatively new boilers with original

5-324
LNB + OFA systems. The performance of original LNB + OFA on
two new wall-fired boilers firing bituminous coal is given in
table 5-7.
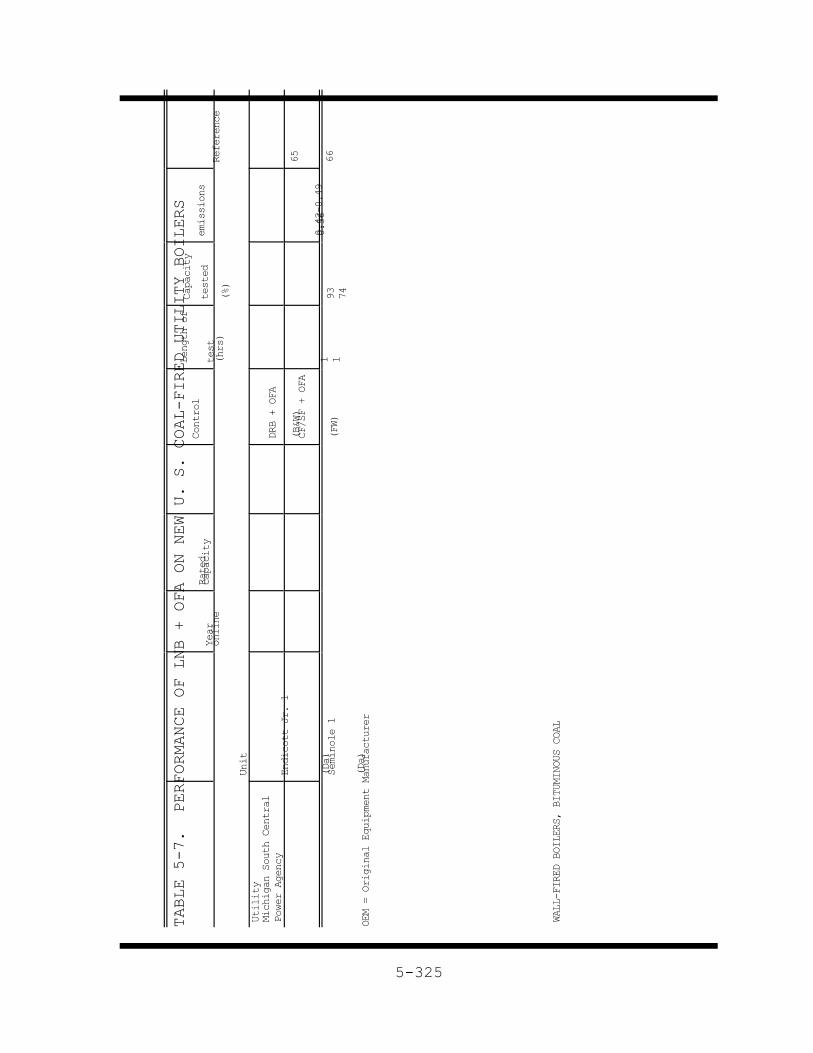
5-325
TABLE 5-7. PERFORMANCE OF LNB + OFA ON NEW U. S. COAL-FIRED UTILITY BOILERS
Utility
Unit
Year
online
Rated
capacity
Control
Length of
test
(hrs)
Capacity
tested
(%)
emissions
Reference
WALL-FIRED BOILERS, BITUMINOUS COAL
Michigan South Central
Power Agency
Endicott Jr. 1
(Da)
DRB + OFA
(B&W)
65
Seminole 1
(Da)
CF/SF + OFA
(FW)
1 19374
0.56
0.42-0.49
66
= Subpart Da
OEM = Original Equipment Manufacturer
= Controlled Flow/Split Flame LNB with OFA
= Dual Register Burner with Overfire Air
= Babcock & Wilcox
= Foster Wheeler

5-326
Short-term averages of NOx emissions for the units operating
at near full-load range from 0.51 lb/MMBtu (Endicott Jr. 1) to
0.56 lb/MMBtu (Seminole 1). At lower loads, the NOx ranged
from 0.42 to 0.49 lb/MMBtu for Seminole 1.
5.1.5 Reburn and Co-Firing
5.1.5.1 Process Descriptions. Reburn is a combustion
hardware modification in which the NOx produced in the main
combustion zone is reduced downstream in a second combustion
zone. This is accomplished by withholding up to 40 percent of
the heat input at the main combustion zone at full-load and
introducing that heat input above the top row of burners to
create a reburn zone. The reburn fuel (which may be natural
gas, oil, or pulverized coal) is injected with either air or
flue gas to create a fuel-rich zone where the NOx formed in
the main combustion zone is reduced to nitrogen and water
vapor. The fuel-rich combustion gases leaving the reburn zone
are completely combusted by injecting overfire air (called
completion air when referring to reburn) above the reburn
zone. Figure 5-20

5-327
Figure 5-20. Application of natural gas reburn on a
67

5-328
presents a simplified diagram of conventional firing and gas
reburning applied to a wall-fired boiler.67
In reburning, the main combustion zone operates at normal
stoichiometry (about 1.1 to 1.2) and receives the bulk of the
fuel input (60 to 90 percent heat input). The balance of the
heat input (10 to 40 percent) is injected above the main
combustion zone through reburning burners or injectors. The
stoichiometry in the reburn zone is in the range of 0.85 to
0.95. To achieve this, the reburn fuel is injected at a
stoichiometry of 0.2 to 0.4. The temperature in the reburn

5-329

5-330

5-331
zone must be above 980 oC (1,800 oF) to provide an environment
for the decomposition of the reburn fuel.68
Any unburned fuel leaving the reburn zone is then burned
to completion in the burnout zone, where overfire air (15 to
20 percent of the total combustion air) is introduced. The
overfire air ports are designed for adjustable air velocities
to optimize the mixing and complete burnout of the fuel before
it exits the furnace.
The kinetics involved in the reburn zone to reduce NOx
are complex and not fully understood. The major chemical
reactions are the following:68
heat/O2 deficientCH4 > CCH3 + CH (hydrocarbon radicals) (5-1)
The reaction process shown in equation 5-1 is initiated
by hydrocarbon formation in the reburn zone. Hydrocarbon
radicals are released due to the pyrolysis of the fuel in an
O2 deficient, high-temperature environment. The hydrocarbon
radicals then mix with the combustion gases from the main
combustion zone and react with NO to form (CN) radicals and
other stable products (equations 5-2 to 5-4).68
CCH3 + NO 6 HCN + H2O (5-2)
N2 + CCH3 6 CNH2 + HCN (5-3)
CH + HCN 6 CCN + H2 (5-4)
The CN radicals and the other products can then react
with NO to form N2, thus completing the major NOx reduction
step (equations 5-5 to 5-7).68
NO + CNH2 6 N2 + H2O (5-5)
NO + CCN 6 N2 + CO (5-6)
NO + CO 6 N2 + .... (5-7)
An O2 deficient environment is important. If O2 levels
are high, the NOx reduction mechanism will not occur and other
reactions will predominate (equations 5-8 to 5-9).68
CN + O2 6 CO + NO (5-8)
NH2 + O2 6 H2O + NO (5-9)
5-332
To complete the combustion process, air must be
introduced above the reburn zone. Conversion of (HCN) and
ammonia compounds in the burnout zone may regenerate some of
the decomposed NOx by equations 5-10 to 5-11:68
HCN + 5/4 O2 6 NO + CO + 1/2 H2O (5-10)
NH3 + 5/4 O2 6 NO + 3/2 H2O (5-11)
The NOx may continue to be reduced by the HCN and NH3
compounds in equations 5-12 to 5-13:68
HCN + 3/4 O2 6 1/2 N2 + CO + 1/2 H2O (5-12)
NH3 + 3/4 O2 6 1/2 N2 + 3/2 H2O (5-13)
Reburning may be applicable to many types of boilers
firing coal, oil, or natural gas as primary fuels in the
boiler. However, the application and effectiveness are site-
specific because each unit is designed to achieve specific
steam conditions and capacity. Also, each unit is designed to
handle a specific coal of range of coals. The type of reburn
fuel can be the same as the primary fuel or a different fuel.
For coal-fired boilers, natural gas is an attractive reburn
fuel because it is nitrogen-free and therefore provides a
greater potential NOx reduction than a reburn fuel with a
higher nitrogen content.69 Natural gas must be supplied via
pipeline and many plants utilize natural gas as ignition or
startup fuel, space heating, or for firing other units. If
natural gas is not available on-site, a pipeline would need to
be installed; however, oil or pulverized coal may be used as
alternative reburn fuels.67

5-333
As shown in figure 5-21

5-334
69
5-335
, reburning may be applicable to cyclone furnaces that may
not be adaptable to other NOx reduction techniques such as
LNB, LEA, or OFA without creating other operational problems.69
Cyclone furnaces burn crushed coal rather than pulverized
coal, and pulverizers would be required if coal is used as the
reburn fuel.
Reburning does not require any changes to the existing
burners or any major operational changes. The major
requirement is that the fuel feed rate to the main combustion
5-336
zone be reduced and an equivalent amount of fuel (on a heat
input basis) be fed to the reburn burners in the reburn zone.
Reburn fuel heat input usually accounts for no more than
20 percent with natural gas or oil as the reburn fuel and
usually no more than 35 percent with coal as the reburn fuel.
Several reburning systems are available from different
vendors for coal-fired applications. Key components of these
reburn systems include reburn fuel burners for coal or oil
reburn fuel or injectors for natural gas reburn fuel and
associated piping and control valves. The Digital Control
System is also a necessary part of the reburn system. If flue
gas is used as the reburn fuel carrier gas, then fans,
ductwork, controls, dampers, and a windbox are also needed in
the reburn zone. Key components of the burnout zone include
ductwork, control dampers, a windbox, and injectors or air
nozzles. Injectors for the reburn fuel and overfire air
require waterwall modifications for installation of the ports.
Natural gas co-firing consists of injecting and
combusting natural gas near or concurrently with the main
coal, oil, or natural gas fuel. At many sites, natural gas is
used during boiler start-up, stabilization, or as an auxiliary
fuel. Co-firing may have little impact to the overall boiler
performance since the natural gas is combusted at the same
locations as the main fuel. Figure 5-22

5-337
70

5-338
shows an example of a co-firing application on a wall-fired
boiler.70
5.1.5.2 Factors Affecting Performance. The reburn
system design and operation can determine the effectiveness of
a reburn application. Reburn must be designed as a "system"
so that the size, number, and location of reburn burners and
overfire air ports are optimized. A successful design can be
accomplished through physical and numerical modeling. The
system must be capable of providing good mixing in the reburn
burnout zones, so that maximum NOx reduction and complete fuel
burnout is achieved. Also, penetration of the reburn fuel
into hot flue gas must be accurately directed because over-

5-339
penetration or under-penetration could result in tube wastage
and flame instability.68
Operational parameters that affect the performance of
reburn include the reburn zone stoichiometry, residence time
in the reburn zone, reburn fuel carrier gas, and the
temperature and O2 level in the burnout zone. Decreasing the
reburn zone stoichiometry can reduce NOx emissions. However,
decreasing the stoichiometry requires adding a larger portion
of fuel to the reburn zone, which can adversely affect upper
furnace conditions by increasing the furnace exit gas
temperature.
As previously described, flue gas may be used to inject
the reburn fuel into the reburn zone. Flue gas recirculation
(FGR) rate to the reburning burners can affect NOx reduction.
Coal reburning is more sensitive to the FGR rate than natural
gas or oil reburning, possibly because of coal nitrogen in the
reburning coal portions. When FGR is not used, NOx is formed
through the volatile flame attached to the reburn burner.
However when FGR is used, mixing is improved and the NOx
formation in the volatile reburning flame is reduced.
A main controlling factor in reducing NOx emissions with
reburn is the residence time in the reburn zone. The reburn
fuel and combustion gases from the main zone must be mixed
thoroughly for reactions to occur. If thorough mixing occurs,
the residence time in this zone can be minimized.68 The
furnace size and geometry determines the placement of reburn
burners and overfire air ports, which will ultimately
influence the residence time in the reburn zone.
The temperature and O2 levels in the burnout zone are
important factors for the regeneration or destruction of NOx
in this area. Low temperature and O2 concentrations promote
higher conversion of nitrogen compounds to elemental nitrogen.
However, high carbon losses occur at low concentrations of O2
and lower temperatures. The burnout zone also requires
sufficient residence time for O2 to mix and react with

5-340
combustibles from the furnace before entering the convective
pass to reduce unburned carbon.68
5.1.5.3 Performance of Reburn. Results from two natural
gas and one pulverized coal reburn retrofit installation are
given in table 5-8.

5-341
TABLE 5-8. PERFORMANCE OF REBURN AND CO-FIRING ON U. S. COAL-FIRED
UTILITY BOILERS
Utility
Unit
)
Rated
capacity
Control
Length
of test
Capacity
tested
(%)
Uncontrolled
emissions
(lb/MMBtu)
Controlled
emissions
(lb/MMBtu)
Reduction
emissions
Reference
TANGENTIALLY-FIRED BOILERS, BITUMINOUS COAL
Illinois Power
Co.
Hennepin 1
(Pre)
NGR
(EERC)
100
53-100
0.59
0.57
0.22
0.23
6360
71
TANGENTIALLY-FIRED BOILERS, SUBBITUMINOUS COAL
Kansas Power &
Light
Lawrence 5
(Pre)
Gas Co-
firing
Short
Short
55-65
55-65
0.22-0.24
0.22-0.24
0.15-0.18
0.14
20-30
35
70
WALL-FIRED BOILERS, SUBBITUMINOUS COAL
Public Service
Co. of CO
Cherokee 3
(Pre)
72
CYCLONE-FIRED BOILERS, BITUMINOUS COAL
Wisconsin Power
and Light Co.
Nelson Dewey 2
(Pre)
Coal
Reburn
(B&W)
100
7450
0.83
0.72
0.69
0.39
0.36
0.44
535036
73, 74
Niles 1
(Pre)
NGR
(ABB-CE)
100
8579
0.95
0.95
0.91
0.90
0.50
0.54
0.60
0.58
47433436
75
Standard: Pre = Pre-NSPS
OEM = Original Equipment Manufacturer
Control Type: Coal Reburn = Pulverized Coal Reburn; and NGR = Natural Gas Reburn.
EERC = Energy and Environmental Research
Corporation
Hours.
3-55 hours.
6-8 days.
Reburn system could not be operated below 75 percent load.

5-342
All three boilers burn bituminous coal. For the natural gas
reburn application on a tangentially-fired boiler (Hennepin 1)
firing bituminous coal, the short-term data indicate that NOx
emissions at full-load are 0.22 lb/MMBtu, corresponding to a
63 percent reduction. The long-term data collected during 3
to 55 hour periods averaged 0.23 lb/MMBtu at loads of 53 to
100 percent. This unit averaged 60 percent NOx reduction.
There is one application of natural gas reburn on a wall-
fired boiler, Cherokee 3, and this unit also has retrofit LNB
with reburn, the NOx was reduced approximately 60 percent to
0.2 lb/MMBtu from the control levels with LNB.
For the natural gas reburn on a cyclone boiler, Niles 1,
the long-term data indicate NOx emissions are in the range of
0.50 to 0.60 lb/MMBtu at 75 to 100 percent load. Niles
reported that maximum NOx reductions (approximately
50 percent) are only achievable at, or near, maximum load
capacity because as the load was reduced, the reburn
performance degraded and could not be operated at less than
75 percent load. This is due to the reburn-fuel mixing
limitations and temperatures required to enable the slag to
run in the furnace. This situation may be boiler- or fuel-
specific.
There was a substantial buildup of slag on the back wall
at Niles (even covering the reburn ports) and substantial
changes had to be made to the reburn equipment design. After
all the changes were made in design and optimization of the
system was completed, the full-load NOx reduction at Niles
averaged 47 percent at full load and 36 percent at 75 percent
load. There was no NOx reduction noted at less than

5-343
5-344
75 percent load. The reburn system was removed in August
1992, 2 years after installation.
The remaining reburn application is a pulverized coal
reburn system on a cyclone boiler (Nelson Dewey 2). The
short-term NOx emissions at full-load were 0.38 lb/MMBtu
(55 percent NOx reduction) when burning bituminous coal. As
noted with the previous application, the NOx emissions were
reduced at mid-load levels and then increased at low loads.
At 73 percent load, the NOx emissions were 0.35 lb/MMBtu
(36 percent reduction) and at half load, the NOx emissions
were 0.49 lb/MMBtu. It was reported that when burning a
western, Powder River Basin Coal, a 50 percent reduction was
achieved over the load range. This further emphasis that the
NOx reduction with reburn is both fuel- and boiler-specific.
The results of the reburn applications are shown in
figure 5-23.

5-345
Figure 5-23. Controlled NOx emissions from coal-fired boilerswith retrofit reburn systems.

5-346
The one co-firing application on table 5-8 is Lawrence 5.
Lawrence 5 was retrofitted with the PM LNB system in 1987 and
consists of five levels of PM coal nozzles. Full-load natural
gas firing is available through natural gas elevations between
the coal elevations. Separated OFA is also part of the PM LNB
system. By selective co-firing with 10 percent natural gas,
the NOx was reduced 29 to 30 percent from the controlled
levels with the PM LNB system. With 20 percent co-firing, the
NOx was reduced an additional 5 percent.
5.1.6 Low NOx Burners and Reburn
5.1.6.1 Process Description. Reburn technology can also
be combined with LNB to further reduce NOx emissions through
additional staging of the combustion process. This staging is
accomplished by reducing the fuel fed to the LNB to
approximately 70-85 percent of the normal heat input and
introducing the remainder of the fuel in the reburn zone.
Combustion of the unburned fuel leaving the reburn zone is
then completed in the burnout zone, where additional
combustion air is introduced. Detailed descriptions of LNB

5-347
5-348
and reburn technology are provided in sections 5.1.3.1 and
5.1.5.1, respectively.
5.1.6.2 Factors Affecting Performance. Design and
operational factors affecting the NOx emission control
performance of combined LNB and reburn systems are the same as
discussed in sections 5.1.3.2 and 5.1.5.2, for the individual
controls.
5.1.6.3 Performance of Low NOx Burners and Reburn.
There is one application of LNB and natural gas reburn on a
coal-fired boiler at the Public Service Company of Colorado's
Cherokee Station Unit 3. This is a U.S. DOE Innovative Clean
Coal Technology Project on a 150 MW pre-NSPS wall-fired boiler
that was predicting a 75-percent decrease in NOx emissions.76
Short-term test data shows an overall 72 percent reduction
from uncontrolled levels. The NOx was reduced by 31 percent
with LNB to 0.5 lb/MMBtu and by 60 percent with reburn to
0.2 lb/MMBtu.
5.2 COMBUSTION CONTROLS FOR NATURAL GAS- AND OIL-FIRED
UTILITY BOILERS
Most of the same NOx control techniques used in
coal-fired utility boilers are also used in natural gas- and
oil-fired utility boilers. These techniques include
operational modifications such as LEA, BOOS, and BF; OFA; LNB;
and reburn. However, in natural gas- and oil-fired boilers, a
combination of these controls is typically used rather than
singular controls. Refer to section 5.1 for a general
discussion of these NOx controls. Additionally, windbox FGR
is a combustion control that is used on natural gas- and oil-
fired boilers that is not used on coal-fired boilers. Windbox
FGR will be described in section 5.2.2.
5.2.1 Operational Modifications
5.2.1.1 Process Description. Operational modifications
are more widely implemented to reduce NOx emissions from
natural gas- and oil-fired utility boilers than from coal-
fired boilers. Because the nitrogen content of natural gas
and oil is low compared to coal, the majority of the NOx

5-349
emitted from natural gas and oil-fired boilers is the result
of thermal NOx generation, which can be minimized by reducing
the available O2 and the peak temperature in the combustion
zone. Since operational modifications promote these
conditions, and natural gas and oil combustion is less
sensitive than coal to variations in operating parameters,
operational modifications are effective, low-cost NOx control
techniques for natural gas- and oil-fired boilers.
The process descriptions of LEA, BOOS, and BF are the
same for natural gas- and oil-fired boilers as for coal-fired
boilers as was discussed in section 5.1.1.1.
5.2.1.2 Factors Affecting Performance. As discussed in
section 5.1.1.2, implementation of LEA, BOOS, and BF
techniques involve changes to the normal operations of the
boiler, which may result in undesirable side-effects. As
mentioned above, natural gas- and oil-fired boilers are less
sensitive to operation outside the "normal range." However,
the factors affecting the performance of operational
modifications in natural gas- and oil-fired boilers are
similar to those discussed for coal-fired units.
The appropriate level of LEA for natural gas- and
oil-fired boilers is unit specific. Usually, however, LEA
levels are lower than can be achieved with coal-fired boilers
because flame instability and furnace slagging do not
determine minimum excess air levels in natural gas- and oil-
fired boilers. The LEA levels in these boilers are typically
defined by the acceptable upper limit of CO and UBC emissions.
Although NOx reductions can be achieved with BOOS and BF,
these operational modifications often slightly degrade the
performance of the boiler because excess air levels must be
sufficiency high enough to prevent elevated levels of CO,
hydrocarbons, and unburned carbon emissions resulting from
abnormal operating conditions. For this reason, monitoring
flue gas composition, especially O2 and CO concentrations, is
very important when employing operational modifications for
NOx control. Because flame instability can occur, the BOOS or

5-350
BF pattern, including the degree of staging of each of the
burners still in service, must be appropriate for optimal
boiler performance.
During BOOS operation, the air admitted through the upper
burner to complete the fuel burnout is generally at low
preheat levels and low supply pressure (windbox pressure), so
it mixes inefficiently with the combustion products, causing
high CO emissions or high excess air operation. If the boiler
is operated at high excess air levels to maintain reasonable
CO emission levels, the degree of combustion staging and NOx
control is reduced. Operating at high excess O2 also reduces
boiler efficiency. Therefore, a trade-off between low NOx
emissions and high boiler efficiency must be managed.77
With BF, the fuel-lean burners provide a combustion zone
with a preheated source of O2 to complete the oxidation of the
unburned fuel from the first combustion zone. The preheating
of this O2 source enhances the penetration and mixing of this
additional O2 and promotes the complete burnout of fuel at
lower excess air levels. In addition, the combustion
stoichiometry in the second combustion zone is more uniform,
reducing the O2 imbalances experienced with BOOS operation.77
5.2.1.3 Performance of Operation Modifications.
Table 5-9

5-351
TABLE 5-9. PERFORMANCE OF BOOS + LEA ON U. S. NATURAL GAS- AND
OIL-FIRED UTILITY BOILERS
Utility
Unit
Rated
capacity
Control
Length
of
Capacity
tested
(%)
Uncontrolled
emissions
(lb/MMBtu)
Controlled
emissions
(lb/MMBtu)
Reduction
emissions
Reference
WALL-FIRED BOILERS, FUEL OIL
Hawaiian Electric
Co.
Kahe 6
(D)
78
WALL-FIRED BOILERS, NATURAL GAS
Southern
California Edison
Co.
Alamitos 6
(Pre)
79
Houston Lighting
& Power Co.
S.R. Bertron 2
(Pre)
1Houston Lighting
& Power Co.
Deepwater 9
(Pre)
1Houston Lighting
& Power Co.
S.R. Bertron 1
(Pre)
LEA +
BOOS
1Houston Lighting
& Power Co.
W.A. Parrish 1
(Pre)
LEA +
BOOS
1Houston Lighting
& Power Co.
W.A. Parrish 2
(Pre)
LEA +
BOOS
1Houston Lighting
& Power Co.
W.A. Parrish 3
(Pre)
LEA +
BOOS
1
TURBO-FIRED BOILERS, NATURAL GAS
Houston Lighting
& Power Co.
Webster 3
(Pre)
Natural
Gas
LEA +
BOOS
1
OEM = Original Equipment Manufacturer; ABB-CE = Asea Brown Boveri-Combustion Engineering; B&W = Babcock & Wilcox; FW = Foster Wheeler;
and RS = Riley Stoker
Type Control: BOOS = Burners-out-of-service; and LEA = Low Excess Air
Short = Short-term test data, i.e., hours.

5-352
presents data for BOOS, LEA, and combination of BOOS and LEA
for natural gas and oil wall-fired boilers. For the single
oil-fired boiler (Kahe 6), BOOS reduced the NOx emissions from
0.81 lb/MMBtu to 0.50 lb/MMBtu (38 percent). For the natural
gas-fired boiler (Alamitos 6), BOOS reduced the NOx from
0.90 lb/MMBtu to 0.19 lb/MMBtu (79 percent).
For LEA application on two wall-fired boilers firing
natural gas (S.R. Berton 2 and Deepwater 9), the NOx was
reduced to levels of 0.24 to 0.28 lb/MMBtu (7 to 40 percent).
Combining LEA + BOOS on natural gas-fired boilers reduced the
NOx emissions to 0.24 to 0.52 lb/MMBtu (39 to 67 percent).

5-353
In general, the higher the baseline NOx emissions, the
higher percent NOx reduction was achieved with this type of
operational modifications. While some boilers may have
achieved higher reductions in NOx emissions, proper
implementation of BOOS + LEA may achieve 30 to 50 percent
reduction with no major increase in CO or particulate
emissions. However, effectiveness of BOOS is boiler-specific
and not all boilers may be amenable to the distortion in
fuel/air mixing pattern imposed by BOOS due to their design
type or fuel characteristics. Boilers originally designed for
coal and then converted to fuel-oil firing may better
accommodate BOOS (and LEA) than boilers with smaller furnaces.
5.2.2 Flue Gas Recirculation
5.2.2.1 Process Description. Flue gas recirculation is
a flame-quenching strategy in which the recirculated flue gas
acts as a thermal diluent to reduce combustion temperatures.
It also reduces excess air requirements, thereby reducing the
concentration of O2 in the combustion zone. As shown in
figure 5-24

5-354
79
5-355
, FGR involves extracting a portion of the flue gas from the
economizer or air heater outlet and readmitting it to the
furnace through the furnace hopper, the burner windbox, or
both.79 To reduce NOx, the flue gas is injected into the
windbox. For coal-fired boilers operating at peak boiler
capacity, flue gas is commonly readmitted through the furnace
hopper or above the windbox to control the superheater steam
temperature; however, this method of FGR does not reduce NOx
emissions. Windbox FGR is most effective for reducing thermal
NOx only and is not used for NOx control on coal-fired boilers
in which fuel NOx is a major contributor.
The degree of FGR is variable (10 to 20 percent of
combustion air) and depends upon the output limitation of the
forced draft (FD) fan (i.e., combustion air source which
directly feeds the boiler). This is particularly true for
units in which FGR was originally installed for steam
temperature control rather than for NOx control.80 The FGR

5-356
fans are located between the FD fans and the burner windbox.
The FGR is injected into the FD fan ducting and then
distributed within the windbox to the burners. As the fan
flow is increased, the pressure within the furnace increases.
At some level, the fans are unable to provide sufficient
combustion air to the windbox. This results in
overpressurization of the boiler and a possible unit de-rate.1
5.2.2.2 Factors Affecting Performance. To maximize NOx
reduction, FGR is routed through the windbox to the burners,
where temperature suppression can occur within the flame. The
effectiveness of the technique depends on the burner heat
release rate and the type of fuel being burned. When burning
heavier fuel oils, less NOx reduction would be expected than
when burning natural gas because of the higher nitrogen
content of the fuel.
Flue gas recirculation for NOx control is more attractive
for new boilers than as a retrofit. Retrofit hardware
modifications to implement FGR include new ductwork, a
recirculation fan, devices to mix flue gas with combustion
air, and associated controls. In addition, the FGR system
itself requires a substantial maintenance program due to the
high temperature environment and potential erosion from
entrained ash.
5.2.2.3 Performance of Flue Gas Recirculation.
Table 5-10

5-357
TABLE 5-10. PERFORMANCE OF FGR ON U. S. NATURAL GAS- AND OIL-FIRED BOILERS
Utility
Unit
Rated
capacity
Control
Length
Capacity
tested
(%)
Uncontrolled
emissions
(lb/MMBtu)
Controlled
emissions
(lb/MMBtu)
Reduction
emissions
References
TANGENTIALLY-FIRED BOILERS, NATURAL GAS
Southern Cal.
Edison Co.
Etiwanda 3
(Pre)
100
5020
0.08
0.04
0.03
255033
81
WALL-FIRED BOILERS, FUEL OIL
Hawaiian
Electric Co.
Kahe 6
(D)
FGR
(B&W)
78
WALL-FIRED BOILERS, NATURAL GAS
Southern Cal.
Edison Co.
Alamitos 6
(Pre)
79
Southern Cal.
Edison Co.
Alamitos 6
(Pre)
79
Standard: Da = Subpart Da; and Pre = Pre-NSPS
OEM = Original Equipment Manufacturer; and B&W = Babcock & Wilcox.
Type Control: FGR = Flue Gas Recirculation
Vendors: B&W = Babcock & Wilcox
Short = Short-term test data, i.e., hours.
Increased flue gas recirculation rate.
Estimated uncontrolled emissions with BOOS only. Controlled emissions with BOOS and FGR.
Extrapolated uncontrolled emissions with LNB only. Controlled emissions with LNB and FGR.
5-358
presents data for FGR applied to one tangentially-fired
boiler and three wall-fired boilers. It should be noted that
FGR is usually used in combination with other modifications or
controls (i.e., LEA, BOOS, OFA, or LNB) and little data are
available for FGR alone. At full-load, the FGR reduced NOx
emissions to 0.42 lb/MMBtu on the wall-fired boiler firing
fuel oil for a NOx reduction of 48 percent. Flue gas
recirculation applied to a tangentially-fired boiler firing
natural gas reduced NOx by 25 to 50 percent across the load
range with FGR on wall-fired boilers firing natural gas, the
NOx reduced by more than 50 percent.

5-359
5.2.3 Overfire Air
5.2.3.1 Process Description. The same types of OFA
systems are used for natural gas- and oil-firing as was
described for coal-firing in section 5.1.2.1.
5.2.3.2 Factors Affecting Performance. Boilers
characterized by small furnaces with high heat release rates
typically have insufficient volume above the top burner row to
accommodate OFA ports and still complete combustion within the
furnace. With some units, retrofitting with OFA would make it
necessary to derate and modify the superheater tube bank to
minimize changes in the heat absorption profile of the boiler.
For these small boilers, BOOS can offer similar NOx reduction
at a fraction of the cost.
The factors that affect OFA performance for natural gas-
and oil-fired boilers are the same as those described for
coal-fired boilers in section 5.1.2.2.
5.2.3.3 Performance of Overfire Air. Data for OFA on
natural gas-fired boilers are presented in table 5-11.

5-360
TABLE 5-11. PERFORMANCE OF OFA + LEA ON U. S. NATURAL GAS- AND OIL-FIRED BOILERS
Utility
Unit
Rated
capacity
Control
Length
Capacity
tested
(%)
Uncontrolled
emissions
(lb/MMBtu)
Controlled
emissions
(lb/MMBtu)
Reduction
emissions
Reference
WALL-FIRED BOILERS, FUEL OIL
Hawaiian
Electric Co.
Kahe 6
(D)
78
TANGENTIALLY-FIRED BOILERS, NATURAL GAS
Houston
Lighting &
Power Co.
S.R. Berton 3
(Pre)
82
Houston
Lighting &
Power Co.
S.R. Berton 4
(Pre)
82
Houston
Lighting &
Power Co.
T.H. Warton 2
(Pre)
82
WALL-FIRED BOILERS, NATURAL GAS
Houston
Lighting &
Power Co.
P.H. Robinson 3
(Pre)
82
Standard: Pre = Pre-NSPS
OEM = Original Equipment Manufacturer; ABB-CE = Asea Brown Boveri-Combustion Engineering; and FW = Foster Wheeler
Type Control: LEA = Low Excess Air; and OFA = Overfire Air
Short = Short-term test data, i.e., hours.
is with LNB and controlled is with LNB + OFA.
5-361
These units were typically operated with LEA; therefore, the
controlled NOx emissions are for OFA + LEA. For the
tangentially-fired boilers, the NOx was reduced to 0.11 to
0.19 lb/MMBtu at full-load with OFA + LEA (10 to 46 percent
reduction). The wall-fired boiler had a higher uncontrolled
NOx level and was reduced to 0.54 lb/MMBtu with OFA + LEA
(48 percent reduction). The OFA application on a wall-fired
boiler firing fuel oil was approximately 20 percent.
5.2.4 Low NOx Burners
5.2.4.1 Process Description. The fundamental NOx
reduction mechanisms in natural gas- and oil-fired LNB are
essentially the same as those in coal-fired LNB discussed in
section 5.1.3.1. However, many vendors of LNB for oil- and
natural gas-fired boilers incorporate FGR as an integral part
of the LNB. Low NOx burners are appealing options for natural
gas- and oil-fired utility boilers because they can eliminate
many of the boiler operating flexibility restraints associated
with BOOS, BF, and OFA.

5-362
5.2.4.1.1 Wall-fired boilers. As with coal-fired LNB,
there are a number of different natural gas- and oil-fired LNB
available from manufacturers. Several of these are discussed
below.
The wall-fired ROPMTM burner for natural gas- or
oil-firing is shown in figure 5-25

5-363
Figure 5-25. ROPMTM burner for natural gas- and oil-fired boilers.83
5-364
.83 Combustion in a ROPMTM burner is internally staged, and
takes place in two different zones; one under fuel-rich
conditions and the other under fuel-lean conditions. Gaseous
fuel burns under pre-mixed conditions in both the fuel-lean
and fuel-rich zones. With liquified fuels, however, burning
occurs under diffused-flame conditions in the fuel-rich
mixture to maintain a stable flame.
The natural gas-fired ROPMTM burner generates a fuel-rich
flame zone surrounded by a fuel-lean zone. The burner
register is divided into two sections. Natural gas and
combustion air supplied via an internal cylindrical
compartment produces the fuel-rich flame. The fuel and air
supplied via the surrounding annular passage produces the
fuel-lean zone.83
The oil-fired ROPMTM burner uses a unique atomizer that
sprays fuel at two different spray angles, creating two
concentric hollow cones. The inner cone creates a fuel-rich
flame zone; the outer cone forms the fuel-lean flame zone.
The inner fuel-rich flame zone has diffusion flame
characteristics that help maintain overall flame stability.
The ROPMTM burner technology generally relies on a combination
of ROPMTM burners and FGR to achieve NOx reductions.83
The DynaswirlTM burner for wall-fired boilers divides
combustion air into several component streams and controls
injection of fuel into the air streams at selected points to
maintain stable flames with low NOx generation. Figure 5-26

5-365
Figure 5-26. DynaswirlTM low NOx burner.79

5-366
schematically illustrates the internal configuration of the
burner.79 For natural gas-firing, fuel is introduced through
six pipes, or pokers, fed from an external manifold. The

5-367

5-368
pokers have skewed, flat tips perforated with numerous holes
and directed inward toward the burner centerline. Primary air
flows down the center of the burner venturi around the center-
fired gas gun, where it mixes with this gas to form a stable
flame. Secondary air flows among the outer walls of the
venturi, where it mixes with gas from the gas pokers and is
ignited by the center flame.79
The Internal Staged CombustionTM (ISC) wall-fired LNB
incorporates LEA in the primary combustion zone, which limits
the O2 available to combine with fuel nitrogen. In the second
combustion stage, additional air is added downstream to form a
cooler, O2-rich zone where combustion is completed and thermal
NOx formation is limited. The ISC design, shown in figure 5-27

5-369
Figure 5-27. Internal Staged CombustionTM low NOx burner.84

5-370
, can fire natural gas or oil.84
The wall-fired Primary Gas - Dual Register BurnerTM (PG-
DRB), shown in figure 5-28

5-371
Figure 5-28. Primary Gas-dual RegisterTM low NOx burner.15

5-372
, was developed to improve the NOx reduction capabilities of
the standard DRB.15 The PG-DRB can be used in new or retrofit
applications. The system usually includes FGR to the burner
and to the windbox, with OFA ports installed above the top
burner row. "Primary gas" is recirculated flue gas that is
routed directly to each PG-DRB and introduced in a dedicated
zone surrounding the primary air zone in the center of the
burner. The recirculated gas inhibits the formation of
thermal and fuel NOx by reducing peak flame temperature and O2
concentration in the core of the flame. The dual air zones
surrounding the PG zone provide secondary air to control fuel
and air mixing and regulate flame shape.
In addition to the DRB XCL-PCTM burner for coal-fired
boilers, the XCL burner, as shown in figure 5-29

5-373
Figure 5-29. Axial ControlTM Flow low NOx burner for gas and oil.15

5-374
, is also available for wall-fired boilers burning natural gas
and oil.15 This design enables the use of an open windbox
(compartmental windbox is unnecessary). Air flow is
controlled by a sliding air damper and swirled by vanes in the
dual air zones.

5-375

5-376

5-377
The Swirl Tertiary SeparationTM (STS) burner for natural
gas- and oil-fired retrofits is shown in figure 5-30

5-378
Figure 5-30. Low NOx Swirl Tertiary SeparationTM
low NOx burner.85

5-379
.85 In this design, the internal staging of primary and
secondary air can be adjusted depending on required NOx
control and overall combustion performance. The ability to
control swirl of the primary and secondary air streams
independently provides flexibility in controlling flame length
and shape, and ensures flame stability under low-NOx firing
conditions. A separate recirculated flue gas stream forms a
distinct separate layer between the primary and secondary air.
This separating layer of inert flue gas delays the combustion
process, reducing peak flame temperatures and reducing the
oxygen concentration in the primary combustion zone.
Therefore, the separation layer controls both thermal and fuel
NOx formation.85
5.2.4.1.2 Tangentially-fired boilers. The
tangentially-fired Pollution MinimumTM (PM) burner is shown in
figure 5-31

5-380
Figure 5-31. Pollution MinimumTM burner for natural gas- and oil-fired boilers.83

5-381
.83 The burners are available for natural gas or oil firing.
Both designs are internally staged, and incorporate FGR within
the burners.
The gas-fired PM burner compartment consists of two fuel
lean nozzles separated by one fuel-rich nozzle. Termed "GM"
(gas mixing), this LNB system incorporates FGD by mixing a
portion of the flue gas with combustion air upstream of the
burner. When necessary, FGR nozzles are installed between two
adjacent PM burner compartments, and a portion of the
recirculated gas is injected via these nozzles.83
The oil-fired PM burner consists of one fuel nozzle
surrounded by two separated gas recirculation (SGR) and air
and GM nozzles. Within each fuel compartment a single oil gun
with a unique atomizer sprays fuel at two different spray
angles. The outer fuel spray passes through the SGR streams
produce the fuel-lean zones. The inner concentric spray
produces the fuel-rich zones between adjacent SGR nozzles.
The SGR creates a boundary between the rich and lean flame

5-382

5-383
5-384
zones, thereby maintaining the NOx reducing characteristics of
both flames.83
5.2.4.2 Factors Affecting Performance. The factors
affecting the performance of oil- and gas-fired LNB are
essentially the same as those for coal-fired LNB discussed in
section 5.1.3.2 of this document. However, the overall
success of NOx reduction with LNB may also be influenced by
fuel grade and boiler design. For example, the most
successful NOx reductions are on natural gas and light fuel
oil firing and on boilers initially designed for specific fuel
use patterns. Also, boilers originally designed with larger
furnace volumes per unit output would be more conducive to NOx
reduction with LNB than a smaller furnace.
Other factors affecting performance are the burner
atomizer design which is critical for controlling NOx and
minimizing opacity. By improving atomization quality, there
is a greater margin for variabilities in the boiler operation
and fuel properties.

5-385
5.2.4.3 Performance of Low NOx Burners. Table 5-12

5-386
TABLE 5-12. PERFORMANCE OF LNB ON U. S. NATURAL GAS- AND OIL-FIRED BOILERS
Utility
Unit
Rated
capacity
Control
Length
Capacity
tested
(%)
Uncontrolled
emissions
(lb/MMBtu)
Controlled
emissions
(lb/MMBtu)
Reduction
emissions
Reference
WALL-FIRED BOILERS, FUEL OIL
Hawaiian
Electric Co.
Kahe 6
(D)
PG-DRB
(B&W)
78
Florida Power &
Light
Port Everglades 3
(Pre)
Dynaswirl
(Todd)
86
Florida Power &
Light
Port Everglades 4
(Pre)
Dynaswirl
(Todd)
86
Jacksonville
Electric
Authority
Northside 3
(Pre)
Dual Fuel
(NEI)
87
WALL-FIRED BOILERS, NATURAL GAS
Florida Power &
Light
Port Everglades 3
(Pre)
Dynaswirl
(Todd)
86
Florida Power &
Light
Port Everglades 4
(Pre)
Dynaswirl
(Todd)
86
Southern Cal.
Edison Co.
Alamitos 5
(Pre)
100
40
0.08-0.12
0.04-0.06
0.05
0.025
38-58
38-58
88
Southern Cal.
Edison Co.
Alamitos 6
(Pre)
Dynaswirl
(Todd)
79
Jacksonville
Electric
Authority
Northside 3
(Pre)
Dual Fuel
(NEI)
87
Pre = Pre-NSPS
OEM = Original Equipment Manufacturer; B&W = Babcock & Wilcox; FW = Foster Wheeler; RS = Riley Stoker
Burner; PG-DRB = Primary Gas-Dual Register Burner; AUS = Applied Utility Systems
Vendors: B&W = Babcock & Wilcox; NEI = NEI Internal Combustion Limited; Todd = Todd Combustion.
Short = Short-term test data, i.e., hours.
Originally had OFA. Controlled emissions were with retrofit LNB only.
Value is an estimate, based on historical data.
Value is extrapolated from test data.
--Data not available.

5-387
presents data for LNB on natural gas- and oil-fired boilers.
Three oil-fired boilers (Kahe 6, Port Everglades 3 and 4) had
uncontrolled NOx emissions in the range of 0.74 to
0.81 lb/MMBtu. With LNB, the NOx was reduced to 0.51 to
0.56 lb/MMBtu which corresponds to a 28 to 35 percent
reduction. The remaining oil-fired boiler, Northside 3,
originally had OFA and was retrofit with LNB capable of
burning either oil or gas. While the LNB were intended to
accommodate the OFA, opacity exceedances occurred and the OFA
ports were closed. Therefore, it is not possible to determine
the percent reduction from this LNB retrofit.
For two wall-fired boilers firing natural gas (Port
Everglades 3 and 4), the NOx was reduced from uncontrolled
levels of 0.52 to 0.57 lb/MMBtu to approximately 0.4 lb/MMBtu
(23 to 33 percent reduction). For Alamitos 5, the NOx was
reduced 40 to 60 percent across the load range with LNB.

5-388
Alamitos 6 had higher uncontrolled NOx emissions (estimated to
be 0.9 lb/MMBtu) and was reduced 75 percent to 0.22 lb/MMBtu.
Again, it is not possible to determine the percent reduction
for Northside 3 with these data.
To summarize, LNB retrofit on wall-fired boilers firing
oil resulted in controlled NOx emissions of approximately 0.5
to 0.55 lb/MMBtu. On wall-fired boilers firing natural gas,
LNB typically resulted in controlled NOx emissions of 0.2 to
0.4 lb/MMBtu. The lower controlled NOx for the natural gas
boilers is probably a result of the lower uncontrolled
emissions.
5.2.5 Reburn
Although reburn may be applicable to oil-fired boilers,
retrofit applications have been limited to large units in
Japan. Reburning is not expected to be used on natural gas
fired units, because other techniques such as FGR, BOOS, and
OFA are effective and do not need the extensive modifications
that reburn systems may require. However, gas reburn on a
dual-fuel boiler (coal/gas) has been evaluated.
5.2.5.1 Process Description. The process description of
reburn for natural gas- or oil-fired boilers is the same as
was described for coal-fired boilers in section 5.1.5.1.
5.2.5.2 Factors Affecting Performance. The factors
affecting the performance of reburn for natural gas- or oil-
fired boilers are the same as was described for coal-fired
boilers in section 5.1.5.2. Additionally, natural gas
produces higher flue gas temperatures than when firing coal;
therefore, the heat absorption profile in the furnace may
change.
5.2.5.3 Performance of Reburn. There are no retrofits
of reburn on oil-fired utility boilers in the United States;
therefore, performance data are not available. Gas reburn has
been tested on Illinois Power's Hennepin Unit 1 while firing
natural gas as the main fuel. Hennepin Unit 1 is a 71 MW
tangential boiler capable of firing coal or natural gas. The
uncontrolled NOx emissions when firing natural gas were

5-389
approximately 0.14 lb/MMBtu at full-load and 0.12 lb/MMBtu at
60 percent load. The NOx emissions were reduced by 37 percent
at full-load to 0.09 lb/MMBtu. At reduced load, the NOx
emissions were reduced by 58 percent to 0.05 lb/MMBtu.89
5.2.6 Combinations of Combustion Controls
5.2.6.1 Process Descriptions. Large NOx reductions can
be obtained by combining combustion controls such as FGR,
BOOS, OFA, and LNB. The types of combinations applicable to a
given retrofit are site-specific and depend upon uncontrolled
levels and required NOx reduction, boiler type, fuel type,
furnace size, heat release rate, firing configuration, ease of
retrofit, and cost. The process descriptions for the
individual controls are found in section 5.1.
5.2.6.2 Factors Affecting Performance. The same basic
factors affecting the performance of individual combustion
controls will apply to these controls when they are used in
combination. Section 5.1 describes the factors affecting the
individual NOx controls.
5.2.6.3 Performance of Combination of Combustion
Modifications. Short-term data for various combinations of
NOx controls for natural gas- and oil-fired boilers are given
in table 5-13

5-390
Table 5-13

5-391
Table 5-13 concluded
5-392
. Results are given for one tangential boiler firing natural
gas, several combinations of controls on two wall-fired
boilers firing fuel oil, and several combinations on wall
boilers firing natural gas. For the tangential boiler firing
natural gas (Pittsburgh 7), the NOx emissions were reduced
from 0.95 lb/MMBtu with FGR + OFA to 0.1 lb/MMBtu at full-load
(89 percent reduction).
For Kahe 6 (with the original burners), the NOx emissions
were reduced from 0.81 lb/MMBtu with FGR + BOOS to
0.28 lb/MMBtu for a 65-percent reduction. As was shown in
sections 5.2.1.3 and 5.2.2.3 (Refer to tables 5-9 and 5-10),
BOOS alone on this unit reduced NOx to 0.50 lb/MMBtu
(38 percent) and FGR alone reduced NOx to 0.42 lb/MMBtu
(48 percent). The combination of LNB and FGR on Kahe 6

5-393

5-394
reduced the NOx emissions to 0.43 lb/MMBtu (47 percent). The
combination of LNB + OFA on Kahe 6 reduced NOx emissions to
0.28 lb/MMBtu (65 percent) and LNB + OFA + FGR reduced NOx
emissions to 0.19 lb/MMBtu (76 percent). These data show that
by combining technologies on this oil-fired boiler, NOx
emissions can be reduced by 47 to 76 percent from uncontrolled
levels. For the other oil-fired wall boiler (Contra Costa 6),
FGR + OFA reduced the NOx emissions from 0.55 to 0.19 lb/MMBtu
at full-load (65 percent reduction). These data also indicate
that combining operational modifications may reduce NOx
emissions as much as or more than combustion hardware changes
(i.e., LNB).
For two natural gas-fired boilers (Pittsburgh 6 and
Contra Costa 6), FGR + OFA reduced NOx emissions to 0.16 and
0.24 lb/MMBtu. The Pittsburgh unit had higher uncontrolled
NOx (0.9 lb/MMBtu) than the Contra Costa unit (0.55 lb/MMBtu)
and resulted in 82 percent reduction as compared to
57 percent.
For two natural gas-fired boilers (Alamitos 6 and Moss
Landing 7), combining FGR + BOOS (similar to FGR + OFA)
reduced NOx emissions to 0.08 to 0.14 lb/MMBtu (92 percent
reduction) at full-load. The combination of LNB + FGR on the
natural gas boilers reduced NOx to approximately 0.1 lb/MMBtu
on Alamitos 6 and Ormond Beach 2 (89 to 94 percent). And,
combining LNB + FGR + BOOS decreased the NOx emissions to 0.06
to 0.12 lb/MMBtu on Alamitos 6 and Ormond Beach 2
(93 percent).
To summarize, combining combustion controls on natural
gas-boilers is effective in reducing NOx emissions. However,
combining combustion controls on oil-firing is not as
effective and reductions of up to 75 percent were reported.
Whereas, reductions of up to 94 percent on natural gas-fired
boilers were reported.
5.3 FLUE GAS TREATMENT CONTROLS
Two commercially available flue gas treatment
technologies for reducing NOx emissions from existing fossil

5-395
fuel utility boilers are selective noncatalytic reduction
(SNCR) and selective catalytic reduction (SCR). Selective
noncatalytic reduction involves injecting ammonia or urea into
the flue gas to yield nitrogen and water. The ammonia or urea
must be injected into specific high-temperature zones in the
upper furnace or convective pass for this method to be
effective.92 The other flue gas treatment method, SCR,
involves injecting ammonia into the flue gas in the presence
of a catalyst. Selective catalytic reduction promotes the
reactions by which NOx is converted to nitrogen and water at
lower temperatures than required for SNCR.
5.3.1 Selective Noncatalytic Reduction
5.3.1.1 Process Description. The SNCR process involves
injecting ammonia or urea into boiler flue gas at specific
temperatures. The ammonia or urea reacts with NOx in the flue
gas to produce N2 and water.

5-396
As shown in figure 5-32

5-397
Figure 5-32. Ammonia-based SNCR.93

5-398
, for the ammonia-based SNCR process, ammonia is injected into
the flue gas where the temperature is 950 ± 30 oC (1,750 ±
90 oF).93 Even though there are large quantities of O2
present, NO is a more effective oxidizing agent, so most of
the NH3 reacts with NO by the following mechanism:94
4NH3 + 6NO 6 5N2 + 6H2O (5-14)
Competing reactions that use some of the NH3 are:
4NH3 + 5O2 6 4NO + 6H2O (5-15)
4NH3 + 3O2 6 2N2 + 6H2O (5-16)
For equation 5-14 to predominate, NH3 must be injected into
the optimum temperature zone, and the ammonia must be
effectively mixed with the flue gas. When the temperature
exceeds the optimum range, equation 5-15 becomes significant,
NH3 is oxidized to NOx, and the net NOx reduction decreases.94
If the temperature of the combustion products falls below the
SNCR operating range, the NH3 does not react and is emitted to
the atmosphere. Ammonia emissions must be minimized because

5-399
NH3 is a pollutant and can also react with sulfur oxides in
the flue gas to form ammonium salts, which can deposit on
downstream equipment such as air heaters. A small amount of
hydrogen (not enough to appreciably raise the temperature) can
be injected with the NH3 to lower the temperature range in
which SNCR is effective.

5-400
As shown in figure 5-33

5-401
Figure 5-33. Urea-based SNCR.92

5-402
, in the urea-based SNCR process, an aqueous solution of urea
(CO(NH2)2) is injected into the flue gas at one or more
locations in the upper furnace or convective pass.92 The urea
reacts with NOx in the flue gas to form nitrogen, water, and
carbon dioxide (CO2). Aqueous urea has a maximum NOx
reduction activity at approximately 930 to 1,040 oC (1,700 to
1,900 oF). Proprietary chemical enhancers may be used to
broaden the temperature range in which the reaction can occur.
Using enhancers and adjusting the concentrations can expand
the effectiveness of urea to 820-1,150 oC (1,500-2,100 oF).92
The exact reaction mechanism is not well understood
because of the complexity of urea pyrolysis and the subsequent
free radical reactions. However, the overall reaction
mechanism is:94
CO(NH2)2 + 2NO + 1/2O2 6 2N2 + CO2 + 2H2O (5-17)
Based on the above chemical reaction, one mole of urea
reacts with two moles of NO. However, results from previous
research indicate that more than stoichiometric quantities of
urea must be injected to achieve the desired level of NOx
removal.92 Excess urea degrades to nitrogen, carbon dioxide,
and unreacted NH3.
Another version of the urea-based SNCR process uses high
energy to inject either aqueous NH3 or urea solution as shown
in figure 5-34

5-403
Figure 5-34. High-energy SNCR process.95

5-404
.95 The solution is injected into the flue gas using steam or
air as a diluent at one or more specific temperature zones in
the convective pass. Additionally, methanol can be added
further in the process to reduce NH3 slip. This system is
based on the same concept as the earlier

5-405
5-406
SNCR systems except that the pressurized urea-water mixtures
are injected into the cross-flowing flue gas with high-
velocity, air-driven nozzles. High-energy urea injection is
especially applicable to units with narrow reagent injection
windows because this system provides intense flue gas mixing.95
Hardware requirements for SNCR processes include reagent
storage tanks, air compressors, reagent injection grids, and
an ammonia vaporizer (NH3-based SNCR). Injection equipment
such as a grid system or injection nozzles is needed at one or
more locations in the upper furnace or convective pass. A
carrier gas, such as steam or compressed air, is used to
provide sufficient velocity through the injection nozzles to
ensure thorough mixing of the reagent and flue gas. For units
that vary loads frequently, multi-level injection is used. A
control system consisting of a NOx monitor and a controller/
processor (to receive NOx and boiler data and to control the
amount of reagent injected) is also required.
Most SNCR experience has been on boilers less than 200 MW
in size. In larger boilers, the physical distance over which
reagent must be dispersed increases and the surface
area/volume ratio of the convective pass decreases. Both of
these factors are likely to make it more difficult to achieve
good mixing of reagent and flue gas, delivery of reagent in
the proper temperature window, and sufficient residence time
of the reagent and flue gas in that temperature window. For
larger boilers, more complex reagent injection, mixing, and
control systems may be necessary. Potential requirements for
such a system could include high momentum injection lances and
more engineering and physical/mathematical modeling of the
process as part of system design.
5.3.1.2 Factors Affecting Performance
5.3.1.2.1 Coal-fired boilers. Six factors influence the
performance of urea- or ammonia-based SNCR systems:
temperature, mixing, residence time, reagent-to-NOx ratio, and
fuel sulfur content. The NOx reduction kinetic reactions are
directly affected by concentrations of NOx. Reduced

5-407
concentrations of NOx lower the reaction kinetics and thus the
potential for NOx reductions.

5-408
As shown in figure 5-35

5-409
Figure 5-35. General effects of temperature on NOx removal.96

5-410
, the gas temperature can greatly affect NOx removal and NH3
slip.96 At temperatures below the desired operating range of
930 to 1,090 oC (1,700 to 2,000 oF), the NOx reduction
reactions begin to diminish, and unreacted NH3 emissions
(slip) increase. Above the desired temperature range, NH3 is
oxidized to NOx, resulting in low NOx reduction efficiency and
low reactant utilization.96
The temperature in the upper furnace and convective pass,
where temperatures are optimum for SNCR, depends on boiler
load, fuel, method of firing (e.g., off-stoichiometric
firing), and extent of heat transfer surface fouling or
slagging. The flue gas temperature exiting the furnace and
entering the convective pass typically may be 1,200 oC + 110
oC (2,200 oF ± 200 oF) at full load and 1,040 oC + 70 oC
(1,900 oF ± 150 oF) at half load. At a given load,
temperatures can increase by as much as 30 to 60 oC (50 to
100 oF) depending on boiler conditions (e.g., extent of
slagging on heat transfer surfaces). Due to these variations
in the temperatures, it is often necessary to inject the
reagent at different locations or levels in the convective
pass for different boiler loads.96
The second factor affecting SNCR performance is mixing of
the reagent with the flue gas. The zone surrounding each
reagent injection nozzle will probably be well mixed by the
turbulence of the injection. However, it is not possible to
mix the reagent thoroughly with the entire flue gas stream
because of the short residence time typically available.
Stratification of the reagent and flue gas will probably be a
greater problem at low boiler loads.96 Retrofit of furnaces
with two or more division walls will be difficult because the
central core(s) of the furnace cannot be treated by injection
lances or wall-mounted injectors on the side walls. This may

5-411
reduce the effectiveness of SNCR.
The third factor affecting SNCR performance is the
residence time of the injected reagent within the required
temperature window. If residence times are too short, there
will be insufficient time for completion of the desired
reactions between NOx and NH3.
The fourth factor in SNCR performance is the ratio of
reagent to NOx. Figure 5-36
5-412
NOTE: This figure is representative of one specific SNCRapplication. Actual NOx removal as a function ofmolar ratio is boiler-specific.
Figure 5-36. General effect of NH3:NOx mole ratio on NOx removal.
97

5-413
shows that at an ammonia-to-NOx ratio of 1.0, NOx reductions
of less than 40 percent are achieved.97 By increasing the
NH3:NOx ratio to 2.0:1, NOx reductions of approximately
60 percent can be obtained. Increasing the ratio beyond 3.0:1
has little effect on NOx reduction. Since NH3:NOx ratios
higher than the theoretical ratio are required to achieve the
desired NOx reduction, a trade-off exists between NOx control
and the presence of excess NH3 in the flue gas. Excess NH3
can react with sulfur compounds in the flue gas, forming
ammonium sulfate salt compounds that deposit on downstream
equipment. The higher NH3 feed rates can result in additional
annual costs. The fifth factor in SNCR performance is
the sulfur content of the fuel. Sulfur compounds in the fuel
can react with NH3 and form liquid or solid particles that can
deposit on downstream equipment. In particular, compounds
such as ammonium bisulfate (NH4HSO4) and ammonium sulfate
[(NH4)2SO4] can plug and corrode air heaters when temperatures
in the air heater fall below 260 oC (500 oF). As shown in
figure 5-37

5-414
Figure 5-37. Ammonia salt formation as a function of temperature and NH3 and SO3 concentration.
98

5-415
, given sufficient concentrations of NH3 and SO3 in the flue
gas, ammonium bisulfate or sulfate can form at temperatures
below 260 oC (500 oF).98
5.3.1.2.2 Natural Gas- and Oil-Fired Boilers. The
factors affecting the performance of SNCR on coal-fired
boilers are applicable to natural gas and oil firing. These
factors are: temperature, mixing, residence time, reagent-to-
NOx ratio, and fuel sulfur content. Because natural gas and
oil do not contain as much sulfur as coal, the fuel sulfur

5-416

5-417
content may not be as much a factor for natural gas- and
oil-fired boilers.
5.3.1.3 Performance of SNCR on Utility Boilers. The
results of SNCR applied to fossil fuel utility boilers are
shown in table 5-14.

5-418
Table 5-14

5-419
Table 5-14 continued

5-420
Table 5-14 continued

5-421
Table 5-14 continued
5-422
Table 5-14 continued

5-423
There are 2 coal-fired, 2 oil-fired, and 10 natural gas-
fired SNCR applications represented on the table. One
application is ammonia-based SNCR with the remainder being
urea-based. Available data on NH3 slip and N2O emissions
during these tests are presented in chapter 7.
For Valley 4, the NOx emissions during testing at full
load decreased as the molar ratio increased. At a molar ratio
of 0.7, the NOx emissions were 0.76 lb/MMBtu whereas a molar
ration of 1.7 resulted in NOx emissions of 0.50 lb/MMBtu. At
reduced loads, the molar ratio has the same effect on NOx
emissions. At 36 percent load, the NOx was reduced to 0.14
and 0.32 lb/MMBtu with molar ratios of 2.0 and 1.0,
respectively. At 34 percent load, the NOx was reduced to 0.35
and 0.54 lb/MMBtu with molar ratios of 2.0 and 1.0,
respectively. The higher NOx emissions at the 34 percent load
are attributed to a different burner pattern being used.
For Arapahoe 4, the NOx was reduced approximately
30 percent at full-load prior to the retrofit of LNB + OFA.
After retrofitting LNB + OFA, SNCR reduced NOx by 30-
40 percent with NH3 slip less than 20 ppm. At lower loads,
SNCR reduced NOx by 40-50 percent; however, the NH3 slip
increased to as high as 100 ppm. This was attributed to
cooled flue gas temperatures at low loads; however, the system
is still being optimized and tested.
Long-term data from one subpart Da stoker boiler shows
controlled NOx emissions of approximately 0.3 lb/MMBtu with
NH3 slip of less than 25 ppm. Baseline NOx levels from this
facility was not reported; however, data from another
subpart Da stoker facility shows baseline levels of
0.4-0.6 lb/MMBtu.
For the Port Jefferson oil-fired boiler, the NOx
emissions were 0.14 to 0.17 lb/MMBtu at full-load and 0.15 to

5-424

5-425

5-426

5-427
5-428
0.21 lb/MMBtu at minimum load depending on the molar ratio.
Higher molar ratios of 1.5 and 2.0 resulted in NOx removals of
up to 56 percent at full and reduced load. The NH3 slip at an
NSR of 1.0 was 20 to 40 parts per million (ppm). Further
experimentation to reduce the NH3 slip at this site is
planned.
For the tangentially-fired natural gas boilers with
urea-based SNCR, the NOx emissions at full-load range from
0.06 to 0.08 lb/MMBtu. At lower loads, the NOx emissions
range from 0.03 lb/MMBtu to 0.05 lb/MMBtu. The NOx reductions
for these boilers ranged from 0 to 42 percent. While the
results varied from station-to-station for the same boiler
type, sister units at the same station generally achieved a
similar reduction. Ammonia slip for these boilers was 6 to
17 ppm.
The results were similar for the wall-fired boilers
firing natural gas. The NOx was reduced on El Segundo 1 and 2
to less than 0.1 lb/MMBtu across the load range with an NH3
slip of less than 75 ppm. At Morro Bay 3, both a urea-based
and an NH3-based SNCR system were tested. Both of these
systems reduced the NOx by 30 to 40 percent across the load
range, depending on the molar ratio. However, the ammonia
slip was 10 to 20 ppm lower for the ammonia-based SNCR system
than the urea-based SNCR. The relatively high NH3 slip levels
are thought to be due to the relatively short residence times
in the convection section cavities. The NH3 slip is reported
in chapter 7.
The effect of increasing the molar N to NO ratio on
percent NOx reduction is shown in figures 5-38

5-429
reduction vs. Molar N/NO ratio for conventional
U. S. coal-fired boilers with SNCR.
5-430
reduction vs. Molar N/NO ratio for conventional
U. S. natural gas- and oil-fired boilers with SNCR.
and 5-39 for coal-fired and for natural gas- or oil-fired

5-431
boilers, respectively. As shown in these figures, percent NOx
reduction increases with increasing molar N/NO ratio.
However, as molar ratio is increased the amount of slip will
also increase. Further, above a molar ratio of approximately
1.0 to 1.5, only slight increases in NOx reduction are
generally seen. Thus, applications of SNCR must be optimized

5-432

5-433
for effective reagent use.
5.3.1.4 Performance of SNCR on Fluidized Bed Boilers.
Short-term results of SNCR on seven fluidized bed boilers are

5-434
given in table 5-15.
5-435
-BASED SNCR ON U. S. FLUIDIZED BED
COMBUSTION BOILERS Years
online
Rated
capacity
(MW)
Coal
Capacity
tested
(MMBtu/hr)
Length
of test
(hrs)
emissions
Reference
BUBBLING FLUIDIZED BED
109
109
CIRCULATING FLUIDIZED BED
Ultrapower
Constellation
Operating Services
110
Ultrapower
Constellation
Operating Services
110
111
Applied Energy
Services
112
Applied Energy
Services
112
Bituminous
Unknown

5-436
Two of the boilers are bubbling bed and five are circulating
bed. All of these boilers utilize ammonia-based SNCR systems.
The NOx emissions from the Stockton A and B bubbling fluidized
bed boilers were 0.03 lb/MMBtu at full-load. The NOx
emissions from the circulating fluidized bed boilers ranged
from 0.03 to 0.1 lb/MMBtu at full-load conditions. The
average NOx emissions from these five boilers were 0.08
lb/MMBtu.
5.3.2 Selective Catalytic Reduction
5.3.2.1 Process Description. Selective catalytic
reduction involves injecting ammonia into boiler flue gases in
the presence of a catalyst to reduce NOx to N2 and water. The
catalyst lowers the activation energy required to drive the
NOx reduction to completion, and therefore decreases the
temperature at which the reaction occurs. The overall SCR
reactions are:113
4NH3 + 4NO + O2 6 4N2 + 6H2O (5-18)
8NH3 + 6NO2 6 7N2 + 12H2O (5-19)
There are also undesirable reactions that can occur in an SCR
system, including the oxidation of NH3 and SO2 and the
formation of sulfate salts. Potential oxidation reactions
are:114
4NH3 + 5O2 6 4NO + 6H2O (5-20)
4NH3 + 3O2 6 2N2 + 6H2O (5-21)
2NH3 + 2O2 6 N2O + 3H2O (5-22)
2SO2 + O2 6 2SO3 (5-23)
The reaction rates of both desired and undesired reactions
increase with increasing temperature. The optimal temperature
5-437
range depends upon the type of catalyst and an example of this
effect is shown in figure 5-40

5-438
Figure 5-40. Relative effect of temperature on NOx reduction.
115

5-439
.115

5-440
Figure 5-41

5-441
Figure 5-41. Possible configurations for SCR.116

5-442
shows several SCR configurations that have been applied to
power plants in Europe or Japan.116 The most common
configurations are diagrams 1a and 1b, also referred to as
"high dust" and "low dust" configurations, respectively.
Diagrams 1c and 1d represent applications of spray drying with
SCR. Diagrams 1a through 1d are called "hot-side" SCR because
the reactor is located before the air heater. Diagram 1e is
called "cold-side" SCR because the reactor is located
downstream of the air heaters, particulate control, and flue
gas desulfurization equipment.117
A new type of SCR system involves replacing conventional
elements in a Ljungstrom air heater with elements coated with
catalyst material. As shown in figure 5-42

5-443
118

5-444
, the flue gas passes through the air heater where it is
cooled, as in a standard Ljungstrom air heater.118 The
catalyst-coated air heater elements serve as the heat transfer
surface as well as the NOx catalyst. The NH3 required for the
SCR process is injected in the duct upstream of the air
heater. Because this type of SCR has a limited amount of
space in which catalyst can be installed, the NOx removal is
also limited. However, replacing the air heater elements with
catalyst material would require no major modifications to the
existing boiler and may be applicable to boilers with little
available space for add-on controls. While this technique has
been used in Germany, there is only one installation in the
United States on a natural gas- and oil-fired boiler in
California.119
The hardware for a hot-side or cold-side SCR system
includes the catalyst material; the ammonia system--including
a vaporizer, storage tank, blower or compressor, and various
valves, indicators, and controls; the ammonia injection grid;
the SCR reactor housing (containing layers of catalyst);
transition ductwork; and a continuous emission monitoring
system. Anhydrous or dilute aqueous ammonia can be used;

5-445

5-446

5-447
however, aqueous ammonia is safer to store and handle. The
control system can be either feed-forward control (the inlet
NOx concentration and a preset NH3/NOx ratio are used), feed-
back control (the outlet NOx concentration is used to tune the
ammonia feed rate), or a combination of the two.
The catalyst must reduce NOx emissions without producing
other pollutants or adversely affecting equipment downstream
of the reactor. To accomplish this, the catalyst must have
high NOx removal activity per catalyst unit size, tolerance to
variations in temperature due to boiler load swings, minimal
tendency to oxidize NH3 to NO and SO2 to SO3, durability to
prevent poisoning and deactivation, and resist erosion by fly
ash.
The SCR catalyst is typically composed of the active
material, catalyst support material, and the substrate. The
active compound promotes the NH3/NOx reaction and may be
composed of a precious metal (e.g., Pt, Pd), a base metal
oxide, or a zeolite. The entire catalyst cannot be made of
these materials because they are expensive and structurally
weak. The catalyst support (usually a metal oxide) provides a
large surface area for the active material, thus enhancing the
contact of the flue gas with the active material. The
mechanical form that holds the active compound and catalyst
support material is called the substrate. The individual
catalyst honeycombs or plates are combined into modules, and
the modules are applied in layers. Figure 5-43

5-448
Figure 5-43. Typical configuration for a catalyst reactor.120
5-449
shows a typical configuration for a catalyst reactor.120
Figure 5-44

5-450
Figure 5-44. Example of optimum temperature range for different types of catalysts.115
5-451
shows examples of relative optimum temperature ranges for
precious metal, base metal, and zeolite catalysts.115
Some manufacturers offer homogeneous extruded monolithic
catalysts that consist of either base metal oxide or zeolite
formulations. The specific formulations contain ingredients
that have mechanical strength and are stable. These catalysts
are comparable in price to composite catalyst and have been
installed in Europe and Japan.121

5-452

5-453
The precious metal catalysts are typically platinum (Pt)
or palladium (Pd) based. They are primarily used in clean
fuel applications and at lower temperatures than the base
metal oxides or zeolite catalysts. The NOx reduction
efficiency of precious metal catalysts is reduced above 400 oC
(750 oF) because the NH3 oxidation reaction is favored.115
The most common commercially available base metal oxide
catalysts are vanadium/titanium based, with vanadium pentoxide
(V2O5) used as the active material and titanium dioxide (TiO2)
or a titanium oxide-silicon dioxide (SiO2) as the support
material.122 Vanadium oxides are among the best catalysts for
SCR of nitric oxide with ammonia because of their high
activity at low temperatures (<400 oC [<750 oF]) and because
of their high resistance to poisoning by sulfur oxides.123
The zeolite catalysts are crystalline aluminosilicate
compounds. These catalysts are characterized by
interconnected systems of pores 2 to 10 times the size of NO,
NH3, SO2, and O2 molecules. They absorb only the compounds
with molecular sizes comparable to their pore size. The
zeolite catalyst is reported to be stable over a wider
temperature window than other types of catalyst.
The SCR catalyst is usually offered in extruded honeycomb
or plate configurations as shown in figure 5-45

5-454
Figure 5-45. Configuration of parallel flow catalyst.124

5-455
.124 Honeycomb catalysts are manufactured by extruding the
catalyst-containing material through a die of specific channel
and wall thickness. The pitch, or number of open channels,
for coal-fired applications is larger than the pitch for oil
or natural gas applications due to the increased amount of
particulate matter with coal-firing. Plate catalysts are
manufactured by pressing a catalyst paste onto a perforated
plate or by dipping the plate into a slurry of catalyst
resulting in a thin layer of catalyst material being applied
to a metal screen or plate.

5-456

5-457
5.3.2.2 Factors Affecting Performance
5.3.2.2.1 Coal-fired boilers. The performance of an SCR
system is influenced by six factors: flue gas temperature,
fuel sulfur content, NH3/NOx ratio, NOx concentration at the
SCR inlet, space velocity, and catalyst condition.
Temperature greatly affects the performance of SCR
systems, and, as discussed earlier, each type of SCR catalyst
has an optimum operating temperature range. Below this range,
NOx reduction does not occur, or occurs too slowly, which
results in NH3 slip. Above the optimum temperature, the NH3
is oxidized to NOx, which decreases the NOx reduction
efficiency. The optimum temperature will depend on the type
of catalyst material being used.
The second factor affecting the performance of SCR is the
sulfur content of the fuel. Approximately 1 to 4 percent of
the sulfur in the fuel is converted to SO3. The SO3 can then
react with ammonia to form ammonium sulfate salts, which
deposit and foul downstream equipment. As can be seen in
figure 5-46

5-458
Figure 5-46. Effect of temperature on conversionof SO2 to SO3.
125

5-459
, the conversion of SO2 to SO3 is temperature dependent, with
higher conversion rates at the higher temperatures.125 The
temperature-sensitive nature of SO2 to SO3 conversion is
especially important for boilers operating at temperatures
greater than 370 oC (700 oF) at the economizer outlet.
Potential reaction equations for ammonium sulfate salts are:126
NH3 (gas) + SO3 (gas) + H2O (gas) 6 NH4HSO4 (liquid) (5-24)
NH4HSO4 (liquid) + NH3 (gas) 6 (NH4)2 SO4 (solid) (5-25)
2 NH3 (gas) + SO3 (gas) + H2O (gas) 6 (NH4)2 SO4 (solid) (5-26)
With the use of medium- to high-sulfur coals, the
concentration of SO3 will likely be higher than experienced in
most SCR applications to date. This increase in SO3
concentration has the potential to affect ammonium sulfate
salt formation. However, there is insufficient SCR

5-460
application experience with medium- to high-sulfur coals to
know the nature of the effects. Applications of SCR with
medium- to high-sulfur coals may need to incorporate ways to
minimize the impacts of ammonium sulfate salt formation and
deposition.
The third factor affecting SCR performance is the ratio
of NH3 to NOx. For NOx reduction efficiencies up to
approximately 80 percent, the NH3-NOx reaction follows
approximately 1:1 stoichiometry. To achieve greater NOx
removal, it is necessary to inject excess NH3, which results
in higher levels of NH3 slip.
The fourth factor affecting SCR performance is the
concentration of NOx at the SCR inlet. The NOx reduction is
relatively unchanged with SCR for inlet NOx concentrations of
150 to 600 ppm.127 However, at inlet concentrations below
150 ppm, the reduction efficiencies decrease with decreasing
NOx concentrations.128
The fifth factor affecting SCR performance is the gas
flow rate and pressure drop across the catalyst. Gas flow
through the reactor is expressed in terms of space velocity
and area velocity. Space velocity (hr-1) is defined as the
inverse of residence time. It is determined by the ratio of
the amount of gas treated per hour to the catalyst bulk
volume. As space velocity increases, the contact time between
the gas and the catalyst decreases. As the contact time
decreases, so does NOx reduction. Area velocity (ft/hr) is
related to the catalyst pitch and is defined as the ratio of
the volume of gas treated per hour to the apparent surface
area of the catalyst. At lower area velocities, the NOx in
the flue gas has more time to react with NH3 on the active
sites on the catalyst; at higher area velocities, the flue gas
has less time to react.129
The sixth factor affecting SCR performance is the
condition of the catalyst material. As the catalyst degrades
over time or is damaged, NOx removal decreases. Catalyst can
be deactivated from wear resulting from attrition, cracking,

5-461
or breaking over time, or from fouling by solid particle
deposition in the catalyst pores and on the surface.
Similarly, catalyst can be deactivated or "poisoned" when
certain compounds (such as arsenic, lead, and alkali oxides)
react with the active sites on the catalyst. Poisoning
typically occurs over the long term, whereas fouling can be
sudden. When the maximum temperature for the catalyst
material is exceeded, catalysts can be thermally stressed or
sintered, and subsequently deactivated. As the catalyst
degrades by these processes, the NH3/NOx ratio must be
increased to maintain the desired level of NOx reduction.
This can result in increased levels of NH3 slip. However, the
greatest impact of degradation is on catalyst life. Because
the catalyst is a major component in the cost of SCR, reducing
the life of the catalyst has a serious impact on the cost.
The top layer of catalyst is typically a "dummy" layer of
catalyst used to straighten the gas flow and reduce erosion of
subsequent catalyst layers. A metal grid can also be used as
a straightening layer. The dummy layer is made of inert
material that is less expensive than active catalyst
material.130 Active catalyst material can be replaced as
degradation occurs in several different ways in order to
maintain NOx removal efficiency. First, all the catalyst may
be replaced at one time. Second, extra catalyst may be added
to the reactor, provided extra space has been designed into
the reactor housing for this purpose. Third, part of the
catalyst may be periodically replaced, which would extend the
useful life of the remaining catalyst.
5.3.2.2.2 Oil and natural gas-fired boilers. The
factors affecting the performance of SCR on coal-fired boilers
are generally applicable to natural gas- and oil-firing.
However, the effect may not be as severe on the natural
gas- and oil-fired applications.
The six factors affecting SCR performance on coal-fired
boilers were: flue gas temperature, fuel sulfur content,
NH3/NOx ratio, NOx concentration at the SCR inlet, space
5-462
velocity, and catalyst condition. Of these, the fuel sulfur
content will not be as much a factor in natural gas and oil
firing applications because these fuels do not contain as much
sulfur as coal. Therefore, there will not be as much SO3 in
the flue gas to react with excess ammonia and deposit in
downstream equipment.
Another parameter which will not have as much impact in
natural gas- or oil-fired boilers is the condition of the
catalyst material. The SCR catalyst material can still be
damaged by sintering or poisoned by certain compounds.
However, since natural gas- and oil-fired boilers do not have
as much fly ash as coal-fired boilers, the pores in the
catalyst will not plug as easily and the surface of the
catalyst would not be scoured or eroded due to the fly ash
particles.
5.3.2.3 Performance of Selective Catalytic Reduction.
Table 5-16

5-463
TABLE 5-16. PERFORMANCE OF SCR ON U. S. UTILITY BOILERS
Unit
Fuel
Type
SCR
slip
(ppm)
ratio
Reduction
Reference
PILOT-SCALE SYSTEMS
NY State Elec. &
Gas
<1
<1
0.8
0.8
131
Tennessee Valley
Authority
0.8
0.8
132
0.8
0.8
133
FULL-SCALE SYSTEMS
Southern California
Edison
Huntington
Beach 2
134
Type: Cold = Cold-side, post-FGD SCR, after air preheater; and Hot = Hot-side, high-dust
SCR, before air preheater
Results are given for two different catalysts.
; catalyst exposure time = 7,800 hours
; catalyst exposure time = 2,400 hours.
; catalyst exposure time = 3,600 to 14,000 hours.
; catalyst exposure time = 1,500 to 7,700 hours.

5-464
presents the results from pilot-scale SCR installations at
two coal-fired boilers and one oil-fired boiler. The SCR
pilot plants are equal to approximately 1 to 2 MW and process
a slip-stream of flue gas from the boiler. Each pilot plant
contained two different catalysts that were evaluated
simultaneously. As of 1993, these pilot plants had been
operating 2-3 years.
For the coal-fired SCR demonstration projects, the
results indicate that 75-80 percent NOx reduction has been
achieved with ammonia slip of less than 20 ppm. The lower NOx
reduction and higher NH3 slip for the oil-fired demonstration
at the Oswego site were measured at higher-than-design space
velocities. Note that these results are pilot facilities in
which operating and process parameters can be carefully
controlled.
To date, there are no full-scale SCR applications on oil-
or coal-firing. However, as shown in table 5-16, Southern

5-465
California Edison has a commercial size installation of SCR on
their gas-fired Huntington Beach Unit 2 boiler. The NOx
reduction reported was approximately 90 percent with the
highest level of NH3 slip at 40 ppm.
The effect of catalyst exposure time and space velocity
on catalyst performance was also examined for each of the
pilot-scale demonstrations. Figures 5-47a

5-466
Figure 5-47a. Extruded catalyst NOx conversion and residual NH3 versus NH3-to-NOx Ratio.
131
Figure 5-47b. Replacement composite catalyst NOx conversion and residual NH3 versus NH3-to-NOx Ratio.
131
5-467
and 5-47b show NOx removal and NH3 slip as a function of
NH3/NOx ratio for two catalysts in a cold-side, post-FGD SCR
demonstration at the Kintigh site.130 The results show no
change in the activity of either the extruded catalyst after
7,800 hours of operation or the replacement composite catalyst
after 2,400 hours of operation. Each catalyst controlled NOx
emissions by 80 percent at an NH3/NOx ratio of 0.8 with a
corresponding NH3 slip of < 1 ppm.131

5-468
Figures 5-48a
5-469
Figure 5-48a. V/Ti catalyst ammonia slip and NOx removalversus ammonia-to-NOx ratio.132
Figure 5-48b. Zeolite catalyst ammonia slip and NOx removalversus ammonia-to-NOx ratio.132
5-470
and 5-48b show performance results for two catalysts in the
high-dust SCR demonstration at the Shawnee site.132 The
figures show a decrease in catalyst activity and an increase
in residual NH3 with increasing hours of operation for both
catalysts. This deterioration in catalyst activity is more
pronounced for the zeolite catalyst as shown in figure 5-
48b.132

5-471
Figures 5-49a

5-472
Figure 5-49a. T1O2 corrugated plate catalyst NOx conversion and residual NH3 versus NH3-to-NOx ratio.
133
Figure 5-49b. Vanadium titanium extruded catalyst NOx conversion and residual NH3 versus NH3-to-NOx ratio.
133
5-473
and 5-49b show the performance results for the two catalysts
evaluated in the SCR application on the oil-fired boiler at
the Oswego plant.133 In each figure, the curves show the
effect of space velocity on NOx reduction as a function of
NH3/NOx ratio. The effect of space velocity on NH3 slip is
also shown in the figures. The results show the expected
decrease in NOx reduction and increase in NH3 slip at the
higher space velocity for both catalysts. The effect is more
pronounced on the V/Ti catalyst.133
5.3.3 Selective Noncatalytic Reduction and Combustion
Controls
5.3.3.1 Process Description. Combustion controls such
as LNBs and OFA may be used in combination with SNCR to reduce

5-474

5-475

5-476
NOx emissions on fossil fuel-fired utility boilers to achieve
high levels of NOx reduction. It may also be possible to
employ operational modifications such as LEA, BOOS, and FGR to
provide additional reductions in NOx prior to the SNCR system.
The process descriptions for combustion controls for
coal-fired boilers are presented in section 5.1 and combustion
control descriptions for natural gas- and oil-fired boilers
are presented in sections 5.2. Selective noncatalytic
reduction is described in section 5.3.1.
5.3.3.2 Factors Affecting Performance. The same basic
factors affecting the performance of individual combustion
controls or SNCR will apply to these controls used in
combination. However, since SNCR requires specific operating
conditions such as gas temperature and residence time, the
range of operating conditions for the combustion controls may
be severely reduced if the combustion controls and SNCR system
are designed incorrectly. When combining LNB + OFA + SNCR,
some systems may be designed to achieve more NOx reduction
with the LNB + OFA and use SNCR to "trim" NOx to desired
levels. There are a very limited number of boilers employing
a combination of these controls; therefore, all the factors
affecting performance have not yet been identified.
The factors affecting the individual combustion controls
for coal-, natural gas- and oil-fired applications are given
in sections 5.1 and 5.2. The factors affecting SNCR are
presented in section 5.3.2.
5.3.3.3 Performance of Combustion Controls and Selective
Noncatalytic Reduction. There is one application of LNB + OFA
+ SNCR on a coal-fired boiler at Public Service Company of
Colorado's Arapahoe Station Unit 4. This is a 100 MW roof-
fired boiler. Short-term data from this unit is given in
Table 5-17
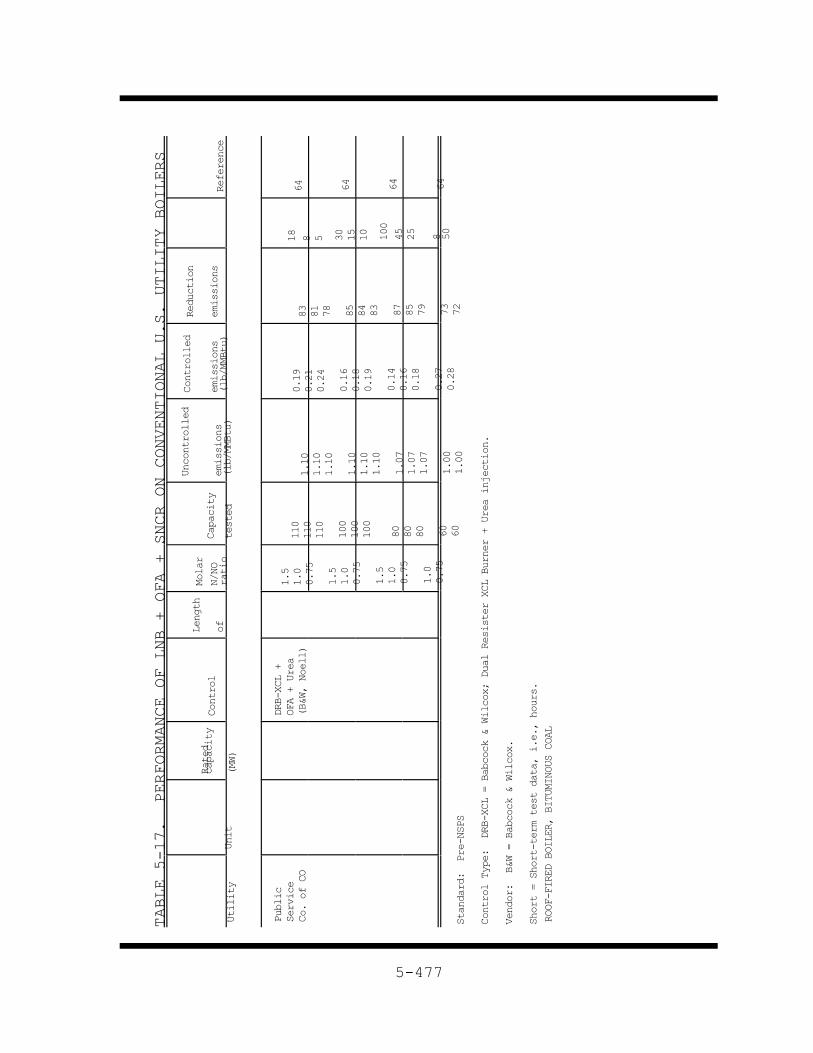
5-477
TABLE 5-17. PERFORMANCE OF LNB + OFA + SNCR ON CONVENTIONAL U.S. UTILITY BOILERS
Utility
Unit
Rated
capacity
(MW)
Control
Length
of
Molar
N/NO
ratio
Capacity
tested
Uncontrolled
emissions
(lb/MMBtu)
Controlled
emissions
(lb/MMBtu)
Reduction
emissions
Reference
ROOF-FIRED BOILER, BITUMINOUS COAL
Public
Service
Co. of CO
DRB-XCL +
OFA + Urea
(B&W, Noell)
1.5
1.0
0.75
110
110
110
1.10
1.10
1.10
0.19
0.21
0.24
838178
18
8 5
64
1.5
1.0
0.75
100
100
100
1.10
1.10
1.10
0.16
0.18
0.19
858483
301510
64
1.5
1.0
0.75
808080
1.07
1.07
1.07
0.14
0.16
0.18
878579
100
4525
64
1.0
0.75
6060
1.00
1.00
0.27
0.28
7372
8 50
64
Standard: Pre-NSPS
Control Type: DRB-XCL = Babcock & Wilcox; Dual Resister XCL Burner + Urea injection.
Vendor: B&W = Babcock & Wilcox.
Short = Short-term test data, i.e., hours.

5-478
. The predicted NOx reduction for LNB + OFA + SNCR was
70 percent; however, reported reductions have been
70-85 percent.
As was discussed in section 5.1.4.3.1, the LNB + OFA
educed NOx emissions across the load range by 60-70 percent.

5-479
The addition of SNCR reduced NOx an additional 30-40 percent
across the load range making a total reduction of
approximately 70-85 percent.
The NH3 slip was lowest (5-20 ppm) at 110 MW where the
flue gas temperature are the highest. As the load and thus
flue gas temperature are lowered, the NH3 slip increases to as
high as 100 ppm.
5.3.4 Selective Catalytic Reduction and Combustion Controls
5.3.4.1 Process Description. Combustion controls such
as OFA + LNB can be used in combination with SCR to reduce NOx
emissions on fossil fuel-fired utility boilers to achieve the
highest level of NOx reduction. It may also be possible to
use operational modifications such as LEA and BOOS, and FGR to
reduce NOx prior to the SCR reactor.
The process descriptions for combustion controls for
coal-fired boilers are given in section 5.1 and the process
descriptions for combustion controls for natural gas- and oil-
fired boilers are presented in section 5.2. Selective
catalytic reduction is described in section 5.3.2.
5.3.4.2 Factors Affecting Performance of Combustion
Controls and Selective Catalytic Reduction. The same basic
factors affecting the performance of individual combustion
controls or SCR will apply to these controls used in
combination. However, since SCR requires very rigid operating
conditions such as flue gas temperature and gas flow rate, the
range of operating conditions for the combustion controls may
be severely reduced. There are very few boilers employing a
combination of these controls; therefore, all the factors
affecting performance have not yet been identified.
The factors affecting the individual combustion controls
for coal-fired applications and natural gas- and oil-fired
applications are given in sections 5.1 and 5.2. The factors
affecting SCR are presented in section 5.3.2.
5.3.4.3 Performance of Combustion Controls and Selective
Catalytic Reduction. There are no known retrofits of SCR on
utility boilers that also have combustion controls.

5-480
5.4 REFERENCES
1. Letter and attachments from Smith, J.R., Houston Lightingand Power, to Hamilton, Randy, Texas Air Control Board.September 22, 1992. Discussion of NOx ReasonablyAvailable Control Technology.
2. Letter from Cichanowicz, J.E., EPRI, to Bradley, Michael,NESCAUM, and Neuffer, William J., EPA. November 21,1991. Comments on draft NESCAUM Report.
3. Lim, K. J., Waterland, L. R., Castaldini, C., Chiba, Z.,and E. B. Higginbotham. Environmental Assessment ofUtility Boiler Combustion Modification NOx Controls: Vol. 1. Technical Results. U.S. EnvironmentalProtection Agency. Research Triangle Park, NC. Publication No. EPA 600/7-80-075a. April 1980. p. 4-24.
4. Levy, E., et al. NOx Control and PerformanceOptimization Through Boiler Fine-Tuning. Presented at the1993 Joint Symposium on Stationary Combustion NOxControl. Miami Beach, FL. May 24-27, 1993.
5. Letter and attachments from Riggs, R. H., TennesseeValley Authority, to Neuffer, W. J., EnvironmentalProtection Agency. September 2, 1993. Comments on thedraft Alternative Control Techniques Document.
6. Natason, P. S., Vaccaro, R. M., Ferraro, J. M., andD. G. Lachapelle. Long-Term Corrosion and EmissionStudies of Combustion Modification Effects at Coal-FiredUtility Boilers. In Proceedings: 1985 Joint Symposiumon Stationary Combustion NOx Control. Vol. 1. U.S.Environmental Protection Agency. Research Triangle Park,N.C. Publication No. EPA/600/9-86-021a, pp. 33-1 through33-18.
7. Kokkinos, A., Lewis, R. D., and D. G. Lachapelle. LowNOx Coal-Firing System Demonstration Results on aTangentially Fired Boiler. In Proceedings: 1985 JointSymposium on Stationary Combustion NOx Control. Vol. 1. U. S. Environmental Protection Agency. Research TrianglePark, NC. Publication No. EPA/600/9-86/021a. pp. 13-1through 13-22.
8. Letter and attachments from Emmel, T. E., RadianCorporation, to Kosim, Z., U. S. Environmental ProtectionAgency. July 11, 1993.

5-481
9. Lisauskas, R. A., et al. Development of Overfire AirDesign Guidelines for Front-Fired Boilers. InProceedings: 1987 Joint Symposium on Stationary SourceCombustion NOx Control. Vol. 1. U. S. EnvironmentalProtection Agency. Research Triangle Park, NC. Publication No. EPA/600/9-88/026b. pp. 8-1 through 8-23.
10. Vatsky, J, et al. Development of an Ultra-Low NOxPulverized Coal Burner. Presented at the 1991 JointSymposium on Stationary Combustion NOx Control. Washington, DC. March 25-28, 1991.
11. May, T. J. Gas Reburn Demonstration Results at theHennepin Power Plant. Presented at the 1992 EPRIConference on NOx Controls for Utility Boilers. Cambridge, MA. July 7-9, 1992.
12. Letter and attachments from Hardman, R. R., SouthernCompany Services, to Harrison, C., Hunton and Williams. November 9, 1992. Questionnaire response from Hammond 4.
13. Letter and attachments from Hardman, R. R., SouthernCompany Services, to Stamey-Hall, S., Radian Corporation. March 9, 1993. Long-Term Data.
14. Letter and attachments from Cater, C. H., Allegheny PowerSystems, to Carney, P. G., New York State Electric andGas Corporation. April 13, 1992. Clean Air ActAmendments of 1990, Title I - NOx Control.
15. Larue, A. D., et al. NOx Control Update - 1989. InProceedings: 1989 Joint Symposium on StationaryCombustion NOx Control. Vol. 1. U. S. EnvironmentalProtection Agency. Research Triangle Park, NC. Publication No. EPA-600/9-89-062a. pp. 4-17 through4-35.
16. Way, K., Allen, A., and F. Franco. Results from aUtility-Scale Installation of ABB CE Services' RO-II LowNOx, Wall-Fired Burners. Presented at the 1993 JointSymposium on Stationary Combustion NOx Control. MiamiBeach, FL. May 24-27, 1993.
17. Briggs, O. G., A Total Combustion Systems Approach Proves Successful for NOx Control for Two SteamGenerators. Presented at the American Power Conference,April 1991.

5-482
18. Donais, R. E., et al. 1989 Update on NOx EmissionControl Technologies at Combustion Engineering. InProceedings: 1989 Joint Symposium on StationaryCombustion NOx Control. Vol. 1. U. S. EnvironmentalProtection Agency. Research Triangle Park, NC. Publication No. EPA-600/9-89-062a. pp. 4-37 through4-56.
19. Letter and attachments from Hardman, R.R., SouthernCompany Services, to Harrison, C., Hunton and Williams. November 9, 1992. Questionnaire response from LansingSmith 2.
20. Manaker, A. M., Babb, R. A., and J. L. Golden. Update ofTVA's NOx Compliance Program. Presented at the 1993 JointSymposium on Stationary Combustion NOx Control. MiamiBeach, FL. May 24-27, 1993.
21. Questionnaire response from Kanary, D. A., Ohio EdisonCo., Edgewater 4. 1993.
22. Letter and attachments from Hardman, R. R., SouthernCompany Service, to Harrison, C., Hunton and Williams. November 9, 1992. Questionnaire response from Gaston 2.
23. Lisauskas, R. A., and A. H. Rawden. Status of NOxControls for Riley Stoker Wall-Fired and Turbo-FiredBoilers. Presented at the 1982 Joint Symposium onStationary Combustion NOx Control. November 1-4, 1982.
24. Manaker, A. M., and R. E. Collins. Status of TVA's NOxCompliance Program. Presented at the 1992 EPRIConference on NOx Controls for Utility Boilers. Cambridge, MA. July 7-9, 1992.
25. Letter and attachments from Riggs, R. H., TennesseeValley Authority to Harrison, C. S., Hunton and Williams. November 2, 1992. NOx information collection request -Colbert 3 and Johnsonville 8.
26. Questionnaire response from Linhart, W. J., MonongahelaPower Co. Pleasants 2. 1993.
27. Sanyal, A., Sommer, T. M., and C. C. Hong. Low NOxBurners and Gas Reburning - An Integrated Advanced NOxReduction Technology. Presented at the 1993 JointSymposium on Stationary Combustion NOx Control. MiamiBeach, FL. May 24-27, 1993.
28. Questionnaire from Allen, C., Arizona Public Service.Four Corners 3. 1993.
5-483
29. Vatsky, J. NOx Control: The Foster Wheeler Approach. In Proceedings: 1989 EPRI Joint Symposium on StationaryCombustion NOx Control. Vol. 1. U. S. EnvironmentalProtection Agency. Research Triangle Park, NC. Publication No. EPA-600/9-89-062a. pp. 4-1 through 4-17.
30. Letter and attachments from Brownell, F. W., Hunton andWilliams, to Neuffer, W. J., U. S. EnvironmentalProtection Agency. December 1, 1992. Informationcollection request from Consumers Power -J. H. Campbell 3.
31. Questionnaire response from Allen, C., Arizona PublicService. Four Corners 4 and 5. 1993.
32. Letter and attachments from Moore, D., Dayton Power andLight Co., to Harrison, C., Hunton and Williams. November 20, 1992. Information collection request fromJ. M. Stuart Station.
33. Laursen, T. A., et al. Results of the Low NOx CellTM
Burner Demonstration at Dayton Power & Light Company'sJ.M. Stuart Station Unit No. 4. Presented at the 1993Joint Symposium on Stationary Combustion NOx Control. Miami Beach, FL. May 24-27, 1993.
34. Letter and attachments from Smith, A. E., NorthernIndiana Public Service Company to Harrison, C., Hunton &Williams. December 1, 1992. Response to NOx InformationRequest of October 29, 1992 for R. M. Schahfer 17 and 18.
35. Questionnaire response from Hunter, J., Tampa ElectricCompany. Big Bend 4. 1993.
36. Questionnaire response from Chaplin, M. C., SouthCarolina Public Service Authority. Cross 2. 1993.
37. Letter and attachments from Scherrer, C. R., MuscatinePower and Water, to Kanary, D. A, Ohio Edison Company. December 2, 1992. Response to NOx Information CollectionRequest of November 5, 1992 for Muscatine 9.
38. Questionnaire response from Bentley, J., Lower ColoradoRiver Authority. Fayette 3. 1993.
39. Questionnaire response from Smith, J. R., HoustonLighting & Power Company. W. A. Parrish 8. 1993.
40. Questionnaire response from Smith, J. R., HoustonLighting & Power Company. Limestone 1 and 2. 1993.

5-484
41. Letter and attachments from Sandefur, M. L., SouthernIndiana Gas and Electric Company, to Kanary, D., OhioEdison. March 8, 1993. NOx information collectionrequest for A. B. Brown 2.
42. Letter and attachments from Marshall, G., PacificCorporation, to Harrison, C. S., Hunton and Williams. December 14, 1992. Information collection request forHunter 3.
43. Questionnaire response from Hicks, R. F., Orlando UtilityCommission - C. H. Stanton 1. 1993.
44. Letter and attachments from Brownell, W. F., Hunton andWilliams, to Eddinger, J. A., U. S. EnvironmentalProtection Agency. December 18, 1992. Response to NOxinformation request - Brandon Shore Unit 1.
45. Letter and attachments from Brownell, W. F., Hunton andWilliams, to Eddinger, J. A., U. S. EnvironmentalProtection Agency. December 18, 1992. Response to NOxinformation request - Brandon Shore Unit 2.
46. Questionnaire response from Giese, J., Los Angeles Dept.of Water & Power. Intermountain 1 and 2. 1993.
47. Letter and attachments from Huff, B. L., Cincinnati Gas &Electric Company, to Harrison, C. S., Hunton andWilliams. December 7, 1992. Response to NOx informationrequest - Zimmer 1.
48. Questionnaire response from Ewing, D., Nevada PowerCompany - Reid Gardner 4. 1993.
49. Letter and attachments from Todd, D. L., Big RiversElectric Corporation, to Harrison, C. S., Hunton andWilliams. March 5, 1993. NOx information collectionrequest for D. B. Wilson 1.
50. Letter and attachments from Linville, C., SunflowerElectric Power Corporation, to Harrison, C., Hunton andWilliams. February 25, 1993. NOx information collectionrequest for Holcomb 1.
51. Letter and attachments from Lewis, P. E., Colorado - UteElectric Association, to Kanary, D. A., Ohio EdisonCompany. December 8, 1992. Response to NOx informationrequest for Craig 3.
52. Questionnaire response from Dawes, S., Sierra PacificPower Company. North Valley 2. 1993.

5-485
53. Questionnaire response from Jeansonne, D., Central LAElectric Company. Dolet Hills 1. 1993.
54. Sorge, J. N. Wall-Fired Low-NOx Burner Test Results fromthe Innovative Clean Coal Technology Project at GeorgiaPower's Plant Hammond Unit 4. Presented at the 1992 EPRIConference on NOx Controls for Utility Boilers. Cambridge, MA. July 7-9, 1992.
55. Hardman, R. R., Smith, L. L., and S. Tavoulareas. Results from the ICCT T-Fired Demonstration ProjectIncluding the Effect of Coal Fineness on NOx Emissionsand Unburned Carbon Levels. Presented at the 1993 JointSymposium on Stationary Combustion NOx Control. MiamiBeach, FL. May 24-27, 1993.
56. Questionnaire response from Fox, M., Public Service Co.of Colorado - Valmont 5. 1993.
57. Questionnaire response from Fox, M., Public Service Co.of Colorado - Cherokee 4. 1993.
58. Smith R. C. LNCFS Level III Low NOx Burner RetrofitLabadie Unit 4. Presented at the 1992 EPRI Conference onNOx Controls for Utility Boilers. Cambridge, MA. July 7-9, 1992.
59. Grusha, J., and M.S. McCartney. Development andEvolution of the ABB Combustion Engineering low NOxConcentric Firing System. ABB Combustion Engineering. Publication TIS 8551.
60. Kramer, E. D., Smith, B. L., and J. Urich. ParametricNOx Results of Low NOx Burner Configurations. Presentedat the 1993 Joint Symposium on Stationary Combustion NOxControl. Miami Beach, FL. May 24-27, 1993.
61. Sorge, J. N., et al. The Effects of Low NOx Combustionon Unburned Carbon Levels in Wall-Fired Boilers.Presented at the 1993 Joint Symposium on StationaryCombustion NOx Control. Miami Beach, FL. May 24-27,1993. Hammond LNB + OFA, Gaston.
62. Questionnaire response from Kanary, D., Ohio EdisonCompany - Sammis 6. 1993.
63. Dresner, K. J., Piechocki, M. A., and A. D. LaRue. LowNOx Combustion System Retrofit for a 630 MWe PC-FiredCell Burner Unit. Presented at the 1993 Joint Symposiumon Stationary Combustion NOx Control. Miami Beach, FL. May 24-27, 1993.

5-486
64. Hunt, T., et al. Selective Non-Catalytic OperatingExperience Using Both Urea and Ammonia. Presented at the1993 Joint Symposium on Stationary Combustion NOxControl. Miami Beach, FL. May 24-27, 1993.
65. Questionnaire response from Michigan South Central PowerAgency - Endicott Jr. Unit 1. 1993.
66. Questionnaire response from Steinlen, J., SeminoleElectric Coop, Inc. - Seminole 1. 1993.
67. Gas Reburning Technology Review. Gas Research Institute. Chicago, IL. July 1991. pp. 2-4 through 2-6.
68. Farzan, H. and R. A. Wessel. Mathematical andExperimental Pilot-Scale Study of Coal Reburning for NOxControl in Cyclone Boilers. Topical Report. U. S. Department of Energy. Report DOE/PC/89659-2. pp. 2-1 through 2-4.
69. A. S. Yagiela, et al. (1991). Update on Coal ReburningTechnology for Reducing NOx in Cyclone Boilers. Presented at the 1991 Joint Symposium on StationaryCombustion NOx Control. Washington, DC. March 25-28,1991.
70. Lewis R. D., Kwasnik, A. F., Doherty, C. A., and P. E.Tempero. Gas Co-Firing: Application to a Tangentially-Fired Boiler. Presented at the 1993 Joint Symposium onStationary Combustion NOx Control. Miami Beach, FL. May 24-23, 1993.
71. Questionnaire response from Dieriex, R., Illinois PowerCompany - Hennepin 1. 1993.
72. Folsom, B., et al. Reducing Stack Emissions by GasFiring in Coal-Designed Boilers -- Field EvaluationResults. Presented at the 1993 Joint Symposium onStationary Combustion NOx Control. Miami Beach, FL. May 24-27, 1993.
73. Letter and attachments from Eirschele, G., WisconsinPower and Light Company, to Jordan, B. C.,U. S. Environmental Protection Agency. March 19, 1993. Response to NOx emissions information collection request- Nelson Dewey.
74. Newell, R., et al. Coal Reburning Application on aCyclone Boiler. Presented at the 1993 Joint Symposium onStationary Combustion NOx Control. Miami Beach, FL. May 24-27, 1993.
5-487
75. Questionnaire response from Kanary, D. A., Ohio EdisonCompany - Niles 1. 1993.
76. Clean Coal Technology Demonstration Program. ProgramUpdate 1991. U. S. Department of Energy. DOE/FE-0247P. February 1992.
77. Quartucy, G. C., et al. Application of Fuel Biasing forNOx Emission Reduction In Gas-Fired Utility Boilers. InProceedings: 1987 Joint Symposium on Stationary SourceCombustion NOx Control. Vol. 2. U. S. EnvironmentalProtection Agency. Research Triangle Park, NC. Publication No. EPA/600/9-88/026b. pp. 41-1 through41-22.
78. Yee, J. L. B., Giovanni, D. V., and M. W. McElroy. Retrofit of an Advanced Low-NOx Combustion System atHawaiian Electric's Oil-Fired Kahe Generating Station. In Proceedings: 1989 Joint Symposium on StationaryCombustion NOx Control. Vol. 2. U. S. EnvironmentalProtection Agency. Research Triangle Park, NC. Publication No. EPA/600/9-89/062b. pp. 9-1 through 9-18.
79. deVolo, N. B., et al. NOx Reduction and OperationalPerformance of Two Full-Scale Utility Gas/Oil BurnerRetrofit Installations. Presented at the 1991 JointSymposium on Stationary Combustion NOx Control,Washington, DC. March 25-28, 1991.
80. Letter and attachments from Smith, J. R., HoustonLighting & Power, to Neuffer, W., U. S. EnvironmentalProtection Agency. October 16, 1992. Influence ofdesign fuel on utility boiler configurations and NOxcharacteristics.
81. Mazzi, E. A., et al. Demonstration of Flue GasRecirculation for NOx Control on a Natural Gas-Fired320 MW Tangential Boiler. Presented at the 1993 JointSymposium on Stationary Combustion NOx Control. MiamiBeach, FL. May 24-27, 1993.
82. Letter and attachments from Smith, J. R., HoustonLighting & Power, to Neuffer, W., U. S. EnvironmentalProtection Agency. December 15, 1992. NOx RACTdiscussion.
83. ROPM Burner for Oil and Gas Wall Fired GeneratingFacilities. Combustion Engineering. PublicationPIB 103. 1993.
84. Peabody ISCTM Low NOx Burners. Peabody Engineering. Bulletin No. ISC-1. 1993.
5-488
85. Lisauskas, R. A., and C. A. Penterson. An Advanced Low-NOx Combustion System for Gas and Oil Firing. Presentedat the 1991 Joint Symposium on Stationary Combustion NOxControl. Washington, DC. March 25-28, 1991.
86. Price, J. V., Kuretski, Jr., J. J., and E. S. Schindler. Retrofit of Low NOx Oil/Gas Burners to Two 400 MW UtilityBoilers, and the Effects on Overall Emissions and BoilerPerformance. In Proceedings: Power-Gen '92. Volumes 11and 12. Orlando, FL. November 17-19, 1992.
87. Letter and attachments from Kappelmann, R. L.,Jacksonville Electric Authority to Harrison, C., Huntonand Williams. February 8, 1993. Questionnaire responsefor Northside 3.
88. Johnson, L., Negra, S., and F. Ghoreishi. SCR NOxRemoval on 4 x 480 MW Gas-Fired Boilers. Presented atthe 1993 Joint Symposium on Stationary Combustion NOxControl. Miami Beach, FL. May 24-27, 1993.
89. Angello, L. C., Marquez, A., and C. C. Hong (Energy andEnvironmental Research Corporation). Evaluation ofGas/Coal Cofiring and Gas/Gas Reburning for EmissionsControl on a Tangentially-Fired Boiler. Prepared for GasResearch Institute. Chicago, IL. Publication No. GRI-93/0154. March 1993. pp. 4-1 through 4-10.
90. Letter and attachments from Strehlitz, F. W., Pacific Gas& Electric Co., to Neuffer, W. J., U. S. EnvironmentalProtection Agency. March 26, 1993. Response to Section114 information collection request -- Pittsburgh 6 and 7,Contra Costa 6, Moss Landing 7, and Morro Bay 3.
91. Bisonett, G. L., and M. McElroy. Comparative Assessmentof NOx Reduction Techniques for Gas- and Oil-FiredUtility Boilers. Presented at the 1991 Joint Symposiumon Stationary Combustion NOx Control. Washington, DC. March 25-28, 1991.
92. Epperly, W. R., et al. Control of Nitrogen OxidesEmissions from Stationary Sources. Presented at theAnnual Meeting of the American Power Conference, April1988.
93. Letter and attachments from Haas, G. A., Exxon Researchand Engineering Co., to Gundappa, M., Radian Corporation. May 1, 1992. Information concerning Thermal DeNOx.

5-489
94. Cato, G. A., Maloney, K. L., and J. G. Sotter. ReferenceGuideline for Industrial Boilers Manufacturers to ControlPollution with Combustion Modification. U. S. Environmental Protection Agency. Research TrianglePark, NC. Publication No. EPA-600/8-77-003b. pp. 49-51. November 1977.
95. Jones, D. G., et al. Preliminary Test Results HighEnergy Urea Injection DeNOx on a 215 MW Utility Boiler.Presented at the 1991 Joint Symposium on StationaryCombustion NOx Control. Washington, DC. March 25-28,1991.
96. Technical and Economic Feasibility of Ammonia-BasedPostcombustion NOx Control. Electric Power ResearchInstitute. Report No. EPRI CS2713. November 1982. pp. 3-18 to 3-25.
97. Ref. 96. p. 3-7.
98. Ref. 96. p. 3-9.
99. Hoffman, J. E., et al. Post Combustion NOx Control forCoal-Fired Utility Boilers. Presented at the 1993 JointSymposium on Stationary Combustion NOx Control. MiamiBeach, FL. May 24-27, 1993.
100. SNCR NOx Control Demonstration, Wisconsin Electric PowerCompany. Valley Power Plant, Unit 4. March 1992. NalcoFuel Tech.
101. Letter and attachments from Welsh, M. A., ElectricGeneration Association, to Eddinger, J. A.,U. S. Environmental Protection Agency. November 18,1993. NOx emission data from stoker units.
102. Teetz, R. D., Stallings, J. W., O'Sullivan, R. C.,Shore, D. E., Sun, W.H., and L.J. Muzio. Urea SNCRDemonstration at Long Island Lighting Company's PortJefferson Unit 3. Presented at the 1992 EPRI NOx Controlfor Utility Boilers Workshop. Cambridge, MA. July 7-9,1992.
103. Shore, D. E., et al. Urea SNCR Demonstration at LongIsland Lighting Company's Port Jefferson Station. Unit 3. Presented at the 1993 Joint Symposium onStationary Combustion NOx Control. Miami Beach, FL. May 24-27, 1993.
5-490
104. Mansour, M. N., Nahas, S. N., Quartucy, G. C.,Nylander, J. H., Kerry, H. A., Radak, L. J., Eskinazi,D., and T. S. Behrens. Full-Scale Evaluation of UreaInjection for NO Removal. In Proceedings: 1987 JointSymposium on Stationary Combustion NOx Control. Vol. 2. U. S. Environmental Protection Agency. Research TrianglePark, NC. Publication No. EPA/600/9-88/026b. pp. 43-1through 43-23.
105. Springer, B. Southern California Edison's Experiencewith SNCR with SNCR for NOx Control. Presented at the1992 EPRI NOx Control for Utility Boilers Workshop. Cambridge, MA. July 7-9, 1992.
106. Letter and attachments from Brownell, F. W., and C. S.Harrison, Hunton and Williams, to Neuffer, W. J.,U. S. Environmental Protection Agency. February 10,1993. Information Collection Request - Alamitos 4.
107. Letter and attachments from Brownell, F. W., and C. S.Harrison, Hunton and Williams, to Neuffer, W. J.,U. S. Environmental Protection Agency. February 10,1993. Information Collection Request - El Segundo 1and 3.
108. Teixeira, D. P., Lin, C. I., Jones, D. G.,Steinberger, J., Himes, R. M., Smith, R. A.,Muzio, L. J., and S. Okazaki. Full-Scale Tests of SNCRTechnology on a Gas-Fired Boiler. Presented at the 1992EPRI NOx Controls for Utility Boilers Workshop. Cambridge, MA. July 7-9, 1992.
109. Questionnaire response from Recor, R. A., POSDEF PowerCo., L.P. Stockton A and B. 1993.
110. Letter and attachments from Barber, D. E., UltrapowerConstellation Operating Services, to Jordan, B. C.,U. S. Environmental Protection Agency. December 17,1992. Information Collection Request - Rio Bravo Jasminand Rio Bravo Poso.
111. Questionnaire response from Hess, T., Stockton Cogen -Stockton Cogen. 1993.
112. Letter and attachments from Cooper, T., AES BarbersPoint, Inc., to Jordan B. C., U. S. EnvironmentalProtection Agency. December 23, 1992. InformationCollection Request from Barbers Point A and B.
113. Bosch, H. and F. Janssen. Catalytic Reduction ofNitrogen Oxides, A Review on the Fundamentals andTechnology. Catalysis Today. Vol 2. p. 392-396. April 1987.

5-491
114. Heck, R. M., Bonacci, J. C., and J. M. Chen. CatalyticAir Pollution Controls Commercial Development ofSelective Catalytic Reduction for NOx. Presented at the80th Annual meeting of the Air Pollution ControlAssociation. June 1987.
115. Ref. 114. p. 4-17.
116. Robie, C. P., Ireland, P. A., and J. E. Cichanowicz. Technical Feasibility and Economics of SCR NOx Control inUtility Applications. In Proceedings: 1989 JointSymposium on Stationary Combustion NOx Control. Vol. 2. U. S. Environmental Protection Agency. Research TrianglePark, NC. Publication No. EPA-600/9-89-062b. pp. 6A-105through 6A-124.
117. Cichanowicz, J. E., and G. Offen. Applicability ofEuropean SCR Experience to U. S. Utility Operation. InProceedings: 1987 Joint Symposium on StationaryCombustion NOx Control. Vol. 2. U. S. EnvironmentalProtection Agency. Research Triangle Park, NC. Publication No. EPA/600/9-88/026b. pp. 28-1 through28-18.
118. Johnson, L. Nitrogen Oxides Emission Reduction Project. Presented at the 1991 Joint Symposium on StationaryCombustion NOx Control. Washington, DC. March 25-28,1991.
119. Rundstrom, D. A., and J. L. Reece. Catalyst air heaterretrofit reduces NOx emissions. Power Engineering. 96:38-40. August 1992.
120. Hjalmarsson, A. K. NOx Control Technologies for CoalCombustion. IEA Coal Research, p. 44. June 1990.
121. Letter and attachments from Wax, M. J., Institute ofClean Air Companies, to Neuffer, W. J., U. S.Environmental Protection Agency. August 20, 1993. Comments on draft ACT Document.
122. Ref. 113, pp. 459-462.
123. Chen, J. P., Buzanowski, M. A., Yang, R. T., andJ. E. Cichanowicz. Deactivation of the Vanadia Catalystin the Selective Catalytic Reduction Process. Journal ofthe Air Waste Management Association, 40:1403-1409,October 1990.
124. Ref. 120, pp. 40-53.

5-492
125. Rummenhohl, V., Weiler, H., and W. Ellison. ExperienceSheds Light on SCR O&M issues. Power Magazine.136:35-36. September 1992.
126. Damon, J. E., et al. Updated Technical and EconomicReview of Selective Catalytic NOx Reduction Systems. InProceedings: 1987 Joint Symposium on StationaryCombustion NOx Control. Vol. 2. U. S. EnvironmentalProtection Agency. Research Triangle Park, NC. Publication No. EPA/600/9-88/026b. pp. 32-1 through32-21.
127. Ref. 96. pp. 5-23, 5-24.
128. Jung, H. J., et al. Vanadia/Ceria - Alumina Catalyst forSelective Reduction of Nitric Oxide from Gas TurbineExhaust. Johnson Matthey, Catalytic Systems Division. Wayne, PA. pp. 1 through 14. 1993.
129. Ref. 113, pp. 495-499.
130. Telecon. Campobenedetto, E. J., Babcock and Wilcox, withSusan Stamey-Hall, Radian Corporation. September 28,1992. Discussion of SCR catalyst.
131. Janik, G., Mechtenberg, A., Zammit, K., and E.Cichanowicz. Status of Post-FGR SCR Pilot Plant Tests onMedium Sulfur Coal at the New York State Electric and GasKintigh Station. Presented at the 1993 Joint Symposiumon Stationary Combustion NOx Control. Miami, FL. May 24-27, 1993.
132. Huang, C. M., et. al. Status of SCR Pilot Plant Tests onHigh Sulfur Coal at Tennessee Valley Authority's ShawneeStation. Presented at the 1993 Joint Symposium onStationary Combustion NOx Control. Miami, FL. May 24-27, 1993.
133. Guest, M., et. al. Status of SCR Pilot Plant Tests onHigh Sulfur Fuel Oil at Niagara Mohawk's Oswego Station. Presented at the 1993 Joint Symposium on StationaryCombustion NOx Control. Miami, FL. May 24-27, 1993.
134. Southern California Edison Research Division, SystemPlanning and Research Department. Selective CatalyticReduction DeNOx Demonstration Test Huntington BeachUnit 2. June 1988.
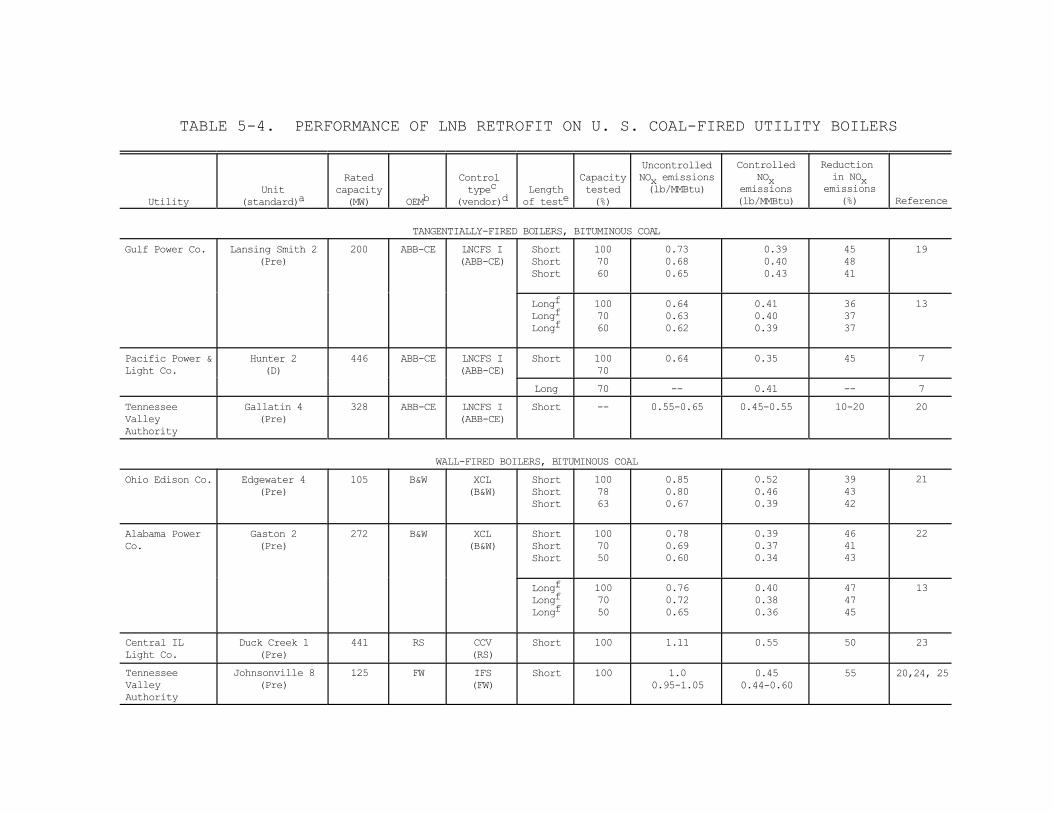
TABLE 5-4. PERFORMANCE OF LNB RETROFIT ON U. S. COAL-FIRED UTILITY BOILERS
UtilityUnit
(standard)a
Ratedcapacity(MW) OEMb
Control typec
(vendor)dLengthof teste
Capacitytested(%)
UncontrolledNOx emissions(lb/MMBtu)
ControlledNOx
emissions(lb/MMBtu)
Reduction in NOx
emissions(%) Reference
TANGENTIALLY-FIRED BOILERS, BITUMINOUS COAL
Gulf Power Co. Lansing Smith 2(Pre)
200 ABB-CE LNCFS I(ABB-CE)
ShortShortShort
1007060
0.730.680.65
0.390.400.43
454841
19
Longf
Longf
Longf
1007060
0.640.630.62
0.410.400.39
363737
13
Pacific Power &Light Co.
Hunter 2(D)
446 ABB-CE LNCFS I(ABB-CE)
Short 10070
0.64 0.35 45 7
Long 70 -- 0.41 -- 7
TennesseeValleyAuthority
Gallatin 4(Pre)
328 ABB-CE LNCFS I(ABB-CE)
Short -- 0.55-0.65 0.45-0.55 10-20 20
WALL-FIRED BOILERS, BITUMINOUS COAL
Ohio Edison Co. Edgewater 4(Pre)
105 B&W XCL(B&W)
ShortShortShort
1007863
0.850.800.67
0.520.460.39
394342
21
Alabama PowerCo.
Gaston 2(Pre)
272 B&W XCL(B&W)
ShortShortShort
1007050
0.780.690.60
0.390.370.34
464143
22
Longf
Longf
Longf
1007050
0.760.720.65
0.400.380.36
474745
13
Central ILLight Co.
Duck Creek 1(Pre)
441 RS CCV(RS)
Short 100 1.11 0.55 50 23
TennesseeValleyAuthority
Johnsonville 8(Pre)
125 FW IFS(FW)
Short 100 1.00.95-1.05
0.450.44-0.60
55 20,24, 25

TABLE 5-4. PERFORMANCE OF LNB RETROFIT ON U. S. COAL-FIRED UTILITY BOILERS (Continued)
UtilityUnit
(standard)a
Ratedcapacity(MW) OEMb
Control typec
(vendor)dLengthof teste
Capacitytested(%)
UncontrolledNOx emissions(lb/MMBtu)
ControlledNOx
emissions(lb/MMBtu)
Reduction in NOx
emissions(%) Reference
WALL-FIRED BOILERS, BITUMINOUS COAL (Continued)
TennesseeValleyAuthority
Colbert 3(Pre)
200 B&W IFS(FW)
Short 100 0.77 0.40 48 25
Long -- -- 0.45 -- 5
Georgia PowerCo.
Hammond 4(Pre)
500 FW CF/SF(FW)
ShortShort
10060
1.201.00
0.650.50
5050
12
Longf
Longf
Longf
1008060
1.231.090.98
0.690.570.47
444852
13
MonogahelaPower Co.
Pleasants 2(Da)
626 FW CF/SF(FW)
ShortShortShort
1008472
0.95----
0.450.330.34
53----
14
Longg -- -- 0.33-0.45 -- 26
Board of PublicUtilities
Quindaro 2(D)
137 RS RO-II(ABB-CE)
Short 907055
------
0.530.510.45
------
16
WALL-FIRED BOILERS, SUBBITUMINOUS COAL
Public ServiceCo. of CO
Cherokee 3(Pre)
172 B&W IFS(FW)
Short 90 0.73 0.50 31 27
Arizona PublicService Co.
Four Corners 3(Pre)
253 FW CF/SF(FW)
ShortShort
10070
----
0.580.51
----
28
Longf -- -- 0.45-0.60 -- 28
Public ServiceCo. of NM
San Juan 1(Pre)
361 FW CF/SF(FW)
Short 100 0.95 0.40 58 29

TABLE 5-4. PERFORMANCE OF LNB RETROFIT ON U. S. COAL-FIRED UTILITY BOILERS (Concluded)
UtilityUnit
(standard)a
Ratedcapacity(MW) OEMb
Control typec
(vendor)dLengthof teste
Capacitytested(%)
UncontrolledNOx emissions(lb/MMBtu)
ControlledNOx
emissions(lb/MMBtu)
Reduction in NOx
emissions(%) Reference
WALL-FIRED BOILERS, SUBBITUMINOUS COAL (Continued)
Consumers PowerCo.
J.H. Campbell 3(D)
778 FW CF/SF(FW)
Short 100 0.58-0.60h 0.39-0.46h 30-41 30
Longg 80-100 0.38-0.60 0.40-0.60 -- 30
Arizona PublicService Co.
Four Corners 4i
(Pre)818 B&W CF/SF
(FW)ShortShortShort
1037050
1.150.980.67
0.490.700.62
57297
31
Longg -- -- 0.5-0.65 -- 31
Arizona PublicService Co.
Four Corners 5i
(Pre)818 B&W CF/SF
(FW)Short 93 1.15 0.57 50 31
Longg -- -- 0.5-0.65 -- 31
Board of PublicUtilities
Quindaro 2(D)
137 RS RO-II(ABB-CE)
Short 907055
------
0.350.270.28
------
16
CELL BOILERS, BITUMINOUS COAL
Dayton Power &Light Co.
JM Stuart 4(Pre)
610 B&W LNCB(B&W)
ShortShortShort
1007557
1.220.920.70
0.550.420.37
555447
32, 33
aStandard: D = Supart D; Da = Subpart Da; and Pre = Pre-NSPSbOEM = Origianl Equipment Manufactuer; ABB-CE = Asea Brown Boveri - Combustion Engineering; B&W = Babcock & Wilcox; FW = Foster Wheeler; and RS = Riley Stoker. cType Control: CCV = Controlled Combustion Venturi Low NOx Burner; CF/SF = Controlled Flow/Split Flame Low NOx Burner; IFS = Internal FuelStaged Low NOx Burner; LNCB = Low NOx Cell Burner; LNCFSI = Low NOx Concentric Firing System, Level I, with close-coupled overfire air; and XCL = Axial Controlled Low NOx BurnerdVendor: Vendor of NOx control. Refer to note "b". eLong = Long-term CEM data, i.e., 2-6 months. Short = Short-term test data, i.e., hours.fLong = Mean value of hourly averages for 2-6 months.gLong = Range of hourly averages.hUncontrolled emissions are with OFA and controlled NOx emissions are with LNB alone. iOriginally 3-nozzle cell burner that has had burner pattern changed to standard opposed-wall configuration.-- = Data not available

TABLE 5-5. PERFORMANCE OF LNB ON NEW U. S. COAL-FIRED UTILITY BOILERS
UtilityUnit
(standard)aYearonline
Ratedcapacity(MW) OEMb
Controltypec
(vendor)d
Lengthof test(hrs)
Capacitytested(%)
NOxemissions(lb/MMBtu) Reference
TANGENTIALLY-FIRED BOILERS, BITUMINOUS COAL
N. Indiana PublicService Co.
R.M. Schahfer 17(Da)
1983 393 ABB-CE LNB/CCOFA(ABB-CE)
625
957958
0.430.420.60
34
N. Indiana PublicService Co.
R.M. Schahfer 18(Da)
1986 393 ABB-CE LNB/CCOFA(ABB-CE)
556
967051
0.410.290.50
34
Tampa Electric Co. Big Bend 4(Da)
1985 455 ABB-CE LNB/CCOFA(ABB-CE)
-- 96 0.41 35
S. Carolina PublicService
Cross 2(Da)
1984 500 ABB-CE LNB/CCOFA(ABB-CE)
111
1009592
0.510.520.50
36
TANGENTIALLY-FIRED BOILERS, SUBBITUMINOUS COAL
Muscatine Power & Water Muscatine 9(Da)
1983 161 ABB-CE LNB/CCOFA(ABB-CE)
424
1077040
0.380.440.66
37
Lower CO RiverAuthority
Fayette 3(Da)
1988 440 ABB-CE LNB/CCOFA(ABB-CE)
6 97 0.42 38
Houston Lighting &Power Co.
W.A. Parrish 8(Da)
1982 615 ABB-CE LNB/CCOFA(ABB-CE)
-- 98 0.35 39
TANGENTIALLY-FIRED BOILERS, LIGNITE COAL
Houston Lighting &Power Co.
Limestone 1(Da)
1985 810 ABB-CE LNB/CCOFA(ABB-CE)
-- 100 0.48 40
Houston Lighting &Power Co.
Limestone 2(Da)
1986 810 ABB-CE LNB/CCOFA(ABB-CE)
-- 97 0.46 40

TABLE 5-5. PERFORMANCE OF LNB ON NEW U. S. COAL-FIRED UTILITY BOILERS (Continued)
UtilityUnit
(standard)aYearonline
Ratedcapacity(MW) OEMb
Controltypec
(vendor)d
Lengthof test(hrs)
Capacitytested(%)
NOxemissions(lb/MMBtu) Reference
WALL-FIRED BOILERS, BITUMINOUS COAL
Southern Indiana Gas &Electric
AB Brown 2(Da)
1986 265 B&W DRB(B&W)
6 91 0.39 41
Utah Power & Light Hunter 3(Da)
1983 430 B&W DRB(B&W)
10 100 0.39 42
Orlando UtilityCommission
CH Stanton 1(Da)
1987 464 B&W LNB(B&W)
8 100 0.42 43
Baltimore Gas &Electric
Brandon Shores 1(Da)
1984 670 B&W DRB (B&W)
3 100 0.50 44
Baltimore Gas &Electric
Brandon Shores 2(Da)
1991 670 B&W DRB (B&W)
3 100 0.52 45
Los Angeles Dept. ofWater & Power
Intermountain 1(Da)
1986 900 B&W DRB(B&W)
422
947148
0.330.300.29
46
Cincinnati Gas &Electric
Zimmer 1(Da)
1991 1300 B&W DRB(B&W)
3 107 0.40 47
Nevada Power Co. Reid Gardner 4(Da)
1983 301 FW CF/SF(FW)
6 100 0.28 48
Big River ElectricCorp.
DB Wilson 1(Da)
1986 440 FW CF/SF(FW)
4 11165
0.40.33
49
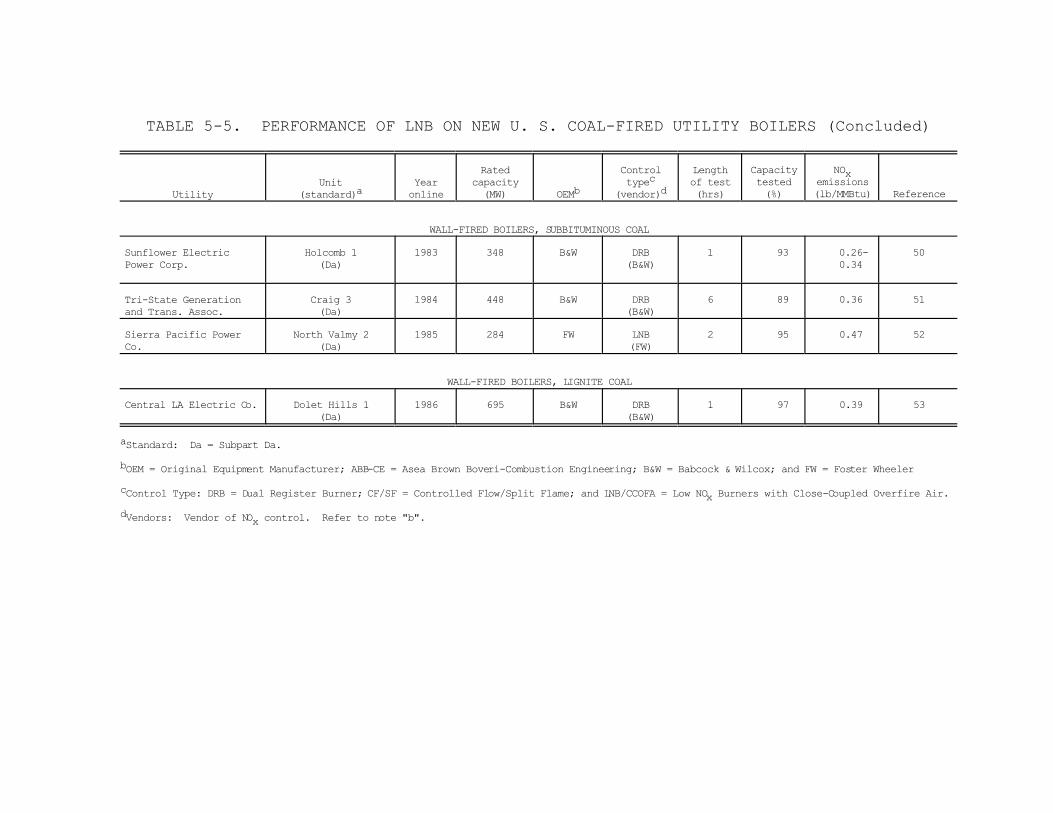
TABLE 5-5. PERFORMANCE OF LNB ON NEW U. S. COAL-FIRED UTILITY BOILERS (Concluded)
UtilityUnit
(standard)aYearonline
Ratedcapacity(MW) OEMb
Controltypec
(vendor)d
Lengthof test(hrs)
Capacitytested(%)
NOxemissions(lb/MMBtu) Reference
WALL-FIRED BOILERS, SUBBITUMINOUS COAL
Sunflower ElectricPower Corp.
Holcomb 1(Da)
1983 348 B&W DRB(B&W)
1 93 0.26-0.34
50
Tri-State Generationand Trans. Assoc.
Craig 3(Da)
1984 448 B&W DRB(B&W)
6 89 0.36 51
Sierra Pacific PowerCo.
North Valmy 2(Da)
1985 284 FW LNB(FW)
2 95 0.47 52
WALL-FIRED BOILERS, LIGNITE COAL
Central LA Electric Co. Dolet Hills 1(Da)
1986 695 B&W DRB(B&W)
1 97 0.39 53
aStandard: Da = Subpart Da.
bOEM = Original Equipment Manufacturer; ABB-CE = Asea Brown Boveri-Combustion Engineering; B&W = Babcock & Wilcox; and FW = Foster Wheeler
cControl Type: DRB = Dual Register Burner; CF/SF = Controlled Flow/Split Flame; and LNB/CCOFA = Low NOx Burners with Close-Coupled Overfire Air.
dVendors: Vendor of NOx control. Refer to note "b".

TABLE 5-6. PERFORMANCE OF LNB + OFA RETROFIT ON U. S. COAL-FIRED UTILITY BOILERS
UtilityUnit
(standard)a
Ratedcapacity(MW) OEMb
Control typec
(vendor)dLengthof teste
Capacitytested(%)
UncontrolledNOx
emissions(lb/MMBtu)
ControlledNOx
emissions(lb/MMBtu)
Reduction in NOx
emissions(%) Reference
TANGENTIALLY-FIRED BOILERS, BITUMINOUS COAL
Public ServiceCo. of CO
Valmont 5(Pre)
165 ABB-CE LNCFS II(ABB-CE)
ShortShortShort
1067350
0.660.651.03
0.320.480.75
522627
56
Gulf Power Co. Lansing Smith 2(Pre)
200 ABB-CE LNCFS II(ABB-CE)
ShortShortShort
1007060
0.730.680.65
0.400.400.38
454141
19
LongLongLong
1007060
0.640.630.62
0.410.390.40
363835
13, 55
Public ServiceCo. of CO
Cherokee 4(Pre)
350 ABB-CE LNCFS II(ABB-CE)
ShortShortShort
1007043
0.520.450.51
0.280.310.33
463135
57
Gulf Power Co. Lansing Smith 2(Pre)
200 ABB-CE LNCFS III(ABB-CE)
ShortShortShort
1007060
0.730.680.65
0.360.340.32
515051
19
LongLongLong
1007060
0.640.630.62
0.340.340.37
484739
13, 55

TABLE 5-6. PERFORMANCE OF LNB + OFA RETROFIT ON U. S. COAL-FIRED UTILITY BOILERS(Continued)
UtilityUnit
(standard)a
Ratedcapacity(MW) OEMb
Control typec
(vendor)dLengthof teste
Capacitytested(%)
UncontrolledNOx
emissions(lb/MMBtu)
ControlledNOx
emissions(lb/MMBtu)
Reduction in NOx
emissions(%) Reference
TANGENTIALLY-FIRED BOILERS, BITUMINOUS/SUBBITUMINOUS BLEND
Union ElectricCo.
Labadie 4(Pre)
620 ABB-CE LNCFS III(ABB-CE)
ShortShortShort
1006025
0.690.500.54
0.450.450.45
351017
58
TANGENTIALLY-FIRED BOILERS, SUBBITUMINOUS COAL
Kansas Powerand Light Co.
Lawrence 5(Pre)
448 ABB-CE PM + OFA(CE-MHI)
Short 80 0.49 0.25 49f 59
LongLong
5033
0.470.49
0.190.14
6071
59
PSI Energy Inc. Gibson 1(Pre)
668 FW Atlas +OFA
Short 100 1.20-1.30 0.74-0.80 ~38 60
PSI Energy Inc. Gibson 3(D)
668 FW Atlas +OFA
Short 100 0.55-0.80 0.34-0.50 ~38 60
WALL-FIRED BOILER, BITUMINOUS COAL
Georgia PowerCo.
Hammond 4(Pre)
500 FW CF/SF +AOFA
Short 9060
1.201.00
0.50.5
5850
61

TABLE 5-6. PERFORMANCE OF LNB + OFA RETROFIT ON U. S. COAL-FIRED UTILITY BOILERS(Concluded)
UtilityUnit
(standard)a
Ratedcapacity(MW) OEMb
Control typec
(vendor)dLengthof teste
Capacitytested(%)
UncontrolledNOx
emissions(lb/MMBtu)
ControlledNOx
emissions(lb/MMBtu)
Reduction in NOx
emissions(%) Reference
WALL-FIRED BOILER, BITUMINOUS COAL (Continued)
Ohio Edison Co. W.H. Sammis 6(Pre)
623 B&W DRB-XCL +SOFA(B&W)
Short 9658
1.14-1.400.49
0.33-0.350.31
60-7037
62, 63
ROOF-FIRED BOILER, SUBBITUMINOUS
Public ServiceCo. of CO
Arapahoe 4(Pre)
100 B&W DRB-XCL +OFA(B&W)
Short 1008060
1.101.071.00
0.350.330.40
686960
64
aStandard: Pre = Pre-NSPS
bOEM = Original Equipment Manufacturer. ABB-CE = Asea Brown Boveri - Combustion Engineering; B&W = Babcock and Wilcox; FW = Foster Wheeler.
cControl Type: DRB-XCL + SOFA = Dual Register-Axial Control with Separated Overfire Air; LNCFS II = Low NOx Concentric Firing System, Level II,with separated overfire air; LNCFS III = Low NOx Concentric Firing System, Level III, with close-coupled and separated overfire air; and PM = Pollution Minimum Burner; Atlas = Phoenix Combustion Atlas LNB; CF/SF + AOFA = Controlled Flow/Split Flame with advanced OFA.
dVendors: CE-MHI = Combustion Engineering - Mitsubishi Heavy Industries. Refer to note "b" for others.
eLong = Long-term CEM data, i.e., 2-4 months. Short = Short-term test data, i.e., hours.
fDifferent coal was burned during the baseline testing (uncontrolled) and 49 percent reduction may not be an accurate depiction of the retrofit.

TABLE 5-13. PERFORMANCE OF COMBINATIONS OF COMBUSTION CONTROLS ON U. S. NATURAL GAS- AND OIL-FIRED UTILITY BOILERS
UtilityUnit
(standard)a
Ratedcapacity(MW) OEMb
Control typec
(vendor)d
Lengthof
teste
Capacitytested(%)
UncontrolledNOx
emissions(lb/MMBtu)
ControlledNOx
emissions(lb/MMBtu)
Reduction in NOx
emissions(%) Reference
TANGENTIALLY-FIRED BOILERS, NATURAL GAS
Pacific Gas &Electric
Pittsburg 7(Pre)
745 ABB-CE FGR + OFA Short 1005030
0.950.420.23
0.100.060.03
898687
90, 91
WALL-FIRED BOILERS, FUEL OIL
HawaiianElectirc Co.
Kahe 6(D)
146 B&W FGR + BOOS(B&W)
Short 92 0.81 0.28 65 78
HawaiianElectirc Co.
Kahe 6(D)
146 B&W LNB + FGR(B&W)
Short 92 0.81 0.43 47 78
HawaiianElectirc Co.
Kahe 6(D)
146 B&W LNB + OFA(B&W)
Short 92 0.81 0.28 65 78
Pacific Gas &Electric Co.
Contra Costa 6(Pre)
345 B&W FGR + OFA ShortShortShort
1005025
0.550.170.10
0.190.160.10
6560
90, 91
HawaiianElectirc Co.
Kahe 6(D)
146 B&W LNB + OFA+ FGR(B&W)
Short 92 0.81 0.19 76 78
WALL-FIRED BOILERS, NATURAL GAS
Pacific Gas &Electric Co.
Pittsburg 6(Pre)
330 B&W FGR + OFA ShortShortShort
1005032
0.900.410.26
0.160.140.13
826650
90, 91
Pacific Gas &Electric Co.
Contra Costa 6(Pre)
345 B&W FGR + OFA Short 100 0.55 0.24 57 90, 91
SouthernCaliforniaEdison Co.
Alamitos 6(Pre)
495 B&W FGR + BOOS Short 100 -- 0.08 91 79

TABLE 5-13. PERFORMANCE OF COMBINATIONS OF COMBUSTION CONTROLS ON U. S. NATURAL GAS- AND OIL-FIRED UTILITY BOILERS (Concluded)
UtilityUnit
(standard)a
Ratedcapacity(MW) OEMb
Control typec
(vendor)d
Lengthof
teste
Capacitytested(%)
UncontrolledNOx
emissions(lb/MMBtu)
ControlledNOx
emissions(lb/MMBtu)
Reduction in NOx
emissions(%) Reference
WALL-FIRED BOILERS, NATURAL GAS (Continued)
Pacific Gas &Electric Co.
Moss Landing 7(Pre)
750 B&W FGR + BOOS ShortShortShort
1008060
1.801.300.88
0.150.060.08
929591
90, 91
SouthernCaliforniaEdison Co.
Alamitos 6(Pre)
495 B&W LNB + FGR(Todd)
Short 100 -- 0.1 89 79
SouthernCaliforniaEdison Co.
Ormond Beach 2Pre)
800 B&W LNB + FGR(Todd)
ShortShortShort
877050
------
0.130.070.04
------
79
SouthernCaliforniaEdison Co.
Alamitos 6(Pre)
495 B&W LNB + FGR+ BOOS(Todd)
Short 100 -- 0.06 93 79
SouthernCaliforniaEdison Co.
Ormond Beach 2(Pre)
800 B&W LNB + FGR+ BOOS(Todd)
ShortShort
8770
----
0.120.06
----
79
aStandard: D = Subpart D; Da = Subpart Da; and Pre = Pre-NSPS
bOEM = Original Equipment Manufacturer; ABB-CE = Asea Brown Boveri-Combustion Engineering; and B&W = Babcock & Wilcox.
cType Control: BOOS = Burners-out-of-service; FGR = Flue Gas Recirculation; LEA = Low Excess Air; LNB = Low NOx Burners; and OFA = Overfire Air
dVendors: B&W = Babcock & Wilcox (Primary Gas-Dual Register Burner); and Todd = Todd Combustion (Todd Dynaswirl LNB).
eShort = Short-term test data, i.e., hours.
-- = Data not available.

TABLE 5-14. PERFORMANCE OF SNCR ON CONVENTIONAL U. S. UTILITY BOILERS
UtilityUnit
(Standard)a
RatedCapacity(MW)
MolarN/NORatio
Control Typeb
(Vendor)c
Lengthof
Testd
CapacityTested(%)
UncontrolledNOx
Emissions(lb/MMBtu)e
ControlledNOx
Emissions(lb/MMBtu)
Reductionin NOx
Emissions(%)
NH3Slip(ppm)
Reference
WALL-FIRED BOILERS, BITUMINOUS COAL
New EnglandPower Co.
Salem Harbor 2(Pre)
82 2.52.32.01.31.02.52.31.71.32.52.31.71.3
Urea(Nalco)
ShortShortShortShortShortShortShortShortShortShortShortShortShort
1001001001001007575757550505050
1.101.101.101.101.100.900.900.900.900.900.900.900.90
0.350.390.400.500.500.300.300.350.300.220.220.380.50
68676455556767616776765844
-- 99
WisconsinElectricPower Co.
Valley 4(Pre)
68 0.71.01.31.71.01.31.72.01.01.31.72.0
Urea(Nalco)
ShortShortShortShortShortShortShortShortShortShortShortShort
1001001001003636363634343434
1.611.611.611.610.620.620.620.621.241.241.241.24
0.760.540.530.500.320.240.170.140.540.460.410.35
525967754961727856626772
-- 100

TABLE 5-14. PERFORMANCE OF SNCR ON CONVENTIONAL U. S. UTILITY BOILERS(Continued)
UtilityUnit
(Standard)a
RatedCapacity(MW)
MolarN/NORatio
Control Typeb
(Vendor)c
Lengthof
Testd
CapacityTested(%)
UncontrolledNOx
Emissions(lb/MMBtu)e
ControlledNOx
Emissions(lb/MMBtu)
Reductionin NOx
Emissions(%)
NH3Slip(ppm)
Reference
ROOF-FIRED BOILERS, BITUMINOUS COAL
PublicService Co.of CO
Arapahoe 4(Pre)
100 1.51.00.750.50.25
Urea(Noell)
Short 100100100100100
1.10f
1.10f
1.10f
1.10f
1.10f
0.68g
0.68g
0.77g
0.88g
0.99g
38g
33g
30g
20g
10g
128533
64
1.51.00.75
Urea(Noell)
Short 110110110
0.35h
0.35h
0.35h
0.190.210.24
45i
38i
30i
1885
64
1.51.00.75
Urea(Noell)
Short 100100100
0.35h
0.35h
0.35h
0.160.180.19
55i
50i
45i
301510
64
1.51.00.75
Urea(Noell)
Short 808080
0.30h
0.30h
0.30h
0.140.160.18
55i
45i
40i
1004525
64
1.00.75
Urea(Noell)
Short 6060
0.40h
0.40h0.270.28
32i
30i850
64
STOKER BOILERS, COAL-FIRED
Cogentrix ofRichmond
Cogentrix 1-4(Da)
-- -- -- Long -- -- 0.28-0.30 -- 0-25 101

TABLE 5-14. PERFORMANCE OF SNCR ON CONVENTIONAL U. S. UTILITY BOILERS(Continued)
UtilityUnit
(Standard)a
RatedCapacity(MW)
MolarN/NORatio
Control Typeb
(Vendor)c
Lengthof
Testd
CapacityTested(%)
UncontrolledNOx
Emissions(lb/MMBtu)e
ControlledNOx
Emissions(lb/MMBtu)
Reductionin NOx
Emissions(%)
NH3Slip(ppm)
Reference
TANGENTIALLY-FIRED BOILERS, FUEL OIL
Long IslandLighting Co.
Port Jefferson 3(Pre)
185 0.51.01.50.51.01.61.01.52.0
Urea(Nalco)
ShortShortShortShortShortShortShortShortShort
100100100656565333333
0.320.320.32------0.320.320.32
0.230.170.14------0.210.160.15
274856454025364855
5-10 102,103
------
Urea(Nalco)
LongLongLong
1006533
0.32--0.32
0.14--0.14
554555
5-10 102,103
San Diego Gasand Electric
Encina 2(Pre)
110 1.0 Urea Short 85 -- -- 40 10-50 104
TANGENTIALLY-FIRED BOILERS, NATURAL GAS
Southern Cal.Edison Co.
Etiwanda 3(Pre)
333 -- Urea ShortShortShort
965025
0.120.060.05
0.070.040.03
423340
-- 105
Southern Cal.Edison Co.
Etiwanda 4(Pre)
333 -- Urea ShortShortShort
965020
0.080.050.05
0.060.040.03
252040
-- 105
Southern Cal.Edison Co.
Alamitos 3(Pre)
333 -- Urea ShortShortShort
955021
0.090.050.03
0.080.040.03
11200
-- 105

TABLE 5-14. PERFORMANCE OF SNCR ON CONVENTIONAL U. S. UTILITY BOILERS(Continued)
UtilityUnit
(Standard)a
RatedCapacity(MW)
MolarN/NORatio
Control Typeb
(Vendor)c
Lengthof
Testd
CapacityTested(%)
UncontrolledNOx
Emissions(lb/MMBtu)e
ControlledNOx
Emissions(lb/MMBtu)
Reductionin NOx
Emissions(%)
NH3Slip(ppm)
Reference
TANGENTIALLY-FIRED BOILERS, NATURAL GAS (Continued)
Southern CalEdison Co.
Alamitos 4(Pre)
333 -- Urea ShortShortShort
764521
0.090.050.05
0.070.040.04
12714
976
106
Southern Cal.Edison Co.
El Segundo 3(Pre)
342 -- Urea ShortShortShort
984020
0.100.050.05
0.060.040.04
362328
71217
107
Southern Cal.Edison Co.
El Segundo 4(Pre)
342 -- Urea ShortShortShort
805023
0.080.060.07
0.060.040.05
253328
-- 105
WALL-FIRED BOILERS, NATURAL GAS
Southern Cal.Edison Co.
El Segundo 1(Pre)
156 -- Urea(AUS)
ShortShortShort
1114519
0.110.10.04
0.080.060.03
264140
151318
107
Southern Cal.Edison Co.
El Segundo 2(Pre)
156 -- Urea ShortShortShort
856337
0.10.090.08
0.070.050.05
305038
-- 105
Pacific Gas &Electric
Morro Bay 3j
(Pre)345 0.8
1.01.22.4
Urea(Noell)
ShortShortShortShort
100100100100
--------
--------
25272927
110 108
1.01.52.0
Urea(Noell)
ShortShortShort
838383
------
------
232627
80 108

TABLE 5-14. PERFORMANCE OF SNCR ON CONVENTIONAL U. S. UTILITY BOILERS(Concluded)
UtilityUnit
(Standard)a
RatedCapacity(MW)
MolarN/NORatio
Control Typeb
(Vendor)c
Lengthof
Testd
CapacityTested(%)
UncontrolledNOx
Emissions(lb/MMBtu)e
ControlledNOx
Emissions(lb/MMBtu)
Reductionin NOx
Emissions(%)
NH3Slip(ppm)
Reference
WALL-FIRED BOILERS, NATURAL GAS (Continued)
Pacific Gas &Electric
Morro Bay 3j
(Pre)345 0.6
1.01.21.8
Ammonia(Noell)
ShortShortShortShort
100100100100
--------
--------
27353945
110 108
1.81.01.52.0
Ammonia(Noell)
ShortShortShort
838383
------
------
303541
50 108
aStandard: Pre = Pre-NSPS
bControl Type: Urea or ammonia (NH3) injection
cVendors: AUS = AUS Combustion Systems, Inc.; Nalco = Nalco Fuel Tech; and Noell = Noell, Inc.
dShort = Short-term test data, i.e., hours.
eFor Valley 4, 100% capacity = A & B Mill, 35% = A Mill only, 34% = B Mill only.
fUncontrolled NOx before retrofit of LNB + OFA + SNCR.
gPercent reduction with SNCR only, before retrofit of LNB + OFA.
hRetrofit with LNB + OFA.
iRetrofit with LNB + OFA + SNCR; therefore, percent reduction is for SNCR.
jTest installation across one-third of boiler width.
-- = Data not available.
TABLE 5-14. PERFORMANCE OF SNCR ON CONVENTIONAL U. S. UTILITY BOILERS(Concluded)
6-509
6.0 NOx TECHNOLOGY CONTROL COSTS
This chapter presents the estimated cost and cost
effectiveness of nitrogen oxide (NOx) control technologies on
fossil fuel-fired utility boilers. The section includes
estimated total capital cost, annualized busbar cost
(hereafter referred to as busbar cost), and cost effectiveness
for 30 generic model plants, as well as information on the
sensitivity of busbar cost and cost effectiveness to
variations in key technical and economic assumptions.
Sections 6.1 and 6.2 discuss costing methodology and the model
plants, respectively. Sections 6.3 and 6.4 present the cost
results for combustion modifications applied to coal-fired
boilers and to natural gas- and oil-fired boilers,
respectively. Section 6.5 presents the cost results for flue
gas treatment and combination controls.
6.1 COSTING METHODOLOGY
This section describes the procedures used to estimate
the capital and operating costs for new and retrofit NOx
control technologies, and how these costs were converted to
busbar and cost effectiveness estimates. Cost procedures
follow the general methodology contained in the Electric Power
Research Institute (EPRI) Technical Assessment Guide (TAG)1
and the Office of Air Quality (OAQPS) Costing Manual.2 The
general framework for handling capital and annual costs is
shown in table 6-1

TABLE 5-14. PERFORMANCE OF SNCR ON CONVENTIONAL U. S. UTILITY BOILERS(Concluded)
6-510
TABLE 6-1. CAPITAL AND OPERATING COST COMPONENTS
Total capital
cost
Basic equipment
Initial chemicals/catalyst
Installation
Start-up/optimization testing
Scope adders
Work area congestion
General facilities
Engineering
Royalty Fees
Project contingency
Process contingency
Operating labor
Maintenance labor
Supervisory labor
Maintenance materials
Energy penalty
Chemicals/catalyst
Electricity
Water
Waste disposal

TABLE 5-14. PERFORMANCE OF SNCR ON CONVENTIONAL U. S. UTILITY BOILERS(Concluded)
6-511
. All costs are presented on 1991 dollars. However, cost
indices for 1992 dollars are only 0.85 percent lower than 1991
dollars; therefore the values in this chapter are indicative
of the 1991-1992 timeframe. The costing
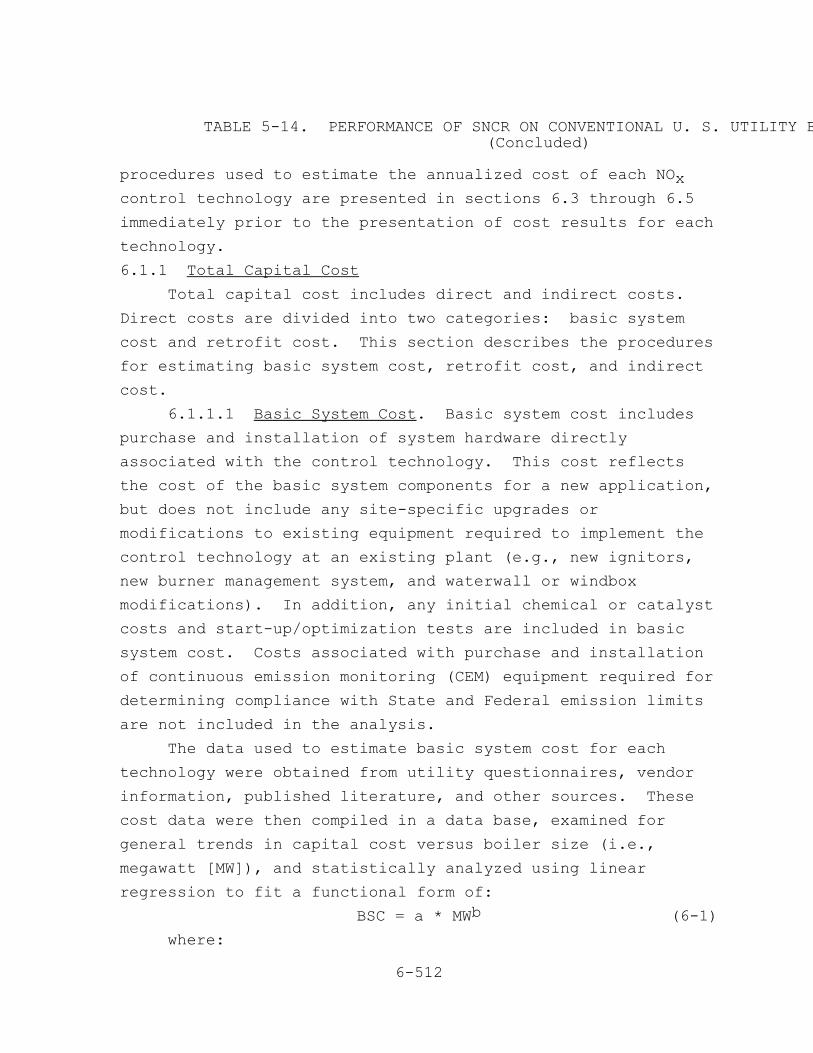
TABLE 5-14. PERFORMANCE OF SNCR ON CONVENTIONAL U. S. UTILITY BOILERS(Concluded)
6-512
procedures used to estimate the annualized cost of each NOx
control technology are presented in sections 6.3 through 6.5
immediately prior to the presentation of cost results for each
technology.
6.1.1 Total Capital Cost
Total capital cost includes direct and indirect costs.
Direct costs are divided into two categories: basic system
cost and retrofit cost. This section describes the procedures
for estimating basic system cost, retrofit cost, and indirect
cost.
6.1.1.1 Basic System Cost. Basic system cost includes
purchase and installation of system hardware directly
associated with the control technology. This cost reflects
the cost of the basic system components for a new application,
but does not include any site-specific upgrades or
modifications to existing equipment required to implement the
control technology at an existing plant (e.g., new ignitors,
new burner management system, and waterwall or windbox
modifications). In addition, any initial chemical or catalyst
costs and start-up/optimization tests are included in basic
system cost. Costs associated with purchase and installation
of continuous emission monitoring (CEM) equipment required for
determining compliance with State and Federal emission limits
are not included in the analysis.
The data used to estimate basic system cost for each
technology were obtained from utility questionnaires, vendor
information, published literature, and other sources. These
cost data were then compiled in a data base, examined for
general trends in capital cost versus boiler size (i.e.,
megawatt [MW]), and statistically analyzed using linear
regression to fit a functional form of:
BSC = a * MWb (6-1)
where:

TABLE 5-14. PERFORMANCE OF SNCR ON CONVENTIONAL U. S. UTILITY BOILERS(Concluded)
6-513
BSC = Basic system cost ($/kW)
a = Constant derived from regression analysis
TABLE 5-14. PERFORMANCE OF SNCR ON CONVENTIONAL U. S. UTILITY BOILERS(Concluded)
6-514
MW = Boiler size (MW)
b = Constant derived from regression analysis
The basic system cost for the model plants and sensitivity
analyses were then derived for each NOx control technology
using equation 6-1 and the calculated values of "a" and "b."
6.1.1.2 Retrofit Cost. Installation of NOx controls on
an existing boiler is generally more costly than installation
on a new unit. This increased cost is referred to as the
retrofit cost.
Retrofit costs are partially due to upgrades and
modifications to the boiler that are required for the NOx
control system to operate as designed. These modifications
and upgrades are referred to as scope adders. Table 6-2

TABLE 5-14. PERFORMANCE OF SNCR ON CONVENTIONAL U. S. UTILITY BOILERS(Concluded)
6-515
TABLE 6-2. POSSIBLE SCOPE ADDERS FOR RETROFIT OF COMBUSTION CONTROLS
Scope adders
Ignitors (Modify)
Ignitors (Replace)
Waterwall Modifications
Flame Scanners
Pulverizer Modifications
Boiler Control Modifications
Burner Management
Coal Piping Modifications
Windbox Modifications
Structural Modifications
Asbestos Removal
Insulation
Electrical System Modifications
Fan Modifications
Demolition

TABLE 5-14. PERFORMANCE OF SNCR ON CONVENTIONAL U. S. UTILITY BOILERS(Concluded)
6-516
lists possible scope adders for the retrofit of combustion
control systems (e.g., low NOx burner [LNB], LNB + advanced
overfire air [AOFA], reburn). A possible scope adder for
selective noncatalytic reduction (SNCR) includes boiler
control modifications. A possible scope adder for selective
catalytic reduction (SCR) retrofit is the air heater
replacement. Another factor that contributes to the retrofit
cost is the restricted access and work space congestion caused
by existing equipment and facilities. A boiler with
relatively few obstructions is less costly to retrofit than a
boiler with substantial access limitations and congestion in
the work area.
For combustion control systems, scope adders contribute
more to the retrofit cost than do access and congestion
factors. Typically, burners and overfire air ports can be
installed from inside the boiler, so exiting equipment does
not interfere. For SCR, site access and congestion can
contribute significantly to the retrofit cost. The retrofit
cost is generally low for SNCR since few scope adders are
necessary when adding an SNCR system, and site access and
congestion are less critical than in SCR applications.
To estimate the total direct cost (basic system cost +
retrofit cost), the basic system cost is multiplied by a

TABLE 5-14. PERFORMANCE OF SNCR ON CONVENTIONAL U. S. UTILITY BOILERS(Concluded)
6-517
retrofit factor. The retrofit factor accounts for the
retrofit cost as a percentage of the basic system cost. For
example, a retrofit factor of 1.3 indicates that the retrofit
cost is 30 percent of the basic system cost. Retrofit factors
were developed for each NOx control technology based on cost
data for planned or actual installations of individual NOx
control technologies to existing utility boilers. The cost
data were also used to estimate low, medium, and high retrofit
factors for the model boiler analysis. A low retrofit factor
of 1.0 could indicate a new unit or an existing unit requiring
minimal, if any, upgrade or modification, and the work area is
easily accessible. A medium retrofit factor reflects moderate
equipment upgrades or modifications and/or some congestion in
the work area. A high retrofit factor indicates that
extensive scope adders are required and/or substantial access
limitations and congestion of the work area.
6.1.1.3 Indirect Costs. Indirect costs include general
facilities, engineering expenses, royalty fees, and
contingencies. General facilities include offices,
laboratories, storage areas, or other facilities required for
installation or operation of the control system. Examples of
general facilities are expansion of the boiler control room to
house new computer cabinets for the boiler control system, or
expansion of an analytical laboratory. Engineering expenses
include the utility's internal engineering efforts and those
of the utility's architect/engineering (A&E) contractor.
Engineering costs incurred by the technology vendor are
included in the equipment cost and are considered direct
costs.
There are two contingency costs: project contingency and
process contingency. Project contingency is assigned based on
the level of detail in the cost estimate. It is intended to
cover miscellaneous equipment and materials not included in

TABLE 5-14. PERFORMANCE OF SNCR ON CONVENTIONAL U. S. UTILITY BOILERS(Concluded)
6-518
the direct cost estimate. Project contingencies range from 5
to 50 percent of the direct costs, depending on the level of
detail included in the direct cost estimate. Generally, the
more detailed the cost estimate, the less the project
contingency required. Process contingency is based on the
maturity of the technology and the number of previous
installations. Process contingency covers unforeseen expenses
incurred because of inexperience with newer technologies.
Process contingencies range from 0 to 40+ percent of the
direct costs. Generally, the older and more mature the
technology, the less process contingency required.
To estimate the total capital cost (total direct cost +
indirect costs), the total direct cost is multiplied by a
indirect cost factor. The indirect cost factor accounts for
the indirect costs as a percentage of the total direct cost.
For example, an indirect cost factor of 1.3 indicates that the
indirect costs are 30 percent of the total direct cost.
Indirect cost factors were developed for each NOx technology.
These indirect cost factors are based on cost data from
planned and actual installations of individual NOx control
technologies to different boilers.
6.1.2 Operating and Maintenance Costs
Operating and maintenance (O&M) costs include fixed and
variable O&M components. Fixed O&M costs include operating,
maintenance, and supervisory labor, and maintenance materials.
Fixed O&M are assumed to be independent of capacity factor.
Variable O&M costs include any energy penalty resulting from
efficiency losses associated with a given technology, and
chemical, electrical, water, and waste disposal costs.
Variable O&M costs are dependent on capacity factor.
Cost rates for labor and materials included in the cost
estimates are shown in table 6-3

TABLE 5-14. PERFORMANCE OF SNCR ON CONVENTIONAL U. S. UTILITY BOILERS(Concluded)
6-519
TABLE 6-3. FIXED AND VARIABLE O&M UNIT COSTS
Reference
1 1 3 3 3 34, 5, 6, 7
$/ton of 50% urea
solution by wt.
8, 9, 10, 11
1 1 1 1
Note that the cost for urea is listed for a 50 percent urea solution.
$200/ton of
50 percent solution is roughly equivalent to $400/ton urea on a dry basis.

TABLE 5-14. PERFORMANCE OF SNCR ON CONVENTIONAL U. S. UTILITY BOILERS(Concluded)
6-520
. The prices listed for coal, residual oil, distillate oil,
and natural gas are the estimated national average prices for
the year 2000, using the reference case analysis of the
Department of Energy's (DOE's) 1992 Annual Energy Outlook.3
The prices listed for ammonia and urea are average values
obtained from vendors. Prices for labor, solid waste,
electricity, water, and high pressure steam, are listed in
1989 dollars. These quantities do not

TABLE 5-14. PERFORMANCE OF SNCR ON CONVENTIONAL U. S. UTILITY BOILERS(Concluded)
6-521
have a major influence on total O&M costs, and therefore, more
recent values were not used.
6.1.3 Calculation of Busbar Cost and Cost Effectiveness
Busbar cost is the sum of annualized capital costs and
total O&M costs divided by the annual electrical output of the
boiler. Busbar cost is commonly expressed in mills/kWh
(1 mill = $0.001) and is a direct indicator of the cost of the
control technology to the utility and its customers. To
convert total capital cost to an annualized capital charge,
the total capital cost is multiplied by an annual capital
recovery factor (CRF). The CRF is based on the economic life
over which the capital investment is amortized and the cost of
capital (i.e., interest rate), and is calculated using the
following equation:
CRF = i(1+i)n/[(1+i)n-1] (6-2)
where:
i = interest rate [assumed to be 0.10 (i.e.,
10 percent) throughout this study]
n = the economic life of the equipment
Cost-effectiveness values indicate the total cost of a
control technology per unit of NOx removed and are calculated
by dividing the total annualized capital charge and O&M
expense by the annual reduction in tons of NOx emitted from
the boiler.
Example calculations of these values are provided in
appendix A.1.
6.2 MODEL PLANT DEVELOPMENT
To estimate the capital cost, busbar cost, and cost
effectiveness of NOx control technologies, a series of model
plants were developed. These model plants reflect the
projected range of size, duty cycle, retrofit difficulty,
economic life, uncontrolled NOx emissions, and controlled NOx
emissions for each major boiler type and NOx control

TABLE 5-14. PERFORMANCE OF SNCR ON CONVENTIONAL U. S. UTILITY BOILERS(Concluded)
6-522
technology. In addition, cost estimates were developed to
illustrate the sensitivity of busbar costs and cost
effectiveness to variations in each of the above parameters.
Key design and operating specifications for the model plant
boilers are presented in section 6.2.1. The NOx control
technologies applied to each model plant type are presented in
section 6.2.2. The procedures used to estimate the
sensitivity of busbar cost and cost effectiveness to key
design and operating assumptions are described in
section 6.2.3.
6.2.1 Model Boiler Design and Operating Specifications
Thirty model plants were selected to represent the
population of existing and projected utility boilers. These
model plants represent six groups of boilers: coal-fired
wall, tangential, cyclone, and fluidized bed combustion (FBC)
boilers; and natural gas- and oil-fired wall and tangential
boilers. Within each of these groups, five model boilers were
selected to estimate the range of total capital costs ($/kW),
busbar cost (mills/kWh), and cost effectiveness ($/ton of NOx
removed) for individual NOx control technologies. These five
model boilers represent the typical range of plant size and
duty cycle that exist for a given boiler type. For every
group except the FBC boilers, the models include a large
(600 MW) baseload unit, medium-size (300 MW) cycling and
baseload units, and small (100 MW) peaking and baseload units.
Because of the limitations on the size of FBC boilers, the FBC
model plants are smaller than the other categories model
plants and also have different duty cycles. The FBC model
plants include a large (200 MW) baseload boiler, medium-size
(100 MW) cycling and baseload units, and small (50 MW) cycling
and baseload units.
For defining the model plants, the economic life of the
control technology was assumed to be 20 years. Key design and

TABLE 5-14. PERFORMANCE OF SNCR ON CONVENTIONAL U. S. UTILITY BOILERS(Concluded)
6-523
operating characteristics for each of the 30 model plants are
listed in table 6-4
TABLE 5-14. PERFORMANCE OF SNCR ON CONVENTIONAL U. S. UTILITY BOILERS(Concluded)
6-524
Table LIV

TABLE 5-14. PERFORMANCE OF SNCR ON CONVENTIONAL U. S. UTILITY BOILERS(Concluded)
6-525
Table 4 (cont.)

TABLE 5-14. PERFORMANCE OF SNCR ON CONVENTIONAL U. S. UTILITY BOILERS(Concluded)
6-526
.
6.2.2 NOx Control Alternatives
Eight NOx control alternatives were selected for
analysis:

TABLE 5-14. PERFORMANCE OF SNCR ON CONVENTIONAL U. S. UTILITY BOILERS(Concluded)
6-527

TABLE 5-14. PERFORMANCE OF SNCR ON CONVENTIONAL U. S. UTILITY BOILERS(Concluded)
6-528
C four combustion control alternatives (operational
modifications, LNB, LNB + AOFA, and reburn);
C two flue gas treatment alternatives (SNCR and SCR);
and
C two combinations of combustion and flue gas
treatment (LNB + SNCR and LNB + AOFA + SCR).
Operational modifications (described in section 5.1)
include low excess air (LEA), burners-out-of-service (BOOS),
and biased burner firing (BF). To estimate the costs of
operational modifications, LEA + BOOS was selected as an
example of this option.
Tangentially-fired boilers with either close-coupled
overfire air (CCOFA) or no overfire air (OFA) ports were
classified in the LNB category (e.g., low NOx concentric
firing system [LNCFS] I, discussed in section 5.1.4).
Tangentially-fired boilers with separated OFA systems were
classified in the LNB + AOFA category (e.g., LNCFS III,
discussed in section 5.1.4). As defined in section 5.1, wall-
fired units may have OFA or AOFA systems. However, because
retrofit data were available only for the LNB + AOFA systems
and because of its higher NOx reduction potential, analysis is
limited to LNB + AOFA.
The matrix of control alternatives applied to each of the
four groups of model boilers is shown in table 6-5

TABLE 5-14. PERFORMANCE OF SNCR ON CONVENTIONAL U. S. UTILITY BOILERS(Concluded)
6-529
CONTROL ALTERNATIVES EVALUATED
Natural gas- and oil-fired
control
alternative
Tangential
Operational
controls
X X X X X X X X
For tangentially-fired boilers, LNB includes close-coupled OFA.

TABLE 5-14. PERFORMANCE OF SNCR ON CONVENTIONAL U. S. UTILITY BOILERS(Concluded)
6-530
. Performance levels used for each model boiler and control
alternative are discussed in conjunction with the cost results
in sections 6.3 through 6.5.
6.2.3 Sensitivity Analysis
In addition to the model plant analysis, a sensitivity
analysis is conducted for each NOx control technology to
examine the effect of varying selected plant design and
operating characteristics on the technology's busbar cost and
cost effectiveness. For each NOx control technology, a
reference boiler is selected to illustrate the results of the
sensitivity analysis. These results are presented in two
graphs for each technology/reference boiler combination.

TABLE 5-14. PERFORMANCE OF SNCR ON CONVENTIONAL U. S. UTILITY BOILERS(Concluded)
6-531
As an example, the results of the sensitivity analysis
for a coal-fired tangential boiler retrofit with LNB are shown
in figures 6-1

TABLE 5-14. PERFORMANCE OF SNCR ON CONVENTIONAL U. S. UTILITY BOILERS(Concluded)
6-532Figure 80

TABLE 5-14. PERFORMANCE OF SNCR ON CONVENTIONAL U. S. UTILITY BOILERS(Concluded)
6-533Figure 81
and 6-2. The two figures show the effects of seven
TABLE 5-14. PERFORMANCE OF SNCR ON CONVENTIONAL U. S. UTILITY BOILERS(Concluded)
aBecause of the inter-relationships between cost effectiveness and busbar cost,it is not possible to simultaneously graph the effect on both values of changesto uncontrolled NOx levels, NOx reduction efficiency, and heat rate. If busbarcost estimates are needed, refer to the cost procedures provided in appendix A.
6-534
independent parameters (retrofit factor, boiler size, capacity
factor, economic life, uncontrolled NOx levels, NOx reduction
efficiency, and average annual heat rate) on cost
effectiveness and busbar cost. Key performance and cost
parameters for this reference boiler are a 1.3 retrofit
factor, a 40-percent capacity factor, a 20-year economic life,
a 0.7 lb/MMBtu controlled NOx emission rate, a 45-percent
reduction in NOx due to the LNB retrofit, and an
11,000 Btu/kWh average annual heat rate.
Figure 6-1 examines the effect of varying four of the
seven parameters (retrofit factor, boiler size, capacity
factor, and economic life). The central point on the graph
reflects the cost effectiveness ($238 per ton) and busbar cost
(0.41 mills/kWh) for LNB applied to the reference boiler.
Each of the four curves emanating from the central point
illustrates the effect of changes in the individual parameter
on cost effectiveness and busbar cost, while holding the other
six parameters constant (this number includes the other three
parameters shown on figure 6-1 and the three parameters
illustrated in figure 6-2). Thus, each curve isolates the
effect of the selected independent parameter on cost
effectiveness and busbar cost. For example, a smaller boiler
size, such as 200 MW, results in an estimated increase in the
cost effectiveness value from $238 to $314 per ton and an
increase in busbar cost from 0.41 mills/kWh to 0.54 mills/kWh.
Figure 6-2 illustrates the sensitivity of cost
effectiveness to the remaining three parameters (uncontrolled
NOx levels, NOx reduction efficiency, and heat rate).aaaaa As

TABLE 5-14. PERFORMANCE OF SNCR ON CONVENTIONAL U. S. UTILITY BOILERS(Concluded)
6-535
with figure 6-1, the central point on the graph reflects the
cost effectiveness and busbar cost for LNB applied to the
reference boiler. Each of the three curves emanating from the
central point illustrates the effect of changes in the
individual parameter on cost effectiveness, while holding the
other six parameters constant. Use of the curves to estimate
the sensitivity of cost effectiveness to changes in an
independent parameter is the same as with figure 6-1.
The independent plant design and operating parameters
used in the sensitivity analyses for other control
technologies will vary from those listed in the example above.
6.3 COMBUSTION MODIFICATIONS FOR COAL-FIRED BOILERS
This section presents the total capital cost, busbar
cost, and cost effectiveness estimates for LNB, LNB + AOFA,
and reburn applied to coal-fired boilers. Cost estimates for
AOFA by itself are included with the discussion of LNB + AOFA.
6.3.1 Low NOx Burners
Cost estimates for LNB technology are presented in this
section for coal-fired wall and tangential boilers.
6.3.1.1 Costing Procedures. Costing procedures for LNB
applied to wall-fired boilers were based on data obtained from
10 units, ranging in size from 130 to 800 MW. These data
included seven cost estimates and three actual installation
costs. These data are summarized in appendix A-2.
No cost data were available for LNB applied to
tangentially-fired units (LNCFS I). Therefore, vendor
information on the relative cost of LNB and close-coupled OFA
(LNCFS I) and LNB + close-coupled and separated OFA
(LNCFS III) was used to develop the LNCFS I cost algorithm for
tangentially-fired units. This information indicates that LNB
costs for tangential units are approximately 55 percent of the
cost of LNB + AOFA.12 Based on this information, the LNCFS III
cost algorithm for tangentially-fired boilers (refer to

TABLE 5-14. PERFORMANCE OF SNCR ON CONVENTIONAL U. S. UTILITY BOILERS(Concluded)
6-536
section 6.3.2) was adjusted for LNCFS I so that LNCFS I costs
are about 40 percent lower than LNCFS III. A scaling factor
of 0.60 (b=-0.40) was assumed for LNCFS I. Details on these
calculations are provided in appendix A.3.
The basic system cost coefficients used in equation 6-1
for wall-fired LNB systems were calculated to be a=220 and
b=-0.44, based on the available cost data discussed above.
For tangentially-fired LNB systems, the cost coefficients were
calculated to be a=80 and b=-0.40, based on adjustments of the
LNCFS III cost algorithm.
Retrofit costs for wall-fired LNB systems averaged
15 percent of the basic system cost (retrofit factor of 1.15)
based on the available installation data. For tangentially-
fired LNB systems, a retrofit factor of 1.15 was also assumed.
For the model plant analysis, low, medium, and high retrofit
factors of 1.0, 1.3, and 1.6 were used.
For both wall-fired and tangentially-fired LNB systems,
indirect costs were estimated at 30 percent of basic system
and retrofit costs. Fixed and variable O&M costs were assumed
to be negligible.
6.3.1.2 Model Plants Results. The capital cost, busbar
cost, and cost effectiveness for the ten wall- and
tangentially-fired model boilers are presented in table 6-6

TABLE 5-14. PERFORMANCE OF SNCR ON CONVENTIONAL U. S. UTILITY BOILERS(Concluded)
6-537
TABLE 6-6. COSTS FOR LNB APPLIED TO COAL-FIRED BOILERS
Plant
identification
Total capital cost,
$/kW
Busbar cost,
mills/kWh
Cost effectiveness,
$/ton
1.6
3,200
615
746
379
279
1,800
345
438
223
169
reduction of
45 percent
were used for wall-fired boilers.
Peaking = 10 percent capacity factor.
Baseload = 65 percent capacity factor.
Cycling = 30 percent capacity factor.
reduction of
45 percent
were used for tangentially-fired boilers.
TABLE 5-14. PERFORMANCE OF SNCR ON CONVENTIONAL U. S. UTILITY BOILERS(Concluded)
6-538
. An economic life of 20 years and a NOx reduction efficiency
of 45 percent were assumed for all of the model boilers. For
the 600 MW baseload wall-fired boiler, the estimated cost
effectiveness ranges from $175 to $279 per ton of NOx removed.
For the 100 MW peaking wall-fired boiler, the estimated cost
effectiveness ranges from $2,000 to $3,200 per ton.
Cost per ton of NOx removed with LNB on tangential
boilers is lower than LNB on wall-fired boilers because of
lower capital cost associated with LNCFS I. The cost
effectiveness for the 600 MW tangentially-fired boiler ranges
from $105 to $169 per ton. For the 100 MW peaking
tangentially-fired boiler, cost effectiveness ranges from
$1,120 to $1,800 per ton.
6.3.1.3 Sensitivity Analysis. The effect of plant
characteristics (retrofit factor, boiler size, capacity

TABLE 5-14. PERFORMANCE OF SNCR ON CONVENTIONAL U. S. UTILITY BOILERS(Concluded)
6-539
factor, and economic life) on cost effectiveness and busbar
cost for wall-fired boilers is shown in figure 6-3

TABLE 5-14. PERFORMANCE OF SNCR ON CONVENTIONAL U. S. UTILITY BOILERS(Concluded)
6-540Figure 82
TABLE 5-14. PERFORMANCE OF SNCR ON CONVENTIONAL U. S. UTILITY BOILERS(Concluded)
6-541Figure 83
. Figure 6-4 presents the sensitivity of cost effectiveness

TABLE 5-14. PERFORMANCE OF SNCR ON CONVENTIONAL U. S. UTILITY BOILERS(Concluded)
6-542
to NOx emission characteristics (uncontrolled NOx level and
NOx reduction efficiency) and heat rate. As shown in
figure 6-4, because equal percent changes in uncontrolled NOx
and NOx reductions result in equivalent changes in cost
effectiveness, these two curves overlap. As shown in the
figures, the reference boiler's cost effectiveness and busbar
cost are approximately $400 per ton of NOx removed and
0.90 mills/kWh.
Of the plant characteristics, the variation of capacity
factor from 10 to 70 percent has the greatest impact on cost
effectiveness and busbar cost. The cost effectiveness value
and busbar cost are inversely related to capacity factor, and
thus, as capacity factor decreases, the cost effectiveness
value and busbar cost increase. This is especially noticeable
at low capacity factors where a decrease of 75 percent in the
reference plant's capacity factor (from 40 percent to
10 percent) results in an increase in the cost effectiveness
value and busbar cost of nearly 300 percent.
Variations in economic life and boiler size follow a
trend similar to capacity factor, but do not cause as great a
change in cost effectiveness and busbar cost. For example, a
decrease of 75 percent in economic life (from 20 to 5 years)
results in an increase in the plant's cost effectiveness value
and busbar cost of nearly 125 percent. Similarly, a decrease
of 75 percent in boiler size (from 400 to 100 MW) results in

TABLE 5-14. PERFORMANCE OF SNCR ON CONVENTIONAL U. S. UTILITY BOILERS(Concluded)
6-543

TABLE 5-14. PERFORMANCE OF SNCR ON CONVENTIONAL U. S. UTILITY BOILERS(Concluded)
6-544

TABLE 5-14. PERFORMANCE OF SNCR ON CONVENTIONAL U. S. UTILITY BOILERS(Concluded)
6-545
an increase in the plant's cost effectiveness value and busbar
cost of nearly 80 percent.
Variation in the retrofit factor from 1.0 to 1.6 causes
the smallest relative percent change in cost effectiveness and
busbar cost. Increases of 0.1 in the retrofit factor cause a
linear increase of approximately 8 percent in the cost
effectiveness value and busbar cost.
Uncontrolled NOx, NOx reduction, and heat rate all
exhibit an inverse relationship with the cost effectiveness
value. As mentioned above, equal percentage changes in
uncontrolled NOx and NOx reduction result in equivalent
changes in cost effectiveness. A decrease of 30 percent in
either of the parameters results in a 50 percent increase in
the cost effectiveness value. Heat rate also exhibits an
inverse relationship with the cost effectiveness value,
however, since the potential relative change in heat rate is
less than the potential variation in the NOx characteristics,
the impact on cost effectiveness is not as great.
The effect of plant characteristics (retrofit factor,
boiler size, capacity factor, and economic life) on cost
effectiveness and busbar cost for tangentially-fired boilers
is shown in figure 6-5

TABLE 5-14. PERFORMANCE OF SNCR ON CONVENTIONAL U. S. UTILITY BOILERS(Concluded)
6-546Figure 84

TABLE 5-14. PERFORMANCE OF SNCR ON CONVENTIONAL U. S. UTILITY BOILERS(Concluded)
6-547Figure 85
. Figure 6-6 presents the sensitivity of cost effectiveness
TABLE 5-14. PERFORMANCE OF SNCR ON CONVENTIONAL U. S. UTILITY BOILERS(Concluded)
6-548
to NOx emission characteristics (uncontrolled NOx level and
NOx reduction efficiency) and heat rate. As shown in the
figures, the reference boiler's cost effectiveness and busbar
cost are approximately $240 per ton of NOx removed and
0.41 mills/kWh. The cost effectiveness value and busbar cost
for LNB applied to tangentially-fired boilers are lower than
for LNB on wall-fired boilers because of lower capital costs
associated with tangentially-fired boilers. The sensitivity
curves follow the same general trends as with LNB applied to
wall-fired boilers. In contrast to the curves for LNB applied
to wall-fired boilers, uncontrolled NOx and NOx reduction do
not overlap for tangentially-fired boilers due to the
difference in relative percent changes in the two parameters.

TABLE 5-14. PERFORMANCE OF SNCR ON CONVENTIONAL U. S. UTILITY BOILERS(Concluded)
6-549

TABLE 5-14. PERFORMANCE OF SNCR ON CONVENTIONAL U. S. UTILITY BOILERS(Concluded)
6-550
6.3.2 Low NOx Burners with Advanced Overfire Air
Cost estimates for LNB + AOFA technology are presented
for coal-fired wall and tangential boilers. Estimated NOx
reductions and capital costs for AOFA by itself are 40 to
50 percent of the levels expected from LNB + AOFA. As a
result, busbar costs for AOFA by itself are estimated at 40 to
50 percent of the cost estimates in this section for LNB +
AOFA and cost effectiveness values are estimated to
approximately equal those for LNB + AOFA.
6.3.2.1 Costing Procedures. There were limited cost
data available on LNB + AOFA applied to wall-fired boilers.
Therefore, as explained in appendix A.4, the basic system cost
algorithm for LNB + AOFA was developed based on a relative
price differential between LNB and LNB + AOFA. Based on the
data available, the LNB basic system cost algorithm was
adjusted so that LNB + AOFA costs are approximately 75 percent
higher than LNB alone. The scaling factor was derived from
the LNB + AOFA cost estimates.
Costing procedures for LNB + AOFA applied to
tangentially-fired boilers (LNCFS III) were based on cost
estimates obtained from 14 units, ranging in size from 124 to
905 MW. These data are summarized in appendix A.5.
The basic system cost coefficients used in equation 6-1
for wall-fired LNB + AOFA systems were calculated to be a=552,
b=-0.50, based on the adjustments of the LNB cost algorithm.
For tangentially-fired LNB + AOFA systems, the cost
coefficients were calculated to be a=247 and b=-0.49, based on
the available cost data discussed above.
Retrofit costs for tangentially-fired LNB + AOFA systems
ranged from 14 to 65 percent of the basic system cost, with a
mean of 30 percent. This corresponds to a mean retrofit
factor of 1.30. This retrofit factor was assumed to apply to
wall-fired LNB + AOFA systems as well. For the model plant

TABLE 5-14. PERFORMANCE OF SNCR ON CONVENTIONAL U. S. UTILITY BOILERS(Concluded)
6-551
analysis, low, medium, and high retrofit factors of 1.0, 1.3,
and 1.6 were used.
Indirect costs ranged from 20 to 45 percent of total
direct costs for tangentially-fired LNB + AOFA systems. Based
on this, an indirect cost factor of 1.30 was assumed for the
cost procedures for both tangentially-fired and wall-fired
systems. Fixed and variable O&M costs were assumed to be
negligible.
6.3.2.2 Model Plants Results. The capital cost, busbar
cost, and cost effectiveness for the ten wall- and
tangentially-fired model boilers are presented in table 6-7
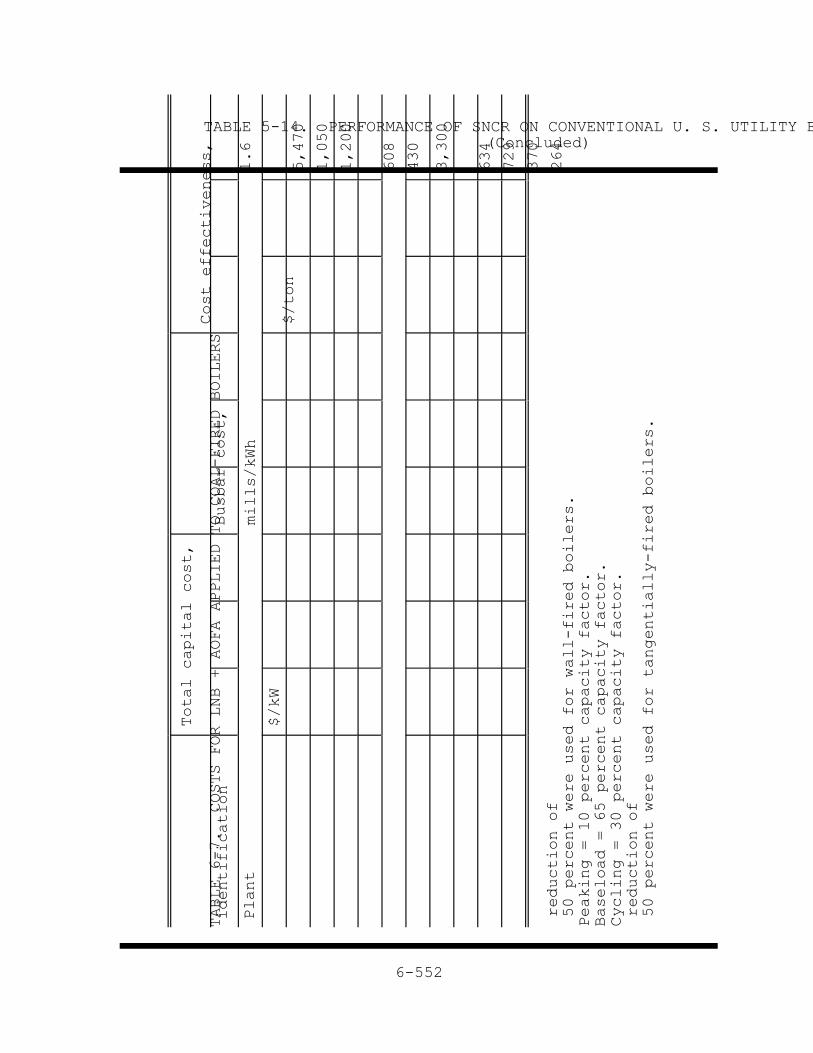
TABLE 5-14. PERFORMANCE OF SNCR ON CONVENTIONAL U. S. UTILITY BOILERS(Concluded)
6-552
TABLE 6-7. COSTS FOR LNB + AOFA APPLIED TO COAL-FIRED BOILERS
Plant
identification
Total capital cost,
$/kW
Busbar cost,
mills/kWh
Cost effectiveness,
$/ton
1.6
5,470
1,050
1,200
608
430
3,300
634
729
370
264
reduction of
50 percent were used for wall-fired boilers.
Peaking = 10 percent capacity factor.
Baseload = 65 percent capacity factor.
Cycling = 30 percent capacity factor.
reduction of
50 percent were used for tangentially-fired boilers.

TABLE 5-14. PERFORMANCE OF SNCR ON CONVENTIONAL U. S. UTILITY BOILERS(Concluded)
6-553
. An economic life of 20 years and a NOx reduction efficiency
of 50 percent were assumed for all of these boilers. For the
600 MW baseload wall-fired boiler, the estimated cost
effectiveness ranged from $269 to $430 per ton of NOx removed.
For the 100 MW peaking wall-fired boiler, the estimated cost
effectiveness ranges from $3,420 to $5,470 per ton.
Cost per ton of NOx removed with LNB + AOFA is lower for
the tangentially-fired units due to the lower capital cost of
LNCFS III. Cost effectiveness for the tangentially-fired
units ranged from $165 to $264 per ton for the 600 MW baseload
unit and $2,060 to $3,300 per ton for the 100 MW peaking unit.
6.3.2.3 Sensitivity Analysis. The effect of plant
characteristics (retrofit factor, boiler size, capacity
factor, and economic life) on cost effectiveness and busbar
cost for wall-fired boilers is shown in figure 6-7

TABLE 5-14. PERFORMANCE OF SNCR ON CONVENTIONAL U. S. UTILITY BOILERS(Concluded)
6-554Figure 86

TABLE 5-14. PERFORMANCE OF SNCR ON CONVENTIONAL U. S. UTILITY BOILERS(Concluded)
6-555Figure 87
. Figure 6-8 presents the sensitivity of cost effectiveness

TABLE 5-14. PERFORMANCE OF SNCR ON CONVENTIONAL U. S. UTILITY BOILERS(Concluded)
6-556
to NOx emission characteristics (uncontrolled NOx level and
NOx reduction efficiency) and heat rate. As shown in the
figures, the reference boiler's cost effectiveness and busbar
cost are approximately $630 per ton of NOx removed and
1.6 mills/kWh. The sensitivity curves follow the same general
trends as with LNB applied to coal-fired wall boilers (refer
to section 6.3.1.3).
The effect of plant characteristics (retrofit factor,
boiler size, capacity factor, and economic life) on cost

TABLE 5-14. PERFORMANCE OF SNCR ON CONVENTIONAL U. S. UTILITY BOILERS(Concluded)
6-557

TABLE 5-14. PERFORMANCE OF SNCR ON CONVENTIONAL U. S. UTILITY BOILERS(Concluded)
6-558

TABLE 5-14. PERFORMANCE OF SNCR ON CONVENTIONAL U. S. UTILITY BOILERS(Concluded)
6-559

TABLE 5-14. PERFORMANCE OF SNCR ON CONVENTIONAL U. S. UTILITY BOILERS(Concluded)
6-560
effectiveness and busbar cost for tangentially-fired boilers
is shown in figure 6-9
TABLE 5-14. PERFORMANCE OF SNCR ON CONVENTIONAL U. S. UTILITY BOILERS(Concluded)
6-561Figure 88

TABLE 5-14. PERFORMANCE OF SNCR ON CONVENTIONAL U. S. UTILITY BOILERS(Concluded)
6-562Figure 89
. Figure 6-10 presents the sensitivity of cost effectiveness
TABLE 5-14. PERFORMANCE OF SNCR ON CONVENTIONAL U. S. UTILITY BOILERS(Concluded)
6-563
to NOx emission characteristics (uncontrolled NOx level and
NOx reduction efficiency) and heat rate. As shown in the
figures, the reference boiler's cost-effectiveness and busbar
cost are approximately $390 per ton of NOx removed and
0.74 mills/kWh. The cost effectiveness values and busbar
costs for LNB + AOFA applied to tangentially-fired boilers are
lower than for LNB + AOFA on wall-fired boilers because of
lower capital costs associated with tangentially-fired
boilers. The sensitivity curves follow the same general
trends as with LNB applied to coal-fired wall boilers (refer
to section 6.3.1.3).
6.3.3 Natural Gas Reburn
Cost estimates for natural gas reburn (NGR) are presented
for coal-fired wall, tangential, and cyclone boilers in this
section.
6.3.3.1 Costing Procedures. Limited cost data on NGR
for coal-fired boilers were obtained from vendor and utility
questionnaire responses. Cost data on reburn were submitted
for one 75 MW plant in response to the questionnaire, and a
vendor provided installation costs for a 33 MW and 172 MW
unit. These data are summarized in appendix A.6. A
regression on the data showed a high degree of scatter and no
obvious costing trend. Therefore, the reburn costs were based
upon the 172 MW unit, whose size is more representative of
most utility boilers.
The economy of scale was assumed to be 0.6 for the reburn
basic cost algorithm. Using this assumption, the cost
coefficients in equation 6-1 for reburn are a=229 and b=-0.40.
The cost of installing a natural gas pipeline was not included
in the analysis because it is highly dependent on site
specific parameters such as the unit's proximity to a gas line
and the difficulty of installation.

TABLE 5-14. PERFORMANCE OF SNCR ON CONVENTIONAL U. S. UTILITY BOILERS(Concluded)
6-564
The vendor questionnaire indicated that the retrofit of
natural gas reburn would cost 10 to 20 percent more than a

TABLE 5-14. PERFORMANCE OF SNCR ON CONVENTIONAL U. S. UTILITY BOILERS(Concluded)
6-565

TABLE 5-14. PERFORMANCE OF SNCR ON CONVENTIONAL U. S. UTILITY BOILERS(Concluded)
6-566
reburn system applied to a new boiler. From this, the
retrofit factor was assumed to be 1.15. However, for the
sensitivity analysis, the retrofit factor was varied from 1.0
to 1.6 to account for different retrofit difficulties on
specific boilers.
The indirect costs were estimated to be 40 percent of the
total direct cost, corresponding to an indirect cost factor of
1.40.
Annual O&M costs were the total of the additional fuel
costs caused by the higher price of natural gas versus coal
and utility savings on sulfur dioxide (SO2) credits, caused by
lower SO2 emission levels when using natural gas reburn on a
coal-fired boiler. The analysis was conducted assuming
18 percent of the total heat input was from natural gas. The
SO2 credit was assumed to be $200 per ton of SO2, equal to
$0.24/MMBtu based on a coal-sulfur content of 1.5 percent.
Refer to appendix A.6 for a summary of the costing data
and procedures.
6.3.3.2 Model Plants Results. The capital cost, busbar
cost, and cost effectiveness for the 15 wall-, tangentially-,
and cyclone-fired model boilers are presented in table 6-8
TABLE 5-14. PERFORMANCE OF SNCR ON CONVENTIONAL U. S. UTILITY BOILERS(Concluded)
6-567
Table 8

TABLE 5-14. PERFORMANCE OF SNCR ON CONVENTIONAL U. S. UTILITY BOILERS(Concluded)
6-568
. An economic life of 20 years and a NOx reduction efficiency
of 55 percent were assumed for all of these boilers. The fuel
price differential was varied from $0.50 to $2.50/MMBtu. For
the 600 MW baseload wall-fired boiler, the estimated cost
effectiveness ranges from $480 to $2,080 per ton of NOx
removed. For the 100 MW peaking wall-fired boiler, the
estimated cost effectiveness ranges from $3,010 to
$4,600 per ton.
Cost per ton of NOx removed with reburn is higher for the
tangentially-fired units due to the lower baseline NOx
emissions. Cost effectiveness for the tangentially-fired
units ranges from $615 per ton to $2,680 per ton for the
600 MW baseload unit and $3,870 per ton to $5,930 per ton for
the 100 MW peaking unit.

TABLE 5-14. PERFORMANCE OF SNCR ON CONVENTIONAL U. S. UTILITY BOILERS(Concluded)
6-569
Cost per ton of NOx removed is lower for cyclone-fired
boilers than for wall-fired boilers because of higher baseline
NOx for cyclone-fired boilers. For the 600 MW baseload
cyclone boiler, cost effectiveness ranges from $290 to
$1,250 per ton and for the 100 MW peaking boiler, cost
effectiveness ranges from $1,810 to $2,720 per ton.
6.3.3.3 Sensitivity Analysis. The effect of plant
characteristics (retrofit factor, boiler size, capacity
factor, and economic life) and fuel price differential on cost
effectiveness and busbar cost for wall-fired boilers is shown
in figure 6-11

TABLE 5-14. PERFORMANCE OF SNCR ON CONVENTIONAL U. S. UTILITY BOILERS(Concluded)
6-570Figure 90

TABLE 5-14. PERFORMANCE OF SNCR ON CONVENTIONAL U. S. UTILITY BOILERS(Concluded)
6-571Figure 91
. Figure 6-12 presents the sensitivity of cost effectiveness

TABLE 5-14. PERFORMANCE OF SNCR ON CONVENTIONAL U. S. UTILITY BOILERS(Concluded)
6-572
to NOx emission characteristics (uncontrolled NOx level and
NOx reduction efficiency) and heat rate. As shown, the
reference boiler's cost effectiveness and busbar cost are
approximately $1,400 per ton of NOx removed and 3.8 mills/kWh.
Of the parameters shown in figure 6-11, the variation of
capacity factor from 10 to 70 percent and variation of fuel
price differential from $0.50 to $2.50/MMBtu have the greatest
impact on cost effectiveness and busbar cost. The cost
effectiveness value and busbar cost are inversely related to
capacity factor, and thus, as capacity factor decreases, the
cost effectiveness value and busbar cost increase. This is
especially noticeable at low capacity factors where a decrease
of 75 percent in the reference plant's capacity factor (from
40 percent to 10 percent) results in an increase in the cost
effectiveness value and busbar cost of approximately
100 percent.
The cost effectiveness value and busbar cost are linearly
related to fuel price differential. An increase or decrease
of $1.00/MMBtu in the fuel price differential compared to the
reference plant cause a corresponding change in cost
effectiveness and busbar cost of approximately 50 percent.
Variations in economic life and boiler size follow a
trend similar to capacity factor, but do not cause as great a
change in cost effectiveness and busbar cost. For example, a

TABLE 5-14. PERFORMANCE OF SNCR ON CONVENTIONAL U. S. UTILITY BOILERS(Concluded)
6-573

TABLE 5-14. PERFORMANCE OF SNCR ON CONVENTIONAL U. S. UTILITY BOILERS(Concluded)
6-574
decrease of 75 percent in economic life (from 20 to 5 years)
results in an increase in the plant's cost effectiveness value
and busbar cost of nearly 45 percent. Similarly, a decrease
of 75 percent in the boiler size (from 400 to 100 MW) results
in an increase in the plant's cost effectiveness value and
busbar cost of nearly 25 percent.
Variation in the retrofit factor from 1.0 to 1.6 causes
the smallest relative percent change in cost effectiveness and
busbar cost. Increases of 0.1 in the retrofit factor cause a
linear increase of approximately 6 percent in the cost
effectiveness value and busbar cost.
Of the parameters shown in figure 6-12, the variation of
uncontrolled NOx from 0.6 to 1.2 lb/MMBtu has the greatest
impact on cost effectiveness. Uncontrolled NOx levels exhibit
an inverse relationship with the cost effectiveness value. A
30-percent decrease in the reference plant's uncontrolled NOx
level (0.9 to 0.6 lb/MMBtu) results in an increase in the cost
effectiveness value of 50 percent. Variations in the NOx
reduction from 45 to 65 percent and heat rate from 9,200 to
12,800 Btu/kWh have less than a 6-percent change in cost
effectiveness.
The effect of plant characteristics (retrofit factor,
boiler size, capacity factor, and economic life) and fuel
price differential on cost effectiveness and busbar cost for
tangentially-fired boilers is shown in figure 6-13

TABLE 5-14. PERFORMANCE OF SNCR ON CONVENTIONAL U. S. UTILITY BOILERS(Concluded)
6-575Figure 92

TABLE 5-14. PERFORMANCE OF SNCR ON CONVENTIONAL U. S. UTILITY BOILERS(Concluded)
6-576Figure 93
. Figure 6-14 presents the sensitivity of cost effectiveness
TABLE 5-14. PERFORMANCE OF SNCR ON CONVENTIONAL U. S. UTILITY BOILERS(Concluded)
6-577
to NOx emission characteristics (uncontrolled NOx level and
NOx reduction efficiency) and heat rate. As shown, the
reference boiler's cost effectiveness and busbar cost are
approximately $1,800 per ton of NOx removed and 3.8 mills/kWh.
The cost effectiveness value for natural gas reburn applied to
tangentially-fired boilers is generally higher than for
natural gas reburn on wall-fired boilers, because of the lower
uncontrolled NOx levels of tangentially-fired boilers. The
sensitivity curves follow the same general trends as with
natural as reburn applied to wall-fired boilers.

TABLE 5-14. PERFORMANCE OF SNCR ON CONVENTIONAL U. S. UTILITY BOILERS(Concluded)
6-578

TABLE 5-14. PERFORMANCE OF SNCR ON CONVENTIONAL U. S. UTILITY BOILERS(Concluded)
6-579
The effect of plant characteristics (retrofit factor,
boiler size, capacity factor, and economic life) and fuel
price differential on cost effectiveness and busbar cost for
cyclone-fired boilers is shown in figure 6-15

TABLE 5-14. PERFORMANCE OF SNCR ON CONVENTIONAL U. S. UTILITY BOILERS(Concluded)
6-580Figure 94

TABLE 5-14. PERFORMANCE OF SNCR ON CONVENTIONAL U. S. UTILITY BOILERS(Concluded)
6-581Figure 95
. Figure 6-16 presents the sensitivity of cost effectiveness
TABLE 5-14. PERFORMANCE OF SNCR ON CONVENTIONAL U. S. UTILITY BOILERS(Concluded)
6-582
to NOx emission characteristics (uncontrolled NOx level and
NOx reduction efficiency) and heat rate. As shown, the
reference boiler's cost effectiveness and busbar cost are
approximately $840 per ton of NOx removed and 3.8 mills/kWh.
The cost effectiveness value for natural gas reburn applied to
cyclone-fired boilers is lower than for natural gas reburn on
wall-fired boilers because of higher uncontrolled NOx levels
of cyclone-fired boilers. The sensitivity curves follow the
same general trends as with natural gas reburn applied to
wall-fired boilers.
6.4 COMBUSTION MODIFICATIONS FOR NATURAL GAS- AND OIL-FIREDBOILERS
This section presents the capital cost, busbar cost, and
cost effectiveness estimates for operational modifications
(with LEA + BOOS used as an example), LNB, LNB + AOFA, and
reburn applied to natural gas- and oil-fired boilers. Cost
estimates for AOFA by itself are included with the discussion
of LNB + AOFA.
6.4.1 Operational Modifications
6.4.1.1 Costing Procedures. Cost estimates for LEA +
BOOS as an example of operational modifications were prepared
for natural gas- and oil-fired wall and tangential boilers.
The only capital costs required for implementing LEA +
BOOS are costs for emissions and boiler efficiency testing to
determine the optimal fuel and air settings. The cost of a
4-week testing and tuning period was estimated at $75,000.
There are no retrofit costs associated with LEA + BOOS.
Indirect costs were estimated at 25 percent of the direct
costs.
Burners-out-of-service alone can decrease boiler
efficiency by up to 1 percent, which ultimately increases

TABLE 5-14. PERFORMANCE OF SNCR ON CONVENTIONAL U. S. UTILITY BOILERS(Concluded)
6-583

TABLE 5-14. PERFORMANCE OF SNCR ON CONVENTIONAL U. S. UTILITY BOILERS(Concluded)
6-584
annual fuel costs. An average efficiency loss of 0.3 percent
has been reported.13
For the model plant analysis, LEA + BOOS was assumed to
cause a 0.1, 0.3, and 0.5 percent loss in boiler efficiency.
Other O&M costs were assumed to be negligible.
6.4.1.2 Model Plants Results. The capital cost, busbar
cost, and cost effectiveness for the ten wall- and
tangentially-fired model boilers are presented in table 6-9

TABLE 5-14. PERFORMANCE OF SNCR ON CONVENTIONAL U. S. UTILITY BOILERS(Concluded)
6-585
TABLE 6-9. COSTS FOR LEA + BOOS APPLIED TO NATURAL GAS- AND OIL-FIRED
BOILERS
Plant
identification
Total capital cost,
$/kW
Busbar cost,
mills/kWh
Cost effectiveness,
$/ton
Efficiency loss
(%)
0.5
299
218
211
205
202
498
363
352
342
336
reduction of
40 percent were used for wall-fired boilers.
Peaking = 10 percent capacity factor.
Baseload = 65 percent capacity factor.
Cycling = 30 percent capacity factor.
reduction of
40 percent were used for tangentially-fired boilers.

TABLE 5-14. PERFORMANCE OF SNCR ON CONVENTIONAL U. S. UTILITY BOILERS(Concluded)
6-586
. For all of these boilers, an economic life of 20 years and
a NOx reduction efficiency of 40 percent were assumed. For
the 600 MW baseload wall-fired boiler, the estimated cost
effectiveness ranges from $43 to $202 per ton of NOx removed.
For the 100 MW peaking wall-fired boiler, the estimated cost
effectiveness ranges from $140 to $299 per ton.
Cost per ton of NOx removed for tangential units is
higher than for wall-fired units due to lower uncontrolled NOx
levels and, therefore, fewer tons of NOx removed. The cost
effectiveness values for the tangentially-fired units ranges
from $71 to $336 per ton for the 600 MW boiler and $234 to
$498 for the 100 MW peaking boiler.
6.4.1.3 Sensitivity Analysis. The effect of plant
characteristics (boiler size, capacity factor, and economic
life) and boiler efficiency on cost effectiveness and busbar
cost for wall-fired boilers is shown in figure 6-17

TABLE 5-14. PERFORMANCE OF SNCR ON CONVENTIONAL U. S. UTILITY BOILERS(Concluded)
6-587Figure 96

TABLE 5-14. PERFORMANCE OF SNCR ON CONVENTIONAL U. S. UTILITY BOILERS(Concluded)
6-588Figure 97
. Figure 6-18 presents the sensitivity of cost effectiveness

TABLE 5-14. PERFORMANCE OF SNCR ON CONVENTIONAL U. S. UTILITY BOILERS(Concluded)
6-589
to NOx emission characteristics (uncontrolled NOx level and
NOx reduction efficiency) and heat rate. As shown in
figure 6-18, because equal percent changes in boiler size and
capacity factor result in equivalent changes in cost
effectiveness, these two curves overlap. As shown in both
figures, the reference boiler's cost effectiveness and busbar
cost are approximately $130 per ton of NOx removed and
0.14 mills/kWh.
Of the parameters shown in figure 6-17, the variation of
efficiency loss from 0.0 to 0.6 percent has the greatest
impact on cost effectiveness and busbar cost. The cost
effectiveness value and busbar cost are linearly related to

TABLE 5-14. PERFORMANCE OF SNCR ON CONVENTIONAL U. S. UTILITY BOILERS(Concluded)
6-590

TABLE 5-14. PERFORMANCE OF SNCR ON CONVENTIONAL U. S. UTILITY BOILERS(Concluded)
6-591
TABLE 5-14. PERFORMANCE OF SNCR ON CONVENTIONAL U. S. UTILITY BOILERS(Concluded)
6-592
fuel price differential. A 0.1 percent boiler efficiency loss
results in an increase in the cost effectiveness value and
busbar cost of 30 percent.
Variations in boiler size, capacity factor, and economic
life follow similar trends, and have less impact on cost
effectiveness and busbar cost than fuel price differential.
For example, a decrease of 75 percent in boiler size and
capacity factor result in an increase in the plant's cost
effectiveness value and busbar cost of approximately
20 percent. A decrease of 75 percent in economic life result
in an increase of the plant's cost effectiveness value and
busbar cost of less than 10 percent.
Of the parameters shown in figure 6-18, the variation of
uncontrolled NOx from 0.2 to 0.8 lb/MMBtu has the greatest
impact on cost effectiveness. Uncontrolled NOx roughly
exhibits a inverse relationship with the cost effectiveness
value. A 60 percent decrease in the reference plant's
uncontrolled NOx level (0.5 to 0.2 lb/MMBtu) results in an
increase in the cost value effectiveness of 60 percent.
Variations in the NOx reduction follow a trend similar to
uncontrolled NOx, but do not cause as great a change in cost
effectiveness. For example, a decrease of 25 percent in NOx
reduction (from 40 to 30 percent) results in an increase in
the plant's cost effectiveness value and busbar cost of nearly
30 percent. Variation in heat rate has very little effect
upon cost effectiveness.
The effect of plant characteristics (boiler size,
capacity factor, and economic life) and boiler efficiency loss
on cost effectiveness and busbar cost for tangentially-fired
boilers is shown in figure 6-19

TABLE 5-14. PERFORMANCE OF SNCR ON CONVENTIONAL U. S. UTILITY BOILERS(Concluded)
6-593Figure 98

TABLE 5-14. PERFORMANCE OF SNCR ON CONVENTIONAL U. S. UTILITY BOILERS(Concluded)
6-594Figure 99
. Figure 6-20 presents the sensitivity of cost effectiveness

TABLE 5-14. PERFORMANCE OF SNCR ON CONVENTIONAL U. S. UTILITY BOILERS(Concluded)
6-595
to NOx emission characteristics (uncontrolled NOx level and
NOx reduction efficiency) and heat rate. As shown in
figure 6-20, because equal percent changes in boiler size and
capacity factor result in equivalent changes in cost
effectiveness, these two curves overlap. As shown in both
figures, the reference

TABLE 5-14. PERFORMANCE OF SNCR ON CONVENTIONAL U. S. UTILITY BOILERS(Concluded)
6-596

TABLE 5-14. PERFORMANCE OF SNCR ON CONVENTIONAL U. S. UTILITY BOILERS(Concluded)
6-597
boiler's cost effectiveness and busbar cost are approximately
$200 per ton of NOx removed and 0.14 mills/kWh. The cost
effectiveness values for LEA + BOOS applied to tangentially-
fired boilers is higher for LEA + BOOS than on wall-fired
boilers because of the low uncontrolled NOx levels of
tangentially-fired boilers. The sensitivity curves follow the
same general trends as with LEA + BOOS applied to wall-fired
boilers.
6.4.2 Low NOx Burners
Cost estimates for LNB technology are presented for
natural gas- and oil-fired wall and tangential boilers in this
section. Estimated NOx reductions and capital costs for AOFA
by itself are 40 to 50 percent of the levels expected from LNB
+ AOFA. As a result, busbar cost for AOFA by itself are
estimated at 40 to 50 percent of the cost estimates in this
section for LNB + AOFA and cost effectiveness values are
estimated to approximately equal those for LNB + AOFA.
6.4.2.1 Costing Procedures. Cost data from the utility
questionnaire for LNB applied to natural gas- and oil-fired
wall boilers were limited to an installed cost for one oil-
fired wall unit. The data from this unit were combined with
literature estimates of installed costs for two natural gas-
and oil-fired boilers.13 These three data points were then
compared to installed costs for coal-fired wall LNB systems
assuming a retrofit factor of 1.15. As discussed in
appendix A.8, these data suggest that installed costs for
natural gas- and oil-fired boilers are equal to the costs for
coal-fired boilers. As a result, the LNB basic system cost
algorithm for coal-fired wall boilers was used to estimate the
costs for natural gas- and oil-fired LNB systems. Thus, the
basic system cost coefficients in equation 6-1 were a=220 and
b=-0.44 for wall-fired LNB systems.

TABLE 5-14. PERFORMANCE OF SNCR ON CONVENTIONAL U. S. UTILITY BOILERS(Concluded)
6-598
For LNB applied to natural gas- and oil-fired tangential
boilers, no cost data were available. Because of similarities
between LNB technology applied to all fossil fuels, the costs
for LNB on natural gas- and oil-fired tangential boilers were
assumed to be equal to costs associated with LNB applied to
coal-fired tangential boilers. Thus, the basic system cost
coefficients in equation 6-1 were a=80 and b=-0.40 for
tangentially-fired LNB systems. Because specific data on
scope adders for gas- and oil-fired units were not available,
the retrofit factors for coal-fired boilers of 1.0, 1.3, and
1.6 were used for the model plant analysis. Indirect costs
were estimated at 30 percent of basic system and retrofit
costs. Fixed and variable O&M costs were assumed to be
negligible.
6.4.2.2 Model Plants Results. The capital cost, busbar
cost, and cost effectiveness for the ten wall- and
tangentially-fired model boilers are presented in table 6-10

TABLE 5-14. PERFORMANCE OF SNCR ON CONVENTIONAL U. S. UTILITY BOILERS(Concluded)
6-599
TABLE 6-10. COSTS FOR LNB APPLIED TO NATURAL GAS- AND OIL-FIRED BOILERS
Plant
identification
Total capital cost,
$/kW
Busbar cost,
mills/kWh
Cost effectiveness,
$/ton
1.6
5,750
1,110
1,340
682
503
4,190
806
1,020
519
394
reduction of
45 percent
were used for wall-fired boilers.
Peaking = 10 percent capacity factor.
Baseload = 65 percent capacity factor.
Cycling = 30 percent capacity factor.
reduction of
45 percent
were used for tangentially-fired boilers.
TABLE 5-14. PERFORMANCE OF SNCR ON CONVENTIONAL U. S. UTILITY BOILERS(Concluded)
6-600
. An economic life of 20 years and a NOx reduction efficiency
of 45 percent were assumed for all of these boilers. For the
600 MW baseload wall-fired boiler, the estimated cost
effectiveness ranges from $314 to $503 per ton of NOx removed.
For the 100-MW peaking wall-fired boiler, the estimated cost
effectiveness ranges from $3,600 to $5,750 per ton.
Cost per ton of NOx removed with LNB on
tangentially-fired boilers is lower than LNB on wall-fired
boilers because of the lower capital cost with LNCFS I. For
the 600 MW baseload tangentially-fired boiler, the cost-
effectiveness ranges from $246 to $394 per ton. For the 100
MW peaking tangentially-fired boiler, cost effectiveness
ranges from $2,620 to $4,190 per ton.
6.4.2.3 Sensitivity Analysis. The effect of plant
characteristics (retrofit factor, boiler size, capacity
factor, and economic life) on cost effectiveness and busbar
cost for wall-fired boilers is shown in figure 6-21

TABLE 5-14. PERFORMANCE OF SNCR ON CONVENTIONAL U. S. UTILITY BOILERS(Concluded)
6-601Figure 100

TABLE 5-14. PERFORMANCE OF SNCR ON CONVENTIONAL U. S. UTILITY BOILERS(Concluded)
6-602Figure 101
. Figure 6-22 presents the sensitivity of cost effectiveness
TABLE 5-14. PERFORMANCE OF SNCR ON CONVENTIONAL U. S. UTILITY BOILERS(Concluded)
6-603
to NOx emission characteristics (uncontrolled NOx level and
NOx reduction efficiency) and heat rate. As shown in these
figures, the reference boiler's cost effectiveness and busbar
cost are approximately $720 per ton of NOx removed and
0.89 mills/kWh. The sensitivity curves follow the same

TABLE 5-14. PERFORMANCE OF SNCR ON CONVENTIONAL U. S. UTILITY BOILERS(Concluded)
6-604
TABLE 5-14. PERFORMANCE OF SNCR ON CONVENTIONAL U. S. UTILITY BOILERS(Concluded)
6-605

TABLE 5-14. PERFORMANCE OF SNCR ON CONVENTIONAL U. S. UTILITY BOILERS(Concluded)
6-606
general trends as with LNB applied to coal-fired wall boilers
(refer to section 6.3.1.3).
The effect of plant characteristics (retrofit factor,
boiler size, capacity factor, and economic life) on cost
effectiveness and busbar cost for tangentially-fired boilers
is shown in figure 6-23

TABLE 5-14. PERFORMANCE OF SNCR ON CONVENTIONAL U. S. UTILITY BOILERS(Concluded)
6-607Figure 102

TABLE 5-14. PERFORMANCE OF SNCR ON CONVENTIONAL U. S. UTILITY BOILERS(Concluded)
6-608Figure 103
. Figure 6-24 presents the sensitivity of cost effectiveness

TABLE 5-14. PERFORMANCE OF SNCR ON CONVENTIONAL U. S. UTILITY BOILERS(Concluded)
6-609
to NOx emission characteristics (uncontrolled NOx level and
NOx reduction efficiency) and heat rate. As shown in the
figures, the reference boiler's cost effectiveness and busbar
cost are approximately $560 per ton of NOx removed and
0.41 mills/kWh. The cost effectiveness values and busbar
costs for LNB applied to tangentially-fired boilers are lower
than for LNB on wall-fired boilers because of lower capital
costs associated with tangentially-fired boilers. The
sensitivity curves follow the same general trends as with LNB
applied to coal-fired wall boilers (refer to section 6.3.1.3).
6.4.3 Low NOx Burners with Advanced Overfire Air
Cost estimates for LNB + AOFA technology were prepared
for natural gas- and oil-fired wall and tangential boilers.
6.4.3.1 Costing Procedures. No cost data were available
on LNB + AOFA technology applied to natural gas- and oil-fired
wall and tangential units. However, because of the similarity
between LNB technology applied to all fossil fuels, costs for
LNB + AOFA on natural gas- and oil-fired boilers were assumed
to be equal to the costs for LNB + AOFA technology on coal-
fired boilers. Thus, the basic system cost coefficients in
equation 6-1 were a=552 and b=-0.40 for wall-fired LNB + AOFA
systems and a=247 and b=-0.49 for tangentially-fired
LNB + AOFA systems. Due to the lack of actual cost data, the
specific scope adders for natural gas- and oil-fired boilers
could not be estimated. As a result, the same scope adder
costs for coal-fired units were assumed to be applicable to
natural gas- and oil-fired boilers. Therefore, the retrofit
factors are 1.0, 1.3, and 1.6. Indirect costs were estimated
at 30 percent of basic system and retrofit costs. Fixed and

TABLE 5-14. PERFORMANCE OF SNCR ON CONVENTIONAL U. S. UTILITY BOILERS(Concluded)
6-610
TABLE 5-14. PERFORMANCE OF SNCR ON CONVENTIONAL U. S. UTILITY BOILERS(Concluded)
6-611
variable O&M costs were assumed to be negligible.
6.4.3.2 Model Plants Results. The capital cost, busbar
cost, and cost effectiveness for the ten wall- and
tangentially-fired model boilers are presented in table 6-11

TABLE 5-14. PERFORMANCE OF SNCR ON CONVENTIONAL U. S. UTILITY BOILERS(Concluded)
6-612
TABLE 6-11. COSTS FOR LNB + AOFA BURNERS APPLIED TO NATURAL
GAS- AND OIL-FIRED BOILERS
Plant
identification
Total capital cost,
$/kW
Busbar cost,
mills/kWh
Cost effectiveness,
$/ton
1.6
9,850
1,900
2,160
1,090
774
7,690
1,480
1,700
864
615
reduction of
50 percent
were used for wall-fired boilers.
Peaking = 10 percent capacity factor.
Baseload = 65 percent capacity factor.
Cycling = 30 percent capacity factor.
reduction of
50 percent

TABLE 5-14. PERFORMANCE OF SNCR ON CONVENTIONAL U. S. UTILITY BOILERS(Concluded)
6-613
. An economic life of 20 years and a NOx reduction efficiency
of 50 percent were assumed for all of these boilers. For the
600 MW baseload wall-fired boiler, the estimated cost-
effectiveness ranges from $483 to $774 per ton of NOx removed.
For the 100-MW peaking wall-fired boiler, the estimated cost
effectiveness ranges from $6,160 to $9,850 per ton.
Cost per ton of NOx removed with LNB + AOFA is lower for
tangentially-fired units due to the lower capital cost of
LNCFS III. For the 600-MW baseload tangentially-fired boiler,
the cost effectiveness ranges from $384 to $615 per ton. For
the 100 MW peaking tangentially-fired boiler, cost
effectiveness ranges from $4,810 to $7,690 per ton.
6.4.3.3 Sensitivity Analysis. The effect of plant
characteristics (retrofit factor, boiler size, capacity
factor, and economic life) on cost effectiveness and busbar
cost for wall-fired boilers is shown in figure 6-25

TABLE 5-14. PERFORMANCE OF SNCR ON CONVENTIONAL U. S. UTILITY BOILERS(Concluded)
6-614Figure 104

TABLE 5-14. PERFORMANCE OF SNCR ON CONVENTIONAL U. S. UTILITY BOILERS(Concluded)
6-615Figure 105
. Figure 6-26 presents the sensitivity of cost effectiveness
TABLE 5-14. PERFORMANCE OF SNCR ON CONVENTIONAL U. S. UTILITY BOILERS(Concluded)
6-616
to NOx emission characteristics (uncontrolled NOx level and
NOx reduction efficiency) and heat rate. As shown in the
figures, the reference boiler's cost effectiveness and busbar
cost are approximately $1,200 per ton of NOx removed and
1.6 mills/kWh. The sensitivity curves follow the same general
trends as with LNB applied to coal-fired wall boilers (refer
to section 6.3.1.3).
The effect of plant characteristics (retrofit factor,
boiler size, capacity factor, and economic life) on cost
effectiveness and busbar cost for tangentially-fired boilers
is shown in figure 6-27

TABLE 5-14. PERFORMANCE OF SNCR ON CONVENTIONAL U. S. UTILITY BOILERS(Concluded)
6-617Figure 106

TABLE 5-14. PERFORMANCE OF SNCR ON CONVENTIONAL U. S. UTILITY BOILERS(Concluded)
6-618Figure 107
. Figure 6-28 presents the sensitivity of cost effectiveness

TABLE 5-14. PERFORMANCE OF SNCR ON CONVENTIONAL U. S. UTILITY BOILERS(Concluded)
6-619
to NOx emission characteristics (uncontrolled NOx level and
NOx reduction efficiency) and heat rate. As shown in the
figures, the reference boiler's cost effectiveness and busbar
cost are approximately $900 per ton

TABLE 5-14. PERFORMANCE OF SNCR ON CONVENTIONAL U. S. UTILITY BOILERS(Concluded)
6-620

TABLE 5-14. PERFORMANCE OF SNCR ON CONVENTIONAL U. S. UTILITY BOILERS(Concluded)
6-621

TABLE 5-14. PERFORMANCE OF SNCR ON CONVENTIONAL U. S. UTILITY BOILERS(Concluded)
6-622

TABLE 5-14. PERFORMANCE OF SNCR ON CONVENTIONAL U. S. UTILITY BOILERS(Concluded)
6-623
TABLE 5-14. PERFORMANCE OF SNCR ON CONVENTIONAL U. S. UTILITY BOILERS(Concluded)
6-624
of NOx removed and 0.74 mills/kWh. The cost effectiveness
value and busbar cost for LNB + AOFA applied to tangentially-
fired boilers are lower than for LNB + AOFA on wall-fired
boilers because of lower capital costs associated with
tangentially-fired boilers. The sensitivity curves follow the
same general trends as with LNB applied to coal-fired wall
boilers (refer to section 6.3.1.3).
6.4.4 Natural Gas Reburn
Cost estimates for NGR were prepared for wall and
tangential oil-fired boilers.
6.4.4.1 Costing Procedures. No actual cost data were
received from utilities or vendors for reburn applied to oil-
fired boilers. Because of the general similarity between the
application of reburn to both oil- and coal-fired boilers, the
capital cost procedures that were used for coal-fired boilers
were also used for oil-fired boilers. Therefore, the
coefficients in equation 6-1 are a=243 and b=-0.40. The
retrofit factor and indirect cost factor were estimated to be
1.15 and 1.40, respectively.
Although the national average price of fuel oil is higher
per million Btu than natural gas, there are regions of the
country (e.g., New England) where fuel oil is the less
expensive fuel. As a result, fuel oil is the primary boiler
fuel in these areas. In these situations, natural gas reburn
can be used as an economic option to reduce NOx emissions.
For the economic analysis of natural gas reburn on oil-fired
boilers, a price differential between these two fuels of $0.50
to $2.50/MMBtu was assumed. To account for the lower sulfur
content of natural gas compared to fuel oil, a credit for
reduced SO2 emissions of $200 per ton was used. Based on a
fuel oil sulfur content of 1.0 percent, this credit equates to
approximately $0.16/MMBtu of natural gas fired.

TABLE 5-14. PERFORMANCE OF SNCR ON CONVENTIONAL U. S. UTILITY BOILERS(Concluded)
6-625
6.4.4.2 Model Plants Results. The capital cost, busbar
cost, and cost effectiveness for the ten wall- and
tangentially-fired model boilers are presented in table 6-12

TABLE 5-14. PERFORMANCE OF SNCR ON CONVENTIONAL U. S. UTILITY BOILERS(Concluded)
6-626
TABLE 6-12. COSTS FOR NGR APPLIED TO OIL-FIRED BOILERS
Plant
identification
Total capital cost,
$/kW
Busbar cost,
mills/kWh
Cost effectiveness,
$/ton
Fuel price
differential
($/MMBtu)
2.50
7,690
4,010
4,250
3,700
3,560
12,800
6,690
7,080
6,170
5,940
reduction of
55 percent
were used for wall-fired boilers.
Peaking = 10 percent capacity factor.
Baseload = 65 percent capacity factor.
Cycling = 30 percent capacity factor.
reduction of
55 percent

TABLE 5-14. PERFORMANCE OF SNCR ON CONVENTIONAL U. S. UTILITY BOILERS(Concluded)
6-627
. An economic life of 20 years and a NOx reduction efficiency
of 55 percent were assumed for all of these boilers. For the
600 MW baseload wall-fired boiler, the estimated cost
effectiveness ranges from $950 to $3,560 per ton of NOx
removed. For the 100 MW peaking wall-fired boiler, the
estimated cost effectiveness ranges from $5,080 to $7,690 per
ton.
Cost per ton of NOx removed with natural gas reburn on
tangentially-fired boilers is higher than that of wall-fired
boilers because of lower baseline NOx emissions for
tangentially-fired boilers. For the 600 MW baseload
tangentially-fired boiler, the cost effectiveness ranges from
$1,580 to $5,940 per ton. For the 100 MW peaking
tangentially-fired boiler, cost effectiveness ranges from
$8,460 to $12,800 per ton.
6.4.4.3 Sensitivity Analysis. The effect of plant
characteristics (retrofit factor, boiler size, capacity
factor, and economic life) and fuel price differential on cost
effectiveness and busbar cost for wall-fired boilers is shown
in figure 6-29

TABLE 5-14. PERFORMANCE OF SNCR ON CONVENTIONAL U. S. UTILITY BOILERS(Concluded)
6-628Figure 108

TABLE 5-14. PERFORMANCE OF SNCR ON CONVENTIONAL U. S. UTILITY BOILERS(Concluded)
6-629Figure 109
. Figure 6-30 presents the sensitivity of cost effectiveness

TABLE 5-14. PERFORMANCE OF SNCR ON CONVENTIONAL U. S. UTILITY BOILERS(Concluded)
6-630
to NOx emission characteristics (uncontrolled NOx level and
NOx reduction efficiency) and heat rate. As shown, the
reference boilers cost effectiveness and busbar cost are
approximately $2,700 per ton of NOx removed and 4.0 mills/kWh.
The sensitivity curves follow the same general trends as for
natural gas reburn applied to coal-fired wall boilers (refer
to section 6.3.3.3).
The effect of plant characteristics (retrofit factor,
boiler size, capacity factor, and economic life) and fuel
price differential on cost effectiveness and busbar cost for
tangentially-fired boilers is shown in figure 6-31

TABLE 5-14. PERFORMANCE OF SNCR ON CONVENTIONAL U. S. UTILITY BOILERS(Concluded)
6-631Figure 110

TABLE 5-14. PERFORMANCE OF SNCR ON CONVENTIONAL U. S. UTILITY BOILERS(Concluded)
6-632Figure 111
. Figure 6-32 presents the sensitivity of cost effectiveness

TABLE 5-14. PERFORMANCE OF SNCR ON CONVENTIONAL U. S. UTILITY BOILERS(Concluded)
6-633
to NOx emission characteristics (uncontrolled NOx level and
NOx

TABLE 5-14. PERFORMANCE OF SNCR ON CONVENTIONAL U. S. UTILITY BOILERS(Concluded)
6-634

TABLE 5-14. PERFORMANCE OF SNCR ON CONVENTIONAL U. S. UTILITY BOILERS(Concluded)
6-635

TABLE 5-14. PERFORMANCE OF SNCR ON CONVENTIONAL U. S. UTILITY BOILERS(Concluded)
6-636

TABLE 5-14. PERFORMANCE OF SNCR ON CONVENTIONAL U. S. UTILITY BOILERS(Concluded)
6-637

TABLE 5-14. PERFORMANCE OF SNCR ON CONVENTIONAL U. S. UTILITY BOILERS(Concluded)
6-638
reduction efficiency) and heat rate. As shown, the reference
boiler's cost effectiveness and busbar cost are approximately
$4,450 per ton of NOx removed and 4.0 mills/kWh. The cost
effectiveness values for natural gas reburn applied to
tangentially-fired boilers is generally higher than for
natural gas reburn on wall-fired boilers because of the lower
uncontrolled NOx levels of tangentially-fired boilers The
sensitivity curves follow the same general trends as for
natural gas reburn applied to coal-fired wall boilers (refer
to section 6.3.3.3).
6.5 FLUE GAS TREATMENT CONTROLS
This section presents the capital cost, busbar cost, and
cost-effectiveness estimates for flue gas treatment controls
on fossil fuel boilers. Costs for SNCR are given in
section 6.5.1 and costs for SCR are in section 6.5.2. Costs
for combining LNB + SNCR are presented in section 6.5.3 and
the cost of LNB + OFA + SCR are given in section 6.5.4.
6.5.1 Selective Noncatalytic Reduction
Cost estimates for SNCR technology are presented in this
section for coal-fired wall, tangential, cyclone, and FBC
boilers, and for natural gas- and oil-fired wall and
tangential boilers. Because the cost estimates for a low-
energy, urea-based SNCR system were found to be comparable in
cost to a high-energy NH3-based SNCR system, results are only
presented for the low-energy, urea-based SNCR system.
6.5.1.1 Costing Procedures. Vendor cost estimates were
used to develop the capital cost algorithms.14 Each boiler was
assumed to have two levels of wall injectors and one level of
lance injectors. Since FBC units are typically smaller and
have different operating characteristics than wall-,
tangential-, or cyclone-fired boilers, these units have a
greater likelihood of needing less than three levels of
injectors. If two levels of injectors were eliminated on the

TABLE 5-14. PERFORMANCE OF SNCR ON CONVENTIONAL U. S. UTILITY BOILERS(Concluded)
6-639
FBC units, cursory analysis indicates that levelized
technology costs could decrease 40 percent.
The injected urea solution was assumed to be 10 percent
urea by weight, 90 percent dilution water. The normalized
stoichiometric ratio (NSR) was assumed to be 1.0. Simplified
algorithms in the form of equation 6-1 were developed from the
capital cost estimates. The capital cost coefficients for the
three coal-fired boilers were nearly identical, therefore,
a=32 and b=-0.24 was used to characterize the costs for all
three. Similarly, the cost coefficients for both natural gas-
and oil-fired boilers were nearly identical, and coefficients
of a=31 and b=-0.25 were used to characterize costs for both.
Vendor cost estimates were also used to estimate fixed
O&M costs. The costs for an SNCR system include operating,
maintenance, supervisory labor, and maintenance materials.
Fixed O&M costs were found to be independent of fuel type.
Simplified algorithms in the form of equation A.5
(appendix A.1) were developed from the vendor estimates.15 The
boilers had fixed O&M cost coefficients of a=85,700 and
b=-0.21.
Variable O&M costs include the urea solution (chemical
costs), energy losses due to mixing air, energy losses due to
the vaporization of the urea solution, dilution water, and
electricity costs necessary to operate the air compressor and
other miscellaneous equipment. The chemical costs were
estimated by determining the amount of urea that had to be
injected as a function of the baseline NOx emission levels and
the assumed NSR of 1.0. The amount of urea injected was
multiplied by solution price to determine the chemical cost.
The amount of urea injected was also used to determine the
energy loss to the injected solution. This energy loss was
multiplied by the fuel cost to determine the costs.
Electricity costs were determined as a function of unit size

TABLE 5-14. PERFORMANCE OF SNCR ON CONVENTIONAL U. S. UTILITY BOILERS(Concluded)
6-640
and reagent injection rate. Appendix A.10 presents the
equation for calculating urea cost.
A retrofit factor of 1.0 was assumed for the analysis
based upon the assumption that the retrofit of SNCR has few
scope adders and work area congestion is not a significant
factor for retrofitting the technology (refer to
section 6.1.1.2). The indirect cost factor was assumed to be
1.3. However, due to the limited SNCR applications on boilers
with generating capabilities of over 200 MW, the indirect
costs on these units may be a greater percentage of total
direct costs then on smaller units.
6.5.1.2 Model Plants Results.
6.5.1.2.1 Coal-fired model plants. The capital cost,
busbar cost, and cost effectiveness for the 20 coal-fired
wall, tangential, cyclone, and FBC boilers are presented in
table 6-13

TABLE 5-14. PERFORMANCE OF SNCR ON CONVENTIONAL U. S. UTILITY BOILERS(Concluded)
6-641
Table 13
TABLE 5-14. PERFORMANCE OF SNCR ON CONVENTIONAL U. S. UTILITY BOILERS(Concluded)
6-642
Table 13 (cont.)

TABLE 5-14. PERFORMANCE OF SNCR ON CONVENTIONAL U. S. UTILITY BOILERS(Concluded)
6-643
. An economic life of 20 years and a NOx reduction efficiency
of 45 percent were assumed for all of these boilers. The urea
price for each boiler was varied from $140 to $260 per ton for
a 50-percent urea solution. For the 600 MW baseload wall-
fired boiler, the estimated cost effectiveness ranges from
$560 to $870 per ton of NOx removed. For the 100 MW peaking
wall-fired boiler, the estimated cost effectiveness ranges
from $2,160 to $2,470 per ton.
Cost per ton of NOx removed with SNCR on tangential
coal-fired boilers is higher than wall-fired boilers because
of lower uncontrolled NOx for tangentially-fired boilers.
Cost effectiveness for the 600 MW baseload tangentially-fired
boiler ranges from $610 to $910 per ton. For the 100 MW
peaking tangentially-fired boiler, cost effectiveness ranges
from $2,660 to $2,960 per ton.
Cost per ton of NOx removed with SNCR on cyclone boilers
is lower than wall- and tangentially-fired boilers because of
higher uncontrolled NOx for cyclone boilers. Cost
effectiveness for the 600 MW baseload cyclone boiler ranges
from $510 to $820 per ton and for the 100 MW peaking cyclone
boiler, cost effectiveness ranges from $1,460 to $1,780 per
ton.
Cost per ton of NOx removed with SNCR on an FBC boiler is
higher than wall-, tangentially- and cyclone-fired boilers due
to the lower uncontrolled NOx levels on FBC boilers as
compared to the other three types of boilers. Cost

TABLE 5-14. PERFORMANCE OF SNCR ON CONVENTIONAL U. S. UTILITY BOILERS(Concluded)
6-644

TABLE 5-14. PERFORMANCE OF SNCR ON CONVENTIONAL U. S. UTILITY BOILERS(Concluded)
6-645
effectiveness for the 200 MW baseload FBC boiler ranges from
$1,520 to $1,820 per ton. For the 50 MW cycling FBC boiler,
cost effectiveness ranges from $5,100 to $5,410 per ton.
6.5.1.2.2 Natural gas- and oil-fired model plants. The
capital cost, busbar cost, and cost effectiveness for the
10 natural gas- and oil-fired wall and tangential model
boilers are presented in table 6-14.

TABLE 5-14. PERFORMANCE OF SNCR ON CONVENTIONAL U. S. UTILITY BOILERS(Concluded)
6-646
TABLE 6-14. COSTS FOR SNCR APPLIED TO NATURAL GAS- AND OIL-FIRED BOILERS
Plant
identification
Total capital cost,
$/kW
Busbar cost,
mills/kWh
Cost effectiveness,
$/ton
260
4,850
1,690
1,760
1,350
1,240
7,450
2,180
2,300
1,620
1,430
reduction of
35 percent
were used for wall-fired boilers.
Peaking = 10 percent capacity factor.
Baseload = 65 percent capacity factor.
Cycling = 30 percent capacity factor.
reduction of
35 percent
were used for tangentially-fired boilers.

TABLE 5-14. PERFORMANCE OF SNCR ON CONVENTIONAL U. S. UTILITY BOILERS(Concluded)
6-647
An economic life of 20 years and a NOx reduction efficiency
of 35 percent were assumed for all of these boilers. For the
600 MW baseload wall-fired boiler, the estimated cost
effectiveness ranges from $859 to $1,240 per ton of NOx
removed. For the 100 MW peaking wall-fired boiler, the
estimated cost effectiveness ranges from $4,470 to $4,850 per
ton.
Cost per ton of NOx removed with SNCR on tangential
boilers is higher than wall-fired boilers because of lower
baseline NOx for the tangentially-fired boilers. Cost
effectiveness for the 600 MW baseload tangentially-fired
boiler ranges from $1,070 to $1,430 per ton. For the 100 MW
peaking tangentially-fired boiler, cost effectiveness ranges
from $7,090 to $7,450 per ton.
6.5.1.3 Sensitivity Analysis
6.5.1.3.1 Coal-fired boiler sensitivity analysis. The
effect of plant characteristics (boiler size, capacity factor,
and economic life) and urea solution on cost effectiveness and
busbar cost for wall-fired boilers is shown in figure 6-33

TABLE 5-14. PERFORMANCE OF SNCR ON CONVENTIONAL U. S. UTILITY BOILERS(Concluded)
6-648Figure 112

TABLE 5-14. PERFORMANCE OF SNCR ON CONVENTIONAL U. S. UTILITY BOILERS(Concluded)
6-649Figure 113
. Figure 6-34 presents the sensitivity of cost effectiveness

TABLE 5-14. PERFORMANCE OF SNCR ON CONVENTIONAL U. S. UTILITY BOILERS(Concluded)
6-650
to NOx emission characteristics (uncontrolled NOx level and
NOx reduction efficiency) and heat rate. As shown in the
figures, the reference boiler's cost effectiveness and busbar
cost are approximately $820 per ton of NOx removed and
1.8 mills/kWh.
Of the parameters shown in figure 6-33, the variation of
capacity factor from 10 to 70 percent has the greatest impact
on cost effectiveness and busbar cost. The cost effectiveness
value and busbar cost are inversely related to capacity
factor, and thus, as capacity factor decreases, the cost
effectiveness value and busbar cost increase. This is

TABLE 5-14. PERFORMANCE OF SNCR ON CONVENTIONAL U. S. UTILITY BOILERS(Concluded)
6-651

TABLE 5-14. PERFORMANCE OF SNCR ON CONVENTIONAL U. S. UTILITY BOILERS(Concluded)
6-652

TABLE 5-14. PERFORMANCE OF SNCR ON CONVENTIONAL U. S. UTILITY BOILERS(Concluded)
6-653
especially noticeable at low capacity factors where a decrease
of 75 percent in the reference plant's capacity factor (from
40 percent to 10 percent) results in an increase in the cost
effectiveness value and busbar cost of nearly 90 percent.
Variations in economic life and boiler size follow a
trend similar to capacity factor, but do not cause as great a
change in cost effectiveness and busbar cost. For example, a
decrease of 75 percent in economic life (from 20 to 5 years)
results in an increase in the plant's cost effectiveness value
and busbar cost of approximately 30 percent. Similarly, a
decrease of 75 percent in the boiler size (from 400 to 100 MW)
results in an increase in the plant's cost effectiveness value
and busbar cost of nearly 25 percent.
Cost effectiveness shown in figure 6-34, the variation of
NOx reduction from 30 to 60 percent has the greatest impact on
cost effectiveness. Variation in NOx reduction is inversely
related to cost effectiveness and busbar cost. A 50-percent
decrease in the reference plant's NOx reduction (45 to
30 percent) results in an increase in the cost effectiveness
value of approximately 50 percent. Variations in the
uncontrolled NOx level and heat rate have less than a
5-percent change in cost effectiveness.
The effect of plant characteristics (boiler size,
capacity factor, and economic life) and urea solution price on
cost effectiveness and busbar cost for tangentially-fired
boilers is shown in figure 6-35

TABLE 5-14. PERFORMANCE OF SNCR ON CONVENTIONAL U. S. UTILITY BOILERS(Concluded)
6-654Figure 114

TABLE 5-14. PERFORMANCE OF SNCR ON CONVENTIONAL U. S. UTILITY BOILERS(Concluded)
6-655Figure 115
. Figure 6-36 presents the sensitivity of cost effectiveness

TABLE 5-14. PERFORMANCE OF SNCR ON CONVENTIONAL U. S. UTILITY BOILERS(Concluded)
6-656
to NOx emission characteristics (uncontrolled NOx level and
NOx reduction efficiency) and heat rate. As shown in the
figures, the reference boiler's cost effectiveness and busbar
cost are approximately $900 per ton of NOx removed and
1.6 mills/kWh. The cost effectiveness values of SNCR applied
to tangentially-fired boilers are slightly higher than for
SNCR on wall-fired boilers because of lower uncontrolled NOx
levels of tangentially-fired boilers, although the busbar cost
is less because of the smaller amount of urea that must be
injected to

TABLE 5-14. PERFORMANCE OF SNCR ON CONVENTIONAL U. S. UTILITY BOILERS(Concluded)
6-657

TABLE 5-14. PERFORMANCE OF SNCR ON CONVENTIONAL U. S. UTILITY BOILERS(Concluded)
6-658
achieve an equivalent percent NOx reduction. The sensitivity
curves follow the same general trends as with SNCR applied to
wall-fired boilers.
The effect of plant characteristics (boiler size,
capacity factor, and economic life) and urea solution price on
cost effectiveness and busbar cost for cyclone boilers is
shown in figure 6-37

TABLE 5-14. PERFORMANCE OF SNCR ON CONVENTIONAL U. S. UTILITY BOILERS(Concluded)
6-659Figure 116

TABLE 5-14. PERFORMANCE OF SNCR ON CONVENTIONAL U. S. UTILITY BOILERS(Concluded)
6-660Figure 117
. Figure 6-38 presents the sensitivity of cost effectiveness
TABLE 5-14. PERFORMANCE OF SNCR ON CONVENTIONAL U. S. UTILITY BOILERS(Concluded)
6-661
to NOx emission characteristics (uncontrolled NOx level and
NOx reduction efficiency) and heat rate. As shown in the
figures, the reference boiler's cost effectiveness and busbar
cost are approximately $730 per ton of NOx removed and
2.7 mills/kWh. The cost effectiveness values and busbar cost
for SNCR applied to cyclone-fired boilers are lower than for
SNCR on wall-fired boilers because of higher uncontrolled NOx
levels of cyclone-fired boilers. The sensitivity curves
follow the same general trends as with SNCR applied to wall-
fired boilers.
The effect of plant characteristics (boiler size,
capacity factor, and economic life) and urea solution price on
cost effectiveness and busbar cost for FBC boilers is shown in
figure 6-39

TABLE 5-14. PERFORMANCE OF SNCR ON CONVENTIONAL U. S. UTILITY BOILERS(Concluded)
6-662Figure 118

TABLE 5-14. PERFORMANCE OF SNCR ON CONVENTIONAL U. S. UTILITY BOILERS(Concluded)
6-663Figure 119
. Figure 6-40 presents the sensitivity of cost effectiveness
TABLE 5-14. PERFORMANCE OF SNCR ON CONVENTIONAL U. S. UTILITY BOILERS(Concluded)
6-664
to NOx emission characteristics (uncontrolled NOx level and
NOx reduction efficiency) and heat rate. As shown in the
figures, the reference boiler's cost effectiveness and busbar
cost are approximately $1,700 per ton of NOx removed and
0.81 mills/kWh. The cost effectiveness values for SNCR
applied to FBC boilers is higher than SNCR on wall-fired
boilers because of lower uncontrolled NOx levels of FBC
boilers, although the busbar cost is less because of the
smaller amount of urea that must be injected to achieve
equivalent percent NOx reductions. The sensitivity curves
follow the same general trends as with SNCR applied to
wall-fired boilers.
6.5.1.3.2 Natural gas- and oil-fired boiler sensitivity
analysis. The effect of plant characteristics (boiler size,
capacity factor, and economic life) and urea solution price on

TABLE 5-14. PERFORMANCE OF SNCR ON CONVENTIONAL U. S. UTILITY BOILERS(Concluded)
6-665

TABLE 5-14. PERFORMANCE OF SNCR ON CONVENTIONAL U. S. UTILITY BOILERS(Concluded)
6-666

TABLE 5-14. PERFORMANCE OF SNCR ON CONVENTIONAL U. S. UTILITY BOILERS(Concluded)
6-667

TABLE 5-14. PERFORMANCE OF SNCR ON CONVENTIONAL U. S. UTILITY BOILERS(Concluded)
6-668
cost effectiveness and busbar cost for wall-fired boilers is
shown in figure 6-41

TABLE 5-14. PERFORMANCE OF SNCR ON CONVENTIONAL U. S. UTILITY BOILERS(Concluded)
6-669Figure 120

TABLE 5-14. PERFORMANCE OF SNCR ON CONVENTIONAL U. S. UTILITY BOILERS(Concluded)
6-670Figure 121
. Figure 6-42 presents the sensitivity of cost effectiveness

TABLE 5-14. PERFORMANCE OF SNCR ON CONVENTIONAL U. S. UTILITY BOILERS(Concluded)
6-671
to NOx emission characteristics (uncontrolled NOx level and
NOx reduction efficiency) and heat rate. As shown in the
figures, the reference boiler's cost effectiveness and busbar
cost are approximately $1,300 per ton of NOx removed and
1.2 mills/kWh. The cost effectiveness values for SNCR applied
to natural gas- and oil-fired wall boilers is higher than for
SNCR on coal-fired wall boilers because of lower uncontrolled
NOx levels of natural gas- and oil-fired boilers, although the
busbar cost is less because of the smaller amount of urea that
must be injected to control NOx. The sensitivity curves
follow the same general trends as with SNCR applied to coal-
fired wall boilers.
The effect of plant characteristics (boiler size,
capacity factor, and economic life) and urea solution price on
cost effectiveness and busbar cost for tangentially-fired
boilers is shown in figure 6-43

TABLE 5-14. PERFORMANCE OF SNCR ON CONVENTIONAL U. S. UTILITY BOILERS(Concluded)
6-672Figure 122

TABLE 5-14. PERFORMANCE OF SNCR ON CONVENTIONAL U. S. UTILITY BOILERS(Concluded)
6-673Figure 123
. Figure 6-44 presents the sensitivity of cost effectiveness

TABLE 5-14. PERFORMANCE OF SNCR ON CONVENTIONAL U. S. UTILITY BOILERS(Concluded)
6-674
to NOx emission characteristics (uncontrolled NOx level and
NOx reduction efficiency) and heat rate. As shown in the
figures, the reference boiler's cost effectiveness and busbar
cost are approximately $1,600 per ton of NOx removed and
0.95 mills/kWh. The cost effectiveness values for SNCR
applied to tangentially-fired boilers are higher than SNCR on
wall fired boilers because of lower uncontrolled NOx levels of
tangentially-fired boilers, although the busbar cost is less
because of smaller amount of urea that must be injected to
control NOx. The sensitivity curves follow the same general
trends as with SNCR applied to coal-fired wall boilers.
6.5.2 SCR
Cost estimates for SCR technology are presented in this
section for coal-fired and natural gas- and oil-fired wall and
tangential boilers. In addition, estimates are presented for
SCR applied to cyclone-fired coal boilers.

TABLE 5-14. PERFORMANCE OF SNCR ON CONVENTIONAL U. S. UTILITY BOILERS(Concluded)
6-675

TABLE 5-14. PERFORMANCE OF SNCR ON CONVENTIONAL U. S. UTILITY BOILERS(Concluded)
6-676

TABLE 5-14. PERFORMANCE OF SNCR ON CONVENTIONAL U. S. UTILITY BOILERS(Concluded)
6-677

TABLE 5-14. PERFORMANCE OF SNCR ON CONVENTIONAL U. S. UTILITY BOILERS(Concluded)
6-678
6.5.2.1. Costing Procedures. Based on outputs from
Integrated Air Pollution Control System (IAPCS)16, simplified
algorithms in the form of equation 6-1 were developed to
estimate capital costs. The SCR basic system cost
coefficients for each of the five boiler types are:
Fuel Boiler type a b
Coal Wall 174 -0.30
Tangential 165 -0.30
Cyclone 196 -0.31
Oil/Gas Wall 165 -0.324
Tangential 156 -0.329
Catalyst price, which has a significant impact on capital
costs, was estimated to be $400/ft3 for coal-, natural gas-,
and oil-fired boilers. Catalyst life was assumed to be 3
years for coal-fired boilers and 6 years for natural gas- and
oil-fired boilers. Catalyst volumes for coal-fired boilers
were assumed to be double the volume of oil-fired boilers and
approximately six times larger than the volume of natural gas-
fired boilers.
Fixed operating and maintenance costs for an SCR system
include operating, maintenance, supervisory labor and
maintenance materials and overhead. Variable O&M costs are
ammonia, catalyst replacement, electricity, water, steam, and
catalyst disposal. The IAPCS model was used to estimate fixed
and variable O&M costs, and details on these calculations are
provided in appendix A.11.
The following factors affect the retrofit difficulty and
costs of an SCR system:
C Congestion in the construction area from existing
buildings and equipment.
C Underground electrical cables and pipes.

TABLE 5-14. PERFORMANCE OF SNCR ON CONVENTIONAL U. S. UTILITY BOILERS(Concluded)
6-679
C The length of ductwork required to connect the SCR
reactor vessels to the existing ductwork.
Due to the lack of actual installation cost data, an EPA
analysis of SCR costs were used to estimate retrofit factors.17
This reference estimates retrofit factors of 1.02 (low), 1.34
(moderate), and 1.52 (high), based on data obtained from hot-
side SCR retrofits on German utility boilers. For the model
plant analysis, a moderate retrofit factor of 1.34 was used.
Indirect costs were assumed to be 45 percent of the process
capital. For the application of SCR to boilers burning
medium- to high-sulfur coals, indirect costs may be greater
than 45 percent of the process capital, due to factors
discussed in chapter 5.
6.5.2.2 Model Plants Results
6.5.2.2.1 Coal-fired model plants. The capital cost,
busbar cost, and cost effectiveness for the 15 coal-fired
wall, tangential, and cyclone boilers are presented in
table 6-15

TABLE 5-14. PERFORMANCE OF SNCR ON CONVENTIONAL U. S. UTILITY BOILERS(Concluded)
6-680
TABLE 6-15. COSTS FOR SCR APPLIED TO COAL-FIRED BOILERS
Cost effectiveness, $/ton
4 7,540
1,580
2,500
1,360
1,270
9,470
1,970
3,140
1,690
1,580
4,670
1,010
1,560
866
809
reduction of 80 percent were used
for wall-fired boilers.
Peaking = 10 percent capacity factor.
Baseload = 65 percent capacity factor.
TABLE 5-14. PERFORMANCE OF SNCR ON CONVENTIONAL U. S. UTILITY BOILERS(Concluded)
6-681
. An economic life of 20 years and a NOx reduction efficiency
of 80 percent and a space velocity of 2,500/hr were assumed
for all of these boilers. For the 600 MW baseload wall-fired
boiler, the estimated cost effectiveness ranges from $1,270 to
$1,670 per ton of NOx removed. For the 100 MW peaking wall-
fired boiler, the estimated cost effectiveness ranges from
$7,540 to $9,650 per ton.
Cost per ton of NOx removed with SCR on
tangentially-fired boilers is higher than wall-fired boilers
because of lower uncontrolled NOx levels for tangentially-
fired boilers. Cost effectiveness for the 600 MW baseload
tangentially-fired boiler ranges from $1,580 to $2,100 per
ton. For the 100 MW peaking tangentially-fired boiler, cost
effectiveness ranges from $9,470 to $12,200 per ton.
Cost per ton of NOx removed with SCR on cyclone-fired
boilers is lower than wall-fired boilers because of higher
uncontrolled NOx levels for cyclone-fired boilers. Cost
effectiveness for the 600 MW baseload cyclone-fired boiler
ranges from $810 to $1,050 per ton and for the 100 MW cyclone
boiler, cost effectiveness ranges from $4,670 to $5,940 per
ton.
6.5.2.2.2 Natural gas and oil-fired model plants. The
capital cost, busbar cost, and cost effectiveness for the

TABLE 5-14. PERFORMANCE OF SNCR ON CONVENTIONAL U. S. UTILITY BOILERS(Concluded)
6-682
10 natural gas- and oil-fired wall and tangential model
boilers are presented in tables 6-16

TABLE 5-14. PERFORMANCE OF SNCR ON CONVENTIONAL U. S. UTILITY BOILERS(Concluded)
6-683
TABLE 6-16. COSTS FOR SCR APPLIED TO NATURAL GAS-FIRED BOILERS
Plant
identification
Total capital cost,
$/kW
Busbar cost,
mills/kWh
Cost effectiveness,
$/ton
9 6,700
1,460
1,960
1,100
970
10,800
2,310
3,150
1,740
1,530
reduction of
85 percent
were used for wall-fired boilers.
Peaking = 10 percent capacity factor.
Baseload = 65 percent capacity factor.
Cycling = 30 percent capacity factor.
reduction of
85 percent
were used for tangentially-fired boilers.

TABLE 5-14. PERFORMANCE OF SNCR ON CONVENTIONAL U. S. UTILITY BOILERS(Concluded)
6-684
TABLE 6-17. COSTS FOR SCR APPLIED TO OIL-FIRED BOILERS
Plant
identification
Total capital cost,
$/kW
Busbar cost,
mills/kWh
Cost effectiveness,
$/ton
9 7,550
1,620
2,280
1,270
1,130
12,200
2,580
3,690
2,010
1,800
reduction of
85 percent
were used for wall-fired boilers.
Peaking = 10 percent capacity factor.
Baseload = 65 percent capacity factor.
Cycling = 30 percent capacity factor.
reduction of
85 percent
were used for tangentially-fired boilers.
and 6-17, respectively. An economic life of 20 years and a

TABLE 5-14. PERFORMANCE OF SNCR ON CONVENTIONAL U. S. UTILITY BOILERS(Concluded)
6-685
NOx reduction efficiency of 85 percent were assumed for all of
these boilers. Space velocities of 14,000/hr and 5,000/hr
were assumed for natural gas-fired boilers and oil-fired
boilers, respectively. Cost per ton of NOx removed with SCR
on natural gad-fired boilers is lower than oil-fired boilers
because of smaller catalyst volumes for natural gas-fired
boilers.
For the 600 MW baseload wall-fired boilers, the estimated
cost effectiveness ranges from $970 to $1,070 per ton of NOx
removed for the natural gas-fired boilers and $1,130 to $1,410
per ton of NOx removed for the oil-fired boilers. For the
100 MW peaking natural gas- and oil-fired wall boilers, the
estimated cost effectiveness ranges from $6,700 to $7,200 per
ton and $7,550 to $8,990 per ton, respectively.
Cost per ton of NOx removed with SCR on tangentially-
fired boilers is higher than wall-fired boilers because of
lower uncontrolled NOx levels for tangentially-fired boilers.
Cost effectiveness for the 600 MW baseload tangentially-fired
boiler ranges from $1,530 to $1,690 per ton for the natural
gas-fired boilers and $1,800 to $2,260 per ton of NOx removed
for the oil-fired boilers. For the 100 MW peaking natural
gas- and oil-fired tangential boilers, cost effectiveness
ranges from $10,800 to $11,700 per ton and $12,200 to $14,600
per ton, respectively.
6.5.2.3 Sensitivity Analysis
6.5.2.3.1 Coal-fired boiler sensitivity analysis. The
effect of plant characteristics (retrofit factor, boiler size,
capacity factor, and economic life) and catalyst life on cost
effectiveness and busbar cost for wall-fired boilers is shown
in figure 6-45

TABLE 5-14. PERFORMANCE OF SNCR ON CONVENTIONAL U. S. UTILITY BOILERS(Concluded)
6-686Figure 124

TABLE 5-14. PERFORMANCE OF SNCR ON CONVENTIONAL U. S. UTILITY BOILERS(Concluded)
6-687Figure 125
. Figure 6-46 presents the sensitivity of cost effectiveness
TABLE 5-14. PERFORMANCE OF SNCR ON CONVENTIONAL U. S. UTILITY BOILERS(Concluded)
6-688
to NOx emission characteristics (uncontrolled NOx level and
NOx reduction efficiency) and heat rate. As shown in the
figures, the reference boiler's cost

TABLE 5-14. PERFORMANCE OF SNCR ON CONVENTIONAL U. S. UTILITY BOILERS(Concluded)
6-689

TABLE 5-14. PERFORMANCE OF SNCR ON CONVENTIONAL U. S. UTILITY BOILERS(Concluded)
6-690

TABLE 5-14. PERFORMANCE OF SNCR ON CONVENTIONAL U. S. UTILITY BOILERS(Concluded)
6-691

TABLE 5-14. PERFORMANCE OF SNCR ON CONVENTIONAL U. S. UTILITY BOILERS(Concluded)
6-692
TABLE 5-14. PERFORMANCE OF SNCR ON CONVENTIONAL U. S. UTILITY BOILERS(Concluded)
6-693
effectiveness and busbar cost are approximately $2,000 per ton
of NOx removed and 8.1 mills/kWh.
Of the parameters shown in figure 6-45, the variation of
capacity factor from 10 to 70 percent has the greatest impact
on cost effectiveness and busbar cost. The cost effectiveness
value and busbar cost exhibit a nearly inverse relationship
with capacity factor, and thus, as capacity factor decreases,
the cost effectiveness value and busbar cost increase. This
is especially noticeable at low capacity factors where a
decrease of 75 percent in the reference plant's capacity
factor (from 40 to 10 percent) results in an increase in the
cost effectiveness value and busbar cost of over 250 percent.
Variations in catalyst life, economic life, and boiler
size follow a trend similar to capacity factor, but do not
cause as great a change in cost effectiveness and busbar cost.
For example, a decrease of 33 percent of the catalyst life
(from 3 years to 2 years) increases the cost effectiveness
approximately 25 percent. Similarly, a decrease of 75 percent
in economic life (from 20 to 5 years) results in an increase
in the plant's cost effectiveness value and busbar cost of
approximately 50 percent, and a decrease of 75 percent in the
boiler size (from 400 to 100 MW) results in an increase in the
plant's cost effectiveness value and busbar cost of nearly
25 percent.
The cost effectiveness value and busbar cost are linearly
related to retrofit factor. An increase or decrease of 0.3
from the reference plant's retrofit factor of 1.3 causes a
corresponding change in the cost effectiveness value and
busbar cost of less than 5 percent.
Of the parameters shown in figure 6-46, the variation of
uncontrolled NOx from 0.6 to 1.2 lb/MMBtu has the greatest
impact on cost effectiveness. Variation in NOx reduction
exhibits an inverse relationship to cost effectiveness. A

TABLE 5-14. PERFORMANCE OF SNCR ON CONVENTIONAL U. S. UTILITY BOILERS(Concluded)
6-694
33 percent decrease in the reference plants uncontrolled NOx
(from 0.9 to 0.6 lb/MMBtu) results in an increase in the cost
effectiveness value of approximately 50 percent.
Variation in the heat rate from 9,200 to 12,800 Btu/kWh
follows a trend similar to the variation in uncontrolled NOx.
A 16-percent decrease in heat rate (11,000 to 9,200 Btu/kWh)
results in an increase of cost effectiveness of approximately
20 percent. Potential variations in the NOx reduction
efficiency of the system result in less than a 5-percent
change in cost effectiveness.
The effect of plant characteristics (retrofit factor,
boiler size, capacity factor, and economic life) and catalyst
life on cost effectiveness and busbar cost for tangentially-
fired boilers is shown in figure 6-47
TABLE 5-14. PERFORMANCE OF SNCR ON CONVENTIONAL U. S. UTILITY BOILERS(Concluded)
6-695Figure 126

TABLE 5-14. PERFORMANCE OF SNCR ON CONVENTIONAL U. S. UTILITY BOILERS(Concluded)
6-696Figure 127
. Figure 6-48 presents the sensitivity of cost effectiveness

TABLE 5-14. PERFORMANCE OF SNCR ON CONVENTIONAL U. S. UTILITY BOILERS(Concluded)
6-697
to NOx emission characteristics (uncontrolled NOx level and
NOx reduction efficiency) and heat rate. As shown in the
figures, the reference boiler's cost effectiveness and busbar
cost are approximately $2,600 per ton of NOx removed and
7.9 mills/kWh. The cost effectiveness values and busbar cost
for SCR applied to tangentially-fired boilers are higher than
for SCR on wall-fired boilers because of lower uncontrolled
NOx levels for tangentially-fired boilers, although the busbar
cost is slightly lower for tangentially-fired boilers because
of the lower capital and O&M costs. The sensitivity curves
follow the same general trends as with SCR applied to wall-
fired boilers.
The effect of plant characteristics (retrofit factor,
boiler size, capacity factor, and economic life) and catalyst
life on cost effectiveness and busbar cost for cyclone-fired
boilers is shown in figure 6-49

TABLE 5-14. PERFORMANCE OF SNCR ON CONVENTIONAL U. S. UTILITY BOILERS(Concluded)
6-698Figure 128

TABLE 5-14. PERFORMANCE OF SNCR ON CONVENTIONAL U. S. UTILITY BOILERS(Concluded)
6-699Figure 129
. Figure 6-50 presents the sensitivity of cost effectiveness

TABLE 5-14. PERFORMANCE OF SNCR ON CONVENTIONAL U. S. UTILITY BOILERS(Concluded)
6-700
to NOx emission characteristics (uncontrolled NOx level and
NOx reduction efficiency) and heat rate. As shown in the
figures, the reference boiler's cost effectiveness and busbar
cost are approximately $1,300 per ton of NOx removed and
8.5 mills/kWh. The cost effectiveness values and busbar cost
for SCR applied to cyclone-fired boilers are lower than for
wall-fired boilers because of higher uncontrolled NOx levels
for cyclone-fired

TABLE 5-14. PERFORMANCE OF SNCR ON CONVENTIONAL U. S. UTILITY BOILERS(Concluded)
6-701

TABLE 5-14. PERFORMANCE OF SNCR ON CONVENTIONAL U. S. UTILITY BOILERS(Concluded)
6-702

TABLE 5-14. PERFORMANCE OF SNCR ON CONVENTIONAL U. S. UTILITY BOILERS(Concluded)
6-703
TABLE 5-14. PERFORMANCE OF SNCR ON CONVENTIONAL U. S. UTILITY BOILERS(Concluded)
6-704
boilers, although the busbar cost is slightly higher for
cyclone-fired boilers of the higher capital and O&M costs.
The sensitivity curves follow the same general trends as with
SCR applied to wall-fired boilers.
6.5.2.3.2 Natural gas- and oil-fired boiler sensitivity
analysis. The effect of plant characteristics (retrofit
factor, boiler size, capacity factor, and economic life) and
catalyst life on cost effectiveness and busbar cost for wall-
fired boilers is shown in figures 6-51

TABLE 5-14. PERFORMANCE OF SNCR ON CONVENTIONAL U. S. UTILITY BOILERS(Concluded)
6-705
Figure 6-51. Impact of plant characteristics on SCR cost effectiveness and
busbar cost
TABLE 5-14. PERFORMANCE OF SNCR ON CONVENTIONAL U. S. UTILITY BOILERS(Concluded)
6-706
Figure 6-52. Impact of plant characteristics on SCR cost effectiveness and
busbar cost
emission characteristics and heat rate on SCR cost
effectiveness for natural gas-fired wall boilers.
emission characteristics and heat rate on SCR cost
effectiveness for oil-fired wall boilers.
and 6-52. Figures 6-53 and 6-54 present the sensitivity of

TABLE 5-14. PERFORMANCE OF SNCR ON CONVENTIONAL U. S. UTILITY BOILERS(Concluded)
6-707
cost effectiveness to NOx emission characteristics
(uncontrolled NOx level and NOx reduction efficiency) and heat
rate. As shown in the figures, the natural gas-fired
reference boiler's cost effectiveness and busbar cost are
approximately $1,450 per ton of NOx removed and 3.4 mills/kWh
and the oil-fired reference boilers cost effectiveness and
busbar cost are approximately $1,750 per ton on NOx removed
and 4.1 mills/kWh. The cost effectiveness value and busbar
cost for SCR applied to natural gas-fired boilers are lower
than for oil-fired boilers because of the smaller catalysts
volumes on natural gas-boilers. Similarly, cost effectiveness
and busbar cost for SCR applied to natural gas- and oil-fired
wall boilers are lower than for the coal-fired wall boilers
because of the smaller catalyst volumes and expected longer
catalyst life on natural gas- and oil-fired boilers. The
sensitivity curves follow the same general trends as with SCR
applied to coal-fired wall boilers.
The effect of plant characteristics (retrofit factor,
boiler size, capacity factor, and economic life) and catalyst
life on cost effectiveness and busbar cost for natural gas-
and oil-fired tangential boilers is shown in figures 6-55
TABLE 5-14. PERFORMANCE OF SNCR ON CONVENTIONAL U. S. UTILITY BOILERS(Concluded)
6-708
Figure 6-55. Impact of plant characteristics on SCR cost effectiveness and
busbar cost

TABLE 5-14. PERFORMANCE OF SNCR ON CONVENTIONAL U. S. UTILITY BOILERS(Concluded)
6-709
Figure 6-56. Impact of plant characteristics on SCR cost effectiveness and
busbar cost
emission characteristics and heat rate on SCR cost
effectiveness for natural gas-fired tangential boilers.
emission characteristics and heat rate on SCR cost
effectiveness for oil-fired tangential boilers.
and 6-56. Figures 6-57 and 6-58 present the sensitivity of

TABLE 5-14. PERFORMANCE OF SNCR ON CONVENTIONAL U. S. UTILITY BOILERS(Concluded)
6-710
cost effectiveness to NOx emission characteristics
(uncontrolled NOx level and NOx reduction efficiency) and heat
rate. As shown in the figures, the natural gas-fired
reference boiler's cost effectiveness and busbar cost are
approximately $2,300 per ton of NOx removed and 3.2 mills/kWh
and the oil-

TABLE 5-14. PERFORMANCE OF SNCR ON CONVENTIONAL U. S. UTILITY BOILERS(Concluded)
6-711

TABLE 5-14. PERFORMANCE OF SNCR ON CONVENTIONAL U. S. UTILITY BOILERS(Concluded)
6-712

TABLE 5-14. PERFORMANCE OF SNCR ON CONVENTIONAL U. S. UTILITY BOILERS(Concluded)
6-713

TABLE 5-14. PERFORMANCE OF SNCR ON CONVENTIONAL U. S. UTILITY BOILERS(Concluded)
6-714

TABLE 5-14. PERFORMANCE OF SNCR ON CONVENTIONAL U. S. UTILITY BOILERS(Concluded)
6-715

TABLE 5-14. PERFORMANCE OF SNCR ON CONVENTIONAL U. S. UTILITY BOILERS(Concluded)
6-716

TABLE 5-14. PERFORMANCE OF SNCR ON CONVENTIONAL U. S. UTILITY BOILERS(Concluded)
6-717
TABLE 5-14. PERFORMANCE OF SNCR ON CONVENTIONAL U. S. UTILITY BOILERS(Concluded)
6-718
fired reference boiler's cost effectiveness and busbar cost
are approximately $2,800 per ton of NOx removed and
4.0 mills/kWh. The cost effectiveness value and busbar cost
for SCR applied to natural-gas fired boilers are lower than
for oil-fired boilers because of the smaller catalyst volumes
on natural-gas boilers. Similarly, cost effectiveness and
busbar cost for SCR applied to natural gas- and oil-fired
tangential boilers are lower than for the coal-fired
tangential boilers because of the smaller catalyst volumes and
expected longer catalyst life on natural gas- and oil-fired
boilers. The sensitivity curves follow the same general
trends as with SCR applied to coal-fired wall boilers.
6.5.3 Low NOx Burners with Selective Non-Catalytic Reduction
Cost estimates for the combination control of LNB + SNCR
are presented in this section for coal-fired and natural
gas- and oil-fired wall and tangential boilers.
6.5.3.1 Costing Procedures. To develop the cost
algorithms for the combination control LNB + SNCR, the
individual capital, variable O&M, and fixed O&M cost
algorithms for LNB and SNCR were combined. Refer to
sections 6.3.1, 6.4.2, and 6.5.1 for these costing procedures.
6.5.3.2 Model Plant Results.
6.5.3.2.1 Coal-fired model plants. The capital cost,
busbar cost, and cost effectiveness for the ten wall- and
tangentially-fired boilers are presented in table 6-18

TABLE 5-14. PERFORMANCE OF SNCR ON CONVENTIONAL U. S. UTILITY BOILERS(Concluded)
6-719
TABLE 6-18. COSTS FOR LNB + SNCR APPLIED TO COAL-FIRED BOILERS
Plant
identification
Total capital
$/kW
Busbar cost,
mills/kWh
Cost effectiveness,
$/ton
260
2,860
760
845
557
478
2,530
696
770
519
452
LNB retrofit factor and indirect cost factor are 1.15 and 1.3 respectively.
SNCR
retrofit factor and indirect cost factor are 1.0 and 1.3, respectively.
reduction of
70 percent were used for wall-fired boilers.
Peaking = 10 percent capacity factor.
Baseload = 65 percent capacity factor.
Cycling = 30 percent capacity factor.

TABLE 5-14. PERFORMANCE OF SNCR ON CONVENTIONAL U. S. UTILITY BOILERS(Concluded)
6-720
. An economic life of 20 years and a NOx reduction efficiency
of 45 percent for LNB and 45 percent for SNCR were assumed for
all boilers. The urea price of each boiler was varied from
$140 to $260 per ton for a 50-percent urea solution. For the
600 MW baseload boiler, the estimated cost effectiveness
ranged from $370 to $478 per ton of NOx removed. For the
100 MW peaking wall-fired boiler, the estimated cost
effectiveness ranges from $2,750 to $2,860 per ton.
Cost per ton of NOx removed with LNB + SNCR on
tangentially-fired boilers is slightly lower than for wall-
fired boilers because of lower capital cost associated with

TABLE 5-14. PERFORMANCE OF SNCR ON CONVENTIONAL U. S. UTILITY BOILERS(Concluded)
6-721
LNB applied to tangentially-fired boilers. Cost effectiveness
for the 600 MW baseload tangentially-fired boiler ranges from
$344 to $452 per ton. For the 100 MW peaking tangentially-
fired boiler, the estimated cost effectiveness ranges from
$2,420 to $2,530 per ton.
6.5.3.2.2 Natural gas- and oil-fired model plants. The
capital cost, busbar cost, and cost effectiveness for the ten
wall- and tangentially-fired boilers are presented in
table 6-19

TABLE 5-14. PERFORMANCE OF SNCR ON CONVENTIONAL U. S. UTILITY BOILERS(Concluded)
6-722
TABLE 6-19. COSTS FOR LNB + SNCR APPLIED TO NATURAL GAS- AND OIL-FIRED
BOILERS
Plant
identification
Total capital
$/kW
Busbar cost,
mills/kWh
Cost effectiveness,
$/ton
260
5,310
1,250
1,400
851
697
5,940
1,370
1,540
919
750
LNB retrofit factor and indirect cost factor are 1.15 and 1.3, respectively.
SNCR
retrofit factor and indirect cost factor are 1.0 and 1.3, respectively.
reduction of
64 percent were used for wall-fired boilers.
Peaking = 10 percent capacity factor.
Baseload = 65 percent capacity factor.
TABLE 5-14. PERFORMANCE OF SNCR ON CONVENTIONAL U. S. UTILITY BOILERS(Concluded)
6-723
. An economic life of 20 years and a NOx reduction efficiency
of 45 percent for LNB and 35 percent for SNCR were assumed for
all boilers. The urea price of each boiler was varied from
$140 to $260 per ton for a 50-percent urea solution. For the
600 MW baseload boiler, the estimated cost effectiveness
ranged from $585 to $697 per ton of NOx removed. For the
100 MW peaking wall-fired boiler, the estimated cost
effectiveness ranges from $5,200 to $5,300 per ton.
Cost per ton of NOx removed with LNB + SNCR is higher on
tangentially-fired boilers because of lower uncontrolled NOx
levels of these boilers. Cost effectiveness for the 600 MW
baseload tangentially-fired boiler ranges from $641 to
$750 per ton. For the 100 MW peaking tangentially-fired
boiler, the estimated cost effectiveness ranges from $5,830 to
$5,940 per ton.
6.5.3.3 Sensitivity Analysis.
6.5.3.3.1 Coal-fired boiler sensitivity analysis. The
effect of plant characteristics (retrofit factor, boiler size,
capacity factor, and economic life) and urea solution price on
cost effectiveness and busbar cost for wall-fired boilers is
shown in figure 6-59

TABLE 5-14. PERFORMANCE OF SNCR ON CONVENTIONAL U. S. UTILITY BOILERS(Concluded)
6-724
Figure 6-59. Impact of plant characteristics on LNB + SNCR cost effectiveness
and

TABLE 5-14. PERFORMANCE OF SNCR ON CONVENTIONAL U. S. UTILITY BOILERS(Concluded)
6-725
emission characteristics and heat rate on LNB + SNCR
cost
. Figure 6-60 presents the sensitivity of cost effectiveness

TABLE 5-14. PERFORMANCE OF SNCR ON CONVENTIONAL U. S. UTILITY BOILERS(Concluded)
6-726
to NOx emission characteristics (uncontrolled NOx level and
the NOx reduction efficiency of the LNB and SNCR systems) and
heat rate. As shown in the figures, the reference boiler's
cost effectiveness and busbar cost are approximately $620 per
ton of NOx removed and 2.1 mills/kWh.

TABLE 5-14. PERFORMANCE OF SNCR ON CONVENTIONAL U. S. UTILITY BOILERS(Concluded)
6-727

TABLE 5-14. PERFORMANCE OF SNCR ON CONVENTIONAL U. S. UTILITY BOILERS(Concluded)
6-728

TABLE 5-14. PERFORMANCE OF SNCR ON CONVENTIONAL U. S. UTILITY BOILERS(Concluded)
6-729
Of the parameters shown in figure 6-59, the variation of
capacity factor from 10 to 70 percent has the greatest impact
on cost effectiveness and busbar cost. The cost effectiveness
value and busbar cost are inversely related to capacity
factor, and thus, as capacity factor decreases, the cost
effectiveness value and busbar cost increase. This is
especially noticeable at low capacity factors where a decrease
of 75 percent in the reference plant's capacity factor (from
40 to 10 percent) results in an increase in the cost
effectiveness value and busbar cost of nearly 200 percent.
Variations in economic life and boiler size follow a
trend similar to capacity factor, but do not cause as great a
change in cost effectiveness and busbar cost. For example, a
decrease of 75 percent in economic life (from 20 to 5 years)
results in an increase in the plant's cost effectiveness value
and busbar cost of approximately 75 percent. Similarly, a
decrease of 75 percent in boiler size (from 400 to 100 MW)
results in an increase in the plant's cost effectiveness value
and busbar cost of nearly 75 percent.
The cost effectiveness value and busbar cost are linearly
related to both retrofit factor and urea cost. An increase or
decrease of 0.3 in retrofit factor or $60 per ton in urea cost
compared to the reference plant causes a corresponding change
in cost effectiveness and busbar cost of less than 5 percent.
Of the parameters shown in figure 6-60, the variation of
uncontrolled NOx from 0.6 to 1.2 lb/MMBtu has the greatest
impact on cost effectiveness. Variation in NOx reduction
exhibits an inverse relationship to cost effectiveness. A
33-percent decrease in the reference plants uncontrolled NOx
(from 0.9 to 0.6 lb/MMBtu) results in an increase in the cost
effectiveness value of approximately 35 percent.
Variation in the NOx reduction of LNB from 30 to
60 percent follow a trend similar to the variation in

TABLE 5-14. PERFORMANCE OF SNCR ON CONVENTIONAL U. S. UTILITY BOILERS(Concluded)
6-730
uncontrolled NOx. A 33-percent decrease of the NOx reduction
of the LNB results in an increase of cost effectiveness of
25 percent. Variation in the NOx reduction of the SNCR system
from 30 to 60 percent follows a trend similar to NOx reduction
of the LNB, but do not cause as great a change in cost
effectiveness. A 33-percent decrease in the NOx reduction of
the SNCR system results in an increase in the cost
effectiveness value of approximately 15 percent. Variation in
heat rate from 9,200 to 12,800 Btu/kWh has nearly an identical
effect on cost effectiveness as the potential variation in NOx
reduction by the SNCR system. A 16-percent decrease in heat
rate (11,000 to 9,200 Btu/kWh) results in an equivalent
increase of cost effectiveness value.
The effect of plant characteristics (retrofit factor,
boiler size, capacity factor, and economic life) and urea
solution price on cost effectiveness and busbar cost for
tangentially-fired boilers is shown in figure 6-61

TABLE 5-14. PERFORMANCE OF SNCR ON CONVENTIONAL U. S. UTILITY BOILERS(Concluded)
6-731
Figure 6-61. Impact of plant characteristics on LNB + SNCR cost effectiveness
and

TABLE 5-14. PERFORMANCE OF SNCR ON CONVENTIONAL U. S. UTILITY BOILERS(Concluded)
6-732
emission characteristics and heat rate on LNB + SNCR
cost
. Figure 6-62 presents the sensitivity of cost effectiveness

TABLE 5-14. PERFORMANCE OF SNCR ON CONVENTIONAL U. S. UTILITY BOILERS(Concluded)
6-733
to NOx emission characteristics (uncontrolled NOx level and
the NOx reduction efficiency of the LNB and SNCR systems) and
heat rate. As shown in the figures, the reference boiler's
cost effectiveness and busbar cost are approximately $560 per
ton of NOx removed and 1.5 mills/kWh. The cost effectiveness
values and busbar cost for LNB + SNCR applied to tangentially-
fired boilers are slightly lower than for LNB + SNCR on wall-
fired boilers because of lower capital cost associated with
LNB applied to tangentially-fired boilers. The sensitivity
curves follow the same general trends as with LNB + SNCR
applied to wall-fired boilers.
6.5.3.3.2 Natural gas- and oil-fired sensitivity
analysis. The effect of plant characteristics (retrofit
factor, boiler size, capacity factor, and economic life) and
urea solution price on cost effectiveness and busbar cost for
wall-fired boilers is shown in figure 6-63
TABLE 5-14. PERFORMANCE OF SNCR ON CONVENTIONAL U. S. UTILITY BOILERS(Concluded)
6-734
Figure 6-63. Impact of plant characteristics on LNB + SNCR cost effectiveness
and
TABLE 5-14. PERFORMANCE OF SNCR ON CONVENTIONAL U. S. UTILITY BOILERS(Concluded)
6-735
emission characteristics and heat rate on LNB + SNCR
cost
. Figure 6-64 presents the sensitivity of cost effectiveness

TABLE 5-14. PERFORMANCE OF SNCR ON CONVENTIONAL U. S. UTILITY BOILERS(Concluded)
6-736
to NOx emission characteristics (uncontrolled NOx level and
the NOx reduction efficiency of the LNB and SNCR systems) and
heat rate. As shown in the figures, the reference boiler's
cost effectiveness and busbar cost are approximately $1,000
per ton

TABLE 5-14. PERFORMANCE OF SNCR ON CONVENTIONAL U. S. UTILITY BOILERS(Concluded)
6-737

TABLE 5-14. PERFORMANCE OF SNCR ON CONVENTIONAL U. S. UTILITY BOILERS(Concluded)
6-738

TABLE 5-14. PERFORMANCE OF SNCR ON CONVENTIONAL U. S. UTILITY BOILERS(Concluded)
6-739

TABLE 5-14. PERFORMANCE OF SNCR ON CONVENTIONAL U. S. UTILITY BOILERS(Concluded)
6-740
of NOx removed and 1.8 mills/kWh. Cost effectiveness for
LNB + SNCR applied natural gas- and oil-fired wall boilers are
higher than for LNB + SNCR applied to coal-fired wall boilers
because of lower uncontrolled NOx levels of natural gas- and
oil-fired boilers, although the busbar cost is less because of
the smaller amount of urea that must be injected to achieve an
equivalent percent NOx reduction. The sensitivity curves
follow the same general trends as with LNB + SNCR applied to
coal-fired wall boilers.
The effect of plant characteristics (retrofit factor,
boiler size, capacity factor, and economic life) and urea
solution price on cost effectiveness and busbar cost for
tangentially-fired boilers is shown in figure 6-65

TABLE 5-14. PERFORMANCE OF SNCR ON CONVENTIONAL U. S. UTILITY BOILERS(Concluded)
6-741
Figure 6-65. Impact of plant characteristics on LNB + SNCR cost effectiveness
and

TABLE 5-14. PERFORMANCE OF SNCR ON CONVENTIONAL U. S. UTILITY BOILERS(Concluded)
6-742
emission characteristics and heat rate on LNB + SNCR
cost
. Figure 6-66 presents the sensitivity of cost effectiveness

TABLE 5-14. PERFORMANCE OF SNCR ON CONVENTIONAL U. S. UTILITY BOILERS(Concluded)
6-743
to NOx emission characteristics (uncontrolled NOx level and
the NOx reduction efficiency of the LNB and SNCR systems) and
heat rate. As shown in the figures, the reference boiler's
cost effectiveness and busbar cost are approximately $1,100
per ton of NOx removed and 1.2 mills/kWh. The cost
effectiveness values of LNB + SNCR applied natural gas- and
oil-fired tangential boilers are higher than for LNB + SNCR
applied to natural gas- and oil-fired wall boilers because of
lower uncontrolled NOx levels of tangentially-fired boilers,
although the busbar cost is less because of the smaller amount
of urea that must be injected to achieve an equivalent percent
NOx reduction. The sensitivity curves follow the same general
trends as with LNB + SNCR applied to coal-fired wall boilers.
6.5.4 Low NOx Burners with Advanced Overfire Air and
Selective Catalytic Reduction
Cost estimates for the combination control of LNB +
AOFA + SCR are presented in this section for wall and
tangential coal-fired and natural gas- and oil-fired boilers.
6.5.4.1 Costing Procedures. The cost algorithms for LNB
+ AOFA + SCR were developed by combining the individual
capital, variable O&M, and fixed O&M cost algorithms for each

TABLE 5-14. PERFORMANCE OF SNCR ON CONVENTIONAL U. S. UTILITY BOILERS(Concluded)
6-744

TABLE 5-14. PERFORMANCE OF SNCR ON CONVENTIONAL U. S. UTILITY BOILERS(Concluded)
6-745

TABLE 5-14. PERFORMANCE OF SNCR ON CONVENTIONAL U. S. UTILITY BOILERS(Concluded)
6-746
of the three technologies. Refer to sections 6.3.2, 6.4.3,
and 6.5.2 for these costing procedures.
6.5.4.2 Model Plant Results.
6.5.4.2.1 Coal-fired model plants. The capital cost,
busbar cost, and cost effectiveness for the ten wall- and
tangentially-fired boilers are presented in table 6-20

TABLE 5-14. PERFORMANCE OF SNCR ON CONVENTIONAL U. S. UTILITY BOILERS(Concluded)
6-747
TABLE 6-20. COSTS FOR LNB + AOFA + SCR APPLIED TO COAL-FIRED BOILERS
Plant
identification
Total capital
$/kW
Busbar cost,
mills/kWh
Cost effectiveness,
$/ton
4 9,250
1,870
2,760
1,460
1,300
9,990
2,020
3,120
1,650
1,500
LNB + AOFA retrofit factor and indirect cost factor are both 1.3. SCR
retrofit
factor and indirect cost factor are 1.34 and 1.45, respectively.
reduction of 90 percent were used for wall-fired boilers.
Peaking = 10 percent capacity factor.
Baseload = 65 percent capacity factor.
Cycling = 30 percent capacity factor.

TABLE 5-14. PERFORMANCE OF SNCR ON CONVENTIONAL U. S. UTILITY BOILERS(Concluded)
6-748
. An economic life of 20 years and a NOx reduction efficiency
of 50 percent for LNB + AOFA and 80 percent for SCR were
assumed for all boilers. The catalyst price was estimated to
be $400/ft3 for each boiler, and an average retrofit factor of
1.34 was used. For the 600 MW baseload boiler, the estimated
cost effectiveness ranged from $1,300 to $1,660 per ton of NOx
removed. For the 100 MW peaking wall-fired boiler, the
estimated cost effectiveness ranges from $9,250 to $11,100 per
ton.
Cost per ton of NOx removed with LNB + AOFA + SCR on
tangentially-fired boilers is higher than for wall-fired
boilers due to the lower baseline NOx levels associated with
tangentially-fired boilers. Cost effectiveness for the 600 MW
baseload tangentially-fired boiler ranges from $1,500 to
$1,970 per ton. For the 100 MW peaking tangentially-fired
boiler, the estimated cost effectiveness ranges from $9,990 to
$12,400 per ton.
6.5.4.2.2 Natural gas- and oil-fired model plants. The
capital cost, busbar cost, and cost effectiveness for the 10
wall- and tangentially-fired boilers are presented in
table 6-21

TABLE 5-14. PERFORMANCE OF SNCR ON CONVENTIONAL U. S. UTILITY BOILERS(Concluded)
6-749
TABLE 6-21. COSTS FOR LNB + AOFA + SCR APPLIED TO NATURAL GAS-FIRED BOILERS
Plant
identification
Total capital
$/kW
Busbar cost,
mills/kWh
Cost effectiveness,
$/ton
(yr)
9 10,500
2,150
2,740
1,470
1,200
13,400
2,750
3,640
1,960
1,650
LNB + AOFA retrofit factor and indirect cost factor are both 1.3. SCR
retrofit
factor and indirect cost factor are 1.34 and 1.45, respectively.
reduction of 93 percent were used for wall-fired boilers.
Peaking = 10 percent capacity factor.
Baseload = 65 percent capacity factor.
Cycling = 30 percent capacity factor.
reduction of 93 percent were used for tangentially-fired boilers.

TABLE 5-14. PERFORMANCE OF SNCR ON CONVENTIONAL U. S. UTILITY BOILERS(Concluded)
6-750
TABLE 6-22. COSTS FOR LNB + AOFA + SCR APPLIED TO OIL-FIRED BOILERS
Plant
identification
Total capital
$/kW
Busbar cost,
mills/kWh
Cost effectiveness,
$/ton
9 11,300
2,300
3,030
1,620
1,350
14,700
3,010
4,130
2,210
1,900
LNB + AOFA retrofit factor and indirect cost factor are both 1.3. SCR
retrofit
factor and indirect cost factor are 1.34 and 1.45, respectively.
reduction of 93 percent were used for wall-fired boilers.
Peaking = 10 percent capacity factor.
Baseload = 65 percent capacity factor.
Cycling = 30 percent capacity factor.
and 6-22, respectively. An economic life of 20 years and a

TABLE 5-14. PERFORMANCE OF SNCR ON CONVENTIONAL U. S. UTILITY BOILERS(Concluded)
6-751
NOx reduction efficiency of 50 percent for LNB + AOFA and
85 percent for SCR were assumed for all boilers. The catalyst
price was estimated to be $400/ft3 for each boiler, and an
average retrofit factor of 1.34 was used. Space velocities
of 14,000/hr and 5,000/hr were assumed for natural gas- and
oil-fired boilers, respectively. Cost per ton of NOx removed
with SCR on oil-fired boilers is higher than natural gas-fired
boilers because of greater catalyst volume for oil-fired
boilers.

TABLE 5-14. PERFORMANCE OF SNCR ON CONVENTIONAL U. S. UTILITY BOILERS(Concluded)
6-752

TABLE 5-14. PERFORMANCE OF SNCR ON CONVENTIONAL U. S. UTILITY BOILERS(Concluded)
6-753

TABLE 5-14. PERFORMANCE OF SNCR ON CONVENTIONAL U. S. UTILITY BOILERS(Concluded)
6-754
For the 600 MW baseload boiler, the estimated cost
effectiveness ranged from $1,200 to $1,290 per ton of NOx
removed for the natural gas-fired boilers and $1,350 to $1,610
per ton of NOx removed for oil-fired boilers. For the 100 MW
peaking natural gas- and oil-fired wall boilers, the estimated
cost effectiveness ranges from $10,500 to $11,000 per ton and
$11,300 to $12,700 per ton, respectively.
Cost per ton of NOx removed with LNB + AOFA + SCR on
tangentially-fired boilers is higher than for wall-fired
boilers due to the lower baseline NOx levels associated with
tangentially-fired boilers. Cost effectiveness for the 600 MW
baseload tangentially-fired boilers range from $1,650 to
$1,800 per ton for the natural gas-fired boiler and $1,900 to
$2,330 per ton of NOx removed for oil-fired boilers. For the
100 MW peaking natural gas- and oil-fired tangential boilers,
the estimated cost effectiveness range from $13,400 to
$13,200 per ton and $14,700 to $16,900 per ton of NOx removed
for oil-fired boilers.
6.5.4.3 Sensitivity Analysis
6.5.4.3.1 Coal-fired boilers sensitivity analysis. The
effect of plant characteristics (retrofit factor, boiler size,
capacity factor, and economic life) and catalyst life on cost
effectiveness and busbar cost for wall-fired boilers is shown
in figure 6-67

TABLE 5-14. PERFORMANCE OF SNCR ON CONVENTIONAL U. S. UTILITY BOILERS(Concluded)
6-755
Figure 6-67. Impact of plant characteristics on LNB + AOFA + SCR cost
effectiveness

TABLE 5-14. PERFORMANCE OF SNCR ON CONVENTIONAL U. S. UTILITY BOILERS(Concluded)
6-756
emission characteristics and heat rate on LNB + AOFA
+ SCR
. Figure 6-68 presents the sensitivity of cost effectiveness
TABLE 5-14. PERFORMANCE OF SNCR ON CONVENTIONAL U. S. UTILITY BOILERS(Concluded)
6-757
to NOx emission characteristics (uncontrolled NOx level and
NOx reduction efficiency for both LNB + AOFA and SCR) and heat
rate. As shown in the figures, the reference boiler's cost
effectiveness and busbar cost are approximately $2,120 per ton
of NOx removed and 9.5 mills/kWh.
Of the parameters shown in figure 6-67, the variation of
capacity factor from 10 to 70 percent has the greatest impact
on cost effectiveness and busbar cost. The cost effectiveness
value and busbar cost exhibit an inverse relationship with
capacity factor, and thus, as capacity factor decreases, the
cost effectiveness value and busbar cost increase. This is
especially noticeable at low capacity factors where a decrease

TABLE 5-14. PERFORMANCE OF SNCR ON CONVENTIONAL U. S. UTILITY BOILERS(Concluded)
6-758

TABLE 5-14. PERFORMANCE OF SNCR ON CONVENTIONAL U. S. UTILITY BOILERS(Concluded)
6-759
of 75 percent in the reference plant's capacity factor (from
40 to 10 percent) results in an increase in the cost
effectiveness value and busbar cost of nearly 300 percent.
Variations in catalyst life, economic life, and boiler
size follow a trend similar to capacity factor, but do not
cause as great a change in cost effectiveness and busbar cost.
For example, a decrease of 33 percent of the catalyst life
(from 3 years to 2 years) increases the cost effectiveness
value approximately 20 percent. Similarly, a decrease of
75 percent in economic life (from 20 to 5 years) results in an
increase in the plant's cost effectiveness value and busbar
cost of approximately 60 percent, and a decrease of 75 percent
in the boiler size (from 400 to 100 MW) results in an increase
in the plant's cost effectiveness value and busbar cost of
nearly 35 percent.
The cost effectiveness value and busbar cost are linearly
related to retrofit factor. An increase or decrease of 0.3
from the reference plant's retrofit factor of 1.3 causes a
corresponding change in the cost effectiveness valu and busbar
cost of less than 10 percent.
Of the parameters shown in figure 6-68, the variation of
uncontrolled NOx from 0.6 to 1.2 lb/MMBtu has the greatest
impact on cost effectiveness. Variation in NOx reduction
exhibits an inverse relationship to the cost effectiveness
value. A 33-percent decrease in the reference plants
uncontrolled NOx (from 0.9 to 0.6 lb/MMBtu) results in an
increase in the cost effectiveness value of approximately
50 percent.
Variation in the heat rate from 9,200 to 12,800 Btu/kWh
follows a trend similar to the variation in uncontrolled NOx.
A 16-percent decrease in heat rate (11,000 to 9,200 Btu/kWh)
results in an increase of the cost effectiveness value of
approximately 20 percent. Potential variations in the NOx
TABLE 5-14. PERFORMANCE OF SNCR ON CONVENTIONAL U. S. UTILITY BOILERS(Concluded)
6-760
reduction efficiency of LNB + AOFA or SCR result in less than
a 5 percent change in cost effectiveness.
The effect of plant characteristics (retrofit factor,
boiler size, capacity factor, and economic life) and catalyst
life on cost effectiveness and busbar cost for tangentially-
fired boilers is shown in figure 6-69
TABLE 5-14. PERFORMANCE OF SNCR ON CONVENTIONAL U. S. UTILITY BOILERS(Concluded)
6-761
Figure 6-69. Impact of plant characteristics on LNB + AOFA + SCR cost
effectiveness

TABLE 5-14. PERFORMANCE OF SNCR ON CONVENTIONAL U. S. UTILITY BOILERS(Concluded)
6-762
emission characteristics and heat rate on LNB + AOFA
+ SCR
. Figure 6-70 presents the sensitivity of cost effectiveness

TABLE 5-14. PERFORMANCE OF SNCR ON CONVENTIONAL U. S. UTILITY BOILERS(Concluded)
6-763
to NOx emission characteristics (uncontrolled NOx level and
NOx reduction efficiency for both LNB + AOFA and SCR) and heat
rate. As shown in the figures, the reference boiler's cost
effectiveness and busbar cost are approximately $2,450 per ton
of NOx removed and 8.5 mills/kWh. The cost effectiveness
values for LNB + AOFA + SCR applied to tangentially-fired
boilers are slightly higher than on wall-fired boilers because
of lower uncontrolled NOx levels of tangentially-fired
boilers, although the busbar cost is lower because of the
higher capital and O&M costs associated with LNB + AOFA + SCR
applied to wall-fired boilers. The sensitivity curves follow
the same general trends as with LNB + AOFA + SCR applied to
wall-fired boilers.
6.5.4.3.2 Natural gas- and oil-fired boiler sensitivity
analysis. The effect of plant characteristics (retrofit
factor, boiler size, capacity factor, and economic life) and
catalyst life on cost effectiveness and busbar cost for
natural gas- and oil-fired wall boilers is shown in
figure 6-71

TABLE 5-14. PERFORMANCE OF SNCR ON CONVENTIONAL U. S. UTILITY BOILERS(Concluded)
6-764
Figure 6-71. Impact of plant characteristics on LNB + AOFA + SCR cost
effectiveness

TABLE 5-14. PERFORMANCE OF SNCR ON CONVENTIONAL U. S. UTILITY BOILERS(Concluded)
6-765
Figure 6-72. Impact of plant characteristics on LNB + AOFA + SCR cost
effectiveness
and busbar cost for oil-fired wall boilers.
emission characteristics and heat rate on LNB + AOFA
+ SCR
emission characteristics and heat rate on LNB + AOFA
+ SCR
and 6-72, respectively. Figures 6-73 and 6-74 presents the

TABLE 5-14. PERFORMANCE OF SNCR ON CONVENTIONAL U. S. UTILITY BOILERS(Concluded)
6-766
sensitivity of cost effectiveness to NOx emission
characteristics (uncontrolled NOx level and NOx reduction
efficiency for both LNB + AOFA and SCR) and heat rate. As
shown in figures 6-71 and 6-72, the natural gas-fired
reference boiler's cost effectiveness and busbar cost are
approximately $1,900 per ton of NOx removed and 4.8 mills/kWh
and the oil-fired reference boilers cost effectiveness and
busbar cost are approximately $2,200 per ton of NOx removed
and 5.6 mills/kWh. The cost effectiveness values and busbar
costs for LNB + AOFA + SCR applied to natural gas-fired
boilers are lower than for oil-fired boilers because of the
smaller catalyst volumes on natural gas boilers. Similarly,

TABLE 5-14. PERFORMANCE OF SNCR ON CONVENTIONAL U. S. UTILITY BOILERS(Concluded)
6-767

TABLE 5-14. PERFORMANCE OF SNCR ON CONVENTIONAL U. S. UTILITY BOILERS(Concluded)
6-768

TABLE 5-14. PERFORMANCE OF SNCR ON CONVENTIONAL U. S. UTILITY BOILERS(Concluded)
6-769

TABLE 5-14. PERFORMANCE OF SNCR ON CONVENTIONAL U. S. UTILITY BOILERS(Concluded)
6-770

TABLE 5-14. PERFORMANCE OF SNCR ON CONVENTIONAL U. S. UTILITY BOILERS(Concluded)
6-771

TABLE 5-14. PERFORMANCE OF SNCR ON CONVENTIONAL U. S. UTILITY BOILERS(Concluded)
6-772
cost effectiveness values for LNB + AOFA + SCR applied to
natural gas- and oil-fired wall boilers are slightly higher
than on coal-fired wall boilers because of lower uncontrolled
NOx levels of natural gas- and oil-fired boilers, although the
busbar cost is lower because of the smaller catalyst volumes
and longer catalyst life associated with SCR applied to
natural gas- and oil-fired boilers. The sensitivity curves
follow the same general trends as with LNB + AOFA + SCR
applied to coal-fired wall boilers.
The effect of plant characteristics (retrofit factor,
boiler size, capacity factor, and economic life) and catalyst
life on cost effectiveness and busbar cost for tangentially-
fired boilers is shown in figures 6-75

TABLE 5-14. PERFORMANCE OF SNCR ON CONVENTIONAL U. S. UTILITY BOILERS(Concluded)
6-773
Figure 6-75. Impact of plant characteristics on LNB + AOFA + SCR cost
effectiveness

TABLE 5-14. PERFORMANCE OF SNCR ON CONVENTIONAL U. S. UTILITY BOILERS(Concluded)
6-774
Figure 6-76. Impact of plant characteristics on LNB + AOFA + SCR cost
effectiveness
emission characteristics and heat rate on LNB + AOFA
+ SCR
emission characteristics and heat rate on LNB + AOFA
+ SCR
and 6-76. Figures 6-77 and 6-78 present the sensitivity of

TABLE 5-14. PERFORMANCE OF SNCR ON CONVENTIONAL U. S. UTILITY BOILERS(Concluded)
6-775
cost effectiveness to NOx emission characteristics
(uncontrolled NOx level and NOx reduction efficiency for both
LNB + AOFA and SCR) and heat rate. As shown in figures 6-76
and 6-78, the natural gas-fired reference boiler's cost
effectiveness and busbar cost are approximately $2,600 per ton
of NOx removed and 3.9 mills/kWh and the oil-fired reference
boilers cost effectiveness and busbar cost are approximately
$3,000 per ton of NOx removed and 4.6 mills/kWh. The cost
effectiveness value and busbar costs for LNB + AOFA + SCR
applied to natural gas-fired boilers are lower than for oil-
fired boilers because of the smaller catalyst volumes on
natural gas boilers. Similarly, cost effectiveness values for
LNB + AOFA + SCR applied to natural gas- and oil-fired
tangential boilers are slightly higher than on coal-fired wall
boilers because of lower uncontrolled NOx levels of natural
gas- and oil-fired boilers, although the busbar cost is lower
because of the smaller catalyst volumes and longer catalyst
life associated with SCR applied to natural gas- and oil-fired
boilers. The sensitivity curves follow the same general
trends as with LNB + AOFA + SCR applied to coal-fired wall
boilers. Tangentially-fired boilers are slightly higher than
on wall-fired boilers because of lower uncontrolled NOx levels
of

TABLE 5-14. PERFORMANCE OF SNCR ON CONVENTIONAL U. S. UTILITY BOILERS(Concluded)
6-776

TABLE 5-14. PERFORMANCE OF SNCR ON CONVENTIONAL U. S. UTILITY BOILERS(Concluded)
6-777

TABLE 5-14. PERFORMANCE OF SNCR ON CONVENTIONAL U. S. UTILITY BOILERS(Concluded)
6-778

TABLE 5-14. PERFORMANCE OF SNCR ON CONVENTIONAL U. S. UTILITY BOILERS(Concluded)
6-779
tangentially-fired boilers, although the busbar cost is lower
because of the higher capital and O&M costs associated with
LNB + AOFA + SCR applied to wall-fired boilers. The
sensitivity curves follow the same general trends as with
LNB + AOFA + SCR applied to wall-fired boilers.
TABLE 5-14. PERFORMANCE OF SNCR ON CONVENTIONAL U. S. UTILITY BOILERS(Concluded)
6-780
6.6 REFERENCES
1. EPRI (Electric Power Research Institute). TAGTMTechnical Assessment Guide. EPRI P-4463-SR, Volume 1. Technical Evaluation Center, Palo Alto, CA. December1986. pp. 3-1 through 3-14.
2. Vatavuk, William M. OAQPS Control Cost Manual. FourthEdition. Chapters 1 and 2. EPA 450/3-90-006. U. S.Environmental Protection Agency, Office of Air QualityPlanning and Standards, Research Triangle Park, NC. January 1990. pp. 1-1 through 2-32.
3. U. S. Department of Energy, Office of Integrated Analysisand Forecasting. Annual Energy Outlook 1992. DOE/EIA-0383(92). Washington, DC. January 1992. pp. 66 and 67.
4. Telecon. Illig, C., Radian Corporation, with Millard,D., National Ammonia Company. January 4, 1993. SNCRchemical costs (urea, anhydrous, and aqueous ammonia).
5. Fax. Verah, J., LaRoche, Industries to Illig, C., RadianCorporation. January 7, 1993. SNCR Chemical Cost.
6. Telecon. Illig C., Radian Corporation, with Martina, T.,LaRoche Industries. January 4, 1993. SNCR ChemicalCost.
7. Telecon. Illig, C., Radian Corporation with Vereah, J.,LaRoche Industries. January 6, 1993. SNCR Costing -Aqua + Anhydrous Ammonia.
8. Telecon. Illig C., Radian Corporation, withMoredyke, D., UNOCAL Corp. January 4, 1993. SNCRChemical Cost, NOxOut A Costing.
9. Letter from Poole, M. F., W. H. Shurtleff Company toIllig, C., Radian Corporation. January 6, 1993. SNCRChemical Cost for Urea + NOxOut A.
10. Telecon. Illig, C., Radian Corporation with Kellog, G.,Nalco Fuel. January 5, 1993. SNCR Chemical Cost forEnhancers.
11. Fax. Miskus, J., Cargill, Inc. to Illig, C., RadianCorporation. January 13, 1993. SNCR Chemical Cost forUrea + NOxoutA.

TABLE 5-14. PERFORMANCE OF SNCR ON CONVENTIONAL U. S. UTILITY BOILERS(Concluded)
6-781
12. Grusha, J. and McCartney, M. S. Development andEvolution of the ABB Combustion Engineering Low NOxConcentric Firing System. TIS 8551. ABB CombustionEngineering Service, Inc. Windsor, CT. 1991. p. 9.
13. U. S. Environmental Protection Agency, Office of AirQuality Planning and Standards. Evaluation and Costingof NOx Controls for Existing Utility Boilers in theNESCAUM Region. EPA-453/R-92-010. Research TrianglePark, NC. December, 1992. p. 6-20.
14. Letter and attachments from R. D. Pickens, Nalco FuelTech, to E. Soderberg, Radian Corporation. February 8,1992.
15. Letter and attachments from R. D. Pickens, Nalco FuelTech, to N. Kaplan, U. S. Environmental ProtectionAgency. January 20, 1992.
16. U. S. Environmental Protection Agency, Integrated AirPollution Control System, Version 4.0, Volume 2: Technical Documentation Manual. EPA-600/7-90-022b. Airand Energy Engineering Research Laboratory, ResearchTriangle Park, NC. December 1990. pp. 4-77 through4-97.
17. Emmel, T. E., Maibodi, M., and J. A. Martinez, Comparisonof West German and U. S. Flue Gas Desulfurization andSelective Catalytic Reduction Costs. EPA-600/7-90-009. Air and Energy Engineering Research Laboratory, U. S.Environmental Protection Agency, Research Triangle Park,NC. April 1990. p. 14.

TABLE 6-4. DESIGN AND OPERATING CHARACTERISTICS OF MODEL BOILERS
Fuel type Furnace typeBoiler
capacity, MWCapacityfactor, %
Heat rate, Btu/kWh
UncontrolledNOx,
lb/MMBtu
Coal Wall 100 10 12,500 0.9
Coal Wall 100 65 10,000 0.9
Coal Wall 300 30 11,000 0.9
Coal Wall 300 65 10,000 0.9
Coal Wall 600 65 10,000 0.9
Coal Tangential 100 10 12,500 0.7
Coal Tangential 100 65 10,000 0.7
Coal Tangential 300 30 11,000 0.7
Coal Tangential 300 65 10,000 0.7
Coal Tangential 600 65 10,000 0.7
Coal Cyclone 100 10 12,500 1.5
Coal Cyclone 100 65 10,000 1.5
Coal Cyclone 300 30 11,000 1.5
Coal Cyclone 300 65 10,000 1.5
Coal Cyclone 600 65 10,000 1.5
Coal FBC 50 30 11,000 0.19
Coal FBC 50 65 10,000 0.19
Coal FBC 100 30 11,000 0.19

TABLE 6-4. DESIGN AND OPERATING CHARACTERISTICS OF MODEL BOILERS(Concluded)
Fuel type Furnace typeBoiler
capacity, MWCapacityfactor, %
Heat rate, Btu/kWh
UncontrolledNOx,
lb/MMBtu
Coal FBC 100 65 10,000 0.19
Coal FBC 200 65 10,000 0.19
Gas/Oil Wall 100 10 12,500 0.5
Gas/Oil Wall 100 65 10,000 0.5
Gas/Oil Wall 300 30 11,000 0.5
Gas/Oil Wall 300 65 10,000 0.5
Gas/Oil Wall 600 65 10,000 0.5
Gas/Oil Tangential 100 10 12,500 0.3
Gas/Oil Tangential 300 30 11,000 0.3
Gas/Oil Tangential 100 65 10,000 0.3
Gas/Oil Tangential 300 65 10,000 0.3
Gas/Oil Tangential 600 65 10,000 0.3

TABLE 6-8. COSTS FOR NGR APPLIED TO COAL-FIRED BOILERS
Plant identification Total capital cost, $/kW Busbar cost, mills/kWh Cost effectiveness, $/ton
Fuel price differential
($/MMBtu)
0.50 1.50 2.50 0.5 1.50 2.50 0.50 1.50 2.50
Wall-fired Boilersa
100 MW, Peakingb 58.0 58.0 58.0 8.44 10.7 12.9 3,010 3,800 4,600
100 MW, Baseloadc 58.0 58.0 58.0 1.69 3.49 5.29 753 1,560 2,360
300 MW, Cyclingd 38.0 38.0 38.0 2.22 4.20 6.18 898 1,700 2,500
300 MW, Baseload 38.0 38.0 38.0 1.26 3.06 4.86 562 1,360 2,170
600 MW, Baseload 29.0 29.0 29.0 1.07 2.87 4.67 478 1,280 2,080
Tangentially-fired boilerse
100 MW, Peaking 58.0 58.0 58.0 8.44 10.7 12.9 3,870 4,900 5,930
100 MW, Baseload 58.0 58.0 58.0 1.69 3.49 5.29 968 2,000 3,030
300 MW, Cycling 38.0 38.0 38.0 2.22 4.20 6.18 1,150 2,190 3,220
300 MW Baseload 38.0 38.0 38.0 1.26 3.06 4.86 722 1,750 2,790
600 MW, Baseload 29.0 29.0 29.0 1.07 2.87 4.67 615 1,650 2,680
Cyclone-fired boilersf
100 MW, Peaking 58.0 58.0 58.0 8.46 10.7 13.0 1,810 2,290 2,770
100 MW, Baseload 58.0 58.0 58.0 1.71 3.51 5.31 456 938 1,420
300 MW, Cycling 38.0 38.0 38.0 2.23 4.21 6.19 543 1,020 1,510
300 MW, Baseload 38.0 38.0 38.0 1.28 3.08 4.88 342 823 1,300
600 MW, Baseload 29.0 29.0 29.0 1.09 2.89 4.69 291 773 1,250
aUncontrolled NOx levels of 0.90 lb/MMBtu and an NGR NOx reduction of 55 percent were used for
wall-fired boilers. bPeaking = 10 percent capacity factor.cBaseload = 65 percent capacity factor.dCycling = 30 percent capacity factor.

eUncontrolled NOx levels of 0.70 lb/MMBtu and an NGR NOx reduction of 55 percent were used for
tangentially-fired boilers.fUncontrolled NOx levels of 1.5 lb/MMBtu and an NGR NOx reduction of 55 percent were used for
cyclone-fired boilers.

TABLE 6-13. COSTS FOR SNCR APPLIED TO COAL-FIRED BOILERS
Plantidentification
Total capital cost,$/kW
Busbar cost,mills/kWh
Cost effectiveness,$/ton
Urea cost, $/ton 140 200 260 140 200 260 140 200 260
Wall-fired boilersa
100 MW, Peakingb 14 14 14 5.47 5.86 6.25 2,160 2,320 2,470
100 MW, Baseloadc 14 14 14 1.54 1.85 2.16 760 910 1,070
300 MW, Cyclingd 10 10 10 1.78 2.12 2.46 800 950 1,100
300 MW, Baseload 10 10 10 1.25 1.56 1.86 610 770 920
600 MW, Baseload 9 9 9 1.14 1.45 1.76 560 720 870
Tangentially-fired boilerse
100 MW, Peaking 14 14 14 5.23 5.53 5.83 2,660 2,810 2,960
100 MW, Baseload 14 14 14 1.35 1.59 1.83 860 1,010 1,160
300 MW, Cycling 10 10 10 1.57 1.83 2.09 910 1,060 1,210
300 MW Baseload 10 10 10 1.06 1.29 1.53 670 820 970
600 MW, Baseload 9 9 9 0.95 1.19 1.43 610 760 910
Cyclone-fired boilersf
100 MW, Peaking 14 14 14 6.18 6.84 7.50 1,460 1,620 1,780
100 MW, Baseload 14 14 14 2.10 2.63 3.16 620 780 940
300 MW, Cycling 10 10 10 2.40 2.98 3.56 650 800 960
300 MW Baseload 10 10 10 1.81 2.34 2.87 540 690 850
600 MW, Baseload 9 9 9 1.71 2.23 2.76 510 660 820

TABLE 6-13. COSTS FOR SNCR APPLIED TO COAL-FIRED BOILERS (Concluded)
Plantidentification
Total capital cost,$/kW
Busbar cost,mills/kWh
Cost effectiveness,$/ton
Urea cost, $/ton 140 200 260 140 200 260 140 200 260
FBC Boilersg
50 MW, Cycling 16 16 16 2.40 2.47 2.54 5,100 5,260 5,410
50 MW, Baseload 16 16 16 1.20 1.26 1.33 2,800 2,950 3,110
100 MW, Cycling 14 14 14 1.66 1.74 1.81 3,540 3,690 3,850
100 MW Baseload 14 14 14 0.86 0.92 0.99 2,010 2,160 2,310
200 MW, Baseload 11 11 11 0.65 0.71 0.78 1,520 1,670 1,820
aUncontrolled NOx levels of 0.90 lb/MMBtu and an SNCR NOx reduction of 45 percent were used for wall-fired boilers.
bPeaking = 10 percent capacity factor.
cBaseload = 65 percent capacity factor.
dCycling = 30 percent capacity factor.
eUncontrolled NOx levels of 0.70 lb/MMBtu and an SNCR NOx reduction of 45 percent were used for tangentially-fired boilers.
fUncontrolled NOx levels of 1.5 lb/MMBtu and an SNCR NOx reduction of 45 percent were used for cyclone-fired boilers.
gUncontrolled NOx levels of 0.19 lb/MMBtu and an SNCR NOx reduction of 45 percent were used for FBC boilers.
7-788
7.0 ENVIRONMENTAL AND ENERGY IMPACTS OF NOx CONTROLS
This chapter presents the reported effects of combustion
modifications and flue gas treatment controls on boiler
performance and secondary emissions from new and retrofit
fossil fuel-fired utility boilers. Since most of these
effects are not routinely measured by utilities, there are
limited data available to correlate boiler performance and
secondary emissions with nitrogen oxides (NOx) emissions or
NOx reduction. These effects are combustion-related and
depend upon unit-specific factors such as furnace type and
design, fuel type, and operating practices and restraints. As
a result, the data in this chapter should be viewed as general
information on the potential effects of NOx controls, rather
than a prediction of effects for specific boiler types.
The effects of combustion controls on coal-fired boilers,
both new and retrofit applications, are given in section 7.1.
The effects of combustion controls on natural gas- and oil-
fired boilers are presented in section 7.2. The effects of
flue gas treatment controls on conventional and fluidized bed
combustion (FBC) boilers are given in section 7.3.
7.1 EFFECTS FROM COMBUSTION CONTROLS ON COAL-FIRED UTILITY
BOILERS
Combustion NOx controls suppress both thermal and fuel
NOx formation by reducing the peak flame temperature and by
delaying mixing of fuel with the combustion air. This can
result in a decrease of boiler efficiency and must be
considered during the design of a NOx control system for any
new or retrofit application.
7-789
In coal-fired boilers, an increase in unburned carbon
(UBC) indicates incomplete combustion and results in a
reduction of boiler efficiency. The UBC can also change the
properties of the fly ash and may affect the performance of
the electrostatic precipitator. Higher UBC levels may make
the flyash unsalable, thus increasing ash disposal costs for
plants that currently sell the flyash to cement producers.
Other combustion efficiency indicators are carbon
monoxide (CO) and total hydrocarbon (THC) emissions. An
increase in CO emissions also signals incomplete combustion
and can reduce boiler efficiency. Emissions of THC from coal-
fired boilers are usually low and are rarely measured.
7.1.1 Retrofit Applications
7.1.1.1 Carbon Monoxide Emissions. The results from
combustion modifications on coal-fired boilers are presented
in table 7-1.

7-790

7-791

7-792

7-793
Carbon monoxide emissions are presented for burners-out-of-
service (BOOS), advanced overfire air (AOFA), low NOx burners
(LNB), LNB + AOFA, and reburn. For several of these
applications, the data show increased CO emissions with
retrofit combustion controls. For other units, however, the
CO levels after application of controls were equal to or less
than the initial levels.
For the only reported BOOS application, the CO emissions
increased from 357 parts per million (ppm) to 392-608 ppm.
The corresponding NOx reduction was 30 to 33 percent.
While there were four units mentioned in section 5.1.2.3
that have NOx emission data from retrofit AOFA, only one unit
(Hammond 4) had corresponding CO emissions data. This unit is
an opposed-wall unit firing bituminous coal. Data are
presented for different loads prior to and after the retrofit
of an AOFA system. The CO levels prior to the retrofit of
AOFA range from 20 to 100 ppm over the load range. With the
AOFA system, the CO levels decreased to an average of 15 ppm
across the load range. The NOx reduction was 10 to 25 percent
across the load range. These data indicate a large decrease
in CO; however, the CO levels were not routinely monitored

7-794

7-795

7-796
prior to the retrofit and the decrease may be attributable to
plant operating personnel taking action to reduce CO emissions
after the retrofit.2
For the one tangential boiler with retrofit LNB (Lansing
Smith 2), the uncontrolled CO emissions were 12 to 15 ppm
while the CO emissions were 10 to 20 ppm with the Low NOx
Concentric Firing System (LNCFS) Level I which incorporates
close-coupled OFA (CCOFA). The corresponding NOx reduction
was 34 to 42 percent across the load range.
For all but two of the wall-fired boilers firing
bituminous coal with LNB, the reported uncontrolled CO
emissions were 100 ppm or less and the controlled CO emissions
were 60 ppm or less. However, for Edgewater 4, the CO
increased from 16 ppm up to 100 to 170 ppm following retrofit
of LNB. At reduced load, Quindaro 2 reported a CO level of
95 ppm with LNB. The CO level without LNB was not reported.
The largest decrease in CO emissions was at the Hammond 4
unit. However, as previously discussed, the CO level was not
routinely measured prior to the retrofit and the decrease may
be attributable to plant operating personnel taking action to
reduce the CO emissions after the retrofit. For the one cell-
fired unit, J.M. Stuart 4, the CO emissions with LNB were
slightly higher than uncontrolled levels at full-load and
intermediate load. The CO emissions were less with LNB at low
load. The corresponding NOx reductions ranged from 47 to
55 percent.
The Four Corners 4 unit, which converted from cell firing
to an opposed-wall circular firing configuration, showed a
small increase in CO emissions with LNB when firing
subbituminous coal. The corresponding NOx reduction for Four
Corners 4 ranged from 6 to 57 percent across the load range.
Quindaro 2 was also tested on subbituminous coal and the CO
ranged from 50-70 ppm across the load range.

7-797
There are four applications of LNB and AOFA on tangential
boilers shown in table 7-1. The LNB represented are the LNCFS
Levels II and III which incorporates separated OFA (SOFA) and
a combination of SOFA and CCOFA, respectively. Three of these
units (Valmont 5, Lansing Smith 2, and Cherokee 4) have the
LNCFS II technology. For these units, the CO emissions for
both uncontrolled and controlled conditions were less than
30 ppm. For the one unit employing LNCFS III technology
(Lansing Smith 2), the CO emissions increased from
uncontrolled levels of 12 to 15 ppm up to controlled levels of
22 to 45 ppm.
One wall-fired boiler, Sammis 6, was originally a cell-
fired boiler and was retrofitted with LNB + OFA. At full-
load, the CO increased to more than 225 ppm from baseline
levels of 17-25 ppm. At reduced load, the CO also increased
almost two-fold to 55 ppm. The reason for the large in CO at
full-load was not reported. The NOx reduction was
approximately 65 percent. The one roof-fired boiler,
Arapahoe 4, reported decreases in CO and ranged from 12-38 ppm
with LNB + OFA. The NOx reduction ranged from 63-71 percent
across the load range.
For the tangentially-fired unit (Hennepin 1) with
retrofit reburn, the CO emissions for both uncontrolled and
controlled conditions were 2 ppm. Carbon monoxide data from
two cyclone units with reburn are also given in table 7-1.
One unit (Nelson Dewey 2), uses pulverized coal as the reburn
fuel while the other unit (Niles 1), uses natural gas as the
reburn fuel. The CO emissions for the cyclone boilers
increased with the reburn system. For Nelson Dewey 2, the CO
emissions were 60 to 94 ppm without reburn and 80 to 110 ppm
with reburn. The corresponding NOx reduction was 36 to
53 percent across the load range. For Niles 1, the CO
emissions increased greatly from 25 to 50 to 312 ppm at full
load. At lower loads, the CO emissions were still at elevated

7-798
levels of 50 to 214 ppm. The corresponding NOx reduction was
36 to 47 percent.
To summarize, the CO emissions may increase with retrofit
combustion modifications. However, as shown in table 7-1,
with few exceptions, the CO emissions were usually less than
100 ppm with retrofit combustion controls.
7.1.1.2 Unburned Carbon Emissions and Boiler Efficiency.
Table 7-2

7-799

7-800

7-801

7-802
presents UBC and boiler efficiency data from 18 applications
of retrofit combustion NOx controls on coal-fired boilers.
For Hammond 4, the AOFA resulted in an increase of UBC two or
three times the uncontrolled level. Uncontrolled levels of
UBC at Hammond 4 ranged from 2.3 percent at low load to
5.2 percent at full load. With the AOFA, the UBC levels
increased to 7.1 percent at low load and 9.6 percent at full
load. The boiler efficiency at low load decreased by
0.7 percentage points and by 0.4 percentage points at full
load. The corresponding NOx reduction with AOFA was
10 percent at low load and 25 percent at full load.
For the tangential unit with LNCFS I technology, Lansing
Smith 2, the UBC levels range from 4.0 to 5.0 percent without
LNB and 4.0 to 5.3 percent with LNB. The boiler efficiency
with LNB decreased slightly to 89.6 percent.
The UBC from all of the wall-fired boilers increased with
the retrofit of LNB and LNB with OFA. For Edgewater 4, the
uncontrolled UBC levels increased from 2.7 to 3.2 percent to
6.6 to 9.0 percent with the LNB. The corresponding NOx
reduction was 39 to 43 percent across the load range. The
boiler efficiency decreased by 1.3 percentages points at full
load with the LNB.
For Gaston 2, the UBC increased from 5.3 to 6.3 percent
at low load and 7.4 to 10.3 percent at full load. The
corresponding NOx reduction at Gaston 2 ranged from 43 to
50 percent across the load range. Boiler efficiency data were
not available for this unit. For Hammond 4, the UBC increased
from 2.3 to 5.8 percent at low load and 5.2 to 8.0 percent at
full load with LNB. Increased UBC levels such as these could
limit the sale of fly ash to cement producers that typically
require UBC levels of 5 percent or less. The corresponding
NOx reductions were 50 and 45 percent, respectively. The
boiler efficiency at Hammond 4 decreased from 89.5 to

7-803

7-804

7-805
88.1 percent at full load and from 90 to 88.8 percent at low
load.
At Pleasants 2, the UBC increased from approximately
2.5 to 4.5 percent with a NOx reduction of 53 percent. Boiler
efficiency data were not available. The UBC level at Four
Corners 4 increased from 0.04 to 0.1 percent due to the LNB
across the load range. The NOx reduction achieved at this
plant ranged from 6 percent at low load to 57 percent at full
load.
The effects on UBC for the tangential units with LNB and
OFA were relatively small. For Valmont 5 with LNCFS II
technology, the UBC at full load decreased from 1.9 to
1.4 percent. At low load, the UBC increased slightly from
0.4 to 1.0 percent. The corresponding NOx reduction was 27 to
52 percent across the load range. The boiler efficiency at
high load decreased from 86.6 to 86.4 percent. For
Cherokee 4, the UBC increased from 2.2 to 2.5 percent at full
load and 0.3 to 0.6 percent at low loads. The NOx reduction
across the load range was 35 to 46 percent.
Lansing Smith 2 reported data for both a LNCFS II and a
LNCFS III retrofit. The UBC level decreased with the LNCFS II
and increased with the LNCFS III; however, the increase in UBC
with LNCFS III cannot be solely attributed to the LNB
retrofit, but rather may have been caused by different mill
performance levels during the testing.4,5,10 With LNCFS II, the
UBC decreased at full-load from 5.0 to 4.4 percent. At low
load, the UBC decreased from 4.0 to 3.9 percent. The
corresponding NOx reduction was 30 to 39 percent across the
load range. The boiler efficiency decreased by 0.6 to
0.9 percentage points with the LNCFS II technology. With
LNCFS III technology, the UBC increased from 5.0 to
6.0 percent at full-load and from 4.0 to 6.8 percent at low
load. The NOx reduction across the load range was 39 to
48 percent. The boiler efficiency decreased by 0.3 to
0.6 percentage points. For the remaining tangential boiler,
7-806
Lawrence 5, the UBC decreased from 0.4 to 0.3 percent at
full-load with LNB and OFA. The NOx reduction was 49 percent.
For Sammis 6, originally a cell-fired boiler, the UBC
increased from uncontrolled levels of 1.6-2.6 percent to
8-9.7 percent at full-load with LNB + OFA. At reduced load,
the UBC increased only slightly.
There are UBC data for two of the three boilers with
reburn as a retrofit NOx control technique. For the
tangential boiler with natural gas reburn, Hennepin 1, the UBC
decreased from 2.5 to 1.5 percent at full-load with a NOx
reduction of 63 percent. The boiler efficiency decreased from
88.3 to 86.7 percent, primarily due to the increased flue gas
moisture content resulting from the higher hydrogen content of
the natural gas as compared to coal.19,20
For Nelson Dewey 2, the UBC increased at all load ranges
with the pulverized coal reburn system. At full load, the UBC
ranged from 4 to 16 percent without reburn and 15 to
21 percent with reburn. At low load, the UBC ranged from 11
to 23 percent without reburn and 21 to 28 percent with the
reburn system. The NOx reduction across the load range was 36
to 53 percent. The boiler efficiency at full-load was
relatively unchanged; however, at low load the boiler
efficiency decreased from 88.5 to 87.0 percent. Niles 1 did
not report UBC levels, but did report a decrease in boiler
efficiency at full-load from 90.7 to 90.1 percent with reburn.
7.1.1.3 Summary of Particulate Matter and Total
Hydrocarbon Emissions. Table 7-3

7-807
TABLE 7-3. SUMMARY OF TOTAL HYDROCARBON AND PARTICULATE MATTER DATA
CONTROLS
Utility
Unit
Unit
Rated
capacity
(MW)
Control
Capacity
tested
(%)
Total hydrocarbon
(ppm)
Particulate matter
reduction
Reference
Uncon-
Control
Uncon-
Control
OVERFIRE AIR, BITUMINOUS COAL
Georgia Power
Co.
Hammond 4
(Pre)
AOFA
(FW)
2,3,12
BURNERS, BITUMINOUS COAL
Georgia Power
Co.
Hammond 4
(Pre)
CF/SF
(FW)
2,3,12
Dayton Power &
Light Co.
JM Stuart 4
(Pre)
LNCB
(B&W)
100
7556
2 1 --
1 ----
0.067
0.04
--
0.031
0.023
--
555447
13
BURNERS + OVERFIRE AIR
Lansing
Smith 2
(Pre)
LNCFS II
(ABB-CE)
4,5,10
BURNERS + OVERFIRE AIR, SUBBITUMINOUS COAL
Kansas Power
and Light Co.
Lawrence 5
(Pre)
PM + OFA
(CE-MHI)
25
REBURN, BITUMINOUS COAL
Illinois Power
Co.
Hennepin 1
(Pre)
NGR
(EERC)
19,20
Wisconsin Power
and Light
Nelson
Dewey 2
(Pre)
Coal
Reburn
(B&W)
100
7550
------
------
0.017
0.014
0.017
0.015
0.014
0.01
535036
21
= Pre-NSPS
Cell = Cell Burner, Cyc = Cyclone, Tan = Tangential, Wall = Wall-fired
Cell Burner, LNCFS II =
Concentric Firing System, Level II, NGR = Natural Gas Reburn, OFA = Overfire Air, PM = Pollution Minimum Burner,
ABB-CE = Asea Brown Boveri-Combustion Engineering, B&W = Babcock & Wilcox, CE-MHI = Combustion Engineering-Mitsubishi
Heavy Industries, EERC = Energy and Environmental Research Corporation, FW = Foster Wheeler
7-808
summarizes the PM and THC emissions from seven applications
of combustion NOx controls on coal-fired boilers. The PM
emissions at Hammond 4 increased from 1.58 gr/scf prior to
retrofit, to 1.68 gr/scf with AOFA and 1.96 gr/scf with LNB.
The corresponding NOx reduction with AOFA was 25 percent and
was 45 percent with LNB. The THC emissions for Hammond 4 were
not reported.
For J.M. Stuart 4, the THC emissions at full load were
2 ppm without LNB and 1 ppm with LNB. The PM emissions
decreased from 0.067 to 0.031 gr/scf with LNB at full-load and

7-809
decreased from 0.04 to 0.023 gr/scf at 75 percent load. The
corresponding NOx reduction was 54 to 55 percent. Lansing
Smith 2 reported THC emissions of less than 10 ppm with the
LNCFS II technology.
There are no THC data reported for reburn technology;
however, the PM emissions for Nelson Dewey 2 decreased from
0.017 to 0.015 gr/scf at high load and from 0.017 to
0.01 gr/scf at low load. The corresponding NOx reduction was
36 to 53 percent across the load range.
7.1.2 New Applications

7-810
Table 7-4
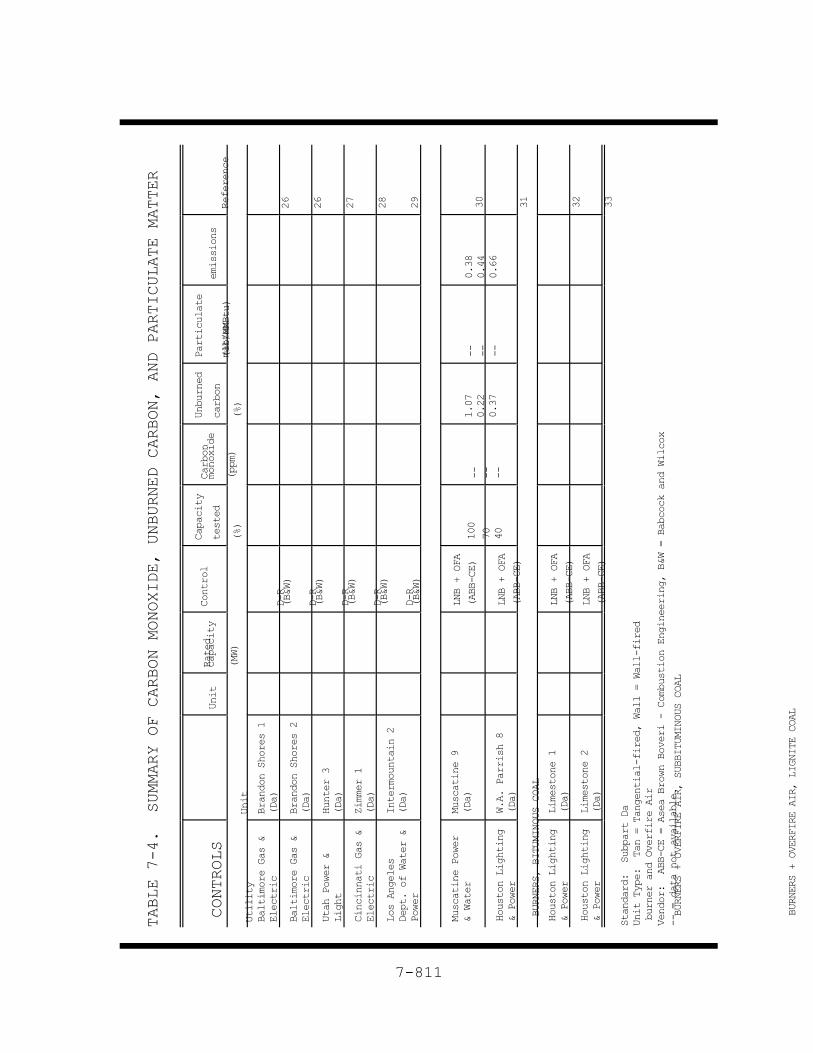
7-811
TABLE 7-4. SUMMARY OF CARBON MONOXIDE, UNBURNED CARBON, AND PARTICULATE MATTER
CONTROLS
Utility
Unit
Unit
Rated
capacity
(MW)
Control
Capacity
tested
(%)
Carbon
monoxide
(ppm)
Unburned
carbon
(%)
Particulate
matter
(lb/MMBtu)
emissions
Reference
BURNERS, BITUMINOUS COAL
Baltimore Gas &
Electric
Brandon Shores 1
(Da)
D-R
(B&W)
26
Baltimore Gas &
Electric
Brandon Shores 2
(Da)
D-R
(B&W)
26
Utah Power &
Light
Hunter 3
(Da)
D-R
(B&W)
27
Cincinnati Gas &
Electric
Zimmer 1
(Da)
D-R
(B&W)
28
Los Angeles
Dept. of Water &
Power
Intermountain 2
(Da)
D-R
(B&W)
29
BURNERS + OVERFIRE AIR, SUBBITUMINOUS COAL
Muscatine Power
& Water
Muscatine 9
(Da)
LNB + OFA
(ABB-CE)
100
7040
------
1.07
0.22
0.37
------
0.38
0.44
0.66
30
Houston Lighting
& Power
W.A. Parrish 8
(Da)
LNB + OFA
(ABB-CE)
31
BURNERS + OVERFIRE AIR, LIGNITE COAL
Houston Lighting
& Power
Limestone 1
(Da)
LNB + OFA
(ABB-CE)
32
Houston Lighting
& Power
Limestone 2
(Da)
LNB + OFA
(ABB-CE)
33
Standard: Subpart Da
Unit Type: Tan = Tangential-fired, Wall = Wall-fired
burner and Overfire Air
Vendor: ABB-CE = Asea Brown Boveri - Combustion Engineering, B&W = Babcock and Wilcox
-- = data not available.

7-812
presents a summary of CO, UBC, and PM emissions from nine new
units subject to the subpart Da standards. These boilers have
either LNB or LNB and OFA as original equipment. The CO
emissions for one wall-fired boiler with LNB were reported to
be less than 50 ppm. Three applications of LNB and OFA on
tangential boilers had CO emissions of 39 to 59 ppm.
The UBC for new units with LNB was in the range of 1.1 to
6.1 percent on boilers firing bituminous coal which is similar
to the UBC from retrofit applications. The UBC was in the
range of approximately 0.01 to 1 percent for boilers with LNB
and OFA firing either subbituminous or lignite coal.
The PM emissions from the new boilers with LNB were less
than 0.02 lb/MMBtu. The low PM emissions are expected since
these units are subject to the subpart Da standards and would
be equipped with high efficiency particulate control devices.
The corresponding NOx emissions from the boilers with LNB
range from 0.33 to 0.52 lb/MMBtu with LNB and 0.35 to
0.48 lb/MMBtu with LNB and OFA at full load.

7-813

7-814
7.2 EFFECTS FROM COMBUSTION CONTROLS ON NATURAL GAS- ANDOIL-FIRED BOILERS
Carbon monoxide emissions from three natural gas-fired
boilers with operational controls are given in table 7-5.

7-815
TABLE 7-7

7-816
THIS PAGE INTENTIONALLY LEFT BLANK.

7-817
Data from the two Broadway units show decreases in CO
emissions with bias firing. The uncontrolled CO emissions
ranged from 40 to 150 ppm across the load range while
controlled CO emissions ranged from 15 to 50 ppm. The
corresponding NOx emissions were 14 to 30 percent across the
load range. The reduction was attributed to the CO formed in
the fuel-rich lower burners being completely burned out as it
passed through the fuel-lean upper zone.
For the South Bay Unit 1, BOOS increased the CO emissions
from 200 to 4,000 ppm at full load while bias firing reduced
the CO to less than 50 ppm at full load. Similar increases in
CO were also seen at lower loads with BOOS. The extreme level
of CO with BOOS may be the result of poor air/fuel
distribution which is exaggerated with BOOS.35
For the flue gas recirculation (FGR) test results, on a
natural gas-fired boiler, the CO increased across the load
range. At full-load, the CO increased from 97 ppm up to
163 ppm with NOx reductions of approximately 30 percent. At
half-load, the CO increased from 82 ppm up to 112 ppm with NOx
reductions of 35 percent.
For two oil-fired boilers (Port Everglades 3 and 4), the
CO emissions decreased to less than 3 ppm with LNB. The NOx
reduction for these two boilers was 29 to 35 percent. The
same large decrease in CO emissions were seen at the same
units when firing natural gas.
With the natural gas-firing at the Alamitos 6 unit, the
range of uncontrolled CO emissions were 117 to 156 ppm while
the range of CO emissions were 151 to 220 ppm with retrofit
LNB. The NOx reduction was 42 to 65 percent. The CO
emissions at the oil-fired unit, Salem Harbor 4, were 73 ppm
with LNB.

7-818

7-819
Five natural gas-fired units reported CO emissions with
retrofit combination controls. For the combination of OFA and
flue gas recirculation (FGR) on four boilers, the CO emissions
ranged from 8 to 833 ppm. The CO emissions for these boilers
were higher at full-load conditions than at the low load
conditions. These boilers did not report the uncontrolled CO
levels. For one application with BOOS, FGR, and OFA, the CO
emissions at full-load decreased from 100 to 90 ppm. At
intermediate load, the CO emissions decreased greatly from
750 to 60 ppm and at low load, CO emissions were reported to
be zero.
7.3 EFFECTS FROM FLUE GAS TREATMENT CONTROLS
This section discusses the possible energy and
environmental impacts from selective noncatalytic reduction
(SNCR) and selective catalytic reduction (SCR) systems on
fossil fuel utility boilers. The SNCR process involves
injecting ammonia (NH3) or urea into high-temperature zones of
the boiler with flue gas temperatures of approximately 930 to
1,040 oC (1,700 to 1,900 oF). Under these conditions, the
injected reagents can react with the NOx to produce nitrogen
(N2) and water. However, since the possible chemical paths
leading to the reduction of NOx involve reaction between
nitrogen oxide (NO) and nitrogen species, a possible byproduct
of the process is nitrous oxide (N2O), a greenhouse gas.42
Recent chemical kinetic calculations and pilot-scale
tests show that N2O can be a product of the SNCR process.
These tests indicate that NH3 injection yielded lower N2O
levels (as a fraction of the NOx reduced) than did the urea
injection. Injection of NH3 yielded N2O levels equal to
4 percent of the NOx reduced, while urea injection yielded N2O
levels of 7 to 25 percent of the NOx reduced.42
Unreacted SNCR reagents can be emitted in the form of NH3
slip. The NH3 slip can be emitted to the atmosphere or can be
absorbed onto the fly ash, which could present disposal
problems or prevent the sale of the fly ash to cement
7-820
producers that may have upper limits of NH3-in-ash that they
would accept. In addition, as mentioned in section 5.3.1, the
SO3 generated when firing fuel oil or coal can react with NH3
to form ammonium bisulfate or ammonium sulfate compounds as
shown in figure 5-35, which can plug and corrode the air
heater. Ammonium bisulfate has also been identified as a
problem in baghouses after a spray dry scrubber. It has been
reported that when the recycled scrubber residue is collected
in the baghouse and returned to the scrubber absorber vessel
for reinjection, the NH3 slip from the SNCR is being collected
by the ash and concentrated during the recycle process. As a
result, the low temperatures in the baghouse causes ammonium
bisulfate to form on the bags and increased the pressure drop
which eventually blinds the bags.43
Another potential impact is the reaction of NH3 and HCl
to form solid ammonium chloride:
NH3 + HCl --> NH4Cl(s) (7-1)
Ammonium chloride forms at temperatures below 110 oC (250 oF),
which with ESP-equipped boilers can occur after the flue gases
leave the stack. The resulting fine particulate may be
observable as a detached plume above the stack.
There are several energy demands associated with
operation of a SNCR system. Injection of an aqueous reagent
into the furnace will result in a loss of energy equal to the
energy required to vaporize the liquid. High energy injection
systems (i.e., systems that use of a separate transport gas to
provide the energy to mix the reagent with the flue gas)
require the use of compressors or blowers to provide transport
gas. Additional minor energy losses are associated with
pumps, heaters, and control systems, that are part of the SNCR
system.
Selective catalytic reduction involves injecting NH3 into
the boiler flue gases in the presence of a catalyst to reduce
NOx to N2 and water. The catalyst lowers the activation

7-821
energy required for the NOx reduction reaction. The SCR
operating temperature is lower than for SNCR,
typically 200 to 480 oC (400 to 900 oF) compared to 930 to
1,040 oC (1,700 to 1,900 oF) for SNCR; however, the specific
temperature depends on the type of catalyst material used.
The SCR process has many of the same energy and
environmental impacts as an SNCR system. In addition, the
installation of the catalyst bed will increase the system
pressure drop and power requirements for the fans, thus
reducing the net power output of the boiler.

7-822
As table 7-6

7-823
TABLE 7-6. SUMMARY OF POTENTIAL IMPACTS DUE TOSCR SYSTEMS44
Component Potential impact
Air Heater C Ammonium bisulfate foulingC Higher exit gas temperatureC Higher leakageC Higher steam sootblow rateC Higher water wash rateC Additional dampers for on-line wash
Forced Draft Fan C Higher mass flowC Provide dilution airC Higher horsepower consumption
ElectrostaticPrecipitator
C Higher inlet gas volumeC Higher gas temperatureC SO3/NH3 conditioningC Higher pressure dropC Resistivity affected
Induced DraftFan
C Higher mass and volumetric flowC Higher pressure drop
Flue GasDesulfurization
C Volume increaseC Higher inlet temperatureC Increase in H2O evaporationC SO2 concentration dilutionC FGD wastewater treatment for NH3C Mist eliminator operation critical
Stack C Increase opacityC Increased temperatureC Increased volume
Plant C Net plate heat rate increaseC Reduced kWC Natural gas may be required (cold-side)C Additional plant complexity
Water Treatment C Treat water wash for nitrogen compounds
Fly Ash C Marketability impactC Odor problems

7-824
shows, the potential impacts can be extensive on the
operation and hardware of key boiler components with SCR.44
One of the impacts may be air heater fouling caused by
deposition of ammonium salt compounds. Higher exit gas
temperatures at the air heater outlet can occur and increased
cleaning may also be necessary. Increased differential
pressure across the catalyst can result in higher horsepower
consumption of the fans. Any change in fly ash properties can
greatly impact the performance of the particulate control
devices such as electrostatic precipitators.
7.3.1 Results from SNCR
7.3.1.1 Conventional Units. A summary of CO, NH3 slip,
and N2O emissions from fossil fuel-fired boilers with retrofit
SNCR is given in table 7-7.

7-825

7-826
Data are shown for one coal-fired, one oil-fired, and six
natural gas applications (five with urea injection and one
with NH3 injection). There are limited data on the secondary
emissions or performance impacts since there are only a few
full-scale SNCR applications on utility boilers.
The CO emissions for most SNCR applications remained the
same as uncontrolled levels; however, one location, Encina 2,
had an increase of 60 to 80 ppm above uncontrolled levels.
The CO levels are not expected to change with SNCR since
conditions in the combustion zone are relatively the same with
or without SNCR. However, it should be noted that for every
mole of urea (NH2CONH2) injected there is a potential to emit

7-827
7-828
one mole of CO if the CO bound in urea is not fully oxidized
to CO2. Typically, most of the CO in urea is oxidized to CO2.
In NH3 based SNCR systems, there is no bound CO; therefore,
there is no potential to emit CO from the NH3 SNCR reagent.
Other impacts from SNCR include the NH3 slip and N2O
emissions. The data indicates that the NH3 slip for the oil-
fired units ranged from 5 to 75 ppm. The data from Encina 2
showed an increase of NH3 emissions as the NSR was increased.
The data from this unit also showed an increased NOx removal
with increasing normalized stoichiometric ratio (NSR) up to a
point. At a certain point, any further increase in NSR
results in a very small or no increase in NOx removal.46
The NH3 slip from five urea-based SNCR applications on
natural gas firing ranged from 6 to 110 ppm across the load
range with NOx reductions of 7 to 50 percent. However, a test
installation of both NH3- and urea-based SNCR at the Morro
Bay 3 unit resulted in NH3 slip levels of 50 to 110 ppm at NOx
reduction of 30 percent. The N2O emissions ranged from 2 to
14 ppm for two natural gas applications.
7-829
7.3.1.2 Fluidized Bed Units. Table 7-8
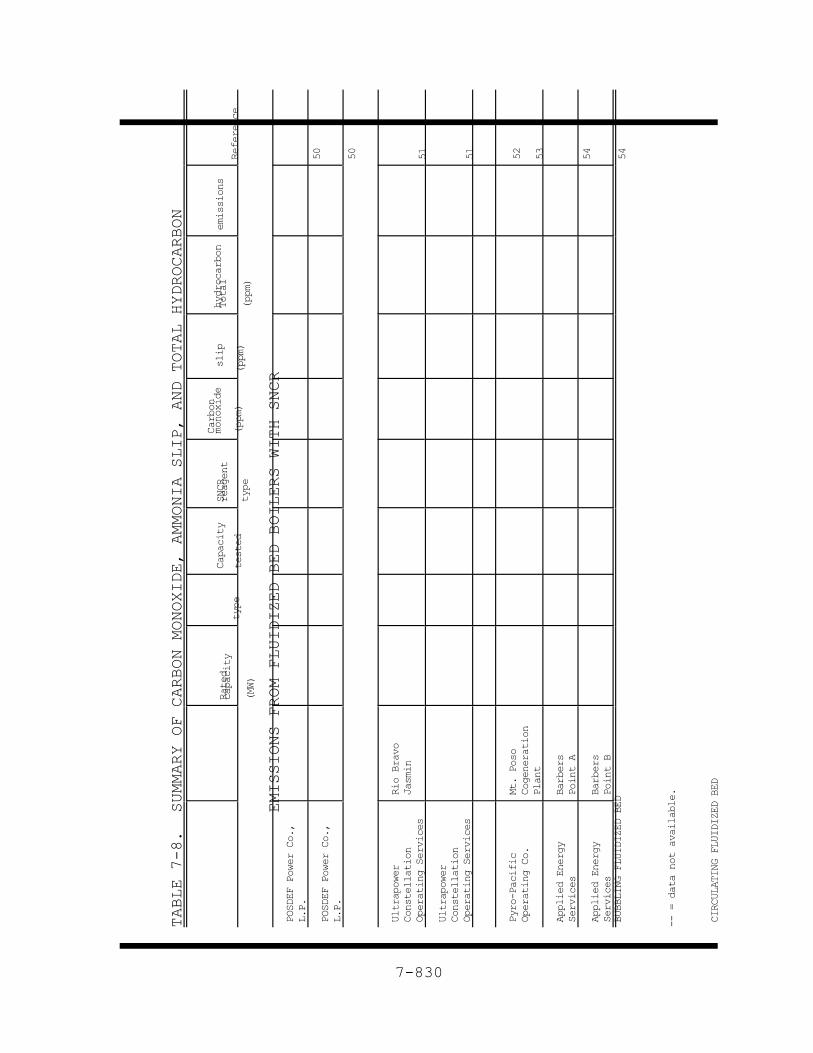
7-830
TABLE 7-8. SUMMARY OF CARBON MONOXIDE, AMMONIA SLIP, AND TOTAL HYDROCARBON
EMISSIONS FROM FLUIDIZED BED BOILERS WITH SNCR
Rated
capacity
(MW)
type
Capacity
tested
SNCR
reagent
type
Carbon
monoxide
(ppm)
slip
(ppm)
Total
hydrocarbon
(ppm)
emissions
Reference
BUBBLING FLUIDIZED BED
POSDEF Power Co.,
L.P.
50
POSDEF Power Co.,
L.P.
50
CIRCULATING FLUIDIZED BED
Ultrapower
Constellation
Operating Services
Rio Bravo
Jasmin
51
Ultrapower
Constellation
Operating Services
51
52
Pyro-Pacific
Operating Co.
Mt. Poso
Cogeneration
Plant
53
Applied Energy
Services
Barbers
Point A
54
Applied Energy
Services
Barbers
Point B
54
Bit = Bituminous
Unk = Unknown
-- = data not available.

7-831
summarizes CO, NH3 slip, and THC emissions from eight FBC
boilers with NH3-based SNCR as original equipment. The CO
emissions ranged from 8.4 to 110 ppm. Only three FBC units
reported NH3 slip emissions and were 28 ppm or less. All
units reported THC data, five of which were less than 3.7 ppm.
7.3.2 Results for SCR
High NH3 emissions indicate a loss of catalyst activity
or poor ammonia distribution upstream of the catalyst. A
summary of NH3 data from three pilot and one full-scale SCR
system are given in table 7-9
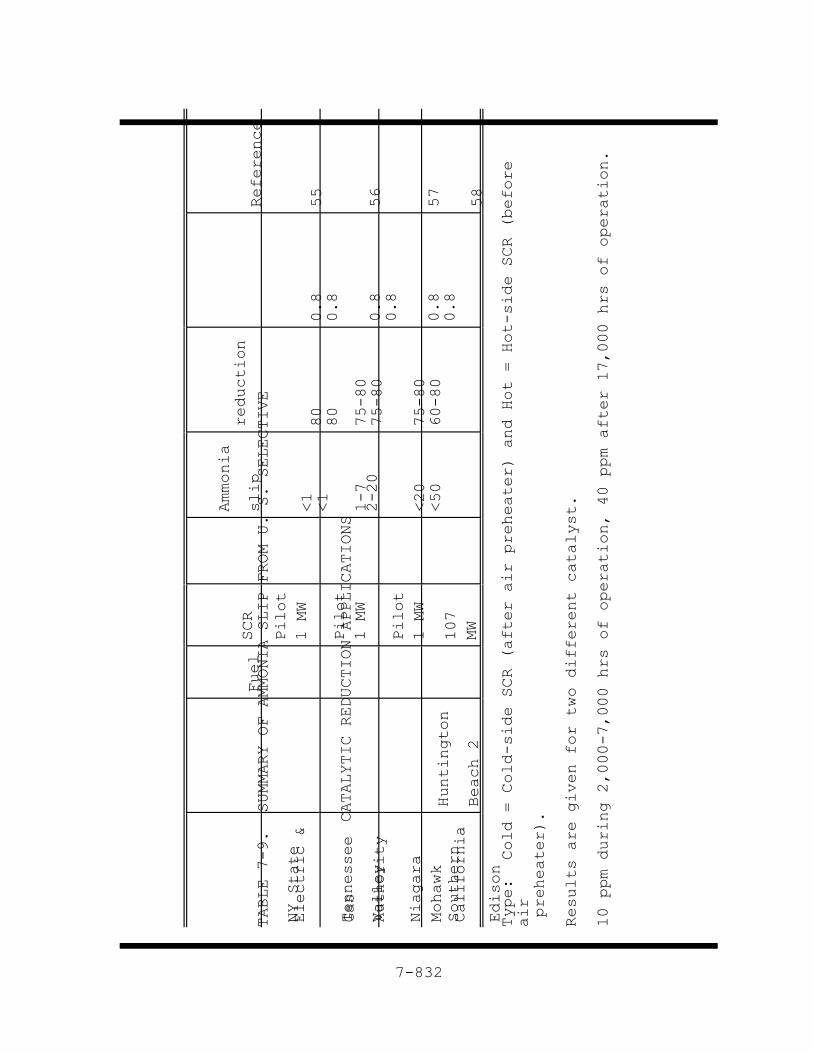
7-832
TABLE 7-9. SUMMARY OF AMMONIA SLIP FROM U. S. SELECTIVE
CATALYTIC REDUCTION APPLICATIONS
Fuel
SCR
Ammonia
slip
reduction
Reference
NY State
Electric &
Gas
Pilot
1 MW
<1
<1
8080
0.8
0.8
55
Tennessee
Valley
Authority
Pilot
1 MW
1-7
2-20
75-80
75-80
0.8
0.8
56
Niagara
Mohawk
Pilot
1 MW
<20
<50
75-80
60-80
0.8
0.8
57
Southern
California
Edison
Huntington
Beach 2
107
MW
58
Type: Cold = Cold-side SCR (after air preheater) and Hot = Hot-side SCR (before
air
preheater).
Results are given for two different catalyst.
10 ppm during 2,000-7,000 hrs of operation, 40 ppm after 17,000 hrs of operation.

7-833
. Two of the pilot units are coal-fired applications and one
is an oil-fired application. At an NH3-to-NOx ratio of 0.8,
the NH3 slip for the three pilot SCR systems ranged from less
than 5 to 20 ppm.
The NH3 emissions from the full-scale SCR system at
Huntington Beach 2 ranged from 10 to 40 ppm. The design
specifications of 10 ppm maximum were only marginally met

7-834
7-835
during the initial period (2,000 to 7,000 hours of operation)
and then increased with catalyst use. After 17,000 hours of
operation, the NH3 had increased to 40 ppm. While operating
the SCR on oil at Huntington Beach 2, the air preheater had to
be cleaned more frequently to eliminate the ammonium bisulfate
deposits. After 1,400 hours of operation on oil, there were
heavy deposits of ammonium-iron sulfate in the intermediate
zone of the air preheater. This resulted in a 50-percent
increase in pressure drop.58
This demonstration of SCR at Huntington Beach 2 did not
fully establish catalyst performance and life. However, it
did provide a rough estimate of how often the catalyst must be
replaced to control deposits in the air preheater at this
facility. The catalyst life on oil was estimated to be 15,000
hours or 2 years and 30,000 hours or 4 years on natural gas.58
The power requirement for the SCR system at Huntington
Beach 2 was approximately 725 kW. This represents an
auxiliary power consumption of approximately 0.7 percent of
full load generator output and 7 percent of minimum load
generator output. The booster fan used to overcome the
pressure drop across the catalyst bed consumed the majority of
this energy.58

7-836
7.4 REFERENCES
1. Sawyer, J. W., and E. B. Higginbotham. CombustionModification NOx Controls for Utility Boilers. Vol. II: Pulverized-Coal Wall-Fired Unit Field Test. U. S. Environmental Protection Agency. Research TrianglePark, N. C. Publication No. EPA 600/7-81-124b. July1981. Pp. 4-2 and 4-6.
2. Sorge, J. N. Wall-Fired Low-NOx Burner Test Results fromthe Innovative Clean Coal Technology Project at GeorgiaPower's Plant Hammond Unit 4. Presented at the 1992 EPRIConference on NOx Controls for Utility Boilers. Cambridge, MA. July 7-9, 1992.
3. Letter and attachments from Hardman, R. R., SouthernCompany Services, to Harrison, C., Hunton and Williams.November 9, 1992. Questionnaire response from Hammond 4.
4. Hardman, R. R., Tangentially Fired Low-NOx CombustionSystem Test Results from the Innovative Clean CoalTechnology Project at Gulf Power Company's Lansing SmithUnit 2. Presented at the 1992 EPRI Conference on NOxControls for Utility Boilers Workshop, Cambridge, MA. July 7-9, 1992.
5. Letter and attachments from Hardman, R. R., SouthernCompany Services, to Harrison, C., Hunton and Williams. November 9, 1992. Questionnaire response from LansingSmith 2.
6. Questionnaire response from Kanary, D., Ohio EdisonCompany. Edgewater 4. 1993.
7. Letter and attachments from Riggs, R. H., TennesseeValley Authority, to Harrison, C. S., Hunton andWilliams. November 2, 1992. NOx information collectionrequest - Colbert 3 and Johnsonville 8.
8. Manaker, A. M., and R. E. Collins. Status of TVA's NOxCompliance Program. Presented at the 1992 EPRIConference on NOx Controls for Utility Boilers. Cambridge, MA. July 7-9, 1992.
9. Way, K., Allen, A., and F. Franco. Results from AUtility-Scale Installation of ABB C-E Services RO-II LowNOx, Wall-Fired Burners. Presented at the 1993 JointSymposium on Stationary Combustion NOx Control. MiamiBeach, FL. May 23-27, 1993.

7-837

7-838
10. Letter and attachments from Hardman, R. R., SouthernCompany Services, to Neuffer, W. J., U.S. EnvironmentalProtection Agency. August 25, 1993. Alternative ControlTechnology Document Control of NOx Emissions fromStationary Sources - Utility Boilers.
11. Letter and attachments from Hardman, R. R., SouthernCompany Services, to Harrison, C., Hunton and Williams. November 9, 1992. Questionnaire response from Gaston 2.
12. Sorge, J. N, Hardman, R. R., Wilson, S. M., and L. L.Smith. The Effects of Low NOx Combustion on UnburnedCarbon Levels in Wall-Fired Boilers. Presented at the1993 Joint Symposium on Stationary Combustion NOxControl. Miami Beach, FL. May 23-27, 1993.
13. Letter and attachments from Moore, D., Dayton Power andLight Company, to Harrison, C., Hunton and Williams. November 20, 1992. Questionnaire response fromJ. M. Stuart 4.
14. Questionnaire response from Allen, C., Arizona PublicService Company. Four Corners 3, 4, and 5. 1993.
15. Questionnaire response from Fox, M., Public Service Co.of Colorado - Valmont 5. 1993.
16. Questionnaire response from Fox, M., Public Service Co.of Colorado - Cherokee 4. 1993.
17. Dresner, P. E., Piechocki, M. A., and A. D. LaRue. LowNOx Combustion System Retrofit for a 630 MWe PC-FiredCell Burner Unit. Presented at the 1993 Joint Symposiumon Stationary Combustion NOx Control. Miami Beach, FL. May 23-27, 1993.
18. Hunt T., et al. Low NOx Combustion Modifications forTop-Fired Boilers. Presented at the 1993 Joint Symposiumon Stationary Combustion NOx Control. Miami Beach, FL. May 23-27, 1993.
19. Angelo, L.C. Folsom, et. al. Field Evaluation of GasCofiring as a Viable Dual Fuel Strategy. Presented at1992 Power-Gen. Orlando, FL. November 17-19, 1992.
20. Questionnaire response from Dieriex, R., Illinois PowerCompany. Hennepin 1. 1993.
21. Letter and attachments from Eirschele, G., WisconsinPower and Light Company, to Jordan, B. C.,U. S. Environmental Protection Agency. March 19, 1993.

7-839
Response to Section 114 information collection request -Nelson Dewey 2.
22. Questionnaire response from Kanary, D., Ohio EdisonCompany - Niles 1. 1993.
23. Questionnaire response from Linhart, W. J., MonongahelaPower Company. Pleasants 2. 1993.
24. Letter and attachments from Cater, C.H., Allegheny PowerSystems, to Carney, P.G., New York State Electric and GasCorporation. April 13, 1992. Clean Air Act Amendmentsof 1990, Title I - NOx Control.
25. Thompson, R. E., et al. NOx Emissions Results for a Low-NOx PM Burner Retrofit. In Proceedings: 1989 JointSymposium on Stationary Combustion NOx Control. Vol. 1. U. S. Environmental Protection Agency. Research TrianglePark, NC. Publication No. EPA/600/9-89-062a. Pp. 2-67through 2-85.
26. Letter and attachments from Brownell, W. F., Hunton andWilliams, to Eddinger, J. A., U. S. EnvironmentalProtection Agency. December 18, 1992. Response to NOxInformation request - Brandon Shore Units 1 and 2.
27. Letter and attachments from Marshall, G., PacificCorporation, to Harrison, C. S., Hunton and Williams. December 14, 1992. Information collection request forHunter 3.
28. Letter and attachments from Huff, B. L., Cincinnati Gas &Electric Company, to Harrison, C., Hunton and Williams. December 7, 1992. Response to NOx Information request -Zimmer 1.
29. Questionnaire response from Giese, J., Los Angeles Dept.of Water & Power. Intermountain 1 and 2. 1993.
30. Letter and attachments from Scherrer, C. R., MuscatinePower and Water, to Kanary, D. A., Ohio Edison Company. December 2, 1992. Response to NOx Information CollectionRequest of November 5, 1992 - Muscatine 9.
31. Questionnaire response from Smith, J. R., HoustonLighting & Power Company - W. A. Parrish 8. 1993.
32. Questionnaire response from Smith, J. R., HoustonLighting & Power Company - Limestone 1. 1993.
33. Questionnaire response from Smith, J. R., Houstonlighting & Power Company - Limestone 2. 1993.
7-840
34. Makansi, J. Fuel biasing Lowers Emissions, BoostsEfficiency at Little Cost. Power. 136:82. September1992.
35. Quartucy, G. C., et al. Application of Fuel Biasing forNOx Emission Reduction in Gas-Fired Utility Boilers. InProceedings: 1987 Joint Symposium on Stationary SourceCombustion NOx Control. Vol. 2. U. S. EnvironmentalProtection Agency. Research Triangle Park, NC. Publication No. EPA/600/9-88/026b. Pp. 41-1 through41-22.
36. Mazzi, E. A., et al. Demonstration of Flue Gas Recirculation for NOx Control on a Natural Gas-Fired320 MW Tangential Boiler. Presented at the 1993 JointSymposium on Stationary NOx Control. Miami Beach, FL. May 23-27, 1993.
37. Price, J. V., Kuretski, Jr., J. J., and E. S. Schindler. Retrofit of Low NOx Oil/Gas Burners to Two 400 MW UtilityBoilers, and the Effects on Overall Emissions and BoilerPerformance. In Proceedings: Power-Gen '92. Volumes 11and 12. Orlando, FL. November 17-19, 1992.
38. Alfonso, R. F. and J. J. Marshall. An R&D Evaluation ofLow-NOx Oil/Gas Burners for Salem Harbor and BraytonPoint Units. Presented at the 1991 Joint Symposium onStationary Combustion NOx Control. Washington, DC. March 25-28, 1991.
39. Letter and attachment from Welsing, P. R., SouthernCalifornia Edison Co., to Stamey-Hall, S., RadianCorporation. March 3, 1993. Response to informationrequest--Alamitos 6 and Huntington Beach 2.
40. Letter and attachments from Strehlitz, F. W., Pacific Gas& Electric Co., to Neuffer, W. J., U.S. EnvironmentalProtection Agency. March 26, 1993. Response toSection 114 Information collection request--Pittsburg 6and 7, Contra Costa 6, Moss Landing 7, and Morro Bay 3.
41. McDannel, M. D., and M. D. Escarcega. Low NOx LevelsAchieved by Improved Combustion Modification on Two480 MW Gas-Fired Boilers. Presented at the 1991 JointSymposium on Stationary Combustion NOx Control. Washington, DC. March 25-28, 1991.
42. Muzio, L. J., et al. N2O Formation in Selective Non-Catalytic NOx Reduction Processes. Presented at the 1991Joint Symposium on Stationary Combustion NOx Control. Washington, DC. March 25-28, 1991.

7-841
43. Letter and attachments from Welsh, M. A., ElectricGeneration Association, to Neuffer, W. J. U. S.Environmental Protection Agency. August 24, 1993. Comments on draft Alternative Control TechniquesDocument.
44. Robie, C. P., Ireland, P. A., and J. E. Cichanowicz. Technical Feasibility and Economics of SCR NOx Control inUtility Applications. In Proceedings: 1989 JointSymposium on Stationary Combustion NOx Control. Vol. 2. U. S. Environmental Protection Agency. Research TrianglePark, NC. Publication No. EPA-600/9-89-062b. Pp. 6A-105through 6A-124.
45. Nalco Fuel Tech. SNCR NOx Control Demonstration. Wisconsin Electric Power Company. Valley Power Plant,Unit 4. March 1992.
46. Mansour, M.N., et al. Full Scale Evaluation of UreaInjection for NO Removal. In Proceedings: 1987 JointSymposium on Stationary Combustion NOx Control. Vol. 2. U. S. Environmental Protection Agency. Research TrianglePark, NC. Publication No. EPA/600/9-88/026b. Pp. 43-1through 43-23.
47. Shore, D. E., et al. Urea SNCR Demonstration At LongIsland Lighting Company's Port Jefferson Station, Unit 3. Presented at the 1993 Joint Symposium on StationaryCombustion NOx Control. Miami Beach, FL. May 23-27,1993.
48. Letter and attachments from Brownell, F. W., Hunton andWilliams, to Neuffer, W. J., U. S. EnvironmentalProtection Agency. February 10, 1993. InformationCollection Request. El Segundo 1, Alamitos 4, andEl Segundo 3.
49. Teixeira, D. P., Himes, R. M., Smith, R. A.,Muzio, L. J., Jones, D. G., and J. Steinberger. Selective Noncatalytic Reduction (SNCR) Field Evaluationin Utility Natural Gas-Fired Boilers. Report. GRI-92/0083. Gas Research Institute. Chicago, IL. March1992.
50. Questionnaire response from Recor, R. A., POSDEF PowerCo., L.P. Stockton A and B. 1993.
51. Letter and attachments from Barber, D. E., UltrapowerConstellation Operating Services, to Jordan, B. C.,U. S. Environmental Protection Agency. December 17,1992. Information Collection Request. Rio Bravo Posoand Rio Bravo Jasmin.
7-842
52. Questionnaire Response from Hess, Tom, Stockton CoGenCo.. Stockton CoGen. 1993.
53. Questionnaire Response from Neal, M., Pyro-PacificOperating Company. Mt. Poso Cogeneration Plant. 1993.

7-843
54. Letter and attachments from Cooper, T., AES BarbersPoint, Inc. to Jordan, B. C., U. S. EnvironmentalProtection Agency. December 23, 1992. InformationCollection Request from Barbers Point A and B.
55. Janik, G, Mechtenberg, A. Zammit, K., and E.Cichanowicz. Status of Post-FGR SCR Pilot Plant Tests onMedium Sulfur Coal at the New York State Electric and GasKintigh Station. Presented at the 1993 Joint Symposiumon Stationary Combustion NOx Control. Miami, FL. May 24-27, 1993.
56. Huang, C.M., et. al. Status of SCR Pilot Plant Tests onHigh Sulfur Coal at Tennessee Valley Authority's ShawneeStation. Presented at the 1993 Joint Symposium onStationary Combusdtion NOx Control. Miami, FL. May 24-27, 1993.
57. Guest, M., et. al. Status of SCR Pilot Plant Tests onHigh Sulfur Fuel Oil at Niagara Mohawk's Oswego Station.Presented at the 1993 Joint Symposium on StationaryCombusdtion NOx Control. Miami, FL. May 24-27, 1993.
58. Southern California Edison Research Division, SystemPlanning and Research Department. Selective CatalyticReduction DeNOx Demonstration Test Huntington BeachUnit 2. Report No. 87-RD-39. June 1988. p.p. S-2through S-5, 6-3 through 6-5, 7-6 through 7-9.

TABLE 7-1. SUMMARY OF CARBON MONOXIDE EMISSIONS FROM COAL-FIRED BOILERS WITH COMBUSTION NOx CONTROLS
UtilityUnit
(standard)aUnittypeb
Ratedcapacity(MW)
Controltypec
(vendor)dCapacitytested
Carbon monoxide(ppm) NOx
reduction(%) ReferenceUncontrolled Control
OPERATIONAL MODIFICATIONS, BITUMINOUS COAL
Gulf Power Co. Crist 7(Pre)
Wall 500 BOOS 85 357 392-608 30-33 1
OVERFIRE AIR, BITUMINOUS COAL
Georgia PowerCo.
Hammond 4(Pre)
Wall 500 AOFA(FW)
1008060
1003020
151515
25--10
2,3
LOW NOx BURNERS, BITUMINOUS COAL
Gulf Power Co. Lansing Smith 2(Pre)
Tan 190 LNCFS I(ABB-CE)
957160
121515
151020
423934
4,5
Ohio Edison Co. Edgewater 4(Pre)
Wall 105 XCL + SI(B&W)
1007863
161616
100130170
394342
6
TennesseeValleyAuthority
Johnsonville 8(Pre)
Wall 125 IFS(FW)
100 50 -- 55 7,8
Board of PublicUtilities
Quindaro 2(Pre)
Wall 137 RO-II(ABB-CE)
907055
------
505095
------
9
Alabama PowerCo.
Gaston 2(Pre)
Wall 272 XCL(B&W)
1006850
60----
6050--
504643
10,11
Georgia PowerCo.
Hammond 4(Pre)
Wall 500 CF/SF(FW)
1008060
1003020
888
45--50
2,3,12
Dayton Power &Light Co.
JM Stuart 4(Pre)
Cell 610 LNCB(B&W)
1007556
261720
352810
555447
13

TABLE 7-1. SUMMARY OF CARBON MONOXIDE EMISSIONS FROM COAL-FIRED BOILERS WITH COMBUSTION NOx CONTROLS (CONTINUED)
UtilityUnit
(standard)aUnittypeb
Ratedcapacity(MW)
Controltypec
(vendor)dCapacitytested
Carbon monoxide(ppm) NOx
reduction(%) ReferenceUncontrolled Control
LOW NOx BURNERS, SUBBITUMINOUS COAL
Board of PublicUtilities
Quindaro 2(Pre)
Wall 137 RO-II(ABB-CE)
807055
------
707050
------
9
Arizona PublicService Co.
Four Corners 4(Pre)
Wall 818 CF/SF(FW)
1056949
533530
863341
57296
14
Arizona PublicService. Co.
Four Corners 5(Pre)
Wall 818 CF/SF(FW)
93 -- <50 50 14
LOW NOx BURNERS + OVERFIRE AIR, BITUMINOUS COAL
Public ServiceCo. of CO
Valmont 5(Pre)
Tan 165 LNCFS II(ABB-CE)
917550
<30----
<30----
522627
15
Gulf Power Co. Lansing Smith 2(Pre)
Tan 190 LNCFS II(ABB-CE)
957160
121515
282220
393530
4,5,10
Public ServiceCo. of CO
Cherokee 4(Pre)
Tan 350 LNCFS II(ABB-CE)
1007145
<30----
<30----
463135
16
Gulf Power Co. Lansing Smith 2(Pre)
Tan 190 LNCFS III(ABB-CE)
957160
121515
452522
484739
4,5,10
Ohio Edison Co. Sammis 6(Pre)
Wall 630 DRB-XCL(B&W)
10055
17.4-25.831.8
225-67055
17
Public ServiceCo. of CO
Arapahoe 4(Pre)
Roof 100 DRB-XCL +OFA(B&W)
1008060
484239
382112
667163
18
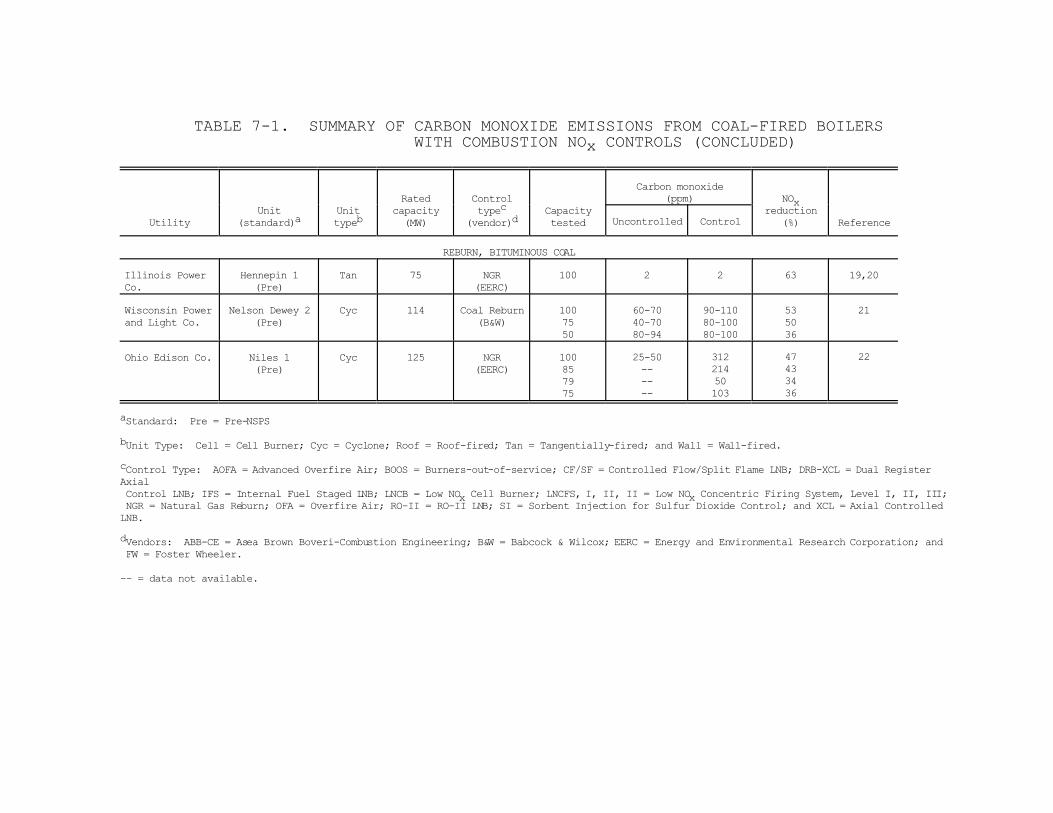
TABLE 7-1. SUMMARY OF CARBON MONOXIDE EMISSIONS FROM COAL-FIRED BOILERS WITH COMBUSTION NOx CONTROLS (CONCLUDED)
UtilityUnit
(standard)aUnittypeb
Ratedcapacity(MW)
Controltypec
(vendor)dCapacitytested
Carbon monoxide(ppm) NOx
reduction(%) ReferenceUncontrolled Control
REBURN, BITUMINOUS COAL
Illinois PowerCo.
Hennepin 1(Pre)
Tan 75 NGR(EERC)
100 2 2 63 19,20
Wisconsin Powerand Light Co.
Nelson Dewey 2(Pre)
Cyc 114 Coal Reburn(B&W)
1007550
60-7040-7080-94
90-11080-10080-100
535036
21
Ohio Edison Co. Niles 1(Pre)
Cyc 125 NGR(EERC)
100857975
25-50------
31221450103
47433436
22
aStandard: Pre = Pre-NSPS
bUnit Type: Cell = Cell Burner; Cyc = Cyclone; Roof = Roof-fired; Tan = Tangentially-fired; and Wall = Wall-fired.
cControl Type: AOFA = Advanced Overfire Air; BOOS = Burners-out-of-service; CF/SF = Controlled Flow/Split Flame LNB; DRB-XCL = Dual RegisterAxial Control LNB; IFS = Internal Fuel Staged LNB; LNCB = Low NOx Cell Burner; LNCFS, I, II, II = Low NOx Concentric Firing System, Level I, II, III; NGR = Natural Gas Reburn; OFA = Overfire Air; RO-II = RO-II LNB; SI = Sorbent Injection for Sulfur Dioxide Control; and XCL = Axial ControlledLNB.
dVendors: ABB-CE = Asea Brown Boveri-Combustion Engineering; B&W = Babcock & Wilcox; EERC = Energy and Environmental Research Corporation; and FW = Foster Wheeler.
-- = data not available.

TABLE 7-2. SUMMARY OF UNBURNED CARBON AND BOILER EFFICIENCY DATA FROM COAL-FIRED BOILERS WITH COMBUSTION NOx CONTROLS
Unburned carbon(%)
Boiler efficiency(%)
UtilityUnit
(standard)aUnittypeb
Ratedcapacity(MW)
Controltypec
(vendor)dCapacitytested
Uncon-trolled Control
Uncon-trolled Control
NOxreduction
(%) Reference
OVERFIRE AIR, BITUMINOUS COAL
GeorgiaPower Co.
Hammond 4(Pre)
Wall 500 AOFA(FW)
1008060
5.24.82.3
9.610.27.1
89.5--90.0
89.1--89.3
25--10
2,3,12
LOW NOx BURNERS, BITUMINOUS COAL
Ohio EdisonCo.
Edgewater 4(Pre)
Wall 105 XCL + SI(B&W)
1007863
2.72.73.2
6.67.69.0
88.6--
87.3--
394342
6
Gulf PowerCo.
Lansing Smith 2(Pre)
Tan 200 LNCFS I(ABB-CE)
957160
5.04.24.0
4.65.34.0
89.790.790.9
89.6----
423934
4,5,10
AlabamaPower Co.
Gaston 2(Pre)
Wall 272 XCL(B&W)
1006850
7.45.75.3
10.38.36.3
------
------
504643
10,11
GeorgiaPower Co.
Hammond 4(Pre)
Wall 500 CF/SF(FW)
1008060
5.24.82.3
8.05.05.8
89.5--90.0
88.1--88.8
45--50
2,3,12
DaytonPower &Light Co.
JM Stuart 4(Pre)
Cell 610 LNCB(B&W)
1007556
1.71.61.1
1.61.0--
89.689.790.2
90.090.090.1
555447
13
MonogahelaPower Co.
Pleasants 2(Da)
Wall 626 CF/SF(FW)
10083
(2.5)--
4.53.8
----
----
53--
22,23
LOW NOx BURNERS, SUBBITUMINOUS COAL
ArizonaPublicService Co.
Four Corners 4(Pre)
Wall 818 CF/SF(FW)
1056949
0.040.040.03
0.10.10.1
------
86.687.787.6
57296
14

TABLE 7-2. SUMMARY OF UNBURNED CARBON AND BOILER EFFICIENCY DATA FROM COAL-FIRED BOILERS WITH COMBUSTION NOx CONTROLS (CONTINUED)
Unburned carbon(%)
Boiler efficiency(%)
UtilityUnit
(standard)aUnittypeb
Ratedcapacity(MW)
Controltypec
(vendor)dCapacitytested
Uncon-trolled Control
Uncon-trolled Control
NOxreduction
(%) Reference
LOW NOx BURNERS, SUBBITUMINOUS COAL (CONTINUED)
ArizonaPublicService Co.
Four Corners 5(Pre)
Wall 818 CF/SF(FW)
93 -- 0.1 -- 88.0 50 14
LOW NOx BURNERS AND OVERFIRE AIR, BITUMINOUS COAL
PublicService Co.of CO
Valmont 5(Pre)
Tan 165 LNCFS II(ABB-CE)
917550
1.91.60.4
1.41.01.0
86.6----
86.4----
522627
15
Gulf PowerCo.
Lansing Smith 2(Pre)
Tan 200 LNCFS II(ABB-CE)
957160
5.04.24.0
4.43.93.9
89.790.790.9
89.189.690.0
393530
4,5,10
PublicService Co.of CO
Cherokee 4(Pre)
Tan 350 LNCFS II(ABB-CE)
1007145
2.21.10.3
2.51.70.6
------
------
463135
16
Gulf PowerCo.
Lansing Smith 2(Pre)
Tan 200 LNCFS III(ABB-CE
957160
5.04.24.0
6.05.96.8
89.790.790.9
89.490.190.3
484739
4,5,10
Ohio EdisonCo.
Sammis 6(Pre)
Wall 630 DRB-SCL +OFA(B&W)
100
55
1.6-2.63.7
8.0-9.74.6
----
----
60-7037
17
LOW NOx BURNERS AND OVERFIRE AIR, SUBBITUMINOUS COAL
KansasPower andLight Co.
Lawrence 5(Pre)
Tan 448 PM + OFA(CE-MHI)
100 0.4 0.3 -- -- 49 25
REBURN, BITUMINOUS COAL
IllinoisPower Co.
Hennepin 1(Pre)
Tan 75 NGR(EERC)
100 2.5 1.5 88.3 86.7 63 19,20

TABLE 7-2. SUMMARY OF UNBURNED CARBON AND BOILER EFFICIENCY DATA FROM COAL-FIRED BOILERS WITH COMBUSTION NOx CONTROLS (CONCLUDED)
Unburned carbon(%)
Boiler efficiency(%)
UtilityUnit
(standard)aUnittypeb
Ratedcapacity(MW)
Controltypec
(vendor)dCapacitytested
Uncon-trolled Control
Uncon-trolled Control
NOxreduction
(%) Reference
REBURN, BITUMINOUS COAL (CONTINUED)
WisconsinPower andLight Co.
Nelson Dewey 2(Pre)
Cyc 114 Coal(B&W)
1007550
4-163-1311-23
15-2113-2421-28
88.288.688.5
88.188.387.0
535036
21
Ohio EdisonCo.
Niles 1(Pre)
Cyc 125 NGR(EERC)
100 -- -- 90.7 90.1 47 22
aStandard: Da = Subpart Da; and Pre = Pre-NSPS
bUnit Type: Cell = Cell Burner; Cyc = Cyclone; Tan = Tangential; and Wall = Wall-fired;
cControl Type: CF/SF = Controlled Flow/Split Flame Low NOx Burner; IFS = Internal Fuel Staged Low NOx Burner; LNCB = Low NOx Cell Burner; LNCFS, I, II, II = Low NOx Concentric Firing System, Level I, II, III; NGR = Natural Gas Reburn; OFA = Overfire Air; PM = Pollution MinimumBurner; SI = Sorbent Injection for Sulfur Dioxide Control; and XCL = Axial Controlled Low NOx Burner.
dVendors: ABB-CE = Asea Brown Boveri-Combustion Engineering; B&W = Babcock & Wilcox; CE-MHI = Combustion Engineering-Mitsubishi HeavyIndustries; EERC = Energy and Environmental Research Corporation; and FW = Foster Wheeler.
-- = data not available.

TABLE 7-5. SUMMARY OF CARBON MONOXIDE DATA FROM NATURAL GAS- AND OIL-FIRED BOILERS WITH COMBUSTION NOx CONTROLS
UtilityUnit
(standard)aUnittype
Ratedcapacity(MW)
Control typea
(vendor)b
Capacitytested(%)
Carbon monoxide(ppm) NOx
reduction(%) ReferenceUncontrolled Control
OPERATIONAL CONTROLS, NATURAL GAS
City of Pasadena Water& Power Dept.
Broadway 1and 2(Pre)
Wall 45 Bias 705038
1507540
503015
142930
34
San Diego Gas &Electric Co.
South Bay 1(Pre)
Wall 153 BOOS 1006733
200<100<50
40001000900
--35
San Diego Gas &Electric Co.
South Bay 1(Pre)
Wall 153 BIAS 1006733
200<100<50
<50<100<50
--35
FLUE GAS RECIRCULATION, NATURAL GAS
Southern CaliforniaEdison
Etiwanda 3(Pre)
Tan. 320 FGR 9782675237
973001498222
163184165112136
2933383529
36
LOW NOx BURNERS, FUEL OIL
Florida Power & Light PortEverglades 3
(Pre)
Wall 400 LNB(Todd)
96 144 1.4 29 37
Florida Power & Light PortEverglades 4
(Pre)
Wall 400 LNB 96 127 2.6 35 37
New England PowerService Co.
Salem Harbor4
(Pre)
Wall 475 LNB -- -- 73 -- 38
LOW NOx BURNERS, NATURAL GAS

TABLE 7-5. SUMMARY OF CARBON MONOXIDE DATA FROM NATURAL GAS- AND OIL-FIRED BOILERS WITH COMBUSTION NOx CONTROLS (CONCLUDED)
UtilityUnit
(standard)aUnittype
Ratedcapacity(MW)
Control typea
(vendor)b
Capacitytested(%)
Carbon monoxide(ppm) NOx
reduction(%) ReferenceUncontrolled Control
Florida Power & Light PortEverglades 3
(Pre)
Wall 400 LNB(Todd)
96 161 1.7 2.3 37
LOW NOx BURNERS, NATURAL GAS
Florida Power & Light PortEverglades 4
(Pre)
Wall 400 LNB 96 270 6.9 34 37
Southern CaliforniaEdison
Alamitos 6(Pre)
Wall 480 LNB(Todd)
957754
156117133
220160151
426558
39
COMBINED CONTROLS, NATURAL GAS
Pacific Gas andElectric Co.
Pittsburg 7(Local)
Tan 745 OFA + FGR 1005030
------
262117
898687
40
Pacific Gas andElectric Co.
Pittsburg 6(Local)
Wall 330 OFA + FGR 1005032
------
2282763
826650
40
Pacific Gas andElectric Co.
Contra Costa6
(Local)
Wall 345 OFA + FGR 1005025
------
83336149
6560
40
Southern CaliforniaEdison
Redondo 8(Pre)
Wall 480 BOOS + FGR + OFA 1007533
1007500
90600
------
41
Pacific Gas andElectric Co.
Moss Landing7
(Local)
Wall 750 OFA + FGR 1008060
------
108118
929591
40
aStandard: Local = Local area standardPre = Pre-NSPS

TABLE 7-5. SUMMARY OF CARBON MONOXIDE DATA FROM NATURAL GAS- AND OIL-FIRED BOILERS WITH COMBUSTION NOx CONTROLS (CONCLUDED)
bControl Type: Bias = Biased Firing, BOOS = Burners-Out-of-Service, FGR = Flue Gas Recirculation, OFA = Overfire Air, LNB = Low NOxBurnerscVendor: Todd = Todd Combustion
-- = data not available.

TABLE 7-7. SUMMARY OF CARBON MONOXIDE, AMMONIA SLIP, AND NITROUS OXIDE EMISSIONS FROM CONVENTIONAL BOILERS WITH SNCR
UtilityUnit
(Standard)a
RatedCapacity(MW)
CapacityTested(%)
ReagentType
Carbon Monoxide (ppm) AmmoniaSlip(ppm)
NitrousOxide(ppm)
NOxReduction
(%) ReferenceUncontrolled Control
BITUMINOUS COAL
Wisconsin ElectricPower Co.
Valley 4(Pre)
68 100
34
Urea 16.434
17.350
----
----
59b
56b45
FUEL OIL
San Diego Gas andElectric
Encina 2(Pre)
110 10072
Urea ----
increase of60-80 ppm fromuncontrolled
levels
10-553-75
----
--42b
46
Long IslandLighting Co.
PortJefferson 3
(Pre)
185 10050
Urea -- No reportedincrease
5-105-10
Increaseof 10-15
ppm
3848
47
NATURAL GAS
San Diego Gas andElectric
Encina 2(Pre)
110 10072
Urea -- increase of60-80 ppm fromuncontrolled
levels
10-50 ----
35-50b
45-50b46
Southern Cal.Edison Co.
ElSegundo 1(Pre)
156 1115019
Urea ------
------
151318
------
264140
48
Southern Cal.Edison Co.
Alamitos 4(Pre)
333 764521
Urea 1103
8011
976
------
12714
48
Souther Cal.Edison Co.
ElSegundo 3(Pre)
342 984220
Urea ------
------
71217
------
362328
48
Pacific Gas &Electric Co.
Morro Bay 3(Pre)
345 100a
83aAmmonia 100-200
125100-200125
11050
42
3030
49
Pacific Gas &Electric Co.
Morro Bay 3(Pre)
345 100a
83aUrea 100-200
100-200100-200100-200
11080
146
3030
49
aStandard: Pre = Pre-NSPS
bResults shown for a normalized stoichiometric
ratio
-- = data not available.

APPENDIX A
COSTING PROCEDURES
A.1 MethodologyA.2 LNB Applied to Coal-Fired Wall BoilersA.3 LNB Applied to Coal-Fired Tangential BoilersA.4 LNB + AOFA Applied to Coal-Fired Wall BoilersA.5 LNB + AOFA Applied to Coal-Fired Tangential BoilersA.6 Natural Gas Reburn Applied to Coal-Fired BoilersA.7 Operational Modifications (LEA + BOOS) on Natural Gas-
and Oil-Fired BoilersA.8 LNB Applied to Natural Gas- and Oil-Fired Wall BoilersA.9 LNB (Tangentially-Fired), LNB + AOFA, and Natural Gas
Reburn Applied to Natural Gas- and Oil-Fired BoilersA.10 SNCRA.11 SCRA.12 Combination Controls - LNB + SNCR and LNB + AOFA + SCRA.13 Appendix References

A-1
(A.1)
(A.2)
A.1 METHODOLOGY
The basic methodologies used to determine NOx control cost
and cost effectiveness are provided in this section. The
application of this methodology to individual NOx control
technologies is provided in sections A.2-A.11.
A.1.1 Basic System Cost
The equation to calculate basic system cost is:
where:
For a 100 MW wall coal-fired boiler retrofitting LNB, "a" and
"b" were determined to be 220 and -0.44 (refer to
section A.2), respectively, the calculation is:
A.1.2 Retrofit and Indirect Cost Factors
The equation to calculate a retrofit factor is:
where:

A-2
(A.3)
(A.4)
The equation to calculate an indirect cost factor is:
where:
For a 100 MW wall coal-fired boiler retrofitting LNB with a
basic system cost of $29/kW, retrofit costs of $5/kW, and
indirect costs of $9/kW, calculations of retrofit and indirect
cost factors are:
A.1.3 Total Capital Cost
The equation to calculate total capital cost is:
where:
For a 100 MW wall coal-fired boiler retrofitting LNB with a
basic system cost of $29/kW, an indirect cost factor of 1.3,
and a retrofit factor of 1.3, the total capital cost is:
A.1.4 Operating and Maintenance Costs
Operating and maintenance (O&M) costs include fixed and
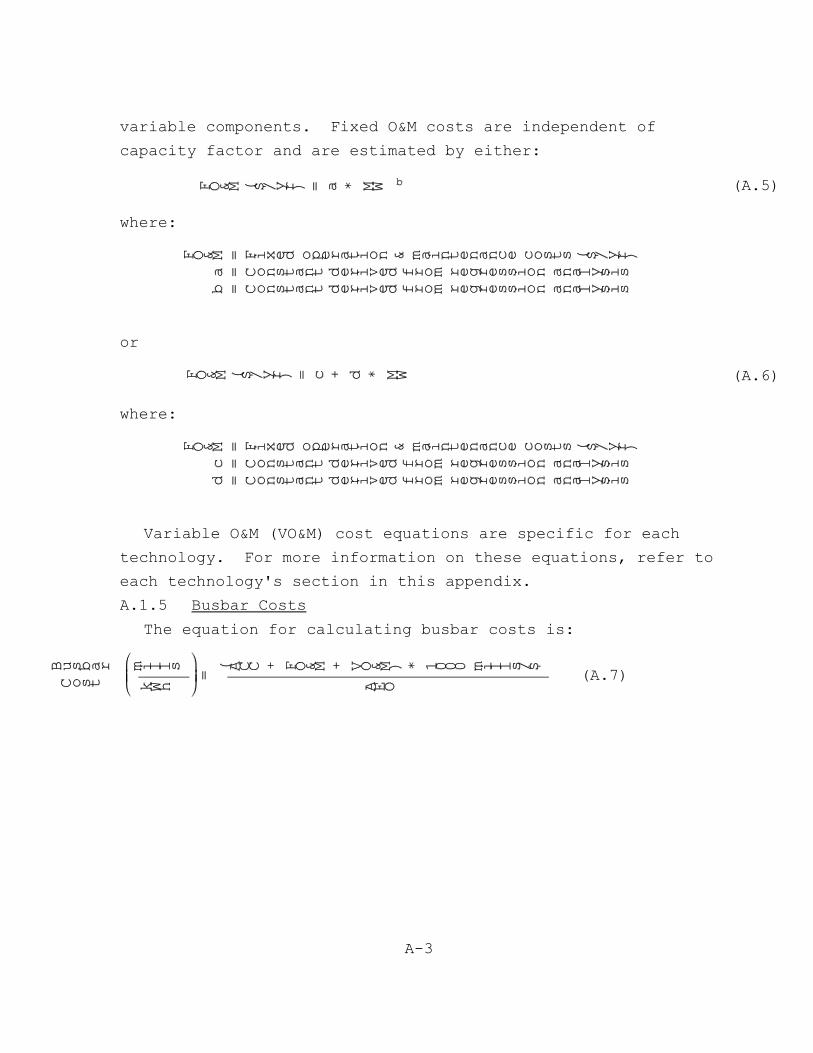
A-3
(A.5)
(A.6)
(A.7)
variable components. Fixed O&M costs are independent of
capacity factor and are estimated by either:
where:
or
where:
Variable O&M (VO&M) cost equations are specific for each
technology. For more information on these equations, refer to
each technology's section in this appendix.
A.1.5 Busbar Costs
The equation for calculating busbar costs is:

A-4
(A.8)
(A.9)
(A.10)
Supporting equations include:
where:
where:
Assuming an interest rate of 0.10 and a economic life of
20 years:
With a total capital requirement of $49/kW, a capital
recovery factor of 0.12, annualized capital costs would be:
where:

A-5
(A.11)
(A.12)
For a 100 MW wall coal-fired boiler retrofitting LNB with
annualized capital costs of $588,000 per year, negligible
O&M costs, and a capacity factor of 0.10, the busbar cost
is:
A.1.6 Cost Effectiveness
The equation for calculating cost effectiveness is:
where:
For a 100 MW wall coal-fired boiler retrofitting LNB with a
baseline NOx level of 0.9 lb/MBtu, a heat rate of 12,500 Btu/kWh,
and a NOx reduction of 40 percent, the tons of NOx removed per
year are:

A-6
With annualized capital costs of $588,000 per year and negligible
O&M costs, the cost effectiveness is:

A-7
A.2 LNB APPLIED TO COAL-FIRED WALL BOILERS
A.2.1 Data Summary
The data used to develop cost equations for applying LNB to
wall-fired boilers are shown in Table

A-8
TABLE A-1. UTILITY LNB COST DATA
(COAL-FIRED UNITS)
Unit
Size
(MW)
Basic
System Cost
($/kW)
Retrofit
System Cost
($/kW)
Indirect
System Cost
($/kW)
Total Capital
Fixed O&M
($/kWyr)
Variable O&M
Reference
1 2 2 2 3 2 2 4 2 2-- = Not provided.

A-9
A-1. Presented in the table are utility and plant name, boiler
size, basic system cost, retrofit system cost, indirect system
cost, total capital cost, fixed O&M, and variable O&M. Fixed O&M
costs were provided for only one unit, and variable O&M costs
were not provided for any units.
The data for three of the units were obtained from
questionnaire responses and are actual installation costs for
existing retrofit projects.1,3,4 The data for the other seven
units were obtained from the EPA's "Analysis of Low NOx Burner
Technology Costs" report and represent cost estimates for
retrofitting LNB, rather than actual installations.2
A.2.2 Basic System Cost
Based on linear regression analysis of the natural
logarithms of basic system cost ($/kW) and boiler size (MW) data,
the cost coefficients for equation A.1 were calculated to be
a = 220 and b = -0.44. Therefore, the basic system cost
algorithm for LNB is:

A-10
Figure

A-11
Figure A-1
A-12
A-1 presents the plot of the data and the curve calculated from
this equation.
A.2.3 Retrofit Cost
Based on the data in Table A-1, retrofit factors for LNB
range from 1.1 to 1.6. Based on the post construction
installation cost data provided by Plants D and G, a retrofit
factor of 1.15 was used for estimating retrofit costs.3,4
Specific cost elements associated with these retrofit factors are
summarized in Section 6.3.1.

A-13

A-14

A-15
A.2.4 Indirect Cost
Indirect cost factors based on Table A-1 range from 1.20 to
1.35. Based on the completed installation cost data provided by
Plants D and G, an ICF of 1.30 was assumed to be typical.3,4
A.2.5 Fixed O&M Cost
Fixed O&M costs include operating, maintenance, and
supervisory labor; maintenance materials, and overhead. Because
of the limited number of moving parts and the expected low
operating labor and maintenance requirements associated with LNB,
fixed O&M costs were not included in the cost procedures.
A.2.6 Variable O&M Cost
The major variable O&M expense associated with LNB is any
increase in fuel expenses resulting from a decrease in boiler
efficiency. The magnitude of this O&M expense will vary
depending on the extent of the efficiency loss and the price of
fuel. As discussed relative to boiler operational modifications,
such as LEA + BOOS, this expense is estimated at less than
0.2 mills/kWh for most boilers. In most instances, this expense
equates to a cost impact of less than 20 percent compared to the
annualized capital expense associated with LNB. Because of their
small impact for most boilers, variable O&M costs associated with
LNB were not included in the cost procedures. To include the
impact of efficiency losses on boiler operating expenses, convert
the efficiency loss to an equivalent Btu/kWh and multiply this
value by the fuel price in mills/Btu.

A-16
A.3 LNB APPLIED TO COAL-FIRED TANGENTIAL BOILERS
A.3.1 Data Summary
There were no available cost data for retrofitting LNB alone
on tangentially-fired boilers. As a result, the basic system
cost algorithm was developed based on the relative price
differentials between LNCFS I (LNB with close-coupled overfire
air) and LNCFS III (LNB plus close-coupled and separated overfire
air) (see appendix A.5 on LNCFS III). Based on information
presented by ABB-Combustion Engineering, the ratio of LNCFS III
basic system cost to LNCFS I basic system cost is 9 to 5.5 This
difference corresponds generally to the price differential
between LNB and LNB + AOFA (see appendix A.4 on LNB + AOFA).
The economy of scale was assumed to be 0.60 for LNCFS I
(corresponding to b = -0.40). This economy of scale is similar
to that for LNB (b = -0.44), and is lower than for LNCFS III
(b = -0.49), which is believed to reflect the lower economy of
scale associated with LNB versus AOFA.
A.3.2 Basic System Cost
Using the relative price differential for LNCFS III to
LNCFS I of 1.8, the basic system cost algorithm for LNCFS III
(see appendix A.5) was modified to develop the algorithm for
LNCFS I.
Dividing the LNCFS III algorithm applied to the 400 MW
reference plant by 1.8 yields the basic system cost for the
400 MW LNCFS I system:
Then, using b = -0.40, the coefficient "a" was determined:

A-17
From this, the basic system cost algorithm for LNCFS I is:
A.3.3 Retrofit Cost
The retrofit and factor for LNCFS I was assumed to be 1.3,
the same as for LNCFS III (see appendix A.5).
A.3.4 Indirect Cost
The indirect cost factor for LNCFS I was assumed to be 1.3,
the same as for LNCFS III.
A.3.5 Fixed O&M Cost
Fixed O&M costs include operating, maintenance, and
supervisory labor; maintenance materials, and overhead. Because
of the limited number of moving parts and the expected low
operating labor and maintenance requirements associated with LNB,
fixed O&M costs were not included in the cost procedures.
A.3.6 Variable O&M Cost
The major variable O&M expense associated with LNB is any
increase in fuel expenses resulting from a decrease in boiler
efficiency. The magnitude of this O&M expense will vary
depending on the extent of the efficiency loss and the price of
fuel. As discussed relative to boiler operational modifications,
such as LEA + BOOS, this expense is estimated at less than
0.2 mills/kWh for most boilers. In most instances, this expense
equates to a cost impact of less than 20 percent compared to the
annualized capital expense associated with LNB. Because of their
small impact for most boilers, variable O&M costs associated with
LNB were not included in the cost procedures. To include the
impact of efficiency losses on boiler operating expenses, convert
the efficiency loss to an equivalent Btu/kWh and multiply this
value by the fuel price in mills/Btu.
A-18
A.4 LNB + AOFA APPLIED TO COAL-FIRED WALL BOILERS
A.4.1 Data Summary
There are limited detailed data available on LNB + AOFA for
wall-fired boilers. Therefore, the basic system cost algorithm
for LNB + AOFA was based on relative price differentials between
LNB and LNB + AOFA.
Information from Southern Company Services on installed cost
estimates for a 100 MW boiler and a 500 MW boiler indicates
ratios of LNB + AOFA to LNB of 2.0 for both boiler sizes.6
Information in the EPA's "Analysis of Low NOx Burner Technology
Costs" report presents ratios of total installed costs ranging
from 1.6 to 1.88.2 Based on review of these data, a ratio of
1.75 for LNB + AOFA to LNB was assumed.
Because of the expected economies of scale for windbox and
air handling systems compared to LNB systems, the scaling factor
for the addition of AOFA is expected to be higher than for LNB
(corresponding to a more negative "b" coefficient in the basic
system cost equation). For LNCFS III, b = -0.49, and for LNB,
b = -0.44. Based on review of LNCFS III and LNB + AOFA data in
the EPA cost report, "b" was assumed to equal -0.5 for
LNB + AOFA.2
A.4.2 Basic System Cost
Using the 400 MW reference plant and the LNB cost algorithm
for basic system cost multiplied by 1.75, the reference plant
cost for LNB + AOFA was determined:
Then, using b = -0.5, the coefficient "a" was determined:

A-19

A-20
From this, the basic system cost algorithm for LNB + AOFA is:
A.4.3 Retrofit Cost
The retrofit factor for LNB + AOFA was assumed to be 1.3,
the same as for LNCFS III.
A.4.4 Indirect Cost
The indirect cost factor for LNB + AOFA was assumed to be
1.3, the same as for LNB only and for LNCFS III.
A.4.5 Fixed O&M Cost
Fixed O&M costs include operating, maintenance, and
supervisory labor; maintenance materials, and overhead. Because
of the limited number of moving parts and the expected low
operating labor and maintenance requirements associated with LNB
+ AOFA, fixed O&M costs were not included in the cost procedures.
A.4.6 Variable O&M Cost
The major variable O&M expense associated with LNB + AOFA is
any increase in fuel expenses resulting from a decrease in boiler
efficiency. The magnitude of this O&M expense will vary
depending on the extent of the efficiency loss and the price of
fuel. As discussed relative to boiler operational modifications,
such as LEA + BOOS, this expense is estimated at less than
0.2 mills/kWh for most boilers. In most instances, this expense
equates to a cost impact of less than 20 percent compared to the
annualized capital expense associated with LNB + AOFA. Because
of their small impact for most boilers, variable O&M costs
associated with LNB + AOFA were not included in the cost
procedures. To include the impact of efficiency losses on boiler
operating expenses, convert the efficiency loss to an equivalent
Btu/kWh and multiply this value by the fuel price in mills/Btu.

A-21
A.5 LNB + AOFA APPLIED TO COAL-FIRED TANGENTIAL BOILERS
A.5.1 Data Summary
The cost data for tangentially-fired boilers retrofitting
LNCFS III are shown in Table
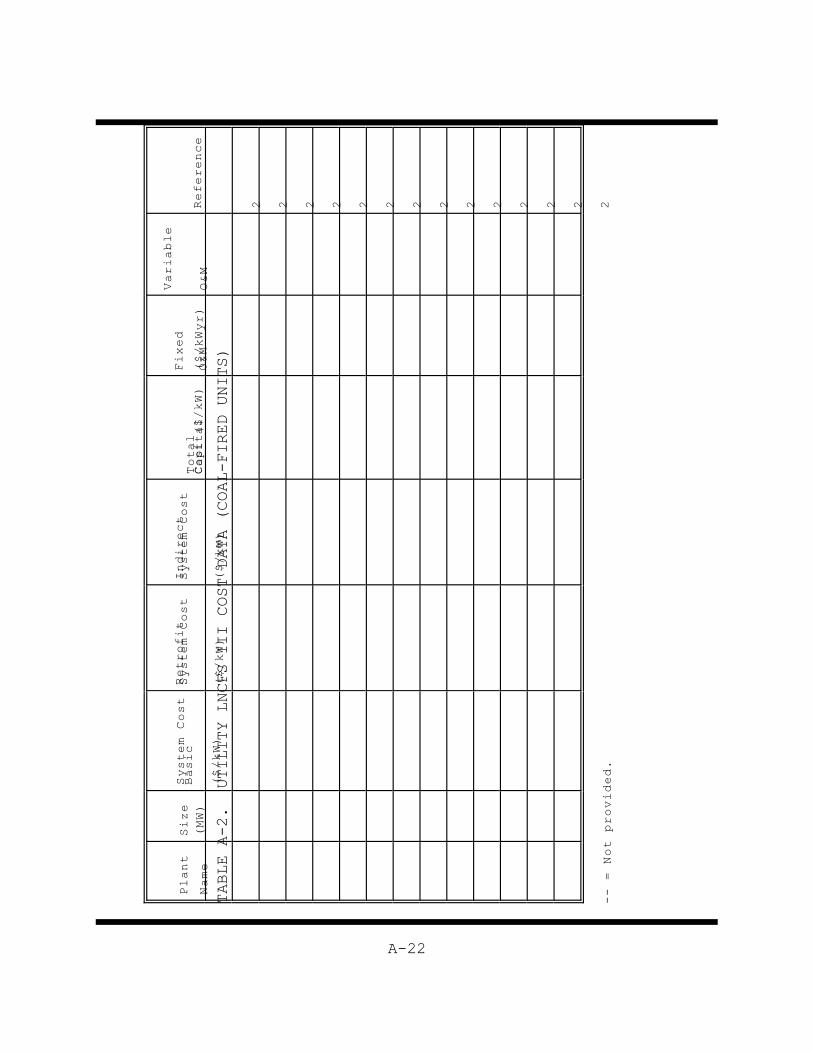
A-22
TABLE A-2. UTILITY LNCFS III COST DATA (COAL-FIRED UNITS)
Plant
Name
Size
(MW)
Basic
System Cost
($/kW)
Retrofit
System Cost
($/kW)
Indirect
System Cost
($/kW)
Total
Capital
Cost ($/kW)
Fixed
O&M
($/kWyr)
Variable
O&M
Reference
2 2 2 2 2 2 2 2 2 2 2 2 2 2-- = Not provided.
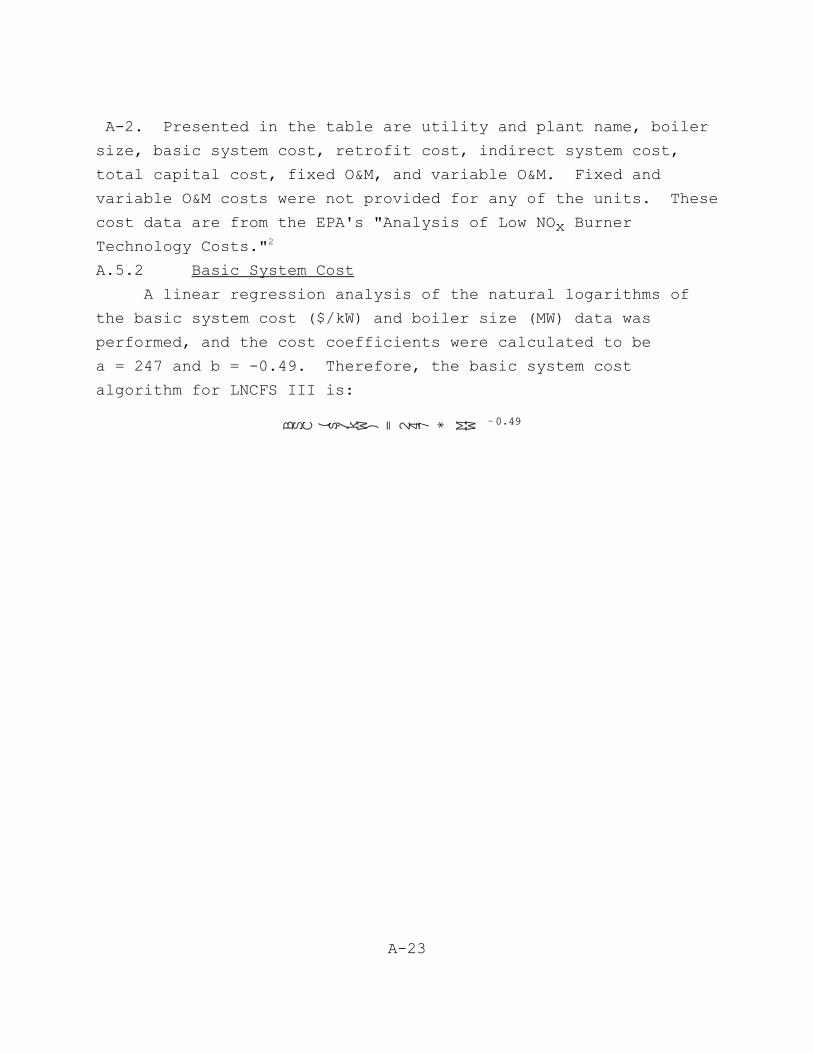
A-23
A-2. Presented in the table are utility and plant name, boiler
size, basic system cost, retrofit cost, indirect system cost,
total capital cost, fixed O&M, and variable O&M. Fixed and
variable O&M costs were not provided for any of the units. These
cost data are from the EPA's "Analysis of Low NOx Burner
Technology Costs."2
A.5.2 Basic System Cost
A linear regression analysis of the natural logarithms of
the basic system cost ($/kW) and boiler size (MW) data was
performed, and the cost coefficients were calculated to be
a = 247 and b = -0.49. Therefore, the basic system cost
algorithm for LNCFS III is:

A-24
Figure

A-25
Figure A-2
A-26
A-2 presents the plot of the data and the curve calculated from
this equation.
A.5.3 Retrofit Cost
The retrofit factors for LNCFS III ranged from 1.14 to 1.65,
with a mean of approximately 1.30.
A.5.4 Indirect Cost
Indirect cost factors ranged from 1.20 to 1.45. For the
cost procedures, an indirect cost factor of 1.30 was assumed.
A.5.5 Fixed O&M Cost
Fixed O&M costs include operating, maintenance, and
supervisory labor; maintenance materials, and overhead. Because
of the limited number of moving parts and the expected low
operating labor and maintenance requirements associated with LNB
+ AOFA, fixed O&M costs were not included in the cost procedures.
A.5.6 Variable O&M Cost
The major variable O&M expense associated with LNB + AOFA is
any increase in fuel expenses resulting from a decrease in boiler
efficiency. The magnitude of this O&M expense will vary
depending on the extent of the efficiency loss and the price of

A-27

A-28
fuel. As discussed relative to boiler operational modifications,
such as LEA + BOOS, this expense is estimated at less than
0.2 mills/kWh for most boilers. In most instances, this expense
equates to a cost impact of less than 20 percent compared to the
annualized capital expense associated with LNB + AOFA. Because
of their small impact for most boilers, variable O&M costs
associated with LNB + AOFA were not included in the cost
procedures. To include the impact of efficiency losses on boiler
operating expenses, convert the efficiency loss to an equivalent
Btu/kWh and multiply this value by the fuel price in mills/Btu.
A-29
A.6 NATURAL GAS REBURN APPLIED TO COAL-FIRED BOILERS
A.6.1 Data Summary
Limited cost data on natural gas reburn for coal-fired
boilers were obtained from vendor and utility questionnaire
responses. These data are presented in Table

A-30
TABLE A-3. REBURN COST DATA
(COAL-FIRED UNITS)
Unit
Size
(MW)
Basic
System Cost
($/kW)
Retrofit
System Cost
($/kW)
Indirect
System Cost
($/kW)
Total Capital
Fixed O&M
($/kWyr)
Variable O&M
Reference
7Public Service
of Colorado
7 8
-- = Not provided.
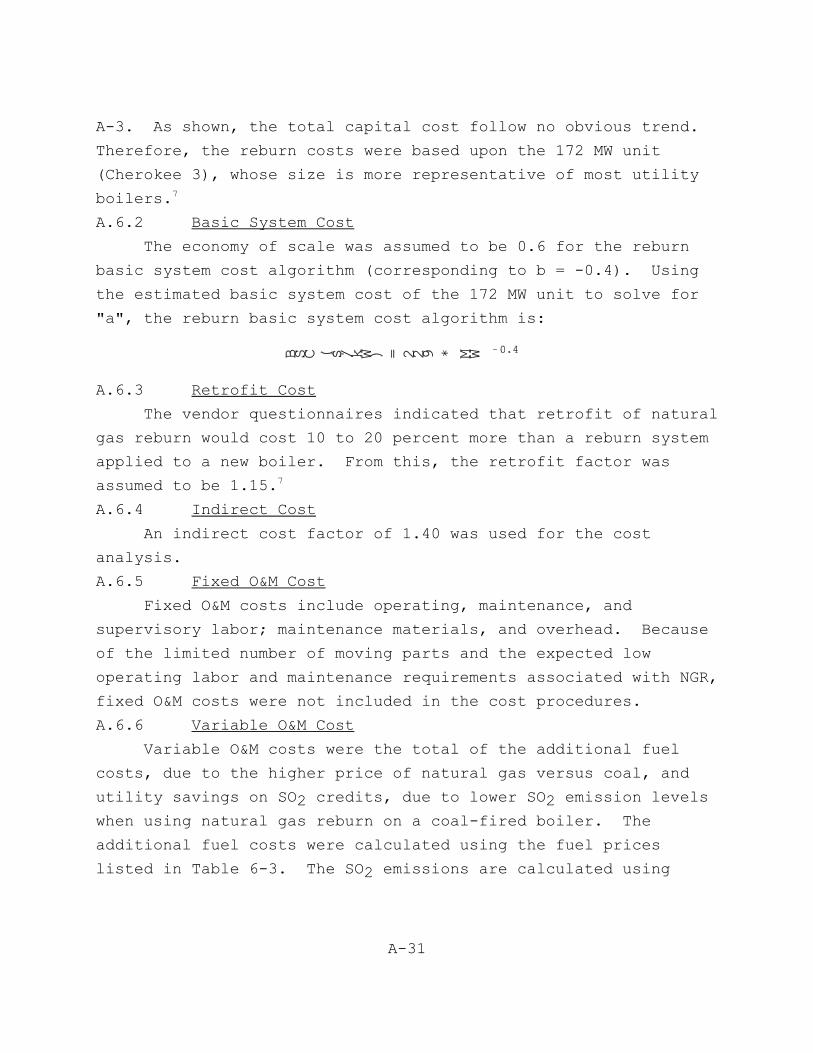
A-31
A-3. As shown, the total capital cost follow no obvious trend.
Therefore, the reburn costs were based upon the 172 MW unit
(Cherokee 3), whose size is more representative of most utility
boilers.7
A.6.2 Basic System Cost
The economy of scale was assumed to be 0.6 for the reburn
basic system cost algorithm (corresponding to b = -0.4). Using
the estimated basic system cost of the 172 MW unit to solve for
"a", the reburn basic system cost algorithm is:
A.6.3 Retrofit Cost
The vendor questionnaires indicated that retrofit of natural
gas reburn would cost 10 to 20 percent more than a reburn system
applied to a new boiler. From this, the retrofit factor was
assumed to be 1.15.7
A.6.4 Indirect Cost
An indirect cost factor of 1.40 was used for the cost
analysis.
A.6.5 Fixed O&M Cost
Fixed O&M costs include operating, maintenance, and
supervisory labor; maintenance materials, and overhead. Because
of the limited number of moving parts and the expected low
operating labor and maintenance requirements associated with NGR,
fixed O&M costs were not included in the cost procedures.
A.6.6 Variable O&M Cost
Variable O&M costs were the total of the additional fuel
costs, due to the higher price of natural gas versus coal, and
utility savings on SO2 credits, due to lower SO2 emission levels
when using natural gas reburn on a coal-fired boiler. The
additional fuel costs were calculated using the fuel prices
listed in Table 6-3. The SO2 emissions are calculated using

A-32
typical sulfur and calorific content of coal from Chapter 3
(Table 3-2) and an average AP-42 emission factor for bituminous
and subbituminous coal.9 The SO2 credit was assumed to be
$500/ton of SO2.10 The equation to determine savings from SO2
credits is:
EF * Sulfur * MW * HR * CF * Credit * Reburn * 2.19
where:
EF = AP-42 SO2 Emission Factor (lb SO2/ton coal *sulfur % of coal)
Sulfur = Sulfur % of coal
Credit = SO2 credit ($/ton)
Reburn = Heat input of reburn fuel fired divided bytotal boiler heat input (decimal fraction)
2.19 = Conversion factor
A-33
A.7 OPERATIONAL MODIFICATIONS (LEA + BOOS) ON NATURAL GAS- AND
OIL-FIRED BOILERS
A.7.1 Overview
Cost estimates for LEA + BOOS were prepared for wall- and
tangentially-fired boilers. The LEA + BOOS cost analysis was
used as an example of operational modifications.
A.7.2 Basic System Cost
The direct capital costs required for LEA + BOOS are the
cost for conducting a 4-week emissions and boiler efficiency test
to determine optimum fuel-air settings. The cost for the 4-week
testing period was estimated at $75,000. Testing costs were not
assumed to be dependent upon boiler size.
A.7.3 Retrofit Cost
A retrofit factor of 1.0 was used in the cost analysis.
A.7.4 Indirect Cost
Indirect costs were estimated at 25 percent of the direct
costs. Therefore, the indirect cost factor was assumed to be
1.25.
A.7.5 Fixed O&M Cost
Fixed O&M costs include operating, maintenance, and
supervisory labor; maintenance materials, and overhead. Because
of the limited number of moving parts and the expected low
operating labor and maintenance requirements associated with LEA
+ BOOS, fixed O&M costs were not included in the cost procedures.
A.7.6 Variable O&M Cost
The only variable O&M cost impact examined for BOOS was
reduced boiler efficiency. The variable O&M cost caused from the
efficiency loss was calculated using the following equation:
where:

A-34
MW, HR, and CR are as previously defined
Effloss = efficiency loss of boiler (decimal fraction)
Fuel Cost = fuel cost ($/MMBtu)
8.76 = conversion factor
A 0.3 percent average decrease in boiler efficiency was used for
the cost analysis.11 Other variable O&M costs were assumed to be
negligible.

A-35
A.8 LNB APPLIED TO NATURAL GAS- AND OIL-FIRED WALL BOILERS
A.8.1 Data Summary
Capital cost data for LNB applied to natural gas and oil
wall-fired boilers were limited to the three points shown in
Table

A-36
TABLE A-4. UTILITY LNB COST DATA
(GAS- AND OIL-FIRED UNITS)
($/kW)
Reference
11
11
12
Breakdown of total capital cost not provided.
-- = Not provided.

A-37
A-4. All three points reflect total capital cost. Two of the
data points are pre-construction estimates.11 The third data
point is from a questionnaire response and reflects actual
installed costs.12
A.8.2 Basic System Cost
To estimate the basic system cost for natural gas- and oil-
fired LNB, the total capital cost data in Table A-4 were compared
to the estimated total capital costs for coal-fired wall boilers
(described in Section A.2). This comparison, shown in Figure A-3

A-38
Figure A-3

A-39
, suggests that the total capital costs for natural gas- and oil-
fired boilers are comparable to the total capital costs for coal-
fired boilers.
Analysis of this conclusion (i.e., that costs for natural
gas- and oil-fired LNB are comparable to those for coal-fired
LNB) suggests that (1) the major costs associated with LNB
technology are associated with development, testing, engineering,
and marketing activities, and (2) differences in the cost of
natural gas- and oil-fired LNB compared to coal-fired LNB caused
by differences in physical design or fabrication requirements are
small. Based on this conclusion and the limited cost data for
LNB designed for natural gas and oil firing, the cost procedures
developed for coal-fired LNB were used to estimate basic system
costs for LNB applied to natural gas- and oil-fired boilers.
A.8.3 Retrofit Cost
There were no specific data on retrofit costs associated
with installing LNB on natural gas- and oil-fired boilers.
Therefore, the retrofit factors were assumed to be the same as
those used for coal-fired boilers.
A.8.4 Indirect Cost
Indirect costs were estimated at 25 percent of direct costs.
Therefore, an indirect cost factor of 1.25 was assumed.

A-40

A-41
A.8.5 Fixed O&M
Fixed O&M costs include operating, maintenance, and
supervisor labor; maintenance materials, and overhead. Because
of the limited number of moving parts and the expected low
operating labor and maintenance requirements associated with LNB,
fixed O&M costs were not included in the cost procedures.
A.8.6 Variable O&M
The major variable O&M expense associated with LNB is any
increase in fuel expenses resulting from a decrease in boiler
efficiency. The magnitude of this O&M expense will vary
depending on the extent of the efficiency loss and the price of
fuel. As discussed relative to boiler operational modifications,
such as LEA + BOOS, this expense is estimated at less than
0.2 mills/kWh for most boilers. In most instances, this expense
equates to a cost impact of less than 20 percent compared to the
annualized capital expense associated with LNB. Because of their
small impact for most boilers, variable O&M costs associated with
LNB were not included in the cost procedures. To include the
impact of efficiency losses on boiler operating expenses, convert
the efficiency los to an equivalent Btu/kWh and multiply this
value by the fuel price in mills/Btu.

aaaaaaFor the application of natural gas reburn to oil-fired boilers, the SO2 emissions are calculated using atypical sulfur and calorific content of oil from Chapter 3(Table 3-4) and an AP-42 emission factor.9
A-42
A.9 LNB (TANGENTIALLY-FIRED), LNB + AOFA, AND NATURAL GAS REBURN
APPLIED TO NATURAL GAS- AND OIL-FIRED BOILERS
There were no cost data available for applying LNB to
natural gas- and oil-fired tangential boilers or LNB + AOFA and
natural gas reburn to natural gas- and oil-fired wall and
tangential boilers.aaaaaa Based on the apparent similarity in cost
for wall-fired LNB firing natural gas, oil, and coal (see Section
A.8), the cost of applying tangentially-fired LNB, LNB + AOFA,
and natural gas reburn to natural gas- and oil-fired boilers were
used to estimate the cost for coal-fired boilers. Refer to the
appropriate appendix section for coal-fired boilers for specific
cost procedures and information.
A-43
A.10 SNCR
A.10.1 Data Summary
To estimate the cost of urea-based SNCR systems, a detailed
engineering model was used. The detailed model was developed by
Radian based upon information on basic system and indirect
costs13,14 and on system operating parameters.15
A total of 15 case studies were evaluated: 100 MW, 300 MW,
and 600 MW for five boiler types (wall, tangential, and cyclone
coal-fired boilers, plus wall and tangential natural gas- and
oil-fired boilers). The results for these case studies were used
to develop simplified costing algorithms for use in this study.
For the case studies, the SNCR system operated at an N/NO
ratio of 1.0, and contained two levels of wall injectors and one
convective pass level of injectors. No enhancer was assumed to
be injected with the urea solution. Cost and material rates were
equal to those listed in Table 6-2.
A.10.2 Basic System Cost
Basic system cost categories included the urea storage
system, the reagent injection system, air compressors, and
installation costs. The algorithm coefficients were derived by
linear regression of cost data from the 15 case studies using the
methodology described in section A.1. The coefficients were
nearly identical for the three coal-fired boiler types.
Therefore, the following algorithm was used to characterize the
costs for all three:
Similarly, the cost coefficients were nearly identical for both
gas- and oil-fired boiler types and the following algorithm was
used to characterize costs for both:

A-44
A.10.3 Retrofit Cost
There were no retrofit cost data available for the analysis.
A retrofit factor of 1.0 was assumed based upon the assumption
that the retrofit difficulty of SNCR is small.
A.10.4 Indirect Cost
The SNCR model calculated two categories of indirect costs:
a contingency factor and engineering support costs. The
engineering cost is determined as a function of the unit size,
whereas the contingency is calculated as a percentage of direct
capital costs. The indirect costs typically ranged between 20 to
30 percent of the total direct costs. An overall indirect cost
factor of 1.3 was assumed for the calculation of total capital
cost.
A.10.5 Fixed O&M Cost
Fixed O&M costs for SNCR include operating labor,
supervision, maintenance labor, maintenance materials, and
overhead. Fixed O&M costs were estimated for each of the five
boiler types using the SNCR model, and found to be independent of
fuel and boiler firing type. Therefore, the following equation,
determined by the methods described in section A.1, estimated
fixed O&M costs for all five types of boilers:
A.10.6 Variable O&M Cost
Variable O&M costs for SNCR include urea, energy penalty
associated with vaporization of the urea solution and mixing air,
dilution water, and electricity. The urea cost was determined
from the following equation:

A-45
where:
Based upon the 15 case studies, the other variable O&M costs were
estimated to be 11 percent of the yearly urea cost.

A-46
A.11 SCR
A.11.1 Data Summary
The SCR cost estimates are based upon the SCR module in
Version 4.0 of EPA's IAPCS16, publised SCR cost information17,18,
and utility questionnaire responses19,20. The existing IAPCS
algorithms were used to estimate ammonia handling and storage,
flue gas handling, air heater modifications, and catalyst costs.
However, the following changes were made to the algorithms:
C IAPCS reactor housing costs were reduced by 71 percent[based on the ratio of reactor housing cost estimatesfrom published information17,18 ($3.56 million) and fromIAPCS ($12.5 million)].16
C Process control equipment costs were reduced to$350,000 (versus $1,840,000 in IAPCS).
C Fan costs were excluded for new boilers. Forretrofits, fan costs are boiler specific and depend onwhether fan modifications are possible or a new fan isneeded.
C A catalyst cost of $400/ft3 was used for all fueltypes.
C A space velocity of 14,000/hr was used for gas-firedboilers.
C A flue gas flow rate of approximately 100 Nft3/kWh wasused for oil and gas, and 126 Nft3/kWh for coal.
C A 45 percent indirect cost factor was applied toprocess capital (10 percent for engineering overhead,10 percent for general facilities, 15 percent projectcontingency, and 10 percent process contingency).
C A 15-25 percent indirect cost factor was applied to thecatalyst cost (15 percent for gas, 20 percent for oil,and 25 percent for coal. This factor includes10 percent for project contingency and the balance forprocess contingency).
C A cost of $160/ft3 of catalyst was added to coverinstallation and disposal of replacement catalyst.

A-47
A total of 15 case studies were developed using the modified
IAPCS output. These case studies were for boilers of 100 MW, 300
MW, and 600 MW, for each of five boiler types (wall, tangential,
and cyclone coal-fired boilers, plus wall and tangential natural
gas- and oil-fired boilers). The results from these case studies
were then used to develop simplified costing algorithms for use
in this study.
The IAPCS algorithms are based on hot-side SCR technology
(i.e., the catalyst is located between the boiler economizer and
air preheater). For the case studies, catalyst life was assumed
to be three years for coal-fired boilers and six years for
natural gas- and oil-fired boilers. A NOx reduction of
85 percent was assumed for all case studies. At this NOx
reduction, catalyst space velocities were assumed to be 2,500/hr
for coal-fired boilers and 5,000/hr for oil-fired boilers, and
14,000/hr for natural gas-fired boilers.
A.11.2 Basic System Cost
Basic system cost for SCR includes both process capital and
the initial catalyst charge:
BSC ($/kW) = process capital + initial catalyst charge.
Process capital includes NH3 handling, storage, and
injection; catalyst reactor housing; flue gas handling; air
preheater modifications; and process control. The cost
coefficients for process capital were derived by linear
regression of cost data from the 15 case studies. The
coefficients for each of the five boiler types are:
Fuel Boiler Type a b
Coal Wall 174 -0.30
Tangential 165 -0.30
Cyclone 196 -0.31
Oil/Gas Wall 165 -0.324
Tangential 156 -0.329

A-48
The equation for estimating the cost of the initial catalyst
charge is based on IAPCS documentation:
Catalyst ($/kW) = Flow * Cat$ / {SVf * [ln(0.20) / ln(1-NOxRed)]}

A-49
where:
Total capital cost is calculated by multiplying the process
capital by the retrofit and process capital indirect cost factor,
multiplying the initial catalyst charge by the catalyst indirect
cost factor, and adding these two products together.
A.11.3 Retrofit Cost
Retrofit cost factors for SCR were obtained from an EPA
analysis of SCR costs.21 This reference estimates retrofit
factors of 1.02 (low), 1.34 (moderate), and 1.52 (high) based on
data obtained from hot-side SCR retrofits on German utility
boilers. For cost estimating purposes, the retrofit factor was
assumed to be 1.34.
A.11.4 Indirect Costs
Separate indirect cost factors were used for the process
capital and the catalyst cost. Indirect costs for the process
capital were estimated at 45 percent. Indirect costs for
catalysts costs were estimated at 25 percent for coal-fired
boilers, 20 percent for oil-fired boilers, and 15 percent for
gas-fired boilers.
A.11.5 Fixed O&M Cost
Fixed O&M costs for SCR include operating labor,
supervision, maintenance labor, maintenance materials, and
overhead. Fixed O&M costs in $/yr were estimated for each of the
five boiler types using IAPCS.16 The resulting data were then
used to develop a cost algorithm as discussed in section A.1.
The results of this analysis are:

A-50

A-51
Fuel Boiler Type c d
Coal Wall 284,600 5,141
Tangential 276,400 5,103
Cyclone 305,100 5,243
Oil/Gas Wall 264,800 3,260
Tangential 256,600 3,219
A.11.6 Variable O&M Cost
Variable O&M costs for SCR include catalyst replacement,
ammonia, electricity, steam, and catalyst disposal. Cost for
these elements were derived from IAPCS.16 The equation used in
the ACT study for estimating catalyst replacement cost in $/kW-yr
was based on the case studies and the IAPCS documentation:
Flow * (Cat$ + 160) / {SVf * [ln(0.20) / ln(1-NOxRed)]} / CL
where:
Flow,Cat$, SVf, and NOxRed are as previously defined
160 = cost to cover installation disposal of replacement
catalyst ($/ft3)
CL = catalyst life (years).
The equation for estimating costs for the other four variable O&M
components in $/kW-yr was also based on the case study data and
the IAPCS documentation:
[1.88 + (4.3 * UncNOx * NOxRed)] * CF
where:
NOxRed is as previously defined
UncNOx = uncontrolled NOx (lb/MBtu)
CF = capacity factor (in decimal fraction form).
A-52
A.12 COMBINATION CONTROLS - LNB + SNCR AND LNB + AOFA + SCR
The costs of the combined control technologies LNB + SNCR
and LNB + AOFA + SCR applied to coal-fired and natural gas- and
oil-fired wall and tangential boilers were determined by
combining individual cost algorithms for each technology. For
example, the individual capital, variable P&M, and fixed O&M cost
algorithms for LNB were combined with those for SNCR. Similarly,
the LNB + AOFA cost algorithms were combined with the SCR cost
algorithms. Refer to each individual section for the specific
cost information.

A-53
A.13 APPENDIX REFERENCES
1. Letter and attachments from Brownell, F. W., Hunton andWilliams, to Neuffer, W. J., U. S. Environmental ProtectionAgency. December 1, 1992. Information collection requestfrom Consumers Power - J. H. Campbell 3.
2. U. S. Environmental Protection Agency, Office of AtmosphericPrograms. Analysis of Low NOx Burner Technology Costs(Draft). Washington, DC 20460. February, 1993.
3. Questionnaire Response - Plant D. 1993
4. Questionnaire Response - Plant G. 1993
5. Grusha, J. and M. S. McCartney. Development and Evolutionof the ABB Combustion Engineering Low NOx Concentric FiringSystem. TIS 8551. ABB Combustion Engineering Service, Inc. Windsor, CT. 1991.
6. Letter and attachments from R. E. Rush, Southern CompanyService, to D. Carter, U. S. Department of Energy. February 21, 1992.
7. Letter and attachments from Jensen, A. D., Energy andEnvironmental Research Corporation, to Eddinger, J. A.,U. S. Environmental Protection Agency. February 19, 1993. Response to request for information on control of NOxemissions from new or modified electric steam generatingunits.
8. Questionnaire response from Dieriex, R., Illinois PowerCompany - Hennepin 1. 1993.
9. U.S. Environmental Protection Agency, Compilation of AirPollutant Emission Factors, Fourth Edition. Office of AirQuality Planning and Standards. Research Triangle Park,North Carolina 27711. September, 1985.
10. Sanyal, A., Sommer, T. M., Folsom, B. A., Angello, L.,Payne, R., and M. Ritz. Cost Effective Technologies for SO2and NOx Control. In: Power-Gen '92 Conference Papers,Volume 3. Orlando, FL. November 17-19, 1992. p. 71.
11. U. S. Environmental Protection Agency, Office of Air QualityPlanning and Standards. Evaluation and Costing of NOx
Controls for Existing Utility Boilers in the NESCAUM Region. EPA 453/R-92-010. Research Triangle Park, NC. December,1992. p. 6-20.
A-54
12. Letter and attachments from Allen, R. N., Florida Power andLight, to Harrison, C. S., Hunton and Williams. November 3,1992. NOx information collection request.
13. Letter and attachments from R. D. Pickens, Nalco Fuel Tech,to N. Kaplan, U. S. Environmental Protection Agency. January 20, 1992.
14. Utility Air Regulatory Group. NOx Emission Controls forUtility Boilers. January 1993. Table 12.
15. Letter and attachments from R. D. Pickens, Nalco Fuel Tech,to E. W. Soderberg, Radian Corporation. February 8, 1992.
16. U. S. Environmental Protection Agency, Integrated AirPollution Control System, Version 4.0. EPA-600/7-90-022b. Air and Energy Engineering Research Laboratory, ResearchTriangle Park, NC, 1990. Section 4.8.
17. Cochran, J. R., et al. Selective Catalytic Reduction for a460 MW Coal Fueled Unit: Overview of a NOx Reduction SystemSelection. Presented at the 1993 Joint Symposium onStationary Combustion NOx Control. Bal Harbour, Florida. May 24-27, 1993.
18. Electric Power Research Institute. Technical Feasibilityand Cost of Selective Catalytic Reduction (SCR) NOx Control. EPRI GS-7266. Palo Alto, CA. May 1991.
19. Fax from J. Klueger, Los Angelos Department of Water andPower, to M. J. Stucky, Radian Corporation. September 9,1993.
20. Letter and attachments concerning SCR costs. ConfidentialBusiness Information. Reference Number 93197-I11-01.
21. Emmel, T. E., Maibodi, M., and J. A. Martinez. Comparisonof West German and U. S. Flue Gas Desulfurization andSelective Catalytic Reduction Costs. EPA-600/7-90-009. Airand Energy Engineering Research Laboratory,U. S. Environmental Protection Agency, Research TrianglePark, NC, 1990. p. 14.
Copyright © 2022 FDOKUMEN


![SACI [e]motion - V-NOX TWIN PUMP](https://static.fdokumen.com/doc/165x107/6334ac3db9085e0bf50921cd/saci-emotion-v-nox-twin-pump.jpg)