Alterations in Frontal Lobe Tracts and Corpus Callosum in Young Children with Autism Spectrum...
11
Cerebral Cortex doi:10.1093/cercor/bhp278 Alterations in Frontal Lobe Tracts and Corpus Callosum in Young Children with Autism Spectrum Disorder Ajay Kumar 1,2 , Senthil K. Sundaram 1,2 , Lalitha Sivaswamy 1,2 , Michael E. Behen 1,2 , Malek I. Makki 2,3 , Joel Ager 4 , James Janisse 4 , Harry T. Chugani 1,2 and Diane C. Chugani 1,3,5 1 Carman and Ann Adams Department of Pediatrics, and the 2 Departments of Neurology and 3 Radiology, and 4 Family Medicine & Community Health, Children’s Hospital of Michigan, Detroit Medical Center, Wayne State University, School of Medicine, Detroit, Michigan, USA and 5 Department of Pharmacology, Children’s Hospital of Michigan, Detroit Medical Center, Wayne State University, School of Medicine, Detroit, Michigan, USA Major frontal lobe tracts and corpus callosum (CC) were investigated in 32 children with autism spectrum disorder (ASD, mean age: 5 years), 12 nonautistic developmentally impaired children (DI, mean age: 4.6 years), and 16 typically developing children (TD, mean age: 5.5 years) using diffusion tensor imaging tractography and tract-based spatial statistics. Various diffusion and geometric properties were calculated for uncinate fasciculus (UF), inferior fronto-occipital fasciculus (IFO), arcuate fasciculus (AF), cingulum (Cg), CC, and corticospinal tract. Fractional anisotropy was lower in the right UF, right Cg and CC in ASD and DI children; in right AF in ASD children; and in bilateral IFO in DI children, compared with TD children. Apparent diffusion coefficient was increased in right AF in both ASD and DI children. The ASD group showed shorter length of left UF and increased length, volume, and density of right UF; increased length and density of CC; and higher density of left Cg, compared with the TD group. Compared with DI group, ASD group had increased length, volume, and density of right UF; higher volume of left UF; and increased length of right AF and CC. Volume of bilateral UF and right AF and fiber density of left UF were positively associated with autistic features. Keywords: association fiber tracts, autism spectrum disorder, children, corpus callosum, corticospinal tract, developmental impairment, diffusion tensor imaging, frontal lobe Introduction Autism spectrum disorders (ASDs) are neurodevelopmental behaviorally defined conditions characterized by impaired language and reciprocal social interaction, as well as presence of repetitive and stereotypical behaviors. Abnormalities within specific frontal lobe regions may play an important role in the manifestation of the core features of autism. For example, there is functional MRI (fMRI) evidence to suggest that the early social deficits of autism may be related to a social cognition network in which frontal lobe plays a crucial role (Baron- Cohen et al. 1999). A number of structural and functional neuroimaging studies have found abnormalities in the frontal lobe of patients with autism; these abnormalities appear to correlate with deficits of social cognition, executive function, communication, and repetitive behavior (Carper and Courch- esne 2000, 2005; Chandana et al. 2005; Chugani et al. 1999; Ohnishi et al. 2000; Luna et al. 2002; Herbert et al. 2003, 2004; Salmond et al. 2003; Hazlett et al. 2004). Previous studies using positron emission tomography from our group had found serotonergic functional abnormalities in the frontal lobe of autistic children (Chugani et al. 1999; Chandana et al. 2005). Specifically, decreased serotonin synthesis capacity in the frontal cortex and an abnormal developmental trajectory for whole-brain serotonin synthesis were observed (Chugani et al. 1998, 1999). Since serotonin acts as a neurotrophic factor early in life and modulates axonal arborization (Vitalis and Parnavelas 2003), we hypothesized that the observed developmental alterations in serotonin synthesis may be related to abnormal- ities in underlying connectivity of frontal lobe. Brain connectivity in autism has been investigated using a number of techniques, including electroencephalography, fMRI, and diffusion tensor imaging (DTI). Though functional connectivity can be demonstrated by electroencephalography and fMRI, these techniques do not directly assess the structural integrity of the neural networks. DTI remains the only non- invasive method, which can directly evaluate structural connec- tivity in the brain. However, to date there are only few studies reporting DTI abnormalities in autism (Barnea-Goraly et al. 2004; Alexander et al. 2007; Ben Bashat et al. 2007; Keller et al. 2007; Lee et al. 2007, 2009; Catani et al. 2008; Sundaram et al. 2008b; Thakkar et al. 2008). In a recent DTI study of frontal lobe fibers from our group (Sundaram et al. 2008b), abnormalities in the diffusion (anisotropy and diffusivity) and geometric (fiber length and fiber volume) properties of long and short association fibers of frontal lobe were observed. The distribution of fiber length was found to differ between the control and ASD groups. In particular, the fiber length distribution was significantly more negatively skewed in the ASD group compared with controls. Histograms of fiber lengths showed a bimodal distribution with a smaller peak corresponding to long fibers. When the fibers corresponding to this second peak were isolated, the average length of these long fibers was significantly higher in ASD than in control subjects. However, that study did not isolate individual association tracts that could explain the anatomic location of the fiber changes within the frontal lobe. Hence, the current study was designed to investigate the major association tracts of the frontal lobe including the uncinate fasciculus (UF), inferior fronto-occipital fasciculus (IFO), arcuate fasciculus (AF), and the cingulum (Cg), as well as the corpus callosum (CC) in young children with ASD compared with typically developing children. In order to evaluate the specificity of the findings, that is, findings specifically related to autistic features, we also investigated another group of children having developmental impairment, but no autistic features (DI). We also investigated the corticospinal tract (CST) as a control tract, which we hypothesized would not be affected in children with ASD or DI. Methods and Materials Subjects Thirty-two children with diagnoses of ASD (ASD group, mean age: 5.0 years; range: 2.5--8.9 years, 29 males and 3 females), 12 nonautistic developmentally impaired children (DI group, mean age: 4.6 years; range: 3.0--9.0 years, 10 males and 2 females), and 16 typically developing Ó The Author 2009. Published by Oxford University Press. All rights reserved. For permissions, please e-mail: [email protected] Cerebral Cortex Advance Access published December 17, 2009 by guest on June 11, 2016 http://cercor.oxfordjournals.org/ Downloaded from
-
Upload
independent -
Category
Documents
-
view
1 -
download
0
Transcript of Alterations in Frontal Lobe Tracts and Corpus Callosum in Young Children with Autism Spectrum...
Cerebral Cortex
doi:10.1093/cercor/bhp278
Alterations in Frontal Lobe Tracts andCorpus Callosum in Young Children withAutism Spectrum Disorder
Ajay Kumar1,2, Senthil K. Sundaram1,2, Lalitha Sivaswamy1,2,
Michael E. Behen1,2, Malek I. Makki2,3, Joel Ager4,
James Janisse4, Harry T. Chugani1,2 and Diane C. Chugani1,3,5
1Carman and Ann Adams Department of Pediatrics, and the2Departments ofNeurology and 3Radiology, and 4FamilyMedicine
& Community Health, Children’s Hospital of Michigan, Detroit
Medical Center, Wayne State University, School of Medicine,
Detroit, Michigan, USA and 5Department of Pharmacology,
Children’s Hospital of Michigan, Detroit Medical Center, Wayne
State University, School of Medicine, Detroit, Michigan, USA
Major frontal lobe tracts and corpus callosum (CC) were investigatedin 32 children with autism spectrum disorder (ASD, mean age: 5 years),12 nonautistic developmentally impaired children (DI, mean age: 4.6years), and 16 typically developing children (TD, mean age: 5.5 years)using diffusion tensor imaging tractography and tract-based spatialstatistics. Various diffusion and geometric properties were calculatedfor uncinate fasciculus (UF), inferior fronto-occipital fasciculus (IFO),arcuate fasciculus (AF), cingulum (Cg), CC, and corticospinal tract.Fractional anisotropy was lower in the right UF, right Cg and CC in ASDand DI children; in right AF in ASD children; and in bilateral IFO in DIchildren, compared with TD children. Apparent diffusion coefficientwas increased in right AF in both ASD and DI children. The ASD groupshowed shorter length of left UF and increased length, volume, anddensity of right UF; increased length and density of CC; and higherdensity of left Cg, compared with the TD group. Compared with DIgroup, ASD group had increased length, volume, and density of rightUF; higher volume of left UF; and increased length of right AF and CC.Volume of bilateral UF and right AF and fiber density of left UF werepositively associated with autistic features.
Keywords: association fiber tracts, autism spectrum disorder, children,corpus callosum, corticospinal tract, developmental impairment, diffusiontensor imaging, frontal lobe
Introduction
Autism spectrum disorders (ASDs) are neurodevelopmental
behaviorally defined conditions characterized by impaired
language and reciprocal social interaction, as well as presence
of repetitive and stereotypical behaviors. Abnormalities within
specific frontal lobe regions may play an important role in the
manifestation of the core features of autism. For example, there
is functional MRI (fMRI) evidence to suggest that the early
social deficits of autism may be related to a social cognition
network in which frontal lobe plays a crucial role (Baron-
Cohen et al. 1999). A number of structural and functional
neuroimaging studies have found abnormalities in the frontal
lobe of patients with autism; these abnormalities appear to
correlate with deficits of social cognition, executive function,
communication, and repetitive behavior (Carper and Courch-
esne 2000, 2005; Chandana et al. 2005; Chugani et al. 1999;
Ohnishi et al. 2000; Luna et al. 2002; Herbert et al. 2003, 2004;
Salmond et al. 2003; Hazlett et al. 2004). Previous studies using
positron emission tomography from our group had found
serotonergic functional abnormalities in the frontal lobe of
autistic children (Chugani et al. 1999; Chandana et al. 2005).
Specifically, decreased serotonin synthesis capacity in the
frontal cortex and an abnormal developmental trajectory for
whole-brain serotonin synthesis were observed (Chugani et al.
1998, 1999). Since serotonin acts as a neurotrophic factor early
in life and modulates axonal arborization (Vitalis and Parnavelas
2003), we hypothesized that the observed developmental
alterations in serotonin synthesis may be related to abnormal-
ities in underlying connectivity of frontal lobe.
Brain connectivity in autism has been investigated using
a number of techniques, including electroencephalography,
fMRI, and diffusion tensor imaging (DTI). Though functional
connectivity can be demonstrated by electroencephalography
and fMRI, these techniques do not directly assess the structural
integrity of the neural networks. DTI remains the only non-
invasive method, which can directly evaluate structural connec-
tivity in the brain. However, to date there are only few studies
reporting DTI abnormalities in autism (Barnea-Goraly et al. 2004;
Alexander et al. 2007; Ben Bashat et al. 2007; Keller et al. 2007;
Lee et al. 2007, 2009; Catani et al. 2008; Sundaram et al. 2008b;
Thakkar et al. 2008). In a recent DTI study of frontal lobe fibers
from our group (Sundaram et al. 2008b), abnormalities in the
diffusion (anisotropy and diffusivity) and geometric (fiber length
and fiber volume) properties of long and short association fibers
of frontal lobe were observed. The distribution of fiber length
was found to differ between the control and ASD groups. In
particular, the fiber length distribution was significantly more
negatively skewed in the ASD group compared with controls.
Histograms of fiber lengths showed a bimodal distribution with
a smaller peak corresponding to long fibers. When the fibers
corresponding to this second peak were isolated, the average
length of these long fibers was significantly higher in ASD than
in control subjects. However, that study did not isolate
individual association tracts that could explain the anatomic
location of the fiber changes within the frontal lobe. Hence, the
current study was designed to investigate the major association
tracts of the frontal lobe including the uncinate fasciculus (UF),
inferior fronto-occipital fasciculus (IFO), arcuate fasciculus (AF),
and the cingulum (Cg), as well as the corpus callosum (CC) in
young children with ASD compared with typically developing
children. In order to evaluate the specificity of the findings, that
is, findings specifically related to autistic features, we also
investigated another group of children having developmental
impairment, but no autistic features (DI). We also investigated
the corticospinal tract (CST) as a control tract, which we
hypothesized would not be affected in children with ASD or DI.
Methods and Materials
SubjectsThirty-two children with diagnoses of ASD (ASD group, mean age: 5.0
years; range: 2.5--8.9 years, 29 males and 3 females), 12 nonautistic
developmentally impaired children (DI group, mean age: 4.6 years; range:
3.0--9.0 years, 10 males and 2 females), and 16 typically developing
� The Author 2009. Published by Oxford University Press. All rights reserved.
For permissions, please e-mail: [email protected]
Cerebral Cortex Advance Access published December 17, 2009 by guest on June 11, 2016
http://cercor.oxfordjournals.org/D
ownloaded from
children (TD group, mean age: 5.5 years; range: 2.5--8.6 years, 12 males
and 4 females) underwent MRI with DTI and developmental and
behavioral assessments. All the patients were referred by the Children’s
Hospital of Michigan Neurology Clinic, and some of these children were
reported previously (Sundaram et al. 2008b).
Inclusion criteria for the ‘‘ASD group’’ included the following: 1)
a diagnosis of Autistic Disorder, Asperger’s Disorder, or Pervasive
Developmental Disorder not-otherwise-specified made by pediatric
neurologists using DSM-IV TR criteria and 2) scores above the cutoff
on the Social Communication Questionnaire (SCQ, Rutter et al. 2003)
and Autism Quotient (AQ) > 85 on the Autism Quotient of the Gilliam
Autism Rating Scales (GARS) (Gilliam 1995). We did not attempt to
distinguish between different diagnostic categories within the ASD
group, as current data does not support the notion that strictly be-
haviorally defined autism is a homogeneous disorder. Conversely, per-
sons on the spectrum in different categories may have the underlying
etiology (Bill and Geschwind 2009). Therefore, the aim of the present
study was to investigate the major association tracts in young children
with ASD compared with typically developing children and children
with developmental impairment without autistic features.
The inclusion criterion for the ‘‘DI group’’ included the following: 1)
measured functioning in at least one domain of adaptive behavior
functioning <70; 2) SCQ total score below the cutoff for ASD; and 3)
AQ < 80.
Inclusion criteria for the typically developing (TD) group included
the following: 1) measured intellectual functioning within normal limits
(>85); 2) normal neurological screening; and 3) absence of any current
or historical medical or psychiatric diagnoses. TD children were
obtained through active recruitment, and a compensation of $100 was
offered to all TD subjects for participation in the study.
Children with any of the following were excluded from the study: 1)
history of seizures; 2) focal deficits on clinical examination by a pediatric
neurologist; 3) MRI interpreted as abnormal by a pediatric neuroradiol-
ogist; 4) dysmorphic features suggestive of a genetic syndrome; 5)
history of prematurity or perinatal hypoxic-ischemic event; and 6) an
inborn error of metabolism, as autistic features can be a part of certain
metabolic disorder. The patients were routinely screened for urea cycle
disorders and disorders of amino/organic acids by testing for serum
ammonia levels, serum amino acid, and urine organic acids, respectively.
When the clinical features were suggestive of Smith-Lemli-Opitz
syndrome (aggression and screaming spells most specifically), it was
ruled out by testing 7-dehydrocholesterol-delta 7-reductase (DHCR7).
All children in the study were right-handed. The groups did not differ
on age (P = 0.24) or gender (P = 0.35). Because the scans for children
with ASD or DI were clinical MRI studies, sedation was used as
necessary by the sedation team at Children’s Hospital of Michigan.
None of the control children were sedated for the MRI. However,
younger children were scanned while sleeping, and all children were
monitored for movement during scan. If there was significant
movement, MRI was repeated or those scans were removed from the
study. All study participants were studied according to the guidelines of
the Human Investigations Committee of Wayne State University.
Written, informed consent was obtained from one of the parents or
legal guardians of the participants. The Human Investigations Commit-
tee at Wayne State University granted permission for the retrieval and
analysis of the data that have been obtained clinically for these children.
Neurobehavioral EvaluationThe results of the neuropsychological evaluation are given in Table 1.
The developmental and behavioral evaluation included assessment of
adaptive behavior functioning, screening for pervasive developmental
disorders, and quantification of autism triad symptoms. The Vineland
Adaptive Behavior Scales-2nd Edition (VABS, Sparrow et al. 1984) is
a caregiver-reported semistructured interview that yields measures of
the child’s adaptive behavior functioning in 4 domains (communica-
tion, daily living, socialization, and motor skills), as well as an overall
adaptive behavior composite. The measure is used extensively in
research studies on children with developmental disabilities and has
excellent reliability and validity (Perry and Factor 1989). The measure
was used in the present study to quantify adaptive behavior functioning
across all 4 domains in both the ASD and DI groups.
The SCQ is a caregiver-report measure based on the most sensitive
items of the Autism Diagnostic Interview-Revised (Lord et al. 1994) that
is widely used as a screening instrument for ASD. The psychometric
properties of the scale have been demonstrated to be good, particularly
supporting the SCQ as a useful instrument for discriminating ASD from
non--ASD problems (Berument et al. 1999). The SCQ was used in the
present study to verify the presence (ASD group) or absence of ASD (DI
children). For the present study, a cutoff of 15 was used to classify
children into the ASD group (Berument et al. 1999; Chandler et al. 2007).
The Gilliam Autism Rating Scale-2nd Edition (Gilliam 1995) is a 42-
item behavioral checklist that allows the quantification of frequency
and severity of the triad symptoms of autism. The GARS comprises
three subscales—stereotyped behaviors, communication, social in-
teraction, and an AQ. The AQ is a standardized score that represents
the overall assessment of autistic symptoms displayed by an individual;
scores greater than 85 are considered to indicate a ‘‘Very Likely’’
probability of autism diagnosis and indicate the presence of substantial
autistic spectrum symptoms. The psychometric properties of the scale
have been shown to be good, and the GARS is widely used in clinical
and research studies with ASD populations.
For psychometric confirmation of autism diagnosis (and to rule out
ASD in children in the DI group), the SCQ was used to ascertain
whether the child was above or below the screening cutoff for an
autism spectrum disorder and the GARS to verify the overall magnitude
of autism triad symptoms present.
Children in the TD group underwent intellectual testing with the
age-appropriate Wechsler measures. Children under the age 6 years
completed the Wechsler Preschool and Pimary Scale of Intelligence-
Third Edition, and children older than 6 years completed the Wechsler
Intelligence Scales for Children-Fourth Edition. Both measures are
widely used in both clinical and research samples, and the psychomet-
ric properties are very good (Sattler 2008).
DTI Acquisition ProtocolMRI scans were performed using a GE system with 3-Tesla magnet
(Signa GE Healthcare, Milwaukee, WI). Diffusion tensor images were
acquired in the axial plane with diffusion sensitization gradients applied
in 6 noncollinear directions and with b value of 1000 s/mm2. The same
imaging parameters were used to acquire T2-weighted (b ~ 0 s/mm2)
images to use as a reference image and to measure the signal
attenuation. All image volumes were acquired using 6 averages to
increase the signal-to-noise ratio and to reduce image artifacts. The
echo time was 79 ms, and the repetition time was about 10 s. A set of
minimum 34 axial slices of 3 mm thickness without gap was acquired
with matrix size 128*128 and reconstructed to 256*256 matrix
covering the whole brain, including the cerebellum. Field of view
was 240*240 mm2, and the approximate scanning time for the DTI
acquisition was 9 min. Double refocusing pulse was used to reduce
eddy current artifacts, and array spatial sensitivity encoding technique
was performed to further reduce the geometric distortion due to the
sequence design. As no major artifacts were observed, even at the level
of the deep brain structures, no offline correction was done.
Table 1Neuropsychological results in ASD and DI children
ASD group DI group
VABS adaptive behavior composite 72.8 ± 13.2 76 ± 10.6VABS communication 71.4 ± 13.7 72.6 ± 8.7VABS daily living skills 79.8 ± 11.9 83 ± 12.9VABS socialization 78.7 ± 14.7 84 ± 13.4VABS motor 77.7 ± 11.6 77.3 ± 12.1GARS AQ 98.4 ± 11.8 64.8 ± 7.1GARS Stereotypic Behaviors 9.9 ± 2.2 6.2 ± 1.4GARS social isolation 9.7 ± 3.4 4.8 ± 1.6GARS communicative disturbances 9.9 ± 1.6 7.1 ± 1.1
Note: ASD, autism spectrum disorder group; DI, nonautistic developmentally impaired group.
VABS is a standard score with a mean of 100 and SD of 15. GARS is a normalized standard score
with a mean of 100 and SD of 15 for the autistic population. Each of the subdomains of GARS has
a mean of 10 and SD of 3. Values are given as mean ± SD (range).
Page 2 of 11 Frontal Lobe Tracts and Corpus Callosum in ASD d Kumar et al.
by guest on June 11, 2016http://cercor.oxfordjournals.org/
Dow
nloaded from
Tractography ApproachAcquired diffusion-sensitized and reference image sets were trans-
ferred to an Intel Pentium, Microsoft windows-based operating system
for further data analysis. Tensor calculation and tractography were
performed using DTI studio software version 2.40 (www.mristudio.
org). Tractography was carried out based on Fiber Assignment by
Continuous Tracking algorithm (Mori et al. 1999). The fiber propaga-
tion was stopped at an FA threshold less than 0.2 or an angle threshold
greater than 60 degrees.
A brute force fiber tracking was initially performed for the whole
brain. Then, individual tracts were isolated by protocols similar to the
knowledge-based multiple region approach described for the associa-
tion tracts previously (Mori et al. 2002). The protocols are described in
detail below. The DTI studio software allows isolation of tracts passing
through a single region of interest (ROI, using inclusive ‘‘OR’’ operator)
or multiple ROIs (using exclusive ‘‘AND’’ operator).
Isolation of Individual Tracts
Uncinate Fasciculus
A 2-ROI approach was used to isolate the UF. The first ‘‘OR’’ ROI was
placed in the frontal lobe at the coronal level corresponding to the
posterior tip of the caudate, and a second ‘‘AND’’ ROI was placed in the
anterior temporal lobe at the same coronal level as the first ROI.
Inferior Fronto-Occipital Fasciculus
Two ROIs were used to isolate the IFO. The first ‘‘OR’’ ROI was placed
in the occipital lobe in a coronal slice just posterior to the parieto-
occipital sulcus. The second ‘‘AND’’ ROI was placed in the frontal lobe
at the location where the frontal and temporal lobes are separated.
Arcuate Fasciculus
For the AF, an ROI was placed in the coronal plane at the level of
posterior tip of putamen using the ‘‘OR’’ operator lateral to the superior
aspect of the corona radiata. A second ROI in the axial plane was then
placed using the ‘‘AND’’ operator at the level just below the Sylvian
fissure where the AF can be discretely identified.
Cingulum
The DTI color map was used to isolate Cg as it can be discretely identified
in the color map, as a green color bundle just above the CC. Multiple
sagittal ROIs around the visible green color were used to extract the Cg.
Corpus Callosum
The CC is the most prominent and easily identifiable tract on standard
DTI color maps (shown in red color because of its side-to-side
orientation). Three ROIs surrounding the CC were drawn in three
consecutive midline sagittal sections to isolate the CC. Because of lack
of identifiable boundary between frontal and nonfrontal fibers of CC, no
attempt was made to isolate the frontal fibers of the CC.
Corticospinal Tract
The CST was isolated by drawing one ROI around the posterior limb of
the internal capsule and another ROI around the CST in the brain stem
(identified as a blue color bundle in the anterior part of the brain stem)
on the axial slices.
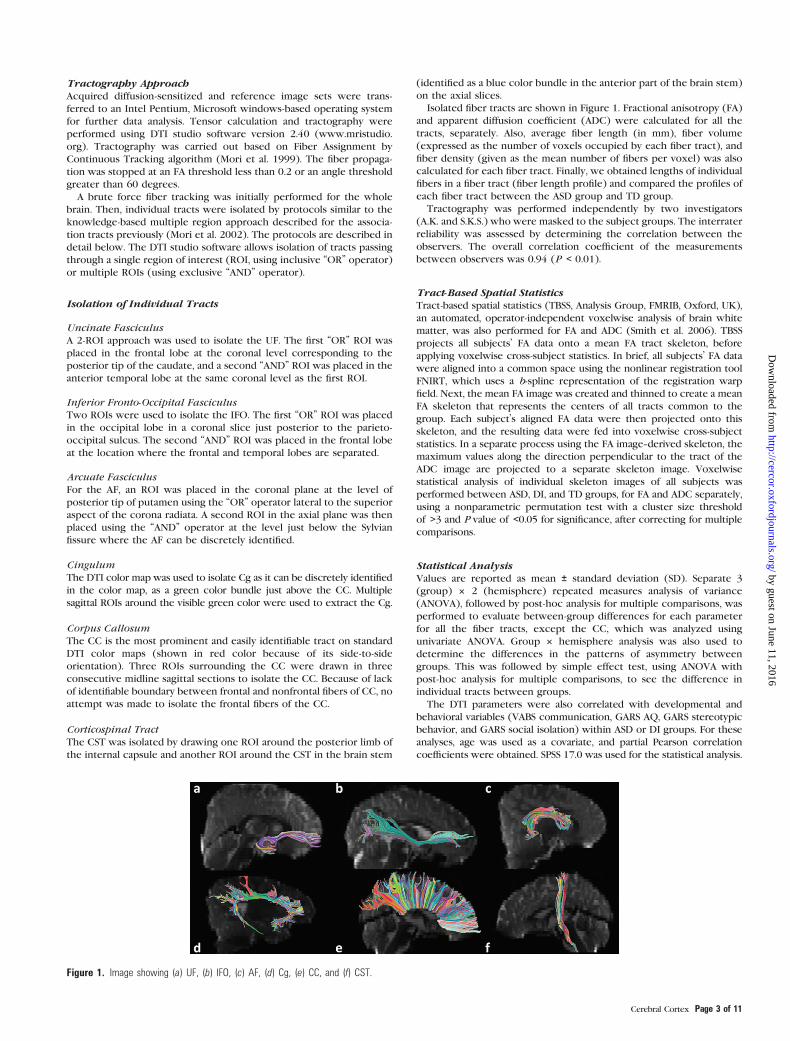
Isolated fiber tracts are shown in Figure 1. Fractional anisotropy (FA)
and apparent diffusion coefficient (ADC) were calculated for all the
tracts, separately. Also, average fiber length (in mm), fiber volume
(expressed as the number of voxels occupied by each fiber tract), and
fiber density (given as the mean number of fibers per voxel) was also
calculated for each fiber tract. Finally, we obtained lengths of individual
fibers in a fiber tract (fiber length profile) and compared the profiles of
each fiber tract between the ASD group and TD group.
Tractography was performed independently by two investigators
(A.K. and S.K.S.) who were masked to the subject groups. The interrater
reliability was assessed by determining the correlation between the
observers. The overall correlation coefficient of the measurements
between observers was 0.94 (P < 0.01).
Tract-Based Spatial StatisticsTract-based spatial statistics (TBSS, Analysis Group, FMRIB, Oxford, UK),
an automated, operator-independent voxelwise analysis of brain white
matter, was also performed for FA and ADC (Smith et al. 2006). TBSS
projects all subjects’ FA data onto a mean FA tract skeleton, before
applying voxelwise cross-subject statistics. In brief, all subjects’ FA data
were aligned into a common space using the nonlinear registration tool
FNIRT, which uses a b-spline representation of the registration warp
field. Next, the mean FA image was created and thinned to create a mean
FA skeleton that represents the centers of all tracts common to the
group. Each subject’s aligned FA data were then projected onto this
skeleton, and the resulting data were fed into voxelwise cross-subject
statistics. In a separate process using the FA image--derived skeleton, the
maximum values along the direction perpendicular to the tract of the
ADC image are projected to a separate skeleton image. Voxelwise
statistical analysis of individual skeleton images of all subjects was
performed between ASD, DI, and TD groups, for FA and ADC separately,
using a nonparametric permutation test with a cluster size threshold
of >3 and P value of <0.05 for significance, after correcting for multiple
comparisons.
Statistical AnalysisValues are reported as mean ± standard deviation (SD). Separate 3
(group) 3 2 (hemisphere) repeated measures analysis of variance
(ANOVA), followed by post-hoc analysis for multiple comparisons, was
performed to evaluate between-group differences for each parameter
for all the fiber tracts, except the CC, which was analyzed using
univariate ANOVA. Group 3 hemisphere analysis was also used to
determine the differences in the patterns of asymmetry between
groups. This was followed by simple effect test, using ANOVA with
post-hoc analysis for multiple comparisons, to see the difference in
individual tracts between groups.
The DTI parameters were also correlated with developmental and
behavioral variables (VABS communication, GARS AQ, GARS stereotypic
behavior, and GARS social isolation) within ASD or DI groups. For these
analyses, age was used as a covariate, and partial Pearson correlation
coefficients were obtained. SPSS 17.0 was used for the statistical analysis.
Figure 1. Image showing (a) UF, (b) IFO, (c) AF, (d) Cg, (e) CC, and (f) CST.
Cerebral Cortex Page 3 of 11
by guest on June 11, 2016http://cercor.oxfordjournals.org/
Dow
nloaded from
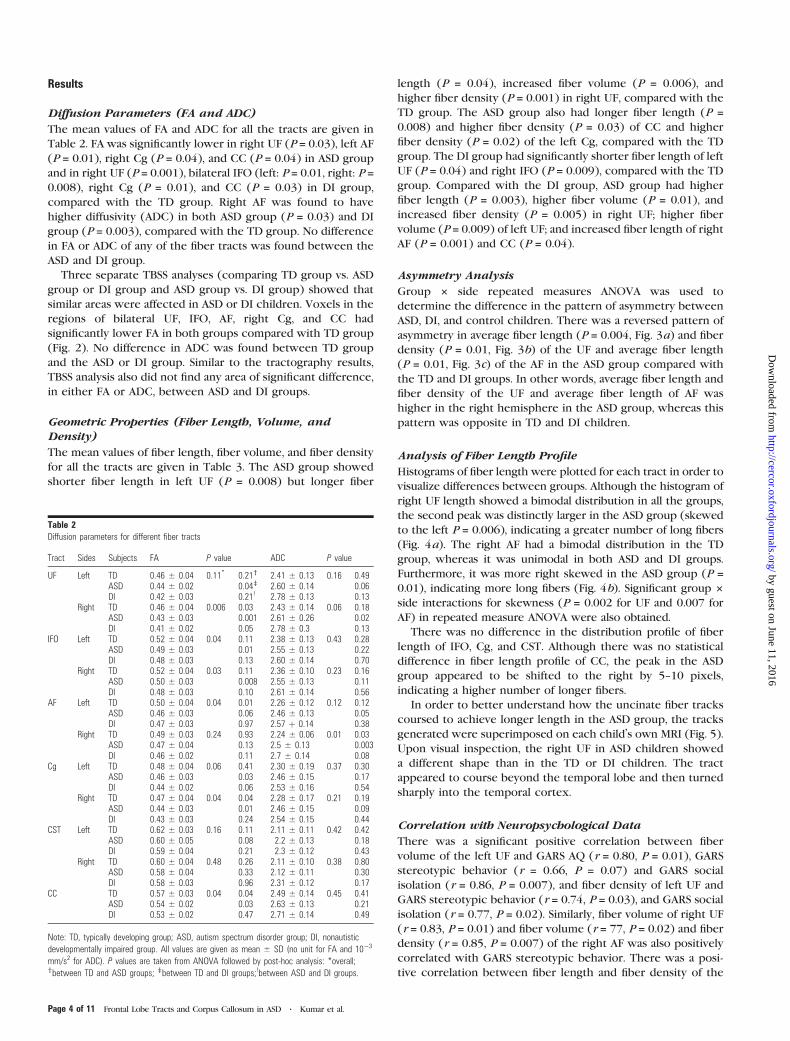
Results
Diffusion Parameters (FA and ADC)
The mean values of FA and ADC for all the tracts are given in
Table 2. FA was significantly lower in right UF (P = 0.03), left AF
(P = 0.01), right Cg (P = 0.04), and CC (P = 0.04) in ASD group
and in right UF (P = 0.001), bilateral IFO (left: P = 0.01, right: P =0.008), right Cg (P = 0.01), and CC (P = 0.03) in DI group,
compared with the TD group. Right AF was found to have
higher diffusivity (ADC) in both ASD group (P = 0.03) and DI
group (P = 0.003), compared with the TD group. No difference
in FA or ADC of any of the fiber tracts was found between the
ASD and DI group.
Three separate TBSS analyses (comparing TD group vs. ASD
group or DI group and ASD group vs. DI group) showed that
similar areas were affected in ASD or DI children. Voxels in the
regions of bilateral UF, IFO, AF, right Cg, and CC had
significantly lower FA in both groups compared with TD group
(Fig. 2). No difference in ADC was found between TD group
and the ASD or DI group. Similar to the tractography results,
TBSS analysis also did not find any area of significant difference,
in either FA or ADC, between ASD and DI groups.
Geometric Properties (Fiber Length, Volume, andDensity)
The mean values of fiber length, fiber volume, and fiber density
for all the tracts are given in Table 3. The ASD group showed
shorter fiber length in left UF (P = 0.008) but longer fiber
length (P = 0.04), increased fiber volume (P = 0.006), and
higher fiber density (P = 0.001) in right UF, compared with the
TD group. The ASD group also had longer fiber length (P =0.008) and higher fiber density (P = 0.03) of CC and higher
fiber density (P = 0.02) of the left Cg, compared with the TD
group. The DI group had significantly shorter fiber length of left
UF (P = 0.04) and right IFO (P = 0.009), compared with the TD
group. Compared with the DI group, ASD group had higher
fiber length (P = 0.003), higher fiber volume (P = 0.01), and
increased fiber density (P = 0.005) in right UF; higher fiber
volume (P = 0.009) of left UF; and increased fiber length of right
AF (P = 0.001) and CC (P = 0.04).
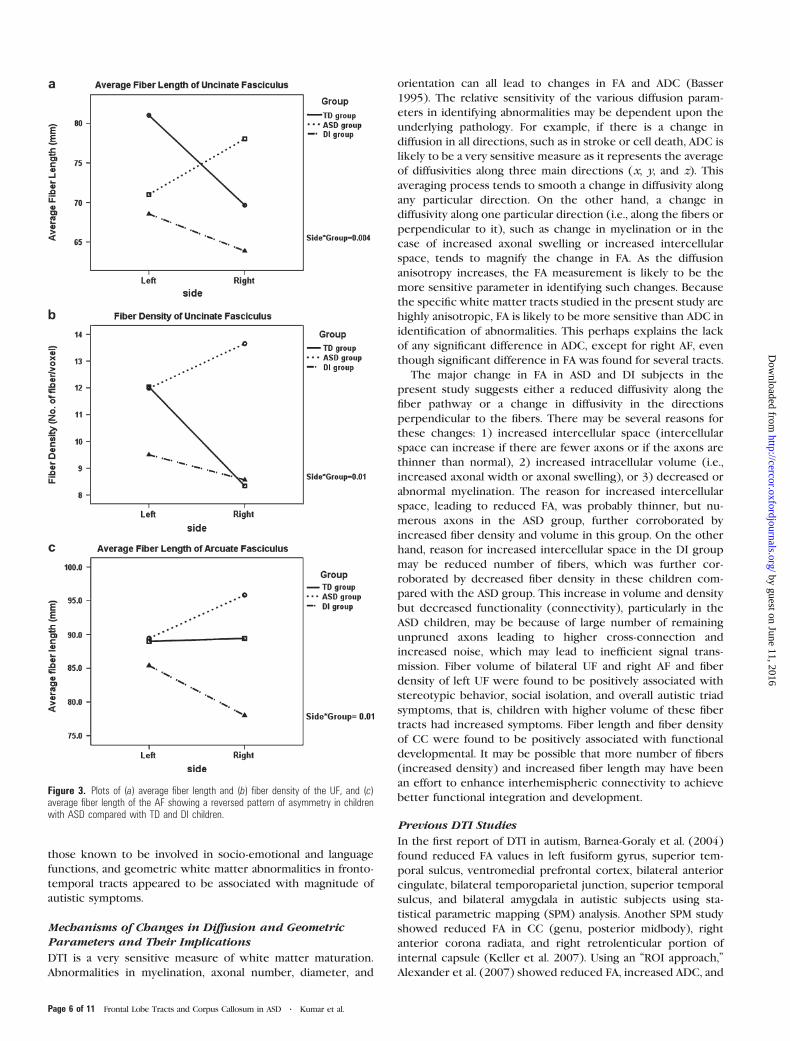
Asymmetry Analysis
Group 3 side repeated measures ANOVA was used to
determine the difference in the pattern of asymmetry between
ASD, DI, and control children. There was a reversed pattern of
asymmetry in average fiber length (P = 0.004, Fig. 3a) and fiber
density (P = 0.01, Fig. 3b) of the UF and average fiber length
(P = 0.01, Fig. 3c) of the AF in the ASD group compared with
the TD and DI groups. In other words, average fiber length and
fiber density of the UF and average fiber length of AF was
higher in the right hemisphere in the ASD group, whereas this
pattern was opposite in TD and DI children.
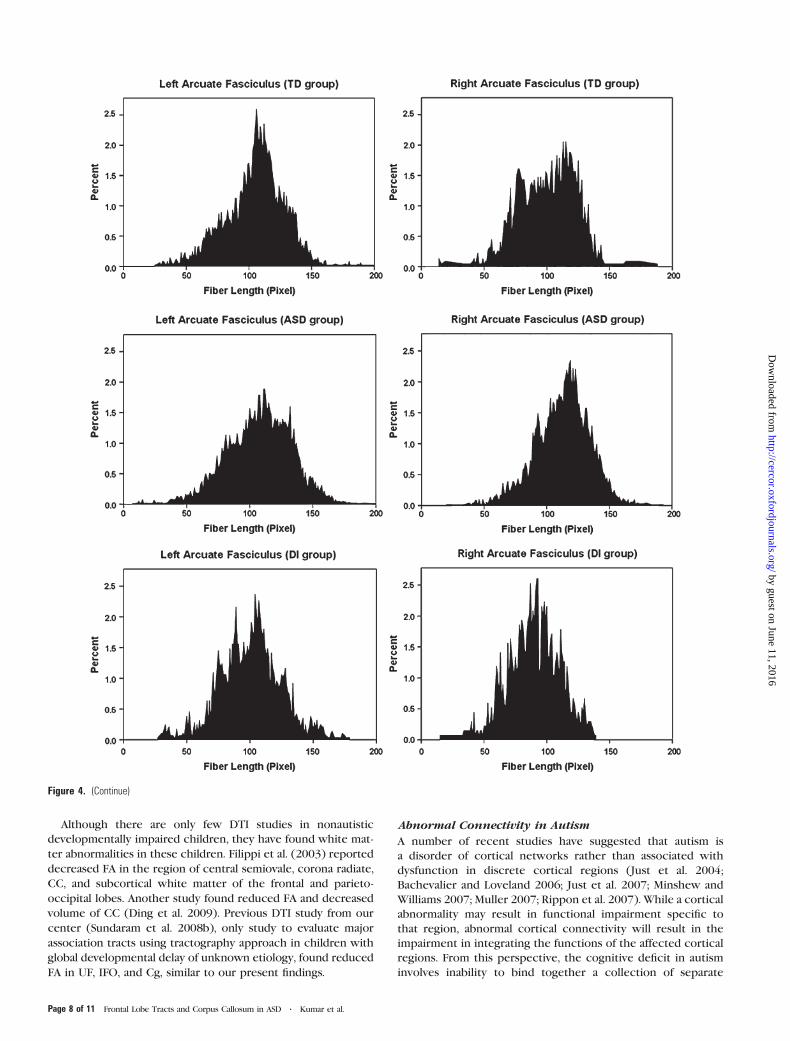
Analysis of Fiber Length Profile
Histograms of fiber length were plotted for each tract in order to
visualize differences between groups. Although the histogram of
right UF length showed a bimodal distribution in all the groups,
the second peak was distinctly larger in the ASD group (skewed
to the left P = 0.006), indicating a greater number of long fibers
(Fig. 4a). The right AF had a bimodal distribution in the TD
group, whereas it was unimodal in both ASD and DI groups.
Furthermore, it was more right skewed in the ASD group (P =0.01), indicating more long fibers (Fig. 4b). Significant group 3
side interactions for skewness (P = 0.002 for UF and 0.007 for
AF) in repeated measure ANOVA were also obtained.
There was no difference in the distribution profile of fiber
length of IFO, Cg, and CST. Although there was no statistical
difference in fiber length profile of CC, the peak in the ASD
group appeared to be shifted to the right by 5--10 pixels,
indicating a higher number of longer fibers.
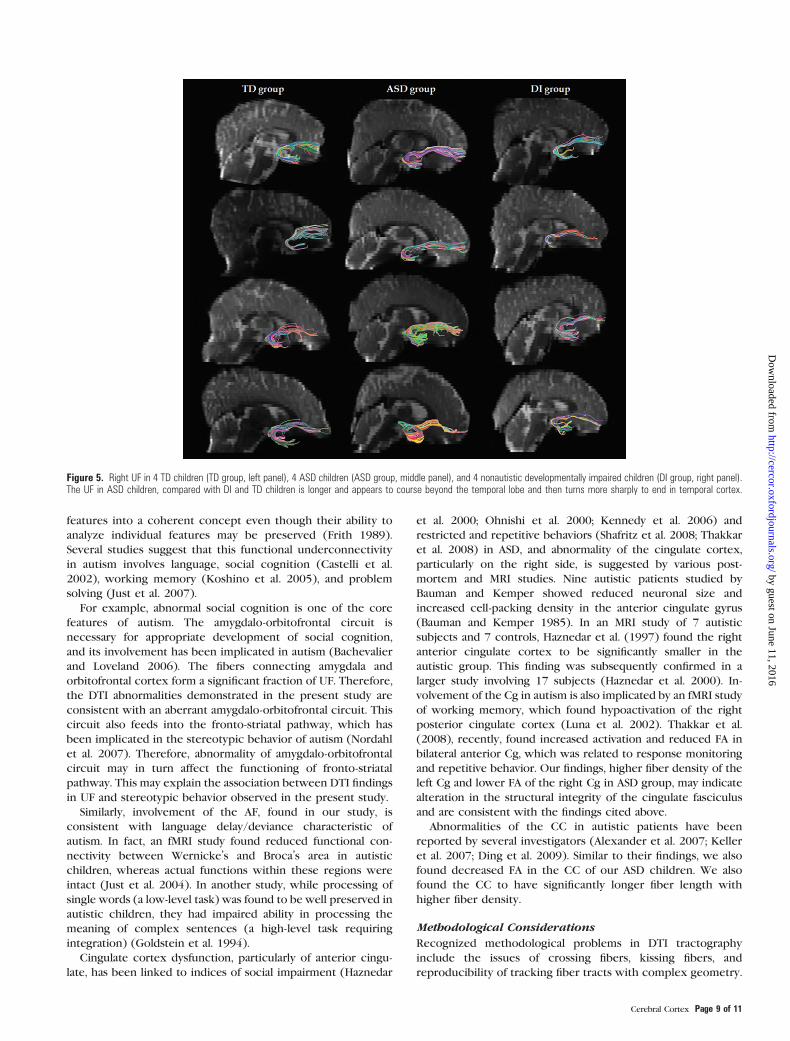
In order to better understand how the uncinate fiber tracks
coursed to achieve longer length in the ASD group, the tracks
generated were superimposed on each child’s own MRI (Fig. 5).
Upon visual inspection, the right UF in ASD children showed
a different shape than in the TD or DI children. The tract
appeared to course beyond the temporal lobe and then turned
sharply into the temporal cortex.
Correlation with Neuropsychological Data
There was a significant positive correlation between fiber
volume of the left UF and GARS AQ (r = 0.80, P = 0.01), GARS
stereotypic behavior (r = 0.66, P = 0.07) and GARS social
isolation (r = 0.86, P = 0.007), and fiber density of left UF and
GARS stereotypic behavior (r = 0.74, P = 0.03), and GARS social
isolation (r = 0.77, P = 0.02). Similarly, fiber volume of right UF
(r = 0.83, P = 0.01) and fiber volume (r = 77, P = 0.02) and fiber
density (r = 0.85, P = 0.007) of the right AF was also positively
correlated with GARS stereotypic behavior. There was a posi-
tive correlation between fiber length and fiber density of the
Table 2Diffusion parameters for different fiber tracts
Tract Sides Subjects FA P value ADC P value
UF Left TD 0.46 ± 0.04 0.11* 0.21y 2.41 ± 0.13 0.16 0.49ASD 0.44 ± 0.02 0.04z 2.60 ± 0.14 0.06DI 0.42 ± 0.03 0.21! 2.78 ± 0.13 0.13
Right TD 0.46 ± 0.04 0.006 0.03 2.43 ± 0.14 0.06 0.18ASD 0.43 ± 0.03 0.001 2.61 ± 0.26 0.02DI 0.41 ± 0.02 0.05 2.78 ± 0.3 0.13
IFO Left TD 0.52 ± 0.04 0.04 0.11 2.38 ± 0.13 0.43 0.28ASD 0.49 ± 0.03 0.01 2.55 ± 0.13 0.22DI 0.48 ± 0.03 0.13 2.60 ± 0.14 0.70
Right TD 0.52 ± 0.04 0.03 0.11 2.36 ± 0.10 0.23 0.16ASD 0.50 ± 0.03 0.008 2.55 ± 0.13 0.11DI 0.48 ± 0.03 0.10 2.61 ± 0.14 0.56
AF Left TD 0.50 ± 0.04 0.04 0.01 2.26 ± 0.12 0.12 0.12ASD 0.46 ± 0.03 0.06 2.46 ± 0.13 0.05DI 0.47 ± 0.03 0.97 2.57 þ 0.14 0.38
Right TD 0.49 ± 0.03 0.24 0.93 2.24 ± 0.06 0.01 0.03ASD 0.47 ± 0.04 0.13 2.5 ± 0.13 0.003DI 0.46 ± 0.02 0.11 2.7 ± 0.14 0.08
Cg Left TD 0.48 ± 0.04 0.06 0.41 2.30 ± 0.19 0.37 0.30ASD 0.46 ± 0.03 0.03 2.46 ± 0.15 0.17DI 0.44 ± 0.02 0.06 2.53 ± 0.16 0.54
Right TD 0.47 ± 0.04 0.04 0.04 2.28 ± 0.17 0.21 0.19ASD 0.44 ± 0.03 0.01 2.46 ± 0.15 0.09DI 0.43 ± 0.03 0.24 2.54 ± 0.15 0.44
CST Left TD 0.62 ± 0.03 0.16 0.11 2.11 ± 0.11 0.42 0.42ASD 0.60 ± 0.05 0.08 2.2 ± 0.13 0.18DI 0.59 ± 0.04 0.21 2.3 ± 0.12 0.43
Right TD 0.60 ± 0.04 0.48 0.26 2.11 ± 0.10 0.38 0.80ASD 0.58 ± 0.04 0.33 2.12 ± 0.11 0.30DI 0.58 ± 0.03 0.96 2.31 ± 0.12 0.17
CC TD 0.57 ± 0.03 0.04 0.04 2.49 ± 0.14 0.45 0.41ASD 0.54 ± 0.02 0.03 2.63 ± 0.13 0.21DI 0.53 ± 0.02 0.47 2.71 ± 0.14 0.49
Note: TD, typically developing group; ASD, autism spectrum disorder group; DI, nonautistic
developmentally impaired group. All values are given as mean ± SD (no unit for FA and 10�3
mm/s2 for ADC). P values are taken from ANOVA followed by post-hoc analysis: *overall;ybetween TD and ASD groups; zbetween TD and DI groups;!between ASD and DI groups.
Page 4 of 11 Frontal Lobe Tracts and Corpus Callosum in ASD d Kumar et al.
by guest on June 11, 2016http://cercor.oxfordjournals.org/
Dow
nloaded from

CC and VABS communication (r = 0.69, P = 0.006; r = 0.83,
P =0.001, respectively).
Discussion
The major findings of the present study are that the frontal lobe
tracts and CC show specific alterations in diffusion or
geometric properties of the tracts in children with ASD
compared with DI and TD children using both tractography
and TBSS approaches. DI children also showed differences
compared with the TD children. However, the specific tracts
involved and the form of the abnormality differed between the
ASD and DI groups. Whereas, the right UF, right Cg, right AF,
and CC had altered microstructural integrity (lower FA or
higher ADC) in both of the groups; left AF had specifically
altered microstructural integrity in ASD children and bilateral
IFO had altered microstructural integrity in DI children.
Similarly, whereas both ASD and DI children had shorter fiber
length of left UF, only ASD children had longer fiber length,
increased fiber volume, and higher fiber density in right UF;
longer fiber length with higher fiber density of CC; and higher
fiber density of the left Cg. DI children had specifically shorter
fiber length of right IFO. When directly compared with DI
group, ASD children had longer fiber length, higher fiber
volume, and higher fiber density in right UF and increased fiber
length of right AF.
The present study not only reconfirmed our finding of longer
frontal lobe association fibers in ASD children from our previous
study (Sundaram et al. 2008b), it further identified the particular
fiber tracts (i.e., right UF and right AF) responsible for this
finding. Previously reported increase in frontal white matter
volume in ASD children also appears to be associated with
specific tracts (bilateral UF), and right hemisphere seems to be
more involved. Tracts showing alterations in the ASD group are
Figure 2. Results of TBSS; Coronal T1-weighted images showing voxels with significantly lower FA value in ASD or DI children (thick red), superimposed over FA skeleton (green).
Table 3Fiber length, fiber tract volume, and fiber density for all the fiber tracts
Tract Sides Average fiber length (mm) P value Fiber volume (voxels) P value Fiber density (fiber/voxel) P value
UF Left TD 81 ± 13 0.03* 0.01y 1519 ± 465 0.02 0.15 12.0 ± 4.2 0.22 0.97ASD 70 ± 13 0.04z 1862 ± 857 0.24 11.9 ± 5.1 0.14DI 69 ± 15 0.92! 1177 ± 671 0.009 9.3 ± 4.1 0.10
Right TD 69 ± 15 0.008 0.04 1406 ± 619 0.005 0.006 8.3 ± 4.3 0.001 0.001ASD 78 ± 11 0.26 2008 ± 690 0.98 13.7 ± 5.4 0.91DI 64 ± 14 0.003 1400 ± 577 0.01 8.5 ± 4.0 0.005
IFO Left TD 127 ± 16 0.11 0.94 3783 ± 1766 0.44 0.81 21.0 ± 8.7 0.81 0.88ASD 128 ± 14 0.09 3901 ± 1556 0.36 20.6 ± 8.7 0.55DI 117 ± 17 0.04 3222 ± 1318 0.20 19 ± 8.7 0.58
Right TD 124 ± 12 0.003 0.64 4116 ± 1408 0.61 0.64 24.6 ± 8.9 0.78 0.87ASD 125 ± 11 0.009 3911 ± 1451 0.32 25.0 ± 8.9 0.64DI 112 ± 10 0.001 3573 ± 1152 0.47 23.1 ± 5.5 0.49
AF Left TD 89 ± 12 0.57 0.91 1726 ± 889 0.75 0.86 13.5 ± 6.4 0.55 0.56ASD 89 ± 11 0.41 1669 ± 1114 0.47 14.5 ± 4.7 0.64DI 85 ± 13.9 0.30 1425 ± 827 0.51 12.5 ± 6.3 0.29
Right TD 89 ± 6 0.004 0.1 1549 ± 999 0.46 0.43 13.4 ± 5.6 0.8 0.70ASD 96 ± 12 0.07 1883 ± 1064 0.69 14.6 ± 7.7 0.79DI 78 ± 4 0.001 1317 ± 751 0.27 12.4 ± 7.8 0.53
Cg Left TD 37 ± 6 0.09 0.11 3725 ± 1670 0.34 0.74 13.4 ± 3.4 0.04 0.02ASD 42 ± 11 0.72 3580 ± 1333 0.17 16.3 ± 4.4 0.80DI 36 ± 8 0.05 2986 ± 1008 0.20 13.8 ± 3.4 0.07
Right TD 37 ± 9 0.27 0.63 3989 ± 1730 0.07 0.58 13.3 ± 4.6 0.35 0.26ASD 38 ± 7 0.30 3741 ± 1415 0.03 14.8 ± 3.9 0.92DI 34 ± 6 0.10 2770 ± 822 0.04 13.2 ± 2.8 0.23
CST Left TD 95 ± 7 0.17 0.08 613 ± 234 0.16 0.25 5.7 ± 2.6 0.22 0.57ASD 100 ± 10 0.11 740 ± 347 0.11 6.2 ± 3.2 0.09DI 99 ± 9 0.87 843 ± 371 0.17 7.8 ± 3.6 0.16
Right TD 99 ± 15 0.47 0.42 551 ± 252 0.23 0.53 5.1 ± 2.9 0.28 0.62ASD 103 ± 13 0.23 610 ± 269 0.09 5.6 ± 2.8 0.12DI 106 ± 16 0.55 743 ± 335 0.20 6.9 ± 2.9 0.20
CC TD 76 ± 7 0.02 0.01 31305 ± 10438 0.15 0.96 34.1 ± 3.8 0.07 0.03ASD 83 ± 9 0.62 31422 ± 7068 0.11 37.9 ± 6.2 0.66DI 78 ± 6 0.04 26484 ± 5059 0.05 35.1 ± 5.1 0.13
Note: TD, typically developing group, ASD, autism spectrum disorder group, DI, nonautistic developmentally impaired group. All values are given as mean ± SD. P values are taken from ANOVA followed
by post-hoc analysis: *Overall; ybetween TD and ASD groups; zbetween TD and DI groups;!between ASD and DI groups.
Cerebral Cortex Page 5 of 11
by guest on June 11, 2016http://cercor.oxfordjournals.org/
Dow
nloaded from
those known to be involved in socio-emotional and language
functions, and geometric white matter abnormalities in fronto-
temporal tracts appeared to be associated with magnitude of
autistic symptoms.
Mechanisms of Changes in Diffusion and GeometricParameters and Their Implications
DTI is a very sensitive measure of white matter maturation.
Abnormalities in myelination, axonal number, diameter, and
orientation can all lead to changes in FA and ADC (Basser
1995). The relative sensitivity of the various diffusion param-
eters in identifying abnormalities may be dependent upon the
underlying pathology. For example, if there is a change in
diffusion in all directions, such as in stroke or cell death, ADC is
likely to be a very sensitive measure as it represents the average
of diffusivities along three main directions (x, y, and z). This
averaging process tends to smooth a change in diffusivity along
any particular direction. On the other hand, a change in
diffusivity along one particular direction (i.e., along the fibers or
perpendicular to it), such as change in myelination or in the
case of increased axonal swelling or increased intercellular
space, tends to magnify the change in FA. As the diffusion
anisotropy increases, the FA measurement is likely to be the
more sensitive parameter in identifying such changes. Because
the specific white matter tracts studied in the present study are
highly anisotropic, FA is likely to be more sensitive than ADC in
identification of abnormalities. This perhaps explains the lack
of any significant difference in ADC, except for right AF, even
though significant difference in FA was found for several tracts.
The major change in FA in ASD and DI subjects in the
present study suggests either a reduced diffusivity along the
fiber pathway or a change in diffusivity in the directions
perpendicular to the fibers. There may be several reasons for
these changes: 1) increased intercellular space (intercellular
space can increase if there are fewer axons or if the axons are
thinner than normal), 2) increased intracellular volume (i.e.,
increased axonal width or axonal swelling), or 3) decreased or
abnormal myelination. The reason for increased intercellular
space, leading to reduced FA, was probably thinner, but nu-
merous axons in the ASD group, further corroborated by
increased fiber density and volume in this group. On the other
hand, reason for increased intercellular space in the DI group
may be reduced number of fibers, which was further cor-
roborated by decreased fiber density in these children com-
pared with the ASD group. This increase in volume and density
but decreased functionality (connectivity), particularly in the
ASD children, may be because of large number of remaining
unpruned axons leading to higher cross-connection and
increased noise, which may lead to inefficient signal trans-
mission. Fiber volume of bilateral UF and right AF and fiber
density of left UF were found to be positively associated with
stereotypic behavior, social isolation, and overall autistic triad
symptoms, that is, children with higher volume of these fiber
tracts had increased symptoms. Fiber length and fiber density
of CC were found to be positively associated with functional
developmental. It may be possible that more number of fibers
(increased density) and increased fiber length may have been
an effort to enhance interhemispheric connectivity to achieve
better functional integration and development.
Previous DTI Studies
In the first report of DTI in autism, Barnea-Goraly et al. (2004)
found reduced FA values in left fusiform gyrus, superior tem-
poral sulcus, ventromedial prefrontal cortex, bilateral anterior
cingulate, bilateral temporoparietal junction, superior temporal
sulcus, and bilateral amygdala in autistic subjects using sta-
tistical parametric mapping (SPM) analysis. Another SPM study
showed reduced FA in CC (genu, posterior midbody), right
anterior corona radiata, and right retrolenticular portion of
internal capsule (Keller et al. 2007). Using an ‘‘ROI approach,’’
Alexander et al. (2007) showed reduced FA, increased ADC, and
Figure 3. Plots of (a) average fiber length and (b) fiber density of the UF, and (c)average fiber length of the AF showing a reversed pattern of asymmetry in childrenwith ASD compared with TD and DI children.
Page 6 of 11 Frontal Lobe Tracts and Corpus Callosum in ASD d Kumar et al.
by guest on June 11, 2016http://cercor.oxfordjournals.org/
Dow
nloaded from

increased RD in multiple regions of the CC. Lee et al. (2007),
using white matter segmentation of superior temporal gyrus
and temporal stem, found decreased FA and increased diffusivity
in the superior temporal gyrus and temporal stem in autistic
patients. Using overall white matter pixel counts and ROI
approach, Ben Bashat et al. (2007) found early and accelerated
abnormal maturation of white matter in very young children
with autism (age: 1.8--3.3 years), particularly involving frontal
lobe and Thakkar et al. (2008) evaluated anterior Cg in ASD
children and found reduced FA in bilateral anterior Cg. Catani
et al. (2008) found significantly lower FA in the short in-
tracerebellar fibers and right superior cerebellar (output)
peduncle in patients with Asperger syndrome. Recently, Ke
et al. (2009) reported decreased FA in the frontal lobe and
left temporal lobe in a group of Chinese children with high
functioning autism. These findings are consistent with our
results, which also showed reduced FA and increased diffusivity
(ADC) in different fiber tracts.
Figure 4. Histograms showing fiber length profiles of (a) UF and (b) AF in TD, ASD, and DI groups. Although the histogram of right UF length showed a bimodal distribution in allthe groups, the second peak was distinctly larger in the ASD group (skewed to the right, P5 0.006), indicating a greater number of long fibers. The right AF in TD group also hada bimodal distribution. However, it was unimodal in both ASD and DI groups, but much more right skewed in the ASD group (P 5 0.01), indicating more long fibers, in the ASDgroup.
Cerebral Cortex Page 7 of 11
by guest on June 11, 2016http://cercor.oxfordjournals.org/
Dow
nloaded from
Although there are only few DTI studies in nonautistic
developmentally impaired children, they have found white mat-
ter abnormalities in these children. Filippi et al. (2003) reported
decreased FA in the region of central semiovale, corona radiate,
CC, and subcortical white matter of the frontal and parieto-
occipital lobes. Another study found reduced FA and decreased
volume of CC (Ding et al. 2009). Previous DTI study from our
center (Sundaram et al. 2008b), only study to evaluate major
association tracts using tractography approach in children with
global developmental delay of unknown etiology, found reduced
FA in UF, IFO, and Cg, similar to our present findings.
Abnormal Connectivity in Autism
A number of recent studies have suggested that autism is
a disorder of cortical networks rather than associated with
dysfunction in discrete cortical regions (Just et al. 2004;
Bachevalier and Loveland 2006; Just et al. 2007; Minshew and
Williams 2007; Muller 2007; Rippon et al. 2007). While a cortical
abnormality may result in functional impairment specific to
that region, abnormal cortical connectivity will result in the
impairment in integrating the functions of the affected cortical
regions. From this perspective, the cognitive deficit in autism
involves inability to bind together a collection of separate
Figure 4. (Continue)
Page 8 of 11 Frontal Lobe Tracts and Corpus Callosum in ASD d Kumar et al.
by guest on June 11, 2016http://cercor.oxfordjournals.org/
Dow
nloaded from
features into a coherent concept even though their ability to
analyze individual features may be preserved (Frith 1989).
Several studies suggest that this functional underconnectivity
in autism involves language, social cognition (Castelli et al.
2002), working memory (Koshino et al. 2005), and problem
solving (Just et al. 2007).
For example, abnormal social cognition is one of the core
features of autism. The amygdalo-orbitofrontal circuit is
necessary for appropriate development of social cognition,
and its involvement has been implicated in autism (Bachevalier
and Loveland 2006). The fibers connecting amygdala and
orbitofrontal cortex form a significant fraction of UF. Therefore,
the DTI abnormalities demonstrated in the present study are
consistent with an aberrant amygdalo-orbitofrontal circuit. This
circuit also feeds into the fronto-striatal pathway, which has
been implicated in the stereotypic behavior of autism (Nordahl
et al. 2007). Therefore, abnormality of amygdalo-orbitofrontal
circuit may in turn affect the functioning of fronto-striatal
pathway. This may explain the association between DTI findings
in UF and stereotypic behavior observed in the present study.
Similarly, involvement of the AF, found in our study, is
consistent with language delay/deviance characteristic of
autism. In fact, an fMRI study found reduced functional con-
nectivity between Wernicke’s and Broca’s area in autistic
children, whereas actual functions within these regions were
intact (Just et al. 2004). In another study, while processing of
single words (a low-level task) was found to be well preserved in
autistic children, they had impaired ability in processing the
meaning of complex sentences (a high-level task requiring
integration) (Goldstein et al. 1994).
Cingulate cortex dysfunction, particularly of anterior cingu-
late, has been linked to indices of social impairment (Haznedar
et al. 2000; Ohnishi et al. 2000; Kennedy et al. 2006) and
restricted and repetitive behaviors (Shafritz et al. 2008; Thakkar
et al. 2008) in ASD, and abnormality of the cingulate cortex,
particularly on the right side, is suggested by various post-
mortem and MRI studies. Nine autistic patients studied by
Bauman and Kemper showed reduced neuronal size and
increased cell-packing density in the anterior cingulate gyrus
(Bauman and Kemper 1985). In an MRI study of 7 autistic
subjects and 7 controls, Haznedar et al. (1997) found the right
anterior cingulate cortex to be significantly smaller in the
autistic group. This finding was subsequently confirmed in a
larger study involving 17 subjects (Haznedar et al. 2000). In-
volvement of the Cg in autism is also implicated by an fMRI study
of working memory, which found hypoactivation of the right
posterior cingulate cortex (Luna et al. 2002). Thakkar et al.
(2008), recently, found increased activation and reduced FA in
bilateral anterior Cg, which was related to response monitoring
and repetitive behavior. Our findings, higher fiber density of the
left Cg and lower FA of the right Cg in ASD group, may indicate
alteration in the structural integrity of the cingulate fasciculus
and are consistent with the findings cited above.
Abnormalities of the CC in autistic patients have been
reported by several investigators (Alexander et al. 2007; Keller
et al. 2007; Ding et al. 2009). Similar to their findings, we also
found decreased FA in the CC of our ASD children. We also
found the CC to have significantly longer fiber length with
higher fiber density.
Methodological Considerations
Recognized methodological problems in DTI tractography
include the issues of crossing fibers, kissing fibers, and
reproducibility of tracking fiber tracts with complex geometry.
Figure 5. Right UF in 4 TD children (TD group, left panel), 4 ASD children (ASD group, middle panel), and 4 nonautistic developmentally impaired children (DI group, right panel).The UF in ASD children, compared with DI and TD children is longer and appears to course beyond the temporal lobe and then turns more sharply to end in temporal cortex.
Cerebral Cortex Page 9 of 11
by guest on June 11, 2016http://cercor.oxfordjournals.org/
Dow
nloaded from

For example, the most medial fibers of IFO lie adjacent to the
most lateral fibers of UF, in the inferior and anterior frontal
white matter. Even though a small fraction of fibers may ‘‘kiss’’
or ‘‘cross’’ in their anterior end, their subsequent trajectory is
distinctly different to allow adequate separation. Further, we
found that the white matter region where these fibers may kiss
or cross was homogeneous with respect to the DTI parameter-
s—FA and ADC (in case of significant kissing or crossing there
should have been marked change in these parameters from one
voxel to another), and, therefore, this issue is unlikely to impact
our results. The reproducibility of tracking algorithms to
identify specific tracts depends primarily on the type of tracts.
For example, it is far less reproducible to track some of the thin
limbic tracts (such as stria terminalis) that approach the limit of
DTI resolution compared with major association and pro-
jection tracts (Mori et al. 2005). The reproducibility of tracking
association tracts on DTI has been previously validated (Mori
et al. 2002; Sundaram et al. 2008a).
Use of TBSS further confirmed and strengthened our
findings. TBSS is an operator independent voxel-based white
matter analysis that reduces the total number of voxel
comparisons and avoids the spatial smoothing used in other
voxel-based techniques. We found that the regions, shown by
TBSS to be significantly different in ASD or DI group (reduced
FA) as compared with control group, were essentially the same
as found with tractography approach. Similarly, our TBSS
results were consistent with those reported by some of the
previous investigators using SPM or other voxel-based ap-
proach (Barnea-Goraly et al. 2004; Ben Bashat et al. 2007; Keller
et al. 2007; Lee et al. 2009).
Notes
Conflict of Interest : None declared.
Address correspondence to Ajay Kumar, MD, PhD, DNB, Assistant
Professor, Department of Pediatrics and Neurology, Children’s Hospital
of Michigan, Detroit Medical Center, Wayne State University, School of
Medicine, Detroit, MI 48201, USA. Email: [email protected].
References
Alexander AL, Lee JE, Lazar M, Boudos R, Dubray MB, Oakes TR,
Miller JN, Lu J, Jeong EK, McMahon WM, et al. 2007. Diffusion tensor
imaging of the corpus callosum in Autism. Neuroimage. 34:61--73.
Bachevalier J, Loveland KA. 2006. The orbitofrontal-amygdala circuit
and self-regulation of social-emotional behavior in autism. Neurosci
Biobehav Rev. 30:97--117.
Barnea-Goraly N, Kwon H, Menon V, Eliez S, Lotspeich L, Reiss AL. 2004.
White matter structure in autism: preliminary evidence from
diffusion tensor imaging. Biol Psychiatry. 55:323--326.
Baron-Cohen S, Ring HA, Wheelwright S, Bullmore ET, Brammer MJ,
Simmons A, Williams SC. 1999. Social intelligence in the normal and
autistic brain: an fMRI study. Eur J Neurosci. 11:1891--1898.
Basser PJ. 1995. Inferring microstructural features and the physiological
state of tissues from diffusion-weighted images. NMR Biomed.
8:333--344.
Bauman M, Kemper TL. 1985. Histoanatomic observations of the brain
in early infantile autism. Neurology. 35:866--874.
Ben Bashat D, Kronfeld-Duenias V, Zachor DA, Ekstein PM, Hendler T,
Tarrasch R, Even A, Levy Y, Ben Sira L. 2007. Accelerated maturation
of white matter in young children with autism: a high b value DWI
study. Neuroimage. 37:40--47.
Berument SK, Rutter M, Lord C, Pickles A, Bailey A. 1999. Autism
screening questionnaire: diagnostic validity. Br J Psychiatry.
175:444--451.
Bill BR, Geschwind DH. 2009. Genetic advances in autism: heteroge-
neity and convergence on shared pathways. Curr Opin Genet Dev.
19:271--278.
Carper RA, Courchesne E. 2000. Inverse correlation between frontal
lobe and cerebellum sizes in children with autism. Brain. 123(Pt
4):836--844.
Carper RA, Courchesne E. 2005. Localized enlargement of the frontal
cortex in early autism. Biol Psychiatry. 57:126--133.
Castelli F, Frith C, Happe F, Frith U. 2002. Autism, Asperger syndrome
and brain mechanisms for the attribution of mental states to
animated shapes. Brain. 125:1839--1849.
Catani M, Jones DK, Daly E, Embiricos N, Deeley Q, Pugliese L, Curran S,
Robertson D, Murphy DG. 2008. Altered cerebellar feedback
projections in Asperger syndrome. Neuroimage. 41:1184--1191.
Chandana SR, Behen ME, Juhasz C, Muzik O, Rothermel RD, Mangner TJ,
Chakraborty PK, Chugani HT, Chugani DC. 2005. Significance of
abnormalities in developmental trajectory and asymmetry of cortical
serotonin synthesis in autism. Int J Dev Neurosci. 23:171--182.
Chandler S, Charman T, Baird G, Simonoff E, Loucas T, Meldrum D,
Scott M, Pickles A. 2007. Validation of the social communication
questionnaire in a population cohort of children with autism
spectrum disorders. J Am Acad Child Adolesc Psychiatry.
46:1324--1332.
Chugani DC, Muzik O, Behen M, Rothermel R, Janisse JJ, Lee J,
Chugani HT. 1999. Developmental changes in brain serotonin
synthesis capacity in autistic and nonautistic children. Ann Neurol.
45:287--295.
Chugani DC, Muzik O, Chakraborty P, Mangner T, Chugani HT. 1998.
Human brain serotonin synthesis capacity measured in vivo with
alpha-[C-11]methyl-L-tryptophan. Synapse (New York. NY 28:
33--43.
Ding XQ, Sun Y, Kruse B, Illies T, Zeumer H, Fiehler J, Lanfermann H.
2009. Microstructural callosal abnormalities in normal-appearing
brain of children with developmental delay detected with diffusion
tensor imaging. Eur Radiol. 19:1537--1543.
Filippi CG, Lin DD, Tsiouris AJ, Watts R, Packard AM, Heier LA, Ulug AM.
2003. Diffusion-tensor MR imaging in children with developmental
delay: preliminary findings. Radiology. 229:44--50.
Frith U. 1989. Autism: explaining the enigma. Oxford: Blackwell.
Gilliam J. 1995. Gilliam Autism Rating Scales. Austin, TX: Pro-Ed.
Goldstein G, Minshew NJ, Siegel DJ. 1994. Age differences in academic
achievement in high-functioning autistic individuals. J Clin Exp
Neuropsychol. 16:671--680.
Hazlett EA, Buchsbaum MS, Hsieh P, Haznedar MM, Platholi J,
LiCalzi EM, Cartwright C, Hollander E. 2004. Regional glucose
metabolism within cortical Brodmann areas in healthy individuals
and autistic patients. Neuropsychobiology. 49:115--125.
Haznedar MM, Buchsbaum MS, Metzger M, Solimando A, Spiegel-
Cohen J, Hollander E. 1997. Anterior cingulate gyrus volume and
glucose metabolism in autistic disorder. Am J Psychiatry.
154:1047--1050.
Haznedar MM, Buchsbaum MS, Wei TC, Hof PR, Cartwright C,
Bienstock CA, Hollander E. 2000. Limbic circuitry in patients with
autism spectrum disorders studied with positron emission tomog-
raphy and magnetic resonance imaging. Am J Psychiatry.
157:1994--2001.
Herbert MR, Ziegler DA, Deutsch CK, O’Brien LM, Lange N,
Bakardjiev A, Hodgson J, Adrien KT, Steele S, Makris N, et al. 2003.
Dissociations of cerebral cortex, subcortical and cerebral white
matter volumes in autistic boys. Brain. 126:1182--1192.
Herbert MR, Ziegler DA, Makris N, Filipek PA, Kemper TL,
Normandin JJ, Sanders HA, Kennedy DN, Caviness VS, Jr. 2004.
Localization of white matter volume increase in autism and
developmental language disorder. Ann Neurol. 55:530--540.
Just MA, Cherkassky VL, Keller TA, Kana RK, Minshew NJ. 2007.
Functional and anatomical cortical underconnectivity in autism:
evidence from an FMRI study of an executive function task and
corpus callosum morphometry. Cereb Cortex. 17:951--961.
Just MA, Cherkassky VL, Keller TA, Minshew NJ. 2004. Cortical
activation and synchronization during sentence comprehension in
high-functioning autism: evidence of underconnectivity. Brain.
127:1811--1821.
Ke X, Tang T, Hong S, Hang Y, Zou B, Li H, Zhou Z, Ruan Z, Lu Z, Tao G,
et al. 2009. White matter impairments in autism, evidence from
Page 10 of 11 Frontal Lobe Tracts and Corpus Callosum in ASD d Kumar et al.
by guest on June 11, 2016http://cercor.oxfordjournals.org/
Dow
nloaded from
voxel-based morphometry and diffusion tensor imaging. Brain Res.
1265:171--177.
Keller TA, Kana RK, Just MA. 2007. A developmental study of the
structural integrity of white matter in autism. Neuroreport.
18:23--27.
Kennedy DP, Redcay E, Courchesne E. 2006. Failing to deactivate:
resting functional abnormalities in autism. Proc Natl Acad Sci USA.
103:8275--8280.
Koshino H, Carpenter PA, Minshew NJ, Cherkassky VL, Keller TA,
Just MA. 2005. Functional connectivity in an fMRI working memory
task in high-functioning autism. Neuroimage. 24:810--821.
Lee JE, Bigler ED, Alexander AL, Lazar M, DuBray MB, Chung MK,
Johnson M, Morgan J, Miller JN, McMahon WM, et al. 2007. Diffusion
tensor imaging of white matter in the superior temporal gyrus and
temporal stem in autism. Neurosci Lett. 424:127--132.
Lee JE, Chung MK, Lazar M, DuBray MB, Kim J, Bigler ED, Lainhart JE,
Alexander AL. 2009. A study of diffusion tensor imaging by tissue-
specific, smoothing-compensated voxel-based analysis. Neuroimage.
44:870--883.
Lord C, Rutter M, Le Couteur A. 1994. Autism Diagnostic Interview-
Revised: a revised version of a diagnostic interview for caregivers of
individuals with possible pervasive developmental disorders. J
Autism Dev Disord. 24:659--685.
Luna B, Minshew NJ, Garver KE, Lazar NA, Thulborn KR, Eddy WF,
Sweeney JA. 2002. Neocortical system abnormalities in autism: an
fMRI study of spatial working memory. Neurology. 59:834--840.
Minshew NJ, Williams DL. 2007. The new neurobiology of autism:
cortex, connectivity, and neuronal organization. Arch Neurol.
64:945--950.
Mori S, Crain BJ, Chacko VP, van Zijl PC. 1999. Three-dimensional
tracking of axonal projections in the brain by magnetic resonance
imaging. Ann Neurol. 45:265--269.
Mori S, Kaufmann WE, Davatzikos C, Stieltjes B, Amodei L,
Fredericksen K, Pearlson GD, Melhem ER, Solaiyappan M,
Raymond GV, et al. 2002. Imaging cortical association tracts in the
human brain using diffusion-tensor-based axonal tracking. Magn
Reson Med. 47:215--223.
Mori S, Wakana S, Nagae-Poetsher LM, Van Zijl PC. 2005. MRI atlas of
human white matter. Amsterdam, The Netherlands: Elsevier.
Muller RA. 2007. The study of autism as a distributed disorder. Ment
Retard Dev Disabil Res Rev. 13:85--95.
Nordahl CW, Dierker D, Mostafavi I, Schumann CM, Rivera SM, Amaral DG,
Van Essen DC. 2007. Cortical folding abnormalities in autism revealed
by surface-based morphometry. J Neurosci. 27:11725--11735.
Ohnishi T, Matsuda H, Hashimoto T, Kunihiro T, Nishikawa M, Uema T,
Sasaki M. 2000. Abnormal regional cerebral blood flow in childhood
autism. Brain. 123(Pt 9):1838--1844.
Perry A, Factor DC. 1989. Psychometric validity and clinical usefulness
of the Vineland Adaptive Behavior Scales and the AAMD Adaptive
Behavior Scale for an autistic sample. J Autism Dev Disord. 19:41--55.
Rippon G, Brock J, Brown C, Boucher J. 2007. Disordered connectivity
in the autistic brain: challenges for the ‘‘new psychophysiology’’. Int
J Psychophysiol. 63:164--172.
Rutter M, Bailey A, Lord C. 2003. Social Communication Questionnaire
(SCQ). Los Angeles, CA: Western Psychological Services.
Salmond CH, de Haan M, Friston KJ, Gadian DG, Vargha-Khadem F.
2003. Investigating individual differences in brain abnormalities in
autism. Philos Trans R Soc Lond B Biol Sci. 358:405--413.
Sattler JM. 2008. Assessment of Children. La Mesa, CA: Jerome M. Sattler,
Publisher.
Shafritz KM, Dichter GS, Baranek GT, Belger A. 2008. The neural
circuitry mediating shifts in behavioral response and cognitive set in
autism. Biol Psychiatry. 63:974--980.
Smith SM, Jenkinson M, Johansen-Berg H, Rueckert D, Nichols TE,
Mackay CE, Watkins KE, Ciccarelli O, Cader MZ, Matthews PM, et al.
2006. Tract-based spatial statistics: voxelwise analysis of multi-
subject diffusion data. Neuroimage. 31:1487--1505.
Sparrow SS, Balla DA, Cicchetti DV, Doll EA. 1984. Vineland Adaptive
Behavior Scales. Circle Pines, MN: American Guidance Service.
Sundaram S, Sivaswamy L, Makki M, Behen M, Chugani H. 2008a.
Absence of arcuate fasciculus in children with global developmental
delay of unknown etiology: a diffusion tensor imaging study. J
Pediatrics. 152:250--255.
Sundaram SK, Kumar A, Makki MI, Behen ME, Chugani HT, Chugani DC.
2008b. Diffusion tensor imaging of frontal lobe in autism spectrum
disorder. Cereb Cortex. 18:2659--2665.
Thakkar KN, Polli FE, Joseph RM, Tuch DS, Hadjikhani N, Barton JJ,
Manoach DS. 2008. Response monitoring, repetitive behaviour and
anterior cingulate abnormalities in autism spectrum disorders
(ASD). Brain. 131:2464--2478.
Vitalis T, Parnavelas JG. 2003. The role of serotonin in early cortical
development. Dev Neurosci. 25:245--256.
Cerebral Cortex Page 11 of 11
by guest on June 11, 2016http://cercor.oxfordjournals.org/
Dow
nloaded from