Almeida_Thesis_Final.pdf - Repositório da Universidade ...
268
Nuno Felipe Alves de Almeida Dissertation presented to obtain the Ph.D degree in Biology Instituto de Tecnologia Química e Biológica António Xavier | Universidade Nova de Lisboa Oeiras, July, 2015 Comparative mapping of disease resistance genes in Lathyrus spp. using model legume genetic information
-
Upload
khangminh22 -
Category
Documents
-
view
1 -
download
0
Transcript of Almeida_Thesis_Final.pdf - Repositório da Universidade ...

Nuno Felipe Alves de Almeida
Dissertation presented to obtain the Ph.D degree in Biology
Instituto de Tecnologia Química e Biológica António Xavier | Universidade Nova de Lisboa
Oeiras, July, 2015
Comparative mapping of
disease resistance genes in
Lathyrus spp. using model
legume genetic information


iii
PhD Supervisors
Maria Carlota Vaz Patto, PhD
Diego Rubiales, PhD
The work presented in this thesis was performed mainly at:
Under the supervision of Maria Carlota Vaz Patto, PhD
Under the supervision of Diego Rubiales, PhD
The student, Nuno Felipe Alves de Almeida received financial support from Fundação para a Ciência e Tecnologia and Fundo Social Europeu in the scope of Quadro Comunitário de Apoio through the PhD Fellowship SFRH/BD/44357/2008.

ISBN: 978-989-20-5841-2

v
Table of Contents
LIST OF FIGURES .............................................................................. XIII
LIST OF TABLES ................................................................................ XV
LIST OF ADDITIONAL FILES .............................................................. XVII
ACKNOWLEDGMENTS / AGRADECIMENTOS ......................................... XIX
RESUMO .......................................................................................... XXI
ABSTRACT ...................................................................................... XXV
LIST OF ABBREVIATIONS ................................................................. XXIX
CHAPTER 1 - GENERAL INTRODUCTION ................................................. 1
1.1. Introduction ........................................................................ 3 1.2. Lathyrus sativus and L. cicera: Origin and systematic ... 4 1.3. Lathyrus sativus varietal groups ...................................... 6 1.4. Genetic resources and utilization ..................................... 7 1.5. Major breeding achievements ........................................... 9 1.6. Specific goals in current breeding .................................. 10 1.7. Biotic stresses.................................................................. 11
1.7.1. Rust ........................................................................ 12
1.7.2. Powdery mildew ...................................................... 13
1.7.3. Ascochyta blight ...................................................... 13
1.8. Breeding methods and specific techniques ................... 15 1.9. Integration of new biotechnologies in breeding
programmes ..................................................................... 17

Table of Contents ___________________________________________________________________
vi
1.10. Objectives ......................................................................... 20 1.11. Acknowledgments ........................................................... 21 1.12. References ........................................................................ 21
CHAPTER 2 - TRANSFERABILITY OF MOLECULAR MARKERS FROM MAJOR
LEGUMES TO LATHYRUS SPP. FOR THEIR APPLICATION IN
MAPPING AND DIVERSITY STUDIES ......................................... 31
2.1. Abstract ............................................................................ 33 2.2. Introduction ...................................................................... 34 2.3. Methods ............................................................................ 36
2.3.1. Plant Material and DNA isolation ................................... 36
2.3.2. Microsatellite markers .................................................... 38
2.3.3. Intron-Targeted Amplified Polymorphic markers,
Defence-Related Genes and Resistance Gene
Analogues ..................................................................... 39
2.3.4. Sequencing ................................................................... 40
2.3.5. Segregation and diversity studies .................................. 40
2.3.6. Cleaved Amplified Polymorphic Sequence and derived
Cleaved Amplified Polymorphic Sequence markers for
mapping ......................................................................... 41
2.4. Results and discussion ................................................... 42 2.4.1. Transferability of microsatellites to Lathyrus spp. ........... 44
2.4.2. Transferability of Intron-Targeted Amplified Polymorphic
markers, Defence-Related and Resistance Gene
Analogues to Lathyrus spp. ........................................... 50
2.4.3. Usefulness of cross amplified markers on Lathyrus spp.
linkage mapping ............................................................ 52

Table of Contents ___________________________________________________________________
vii
2.4.4. Usefulness of cross amplified markers on Lathyrus spp.
diversity studies ............................................................. 54
2.5. Conclusions ..................................................................... 59
2.6. Acknowledgements ......................................................... 60
2.7. References ........................................................................ 60
CHAPTER 3 - ALLELIC DIVERSITY IN THE TRANSCRIPTOMES OF
CONTRASTING RUST-INFECTED GENOTYPES OF LATHYRUS SATIVUS, A
LASTING RESOURCE FOR SMART BREEDING ...................................... 69
3.1. Abstract ............................................................................ 71 3.2. Introduction ...................................................................... 72 3.3. Material and methods ...................................................... 76
3.3.1. Plant and fungal material, inoculation and RNA
isolation ......................................................................... 76
3.3.2. Sequencing and quantification ....................................... 77
3.3.3. SNP detection ................................................................ 79
3.3.4. EST-SSR development and genotyping ......................... 79
3.3.5. Quantitative RT-PCR assay ........................................... 80
3.3.6. Contig annotation and data analysis .............................. 81
3.3.7. Availability of supporting data ........................................ 81
3.4. Results .............................................................................. 82 3.4.1. Contigs from the RNA-Seq transcriptomes of resistant
and susceptible L. sativus genotypes ............................ 82
3.4.2. RNA-Seq validation by quantitative RT-PCR assay ....... 83
3.4.3. Differential gene expression in resistant and susceptible
L. sativus genotypes during infection ............................. 84
3.4.4. Annotation ..................................................................... 87
3.4.5. Biotic stress related proteins .......................................... 92

Table of Contents ___________________________________________________________________
viii
3.4.6. SNPs in resistance pathways ........................................ 96
3.4.7. EST-SRR development ................................................. 96
3.5. Discussion ........................................................................ 98 3.6. Conclusions ................................................................... 105 3.7. Acknowledgments ......................................................... 106 3.8. References ...................................................................... 106
CHAPTER 4 - LATHYRUS SATIVUS TRANSCRIPTOME RESISTANCE
RESPONSE TO ASCOCHYTA LATHYRI INVESTIGATED BY
DEEPSUPERSAGE ANALYSIS ........................................................ 115
4.1. Abstract .......................................................................... 117 4.2. Introduction .................................................................... 118 4.3. Material and methods .................................................... 120
4.3.1.1. Plant material and inoculation ...................................... 120
4.3.2. RNA extraction and deepSuperSAGE library
construction ................................................................. 120
4.3.3. Data analysis and annotation ....................................... 121
4.3.4. Quantitative RT-PCR assays ....................................... 122
4.3.5. UniTag assignment to functional categories ................ 123
4.4. Results ............................................................................ 125 4.4.1. DeepSuperSAGE library characterization .................... 125
4.4.2. DeepSuperSAGE validation by quantitative RT-PCR
assay ........................................................................... 125
4.4.3. Annotation of differentially expressed genes in the
resistant L. sativus genotype after A. lathyri
infection ....................................................................... 126
4.5. Discussion ...................................................................... 128 4.5.1. Pathogen perception .................................................... 131
Table of Contents ___________________________________________________________________
ix
4.5.2. Hormone signaling ....................................................... 132
4.5.3. Cell wall fortification ..................................................... 134
4.5.4. Antimicrobial activity .................................................... 137
4.5.5. Reactive oxygen species ............................................. 138
4.5.6. Detoxification ............................................................... 138
4.6. Conclusions ................................................................... 139 4.7. Acknowledgments ......................................................... 140 4.8. References ...................................................................... 140
CHAPTER 5 - DIFFERENTIAL EXPRESSION AND ALLELIC DIVERSITY
IN LATHYRUS CICERA / RUST INFECTION, A COMPREHENSIVE ANALYSIS ..................................................................................... 147
5.1. Abstract .......................................................................... 149 5.2. Introduction .................................................................... 149 5.3. Material and methods .................................................... 152
5.3.1.1. Plant material, inoculation and DNA and RNA
isolation ....................................................................... 152
5.3.2. RNA sequencing and transcript quantification.............. 153
5.3.3. Contig annotation and data analysis ............................ 155
5.3.4. RNA-Seq validation by quantitative RT-PCR
assay ........................................................................... 156
5.3.5. SNP detection .............................................................. 157
5.3.6. Allele-specific expression analysis by dual labelled
probe RT-qPCR assays ............................................... 157
5.3.7. EST-SSR development and genotyping ....................... 158
5.4. Results ............................................................................ 158 5.4.1. RNA-Seq transcriptomes of analysed
L. cicera genotypes...................................................... 158
5.4.2. Differential gene expression in partially resistant and
susceptible L. cicera genotypes to rust infection .......... 159

Table of Contents ___________________________________________________________________
x
5.4.3. RNA-Seq validation by quantitative RT-PCR
assay ........................................................................... 161
5.4.4. Annotation of L. cicera contigs ..................................... 162
5.4.5. SNP identification in resistance pathways .................... 166
5.4.6. Allele-specific expression validation by dual
probe RT-qPCR assays ............................................... 166
5.4.7. EST-SRR markers development .................................. 168
5.5. Discussion ...................................................................... 168 5.6. Conclusions ................................................................... 178 5.7. Acknowledgments ......................................................... 178 5.8. References ...................................................................... 179
CHAPTER 6 - GENETIC BASIS OF PARTIAL RESISTANCE TO RUST AND
POWDERY MILDEW IN LATHYRUS CICERA - QTL MAPPING AND SYNTENY STUDIES ......................................................................... 185
6.1. Abstract .......................................................................... 187 6.2. Introduction .................................................................... 187 6.3. Material and methods .................................................... 191
6.3.1. Plant material ............................................................... 191
6.3.2. Disease reaction evaluation ......................................... 191
6.3.2.1. Rust evaluation ................................................... 191
6.3.2.2. Powdery mildew evaluation ................................ 192
6.3.3. DNA isolation and molecular markers screening .......... 193
6.3.4. Map construction ......................................................... 194
6.3.5. Comparison with M. truncatula genome ....................... 194
6.3.6. Phenotypic data analysis ............................................. 195
6.3.7. QTL mapping ............................................................... 195
6.4. Results ............................................................................ 196

Table of Contents ___________________________________________________________________
xi
6.4.1. Disease evaluation under controlled conditions ........... 196
6.4.2. Linkage map construction ............................................ 198
6.4.3. Macrosynteny between L. cicera LGs and
M. truncatula chromosomes ......................................... 200
6.4.4. QTL mapping for rust and powdery mildew
resistance .................................................................... 202
6.4.5. Discovery of potential candidate genes in the
identified QTLs ............................................................ 203
6.5. Discussion ...................................................................... 206 6.6. Acknowledgments ......................................................... 210 6.7. References ...................................................................... 210
CHAPTER 7 - GENERAL DISCUSSION .............................................. 217
7.1. Project overview ............................................................. 219 7.2. Molecular marker development ..................................... 221 7.3. Development of the first Lathyrus cicera linkage
map ................................................................................. 223 7.4. Lathyrus spp. response to Uromyces pisi
inoculation ...................................................................... 224 7.5. Powdery mildew resistance in Lathyrus cicera ........... 227 7.6. Lathyrus sativus response to Ascochyta lathyri
inoculation ...................................................................... 228 7.7. Future research and practical applications .................. 229 7.8. References ...................................................................... 231


xiii
List of Figures
Figure 2.1 Numbers and percentages of gSSRs and EST-SSRs
from lentil, pea and faba bean amplified in Lathyrus spp.. ............. 44
Figure 2.2 Numbers and percentages of ITAPs and pea DRs and
RGAs amplified in Lathyrus spp.. ................................................... 51
Figure 2.3 Neighbor-Joining tree based on the proportion-of-
shared-alleles distance values among 20 Lathyrus individuals. ..... 58
Figure 3.1 Correlation between RNA-Seq and RT-qPCR. ............... 86
Figure 3.2 Venn diagram of the number of unique and shared
contigs between the two genotypes and its expression.................. 88
Figure 3.3 Number of contigs that could be BLASTed to different
plant species. ................................................................................ 89
Figure 3.4 Percentage of contigs assigned in each main
functional category. ....................................................................... 91
Figure 3.5 Percentage of contigs assigned in each functional
category for each expression pattern group. .................................. 93
Figure 3.6 Percentage of contigs containing SNPs between the
resistant and susceptible genotypes in each Mercator mapping
functional sub-category. ................................................................. 97
Figure 4.1 Relative expression levels correlation between RNA-
Seq and RT-qPCR. ...................................................................... 126

List of Figures ___________________________________________________________________
xiv
Figure 4.2 Percentage of annotated up- and down-regulated L.
sativus UniTags upon A. lathyri inoculation in several functional
categories by MapMan. ............................................................... 128
Figure 5.1 Venn diagram of the number of unique and shared
contigs between the two genotypes and its expression................ 161
Figure 5.2 Number of contigs that could be BLASTed to different
plant species. .............................................................................. 162
Figure 5.3 Percentage of contigs assigned in each main
functional category. ..................................................................... 164
Figure 5.4 Percentage of contigs containing SNPs between the
resistant and susceptible genotypes in each Mercator mapping
functional sub-category. ............................................................... 167
Figure 6.1 Frequency distributions of rust (experiment 2R) and
powdery mildew (experiment 3PM) DS in the RIL families under
controlled conditions. ................................................................... 197
Figure 6.2 L. cicera first genetic linkage map based on a RIL
population. ................................................................................... 201
Figure 6.3 Matrix plot of common gene-based SNP markers
mapped in L. cicera and M. truncatula. ........................................ 202
Figure 6.4 MQM QTL mapping analysis for rust and powdery
mildew resistance on LG II of the L. cicera linkage map
developed. ................................................................................... 204

xv
List of Tables
Table 2.1 Lathyrus cicera and Lathyrus sativus accession
references at the CRF-INIA germplasm bank. ............................... 37
Table 2.2 Characteristics of developed CAPS and dCAPS
markers. .................................................................................... 43
Table 2.3 Characteristics of pea microsatellite markers
successfully amplified and sequenced on Lathyrus spp.. ............... 46
Table 2.4 Lathyrus cicera BGE008277xBGE023542 RILs
polymorphic markers characteristics and respective
segregation analysis (χ2 test for 1:1 segregation). ......................... 53
Table 2.5 Lathyrus cicera and Lathyrus sativus cross
amplifiable markers diversity analysis. ........................................... 56
Table 3.1 Log2 fold expression results for RNA-Seq and RT-
qPCR experiments. ....................................................................... 85
Table 3.2 Classification of contigs according to their differential
expression in the susceptible and resistant genotype upon
infection with U. pisi. ...................................................................... 87
Table 4.1 Contig information and primer sequences for RT-
qPCR. .................................................................................... 124
Table 4.2 Log2 fold expression results for deepSuperSAGE
and RT-qPCR experiments. ......................................................... 127

List of Tables ___________________________________________________________________
xvi
Table 4.3 List of detected genes by functional category,
expression values and putative function as described in
Mercator. .................................................................................... 129
Table 5.1 Classification of contigs according to their differential
expression in the susceptible and resistant genotype upon
infection with U. pisi. .................................................................... 160
Table 5.2 Allele-specific expression analysis results. .................. 169
Table 6.1 Phenotypic values (mean ± standard deviation) of the
RIL families and quantitative genetic parameters for rust and
powdery mildew resistance. ......................................................... 198
Table 6.2 Description of the obtained linkage groups .................. 200
Table 6.3 Quantitative trait loci for rust and powdery mildew
resistance in a L. cicera RIL5 population
(BGE023542xBGE008277). ........................................................ 203
Table 6.4 Potential candidate genes identified in QTLs. .............. 205

xvii
List of Additional files
Chapter 3
Additional files can be found at http://www.biomedcentral.com/1471-2229/14/376/additional. Please note that due to format changes, they appear under different names in the published version.
Additional file 3.1 List of detected SNPs between grass pea genotypes BGE015746 and BGE024709. (published as Additional file 3)
Additional file 3.2 List of detected polymorphic EST-SSRs between grass pea genotypes BGE015746 and BGE024709. (published as Additional file 4)
Additional file 3.3 Contig information and primer sequences for RT-qPCR. (published as Additional file 5)
Additional file 3.4 Lists of genes in expression pattern groups mapped to the reference assembly. RPKM: reads per kilobase per million (published as Additional file 1)
Additional file 3.5 List of contigs, mapped to the reference assembly, present only in the inoculated condition with a higher bit-score in fungal databases than in plant databases. (published as Additional file 2)
Chapter 4
The Additional file can be found at http://www.frontiersin.org/journal/ 10.3389/fpls.2015.00178/abstract. Please note that due to format changes, it appears under a different name in the published version.
Additional file 4.1 UniTags differentially expressed in Lathyrus sativus BGE015746 after inoculation with Ascochyta lathyri. TPM; tags per million.

List of Additional files ___________________________________________________________________
xviii
Chapter 5
Additional files can be found at http://www2.itqb.unl.pt/~nalmeida/ external/thesis_chapter5/
Additional file 5.1 Log2 fold expression results for RNA-Seq and qRT-PCR experiments and primer sequences for qRT-PCR.
Additional file 5.2 Transcript information for allele-specific RT-qPCR assays.
Additional file 5.3 List of primer and probe sequences for the allele-specific expression analysis assay.
Additional file 5.4 Lists of genes in expression pattern groups mapped to the reference assembly. RPKM: reads per kilobase per million.
Additional file 5.5 List of contigs, mapped to the reference assembly, present only in the inoculated condition with a higher bit-score in fungal databases than in plant databases.
Additional file 5.6 List of detected polymorphic SNPs between grass pea accessions BGE008277 and BGE023542
Additional file 5.7 List of detected polymorphic EST-SSRs between grass pea genotypes BGE008277 and BGE023542

xix
Acknowledgements Agradecimentos
I would like to express my gratitude to the people who directly
or indirectly contributed in so many ways to this work. I would like to
thank:
- Maria Carlota Vaz Patto, my supervisor, for giving me the
opportunity to start this PhD work and all the help and support
throughout the last years. Your mentoring allowed me to improve at
both professional and personal level.
- Diego Rubiales, my co-supervisor, for all the guidance and support
for this work. Your advices have been priceless.
- Pedro Fevereiro, head of the BVC lab at ITQB, for the support and
giving all the best conditions possible at his group.
- Ana Maria Torres, for receiving me at her laboratory at IFAPA, and
providing the proper resources and expertise for the cross-species
amplification work.
- Peter Winter, for receiving me at GenXPro and providing the
logistics in my stay in Frankfurt. Your considerations were very
important when I was trying to organize the avalanche of genomic data.
- Zlatko Šatović and Manuela Veloso for the relevant advices as
being part of my thesis committee.
- Susana Leitão, at first for all the great help with the genotyping part
of this work. Secondly, for having me as desk neighbour for the last 6
years and never losing the sanity (I hope). Now that you have your own
PhD thesis to take care I wish you a pleasant time finishing it.
Saudações Leoninas.
- Mara Alves, for being the statistical master, helping in the
statistical analysis, linkage map development and QTL mapping. Also,

Acknowledgements / Agradecimentos ___________________________________________________________________
xx
thank you for being the person in the lab who can understand my not-
so-obvious (bad) jokes. Força aí com essa tese!
- Inês Trindade and Rita Morgado, for the help in setting up,
analysing and discussing the RT-qPCR assays.
- All my former and present colleagues at the BCV lab (André
Almeida, Catarina Bicho, Cátia, Clara, Diana, Jorge Paiva, Maria,
Matilde, Olivia, Silvana, Sofia, Susana Araújo, Susana Neves, Susana
Pera, Victor, Zé), for the science related discussions, but also for non-
work related discussions.
- All my colleagues at IAS-CSIC, that helped me in my short stays
in Córdoba (particularly Alessio Cimino, Angel Aller, Angel Villegas,
Elena Cabalero, Elena Prats, Eleonora, Estefania Carrillo, Javi
Sanchez, Mariane, Nicolas, Pedro and Sara) with their expertise in the
scientific topics and kindness to help the Portuguese guy to adapt to
the city.
- Ana Moral, por el precioso entrenamiento en la evaluación de
resistencia y toda la preciosa ayuda dentro y fuera del laboratorio.
- Thaïs, for the scientific and philosophical discussions. Also for
sheltering me, making me feel at home.
- All the people at GenXPro (particularly Björn, Conny, Günter, Nico
and Ralf) for the contribution with the NGS part of my thesis and the
help during my stay in Frankfurt.
- Elsa and all the Kohl family, for the hospitality and friendship.
- Aos meus pais, António e Liliana, por sempre me apoiarem. Este
trabalho só é possível por me terem preparado para qualquer desafio.
- À minha avó Emília, por ser sempre tão amável.
- À minha filha Laura, por nos teres brindado com a tua alegria
contagiante. A tua presença torna tudo mais brilhante.
- À Dora, a minha amiga, companheira e pilar. Obrigado por me
teres mantido focado e teres suportado a minha “ausência presente”.

xxi
Resumo
Entre as leguminosas de grão, Lathyrus sativus (chícharo) e L.
cicera (chícharo-miúdo) detêm um grande potencial pela sua
adaptabilidade a ambientes adversos, alto teor em proteína e
resistência a doenças relevantes. As espécies do género Lathyrus são
consideradas potenciais fontes de proteínas de alta qualidade e baixo
custo. No entanto, devido à sua pouca utilização, esforços adicionais
são necessários de forma a explorar o seu potencial e capitalizar os
atuais avanços na biologia molecular para os programas de
melhoramento em Lathyrus spp..
Nesta tese, a base genética dos mecanismos de defesa de
duas espécies de Lathyrus, a três das mais importantes doenças
foliares em leguminosas foram estudadas, nomeadamente, ferrugem
(Uromyces pisi), oídio (Erysiphe pisi) e ascoquitose (Ascochyta
lathyri). Dois genótipos de cada L. cicera e L. sativus com resposta
contrastante à infeção com ferrugem e oídio, e um genótipo de L.
sativus resistente à ascoquitose, foram utilizados para esta análise.
De forma a permitir a construção de um mapa de ligamento
genético de L. cicera, tendo como base uma população de linhas puras
recombinantes (RILs – recombinant inbred lines), foram desenvolvidos
marcadores moleculares polimórficos. Duas abordagens diferentes
foram utilizadas para o desenvolvimento de marcadores moleculares.
Primeiro foram testados marcadores desenvolvidos para espécies
próximas filogeneticamente de Lathyrus, como Medicago truncatula ou
Pisum sativum. Apesar dos marcadores serem transferíveis entre
espécies, obtiveram-se poucos marcadores polimórficos entre os
genótipos parentais das RILs. De forma a superar este facto, foi

Resumo ___________________________________________________________________
xxii
efetuada uma segunda abordagem utilizando bibliotecas obtidas por
sequenciação de ARN (RNA-Seq) de L. cicera e L. sativus (também
desenvolvidas nesta tese), de forma a desenvolver marcadores (EST-
SSR e SNPs) polimórficos específicos para estas espécies. Devido à
incorporação no mapa de ligamento de L. cicera de vários marcadores
homólogos em espécies modelo de leguminosas, foi possível efetuar
estudos de sintenia. Este estudo indicou uma grande conservação
macrosinténica entre L. cicera e M. truncatula, permitindo novas linhas
de investigação associadas com o mapeamento comparativo de
processos fisiológicos e mecanismos de defesa comuns. Beneficiando
deste mapa de ligamento, também foi possível mapear locus de
características quantitativas (QTL – quantitative trait locus)
relacionadas com resistência a doenças. Foram detetados dois QTLs
para a resistência parcial à ferrugem e um QTL para a resistência
parcial ao oídio. A pequena percentagem de variação fenotípica total
explicada pelos QTLs levou-nos a concluir que o controlo genético das
resistências parciais ao oídio e à ferrugem é efetivamente poligénica.
Adicionalmente ao estudo genético, uma abordagem usando
transcriptómica (RNA-Seq) foi efetuada para ambas as espécies de
forma a elucidar quais as respostas defensivas da planta à infeção por
ferrugem. Os perfis de transcrição de L. sativus revelaram diferenças
consideráveis na regulação das vias de sinalização hormonal mais
importantes entre o genótipo resistente e o suscetível. Além disso,
vários genes relacionados com patogenicidade foram sobre-
expressos no genótipo resistente e sub-expressos no genótipo
suscetível.
Os resultados de transcriptómica de L. cicera sugerem uma
regulação diferencial de genes envolvidos na sinalização,
metabolismo da parece celular e na síntese de metabolitos

Resumo ___________________________________________________________________
xxiii
secundários como base genética da resistência parcial à ferrugem.
Particularmente, um homólogo do gene PsMLO1 encontrava-se
diferencialmente expresso após inoculação com ferrugem. Este gene
já havia sido descrito como estando envolvido na resistência ao oídio
em P. sativum e o seu papel na resistência de L. cicera à ferrugem
deve ser melhor estudada. Os genes identificados como
diferencialmente expressos são genes candidatos adequados a
futuros estudos funcionais, de forma a esclarecer os mecanismos das
interações planta-patógeno. Adicionalmente, as duas espécies de
Lathyrus possuíam milhares de contigs polimórficos entre seus
genótipos, com SNPs distribuídos de forma desigual entre as
diferentes categorias funcionais. As categorias mais mutadas foram
degradação de proteínas e proteínas cinase recetoras envolvidas na
sinalização, o que ilustra a adaptação evolutiva destas espécies no
braço de ferro entre hospedeiro/patógeno.
Uma abordagem transcriptómica diferente, deepSuperSAGE,
foi também utilizada para elucidar as vias diferencialmente reguladas
e identificar candidatos a genes de resistência na interação ascochyta-
L. sativus. Os resultados indicam que varias classes de genes,
atuando em diferentes fases da interação planta-patógeno, estão
envolvidos na resposta de L. cicera à infeção por A. lathyri. Por
exemplo, foi observada uma clara sobre-expressão de genes
relacionados com defesa envolvidos na via biosintética do etileno.
Houve também evidências de alterações no metabolismo da parede
celular, indicada pela sobre-expressão de genes envolvidos na
biossíntese de celulose e lignina.
Juntando todos os dados de transcriptómica e mapeamento de
QTLs, estes resultados fornecem uma visão global dos perfis de
expressão génica dos genótipos de Lathyrus spp. inoculados com

Resumo ___________________________________________________________________
xxiv
ferrugem, oídio e ascoquitose, fornecendo recursos muito importantes
para abordagens futuras usando o melhoramento de precisão nestas
valiosas leguminosas, até agora pouco estudadas.

xxv
Abstract
Lathyrus cicera L. (chickling pea) and L. sativus L. (grass pea)
have great potential among grain legumes due to their adaptability to
inauspicious environments, high protein content and resistance to
serious diseases. Lathyrus spp. are considered potential sources of
high quality and cheap protein. Nevertheless, due to its past underuse,
further activities are required to exploit this potential and to capitalise
on the present molecular biology advances on Lathyrus spp. breeding
programmes.
In this thesis the genetic basis of the defence mechanisms, of
two Lathyrus spp. to three of the most important foliar diseases in
legumes, rust (Uromyces pisi), powdery mildew (Erysiphe pisi) and
ascochyta blight (Ascochyta lathyri) were studied. Contrasting
genotypes of both L. sativus and L. cicera in what concerns infection
reaction to rust and powdery mildew, and a resistant L. sativus
genotype against ascochyta blight were used in this analysis.
Polymorphic molecular markers that enabled the construction
of a L. cicera linkage map base on recombinant inbred lines population
were developed. Two different approaches were used in this molecular
markers development. First we tested markers developed for Lathyrus
close related species, such as Medicago truncatula and Pisum sativum
that despite a good transferability, yielded a low amount of polymorphic
markers between the RILs parental genotypes. To overcome that, and
as a second approach we used RNA-Seq libraries of L. cicera and L.
sativus (also developed in this thesis) to develop specific polymorphic
EST-SSRs and SNPs. Due to the incorporation of several homologous

Abstract ___________________________________________________________________
xxvi
markers to model legume species in the developed L. cicera linkage
map, it was possible to perform synteny studies. This indicated a high
macrosyntenic conservation between L. cicera and M. truncatula,
opening research opportunities associated with comparative mapping
of shared physiological process and defence mechanisms. Profiting
from this linkage map, we also evaluated the L. cicera RILs for rust and
powdery mildew resistance response in order to detect and map QTLs
underlying disease resistance. One QTL for partial resistance to
powdery mildew and two QTLs for partial resistance to rust were
detected. The small percentage of total phenotypic variation explained
by the detected QTLs led us to conclude that the genetic control of the
partial resistances to rust and powdery mildew was indeed polygenic.
In addition to the genetic study, a transcriptomics approach
(RNA-Seq) was used for both species to elucidate the defence
responses to rust infection. L. sativus, transcription profiles revealed
considerable differences in regulation of major phytohormone
signalling pathways between resistant and susceptible genotypes.
Also, several pathogenesis-related genes were up-regulated in the
resistant and exclusively down regulated in the susceptible genotype.
L. cicera transcriptomic results suggested different regulation of genes
involved in signalling, cell wall metabolism and in the synthesis of
secondary metabolites as the genetic basis of partial resistance to rust.
In particular a PsMLO1 homolog was found differentially expressed
upon inoculation with rust. This gene was already described as
involved in powdery mildew resistance in pea, and its role in L. cicera
rust resistance should be further investigated. The differentially
expressed genes identified are suitable candidate genes for future
functional studies to shed light on the molecular mechanisms of plant-
pathogen interactions. In addition, the two Lathyrus spp. contained

Abstract ___________________________________________________________________
xxvii
thousands of polymorphic contigs between each species genotype,
with SNPs unevenly distributed between different functional
categories. Protein degradation and signalling receptor kinases were
the most mutated categories, illustrating evolutionary adaptation of L.
sativus to the host/pathogens arms race.
A different transcriptomic approach, deepSuperSAGE, was
also employed to elucidate the pathways differentially regulated and
identify resistance candidate genes during ascochyta-L. sativus
interaction. The results indicated that several gene classes acting in
different phases of the plant/pathogen interaction are involved in the L.
sativus response to A. lathyri infection. As example a clear up-
regulation of defence-related genes related with the ethylene pathway
was observed. There was also evidence of alterations in cell wall
metabolism indicated by overexpression of cellulose synthase and
lignin biosynthesis genes.
Taking all the transcriptomics data and QTL mapping together,
our results provide a broad overview of gene expression profiles of
Lathyrus spp. genotypes inoculated with rust and Ascochyta, providing
a highly valuable resource for future smart breeding approaches in this
hitherto under-researched, valuable legume crop.


xxix
List of most used abbreviations
ABA abscisic acid
AFLP Amplified Fragment Length Polymorphisms
CAPS Cleaved Amplified Polymorphic Sequence
d.a.i. days after inoculation
DAMP damage-associated molecular pattern
dCAPS derived Cleaved Amplified Polymorphic Sequence
ddPCR droplet digital PCR
DE differentially expressed
DR disease resistance
DS disease severity
eQTL expression quantitative trait locus
ER endoplasmic reticulum
EST expression sequence tags
EST-SSR expressed sequence tag - simple sequence repeat
ET ethylene
ETI effector-triggered immunity
gSSR genomic simple sequence repeat
GST glutathione S-transferase
h.a.i. hours after inoculation
HR hypersensitive response
IT infection type
ITAP intron-targeted amplified polymorphism
ITS internal transcribed spacer

List of most used abbreviations ___________________________________________________________________
xxx
JA jasmonate
LG linkage group
LOD logarithm (base 10) of odds
LRR Leucine-rich repeat
MAP mitogen-activated protein
MAS marker assisted selection
MLO mildew resistance locus O
MQM multiple-QTL mapping
NBS-LRR nucleotide-binding site leucine-rich repeat
NGS next-generation sequencing
ODAP ß-N-ozalyl-L-a,ß-diaminopropanoic acid
PAMP pathogen associated molecular patterns
PCR Polymerase Chain Reaction
PIC Polymorphic Information Content
PR pathogenesis related
PRR pattern recognition receptor
PTI pathogen-associated molecular pattern triggered immunity
QTL quantitative trait locus
R gene resistance gene
RAPD Random Amplified Polymorphic DNA
RGA resistance gene analogue
RIL Recombinant Inbred Line
RNA-Seq RNA-Sequencing
ROS reactive oxygen species
RT reverse-transcription

List of most used abbreviations ___________________________________________________________________
xxxi
RT-qPCR Real-Time Quantitative Reverse Transcription PCR
SA salicylic acid
SNP single nucleotide polymorphism
SSR simple sequence repeats, or microsatellite
VLCFA very long chain fatty acid


1
CHAPTER 1
General introduction
This chapter is based on:
Almeida, N.F., Rubiales, D., and Vaz Patto, M.C. (2015). Grass pea. In: De Ron, A.M. (Ed.) Grain Legumes, Series Handbook of Plant Breeding. (New York, U.S.A.: Springer Science+Business Media). (in press) (see Acknowledgements section for authors contributions)


General introduction ___________________________________________________________________
3
1.1. Introduction
Lathyrus sativus L. (grass pea) and L. cicera L. (chickling pea)
are multipurpose robust cool season legume crops. They can grow in
both drought- and flooding-prone environments and poor soils due to
its hardy and penetrating root systems (Campbell, 1997; Vaz Patto et
al., 2006b). They have high nutritional value (protein content raging
25–30%), being grass pea important both for human food and animal
feed, while chickling pea is more usually used as animal feed and
forage. In what concerns human consumption grass pea can be
consumed uncooked as a green snack, cooked in a stew, milled into
flour or by roasting the seed (Peña-Chocarro and Peña, 1999). In
addition to its uses as food and feed, symbiosis with rhizobia allows an
efficient nitrogen fixation in the soil, lowering the inputs needed in crop
rotation and making them suitable to be used as green manure in
sustainable farming systems (Hanbury et al., 2000). As an example of
its versatility, L. sativus is easily introduced in intercropping systems,
rotations or used along with paddy rice in relay cropping systems
(Campbell et al., 1994; Abd El Moneim et al., 2001; Hillocks and
Maruthi, 2012).
There is great potential for the expansion in the utilization of
Lathyrus spp. in dry areas or zones which are becoming more drought-
prone, with increased salinity or increased tendency to suffer from
biotic stresses. However, those species, and in particular grass pea,
are unpopular with governments and donors because they contain
small amounts of a toxin, β-N-ozalyl-L-α,β-diaminopropanoic acid
(ODAP). Although this toxin can cause a neuronal disorder, known as
‘lathyrism’, the condition develops in humans with a 6% chance only
when grass pea is consumed in large quantities, unaccompanied by
other foodstuffs in an unbalanced diet and during a long period of time

Chapter 1 ___________________________________________________________________
4
(Lambein et al., 2009). Also, seeds can be partly detoxified by the
various processing methods (Kuo et al., 2000; Kumar et al., 2011).
Even though, these robust crops are rightly considered as a
model crop for sustainable agriculture and despite the lathyrism
stigma, the development of new breeding technologies and the
growing interest in its use in Mediterranean type environments, all over
the world will provide a bright future to this crop (Vaz Patto et al.,
2006b; Vaz Patto and Rubiales, 2014a).
1.2. Lathyrus sativus and L. cicera: Origin and systematic
The Lathyrus genus is located within the Fabaceae family (syn.
Leguminosae), subfamily Faboideae (syn. Papilionoideae), tribe
Fabeae (syn. Vicieae), along with genera Pisum, Vicia, Lens and
Vavilovia (Wojciechowski et al., 2004; Kenicer et al., 2005; Smýkal et
al., 2011; Schaefer et al., 2012).
The natural distribution of grass pea has been completely
obscured by its human cultivation. Its use for food, feed and forage
difficult the distinction between wild and domesticated populations,
toughen the task to precisely locate its centre of origin (Kumar et al.,
2013). The most probable grass pea centre of origin is believed to have
been the Eastern Mediterranean or Fertile Crescent, around 6.000
B.C.E. This has been supported by archeobotanical and recent
phylogenetic reports (Kislev, 1989; Schaefer et al., 2012), refuting the
hypothesis by Smartt (1984) that the centre of origin was located in
south-west or central Asia. Domestication of grass pea seems to have
occurred alongside with other pulses, being normally found with early
domesticates of pea (Pisum sativum L.), lentils (Lens culinaris Medik.)
and bitter vetch (Vicia ervilia (L.) Willd.) (Erskine et al., 1994).

General introduction ___________________________________________________________________
5
Hopf (1986) hypothesized that L. sativus is a derivative from L.
cicera, its genetically nearest wild species. In addition, in what
concerns domestication in Southern Europe (France and Iberian
peninsula), evidences of cultivation of L. cicera were found, dating from
4.000 or 3.000 B.C.E., suggesting that expansion of L. sativus farming
may have led also to the domestication of the local L. cicera (Campbell,
1997).
Within the economically important legume crops and model
species, P. sativum is reported as the closest related to grass pea and
chickling pea, followed by lentil, faba bean (Vicia faba L.), barrel medic
(Medicago truncatula Gaertn.), chickpea (Cicer arietinum L.) and Lotus
corniculatus L. (Asmussen and Liston, 1998; Wojciechowski et al.,
2004; Ellison et al., 2006).
The infrageneric classification of Lathyrus genus has been
revised several times, being the one reported by Kupicha (1983) the
most largely accepted. In this treatment, the genus is organized in 13
clades (Orobus, Lathyrostylis, Lathyrus, Orobon, Pratensis, Aphaca,
Clymenum, Orobastrum, Viciopsis, Linearicarpus, Nissolia,
Neurolobus, and Notolathyrus). This morphological based
classification has been recently supported by molecular phylogenetic
studies using sequence data from the internal transcribed spacer (ITS)
region and from cpDNA (Kenicer et al., 2005; Kenicer et al., 2009).
Schaefer et al. (2012), using nuclear and chloroplast phylogenetic
data, further suggested that the genus Lathyrus is not monophyletic,
and recommended that a more natural classification would be to
transfer Pisum and Vavilovia to a then monophyletic Lathyrus genus.

Chapter 1 ___________________________________________________________________
6
1.3. Lathyrus sativus varietal groups
Great morphological variation is reported in grass pea,
especially in vegetative characters such as leaf length, while, for
instances, its floral characters are much less variable, showing a clear
grouping in flower colour (Jackson and Yunus, 1984), as well as in its
seed and yield traits (Hanbury et al., 1999). Several studies divided
grass pea accessions broadly into two groups; those from the Indian
sub-continent and those from the Mediterranean region. Jackson and
Yunus (1984) reported that all blue-flowered accessions came from
south-west and south Asia, while the white and mixed coloured
accessions had a more western distribution, from the Canary Isles to
the western republics of the Soviet Union. These authors also pointed
out that white flowered accessions only had white seeds with no
secondary markings on the seed coat. In accordance with this,
Hanbury et al. (1999), reported that Mediterranean accessions were
characterized by larger and whiter seeds, selected for human
consumption, with higher yield potential than the Indian accessions.
Grass pea small-seeded accessions are considered more primitive
types and normally associated with hardened seeds like what happens
in other Old World grain legumes such as pea, chickpea or lentil
(Chowdhury and Slinkard, 2000).
A particular case is the germplasm selected for forage, in the
Mediterranean region, with landraces with broad leaves and pods, but
low seed yield (Chowdhury and Slinkard, 2000; Kumar et al., 2013).

General introduction ___________________________________________________________________
7
1.4. Genetic resources and utilization
Conservation of Lathyrus genetic resources has recently
attracted more attention because of the potential role of these species
under the climate change scenario (Kumar et al., 2013).
Grass pea is mentioned in two conservation programs for major
food legumes. One is the International Treaty on Plant Genetic
Resources for Food and Agriculture (ITPGRFA) (FAO, 2009), which
aims at guaranteeing food security through conservation of
biodiversity, fair exchange and sustainable use of plant genetic
resources. This is being accomplished by establishing a global system
to provide farmers, plant breeders and scientists’ access to plant
genetic materials, ensuring that recipients share benefits with the
countries where they have been originated and by recognizing the
contribution of farmers to the diversity of crops used as food.
The other, a more specific program developed by the Global
Crop Diversity Trust (CGDT) in collaboration with ICARDA, aims for a
long-term conservation strategy of L. sativus, L. cicera and L. ochrus
(GCDT, 2009). This program is detailing the current status of national
collections and identifying gaps in collections of these three species
from areas of diversity. Their strategy recommends that documentation
on collections should be upgraded and that more work should be
carried out on characterizing and evaluating collections for key traits,
making this data widely available (Gurung and Pang, 2011).
Several ex situ and a few in situ conservation examples exist
for Lathyrus germplasm. The largest Lathyrus ex situ collections are
maintained at the Conservatoire Botanique National des Pyrénées et
de Midi-Pyrénées in France (4.477 accessions) (previously at Pau
University), by the International Center for Agricultural Research in Dry

Chapter 1 ___________________________________________________________________
8
Areas (ICARDA) comprising 3.239 accessions, and by the National
Bureau of Plant Genetic Resources (NBPGR) in India (2.619
accessions). Smaller, but still relevant collections are maintained by
other banks such as the Germplasm Resource Information Network
(GRIN) from the United States Department of Agriculture (USDA) in the
United States of America, the Leibniz Institute of Plant Genetics and
Crop Plant Research (IPK) in Germany and the Centro de Recursos
Fitogenéticos (CRF) from the Instituto Nacional de Investigación y
Tecnología Agraria y Alimentaria (INIA) in Spain. Backups from 2.134
grass pea accessions, from 44 countries, and 176 chickling pea
accessions, from 20 countries, are deposited at the Svalbard Global
Seed Vault (http://www.nordgen.org/sgsv/; accessed January 2015). In
what concerns in situ conservation, five genetic reserves for Lathyrus
diversity conservation have been proposed in Syria and Turkey
(Heywood et al., 2007). These authors also stressed the importance of
increasing public awareness for the significance of crop wild relatives
in agricultural development and the need for their simultaneous
conservation.
This conserved germplasm represent a valuable reservoir of
diversity, providing access to sources of a wide range of interesting
agromorphological traits such as earliness, plant architectural traits,
disease and pest tolerance, as well as low ODAP content.
Characterization of this diversity through phenotyping and genotyping
studies will unveil novel alleles that can be used to improve this crop.
Diversity characterization in Lathyrus germplasm have focused for
example on ODAP content (Fikre et al., 2008; Kumar et al., 2011; Grela
et al., 2012), phenology and yield (Mera, 2010; Grela et al., 2012),
parasitic weed resistance (Fernández-Aparicio et al., 2012), disease
resistance (Gurung et al., 2002; Vaz Patto et al., 2006a; Vaz Patto and

General introduction ___________________________________________________________________
9
Rubiales, 2009) or quality traits (Granati et al., 2003). Some of these
characterization studies have represented the first steps of several
existing selection programs.
1.5. Major breeding achievements
Conventional grass pea breeding programs have been
established in several countries, including Australia (Hanbury et al.,
1995), Bangladesh (Malek, 1998), Canada (Campbell and Briggs,
1987), China (Yang and Zhang, 2005), Chile (Mera et al., 2003),
Ethiopia (Tadesse and Bekele, 2003), India (Lal et al., 1986; Pandey
et al., 1996), Nepal (Yadav, 1996) Syria (Abd El-Moneim et al., 2000)
and Portugal (Carita, 2012). Some of these breeding programs are still
active, but most are small in comparison to other legume crops (Vaz
Patto et al., 2011).
Due to the occurrence of lathyrism in humans, major breeding
programs essentially aimed for low ODAP content, besides productivity
and adaptability. This has resulted at present in several L. sativus or L.
cicera breeding lines or released varieties with reduced ODAP content
(from 0.5 to 1.5 %, down to 0.01 % or less) (Kumar et al., 2011). For
instance, low ODAP grass pea cultivars have been released in several
countries, such as “Wasie” in Ethiopia, “Ali-Bar” in Kazakhstan and
“Gurbuz 1” in Turkey (ICARDA, 2006; 2007). Similarly, low ODAP and
high yielding grass pea cultivars have been released in India such as
“Pusa 24”, “Prateek”, “Ratan” and “Mahateora” (ICAR, 2009). In
Bangladesh, examples are the low ODAP and high-yielding grass pea
varieties “BARI Khesari 1”, “BARI Khesari 2” and “BARI Khesari 3”
(Malek 1998), or the “BINA Khesari 1” (Kumar et al., 2011). In Canada,
high yield and low ODAP (0.03%) grass pea variety “LS8246” was

Chapter 1 ___________________________________________________________________
10
released for feed and fodder (Campbell and Briggs, 1987), in addition
to a high N fixation grass pea variety, “AC Greenfix”, released specially
as green manure (Krause and Krause, 2003). In Chile, “Luanco-INIA”,
a large-seeded, high yielding grass pea variety was released, used
locally as feed and for export, especially for some European markets
where larger seed size is desirable for human consumption (Mera et
al., 2003). Finally, in Australia, the grass pea variety “Ceora” was bred
to be used as forage, hay or as a green manure crop (Siddique et al.,
2006). Also in Australia a chickling pea cultivar, “Chalus”, was selected
for high yields and low ODAP levels (Hanbury and Siddique, 2000). In
Portugal two chickling pea varieties are registered in the
“Catálogo Nacional de Variedades” (http://
www.dgv.min-agricultura.pt/xeov21/attachfileu.jsp?look_parentBoui=
4259527&att_display=n&att_download=y, accessed September
2014), named “Grão da Comenda” and “Grão da Gramicha”, both to
be used as forage.
1.6. Specific goals in current breeding
Low ODAP content is still one important goal of many of the
current Lathyrus spp. breeding programs. Nevertheless other
important agronomic traits have always been associated to this in
breeding programs, such as yield and adaptation.
Increased yield is a selection criterion for most crop
improvement programmes. However, some of the yield components
that affect yield, such as double podding or increased seeds per pod,
have in Lathyrus spp. breeding received insufficient attention. Also the
biomass yield of L. sativus has started to receive more attention during
the past few years (Campbell, 1997; Abd El Moneim et al., 2001; Vaz
Patto et al., 2006b). This is a very important area due to the large

General introduction ___________________________________________________________________
11
potential of this crop for forage and straw in the North African and South
Asian regions (Campbell, 1997). Additionally, undesirable traits such
as prostrate plant habit, indeterminate growth, late maturity and pod
shattering (Rybinski, 2003) are being also handled by several breeding
programs.
The concentrated effort on reducing ODAP content resulted in
many other areas of evaluation and crop improvement, such as
resistance to biotic and abiotic stresses, being neglected. However,
with the release of low ODAP lines, the development of varieties, for
instance, with increased resistance to prevalent pests and diseases
has gained new strength. This crop is usually grown by poor farmers
and under poor management, where it is difficult to adopt chemical
control for diseases and pests. Therefore, the development of varieties
having resistance to prevalent biotic stresses is essential and more
efforts are required in this area of improvement of these very hardy
crops (Vaz Patto et al., 2006b).
1.7. Biotic stresses
Grass pea and chickling pea as any other plant species are
subjected to diseases caused by a vast array of pathogens, including
fungi, viruses, bacteria, parasitic plants and insects. Previous studies
identified resistance in grass pea and chickling pea germplasm for rust
(Vaz Patto et al., 2009; Vaz Patto and Rubiales, 2009), powdery
mildew (Vaz Patto et al., 2006a; 2007), ascochyta blight (Gurung et al.,
2002), bacterial blight (Martín-Sanz et al., 2012) and crenate
broomrape (Sillero et al., 2005; Fernández-Aparicio et al., 2009;
Fernández-Aparicio and Rubiales, 2010; Fernández-Aparicio et al.,
2012). However, only the genetic basis of aschocyta blight resistance

Chapter 1 ___________________________________________________________________
12
in L. sativus was analysed through a quantitative trait locus (QTL)
mapping and expression analyses of a few candidate genes (Skiba et
al., 2004a; b; 2005), and detailed molecular information is missing for
the majority of the identified resistances, hampering their introduction
in breeding programs.
This thesis will focus on three of the most important fungal
diseases for legume crops in which resistance was identified in
Lathyrus spp.
1.7.1 Rust
Rusts are among the most important diseases of legumes
(Sillero et al., 2006) and Lathyrus spp. are not exceptions (Duke, 1981;
Campbell, 1997; Vaz Patto et al., 2006b). Rusts are caused by
biotrophic fungi that keep infected host cells alive for their
development, depending on the hosts to reproduce and complete their
life cycles. Although some rusts can be cultured on very complex
synthetic media, they have no known saprotrophic existence in nature
(Staples, 2000). Rusts form elaborate intracellular feeding structures
called haustoria, which maintain an intimate contact between fungal
and plant cells over a prolonged period of time (O’Connell and
Panstruga, 2006).
Rust in Lathyrus spp. is caused by Uromyces pisi (Pers.) Wint.
and U. viciae-fabae (Pers.) J. Schröt. (Barilli et al., 2011; Barilli et al.,
2012). In particular, U. pisi infects a broad range of other legumes, such
as Vicia faba, Lens culinaris, Vicia ervilia and Cicer arietinum (Barilli et
al., 2012; Rubiales et al., 2013).
The resistance observed in L. cicera and L. sativus against rust
infection is due to a restriction of haustoria formation with high

General introduction ___________________________________________________________________
13
percentage of early aborted colonies, reduction of number of haustoria
per colony and reduction of intercellular growth of infection hyphae
(Vaz Patto et al., 2009; Vaz Patto and Rubiales, 2009; Vaz Patto and
Rubiales, 2014b).
1.7.2 Powdery mildew
Powdery mildews are probably the most common, conspicuous
and widespread plant diseases. As biotrophs they seldom kill their
hosts, but utilize their nutrients, reduce photosynthesis, increase
respiration and transpiration, impair growth and reduce yields up to
40% (Agrios, 2005). Erysiphe pisi DC. is a biotrophic ascomycete
fungus, characterized by its grey to white colonies formed on leaves,
stem and pods of infected plants (Vaz Patto et al., 2006a). It is
commonly known as pea powdery mildew but it can also infect
Medicago, Vicia, Lupinus, Lens and Lathyrus (Sillero et al., 2006). Pea
powdery mildew is a serious disease of worldwide distribution, being
particularly important in climates with warm, dry days and cool nights
(Smith et al., 1996).
Lathyrus sativus and L. cicera accessions with reduced disease
severity despite of a high infection type after E. pisi infection, have also
been identified (Vaz Patto et al., 2006a; 2007; Vaz Patto and Rubiales,
2014b), fitting the definition of Partial Resistance according to
Parlevliet (1979).
1.7.3 Ascochyta blight
Ascochyta blights are among the most important groups of plant
diseases worldwide (Rubiales and Fondevilla, 2012). Ascochyta blights

Chapter 1 ___________________________________________________________________
14
are incited by different pathogens in the various legumes. As
examples, Ascochyta rabiei (teleomorph Didymella rabiei) in chickpea;
A. fabae (teleomorph D. fabae) in faba bean and A. lentis (teleomorph
D. lentis) in lentil (Tivoli et al., 2006). Ascochyta blight of pea (Pisum
sativum) is caused by a complex of fungi formed by Ascochyta pisi Lib.,
Didymella pinodes (Berk. & Blox.) Petrak. and Phoma medicaginis var.
pinodella (L.K. Jones) Morgan-Jones & K.B. Burch. (Carrillo et al.,
2013). Of these, D. pinodes (syn. Mycosphaerella pinodes) is the most
frequent and damaging (Tivoli and Banniza, 2007). D. pinodes is a
necrotrophic pathogen, being characterized by dark concentric lesions
containing black picnidia on leaves, pods and stems (Peever, 2007).
Lathyrus spp. are known to be resistant to D. pinodes, the causal agent
of pea ascochyta blight. Gurung et al. (2002) showed that L. sativus, L.
ochrus and L. clymenum accessions were significantly more resistant
to D. pinodes stem infection than field pea cultivars. A detailed analysis
of quantitative resistance of L. sativus to ascochyta blight, caused by
D. pinodes, suggested that resistance in L. sativus may be controlled
by two independently segregating genes, operating in a
complementary epistatic manner (Skiba et al., 2004b). In another
study, Skiba et al. (Skiba et al., 2004a) developed a grass pea linkage
map and used it to locate two QTL, explaining 12% and 9% of the
observed variation in resistance to D. pinodes. Nevertheless, no
candidate genes were identified at that time for these resistance QTLs,
hampering their use in precision breeding. In an attempt to identify
defence-related candidate genes involved in D. pinodes resistance in
L. sativus, the expression of 29 potentially defence-related expression
sequence tags (ESTs) was compared between L. sativus resistant and
susceptible lines (Skiba et al., 2005). These ESTs were selected from
a previously developed cDNA library of L. sativus stem and leaf tissue
challenged with D. pinodes. From these, sixteen ESTs were

General introduction ___________________________________________________________________
15
considered eventually important for conferring stem resistance to
ascochyta blight in L. sativus. In addition, the marker developed from
one of them, EST LS0574 (Cf-9 resistance gene cluster), was
significantly linked to one of the previously identified resistance QTLs.
However this study was necessarily limited to the small number of
initially selected EST sequences.
1.8. Breeding methods and specific techniques
Collection and evaluation of germplasm, local or introduced, is
the cornerstone in any breeding program. Subsequent hybridization
and selection of the resulting progeny using different strategies, will
allow incorporating interesting traits into more adapted background.
This may include backcrossing, recurrent selection, single seed
descent and pedigree/bulk breeding methods. All of these methods can
be applied on Lathyrus spp. improvement.
Grass pea and chickling pea are predominantly self-pollinated
crops, although outcrossing up to 30% has been reported (Rahman et
al., 1995; Chowdhury and Slinkard, 1997; Ben Brahim et al., 2001).
Large size of flower, bright colour of petals, flower density, and nectar
production are reported to influence the outcrossing in Lathyrus
species (Kiyoshi et al., 1985). Entomophilic pollination in grass pea is
due especially to bees and bumblebees (Kumar et al., 2011). Due to
this observed outcrossing level, in most Lathyrus spp. breeding
programmes, crosses are done under controlled conditions, in
greenhouse or under insect proof coverings (Vaz Patto et al., 2011).
Conventional grass pea breeding focused essentially in
hybridization of selected accessions, with the screening and evaluation
of the resulting progeny. In the particular case of breeding to reduce

Chapter 1 ___________________________________________________________________
16
ODAP contend, low ODAP accessions are crossed with high yield
material with good agronomic potential (Campbell, 1997).
Intergeneric hybridization, although difficult, is possible
between grass pea and L. amphicarpos or L. cicera (Yunus and
Jackson, 1991). Crosses have been also made with other species such
as L. chrysanthus, L. gorgoni, L. marmoratus and L. pseudocicera
(Heywood et al., 2007), but only ovules were produced.
Also with the objective of reducing ODAP content, grass pea
has been subjected to induced mutagenesis by physical and/or
chemical mutagens. Other traits have been affected by mutagenesis
such as plant habit, maturity, branching, stem shape, leaf size, stipule
shape, flower colour and structure, pod size, seed size and colour and
NaCl tolerance (Nerkar, 1972; 1976; Rybinski, 2003; Biswas, 2007;
Talukdar, 2009; 2011). In vitro culture was also employed, inducing
somaclonal variation (Roy et al., 1993; Ochatt et al., 2002a; Zambre et
al., 2002). Induced mutagenesis and somaclonal variation created new
diversity, allowing the selection of lines with interesting agronomical
traits, such as yield, plant architecture and low ODAP content,
Ochatt et al. (2002b) developed an in vitro system coupled with
in vivo stages in order to shorten grass pea regeneration cycles,
obtaining up to almost 4 cycles per year. However this approach is only
applicable when few seeds/plant are intended, as in single-seed
descendant breeding schemes.
The advent of various molecular marker techniques and the
ability to transfer genes across different organisms, using transgene
technology, has begun to have an impact on plant genome research
and breeding. These techniques offer new approaches for improving
important agronomic traits in Lathyrus species and breaking down

General introduction ___________________________________________________________________
17
transfer barriers to related legume species (Vaz Patto et al., 2006b).
This would allow exploring the variability existing in other Lathyrus
gene pools and hopefully transfer the interesting grass pea and
chickling pea traits to related legume species.
Genetic transformation of grass pea was attempted with only
one successful report obtaining stable transformed plants (Barik et al.,
2005). Given that regeneration protocols are often genotype specific, it
may be necessary either to develop more generally applicable
protocols or to adapt the protocol after transformation (Ochatt et al.,
2013).
1.9. Integration of new biotechnologies in breeding programmes
Comparing to other grain legumes such as pea, faba bean or
chickpea, genomic recourses for grass pea are still scarce. Prior to the
inclusion of this thesis results, the NCBI database had available the
information of 178 EST sequences from a cDNA library of one L.
sativus accession inoculated with Mycosphaerella pinodes (Skiba et
al., 2005), 89 nucleotide sequences mainly from Bowman–Birk
protease inhibitor (BBI) coding sequences (41 accessions) and
chloroplast sequences (21 accessions) and 216 protein sequences (44
amino acid sequences from BBI, 150 sequences from chloroplast
proteins), for L. cicera these numbers were reduced to 4 internal
transcribed spacers (ITS), 1 antifungal protein DNA sequence, 1
convicilin gene sequence, 26 sequences from chloroplast regions and
4 protein amino-acid sequences.
In order to perform precision plant breeding through marker
assisted selection (MAS), it is necessary to identify the genetic regions
that are closely linked to the genetic control of a particular trait of
Chapter 1 ___________________________________________________________________
18
interest. Once an interesting plant trait is found associated with a
marker (or more), plants can be selected, using a genetic screen with
those markers, early on its growth stage. This selection allows a faster
and more efficient breeding process.
Linkage maps are a representation of the relative position of
genetic regions in the genome, taking into account the recombination
frequency of those genetic regions in a segregating mapping
population. Until now only two linkage maps using molecular markers
were developed for L. sativus. One developed by Chowdhury
and Slinkard (1999), using eleven Random Amplified Polymorphic
DNA (RAPD) markers, one isozyme marker and one
morphological trait (flower colour). The other linkage map was
constructed by Skiba et al. (2004a), using 47 RAPDs, 7 cross-
amplified pea microsatellite (SSR) markers and 13 Cleaved
Amplified Polymorphic Sequence (CAPS) markers and was used
to study the genetic basis of resistance to ascochyta blight.
Nevertheless, these maps were not informative enough to allow
bridging the information between them, as reviewed by Vaz Patto et
al. (2006b).
Existing molecular markers specific or cross-amplification
studies in grass pea included the work of Shiferaw et al. (2011), that
successfully amplified nine EST-SSRs (expressed sequence tag -
simple sequence repeats) developed from the EST sequences of Skiba
et al. (2005) and 12 EST-SSRs from M. truncatula, which have been
previously proven to be transferable to other legume species by
Gutierrez et al. (2005). Lioi et al. (2011) were able to genotype in a
grass pea diversity study, 10 SSRs developed from nucleotide
sequences stored at public databases, being nine from L. sativus
sequences and one from a L. japonicus sequence.

General introduction ___________________________________________________________________
19
Plant response to pathogens consists on the activation of
several layers of defence, in a constant arms race between host and
pathogen (Wirthmueller et al., 2013). After a compatible interaction,
general defence mechanisms consist in perception through a panoply
of receptors (Helliwell and Yang, 2001), that will mediate the
expression of genes involved in hormone signalling, like the salicylic
acid, jasmonic acid and ethylene pathways (Bari and Jones, 2009),
leading to the reinforcement of plant cell wall through the production of
callose or lignin, and the production of antimicrobial compounds in
order to restrain pathogen development (Glazebrook, 2005).
Plants respond differentially to biotroph or necrotroph attack
(Glazebrook, 2005). The most effective defence mechanism against
biotrophic pathogens is the programmed cell death, preventing the
pathogen from colonize adjacent host cells. On the other hand,
necrotrophic pathogens feed from the debris of plant cells, and then
benefit from the activation of the host cell death (Mengiste, 2012).
Therefore, an efficient defence response of the plant relies on a
dynamic recognition mechanism in order to prevent pathogen
colonization.
The development of new molecular tools will allow the
identification of candidate genes acting in the different phases of the
host/pathogen interaction, increasing the knowledge on the defence
mechanisms of Lathyrus spp.. Prior to the inclusion of this thesis results
the only grass pea expression analysis existing was performed by
Skiba et al. (2005), identifying 29 potential defence related genes
differentially expressed in response to M. pinodes inoculation. These
included genes associated with pathogen recognition, the
phenylpropanoid pathway, hypersensitivity, pathogenesis-related and
disease resistance response proteins.

Chapter 1 ___________________________________________________________________
20
1.10. Objectives
This thesis applies new technological advances in genetics and
genomics to explore the genetics and mechanisms underlying Lathyrus
spp. resistance to different pathogens. We have also developed new
molecular tools to support future breeding efforts in these species.
In chapter 2, we aimed at evaluating the transferability of
molecular markers developed for close related legume species to
Lathyrus spp. and test the application of those new molecular tools on
Lathyrus mapping and diversity analysis.
In chapter 3 and 5, efforts were made to unveil the different
molecular responses, by a transcriptomic approach, of susceptible and
resistant phenotypes of L. sativus (Chapter 3) and L. cicera (Chapter
5) to rust inoculation, and to develop new SSR and single nucleotide
polymorphism (SNP) molecular markers from the RNA-Seq data
generated.
In chapter 4, we aimed to elucidate the molecular responses,
using deepSuperSAGE, of a resistant L. sativus genotype upon
inoculation with Ascochyta lathyri.
In chapter 6, the objective was to develop the first linkage map
for L. cicera and perform QTL analysis for resistance to rust and
powdery mildew in this species and the first co-linearity studies with the
model Medicago truncatula.
Finally, in chapter 7 it is discussed how the obtained results
allowed the data integration in order to develop new molecular tools for
Lathyrus ssp., providing a highly valuable resource for future smart
breeding approaches in these previously under-researched, valuable
legume crops.

General introduction ___________________________________________________________________
21
1.11. Acknowledgments
Part of this chapter is included in the book chapter “Grass pea”,
Grain Legumes, Series Handbook of Plant Breeding. (New York,
U.S.A.: Springer Science+Business Media) where NFA drafted the
manuscript and DR and MCVP revised the manuscript critically.
1.12. References Abd El-Moneim, A.M., Van Dorrestein, B., Baum, M., and Mulugeta, W.
(2000). Improving the nutritional quality and yield potential of grasspea (Lathyrus sativus L.). Food & Nutrition Bulletin 21, 493-496.
Abd El Moneim, A., Van Dorrestein, B., Baum, M., Ryan, J., and Vejiga, G. (2001). Role of ICARDA in improving the nutritional quality and yield potential of grasspea (Lathyrus sativus L.) for subsistence farmers in dry areas. Lathyrus Lathyrism Newsletter 2, 55-58.
Agrios, G.N. (2005). Plant Pathology. New York, U.S.A.: Elsevier Academic Press.
Asmussen, C.B., and Liston, A. (1998). Chloroplast DNA characters, phylogeny, and classification of Lathyrus (Fabaceae). American Journal of Botany 85, 387-401.
Bari, R., and Jones, J.G. (2009). Role of plant hormones in plant defence responses. Plant Molecular Biology 69, 473-488.
Barik, D.P., Mohapatra, U., and Chand, P.K. (2005). Transgenic grasspea (Lathyrus sativus L.): factors influencing agrobacterium-mediated transformation and regeneration. Plant Cell Reports 24, 523-531.
Barilli, E., Moral, A., Sillero, J.C., and Rubiales, D. (2012). Clarification on rust species potentially infecting pea (Pisum sativum L.) crop and host range of Uromyces pisi (Pers.) Wint. Crop Protection 37, 65-70.
Barilli, E., Satovic, Z., Sillero, J.C., Rubiales, D., and Torres, A.M. (2011). Phylogenetic analysis of Uromyces species infecting grain and forage legumes by sequence analysis of nuclear ribosomal internal transcribed spacer region. Journal of Phytopathology 159, 137-145.
Ben Brahim, N., Combes, D., and Marrakchi, M. (2001). Autogamy and allogamy in genus Lathyrus. Lathyrus Lathyrism Newsletter 2, 21-26.
Chapter 1 ___________________________________________________________________
22
Biswas, A.K. (2007). "Induced mutation in grass pea," in Breeding of neglected and under-utilised crops, spices and herbs., eds. S.J. Ochatt & S.M. Jain. (Plymouth, U.K.: Science Publishers), 29-39.
Campbell, C.G. (1997). Promoting the conservation and use of underutilized and neglected crops. Grass pea. Lathyrus sativus L. Rome, Italy: International Plant Genetic Resources Institute.
Campbell, C.G., and Briggs, C.J. (1987). Registration of low neurotoxin content Lathyrus germplasm LS 8246. Crop Science 27, 821-821.
Campbell, C.G., Mehra, R.B., Agrawal, S.K., Chen, Y.Z., Elmoneim, A.M.A., Khawaja, H.I.T., Yadov, C.R., Tay, J.U., and Araya, W.A. (1994). Current status and future strategy in breeding grasspea (Lathyrus sativus). Euphytica 73, 167-175.
Carita, T. (2012). Influencia de la fecha de siembra, genotipo y densidad de plantas en el crecimiento, rendimiento y calidad del Lathyrus sativus L. en condiciones de secano Mediterráneo. PhD, UNIVERSIDAD DE EXTREMADURA.
Carrillo, E., Rubiales, D., Perez-De-Luque, A., and Fondevilla, S. (2013). Characterization of mechanisms of resistance against Didymella pinodes in Pisum spp. European Journal of Plant Pathology 135, 761-769.
Chowdhury, M.A., and Slinkard, A.E. (1997). Natural outcrossing in grasspea. Journal of Heredity 88, 154-156.
Chowdhury, M.A., and Slinkard, A.E. (1999). Linkage of random amplified polymorphic DNA, isozyme and morphological markers in grasspea (Lathyrus sativus). Journal of Agricultural Science 133, 389-395.
Chowdhury, M.A., and Slinkard, A.E. (2000). Genetic diversity in grasspea (Lathyrus sativus L.). Genetic Resources and Crop Evolution 47, 163-169.
Duke, J. (1981). Handbook of Legumes of World Economic Importance. New York, U.S.A.: Plennun Press.
Ellison, N.W., Liston, A., Steiner, J.J., Williams, W.M., and Taylor, N.L. (2006). Molecular phylogenetics of the clover genus (Trifolium-Leguminosae). Molecular Phylogenetics and Evolution 39, 688-705.
Erskine, W., Smartt, J., and Muehlbauer, F. (1994). Mimicry of lentil and the domestication of common vetch and grass pea. Economic Botany 48, 326-332.
Fao (2009). International treaty on plant genetic resources for food and agriculture, Food and Agriculture Organization of the United Nations (FAO). Rome, Italy: FAO (accessible at ftp://ftp.fao.org/docrep/fao/011/i0510e/i0510e.pdf).

General introduction ___________________________________________________________________
23
Fernández-Aparicio, M., Flores, F., and Rubiales, D. (2009). Field response of Lathyrus cicera germplasm to crenate broomrape (Orobanche crenata). Field Crops Research 113, 321-327.
Fernández-Aparicio, M., Flores, F., and Rubiales, D. (2012). Escape and true resistance to crenate broomrape (Orobanche crenata Forsk.) in grass pea (Lathyrus sativus L.) germplasm. Field Crops Research 125, 92-97.
Fernández-Aparicio, M., and Rubiales, D. (2010). Characterisation of resistance to crenate broomrape (Orobanche crenata Forsk.) in Lathyrus cicera L. Euphytica 173, 77-84.
Fikre, A., Korbu, L., Kuo, Y.H., and Lambein, F. (2008). The contents of the neuro-excitatory amino acid beta-ODAP (beta-N-oxalyl-L-alpha,beta-diaminopropionic acid), and other free and protein amino acids in the seeds of different genotypes of grass pea (Lathyrus sativus L.). Food Chemistry 110, 422-427.
Gcdt (2009). Strategy for the ex situ conservation of Lathyrus (grass pea), with special reference to Lathyrus sativus, L. cicera, and L. ochrus. Rome, Italy: Global Crop Diversity Trust (GCDT).
Glazebrook, J. (2005). Contrasting mechanisms of defense against biotrophic and necrotrophic pathogens. Annual Review of Phytopathology 43, 205-227.
Granati, E., Bisignano, V., Chiaretti, D., Crinò, P., and Polignano, G. (2003). Characterization of Italian and exotic Lathyrus germplasm for quality traits. Genetic Resources and Crop Evolution 50, 273-280.
Grela, E., Rybiński, W., Matras, J., and Sobolewska, S. (2012). Variability of phenotypic and morphological characteristics of some Lathyrus sativus L. and Lathyrus cicera L. accessions and nutritional traits of their seeds. Genetic Resources and Crop Evolution 59, 1687-1703.
Gurung, A.M., and Pang, E.C.K. (2011). "Lathyrus," in Wild Crop Relatives: Genomic and Breeding Resources, ed. C. Kole. (Berlin, Germany: Springer-Verlag), 117-126.
Gurung, A.M., Pang, E.C.K., and Taylor, P.W.J. (2002). Examination of Pisum and Lathyrus species as sources of ascochyta blight resistance for field pea (Pisum sativum). Australasian Plant Pathology 31, 41-45.
Gutierrez, M.V., Vaz Patto, M.C., Huguet, T., Cubero, J.I., Moreno, M.T., and Torres, A.M. (2005). Cross-species amplification of Medicago truncatula microsatellites across three major pulse crops. Theoretical and Applied Genetics 110, 1210-1217.
Hanbury, C.D., Sarker, A., Siddique, K.H.M., and Perry, M.W. (1995). Evaluation of Lathyrus germplasm in a Mediterranean type environment in south-western Australia. CLIMA Occasional

Chapter 1 ___________________________________________________________________
24
Publication (Cooperative Research Centre for Legumes in Mediterranean Agriculture) No. 8, Perth, Australia, p 23.
Hanbury, C.D., Siddique, K.H.M., Galwey, N.W., and Cocks, P.S. (1999). Genotype-environment interaction for seed yield and ODAP concentration of Lathyrus sativus L. and L. cicera L. in Mediterranean-type environments. Euphytica 110, 45-60.
Hanbury, C.D., White, C.L., Mullan, B.P., and Siddique, K.H.M. (2000). A review of the potential of Lathyrus sativus L. and L. cicera L. grain for use as animal feed. Animal Feed Science and Technology 87, 1-27.
Hanbury, C.L., and Siddique, K.H.M. (2000). Registration of 'Chalus' Lathyrus cicera L. Crop Science 40, 1199.
Helliwell, E.E., and Yang, Y. (2001). "Systemic signalling in plant defence," in eLS. (Chichester, U.K.: John Wiley & Sons, Ltd).
Heywood, V., Casas, A., Ford-Lloyd, B., Kell, S., and Maxted, N. (2007). Conservation and sustainable use of crop wild relatives. Agriculture Ecosystems & Environment 121, 245-255.
Hillocks, R., and Maruthi, M. (2012). Grass pea (Lathyrus sativus): Is there a case for further crop improvement? Euphytica 186, 647-654.
Hopf, M. (1986). "Archaeological evidence of the spread and use of some members of the Leguminosae family," in The Origin and domestication of cultivated plants: symposium, ed. C. Barigozzi. (Oxford, U.K.: Elsevier), 35-60.
Icar (2009). Project Coordinator’s Report of All India Coordinated Research Project on Mungbean, Urdbean, Lentil, Lathyrus, Rajmash and Pea. New Delhi, India: Indian Council of Agricultural Research, pp.118.
Icarda (2006). ICARDA Annual Report 2005. Aleppo, Syria: International Center for Agricultural Research in the Dry Areas. pp. 54-55.
Icarda (2007). ICARDA Annual Report 2006. Aleppo, Syria: International Center for Agricultural Research in the Dry Areas. pp. 57-58.
Jackson, M.T., and Yunus, A.G. (1984). Variation in the grass pea (Lathyrus sativus L.) and Wild-Species. Euphytica 33, 549-559.
Kenicer, G., Nieto-Blásquez, E.M., Mikić, A., and Smýkal, P. (2009). Lathyrus – diversity and phylogeny in the genus. Grain Legumes 54, 16-18.
Kenicer, G.J., Kajita, T., Pennington, R.T., and Murata, J. (2005). Systematics and biogeography of Lathyrus (Leguminosae) based on internal transcribed spacer and cpDNA sequence data. American Journal of Botany 92, 1199-1209.

General introduction ___________________________________________________________________
25
Kislev, M.E. (1989). Origins of the Cultivation of Lathyrus sativus and Lathyrus cicera (Fabaceae). Economic Botany 43, 262-270.
Kiyoshi, Y., Toshiyuki, F., and Blumenreich, I.D. (1985). "Isozymic variation and interspecific crossability in annual species of genus Lathyrus L.," in Lathyrus and Lathyrism, eds. A.K. Kaul & D. Combes. (Pau, France), 118-129.
Krause, D., and Krause, I. (2003). New green manuring Lathyrus sativus variety AC Greenfix available in USA. Lathyrus Lathyrism Newsletter 3, 13-14.
Kumar, S., Bejiga, G., Ahmed, S., Nakkoul, H., and Sarker, A. (2011). Genetic improvement of grass pea for low neurotoxin (beta-ODAP) content. Food and Chemical Toxicology 49, 589-600.
Kumar, S., Gupta, P., Barpete, S., Sarker, A., Amri, A., Mathur, P.N., and Baum, M. (2013). "Grass Pea," in Genetic and Genomic Resources of Grain Legume Improvement, eds. M. Singh, H.D. Upadhyaya & I.S. Bisht. (Oxford, U.K.: Elsevier Science), 269-292.
Kuo, Y.H., Bau, H.M., Rozan, P., Chowdhury, B., and Lambein, F. (2000). Reduction efficiency of the neurotoxin beta-ODAP in low-toxin varieties of Lathyrus sativus seeds by solid state fermentation with Aspergillus oryzae and Rhizopus microsporus var. chinensis. Journal of the Science of Food and Agriculture 80, 2209-2215.
Kupicha, F.K. (1983). The infrageneric structure of Lathyrus. Notes from the Royal Botanic Garden Edinburgh 41, 209-244.
Lal, M.S., Agrawal, I., and Chitale, M.W. (1986). "Genetic improvement of chickling vetch (Lathyrus sativus L.) in Madhya Pradesh, India," in Lathyrus and Lathyrism, eds. A.K. Kaul & D. Combes. (New York, U.S.A.: Third World Medical Research Foundation), 146-160.
Lambein, F., Ngudi, D.D., and Kuo, Y.H. (2009). Progress in prevention of toxico-nutritional neurodegenerations. http://www.atdforum.org/journal/html/200 9-34/8. Accessed July 2014.
Lioi, L., Sparvoli, F., Sonnante, G., Laghetti, G., Lupo, F., and Zaccardelli, M. (2011). Characterization of Italian grasspea (Lathyrus sativus L.) germplasm using agronomic traits, biochemical and molecular markers. Genetic Resources and Crop Evolution 58, 425-437.
Malek, M.A. (1998). "Genetic resources of grass pea (Lathyrus sativus L.) in Bangladesh. Proceedings of the IPGRIICARDA-ICAR Regional Working Group Meeting", in: Lathyrus Genetic Resources Network. (eds.) P.N. Mathur, V.R. Rao & A. R.K.

Chapter 1 ___________________________________________________________________
26
(New Delhi, India: National Bureau of Plant Genetic Resources, IPGRI).
Martín-Sanz, A., Palomo, J., Pérez De La Vega, M., and Caminero, C. (2012). Characterization of Pseudomonas syringae pv. syringae isolates associated with bacterial blight in Lathyrus spp. and sources of resistance. European Journal of Plant Pathology 134, 205-216.
Mengiste, T. (2012). Plant immunity to necrotrophs. Annual Review of Phytopathology 50, 267-294.
Mera, M. (2010). Inheritance of seed weight in large-seed grass pea Lathyrus sativus L. Chilean Journal of Agricultural Research 70, 357-364.
Mera, M., Tay, J., France, A., Montenegro, A., Espinoza, A., and Guete, N. (2003). Luanco-INIA, a large-seeded cultivar of Lathyrus sativus released in Chile. Lathyrus Lathyrism Newsletter 3, 26.
Nerkar, Y.S. (1972). Induced variation and response to selection for low neurotoxin content in Lathyrus sativus. Indian Journal of Genetics and Plant Breeding 32, 175-180.
Nerkar, Y.S. (1976). Mutation studies in Lathyrus sativus. Indian Journal of Genetics and Plant Breeding 36, 223-229.
O’connell, R.J., and Panstruga, R. (2006). Tête à tête inside a plant cell: establishing compatibility between plants and biotrophic fungi and oomycetes. New Phytologist 171, 699-718.
Ochatt, S.J., Conreux, C., and Jacas, L. (2013). Flow cytometry distinction between species and between landraces within Lathyrus species and assessment of true-to-typeness of in vitro regenerants. Plant Systematics and Evolution 299, 75-85.
Ochatt, S.J., Muneaux, E., Machado, C., Jacas, L., and Pontécaille, C. (2002a). The hyperhydricity of in vitro regenerants of grass pea (Lathyrus sativus L.) is linked with an abnormal DNA content. Journal of Plant Physiology 159, 1021-1028.
Ochatt, S.J., Sangwan, R.S., Marget, P., Ndong, Y.A., Rancillac, M., Perney, P., and Röbbelen, G. (2002b). New approaches towards the shortening of generation cycles for faster breeding of protein legumes. Plant Breeding 121, 436-440.
Pandey, R.L., Chitale, M.W., Sharma, R.N., and Rastogi, N. (1996). "Status of Lathyrus research in India. Proceedings of a Regional Workshop", in: Lathyrus Genetic Resources in Asia. (eds.) R.K. Arora, P.N. Mathur, K.W. Riley & Y. Adham. (New Delhi, India: International Plant Genetic Resourses Institute).
Parlevliet, J.E. (1979). "The co-evolution of host-parasite systems," in Parasites as plant taxonomists, Acta Universitatis Upsaliensis XXVI, ed. J. Hedberg.), 39-45.

General introduction ___________________________________________________________________
27
Peever, T.L. (2007). Role of host specificity in the speciation of Ascochyta pathogens of cool season food legumes. European Journal of Plant Pathology 119, 119-126.
Peña-Chocarro, L., and Peña, L.Z. (1999). History and traditional cultivation of Lathyrus sativus L. and Lathyrus cicera L. in the Iberian peninsula. Vegetation History and Archaeobotany 8, 49-52.
Rahman, M.M., Kumar, J., Rahman, M.A., and Ali Afzal, M. (1995). Natural outcrossing in Lathyrus sativus L. Indian Journal of Genetics & Plant Breeding 55, 204-207.
Roy, P.K., All, K., Gupta, A., Barat, G.K., and Mehta, S.L. (1993). β-N-Oxalyl-L-α, β-diaminopropionic acid in somaclones derived from internode explants of Lathyrus sativus. Journal of Plant Biochemistry and Biotechnology 2, 9-13.
Rubiales, D., and Fondevilla, S. (2012). Future prospects for ascochyta blight resistance breeding in cool season food legumes. Frontiers in Plant Science 3, 27.
Rubiales, D., Sillero, J.C., and Emeran, A.A. (2013). Response of vetches (Vicia spp.) to specialized forms of Uromyces vicia-fabae and to Uromyces pisi. Crop Protection 46, 38-43.
Rybinski, W. (2003). Mutagenesis as a tool for improvement of traits in grass pea (Lathyrus sativus L.). Lathyrus Lathyrism Newsletter 3, 30-34.
Schaefer, H., Hechenleitner, P., Santos-Guerra, A., Sequeira, M.M.D., Pennington, R.T., Kenicer, G., and Carine, M.A. (2012). Systematics, biogeography, and character evolution of the legume tribe Fabeae with special focus on the middle-Atlantic island lineages. BMC Evolutionary Biology 12, 250.
Shiferaw, E., Pè, M., Porceddu, E., and Ponnaiah, M. (2011). Exploring the genetic diversity of Ethiopian grass pea (Lathyrus sativus L.) using EST-SSR markers. Molecular Breeding 30, 789-797.
Siddique, K.H.M., Hanbury, C.L., and Sarker, A. (2006). Registration of ‘Ceora’ grass pea registration by CSSA. Crop Science 46, 986-986.
Sillero, J.C., Cubero, J.I., Fernández-Aparicio, M., and Rubiales, D. (2005). Search for resistance to crenate broomrape (Orobanche crenata) in Lathyrus. Lathyrus Lathyrism Newsletter 4, 7-9.
Sillero, J.C., Fondevilla, S., Davidson, J., Patto, M.C.V., Warkentin, T.D., Thomas, J., and Rubiales, D. (2006). Screening techniques and sources of resistance to rusts and mildews in grain legumes. Euphytica 147, 255-272.
Skiba, B., Ford, R., and Pang, E.C.K. (2004a). Construction of a linkage map based on a Lathyrus sativus backcross population

Chapter 1 ___________________________________________________________________
28
and preliminary investigation of QTLs associated with resistance to ascochyta blight. Theoretical and Applied Genetics 109, 1726-1735.
Skiba, B., Ford, R., and Pang, E.C.K. (2004b). Genetics of resistance to Mycosphaerella pinodes in Lathyrus sativus. Australian Journal of Agricultural Research 55, 953–960.
Skiba, B., Ford, R., and Pang, E.C.K. (2005). Construction of a cDNA library of Lathyrus sativus inoculated with Mycosphaerella pinodes and the expression of potential defence-related expressed sequence tags (ESTs). Physiological and Molecular Plant Pathology 66, 55-67.
Smartt, J. (1984). Evolution of grain legumes .1. Mediterranean pulses. Experimental Agriculture 20, 275-296.
Smith, P.H., Foster, E.M., Boyd, L.A., and Brown, J.K.M. (1996). The early development of Erysiphe pisi on Pisum sativum L. Plant Pathology 45, 302-309.
Smýkal, P., Kenicer, G., Flavell, A.J., Corander, J., Kosterin, O., Redden, R.J., Ford, R., Coyne, C.J., Maxted, N., Ambrose, M.J., and Ellis, N.T.H. (2011). Phylogeny, phylogeography and genetic diversity of the Pisum genus. Plant Genetic Resources 9, 4-18.
Staples, R.C. (2000). Research on the rust fungi during the twentieth century. Annual Review of Phytopathology 38, 49-69.
Tadesse, W., and Bekele, E. (2003). Phenotypic diversity of Ethiopian grass pea (Lathyrus sativus L.) in relation to geographical regions and altitudinal range. Genetic Resources and Crop Evolution 50, 497-505.
Talukdar, D. (2009). Dwarf mutations in grass pea (Lathyrus sativus L.): origin, morphology, inheritance and linkage studies. Journal of Genetics 88, 165-175.
Talukdar, D. (2011). Isolation and characterization of NaCl-tolerant mutations in two important legumes, Clitoria ternatea L. and Lathyrus sativus L.: Induced mutagenesis and selection by salt stress. Journal of Medicinal Plants Research 5, 3619-3628.
Tivoli, B., and Banniza, S. (2007). Comparison of the epidemiology of ascochyta blights on grain legumes. European Journal of Plant Pathology 119, 59-76.
Tivoli, B., Baranger, A., Avila, C.M., Banniza, S., Barbetti, M., Chen, W.D., Davidson, J., Lindeck, K., Kharrat, M., Rubiales, D., Sadiki, M., Sillero, J.C., Sweetingham, M., and Muehlbauer, F.J. (2006). Screening techniques and sources of resistance to foliar diseases caused by major necrotrophic fungi in grain legumes. Euphytica 147, 223-253.

General introduction ___________________________________________________________________
29
Vaz Patto, M.C., Fernández-Aparicio, M., Moral, A., and Rubiales, D. (2006a). Characterization of resistance to powdery mildew (Erysiphe pisi) in a germplasm collection of Lathyrus sativus. Plant Breeding 125, 308-310.
Vaz Patto, M.C., Fernández-Aparicio, M., Moral, A., and Rubiales, D. (2007). Resistance reaction to powdery mildew (Erysiphe pisi) in a germplasm collection of Lathyrus cicera from Iberian origin. Genetic Resources and Crop Evolution 54, 1517-1521.
Vaz Patto, M.C., Fernández-Aparicio, M., Moral, A., and Rubiales, D. (2009). Pre and posthaustorial resistance to rusts in Lathyrus cicera L. Euphytica 165, 27-34.
Vaz Patto, M.C., Hanbury, C.D., Moorhem, M.V., Lambein, F., Ochatt, S.J., and Rubiales, D. (2011). "Grass Pea," in Genetics, Genomics and Breeding of Cool Season Grain Legumes, ed. C. Kole. (Enfield, U.S.A.: Science Publishers), 151-204.
Vaz Patto, M.C., and Rubiales, D. (2009). Identification and characterization of partial resistance to rust in a germplasm collection of Lathyrus sativus L. Plant Breeding 128, 495-500.
Vaz Patto, M.C., and Rubiales, D. (2014a). Lathyrus diversity: available resources with relevance to crop improvement – L. sativus and L. cicera as case studies. Annals of Botany 113, 895-908.
Vaz Patto, M.C., and Rubiales, D. (2014b). Resistance to rust and powdery mildew in Lathyrus crops. Czech Journal of Genetics and Plant Breeding 50, 116-122.
Vaz Patto, M.C., Skiba, B., Pang, E.C.K., Ochatt, S.J., Lambein, F., and Rubiales, D. (2006b). Lathyrus improvement for resistance against biotic and abiotic stresses: From classical breeding to marker assisted selection. Euphytica 147, 133-147.
Wirthmueller, L., Maqbool, A., and Banfield, M.J. (2013). On the front line: structural insights into plant-pathogen interactions. Nature Reviews Microbiology 11, 761-776.
Wojciechowski, M.F., Lavin, M., and Sanderson, M.J. (2004). A phylogeny of legumes (Leguminosae) based on analysis of the plastid matK gene resolves many well-supported subclades within the family. American Journal of Botany 91, 1846-1862.
Yadav, C.R. (1996). "Genetic evaluation and varietal improvement of grasspea in Nepal," in Lathyrus Genetic Resources in Asia: Proc Regional Workshop. Indira Gandhi Agricultural University, Raipur, India. IPGRI Office for South Asia, New Delhi, India, pp 21-28., eds. R.K. Arora, P.N. Mathur, K.W. Riley & Y. Adham.).
Yang, H.-M., and Zhang, X.-Y. (2005). Considerations on the reintroduction of grass pea in China. Lathyrus Lathyrism Newsletter 4, 22-26.

Chapter 1 ___________________________________________________________________
30
Yunus, A.G., and Jackson, M.T. (1991). The gene pools of the grasspea (Lathyrus sativus L.). Plant Breeding 106, 319-328.
Zambre, M., Chowdhury, B., Kuo, Y.-H., Van Montagu, M., Angenon, G., and Lambein, F. (2002). Prolific regeneration of fertile plants from green nodular callus induced from meristematic tissues in Lathyrus sativus L. (grass pea). Plant Science 163, 1107-1112.

31
CHAPTER 2
Transferability of molecular markers from major legumes to Lathyrus spp. for their
application in mapping and diversity studies
The work presented in this chapter was mostly performed by Nuno
Felipe Almeida (see Acknowledgements section), and corresponds to
the following publication:
Almeida, N.F., Leitão, S.T., Caminero, C., Torres, A.M., Rubiales, D.,
and Vaz Patto, M.C. (2014). Transferability of molecular markers from
major legumes to Lathyrus spp. for their application in mapping and
diversity studies. Molecular Biology Reports 41, 269-283.


Cross-species amplification ___________________________________________________________________
33
2.1. Abstract
Lathyrus cicera L. (chickling pea) and L. sativus L. (grass pea)
have great potential among grain legumes due to their adaptability to
inauspicious environments, high protein content and resistance to
serious diseases. Nevertheless, due to its past underused, further
activities are required to exploit this potential and to capitalise on the
advances in molecular biology that enable improved Lathyrus spp.
breeding programmes. In this study we evaluated the transferability of
molecular markers developed for closely related legume species to
Lathyrus spp. (Medicago truncatula, pea, lentil, fababean and lupin)
and tested the application of those new molecular tools on Lathyrus
mapping and diversity studies. Genomic and expressed sequence tag
microsatellite (gSSR and EST-SSR), intron-targeted amplified
polymorphic (ITAP), resistance gene analogue (RGA) and defence-
related gene (DR) markers were tested. In total 128 (27.7%) and 132
(28.6%) molecular markers were successfully cross-amplified,
respectively in L. cicera and L. sativus. In total, the efficiency of
transferability from genomic microsatellites was 5%, and from gene-
based markers, 55%. For L. cicera, three Cleaved Amplified
Polymorphic Sequence markers (CAPS) and one derived Cleaved
Amplified Polymorphic Sequence marker (dCAPS) based on the
cross-amplified markers were also developed. Nine of those
molecular markers were suitable for mapping in a L. cicera
Recombinant Inbred Line (RIL) population. From the 17 molecular
markers tested for diversity analysis, six (35%) in L. cicera and seven
(41%) in L. sativus were polymorphic and discriminate well all the L.
sativus accessions. Additionally, L. cicera accessions were clearly
distinguished from L. sativus accessions. This work revealed a high
number of transferable molecular markers to be used in current

Chapter 2 ___________________________________________________________________
34
genomic studies in Lathyrus spp.. Although their usefulness was
higher on diversity studies, they represent the first steps for future
comparative mapping involving these species.
2.2. Introduction
Lathyrus sativus L. (grass pea) and L. cicera L. (chickling pea)
are legume crops with considerable potential in dryland farming
systems of semi-arid regions. Their ability to provide an economic
yield under adverse conditions made them popular crops in
subsistence farming in many developing countries, offering great
potential for use in marginal low-rainfall areas (Campbell, 1997).
Although widespread in the past, both as forage and grain crops, they
are now rarely grown in Europe due to yield unpredictability and the
presence of anti-nutritional substances. However, a renewed interest
in its reintroduction in cropping systems in Southern Australia and
North America is growing because of their high agronomic potential
(Hanbury et al., 2000; Rao and Northup, 2011; Calderón et al., 2012;
Gusmao et al., 2012). In Europe, their cultivation is justified by the
need to recover marginal lands, providing also an efficient alternative
to the areas overexploited by cereal cultivation (Vaz Patto et al.,
2006b; Tavoletti and Iommarini, 2007; Grela et al., 2012; Martín-Sanz
et al., 2012). Moreover, a large variation has been found in Lathyrus
spp. germplasm regarding the resistance for common diseases in
grain legumes (Vaz Patto et al., 2006a; 2007; 2009; Vaz Patto and
Rubiales, 2009).
L. sativus and L. cicera are diploid (2n = 14) and primarily self-
pollinated (Ben Brahim et al., 2001). Due to Lathyrus large genome
size, circa 8.2 Gb in L. sativus and circa 6.8 Gb in L. cicera (reviewed

Cross-species amplification ___________________________________________________________________
35
by Bennett and Leitch, 2012) and little economic relevance in
developed countries, not much progress has been attained on the
study of the genetic control of important traits such as disease
resistance, hampering the development of modern cultivars or the
introgression of their interesting traits in other related species. Until
now only two linkage maps using molecular markers were developed
for L. sativus (Chowdhury and Slinkard, 1999; Skiba et al., 2004), but
these maps were not informative enough to bridge that information
between both of them, as reviewed by Vaz Patto et al. (2006b).
Cross-species and cross-genus amplification of molecular
markers is now a common strategy for the discovery of markers to
use on the not so well studied species (Castillo et al., 2008; Ellwood
et al., 2008). Molecular markers from genomic libraries (genomic
microsatellites, gSSRs) and/or derived from expressed sequence
tags from the most important crops or model species, are now
frequently used on diversity, evolutionary and mapping studies in
other related species (Xu et al., 2004; Zhang et al., 2007; Feng et al.,
2009; Datta et al., 2010; Harris-Shultz et al., 2012). These valuable
tools can also be used for comparative mapping between underused
food and feed legume crops and the model species. Within the
Fabaceae family, this relationship can work both ways (Varshney et
al., 2009; Parra-Gonzalez et al., 2012) for the “orphan” species, well
studied and phylogenetically close species can provide molecular
tools for genetic and genomic studies; and in the opposite direction,
underused crops such as the Lathyrus spp. can be a source of
interesting genes such as biotic and abiotic resistance. From the
better genetically characterized legume species (Kumar et al., 2012),
Pisum sativum L. is reported as the closest related to Lathyrus,
followed by lentil, faba bean, Medicago, chickpea and Lotus

Chapter 2 ___________________________________________________________________
36
(Asmussen and Liston, 1998; Wojciechowski et al., 2004; Smýkal et
al., 2011; Schaefer et al., 2012).
In this study we evaluated the transferability of molecular
markers developed for Medicago truncatula Gaertn., P. sativum
(pea), Lens culinaris Medik. (lentil), Lupinus spp. and Vicia faba L.
(faba bean), to Lathyrus spp. and tested the application of those new
molecular tools on Lathyrus mapping and diversity studies. This
represents the first steps for future comparative mapping in Lathyrus
spp..
2.3. Methods
2.3.1. Plant Material and DNA isolation
For the cross-amplification screening two L. sativus
accessions (BGE015746, BGE024709) and two L. cicera accessions
(BGE008277, BGE023542), kindly provided by the Plant Genetic
Resources Centre (CRF-INIA), Madrid, Spain were used. These
accessions were already evaluated for resistance against rust and
powdery mildew, and showed, within each particular species,
contrasting phenotypes (Vaz Patto et al., 2006a; 2007; 2009; Vaz
Patto and Rubiales, 2009). Cross-amplification controls used were:
the P. sativum cv. ‘Messire’ and the P. sativum subsp. syriacum
accession P665, parents of a recombinant inbred line RILs mapping
population (Fondevilla et al., 2008; Fondevilla et al., 2010; Fondevilla
et al., 2011), the L. culinaris cv. ‘Armuña’, the M. truncatula cv.
‘Jemalong’ and the V. faba accession Vf136. To validate the
usefulness of transferable markers for diversity studies, 20
accessions randomly chosen of L. sativus and L. cicera (10 of each)
from the CRF-INIA collection were used (Table 2.1). To validate

Cross-species amplification ___________________________________________________________________
37
usefulness of the transferable markers in the development of a
linkage map, 103 individuals from a L. cicera RILs F5 population,
segregating for several fungal diseases resistance, were used. DNA
from fresh young leaves was extracted using a modified CTAB
protocol developed by Torres et al. (1993).
Table 2.1 – Lathyrus cicera and Lathyrus sativus accession references at the CRF-INIA germplasm bank. For more information consult: http://wwwx.inia.es/crf/WWWCRF/CRFing/PaginaPrincipal.asp
CRF-INIA accession
Collection site Species
Latitude Longitude Altitude (m) BGE001043 374329N 0035758W 753 Lathyrus cicera L. BGE001164 385138N 0060555W 287 Lathyrus cicera L. BGE008277 385633N 0031416W 770 Lathyrus cicera L. BGE010898 424901N 0042242W 991 Lathyrus cicera L. BGE018818 395520N 0025259W 870 Lathyrus cicera L. BGE022223 373857N 0020422W 839 Lathyrus cicera L. BGE023542 373149N 0033908W 1084 Lathyrus cicera L. BGE023558 - - - Lathyrus cicera L. BGE023562 - - - Lathyrus cicera L. BGE027064 365251N 0031752W 684 Lathyrus cicera L. BGE001489 385403N 0030311W 863 Lathyrus sativus L. BGE002259 420039N 0060233W 750 Lathyrus sativus L. BGE003490 420039N 0060233W 750 Lathyrus sativus L. BGE015744 384210N 002361W 870 Lathyrus sativus L. BGE015746 394454N 0015846W 991 Lathyrus sativus L. BGE018800 400835N 0013801W 1237 Lathyrus sativus L. BGE023247 424425N 0063930W 670 Lathyrus sativus L. BGE023500 420032N 0043200W 734 Lathyrus sativus L. BGE023552 - - - Lathyrus sativus L. BGE023553 - - - Lathyrus sativus L. BGE024709 290935N 0132947W 241 Lathyrus sativus L. BGE029748 400833N 0032516W 753 Lathyrus sativus L.

Chapter 2 ___________________________________________________________________
38
2.3.2. Microsatellite markers
Two hundred and twenty seven simple sequence repeat
(SSRs) primer pairs (Loridon et al., 2005), from which 42 expressed
sequence tag microsatellite (EST-SSR) markers (Burstin et al., 2001)
and 185 gSSR markers (Pea Microsatellite Consortium set up by
Agrogène Inc., Moissy-Cramayel, France) developed for pea, 30
primer pairs of gSSR markers developed for lentil (Hamwieh et al.,
2005) and 25 gSSR primer pairs developed for faba bean (Pozarkova
et al., 2002) were tested (see ESM 2.1 for sequences and optimized
annealing temperature (Ta)).
PCR reactions were conducted in a total volume of 15 μl using
a Biometra Uno II thermal cycler, containing 20 ng of template DNA,
0.2 μM of forward primer and of reverse primer, 0.2 mM of each
dNTP, 1.5-2 mM of MgCl2, and 0.6 units of Taq DNA polymerase
(Promega, Madison, USA). The amplification reaction consisted of a
denaturing step of 2 min at 95ºC, followed by 35 cycles of 30 s at
94ºC, 30 s at the optimized annealing temperature (Ta), and 30 s at
72ºC. For the pea EST-SSRs and gSSRs and lentil gSSRs Ta was
optimized using as starting point the optimal temperature described
for the donor species (see ESM 2.1). For the faba bean gSSRs Ta
was optimized using 58ºC as initial temperature. The reaction was
terminated at 72ºC for 5 min. SSR fragments were resolved using a
1.5 % Seaken LE TBE agarose gel (Lonza, Rockland, USA) with 0.5
μg/L ethidium bromide and visualised using a GEL-DOC 1000
System (Bio-Rad, Hercules, USA).
Cross-species amplification ___________________________________________________________________
39
2.3.3. Intron-Targeted Amplified Polymorphic markers, Defence-Related Genes and Resistance Gene Analogues
One hundred fifty six primers pairs of intron-targeted amplified
polymorphic (ITAPs) markers from M. truncatula, P. sativum and
Lupinus spp. were tested on the Lathyrus spp. lines (Phan et al.,
2007; Ellwood et al., 2008). These markers were developed after
sequence alignments of M. truncatula and Lupinus spp. (ITAP ML)
(Nelson et al., 2010), M. truncatula, Lupinus albus and Glycine max
(ITAP MLG) (Phan et al., 2007), M. truncatula and M. sativa (ITAP
MP) (Choi et al., 2004). The ITAPs from the Grain Legume Integrated
Program (ITAP GLIP) were developed mainly from sequence
alignments of M. truncatula and pea as referred by Ellwood et al.
(2008). Additionally, primer pairs designed for 12 defence-related
(DR) genes and 12 (putative nucleotide-binding site leucine-rich
repeat, NBS-LRR, type) resistance gene analogues (RGAs)
developed for pea (Prioul-Gervais et al., 2007), were tested with the
Lathyrus accessions previously described. A full list with all primers’
sequence, Ta and cited reference can be found in ESM 2.1. The
molecular markers from the GLIP project are also available at the
website (http://bioweb.abc.hu/cgi-mt/pisprim/pisprim.pl).
PCR reactions were conducted in a total volume of 20 µl,
containing 30 ng of template DNA, 0.6 µM of forward primer and of
reverse primer, 0.2 mM of each dNTP, 1.5-2 mM of MgCl2, and 1 U of
Taq DNA polymerase (Biotools, Madrid, Spain). The amplification
reaction consisted of a denaturing step of 5 min at 95ºC, followed by
40 cycles of 60 s at 95ºC, 60 s at 58-62ºC, and 2 min at 72ºC (see
ESM 2.1 for sequences and Ta). The reaction was terminated at 72ºC
for 8 min. The amplified fragments were resolved using 2 % w/v (1 %
w/v Seakem, 1 % w/v NuSieve) agarose gels in 1 x TBE buffer. Gels

Chapter 2 ___________________________________________________________________
40
were stained with ethidium bromide and photographed under UV light
using the software KODAK Digital Science 1D Ver. 2.0 and 3.5.
2.3.4. Sequencing
All primer combinations were amplified at least two times to
rule out nonspecific amplicons or the possibility of PCR failure. Primer
pairs that produced a complex amplification pattern or presented non
consistent amplicon sizes after the second PCR reaction were not
further analysed. Primers producing one band in Lathyrus spp. of
similar length to the donor species were re-amplified and resolved in
a 4 % Metaphor gel (Lonza, Rockland, USA), to confirm the presence
of a single band.
PCR products that originated one confirmed single amplicon
were purified using MultiScreen PCRµ96 Filter Plate, (Millipore,
Billerica, USA) and sequenced in both directions using BigDye
Terminator 3 on an ABI 3730XL sequencer (Applied Biosystems).
Obtained sequences were aligned against the donor sequence, using
the software Geneious (Drummond et al., 2011), to confirm the
amplification of the same locus.
2.3.5. Segregation and diversity studies
To test the applicability of the cross amplified markers for
mapping and diversity studies, an M13 tail was added to the 5’-end of
the forward primers, allowing them to be labelled with IRD
fluorescence (Schuelke, 2000), to allow resolution using a LI-COR
4300 DNA Analyzer (Lincoln, NE, USA). PCR reactions were
conducted in a total volume of 10 µl containing 10 ng of template

Cross-species amplification ___________________________________________________________________
41
DNA, 0.04 µM of M13(-21) tagged forward primer, 0.16 µM of IRD700
or IRD 800 M13(-21) and 0.16 µM of reverse primer, 0.2 mM of each
dNTP, 1.5 mM of MgCl2, and 0.2 unit of Taq DNA polymerase
(Promega, Madison, USA). The amplification reaction consisted of a
denaturing step of 5 min at 94ºC, followed by 30 cycles of 30 s at
94ºC, 45 s at 56ºC, 45 s at 72ºC, and 8 cycles of 30 s at 94ºC, 45 s at
53ºC, 45 s at 72ºC. The reaction was terminated at 72ºC for 10 min.
For the segregation study of each assessed marker, a chi-
square analysis was used to test for deviations from the expected 1:1
segregation ratio in the RIL population. For the diversity study,
statistics on diversity, including number of alleles per locus, major
allele frequency, gene diversity, heterozygosity and Polymorphic
Information Content (PIC) values, were computed using the software
PowerMarker (Liu and Muse 2005). The proportion-of-shared-alleles
distance (Dpsa; Bowcock et al., 1994) between pairs of accessions
was calculated using the MICROSAT software (Minch et al., 1997).
Cluster analysis based on distance matrix was performed using the
Neighbor-Joining algorithm as implemented in NEIGHBOR program
of the PHYLIP ver. 3.6b software package (Felsenstein, 2004). The
reliability of the tree topology was assessed via bootstrapping
(Felsenstein, 1985) over 1000 replicates generated by MICROSAT
and subsequently used in NEIGHBOR and CONSENSE program in
PHYLIP.
2.3.6. Cleaved Amplified Polymorphic Sequence and derived Cleaved Amplified Polymorphic Sequence markers for mapping
Using the sequence information of the cross-amplified
monomorphic markers from both L. cicera RILs parental lines,

Chapter 2 ___________________________________________________________________
42
restriction regions overlapping single nucleotide polymorphisms
(SNPs) where detected using the Geneious software (Drummond et
al., 2011) in order to design polymorphic cleaved amplified
polymorphic sequence CAPS markers. When there were no
restriction sites suitable to design CAPS markers for the SNP
screening, derived cleaved amplified polymorphic sequence (dCAPS)
markers were designed using the web based program dCAPS Finder
2.0 (Neff et al., 2002). See Table 2.2 for details on the SNPs,
restriction enzymes, CAPS and dCAPS designed primers. PCR
products were digested with the suitable enzyme (FastDigest,
Fermentas), following the manufactures’ instructions. Digestion
products were then resolved in 1.75 % Seaken LE agarose gel
(Lonza, Rockland, USA) with SYBRSafe (Invitrogen, Eugene, USA)
and visualised using a GEL-DOC 1000 System (Bio Rad, Hercules,
USA).
2.4. Results and discussion
This study was performed to provide new molecular tools for
L. cicera and L. sativus, since the few specific molecular markers
developed so far for the construction of a linkage map in L. sativus
(Skiba et al., 2003) were unsuitable to perform molecular studies in
our Lathyrus spp. working accessions. One important constrain when
using those molecular markers was that the 17 markers tested were
all monomorphic between our mapping accessions of interest
(BGE008277, BGE023542 and BGE015746, BGE024709) (data not
shown). In order to obtain these new tools, we determined the
transferability rate of different types of molecular markers developed
for Lathyrus related species and tested their applicability for mapping
and diversity studies in Lathyrus spp.

Tabl
e 2.
2 –
Char
acte
ristic
s of
dev
elop
ed C
APS
and
dCAP
S m
arke
rs.
Mar
ker n
ame
Mar
ker
type
Re
stric
tion
Enzy
me
Forw
ard
prim
er (5
'–3'
)a Re
vers
e pr
imer
(5'–
3')a
T a
(ºC)
Psm
t_ES
T_00
196_
01_1
C
AP
S N
laIII
TG
GA
TTG
GTA
GG
AG
AC
TCG
G
TAG
TTA
TGC
TCA
TGG
CG
CTG
55
SHM
T C
AP
S H
infI
TTG
CTG
AGAA
CC
TGC
TCTT
GG
TATG
A
CC
AC
AAC
TCA
CA
AG
TCA
CTT
C
58
Pis_
GEN
_7 _
1_2
_1
CA
PS
Alu
I A
GTG
CTC
CTA
GC
ATA
GC
CC
A TT
GA
TGG
CA
GC
TAC
AG
CA
AG
60
Pis_
GEN
_7 _
1_2
_1
CA
PS
Dra
I A
GTG
CTC
CTA
GC
ATA
GC
CC
A TT
GA
TGG
CA
GC
TAC
AG
CA
AG
60
tRAL
S C
AP
S A
luI
GC
AA
TTC
CC
TCC
TCA
GC
TAAA
AGTG
G
GTC
TGC
GA
GC
TGTT
TTTG
GAG
AA
G
60
tRAL
S C
AP
S R
saI
GC
AA
TTC
CC
TCC
TCA
GC
TAAA
AGTG
G
GTC
TGC
GA
GC
TGTT
TTTG
GAG
AA
G
60
mtm
t_G
EN_0
1947
_02_
1 C
AP
S M
seI
GG
AG
CA
CG
GTG
TTC
TCTC
TC
GTA
AAG
TTG
CC
AG
CC
CAT
GT
60
mtm
t_G
EN_0
0036
_02_
1_dC
APS
dCA
PS
Hin
fI C
AA
AAG
GA
ATTG
CA
CG
TTA
CTG
A
ATG
AC
GG
TAG
CTT
GG
ATG
G
43
SHM
T_dC
APS
dCA
PS
Alu
I G
CTA
AAC
CG
GTA
ATG
GTA
TAG
A
CC
AC
AAC
TCA
CA
AG
TCA
CTT
C
45
Lup1
85_d
CAP
S dC
AP
S R
saI
CC
AC
TTTC
CA
TGA
CAA
ATC
T A
AAAA
TTA
GTA
TGG
TCC
AG
TA
45
Peaβglu_dC
APS
dCA
PS
Alu
I C
TCTT
TCC
CTC
CA
TCTA
AAAG
A
AAC
AAC
AA
CA
TTC
AC
CC
AA
CC
45
Peaβglu_dC
APS
dCA
PS
Dra
III
AC
AG
TATG
TTC
TAC
CTG
CAA
CAC
AA
AG
AAA
CAA
CA
AC
ATT
CA
CC
CA
AC
C
45
DRR2
06-d
_dC
APS
dCA
PS
Hpa
I C
AC
CTC
AAT
CC
CA
CTT
TGT
AAA
GAA
CTT
GA
TATA
AAC
AC
C
47
a bas
e m
ism
atch
intro
duce
d in
dC
APS
prim
ers
are
in b
old
and
unde
rline
d
Cross-species amplification ___________________________________________________________________
43

Chapter 2 ___________________________________________________________________
44
2.4.1. Transferability of microsatellites to Lathyrus spp.
EST-SSR markers (in this case only developed for pea) were
the ones presenting the higher rates of simple pattern amplification on
the two Lathyrus spp. (33.3 % and 42.9 % on L. cicera and L. sativus
respectively) from all the tested marker types (Figure 2.1). These
values dropped quite dramatically when analysing the general results
of the gSSR markers (Figure 2.1). From the lentil gSSR tested, not
even one marker successfully amplified one single fragment in L.
sativus.
The two Lathyrus species presented very similar results when
analysing the non-simple patterns of amplification obtained with the
pea EST-SSR and the faba bean gSSR (Figure 2.1). Both species
had in general higher percentages of SSRs resulting in complex
amplification pattern then failed to amplify any fragment. These
differences were not so obvious in the case of the pea gSSR. In the
case of the lentil gSSRs, both Lathyrus sp. had higher percentages of
failed amplification (Figure 2.1).
Figure 2.1 - Numbers and percentages of gSSRs and EST-SSRs from lentil, pea and faba bean amplified in Lathyrus spp..

Cross-species amplification ___________________________________________________________________
45
From all the markers tested, only the pea EST-SSR
PSBLOX13.2 was polymorphic between the L. sativus parental
accessions (BGE015746, BGE024709), using a 4 % Metaphor gel.
The observed transferability rates across different genera of
the cross-amplified microsatellites were in accordance with previous
studies for EST-SSRs and gSSRs (Peakall et al., 1998; Gupta et al.,
2003; Gutierrez et al., 2005; Varshney et al., 2005; Perez et al.,
2006). Those authors reported transferability values that varied from
18-78 % for EST-SSRs and 3-24 % for gSSRs. The higher
transferability rate for EST-SSRs was expected due to their location
in coding regions. This feature makes them more transferable than
gSSRs, but also less polymorphic among individuals of the same
species (Gupta et al., 2003). Since both L. sativus and L. cicera are
diploid, EST-SSRs and gSSRs showing complex band patterns with
more than two alleles implied that these loci arise from duplication
events. In the case of EST-SSRs this may suggest the existence of
multigene families (Raji et al., 2009). In the case of the gSSRs, their
location in the Long Terminal Repeat (LTR) of ancient
retrotransposons could be the reason for the complex band patterns
encountered, since these regions are prone to duplications (Smýkal
et al., 2009).
To confirm the specificity of the amplified regions and the
presence of the microsatellite motifs on the amplicons, we aligned the
two L. cicera parental accessions (BGE008277 and BGE023542) and
one L. sativus (BGE015746) sequenced fragments against the
reference sequence from the donor species using the Geneious

Tabl
e 2.
3 –
Char
acte
ristic
s of
pea
mic
rosa
telli
te m
arke
rs s
ucce
ssfu
lly a
mpl
ified
and
seq
uenc
ed o
n La
thyr
us s
pp..
Gen
Ban
k in
form
atio
n ty
pe: (
g) g
enom
ic s
eque
nce;
(m) m
RN
A s
eque
nce
Prim
er n
ame
Mar
ker
type
Ta
rget
sp
ecie
s La
thyr
us
ampl
icon
Si
ze (b
p)
Pea
SSR
mot
if La
thyr
us S
SR m
otif
% p
airw
ise
iden
tity
Top
BLA
STn
hit
P. s
ativ
um
sequ
ence
d am
plic
on
Top
BLA
STn
hit
Pea
Gen
Ban
k Ac
cess
ion
E-va
lue
AA24
1 gS
SR
La
thyr
us
cice
ra
283
(TC
) 4
(TC
) 2
- 75
,4
CU
6558
81 (g
) 3,
31E
-40
AA24
1 gS
SR
La
thyr
us
sativ
us
284
(TC
) 4
(TC
) 2
- 74
,7
CU
6558
81 (g
) 4,
92E
-38
AB11
1 gS
SR
La
thyr
us
sativ
us
139
(AG
) 15
(AG
) 3
72,2
-
- -
AD16
0 gS
SR
La
thyr
us
cice
ra
136
(ATC
TCT)
7ATC
TAT
(CT)
5(A
TCT)
9 TA
G(C
T)4(
AT)
4 68
,1
- -
-
AD16
0 gS
SR
La
thyr
us
sativ
us
132
(ATC
TCT)
7ATC
TAT
(CT)
5(A
TCT)
9 TA
G(C
T)5(
AT)
4 57
,9
- -
-
AA42
7337
E
ST-
SS
R
Lath
yrus
ci
cera
19
3 (A
C) 5
(A
C) 4
-
85,2
A
A42
7337
(m)
1,58
E-
53
AA42
7337
E
ST-
SS
R
Lath
yrus
sa
tivus
19
2 (A
C) 5
(A
C) 4
-
89,4
A
A42
7337
(m)
2,57
E-
63
AA43
0902
E
ST-
SS
R
Lath
yrus
ci
cera
18
8 (A
AT)
7(A
T)3
(AA
T)5(
TA)2
-
89,1
A
A43
0942
(m)
3,60
E-
56
AA43
0902
E
ST-
SS
R
Lath
yrus
sa
tivus
18
5 (A
AT)
7(A
T)3
(TA
A) 3
(TA
) 3 -
86,3
A
A43
0942
(m)
1,05
E-
61
AA43
0942
E
ST-
SS
R
Lath
yrus
ci
cera
18
8 (A
AT)
7(A
T)3
(AA
T)5(
TA)2
-
89,1
A
A43
0942
(m)
3,60
E-
56
AA43
0942
E
ST-
SS
R
Lath
yrus
sa
tivus
18
5 (A
AT)
7(A
T)3
(TA
A) 3
(TA
) 3 -
86,3
A
A43
0943
(m)
1,05
E-
61
CHPS
GPA
1 E
ST-
SS
R
Lath
yrus
ci
cera
19
3 (A
T)17
(AG
ATA
T)2
(AT)
6AG
ATAT
-
84,8
X1
5190
(m)
4,61
E-
67
CHPS
GPA
1 E
ST-
SS
R
Lath
yrus
sa
tivus
18
9 (A
T)17
(AG
ATA
T)2
(AT)
4AG
ATAT
-
83,0
X1
5190
(m)
9,91
E-
63
CHPS
TZPP
E
ST-
SS
R
Lath
yrus
ci
cera
37
3 (T
A) 6
(T
A) 4
-
70,2
X5
6315
(g)
1,16
E-
40
46
Chapter 2 ___________________________________________________________________

Tabl
e 2.
3 (c
ont.)
Prim
er n
ame
Mar
ker
type
Ta
rget
sp
ecie
s La
thyr
us
ampl
icon
Si
ze (b
p)
Pea
SSR
mot
if La
thyr
us S
SR m
otif
% p
airw
ise
iden
tity
Pea
Gen
Ban
k Ac
cess
ion
E-va
lue
P. s
ativ
um
sequ
ence
d am
plic
on
Top
BLA
STn
hit
CHPS
TZPP
E
ST-
SS
R
Lath
yrus
sa
tivus
30
3 (T
A) 6
(T
A) 4
-
84,3
X5
6315
(g)
2,40
E-
30
PEAA
TPSY
ND
ES
T-S
SR
La
thyr
us
cice
ra
209
(AC
) 5
(AC
) 4
- 91
,0
M94
558
(m)
1,05
E-
75
PEAA
TPSY
ND
ES
T-S
SR
La
thyr
us
sativ
us
209
(AC
) 5
(AC
) 4
- 90
,5
M94
558
(m)
1,28
E-
74
PEAC
PLHP
PS
ES
T-S
SR
La
thyr
us
cice
ra
114
(TA
) 3(A
T)6
(AT)
2 -
84,1
L1
9651
(m)
1,59
E-
31
PEAC
PLHP
PS
ES
T-S
SR
La
thyr
us
sativ
us
113
(TA
) 3(A
T)6
(AT)
2 -
84,1
L1
9651
(m)
1,91
E-
30
PEAO
M14
A E
ST-
SS
R
Lath
yrus
ci
cera
19
7 (C
CT)
6 C
CT…
(CC
T)3
- 90
,9
M69
105
(m)
1,11
E-
68
PEAO
M14
A E
ST-
SS
R
Lath
yrus
sa
tivus
20
3 (C
CT)
6 C
CTG
CTC
CT…
(CC
T)3
- 88
,2
M69
105
(m)
4,90
E-
67
PSAJ
3318
E
ST-
SS
R
Lath
yrus
ci
cera
17
2 (T
A) 3
…(C
AT)
6 (T
A) 9
…(C
AT)
4 -
86,0
A
J223
318
(m)
6,35
E-
52
PSAJ
3318
E
ST-
SS
R
Lath
yrus
sa
tivus
16
5 (T
A) 3
…(C
AT)
6 (T
A) 7
…(C
AT)
4 -
88,5
A
J223
318
(m)
2,74
E-
56
PSAS
E
ST-
SS
R
Lath
yrus
sa
tivus
23
5 (A
AT)
6 (A
AT)
4 -
86,2
Y
1332
1 (g
) 3,
44E
-76
PSBL
OX1
3.2
ES
T-S
SR
La
thyr
us
cice
ra
92
(CA
T)8
(CA
T)4
- 88
,3
X785
81 (g
) 2,
09E
-28
PSBL
OX1
3.2
ES
T-S
SR
La
thyr
us
sativ
us
93
(CA
T)8
(CA
T)5
- 87
,4
X785
81 (g
) 9,
04E
-27
PSBT
2AG
EN
ES
T-S
SR
La
thyr
us
cice
ra
266
(CC
T)5(
CTT
) 2C
AT(
CTT
) 3
CC
TCTT
(CC
T)3
(CTT
) 2C
AT(
CTT
) 2
- 95
,5
X967
64 (m
) 2,
20E
-11
7
PSBT
2AG
EN
ES
T-S
SR
La
thyr
us
sativ
us
266
(CC
T)5(
CTT
) 2C
AT(
CTT
) 3
CC
TCTT
(CC
T)3
(CTT
) 2C
AT(
CTT
) 2
- 96
,7
X967
64 (m
) 3,
81E
-12
1
47
Cross-species amplification ___________________________________________________________________

Tabl
e 2.
3 (c
ont.)
Prim
er n
ame
Mar
ker
type
Ta
rget
sp
ecie
s La
thyr
us
ampl
icon
Si
ze (b
p)
Pea
SSR
mot
if La
thyr
us S
SR m
otif
% p
airw
ise
iden
tity
Pea
Gen
Ban
k Ac
cess
ion
E-va
lue
P. s
ativ
um
sequ
ence
d am
plic
on
Top
BLA
STn
hit
PSG
APA1
E
ST-
SS
R
Lath
yrus
ci
cera
14
7 (A
T)17
(AG
ATA
T)2
(AT)
6AG
ATAT
-
81,5
X1
5190
(m)
2,07
E-
44
PSG
APA1
E
ST-
SS
R
Lath
yrus
sa
tivus
14
2 (A
T)17
(AG
ATA
T)2
(AT)
4AG
ATAT
-
79,1
X1
5190
(m)
1,54
E-
39
PSG
DPP
ES
T-S
SR
La
thyr
us
cice
ra
206
AA
CAT
C(A
AC
) 5 (A
AC
) 2TA
T(A
AC
) 2 -
94,6
X5
9773
(m)
2,12
E-
84
PSG
DPP
ES
T-S
SR
La
thyr
us
sativ
us
205
AA
CAT
C(A
AC
) 5 (A
AC
) 2TA
T(A
AC
) 2 -
94,1
X5
9773
(m)
2,57
E-
83
PSJ0
0064
0A
ES
T-S
SR
La
thyr
us
cice
ra
199
(AA
C) 7
(A
AC
) 5
- 82
,0
AJ0
0064
0 (g
) 2,
04E
-46
PSJ0
0064
0A
ES
T-S
SR
La
thyr
us
sativ
us
194
(AA
C) 7
(A
AC
) 5
- 80
,2
AJ0
0064
0 (g
) 3,
50E
-42
PSU5
1918
E
ST-
SS
R
Lath
yrus
ci
cera
13
6 (G
AA
) 6 (G
AA
) 4 -
91,6
U
5191
8 (m
) 1,
07E
-48
PSU5
1918
E
ST-
SS
R
Lath
yrus
sa
tivus
13
4 (G
AA
) 6 (G
AA
) 3 -
89,5
U
5191
8 (m
) 1,
59E
-46
PSU8
1287
E
ST-
SS
R
Lath
yrus
ci
cera
26
5 (T
GG
) 5TT
AT(
TGG
) 3
(TG
G) 2
CG
G(T
GG
) 2 TT
AT(
TGG
) 3
- 96
,0
U81
287
(m)
3,75
E-
37
PSU8
1287
E
ST-
SS
R
Lath
yrus
sa
tivus
26
9 (T
GG
) 5TT
AT(
TGG
) 3
(TG
G) 5
TTA
T(TG
G) 3
-
94,6
U
8128
7 (m
) 3,
52E
-31
PSZI
NCFI
N E
ST-
SS
R
Lath
yrus
ci
cera
21
0 (A
AC
) 5
(AA
C) 5
-
96,2
X8
7374
(m)
1,90
E-
91
PSZI
NCFI
N E
ST-
SS
R
Lath
yrus
sa
tivus
21
0 (A
AC
) 5
(AA
C) 5
-
96,2
X8
7374
(m)
1,90
E-
91
48
Chapter 2 ___________________________________________________________________

Cross-species amplification ___________________________________________________________________
49
alignment software (Drummond et al., 2011). For the donor fragments
not found in the exploited databases, amplicons from the donor
species were also sequenced to allow comparison (Table 2.3).
Only one cross-amplified pea gSSR loci (AA241), sequenced
in the Lathyrus spp., gave rise to a significant BLAST hit, with an E-
value of 3.3e-40 for L. cicera and 4.9e-38 for L. sativus, allowing
comparison of the microsatellite motif with pea. Five other cross-
amplified gSSR fragments lacking a BLAST hit had also to be
sequenced in pea to allow comparisons. In two of these amplicons
(AB111, AD160) the sequences were similar to the donor pea despite
the low pairwise identity (58 – 72 %), because although the SSR
flanking regions were conserved, a large portion of the SSR region
was missing in the two Lathyrus spp. (Table 2.3). In the other three
sequenced loci (AD146, D21 and SSR124) in Lathyrus spp., the
amplified regions were not conserved. The sequenced amplicons of
the pea EST-SSRs, producing one single fragment in L. cicera and L.
sativus, showed that the cross-amplified loci were orthologous to the
donor species (maximum E-value = 9e-27). Microsatellite size
homoplasy, confirmed by sequence alignment, was present in two
markers (PEAATPSYND, PSZINCFIN) when comparing pea with
both Lathyrus spp.. Additionally, PSGDPP had the same sequence
length in pea and L. cicera. In the case of PSBT2AGEN microsatellite
size homoplasy was only detected between both Lathyrus spp.. For
other two pea EST-SSRs the repeat motif was maintained
(PSU81287 in L. sativus and PSZINCFIN in both Lathyrus spp.). In
most of the cases there were more than one mutation event in each
microsatellite region (Table 2.3). When comparing the mutations in
those loci, only in PSGDPP the mutations were equal for both

Chapter 2 ___________________________________________________________________
50
species. The most common mutations in the microsatellite motifs
were deletions (57.1 %) (Table 2.3).
2.4.2. Transferability of Intron-Targeted Amplified Polymorphic markers, Defence-Related and Resistance Gene Analogues to Lathyrus spp.
Differences in the transferability rates among ITAP, DR and
RGA markers were much less pronounced than between EST-SSR
and gSSR. Both Lathyrus spp. had very similar results in the
transferability rates of each of these particular molecular marker types
(Figure 2.2). The majority of the tested markers resulted in one single
fragment amplification with the highest rates for the ITAP markers
(58% in both Lathyrus sp.), follow by the pea DR (58%) and finally the
pea RGA (50%) (Figure 2.2).
Few of the tested markers failed to amplify in both Lathyrus
sp., but 25 % to 40 % of each marker types resulted in a complex
pattern of amplification (Figure 2.2). Thirteen ITAPs presented a
direct polymorphism between two of the parental accessions tested,
four only in L. cicera and eight only in L. sativus (ESM 2.1).
Additionally, one ITAP (Lup280) was polymorphic between both
species’ parental accessions.

Cross-species amplification ___________________________________________________________________
51
Figure 2.2 Numbers and percentages of ITAPs and pea DRs and RGAs amplified in Lathyrus spp..
From the 58 ITAP markers giving a single amplicon in L.
cicera that were sequenced, 28 presented high homology (>70 %
identity) with the donor sequence (ESM 2.2). In addition, 10 ITAP
amplicons had a BLASTn hit with low pairwise identity (below 70%).
The reason for this was that the sequence present in the NCBI
database is an mRNA molecule that, when aligned with our genomic
sequence, misses the intronic region. Nevertheless, five other ITAP
amplicons, presenting large insertions or deletions in one or two
sections, were considered as positive hits, since the aligned exonic
regions were highly conserved. All these L. cicera amplicons were
BLASTed against the NCBI database, where 55 (94.8 %) presented
an E-value < 1e-10 (ESM 2.2).
From the 61 ITAP marker fragments sequenced in L. sativus
(ESM 2.2), 43 where considered homologous to the donor species,
25 of which presenting a high pairwise identity (>70 %) (comparison
between DNA and RNA). All the amplicons were BLASTed against

Chapter 2 ___________________________________________________________________
52
the NCBI database, where 95.1 % presented an E-value < 1e-10
(ESM 2.2).
Not all amplified sequences from the DR and RGA could be
compared to the reference donor species due to the lack of
information about the donor’ sequence in databases and the failure to
be sequenced after several attempts. The ones that could be
compared (three DRs and two RGAs) showed a pairwise identity
above 70 % (ESM 2.2). Nevertheless all the cross-amplified DR and
RGA amplicons had a significant BLAST hit (maximum E-value =
1.34e-38). From the DR and RGA markers originating one single
amplicon (Figure 2.2), just the DR DRR230-d presented a direct
polymorphism between the L. sativus parental accessions.
2.4.3. Usefulness of cross amplified markers on Lathyrus spp. linkage mapping
In order to access the usefulness for linkage mapping, the
successfully cross-amplified markers, were analysed for size
polymorphism and SNPs among the Lathyrus parental accessions.
Segregation ratios of polymorphic markers were then tested in a L.
cicera RILs population segregating for rust and powdery mildew.
From the transferable markers, one EST-SSR, one DR and
nine ITAPs presented direct size polymorphism between the parental
accessions of the L. sativus mapping population (ESM 2.1).
Additionally five ITAP markers were size polymorphic between the L.
cicera parental accessions (ESM 2.1) and were used to screen the L.
cicera RILs mapping population. In this screening all the molecular
marker segregations presented a χ2 value between 0.08 and 1.52

Cross-species amplification ___________________________________________________________________
53
(α=0.05) confirming that the segregation ratios were not deviating
from the expected 1:1 segregation (Table 2.4).
For the markers presenting microsatellite size homoplasy in L.
cicera (ESM 2.2), 29 fragments amplified in both parental accessions
were sequenced and aligned to detect
SNPs and design CAPS. When no
restriction sites were associated with
SNPs, dCAPS markers were designed
to allow their scoring in the L. cicera
RILs population. The high sequence
similarity existing among the
accessions of L. cicera decreased the
probability of detecting SNPs.
Potential sequencing errors or a low
GC content in the amplicon region,
further hampered the design of
suitable primer pairs. As result, just 10
fragments containing SNPs were
detected and for only nine of these it
was possible to design CAPs or
dCAPS markers. From the seven
CAPs identified in five fragments and
six dCAPS developed for other five
fragments (Table 2.2) only three and
one markers respectively, were
suitable to be screened in the RILs L.
cicera population and presented a 1:1
Mendelian segregation (Table 2.4).
The other four CAPs failed to

Chapter 2 ___________________________________________________________________
54
give clear polymorphisms in the parental accessions and the other
five dCAPS did no amplified at all or there was no cleavage of the
amplicon (Table 2.3). All of these unsuitable markers were not
screened in the RILs.
The use of alternative SNP screening approaches (such as
dHPLC, ecoTILLING or TaqMan) not depending on specific
sequences for restriction endonucleases would have allowed the
identification of a higher number of SNPs to genotype in the L. cicera
segregation population.
The inclusion of codominant molecular markers, as the ones
here identified, on the Lathyrus spp. linkage maps will allow the future
identification of chromosomal rearrangements with different donor
species. The utility of transferable markers to access macrosynteny
(Phan et al., 2007; Ellwood et al., 2008; Hougaard et al., 2008) and
microsynteny (Gualtieri et al., 2002; Guyot et al., 2012) in related and
distant species have been already shown by several previous studies.
2.4.4. Usefulness of cross amplified markers on Lathyrus spp. diversity studies
In order to assess the utility of the cross amplified markers for
diversity studies a set of selected gSSRs, EST-SSRs and ITAPs were
tested (Table 2.5). One of the selected gSSRs markers amplified in
the Lathyrus sp. revealed a sequence very similar to the donor pea
species although a large part of the microsatellite region was missing.
As a result, the pea amplicon was almost double than that of the
Lathyrus accessions and displayed a low pairwise identity value
(AD160 – 58 %). A second selected gSSR marker had a similar size
and a higher pairwise identity value when comparing to the donor pea

Cross-species amplification ___________________________________________________________________
55
(AA241 – 73 %). The selected ITAPs and EST-SSRs displayed a
similar size when compared with the donor species. In total, 2 EST-
SSRs, 2 gSSRs and 13 ITAPs, were tested in 20 random Lathyrus
spp. individuals, 10 L. cicera and 10 L. sativus.
For four of the seven monomorphic markers in both species
(Table 2.5), L. cicera presented a different allele to L. sativus (AA241,
AD160, LG054 and mt_00495_01_1). Using the selected markers,
the higher polymorphic information content (PIC) was observed for
the L. sativus accessions (mean = 0.174). Two markers were highly
informative for L. sativus (Pis_GEN_21_1_1 and PSBLOX13.2) with a
PIC > 0.6. For the L. cicera accessions under study there was no
heterozygosity detected which explains the lower PIC values obtained
(mean = 0.110) (Table 2.5).
The diversity analysis of the cross-amplified molecular
markers presented here, clearly distinguishes between L. cicera and
L. sativus individuals (Figure 2.3). Among L. cicera accessions, the
genetic distance (DPSA) varied from 0.000 to 0.435, with a mean value
of 0.167. Among L. sativus accessions, the distance varied from
0.065 to 0.375 with a mean value of 0.203. A total of four
(BGE001043, BGE001164, BGE023542, BGE023558) and two
(BGE022223, BGE027064) indistinguishable accessions were
observed, all from L. cicera. The mean genetic distance between
species was 0.817 ranging from 0.782 to 0.877. Also, the mapping
parental lines from the L. cicera RIL population (BGE008277 and
BGE023542) were well separated in the Neighbor-Joining tree.

Tabl
e 2.
5 –
Lath
yrus
cic
era
and
Lath
yrus
sat
ivus
cro
ss a
mpl
ifiab
le m
arke
rs d
iver
sity
ana
lysi
s
Mar
ker
Mar
ker
type
La
thyr
us c
icer
a La
thyr
us s
ativ
us
Na
Nab
Al
lele
siz
e M
AFc
HEd
HO
e PI
Cf
Na
Nab
Al
lele
siz
e M
AFc
HEd
HO
e PI
Cf
LG04
1 IT
AP M
LG
10
1 33
1 -
- -
0,00
0 10
1
331
- -
- 0,
000
LG05
4 IT
AP M
LG
10
1 28
1 -
- -
0,00
0 10
1
278
- -
- 0,
000
Lup2
80
ITAP
ML
10
3 57
8, 6
02, 6
22
0,10
0 0,
540
0,00
0 0,
466
10
3 58
0, 5
88, 6
32
0,05
0 0,
515
0,30
0 0,
424
mtm
t_G
EN_0
0012
_03_
1 IT
AP G
LIP
10
2 65
8, 6
70
0,20
0 0,
320
0,00
0 0,
269
10
2 23
2, 2
35
0,45
0 0,
495
0,90
0 0,
372
mtm
t_G
EN_0
0385
_06_
1 IT
AP G
LIP
10
2 60
4, 6
44
0,30
0 0,
420
0,00
0 0,
332
10
2 62
9, 6
33
0,05
0 0,
095
0,10
0 0,
090
mtm
t_G
EN_0
0423
_02_
2 IT
AP G
LIP
10
1 35
5 -
- -
0,00
0 10
2
389,
391
0,
400
0,48
0 0,
400
0,36
5
mtm
t_G
EN_0
0495
_01_
1 IT
AP G
LIP
10
1 47
5 -
- -
0,00
0 10
1
463
- -
- 0,
000
mtm
t_G
EN_0
1115
_02_
1 IT
AP G
LIP
10
2 32
9, 3
37
0,20
0 0,
320
0,00
0 0,
269
10
1 33
7 -
- -
0,00
0
Pis_
GEN
_21_
1_1
ITAP
GLI
P 10
1
597
- -
- 0,
000
10
6 53
4, 5
37, 5
43, 5
49, 5
76, 5
79
0,05
0 0,
725
0,70
0 0,
692
Pis_
GEN
_6_3
_1
ITAP
GLI
P 10
1
500
- -
- 0,
000
10
2 60
2, 6
38
0,40
0 0,
480
0,20
0 0,
365
Pis_
GEN
_9_3
_1
ITAP
GLI
P 10
1
500
- -
- 0,
000
10
1 50
0 -
- -
0,00
0
Pis_
PR_1
27_1
IT
AP G
LIP
10
2 41
9, 4
22
0,20
0 0,
320
0,00
0 0,
269
- -
- -
- -
-
Psat
_EST
_001
78_0
1_1
ITAP
GLI
P 10
2
362,
410
0,
200
0,32
0 0,
000
0,26
9 10
1
410
- -
- 0,
000
PSB
LOX1
3.2
EST-
SSR
10
1
90
- -
- 0,
000
10
5 93
, 96,
99,
102
, 105
0,
050
0,69
5 0,
900
0,64
3
PSG
DPP
ES
T-SS
R
10
1 20
5 -
- -
0,00
0 10
1
205
- -
- 0,
000
AA2
41
gSSR
10
1
283
- -
- 0,
000
10
1 28
4 -
- -
0,00
0
AD16
0 gS
SR
10
1 13
5 -
- -
0,00
0 10
1
133
- -
- 0,
000
Mea
n -
1,4
- 0,
200
0,37
3 0,
000
0,11
0 -
1,9
- 0,
207
0,49
8 0,
500
0,18
5
a num
ber o
f ana
lyse
d in
divi
dual
s; b n
umbe
r of a
llele
s; c m
inor
alle
le fr
eque
ncy;
d exp
ecte
d he
tero
zygo
sity
; e obs
erve
d he
tero
zygo
sity
; f pol
ymor
phis
m in
form
atio
n co
nten
t
56
Chapter 2 ___________________________________________________________________
Cross-species amplification ___________________________________________________________________
57
Previous studies on Lathyrus diversity employed a range of
different molecular markers like Random Amplified Polymorphic
DNAs (RAPD) (Croft et al., 1999), Isozymes (Chowdhury and
Slinkard, 2000; Ben Brahim et al., 2002; Gutiérrez-Marcos et al.,
2006), Inter-Simple Sequence Repeats (ISSR) (Belaid et al., 2006),
Amplified Fragment Length Polymorphisms (AFLP) (Tavoletti and
Iommarini, 2007; Lioi et al., 2011) and also EST-SSRs (Lioi et al.,
2011; Shiferaw et al., 2011). In contrast with the only work analysing
L. sativus accessions (Croft et al., 1999), the present study, using the
set of selected cross-amplified molecular markers, managed to
distinguish all L. sativus accessions. Nevertheless this comparison
should be made with caution since more individuals from each
accession and a different molecular marker type (RAPD), known for
their higher polymorphism rate, were used on the previous study.
When comparing with the isozyme analysis reported by Gutierrez-
Marcos (2006), similar Nei’s genetic identity average values (Nei,
1973) were obtained between the accessions from Iberian origin
(0.888) and the ones considered in this work (0.864 for L. cicera and
0.886 for L. sativus), thus confirming the existence of high genetic
diversity and a good representation of the Lathyrus Iberian
germplasm diversity in our 20 accessions.
To our knowledge, only two studies using cross-amplified
EST-SSRs in Lathyrus have been reported so far. One of them used
EST-SSRs developed for M. truncatula to access the diversity in
Ethiopian L. sativus populations (Shiferaw et al., 2011) and the
second used EST-SSRs developed for L. japonicus to discriminate
between different L. sativus accessions from Italian origin (Lioi et al.,
2011).

Chapter 2 ___________________________________________________________________
58
Figure 2.3 - Neighbor-Joining tree based on the proportion-of-shared-alleles distance values among 20 Lathyrus individuals. Numbers at nodes indicate bootstrap values (%) out
of 1.000 replications; only values above 50 % are shown. Black dots indicate the L. cicera
RILs parental lines.
Our work expand upon the previous works in two ways; first,
by testing the cross-amplification of a much higher number of different
types of markers from different related legume species and, second,
all of the cross-amplified SSRs and most of the ITAPs, DRs and
RGAs were confirmed by sequencing in order to verify the
correspondence between the donor and the target species
sequences.

Cross-species amplification ___________________________________________________________________
59
2.5. Conclusions
This paper describes the transferability of molecular markers
from Medicago truncatula, Pisum sativum, Lens culinaris, Lupinus
spp. and Vicia faba to Lathyrus spp. for their application in mapping
and diversity studies. Cross-genera amplification of molecular
markers provides an alternative for the development of new molecular
markers on understudied genus. The increase availability of public
legume resources constitutes an efficient and cost-effective source of
molecular markers for use in Lathyrus breeding and genetics.
Nevertheless, one of the primary factors limiting broader cross-
markers applications is the unsuccessful amplification of homologous
products across species. It is therefore, advisable to know the
sequence of the amplified fragments if the objective is to draw
conclusions about equivalent genomic regions between species.
Our results revealed quite high marker transferability among
the above mentioned legume species. The number of transferred
markers would likely improve by using mainly markers developed
from expressed sequences. EST-derived SSRs, which can easily be
extracted from EST databases, can be successfully used for this
purpose. They will also have a higher probability of being in linkage
disequilibrium with genes/QTLs controlling economic traits, thus
proving relatively more useful for studies involving marker-trait
association, QTL mapping and genetic diversity analysis.
Additionally in the future, due to the constant diminishing
sequencing costs, specific Lathyrus cicera or L. sativus genomic
libraries will also provide gene based molecular markers (EST-SSRs
and SNP markers) for these species. These new markers could be
annotated using the information already available for related species
such as Medicago truncatula or Glycine max, or mapped on other

Chapter 2 ___________________________________________________________________
60
major legume crops linkage maps not yet totally sequenced as pea,
faba beans and chickpea, as a natural complementation of the now
generated marker information.
Our outcomes have increased the number of molecular
markers available for Lathyrus species, and particularly for our L.
cicera and L. sativus crosses which did not had yet useful codominant
markers for developing a linkage map useful in future genetics
studies. A Lathyrus linkage map containing these cross-amplified
markers will establish the basis to enable future comparative mapping
across legume species.
2.6. Acknowledgements
NFA carried out the cross-amplifications, sample processing
for sequencing, data analysis and drafted the manuscript. STL
participated in the results generation on genotyping the L. cicera RILs
and the Lathyrus spp. accessions for the diversity study. DR
generated the RIL populations studied. CC, AMT and DR revised the
manuscript critically. MCVP coordinated the study and participated to
the drafting and revision of the manuscript. NFA would like to thank
CRF-INIA, Madrid, Spain, for supplying the accessions, Mara Lisa
Alves for helping in the diversity study analysis and Alberto Martín-
Sanz for the technical support on the primer pairs supply.
2.7. References
Asmussen, C.B., and Liston, A. (1998). Chloroplast DNA characters, phylogeny, and classification of Lathyrus (Fabaceae). American Journal of Botany 85, 387-401.
Belaid, Y., Chtourou-Ghorbel, N., Marrakchi, M., and Trifi-Farah, N. (2006). Genetic diversity within and between populations of

Cross-species amplification ___________________________________________________________________
61
Lathyrus genus (Fabaceae) revealed by ISSR markers. Genetic Resources and Crop Evolution 53, 1413-1418.
Ben Brahim, N., Combes, D., and Marrakchi, M. (2001). Autogamy and allogamy in genus Lathyrus. Lathyrus Lathyrism Newsletter 2, 21-26.
Ben Brahim, N., Salhi, A., Chtourou, N., Combes, D., and Marrakchi, M. (2002). Isozymic polymorphism and phylogeny of 10 Lathyrus species. Genetic Resources and Crop Evolution 49, 427-436.
Bennett, M.D., and Leitch, I.J. (2012). "Angiosperm DNA C-values database". (release 8.0, Dec. 2012) http://data.kew.org/cvalues/).
Bowcock, A.M., Ruiz-Linares, A., Tomfohrde, J., Minch, E., Kidd, J.R., and Cavalli-Sforza, L.L. (1994). High resolution of human evolutionary trees with polymorphic microsatellites. Nature 368, 455-457.
Burstin, J., Deniot, G., Potier, J., Weinachter, C., Aubert, G., and Baranger, A. (2001). Microsatellite polymorphism in Pisum sativum. Plant Breeding 120, 311-317.
Calderón, F.J., Vigil, M.F., Nielsen, D.C., Benjamin, J.G., and Poss, D.J. (2012). Water use and yields of no-till managed dryland grasspea and yellow pea under different planting configurations. Field Crops Research 125, 179-185.
Campbell, C.G. (1997). Promoting the conservation and use of underutilized and neglected crops. Grass pea. Lathyrus sativus L. Rome, Italy: International Plant Genetic Resources Institute.
Castillo, A., Budak, H., Varshney, R.K., Dorado, G., Graner, A., and Hernandez, P. (2008). Transferability and polymorphism of barley EST-SSR markers used for phylogenetic analysis in Hordeum chilense. BMC Plant Biology 8, 97.
Choi, H.K., Mun, J.H., Kim, D.J., Zhu, H.Y., Baek, J.M., Mudge, J., Roe, B., Ellis, N., Doyle, J., Kiss, G.B., Young, N.D., and Cook, D.R. (2004). Estimating genome conservation between crop and model legume species. Proceedings of the National Academy of Sciences of the United States of America 101, 15289-15294.
Chowdhury, M.A., and Slinkard, A.E. (1999). Linkage of random amplified polymorphic DNA, isozyme and morphological markers in grasspea (Lathyrus sativus). Journal of Agricultural Science 133, 389-395.
Chowdhury, M.A., and Slinkard, A.E. (2000). Genetic diversity in grasspea (Lathyrus sativus L.). Genetic Resources and Crop Evolution 47, 163-169.

Chapter 2 ___________________________________________________________________
62
Croft, A.M., Pang, E.C.K., and Taylor, P.W.J. (1999). Molecular analysis of Lathyrus sativus L. (grasspea) and related Lathyrus species. Euphytica 107, 167-176.
Datta, S., Mahfooz, S., Singh, P., Choudhary, A., Singh, F., and Kumar, S. (2010). Cross-genera amplification of informative microsatellite markers from common bean and lentil for the assessment of genetic diversity in pigeonpea. Physiology and Molecular Biology of Plants 16, 123-134.
Drummond, A.J., Ashton, B., Buxton, S., Cheung, M., Cooper, A., Duran, C., Field, M., Heled, J., Kearse, M., Markowitz, S., Moir, R., Stones-Havas, S., Sturrock, S., Thierer, T., and Wilson, A. (2011). "Geneious v5.4", Available from http://www.geneious.com/).
Ellwood, S.R., Phan, H.T.T., Jordan, M., Hane, J., Torres, A.M., Avila, C.M., Cruz-Izquierdo, S., and Oliver, R.P. (2008). Construction of a comparative genetic map in faba bean (Vicia faba L.); conservation of genome structure with Lens culinaris. BMC Genomics 9, 380.
Felsenstein, J. (1985). Confidence limits on phylogenies: an approach using the bootstrap. Evolution 39, 783-791.
Felsenstein, J. (2004). "PHYLIP (Phylogeny Inference Package) version 3.6. Distributed by the author. , Seattle, WA Department of Genomic Sciences, University of Washington".).
Feng, S.P., Li, W.G., Huang, H.S., Wang, J.Y., and Wu, Y.T. (2009). Development, characterization and cross-species/genera transferability of EST-SSR markers for rubber tree (Hevea brasiliensis). Molecular Breeding 23, 85-97.
Fondevilla, S., Almeida, N.F., Satovic, Z., Rubiales, D., Vaz Patto, M.C., Cubero, J., and Torres, A.M. (2011). Identification of common genomic regions controlling resistance to Mycosphaerella pinodes earliness and architectural traits in different pea genetic backgrounds. Euphytica 182, 43-52.
Fondevilla, S., Fernández-Aparicio, M., Satovic, Z., Emeran, A.A., Torres, A.M., Moreno, M.T., and Rubiales, D. (2010). Identification of quantitative trait loci for specific mechanisms of resistance to Orobanche crenata Forsk. in pea (Pisum sativum L.). Molecular Breeding 25, 259-272.
Fondevilla, S., Satovic, Z., Rubiales, D., Moreno, M.T., and Torres, A.M. (2008). Mapping of quantitative trait loci for resistance to Mycosphaerella pinodes in Pisum sativum subsp syriacum. Molecular Breeding 21, 439-454.
Grela, E., Rybiński, W., Matras, J., and Sobolewska, S. (2012). Variability of phenotypic and morphological characteristics of
Cross-species amplification ___________________________________________________________________
63
some Lathyrus sativus L. and Lathyrus cicera L. accessions and nutritional traits of their seeds. Genetic Resources and Crop Evolution 59, 1687-1703.
Gualtieri, G., Kulikova, O., Limpens, E., Kim, D.J., Cook, D.R., Bisseling, T., and Geurts, R. (2002). Microsynteny between pea and Medicago truncatula in the SYM2 region. Plant Molecular Biology 50, 225-235.
Gupta, P.K., Rustgi, S., Sharma, S., Singh, R., Kumar, N., and Balyan, H.S. (2003). Transferable EST-SSR markers for the study of polymorphism and genetic diversity in bread wheat. Molecular Genetics and Genomics 270, 315-323.
Gusmao, M., Siddique, K.H.M., Flower, K., Nesbitt, H., and Veneklaas, E.J. (2012). Water deficit during the reproductive period of grass pea (Lathyrus sativus L.) reduced grain yield but maintained seed size. Journal of Agronomy and Crop Science 198, 430-441.
Gutiérrez-Marcos, J.F., Vaquero, F., Sáenz De Miera, L.E., and Vences, F.J. (2006). High genetic diversity in a world-wide collection of Lathyrus sativus L. revealed by isozymatic analysis. Plant Genetic Resources 4, 159-171.
Gutierrez, M.V., Vaz Patto, M.C., Huguet, T., Cubero, J.I., Moreno, M.T., and Torres, A.M. (2005). Cross-species amplification of Medicago truncatula microsatellites across three major pulse crops. Theoretical and Applied Genetics 110, 1210-1217.
Guyot, R., Lefebvre-Pautigny, F., Tranchant-Dubreuil, C., Rigoreau, M., Hamon, P., Leroy, T., Hamon, S., Poncet, V., Crouzillat, D., and De Kochko, A. (2012). Ancestral synteny shared between distantly-related plant species from the asterid (Coffea canephora and Solanum sp.) and rosid (Vitis vinifera) clades. BMC Genomics 13, 103.
Hamwieh, A., Udupa, S.M., Choumane, W., Sarker, A., Dreyer, F., Jung, C., and Baum, M. (2005). A genetic linkage map of Lens sp. based on microsatellite and AFLP markers and the localization of fusarium vascular wilt resistance. Theoretical and Applied Genetics 110, 669-677.
Hanbury, C.D., White, C.L., Mullan, B.P., and Siddique, K.H.M. (2000). A review of the potential of Lathyrus sativus L. and L. cicera L. grain for use as animal feed. Animal Feed Science and Technology 87, 1-27.
Harris-Shultz, K., Milla-Lewis, S., and Brady, J. (2012). Transferability of SSR and RGA Markers Developed in Cynodon spp. to Zoysia spp. Plant Molecular Biology Reporter 30, 1264-1269.
Hougaard, B.K., Madsen, L.H., Sandal, N., Moretzsohn, M.D., Fredslund, J., Schauser, L., Nielsen, A.M., Rohde, T., Sato,

Chapter 2 ___________________________________________________________________
64
S., Tabata, S., Bertioli, D.J., and Stougaard, J. (2008). Legume anchor markers link syntenic regions between Phaseolus vulgaris, Lotus japonicus, Medicago truncatula andArachis. Genetics 179, 2299-2312.
Kumar, J., Pratap, A., Solanki, R.K., Gupta, D.S., Goyal, A., Chaturvedi, S.K., Nadarajan, N., and Kumar, S. (2012). Genomic resources for improving food legume crops. Journal of Agricultural Science 150, 289-318.
Lioi, L., Sparvoli, F., Sonnante, G., Laghetti, G., Lupo, F., and Zaccardelli, M. (2011). Characterization of Italian grasspea (Lathyrus sativus L.) germplasm using agronomic traits,biochemical and molecular markers. Genetic Resources and Crop Evolution 58, 425-437.
Loridon, K., Mcphee, K., Morin, J., Dubreuil, P., Pilet-Nayel, M.L., Aubert, G., Rameau, C., Baranger, A., Coyne, C., Lejeune-Hènaut, I., and Burstin, J. (2005). Microsatellite marker polymorphism and mapping in pea (Pisum sativum L.).Theoretical and Applied Genetics 111, 1022-1031.
Martín-Sanz, A., Palomo, J., Pérez De La Vega, M., and Caminero, C. (2012). Characterization of Pseudomonas syringae pv.syringae isolates associated with bacterial blight in Lathyrusspp. and sources of resistance. European Journal of Plant Pathology 134, 205-216.
Minch, E., Ruiz Linares, A., Goldstein, D., Feldman, M., and Cavalli-Sforza, L. (1997). MICROSAT, Version 1.5 b. Standford CA: Standford University.
Neff, M.M., Turk, E., and Kalishman, M. (2002). Web-based primer design for single nucleotide polymorphism analysis. Trends in Genetics 18, 613-615.
Nei, M. (1973). Analysis of gene diversity in subdivided populations. Proceedings of the National Academy of Sciences of the United States of America 70, 3321-3323.
Nelson, M.N., Moolhuijzen, P.M., Boersma, J.G., Chudy, M., Lesniewska, K., Bellgard, M., Oliver, R.P., Swiecicki, W., Wolko, B., Cowling, W.A., and Ellwood, S.R. (2010). Aligning a new reference genetic map of Lupinus angustifolius with thegenome sequence of the model legume, Lotus japonicus. DNA Research 17, 73-83.
Parra-Gonzalez, L., Aravena-Abarzua, G., Navarro-Navarro, C., Udall, J., Maugham, P., Peterson, L., Salgo-Garrido, H., and Maureira Butler, I. (2012). Yellow lupin (Lupinus luteus L.)transcriptome sequencing: molecular marker development and comparative studies. BMC Genomics 13, 425.

Cross-species amplification ___________________________________________________________________
65
Peakall, R., Gilmore, S., Keys, W., Morgante, M., and Rafalski, A. (1998). Cross-species amplification of soybean (Glycine max) simple sequence repeats (SSRs) within the genus and other legume genera: Implications for the transferability of SSRs in plants. Molecular Biology and Evolution 15, 1275-1287.
Perez, J.O., Dambier, D., Ollitrault, P., D'eeckenbrugge, G.C., Brottier, P., Froelicher, Y., and Risterucci, A.M. (2006). Microsatellite markers in Carica papaya L.: isolation, characterization and transferability to Vasconcellea species. Molecular Ecology Notes 6, 212-217.
Phan, H.T.T., Ellwood, S.R., Hane, J.K., Ford, R., Materne, M., and Oliver, R.P. (2007). Extensive macrosynteny between Medicago truncatula and Lens culinaris ssp. culinaris. Theoretical and Applied Genetics 114, 549-558.
Pozarkova, D., Koblizkova, A., Roman, B., Torres, A.M., Lucretti, S., Lysak, M., Dolezel, J., and Macas, J. (2002). Development and characterization of microsatellite markers from chromosome 1-specific DNA libraries of Vicia faba. Biologia Plantarum 45, 337-345.
Prioul-Gervais, S., Deniot, G., Receveur, E.M., Frankewitz, A., Fourmann, M., Rameau, C., Pilet-Nayel, M.L., and Baranger, A. (2007). Candidate genes for quantitative resistance to Mycosphaerella pinodes in pea (Pisum sativum L.). Theoretical and Applied Genetics 114, 971-984.
Raji, A., Anderson, J., Kolade, O., Ugwu, C., Dixon, A., and Ingelbrecht, I. (2009). Gene-based microsatellites for cassava (Manihot esculenta Crantz): prevalence, polymorphisms, and cross-taxa utility. BMC Plant Biology 9, 118.
Rao, S.C., and Northup, B.K. (2011). Growth and nutritive value of grass pea in Oklahoma. Agronomy Journal 103, 1692-1696.
Schaefer, H., Hechenleitner, P., Santos-Guerra, A., Sequeira, M.M.D., Pennington, R.T., Kenicer, G., and Carine, M.A. (2012). Systematics, biogeography, and character evolution of the legume tribe Fabeae with special focus on the middle-Atlantic island lineages. BMC Evolutionary Biology 12, 250.
Schuelke, M. (2000). An economic method for the fluorescent labeling of PCR fragments. Nature Biotechnology 18, 233-234.
Shiferaw, E., Pè, M., Porceddu, E., and Ponnaiah, M. (2011). Exploring the genetic diversity of Ethiopian grass pea (Lathyrus sativus L.) using EST-SSR markers. Molecular Breeding 30, 789-797.
Skiba, B., Ford, R., and Pang, E.C.K. (2003). Amplification and detection of polymorphic sequence-tagged sites in Lathyrus sativus. Plant Molecular Biology Reporter 21, 391-404.

Chapter 2 ___________________________________________________________________
66
Skiba, B., Ford, R., and Pang, E.C.K. (2004). Construction of a linkage map based on a Lathyrus sativus backcrosspopulation and preliminary investigation of QTLs associated with resistance to ascochyta blight. Theoretical and Applied Genetics 109, 1726-1735.
Smýkal, P., Kalendar, R., Ford, R., Macas, J., and Griga, M. (2009). Evolutionary conserved lineage of Angela-family retrotransposons as a genome-wide microsatellite repeat dispersal agent. Heredity 103, 157-167.
Smýkal, P., Kenicer, G., Flavell, A.J., Corander, J., Kosterin, O., Redden, R.J., Ford, R., Coyne, C.J., Maxted, N., Ambrose, M.J., and Ellis, N.T.H. (2011). Phylogeny, phylogeography and genetic diversity of the Pisum genus. Plant Genetic Resources9, 4-18.
Tavoletti, S., and Iommarini, L. (2007). Molecular marker analysis of genetic variation characterizing a grasspea (Lathyrus sativus)collection from central Italy. Plant Breeding 126, 607-611.
Torres, A.M., Weeden, N.F., and Martin, A. (1993). Linkage among isozyme, RFLP and RAPD markers in Vicia faba. Theoretical and Applied Genetics 85, 937-945.
Varshney, R.K., Graner, A., and Sorrells, M.E. (2005). Genic microsatellite markers in plants: features and applications. Trends in Biotechnology 23, 48-55.
Varshney, R.K., Hiremath, P.J., Lekha, P., Kashiwagi, J., Balaji, J., Deokar, A.A., Vadez, V., Xiao, Y., Srinivasan, R., Gaur, P.M., Siddique, K.H., Town, C.D., and Hoisington, D.A. (2009). A comprehensive resource of drought- and salinity- responsive ESTs for gene discovery and marker development in chickpea (Cicer arietinum L.). BMC Genomics 10, 523.
Vaz Patto, M.C., Fernández-Aparicio, M., Moral, A., and Rubiales, D. (2006a). Characterization of resistance to powdery mildew (Erysiphe pisi) in a germplasm collection of Lathyrus sativus.Plant Breeding 125, 308-310.
Vaz Patto, M.C., Fernández-Aparicio, M., Moral, A., and Rubiales, D. (2007). Resistance reaction to powdery mildew (Erysiphe pisi)in a germplasm collection of Lathyrus cicera from Iberianorigin. Genetic Resources and Crop Evolution 54, 1517-1521.
Vaz Patto, M.C., Fernández-Aparicio, M., Moral, A., and Rubiales, D. (2009). Pre and posthaustorial resistance to rusts in Lathyrus cicera L. Euphytica 165, 27-34.
Vaz Patto, M.C., and Rubiales, D. (2009). Identification and characterization of partial resistance to rust in a germplasm collection of Lathyrus sativus L. Plant Breeding 128, 495-500.

Cross-species amplification ___________________________________________________________________
67
Vaz Patto, M.C., Skiba, B., Pang, E.C.K., Ochatt, S.J., Lambein, F., and Rubiales, D. (2006b). Lathyrus improvement for resistance against biotic and abiotic stresses: From classical breeding to marker assisted selection. Euphytica 147, 133-147.
Wojciechowski, M.F., Lavin, M., and Sanderson, M.J. (2004). A phylogeny of legumes (Leguminosae) based on analysis of the plastid matK gene resolves many well-supported subclades within the family. American Journal of Botany 91, 1846-1862.
Xu, Y., Ma, R.C., Xie, H., Liu, J.T., and Cao, M.Q. (2004). Development of SSR markers for the phylogenetic analysis of almond trees from China and the Mediterranean region. Genome 47, 1091-1104.
Zhang, Y., Sledge, M.K., and Bouton, J.H. (2007). Genome mapping of white clover (Trifolium repens L.) and comparative analysis within the Trifolieae using cross-species SSR markers. Theoretical and Applied Genetics 114, 1367-1378.


CHAPTER 3 Allelic diversity in the transcriptomes of
contrasting rust-infected genotypes of Lathyrus sativus, a lasting resource for
smart breeding
The work presented in this chapter was mostly performed by Nuno
Felipe Almeida (see Acknowledgements section), and corresponds to
the following publication:
Almeida, N.F., Leitão, S.T., Krezdorn, N., Rotter, B., Winter, P.,
Rubiales, D., and Vaz Patto, M.C. (2014). Allelic diversity in the
transcriptomes of contrasting rust-infected genotypes of Lathyrus
sativus, a lasting resource for smart breeding. BMC Plant Biology
14, 376.
69


Grass pea response to rust ___________________________________________________________________
71
3.1. Abstract
Grass pea (Lathyrus sativus L.) is a valuable resource for
potentially durable partial resistance to rust. To gain insight into the
resistance mechanism and identify potential resistance genes, we
generated the first comprehensive transcriptome assemblies from
control and Uromyces pisi inoculated leafs of a susceptible and a
partially rust-resistant grass pea genotype by RNA-Seq.
134,914 contigs, shared by both libraries, were used to
analyse their differential expression in response to rust infection.
Functional annotation grouped 60.4% of the contigs present in plant
databases (37.8% of total) to 33 main functional categories, being
“protein”, “RNA”, “signalling”, “transport” and “stress” the most
represented. Transcription profiles revealed considerable differences
in regulation of major phytohormone signalling pathways: whereas
Salicylic and Abscisic Acid pathways were up-regulated in the
resistant genotype, Jasmonate and Ethylene pathways were down-
regulated in the susceptible one. As potential Resistance-genes we
identified a mildew resistance locus O (MLO)-like gene, and MLO-
related transcripts. Also, several pathogenesis-related genes were
up-regulated in the resistant and exclusively down regulated in the
susceptible genotype. Pathogen effectors identified in both inoculated
libraries, as e.g. the rust Rtp1 transcript, may be responsible for the
down-regulation of defence-related transcripts. The two genotypes
contained 4,892 polymorphic contigs with SNPs unevenly distributed
between different functional categories. Protein degradation (29.7%)
and signalling receptor kinases (8.2%) were the most diverged,
illustrating evolutionary adaptation of grass pea to the host/pathogens
arms race.

Chapter 3 ___________________________________________________________________
72
The vast array of novel, resistance-related genomic
information we present here provides a highly valuable resource for
future smart breeding approaches in this hitherto under-researched,
valuable legume crop.
3.2. Introduction
Rusts are among the most important diseases of legumes
(Sillero et al., 2006) and grass pea (Lathyrus sativus L.) is not an
exception (Duke, 1981; Campbell, 1997; Vaz Patto et al., 2006b).
Rusts are caused by biotrophic fungi that keep infected host cells
alive for their development. They form elaborate intracellular
accommodation structures called haustoria, which maintain an
intimate contact between fungal and plant cells over a prolonged
period of time (O’Connell and Panstruga, 2006).
Rust in Lathyrus spp. is caused by Uromyces pisi (Pers.) Wint
and U. viciae-fabae (Pers.) J. Schröt (Barilli et al., 2011; Barilli et al.,
2012), but and in addition to Lathyrus, U. pisi infects a broad range of
other legumes too (Barilli et al., 2012; Rubiales et al., 2013). Plants
have developed multifaceted defence responses, many of which are
induced only upon pathogen attack. These responses may include
induction of pathogenesis related (PR) genes, the production of
secondary metabolites (as e.g. phytoalexins), as well as the
reinforcement of cell walls (Stintzi et al., 1993). Associated with these
responses may be the production of reactive oxygen species (ROS)
and the induction of localized cell death (the hypersensitive response,
HR) (Zurbriggen et al., 2010). The induction of this basal plant
defence machinery occurs upon the recognition of conserved
molecules which are present in a variety of microbial species, but

Grass pea response to rust ___________________________________________________________________
73
absent in the host. These pathogen associated molecular patterns
(PAMPs) are molecular components highly conserved within a class
of microbes, where they have essential functions for their fitness or
survival (Medzhitov and Janeway Jr, 1997). These include, for
example, fungal chitin, β-glucan and ergosterol. The specific virulence
factors of the pathogen, known as fungal effectors, are recognized by
corresponding resistance (R) genes of the host plant. Both rust-
causing pathogens of Lathyrus are able to efficiently overcome R-
gene based resistance (McDonald and Linde, 2002). To date, most
fungal effectors identified are lineage-specific small secreted proteins
(SSP) of unknown function (Stergiopoulos and de Wit, 2009; Schmidt
and Panstruga, 2011). The U. viciae-fabae rust transferred protein 1
(Rtp1) was the first fungal effector visualized in the host cytoplasm
and nucleus after in planta secretion by the rust fungus (Kemen et al.,
2005). Rtp1 belongs to a family of cysteine protease inhibitors that
are conserved in the rust species (order Pucciniales formerly known
as Uredinales) (Pretsch et al., 2013).
Gene-for-gene resistance is associated with the activation of,
for instance, the salicylic acid (SA)-dependent signalling pathway,
leading to expression of defence-related genes like PR1, the
production of ROS and finally to programmed cell death (Bari and
Jones, 2009; Pieterse et al., 2012). Other phytohormones involved in
plant/pathogen interaction are ethylene (ET) and jasmonates (JA).
Plant defence responses appear specifically adapted to the attacking
pathogen, with SA-dependent defences acting mainly against
biotrophs, and JA- and ET-dependent responses acting mainly
against necrotrophs (Glazebrook, 2005; O’Connell and Panstruga,
2006; Smith et al., 2009).

Chapter 3 ___________________________________________________________________
74
Grass pea is a diploid species (2n = 14) with a genome size of
approx. 8.2 Gbp (Bennett and Leitch, 2012). Although grass pea is
primarily self-pollinated, a 2 to 36% outcrossing rate was reported,
depending on location and genotype (Rahman et al., 1995;
Chowdhury and Slinkard, 1997; Gutiérrez-Marcos et al., 2006).
Outcrossing is mainly driven by pollinators, and therefore can be
minimized when grown in isolation (Chowdhury and Slinkard, 1997).
There is a great potential for the expansion of grass pea in dry areas
and zones that are becoming more drought-prone as a result of
climate change (Hillocks and Maruthi, 2012). Partial resistance to U.
pisi has been reported in grass pea as a clear example of
prehaustorial resistance, with no associated necrosis. This resistance
is due to restriction of haustoria formation accompanied by frequent
early abortion of the colonies, reduction in the number of haustoria
per colony and decreased intercellular growth of infecting hyphae
(Vaz Patto and Rubiales, 2009). Though prehaustorial resistance is
typical for non-hosts, it has also been implicated in host partial
resistance (Rubiales and Niks, 1995; Sillero and Rubiales, 2002) and
is common in resistance of major cool season grain legumes against
rusts (Sillero et al., 2006; Rubiales et al., 2011). Additionally, resistant
Lathyrus genotypes may serve as a source of new and useful genetic
traits in the breeding of related major legume crops such as peas,
lentils and vetches. Cross-incompatibility has been reported between
pea and L. sativus, but successful fusion of Pisum sativum and L.
sativus protoplasts (Durieu and Ochatt, 2000) creates new
possibilities for gene transfer between these species. However, the
slow progress in understanding the genetic control of important traits,
such as disease resistance, in Lathyrus species hampered the
development of modern cultivars or the introgression of their
interesting traits into related species.

Grass pea response to rust ___________________________________________________________________
75
In economically important warm season legumes such as
common bean and soybean, complete monogenically controlled
resistances to rusts and associated rust resistance genes have been
described together with closely linked markers for use in marker
assisted backcrossing (Faleiro et al., 2004; Miklas et al., 2006; Hyten
et al., 2007; Garcia et al., 2008; Rubiales et al., 2011). By contrast,
most rust resistances described so far in cool season food legumes
are incomplete in nature and the genetic basis of resistance is largely
unknown. Although QTL mapping studies confirmed the polygenic
control of resistance as e.g. in pea (Barilli et al., 2010a), faba bean
(Rai et al., 2011) and chickpea (Madrid et al., 2008), no markers
suitable for marker assisted selection (MAS) are available yet.
Genomic resources for grass pea are still scarce (e.g. in April
2014 the NCBI database contained only 178 EST sequences from L.
sativus (Skiba et al., 2005)), and the two linkage maps existing for
grass pea do not contain sufficiently informative markers to bridge
between them (Vaz Patto et al., 2006b).
The advent of next-generation sequencing (NGS)
technologies was an important breakthrough enabling the sensitive
and quantitative high-throughput transcriptome analysis referred to as
RNA-Seq (Simon et al., 2009; Metzker, 2010). RNA-Seq
discriminated between microbial and host transcriptomes, during
plant-microbe interactions, using original or phylogenetically related
genomes as a reference for transcript annotation (Kemen et al., 2011;
Fernandez et al., 2012; Tisserant et al., 2012; Westermann et al.,
2012). RNA-Seq gene expression patterns provided also information
on complex regulatory networks and on variations in expressed
genes, such as SNPs and SSRs, in an increasing number of non-

Chapter 3 ___________________________________________________________________
76
model plants (Strickler et al., 2012) and thus may be well suited to
overcome the bottleneck of lacking genomic resources in Lathyrus.
Here we employed RNA-Seq to study the response of L.
sativus to U. pisi infection. We used MapMan and metabolic pathway
analyses to interpret the results and assessed allelic diversity in
transcripts as a source for genic markers for future (comparative)
mapping studies. In addition, the expression of a set of selected
genes was measured by RT-qPCR to validate the RNA-Seq results.
To our knowledge, this is the first study on the global
expression profiling of genes in grass pea/pathogen interaction using
NGS. Our results will assist the elucidation of pathways and genes
associated with resistance to rust in grass pea and related species.
This approach may represent one of the initial steps towards the
development of effective strategies for resistance breeding against
such a quickly evolving pathogen.
3.3. Material and methods
3.3.1. Plant and fungal material, inoculation and RNA isolation
The two L. sativus genotypes, BGE015746 and BGE024709
analysed in the present work were kindly provided by the Plant
Genetic Resources Centre (CRF-INIA), Madrid, Spain. Seeds were
multiplied in insect proof cages in order to minimize outcrossing.
Evaluation for their resistance against U. pisi demonstrated that
BGE024709 is susceptible to rust, whereas BGE015746 displays
partial resistance (Vaz Patto and Rubiales, 2009). Upon infection,
both genotypes present well-formed pustules, with no associated
chlorosis or necrosis. They contrast, however, in disease severity
(DS), i.e. the percentage of leaf area covered by the fungus. Whereas
Grass pea response to rust ___________________________________________________________________
77
the partial resistant genotype has a DS=9%, the susceptible one has
a DS=30%.
The U. pisi monosporic isolate UpCo-01 from the fungal
collection of the Institute for Sustainable Agriculture-CSIC (Córdoba,
Spain) was used for the experiment. Inoculum was multiplied on
plants of the susceptible P. sativum cv. Messire before use.
Twenty-four plants per each genotype and treatment
(inoculated/control) were used. Two-week-old L. sativus seedlings
were inoculated by dusting all the plants at the same time with 2 mg
of spores per plant, diluted in pure talk (1:10), with the help of a small
manual dusting device in a complete random experiment. Inoculated
and control plants were incubated for 24 h at 20 ºC, in complete
darkness, and 100% relative humidity, then transferred to a growth
chamber and kept at 20 ± 2 ºC under 14h light (150 μmol m−2 s−1) and
10h dark.
RNA was extracted from inoculated and non-inoculated fresh
leaves collected 37 hours after inoculation. The material was
immediately frozen in liquid nitrogen and stored at -80 °C. RNA was
isolated using the GeneJET Plant RNA Purification Mini Kit (Thermo
Scientific, Vilnius, Lithuania), according to the manufacturer’s
instructions. The extracted RNA was treated with Turbo DNase I
(Ambion, Austin, TX, USA), and RNA quantification was carried out
using the NanoDrop device (Thermo Scientific, Passau, Germany).
3.3.2. Sequencing and quantification
For each of the 4 combinations, genotype and treatment
(BGE015746 control, BGE015746 inoculated, BGE024709 control
and BGE024709 inoculated) total RNA from 24 plants was extracted

Chapter 3 ___________________________________________________________________
78
and pooled in equal amounts for sequencing. Three RNA-Seq
libraries (one for each genotype and one reference assembly,
including all genotypes and treatments) were generated by GenXPro
GmbH, Germany, using a proprietary protocol. In short, mRNA was
captured from 20 µg of total RNA using Oligo dT(25) beads
(Dynabeads; life Technologies). The purified mRNA was randomly
fragmented in a Zn2+ solution to obtain approximately 250 bp long
RNA fragments. cDNA was synthesized by reverse transcription
starting from 6(N) random hexamer oligonucleotides followed by
second strand synthesis. Barcoded Y-adapters were ligated to the
cDNA and the library was amplified with 10 cycles of PCR. The
libraries were sequenced on an Illumina Hiseq2000 machine. After
Illumina paired-end sequencing, raw sequence reads were passed
through quality filtering, thereby also removing sequencing adapter
primers and cDNA synthesis primers. All high-quality reads were
assembled using the Trinity RNA-Seq de novo assembly (Version:
trinityrnaseq_r2011-11-26). In order to minimize the redundancy,
CAP3 software (Huang and Madan, 1999) was also used with overlap
length cutoff of 30 bp and overlap percent identity cutoff of 75%.
Redundancy was tested using the clustering algorithm UCLUST
((Edgar, 2010), available at http://drive5.com/usearch/
manual/uclust_algo.html). The resulting contigs were annotated via
BLASTX to publically available databases
(ftp://ftp.ncbi.nlm.nih.gov/blast/db/FASTA/nr.gz, nr, plants only). To
identify fungal transcripts, an additional BLASTX to public fungal
databases (http://www.ebi.ac.uk/uniprot, UniProtKB/Swiss-Prot and
UniProtKB/TrEMBL) was performed. The sequenced reads were
mapped with novoalign software (V2.07.14;
http://www.novocraft.com/) to the own assembled contigs. RPKM was
calculated as the normalized transcript expression value (Marioni et

Grass pea response to rust ___________________________________________________________________
79
al., 2008). Our obtained counts were subsequently passed through
DEGSeq to calculate the differential gene expression (R package
version 1.16.0) (Wang et al., 2010).
3.3.3. SNP detection
SNPs were discovered between the two L. sativus genotypes
using JointSNVMix (Roth et al., 2012). The mappings from the
transcriptome analysis were also analysed by JointSNVMix and the
output was furthermore processed by GenXPro’s in-house software to
detect SNPs discriminating the bulks. SNP calling was performed
taking in account only the inoculated samples. A minimum coverage
of 15 reads in each genotype in the inoculated condition was needed
to call a SNP. Polymorphic contigs and their respective SNPs are
listed in Additional File 3.1.
3.3.4. EST-SSR development and genotyping
EST-SSRs were selected in silico by identifying the
polymorphic SSRs between the two L. sativus genotypes.
Identification of the SSRs was done using Phobos plug-in (Mayer,
2010) for the Geneious software (Drummond et al., 2011), using as
search parameters, perfect SSRs with a repeat unit length of two to
six nucleotides. Length polymorphisms were manually identified by
aligning SSR-containing contigs of one genotype against the whole
library of the other genotype. Primers were designed using Primer3
plug-in (Untergasser et al., 2012) for the Geneious software, using as
parameters a melting temperature from 59 to 63ºC, a GC content of
50 to 60% and a primer size ranging from 18 to 24 nucleotides. The
developed EST-SSR markers are listed in Additional File 3.2.

Chapter 3 ___________________________________________________________________
80
PCR reactions for the EST-SSRs genotyping were conducted
using the M13 tail labelling strategy described by Schuelke (2000) in
a total volume of 10 µl containing 10 ng of template DNA, 0.04 µM of
M13(-21) tagged forward primer, 0.16 µM of IRD700 or IRD 800
M13(-21) and 0.16 µM of reverse primer, 0.2 mM of each dNTP, 1.5
mM of MgCl2, and 0.2 unit of Taq DNA polymerase (Promega,
Madison, USA). The amplification reaction consisted of a denaturing
step of 5 min at 94ºC, followed by 30 cycles of 30 s at 94ºC, 45 s at
56ºC, 45 s at 72ºC, and 8 cycles of 30 s at 94ºC, 45 s at 53ºC, 45 s at
72ºC. The reaction was terminated at 72ºC for 10 min.
SSR fragments were resolved with 6.5% polyacrylamide gel
using a LI-COR 4300 DNA Analyzer (Lincoln, NE, USA).
3.3.5. Quantitative RT-PCR assay
1 μg of total RNA from each of three randomly chosen plants
per genotype, per treatment (inoculated/control), was reverse
transcribed in duplicates, using the High Capacity cDNA Reverse
Transcription Kit (Applied Biosystems, Foster City, CA, USA)
following manufacturer’s instructions. Three independent reverse-
transcription reactions (RT) were performed for each cDNA sample in
a total of nine samples per genotype, per treatment. For all genes
studied, the product of each of these reactions was analysed in
technical duplicates, in a total of six technical replicates per
treatment. RT-qPCR reactions were performed with a iQ™5 Real-
Time PCR Detection System (Bio-Rad, Munich, Germany). Primers
were designed using the Primer3 software (Untergasser et al., 2012).
Primer sequences can be found in Additional File 3.3. For data
analysis, the Genex software package (MultiD, Goteborg, Sweden),

Grass pea response to rust ___________________________________________________________________
81
including the geNorm software (Vandesompele et al., 2002) was
used.
3.3.6. Contig annotation and data analysis
In order to classify the contigs into functional categories, the
Mercator pipeline for automated sequence annotation ((Lohse et al.,
2014), available at http://mapman.gabipd.org/web/guest/app/
mercator) was employed. The mapping file was created excluding
contigs without BLAST hit in previous analyses and accessing the
following, manually curated databases: Arabidopsis TAIR proteins
(release 10), SwissProt/UniProt Plant Proteins (PPAP), TIGR5 rice
proteins (ORYZA), Clusters of orthologous eukaryotic genes
database (KOG), Conserved domain database (CDD) and InterPro
scan (IPR). The Mercator mapping file was then employed for
pathway analysis by the MapMan software ((Thimm et al., 2004),
available at http://mapman.gabipd.org/web/guest/mapman).
Differentially expressed contigs were identified by comparing
their expression in leaves of the resistant genotype BGE015746,
control vs. inoculated, and of the susceptible BGE024709, control vs.
inoculated, using DEGSeq (Wang et al., 2010). In cases where a
particular transcript reacted in the same way in both genotypes, the
total transcript count before and after inoculation was compared,
allowing the identification of basal genotypic differences between the
two genotypes.
3.3.7. Availability of supporting data
The raw RNA-Seq data supporting the result of this article is
available in the Sequence Read Archive (SRA), with accession

Chapter 3 ___________________________________________________________________
82
numbers SRS686331, SRS687370, SRS687371 and SRS687373.
This Transcriptome Shotgun Assembly (TSA) project has been
deposited at DDBJ/EMBL/GenBank under the accession
GBSS00000000. The version described in this paper is the first
version, GBSS01000000.
3.4. Results
3.4.1. Contigs from the RNA-Seq transcriptomes of resistant and susceptible L. sativus genotypes
The RNA-Seq libraries from control and inoculated leafs from
the resistant genotype BGE015746 were united prior to assembly to
generate a comprehensive data set enabling the generation of
contigs of maximum length. They included 46,994,629 reads which
were assembled into 105,288 contigs, ranging in size from 150 to
13,929 bp, with a mean contig length of 544 bp. The respective united
library from the susceptible genotype BGE024709 comprised
72,566,465 reads which assembled in 119,870 contigs, with a size
range of 150 to 15,658 bp and a mean contig length of 524 bp.
A reference assembly using both genotypes and treatments
assembled in 134,914 contigs, ranging in size from 150 to 13,916 bp,
with a mean contig length of 501 bp. The mapping and quantification
of both genotypes’ libraries to the reference assembly allowed the
analysis of their differential expression in response to U. pisi infection.
9,501 contigs were unique to the resistant and 15,645 contigs were
unique to the susceptible genotype. Redundancy of the reference
assembly was checked using the clustering algorithm UCLUST,
identifying only 49 (0.036%) transcripts with identity higher than 95%.

Grass pea response to rust ___________________________________________________________________
83
This Transcriptome Shotgun Assembly project has been
deposited at DDBJ/EMBL/GenBank under the accession
GBSS00000000. The version described in this paper is the first
version, GBSS01000000.
3.4.2. RNA-Seq validation by quantitative RT-PCR assay
To validate the RNA-Seq results, expression levels of a set of
9 selected genes were analysed by RT-qPCR. Genes were selected
by their level of expression and transcript count, in order to represent
a broad range of expression profiles. Further, the number of their
transcripts differed between inoculated and control samples by log2
ratios ranging from -6.39 to 4.70 at q-values < 0.05. Their read count
numbers were generally higher than 100, with exception of contig
a45744;151, “mitochondrial chaperone BCS1”, with 2 counts in the
resistant control and 36 counts in the resistant inoculated line, and
contig a32859;123 “seed maturation protein”, with 3 counts in the
susceptible inoculated line and 104 counts in the resistant inoculated
line (Table 3.1). The best housekeeping genes for normalization
suggested by the geNorm software were, for the resistant genotype
samples, “β-tubulin” (a6507;507) and “photosystem I P700 apoprotein
A2” (a160;902), and “O-methyltransferase” (a5102;390), for the
susceptible genotype. A good correlation (R=0.82 for the resistant
and R=0.80 for the susceptible genotypes) was observed between
the log2 fold changes measured by RNA-Seq and RT-qPCR (Figure
3.1).

Chapter 3 ___________________________________________________________________
84
3.4.3. Differential gene expression in resistant and susceptible L. sativus genotypes during infection
Differentially expressed contigs were grouped by expression
patterns based on up- or down-regulation (log2 ≥ 2 or log2 ≤ -2;
respectively, q-value ≤ 0.05) after inoculation. Within each expression
pattern group, comparisons were performed between genotypes.
Expression patterns were grouped in eight response types, according
to their up- or down-regulation, in susceptible and resistant
genotypes, respectively. The number of contigs and description of
each group is summarized in Table 3.2. Most representative groups
are group F (contigs down regulated in both genotypes) and H
(contigs down-regulated only in the resistant genotype) with 2,516
and 1,606 contigs respectively, followed by group A that includes 814
contigs up-regulated in both resistant and susceptible genotypes
upon infection. A detailed list with all the identified contigs, their
description and expression pattern groups can be found in Additional
File 3.4.
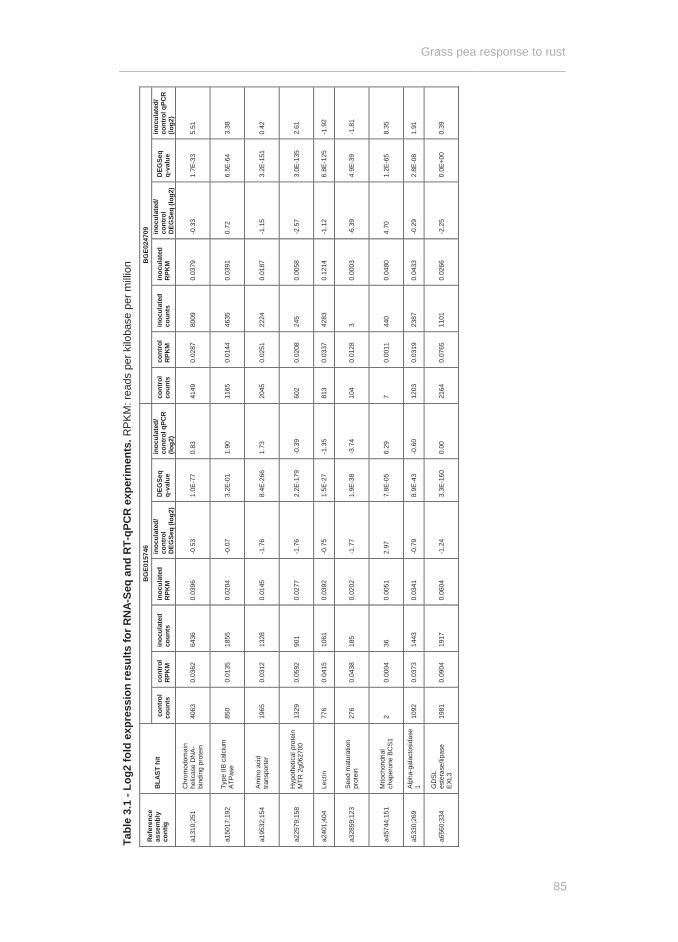
Tabl
e 3.
1 - L
og2
fold
exp
ress
ion
resu
lts fo
r RN
A-Se
q an
d RT
-qPC
R ex
perim
ents
. RPK
M: r
eads
per
kilo
base
per
milli
on
Refe
renc
e as
sem
bly
cont
ig
BLAS
T hi
t BG
E015
746
BGE0
2470
9
con
trol
coun
ts
cont
rol
RPKM
in
ocul
ated
co
unts
in
ocul
ated
RP
KM
inoc
ulat
ed/
cont
rol
DEG
Seq
(log2
) DE
GSe
q
q-va
lue
inoc
ulat
ed/
cont
rol q
PCR
(log2
) co
ntro
l co
unts
co
ntro
l RP
KM
inoc
ulat
ed
coun
ts
inoc
ulat
ed
RPKM
in
ocul
ated
/ co
ntro
l DE
GSe
q (lo
g2)
DEG
Seq
q-
valu
e in
ocul
ated
/ co
ntro
l qPC
R (lo
g2)
a131
0;25
1 C
hrom
odom
ain
helic
ase
DN
A-bi
ndin
g pr
otei
n 40
63
0.03
62
6436
0.
0396
-0
.53
1.0E
-77
0.83
41
49
0.02
87
8009
0.
0379
-0
.33
1.7E
-33
5.51
a150
17;1
92
Type
IIB
calc
ium
AT
Pase
85
0 0.
0135
18
55
0.02
04
-0.0
7 3.
2E-0
1 1.
90
1165
0.
0144
46
35
0.03
91
0.72
6.
5E-6
4 3.
38
a195
32;1
54
Amin
o ac
id
trans
porte
r 19
65
0.03
12
1328
0.
0145
-1
.76
8.4E
-266
1.
73
2045
0.
0251
22
24
0.01
87
-1.1
5 3.
2E-1
51
0.42
a225
79;1
58
Hyp
othe
tical
pro
tein
M
TR 2
g062
700
1329
0.
0592
90
1 0.
0277
-1
.76
2.2E
-179
-0
.39
602
0.02
08
245
0.00
58
-2.5
7 3.
0E-1
35
2.61
a240
1;40
4 Le
ctin
77
6 0.
0415
10
61
0.03
92
-0.7
5 1.
5E-2
7 -1
.35
813
0.03
37
4283
0.
1214
-1
.12
6.8E
-125
-1
.92
a328
59;1
23
Seed
mat
urat
ion
prot
ein
276
0.04
38
185
0.02
02
-1.7
7 1.
9E-3
8 -3
.74
104
0.01
28
3 0.
0003
-6
.39
4.9E
-39
-1.8
1
a457
44;1
51
Mito
chon
dria
l ch
aper
one
BCS1
2
0.00
04
36
0.00
51
2.97
7.
8E-0
5 6.
29
7 0.
0011
44
0 0.
0480
4.
70
1.2E
-65
8.35
a533
0;26
9 Al
pha-
gala
ctos
idas
e 1
1092
0.
0373
14
43
0.03
41
-0.7
9 8.
9E-4
3 -0
.60
1203
0.
0319
23
87
0.04
33
-0.2
9 2.
8E-0
8 1.
91
a656
0;33
4 G
DSL
es
tera
se/li
pase
EX
L3
1981
0.
0904
19
17
0.06
04
-1.2
4 3.
3E-1
60
0.00
21
64
0.07
65
1101
0.
0266
-2
.25
0.0E
+00
0.39
Grass pea response to rust ___________________________________________________________________
85

Chapter 3 ___________________________________________________________________
86
Figure 3.1 - Correlation between RNA-Seq and RT-qPCR. The relative expression levels obtained by RNA-Seq using DEGSeq and by RT-qPCR using the ΔΔCt method. Pearson’s correlation coefficient (R) between relative expression levels is shown above the trend line.
As depicted in Figure 3.2, from the 134,914 contigs that could
be identified and quantified, 68,889 were shared among all libraries.
Of these, 974 contigs were up-regulated and 5,203 contigs down-
regulated in the resistant genotype BGE015746 and 772 contigs up-
and 4,617 down-regulated in the susceptible genotype BGE024709.
Furthermore, from the 5,807 contigs only present in the resistant
genotype’s libraries, 132 were up- and 485 down-regulated
(inoculated vs. control). From the 7,938 contigs only found in the
susceptible genotype’s libraries, 134 were up- and 689 down-
regulated.

Grass pea response to rust ___________________________________________________________________
87
Table 3.2 - Classification of contigs according to their differential expression in the susceptible and resistant genotype upon infection with U. pisi. Up regulated: (log2 >= 2; q-
value ≤ 0.05); Down-regulated: (log2 ≤ -2; q-value ≤ 0.05); higher in Susceptible: (log2 fold
change between all resistant and susceptible genotype contigs <= -2; q-value ≤ 0.05); higher in
Resistant: (log2 fold change between all resistant and susceptible genotype contigs >= 2; q-
value ≤ 0.05)
Expression pattern group Feature # of
contigs
A Up-regulated in Resistant Up-regulated in Susceptible 814
B Up-regulated in Resistant Up-regulated in Susceptible, higher in Susceptible 32
C Up-regulated in Resistant, higher in Resistant Up-regulated in Susceptible 56
D Up-regulated in Susceptible 319
E Up-regulated in Resistant 576
F Down-regulated in Resistant Down-regulated in Susceptible 2,516
G Down-regulated in Susceptible 548
H Down-regulated in Resistant 1,606
Total 134,914
3.4.4. Annotation
From the 134,914 contigs detected in all libraries, 50,937
(37.75%) contigs could be matched via BLAST to entries in plant
databases and 961 (0.71%) matched only to fungal databases. The
latter contigs were present only in the inoculated libraries. Also, 4,558
contigs were absent in control samples and found exclusively in
fungal databases, or with a higher bit-score in fungal databases than
in plant databases and thus, most probably correspond to U. pisi
sequences.

Chapter 3 ___________________________________________________________________
88
Figure 3.2 - Venn diagram of the number of unique and shared contigs between the two genotypes and its expression. In black boxes the number of up (log2 fold ≥ 2) and down (log2 fold ≤ -2) regulated contigs in the inoculated condition versuscontrol. Resistant genotype: BGE015746, susceptible genotype: BGE024709.
As indicated in Figure 3.3, BLAST produced hits mainly to
other legume species with frequencies in the order Medicago
truncatula (26,728; 19.81%), Glycine max (11,436; 8.48%), P.
sativum (1,538; 1.14%) and Lotus japonicus (921; 0.68%). Vitis
vinifera (2,409; 1.79%), Populus trichocarpa (656; 0.49%) and the
model Arabidopsis thaliana (607; 0.45%) were the best matching non-
legume species. BLAST hits from L. sativus comprised only 0.02%
(33 contigs) of the total illustrating the scarcity of Lathyrus entries in
the data bases.

Grass pea response to rust ___________________________________________________________________
89
Figure 3.3 - Number of contigs that could be BLASTed to different plant species.
From the 4,558 contigs that were absent in control samples
and found exclusively in fungal databases, or with a higher bit-score
in fungal databases, 20 contigs from the 49 accessions described in
UniProtKB/Swiss-Prot and UniProtKB/TrEMBL as U. viciae-fabae,
were identified (see list in Additional File 3.5). None of these 20
contigs were significantly differentially expressed between the two
inoculated genotypes. For example, among the eight contigs out of
the 20 without a plant database hit, five were homologous to
“invertase 1”, and the three others to “rust transferred protein – Rtp1”,
“amino acid transporter” and “putative permease”. Six other contigs
absent in control samples and found exclusively in fungal databases
or with a higher bit-score in fungal databases, were homologous to
housekeeping genes that can be found throughout different kingdoms
(three “tubulin beta chain”, two “succinate dehydrogenase” and one
“plasma membrane (H+) ATPase”.

Chapter 3 ___________________________________________________________________
90
Functional annotation of the contigs via Mercator and
MapMan, depicted in Figure 3.4, grouped 60.4 % of them into 33
main functional categories, of which the categories “protein” (11.0%),
“RNA” (8.0%), “signalling” (6.7%), “transport” (5.4%) and “stress”
(4.2%) were most crowded. A total of 39.4% could not be assigned to
any functional category.
Analysis of functional categories, within each expression
pattern group, identified differences among the functions present
within each group. Comparisons were also performed among the
different expression profiles in each category (Figure 3.5). Transcripts
included in the functional categories “stress” and “protein” were
present at a higher percentage in up-regulated expression pattern
groups (“stress” in A, B and C; “protein” in A, B and E), while the
functional category “cell” was present at higher percentage in down-
regulated expression pattern groups (F, G and H). The most
prominent functional category in group C contigs up-regulated in both
genotypes, with a higher expression in the resistant genotype was
“cell wall”. “Lipid metabolism” and “DNA” were also over-represented.
However, also the down-regulated groups F, G, and H contained a
considerable number of contigs from the “cell wall” category. In group
B, joining contigs up-regulated in both genotypes with a higher
expression in the susceptible genotype, the categories “secondary
metabolism” and “hormone metabolism” were over-represented.
Interestingly, the functional category “signalling” was over-
represented in contigs up- regulated only in the susceptible genotype,
as in group D.

Figu
re 3
.4 -
Perc
enta
ge o
f con
tigs
assi
gned
in e
ach
mai
n fu
nctio
nal c
ateg
ory.
Grass pea response to rust ___________________________________________________________________
91
Chapter 3 ___________________________________________________________________
92
3.4.5. Biotic stress related proteins
In order to restrict the number of analysed contigs to the ones
probably more directly related to resistance, we focused mostly on
contigs up-regulated at a higher ratio, or exclusively, in the resistant
genotype (groups C and E), contigs exclusively down-regulated in the
susceptible genotype (group G) and contigs exclusively down-
regulated in the resistant genotype (group H).
From the subcategory “stress.biotic”, two contigs in group E
corresponded to the well- studied mildew resistance locus O (MLO)
gene which was first identified in barley, conferring resistance to
powdery mildew (Jørgensen, 1992). Also, from a total of 25 “MLO-
like” contigs, 12 were differentially expressed. Two of these
(a116583;40 and a25504;132) were down-regulated in the resistant
genotype (group H). These might be related to MLO susceptibility
genes, as reported by several previous studies (Kim and Hwang,
2012; Zheng et al., 2013; McGrann et al., 2014). Interestingly, in the
susceptible genotype, one “PREDICTED: beta glucosidase 12-like”,
identified by Mercator as “PENETRATION 2”, required for MLO-
mediated resistance and belonging to the functional category
“secondary metabolism”, was down-regulated (group G). Group G
also contained one “acidic endochitinase” and two leucine-rich repeat
(LRR) proteins, one TIR-NBS-LRR and one containing LRR and NB-
ARC domains. In group C, a pathogenesis related protein 1 (PR-1)
contig was identified.

Figu
re
3.5
- Pe
rcen
tage
of
co
ntig
s as
sign
ed
in
each
fu
nctio
nal
cate
gory
fo
r ea
ch
expr
essi
on p
atte
rn g
roup
.
A -
cont
igs
up-re
gula
ted
in b
oth
resi
stan
t an
d su
scep
tible
ge
noty
pes
sim
ilarly
;
B -
cont
igs
up-re
gula
ted
in b
oth
geno
type
s,
with
a
high
er
expr
essi
on
in
the
susc
eptib
le
geno
type
;
C -
con
tigs
up-re
gula
ted
in b
oth
geno
type
s, w
ith a
hig
her
expr
es-
sion
in th
e re
sist
ant g
enot
ype;
D -
con
tigs
up-re
gula
ted
only
in
the
susc
eptib
le g
enot
ype;
E -
cont
igs
up-re
gula
ted
only
in
the
resi
stan
t gen
otyp
e;
F - c
ontig
s do
wn-
regu
late
d in
bot
h re
sist
ant
and
susc
eptib
le
geno
type
s si
mila
rly;
G -
cont
igs
dow
n-re
gula
ted
only
in
the
susc
eptib
le g
enot
ype;
H -
cont
igs
dow
n-re
gula
ted
only
in
the
resi
stan
t gen
otyp
e.
Grass pea response to rust ___________________________________________________________________
93

Chapter 3 ___________________________________________________________________
94
The subcategory “stress.abiotic” contained, i.a., genes
involved in response to heat that also respond to biotic stresses. For
example, in group C and E, we identified one “DNAJ heat shock
protein” in both groups, three “heat shock protein 70 family” (group E)
and one “18.1 kDa class 1 heat shock protein” (group E). Group G,
however, contained one “DNAJ homolog subfamily B member” and
one “double Clp-N motif-containing P-loop nucleoside triphosphate
hydrolases superfamily protein”.
Several contigs related to secondary metabolism were
exclusively up-regulated in the resistant genotype (group E). These
comprised a “reticuline oxidase-like protein” involved in alkaloid
biosynthesis, an “isoflavone 2’hydroxylase”, functioning in the
isoflavonoid biosynthesis pathway, a “dihydroflavonol-4-reductase”,
with roles in the flavonoid and brassinosteroid metabolic pathway and
an “AMP-dependent CoA ligase”, acting in the JA and lignin
biosynthesis pathways. In group G, 17 contigs were related to
secondary metabolism including four involved in the flavonoid
pathway, two in the isoprenoid/terpenoid pathway and one “WAX 2-
like” involved in wax biosynthesis.
PTI (pathogen-associated molecular pattern triggered
immunity) relies on an efficient signalling network in order to control
the infection (Nicaise et al., 2009). Receptor kinases are important for
the plant’s pathogen recognition and their expression may be
constitutively expressed or up-regulated in resistant genotypes or
down-regulated in susceptible genotypes in response to effectors
from the pathogen. Receptor kinases and kinases exclusively up-
regulated in the resistant genotype and contained in group E may be
part of such signalling cascades. These included one protein kinase
with thaumatin (PR-5) domain, six “DUF 26”, one “CRINKLY4”, one

Grass pea response to rust ___________________________________________________________________
95
“FERONIA receptor like kinase”, and also a MAP kinase “MAPKKK5”
and a G-protein “zinc finger (Ran-binding) family protein”. In contrast,
the down-regulation of such transcripts in the susceptible genotype
(group G) may contribute to susceptibility. Here we identified three
“DUF 26”, three LRR (“NIK1”, “RKF1” and “PXY”), two G-proteins
(“guanine nucleotide-binding protein” and “dynamin-related protein
1E-like”), two MAP kinases (“PAS domain-containing protein tyrosine
kinase family protein”) and three genes involved in calcium signalling
(“calcium-transporting ATPase”, “calmodulin-binding heat-shock
protein” and “calmodulin-domain protein kinase 9”). Interestingly,
calmodulin also plays a role in the MLO response, where the lack of a
calmodulin binding site decreases its defence response (Kim et al.,
2002).
The “cell wall” category contained seven cellulose synthase
contigs: one in group E “IRREGULAR XYLEM 3 (IRX3)” and four in
group C (three “IRX1” and one “CESA1”). In group G, we identified
two cellulose synthase “IRX14” and two “pectinesterase inhibitor”
contigs.
From the genes normally associated with defence response,
only one “endo-beta-1 3-glucanase” was identified in group C, while
two others “endo-beta-1 3-glucanase” were detected in group G. Also
in group G, we identified two “peroxidase” and two “glutathione S-
transferase” genes.

Chapter 3 ___________________________________________________________________
96
3.4.6. SNPs in resistance pathways
In the 68,889 contigs present in both the susceptible and the
resistant genotypes, we identified 2,634 contigs containing Single
Nucleotide Polymorphisms (SNPs) discriminating between their
respective alleles. The number of SNPs in functional (MapMan)
categories varied considerably. The categories “RNA regulation of
transcription” (9.5%) and “protein.degradation” (8.9%) contained by
far the most SNPs, followed by the protein-related categories
“protein.postranslational modification” (4.3%) and “protein.synthesis”
(3.2%). Other categories including the most SNP-containing contigs
were “signalling.receptor kinases” (2.5%), “protein.targeting” (2.4%)
and the stress related categories, “stress.biotic” (1.8%) and
“stress.abiotic” (1.6%) (Figure 3.6).
3.4.7. EST-SRR development
200 EST-SSR potential polymorphic markers between the two
genotypes were designed. EST-SSRs were identified by the Phobos
software (Mayer, 2010), using as search parameters, perfect SSRs
with a repeat unit lenght of two to six nucleotides. Polymorphisms
between the resistant and susceptible genotypes were manually
identified and flanked by primer pair using the Primer3 software
(Untergasser et al., 2012). To validate the EST-SSR sequences, 40
primer pairs were randomly selected for PCR amplification to confirm
the presence of size polymorphism between the two accessions. PCR
reactions were conducted twice in order to confirm the results. From
the total 40 EST-SSR tested, 25 (62.5%) primer pairs successfully
amplified polymorphic fragments between the two accessions. 6
(15.0%) primer pairs

Figu
re 3
.6 -
Perc
enta
ge o
f con
tigs
cont
aini
ng S
NPs
betw
een
the
resi
stan
t and
sus
cept
ible
gen
otyp
es in
eac
h M
erca
tor m
appi
ng fu
nctio
nal s
ubca
te-
gory
. FA:
fatty
aci
d; m
etab
ol.:
met
abol
ism
; mis
c.: m
isce
llane
ous;
PS:
pho
tosy
nthe
sis;
red.
: red
ox
Grass pea response to rust ___________________________________________________________________
97

Chapter 3 ___________________________________________________________________
98
amplified monomorphic fragments and 5 (12.5%) produce a very
complex pattern. The remaining 4 (10.0%) primer pairs were not able
to produce any fragments.
3.5. Discussion
Lathyrus spp. is a potential source of resistance to several
pathogens (Vaz Patto et al., 2006a; Hillocks and Maruthi, 2012) and
especially L. sativus provides resistance to several fungal and
bacterial diseases (Skiba et al., 2005; Vaz Patto et al., 2006a; Vaz
Patto and Rubiales, 2009; Martín-Sanz et al., 2012). However, the
lack of genetic and/or genomic information was a barrier to further
identify resistance-related genes and to use them in breeding.
In the present study we therefore attempted to improve this
unfavourable situation by identifying ESTs and SNPs, potentially
involved in resistance, that may be used in future smart breeding
approaches. We describe for the first time a high-throughput
transcriptome assembly of grass pea/pathogen interaction, using
genotypes contrasting in response to rust infection, to unravel the
involved partial resistance mechanism and associated resistant
genes.
Our study has identified a large number of differentially
expressed genes corresponding to biological categories that are
thought to be most relevant in grass pea response to rust. A limitation
of our study is the fact that only a single pooled sample was
investigated for each genotype and condition. Although the biological
variance could not be assessed in the bulked approach, the large
number of individual samples in the pool is likely to level out many of
possible outliers. Nevertheless, the validation of twelve genes by RT-

Grass pea response to rust ___________________________________________________________________
99
qPCR, using three biological replicates, provided a good correlation
with RNA-Seq results.
Another motive that could also be influencing our results is
that we used different cDNA synthesis primers, oligo(dT) for the RNA-
Seq and poly(A) for RT-qPCR, what might yield different quantities of
poly-adenylated and non-adenylated transcripts.
Our study was severely hampered by the low number of
annotated sequences, which is due to the lack of a reference
genomic sequence for Lathyrus. Nevertheless, we could annotate
between 34% and 46% of differentially expressed contigs to hits in
plant databases, depending on the genotype and the infection status
of the plants. We further developed new gene-based molecular tools
as e.g. expressed sequence tags, gene-based simple sequence
repeats (EST-SSR) and SNP-based markers. Moreover, we identified
a number of U. pisi effectors in the infected tissues though the overall
low number of observed fungal transcripts probably reflects the low
quantity of fungal structures in early-infected leaves (Hacquard et al.,
2011). Thus, our present study will help to overcome the problems we
encountered in previous work, where the transfer of molecular
markers from close related species had a very low rate of success
(18% for pea EST-SSRs and 6% for pea genomic SSRs, (Almeida et
al., 2014)) Therefore, the present RNA-Seq libraries will boost the
availability of specific EST-SSRs and SNP-based markers that will be
equally important for future development of more effective grass pea
resistance breeding approaches.
The high amplification rate of the developed EST-SSRs
validates the quality of the RNA-Seq data. The few primers that failed
to produce amplification products or produced amplicons with an
unexpected pattern may be caused by the location of the respective

Chapter 3 ___________________________________________________________________
100
primers across splice regions or the presence of a large intron, since
genomic regions are absent from cDNA. In addition also primers
could be derived from chimeric cDNA clones (Varshney et al., 2005)].
Besides the novel markers, the deep insights into
pathogenesis-related mechanisms provided by this study are of
particular interest. The most interesting pathogenesis-related protein
that we identified, the “MLO-like protein” is involved in signalling in
response to biotic stress. MLO was described for the first time in
barley, where its loss of function conferred partial resistance to
powdery mildew by inducing the thickening of the cell wall at fungal
penetration sites (Jørgensen, 1992). Two “MLO-like” contigs were
down-regulated exclusively in the resistant genotype (group E), and
perhaps related to this, we identified cellulose biosynthesis genes.
The exclusively resistance-up-regulated group E contained one
“IRREGULAR XYLEM 3” (IRX3) gene and three “IRX1”. Additionally,
one “cellulose synthase 1” (CESA1) was stronger up-regulated in the
resistant genotype than in the susceptible one (group C). Consistent
with the assumed importance of MLO signalling for rust resistance,
some genes important for MLO function as e.g. “calmodulin”, involved
in calcium signalling as a prerequisite for MLO function (Kim et al.,
2002), were down-regulated in the susceptible genotype (group G).
Previously, several MLO orthologs were already demonstrated to
function as susceptibility genes (Kim and Hwang, 2012; Zheng et al.,
2013; McGrann et al., 2014). Therefore, we consider these two MLO-
like transcripts (a116583;40 and a25504;132) as good potential
candidate susceptibility genes. In order to confirm this assumption,
callose deposition, as a potentially durable resistance mechanism
against rusts, should be further investigated in rust-resistant and
susceptible grass pea genotypes.

Grass pea response to rust ___________________________________________________________________
101
Plant responses to biotic stressors are, i.a., controlled by
phytohormones as e.g. salicylic acid (SA), abscisic acid (ABA),
jasmonates (JA) and ethylene (ET). Differences in expression of
hormone-related genes of the susceptible and resistant genotype, in
response to the pathogen, also occurred in our gene expression
patterns. For example, plant resistance to biotrophic pathogens is
mainly controlled by the SA pathway (Bari and Jones, 2009) and the
importance of SA in the induction of systemic acquired resistance in
legumes against rust fungi has been reported (Barilli et al., 2010b;
Sillero et al., 2012). In our study an inducer of the SA pathway, the
“ethylene response factor 5” (ERF5) gene, which at the same time
inhibits the JA and ET biosynthesis pathways (Son et al., 2011), was
exclusively up-regulated in the resistance genotype (group E),
whereas two Apetala2/Ethylene Responsive Factor (AP2/ERF)
transcription factor genes, important for the regulation of defence
responses (Gutterson and Reuber, 2004), were down- regulated in
the susceptible genotype (group G).
ABA regulates defence responses through its effects on
callose deposition and production of ROS intermediates (Bari and
Jones, 2009), activating also stomata closure as a barrier against
pathogen infection (Melotto et al., 2006). In the resistant genotype,
the transcript for “9-cis-epoxycarotenoid dioxygenase 2”, a key
regulator of ABA biosynthesis in response to drought (Qin and
Zeevaart, 1999), and involved in the crosstalk between ABA and SA
signalling in plant-pathogen interactions (Cao et al., 2011), was up-
regulated (group E), whereas several transcripts engaged in ABA,
auxin and JA signalling, were down-regulated in the susceptible
genotype (group G). This is consistent with a susceptible response to
a biotroph attack (Bari and Jones, 2009).

Chapter 3 ___________________________________________________________________
102
The image emerging from the transcription profiles, of the
resistant and susceptible genotype, further highlights that
pathogenesis related (PR) proteins are key players in Lathyrus-rust
interactions since several PR genes were mainly up-regulated in the
resistant genotype, after inoculation. Among these were two
chitinases (PR-3 and PR-9) involved in the degradation of the fungal
cell wall [9] and a thaumatin (PR-5) gene, which causes an increase
of the permeability of fungal membranes by pore-forming
mechanisms (Selitrennikoff, 2001). In group E, we found a
“pathogenesis related protein 1” (PR-1) and a “protein kinase-coding
resistance protein”, a receptor kinase with a thaumatin domain
(PR5K), presumably involved in thaumatin signaling and described
previously as delaying infection (Guo et al., 2003). Another important
PR-gene, an “acidic endochitinase” (PR3), was down regulated
exclusively in the susceptible genotype. Genes involved in secondary
metabolism were also detected. Legumes utilize flavonoids, notably
isoflavones and isoflavanones, for defence against pathogens and as
signalling molecules, with a number of phenylpropanoids having
antimicrobial activity and restricting pathogen growth and disease
symptoms (Rojas-Molina et al., 2007). In group G, we identified a
“reticuline oxidase-like protein”, up regulated in non- race-specific
resistance to stripe rust in wheat (Chen et al., 2013), an “isoflavone
2'-hydroxylase” from the isoflavonoid pathway (Liu et al., 2003) and a
“dihydroflavonol-4-reductase” catalysing the first enzymatic step in
anthocyanin biosynthesis, in the flavonoid pathway (Shimada et al.,
2004).
Also, exclusively down regulated in the susceptible genotype,
we found some genes important for defence response within the
miscellaneous category, like “endo-beta-1 3-glucanase”, “glutathione

Grass pea response to rust ___________________________________________________________________
103
S-transferase” (GST) and “peroxidase”. In plants, beta-glycosidases
serve a number of diverse and important functions, including
bioactivation of defence compounds, cell wall degradation in
endosperm during seed germination, activation of phytohormones,
and lignifications (Morant et al., 2008). GSTs are detoxification-
related proteins, protecting cells from secondary metabolites
produced in response to pathogen attack, including peroxidases
(Marrs, 1996). Finally, peroxidases function as resistance factors
against invading fungi, inhibiting hyphal elongation, and when H2O2 is
present, causing oxidative burst (Ghosh, 2006).
Effectors are expected to be excellent targets for the control of
pathogens, but, unlike effectors from some other plant pathogens,
relatively little is known about rust effectors (Link et al., 2014). In this
study, several unigenes were identified in fungal databases. The most
known rust effector identified was “rust transferred protein 1” (Rtp1).
This effector aggregates into amyloid-like filaments in vitro (Kemen et
al., 2013). Immunoelectron microscopy localized this effector to the
extrahaustorial matrix protuberances extending into the host
cytoplasm, although the exact role for this protein remains to be
discovered (Giraldo and Valent, 2013). Other Uromyces effectors
identified in this study were “succinate dehydrogenase”, “invertase”
and “permease”. From the total potential rust transcripts identified, a
selection of effector proteins could be used as probes to identify the
target host proteins as a first step in the development of effector-
driven legume breeding, maximizing the durability of resistance
against the quickly evolving rust pathogens (Vleeshouwers et al.,
2011).
From the DE contigs obtained in the present study, 2,634
presented SNPs between the resistant and the susceptible lines. The

Chapter 3 ___________________________________________________________________
104
MapMan software aided in the functional categorisation of SNPs,
revealing that the categories “RNA regulation of transcription” (9.5%)
and “protein.degradation” (8.9%) contained by far the most SNPs.
Within these categories, ubiquitins were most polymorphic (5.6%).
Ubiquitins tag proteins for proteasome degradation and play a central
role in signalling pathways (Marino et al., 2012). Especially ubiquitin
“E3 RING” and “SCF F-BOX” contigs contained a large number of
SNPs (1.7% and 1.8% respectively). E3 RING and SCF F-BOX
proteins are involved in several aspects of plant immunity ranging
from pathogen recognition to both PTI to effector-triggered immunity
(ETI). From the differentially expressed contigs identified as
containing SNPs, we found one E3 RING, “PREDICTED: RING-H2
finger protein ATL2-like”, down regulated in the susceptible genotype.
Four other functional categories, “RNA.regulation of transcription”
(9.5%), “protein.postranslational modification” (4.3%),
"protein.synthesis" (3.2%) and "signalling.receptor kinases" (2.5%),
also contained significant numbers of polymorphisms. Especially the
“signalling.receptor kinases” category may be of particular interest for
further studies since receptor kinases recognize pathogen effectors
and their rapid evolution, reflected by large numbers of
polymorphisms, may represent plants adaptation to a rapidly
changing spectrum of pathogens in the arms race between them and
their hosts (Karasov et al., 2014).
The large number of SNPs that we identified will be
instrumental for the development of linkage and high-throughput
association mapping approaches and for the expansion of our
previous diversity studies in Lathyrus (Almeida et al., 2014; Vaz Patto
and Rubiales, 2014).
Grass pea response to rust ___________________________________________________________________
105
Our results provide an overview of gene expression profiles of
contrasting L. sativus genotypes inoculated with rust, offering a
valuable set of sequence data for candidate rust resistant gene
discovery.
3.6. Conclusions
Our transcriptome analysis provided comprehensive insight
into the molecular mechanisms underlying prehaustorial rust
resistance in L. sativus.
The differences in resistance between the two L. sativus
genotypes investigated appear to be mainly due to the activation of
the SA pathway and several pathogenesis related genes, including
the ones regulated by MLO. The fastest-evolving pathways
differentiating between the two genotypes are the general RNA’s
regulation of transcription, followed by the Ubiquitin-26S proteasome
system and having also as most mutated receptor-based signalling
genes and biotic and abiotic stress related genes. The detected
polymorphic SNPs will allow the development of new gene-based
molecular tools. Altogether, 51 genes were identified as potential
resistance genes, prioritizing them as specific targets for future
functional studies on grass pea/rust interactions. Besides a plethora
of pathogenesis-related host genes, 4,558 transcripts, including
putative effectors, were also identified for the rust fungus U. pisi. As a
consequence of the newly developed wider array of genetic and
genomic resources, future work will focus on high throughput
mapping of the genetic basis of disease resistance in L. sativus and
eventual comparative mapping with other legume species,

Chapter 3 ___________________________________________________________________
106
contributing all to an improved exploitation of this under used highly
potential legume species.
3.7. Acknowledgments
NFA carried out the inoculations and sample processing for
sequencing and RT-qPCR, designed the RT-qPCR primers,
performed the data analysis, developed the EST-SSRs primers and
drafted the manuscript. NFA and STL participated in the results
generation on RT-qPCR and data analysis. STL performed the EST-
SSR genotyping. NK and BR performed the RNA sequencing and
bioinformatics data processing. PW and DR revised the manuscript
critically. MCVP coordinated the study and participated to the drafting
and revision of the manuscript. NFA would like to thank the CRF-
INIA, Madrid, Spain, for supplying the genotypes.
3.8. References
Almeida, N.F., Leitão, S.T., Caminero, C., Torres, A.M., Rubiales, D., and Vaz Patto, M.C. (2014). Transferability of molecular markers from major legumes to Lathyrus spp. for their application in mapping and diversity studies. Molecular Biology Reports 41, 269-283.
Bari, R., and Jones, J.G. (2009). Role of plant hormones in plant defence responses. Plant Molecular Biology 69, 473-488.
Barilli, E., Moral, A., Sillero, J.C., and Rubiales, D. (2012). Clarification on rust species potentially infecting pea (Pisum sativum L.) crop and host range of Uromyces pisi (Pers.) Wint. Crop Protection 37, 65-70.
Barilli, E., Satovic, Z., Rubiales, D., and Torres, A.M. (2010a). Mapping of quantitative trait loci controlling partial resistance against rust incited by Uromyces pisi (Pers.) Wint. in a Pisum fulvum L. intraspecific cross. Euphytica 175, 151-159.
Barilli, E., Satovic, Z., Sillero, J.C., Rubiales, D., and Torres, A.M. (2011). Phylogenetic analysis of Uromyces species infecting

Grass pea response to rust ___________________________________________________________________
107
grain and forage legumes by sequence analysis of nuclear ribosomal internal transcribed spacer region. Journal of Phytopathology 159, 137-145.
Barilli, E., Sillero, J.C., and Rubiales, D. (2010b). Induction of systemic acquired resistance in pea against rust (Uromyces pisi) by exogenous application of biotic and abiotic inducers. Journal of Phytopathology 158, 30-34.
Bennett, M.D., and Leitch, I.J. (2012). "Angiosperm DNA C-values database". (release 8.0, Dec. 2012) http://data.kew.org/cvalues/).
Campbell, C.G. (1997). Promoting the conservation and use of underutilized and neglected crops. Grass pea. Lathyrus sativus L. Rome, Italy: International Plant Genetic Resources Institute.
Cao, F.Y., Yoshioka, K., and Desveaux, D. (2011). The roles of ABA in plant-pathogen interactions. Journal of Plant Research 124, 489-499.
Chen, X., Coram, T., Huang, X., Wang, M., and Dolezal, A. (2013). Understanding molecular mechanisms of durable and non-durable resistance to stripe rust in wheat using a transcriptomics approach. Current Genomics 14, 111-126.
Chowdhury, M.A., and Slinkard, A.E. (1997). Natural outcrossing in grasspea. Journal of Heredity 88, 154-156.
Drummond, A.J., Ashton, B., Buxton, S., Cheung, M., Cooper, A., Duran, C., Field, M., Heled, J., Kearse, M., Markowitz, S., Moir, R., Stones-Havas, S., Sturrock, S., Thierer, T., and Wilson, A. (2011). "Geneious v5.4, Available from http://www.geneious.com).
Duke, J. (1981). Handbook of Legumes of World Economic Importance. New York, U.S.A.: Plennun Press.
Durieu, P., and Ochatt, S.J. (2000). Efficient intergeneric fusion of pea (Pisum sativum L.) and grass pea (Lathyrus sativus L.) protoplasts. Journal of Experimental Botany 51, 1237-1242.
Edgar, R.C. (2010). Search and clustering orders of magnitude faster than BLAST. Bioinformatics 26, 2460-2461.
Faleiro, F., Ragagnin, V.A., Moreira, M.A., and De Barros, E.G. (2004). Use of molecular markers to accelerate the breeding of common bean lines resistant to rust and anthracnose. Euphytica 138, 213-218.
Fernandez, D., Tisserant, E., Talhinhas, P., Azinheira, H., Vieira, A.N.A., Petitot, A.-S., Loureiro, A., Poulain, J., Da Silva, C., Silva, M.D.O.C., and Duplessis, S. (2012). 454-pyrosequencing of Coffea arabica leaves infected by the rust fungus Hemileia vastatrix reveals in planta-expressed

Chapter 3 ___________________________________________________________________
108
pathogen-secreted proteins and plant functions in a late compatible plant–rust interaction. Molecular Plant Pathology 13, 17-37.
Garcia, A., Calvo, E.S., De Souza Kiihl, R.A., Harada, A., Hiromoto, D.M., and Vieira, L.G. (2008). Molecular mapping of soybean rust (Phakopsora pachyrhizi) resistance genes: discovery of a novel locus and alleles. Theoretical and Applied Genetics 117, 545-553.
Ghosh, M. (2006). Antifungal properties of haem peroxidase from Acorus calamus. Annals of Botany 98, 1145-1153.
Giraldo, M.C., and Valent, B. (2013). Filamentous plant pathogen effectors in action. Nature Reviews Microbiology 11, 800-814.
Glazebrook, J. (2005). Contrasting mechanisms of defense against biotrophic and necrotrophic pathogens. Annual Review of Phytopathology 43, 205-227.
Guo, Z., Bonos, S., Meyer, W., Day, P., and Belanger, F. (2003). Transgenic creeping bentgrass with delayed dollar spot symptoms. Molecular Breeding 11, 95-101.
Gutiérrez-Marcos, J.F., Vaquero, F., Sáenz De Miera, L.E., and Vences, F.J. (2006). High genetic diversity in a world-wide collection of Lathyrus sativus L. revealed by isozymatic analysis. Plant Genetic Resources 4, 159-171.
Gutterson, N., and Reuber, T.L. (2004). Regulation of disease resistance pathways by AP2/ERF transcription factors. Current Opinion in Plant Biology 7, 465-471.
Hacquard, S., Veneault-Fourrey, C., Delaruelle, C., Frey, P., Martin, F., and Duplessis, S. (2011). Validation of Melampsora larici-populina reference genes for in planta RT-quantitative PCR expression profiling during time-course infection of poplar leaves. Physiological and Molecular Plant Pathology 75, 106-112.
Hillocks, R., and Maruthi, M. (2012). Grass pea (Lathyrus sativus): Is there a case for further crop improvement? Euphytica 186, 647-654.
Huang, X., and Madan, A. (1999). CAP3: A DNA sequence assembly program. Genome Research 9, 868-877.
Hyten, D.L., Hartman, G.L., Nelson, R.L., Frederick, R.D., Concibido, V.C., Narvel, J.M., and Cregan, P.B. (2007). Map location of the Rpp1 locus that confers resistance to soybean rust in soybean. Crop Science 47, 837-840.
Jørgensen, I.H. (1992). Discovery, characterization and exploitation of Mlo powdery mildew resistance in barley. Euphytica 63, 141-152.

Grass pea response to rust ___________________________________________________________________
109
Karasov, T.L., Horton, M.W., and Bergelson, J. (2014). Genomic variability as a driver of plant–pathogen coevolution? Current Opinion in Plant Biology 18, 24-30.
Kemen, E., Gardiner, A., Schultz-Larsen, T., Kemen, A.C., Balmuth, A.L., Robert-Seilaniantz, A., Bailey, K., Holub, E., Studholme, D.J., Maclean, D., and Jones, J.D. (2011). Gene gain and loss during evolution of obligate parasitism in the white rust pathogen of Arabidopsis thaliana. PLoS Biol 9, e1001094.
Kemen, E., Kemen, A., Ehlers, A., Voegele, R., and Mendgen, K. (2013). A novel structural effector from rust fungi is capable of fibril formation. The Plant Journal 75, 767-780.
Kemen, E., Kemen, A.C., Rafiqi, M., Hempel, U., Mendgen, K., Hahn, M., and Voegele, R.T. (2005). Identification of a protein from rust fungi transferred from haustoria into infected plant cells. Molecular Plant-Microbe Interactions 18, 1130-1139.
Kim, D.S., and Hwang, B.K. (2012). The pepper MLO gene, CaMLO2, is involved in the susceptibility cell-death response and bacterial and oomycete proliferation. The Plant Journal 72, 843-855.
Kim, M.C., Panstruga, R., Elliott, C., Muller, J., Devoto, A., Yoon, H.W., Park, H.C., Cho, M.J., and Schulze-Lefert, P. (2002). Calmodulin interacts with MLO protein to regulate defence against mildew in barley. Nature 416, 447-451.
Link, T.I., Lang, P., Scheffler, B.E., Duke, M.V., Graham, M.A., Cooper, B., Tucker, M.L., Van De Mortel, M., Voegele, R.T., Mendgen, K., Baum, T.J., and Whitham, S.A. (2014). The haustorial transcriptomes of Uromyces appendiculatus and Phakopsora pachyrhizi and their candidate effector families. Molecular Plant Pathology 15, 379-393.
Liu, C.J., Huhman, D., Sumner, L.W., and Dixon, R.A. (2003). Regiospecific hydroxylation of isoflavones by cytochrome p450 81E enzymes from Medicago truncatula. The Plant Journal 36, 471-484.
Lohse, M., Nagel, A., Herter, T., May, P., Schroda, M., Zrenner, R., Tohge, T., Fernie, A.R., Stitt, M., and Usadel, B. (2014). Mercator: a fast and simple web server for genome scale functional annotation of plant sequence data. Plant Cell and Environment 37, 1250-1258.
Madrid, E., Rubiales, D., Moral, A., Moreno, M.T., Millán, T., Gil, J., and Rubio, J. (2008). Mechanism and molecular markers associated with rust resistance in a chickpea interspecific cross (Cicer arietinum × Cicer reticulatum). European Journal of Plant Pathology 121, 43-53.

Chapter 3 ___________________________________________________________________
110
Marino, D., Peeters, N., and Rivas, S. (2012). Ubiquitination during plant immune signaling. Plant Physiology 160, 15-27.
Marioni, J.C., Mason, C.E., Mane, S.M., Stephens, M., and Gilad, Y. (2008). RNA-seq: an assessment of technical reproducibility and comparison with gene expression arrays. Genome Research 18, 1509-1517.
Marrs, K.A. (1996). The functions and regulation of glutathione S-transferases in plants. Annu Rev Plant Physiol Plant Mol Biol 47, 127-158.
Martín-Sanz, A., Palomo, J., Pérez De La Vega, M., and Caminero, C. (2012). Characterization of Pseudomonas syringae pv. syringae isolates associated with bacterial blight in Lathyrus spp. and sources of resistance. European Journal of Plant Pathology 134, 205-216.
Mayer, C. (2010) Phobos 3.3.11, http://www.rub.de/spezzoo/cm/cm_phobos.htm.
Mcdonald, B., and Linde, C. (2002). The population genetics of plant pathogens and breeding strategies for durable resistance. Euphytica 124, 163-180.
Mcgrann, G.R.D., Stavrinides, A., Russell, J., Corbitt, M.M., Booth, A., Chartrain, L., Thomas, W.T.B., and Brown, J.K.M. (2014). A trade off between mlo resistance to powdery mildew and increased susceptibility of barley to a newly important disease, Ramularia leaf spot. Journal of Experimental Botany.
Medzhitov, R., and Janeway Jr, C.A. (1997). Innate immunity: the virtues of a nonclonal system of recognition. Cell 91, 295-298.
Melotto, M., Underwood, W., Koczan, J., Nomura, K., and He, S.Y. (2006). Plant stomata function in innate immunity against bacterial invasion. Cell 126, 969-980.
Metzker, M.L. (2010). Sequencing technologies - the next generation. Nature Reviews Genetics 11, 31-46.
Miklas, P., Kelly, J., Beebe, S., and Blair, M. (2006). Common bean breeding for resistance against biotic and abiotic stresses: From classical to MAS breeding. Euphytica 147, 105-131.
Morant, A.V., Bjarnholt, N., Kragh, M.E., Kjærgaard, C.H., Jørgensen, K., Paquette, S.M., Piotrowski, M., Imberty, A., Olsen, C.E., Møller, B.L., and Bak, S. (2008). The β-glucosidases responsible for bioactivation of hydroxynitrile glucosides in Lotus japonicus. Plant Physiology 147, 1072-1091.
Nicaise, V., Roux, M., and Zipfel, C. (2009). Recent advances in PAMP-triggered immunity against bacteria: pattern recognition receptors watch over and raise the alarm. Plant Physiology 150, 1638-1647.

Grass pea response to rust ___________________________________________________________________
111
O’connell, R.J., and Panstruga, R. (2006). Tête à tête inside a plant cell: establishing compatibility between plants and biotrophic fungi and oomycetes. New Phytologist 171, 699-718.
Pieterse, C.M.J., Van Der Does, D., Zamioudis, C., Leon-Reyes, A., and Van Wees, S.C.M. (2012). Hormonal modulation of plant immunity. Annual Review of Cell and Developmental Biology, Vol 28 28, 489-521.
Pretsch, K., Kemen, A., Kemen, E., Geiger, M., Mendgen, K., and Voegele, R. (2013). The rust transferred proteins-a new family of effector proteins exhibiting protease inhibitor function. Molecular Plant Pathology 14, 96-107.
Qin, X., and Zeevaart, J.a.D. (1999). The 9-cis-epoxycarotenoid cleavage reaction is the key regulatory step of abscisic acid biosynthesis in water-stressed bean. Proceedings of the National Academy of Sciences of the United States of America 96, 15354-15361.
Rahman, M.M., Kumar, J., Rahman, M.A., and Ali Afzal, M. (1995). Natural outcrossing in Lathyrus sativus L. Indian Journal of Genetics & Plant Breeding 55, 204-207.
Rai, R., Singh, A.K., Singh, B.D., Joshi, A.K., Chand, R., and Srivastava, C.P. (2011). Molecular mapping for resistance to pea rust caused by Uromyces fabae (Pers.) de-Bary. Theoretical and Applied Genetics 123, 803-813.
Rojas-Molina, M.D., Rubiales, D., Prats, E., and Sillero, J.C. (2007). Effects of phenylpropanoid and energetic metabolism inhibition on faba bean resistance mechanisms to rust. Phytopathology 97, 60-65.
Roth, A., Ding, J., Morin, R., Crisan, A., Ha, G., Giuliany, R., Bashashati, A., Hirst, M., Turashvili, G., Oloumi, A., Marra, M.A., Aparicio, S., and Shah, S.P. (2012). JointSNVMix: a probabilistic model for accurate detection of somatic mutations in normal/tumour paired next-generation sequencing data. Bioinformatics 28, 907-913.
Rubiales, D., Castillejo, M.A., Madrid, E., Barilli, E., and Rispail, N. (2011). Legume breeding for rust resistance: lessons to learn from the model Medicago truncatula. Euphytica 180, 89-98.
Rubiales, D., and Niks, R.E. (1995). Characterization of Lr34, a major gene conferring nonhypersensitive resistance to wheat leaf rust. Plant Disease 79, 1208-1212.
Rubiales, D., Sillero, J.C., and Emeran, A.A. (2013). Response of vetches (Vicia spp.) to specialized forms of Uromyces vicia-fabae and to Uromyces pisi. Crop Protection 46, 38-43.

Chapter 3 ___________________________________________________________________
112
Schmidt, S.M., and Panstruga, R. (2011). Pathogenomics of fungal plant parasites: what have we learnt about pathogenesis? Current Opinion in Plant Biology 14, 392-399.
Schuelke, M. (2000). An economic method for the fluorescent labeling of PCR fragments. Nature Biotechnology 18, 233-234.
Selitrennikoff, C.P. (2001). Antifungal proteins. Applied and Environmental Microbiology 67, 2883-2894.
Shimada, S., Takahashi, K., Sato, Y., and Sakuta, M. (2004). Dihydroflavonol 4-reductase cDNA from non-anthocyanin-producing species in the Caryophyllales. Plant Cell Physiology 45, 1290-1298.
Sillero, J.C., Fondevilla, S., Davidson, J., Patto, M.C.V., Warkentin, T.D., Thomas, J., and Rubiales, D. (2006). Screening techniques and sources of resistance to rusts and mildews in grain legumes. Euphytica 147, 255-272.
Sillero, J.C., Rojas-Molina, M.M., Avila, C.M., and Rubiales, D. (2012). Induction of systemic acquired resistance against rust, ascochyta blight and broomrape in faba bean by exogenous application of salicylic acid and benzothiadiazole. Crop Protection 34, 65-69.
Sillero, J.C., and Rubiales, D. (2002). Histological characterization of resistance to Uromyces viciae-fabae in faba bean. Phytopathology 92, 294-299.
Simon, S.A., Zhai, J., Nandety, R.S., Mccormick, K.P., Zeng, J., Mejia, D., and Meyers, B.C. (2009). Short-read sequencing technologies for transcriptional analyses. Annual Review of Plant Biology 60, 305-333.
Skiba, B., Ford, R., and Pang, E.C.K. (2005). Construction of a cDNA library of Lathyrus sativus inoculated with Mycosphaerella pinodes and the expression of potential defence-related expressed sequence tags (ESTs). Physiological and Molecular Plant Pathology 66, 55-67.
Smith, J.L., De Moraes, C.M., and Mescher, M.C. (2009). Jasmonate- and salicylate-mediated plant defense responses to insect herbivores, pathogens and parasitic plants. Pest Management Science 65, 497-503.
Son, G.H., Wan, J., Kim, H.J., Nguyen, X.C., Chung, W.S., Hong, J.C., and Stacey, G. (2011). Ethylene-Responsive Element-Binding Factor 5, ERF5, is involved in chitin-induced innate immunity response. Molecular Plant-Microbe Interactions 25, 48-60.
Stergiopoulos, I., and De Wit, P.J.G.M. (2009). Fungal effector proteins. Annual Review of Phytopathology 47, 233-263.

Grass pea response to rust ___________________________________________________________________
113
Stintzi, A., Heitz, T., Prasad, V., Wiedemann-Merdinoglu, S., Kauffmann, S., Geoffroy, P., Legrand, M., and Fritig, B. (1993). Plant ‘pathogenesis-related’ proteins and their role in defense against pathogens. Biochimie 75, 687-706.
Strickler, S.R., Bombarely, A., and Mueller, L.A. (2012). Designing a transcriptome next-generation sequencing project for a nonmodel plant species. American Journal of Botany 99, 257-266.
Thimm, O., Blasing, O., Gibon, Y., Nagel, A., Meyer, S., Kruger, P., Selbig, J., Muller, L.A., Rhee, S.Y., and Stitt, M. (2004). MAPMAN: a user-driven tool to display genomics data sets onto diagrams of metabolic pathways and other biological processes. The Plant Journal 37, 914-939.
Tisserant, E., Kohler, A., Dozolme-Seddas, P., Balestrini, R., Benabdellah, K., Colard, A., Croll, D., Da Silva, C., Gomez, S.K., Koul, R., Ferrol, N., Fiorilli, V., Formey, D., Franken, P., Helber, N., Hijri, M., Lanfranco, L., Lindquist, E., Liu, Y., Malbreil, M., Morin, E., Poulain, J., Shapiro, H., Van Tuinen, D., Waschke, A., Azcón-Aguilar, C., Bécard, G., Bonfante, P., Harrison, M.J., Küster, H., Lammers, P., Paszkowski, U., Requena, N., Rensing, S.A., Roux, C., Sanders, I.R., Shachar-Hill, Y., Tuskan, G., Young, J.P.W., Gianinazzi-Pearson, V., and Martin, F. (2012). The transcriptome of the arbuscular mycorrhizal fungus Glomus intraradices (DAOM 197198) reveals functional tradeoffs in an obligate symbiont. New Phytologist 193, 755-769.
Untergasser, A., Cutcutache, I., Koressaar, T., Ye, J., Faircloth, B.C., Remm, M., and Rozen, S.G. (2012). Primer3-new capabilities and interfaces. Nucleic Acids Research 40, e115.
Vandesompele, J., De Preter, K., Pattyn, F., Poppe, B., Van Roy, N., De Paepe, A., and Speleman, F. (2002). Accurate normalization of real-time quantitative RT-PCR data by geometric averaging of multiple internal control genes. Genome Biology 3, research0034-research0034.0011.
Varshney, R.K., Graner, A., and Sorrells, M.E. (2005). Genic microsatellite markers in plants: features and applications. Trends in Biotechnology 23, 48-55.
Vaz Patto, M.C., Fernández-Aparicio, M., Moral, A., and Rubiales, D. (2006a). Characterization of resistance to powdery mildew (Erysiphe pisi) in a germplasm collection of Lathyrus sativus. Plant Breeding 125, 308-310.
Vaz Patto, M.C., and Rubiales, D. (2009). Identification and characterization of partial resistance to rust in a germplasm collection of Lathyrus sativus L. Plant Breeding 128, 495-500.

Chapter 3 ___________________________________________________________________
114
Vaz Patto, M.C., and Rubiales, D. (2014). Lathyrus diversity: available resources with relevance to crop improvement – L. sativus and L. cicera as case studies. Annals of Botany 113, 895-908.
Vaz Patto, M.C., Skiba, B., Pang, E.C.K., Ochatt, S.J., Lambein, F., and Rubiales, D. (2006b). Lathyrus improvement for resistance against biotic and abiotic stresses: From classical breeding to marker assisted selection. Euphytica 147, 133-147.
Vleeshouwers, V.G., Raffaele, S., Vossen, J.H., Champouret, N., Oliva, R., Segretin, M.E., Rietman, H., Cano, L.M., Lokossou, A., Kessel, G., Pel, M.A., and Kamoun, S. (2011). Understanding and exploiting late blight resistance in the age of effectors. Annual Review of Phytopathology 49, 507-531.
Wang, L., Feng, Z., Wang, X., and Zhang, X. (2010). DEGseq: an R package for identifying differentially expressed genes from RNA-seq data. Bioinformatics 26, 136-138.
Westermann, A.J., Gorski, S.A., and Vogel, J. (2012). Dual RNA-seq of pathogen and host. Nature Reviews Microbiology 10, 618-630.
Zheng, Z., Nonomura, T., Appiano, M., Pavan, S., Matsuda, Y., Toyoda, H., Wolters, A.-M.A., Visser, R.G.F., and Bai, Y. (2013). Loss of function in Mlo orthologs reduces susceptibility of pepper and tomato to powdery mildew disease caused by Leveillula taurica. PLoS ONE 8, e70723.
Zurbriggen, M.D., Carrillo, N., and Hajirezaei, M.R. (2010). ROS signaling in the hypersensitive response: when, where and what for? Plant Signal Behav 5, 393-396.

Grass pea response to ascochyta blight ___________________________________________________________________
115
Chapter 4 Lathyrus sativus transcriptome resistance response to Ascochyta lathyri investigated
by deepSuperSAGE analysis
The work presented in this chapter was mostly performed by Nuno
Felipe Almeida (see Acknowledgements section), and corresponds to
the following publication:
Almeida, N.F., Krezdorn, N., Rotter, B., Winter, P., Rubiales, D., and
Vaz Patto, M.C. (2015). Lathyrus sativus transcriptome resistance
response to Ascochyta lathyri investigated by deepSuperSAGE
analysis. Frontiers in Plant Science 6, 178.


Grass pea response to ascochyta blight ___________________________________________________________________
117
4.1. Abstract
Lathyrus sativus (grass pea) is a temperate grain legume crop
with a great potential for expansion in dry areas or zones that are
becoming more drought-prone. It is also recognized as a potential
source of resistance to several important diseases in legumes, such
as ascochyta blight. Nevertheless, the lack of detailed genomic
and/or transcriptomic information hampers further exploitation of
grass pea resistance-related genes in precision breeding. To
elucidate the pathways differentially regulated during ascochyta-grass
pea interaction and to identify resistance candidate genes, we
compared the early response of the leaf gene expression profile of a
resistant L. sativus genotype to Ascochyta lathyri infection with a non-
inoculated control sample from the same genotype employing
deepSuperSAGE. This analysis generated 14.387 UniTags of which
95.7% mapped to a reference grass pea/rust interaction
transcriptome. From the total mapped UniTags, 738 were significantly
differentially expressed between control and inoculated leaves. The
results indicate that several gene classes acting in different phases of
the plant/pathogen interaction are involved in the L. sativus response
to A. lathyri infection. Most notably a clear up-regulation of defence-
related genes involved in and/or regulated by the ethylene pathway
was observed. There was also evidence of alterations in cell wall
metabolism indicated by overexpression of cellulose synthase and
lignin biosynthesis genes. This first genome-wide overview of the
gene expression profile of the L. sativus response to ascochyta
infection delivered a valuable set of candidate resistance genes for
future use in precision breeding.

Chapter 4 ___________________________________________________________________
118
4.2. Introduction
Lathyrus sativus (grass pea) is a diploid species (2n = 14;
genome size of approx. 8.2 Gbp (Bennett and Leitch, 2012)) with a
great potential for expansion in dry areas or zones that are becoming
more drought-prone (Hillocks and Maruthi, 2012). This species has
been also recognized as a potential source of resistance to several
important diseases in legumes (Vaz Patto and Rubiales, 2014).
Ascochyta blights are among the most important plant
diseases worldwide (Rubiales and Fondevilla, 2012). Among the
legume species, ascochyta blights are incited by different pathogens.
For example, ascochytoses are caused by Ascochyta rabiei
(teleomorph Didymella rabiei) in chickpea, A. fabae (teleomorph D.
fabae) in faba bean and A. lentis (teleomorph D. lentis) in lentil (Tivoli
et al., 2006). Ascochyta blight in pea (Pisum sativum) is caused by a
fungal complex formed by A. pisi, A. pinodes (teleomorph Didymella
pinodes (syn. Mycosphaerella pinodes)) and Phoma medicaginis var.
pinodella (Jones, 1927). Of these, D. pinodes is the most frequent
and damaging (Tivoli and Banniza, 2007).
Lathyrus spp. (L. sativus, L. cicera, L. ochrus and L.
clymenum) however, are significantly more resistant to D. pinodes
than field pea cultivars (Gurung et al., 2002). A detailed analysis of
quantitative resistance of L. sativus to ascochyta blight, caused by D.
pinodes, suggested that resistance in L. sativus may be controlled by
two independently segregating genes, operating in a complementary
epistatic manner (Skiba et al., 2004b). In another study, Skiba et al.
(2004a) developed a grass pea linkage map and used it to locate two
quantitative trait loci (QTL), explaining 12% and 9% of the observed
variation in resistance to D. pinodes. Nevertheless, no candidate
genes were identified at that time for these resistance QTLs,

Grass pea response to ascochyta blight ___________________________________________________________________
119
hampering their use in precision breeding. In an attempt to identify
defence-related candidate genes involved in D. pinodes resistance in
L. sativus, the expression of 29 potentially defence-related ESTs was
compared between L. sativus resistant and susceptible lines (Skiba et
al., 2005). These ESTs were selected from a previously developed
cDNA library of L. sativus stem and leaf tissue challenged with D.
pinodes. From these, sixteen ESTs were considered eventually
important for conferring stem resistance to ascochyta blight in L.
sativus. In addition, the marker developed from one of them, EST
LS0574 (Cf-9 resistance gene cluster), was significantly linked to one
of the previously identified resistance QTLs. However this study was
necessarily limited to the small number of initially selected EST
sequences.
deepSuperSAGE (Matsumura et al., 2012) is the combination
of SuperSAGE (Matsumura et al., 2003) with high-throughput
sequencing technologies, allowing genome-wide and quantitative
gene expression profiling. Two recent studies applied this technique
for the identification of genes involved in resistance to ascochyta
blight in pea (Fondevilla et al., 2014) and faba bean (Madrid et al.,
2013).
In the present study we employed deepSuperSAGE to obtain
a genome-wide overview of the response of the transcriptome of a
resistant L. sativus genotype to A. lathyri infection in comparison to a
non-inoculated control. Thereby we aimed at elucidation of signaling
pathways responding to A. lathyri infection and identification of
candidate genes associated with resistance to ascochyta blight in
grass pea as first step towards the development of effective
strategies for legume resistance breeding against this pathogen.

Chapter 4 ___________________________________________________________________
120
4.3. Materials and methods
4.3.1. Plant material and inoculation
Lathyrus sativus genotype BGE015746, previously
characterized by our team as resistant to A. lathyri (isolate “Asc.8”),
not developing macroscopic disease symptoms (pers. comm.), was
used for the experiments. Isolate “Asc.8” belongs to the fungal
collection of the Institute for Sustainable Agriculture-CSIC (Córdoba,
Spain) while the L. sativus genotype BGE015746 was kindly provided
by the Plant Genetic Resources Centre (CRF-INIA), Madrid, Spain.
Fifteen-days old seedlings, grown in plastic pots containing 250 cm3
of 1:1 sand-peat mixture in a controlled growth chamber (20 ± 2 ºC
with a 12 h light photoperiod), were inoculated with the monoconidial
A. lathyri isolate “Asc.8”, collected in Zafra, Spain. Three individual
plants were used for each treatment (inoculated/control). Spore
suspension for inoculation was prepared at a concentration of 5x10⁵
spores per millilitre and sprayed onto the plants’ aerial parts as
described by Fondevilla et al. (2014). Inoculated and control plants
were then kept in the dark for 24 h at 20 ºC and with 100% relative
humidity in order to promote spore germination and were then
transferred to the initial growth chamber conditions. Resistance was
confirmed by the absence of disease symptoms 15 days after
inoculation (d.a.i.), while other Lathyrus spp. genotypes presented
diverse levels of infection, ranging up to 60% of leaf area covered by
lesions (pers. comm.).
4.3.2. RNA extraction and deepSuperSAGE library construction
Leaves from one plant per treatment were harvested at 2 h
time intervals during the first 24 h after inoculation (h.a.i.). A total of

Grass pea response to ascochyta blight ___________________________________________________________________
121
twelve leaf samples per plant (one per each 2 h time point) were
immediately frozen in liquid nitrogen after harvest and stored at -80
ºC. Total RNA was isolated from each sample separately, using the
GeneJet Plant purification kit (Thermo Scientific, Vilnius, Lithuania)
according to the manufacture’s protocols. Isolated RNA was
subsequently treated with Turbo DNase I (Ambion, Austin, TX, USA),
and quantified by NanoDrop (Thermo Scientific, Passau, Germany).
100 µg-samples of individual plant RNA from each time point were
then pooled in two bulks, a control and an inoculated pool. RNA
integrity was controlled by electrophoresis on a 2% agarose gel
(Lonza, Rockland, USA) with SYBRSafe (Invitrogen, Eugene, USA)
staining and visualized using a GEL-DOC 1000 System (Bio-Rad,
Hercules, USA). deepSuperSAGE libraries from the two pools of
control and inoculated RNAs were generated at GenXPro GmbH as
described by Zawada et al. (2011). High-throughput DNA sequencing
was performed on an Illumina Genome Analyser IIx using the
Chrysalis 36 cycles v 4.0 sequencing kit. The multiplexed sequencing
run consists of thirty-eight sequencing cycles on a single lane.
4.3.3. Data analysis and annotation
The sequence reads obtained by Illumina sequencing from
each of the two pooled samples were processed with GenXPro’s in-
house analysis pipeline. Briefly, libraries were sorted according to
their respective index, followed by elimination of PCR-derived tags
identified by TrueQuant technology. The sequences representing
distinct deepSuperSAGE tags were quantified. These unique
sequences (UniTags) were subsequently annotated against various
databases via BLAST (Altschul et al., 1990). A multi-step BLAST
procedure was used to annotate the UniTag reads to ensure an

Chapter 4 ___________________________________________________________________
122
unambiguous assignment to their corresponding transcript and to
eliminate any remaining adaptor sequences. Reference datasets
were generated by own de-novo-assembly (Almeida et al., 2014) and
downloaded from the publicly accessible Fabaceae databases using
the nucleotide database from the National Center for Biotechnology
Information (NCBI). UniTag reads were successively aligned against
these reference datasets in the following order: (1) 26 bp de-novo-
assembly dataset with a minimum BLAST-score of 42; (2) UniTags
which did not attain the specified BLAST score in the previous step
were aligned against the complete NCBI dataset with the same
required BLAST score of 42 or above. For each library, UniTag read
numbers were normalized to a million sequenced reads in total (tags
per million; TPM) to allow the comparison between the two
(control/inoculated) libraries. P-values for the UniTags were
calculated using a perl module (http://search.cpan.org/~scottzed/Bio-
SAGE-Comparison-1.00/) (Velculescu et al., 1995; Audic and
Claverie, 1997; Saha et al., 2002). The fold changes were calculated
as the log2 ratio of the normalized values between the two libraries.
4.3.4. Quantitative RT-PCR assays
For the quantitative RT-PCR assay, RNA samples from the
different time points were pooled into two composite samples per
plant, one control and one inoculated, in equimolar amounts. One μg
of total RNA from each of these six composite samples (three plants/
two treatments) was reverse transcribed using the High Capacity
cDNA Reverse Transcription Kit (Applied Biosystems, Foster City,
CA, USA), according to manufacturer’s instructions. For all studied
genes, the product of each of these reactions was analysed in
technical duplicates, in a total of six technical replicates per treatment

Grass pea response to ascochyta blight ___________________________________________________________________
123
(inoculated/control). Analysed genes were selected by their level of
expression and tag count from the deepSuperSAGE analysis. The
chosen UniTags differed between inoculated and control samples by
log2 ratios ranging from -1.73 to 3.37, with UniTag counts ranging
from 1 to 558. Primers were designed using the Primer3 software
(Untergasser et al., 2012) (Table 4.1), and RT-qPCR reactions
performed with an iQ™5 Real-Time PCR Detection System (Bio-Rad,
Munich, Germany). Data analysis was performed using the Genex
software package (MultiD, Goteborg, Sweden), by the geNorm
software (Vandesompele et al., 2002).
4.3.5. UniTag assignment to functional categories
In order to classify the L. sativus UniTags into functional
categories, the Mercator pipeline for automated sequence annotation
(Lohse et al., 2014), available at http://mapman.gabipd.org/web/
guest/app/mercator, was employed. The mapping file was created
using only significantly (-1 ≤ log2 fold change ≥ 1; p-value < 0.05) up-
and down-regulated UniTags and accessing the following, manually
curated databases: Arabidopsis TAIR proteins (release 10),
SwissProt/UniProt Plant Proteins (PPAP), TIGR5 rice proteins
(ORYZA), Clusters of orthologous eukaryotic genes database (KOG),
Conserved domain database (CCD) and InterPro scan (IPR). The
Mercator mapping file was then employed for analysis by the
MapMan software (Thimm et al., 2004), available at
http://mapman.gabipd.org/web/guest/mapman.

Tabl
e 4.
1. C
ontig
info
rmat
ion
and
prim
er s
eque
nces
for R
T-qP
CR.
Cont
ig
BLAS
T hi
t Fo
rwar
d pr
imer
5´
3´
Rev
erse
prim
er 5
´3´
a716
2;27
2 1-
acyl
-sn-
glyc
erol
-3-p
hosp
hate
ac
yltra
nsfe
rase
1, c
hlor
opla
stic
-like
C
ATG
CTT
TGC
TTC
GG
TGG
AC
C
TTG
GA
CC
GC
CAT
TGC
AATC
a600
;793
40
S ri
boso
mal
pro
tein
S24
G
CG
GA
CAA
GG
CAG
TCA
CTA
T G
GC
CTT
TGAG
AC
ATT
AG
CC
CT
a574
;578
40
S ri
boso
mal
pro
tein
S29
A
TGG
AC
TCA
TGTG
CTG
CA
GG
A
AAC
CTA
AC
CTT
GG
CTG
GC
C
a114
56;2
03
AB
C tr
ansp
orte
r A fa
mily
m
embe
r 1-li
ke
TGC
ATC
CAT
CA
TGG
TGA
CG
G
TGC
TGC
CC
AG
TTTC
AC
TGTT
a145
90;2
04
Abh
ydro
lase
dom
ain
cont
aini
ng
prot
ein
CC
CG
AC
AG
TGA
ATC
CC
TTC
C
AC
AG
AC
AG
CAG
TGC
CG
AAAT
a650
7;50
7 β-
tubu
lin
TGC
CTA
GG
ATC
AGC
AG
CA
CA
TCA
GTG
TCC
CTG
AG
CTC
AC
T
a535
4;16
1 hi
ston
e H
3 A
CG
CTC
GC
CTC
TAA
TAC
GC
G
CA
GC
TGAG
TCG
TAC
CTT
GT
a833
;622
L-
allo
-thre
onin
e al
dola
se
AG
TCA
CG
GAA
TCA
CC
AAAT
CC
C
ATC
GTC
TCG
TGG
CTT
GTG
G
a639
6;39
4 M
alic
enz
yme
TTG
GC
TAC
GC
ATC
TTC
CTC
G
GC
TTC
TGTT
CA
CC
TATA
GTT
GC
GG
a156
;182
8 ox
ygen
-evo
lvin
g en
hanc
er
prot
ein
3 pr
ecur
sor
GTA
CTT
CTC
TGC
TTC
TGA
GG
GAC
C
CA
AG
CC
TAA
GG
AC
CA
GA
AAC
A
a865
8;35
8 pr
imar
y am
ine
oxid
ase-
like
GG
GC
CTT
TCAA
AGC
TTG
GC
TG
TTC
CTC
CAA
GC
CC
AAG
TG
a183
19;1
29
RN
A p
olym
eras
e II
C-te
rmin
al
dom
ain
phos
phat
ase-
like
prot
ein
AA
TCTC
GC
GA
TCC
AC
GTC
AC
TG
GC
TTG
TGG
AAC
GAA
TGA
GG
a125
5;50
8 un
know
n A
GTG
CG
GG
TATG
GAA
TCA
CG
TG
GG
AC
AC
CA
GA
TGAA
TGG
C
a108
68;2
60
Vill
in-4
G
TCA
GC
TCC
CG
GC
AG
TTTA
G
AAA
GTT
TCC
CG
GG
AG
CA
GTC
Chapter 4 ___________________________________________________________________
124

Grass pea response to ascochyta blight ___________________________________________________________________
125
4.4. Results
4.4.1. SuperSAGE library characterization
A total of 399,648 deepSuperSAGE 26bp-tags were obtained.
Of these 205,691 tags were derived from L. sativus inoculated with A.
lathyri and 193,957 tags from control plants. These tags
corresponded to 14,386 unique sequences (UniTags) of which 13,773
(95.7%) were successfully annotated to the L. sativus reference
dataset (Almeida et al., 2014).
When comparing inoculated versus control samples, 738
UniTags were differentially expressed (DE) (log2 fold ≥ 2 (up) or log2
fold ≤ -2 (down); p-value < 0.05). Of the differentially expressed
UniTags, 625 (84.7%) were successfully annotated in public plant
databases. 354 UniTags matched also to entries in fungal databases,
but bit scores were always lower than the plant database hit, and
therefore were considered UniTags of plant origin. From the 625
differentially expressed UniTags with BLAST hit, 382 (61.1%) were
up-regulated while 243 (38.9%) were down-regulated. The full list of
differentially expressed UniTags can be found in Additional file 4.1.
4.4.2. SuperSAGE validation by quantitative RT-qPCR assay
From the geNorm software analysis the best housekeeping
gene for the quantitative RT-qPCR validation was “β-tubulin”
(transcript a6507;507). The expression levels of the remaining
thirteen genes analysed by RT-qPCR to validate the RNA-Seq results
are present in Table 4.2. A good correlation (R=0.8) was observed
between the log2 fold changes measured by deepSuperSAGE and
RT-qPCR for the genes tested (Figure 4.1).

Chapter 4 ___________________________________________________________________
126
Figure 4.1: Relative expression levels correlation between RNA-Seq and RT-qPCR. Pearson’s correlation coefficient (R) between relative expression levels is shown below the trend line.
4.4.3. Annotation of differentially expressed genes in the resistant L. sativus genotype after A. lathyri infection
Functional annotation of the UniTags via Mercator and
MapMan, grouped 625 UniTags (382 up- and 243 down-regulated)
into 25 main functional categories. Most represented categories from
up-regulated UniTags were “protein metabolism” (11.6% up- and
8.1% down-regulated), “RNA metabolism” (9.4% up- and 4.7% down-
regulated), “miscellaneous” (5.7% up- and 3.4% down-regulated),
“signaling” (4.7% up- and 3.4% down-regulated) and “cell
metabolism” (4.2% up- and 2.7% down-regulated) (Figure 4.2).
Potential candidate genes assigned to stress-related
functional categories are listed in Table 4.3.

Tabl
e 4.
2. L
og2
fold
exp
ress
ion
resu
lts fo
r dee
pSup
erSA
GE
and
RT-q
PCR
expe
rimen
ts.
Cont
ig
BLAS
T hi
t
BGE0
1574
6
Cont
rol
tag
coun
ts
Cont
rol
tags
per
m
illio
n In
ocul
ated
ta
g co
unts
In
ocul
ated
ta
gs p
er
mill
ion
inoc
ulat
ed/ c
ontr
ol
deep
Supe
rSAG
E (lo
g2)
inoc
ulat
ed/
cont
rol
qPC
R (lo
g2)
a716
2;27
2 1-
acyl
-sn-
glyc
erol
-3-p
hosp
hate
ac
yltra
nsfe
rase
1, c
hlor
opla
stic
-lik
e 1
5,15
58
11
53,4
783
3.37
5 1.
81
a600
;793
40
S ri
boso
mal
pro
tein
S24
76
39
1,83
9 57
27
7,11
5 -0
.500
0.
15
a574
;578
40
S ri
boso
mal
pro
tein
S29
17
1 88
1,63
9 12
8 62
2,29
3 -0
.503
0.
21
a114
56;2
03
AB
C tr
ansp
orte
r A fa
mily
m
embe
r 1-li
ke
10
51,5
578
23
111,
818
1.11
7 0.
23
a145
90;2
04
Abh
ydro
lase
dom
ain
cont
aini
ng
prot
ein
5 25
,778
9 4
19,4
466
-0.4
07
-0.0
1
a535
4;16
1 hi
ston
e H
3 54
27
8,41
2 31
15
0,71
2 -0
.885
-0
.79
a833
;622
L-
allo
-thre
onin
e al
dola
se
12
61,8
694
36
175,
02
1.50
0 0.
45
a639
6;39
4 M
alic
enz
yme
18
92,8
041
41
199,
328
1.10
3 0.
77
a156
;182
8 ox
ygen
-evo
lvin
g en
hanc
er
prot
ein
3 pr
ecur
sor
558
2876
,93
292
1419
,61
-1.0
19
-1.0
2
a865
8;35
8 pr
imar
y am
ine
oxid
ase-
like
122
629,
005
39
189,
605
-1.7
30
-2.3
8
a183
19;1
29
RN
A p
olym
eras
e II
C-te
rmin
al
dom
ain
phos
phat
ase-
like
prot
ein
31
159,
829
26
126,
403
-0.3
38
0.21
a125
5;50
8 un
know
n 36
18
5,60
8 36
17
5,02
-0
.085
-0
.74
a108
68;2
60
Vill
in-4
30
15
4,67
3 14
68
,063
3 -1
.184
0.
04
Grass pea response to ascochyta blight ___________________________________________________________________
127

Chapter 4 ___________________________________________________________________
128
Figure 4.2: Percentage of annotated up- and down-regulated L. sativus UniTags upon A. lathyri inoculation in several functional categories by MapMan.
4.5. Discussion
The present study provides the first comprehensive overview
of gene expression of the L. sativus response to ascochyta infection.
It delivered a valuable set of grass pea sequences for resistance
candidate gene discovery and use in precision breeding for this
species.
deepSuperSAGE analysis of an ascochyta blight resistant
grass pea genotype, using control and inoculated plants, generated
14.387 UniTags. Of those, 95.7% mapped to a recently published
reference grass pea/rust interaction transcriptome assembly (Almeida
et al., 2014). From the total mapped UniTags, 738 were differentially
expressed between control and inoculated conditions, 625 of which
could be annotated in public plant databases.

Grass pea response to ascochyta blight ___________________________________________________________________
129
Table 4.3 - List of detected genes by functional category, expression values and putative function as described in Mercator.
Functional category
Up/Down-regulated Gene Contig
log2 fold
change Putative function
stress total of 13 genes
biotic Up
multidrug and toxin compound extrusion (MATE) efflux a10578;232 10.1 transport
armadillo (ARM) repeat superfamily protein a11957;197 9.2 protein degradation
acidic endochitinase precursor (E.C. 3.2.1.14) a3844;425 2.7 antimicrobial activity
RESISTANCE TO P. SYRINGAE PV MACULICOLA 1 (RPM1) a15229;117 2.7 pathogen recognition
PR-1-like protein a8364;304 2.5 pathogenesis related - function unknown
disease resistance-responsive (dirigent-like protein) a19559;148 2.4 pathogenesis related - function
unknown
Down similar to a chitin-binding protein (PR-4) a4526;396 -2.7 antimicrobial activity
abiotic
Up
DNAJ heat shock protein a14646;184 9.2 protein folding
DNAJ heat shock protein a11774;196 2.9 protein folding
heat shock protein 101 family a22155;174 2.7 thermotolerance to chloroplasts
Down
S-adenosyl-L-methionine-dependent methyltransferases superfamily proteins a76762;48 -10.0 methylation
S-adenosyl-L-methionine-dependent methyltransferases superfamily proteins a15131;185 -9.3 methylation
damaged DNA binding protein 1A a7531;356 -2.4 negative regulation of photomorphogenesis
secondary metabolism
total of 8 genes
flavonoids Up chalcone reductase a124260;32 9.6 flavonoid biosynthesis
isoprenoids Up
violaxanthin de-epoxidase a1039;529 10.2 isoprenoid biosynthesis
tocopherol cyclase a708;558 9.8 isoprenoid biosynthesis
beta-hydroxylase 1 a3019;480 9.2 isoprenoid biosynthesis
RAB geranylgeranyl transferase beta subunit 1 a18716;198 2.7 isoprenoid biosynthesis
Down pyridoxal phosphate (PLP)-dependent transferases superfamily protein a23319;167 -9.3 isoprenoid biosynthesis
phenylpropanoids Up phenylalanine ammonia-lyase 1 (PAL1) a5118;361 3.1 lignin biosynthesis
4-coumarate-CoA ligase a9524;336 2.4 lignin biosynthesis
cell wall total of 9 genes
precursor synthesis Up UDP-sugar pyrophospharylase a18802;199 9.2 cell wall synthesis
cellulose synthesis
Up IRREGULAR XYLEM 1 (IRX1) a12901;208 2.9 cell wall synthesis
Down
cellulose synthase isomer (CESA3) a6154;437 -9.0 cell wall synthesis
cellulose-synthase-like C5 (CSLC5) a69762;64 -9.0 cell wall synthesis
glycosylphosphatidylinositol-anchored protein COBRA-like (COB) a5236;405 -2.2 cell wall synthesis
degradation Down β-xylosidase 1 (BXL1) a4868;387 -2.5 cell wall degradation
modification Down xyloglucan endotransglycosylase-related protein (XTR4) a2002;437 -2.9 cell wall modifications
pectin*esterases Up SKU5 similar 9 (sks9) a34641;119 9.4 cell wall modifications
Down plant invertase/pectin methylesterase inhibitor superfamily a7441;320 -2.4 cell wall modifications

Chapter 4 ___________________________________________________________________
130
Table 4.3 (cont.)
Functional category
Up/Down-regulated Gene Contig
log2 fold
change Putative function
hormone metabolism total of 6 genes
ethylene Up
basic helix-loop-helix (bHLH) DNA-binding superfamily protein a246012;14 9.8 induced by ethylene
1-aminocyclopropane-1-carboxylate synthase (ACC) a11244;194 9.4 ethylene biosynthesis
calmodulin-binding transcription activator protein with CG-1 and Ankyrin domains a7309;224 8.9 induced by ethylene
Down RING E3 ligase, XBAT32 a25116;120 -2.9 inhibitor of ethylene biosynthesis
salicylic acid Up UDP-glucosyltransferase 74F1 a25008;62 9.2 salicylic acid biosynthesis
abscisic acid Up plasma membrane protein KOBITO (KOB1) a7591;247 2.7 abscisic acid signal
transduction
miscella-neous
total of 4 genes
glutathione S transferases Up glutathione S-transferase a20761;129 9.6 detoxification
peroxidases Down peroxidase superfamily protein a20130;174 -9.3 production of reactive oxygen species
beta 1,3 glucan hydrolases
Up glucan endo-1,3-beta-glucosidase a243608;22 8.9 antimicrobial activity
Down glucan endo-1,3-beta-glucosidase 11-like a34766;162 -3.1 antimicrobial activity
Although differences may be observed between
deepSuperSAGE and RT-qPCR results due to the presence of
different transcript isoforms from the same gene, or different genes
from the same family that cannot be distinguished by the 26-bp tag of
the 3’-untranslated region provided by deepSuperSAGE (Fondevilla
et al., 2014), the validation of thirteen differentially expressed genes
by RT-qPCR, using three biological replicates, provided a good
correlation with deepSuperSAGE results. Interestingly, the most
invariably expressed UniTag corresponded to a β-tubulin transcript.
This transcript was also identified as the best normalization gene in a
previous RNA-Seq study, where this genotype (BGE015746) was
inoculated with Uromyces pisi (Almeida et al., 2014).
The functional interpretation of differential gene expression
patterns provided evidence for the involvement of genes assigned to
several functional categories in different phases of the plant/pathogen
interaction. As listed in Table 4.3, the most significant stress-related

Grass pea response to ascochyta blight ___________________________________________________________________
131
responses of the resistant genotype, however, were probably the
clear-cut up-regulation of the ethylene signaling pathway represented
by genes involved in ethylene synthesis and down-regulation of
inhibitors of ethylene synthesis and the up-regulation of ethylene-
induced genes. Another prominent response concerned alterations in
the cell wall metabolism, as indicated by the up-regulation of cellulose
synthase genes and genes related to lignin biosynthesis.
Pathogenesis-related functions induced by ascochyta infection are
discussed below.
4.5.1. Pathogen perception
The first step in plant defence response is pathogen detection
by pattern recognition receptors (PRR) as part of the innate immune
system. This pathogen perception will trigger signaling events that
activate a broad array of downstream defensive measures in the plant
(Nicaise et al., 2009). In this study we identified several differentially
expressed receptor kinases (up- and down-regulated) containing
leucine-rich repeats (LRRs), that are key players in the regulation of
diverse biological processes such as development, hormone
perception and/or plant defence (Torii, 2004). We also identified an
up-regulated receptor kinase with a thaumatin-like domain
(a36033;97, log2 fold = 9.4). Thaumatin is a pathogenesis related
(PR) protein described as increasing the permeability of fungal
membranes by pore-forming mechanisms and therefore restraining
fungal growth or even killing it (Selitrennikoff, 2001). Several
thaumatin-like proteins have been shown to increase resistance in
potato (Acharya et al., 2013), rice (Datta et al., 1999), wheat (Anand
et al., 2003) and grapevine (Jayasankar et al., 2003) to diverse fungal
pathogens. Several transcription factors were also induced upon

Chapter 4 ___________________________________________________________________
132
pathogen recognition. One “WRKY DNA-binding protein 4”
(a8940;191, log2 fold = 8.9) was identified in our study as up-
regulated after inoculation. WRKY transcription factors are induced
after the recognition by intracellular receptors of pathogen virulence
molecules (effectors). After its induction, WRKY transcription factors
can positively or negatively regulate various aspects of pathogen-
associated molecular pattern (PAMP)-triggered immunity (PTI) and
effector triggered immunity (ETI) (review by Eulgem (2005)). Also
related to ETI, we found an up-regulated transcript with homology to
Arabidopsis “RESISTANCE TO P. SYRINGAE PV MACULICOLA 1
(RPM1)”, known to confer resistance to Pseudomonas syringae
strains containing the avirulence genes avrB and avrRpm1 (Bisgrove
et al., 1994). In the incompatible interaction in the model plant, RIN4
(RPM1 interacting protein 4) interacts with RPM1, to prevent its
activation. Reduction of RIN4 expression enhances resistance to P.
syringae and to the oomycete Paranospora parasitica. Therefore
RIN4 is considered a negative regulator of basal plant defences that
is activated by P. syringae´s avrB and avrRpm1 (Mackey et al.,
2002). Assuming a similar function of the RPM1-homolog in grass
pea-ascochyta interaction this gene could be a resistance-steering
candidate gene. It would be further interesting to know whether up-
regulation of the RPM1-homolog is part of a broad defence response,
or if it is activated by a specific Ascochyta spp. effector that the grass
pea’s RPM1 is able to recognize.
4.5.2. Hormone signaling
It is generally accepted that biotrophic pathogens usually
trigger the salicylic acid (SA) pathway, while necrotrophic pathogens
activate jasmonic acid (JA) and the ethylene (ET) pathways

Grass pea response to ascochyta blight ___________________________________________________________________
133
(Glazebrook, 2005; Bari and Jones, 2009). The nature of the initial
phases of Ascochyta spp. infection in grass pea is still not completely
understood. Normally considered as necrotroph, there is evidence, at
least for some Ascochyta spp., for an early biotrophic phase spanning
from the penetration of the epidermis of the plant until the initial
colonization of the mesophyll (Tivoli and Banniza, 2007).
Our data, however, demonstrate that the ethylene pathway
may have a major role in resistance of at least our grass pea
accession to A. lathyri, in line with the necrotrophic nature of the
interaction. For example, the “1-aminocyclopropane-1-carboxylate
synthase (ACC)” gene involved in ET biosynthesis and other two
genes described by Mercator (Lohse et al., 2014) as being induced
by ethylene (“Calmodulin-binding transcription activator with CG-1
and Ankyrin domains” and “basic helix-loop-helix (bHLH) DNA-
binding superfamily protein”) were significantly up-regulated upon
infection. The transcript is homologous to the “Calmodulin-binding
transcription activator with CG-1 and Ankyrin domains” previously
identified as similar to “Calmodulin-binding protein/ER66 protein” from
tomato (Skiba et al., 2005). It seems that in grass pea either different
transcript isoforms or a gene family exists, since in Skiba et al.
(2005), sixteen defence-related ESTs were identified with a greater
or/and earlier expression in stems of resistant L. sativus genotypes
compared with susceptible ones upon ascochyta blight inoculation. In
our study from those only “Calmodulin-binding transcription activator
with CG-1 and Ankyrin domains” was up-regulated whereas three
other SuperTags with similar annotation were not differentially
expressed. The incongruence between our results and that of Skiba
et al. (2005) may be explained by the different mechanism of
resistance, since the L. sativus genotype used by Skiba et al. (2005),

Chapter 4 ___________________________________________________________________
134
ATC 80878, is partially resistant, and the genotype used in our study,
BGE015746, displays complete resistance. Furthermore, the
pathogen isolates used in both studies were also different, since the
ATC 80878 genotype was inoculated with a mixture of three highly
aggressive (on several P. sativum genotypes) M. pinodes isolates
(WAL3, T16 and 4.9) whereas our ascochyta inoculum was a
monoconidial A. lathyri isolate.
Additionally in our study, “RING E3 ligase, XBAT32”, an
ubiquitin described as negative regulator of ET biosynthesis in
Arabidopsis during plant growth, development and salt stress (Prasad
and Stone, 2010), was down-regulated again stressing the
importance of ET for resistance in our L. sativus genotype. ET
pathway induction was also observed by microarray and
deepSuperSAGE analyses during the response of a resistant pea
genotype to ascochyta blight infection (Fondevilla et al., 2011;
Fondevilla et al., 2014). Thus, up-regulation of ET signaling may be a
general response of temperate legumes to ascochyta blight infection.
Although the ET pathway was the only hormone pathway
clearly up-regulated, other genes involved in hormone signaling were
also up-regulated. These included “UDP-glycosyltransferase 74 F1
(UGT74F1)”, and “phenylalanine ammonia-laser 1” (PAL1), both
involved in SA biosynthesis in Arabidopsis (Mauch-Mani and
Slusarenko, 1996).
4.5.3. Cell wall fortification
Ascochyta lathyri penetrates the host’s epidermal cells via an
as yet imperfectly described biotrophic or necrotrophic phase to reach
the mesophyll. However, it is known that during pathogen penetration,
Grass pea response to ascochyta blight ___________________________________________________________________
135
the plant’s cell wall is not just a static physical barrier. The perception
of cell wall degradation by the pathogen can activate local plant
responses that trigger repair and fortification mechanisms via
expression of different genes as e.g. the cell wall synthesis precursor,
“UDP-sugar pyrophosphorylase” (Gibeaut, 2000) or the cellulose
synthase “IRREGULAR XYLEM 1 (IRX1)” genes both involved in cell
wall synthesis (Taylor et al., 2000). Both were up-regulated in our
grass pea genotype after A. lathyri inoculation. IRX1 was also up-
regulated in the same genotype BGE015746 in response to the
infection with rust (Almeida et al., 2014), suggesting that the induction
of this cellulose synthase, and consequently cell wall strengthening,
may play an important role in resistances of this grass pea genotype
to diverse pathogens. Improving the cell wall lignin content is another
common plant defence mechanism. In our study, inoculation elicited
the expression of three UniTags representing genes implicated in cell
lignification: “4-coumarate-CoA ligase”, involved in lignin biosynthesis
(Lee et al., 1995), “disease resistance-responsive (dirigent-like)”,
previously identified as improving lignin content at infection sites (Zhu
et al., 2007) and a “phenylalanine ammonia-lyase 1 (PAL1)”,
previously related to SA biosynthesis and also to the synthesis of
lignin precursors (Mauch-Mani and Slusarenko, 1996).
However, there were also cell wall synthesis genes that were
down-regulated. For example, three transcripts involved in cellulose
biosynthesis (“glycosylphosphatidylinositol-anchored protein COBRA-
like (COB)”, “cellulose synthase isomer (CESA3)” and “cellulose-
synthase-like C5 (CSLC5)”) and two pectinesterase transcripts
involved in cellulose biosynthesis and in cell wall modifications (Dai et
al., 2011; Hansen et al., 2011; Liu et al., 2013), were down-regulated
after inoculation. Though this is somehow unexpected in a resistant

Chapter 4 ___________________________________________________________________
136
accession it may be explained by results from Arabidopsis where
CESA3-deficient mutants reduced their cellulose synthesis, but
instead activated lignin synthesis and defence responses through the
jasmonate and the ethylene signaling pathways (Cano-Delgado et al.,
2003; Hamann, 2012). These observations suggest that mechanisms
monitoring cell wall integrity can activate lignification and defence
responses. Therefore, cellulose biosynthesis may not only be
involved in the first line of defence but also in signaling as an indirect
defence mechanism. Histological analysis will allow clarifying this
hypothesis in the future.
Additionally, “beta-xylosidase 1 (BXL1)” and “xyloglucan
endotransglycosylase-related protein (XTR4)”, were found down-
regulated after inoculation. BXL1 is involved in development of
normal (non-infected) cell walls. BXL1 deficient Arabidopsis mutants
showed alterations of cell wall composition and in plant development
(Goujon et al., 2003). XTR4 belongs to the xyloglucan
endotransglycosylase gene family, the so called endoxyloglucan
transferases, that are involved in hemicellulose metabolism.
Interestingly, XTR4 is down-regulated in Arabidopsis by the growth
hormone auxin (Xu et al., 1996). Therefore, in grass pea these genes
may be down-regulated under the mechanisms regulating cell wall
thickening to restrict fungal penetration.
Taken together these results hint to a general reshuffling of
cell wall components that exchanges certain cellulose types, restricts
hemicelluloses and favours lignin as part of the resistance reaction of
a resistant L. sativus genotype. To which extent these mechanisms
contribute to resistance needs to be determined in populations
segregating for resistance.

Grass pea response to ascochyta blight ___________________________________________________________________
137
4.5.4. Antimicrobial activity
Upon infection plants increase the production of antibacterial
defence proteins to limit colonization by the pathogen (Consonni et
al., 2009). After inoculation of grass pea with A. lathyri, “chitinase A
(PR-3)” was up-regulated. Chitinases are involved in the inhibition of
fungal hyphae growth in intercellular spaces as a defence response
to fungal infection in several plant species (reviewed by Grover et al.
(2012)). Additionally, a “GDSL lipase 1”, another antimicrobial
compound that also functions as ET-dependent elicitor (Kwon et al.,
2009), and a “pathogenesis-related protein (PR-1-like)” with
antifungal properties (van Loon and van Strien, 1999) were up
regulated. This PR-1-like transcript is similar to an EST sequence
(DY396405) identified previously in the response of grass pea to M.
pinodes (Skiba et al., 2005), but in that study it showed low to mid-
level expression in leaf and stem tissue, with little difference between
resistant and susceptible genotypes. PR-1-like genes were also up-
regulated in the resistance response of our grass pea accession
BGE015746 to rust infection (Almeida et al., 2014). Chitinases were
also found up-regulated in the resistance response of pea to
ascochyta blight infection (Fondevilla et al., 2014).
The phenylpropanoid secondary metabolite biosynthesis
pathway is notorious for the production of antimicrobial compounds in
plants. In our resistant genotype, inoculation elicited a “chalcone
reductase” transcript coding for an enzyme that co-acts with chalcone
synthase in the first step of flavonoid biosynthesis (Naoumkina et al.,
2010). Interestingly, in a previous study in L. sativus a chalcone
reductase EST was also up-regulated as a defence reaction after
inoculation with M. pinodes (Skiba et al., 2005).

Chapter 4 ___________________________________________________________________
138
4.5.5. Reactive oxygen species
Reactive oxygen species (ROS) in plants are generated
normally as by-products of oxidative phosphorylation and diverse
biosynthetic pathways. Under non-stress conditions these potentially
deleterious molecules are controlled by antioxidants. Under biotic or
abiotic stress however, ROS production increases as part of the anti-
microbial response. Their rapid accumulation of ROS creates an
oxidative burst that may induce cell death and restricts the
establishment of the pathogen in the plant (Apel and Hirt, 2004). In
our study however, the lack of visual symptoms of a hypersensitive
response or necrosis in the inoculated resistant grass pea, suggests
that the over-production of ROS is not important for resistance in this
plant/pathogen interaction. Moreover, our transcriptomic data reflects
this aspect, since the only differentially expressed UniTag related to
ROS regulation was a “peroxidase” which was down-regulated after
inoculation.
4.5.6. Detoxification
During defence response, plants produce toxic compounds for
defence and are themselves attacked by toxins secreted by the
pathogen. To cope with toxins from the pathogen, plants developed
several detoxification mechanisms. In our grass pea accession two
UniTags related to detoxification were up-regulated upon A. lathyri
infection, namely a “phytoene synthase”, a precursor in the
carotenoids biosynthesis pathway and a “glutathione S-transferase
(GST)”. Carotenoids are lipophilic antioxidants being able to detoxify
various forms of ROS, playing an important role in both biotic and
abiotic stress responses (Young, 1991; Ramel et al., 2012). GSTs

Grass pea response to ascochyta blight ___________________________________________________________________
139
form a large family of enzymes that have diverse roles in detoxifying
xenobiotics, antioxidant activity or ROS scavenging (Dalton et al.,
2009). ROS scavengers are needed to maintain ROS activity levels
below the oxidative damage threshold (Moller et al., 2007). GST was
also found up-regulated upon inoculation in an ascochyta blight
resistant pea genotype challenged with M. pinodes (Fondevilla et al.,
2014), corroborating its important role in resistance.
4.6. Conclusions
Our deepSuperSAGE analysis provided deep insights into the
molecular mechanisms underlying resistance to A. lathyri in L. sativus
suggesting candidate genes and pathways potentially involved in
ascochyta blight resistance in a particular, completely resistant
genotype. Resistance reactions involved a wide range of reactions
including changes in hormone signaling, biotic and abiotic stress
reactions, cell wall metabolism and in the secondary metabolism that
can now be further investigated. In particular, this study suggests a
strong up-regulation of the ET pathway and of cell wall fortification
upon inoculation with A. lathyri. In agreement with the macroscopic
phenotypic observations 15 d.a.i., that gave no hint to the presence of
an oxidative burst or hypersensitive response, the changes in
transcripts related to ROS management were rather moderate. Thus,
we conclude that the resistance of our L. sativus genotype
BGE015746 to ascochyta is quantitative rather than qualitative, as it
has been reported in other legume species such as pea (Carrillo et
al., 2013), lentil (Tullu et al., 2006), faba bean (Rubiales et al., 2012)
and chickpea (Hamwieh et al., 2013) and represents a potentially
lasting source of resistance to ascochyta blight (Rubiales et al. 2015).
To exploit this genotype for resistance breeding next steps will

Chapter 4 ___________________________________________________________________
140
the identification of polymorphisms in the identified candidate
resistance genes to facilitate resistance breeding by marker-assisted
selection. On the other hand, we will use histological approaches to
characterize in detail the type of resistance response and correlate it
with the molecular mechanisms identified in this study. A deeper
understanding of resistance mechanism and facilitated resistance
breeding will help to harness grass pea for agronomy in dry areas or
zones that are becoming more drought-prone due to global climate
change in the future.
4.7. Acknowledgements
NFA carried out the inoculations and sample processing for
sequencing and RT-qPCR, designed the RT-qPCR primers, performed
the data analysis and drafted the manuscript. NK and BR performed
the RNA sequencing and bioinformatics data processing. PW and DR
revised the manuscript critically. MCVP coordinated the study and
participated to the drafting and revision of the manuscript. NFA would
like to thank the CRF-INIA, Madrid, Spain, for supplying the genotypes.
4.8. References Acharya, K., Pal, A.K., Gulati, A., Kumar, S., Singh, A.K., and Ahuja,
P.S. (2013). Overexpression of Camellia sinensis thaumatin-like protein, CsTLP in potato confers enhanced resistance to Macrophomina phaseolina and Phytophthora infestans Infection. Molecular Biotechnology 54, 609-622.
Almeida, N.F., Leitão, S.T., Krezdorn, N., Rotter, B., Winter, P., Rubiales, D., and Vaz Patto, M.C. (2014). Allelic diversity in the transcriptomes of contrasting rust-infected genotypes of Lathyrus sativus, a lasting resource for smart breeding. BMC Plant Biology 14, 376.

Grass pea response to ascochyta blight ___________________________________________________________________
141
Altschul, S.F., Gish, W., Miller, W., Myers, E.W., and Lipman, D.J. (1990). Basic local alignment search tool. Journal of Molecular Biology 215, 403-410.
Anand, A., Zhou, T., Trick, H.N., Gill, B.S., Bockus, W.W., and Muthukrishnan, S. (2003). Greenhouse and field testing of transgenic wheat plants stably expressing genes for thaumatin-like protein, chitinase and glucanase against Fusarium graminearum. Journal of Experimental Botany 54, 1101-1111.
Apel, K., and Hirt, H. (2004). Reactive oxygen species: metabolism, oxidative stress, and signal transduction. Annual Review of Plant Biology 55, 373-399.
Audic, S., and Claverie, J.M. (1997). The significance of digital gene expression profiles. Genome Research 7, 986-995.
Bari, R., and Jones, J.G. (2009). Role of plant hormones in plant defence responses. Plant Molecular Biology 69, 473-488.
Bennett, M.D., and Leitch, I.J. (2012). "Angiosperm DNA C-values database". (release 8.0, Dec. 2012) http://data.kew.org/cvalues/).
Bisgrove, S.R., Simonich, M.T., Smith, N.M., Sattler, A., and Innes, R.W. (1994). A disease resistance gene in Arabidopsis with specificity for two different pathogen avirulence genes. The Plant Cell 6, 927-933.
Cano-Delgado, A., Penfield, S., Smith, C., Catley, M., and Bevan, M. (2003). Reduced cellulose synthesis invokes lignification and defence responses in Arabidopsis thaliana. The Plant Journal 34, 351-362.
Carrillo, E., Rubiales, D., Perez-De-Luque, A., and Fondevilla, S. (2013). Characterization of mechanisms of resistance against Didymella pinodes in Pisum spp. European Journal of Plant Pathology 135, 761-769.
Consonni, C., Humphry, M., and Panstruga, R. (2009). "Defence Responses in Plants," in Plant Relationships, ed. H. Deising. (Berlin Heidelberg, Germany: Springer), 363-385.
Dai, X., You, C., Chen, G., Li, X., Zhang, Q., and Wu, C. (2011). OsBC1L4 encodes a COBRA-like protein that affects cellulose synthesis in rice. Plant Molecular Biology 75, 333-345.
Dalton, D.A., Boniface, C., Turner, Z., Lindahl, A., Kim, H.J., Jelinek, L., Govindarajulu, M., Finger, R.E., and Taylor, C.G. (2009). Physiological roles of glutathione S-transferases in soybean root nodules. Plant Physiology 150, 521-530.
Datta, K., Velazhahan, R., Oliva, N., Ona, I., Mew, T., Khush, G.S., Muthukrishnan, S., and Datta, S.K. (1999). Over-expression of the cloned rice thaumatin-like protein (PR-5) gene in transgenic rice plants enhances environmental friendly resistance to

Chapter 4 ___________________________________________________________________
142
Rhizoctonia solani causing sheath blight disease. Theoretical and Applied Genetics 98, 1138-1145.
Eulgem, T. (2005). Regulation of the Arabidopsis defence transcriptome. Trends in Plant Science 10, 71-78.
Fondevilla, S., Kuster, H., Krajinski, F., Cubero, J.I., and Rubiales, D. (2011). Identification of genes differentially expressed in a resistant reaction to Mycosphaerella pinodes in pea using microarray technology. BMC Genomics 12, 28.
Fondevilla, S., Rotter, B., Krezdorn, N., Jüngling, R., Winter, P., and Rubiales, D. (2014). Identification of genes involved in resistance to Didymella pinodes in pea by deepSuperSAGE transcriptome profiling. Plant Molecular Biology Reporter 32, 258-269.
Gibeaut, D.M. (2000). Nucleotide sugars and glycosyltransferases for synthesis of cell wall matrix polysaccharides. Plant Physiology and Biochemistry 38, 69-80.
Glazebrook, J. (2005). Contrasting mechanisms of defence against biotrophic and necrotrophic pathogens. Annual Review of Phytopathology 43, 205-227.
Goujon, T., Minic, Z., El Amrani, A., Lerouxel, O., Aletti, E., Lapierre, C., Joseleau, J.-P., and Jouanin, L. (2003). AtBXL1, a novel higher plant (Arabidopsis thaliana) putative beta-xylosidase gene, is involved in secondary cell wall metabolism and plant development. The Plant Journal 33, 677-690.
Grover, A. (2012). Plant Chitinases: Genetic Diversity and Physiological Roles. Critical Reviews in Plant Sciences 31, 57-73.
Gurung, A.M., Pang, E.C.K., and Taylor, P.W.J. (2002). Examination of Pisum and Lathyrus species as sources of ascochyta blight resistance for field pea (Pisum sativum). Australasian Plant Pathology 31, 41-45.
Hamann, T. (2012). Plant cell wall integrity maintenance as an essential component of biotic stress response mechanisms. Frontiers in Plant Science 3, 77.
Hamwieh, A., Imtiaz, M., Hobson, K., and Ahmed Kemal, S. (2013). Genetic diversity of microsatellite alleles located at quantitative resistance loci for ascochyta blight resistance in a global collection of chickpea germplasm. Phytopathologia Mediterranea 52, 183-191.
Hansen, K.D., Wu, Z., Irizarry, R.A., and Leek, J.T. (2011). Sequencing technology does not eliminate biological variability. Nature Biotechnology 29, 572-573.

Grass pea response to ascochyta blight ___________________________________________________________________
143
Hillocks, R., and Maruthi, M. (2012). Grass pea (Lathyrus sativus): Is there a case for further crop improvement? Euphytica 186, 647-654.
Jayasankar, S., Li, Z.J., and Gray, D.J. (2003). Constitutive expression of Vitis vinifera thaumatin-like protein after in vitro selection and its role in anthracnose resistance. Functional Plant Biology 30, 1105-1115.
Jones, L.K. (1927). Studies of the nature and control of blight, leaf and pod spot, and footrot of peas caused by species of Ascochyta. New York State Agricultural Experiment Station Bulletin 547, 1-45.
Kwon, S.J., Jin, H.C., Lee, S., Nam, M.H., Chung, J.H., Kwon, S.I., Ryu, C.-M., and Park, O.K. (2009). GDSL lipase-like 1 regulates systemic resistance associated with ethylene signaling in Arabidopsis. The Plant Journal 58, 235-245.
Lee, D., Ellard, M., Wanner, L., Davis, K., and Douglas, C. (1995). The Arabidopsis thaliana 4-coumarate:CoA ligase (4CL) gene: stress and developmentally regulated expression and nucleotide sequence of its cDNA. Plant Molecular Biology 28, 871-884.
Liu, L., Shang-Guan, K., Zhang, B., Liu, X., Yan, M., Zhang, L., Shi, Y., Zhang, M., Qian, Q., Li, J., and Zhou, Y. (2013). Brittle Culm1, a COBRA-like protein, functions in cellulose assembly through binding cellulose microfibrils. PLoS Genetics 9, e1003704.
Lohse, M., Nagel, A., Herter, T., May, P., Schroda, M., Zrenner, R., Tohge, T., Fernie, A.R., Stitt, M., and Usadel, B. (2014). Mercator: a fast and simple web server for genome scale functional annotation of plant sequence data. Plant Cell and Environment 37, 1250-1258.
Mackey, D., Holt, B.F., 3rd, Wiig, A., and Dangl, J.L. (2002). RIN4 interacts with Pseudomonas syringae type III effector molecules and is required for RPM1-mediated resistance in Arabidopsis. Cell 108, 743-754.
Madrid, E., Palomino, C., Plotner, A., Horres, R., Rotter, B., Winter, P., Krezdorn, N., and Torres, A.M. (2013). DeepSuperSage analysis of the Vicia faba transcriptome in response to Ascochyta fabae infection. Phytopathologia Mediterranea 52, 166-182.
Matsumura, H., Molina, C., Krüger, D.H., Terauchi, R., and Kahl, G. (2012). "DeepSuperSAGE: High-Throughput Transcriptome Sequencing with Now- and Next-Generation Sequencing Technologies," in Tag-Based Next Generation Sequencing. Wiley-VCH Verlag GmbH & Co. KGaA), 1-21.

Chapter 4 ___________________________________________________________________
144
Matsumura, H., Reich, S., Ito, A., Saitoh, H., Kamoun, S., Winter, P., Kahl, G., Reuter, M., Kruger, D.H., and Terauchi, R. (2003). Gene expression analysis of plant host-pathogen interactions by SuperSAGE. Proceedings of the National Academy of Sciences of the United States of America 100, 15718-15723.
Mauch-Mani, B., and Slusarenko, A.J. (1996). Production of salicylic acid precursors is a major function of phenylalanine ammonia-lyase in the resistance of Arabidopsis to Peronospora parasitica. The Plant Cell 8, 203-212.
Moller, I.M., Jensen, P.E., and Hansson, A. (2007). Oxidative modifications to cellular components in plants. Annual Review of Plant Biology 58, 459-481.
Naoumkina, M.A., Zhao, Q., Gallego-Giraldo, L., Dai, X., Zhao, P.X., and Dixon, R.A. (2010). Genome-wide analysis of phenylpropanoid defence pathways. Molecular Plant Pathology 11, 829-846.
Nicaise, V., Roux, M., and Zipfel, C. (2009). Recent advances in PAMP-triggered immunity against bacteria: pattern recognition receptors watch over and raise the alarm. Plant Physiology 150, 1638-1647.
Prasad, M.E., and Stone, S.L. (2010). Further analysis of XBAT32, an Arabidopsis RING E3 ligase, involved in ethylene biosynthesis. Plant Signaling & Behavior 5, 1425-1429.
Ramel, F., Birtic, S., Ginies, C., Soubigou-Taconnat, L., Triantaphylidès, C., and Havaux, M. (2012). Carotenoid oxidation products are stress signals that mediate gene responses to singlet oxygen in plants. Proceedings of the National Academy of Sciences 109, 5535-5540.
Rubiales, D., Avila, C.M., Sillero, J.C., Hybl, M., Narits, L., Sass, O., and Flores, F. (2012). Identification and multi-environment validation of resistance to Ascochyta fabae in faba bean (Vicia faba). Field Crops Research 126, 165-170.
Rubiales, D., and Fondevilla, S. (2012). Future prospects for ascochyta blight resistance breeding in cool season food legumes. Frontiers in Plant Science 3.
Rubiales, D., Fondevilla, S., Chen, W., Gentzbittel, L., Higgins, T.J.V., Castillejo, M.A., Singh, K.B., and Rispail, N. (2015). Achievements and challenges in legume breeding for pest and disease resistance. Critical Reviews in Plant Sciences 34, 195-236.
Saha, S., Sparks, A.B., Rago, C., Akmaev, V., Wang, C.J., Vogelstein, B., Kinzler, K.W., and Velculescu, V.E. (2002). Using the transcriptome to annotate the genome. Nature Biotechnology 20, 508-512.

Grass pea response to ascochyta blight ___________________________________________________________________
145
Selitrennikoff, C.P. (2001). Antifungal proteins. Applied and Environmental Microbiology 67, 2883-2894.
Skiba, B., Ford, R., and Pang, E.C.K. (2004a). Construction of a linkage map based on a Lathyrus sativus backcross population and preliminary investigation of QTLs associated with resistance to ascochyta blight. Theoretical and Applied Genetics 109, 1726-1735.
Skiba, B., Ford, R., and Pang, E.C.K. (2004b). Genetics of resistance to Mycosphaerella pinodes in Lathyrus sativus. Australian Journal of Agricultural Research 55, 953–960.
Skiba, B., Ford, R., and Pang, E.C.K. (2005). Construction of a cDNA library of Lathyrus sativus inoculated with Mycosphaerella pinodes and the expression of potential defence-related expressed sequence tags (ESTs). Physiological and Molecular Plant Pathology 66, 55-67.
Taylor, N.G., Laurie, S., and Turner, S.R. (2000). Multiple cellulose synthase catalytic subunits are required for cellulose synthesis in Arabidopsis. The Plant Cell 12, 2529-2539.
Thimm, O., Blasing, O., Gibon, Y., Nagel, A., Meyer, S., Kruger, P., Selbig, J., Muller, L.A., Rhee, S.Y., and Stitt, M. (2004). MAPMAN: a user-driven tool to display genomics data sets onto diagrams of metabolic pathways and other biological processes. The Plant Journal 37, 914-939.
Tivoli, B., and Banniza, S. (2007). Comparison of the epidemiology of ascochyta blights on grain legumes. European Journal of Plant Pathology 119, 59-76.
Tivoli, B., Baranger, A., Avila, C.M., Banniza, S., Barbetti, M., Chen, W.D., Davidson, J., Lindeck, K., Kharrat, M., Rubiales, D., Sadiki, M., Sillero, J.C., Sweetingham, M., and Muehlbauer, F.J. (2006). Screening techniques and sources of resistance to foliar diseases caused by major necrotrophic fungi in grain legumes. Euphytica 147, 223-253.
Torii, K.U. (2004). Leucine-rich repeat receptor kinases in plants: structure, function, and signal transduction pathways. International Review of Cytology 234, 1-46.
Tullu, A., Tar'an, B., Breitkreutz, C., Banniza, S., Warkentin, T.D., Vandenberg, A., and Buchwaldt, L. (2006). A quantitative-trait locus for resistance to ascochyta blight [Ascochyta lentis] maps close to a gene for resistance to anthracnose [Colletotrichum truncatum] in lentil. Canadian Journal of Plant Pathology 28, 588-595.
Untergasser, A., Cutcutache, I., Koressaar, T., Ye, J., Faircloth, B.C., Remm, M., and Rozen, S.G. (2012). Primer3-new capabilities and interfaces. Nucleic Acids Research 40, e115.

Chapter 4 ___________________________________________________________________
146
Van Loon, L.C., and Van Strien, E.A. (1999). The families of pathogenesis-related proteins, their activities, and comparative analysis of PR-1 type proteins. Physiological and Molecular Plant Pathology 55, 85-97.
Vandesompele, J., De Preter, K., Pattyn, F., Poppe, B., Van Roy, N., De Paepe, A., and Speleman, F. (2002). Accurate normalization of real-time quantitative RT-PCR data by geometric averaging of multiple internal control genes. Genome Biology 3, research0034-research0034.0011.
Vaz Patto, M.C., and Rubiales, D. (2014). Lathyrus diversity: available resources with relevance to crop improvement – L. sativus and L. cicera as case studies. Annals of Botany 113, 895-908.
Velculescu, V.E., Zhang, L., Vogelstein, B., and Kinzler, K.W. (1995). Serial analysis of gene-expression. Science 270, 484-487.
Xu, W., Campbell, P., Vargheese, A.K., and Braam, J. (1996). The Arabidopsis XET-related gene family: environmental and hormonal regulation of expression. The Plant Journal 9, 879-889.
Young, A.J. (1991). The photoprotective role of carotenoids in higher plants. Physiologia Plantarum 83, 702-708.
Zawada, A.M., Rogacev, K.S., Rotter, B., Winter, P., Marell, R.R., Fliser, D., and Heine, G.H. (2011). SuperSAGE evidence for CD14++CD16+ monocytes as a third monocyte subset. Blood 118, e50-61.
Zhu, L., Zhang, X., Tu, L., Zeng, F., Nie, Y., and Guo, X. (2007). Isolation and characterization of two novel dirigent-like genes highly induced in cotton (Gossypium barbadense and G. hirsutum) after infection by Verticillium dahliae. Journal of Plant Pathology 89, 41-45.
Chickling pea response to rust ___________________________________________________________________
147
Chapter 5
Differential expression and allelic diversity in Lathyrus cicera / rust infection, a
comprehensive analysis
The work presented in this chapter was mostly performed by Nuno
Felipe Almeida (see Acknowledgements section), and corresponds to
the following manuscript in preparation:
Almeida, N.F., Horres, R., Krezdorn, N., Leitão, S.T., Aznar-Fernandez, T., Rotter, B., Winter, P., Rubiales, D., and Vaz Patto, M.C. Differential expression and allelic diversity in Lathyrus cicera / rust infection, a comprehensive analysis.


Chickling pea response to rust ___________________________________________________________________
149
5.1. Abstract
Lathyrus cicera transcriptome, in response to rust infection, was
analysed to unveil resistance mechanisms and develop novel
molecular breeding tools, until now inexistent, for this robust legume
species. RNA-Seq libraries were generated from control and rust-
inoculated (Uromyces pisi) leaves from two L. cicera genotypes with
contrasting resistance levels. A de novo assembly was performed in
order to allow quantification and interpretation of transcripts differential
expression and sequence polymorphisms. We analysed the profile of
111,024 transcripts upon inoculation with U. pisi. Functional annotation
grouped 62.6% of the contigs present in plant databases (41.9% of
total) in 33 main functional categories, being ‘protein’, ‘RNA’,
‘signalling’, ‘transport’ and ‘stress’ the most represented. Most
differentially expressed transcripts upon inoculation in partially
resistant and susceptible genotypes were involved in signalling, cell
wall metabolism and synthesis of secondary metabolites. Several
polymorphic EST-SSR and SNP markers between the two L. cicera
genotypes were developed. Also allele-specific expression was
detected and validated through specific dual labelled probes RT-qPCR
assays. This study represents the first efforts for genomic precision
breeding in L. cicera, providing a large new set of molecular markers
and potential candidate resistance genes to rust infection.
5.2. Introduction
Lathyrus cicera L., known as chickling pea, is an annual legume
belonging to the tribe Fabeae (Kenicer et al., 2005; Schaefer et al.,
2012), and mainly grown as stock feed, both as fodder and grain
(Hanbury et al., 1999). L. cicera can adapt well to harsh environments,

Chapter 5 ___________________________________________________________________
150
being resistant to drought, water lodging and to several important
legume biotic constrains. Among these we find resistance sources to
rust (Vaz Patto et al., 2009), powdery mildew (Vaz Patto et al., 2007),
bacterial blight (Martín-Sanz et al., 2012) and crenate broomrape
(Fernández-Aparicio et al., 2009). In this way L. cicera is a good
alternative for cropping systems in marginal lands and can function
also as a source of resistance genes to related species such as pea
(Vaz Patto et al., 2006).
Limited genetic resources exist for this plant species,
hampering its potential fully exploitation in legume breeding. In the
NCBI database, accessed on January 2015, we could only find 4
internal transcribed spacers (ITS), 1 antifungal protein DNA sequence,
1 convicilin gene sequence, 26 sequences from chloroplast regions
and 4 protein amino-acid sequences. Although also in a reduced
number, molecular tools from related species have proven to be useful
in this legume species. 91 intron-targeted amplified polymorphic
(ITAP), 14 expressed sequence tag Simple Sequence Repeats (EST-
SSR), 10 genomic microsatellite (gSSR), 6 resistance genes analogs
(RGA) and 7 disease resistance (DR) markers previously developed
for other legume species (Medicago truncatula Gaertn., Pisum sativum
L., Lens culinaris Medik., Lupinus spp. and Vicia faba L.) were
successfully cross-amplified in L. cicera (Almeida et al., 2014a).
Rusts are among the most important legume diseases, being
the Uromyces genus the most significant. Uromyces pisi (Pers.) Wint.
is suggested to be the principal agent causing pea rust (Barilli et al.,
2009), being also capable of causing infection in Lathyrus species (Vaz
Patto et al., 2009; Vaz Patto and Rubiales, 2009) and in Vicia and Lens
(Barilli et al., 2012; Rubiales et al., 2013).

Chickling pea response to rust ___________________________________________________________________
151
Lathyrus sativus is the genetically nearest cultivated species of
L. cicera, with evidences suggesting that it even derivatives from L.
cicera (Hopf, 1986). Consequently, these two species might share
many physiological/genetic mechanisms in response to stress.
Previous studies demonstrated that both species show a
compatible reaction to U. pisi. Also, similar defence mechanisms were
present despite the different recorded resistance levels, being L.
sativus generally more resistant than L. cicera accessions (Vaz Patto
et al., 2009; Vaz Patto and Rubiales, 2009). Recently, a work unveiling
L. sativus transcriptome in response to inoculation with U. pisi was
published (Almeida et al., 2014b). The development of new tools will
facilitate a comparative analysis between those two species resistance
mechanisms.
Allele-specific gene expression, the differential expression of
alleles, has been described in yeasts (Brem et al., 2002), mammals
(Cowles et al., 2002; Yan et al., 2002) and plants (Guo et al., 2004;
Zhang and Borevitz, 2009). Differential expression in allele variants
may contribute to different phenotypes, such as resistance responses.
Therefore the development of molecular tools that allow the detection
and quantification of allele-specific expression will improve the
understanding of the mechanisms regulating plant resistance to
pathogens. In addition, allele-specific assays would be also be useful
for mapping of related expression quantitative trait loci (eQTLs).
Understanding the genetic control of disease resistance in
plants is important to develop efficient molecular breeding tools. These
tools will be fundamental in the development of modern resistant
cultivars but also in the introgression of their interesting resistance
traits into related species.

Chapter 5 ___________________________________________________________________
152
The aims of this study were: 1) To detect potential genes
involved in L. cicera resistance to rust infection. For this, L. cicera
differentially expressed genes upon inoculation were functionally
characterized and their expression profiles compared; 2) To develop
novel molecular markers to be employed in future L. cicera mapping
and diversity studies, especially EST-SSR and SNP (Single Nucleotide
Polymorphism); 3) To examine the differential expression of allelic
variants after inoculation, based on the SNP information within
candidate genes, and develop appropriate assays for future eQTLs
analysis associated with rust resistance in L. cicera.
5.3. Material and methods
5.3.1. Plant material, inoculation and DNA and RNA isolation
The two L. cicera genotypes, BGE008277 and BGE023542,
used in the present work were kindly provided by the Plant Genetic
Resources Centre (CRF-INIA), Madrid, Spain. Seeds were multiplied
in insect proof cages. Previous evaluation of resistance levels against
U. pisi inoculation had demonstrated that BGE008277 is susceptible to
rust, whereas BGE023542 displays partial resistance (Vaz Patto et al.,
2009). Upon infection, both genotypes present well-formed pustules,
with no associated chlorosis or necrosis. However, clear differences
exist in the percentage of leaf area covered by the fungus (disease
severity; DS). While the partially resistant BGE023542 has a DS=36%,
the susceptible BGE008277 has a DS=80%.
The U. pisi monosporic isolate UpCo-01, from the fungal
collection of the Institute for Sustainable Agriculture-CSIC (Córdoba,
Spain), was used for inoculation. Inoculum was multiplied on plants of
the susceptible P. sativum cv. Messire before use.

Chickling pea response to rust ___________________________________________________________________
153
Two-week-old L. cicera seedlings were inoculated by dusting
all the plants at the same time with 2 mg of spores per plant, diluted in
pure talk (1:10), with the help of a small manual dusting device, in a
complete random experiment. Twenty-four plants per each L. cicera
genotype and treatment, inoculated and control (non-inoculated), were
then incubated for 24 h at 20 ºC, in complete darkness, and 100%
relative humidity, then transferred to a growth chamber and kept at 20
± 2 ºC under 14h light (150 μmol m−2 s−1) and 10h dark.
RNA, to be used in the RNA-Seq experiment, RT-qPCR
validation and SNP validation, was extracted from inoculated and non-
inoculated fresh leaves, from each of the 24 individual
plants/genotype/treatment, collected 37 hours after inoculation,
immediately frozen in liquid nitrogen and stored at -80 °C. RNA was
isolated using the GeneJET Plant RNA Purification Mini Kit (Thermo
Scientific, Vilnius, Lithuania), according to the manufacturer’s
instructions. Isolated RNA was treated with Turbo DNase I (Ambion,
Austin, TX, USA), and RNA quantification was carried out using the
NanoDrop device (Thermo Scientific, Passau, Germany).
For the EST-SSR validation, DNA from frozen young leaves,
from the two L. cicera genotypes, was extracted using a modified CTAB
protocol developed by Torres et al. (1993).
5.3.2. RNA sequencing and transcript quantification
For each of the 4 combinations, genotype and treatment
(BGE008277 control, BGE008277 inoculated, BGE023542 control and
BGE023542 inoculated) total RNA from 24 plants was pooled in equal
amounts for sequencing. Five RNA-Seq libraries (one for each
genotype, each one with the two treatments, and one reference

Chapter 5 ___________________________________________________________________
154
assembly, including all genotypes and treatments) were generated by
GenXPro GmbH, Germany, using a proprietary protocol. In short, for
each library, mRNA was captured from 20 µg of total RNA using Oligo
dT(25) beads (Dynabeads; life Technologies). The purified mRNA was
randomly fragmented in a Zn2+ solution to obtain approximately 250 bp
long RNA fragments. cDNA was synthesized by reverse transcription
starting from 6(N) random hexamer oligonucleotides, followed by
second strand synthesis. Barcoded Y-adapters were ligated to the
cDNA and the library was amplified with 10 cycles of PCR. The libraries
were sequenced on an Illumina Hiseq2000 machine. After Illumina
paired-end sequencing, raw sequence reads were passed through
quality filtering, thereby also removing sequencing adapter primers and
cDNA synthesis primers. All high-quality reads were assembled using
the Trinity RNA-Seq de novo assembly (Version: trinityrnaseq_r2011-
11-26). In order to minimize the redundancy CAP3 software (Huang
and Madan, 1999) was also used with overlap length cutoff of 30 bp
and overlap percent identity cutoff of 75%. Redundancy was tested
using the clustering algorithm UCLUST ((Edgar, 2010), available at
http://drive5.com/usearch/manual/uclust_algo.html). The resulting
contigs were annotated via BLASTX to publically available plant
databases (ftp://ftp.ncbi.nlm.nih.gov/blast/db/FASTA/nr.gz, nr, plants
only). To identify potential fungal transcripts, an additional BLASTX to
public fungal databases (http://www.ebi.ac.uk/uniprot,
UniProtKB/Swiss-Prot and UniProtKB/TrEMBL) was performed. The
sequenced reads were mapped with novoalign software (V2.07.14;
http://www.novocraft.com/) to the own assembled contigs. RPKM
(reads per kilobase per million) was calculated as the normalized
transcript expression value (Marioni et al., 2008). The obtained counts
were subsequently passed through DEGSeq to calculate the

Chickling pea response to rust ___________________________________________________________________
155
differential gene expression (R package version 1.16.0) (Wang et al.,
2010).
5.3.3. Contig annotation and data analysis
In order to classify the obtained contigs into functional
categories, the Mercator pipeline for automated sequence annotation
(Lohse et al., 2014), available at http://mapman.gabipd.org/
web/guest/app/mercator), was used. The mapping file was created
with information from the following manually curated databases:
Arabidopsis TAIR proteins (release 10), SwissProt/UniProt Plant
Proteins (PPAP), TIGR5 rice proteins (ORYZA), Clusters of
orthologous eukaryotic genes database (KOG), Conserved domain
database (CDD) and InterPro scan (IPR). The Mercator mapping file
was then employed for pathway analysis by the MapMan software
(Thimm et al., 2004), available at http://mapman.gabipd.org/web/
guest/mapman).
Differentially expressed contigs were identified by comparing
their expression in leaves of the partially resistant genotype
BGE023542, control vs. inoculated, and of the susceptible genotype
BGE008277, control vs. inoculated, using DEGseq (Wang et al., 2010).
In cases where a particular transcript had the same profile in both
genotypes, the total transcript count, before and after inoculation, was
compared, allowing the identification of basal genotypic differences
between the two genotypes.

Chapter 5 ___________________________________________________________________
156
5.3.4. RNA-Seq validation by quantitative RT-PCR assay
To validate the RNA-Seq results, expression levels of a set of
10 selected genes were analysed by RT-qPCR. Genes were selected
by their level of expression and transcript count, in order to represent
a broad range of expression profiles. Further, the number of their
transcripts differed between inoculated and control samples by log2
ratios ranging from -2.19 to 3.31. Their read count numbers were
generally higher than 100, with three exceptions. Contig a20510;122,
‘Histone H2A.2’, with 28 counts in BGE008277 inoculated and 88
counts in BGE023542 inoculated sample, and contig a6507;507 ‘β-
tubulin’, and contig a77720;50 ‘γ-tubulin’, with 76 an 73 counts in the
susceptible inoculated line, respectively (Additional file 5.1).
1 μg of total RNA from each of three randomly chosen plants
per genotype, per treatment (inoculated/control), was reverse
transcribed in duplicates, using the High Capacity cDNA Reverse
Transcription Kit (Applied Biosystems, Foster City, CA, USA) following
manufacturer’s instructions. Three independent reverse-transcription
reactions (RT) were performed for each cDNA sample in a total of nine
samples per genotype, per treatment.
For all genes studied, the product of each of these reactions
was analysed in technical replicates, in a total of six technical replicates
per treatment. RT-qPCR reactions were performed with an iQ™5 Real-
Time PCR Detection System (Bio-Rad, Munich, Germany). Primers
were designed using the Primer3 software (Untergasser et al., 2012).
Primer sequences can be found in Additional file 5.1. For data
analysis, the Genex software package (MultiD, Goteborg, Sweden),
using the NormFinder software (Andersen et al., 2004) was
employed.

Chickling pea response to rust ___________________________________________________________________
157
5.3.5. SNP detection
SNPs were discovered between the two L. cicera genotypes
using the software JointSNVMix (Roth et al., 2012). The mappings from
the transcriptome analysis were also analysed by Joint-SNV-Mix and
the output was furthermore processed by GenXPro’s in-house software
to detect SNPs discriminating the variant alleles. SNP calling was
performed taking into account only the inoculated samples. A minimum
coverage of 15 reads in each genotype in the inoculated condition was
needed to call a SNP.
5.3.6. Allele-specific expression analysis by dual labelled probe RT-qPCR assays
In order to analyse the differential expression profile between
allelic variants, SNPs in genes of interest discriminating the genotypes
BGE023542 and BGE008277 after inoculation were selected for the
design of allele-specific RT-qPCR assays (see Additional file 5.2). The
SNP-containing transcripts analysed included 11 transcripts that had
the similar expression level between the genotypes (five of them are
housekeeping genes), one transcript with higher expression level on
the partially resistant genotype and four transcripts with higher
expression level on the susceptible genotype. Altogether 2x 17 allele-
specific dual labelled probe RT-qPCR assays with SNP specific
mismatch primer were tested.
The primer design of the dual labelled probe RT-qPCR assays
with introduced additional mismatch forward or reverse primer was
made with short amplicon size of <90 bp in order to avoid background
by flanking additional SNPs. See the documentation of the primer
design in the Additional file 5.3. We made a one-step RT-qPCR with
Chapter 5 ___________________________________________________________________
158
40-60 ng total RNA template per reaction from BGE023542 and
BGE008277 and the corresponding SNP alleles in separate tubes, so
reactions for each allele with the same 5’6-Fam-3’TQ2 dual labelled
probe and the different mismatch primer. All reactions were made in
12µl reaction volume with the One Step Prime Script™ RT-PCR Kit
(Perfect Real Time) from TAKARA Bio Inc., Japan. The RT-qPCR
regime consisted of a reverse transcription step of 5 min at 42ºC and a
initial denaturation step of 10 s at 95ºC, followed by 40 cycles of 5 s at
95ºC (denaturation) and 30 s at 62ºC (annealing/elongation).
5.3.7. EST-SSR development and genotyping
EST-SSRs were searched in silico from the obtained
transcriptomes employing Phobos (Mayer, 2010) plug-in for Geneious
software (Drummond et al., 2011), and using as search parameters,
perfect SSRs with a repeat unit length of two to six nucleotides. Length
polymorphisms were manually identified by aligning SSR-containing
contigs of one genotype against the whole library of the other genotype.
EST-SSR development and genotyping procedures were conducted as
described in Almeida et. al. (2014b).
5.4. Results
5.4.1. RNA-Seq transcriptomes of analysed L. cicera genotypes
RNA-Seq libraries from control and inoculated leafs from each
L. cicera genotype were united, prior to assembly, to generate a
comprehensive data set enabling the generation of contigs of
maximum length. The susceptible genotype BGE008277 united library
included 18,395,860 reads, which were assembled into 66,210 contigs,
ranging in size from 150 to 8,664 bp, with a mean contig length of 537

Chickling pea response to rust ___________________________________________________________________
159
bp. The united library from the partially resistant genotype BGE023542
comprised 30,320,831 reads which assembled in 64,382 contigs, with
a size range of 150 to 9,694 bp and a mean contig length of 571 bp.
The reference assembly using both genotypes and treatments
gather 145,985 contigs, ranging in size from 150 to 13,916 bp, with a
mean contig length of 485 bp. The mapping and quantification of both
genotypes’ libraries to the reference assembly allowed the analysis of
their differential expression in response to U. pisi infection. 20,362
contigs were unique to the partially resistant and 12,114 contigs were
unique to the susceptible genotype.
5.4.2. Differential gene expression in partially resistant and susceptible L. cicera genotypes to rust infection
Differentially expressed L. cicera contigs after rust inoculation
were grouped by expression patterns based on up- or down-regulation
(log2 ≥ 2 or log2 ≤ -2; respectively, q-value ≤ 0.05). Within each
expression pattern group, comparisons were performed between
genotypes. Expression patterns were grouped in eight response types,
according to their up- or down-regulation, in susceptible and partially
resistant genotypes, respectively, similarly to a previous work, where
the transcriptomic response of two L. sativus genotypes with
contrasting level of resistance were compared upon inoculation with U.
pisi (Almeida et al., 2014b).
The number of differentially expressed contigs and description
of each group is summarized in Table 5.1. Most representative groups
are group F (contigs down regulated in both genotypes) and H (contigs
down-regulated only in the partially resistant genotype) with 4,520 and
3,498 contigs respectively, followed by a group that includes 2,161

Chapter 5 ___________________________________________________________________
160
contigs up-regulated upon infection in both partially resistant and
susceptible genotypes (group A). A detailed list with all the identified
contigs, their description and expression pattern groups can be found
in Additional File 5.4.
Table 5.1 - Classification of contigs according to their differential expression in the susceptible and resistant genotype upon infection with U. pisi. Up regulated: (log2 >= 2; q-value ≤ 0.05); Down-regulated: (log2 ≤ -2; q-value ≤ 0.05); higher in Susceptible: (log2 fold change between all resistant and susceptible genotype contigs <= -2; q-value ≤ 0.05); higher in Resistant: (log2 fold change between all resistant and susceptible genotype contigs >= 2; q-value ≤ 0.05)
Expression pattern group Feature # of contigs
A Up-regulated in Resistant Up-regulated in Susceptible 2,161
B Up-regulated in Resistant Up-regulated in Susceptible, higher in Susceptible 12
C Up-regulated in Resistant, higher in Resistant Up-regulated in Susceptible 20
D Up-regulated in Susceptible 1,715
E Up-regulated in Resistant 338
F Down-regulated in Resistant Down-regulated in Susceptible 4,520
G Down-regulated in Susceptible 1,399
H Down-regulated in Resistant 3,498
Total 13,663
As depicted in Figure 5.1, from the 111,287 contigs that could
be identified and quantified, 43,590 were shared among all libraries.

Chickling pea response to rust ___________________________________________________________________
161
Figure 5.1 - Venn diagram of the number of unique and shared contigs between the two genotypes and its expression. Partially resistant genotype: BGE023542, Susceptible genotype: BGE008277.
5.4.3. RNA-Seq validation by quantitative RT-PCR assay
To validate the RNA-Seq results, expression levels of a set of
10 selected genes were analysed by RT-qPCR. Genes were selected
by their level of expression and transcript count, in order to represent
a broad range of expression profiles. Furthermore, the number of their
transcripts differed between inoculated and control samples by log2
ratios, ranging from -2.19 to 3.31. Their read count numbers were
generally higher than 100, with three exceptions: Contig a20510;122,
‘Histone H2A.2’, with 28 counts in BGE008277 inoculated and 88
counts in BGE023542 inoculated sample, and contig a6507;507 ‘β-
tubulin’, and contig a77720;50 ‘γ-tubulin’, with 76 an 73 counts in the
susceptible inoculated line, respectively. The best reference gene
assay for normalization, suggested by the NormFinder software, for

Chapter 5 ___________________________________________________________________
162
both genotype samples, was a transcript coding for a ‘γ-tubulin’
(a77720;50). Results for the analysed transcripts can be found in
Additional file 5.1.
5.4.4. Annotation of L. cicera contigs
From the 111,287 contigs detected in all libraries, 46,588
(41.9%) contigs were matched, via BLAST, to entries in plant
databases and 622 (0.6%) contigs matched only to fungal databases,
being present only in the inoculated libraries. In addition to the already
described contigs, 688 (0.6%) other contigs absent in control samples
had a higher bit-score in fungal databases than in plant databases and
thus, most probably correspond also to U. pisi sequences.
Figure 5.2 - Number of contigs that could be BLASTed to different plant species

Chickling pea response to rust ___________________________________________________________________
163
As indicated in Figure 5.2, BLAST produced hits mainly to other
legume species. Medicago truncatula (23,754; 50.99%), Cicer
arietinum (11,177; 23.99%), Glycine max (3,559; 7.64%), P. sativum
(1,224; 2.63%), Phaseolus vulgaris (800; 1.72%) and Lotus japonicus
(300; 0.64%) were the best matching legume species. Vitis vinifera
(1,128; 2.42%), Hordeum vulgare (307; 0.66%), Zea mays (216;
0.46%) and the model Arabidopsis thaliana (214; 0.46%) were the best
matching non-legume species.
From the 49 accessions described in UniProtKB/Swiss-Prot
and UniProtKB/TrEMBL as U. viciae-fabae, 12 were identified in our
data, four of them absent in control samples and found exclusively in
fungal databases, and eight had a higher bit-score in fungal databases
than in plant databases (see list in Additional file 5.5. None of these 12
contigs were significantly differentially expressed between the two
inoculated genotypes. For example, among the four contigs out of the
12 without a plant database hit, three were homologous to ‘invertase
1’, and the other to ‘rust transferred protein – Rtp1’.
Functional annotation of the all identified differentially
expressed contigs via Mercator and MapMan, depicted in Figure 5.3,
grouped them into 34 main functional categories, of which the
categories ‘protein’ (11.5%), ‘RNA’ (8.7%), ‘signalling’ (6.4%),
‘transport’ (5.2%), ‘miscellaneous’ (4.7%), and ‘stress’ (3.9%) were the
most enriched. A total of 37.4% differentially expressed (DE) contigs
could not be assigned to any functional category.
When analysing in more detail the stress related functional
category, we observed that transcripts involved in the several layers of
defence against pathogens were assigned to different expression
pattern groups (Thimm et al., 2004). In order to restrict the number of
analysed contigs to the ones probably more directly related to disease

Chapter 5 ___________________________________________________________________
164
Figure 5.3 - Percentage of contigs assigned in each main functional category.
resistance, the analysis was focused on contigs up-regulated in the
partially resistant genotype, upon inoculation with U. pisi (group E). The
complete set of transcripts and its expression profiles can be found in
Additional file 5.4.

Chickling pea response to rust ___________________________________________________________________
165
In group E, several transcripts were identified as related with
signaling and regulation of transcription of defence responses. Ten
receptor kinases, one calcium receptor and a ‘WRKY family
transcription factor’ were found up-regulated in the partially resistant
genotype.
Plant hormones play a key role in numerous processes,
including modulating the response to biotic stresses (Bari and Jones,
2009). In this particular expression pattern group E, only one transcript
that may play a role in biotic stresses was identified, in the ‘hormone
metabolism’ category, a ‘SAUR-like auxin-responsive protein family’
(a165751;26).
Plant cell wall is not just a static physical barrier. Related with
cell wall degradation, a ‘glycosyl hydrolase superfamily protein’
(a77705;78), a ‘rhamnogalacturonate lyase family protein’
(a160424;29), a ‘polygalacturonase precursor (EC 3.2.1.15)’
(a385339;11) and a ‘pectinesterase-2 precursor (EC 3.1.1.11)’
(a13317;203) were identified in group E.
Upon infection, plants increase the production of defence
proteins with antibacterial properties to limit the pathogen colonization
(Consonni et al., 2009). In the subcategory ‘secondary metabolism’
four transcripts were identified: two transcripts encoding a 3-ketoacyl-
CoA synthase family protein (KCS6) involved in the biosynthesis of
very long chain fatty acids, in addition to a ‘hydroxycinnamoyl-CoA
shikimate/quinate hydroxycinnamoyl transferase’ involved in the
phenylpropanoid pathway; and a ‘DOWNY MILDEW RESISTANT 6
(DMR6)’ transcript, which was found to encode a 2-oxoglutarate
(2OG)-Fe(II) oxygenase of unknown function, but that has been
involved in defence responses to biotic stress (Van Damme et al.,
2005; 2008).

Chapter 5 ___________________________________________________________________
166
Although no hypersensitive response was detected, a
‘peroxidase superfamily protein’, that generate hydrogen peroxide
involved in oxidative stress (Passardi et al., 2005) was identified in
group E. Furthermore, a ‘glucan endo-1,3-beta-glucosidase precursor
(EC 3.2.1.39)’ was identified DE in group E.
5.4.5. SNP identification in resistance pathways
In the 43,590 transcripts present in both the susceptible and the
partially resistant genotypes (Figure 5.1), 19,224 Single Nucleotide
Polymorphisms (SNPs) in 5,152 transcripts were detected between the
two genotypes in the inoculated samples. Among those, 811 contigs
containing SNPs discriminating between their respective alleles were
functionally annotated and identified. The number of SNPs in functional
(MapMan) categories varied considerably. The categories ‘RNA
regulation of transcription’ (6.15%) and ‘protein.degradation’ (4.97%)
contained by far the most SNPs, followed by the protein-related
categories ‘protein.postranslational modification’ (2.72%),
‘protein.synthesis’ (1.89%) and ‘protein.targeting’ (1.78%). Other
categories among the most SNP-containing contigs were
‘signalling.receptor kinases’ (1.42%) and ‘hormone metabolism.auxin’
(1.30%) (Figure 5.4).Polymorphic contigs and their respective SNPs
are listed in Additional file 5.6.
5.4.6. Allele-specific expression validation by dual probe assays
Seventeen allele-specific expression assays were analysed for
SNP validation in the genotypes BGE023542 and BGE008277. These
resulted for 5 sites in the confirmation of allele-specific expression for
both alleles. Additionally the analysis of allele-specific expression was

Chickling pea response to rust ___________________________________________________________________
167
nine times positive for one of the two allele specific assays tested.
Results can be found in Table 5.2.
Figure 5.4 - Percentage of contigs containing SNPs between the resistant and susceptible genotypes in each Mercator mapping functional sub-category. FA: fatty acid; met.: metabolism; misc.: miscellaneous; PS: photosynthesis

Chapter 5 ___________________________________________________________________
168
5.4.7. EST-SRR markers development
EST-SSRs were identified through the Phobos software
(Mayer, 2010), using as search parameters, perfect SSRs with a repeat
unit length of two to six nucleotides. Polymorphisms between the
partially resistant and susceptible genotypes were manually identified
and flanked by primer pair using the Primer3 software (Untergasser et
al., 2012). From the 341 EST-SSR developed and tested through PCR
amplification on the two studied L. cicera genotypes, 251 produced an
amplicon, being 206 (60.4%) polymorphic between accessions
BGE008277 and BGE023542 and 45 (13.2%) monomorphic. 31 (9.1%)
primers pairs produced a complex pattern and the remaining 59
(17.3%) primer pairs failed to produce any fragment. The developed
EST-SSR marker primers and genotyping results are listed in
Additional File 5.7.
5.5. Discussion
The present study provided the first genomic profile of L. cicera
pathogen interaction. Although there are previous studies on this
species focused on the response against stresses such as rust (Vaz
Patto et al., 2009), powdery mildew (Vaz Patto et al., 2007), broomrape
(Fernández-Aparicio et al., 2009; Fernández-Aparicio and Rubiales,
2010) and bacterial blight (Martín-Sanz et al., 2012), none of those
were performed at molecular level. A valuable set of novel molecular
tools and expression information on genes potentially involved in the
partial resistance of L. cicera against rust is now available from the
present study, which will be useful in future precision breeding
approaches.

Tabl
e 5.
2 - A
llele
-spe
cific
exp
ress
ion
anal
ysis
resu
lts. S
umm
ary
of th
e R
T-qP
CR
resu
lts in
com
paris
on to
the
alle
le d
istri
butio
n in
RN
A-Se
q re
sults
. ∞ -
only
ex
pres
sed
in B
GE0
2354
2 or
BG
E008
277.
Refe
renc
e as
sem
bly
cont
ig
SNP
posi
-tio
n BL
AST
hit
BLAS
Tn
e-va
lue
refe
r-en
ce
base
va
riant
ba
se
BGE0
0827
7 in
ocul
ated
BG
E023
542
inoc
ulat
ed
ΔCт
Mea
n (B
GE0
2354
2 -
BGE0
0827
7)
refe
renc
e ba
se
ΔCт
Mea
n (B
GE0
2354
2 -
BGE0
0827
7)
varia
nt b
ase
RNA-
Seq
coun
ts
refe
renc
e ba
se
RNA-
Seq
coun
ts
varia
nt
base
SNP
assa
y re
fere
nce
base
(Ct
mea
n)
SNP
assa
y va
riant
ba
se (C
t m
ean)
RNA-
Seq
coun
ts
refe
renc
e ba
se
RNA-
Seq
coun
ts
varia
nt
base
SNP
assa
y re
fere
nce
base
(Ct
mea
n)
SNP
assa
y va
riant
ba
se
(Ct
mea
n)
a225
44;1
81
127
Glu
can
endo
-1,3
-bet
a-gl
ucos
idas
e [M
edic
ago
trunc
atul
a]
3,00
E-16
8 A
G
10
0 36
,96
- 0
162
- 31
,91
∞∞
a1
6587;2
04
389
poly
gala
ctur
onas
e in
hibi
ting
prot
ein
[Pis
um s
ativ
um]
0 C
T
24
0 -
- 3
186
29,9
1 34
,97
∞∞
a121
35;1
96
396
Cel
l div
isio
n pr
otea
se ft
sH-li
ke p
rote
in
[Med
icag
o tru
ncat
ula]
0
A T
23
0 33
,92
31,7
7 1
149
33,9
2 -
2,15
-
a288
70;9
7 85
6 un
know
n [M
edic
ago
trunc
atul
a]
0 G
A
1 13
35
,92
- 11
0 0
- -
0,40
-
a187
1;38
3 34
2 Pe
roxi
dase
[Med
icag
o tru
ncat
ula]
6,
00E-
150
T C
1
19
- -
264
0 -
- -
-
a187
1;38
3 59
3 Pe
roxi
dase
[Med
icag
o tru
ncat
ula]
6,
00E-
150
C
G
35
2 30
,42
29,5
0 0
318
30,4
2 29
,50
-3,4
4 -1
,55
a428
21;8
5 11
02
Cal
mod
ulin
-bin
ding
hea
t sho
ck p
rote
in
[Med
icag
o tru
ncat
ula]
6,
00E-
150
G
A 8
0 30
,01
35,1
9 3
38
30,7
2 30
,96
0,71
-4
,23
a601;5
48
419
gluc
an e
ndo-
1,3-
beta
-d-g
luco
sida
se
[Cic
er a
rietin
um]
0 C
G
25
16
4 32
,17
24,1
7 18
12
10
19,2
2 24
,69
-12,
95
0,52
a232
48;1
09
415
ATP-
depe
nden
t RN
A he
licas
e [M
edic
ago
trunc
atul
a]
3,00
E-97
A
G
0 21
-
30,9
3 73
0
35,9
5 -
- -
a286
0;34
4 12
36
NAD
P-de
pend
ent D
-sor
bito
l-6-p
hosp
hate
de
hydr
ogen
ase
[Med
icag
o tru
ncat
ula]
0
G
A 76
3
- -
0 16
3 -
- -
-
a100
29;2
59
1404
pr
obab
le u
biqu
itin-
conj
ugat
ing
enzy
me
E2
24-li
ke [G
lyci
ne m
ax]
0 G
A
33
0 23
,94
25,7
1 0
101
23,3
5 24
,99
-0,5
9 -0
,71
a192
61;1
30
1328
hy
poth
etic
al p
rote
in M
TR_5
g063
940
[Med
icag
o tru
ncat
ula]
0
A G
14
1
- -
0 48
35
,92
- -
-
a334
67;1
17
1535
ac
tin-re
late
d pr
otei
n 2-
like
[Gly
cine
max
] 0
T C
25
0
28,1
7 35
,92
0 70
36
,91
29,4
9 8,
74
-6,4
3
a498
0;38
1 52
9 pr
otei
n no
tum
hom
olog
[Gly
cine
max
] 3,
00E-
58
A G
2
194
33,6
6 24
,99
187
2 25
,96
31,8
8 -7
,70
6,89
a169
7;46
0 38
8 H
yper
sens
itive
reac
tion
asso
ciat
ed C
a2+-
bind
ing
prot
ein
[Med
icag
o tru
ncat
ula]
1,
00E-
86
C
T 11
6 0
- -
0 13
7 -
26,8
9 -
∞a7
16;3
25
744
ethy
lene
-ove
rpro
duct
ion
prot
ein
1-lik
e [G
lyci
ne m
ax]
0 C
T
317
3 28
,46
35,8
9 1
292
35,8
9 29
,28
7,42
-6
,60
a160
62;8
7 26
4 in
dole
-3-a
cetic
aci
d-am
ido
synt
heta
se
GH
3.6-
like
[Gly
cine
max
] 0
C
A 40
6
- 36
,74
0 26
-
36,9
3 -
0,19
Chickling pea response to rust ___________________________________________________________________
169

Chapter 5 ___________________________________________________________________
170
The first set of specific EST-SSRs and SNP-based markers for
this plant species was developed within this study. The performed
EST-SSR markers validation confirmed 206 new EST-SSRs
polymorphic between two L. cicera genotypes, which may support the
future construction of a linkage map in this species, crucial to the
development of more effective precision breeding approaches. With
the SNP information, SNP base markers can be developed, such as
the dual labelled probe RT-qPCR assays here presented, that can be
used for eQTL studies. With the SNP data it is also possible the
development of SNP arrays for diversity and mapping studies.
Incongruence between the expected and experimental results
in the EST-SSR validation may be due to the fact that RNA-Seq data
provides information only from the exons. Therefore, primer pairs that
failed to amplify or amplified a complex pattern of fragments might be
caused by the presence of large introns in the flanking region not
detectable in the available RNA-Seq data. Also, not validated EST-
SSRs may be due to the existence of homologous regions in others
genetic regions, or the primers being located across splice regions.
The lack of an amplicon could also be due to primers derived from
chimeric cDNA clones (Varshney et al., 2005).
Allele-specific expression of candidate resistance genes points
out to more complex levels in regulation of gene expression that can
be further explored (Zhang and Borevitz, 2009). In our allele-specific
expression RT-qPCR assays, a low number of assays corroborated the
RNA-Seq data. One reason for the failure of many allele-specific
assays is the selection of sites with partly quite low expression levels.
In combination with limitations derived from assay design this is one
explanation why several assays did not confirm the RNA-Seq data. An
additional explanation for the failure of the majority of the assays is the

Chickling pea response to rust ___________________________________________________________________
171
limited resolution of common qPCR systems like the StepOne applied
in this study. These results were more evident since we mainly
analysed alleles with low expression. We expect more positive results
for the developed allele-specific assays in future applications, like
eQTL mapping, using a Droplet Digital PCR system (ddPCR platform),
that has a much higher resolution – e.g. five logs of dynamic range with
the BIORAD Q100 system - what will increase especially the
detection of rare alleles like ‘a16062;87’ with a maximum of 40
normalized reads only in RNA-Seq data (Table 5.2).
The lack of genomic resources is common in orphan crops, and
L. cicera was not an exception. From all the contigs assembled in this
study, only 42% were successfully BLASTed in plant databases. Since
we sequenced samples inoculated with rust, we could also identify
transcripts that probably have a fungal origin. Those were 1.2% of the
total transcripts. As already discussed by Hacquard et al. (2011), the
low number of fungal transcripts may reflect the low number of fungal
structures in early-infected leaves.
This study was pioneer in providing a molecular overview of
defence responses in L. cicera against U. pisi. U. pisi penetrates
through the stoma, thus, pathogen perception is the first key element
in defence response. Pathogen-associated molecular pattern triggered
immunity (PTI) rely on an efficient signalling network in order to restrain
infection (Nicaise et al., 2009). The receptor-like kinase 53 (RLP53),
identified exclusively up-regulated in the partially resistant genotype, is
a mitogen activated protein kinase (MAPK) associated with biotic
stress signalling, that along with the WRKY transcription factor, also
up-regulated exclusively in the partially resistant genotype, could be
important in the defence response. WRKY transcription factors are well

Chapter 5 ___________________________________________________________________
172
known elements that can influence pathogen perception (Eulgem,
2005).
Also related with signaling, several MLO-like transcripts were
identified differentially expressed. The MLO gene was first identified in
barley, where mutations in this gene were found to confer resistance
to powdery mildew (Jørgensen, 1992) and up to now several MLO
genes were identified as being responsible for susceptibility (Chen et
al., 2006; Kim and Hwang, 2012; Zheng et al., 2013; McGrann et al.,
2014). In L. cicera, a MLO-like transcript (AtMLO6, PsMLO1,
a289255;11) was also detected up-regulated in the susceptible
genotype and down regulated in the partially resistant genotype. This
MLO-like gene was already identified as a susceptibility gene,
mediating the vulnerability to several fungal pathogens in Arabidopsis
(Chen et al., 2006) and to powdery mildew in Pisum sativum (Humphry
et al., 2011). Recently, this gene was found up-regulated in a partially
resistant L. sativus genotype, while in the resistant genotype the
transcript for this gene was not detected (Almeida et al., 2014b). These
findings ensure the importance of AtMLO6/PsMLO1 homologs as
susceptibility genes in several Lathyrus spp. what should be further
explored in the future.
After entering the mesophyll through the stoma, the rust fungal
hyphae try to penetrate the mesophyll cells where haustoria are formed
(Vaz Patto and Rubiales, 2009). The perception of cell wall
modifications, through components released through cell wall
degradation by the pathogen, can activate plant local responses
triggering repair and fortification mechanisms by the expression of
different genes (Cantu et al., 2008). Four transcripts described as
being involved in cell wall degradation were identified exclusively up-
regulated in the partially resistant genotype. The product of these

Chickling pea response to rust ___________________________________________________________________
173
genes may act directly in the pathogen cell wall, having an antimicrobial
activity, or act in the own plant cell wall producing damage-associated
molecular patterns (DAMPs) to activate defence responses (Boller and
Felix, 2009).
Also three cellulose synthase ‘IRREGULAR XYLEM 1 (IRX1)’,
involved in cell wall synthesis (Taylor et al., 2000), were identified as
being down-regulated in both genotypes upon inoculation with rust
(groups F, G and H). IRX1 was previously found up-regulated in a L.
sativus resistant genotype also in response to rust infection (Almeida
et al., 2014b). This evidence indicate that the induction of this cellulose
synthase, and consequent cell wall strengthening, may play an
important role in the diverse resistance mechanisms presented by this
L. sativus genotype and absent in L. cicera genotypes.
Another gene involved in cell wall synthesis, identified as down-
regulated (one transcript down-regulated in both genotypes and
another transcript down-regulated only in the susceptible genotype)
was the ‘cellulose synthase 3 (CESA3)’. CESA3-deficient Arabidopsis
mutants showed to have reduced levels of cellulose synthesis, which
activated lignin synthesis and defence responses through the
jasmonate and the ethylene signaling pathways (Caño-Delgado et al.,
2003).
Related with secondary metabolism, two transcripts encoding
the ‘3-ketoacyl-CoA synthase 6 (KCS6)’, involved in the biosynthesis
of very long chain fatty acid (VLCFA) were identified exclusively up-
regulated in the partially resistant genotype. The VLCFAs are fatty
acids synthesized in the endoplasmic reticulum, which are crucial for a
wide range of biological processes in plants, including defence. These
lipids are known to be required for the biosynthesis of the plant cuticle
Chapter 5 ___________________________________________________________________
174
(Samuels et al., 2008), and the generation of sphingolipids (Worrall et
al., 2003), that can play a direct role in defence (Berkey et al., 2012).
Also exclusively up-regulated in the partially resistant genotype
(group E) a ‘DOWNY MILDEW RESISTANT 6 (DMR6) was identified.
DMR6 was found to encode a 2-oxoglutarate (2OG)-Fe(II) oxygenase
of unknown function. Despite its name, the expression of this gene is
required for susceptibility to Hyaloperonospora parasitica and
Colletotrichum higginsianum in Arabidopsis (Van Damme et al., 2008).
Peroxidases localised in the cell wall generate hydrogen
peroxide, contributing as a source of reactive oxygen species
(Passardi et al., 2005; Daudi et al., 2012), that leads to oxidative stress,
a serious imbalance between production of ROS and antioxidant
defences. In plants, the balance between ROS production and
antioxidant defence determines the extent of oxidative damage (Moller
et al., 2007). Since no hypersensitive response was detected in the L.
cicera response to U. pisi infection, we may assume that the only
peroxidase identified exclusively up-regulated in the partially resistant
genotype is insufficient to produce a visible hypersensitive response.
The resistance to rust depicted by several L. cicera and L.
sativus genotypes is due to a restriction of haustoria formation with high
percentage of early abortion of colonies, with an associated reduction
of number of haustoria per colony and reduction of intercellular growth
of infection hyphae (Vaz Patto et al., 2009; Vaz Patto and Rubiales,
2009; Vaz Patto and Rubiales, 2014). Although the resistance
mechanisms against rust infection are the same, those L. sativus and
L. cicera genotypes present on average different resistance levels,
being the most resistant L. cicera genotype (DS = 36%) (Vaz Patto et
al., 2009) slightly more susceptible than the most susceptible L. sativus
genotype (DS = 30%) (Vaz Patto and Rubiales, 2009).

Chickling pea response to rust ___________________________________________________________________
175
By comparing common transcripts between the presently
obtained L. cicera results and the L. sativus transcriptomic profile
response to the same rust (U. pisi) inoculation (Almeida et al., 2014b),
13 transcripts with contrasting expression patterns where identified.
Two transcripts were exclusively up-regulated in both L. cicera
genotypes and down regulated in both L. sativus genotypes, and 11
transcripts down-regulated in L. cicera and up-regulated in L. sativus.
In this way an ‘acyl-CoA N-acetyltransferase (NAT) family protein’
(a330638;13) and a ‘Myristoyl-acyl carrier protein thiosterase (EC
3.1.2.-)’ (a39652;86) were found within the exclusively up-regulated
genes in L. cicera.
Transcripts exclusively up-regulated in L. cicera (in general
more susceptible) and exclusively down-regulated in L. sativus (in
general more resistant) were involved in the jasmonic acid pathway,
aromatic amino acid synthesis, flavonoid biosynthesis, stress abiotic,
transport and signalling. Interestingly in signalling, the transcript
identified corresponds to the ‘AtMLO8 (a228904;23)’, a gene described
to be induced by wounding in Arabidopsis, but non-responsive to
inoculation with the biotrophic fungi Erysiphe cichoracearum and
Erysiphe orontii, the hemibiotrophic fungus Phytophtora infestans or
the necrotrophic fungus Botrytis cinerea (Chen et al., 2006). It would
be interesting to further study this gene in order to access its role in L.
cicera higher susceptibility to rust.
When focusing on the most contrasting studied Lathyrus
genotypes, L. sativus resistant genotype (DS=9%) and L. cicera
susceptible genotype (DS=80%), nine transcripts were detected
exclusively up-regulated in the resistant L. sativus genotype and
exclusively down-regulated in the susceptible L. cicera genotype. Two
of these transcripts related with signalling, three with transport and one

Chapter 5 ___________________________________________________________________
176
with the phenylpropanoid/isoflavonoid pathways. In detail, in signalling,
two receptor kinases were identified, a ‘mitogen-activated protein
kinase kinase kinase 5 (MAPKKK5)’ (a271743;21) and a ‘receptor
serine/threonine kinase with thaumatin domains’ (a130472;54). These
genes might be involved on the pathogen perception and subsequent
signalling cascades. Interestingly thaumatin is a pathogenesis related
(PR) protein involved in increasing the permeability of fungal
membranes by pore-forming mechanisms and therefore restraining
fungal growth or even killing it (Selitrennikoff, 2001). In the functional
category transport, a ‘cyclic nucleotide gated channel 1 (CNGC)’
(a61456;73) and two ‘aminophospholipid ATPase 1 (ALA1)’
(a162161;22 and a209230;31) were identified. CNGCs were found to
be involved in the defence responses of Arabidopsis to inoculation with
P. syringae and H. parasitica, as reviewed by Kaplan et al (2007), while
ALA1 has been associated with cold tolerance, potentially involved in
generating membrane lipid asymmetry (Gomes et al., 2000). Finally the
‘Isoflavone-7-O-methyltransferase 9 (IOMT9) (EC 2.1.1.150)’
(a27045;83), was identified up-regulated in the resistant L. sativus
genotype while being down-regulated in the L. cicera susceptible
genotype. It is reported that the overexpression of IOMTs in Medicago
sativa, induce the phenylpropanoid/isoflavonoid pathway, conferring
resistance to Phoma medicaginis (He and Dixon, 2000).
In order to access transcripts contributing to the overall
resistance in Lathyrus spp. we compared transcripts from the most
resistant genotypes, L. sativus resistant genotype (BGE015746;
DS=9%), L. sativus partially resistant genotype (BGE024709;
DS=30%) and L. cicera partially resistant genotype (BGE023542;
DS=36%) against the susceptible L. cicera genotype (BGE008277;
DS=80%). For that, common transcripts were filtered using the
Chickling pea response to rust ___________________________________________________________________
177
following conditions: exclusively up-regulated in L. sativus genotypes,
exclusively up-regulated in the partially resistant L. cicera genotype
and exclusively down-regulated in the susceptible L. cicera genotype.
A total of twenty five transcripts met these criteria. From those, six
transcripts are known to be associated with plant defence responses,
namely two transcripts encoding for ‘PENETRATION 3 (PEN3)’
(a14741;145 and a49947;119), a gene required for non-host
penetration resistance to Blumeria graminis and Phytophtora infestans
in Arabidopsis, being this gene also required for mlo-mediated
resistance (reviewed by Hückelhoven, 2007). Another transcript
identified was the ‘ethylene response factor 5 (ERF5)’ (a259652;14),
an inducer of the SA biosynthesis pathway that also inhibits the JA and
ET biosynthesis pathways (Son et al., 2011), an expected pattern in
response to biotrophs (Bari and Jones, 2009). Also identified with this
pattern was a transcript encoding for a ‘glucan endo-1,3-beta
glucosidase (EC 3.2.1.39)’ (a44607;146). Beta-glycosidases are
involved in diverse and important functions in plants, including
bioactivation of defence compounds, cell wall degradation in
endosperm during germination, activation of phytohormones, and
lignifications (Morant et al., 2008). Moreover an ‘acidic endochitinase
precursor (EC 3.2.1.14)’ (a21834;176) was also identified in the same
pattern. Chitinases are involved in the inhibition of fungal hyphae
growth in intercellular spaces as a defence response to fungal infection
in several plant species (Grover, 2012). Finally, also identified with this
pattern a ‘disease resistance family protein/leucine-rich repeat family
protein’ (a26409;113), potentially involved in disease resistance which
function remains unknown and representing an interesting candidate
for further studies.

Chapter 5 ___________________________________________________________________
178
5.6. Conclusions
Our results provided an overview of gene expression profiles of
contrasting L. cicera genotypes inoculated with rust, suggesting a
different regulation of genes involved in signalling, cell wall metabolism
and in the synthesis of secondary metabolites as the genetic basis of
partial resistance to rust. The differentially expressed genes identified
may be significant for the establishment or prevention of infection.
Those are suitable candidate genes for future functional studies in
order to shed light on the molecular mechanisms of plant-pathogen
interactions.
The L. cicera gene expression results along with the previous
information obtained from the L. sativus transcriptome inoculated with
the same pathogen (Almeida et al., 2014b), offered a valuable set of
sequence data for candidate rust resistant gene discovery in this
genus. The design of specific EST-SSRs and detection and validation
of SNPs for the first time on L. cicera will support future genetic studies
on this species. These new molecular tools are suitable for studies
involving marker-trait association, QTL and eQTL mapping and genetic
diversity analysis.
5.7. Acknowledgments
NFA carried out the inoculations and sample processing for
sequencing and RT-qPCR, designed the primers, performed and
analysed the RT-qPCR experiments, selected the SNPs for the allele-
specific expression, developed the EST-SSRs primers and performed
the all the data analysis and drafted the manuscript. RH designed and
tested the dual labelled probes. STL and TAF performed the EST-SSR
genotyping. NK and BR performed the RNA sequencing and

Chickling pea response to rust ___________________________________________________________________
179
bioinformatics data processing. PW and DR revised the manuscript
critically. MCVP coordinated the study and participated to the drafting
and revision of the manuscript. NFA would like to thank the CRF-INIA,
Madrid, Spain, for supplying the genotypes.
5.8. References
Almeida, N.F., Leitão, S.T., Caminero, C., Torres, A.M., Rubiales, D., and Vaz Patto, M.C. (2014a). Transferability of molecular markers from major legumes to Lathyrus spp. for their application in mapping and diversity studies. Molecular Biology Reports 41, 269-283.
Almeida, N.F., Leitão, S.T., Krezdorn, N., Rotter, B., Winter, P., Rubiales, D., and Vaz Patto, M.C. (2014b). Allelic diversity in the transcriptomes of contrasting rust-infected genotypes of Lathyrus sativus, a lasting resource for smart breeding. BMC Plant Biology 14, 376.
Andersen, C.L., Jensen, J.L., and Orntoft, T.F. (2004). Normalization of real-time quantitative reverse transcription-PCR data: a model-based variance estimation approach to identify genes suited for normalization, applied to bladder and colon cancer data sets. Cancer Res 64, 5245-5250.
Bari, R., and Jones, J.G. (2009). Role of plant hormones in plant defence responses. Plant Molecular Biology 69, 473-488.
Barilli, E., Moral, A., Sillero, J.C., and Rubiales, D. (2012). Clarification on rust species potentially infecting pea (Pisum sativum L.) crop and host range of Uromyces pisi (Pers.) Wint. Crop Protection 37, 65-70.
Barilli, E., Sillero, J.C., Serrano, A., and Rubiales, D. (2009). Differential response of pea (Pisum sativum) to rusts incited by Uromyces viciae-fabae and U. pisi. Crop Protection 28, 980-986.
Berkey, R., Bendigeri, D., and Xiao, S. (2012). Sphingolipids and plant defense/disease: The “death” connection and beyond. Frontiers in Plant Science 3, 68.
Boller, T., and Felix, G. (2009). A Renaissance of elicitors: Perception of microbe-associated molecular patterns and danger signals by pattern-recognition receptors. Annual Review of Plant Biology 60, 379-406.
Brem, R.B., Yvert, G., Clinton, R., and Kruglyak, L. (2002). Genetic dissection of transcriptional regulation in budding yeast. Science 296, 752-755.

Chapter 5 ___________________________________________________________________
180
Caño-Delgado, A., Penfield, S., Smith, C., Catley, M., and Bevan, M. (2003). Reduced cellulose synthesis invokes lignification and defense responses in Arabidopsis thaliana. The Plant Journal 34, 351-362.
Cantu, D., Vicente, A.R., Labavitch, J.M., Bennett, A.B., and Powell, A.L. (2008). Strangers in the matrix: plant cell walls and pathogen susceptibility. Trends in Plant Science 13, 610-617.
Chen, Z., Hartmann, H.A., Wu, M.-J., Friedman, E., Chen, J.-G., Pulley, M., Schulze-Lefert, P., Panstruga, R., and Jones, A. (2006). Expression analysis of the AtMLO gene family encoding plant-specific seven-transmembrane domain proteins. Plant Molecular Biology 60, 583-597.
Consonni, C., Humphry, M., and Panstruga, R. (2009). "Defence Responses in Plants," in Plant Relationships, ed. H. Deising. (Berlin Heidelberg, Germany: Springer), 363-385.
Cowles, C.R., Hirschhorn, J.N., Altshuler, D., and Lander, E.S. (2002). Detection of regulatory variation in mouse genes. Nature Genetics 32, 432-437.
Daudi, A., Cheng, Z., O’brien, J.A., Mammarella, N., Khan, S., Ausubel, F.M., and Bolwell, G.P. (2012). The apoplastic oxidative burst peroxidase in Arabidopsis is a major component of pattern-triggered immunity. The Plant Cell 24, 275-287.
Drummond, A.J., Ashton, B., Buxton, S., Cheung, M., Cooper, A., Duran, C., Field, M., Heled, J., Kearse, M., Markowitz, S.,Moir, R., Stones-Havas, S., Sturrock, S., Thierer, T., andWilson, A. (2011). "Geneious v5.4", (Available fromhttp://www.geneious.com/).
Edgar, R.C. (2010). Search and clustering orders of magnitude faster than BLAST. Bioinformatics 26, 2460-2461.
Eulgem, T. (2005). Regulation of the Arabidopsis defense transcriptome. Trends in Plant Science 10, 71-78.
Fernández-Aparicio, M., Flores, F., and Rubiales, D. (2009). Field response of Lathyrus cicera germplasm to crenate broomrape (Orobanche crenata). Field Crops Research 113, 321-327.
Fernández-Aparicio, M., and Rubiales, D. (2010). Characterisation of resistance to crenate broomrape (Orobanche crenata Forsk.) in Lathyrus cicera L. Euphytica 173, 77-84.
Gomes, E., Jakobsen, M.K., Axelsen, K.B., Geisler, M., and Palmgren, M.G. (2000). Chilling tolerance in Arabidopsis involves ALA1, a member of a new family of putative aminophospholipid translocases. The Plant Cell 12, 2441-2454.
Grover, A. (2012). Plant Chitinases: Genetic Diversity and Physiological Roles. Critical Reviews in Plant Sciences 31, 57-73.

Chickling pea response to rust ___________________________________________________________________
181
Guo, M., Rupe, M.A., Zinselmeier, C., Habben, J., Bowen, B.A., and Smith, O.S. (2004). Allelic variation of gene expression in maize hybrids. Plant Cell 16, 1707-1716.
Hacquard, S., Veneault-Fourrey, C., Delaruelle, C., Frey, P., Martin, F., and Duplessis, S. (2011). Validation of Melampsora larici-populina reference genes for in planta RT-quantitative PCR expression profiling during time-course infection of poplar leaves. Physiological and Molecular Plant Pathology 75, 106-112.
Hanbury, C.D., Siddique, K.H.M., Galwey, N.W., and Cocks, P.S. (1999). Genotype-environment interaction for seed yield and ODAP concentration of Lathyrus sativus L. and L. cicera L. in Mediterranean-type environments. Euphytica 110, 45-60.
He, X.Z., and Dixon, R.A. (2000). Genetic manipulation of isoflavone 7-O-methyltransferase enhances biosynthesis of 4'-O-methylated isoflavonoid phytoalexins and disease resistance in alfalfa. The Plant Cell 12, 1689-1702.
Hopf, M. (1986). "Archaeological evidence of the spread and use of some members of the Leguminosae family," in The Origin and domestication of cultivated plants: symposium, ed. C. Barigozzi. (Oxford, U.K.: Elsevier), 35-60.
Huang, X., and Madan, A. (1999). CAP3: A DNA sequence assembly program. Genome Research 9, 868-877.
Hückelhoven, R. (2007). Cell wall–associated mechanisms of disease resistance and susceptibility. Annual Review of Phytopathology 45, 101-127.
Humphry, M., Reinstadler, A., Ivanov, S., Bisseling, T., and Panstruga, R. (2011). Durable broad-spectrum powdery mildew resistance in pea er1 plants is conferred by natural loss-of-function mutations in PsMLO1. Molecular Plant Pathology 12, 866-878.
Jørgensen, I.H. (1992). Discovery, characterization and exploitation of Mlo powdery mildew resistance in barley. Euphytica 63, 141-152.
Kaplan, B., Sherman, T., and Fromm, H. (2007). Cyclic nucleotide-gated channels in plants. FEBS Letters 581, 2237-2246.
Kenicer, G.J., Kajita, T., Pennington, R.T., and Murata, J. (2005). Systematics and biogeography of Lathyrus (Leguminosae) based on internal transcribed spacer and cpDNA sequence data. American Journal of Botany 92, 1199-1209.
Kim, D.S., and Hwang, B.K. (2012). The pepper MLO gene, CaMLO2, is involved in the susceptibility cell-death response and bacterial and oomycete proliferation. The Plant Journal 72, 843-855.

Chapter 5 ___________________________________________________________________
182
Lohse, M., Nagel, A., Herter, T., May, P., Schroda, M., Zrenner, R., Tohge, T., Fernie, A.R., Stitt, M., and Usadel, B. (2014). Mercator: a fast and simple web server for genome scale functional annotation of plant sequence data. Plant Cell and Environment 37, 1250-1258.
Marioni, J.C., Mason, C.E., Mane, S.M., Stephens, M., and Gilad, Y. (2008). RNA-seq: an assessment of technical reproducibility and comparison with gene expression arrays. Genome Research 18, 1509-1517.
Martín-Sanz, A., Palomo, J., Pérez De La Vega, M., and Caminero, C. (2012). Characterization of Pseudomonas syringae pv. syringae isolates associated with bacterial blight in Lathyrus spp. and sources of resistance. European Journal of Plant Pathology 134, 205-216.
Mayer, C. (2010). "Phobos 3.3.11,[http://www.rub.de/spezzoo/cm/cm_phobos.htm]".).
Mcgrann, G.R., Stavrinides, A., Russell, J., Corbitt, M.M., Booth, A., Chartrain, L., Thomas, W.T., and Brown, J.K. (2014). A trade off between mlo resistance to powdery mildew and increased susceptibility of barley to a newly important disease, Ramularia leaf spot. Journal of Experimental Botany 65, 1025-1037.
Moller, I.M., Jensen, P.E., and Hansson, A. (2007). Oxidative modifications to cellular components in plants. Annual Review of Plant Biology 58, 459-481.
Morant, A.V., Bjarnholt, N., Kragh, M.E., Kjærgaard, C.H., Jørgensen, K., Paquette, S.M., Piotrowski, M., Imberty, A., Olsen, C.E., Møller, B.L., and Bak, S. (2008). The β-glucosidases responsible for bioactivation of hydroxynitrile glucosides in Lotus japonicus. Plant Physiology 147, 1072-1091.
Nicaise, V., Roux, M., and Zipfel, C. (2009). Recent advances in PAMP-triggered immunity against bacteria: pattern recognition receptors watch over and raise the alarm. Plant Physiology 150, 1638-1647.
Passardi, F., Cosio, C., Penel, C., and Dunand, C. (2005). Peroxidases have more functions than a Swiss army knife. Plant Cell Reports 24, 255-265.
Roth, A., Ding, J., Morin, R., Crisan, A., Ha, G., Giuliany, R., Bashashati, A., Hirst, M., Turashvili, G., Oloumi, A., Marra, M.A., Aparicio, S., and Shah, S.P. (2012). JointSNVMix: a probabilistic model for accurate detection of somatic mutations in normal/tumour paired next-generation sequencing data. Bioinformatics 28, 907-913.

Chickling pea response to rust ___________________________________________________________________
183
Rubiales, D., Sillero, J.C., and Emeran, A.A. (2013). Response of vetches (Vicia spp.) to specialized forms of Uromyces vicia-fabae and to Uromyces pisi. Crop Protection 46, 38-43.
Samuels, L., Kunst, L., and Jetter, R. (2008). Sealing plant surfaces: cuticular wax formation by epidermal cells. Annual Review of Plant Biology 59, 683-707.
Schaefer, H., Hechenleitner, P., Santos-Guerra, A., Sequeira, M.M.D., Pennington, R.T., Kenicer, G., and Carine, M.A. (2012). Systematics, biogeography, and character evolution of the legume tribe Fabeae with special focus on the middle-Atlantic island lineages. BMC Evolutionary Biology 12, 250.
Selitrennikoff, C.P. (2001). Antifungal proteins. Applied and Environmental Microbiology 67, 2883-2894.
Son, G.H., Wan, J., Kim, H.J., Nguyen, X.C., Chung, W.S., Hong, J.C., and Stacey, G. (2011). Ethylene-Responsive Element-Binding Factor 5, ERF5, is involved in chitin-induced innate immunity response. Molecular Plant-Microbe Interactions 25, 48-60.
Taylor, N.G., Laurie, S., and Turner, S.R. (2000). Multiple cellulose synthase catalytic subunits are required for cellulose synthesis in Arabidopsis. The Plant Cell 12, 2529-2539.
Thimm, O., Blasing, O., Gibon, Y., Nagel, A., Meyer, S., Kruger, P., Selbig, J., Muller, L.A., Rhee, S.Y., and Stitt, M. (2004). MAPMAN: a user-driven tool to display genomics data sets onto diagrams of metabolic pathways and other biological processes. The Plant Journal 37, 914-939.
Torres, A.M., Weeden, N.F., and Martin, A. (1993). Linkage among isozyme, RFLP and RAPD markers in Vicia faba. Theoretical and Applied Genetics 85, 937-945.
Untergasser, A., Cutcutache, I., Koressaar, T., Ye, J., Faircloth, B.C., Remm, M., and Rozen, S.G. (2012). Primer3-new capabilities and interfaces. Nucleic Acids Research 40, e115.
Van Damme, M., Andel, A., Huibers, R.P., Panstruga, R., Weisbeek, P.J., and Van Den Ackerveken, G. (2005). Identification of Arabidopsis loci required for susceptibility to the downy mildew pathogen Hyaloperonospora parasitica. Molecular Plant-Microbe Interactions 18, 583-592.
Van Damme, M., Huibers, R.P., Elberse, J., and Van Den Ackerveken, G. (2008). Arabidopsis DMR6 encodes a putative 2OG-Fe(II) oxygenase that is defense-associated but required for susceptibility to downy mildew. The Plant Journal 54, 785-793.
Varshney, R.K., Graner, A., and Sorrells, M.E. (2005). Genic microsatellite markers in plants: features and applications. Trends in Biotechnology 23, 48-55.

Chapter 5 ___________________________________________________________________
184
Vaz Patto, M.C., Fernández-Aparicio, M., Moral, A., and Rubiales, D. (2007). Resistance reaction to powdery mildew (Erysiphe pisi) in a germplasm collection of Lathyrus cicera from Iberian origin. Genetic Resources and Crop Evolution 54, 1517-1521.
Vaz Patto, M.C., Fernández-Aparicio, M., Moral, A., and Rubiales, D. (2009). Pre and posthaustorial resistance to rusts in Lathyrus cicera L. Euphytica 165, 27-34.
Vaz Patto, M.C., and Rubiales, D. (2009). Identification and characterization of partial resistance to rust in a germplasm collection of Lathyrus sativus L. Plant Breeding 128, 495-500.
Vaz Patto, M.C., and Rubiales, D. (2014). Resistance to rust and powdery mildew in Lathyrus crops. Czech Journal of Genetics and Plant Breeding 50, 116-122.
Vaz Patto, M.C., Skiba, B., Pang, E.C.K., Ochatt, S.J., Lambein, F., and Rubiales, D. (2006). Lathyrus improvement for resistance against biotic and abiotic stresses: From classical breeding to marker assisted selection. Euphytica 147, 133-147.
Wang, L., Feng, Z., Wang, X., and Zhang, X. (2010). DEGseq: an R package for identifying differentially expressed genes from RNA-seq data. Bioinformatics 26, 136-138.
Worrall, D., Ng, C.K., and Hetherington, A.M. (2003). Sphingolipids, new players in plant signaling. Trends in Plant Science 8, 317-320.
Yan, H., Yuan, W., Velculescu, V.E., Vogelstein, B., and Kinzler, K.W. (2002). Allelic variation in human gene expression. Science 297, 1143.
Zhang, X., and Borevitz, J.O. (2009). Global analysis of allele specific expression in Arabidopsis thaliana. Genetics.
Zheng, Z., Nonomura, T., Appiano, M., Pavan, S., Matsuda, Y., Toyoda, H., Wolters, A.-M.A., Visser, R.G.F., and Bai, Y. (2013). Loss of function in Mlo orthologs reduces susceptibility of pepper and tomato to powdery mildew disease caused by Leveillula taurica. PLoS ONE 8, e70723.

185
Chapter 6
Genetic basis of partial resistance to rust and powdery mildew in Lathyrus cicera -
QTL mapping and synteny studies
The work presented in this chapter was mostly performed by Nuno
Felipe Almeida (see Acknowledgements section), and corresponds to
the following manuscript in preparation:
Almeida, N.F., Alves, M.L., Leitão, S.T., Rubiales, D., and Vaz Patto,
M.C. Genetic basis of partial resistance to rust and powdery mildew in
Lathyrus cicera - QTL mapping and synteny studies


Disease resistance QTL mapping and Synteny studies in L. cicera ___________________________________________________________________
187
6.1 Abstract
Lathyrus cicera L. (chickling pea) is a cool season fodder crop
that has a great capacity to adapt to unfavourable environments (e.g.,
drought, flood and salinity). Besides its tolerance to abiotic factors,
this species presents resistance to some important legume diseases
like rust, powdery mildew, ascochyta blight or bacterial blight.
However, no molecular tools exist to aid in the elucidation of the
molecular mechanisms involved in the resistance process. For that,
this work reports the first linkage map for L. cicera, and QTL mapping
for rust and powdery mildew resistance, based in a RIL population.
Additionally, the data enable comparative mapping between L. cicera
and Medicago truncatula. The map was constructed with 258
molecular markers (21 EST-SSRs, 4 ITAPs and 233 SNPs), covering
757.11 cM of genetic distance organized on 8 major and 3 minor
linkages groups, with an average distance between markers of 2.93
cM. The synteny study indicates a high macrosyntenic conservation
between L. cicera and M. truncatula. One QTL for resistance to
powdery mildew (explaining 31.4% of the phenotypic variance) and
two QTLs for partial resistance to rust (explaining 26.8% of the
phenotypic variance) were detected. QTL analysis revealed that the
genetic control of the partial resistances to rust and powdery mildew
was polygenic. These new genetic and genomic information
represents the foundation stones for a more effective L. cicera
breeding.
6.2. Introduction
Lathyrus cicera L. (chickling pea) is an annual temperate
legume mainly grown as stock feed, both as forage and grain

Chapter 6 ___________________________________________________________________
188
(Hanbury et al., 1999). It can adapt well to harsh environments, being
tolerant to drought, water lodging and resistant to several important
legume pathogens. Due to that, L. cicera is considered a good
alternative for low-input cropping systems in more marginal lands
generally more prone to these biological stresses (Vaz Patto et al.,
2006b). Rust (Vaz Patto et al., 2009), powdery mildew (Vaz Patto et
al., 2007), bacterial blight (Martín-Sanz et al., 2012) and crenate
broomrape (Fernández-Aparicio et al., 2009) are among the biotic
constrains to which L. cicera presents different resistance levels.
Rusts are among the most important diseases of legumes
(Sillero et al., 2006) affecting also Lathyrus spp. (Duke, 1981;
Campbell, 1997; Vaz Patto et al., 2006b). Rusts are caused by
biotrophic fungi that keep infected host cells alive, depending on the
hosts to reproduce and complete their life cycles. Although some
rusts can be cultured on very complex synthetic media, they have no
known saprotrophic existence in nature (Staples, 2000). Rusts form
elaborate intracellularlly accommodated structures called haustoria,
that allow contact between fungal and plant cells over a prolonged
period of time (O’Connell and Panstruga, 2006). In Lathyrus spp., rust
is caused by Uromyces pisi (Pers.) Wint. and U. viciae-fabae (Pers.)
J. Schröt. Both hypersensitive and partial resistance response to rust
has been described in L. cicera. Partial resistance is due to a
restriction of haustoria formation with high percentage of early
aborted colonies, reduction of number of haustoria per colony and
reduction of intercellular growth of infection hyphae (Vaz Patto et al.,
2009; Vaz Patto and Rubiales, 2009; Vaz Patto and Rubiales, 2014).
Powdery mildews are probably the most common,
conspicuous and widespread plant diseases, seldom killing their
hosts, but utilizing their nutrients, reducing their photosynthesis and

Disease resistance QTL mapping and Synteny studies in L. cicera ___________________________________________________________________
189
impairing growth, resulting in yield reductions up to 40% (Agrios,
2005). Powdery mildew in L. cicera is caused by Erysiphe pisi DC.,
that is the causal agent of pea powdery mildew. Erysiphe pisi is an
obligate biotrophic ascomycete fungus characterized by its grey to
white colonies formed on leaves, stem and pods of infected plants
(Vaz Patto et al., 2006a) and can also be found on Medicago, Vicia,
Lupinus, Lens and other Lathyrus spp. (Sillero et al., 2006). Pea
powdery mildew is a serious disease of worldwide distribution, being
particularly important in climates with warm, dry days and cool nights
(Fondevilla and Rubiales, 2012). In general, the infection of L. cicera
by pea powdery mildew presents a compatible reaction with no
macroscopically visible necrosis. However, genotypes with reduced
disease severity, despite of a high infection type, have been identified
(Vaz Patto et al., 2006a; 2007; Vaz Patto and Rubiales, 2014), fitting
the definition of partial resistance according to Parlevliet (1979). Until
now, little is known about the genetic basis of rust and powdery
mildew partial resistance in L. cicera. In the Chapter 5 of this thesis,
the transcriptomic response of L. cicera to inoculation with rust was
studied for the first time, indicating that the most differentially
expressed transcripts, upon rust inoculation, between partially
resistant (BGE023542) and susceptible (BGE008277) genotypes
were involved in signalling, cell wall metabolism and synthesis of
secondary metabolites.
Rusts and powdery mildews are airborne pathogens, with both
sexual and asexual cycles of reproduction. This represents an
increased complexity to the resistance trait stability, since resistance
due to a single gene is more easily overcome by new races of the
pathogens. In those cases, polygenic resistance, as in some cases of
partial resistance, would be more difficult to overcome, and

Chapter 6 ___________________________________________________________________
190
consequently is expected to be more durable (McDonald and Linde,
2002; Niks and Rubiales, 2002).
A linkage map of L. cicera would be crucial, although not yet
available, to identify and locate the genes and genomic regions
responsible to the resistance traits, opening the way for marked
assisted selection (MAS) on this orphan species.
Molecular markers are the stepping stones in this mapping
process. For L. cicera, a large set of expressed sequence tag - simple
sequence repeat markers (EST-SSRs) and single nucleotide
polymorphisms (SNPs) were already developed and may be used for
mapping and diversity studies (Chapter 5). Also, other marker classes
(intron-targeted amplified polymorphic (ITAP), EST-SSR, genomic
simple sequence repeat (gSSR), resistance genes analogs (RGA)
and disease resistance (DR) markers developed for other legume
species (Medicago truncatula Gaertn., Pisum sativum L., Lens
culinaris Medik., Lupinus spp. and Vicia faba L.) have been
successfully cross-amplified in L. cicera (Almeida et al., 2014a). The
existence of cross-species amplified markers would allow
comparative mapping between L. cicera and related legume species,
facilitating the exchange of genetic information in both directions.
In this study, and as a first step to understand the genetic
basis of partial resistance to rust and powdery mildew in L. cicera, we
used previously developed L. cicera molecular markers (described in
Chapter 2 (Almeida et al., 2014a) and Chapter 5), to construct the
first L. cicera linkage map. This approach has also allowed a
comparative/synteny study of L. cicera with other legume species.
This map was developed using a recombinant inbred line (RIL)
population segregating for rust and powdery mildew resistance. This
molecular information was then jointly analysed with the disease

Disease resistance QTL mapping and Synteny studies in L. cicera ___________________________________________________________________
191
resistance scores of this population to study the genetic control of the
L. cicera partial resistance to rust and powdery mildew.
6.3. Material and Methods
6.3.1. Plant Material
The mapping population used for the development of the
linkage map consisted of 102 F5 Recombinant Inbred Lines (RILs)
derived by single seed descendent from a cross between L. cicera
genotypes BGE023542 and BGE008277. These two genotypes
showed contrasting phenotypes to rust and powdery mildew infection
and were kindly provided by the Plant Genetic Resources Centre
(CRF-INIA), Madrid, Spain. BGE023542 shows partial resistance to
rust, while BGE008277 is susceptible to rust and to powdery mildew
(Vaz Patto et al., 2007; 2009).
6.3.2. Disease reaction evaluation
Disease reaction was evaluated under controlled conditions in
three different periods. Rust evaluations were performed in the
autumn of 2009, and in the spring of 2011 and 2013. Powdery mildew
evaluations were performed in the autumn of 2009, spring of 2011
and autumn of 2011. These different evaluations will be referred in
the manuscript as experiment 1R, 2R and 3R for rust and 1PM, 2PM
and 3PM for powdery mildew.
6.3.2.1. Rust evaluation
The Uromyces pisi monosporic isolate UpCo-01, from the
fungal collection of the Institute for Sustainable Agriculture-CSIC

Chapter 6 ___________________________________________________________________
192
(Córdoba, Spain), was used for the rust inoculation experiments. The
inoculum was multiplied on plants of the very susceptible P. sativum
cv. ‘Messire’ before use. Fifteen-day-old RILs seedlings, grown in
plastic pots containing 250 cm3 of 1:1 sand-peat mixture in a
controlled growth chamber (20 ± 2 ºC with a 12 h light photoperiod)
were inoculated by dusting all the plants at the same time with 2 mg
of spores per plant, diluted in pure talk (1:10), with the help of a small
manual dusting device in a complete random experiment. Three
replicates were used, each having four plants of each RIL individual
family, the parental lines and two of cv. ‘Messire’ as control.
Inoculated and control plants were incubated for 24 h at 20 ºC, in
complete darkness, and 100% relative humidity, then transferred to
the growth chamber and kept at 20 ± 2 ºC under 14 h light (150 μmol
m−2 s−1) and 10 h dark. Rust reactions were assessed by measuring
infection type (IT) and disease severity (DS). IT was scored 10 days
after inoculation (d.a.i), and revised 15 d.a.i, using the IT scale of
Stakman et al. (1962), where 0 = no symptoms, i = necrotic flecks, 1
= necrotic flecks with minute pustules barely sporulating, 2 = necrotic
halo surrounding small pustules, 3 = chlorotic halo and 4 = well-
formed pustules with no associated chlorosis or necrosis. Values 0–2
are considered indicative of resistance and 3–4 of susceptibility. DS
was scored as the percentage of leaf area covered by rust pustules
15 d.a.i, on the second upper pair of open leaves, thus, the lower the
DS value, the higher the resistance.
6.3.2.2. Powdery mildew evaluation
The Erysiphe pisi isolate CO-01, from the fungal collection of
the Institute for Sustainable Agriculture-CSIC (Córdoba, Spain), was
used for the powdery mildew inoculation experiments. The isolate

Disease resistance QTL mapping and Synteny studies in L. cicera ___________________________________________________________________
193
derives from a population collected from an infected field (Córdoba,
Spain) and maintained and multiplied before experiments on
susceptible P. sativum cv. ‘Messire’ plants. RILs inoculation was done
on detached L. cicera leaves from two-week-old seedlings using two
leaves per each of six plants of each RIL individual family and were
inoculated using a settling tower to give an inoculum density of about
20 conidia/mm2. Detached leaves were placed with the adaxial
surface up on Petri dishes containing agar (4 g/L) + water +
benzimidazole (62.5 mg/L). After inoculation, Petri dishes were
covered and placed in the growth chamber at 20 ºC. Incubation
started with a 6 h light period (250 µmol/m2) followed by a
photoperiod of 14 h light and 10 h dark. Five d.a.i, the infection type
and disease severity were measured. IT was recorded according to a
0–4 scale (Fondevilla et al., 2006), where 0 = no visible sign of
disease, and 4 = well developed, freely sporulating colonies. DS was
scored as the percentage of leaf coverage by the mycelium.
6.3.3. DNA isolation and molecular markers screening
Using fresh young leaves of one individual of each RIL family
plus the two parental genotypes, DNA was extracted using a modified
CTAB protocol developed by Torres et al. (1993). DNA was
subsequently screened using different molecular markers. The
markers used in this study were the following: Five heterologous ITAP
markers selected from our previous work (Almeida et al., 2014a),
identified as polymorphic and with an 1:1 Mendelian segregation in
this mapping population; 57 EST-SSR makers predicted in silico from
L. cicera parental genotypes RNA-Seq libraries (Chapter 5); 768
SNPs, selected taking into consideration their homology with the
Medicago truncatula genome (MT3.5) (BLASTn; E-value < 1E-6) and

Chapter 6 ___________________________________________________________________
194
their physical position in this genome to cover evenly M. truncatula’s
chromosomic regions (http://www.medicagohapmap.org/tools/
blastsearch), preventing unwanted clustering of markers.
Identification of the SSRs motifs and SNPs was performed as
described in Chapter 5. PCR reactions and genotyping were
performed as described in Almeida et al. (2014b), with the exception
of SNP markers that were genotyped using an Illumina’s custom
Golden Gate genotyping assay by Traitgenetics GmbH, Germany.
6.3.4. Map construction
Linkage analysis and segregation distortion tests were
performed using JoinMap 4.0 software (van Ooijen, 2006), using a
binary matrix including all the genotyping data as input. Markers with
a severe segregation distortion (p ≤ 0.0005) were removed from the
original molecular data set.
The determination of groups of linked markers (linkage groups)
was done with a LOD score of 3. Linkage map calculations were done
using all pairwise recombination estimates lower than 0.40 and a
LOD score higher than 1.00, applying the Kosambi mapping function
(Kosambi, 1943). The reliability of the obtained map was checked by
inspecting the individual linkage group χ2 value.
6.3.5. Comparison with M. truncatula genome
Using the order of the SNP markers in the L. cicera linkage
map and the information of the physical position of the same markers
mapped on the M. truncatula genome (MT3.5) (BLASTn; E-value <
1E-6), were aligned in a matrix. Lines from the matrix correspond to
the M. truncatula genome and the columns correspond to the L.

Disease resistance QTL mapping and Synteny studies in L. cicera ___________________________________________________________________
195
cicera linkage groups that were rearranged in order to facilitate the
visual estimation of co-linearity.
6.3.6. Phenotypic data analysis
In order to exclude outliers, RILs showing a DS value with
standard deviation percentage higher than 30% were excluded from
further analysis. Phenotypic data (disease reaction measurements)
descriptive statistics analysis was done using SAS software (The
SAS System for Windows version 9.2, Cary, NC, USA). Normality of
residual distribution was checked using the Kolmogorov-Smirnov test.
Spearman's correlation coefficients were computed for each trait
between experiments by PROC CORR procedure. PROC GLM
procedure was used for analysis of variance. In this model,
environments (experiments) and genotypes were treated as fixed
effects. Repetitions, treated as random, were nested in the
environments. Genotype x Environment interaction was included in
the model. The variance components for each trait in each
environment where estimated using the PROC VARCOMP
procedure. Broad-sense heritability, representing the part of the
genetic variance in the total phenotypic variance, were calculated for
each environment as: ℎ2 = 𝛿𝛿𝑔𝑔2/[𝛿𝛿𝑔𝑔2 + (𝛿𝛿2/𝑟𝑟)] , where 𝛿𝛿𝑔𝑔2 is the
genotypic variance, 𝛿𝛿2 is the error variance and 𝑟𝑟 is the number of
replications.
6.3.7. QTL mapping
The obtained linkage map was used for resistance to rust and
powdery mildew QTL identification on this RIL population. Kruskal-
Wallis single-marker analysis (non-parametric test), as well as both

Chapter 6 ___________________________________________________________________
196
interval mapping (Lander and Botstein, 1989) and multiple-QTL
mapping (MQM) (Jansen and Stam, 1994) were performed using
MapQTL version 4.0 (Van Ooijen et al., 2002). A backward
elimination procedure was applied to select cofactors significantly
associated with each trait at P < 0.02 to be used in MQM. Genome-
wide threshold values (P < 0.05) for declaring the presence of QTL
were estimated from 10,000 permutations of each phenotypic trait
(Churchill and Doerge, 1994). The 1-LOD and 2-LOD support
intervals were determined for each LOD peak.
The R2 value, representing the percentage of the phenotypic
variance explained by the marker genotype at the QTL, was taken
from the peak QTL position as estimated by MapQTL. Additive effect
for each detected QTL was estimated using the MQM procedure.
Gene action was determined as described by Stuber et al. (1987)
where: additive (|d/a| < 0.20); partial dominance (0.2 < |d/a| < 0.8);
dominance (0.8 < |d/a| < 1.2); and overdominance (|d/a| > 1.20),
where, d/a = dominance effects/additive effects. Linkage groups were
drawn using MapChart version 2.2 software (Voorrips, 2002).
Molecular markers were previously annotated via BLASTX as
described in Chapter 5, allowing the identification of candidate
resistance genes among the molecular markers within the QTL
confidence intervals.
6.4. Results
6.4.1. Disease evaluation under controlled conditions The L. cicera parental genotypes and RILs used in this study
presented an IT=4 for both diseases evaluated. BGE023542
displayed partial resistance to both rust and powdery mildew, with

Disease resistance QTL mapping and Synteny studies in L. cicera ___________________________________________________________________
197
fully compatible interaction to both pathogens in spite of some
reduced disease progress, with an average DS of 36% against the 52%
observed in BGE008277 for rust evaluation across experiments, and
DS of 33% for powdery mildew against the 73% observed in
BGE008277. L. cicera RIL population rust and powdery mildew DS
levels did not follow a normal distribution (Figure 6.1). An arcsine
transformation was applied to DS to improve homogeneity of residual
variance but no improvement in the normality of the data was
observed. Positive transgressive segregation was detected for both
disease reactions (Figure 6.1), with a higher degree for rust
resistance, with more than half of the RIL families showing lower DS
than the more resistant parent. No correlation between individual
experiments for rust DS, and a weak correlation for powdery mildew
DS, ranging from 0.19 (1PM vs. 2PM) and 0.25 (1PM vs. 3PM), were
detected (Spearman’s correlation tests). Also, no correlation was
detected when comparing the DS of the RILs to rust and powdery
mildew inoculation (r=0.22).
Figure 6.1 - Frequency distributions of rust (experiment 2R) and powdery mildew (experiment 3PM) DS in the RIL families under controlled conditions. The average values of rust and powdery mildew DS of the two parental lines are indicated by the arrows.

Chapter 6 ___________________________________________________________________
198
The calculated broad-sense heritability for rust DS had a
maximum value of 86% for experiment 3R, while for powdery mildew
DS the maximum value was for experiment 2PM with 77%. Results
for all the experiments can be found in Table 6.1.
Significant differences for rust and powdery mildew disease
severity were detected between genotypes and the different
experiments. The interaction between Genotype x Experiment was
also significant, therefore, QTL mapping was performed separately
for each experiment.
Table 6.1 – Phenotypic values (mean ± standard deviation) of the RIL families and quantitative genetic parameters for rust and powdery mildew resistance. Exp: experiment; Significance of the sources of variability: G-Genotype, E-Environment, Rep (E)-Repetitions within Environment, G x E-Genotype x Environment; Interaction-Levels of significance:ns non-significant value; *** significant at P < 0.001
RILs disease severity (%)
(mean ± sd) Pearson's correlation
( r ) Heritability (h2) (%) ANOVA
Trait Exp. 1 Exp. 2 Exp. 3 Exp. 1&2
Exp. 1&3
Exp. 2&3
Exp. 1
Exp. 2
Exp. 3 G E Rep
(E) G x E
rust 30,0 ± 10,1
40,3 ± 11,3
20,0 ± 4,4 0,03 -0,02 -0,02 65.16 77.35 72.78 *** *** ns ***
powdery mildew
60,9 ± 13,0
63,9 ± 14,9
46,6 ± 12,7 0,19 0,25 0,24 51.28 46.13 86.31 *** *** ns ***
6.4.2. Linkage map construction
A total of 830 molecular markers (57 EST-SSRs, 5 ITAPs and
768 SNPs) were screened in the parental genotypes of the F5 RIL
population. From these, 258 polymorphic loci were successfully
mapped, namely, 21 EST-SSRs, 4 ITAPs and 233 SNPs.
In more detail, from the initial 57 EST-SSRs tested in the
parental genotypes, 12 were excluded from the RILs genotyping
because: four did not amplify any band, one presented a complex
pattern and seven were monomorphic between the parental
genotypes. From the 44 EST-SSRs screened in the RILs, 29 were

Disease resistance QTL mapping and Synteny studies in L. cicera ___________________________________________________________________
199
selected for mapping, 28 with the expected Mendelian segregation (1
degree of freedom; α = 0.05; χ2 < 3.84) and one with a low
segregation distortion (χ2 = 4.46). The remaining markers presented a
high segregation distortion and were excluded from further analysis.
One of the ITAPs presented a high segregation distortion and was
removed. From the 768 SNPs genotyped in the RIL population, 369
were withdrawn from the mapping due to several causes: 206 for
having more than 20% missing values and 163 with heterozygous
individuals (not expected on a RIL population). A total of 399 SNPs
were then selected for developing the linkage map. However, from
the 399 SNP markers selected, 23 presented a severe segregation
distortion (p ≤ 0.0005) and were also removed. From the remaining
376 markers, 81 were removed for being identical to other markers,
thus redundant for the map construction. Additionally one RIL was
removed because it had more than 25% of missing data.
Finally, the L. cicera linkage map was developed using data
from 101 RILs screened with 258 polymorphic loci, 21 EST-SSRs, 4
ITAPs and 233 SNP. It covered 757.11 cM of genetic distance
organized on 8 major and 3 minor linkages groups, with an average
distance between markers of 2.93 cM. Only one marker could not be
linked with any other LG. Twenty two percent of the markers showed
significant deviation from the expected 1:1 segregation ratio
(segregation distortion). A chromosomal region was considered
skewed when four or more closely linked markers showed significant
segregation distortion in the same direction (Xu et al., 1997). In the
present linkage map these were observed in the extremity of linkage
groups (LG) IV, V and IX, and in the centre of LG I and III. The
smallest LGs (X and XI) were constituted exclusively by markers with
high segregation distortion (Figure 6.2).

Chapter 6 ___________________________________________________________________
200
Inspection of the individual linkage group χ2 values for
goodness-of-fit gave insight into the reliability of the obtained map.
The χ2 values for all the linkage groups were < 1 (Table 6.2).
Table 6.2 - Description of the obtained linkage groups.
Linkage group
number of loci
χ2 mean
LOD threshold
Length (cM)
Average distance (cM)
Largest gap (cM)
I 46 0.174 4 150.16 3.26 15.05 II 41 0.133 4 134.40 3.28 14.80 III 47 0.417 4 114.61 2.44 11.73 IV 30 0.669 4 88.55 2.95 10.42 V 22 0.216 4 72.92 3.32 14.36 VI 24 0.234 4 66.64 2.78 18.61 VII 14 0.070 4 46.89 3.35 16.10 VIII 19 0.373 4 44.60 2.35 9.23 IX 9 0.221 3 25.36 2.82 6.27 X 3 0.025 4 9.22 3.07 8.65 XI 3 0.002 3 3.77 1.26 2.71
6.4.3. Macrosynteny between L. cicera LGs and M. truncatula chromosomes
Clear evidence of a simple and direct macrosyntenic
relationship between the L. cicera and M. truncatula genome was
detected in the dot matrix in Figure 6.3. The clear isoclinic diagonal
line along the linkage groups provides a strong indication of the
conservation of gene order in the two legume genomes. However,
chromosomal rearrangements were also evident at a moderate level.
For example, M. truncatula chromosomes 2 and 6 merged to form the
L. cicera LG IV. Similarly, M. truncatula chromosome 4 splits into L.
cicera LGs II and IX and M. truncatula chromosome 7 into L. cicera
LGs VI and VII (Figure 6.3). Additionally, M. truncatula chromosome 8

Disease resistance QTL mapping and Synteny studies in L. cicera ___________________________________________________________________
201
spans L. cicera LGs VIII, X and a large portion on the extremity of LG
II.
Figure 6.2 - L. cicera first genetic linkage map based on a RIL population. Genetic distances given in cM (Kosambi mapping function) on the left. Marker names are shown on the right side of each linkage group with connecting lines indicating the position of each marker on the linkage group. Markers with distorted segregation ratios are marked with asterisks according to their significance levels (*: 0.05, **: 0.01, ***: 0.005, ****: 0.001, *****: 0.0005).

Chapter 6 ___________________________________________________________________
202
Figure 6.3 - Matrix plot of common gene-based SNP markers mapped in L. cicera and M. truncatula. The L. cicera and M. truncatula loci are listed horizontally and vertically, respectively, according to their linkage group order.
6.4.4. QTL mapping for rust and powdery mildew resistance
Two QTLs for partial resistance to rust (qrustres1 and
qrustres2) and one to powdery mildew (qpmres1) were identified. In
linkage group (LG) II, qrustres1 on experiment 2R, and qpmres1, on
experiment 3PM (Figure 6.4) were detected. These QTLs explained,
respectively, 14.1 and 31.4% of the phenotypic variance observed.
Also in the rust experiment 2R, qrustres2 was detected in LG II
explaining 12.7% of the phenotypic variance observed (Table 6.3).
Resistant alleles (the ones presenting low DS values) were derived
from the more resistant genotype for all QTLs. Using the estimated

Disease resistance QTL mapping and Synteny studies in L. cicera ___________________________________________________________________
203
additive effects of the BGE023542 alleles, we predicted a difference
of 28.7% for rust resistance level between the two parental
genotypes, based on simple additive model (two-times the sum of the
additive affects). The observed phenotypic difference between the
two parental genotypes was 25% for rust experiment R2.
Table 6.3 – Quantitative trait loci for rust and powdery mildew resistance in a L. cicera RIL5 population (BGE023542xBGE008277).
Trait QTL Linkage Group
Peak Marker (Positiona/LOD)
Flanking markersb
Peak LOD score
Additive effect (a)c
R2 (%)d
Reaction to rust infection
qrustres1 II c4_a35535 (55.793/3.27)
c4_a65394/ c4_a26111 3.27 -3.37 14.1
qrustres2 II c4_a5026 (115.603/2.97)
c4_a17517/ c4_a1108 2.97 -3.80 12.7
Reaction to powdery mildew infection
qpmres1 II c4_a12255 (58.658/6.71)
c5_a35535/ c5_a5292 6,71 -6.72 31.4
a QTL position in cM from the top of the chromosome b molecular markers flanking the support interval estimated at a LOD fall of -2.00 c Additive effect = (mu_BGE023542 – mu_BGE008277) / 2; negative values indicate that the BGE023542 allele increased resistance trait value
mu_BGE023542 – the estimated mean of the distribution of the quantitative trait associated with the BGE023542 allele mu_ BGE008277 – idem for the BGE008277 allele
d Percent explained phenotypic variance.
6.4.5. Discovery of potential candidate genes for the identified QTLs
All the molecular markers present in this study were previously
BLASTed against public plant protein databases (Chapter 5) in order
to facilitate the identification of potential candidate genes, for rust and
powdery mildew resistance QTLs.
Two potential candidate genes were identified for the powdery
mildew resistance QTL located on LG II (“Dihydroorotase” and
“Protein trichome birefringence-like 27”). For the rust resistance QTLs

Chapter 6 ___________________________________________________________________
204
located on LG II, one potential candidate gene was identified per QTL
(qrustres1 and qrustres2), although only one of those two (“MAG2-
interacting protein 3”) on qrustres1 was functionally annotated (Table
6.4). Exploring the homologous region from the identified QTLs in the
M. truncatula genome, we observed that one of the PsMLO1
homologs was identified in the same region as the qpmres1 syntenic
region.
Figure 6.4 - MQM QTL mapping analysis for rust and powdery mildew resistance on LG II of the L. cicera linkage map developed. Dashed line representing the significant LOD threshold for detecting QTLs.

Tabl
e 6.
4 –
Pote
ntia
l can
dida
te g
enes
loca
ted
unde
r the
iden
tifie
d in
QTL
s.
QTL
Li
nkag
e gr
oup
Mar
kers
un
der Q
TL
BLAS
T hi
t e-
valu
e Fu
nctio
n R
efer
ence
qpm
res1
II
a122
55;1
47
Dih
ydro
orot
ase
[Ara
bido
psis
thal
iana
] 0
- inv
olve
d in
piri
mid
ine
met
abol
ism
- i
nvol
ved
in p
rodu
ctio
n of
sec
onda
ry m
etab
olis
m
(Gie
rman
n et
al.,
200
2)
(Bro
wn
and
Tura
n, 1
995)
qpm
res1
II
a261
11;1
29
Prot
ein
trich
ome
bire
fring
ence
-lke
27
[Ara
bido
psis
thal
iana
] 2.
00E-
22
- cel
lulo
se b
iosy
nthe
sis
in A
rabi
dops
is
(Bis
chof
f et a
l., 2
010)
qrus
tres1
II
a355
35;9
4 M
AG2-
inte
ract
ing
prot
ein
3 [A
rabi
dops
is th
alia
na]
0 - t
rans
port
of p
rote
ins
betw
een
ER a
nd G
olgi
in
Ara
bido
psis
- rol
e of
ER
in d
efen
ce t
houg
h pr
otei
n tra
ffick
ing
(Li e
t al.,
201
3)
(Yam
ada
et a
l., 2
011)
qrus
tres2
II
a502
6;27
9 hy
poth
etic
al p
rote
in
MTR
_4g0
1906
0 [M
edic
ago
trunc
atul
a]
7.88
E-17
9 -
-
qrus
tres1
– R
ust r
esis
tanc
e Q
TL 1
qr
ustre
s2 –
Rus
t res
ista
nce
QTL
2
qpm
res1
– P
owde
ry m
ildew
resi
stan
ce Q
TL
Disease resistance QTL mapping and Synteny studies in L. cicera ___________________________________________________________________
205

Chapter 6 ___________________________________________________________________
206
6.5. Discussion
In order to understand the genetic basis of the rust and
powdery mildew partial resistance in L. cicera we performed a QTL
analysis of these traits using a segregating RIL population.
Resistance to both diseases was based on the reduction of disease
severity, with parental genotypes and evaluated RILs showing a
compatible interaction, with no associated cell death, fitting the
definition of Partial Resistance sensu Parlevliet (1979).
To localize these resistance QTLs, we developed the first
linkage map for L. cicera based on a RIL population. This linkage
map is based on different types of molecular markers, including EST-
SSRs, SNPs and ITAPs. A total of 1,113 molecular markers were
screened in 102 individuals from a F5 RIL population segregating for
rust and powdery mildew response to infection. The obtained map
covered a total of 757.11 cM, with an average density of one marker
every 2.93 cM, organized in 11 linkage groups, eight longer than 40
cM and 3 shorter groups.
Regions showing distorted segregation of molecular markers
were found in clusters, mainly in the extremities of linkage groups.
Also the two smaller LGs (X and XI) were exclusively constituted by
segregation distorted markers, what might have contributed for their
unlinked situation. Skewed regions were distorted towards the same
direction (an excess of female parental line alleles), with the
exception of the region on LG III, distorted towards an excess of male
parental line alleles. These distorted regions may include potential
lethal genes (Cheng et al., 1998), that when in homozygosity produce
a lethal phenotype, and therefore, RILs containing those alleles will
be absent from the mapping population. This will contribute for the

Disease resistance QTL mapping and Synteny studies in L. cicera ___________________________________________________________________
207
segregation distortion of the markers linked to those genes that will
not segregate independently from each other (Torjek et al., 2006).
A strong extensive co-linearity was detected between the L.
cicera linkage groups and the M. truncatula genome. Similar high
levels of marker order conservation have also been reported between
M. truncatula and P. sativum (Aubert et al., 2006) and other closely
related legumes such as M. truncatula and M. sativa (Choi et al.,
2004a), L. culinaris and M. truncatula (Phan et al., 2007) and L.
culinaris and P. sativum (Weeden et al., 1992). In the present study, a
few rearrangements in the homologous marker order have also been
detected, such as inversions (LG II and III) and translocations (LG II
and IV). In a previous study comparing M. sativa and P. sativum
synteny (Kaló et al., 2004), one rearrangement event was similar to
the one observed in this study: in L. cicera, a linkage group (LG IV)
was split in two, spanning chromosomes 2 and 6 in M. truncatula. In
Kalo et al. (2004), P. sativum’s LG IV contained M. sativa’s LG 2 and
LG 6, being acceptable to hypothesize that the chromosomal
reduction between M. truncatula/M. sativa (n = 8) and L. cicera/P.
sativum (n = 7) was caused by the fusion of M. truncatula
chromosomes 2 and 6 (Choi et al., 2004b).
QTL analysis revealed that the genetic control of partial
resistance to rust and powdery mildew was indeed polygenic taking
into consideration the small percentage of total phenotypic variation
explained by the detected QTLs. The QTL detected for resistance to
powdery mildew explained 31.4% of the phenotypic variation and the
two detected QTLs for partial resistance to rust explained a total of
26.8% of the phenotypic variation. The main advantage of the
polygenic resistance is that it is generally more durable than
monogenic resistance, that due to the higher selective pressure

Chapter 6 ___________________________________________________________________
208
inflicted by the host to the pathogen, are more easily overcome by the
fast evolving fungi (McDonald and Linde, 2002; Niks and Rubiales,
2002). The partial resistance reaction found in L. cicera is similar to
what is found commonly in cool season legumes interaction with rusts
and powdery mildews (Sillero et al., 2006; Rubiales et al., 2011), but
due to the lack of anchor markers, our study was still unable to bridge
the information with the other existing legume QTL resistance studies.
The QTL for powdery mildew resistance accounted for 31.4%
of the total estimated phenotypic variance at seedling stage, while the
two detected QTLs for rust resistance explained 14.1% and 12.7% of
phenotypic variance. The remaining and unexplained variance may
be due to other unidentified loci, which have not been detected either
because of insufficient genome coverage or/and especially because
of uncontrolled experimental and environmental variation. For
instance, despite the use of the same U. pisi and E. pisi isolates in all
experiments, the isolate refreshment/multiplication procedures before
inoculation may have alter the fungi genetic background of each
experiment.
For powdery mildew resistance, two potential candidate
resistance genes co-localized with the QTL identified in LG II. One
locus corresponds to a “dihydroorotase”. This enzyme is involved in
the pirimidine metabolism (Giermann et al., 2002), that, in its turn, is
involved in the production of secondary metabolites (Brown and
Turan, 1995). Secondary metabolites are often involved in defence,
since many possess antimicrobial properties (Stintzi et al., 1993). The
other potential candidate gene is the “protein trichome birefringence”,
described as being involved in cellulose biosynthesis in Arabidopsis
thaliana (Bischoff et al., 2010). Alterations in cellulose synthesis can
be monitored by the cell, activating a cascade of signalling events

Disease resistance QTL mapping and Synteny studies in L. cicera ___________________________________________________________________
209
that triggers lignification and defence responses (Caño-Delgado et
al., 2003).
Within the confidence intervals of the two QTLs for rust
resistance only one molecular marker was functionally annotated, as
“MAG2-interacting protein 3”. This protein is involved in protein
trafficking between the endoplasmic reticulum (ER) and Golgi in
Arabidopsis (Li et al., 2013). The role of ER in defence through
protein trafficking and the formation of ER bodies in plants was
already postulated (Hayashi et al., 2001; Yamada et al., 2011). ER
bodies are located specifically in epidermal cells and contain stress-
inducible proteases. These bodies fuse with each other and with
vacuoles during stress conditions. Proteases when in vacuoles
become active and are discharged to the intracellular space in order
to inhibit pathogen development and induce cell death in adjacent
cells (Hatsugai et al., 2009).
In our study, the QTL for powdery mildew (qpmres1)
resistance is located in a M. truncatula’s syntenic region containing a
homologous sequence to the er1 gene (central region of the
chromosome 4). The gene er1, identified as PsMLO1 (Humphry et al.,
2011), may confer complete or incomplete resistance to powdery
mildew in pea depending on the environment (reviewed by Rubiales
et al. (2009)). Interestingly this gene was detected up-regulated in the
susceptible genotype and down regulated in the partially resistant
genotype in our transcriptomics dataset in response to rust (Chapter
5). Therefore, the role of PsMLO1 should be further analysed in the
future, also for rust resistance response in legumes.
This study has provided a number of significant genetic
outcomes for L. cicera and legume genomics in general. More
specifically, the developed linkage map can be used as a tool to

Chapter 6 ___________________________________________________________________
210
localize gene governing other desirable traits. In addition, the
already detected resistance QTLs will support the selection of
interesting regions for future fine mapping, increasing the potential of
precision resistance breeding through Marker Assisted Selection
(MAS). As a final future goal, pyramiding of different resistance gene
combinations using MAS will result in a more efficient development of
new more durable resistant cultivars.
6.6. Acknowledgments
NFA carried out the phenotyping, sample processing for
genotyping, performed the data analysis, developed the EST-SSRs
primers and the SNP assay, and drafted the manuscript. MLA
participated in the construction of the linkage map, QTL mapping and
statistical analysis. STL participated in the results generation on the
EST-SSR genotyping and data analysis. DR developed de RIL
population and revised the manuscript critically. MCVP coordinated
the study and participated to the drafting and revision of the
manuscript. NFA would like to thank the CRF-INIA, Madrid, Spain, for
supplying the genotypes and Professor Zlatko Šatović for the relevant
suggestions.
6.7. References Agrios, G.N. (2005). Plant Pathology. New York, U.S.A.: Elsevier
Academic Press. Almeida, N.F., Leitão, S.T., Caminero, C., Torres, A.M., Rubiales, D.,
and Vaz Patto, M.C. (2014a). Transferability of molecular markers from major legumes to Lathyrus spp. for their application in mapping and diversity studies. Molecular Biology Reports 41, 269-283.
Almeida, N.F., Leitão, S.T., Krezdorn, N., Rotter, B., Winter, P., Rubiales, D., and Vaz Patto, M.C. (2014b). Allelic diversity in

Disease resistance QTL mapping and Synteny studies in L. cicera ___________________________________________________________________
211
the transcriptomes of contrasting rust-infected genotypes of Lathyrus sativus, a lasting resource for smart breeding. BMC Plant Biology 14, 376.
Aubert, G., Morin, J., Jacquin, F., Loridon, K., Quillet, M.C., Petit, A., Rameau, C., Lejeune-Henaut, I., Huguet, T., and Burstin, J. (2006). Functional mapping in pea, as an aid to the candidate gene selection and for investigating synteny with the model legume Medicago truncatula. Theoretical and Applied Genetics 112, 1024-1041.
Bischoff, V., Nita, S., Neumetzler, L., Schindelasch, D., Urbain, A., Eshed, R., Persson, S., Delmer, D., and Scheible, W.-R. (2010). TRICHOME BIREFRINGENCE and its homolog AT5G01360 encode plant-specific DUF231 proteins required for cellulose biosynthesis in Arabidopsis. Plant Physiology 153, 590-602.
Brown, E.G., and Turan, Y. (1995). Pyrimidine metabolism and secondary product formation - biogenesis of albizziine, 4-hydroxyhomoarginine and 2,3-diaminopropanoic Acid. Phytochemistry 40, 763-771.
Campbell, C.G. (1997). Promoting the conservation and use of underutilized and neglected crops. Grass pea. Lathyrus sativus L. Rome, Italy: International Plant Genetic Resources Institute.
Caño-Delgado, A., Penfield, S., Smith, C., Catley, M., and Bevan, M. (2003). Reduced cellulose synthesis invokes lignification and defense responses in Arabidopsis thaliana. The Plant Journal 34, 351-362.
Cheng, R., Kleinhofs, A., and Ukai, Y. (1998). Method for mapping a partial lethal-factor locus on a molecular-marker linkage map of a backcross and doubled-haploid population. Theoretical and Applied Genetics 97, 293-298.
Choi, H.-K., Kim, D., Uhm, T., Limpens, E., Lim, H., Mun, J.-H., Kalo, P., Penmetsa, R.V., Seres, A., Kulikova, O., Roe, B.A., Bisseling, T., Kiss, G.B., and Cook, D.R. (2004a). A sequence-based genetic map of Medicago truncatula and comparison of marker colinearity with M. sativa. Genetics 166, 1463-1502.
Choi, H.K., Mun, J.H., Kim, D.J., Zhu, H.Y., Baek, J.M., Mudge, J., Roe, B., Ellis, N., Doyle, J., Kiss, G.B., Young, N.D., and Cook, D.R. (2004b). Estimating genome conservation between crop and model legume species. Proceedings of the National Academy of Sciences of the United States of America 101, 15289-15294.

Chapter 6 ___________________________________________________________________
212
Churchill, G.A., and Doerge, R.W. (1994). Empirical threshold values for quantitative trait mapping. Genetics 138, 963-971.
Duke, J. (1981). Handbook of Legumes of World Economic Importance. New York, U.S.A.: Plennun Press.
Fernández-Aparicio, M., Flores, F., and Rubiales, D. (2009). Field response of Lathyrus cicera germplasm to crenate broomrape (Orobanche crenata). Field Crops Research 113, 321-327.
Fondevilla, S., Carver, T.L.W., Moreno, M.T., and Rubiales, D. (2006). Macroscopic and histological characterisation of genes er1 and er2 for powdery mildew resistance in pea. European Journal of Plant Pathology 115, 309-321.
Fondevilla, S., and Rubiales, D. (2012). Powdery mildew control in pea. A review. Agronomy for Sustainable Development 32, 401-409.
Giermann, N., Schröder, M., Ritter, T., and Zrenner, R. (2002). Molecular analysis of de novo pyrimidine synthesis in solanaceous species. Plant Molecular Biology 50, 393-403.
Hanbury, C.D., Siddique, K.H.M., Galwey, N.W., and Cocks, P.S. (1999). Genotype-environment interaction for seed yield and ODAP concentration of Lathyrus sativus L. and L. cicera L. in Mediterranean-type environments. Euphytica 110, 45-60.
Hatsugai, N., Iwasaki, S., Tamura, K., Kondo, M., Fuji, K., Ogasawara, K., Nishimura, M., and Hara-Nishimura, I. (2009). A novel membrane fusion-mediated plant immunity against bacterial pathogens. Genes & Development 23, 2496-2506.
Hayashi, Y., Yamada, K., Shimada, T., Matsushima, R., Nishizawa, N.K., Nishimura, M., and Hara-Nishimura, I. (2001). A proteinase-storing body that prepares for cell death or stresses in the epidermal cells of Arabidopsis. Plant and Cell Physiology 42, 894-899.
Humphry, M., Reinstadler, A., Ivanov, S., Bisseling, T., and Panstruga, R. (2011). Durable broad-spectrum powdery mildew resistance in pea er1 plants is conferred by natural loss-of-function mutations in PsMLO1. Molecular Plant Pathology 12, 866-878.
Jansen, R.C., and Stam, P. (1994). High resolution of quantitative traits into multiple loci via interval mapping. Genetics 136, 1447-1455.
Kaló, P., Seres, A., Taylor, S.A., Jakab, J., Kevei, Z., Kereszt, A., Endre, G., Ellis, T.H.N., and Kiss, G.B. (2004). Comparative mapping between Medicago sativa and Pisum sativum. Molecular Genetics and Genomics 272, 235-246.
Kosambi, D.D. (1943). The estimation of a map distance from recombination values. Annals of Eugenics 12, 172-175.

Disease resistance QTL mapping and Synteny studies in L. cicera ___________________________________________________________________
213
Lander, E.S., and Botstein, D. (1989). Mapping mendelian factors underlying quantitative traits using RFLP linkage maps. Genetics 121, 185-199.
Li, L., Shimada, T., Takahashi, H., Koumoto, Y., Shirakawa, M., Takagi, J., Zhao, X., Tu, B., Jin, H., Shen, Z., Han, B., Jia, M., Kondo, M., Nishimura, M., and Hara-Nishimura, I. (2013). MAG2 and three MAG2-INTERACTING PROTEINs form an ER-localized complex to facilitate storage protein transport in Arabidopsis thaliana. The Plant Journal 76, 781-791.
Martín-Sanz, A., Palomo, J., Pérez De La Vega, M., and Caminero, C. (2012). Characterization of Pseudomonas syringae pv. syringae isolates associated with bacterial blight in Lathyrus spp. and sources of resistance. European Journal of Plant Pathology 134, 205-216.
Mcdonald, B., and Linde, C. (2002). The population genetics of plant pathogens and breeding strategies for durable resistance. Euphytica 124, 163-180.
Niks, R., and Rubiales, D. (2002). Potentially durable resistance mechanisms in plants to specialised fungal pathogens. Euphytica 124, 201-216.
O’connell, R.J., and Panstruga, R. (2006). Tête à tête inside a plant cell: establishing compatibility between plants and biotrophic fungi and oomycetes. New Phytologist 171, 699-718.
Parlevliet, J.E. (1979). "The co-evolution of host-parasite systems," in Parasites as plant taxonomists, Acta Universitatis Upsaliensis XXVI, ed. J. Hedberg.), 39-45.
Phan, H.T.T., Ellwood, S.R., Hane, J.K., Ford, R., Materne, M., and Oliver, R.P. (2007). Extensive macrosynteny between Medicago truncatula and Lens culinaris ssp. culinaris. Theoretical and Applied Genetics 114, 549-558.
Rubiales, D., Castillejo, M.A., Madrid, E., Barilli, E., and Rispail, N. (2011). Legume breeding for rust resistance: lessons to learn from the model Medicago truncatula. Euphytica 180, 89-98.
Rubiales, D., Fernández-Aparicio, M., Moral, A., Barilli, E., Sillero, J.C., and Fondevilla, S. (2009). Disease resistance in pea (Pisum sativum L.) types for autumn sowings in Mediterranean environments. Czech Journal of Genetics and Plant Breeding 45, 135-142.
Sillero, J.C., Fondevilla, S., Davidson, J., Patto, M.C.V., Warkentin, T.D., Thomas, J., and Rubiales, D. (2006). Screening techniques and sources of resistance to rusts and mildews in grain legumes. Euphytica 147, 255-272.
Stakman, E.C., Stewart, D.M., and Loegering, W.Q. (1962). Identification of physiologic races of Puccinia graminis var.

Chapter 6 ___________________________________________________________________
214
Tritici. United States Department of Agriculture, Agricultural Research Service.
Staples, R.C. (2000). Research on the rust fungi during the twentieth century. Annual Review of Phytopathology 38, 49-69.
Stintzi, A., Heitz, T., Prasad, V., Wiedemann-Merdinoglu, S., Kauffmann, S., Geoffroy, P., Legrand, M., and Fritig, B. (1993). Plant ‘pathogenesis-related’ proteins and their role in defense against pathogens. Biochimie 75, 687-706.
Stuber, C.W., Edwards, M.D., and Wendel, J.F. (1987). Molecular marker-facilitated investigations of quantitative trait loci in maize. II. Factors influencing yield and its component traits. Crop Science 27, 639-648.
Torjek, O., Witucka-Wall, H., Meyer, R.C., Von Korff, M., Kusterer, B., Rautengarten, C., and Altmann, T. (2006). Segregation distortion in Arabidopsis C24/Col-0 and Col-0/C24 recombinant inbred line populations is due to reduced fertility caused by epistatic interaction of two loci. Theoretical and Applied Genetics 113, 1551-1561.
Torres, A.M., Weeden, N.F., and Martin, A. (1993). Linkage among isozyme, RFLP and RAPD markers in Vicia faba. Theoretical and Applied Genetics 85, 937-945.
Van Ooijen, J.W. (2006). JoinMap ® 4, Software for the calculation of genetic linkage maps in experimental populations. Kyazma B.V., Wageningen, Netherlands.
Van Ooijen, J.W., Boer, M.P., Jansen, R.C., and Maliepaard, C. (2002). MapQTL® 4.0, Software for the calculation of QTL positions on genetic maps. Plant Research International, Wageningen, the Netherlands.
Vaz Patto, M.C., Fernández-Aparicio, M., Moral, A., and Rubiales, D. (2006a). Characterization of resistance to powdery mildew (Erysiphe pisi) in a germplasm collection of Lathyrus sativus. Plant Breeding 125, 308-310.
Vaz Patto, M.C., Fernández-Aparicio, M., Moral, A., and Rubiales, D. (2007). Resistance reaction to powdery mildew (Erysiphe pisi) in a germplasm collection of Lathyrus cicera from Iberian origin. Genetic Resources and Crop Evolution 54, 1517-1521.
Vaz Patto, M.C., Fernández-Aparicio, M., Moral, A., and Rubiales, D. (2009). Pre and posthaustorial resistance to rusts in Lathyrus cicera L. Euphytica 165, 27-34.
Vaz Patto, M.C., and Rubiales, D. (2009). Identification and characterization of partial resistance to rust in a germplasm collection of Lathyrus sativus L. Plant Breeding 128, 495-500.

Disease resistance QTL mapping and Synteny studies in L. cicera ___________________________________________________________________
215
Vaz Patto, M.C., and Rubiales, D. (2014). Resistance to rust and powdery mildew in Lathyrus crops. Czech Journal of Genetics and Plant Breeding 50, 116-122.
Vaz Patto, M.C., Skiba, B., Pang, E.C.K., Ochatt, S.J., Lambein, F., and Rubiales, D. (2006b). Lathyrus improvement for resistance against biotic and abiotic stresses: From classical breeding to marker assisted selection. Euphytica 147, 133-147.
Voorrips, R.E. (2002). MapChart: Software for the graphical presentation of linkage maps and QTLs. Journal of Heredity 93, 77-78.
Weeden, N.F., Muehlbauer, F.J., and Ladizinsky, G. (1992). Extensive conservation of linkage relationships between pea and lentil genetic maps. Journal of Heredity 83, 123-129.
Xu, Y., Zhu, L., Xiao, J., Huang, N., and Mccouch, S.R. (1997). Chromosomal regions associated with segregation distortion of molecular markers in F2, backcross, doubled haploid, and recombinant inbred populations in rice (Oryza sativa L.). Molecular and General Genetics 253, 535-545.
Yamada, K., Hara-Nishimura, I., and Nishimura, M. (2011). Unique defense strategy by the endoplasmic reticulum body in plants. Plant and Cell Physiology 52, 2039-2049.


217
Chapter 7
General discussion


General discussion ___________________________________________________________________
219
7.1. Project overview
In recent years Lathyrus spp. agronomical potential has been
advocated due to their multipurpose grain and forage usage. These
species have a hardy and penetrating root system allowing them to
grown on a wide range of soil types, including very poor soils and heavy
clays (Campbell, 1997). Also Lathyrus spp. are low production cost
grain and forage legumes, adapted to low rainfall environments and
are considerable potential high quality and cheap protein sources
(Hanbury et al., 2000). As legume species, Lathyrus spp., require less
fertilizer inputs, since rhizobial bacteria live symbiotically within their
root nodules and fix atmospheric nitrogen in a form that can be used
by plants (Brewin, 2004). Within the Lathyrus genus, Lathyrus sativus
and L. cicera, the two species focus of this thesis, were described as
showing resistance to several legume pathogens, such as rust,
powdery mildew, ascochyta blight and crenate broomrape (Rubiales et
al., 2015).
Earlier investigations on the characterization of such resistance
mechanisms against rust (U. pisi) and powdery mildew (E. pisi) were
developed by an international collaboration between Portuguese and
Spanish teams (Vaz Patto et al., 2006; 2007; 2009; Vaz Patto and
Rubiales, 2009). In these studies, an Iberian L. sativus and L. cicera
germplasm collection was evaluated for disease resistance, both
macro- and microscopically. In both species the resistance against rust
and powdery mildew was due to a high frequency of early abortion of
the colonies, a reduction in the number of haustoria per colony and the
reduction in the intercellular growth of infection hyphae. These
phenotypes are typical examples of pre-haustorial resistance with no
associated necrosis (Vaz Patto and Rubiales, 2014).

Chapter 7 ___________________________________________________________________
220
Studies on Ascochyta lathyri resistance in these species are
scarce. Previous studies regarding ascochyta blight in Lathyrus spp.
were performed using the pea pathogen Didymella pinodes (Gurung et
al., 2002; Skiba et al., 2004b; a; 2005). Lathyrus spp., were shown to
be significantly more resistant to ascochyta blight than pea, and
therefore, findings in these underused species are valuable also to be
transferred to close related, economically important crops like pea.
The work described on the present thesis aims to deepen the
understanding of the genetics and defence mechanisms, of two
Lathyrus spp., to three of the most important foliar diseases in legumes
(Rubiales et al., 2015). With that purpose we analysed contrasting
genotypes of both L. sativus and L. cicera in what concerns their
infection reaction to rust and powdery mildew, and a resistant L. sativus
genotype reaction against ascochyta blight. Due to their genetic
closeness to other cool season grain legumes, Lathyrus species may
share genes, physiological processes and defence mechanisms.
Therefore, this knowledge will be useful to several other legume
species. Another outcome of this work was the development of new
molecular tools, such as the RNA-Seq libraries important for the
transcriptome analysis and the development of molecular markers; the
development of the first linkage map for L. cicera and the subsequent
use of this map to locate rust and powdery mildew resistance QTLs.
These new resources will facilitate future research, allowing performing
precision breeding on these species, advancing them into the “omics”
era.

General discussion ___________________________________________________________________
221
7.2. Molecular marker development
The first attempt, in this PhD thesis, to obtain molecular
markers for Lathyrus spp. was the cross amplification of microsatellites
(SSR), intron-targeted amplified polymorphism (ITAP) markers,
defence related (DR) genes and resistance gene analogs (RGA) from
related legume species (Chapter 2). These markers were tested in our
segregating populations L. sativus and L. cicera parental lines with
different objectives:
1) Access the transferability of the different markers.
2) Test their use for diversity studies.
3) Identify markers suitable for mapping the segregant progenies
and for legume species synteny studies.
Regarding transferability, pea EST-SSRs were significantly
more transferable than pea gSSRs. This is not surprising, due to their
intrinsic nature. EST-SSRs are exclusively located in coding regions,
the more conserved regions of the genome, and gSSRs are distributed
indiscriminately throughout the genome, spanning also non-coding
regions.
The transferability of the other markers used (ITAP, DR, RGA)
was high, mainly because their primers target exons. In the case of the
ITAPs their primer pairs flanks intronic regions. This aspect is important
for developing polymorphic markers, since in this way, the primer
region is conserved, but the region amplified might be more diverse
due to its non-coding nature.
This first strategy revealed to be inefficient for one of this thesis
main purpose, which was to obtain a large number of cross-species
amplified molecular markers useful for genetic mapping of our L.
sativus and L. cicera RIL populations. In total, the amplification of

Chapter 7 ___________________________________________________________________
222
heterologous markers in the L. cicera parental lines yielded only five
polymorphic ITAP markers. Despite this, a satisfactory amount of
markers were obtained for diversity studies in our Lathyrus spp. Iberian
collection. This study in particular clearly separated the two species (L.
sativus and L. cicera) and most of the individuals within each species.
New attempts for the development of molecular markers were
later performed profiting from the L. sativus and L. cicera transcriptomic
studies of the differential expression upon inoculation with rust. Several
EST-SSRs and single nucleotide polymorphism (SNP) markers were
developed by this approach, specifically for those species (Chapters 3
and 5). Since different cDNA libraries were created for each genotype
separately, allowing comparison between them, this marker
development was targeted for polymorphic sites, increasing the
probability of obtaining polymorphic markers very useful for diversity
and mapping studies has demonstrated by the inclusion of 29 from the
57 tested EST-SSR on the first L. cicera linkage map developed on
Chapter 6 . As expected, this RNA-Seq based molecular marker
development proved to be much more efficient than the cross-species
amplification, since about 60% of the predicted EST-SSRs were
experimentally confirmed to be polymorphic in the same parental
genotypes, and suitable for mapping. However, approximately 13% of
the developed markers were monomorphic between the parental
genotypes. These markers were not useful for the previous mapping
purposes, but may be suitable for diversity studies or linkage mapping
in more diverse germplasm.
Also with our RNA-Seq data, we compared homolog transcripts
from the parental genotypes to search for SNPs. A set of 768 predicted
homozygous SNPs were then used for mapping the L. cicera RILs
(Chapter 6). From those, 399 SNPs were suitable to screen the RIL

General discussion ___________________________________________________________________
223
population (amplified and were polymorphic between the parental
lines), in order to saturate their linkage map. These SNPs were chosen
taking in account their homology with the Medicago truncatula genome.
This allowed that after the development of the L. cicera linkage map, it
was possible to perform comparative studies between these species
(L. cicera and M. truncatula).
7.3. Development of the first Lathyrus cicera linkage map
In order to increase the available molecular tools to L. cicera,
we developed the first linkage map for this species, based on a
recombinant inbred line (RIL) population (Chapter 6). To achieve this
goal, the already described set of new molecular markers proven
polymorphic between the two parental lines, were screened on the
mapping RIL population. Excluding highly distorted and cosegregating
markers, the final map was constituted by 258 molecular markers,
distributed along 11 linkage maps, with an average marker density of
2.93 cM/marker.
The development of this molecular tool provides new
opportunities for genetic studies in L. cicera, like quantitative trait loci
(QTL) mapping or comparative mapping to other species. However,
before that there are still improvements that can be performed in this
linkage map. Many of the EST-SSRs described in this thesis (Chapter
5), where developed after the construction of the linkage map (Chapter
6), and are not yet included in the map. Their inclusion in this map
would increase the marker density and contribute to the ultimate goal
to reduce the difference from the obtained number of linkage groups in
the linkage map and the actual number of L. cicera chromosomes. In
addition, a more dense linkage map will allow a more precise QTL/gene

Chapter 7 ___________________________________________________________________
224
mapping. This linkage map will be also useful for further comparative
mapping with other species, using the same approach followed as in
the comparative mapping to M. truncatula described in Chapter 6. In
that analysis, by comparing the relative position of the L. cicera
markers to the homologs in the M. truncatula genome, it was possible
to observe that the macrosyntenic organization of the genomes is
similar, despite L. cicera’s genome size (6.8 Gbp) being 14x bigger
than M. truncatula (465 Mbp). Extensive macrosynteny was also
observed in previous studies in the Fabaceae tribe such as when
comparing M. truncatula to P. sativum (Aubert et al., 2006) and other
closely related legumes comparison such as M. truncatula and M.
sativa (Choi et al., 2004), L. culinaris and M. truncatula (Phan et al.,
2007) and L. culinaris and P. sativum (Weeden et al., 1992). In other
study comparing the synteny between M. sativa and P. sativum (Kaló
et al., 2004), one rearrangement event, similar to the observed in the
comparison between L. cicera and M. truncatula, was observed. In L.
cicera, a linkage group (LG IV) was spanning chromosomes 2 and 6 in
M. truncatula. Similarly in Kalo et al. (2004), P. sativum’s LG IV was
found homolog to M. sativa’s LG 2 and LG 6. This suggested that
chromosomal fission/fusion events involving M. truncatula
chromosome 6 an d 2 might be responsible for the reduction of
chromosome number between M. truncatula/M. sativa (n=8) and L.
cicera/P. sativum (n=7).
7.4. Lathyrus spp. response to Uromyces pisi inoculation
In order to understand the genetic basis of resistance to rust in
Lathyrus spp., the RNA-Seq libraries from rust inoculated L. sativus
and L. cicera were analysed in Chapter 3 and Chapter 5 respectively,

General discussion ___________________________________________________________________
225
complemented with a rust resistance QTL mapping analysis performed
for L. cicera in Chapter 6.
Lathyrus sativus differential response to U. pisi inoculation,
between the studied resistant (DS=9%) and partially resistant
(DS=30%) genotypes, seems to be related to the expression of MLO
and MLO-related genes. Mlo interacts with calmodulin to negatively
regulate plant defence and promote susceptibility to powdery mildew
(Kim et al., 2002). From the 12 differentially expressed MLO transcripts
identified between control and inoculated plants, only one was down-
regulated, and only in the resistant L. sativus genotype upon
inoculation. Since the loss of function of MLO is related to the
thickening of the cell wall at penetration sites (Jørgensen, 1992), this
may be a common mechanism in the plant defence against powdery
mildew and rust. Additionally, emphasizing the importance of the
straightening of the cell wall in rust resistance, three transcripts
involved in cellulose biogenesis showed a higher up-regulation in the
resistant L. sativus genotype than in the susceptible one. Related to
defence response induced by phytohormones, transcripts identified as
being involved in the salicylic acid pathway had a contrasting
expression profile upon inoculation, with genes up-regulated in the
partially resistant L. sativus genotype, and down-regulated in the
susceptible L. sativus genotype. These identified genes are good
candidates for future gene expression studies in order to validate their
roles in L. sativus partial resistance to rust.
The studied L. cicera genotypes depicted a lower level of
resistance to rust when comparing to L. sativus, presenting a high
susceptible genotype (DS=80%) and a partially resistant genotype
(DS=36%). For this species, also a MLO-like transcript was found
down-regulated upon inoculation in the partially resistant genotype.
Chapter 7 ___________________________________________________________________
226
This transcript is homologous to A. thaliana’s AtMLO6 and P. sativum’s
PsMLO1, which are known to confer susceptibility to several fungal
pathogens in Arabidopsis (Chen et al., 2006) and to powdery mildew
in P. sativum (Humphry et al., 2011). Interestingly, this transcript is only
present in the RNA-Seq library of the most susceptible L. sativus
genotype. Several hypotheses could explain its absence on the partial
resistant genotype. The gene could be absent from the transcriptome,
caused by a deletion or major mutation event that altered significantly
the sequence in the gene region. Other cause could be technical, and
despite the enrichment steps is the RNA-Seq library preparation prior
to sequencing, the expression levels of this transcript might have been
so low that could not be detected.
Other genes that can be involved in the contrasting resistance
levels between the studied L. cicera genotypes, are genes involved in
plant cell wall degradation signalling response through damage-
associated molecular patterns (DAMPs) (Boller and Felix, 2009). QTL
mapping for rust resistance (Chapter 6) identified 2 QTLs in linkage
group II, together explaining 27% of the phenotypic variation. This
supports the polygenic nature of the observed resistance, where only
the larger QTLs can be detected, but explaining a small percentage of
phenotypic variation. The remaining phenotypic variation is induced by
small QTLs that were below the detection thresholds. Under those
identified QTL regions only one marker could be functionally
annotated. This was a protein involved in the protein trafficking
between the endoplasmic reticulum (ER) and Golgi in Arabidopsis, the
“MAG2-interacting protein 3” (Li et al., 2013). The role of ER in defence
through protein trafficking and the formation of ER bodies specifically
in plant epidermal cells was already proposed (Hayashi et al., 2001;
Yamada et al., 2011). These bodies contain stress-inducible proteases

General discussion ___________________________________________________________________
227
that fuse with each other and with vacuoles during stress conditions. In
vacuoles the proteases become active and are discharged to the
intracellular space in order to inhibit pathogen development and induce
cell death in surrounding cells (Hatsugai et al., 2009).
7.5. Powdery mildew resistance in Lathyrus cicera
As reviewed by Rubiales et al. (2009), so far identified
resistance genes to E. pisi in P. sativum consists of only three genes,
two recessive (er1 and er2) and one dominant (Er3). Genes er1 and
er2 resistance response depends on the environment, displaying
complete or incomplete resistance, while Er3 confers always complete
resistance. Histological analyses after inoculation of pea genotypes
carrying er1, er2 or Er3 genes, showed that these genes influence
different stages of the fungal infection process, from a decrease ability
of the fungus to penetrate the host cell wall, to a post-penetration cell
death response (or hypersensitive response, HR), which results in the
collapse of young fungal colonies (Fondevilla et al., 2005; Fondevilla
et al., 2007).
Gene er1 was identified as PsMLO1 (Humphry et al., 2011),
that depending on the environment may confer complete or incomplete
resistance to powdery mildew (reviewed by Rubiales et al.(2009)).
Several er1 homologous sequences are found in the M. truncatula
genome, being one of them located in the central region of the
chromosome 4. From our synteny study, this region corresponds to the
L. cicera linkage group II region where the QTLs for powdery mildew
and rust resistance were identified.
Co-located with the identified L. cicera powdery mildew
resistance QTL, now by direct map analysis, two candidate genes for

Chapter 7 ___________________________________________________________________
228
resistance were identified (Chapter 6). One of these genes is the
“protein trichome birefringence”, described as being involved in
cellulose biosynthesis in Arabidopsis thaliana (Bischoff et al., 2010).
Alterations in cellulose synthesis can be monitored by the cell,
activating a cascade of signalling events that triggers lignification and
defence responses (Caño-Delgado et al., 2003). This can be somehow
related with the er1 function, since in pea (Fondevilla et al., 2006;
Humphry et al., 2011), barley (Buschges et al., 1997), Arabidopsis
(Consonni et al., 2006) and tomato (Bai et al., 2008), er1 is associated
with the fungus being unable to penetrate the host cells. The other co-
located gene is the “dihydroorotase”. This enzyme is involved in the
pirimidine metabolism (Giermann et al., 2002), that, in its turn, is
involved in the production of secondary metabolites (Brown and Turan,
1995). Many of the secondary metabolites have antimicrobial
properties, being involved in the inhibition of hyphae growth, which can
explain the restriction of haustoria formation with high percentage of
early aborted colonies and reduction of intercellular growth of infection
hyphae observed in many L. cicera genotypes upon inoculation with U.
pisi (Vaz Patto et al., 2009).
7.6. Lathyrus sativus response to Ascochyta lathyri inoculation
In order to investigate the molecular resistance response of a
L. sativus genotype to A. lathyri inoculation, we analysed its
transcriptome 24h after inoculation, by deepSuperSAGE. This
technique sequence a 26bp tag from each transcript, allowing the
quantification of the whole transcriptome using reduced sequencing
resources. The RNA-Seq library developed in the scope of this thesis
(Chapter 5) was crucial to annotate the generated 26bp tags, since the
annotation of those tags using only homologous sequences from other

General discussion ___________________________________________________________________
229
species present in the public databases produced a low number of
significant BLAST hits.
One important factor of virulence in a necrotroph, as Ascochyta
spp., is the ability of induce cell death. No macroscopic necrotic lesions
were observed 15 d.a.i., which was in accordance to the transcriptomic
data. The only transcript identified as been involved in ROS production
was a peroxidase, but was down-regulated upon inoculation, and
several detoxification agents, such as glutathione S-transferase, and a
precursor of the carotenoids synthesis pathway, were found up-
regulated upon inoculation. Since no HR response was evident, we
conclude that the resistance of our L. sativus genotype BGE015746 to
ascochyta is quantitative rather than qualitative, as it has been reported
in other legume species such as pea (Carrillo et al., 2013), lentil (Tullu
et al., 2006), faba bean (Rubiales et al., 2012) and chickpea (Hamwieh
et al., 2013) and represents a potentially lasting source of resistance
to ascochyta blight (Rubiales et al., 2015).
7.7. Future research and practical applications
Profiting from the molecular tools developed under this PhD
thesis, further studies can be planned on L. sativus and L. cicera in
order to increase information on those crops, and share knowledge
with related legume species. These novel molecular tools can be used
for diversity studies, to study the genetic basis of other interesting
(complex or not) agronomic traits and supporting future precision
breeding activities.
For diversity studies, the molecular markers can be used to
clarify the relation among genotypes from different domestication
centres, useful information to increase the genetic variability in
Chapter 7 ___________________________________________________________________
230
Lathyrus spp. breeding. The study of a diverse germplasm collection
will also enable association mapping studies. The already developed
L. cicera linkage map can be further improved by including the
remaining EST-SSRs developed, saturating the map in order to link
linkage groups belonging to the same chromosome and increase the
precision of QTL/gene location. With this linkage map and respective
RIL population, it will be also possible to study the genetic basis of
other important agronomical traits. For that the parental genotypes
could be evaluated, to search for contrasting phenotypes for interesting
agronomic traits, such as biotic/abiotic stress responses, ODAP
content, yield and plant architecture. Also other linkage maps for
Lathyrus spp. could be developed with these markers, using other
segregating populations (RILs or F2:3), such as L. sativus RILs
segregating for ODAP content, that is currently being developed by our
colleagues at IAS-CSIC, Spain.
The obtained linkage map can be used to perform comparative
mapping with other legume and non-legume species in order to share
knowledge on similar molecular mechanisms conserved among
species. This would be important especially for P. sativum which is the
closest legume species to Lathyrus spp. and whose genome is
predicted to be available in 2016.
The vast array of novel, resistance-related genomic information
presented in this thesis provides a highly valuable resource for future
smart breeding approaches in these previously under-researched,
valuable legume crops.

General discussion ___________________________________________________________________
231
7.8. References Aubert, G., Morin, J., Jacquin, F., Loridon, K., Quillet, M.C., Petit, A.,
Rameau, C., Lejeune-Henaut, I., Huguet, T., and Burstin, J. (2006). Functional mapping in pea, as an aid to the candidate gene selection and for investigating synteny with the model legume Medicago truncatula. Theoretical and Applied Genetics 112, 1024-1041.
Bai, Y., Pavan, S., Zheng, Z., Zappel, N.F., Reinstadler, A., Lotti, C., De Giovanni, C., Ricciardi, L., Lindhout, P., Visser, R., Theres, K., and Panstruga, R. (2008). Naturally occurring broad-spectrum powdery mildew resistance in a Central American tomato accession is caused by loss of mlo function. Molecular Plant-Microbe Interactions 21, 30-39.
Bischoff, V., Nita, S., Neumetzler, L., Schindelasch, D., Urbain, A., Eshed, R., Persson, S., Delmer, D., and Scheible, W.-R. (2010). TRICHOME BIREFRINGENCE and its homolog AT5G01360 encode plant-specific DUF231 proteins required for cellulose biosynthesis in Arabidopsis. Plant Physiology 153, 590-602.
Boller, T., and Felix, G. (2009). A Renaissance of elicitors: Perception of microbe-associated molecular patterns and danger signals by pattern-recognition receptors. Annual Review of Plant Biology 60, 379-406.
Brewin, N.J. (2004). Plant cell wall remodelling in the rhizobium–legume symbiosis. Critical Reviews in Plant Sciences 23, 293-316.
Brown, E.G., and Turan, Y. (1995). Pyrimidine metabolism and secondary product formation - biogenesis of albizziine, 4-hydroxyhomoarginine and 2,3-diaminopropanoic Acid. Phytochemistry 40, 763-771.
Buschges, R., Hollricher, K., Panstruga, R., Simons, G., Wolter, M., Frijters, A., Van Daelen, R., Van Der Lee, T., Diergaarde, P., Groenendijk, J., Topsch, S., Vos, P., Salamini, F., and Schulze-Lefert, P. (1997). The barley Mlo gene: a novel control element of plant pathogen resistance. Cell 88, 695-705.
Campbell, C.G. (1997). Promoting the conservation and use of underutilized and neglected crops. Grass pea. Lathyrus sativus L. Rome, Italy: International Plant Genetic Resources Institute.
Caño-Delgado, A., Penfield, S., Smith, C., Catley, M., and Bevan, M. (2003). Reduced cellulose synthesis invokes lignification and defense responses in Arabidopsis thaliana. The Plant Journal 34, 351-362.
Carrillo, E., Rubiales, D., Perez-De-Luque, A., and Fondevilla, S. (2013). Characterization of mechanisms of resistance against

Chapter 7 ___________________________________________________________________
232
Didymella pinodes in Pisum spp. European Journal of Plant Pathology 135, 761-769.
Chen, Z., Hartmann, H.A., Wu, M.-J., Friedman, E., Chen, J.-G., Pulley, M., Schulze-Lefert, P., Panstruga, R., and Jones, A. (2006). Expression analysis of the AtMLO gene family encoding plant-specific seven-transmembrane domain proteins. Plant Molecular Biology 60, 583-597.
Choi, H.-K., Kim, D., Uhm, T., Limpens, E., Lim, H., Mun, J.-H., Kalo, P., Penmetsa, R.V., Seres, A., Kulikova, O., Roe, B.A., Bisseling, T., Kiss, G.B., and Cook, D.R. (2004). A sequence-based genetic map of Medicago truncatula and comparison of marker colinearity with M. sativa. Genetics 166, 1463-1502.
Consonni, C., Humphry, M.E., Hartmann, H.A., Livaja, M., Durner, J., Westphal, L., Vogel, J., Lipka, V., Kemmerling, B., Schulze-Lefert, P., Somerville, S.C., and Panstruga, R. (2006). Conserved requirement for a plant host cell protein in powdery mildew pathogenesis. Nature Genetics 38, 716-720.
Fondevilla, S., Avila, C.M., Cubero, J.I., and Rubiales, D. (2005). Response to Mycosphaerella pinodes in a germplasm collection of Pisum spp. Plant Breeding 124, 313-315.
Fondevilla, S., Carver, T.L.W., Moreno, M.T., and Rubiales, D. (2006). Macroscopic and histological characterisation of genes er1 and er2 for powdery mildew resistance in pea. European Journal of Plant Pathology 115, 309-321.
Fondevilla, S., Torres, A.M., Iacute, Moreno, M., A, T., and Rubiales, D. (2007). Identification of a new gene for resistance to powdery mildew in Pisum fulvum, a wild relative of pea. Breeding Science 57, 181-184.
Giermann, N., Schröder, M., Ritter, T., and Zrenner, R. (2002). Molecular analysis of de novo pyrimidine synthesis in solanaceous species. Plant Molecular Biology 50, 393-403.
Gurung, A.M., Pang, E.C.K., and Taylor, P.W.J. (2002). Examination of Pisum and Lathyrus species as sources of ascochyta blight resistance for field pea (Pisum sativum). Australasian Plant Pathology 31, 41-45.
Hamwieh, A., Imtiaz, M., Hobson, K., and Ahmed Kemal, S. (2013). Genetic diversity of microsatellite alleles located at quantitative resistance loci for ascochyta blight resistance in a global collection of chickpea germplasm. Phytopathologia Mediterranea 52, 183-191.
Hanbury, C.D., White, C.L., Mullan, B.P., and Siddique, K.H.M. (2000). A review of the potential of Lathyrus sativus L. and L. cicera L. grain for use as animal feed. Animal Feed Science and Technology 87, 1-27.

General discussion ___________________________________________________________________
233
Hatsugai, N., Iwasaki, S., Tamura, K., Kondo, M., Fuji, K., Ogasawara, K., Nishimura, M., and Hara-Nishimura, I. (2009). A novel membrane fusion-mediated plant immunity against bacterial pathogens. Genes & Development 23, 2496-2506.
Hayashi, Y., Yamada, K., Shimada, T., Matsushima, R., Nishizawa, N.K., Nishimura, M., and Hara-Nishimura, I. (2001). A proteinase-storing body that prepares for cell death or stresses in the epidermal cells of Arabidopsis. Plant and Cell Physiology 42, 894-899.
Humphry, M., Reinstadler, A., Ivanov, S., Bisseling, T., and Panstruga, R. (2011). Durable broad-spectrum powdery mildew resistance in pea er1 plants is conferred by natural loss-of-function mutations in PsMLO1. Molecular Plant Pathology 12, 866-878.
Jørgensen, I.H. (1992). Discovery, characterization and exploitation of Mlo powdery mildew resistance in barley. Euphytica 63, 141-152.
Kaló, P., Seres, A., Taylor, S.A., Jakab, J., Kevei, Z., Kereszt, A., Endre, G., Ellis, T.H.N., and Kiss, G.B. (2004). Comparative mapping between Medicago sativa and Pisum sativum. Molecular Genetics and Genomics 272, 235-246.
Kim, M.C., Panstruga, R., Elliott, C., Muller, J., Devoto, A., Yoon, H.W., Park, H.C., Cho, M.J., and Schulze-Lefert, P. (2002). Calmodulin interacts with MLO protein to regulate defence against mildew in barley. Nature 416, 447-451.
Li, L., Shimada, T., Takahashi, H., Koumoto, Y., Shirakawa, M., Takagi, J., Zhao, X., Tu, B., Jin, H., Shen, Z., Han, B., Jia, M., Kondo, M., Nishimura, M., and Hara-Nishimura, I. (2013). MAG2 and three MAG2-INTERACTING PROTEINs form an ER-localized complex to facilitate storage protein transport in Arabidopsis thaliana. The Plant Journal 76, 781-791.
Phan, H.T.T., Ellwood, S.R., Hane, J.K., Ford, R., Materne, M., and Oliver, R.P. (2007). Extensive macrosynteny between Medicago truncatula and Lens culinaris ssp. culinaris. Theoretical and Applied Genetics 114, 549-558.
Rubiales, D., Avila, C.M., Sillero, J.C., Hybl, M., Narits, L., Sass, O., and Flores, F. (2012). Identification and multi-environment validation of resistance to Ascochyta fabae in faba bean (Vicia faba). Field Crops Research 126, 165-170.
Rubiales, D., Fernández-Aparicio, M., Moral, A., Barilli, E., Sillero, J.C., and Fondevilla, S. (2009). Disease resistance in pea (Pisum sativum L.) types for autumn sowings in Mediterranean environments. Czech Journal of Genetics and Plant Breeding 45, 135-142.

Chapter 7 ___________________________________________________________________
234
Rubiales, D., Fondevilla, S., Chen, W., Gentzbittel, L., Higgins, T.J.V., Castillejo, M.A., Singh, K.B., and Rispail, N. (2015). Achievements and challenges in legume breeding for pest and disease resistance. Critical Reviews in Plant Sciences 34, 195-236.
Skiba, B., Ford, R., and Pang, E.C.K. (2004a). Construction of a linkage map based on a Lathyrus sativus backcross population and preliminary investigation of QTLs associated with resistance to ascochyta blight. Theoretical and Applied Genetics 109, 1726-1735.
Skiba, B., Ford, R., and Pang, E.C.K. (2004b). Genetics of resistance to Mycosphaerella pinodes in Lathyrus sativus. Australian Journal of Agricultural Research 55, 953–960.
Skiba, B., Ford, R., and Pang, E.C.K. (2005). Construction of a cDNA library of Lathyrus sativus inoculated with Mycosphaerella pinodes and the expression of potential defence-related expressed sequence tags (ESTs). Physiological and Molecular Plant Pathology 66, 55-67.
Tullu, A., Tar'an, B., Breitkreutz, C., Banniza, S., Warkentin, T.D., Vandenberg, A., and Buchwaldt, L. (2006). A quantitative-trait locus for resistance to ascochyta blight [Ascochyta lentis] maps close to a gene for resistance to anthracnose [Colletotrichum truncatum] in lentil. Canadian Journal of Plant Pathology 28, 588-595.
Vaz Patto, M.C., Fernández-Aparicio, M., Moral, A., and Rubiales, D. (2006). Characterization of resistance to powdery mildew (Erysiphe pisi) in a germplasm collection of Lathyrus sativus. Plant Breeding 125, 308-310.
Vaz Patto, M.C., Fernández-Aparicio, M., Moral, A., and Rubiales, D. (2007). Resistance reaction to powdery mildew (Erysiphe pisi) in a germplasm collection of Lathyrus cicera from Iberian origin. Genetic Resources and Crop Evolution 54, 1517-1521.
Vaz Patto, M.C., Fernández-Aparicio, M., Moral, A., and Rubiales, D. (2009). Pre and posthaustorial resistance to rusts in Lathyrus cicera L. Euphytica 165, 27-34.
Vaz Patto, M.C., and Rubiales, D. (2009). Identification and characterization of partial resistance to rust in a germplasm collection of Lathyrus sativus L. Plant Breeding 128, 495-500.
Vaz Patto, M.C., and Rubiales, D. (2014). Resistance to rust and powdery mildew in Lathyrus crops. Czech Journal of Genetics and Plant Breeding 50, 116-122.
Weeden, N.F., Muehlbauer, F.J., and Ladizinsky, G. (1992). Extensive conservation of linkage relationships between pea and lentil genetic maps. Journal of Heredity 83, 123-129.

General discussion ___________________________________________________________________
235
Yamada, K., Hara-Nishimura, I., and Nishimura, M. (2011). Unique defense strategy by the endoplasmic reticulum body in plants. Plant and Cell Physiology 52, 2039-2049.