Alloy Design and Development of Advanced Materials Based ...
13
Alloy Design and Development of Advanced Materials Based on Phase Diagrams and Microstructural Control K. Ishida + Department of Materials Science, Graduate School of Engineering, Tohoku University, Sendai 980-8579, Japan Recent progress in the development of advanced materials based on the study of CALPHAD approach to the phase diagrams and microstructural control is presented. Thermodynamic databases on the Fe-S based system, Fe-Mn-Al based alloys, Cu-based alloys and Co- based superalloys have been constructed. By utilizing these databases and information on phase diagrams, the following advanced materials have been designed and developed; (i) Schaeffler-type Ti-based alloys, (ii) Pb-free machinable stainless steels using titanium carbosulphide, (iii) high strength Fe-Mn based alloys with low density, (iv) FSW (Friction Stir Welding) tool using Co-based superalloy strengthened by £ A (Co 3 (Al, W)) phase, (v) Ni based metamagnetic shape memory alloys, (vi) Cu-Ni-Al based alloys with high strength and high electronic conductivity strengthened by £ A (Ni 3 Al) phase, and (vii) Ingrown nail correcting device and seismic application using Cu-Al-Mn based shape memory alloys. The alloy design and practical application of these materials focussing on the use of phase diagrams have been presented. [doi:10.2320/matertrans.MT-M2019362] (Received December 10, 2019; Accepted February 12, 2020; Published March 23, 2020) Keywords: thermodynamic database, CALPHAD, practical applications, lead-free machinable steels, Fe-Mn based alloys, Heusler alloys, Cu based shape memory alloys, Cu-based alloy with high strength and high electronic conductivity, Co-based superalloys 1. Introduction Recent advances on ICMD (Integrated Computational Materials Design) have produced new approaches on simulation modelings, databases, computational methods etc. particularly since MG (Materials Genome) has been started in USA. 1) In the MG, CALPHAD (Calculation of Phase Diagrams) plays vital important role in the alloy design and alloy development. As pointed out by Kaufman and Agren, 2) CALPHAD database and accompanying software are the major part of the MG. The CALPHAD method is technique by which a variety of experimental values concerning phase boundaries and thermodynamic properties are analyzed according to an appropriate thermodynamic model and the interaction energies between atoms are evaluated. Phase diagrams outside the experimental range can be calculated based on thermodynamic proof according to this method. Table 1 shows the thermodynamic databases for various alloy systems such as Fe, Ni, Ti, Al, Mg-based alloys, ceramics systems and alloy semiconductors, 3) which have been developed based on experimental data of thermodynamic properties and phase equilibria. In the thermodynamic assessments, not only experimental data but also first principle calculations have also been applied. Although it has been recognized that CALPHAD approach is powerful engineering tool, the specific examples for the industrial application have been reported in limited cases. In this paper, the use of thermodynamic databases and CALPHAD method to the alloy design and alloy develop- ment in relation to the microstructural control is presented. 2. Alloy Design of Ti-Based Alloys The prediction of the phase constituent from the composition is one of the fundamental aspects for alloy design. The Schaeffler diagram 4) as shown in Fig. 1 is well known to be utilized for the alloy design of stainless steels, where Cr and Ni equivalents are introduced. The coefficients of alloying elements compared with Cr or Ni are empirically estimated. A similar situation of bcc/fcc phase stability of Cu-based alloys has been proposed by using Zn equiv- alent. 5,6) In the Ti-based alloys, Al and Mo equivalents which are typical ¡ (hcp) and ¢ (bcc) forming elements, respectively, have been used in the alloy design. 7,8) Recently, the author proposed the thermodynamic definition of Al eq and Mo eq , where Al eq is defined by the ratio of partial molar free energy changes transfer for one mole of each ¡ forming element and Al, from a dilute solution of ¡ phase to ¢ phase, while Mo eq is also deduced by similar thermodynamic quantities of ¢ forming elements and Mo. Al eq and Mo eq are estimated from the thermodynamic parameters assessed by Kaufman 9-12) and Murray. 13) The recommended values of Al eq and Mo eq can be expressed by the following equations. 14) Al eq ¼ Al þ 0:14Ag þ 19:97C þ 1:05Ce þ 1:08Er þ 0:12Gd þ 0:15Ga þ 0:83Ge þ 0:84La þ 24:76N þ 0:89Nd þ 7:68O þ 0:05Sc þ 0:00Sn ð1Þ Mo eq ¼ Mo þ 0:26Au þ 0:43Bi þ 12:62Be þ 2:93Co þ 1:65Cr þ 0:85Cu þ 4:17Fe þ 0:05Hf þ 0:17Mg þ 3:28Mn þ 0:64Nb þ 1:75Ni þ 0:23Os þ 0:71Pd þ 0:64Pt þ 0:29Pu þ 1:72Re þ 2:89 Rh þ 1:67Ru þ 0:97Si þ 0:23Ta þ 0:32U þ 0:80V þ 0:56W þ 1:13Y þ 0:16Zr ð2Þ Figure 2 shows the calculated ¡/¢ equilibrium of Ti-Al-Mo ternary system at 1073 K (800°C), where commercial Ti alloys are plotted using above Al eq and Mo eq . It can be seen that three types of Ti alloys, i.e., ¡ and near ¡, ¡ + ¢, and ¢ alloys, can be accurately classified by Al eq and Mo eq . It is emphasized that the previous values of Al eq and Mo eq equivalents are completely empirical values, while the + Corresponding author, E-mail: kiyohito.ishida.d2@tohoku.ac.jp Materials Transactions, Vol. 61, No. 5 (2020) pp. 807 to 819 © 2020 The Japan Institute of Metals and Materials OVERVIEW
-
Upload
khangminh22 -
Category
Documents
-
view
3 -
download
0
Transcript of Alloy Design and Development of Advanced Materials Based ...

Alloy Design and Development of Advanced Materials Based on Phase Diagrams andMicrostructural Control
K. Ishida+
Department of Materials Science, Graduate School of Engineering, Tohoku University, Sendai 980-8579, Japan
Recent progress in the development of advanced materials based on the study of CALPHAD approach to the phase diagrams andmicrostructural control is presented. Thermodynamic databases on the FeS based system, FeMnAl based alloys, Cu-based alloys and Co-based superalloys have been constructed. By utilizing these databases and information on phase diagrams, the following advanced materials havebeen designed and developed; (i) Schaeffler-type Ti-based alloys, (ii) Pb-free machinable stainless steels using titanium carbosulphide, (iii) highstrength FeMn based alloys with low density, (iv) FSW (Friction Stir Welding) tool using Co-based superalloy strengthened by £ A (Co3 (Al,W))phase, (v) Ni based metamagnetic shape memory alloys, (vi) CuNiAl based alloys with high strength and high electronic conductivitystrengthened by £ A (Ni3Al) phase, and (vii) Ingrown nail correcting device and seismic application using CuAlMn based shape memory alloys.The alloy design and practical application of these materials focussing on the use of phase diagrams have been presented.[doi:10.2320/matertrans.MT-M2019362]
(Received December 10, 2019; Accepted February 12, 2020; Published March 23, 2020)
Keywords: thermodynamic database, CALPHAD, practical applications, lead-free machinable steels, FeMn based alloys, Heusler alloys, Cubased shape memory alloys, Cu-based alloy with high strength and high electronic conductivity, Co-based superalloys
1. Introduction
Recent advances on ICMD (Integrated ComputationalMaterials Design) have produced new approaches onsimulation modelings, databases, computational methodsetc. particularly since MG (Materials Genome) has beenstarted in USA.1) In the MG, CALPHAD (Calculation ofPhase Diagrams) plays vital important role in the alloy designand alloy development. As pointed out by Kaufman andAgren,2) CALPHAD database and accompanying softwareare the major part of the MG. The CALPHAD method istechnique by which a variety of experimental valuesconcerning phase boundaries and thermodynamic propertiesare analyzed according to an appropriate thermodynamicmodel and the interaction energies between atoms areevaluated. Phase diagrams outside the experimental rangecan be calculated based on thermodynamic proof accordingto this method. Table 1 shows the thermodynamic databasesfor various alloy systems such as Fe, Ni, Ti, Al, Mg-basedalloys, ceramics systems and alloy semiconductors,3) whichhave been developed based on experimental data ofthermodynamic properties and phase equilibria. In thethermodynamic assessments, not only experimental data butalso first principle calculations have also been applied.Although it has been recognized that CALPHAD approachis powerful engineering tool, the specific examples for theindustrial application have been reported in limited cases.
In this paper, the use of thermodynamic databases andCALPHAD method to the alloy design and alloy develop-ment in relation to the microstructural control is presented.
2. Alloy Design of Ti-Based Alloys
The prediction of the phase constituent from thecomposition is one of the fundamental aspects for alloydesign. The Schaeffler diagram4) as shown in Fig. 1 is well
known to be utilized for the alloy design of stainless steels,where Cr and Ni equivalents are introduced. The coefficientsof alloying elements compared with Cr or Ni are empiricallyestimated. A similar situation of bcc/fcc phase stability ofCu-based alloys has been proposed by using Zn equiv-alent.5,6) In the Ti-based alloys, Al and Mo equivalents whichare typical ¡ (hcp) and ¢ (bcc) forming elements,respectively, have been used in the alloy design.7,8) Recently,the author proposed the thermodynamic definition of Aleq andMoeq, where Aleq is defined by the ratio of partial molar freeenergy changes transfer for one mole of each ¡ formingelement and Al, from a dilute solution of ¡ phase to ¢ phase,while Moeq is also deduced by similar thermodynamicquantities of ¢ forming elements and Mo. Aleq and Moeqare estimated from the thermodynamic parameters assessedby Kaufman912) and Murray.13) The recommended valuesof Aleq and Moeq can be expressed by the followingequations.14)
Aleq ¼ Alþ 0:14Agþ 19:97Cþ 1:05Ceþ 1:08Er
þ 0:12Gdþ 0:15Gaþ 0:83Geþ 0:84Laþ 24:76N
þ 0:89Ndþ 7:68Oþ 0:05Scþ 0:00Sn ð1ÞMoeq ¼ Moþ 0:26Auþ 0:43Biþ 12:62Beþ 2:93Co
þ 1:65Crþ 0:85Cuþ 4:17Feþ 0:05Hf
þ 0:17Mgþ 3:28Mnþ 0:64Nbþ 1:75Ni
þ 0:23Osþ 0:71Pdþ 0:64Ptþ 0:29Pu
þ 1:72Reþ 2:89 Rhþ 1:67Ruþ 0:97Si
þ 0:23Taþ 0:32Uþ 0:80Vþ 0:56Wþ 1:13Y
þ 0:16Zr ð2ÞFigure 2 shows the calculated ¡/¢ equilibrium of TiAlMoternary system at 1073K (800°C), where commercial Tialloys are plotted using above Aleq and Moeq. It can be seenthat three types of Ti alloys, i.e., ¡ and near ¡, ¡ + ¢, and ¢
alloys, can be accurately classified by Aleq and Moeq. It isemphasized that the previous values of Aleq and Moeqequivalents are completely empirical values, while the+Corresponding author, E-mail: [email protected]
Materials Transactions, Vol. 61, No. 5 (2020) pp. 807 to 819©2020 The Japan Institute of Metals and Materials OVERVIEW

present values are determined by CALPHAD approach. TheMs and ¢ transus temperatures can also be predicted by Aleqand Moeq.14) Therefore, the Aleq and Moeq expressed byeqs. (1) and (2) are very useful for alloy design, heattreatment and microstructural evolution of Ti-based alloys.
3. Alloy Design of Fe-Based Alloys
3.1 Alloy design and development of Pb-free machinablesteels
Various sulfides, which are formed in steels influencephysical, chemical, and mechanical properties. However,information on thermodynamic properties of sulfide are verylimited. Systematic studies have been performed on theexperimental determinations of phase equilibria and thermo-dynamic assessments of the various FeXS ternary systems,which results in the thermodynamic database on the FeCr
MnNiTiSCN system.15) A typical example for theexperimental determinations of solubility products of TiS andTiC0.5S0.5 by diffusion couple method is shown in Fig. 3.16)
A steel containing Pb has long been used as free-cuttingsteel, because it minimizes the negative effects on otherphysical and chemical properties of the steel. However, thetoxicity of Pb is a problem from the standpoint ofenvironmental protection. We have recently developed newtypes of Pb-free machinable stainless steels with dispersedtitanium carbo-sulfide,17,18) where thermodynamic databaseon sulfide in steel plays the vital role in alloy design. Figure 4shows the isothermal section diagram of Fe0.21Si0.7Mn16.5Cr0.55TiCS (mass%) alloy at 800°C.19) The shadedarea showing the three-phase region composed by ferrite(¡) + Ti4C2S2 + TiS is optimum field for containing suitableinclusion because other area contains detrimental phases suchas hard TiC or M23C6 and corrosive MnS. The developed
Fig. 1 Schaeffler diagram for stainless steels.
Table 1 Thermodynamic databases for various alloy systems.
K. Ishida808

stainless steel using Ti4C2S2 (trademark: TICS) shows notonly good machinability but also good corrosion resistanceand magnetic properties as shown in Fig. 5.
3.2 Alloy design and development of high strength steelswith low density
Recently, the development of high specific strength
(strength-to-density ratio) is strongly required in theautomotive industry for the reduction of the weight oftransport vehicles. In view of this alloy design, FeMnAlSiC based alloys are the candidates and thermodynamicdatabase for this alloy system has been constructed as shownin Table 1.20)
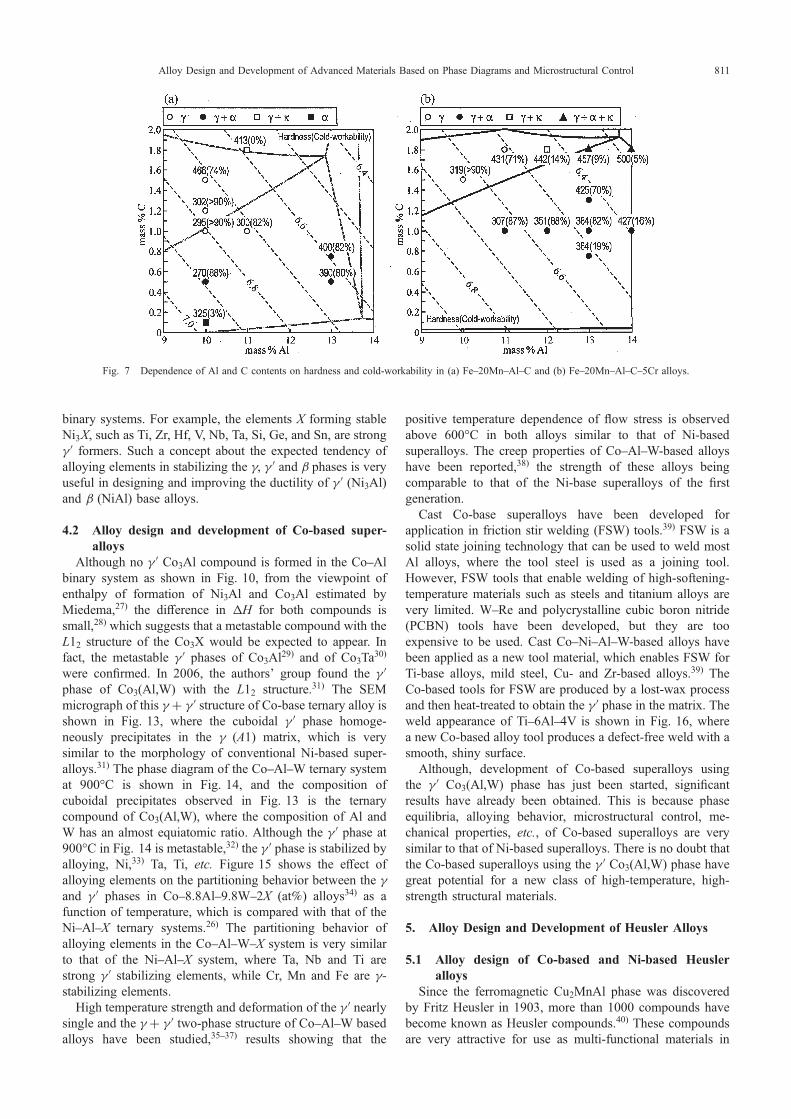
Figure 6 shows the calculated phase diagram of Fe20MnAlC quaternary system at 1100°C with iso-density contourlines,20) where the ¬ phase is the ternary carbide Fe3AlCxwith perovskite structure and x is round 0.66.21) Based on thecalculated phase diagrams of FeMnAlC quaternary andFeMnAlCCr quinary alloys, the alloy compositions wereselected to determine the dependence of Al and C contentson hardness and cold-workability of both alloys as shownin Fig. 7. Figures 8(a) and 8(b) show the typical stress-strain curves in FeMnAlC and FeMnAlCCr alloys,respectively. From Figs. 7 and 8, the Fe20Mn10Al(0.251.0) C alloys show that the cold-workability and tensileelongation drastically increase with increasing C contentbecause of the decrease in the volume fraction of the ¡Fe. Inthe Fe20MnAlC5Cr alloys the £Fe phase alloy showsthe excellent cold-workability and high strength with goodductility. It should be noted that the tensile properties ofFe20Mn10Al1.5C5Cr £ alloy depend on cooling rate.20)
The air-cooled specimen shows a much higher yield strengththan the water-quenched specimen, which is due to theprecipitation of nano-size ¬ phase with perovskite structureduring cooling.
Figure 9 shows the relationship between specific strengthand tensile elongation in various steels. It is seen that thepresent FeMnAlCCr alloys show a higher specificstrength than the conventional steels. For example, the Fe20Mn11Al1.8C5Cr alloy with a density of 6.51 g/cm3
showed high specific strength of more than 180MPa·cm3/gwith good tensile elongation of 40%. Moreover, the specificstrength of the present alloys is higher than that of FeMnSiAl TWIP steels.22)
Fig. 3 Solubility products of sulfide, carbide and nitride in steel.
Fig. 4 Calculated isothermal section diagram of Fe0.21Si0.70Mn16.5Cr0.55TiCS (mass%) alloy at 800°C.
Fig. 2 Schaeffler-type diagram for Ti-based alloys.
Alloy Design and Development of Advanced Materials Based on Phase Diagrams and Microstructural Control 809

4. Alloy Design of Ni-Based and Co-Based Alloys
4.1 Alloy design of Ni-based superalloysNi-based superalloys are widely used as high-temperature
materials in aircraft jet engines, gas turbines, reactors,
chemical industry, etc., where the £ A phase of Ni3Al withthe L12 structure plays a key role in maintaining strength athigher temperatures,23) while the strengthening mechanismutilized Co-base high temperature alloys is principally dueto the solid solution hardening with refractory element andcarbide precipitation.24) This difference in the strengtheningphase of Ni-based and Co-based alloys is due to the existenceof the £ A phase as shown in Fig. 10, where the stable £ A phaseof Ni3Al appears at up to 1395°C, while no Co3Al compoundis formed. The ¢ (NiAl, CoAl:B2) phase has been used forthe surface coating of Ni-base superalloys where ¢ phase isan Al reservoir for the protective Al2O3 layer formation onthe surface.25) Therefore, the data on phase equilibriainvolving the £ (A1), £ A (L12) and ¢ (B2) phases in theNiAl-base system are fundamentally important for thepractical design of Ni-based superalloys. Figure 11 showsthe isothermal phase diagrams relating to the £, £ A and ¢
phases in the NiAlX ternary systems,26) where the phaserelations can be classified into six categories depending onthe compositional range of £ A phase field and tie-linesbetween £, £ A and ¢ phases. The upper three of the diagramsin Fig. 11 show that the £ A phase field terminates at a certainextent of the solubility such as Mn, Cr, Fe, Co and Cu, whilelower three of the diagrams show that Ti, V, Ta, Mo, W and Sistabilize the £ A phase and that no direct £/¢ equilibrium isobtained. The partition behavior of alloying elements amongthe £, £ A and ¢ phases is shown in Fig. 12. The tendency forpartitioning among the £, £ A and ¢ phases is strongly relatedto the stability of Ni3X, NiX, and XAl compounds in the
Tool : WC-Base CarbideCutting Speed : 200 m/minFeed : 0.1 mmDepth of Cut : 1 mmCutting Length : 33 mLubricant : Water-soluble
TICS
250
200
150
100
50
0PbAddingSteel
SAddingSteel
(a)
(b)
Fig. 5 (a) Machinability of turning test and (b) Corrosion-resitance of salt spray test of TICS stainless steel.
0 20wt.%Al
10
10
wt.%C
5
0
7.5 7.0
6.5
6.0
5.5
Fig. 6 Calculated phase diagram of Fe20MnAlC system at 1100°Cwith estimated of iso-density contour lines.
K. Ishida810
binary systems. For example, the elements X forming stableNi3X, such as Ti, Zr, Hf, V, Nb, Ta, Si, Ge, and Sn, are strong£ A formers. Such a concept about the expected tendency ofalloying elements in stabilizing the £, £ A and ¢ phases is veryuseful in designing and improving the ductility of £ A (Ni3Al)and ¢ (NiAl) base alloys.
4.2 Alloy design and development of Co-based super-alloys
Although no £ A Co3Al compound is formed in the CoAlbinary system as shown in Fig. 10, from the viewpoint ofenthalpy of formation of Ni3Al and Co3Al estimated byMiedema,27) the difference in ¦H for both compounds issmall,28) which suggests that a metastable compound with theL12 structure of the Co3X would be expected to appear. Infact, the metastable £ A phases of Co3Al29) and of Co3Ta30)
were confirmed. In 2006, the authors’ group found the £ Aphase of Co3(Al,W) with the L12 structure.31) The SEMmicrograph of this £ + £ A structure of Co-base ternary alloy isshown in Fig. 13, where the cuboidal £ A phase homoge-neously precipitates in the £ (A1) matrix, which is verysimilar to the morphology of conventional Ni-based super-alloys.31) The phase diagram of the CoAlW ternary systemat 900°C is shown in Fig. 14, and the composition ofcuboidal precipitates observed in Fig. 13 is the ternarycompound of Co3(Al,W), where the composition of Al andW has an almost equiatomic ratio. Although the £ A phase at900°C in Fig. 14 is metastable,32) the £ A phase is stabilized byalloying, Ni,33) Ta, Ti, etc. Figure 15 shows the effect ofalloying elements on the partitioning behavior between the £and £ A phases in Co8.8Al9.8W2X (at%) alloys34) as afunction of temperature, which is compared with that of theNiAlX ternary systems.26) The partitioning behavior ofalloying elements in the CoAlWX system is very similarto that of the NiAlX system, where Ta, Nb and Ti arestrong £ A stabilizing elements, while Cr, Mn and Fe are £-stabilizing elements.
High temperature strength and deformation of the £ A nearlysingle and the £ + £ A two-phase structure of CoAlW basedalloys have been studied,3537) results showing that the
positive temperature dependence of flow stress is observedabove 600°C in both alloys similar to that of Ni-basedsuperalloys. The creep properties of CoAlW-based alloyshave been reported,38) the strength of these alloys beingcomparable to that of the Ni-base superalloys of the firstgeneration.
Cast Co-base superalloys have been developed forapplication in friction stir welding (FSW) tools.39) FSW is asolid state joining technology that can be used to weld mostAl alloys, where the tool steel is used as a joining tool.However, FSW tools that enable welding of high-softening-temperature materials such as steels and titanium alloys arevery limited. WRe and polycrystalline cubic boron nitride(PCBN) tools have been developed, but they are tooexpensive to be used. Cast CoNiAlW-based alloys havebeen applied as a new tool material, which enables FSW forTi-base alloys, mild steel, Cu- and Zr-based alloys.39) TheCo-based tools for FSW are produced by a lost-wax processand then heat-treated to obtain the £ A phase in the matrix. Theweld appearance of Ti6Al4V is shown in Fig. 16, wherea new Co-based alloy tool produces a defect-free weld with asmooth, shiny surface.
Although, development of Co-based superalloys usingthe £ A Co3(Al,W) phase has just been started, significantresults have already been obtained. This is because phaseequilibria, alloying behavior, microstructural control, me-chanical properties, etc., of Co-based superalloys are verysimilar to that of Ni-based superalloys. There is no doubt thatthe Co-based superalloys using the £ A Co3(Al,W) phase havegreat potential for a new class of high-temperature, high-strength structural materials.
5. Alloy Design and Development of Heusler Alloys
5.1 Alloy design of Co-based and Ni-based Heusleralloys
Since the ferromagnetic Cu2MnAl phase was discoveredby Fritz Heusler in 1903, more than 1000 compounds havebecome known as Heusler compounds.40) These compoundsare very attractive for use as multi-functional materials in
Fig. 7 Dependence of Al and C contents on hardness and cold-workability in (a) Fe20MnAlC and (b) Fe20MnAlC5Cr alloys.
Alloy Design and Development of Advanced Materials Based on Phase Diagrams and Microstructural Control 811

magnetic recording, superconductors, shape memory, ther-moelectrics, etc. The phase stability of Heusler compoundsis the basic information for the development of functionalmaterials. The present authors’ group has investigated thephase stability of Co-based and Ni-based Heusler com-pounds. Figure 17 shows the ordering and phase separationbetween the B2 and L21 (Heusler) phases in the X2AlTi(X = Fe, Co, Ni, Cu) compounds.41) Surprisingly, the phasestability, i.e., the maximum temperature of the B2/L21ordering (maxTcB2=L21 ), the tricritical temperature of a pointat which the order of the transition changes its character fromfirst to second order (T tB2=L21 ) and the phase boundaries ofmiscibility gap between B2 and L21 phases, can be predictedby the valence electron concentration of the X site atoms.Figure 18 shows the relation between the critical temper-atures and 3d + 4s electron concentration in the X site. Inthe similar way of Fig. 17, both maxTcB2=L21 and TtB2=L21 are
linearly dependent on the 3d+4s electron concentration.Figure 19 shows the TcB2=L21 and the Curie temperature Tcas a function of a number of valence electron of 3d in the Yelements in Co2YZ (Y = Ti, V, Cr, Mn, Fe and Z = Al, Ga)Heusler alloys.4143) Tc increases with the increase of N3d andthe values are not so different between the Al and Ga series.On the other hand, TtB2=L21 tends to indicate oppositebehavior to that of Tc, i.e., TtB2=L21 decreases with theincrease of N3d except for Y = Cr. Although the tendency ofTtB2=L21 as a function of N3d is similar with respect toone another, Z = Al and Ga, actual values of TtB2=L21 forZ = Ga are higher than that of the Z = Al series in whole.The Co-based Heusler alloys with higher values of TtB2=L21
are easier to order to the L21-type structure. This means thatthe confirmation of TtB2=L21 is very valuable to efficientlyheighten the degree of order by thermal annealing inindustrial processing and is a very important component inthe technology of spintronics.44)
5.2 Alloy design and development of Ni-based meta-magnetic shape memory alloys
Large magnetic-field-induced strains have been observedin Heusler alloys and have been explained as resulting fromthe rearrangement of martensite structural variants due to anexternal magnetic field.4547) We have reported some newferromagnetic shape memory alloys in the NiMnIn, NiMnSnand NiMnSb alloy systems.48) Figure 20 shows the magneticphase diagram, including the Ms and Af temperatures ofNi50Mn50yXy (X = In, Sn, Sb and y = 0³50) alloysystems.48) The Ms and Af temperatures decrease withincreasing In, Sn and Sb contents and the slopes in the Msand Af temperatures as a function of X content in the
Fig. 8 Stress-strain curves at room temperature in (a) FeMnAlC and(b) FeMnAlCCr alloys.
Fig. 9 Relation between specific strength and tensile elongation in varioussteels.
K. Ishida812

ferromagnetic state are larger than those in the paramagneticstate. This is because the T0 temperature (= (Ms + Af )/2) atwhich the parent and martensite phases are in equilibriumvaries with the magnetic contribution to the Gibbs energy.Especially in the NiMnIn system, the martensitic trans-formation temperatures in the ferromagnetic state drasticallydecrease with increasing In content. It is noted that the
(a) (b)
Fig. 10 Phase diagrams of (a) NiAl and (b) CoAl binary systems.
Fig. 12 Effect of alloying elements on the relative stability of the £, £ A(Ni3Al) and ¢ (NiAl) phases.
Fig. 13 TEM image of Co9Al7.5W (at%) alloy heat-treated at 900°C for72 hours.
Fig. 11 Classification of £/£ A/¢ phase equilibria in the NiAlX systems.
Fig. 14 Isothermal section phase diagrams of the CoAlW ternary systemin the Co-rich portion at 900°C.
Alloy Design and Development of Advanced Materials Based on Phase Diagrams and Microstructural Control 813

compositional dependence of the Curie temperatures Tc ofthe austenite phase is small, while the Tc of the martensitephase strongly depends on the alloy compositions anddrastically decreases with decreasing In, Sn and Sb contentsin all the systems. Although this different behavior of theCurie temperatures of austenite and martensite is not clear atpresent, the part of antiferromagnetic or ferrimagnetic statein the martensite may be concerned. In particular, in theNiMnIn alloy system, the compositional dependence of theTc temperature of the martensite phase is the largest of thosein the three alloy systems and the Tc of the martensite phase
in the Ni50Mn35In15 alloy is estimated to be below ¹200°C.Figure 21 shows the thermo-magnetization curves for the13.4 In alloy at magnetic field strengths of H = 0.5, 20 and70 kOe.49) During the initial heating in a magnetic field ofH = 0.5 kOe, the thermo-magnetization curve drasticallydecreased between 375K and 390K owing to the trans-formation from ferromagnetic (or ferrimagnetic) toparamagnetic in the parent phase, where the Curie temper-ature Tc was calculated to be Tc = 382K. The magnetism ofthe parent phase below Tc is considered to be ferromagneticrather than ferrimagnetic because the temperature depend-ence of the reciprocal susceptibility in the paramagnetic statefollows the normal Curie-Weiss law. After heating to 473K
Fig. 15 Effect of alloying elements on distribution coefficient between the£ and £ A phases in the CoAlWX systems.
Fig. 16 FSW appearance of Ti6Al4V alloy using a Co-base alloy tool.
Fig. 17 Composition of the calculated and experimentally obtained phase equilibria between the B2 and L21 phases at (a) 1573K,(b) 1473K, (c) 1373K and (d) 1273K.
K. Ishida814

followed by furnace cooling, the magnetization was cycli-cally measured at temperatures between 200K and 330K inmagnetic fields of H = 0.5, 20 and 70 kOe. The magnetiza-tion curve of 0.5 kOe declined suddenly at about 292K asa result of the martensitic transformation and entered asteady region with a very low magnetization on cooling.Furthermore, the magnetization drastically increased at about300K as a result of the reverse transformation with a smallthermal hysteresis of less than 10K on heating. Figure 22
shows the magnetization curves at several temperatures.While the curves at 200K and 320K exhibit typical non-magnetic and ferromagnetic M-H behavior, respectively, thecurves at 270K and 290K show a metamagnetic behaviorwith a large hysteresis with the magnetic field inducingreverse transformation from non-magnetic martensite tothe ferromagnetic parent phase.49,50) These results are inaccordance with the thermo-magnetization behavior shownin Fig. 21.
6. Alloy Design and Development of Cu-Based Alloys
6.1 Alloy design and development of high-strength andhigh-conductive CuNiAl based alloys
In the field of materials science, combinatorial techniques,for instance making use of a diffusion couple (DC) or triple(DT) samples, has been recognized as a powerful andeffective method for the determination of phase diagrams,including not only equilibrium compositions but alsotransition boundaries of martensite/austenite, ferro-/para-
Fig. 18 The critical temperatures of maxTcB2=L21 and TtB2=L21 evaluated byextrapolation from the experimental data as a function of 3d+4s electronnumber of Fe, Co, Ni and Cu.
Fig. 19 Order-disorder phase transition temperatures from L21 to B2 phase,TtB2=L21 and Curie temperature, TC, as a function of the number ofvalence electrons for 3d in Y elements for Co2YZ (Y = Ti, V, Cr, Mn, Feand Z = Al, Ga) alloys.
Fig. 20 Martensitic and magnetic transition temperatures of the (a)Ni50Mn50¹yIny, (b) Ni50Mn50¹ySny and (c) Ni50Mn50¹ySby alloys, wherePara and Ferro mean paramagnetic and ferromagnetic, respectively, and Aand M indicate the austenite and martensite, respectively.
Alloy Design and Development of Advanced Materials Based on Phase Diagrams and Microstructural Control 815

magnetic, order/disorder phases, etc., simultaneously in awide range of chemical composition.51) Here we would liketo show how the combinatorial technique was applied todevelop high-strength and high-conductive CuNiAl basedalloys.52) Figure 23 shows the isothermal section phasediagram of the CuNiAl ternary system at 500°C calculatedfrom the thermodynamic database, where the two-phaseregion of fcc (Cu) and L12 (Ni3Al) phases are predicted. Thistwo-phase region is expected to have high strength and highelectrical conductivity strengthened by Ni3Al precipitation.
To find the optimum compositions, the combinatorial methodwas used.
Ingots of pure Cu, Cu30Ni and Cu20Al (mass%) wereprepared by induction melting. Each ingot was cut into smallcubic pieces, the surfaces of which were mechanicallypolished to remove contaminated layers. Cubic samples ofCu and Cu30Ni were first diffusion bonded at 900°C for 1hour. The Cu/Cu30Ni diffusion couples and CuAl alloyswere diffusion bonded as the Cu/Cu30Ni interface wasaligned perpendicular to the bonded surface of the CuAlsamples. The prepared DT samples were heat-treated at1000°C for 60 days to obtain the solid solution fcc-(Cu)phase, in which considerable amounts of Ni and Al weresolved to form a wide range of chemical compositions in oneDT sample. After that, the solution-treated DT samples wereaged at 500°C for 6 to 18 hours to obtain a precipitatedmicrostructures, which can be predicted from the calculatedphase diagram shown in Fig. 23. Chemical compositions ofthe solution-treated DT samples were determined by anElectron Probe Micro Analyser (EPMA) (JEOL, JXA-8100).Vickers hardness and electrical conductivity were measuredby a micro Vickers hardness tester (Akashi, MVK-H1) and anelectrical resistance tester for tiny areas equipped with a0.1mm-interstices four-point probe, respectively. Precipitatedmicrostructure of aged DT samples was examined by a TEM(JEOL, JEM-2000EXII).
Figure 24 shows a dark field image taken from a (100) L12super-lattice reflection of Cu12.3Ni1Al0.3Si (mass%)alloy aged at 500°C for 12 h, the chemical composition ofwhich was optimized based on results of combinatorialexperiments. Fine particles of the L12-Ni3Al phase weredispersed presumably due to the spinodal decomposition,which results in a considerable increase of both hardness andelectrical conductivity. The relationship between the tensilestrength and electrical conductivity is summarized in Fig. 25.Optimized CuNiAlSi alloys, which show especially high-
Fig. 21 Thermo-magnetization curves of the Ni45Co5Mn36.6In13.4 alloymeasured in several magnetic fields.
Fig. 22 Magnetization versus magnetic field curves for the Ni45Co5-Mn36.6In13.4 alloy between 200K and 320K.
Fig. 23 Calculated phase diagram at 500°C in the CuNiAl ternarysystem. Shaded area represents a miscibility gap between the fcc (Cu) andL12 (Ni3Al) phases.
Fig. 24 TEM dark-field image taken from (100) L12 super-lattice reflectionand selected area diffraction pattern with the incident beam direction of[001]. L12 (Ni3Al) particles are finely dispersed in fcc (Cu) matrix inCu12.3Ni1Al0.3Si (mass%) alloy solution-treated at 900°C for10min, 30% cold-rolled and aged at 500°C for 12 h.
K. Ishida816

strength properties, can be substituted for conventional CuBe alloys. This alloy system has been commercialized assuspension wire for optical pickup in DVD drives.
6.2 Alloy design and development of CuMnAl shapememory alloys
Cu-based shape memory alloys (SMAs) such as CuAl-and CuZn-based alloys are commercially attractive forpractical applications of the shape memory effect (SME) andpseudo elasticity (PE) because of their low cost and theiradvantages with regard to electrical and thermal conductiv-ities. However, the polycrystalline Cu-based SMAs aregenerally brittle and tend to cause intergranular fracturesdue to their high degree of order in the parent ¢ phase withB2, D03 or L21 structure and the extremely high elasticanisotropy ratio in the ¢ phase.53) We have reported54) thatexcellent ductility can be obtained by controlling the degreeof order in the ¢ phase of the CuAlMn SMAs.Figures 26(a) and (b) show the isothermal section phasediagram at 850°C55) and vertical section of CuAl10 at%Mnalloys,56) respectively. This system is well-known for theHeusler phase Cu2AlMn, which is shown by the asterisk inFig. 26(a), but this phase is no longer stable at 850°C, wherea large solubility range of the ¢ phase can be seen. It is alsoseen from Fig. 26(b) that both the transition temperatures oforder-disorder transitions, ¢ (A2)¼ ¢2 (B2) and ¢2 ¼ ¢1(L21), drastically decrease with decreasing Al content. TheCuAlMn SMAs with an Al content below 18 at% havinga low degree of order in the ¢ phase show excellent cold-workability of over 60% in cold-rolling reduction and alsoexhibit SME and PE based on cubic ¢1 (L21) to monoclinic¢A1 (18R), as shown in Fig. 27. The large grain size of thisalloy system shows excellent SME and PE,57,58) which can beachieved by special heat treatment for obtaining the abnormalgrain growth.59) This alloy has been practically used for an
ingrown nail correcting device60) and also applied as aseismic damping material.61)
7. Summary
The methodology of phase diagrams and the micro-structure control to alloy design were reviewed. This articlepresents recent progress on the thermodynamic databasesconstructed by CALPHAD approach and materials develop-ment focusing on (i) the prediction of phase constitutionof Ti-based alloys, (ii) Pb-free machinable stainless steelsusing Titanium carbo-sulfide, (iii) FeMnAlC based high-strength alloys with low density, (iv) the £ + £ A CoAlW-based superalloys for high temperature use, (v) themetamagnetic shape memory alloys of the NiMnX (X:In, Sn, Sb) Heusler phase, (vi) the high strength and high-conductive CuNiAl based alloys strengthened by £ A Ni3Alphase and (vii) the ductile CuMnAl shape memory alloys
Fig. 25 Relationship between tensile strength and electrical conductivity ofdeveloped CuNiAlSi alloy in comparison with conventional Cu-basealloys.
Fig. 26 (a) Isothermal section phase diagram of the CuAlMn system at850°C. (b) Vertical section phase diagram of CuAl10 at% Mn alloys.
Alloy Design and Development of Advanced Materials Based on Phase Diagrams and Microstructural Control 817

by controlling the degree of order, and its applications toingrown nail correcting device and seismic damping material.
Acknowledgement
The author would like to express his sincere gratitude tolate Prof. Taiji Nishizawa for his guidance. The author alsothanks Profs. R. Kainuma, K. Oikawa, Y. Sutou, I. Ohnuma,T. Omori, Y. Sato, R.Y. Umetsu and Y. Araki for their help.
REFERENCES
1) G.B. Olson: Scr. Mater. 70 (2014) 12.2) L. Kaufman and J. Agren: Scr. Mater. 70 (2014) 36.3) I. Ohnuma and K. Ishida: Tecnol. Metal. Mater. Miner. Sao Paulo 13
(2016) 4663.4) A.L. Scheffler: Metal Prog. 56 (1949) 680680B.5) L. Gaillet: Chem. Met. Eng. 24 (1921) 609.6) J.B. Haworth: JOM 8 (1952/53) 254.7) H.W. Rosenberg: Titanium alloying in theory and practice in the
science, technology and application of Titanium. Proc. 1st Int. Conf. onTitanium, London, ed. by R.I. Jaffee and N.E. Promisel, (PergamonPress, 1970) pp. 851859.
8) E.W. Colling: Materials Properties Handbook, Titanium Alloys, (ASMInternational, Materials Park, 1995) pp. 511.
9) L. Kaufman: Calphad 2 (1978) 5580.10) L. Kaufman: Calphad 2 (1978) 117146.11) L. Kaufman and H. Nesor: Calphad 2 (1978) 325348.12) L. Kaufman: Calphad 3 (1979) 4576.13) J.L. Murray: Phase Diagrams of Binary Titanium Alloys, (ASM
International, Materials Park, 1987).14) K. Ishida: Metall. Mater. Trans. A 48 (2017) 49904998.15) K. Oikawa, H. Mitsui and K. Ishida: Mater. Sci. Forum 500501 (2005)
711718.16) K. Oikawa, H. Mitsui and K. Ishida, Unpublished work.17) K. Oikawa, H. Mitsui, T. Ebata, T. Takiguchi, T. Shimizu, K. Ishikawa,
T. Noda, M. Okabe and K. Ishida: ISIJ Int. 42 (2002) 806807.
18) T. Ebata, T. Takiguchi, T. Shimizu, K. Oikawa, H. Mitsui and K. Ishida:Adv. Eng. Mater. 6 (2004) 889893.
19) K. Oikawa, I. Ohnuma, R. Kainuma and K. Ishida: J. Japan Inst. Metals72 (2008) 545556.
20) Y. Sutou, N. Kamiya, R. Umino, I. Ohnuma and K. Ishida: ISIJ Int. 50(2010) 893899.
21) H.T. Goldschmidt: Interstitial Alloys, (Butterworths, London, 1967)pp. 187195.
22) O. Grässel, G. Krüger, G. Frommeyer and L.W. Meyer: Int. J. Plast. 16(2000) 13911409.
23) E.W. Ross and C.T. Sims: Superalloys II, (John Wiley & Sons, NewYork, 1987) pp. 97133.
24) A.M. Beltran: Superalloys II, (John Wiley & Sons, New York, 1987)pp. 135163.
25) T.E. Wood and E. Goldman: Superalloys II, (John Wiley & Sons, NewYork, 1987) pp. 359384.
26) C.C. Jia, K. Ishida and T. Nishizawa: Metall. Mater. Trans. A 25 (1994)473485.
27) F.R. de Boer, R. Boom, W.C.M. Mattens, A.R. Miedema and A.K.Niessen: Cohesion in Metals: Transition Metal Alloys, (North-Holland,Amsterdam, 1989).
28) K. Ishida: MRS Proc. 1128 (2008) 1128-U06-06.29) T. Omori, Y. Sutou, K. Oikawa, R. Kainuma and K. Ishida: Mater. Sci.
Eng. A 438440 (2006) 10451049.30) K. Shinagawa, H. Chinen, T. Omori, K. Oikawa, I. Ohnuma, K. Ishida
and R. Kainuma: Intermetallics 49 (2014) 8797.31) J. Sato, T. Omori, K. Oikawa, I. Ohnuma, R. Kainuma and K. Ishida:
Science 312 (2006) 9091.32) K. Kobayashi, Y. Tsukamoto, T. Takasugi, H. Chinen, T. Omori, K.
Ishida and S. Zaefferer: Intermetallics 17 (2009) 10851089.33) K. Shinagawa, T. Omori, J. Sato, K. Oikawa, I. Ohnuma, R. Kainuma
and K. Ishida: Mater. Trans. 49 (2008) 14741479.34) T. Omori, K. Oikawa, J. Sato, I. Ohnuma, U.R. Kattner, R. Kainuma
and K. Ishida: Intermetallics 32 (2013) 274283.35) A. Suzuki and T.M. Pollock: Acta Mater. 56 (2008) 12881297.36) T.M. Pollock, J. Dobbern, M. Tsunekane, J. Zhu and A. Suzuki: JOM
62 (2010) 5863.37) K. Shinagawa, T. Omori, K. Oikawa, R. Kainuma and K. Ishida: Scr.
Mater. 61 (2009) 612615.38) K. Tanaka, M. Doshima, N. Tsuno, A. Sato and H. Inui: Philos. Mag.
92 (2012) 40114027.39) Y.S. Sato, M. Miyake, H. Kokawa, T. Omori, K. Ishida, S. Imano,
S.H.C. Park and S. Hirano: Friction Stir Welding and Processing VI,(TMS, 2011) pp. 39.
40) T. Graf, C. Felser and S.S.P. Parkin: Prog. Solid State Chem. 39 (2011)150.
41) K. Ishikawa, R. Kainuma, I. Ohnuma, K. Aoki and K. Ishida: ActaMater. 50 (2002) 22332243.
42) K. Kobayashi, R.Y. Umetsu, A. Fujita, K. Oikawa, R. Kainuma, K.Fukamichi and K. Ishida: J. Alloy. Compd. 399 (2005) 6063.
43) K. Kobayashi, K. Ishikawa, R.Y. Umetsu, R. Kainuma, K. Aoki and K.Ishida: J. Magn. Magn. Mater. 310 (2007) 17941795.
44) R.Y. Umetsu, A. Okubo, M. Nagasako, M. Ohtsuka, R. Kainuma andK. Ishida: Spin 4 (2014) 1440018.
45) K. Ullakko, J.K. Huang, C. Kanter, V.V. Kokorin and R.C. O’Handley:Appl. Phys. Lett. 69 (1996) 19661968.
46) R.D. James and M. Wuttig: Philos. Mag. A 77 (1998) 12731299.47) R.C. O’Handley: J. Appl. Phys. 83 (1998) 32633270.48) Y. Sutou, Y. Imano, N. Koeda, T. Omori, R. Kainuma, K. Ishida and K.
Oikawa: Appl. Phys. Lett. 85 (2004) 43584360.49) R. Kainuma, Y. Imano, W. Ito, Y. Sutou, H. Morito, S. Okamoto, O.
Kitakami, K. Oikawa, A. Fujita, T. Kanomata and K. Ishida: Nature439 (2006) 957960.
50) R. Kainuma, K. Oikawa, W. Ito, Y. Sutou, T. Kanomata and K. Ishida:J. Mater. Chem. 18 (2008) 18371842.
51) T. Miyamoto, M. Nagasako and R. Kainuma: J. Alloy. Compd. 549(2013) 5763.
52) T. Miyamoto, M. Nagasako, T. Omori, K. Ishida and R. Kainuma:J. Jpn. Inst. Copper 54 (2015) 190195.
53) T. Tadaki: Shape Memory Materials, ed. by K. Otsuka and C.M.Wayman, (Cambridge University Press, Cambridge, 1998) pp. 97116.
Fig. 27 Shape recovery, cold workability and elongation of ¢ single phaseof CuAl(913) at% Mn alloys.
K. Ishida818

54) R. Kainuma, S. Takahashi and K. Ishida: Metall. Mater. Trans. A 27(1996) 21872195.
55) W. Koster and T. Godecke: Z. Metallk. 57 (1966) 889901.56) R. Kainuma, N. Satoh, X.J. Liu, I. Ohnuma and K. Ishida: J. Alloy.
Compd. 266 (1998) 191200.57) Y. Sutou, T. Omori, R. Kainuma, K. Ishida and K. Yamauchi: Materia
Japan 42 (2003) 813821.58) Y. Sutou, T. Omori, K. Yamauchi, N. Ono, R. Kainuma and K. Ishida:
Acta Mater. 53 (2005) 41214133.59) T. Omori, K. Kusama, S. Kawata, I. Ohnuma, Y. Araki, K. Ishida and
R. Kainuma: Science 341 (2013) 15001502.60) M. Ishibashi, N. Tabata, T. Suetake, T. Omori, Y. Sutou, R. Kainuma,
K. Yamauchi and K. Ishida: J. Dermatol. Treat. 19 (2008) 291292.61) Y. Araki, T. Endo, T. Omori, T. Koetake, R. Kainuma and K. Ishida:
Earthquake Eng. Struct. Dyn. 40 (2011) 107115.
Alloy Design and Development of Advanced Materials Based on Phase Diagrams and Microstructural Control 819