Allan da Silva Pinto
208
Universidade Estadual de Campinas Instituto de Computação INSTITUTO DE COMPUTAÇÃO Allan da Silva Pinto Analysis of Intrinsic and Extrinsic Properties of Biometric Samples for Presentation Attack Detection Análise de Propriedades Intrínsecas e Extrínsecas de Amostras Biométricas para Detecção de Ataques de Apresentação CAMPINAS 2018
-
Upload
khangminh22 -
Category
Documents
-
view
1 -
download
0
Transcript of Allan da Silva Pinto
Universidade Estadual de CampinasInstituto de Computação
INSTITUTO DECOMPUTAÇÃO
Allan da Silva Pinto
Analysis of Intrinsic and Extrinsic Properties ofBiometric Samples for Presentation Attack Detection
Análise de Propriedades Intrínsecas e Extrínsecas deAmostras Biométricas para Detecção de Ataques de
Apresentação
CAMPINAS2018

Allan da Silva Pinto
Analysis of Intrinsic and Extrinsic Properties of BiometricSamples for Presentation Attack Detection
Análise de Propriedades Intrínsecas e Extrínsecas de AmostrasBiométricas para Detecção de Ataques de Apresentação
Tese apresentada ao Instituto de Computaçãoda Universidade Estadual de Campinas comoparte dos requisitos para a obtenção do títulode Doutor em Ciência da Computação.
Dissertation presented to the Institute ofComputing of the University of Campinas inpartial fulfillment of the requirements for thedegree of Doctor in Computer Science.
Supervisor/Orientador: Prof. Dr. Anderson de Rezende RochaCo-supervisor/Coorientador: Prof. Dr. Hélio Pedrini
Este exemplar corresponde à versão final daTese defendida por Allan da Silva Pinto eorientada pelo Prof. Dr. Anderson deRezende Rocha.
CAMPINAS2018

Agência(s) de fomento e nº(s) de processo(s): CAPES; CNPq, 140069/2016-0; CNPq,142110/2017-5ORCID: http://orcid.org/0000-0003-3765-8300
Ficha catalográficaUniversidade Estadual de Campinas
Biblioteca do Instituto de Matemática, Estatística e Computação CientíficaAna Regina Machado - CRB 8/5467
Pinto, Allan da Silva, 1984- P658a PinAnalysis of intrinsic and extrinsic properties of biometric samples for
presentation attack detection / Allan da Silva Pinto. – Campinas, SP : [s.n.],2018.
PinOrientador: Anderson de Rezende Rocha. PinCoorientador: Hélio Pedrini. PinTese (doutorado) – Universidade Estadual de Campinas, Instituto de
Computação.
Pin1. Biometria. 2. Reconhecimento de padrões. 3. Tecnologia da informação -
Sistemas de segurança. 4. Ciência forense digital. I. Rocha, Anderson deRezende, 1980-. II. Pedrini, Hélio, 1963-. III. Universidade Estadual deCampinas. Instituto de Computação. IV. Título.
Informações para Biblioteca Digital
Título em outro idioma: Análise de propriedades intrínsecas e extrínsecas de amostrasbiométricas para detecção de ataques de apresentaçãoPalavras-chave em inglês:BiometryPattern recognitionInformation technology - Security measuresDigital forensic scienceÁrea de concentração: Ciência da ComputaçãoTitulação: Doutor em Ciência da ComputaçãoBanca examinadora:Anderson de Rezende Rocha [Orientador]Aparecido Nilceu MaranaSiovani Cintra FelipussiSandra Eliza Fontes de AvilaJosé Mário De MartinoData de defesa: 06-09-2018Programa de Pós-Graduação: Ciência da Computação
Powered by TCPDF (www.tcpdf.org)

Universidade Estadual de CampinasInstituto de Computação
INSTITUTO DECOMPUTAÇÃO
Allan da Silva Pinto
Analysis of Intrinsic and Extrinsic Properties of BiometricSamples for Presentation Attack Detection
Análise de Propriedades Intrínsecas e Extrínsecas de AmostrasBiométricas para Detecção de Ataques de Apresentação
Banca Examinadora:
• Prof. Dr. Anderson de Rezende RochaIC/Unicamp
• Prof. Dr. Aparecido Nilceu MaranaFC/UNESP
• Prof. Dr. Siovani Cintra FelipussiCCGT/UFSCar
• Prof.a Dra. Sandra Eliza Fontes de AvilaIC/Unicamp
• Prof. Dr. José Mário De MartinoFEEC/Unicamp
A ata da defesa, assinada pelos membros da Comissão Examinadora, consta noSIGA/Sistema de Fluxo de Dissertação/Tese e na Secretaria do Programa da Unidade.
Campinas, 06 de setembro de 2018

To my wife, Dinéia, who always provided meall support necessary for this long journey.Your words of encouragement and your im-mense comprehension of the importance ofthis work in our lives helped us to get tothis moment. I love you! Thank you!

Acknowledgments
THERE are many reasons that may motivate a person for pursuing a Ph.D. degree.For some people, the doctoral degree is a valuable asset that increases one’s chances
of earning higher paid in more satisfying jobs. For other ones, the chance of getting ahigher position in their professional career may empower a person for dedicating to thistask. For some young people, the perspective of getting a more comfortable future oreven their dream profession may be attenuated by their family’s background and reality,and so, a Master’s and a Ph.D. degrees may represent a valuable passport to change theirliving conditions through the education.
Although all those reasons may encourage a student to dedicate four or more years ofhis/her life to have a doctoral degree, I realized that the discovery of a world of research,science and new knowledge can perfectly act as a prime stimulus that makes a studentkeep moving toward its ultimate goal. In fact, the belief of how the research, science,and education can change a society and provide them with new perspectives of a brilliantfuture was the real motivation that inspired me to work hard during four years, fightingwith myself to surpass several barriers of difficulties found in this journey and my limita-tions. Undoubtedly, that was the most beautiful finding that could achieve in this thesis,which will be in my heart along for my entire life. Moreover, the most beautiful part ofthis discovery is that I would have never reached these conclusions only by designing so-lutions, algorithms, and by writing codes. What really made me understand the valuablework of professors and scientists in our country was the conviviality and interaction withseveral people, which I had the great opportunity to meet along these years. Without thededication and guidance of remarkable people that I met during this journey, I certainlywould not have found the true meaning of our profession. Additionally, this thesis wouldnot have been possible without the support and collaboration of several people who par-ticipated directly or indirectly in the principal moments of my life during these four years.Thus, I dedicate this humble tribute as a form of demonstrating my deep gratitude to allthese people.
Firstly, I would like to thank my sweet wife Dinéia for being present in all momentsof joy and difficulties that we have been through these last years. Thank you for alwayshaving words of support and comfort to me. Your wisdom and comprehension of theimportance of the hours dedicated to this work was fundamental for me to achieve theseresults. You were the greatest gift that God could have given me. May God bless you forbeing an excellent wife, and my best friend. I love you.
I thank my parents, Laudicéia and Nairton for the dedication and care they always hadwith my education as a citizen, human being and a professional. It is clear in my memoriesthe moments which you always looked for alternatives to give me a good education, evenwithout enough financial resources. Without your care, I certainly would not have gottenhere. May God bless you and give you much joy in your hearts, peace of mind and health.I love you.
I would like to express my gratitude to my dear sister Vanessa, my dear sister-in-law

Néria, and my parents-in-law Lourival and Hosana, who have always supported me withwords of encouragement and gestures of affection. You are the best family that anyonecould ever have had. I thank God for giving me the honor of living with such wonderfulpeople as you.
I would like to thank my advisor, Prof. Dr. Anderson de Rezende Rocha, for thewords of support, wisdom, and encouragement given throughout this journey. I thankyou for your absolute dedication to always teach me, for your help in times of trouble,for correcting me and for showing me new paths and opportunities of our profession.Undoubtedly, all those gestures were crucial to getting us to this moment. Thank you foralways believing in my work, and for showing the real meaning of being a professor. Yourlove for our profession is an inspiration to me. May God bless you and your family.
I would also like to thank my co-advisor, Prof. Dr. Hélio Pedrini, for his dedicationas a professor and co-advisor. I am grateful to you for always being ready to help me andhear me whenever I needed. Your wisdom and sensitivity as a human being make you adistinct professional. Thank you for your valuable contributions to this thesis.
I thank Prof. Dr. William Robson Schwartz, Prof. Dr. David Menotti Gomes, Prof.Dr. Alexandre Xavier Falcão, Prof. Dr. Siome Klein Goldenstein and Dr. GiovaniChiachia for valuable contributions to this thesis and for sharing their wisdom with meduring our conversations, meetings, and during the hours of working in the laboratories.Our discussions were valuable to my professional growth.
I would like to thank Dr. Fernanda Alcântara Andaló, Prof. Dr. José Mário DeMartino, and Prof. Dr. Ricardo da Silva Torres for valuable contribution to this thesisduring the qualification exam process. Your observations, recommendations, and critiquewere very important for increasing the quality of this work.
I thank Prof. Dr. Kevin Boyer, Prof. Dr. Patrick Flynn, Prof. Dr. Walter Scheirerand Prof. Dr. Adam Czajka for hosting me at the University of Notre Dame, USA, duringmy doctoral internship. I am grateful for all support necessary to accomplish my workand for the excellent hospitality and interaction during my stay at Notre Dame. Thankyou for your contributions to this thesis.
I would like to thank my colleagues of the Reasoning for Complex Data (Recod)laboratory for their valuable friendship and discussions that we had along these years.I am grateful for having the opportunity of working with such brilliant minds. I wouldalso like to thank my colleagues from the Computer Vision Research Laboratory (CVRL)from the University of Notre Dame. Your friendship and hospitality made me feel likeat home. I thank Andrey Kuehlkamp, Dr. Alexandre Ferreira, Aparna Bharati, BenedictBecker, Dr. Daniel Moreira, Joel Brogan, Michael Krumdick, and Dr. Tiago Carvalhofor their valuable collaborations which certainly made me a better professional. I learneda lot with you guys. A special thanks to Daniel Moraes, Dr. Felipe Louza, Luis AugustoMartins, Ramon Pires, and Samuel Botter Martins, for their friendship and for our niceconversations during coffee times. You have a friend in me.
I would like to thank the Institute of Computing at the University of Campinas, itsfaculty, and staff for the excellent work carried out in this university toward providingstudents with such magnificent professional education. A special thanks to everyone thatworks hard every day to make the University of Campinas a high-quality educationalinstitution. I also thank this same institution and community for providing me with aneducation of excellence during my Master’s studies, which were fundamental for me toreach the maturity necessary for pursuing a Ph.D. degree.
I thank all my former professors and advisors from the Institute of Mathematics and
Computer Sciences (ICMC) at the University of São Paulo, for all dedication and hardwork toward providing me with an excellent professional education during college. I amgrateful to all professors and people of that institution that contributed to my formationas professional and citizen. A special thanks to my advisors in the scientific initiationprojects that I accomplished at the University of São Paulo, Prof. Dr. Jorge Luiz e Silva,and Prof. Dr. Odemir Martinez Bruno, for their great patience, for sharing their wisdom.
I thank all my family friends for their friendship and for all moments we had together.I thank you for their comprehension whenever I needed to dedicate to this thesis. Aspecial thanks to Andréia, Clóvis & family, and Rudnei & family. I thank God for givingme the opportunity for meeting such nice people in my life. Also, a special thanks toAnderson Nascimento & family, for all the help given to my wife and me during our stayin the USA. For our sincere friendship to you and for the moments of joy that we hadtogether. I also thank our friends from Chicago, USA, and from West Lafayette, USA,for all help, support and friendship. May God bless you all.
I am especially grateful to my grandparents, the late Delmira & the late Luís, forvaluable advice and care they had with me during their lives.
Finally, I would like to thank the Brazilian federal government agencies, NationalCouncil for Scientific and Technological Development (CNPq) and Coordination for theImprovement of Higher Education Personnel (CAPES), for the financial support duringthis thesis. I really hope to take the opportunity to reciprocate all this support offered tome by working for the growth of our country.

Resumo
Os recentes avanços nas áreas de pesquisa em biometria, forense e segurança da informaçãotrouxeram importantes melhorias na eficácia dos sistemas de reconhecimento biométricos.No entanto, um desafio ainda em aberto é a vulnerabilidade de tais sistemas contra ataquesde apresentação, nos quais os usuários impostores criam amostras sintéticas, a partir dasinformações biométricas originais de um usuário legítimo, e as apresentam ao sensor deaquisição procurando se autenticar como um usuário válido. Dependendo da modalidadebiométrica, os tipos de ataque variam de acordo com o tipo de material usado para cons-truir as amostras sintéticas. Por exemplo, em biometria facial, uma tentativa de ataque écaracterizada quando um usuário impostor apresenta ao sensor de aquisição uma fotogra-fia, um vídeo digital ou uma máscara 3D com as informações faciais de um usuário-alvo.Em sistemas de biometria baseados em íris, os ataques de apresentação podem ser reali-zados com fotografias impressas ou com lentes de contato contendo os padrões de íris deum usuário-alvo ou mesmo padrões de textura sintéticos. Nos sistemas biométricos de im-pressão digital, os usuários impostores podem enganar o sensor biométrico usando réplicasdos padrões de impressão digital construídas com materiais sintéticos, como látex, massade modelar, silicone, entre outros. Esta pesquisa teve como objetivo o desenvolvimentode soluções para detecção de ataques de apresentação considerando os sistemas biométri-cos faciais, de íris e de impressão digital. As linhas de investigação apresentadas nestatese incluem o desenvolvimento de representações baseadas nas informações espaciais,temporais e espectrais da assinatura de ruído; em propriedades intrínsecas das amostrasbiométricas (e.g., mapas de albedo, de reflectância e de profundidade) e em técnicas deaprendizagem supervisionada de características. Os principais resultados e contribuiçõesapresentadas nesta tese incluem: a criação de um grande conjunto de dados publicamentedisponível contendo aproximadamente 17K vídeos de simulações de ataques de apresenta-ções e de acessos genuínos em um sistema biométrico facial, os quais foram coletados coma autorização do Comitê de Ética em Pesquisa da Unicamp; o desenvolvimento de novasabordagens para modelagem e análise de propriedades extrínsecas das amostras biomé-tricas relacionadas aos artefatos que são adicionados durante a fabricação das amostrassintéticas e sua captura pelo sensor de aquisição, cujos resultados de desempenho foramsuperiores a diversos métodos propostos na literature que se utilizam de métodos tradi-cionais de análise de images (e.g., análise de textura); a investigação de uma abordagembaseada na análise de propriedades intrínsecas das faces, estimadas a partir da informaçãode sombras presentes em sua superfície; e, por fim, a investigação de diferentes abordagensbaseadas em redes neurais convolucionais para o aprendizado automático de característi-cas relacionadas ao nosso problema, cujos resultados foram superiores ou competitivos aosmétodos considerados estado da arte para as diferentes modalidades biométricas aborda-das nesta tese. A pesquisa também considerou o projeto de eficientes redes neurais comarquiteturas rasas capazes de aprender características relacionadas ao nosso problema apartir de pequenos conjuntos de dados disponíveis para o desenvolvimento e a avaliaçãode soluções para a detecção de ataques de apresentação.

Abstract
Recent advances in biometrics, information forensics, and security have improved therecognition effectiveness of biometric systems. However, an ever-growing challenge is thevulnerability of such systems against presentation attacks, in which impostor users createsynthetic samples from the original biometric information of a legitimate user and showthem to the acquisition sensor seeking to authenticate themselves as legitimate users.Depending on the trait used by the biometric authentication, the attack types vary withthe type of material used to build the synthetic samples. For instance, in facial biomet-ric systems, an attempted attack is characterized by the type of material the impostoruses such as a photograph, a digital video, or a 3D mask with the facial information ofa target user. In iris-based biometrics, presentation attacks can be accomplished withprintout photographs or with contact lenses containing the iris patterns of a target useror even synthetic texture patterns. In fingerprint biometric systems, impostor users candeceive the authentication process using replicas of the fingerprint patterns built withsynthetic materials such as latex, play-doh, silicone, among others. This research aimedat developing presentation attack detection (PAD) solutions whose objective is to detectattempted attacks considering different attack types, in each modality. The lines of inves-tigation presented in this thesis aimed at devising and developing representations basedon spatial, temporal and spectral information from noise signature, intrinsic propertiesof the biometric data (e.g., albedo, reflectance, and depth maps), and supervised featurelearning techniques, taking into account different testing scenarios including cross-sensor,intra-, and inter-dataset scenarios. The main findings and contributions presented in thisthesis include: the creation of a large and publicly available benchmark containing 17Kvideos of presentation attacks and bona-fide presentation simulations in a facial biomet-ric system, whose collect were formally authorized by the Research Ethics Committeeat Unicamp; the development of novel approaches to modeling and analysis of extrinsicproperties of biometric samples related to artifacts added during the manufacturing ofthe synthetic samples and their capture by the acquisition sensor, whose results were su-perior to several approaches published in the literature that use traditional methods forimage analysis (e.g., texture-based analysis); the investigation of an approach based onthe analysis of intrinsic properties of faces, estimated from the information of shadowspresent on their surface; and the investigation of different approaches to automaticallylearning representations related to our problem, whose results were superior or compet-itive to state-of-the-art methods for the biometric modalities considered in this thesis.We also considered in this research the design of efficient neural networks with shallowarchitectures capable of learning characteristics related to our problem from small sets ofdata available to develop and evaluate PAD solutions.

List of Figures
1.1 Overview of the authentication process in a generic biometric system. . . . 261.2 This roadmap shows the main contributions of this thesis, Research Ques-
tions (RQs) driving our research, main challenges and advancements achievedin our work. . . . . . . . . . . . . . . . . . . . . . . . . . . . . . . . . . . . 35
2.1 General biometric system and its vulnerability points. . . . . . . . . . . . . 382.2 Proposed method based on Fourier analysis and visual rhythm summariza-
tion technique. . . . . . . . . . . . . . . . . . . . . . . . . . . . . . . . . . 462.3 Example of a video frame of the spectra generated from (a) a valid video
and (b) an attack video. . . . . . . . . . . . . . . . . . . . . . . . . . . . . 482.4 Visual rhythms constructed from (a)-(b) central horizontal lines and from
(c)-(d) central vertical lines. Note that the visual rhythm obtained fromhorizontal lines has been rotated 90 degrees for visualization purposes. . . . 49
2.5 Examples of spectra whose highest responses are not only at the abscissaand ordinates axes. . . . . . . . . . . . . . . . . . . . . . . . . . . . . . . . 49
2.6 Examples of visual rhythms constructed in a zig-zag traversal. . . . . . . . 492.7 Examples of valid access video frames for outdoor (first and second images
on the left) and indoor (three images on the right) scenes. . . . . . . . . . 512.8 Examples of attempted attack video frames for outdoor (first and second
images on the left) and indoor (three images on the right) scenes usingSony (first and second columns), Canon (third and fourth columns) andNikon (last column) cameras. . . . . . . . . . . . . . . . . . . . . . . . . . 52
2.9 Differences in mean levels of the results obtained by the different descrip-tors used in this work and their confidence intervals for 95% family-wiseconfidence level. There are statistical difference between the comparisonswhose confidence intervals do not include zero. . . . . . . . . . . . . . . . . 55
2.10 Differences in mean levels of the results obtained by the visual rhythmsconsidered in this work and their confidence intervals for 95% family-wiseconfidence level. There are statistical difference between the comparisonswhose confidence intervals do not include zero. . . . . . . . . . . . . . . . . 56
2.11 Example of a video frame of the spectra generated from (a) a valid accessvideo of the Replay-Attack database and (b) a video of an attempted attackof the same dataset. Note a concentration of information on the centerrather than spread over as for the videos case shown in Fig. 2.5. . . . . . . 59
3.1 Main steps of the proposed method. . . . . . . . . . . . . . . . . . . . . . . 643.2 (a) Original frames extracted from a valid access video, (b) their respective
residual noise frames and (c) magnitude spectra. . . . . . . . . . . . . . . 703.3 (a) Original frames extracted from an attempted attack video, (b) their
respective residual noise frames and (c) magnitude spectra. . . . . . . . . 70

3.4 Examples of valid access and attempted attack videos. . . . . . . . . . . . 713.5 Examples of valid access video frames for outdoor (first and second images
on the left) and indoor (three images on the right) scenes. . . . . . . . . . 743.6 Examples of attempted attack video frames for outdoor (first and second
images on the left) and indoor (three images on the right) scenes usingSony (first and second columns), Canon (third and fourth columns) andNikon (last column) cameras. . . . . . . . . . . . . . . . . . . . . . . . . . 74
3.7 Confidence interval on the differences between the means of the levels ofthe factors (a) LGF, and (b) M. . . . . . . . . . . . . . . . . . . . . . . . . 78
3.8 Confidence interval of the differences between the means of the levels ofthe factors (a) DS, (b) CP, (c) CS and (d) SDD. . . . . . . . . . . . . . . . 79
3.9 Interaction plots between pairs of factors (a) LGF×M and (b) CS×CP. . . 803.10 Results obtained on Replay-Attack dataset for each type of attack using
fixed-support (a) in contrast with hand-based attacks (b). . . . . . . . . . 813.11 Results obtained on CASIA dataset for the three type of attacks (a) and
for the three quality of attack (b). . . . . . . . . . . . . . . . . . . . . . . . 833.12 Results in terms of HTER (%) of the proposed method for different video
input length for Replay-Attack, CASIA and 3DMAD datasets. . . . . . . . 85
4.1 Schematic diagram detailing how anti-spoofing systems are built from spoof-ing detection benchmarks. . . . . . . . . . . . . . . . . . . . . . . . . . . . 92
4.2 Schematic diagram for architecture optimization (AO) illustrating how op-erations are stacked in a layer (left) and how the network is instantiatedand evaluated according to possible hyperparameter values (right). . . . . . 100
4.3 Architecture of convolutional network found in the Cuda-convnet libraryand here used as reference for filter optimization (cf10-11, top). . . . . . . 101
4.4 Activation maps of the filters that compose the first convolutional layerwhen forwarding real and fake images through the network. . . . . . . . . . 110
4.5 Examples of hit and missed testing samples lying closest to the real-fakedecision boundary of each benchmark. A magnified visual inspection onthese images may suggest some properties of the problem to which thelearned representations are sensitive. . . . . . . . . . . . . . . . . . . . . . 112
5.1 General pipeline exploited in this work. Initial network architectures, orig-inally proposed for other problems, are independently fine-tuned with ap-propriate PAD examples from different datasets leading to discriminativefeatures. . . . . . . . . . . . . . . . . . . . . . . . . . . . . . . . . . . . . . 117
5.2 Adopted network architecture, originally proposed for object recognitionby the Visual Geometry Group and thus referred to as VGG network. . . . 127
5.3 Left: Empirical probability distributions (ePDF) of the difference betweentwo CNN output nodes (after softmax) obtained separately for authenticand spoof face samples. Right: ROC curve. . . . . . . . . . . . . . . . . . 133
5.4 Same as Fig. 5.3 except the variant: training on CASIA, testing on CASIA.1335.5 Same as Fig. 5.3 except the variant: training on Replay-Attack, testing
on CASIA (cross-dataset testing). . . . . . . . . . . . . . . . . . . . . . . 1345.6 Same as Fig. 5.3 except the variant: training on CASIA, testing on
Replay-Attack. . . . . . . . . . . . . . . . . . . . . . . . . . . . . . . . . 134

5.7 Left: Empirical distributions of the difference between two CNN outputnodes (after softmax) obtained separately for authentic and spoof finger-print samples. Right: ROC curve. . . . . . . . . . . . . . . . . . . . . . . 135
5.8 Same as Fig. 5.7 except the variant: training on LivDet2013, testing onLivDet2013. . . . . . . . . . . . . . . . . . . . . . . . . . . . . . . . . . . 136
5.9 Same as Fig. 5.7 except the variant: training on Italdata+Swipe, testingon Biometrika+CrossMatch. . . . . . . . . . . . . . . . . . . . . . . . . 137
5.10 Same as Fig. 5.7 except the cross-sensor that training is realized on samplescomposed Biometrika+CrossMatch, testing on Italdata+Swipe. . . . 137
5.11 Same as Fig. 5.7 except the variant: training on Italdata+Swipe, testingon Italdata+Swipe. . . . . . . . . . . . . . . . . . . . . . . . . . . . . . . 137
5.12 Same as Fig. 5.7 except the variant: training onBiometrika+CrossMatch,testing on Biometrika+CrossMatch. . . . . . . . . . . . . . . . . . . . . 138
5.13 Left: empirical distributions of the difference between two CNN outputnodes (before softmax) obtained separately for authentic and spoof irissamples. Right: ROC curve. . . . . . . . . . . . . . . . . . . . . . . . . . 139
5.14 Same as Fig. 5.13 except the variant: training on ATVS, testing on ATVS.1395.15 Same as Fig. 5.13 except the variant: training on Warsaw LivDet2015,
testing on ATVS. . . . . . . . . . . . . . . . . . . . . . . . . . . . . . . . . 1405.16 Same as Fig. 5.13 except the variant: training on ATVS, testing on War-
saw LivDet2015. . . . . . . . . . . . . . . . . . . . . . . . . . . . . . . . 141
6.1 Example of a facial surface reconstruction using an SfS algorithm for pre-sentation attack video frame. . . . . . . . . . . . . . . . . . . . . . . . . . . 145
6.2 Overview of the proposed method for face presentation attack detection. . 1506.3 Results obtained on Replay-Attack dataset for the three attack types and
for the different maps obtained with the shape-from-shading algorithm. . . 1576.4 Results obtained on CASIA dataset for the different attack types and for
the different maps obtained with the shape-from-shading algorithm. . . . . 1586.5 Example of a bona fide presentation video frame (first line) a presentation
attack video frame (second line). First column illustrate original framescaptured by the acquisition sensor, whereas the other columns show theirrespective maps. . . . . . . . . . . . . . . . . . . . . . . . . . . . . . . . . . 161
6.6 Details of the reconstructed surface for the video frames showed in Fig. 6.5from a genuine access (a) and an attempted attack (b), in which we foundstrong evidence of a natural (skin roughness) texture pattern and of asynthetic (horizontal and vertical lines) texture pattern for these respectiveclasses. . . . . . . . . . . . . . . . . . . . . . . . . . . . . . . . . . . . . . . 162

List of Tables
2.1 Comparison of the proposed UVAD database and other available referencebenchmarks in the literature. . . . . . . . . . . . . . . . . . . . . . . . . . . 52
2.2 Number of features (dimensions) using either the direct pixel intensities asfeatures or the features extracted by image description methods. . . . . . . 54
2.3 Results (AUC) of the experiment in which we find the best configurationof our method considering all possible setups. . . . . . . . . . . . . . . . . 55
2.4 Results (AUC) of the experiment analyzing the influence of the biometricsensors using a PLS Classifier and Median Filter. . . . . . . . . . . . . . . 56
2.5 Results (AUC) of the experiment analyzing the influence of the displaydevices using a PLS Classifier and Median Filter. . . . . . . . . . . . . . . 57
2.6 Comparison between Schwartz’s approach and the method proposed in thiswork in its best setup (using combined visual rhythm, Median filter and aPLS Classifier). . . . . . . . . . . . . . . . . . . . . . . . . . . . . . . . . . 58
2.7 Results (AUC) for the test set of the Replay-Attack database . . . . . . . . 59
3.1 After the statistical analysis, we have found that the factors highlightedwith † are the ones that did not present statistical significance when con-figuring our method, whereas the levels highlighted in bold are the chosenlevels. . . . . . . . . . . . . . . . . . . . . . . . . . . . . . . . . . . . . . . 76
3.2 Performance results for the Replay-Attack Dataset. . . . . . . . . . . . . . 813.3 Performance results for the CASIA dataset. . . . . . . . . . . . . . . . . . 823.4 Comparison among LBP-based approach, motion-based approach and the
proposed method on the UVAD dataset. . . . . . . . . . . . . . . . . . . . 833.5 Comparison among the existing methods. The first column shows the
HTERs reported by the authors, whereas the second column shows theRelative Error Reduction (RER) obtained with the proposed method. Thereported HTERs were obtained using the original Replay-Attack Datasetprotocol. The results highlighted with † and ‡ were reported by Chingovskaet al. and Pereira et al., respectively. . . . . . . . . . . . . . . . . . . . . . 84
3.6 Comparison among the proposed method and others available in the liter-ature. According to the authors of the proposed methods, EERs reportedwere obtained using the original CASIA Dataset protocol. . . . . . . . . . 84
3.7 Results obtained with the cross-dataset protocol and using the overall testsets of each dataset. . . . . . . . . . . . . . . . . . . . . . . . . . . . . . . . 86
3.8 Comparison among different anti-spoofing methods considering cross-datasetprotocol. . . . . . . . . . . . . . . . . . . . . . . . . . . . . . . . . . . . . . 87
4.1 Main features of the benchmarks considered herein. . . . . . . . . . . . . . 974.2 Input image dimensionality after basic preprocessing on face and fingerprint
images (highlighted). See Section 4.4.3 for details. . . . . . . . . . . . . . . 103

4.3 Overall results considering relevant information of the best found archi-tectures, detection accuracy (ACC) and HTER values according to theevaluation protocol, and state-of-the-art (SOTA) performance. . . . . . . . 106
4.4 Results for filter optimization (FO) in cf10-11 and spoofnet (Fig. 4.3). . . . 1084.5 Results for architecture and filter optimization (AO+FO) along with cf10-
11 and spoofnet networks considering random weights. . . . . . . . . . . . 111
5.1 Main features of the benchmarks considered herein. . . . . . . . . . . . . . 1315.2 Performance results obtained in the same-dataset evaluations of the face
PAD. Pointers to plots presenting Receiver Operating Characteristics (ROC)and empirical Probability Distribution Functions (ePDF) are added in thelast column. . . . . . . . . . . . . . . . . . . . . . . . . . . . . . . . . . . . 133
5.3 Performance results obtained with the cross-dataset evaluations of facePAD and using the overall testing set of each dataset. . . . . . . . . . . . 134
5.4 Performance results obtained in same-dataset evaluations of fingerprintPAD using a part of testing samples acquired by the same sensor as inthe training procedure. Results are averaged over all subsets representingdifferent sensors. . . . . . . . . . . . . . . . . . . . . . . . . . . . . . . . . 135
5.5 Performance results obtained in cross-dataset evaluations of fingerprintPAD using a part of testing samples acquired by different sensor as in thetraining procedure. All data comes for LivDet2013 fingerprint benchmark.IS = Italdata+Swipe, BC = Biometrika+CrossMatch. . . . . . . . . . . . . 136
5.6 Performance results obtained in same-dataset evaluations of iris PADusing the overall testing set of each dataset. . . . . . . . . . . . . . . . . . 139
5.7 Performance results obtained in cross-dataset evaluations of iris PADusing the overall testing set of each dataset. . . . . . . . . . . . . . . . . . 140
6.1 Performance results (in %) for the CASIA dataset considering the intra-dataset evaluation protocol. . . . . . . . . . . . . . . . . . . . . . . . . . . 155
6.2 Performance results (in %) for the Replay-Attack and CASIA datasetsconsidering the intra-dataset evaluation protocol. . . . . . . . . . . . . . . 155
6.3 Performance results (in %) for the Replay-Attack dataset considering thepresentation attacks simulations individually. . . . . . . . . . . . . . . . . . 156
6.4 Performance results (in %) for the CASIA dataset considering the presen-tation attacks simulations individually. . . . . . . . . . . . . . . . . . . . . 157
6.5 Performance results (in %) for the UVAD dataset considering the differentmaps obtained with the shape-from-shading algorithm. . . . . . . . . . . . 158
6.6 Results (in %) obtained with the cross-dataset protocol considering bothpresentation attacks simulations individually and the overall test sets ofeach dataset. . . . . . . . . . . . . . . . . . . . . . . . . . . . . . . . . . . 159
6.7 Comparison among the existing CNN-based methods considering the intra-and inter-based evaluation protocols for the datasets considered in this work.160
7.1 Source code developed during this thesis and freely available for repro-ducibility purposes. . . . . . . . . . . . . . . . . . . . . . . . . . . . . . . . 171

List of Abbreviations and Acronyms
Abbreviationsand Acronyms Description
3DMAD 3D Mask Attack DatabaseACC AccuracyAPCER Attack Presentation Classification Error RateATM Automated Teller MachineAUC Area Under Receiver Operating Characteristic CurveBPCER Bona Fide Presentation Classification Error RateCF Color FrequencyCNN Convolutional Neural NetworkDET Detection Error Trade-offDNA Deoxyribonucleic AcidEER Equal Error RateFAR False Acception RateFPN Fixed Pattern NoiseFRR False Rejection RateGLCM Gray-Level Co-occurrence MatricesHD High-DefinitionHOG Histogram of Oriented GradientsHSC Histograms of Shearlet CoefficientsHTER Half-Total Error RateHVC Hierarchical Visual CodebookIEC International Electrotechnical CommissionISO International Organization for StandardizationLBP Local Binary PatternLDA Linear Discriminant AnalysisLPQ Local Phase QuantizationPA Presentation AttackPAD Presentation Attack DetectionPAI Presentation Attack InstrumentPLS Partial Least SquarePRNU Photo-Responsiveness of Non-Uniform Light-Sensitive CellsRER Relative Error ReductionROC Receiver Operating CharacteristicSfS Shape-from-Shading

SOTA State of the art (or the adjective State-of-the-Art)SVM Support Vector MachineUVAD Unicamp Video-Based Attack DatabaseWLD Weber Local Image Descriptor

Terms and Glossary
Terms and Glossary DescriptionAcquisition process see “Biometric data capture subsystem”Acquisition sensor see “Biometric data capture subsystem”
Attack type Method used to attack the biometric data capturesubsystem
Biometric data capturesubsystem
Subsystem responsible for capturing the biometricdata
Bona fide presentations Presentation of a truthly biometric data to thebiometric data capture subsystem
Cross-dataset evaluation protocol see “Inter-dataset evaluation protocol”
Cross-sensor scenarioA testing scenario in which a PAD system isevaluated into a different biometric data capturesubsystem from which it was configured
Impostor user A user without permission for accessing a biometricsystem
Inter-dataset evaluation protocol
A testing scenario in which a PAD system isevaluation into a different biometric system of thesame modality, which means an operation with andifferent biometric data capture subsystem andtemplate database
Intra-dataset evaluation protocolA testing scenario in which a PAD system isevaluated into the same biometric system of whichit was configured
Legitimate user A user authorized to access a biometric systemLiveness detection see “Presentation attack”
PAD system Module responsible for detection presentationattacks
Presentation attackA single or multiple attempts of attacking thebiometric data capture subsystem aiming to deceivea biometric authentication system
Presentation attack instrumentInstrument used to perform a single or multipleattempts of attacking the biometric data capturesubsystem
Spoofing attack see “Presentation attack”
Template database A database responsible for storing the templates ofthe legitimate users enrolled in the biometric system
Valid access see “Bona fide presentations”

Valid user see “Legitimate user”

Contents
1 Introduction 241.1 Basic Concepts in Biometrics . . . . . . . . . . . . . . . . . . . . . . . . . 251.2 Presentation Attacks in Biometrics . . . . . . . . . . . . . . . . . . . . . . 251.3 Research Vision: New Insights for the Presentation Attack Detection Problem 28
1.3.1 Problems with the Existing Approaches . . . . . . . . . . . . . . . . 281.3.2 Hypothesis Statements . . . . . . . . . . . . . . . . . . . . . . . . . 291.3.3 Novelties and Rationales Brought in this Thesis . . . . . . . . . . . 30
1.4 Key Contributions . . . . . . . . . . . . . . . . . . . . . . . . . . . . . . . 321.5 Thesis Organization . . . . . . . . . . . . . . . . . . . . . . . . . . . . . . . 34
2 Using Visual Rhythms for Detecting Video-based Facial Spoof Attacks 362.1 Introduction . . . . . . . . . . . . . . . . . . . . . . . . . . . . . . . . . . . 372.2 Related Work . . . . . . . . . . . . . . . . . . . . . . . . . . . . . . . . . . 40
2.2.1 Existing Databases . . . . . . . . . . . . . . . . . . . . . . . . . . . 412.2.2 Motion Analysis and Clues of the Scene . . . . . . . . . . . . . . . 422.2.3 Texture and Frequency Analysis . . . . . . . . . . . . . . . . . . . . 432.2.4 Other Approaches . . . . . . . . . . . . . . . . . . . . . . . . . . . . 442.2.5 Problems with the Existing Approaches . . . . . . . . . . . . . . . . 45
2.3 Proposed Method . . . . . . . . . . . . . . . . . . . . . . . . . . . . . . . . 462.3.1 Calculation of the Residual Noise Videos . . . . . . . . . . . . . . . 472.3.2 Calculation of the Fourier Spectrum Videos . . . . . . . . . . . . . 472.3.3 Calculation of the Visual Rhythms . . . . . . . . . . . . . . . . . . 472.3.4 Feature Extraction . . . . . . . . . . . . . . . . . . . . . . . . . . . 492.3.5 Learning . . . . . . . . . . . . . . . . . . . . . . . . . . . . . . . . . 50
2.4 Database Creation . . . . . . . . . . . . . . . . . . . . . . . . . . . . . . . 512.5 Experimental Results . . . . . . . . . . . . . . . . . . . . . . . . . . . . . . 52
2.5.1 Protocols for the UVAD Database . . . . . . . . . . . . . . . . . . . 522.5.2 Parameters for the Filtering Process, Visual Rhythm Analysis and
Classification . . . . . . . . . . . . . . . . . . . . . . . . . . . . . . 532.5.3 Experiment I: Finding the Best Configuration . . . . . . . . . . . . 542.5.4 Experiment II: Influence of the Biometric Sensors . . . . . . . . . . 552.5.5 Experiment III: Influence of the Display Devices . . . . . . . . . . . 562.5.6 Experiment IV: Comparison to a State-of-the-Art Method for Photo-
Based Spoofing Attack Detection . . . . . . . . . . . . . . . . . . . 572.5.7 Experiment V: Evaluation of the Method in the Replay-Attack
Database . . . . . . . . . . . . . . . . . . . . . . . . . . . . . . . . 582.6 Conclusions and Future Work . . . . . . . . . . . . . . . . . . . . . . . . . 59

3 Face Spoofing Detection Through Visual Codebooks of Spectral Tem-poral Cubes 613.1 Introduction . . . . . . . . . . . . . . . . . . . . . . . . . . . . . . . . . . . 623.2 Related Work . . . . . . . . . . . . . . . . . . . . . . . . . . . . . . . . . . 65
3.2.1 Frequency-based approaches . . . . . . . . . . . . . . . . . . . . . . 653.2.2 Texture-based approaches . . . . . . . . . . . . . . . . . . . . . . . 663.2.3 Motion-based approaches . . . . . . . . . . . . . . . . . . . . . . . . 67
3.3 Proposed Method . . . . . . . . . . . . . . . . . . . . . . . . . . . . . . . . 673.3.1 Low-Level Descriptor Extraction . . . . . . . . . . . . . . . . . . . 683.3.2 Mid-Level Descriptor Extraction . . . . . . . . . . . . . . . . . . . . 713.3.3 Classification . . . . . . . . . . . . . . . . . . . . . . . . . . . . . . 73
3.4 Experiments and Results . . . . . . . . . . . . . . . . . . . . . . . . . . . . 733.4.1 Datasets . . . . . . . . . . . . . . . . . . . . . . . . . . . . . . . . . 733.4.2 Experimental Protocol . . . . . . . . . . . . . . . . . . . . . . . . . 743.4.3 Method Parameterization . . . . . . . . . . . . . . . . . . . . . . . 763.4.4 Experimental Design and Analysis . . . . . . . . . . . . . . . . . . 763.4.5 Summary After Analyzing Different Factors and Levels . . . . . . . 793.4.6 Results . . . . . . . . . . . . . . . . . . . . . . . . . . . . . . . . . . 80
3.5 Conclusions and Future Work . . . . . . . . . . . . . . . . . . . . . . . . . 86
4 Deep Representations for Iris, Face, and Fingerprint Spoofing Detection 894.1 Introduction . . . . . . . . . . . . . . . . . . . . . . . . . . . . . . . . . . . 904.2 Related Work . . . . . . . . . . . . . . . . . . . . . . . . . . . . . . . . . . 93
4.2.1 Iris Spoofing . . . . . . . . . . . . . . . . . . . . . . . . . . . . . . . 934.2.2 Face Spoofing . . . . . . . . . . . . . . . . . . . . . . . . . . . . . . 944.2.3 Fingerprint Spoofing . . . . . . . . . . . . . . . . . . . . . . . . . . 954.2.4 Multi-modalities . . . . . . . . . . . . . . . . . . . . . . . . . . . . 95
4.3 Benchmarks . . . . . . . . . . . . . . . . . . . . . . . . . . . . . . . . . . . 964.3.1 Iris Spoofing Benchmarks . . . . . . . . . . . . . . . . . . . . . . . 964.3.2 Video-based Face Spoofing Benchmarks . . . . . . . . . . . . . . . . 964.3.3 Fingerprint Spoofing Benchmarks . . . . . . . . . . . . . . . . . . . 984.3.4 Remark . . . . . . . . . . . . . . . . . . . . . . . . . . . . . . . . . 98
4.4 Methodology . . . . . . . . . . . . . . . . . . . . . . . . . . . . . . . . . . 984.4.1 Architecture Optimization (AO) . . . . . . . . . . . . . . . . . . . . 984.4.2 Filter Optimization (FO) . . . . . . . . . . . . . . . . . . . . . . . . 1014.4.3 Elementary Preprocessing . . . . . . . . . . . . . . . . . . . . . . . 1034.4.4 Evaluation Protocol . . . . . . . . . . . . . . . . . . . . . . . . . . . 1044.4.5 Implementation . . . . . . . . . . . . . . . . . . . . . . . . . . . . . 105
4.5 Experiments and Results . . . . . . . . . . . . . . . . . . . . . . . . . . . . 1054.5.1 Architecture Optimization (AO) . . . . . . . . . . . . . . . . . . . . 1074.5.2 Filter Optimization (FO) . . . . . . . . . . . . . . . . . . . . . . . . 1074.5.3 Interplay between AO and FO . . . . . . . . . . . . . . . . . . . . . 1104.5.4 Runtime . . . . . . . . . . . . . . . . . . . . . . . . . . . . . . . . . 1114.5.5 Visual Assessment . . . . . . . . . . . . . . . . . . . . . . . . . . . 112
4.6 Conclusions and Future Work . . . . . . . . . . . . . . . . . . . . . . . . . 113

5 Counteracting Presentation Attacks in Face, Fingerprint, and Iris Recog-nition 1155.1 Introduction . . . . . . . . . . . . . . . . . . . . . . . . . . . . . . . . . . . 1165.2 Related Work . . . . . . . . . . . . . . . . . . . . . . . . . . . . . . . . . . 118
5.2.1 Face Presentation Attack Detection . . . . . . . . . . . . . . . . . . 1185.2.2 Fingerprint Presentation Attack Detection . . . . . . . . . . . . . . 1215.2.3 Iris Presentation Attack Detection . . . . . . . . . . . . . . . . . . . 1235.2.4 Unified Frameworks to Presentation Attack Detection . . . . . . . . 125
5.3 Methodology . . . . . . . . . . . . . . . . . . . . . . . . . . . . . . . . . . 1265.3.1 Network Architecture . . . . . . . . . . . . . . . . . . . . . . . . . . 1265.3.2 Training and Testing . . . . . . . . . . . . . . . . . . . . . . . . . . 1265.3.3 Memory Footprint . . . . . . . . . . . . . . . . . . . . . . . . . . . 128
5.4 Metrics and Datasets . . . . . . . . . . . . . . . . . . . . . . . . . . . . . . 1285.4.1 Video-based Face Spoofing Benchmarks . . . . . . . . . . . . . . . . 1285.4.2 Fingerprint Spoofing Benchmarks . . . . . . . . . . . . . . . . . . . 1295.4.3 Iris Spoofing Benchmarks . . . . . . . . . . . . . . . . . . . . . . . 1305.4.4 Error Metrics . . . . . . . . . . . . . . . . . . . . . . . . . . . . . . 131
5.5 Results . . . . . . . . . . . . . . . . . . . . . . . . . . . . . . . . . . . . . . 1325.5.1 Face . . . . . . . . . . . . . . . . . . . . . . . . . . . . . . . . . . . 1325.5.2 Fingerprints . . . . . . . . . . . . . . . . . . . . . . . . . . . . . . . 1345.5.3 Iris . . . . . . . . . . . . . . . . . . . . . . . . . . . . . . . . . . . . 136
5.6 Conclusions . . . . . . . . . . . . . . . . . . . . . . . . . . . . . . . . . . . 140
6 Leveraging Shape, Reflectance and Albedo from Shading for Face Pre-sentation Attack Detection 1436.1 Introduction . . . . . . . . . . . . . . . . . . . . . . . . . . . . . . . . . . . 144
6.1.1 Optical Properties of the Light and Rationale of Proposed Approach 1456.1.2 Contributions and Organization . . . . . . . . . . . . . . . . . . . . 146
6.2 Related Work . . . . . . . . . . . . . . . . . . . . . . . . . . . . . . . . . . 1476.3 Proposed Method . . . . . . . . . . . . . . . . . . . . . . . . . . . . . . . . 149
6.3.1 Surface Reconstruction: Recovering the Depth, Reflectance andAlbedo maps . . . . . . . . . . . . . . . . . . . . . . . . . . . . . . 149
6.3.2 Convolutional Neural Network for Learning Intrinsics Surface Prop-erties . . . . . . . . . . . . . . . . . . . . . . . . . . . . . . . . . . . 151
6.4 Experimental Results . . . . . . . . . . . . . . . . . . . . . . . . . . . . . . 1526.4.1 Datasets . . . . . . . . . . . . . . . . . . . . . . . . . . . . . . . . . 1526.4.2 Experimental Protocols . . . . . . . . . . . . . . . . . . . . . . . . . 1536.4.3 Experimental Setup . . . . . . . . . . . . . . . . . . . . . . . . . . . 1546.4.4 Evaluation of the Proposed CNN Architecture . . . . . . . . . . . . 1546.4.5 How to Feed the Proposed CNN Network with the Different Maps? 1556.4.6 Intra-dataset Evaluation Protocol . . . . . . . . . . . . . . . . . . . 1566.4.7 Inter-dataset Evaluation Protocol . . . . . . . . . . . . . . . . . . . 1596.4.8 Comparison with State-of-the-Art Methods . . . . . . . . . . . . . . 1596.4.9 Visual Assessment . . . . . . . . . . . . . . . . . . . . . . . . . . . 161
6.5 Conclusion and Future Work . . . . . . . . . . . . . . . . . . . . . . . . . . 162

7 Conclusions and Future Work 1647.1 Final Remarks . . . . . . . . . . . . . . . . . . . . . . . . . . . . . . . . . . 1647.2 Directions for Future Work . . . . . . . . . . . . . . . . . . . . . . . . . . . 1657.3 Other Applications to Algorithms Presented in this Thesis . . . . . . . . . 166
7.3.1 Detection of (Illegal) Copyrighted Video Recapture . . . . . . . . . 1667.3.2 Image Tampering Detection . . . . . . . . . . . . . . . . . . . . . . 167
7.4 Publications During this Doctoral Research . . . . . . . . . . . . . . . . . 1677.5 Source Code Available Along with this Thesis . . . . . . . . . . . . . . . . 171
Bibliography 172
A Ethics Committee Approval 191
B Convolutional Network Operations 197
C Copyright Permissions 199

24
Chapter 1
Introduction
“One can only see what one observes, and one observes only things which arealready in the mind.”
—Alphonse Bertillon, French police officer & biometric researcher (1853–1914)
“A really intelligent nation might be held together by far stronger forces thanare derived from the purely gregarious instincts. A nation need not be a mob ofslaves, clinging to one another through fear, and for the most part incapable of
self-government, and begging to be led; but it might consist of vigorousself-reliant men, knit to one another by innumerable ties, into a strong, tense,
and elastic organisation.”—Sir Francis Galton, English sociologist, anthropologist, inventor, mathematician,
statistician, etc. (1822–1911)
THIS thesis addresses a still open problem in a subfield of the biometric researchrelated to security aspects of biometric systems, named as presentation attack de-
tection (PAD), which can be briefly described as the ability of detecting attempted attackperformed by an impostor user that seeks to deceive the authentication system by pre-senting to the acquisition sensor a synthetic biometric sample of a legitimate user enrolledin the system.
We organize this thesis as a compilation of articles published (or submitted for publica-tion) in scientific journals containing proposals of algorithms and methodologies designedto protect biometric systems against presentation attacks. In this chapter, we discuss thebasic concepts in biometrics and the benefits of its use to a reliable and transparent au-thentication. Next, we discuss the limitations related to security aspects of such systems,focusing on the presentation attacks vulnerability, as well as the hypotheses establishedin this thesis, the main contributions of this research and their relationships with theremaining chapters of this document.

25
1.1 Basic Concepts in Biometrics
The protection of personal data has become a fundamental requirement of security. Ac-cording to Tipton [250], information security is concerned with the development of meth-ods and tools for protecting information and preserving the value it has for an individualor an organization. For efficient and effective protection, the use of robust authenticationmechanisms is paramount.
Knowledge-based methods (e.g., password, secret question) and token-based methods(e.g., smart cards, token codes) are probably the most used authentication mechanismsto date. However, these methods have a critical feature: at the time of authentication,the system does not verify who is requesting access, but rather what the users know orpossess. This aspect renders the system vulnerable since that knowledge or an object canbe easily lost, shared or manipulated. As an alternative, biometrics is an authenticationmechanism considered more natural and reliable as it focuses on verifying who is theperson requesting the access [109].
Biometrics provides methods to recognize humans automatically based on their behav-ior, physical or chemical traits, being the fingerprint, face, iris, hand geometry, hand veinand DNA, the most common traits used for deploying such systems [109]. According tothe nature of the application, we might have one or more traits more suitable to be usedin a biometric system. In forensic applications such as corpse identification, the DNAmight be a better choice to identify a victim due to the natural body’s deterioration. Onthe other hand, in government applications (e.g., driver’s license, voting, border control),face and fingerprint traits might be more suitable for authenticating users of the systemdue to the ease in measuring these characteristics. Jain et al. [110] describe seven factorsthat could help to determine the suitability of a trait to a biometric system: universality,uniqueness, permanence, measurability, performance, acceptability, and circumvention.
Independent of the traits used to recognize a person, a biometric system can operatein two modes, namely verification and identification modes. In the first mode of opera-tion, the system recognizes a user, recovering the template that was previously extractedand stored in a database, at the time of enrollment, and compares it with the templateextracted at the time of the authentication claim (query). This comparison is performedby a matching algorithm that produces a similarity score that indicates whether the useris who he claims to be, in the case in that the similarity score is higher than a thresholdpreset for each user. In the second mode of operation, the system compares the query ofthe user with N templates enrolled in the database. In this case, the matching algorithmproduces N similarity scores, such that a higher score indicates the identity of the user.Figure 1.1 illustrates the architecture of a generic biometric system.
1.2 Presentation Attacks in Biometrics
Although several traits can be used in an authentication process, researchers are con-stantly looking for biometric traits with low acquisition and storage costs, that are lessinvasive, present a high degree of uniqueness and are stable. However, the static nature

26
ENROLLMENT PROCESS
Acquisitionsensor
Identity
AUTHENTICATION PROCESS
Claimed identity(verification mode)
Identity (identification mode)
orGenuine/Impostor(verification mode)vulnerability points
(a)
(b) (c) (d)
(i)
(f)
(e)
(h)
(g)
Pre-processing Featureextraction
Templatedatabase
Acquisitionsensor
Pre-processing Featureextraction
Matchingalgorithm
ACQUISITION PROCESS
Figure 1.1: Overview of the authentication process in a generic biometric system. Thefirst stage consists of the enrollment process, in which a biometric sample of the user iscaptured by the sensor, and submitted to the pre-processing module for noise removal,enhancement of the data, among other features. Next, the pre-processed sample is used bythe feature extraction module responsible for extracting the main patterns and featuresrelevant to the authentication, generating a specific user template which is stored inthe database. In the second stage, when the user tries to authenticate, the template issubmitted to the matching algorithm that compares the input template with the onesstored in the database. The red points represent some vulnerabilities when the biometricsystem is unprotected against such threats (adapted from [202]).
of a stable biometric trait suggests “the paradox of secure biometrics” [167]:
“An authenticator must be stable and distinctive to be considered a good authen-ticator. But, stability leaves no option for compromise recovery, since userscannot change their biometric trait if stolen. Moreover, since a biometric clueis not secret, its information can be learned and copied.”
Despite a stable biometric trait being an ideal authenticator, in practice, its use wouldnot work if it were learned or copied. Therefore, researchers have striven to developmethods that detect whether a biometric sample presented to the acquisition sensor is areplica of the original sample. In the literature, the act of presenting a synthetic biometricsample of some genuine user to the acquisition sensor in order to authenticate itself asa legitimate user is known as presentation attack. Figure 1.1 shows a general biometricauthentication system without any protective measure and some points of vulnerabilities.In point (a), we have a threat resulting from an attack on the biometric sensor, presenting asynthetic biometric sample (fake). In points (b), (c), (d), and (e), we have threats resultingfrom re-submission of a biometric latent signal previously stored in the communicationchannel. In (f), it can occur an attack on the matching algorithm in order to producea higher or lower score. In point (g), we have a threat on the communication channel

27
between the enrollment center and the database (the control of this channel allows anattacker to overwrite the template that is sent to the biometric database). In (h), wehave a threat on the database itself, which could result in corrupted models, denial ofservice to the person associated to the corrupted model, or fraudulent authorization of anindividual. Finally, in point (i), we have a threat that consists of overwriting the output ofthe matching algorithm, bypassing the authentication process. Other abuses in biometricsystems can be found in more details in Campisi [34].
Although effective in many situations, a biometric system should have protectionagainst presentation attacks. Erdogmus et al. [66] evaluated the behavior of a facebiometric system protected with an anti-spoofing solution proposed in [151] and Mi-crosoft’s Kinect motion sensor under attempted attacks performed with static 3-D masks.Kose et al. [127] demonstrated that the face verification system is vulnerable to presenta-tion attacks. In addition, the same authors evaluated the anti-spoofing method proposedin [151], which was proposed to detect photo-based attacks.
Besides these evidences made in laboratories about vulnerability of biometric systemsagainst presentation attacks, real cases confirm the problem. In the city of Ferraz deVasconcelos, São Paulo state, Brazil, a medical of the SAMU (service of mobile healthcare and urgency) was caught red-handed by the police using silicone fingers to bypass theauthentication system and marking presences at work for co-workers [147]. A similar caseit has been investigated by the Federal Police, in which workers of the Paranaguá Harbor,Paraná state, Brazil, where suspects used silicone fingers to circumvent the biometricsystem for registering the worked hours of employees [35]. In Germany, the biometricshacking team of the Chaos Computer Club has managed to hack Apple’s iPhone TouchID [10], demonstrating that a biometric system without an adequate protection is unsuit-able as an access control method. Other cases of impostors bypassing surveillance systemswith 3D masks can be found in [210,211].
In face of such overwhelming evidence of the need for more secure biometric systemsand effective detection of attacks, in this thesis, we investigate the presentation attackproblem considering the three different biometric traits: fingerprint, iris, and face. Amongseveral forms of biometrics, face recognition is of paramount importance with outstandingsolutions presented thus far such as deformable models [262], texture-based representa-tions [2], and shape-based representations [145]. Although effective in many cases, ac-cording to Maltoni et al. [153], face, signature and voice are the easiest biometric signalsto be circumvented. For instance, presentation attacks can be successfully accomplishedin a face biometric system if an impostor obtains access by presenting to the acquisitionsensor a photography, a digital video or a 3D model of the target person [109]. Evenwith recent advances in biometrics, information forensics and security, the vulnerabilityof facial biometric systems against presentation attacks is still an open problem.
Iris-based biometrics is another important modality used to recognize people. Thehigh accuracy rate and speed of iris-based recognition systems make them a promisingmodality [109]. However, such modality is not free of presentation attacks, which arenormally performed using printed iris images [229] or, more interestingly, cosmetic contactlenses [32, 264]. Finally, in fingerprint-based biometric systems, the most common pre-sentation attack method consists of using synthetic samples [83] created in a cooperative

28
way, where a mold of the fingerprint is acquired with the cooperation of a valid user andis used to replicate the user’s fingerprint with different materials, including gelatin, latex,play-doh or silicone. Latent fingerprints left on a surface may also be used and furtherenhanced after acquisition with a digital camera.
1.3 Research Vision: New Insights for the PresentationAttack Detection Problem
During the production of synthetic biometric data, inevitably, there are noise informationand telltales added to the biometric signal that can be captured and further processed topinpoint attacks. In fact, in the manufacturing process of a synthetic sample, there are,at least, two re-quantization and re-sampling steps of the original biometric signal. Forexample, in the photo- and mask-based face presentation attacks, the continuous signalis quantized and sampled during the digitization process. Then, this digital version isre-quantized and re-sampled due to the printing process with 2D and 3D printers andagain digitized during the presentation of the synthetic data to the acquisition sensor.In print-based iris presentation attacks, the process of generation of the synthetic sam-ples are comparable to the photo-based face attempted attacks and, therefore, we alsomay have noise and telltales upon synthetic data. In video-based face presentation at-tacks, the continuous signal is digitized and recaptured by the acquisition sensor duringan attempted attack. The same reasoning can be applied to the fingerprint-based recog-nition systems, considering the user cooperation scenario, or by using latent fingerprints.Examples of artifacts and telltales of presentation attacks added in synthetics biometricsample include blurring effects, printing artifacts, banding effects, distortions, flickering,and Moiré patterns. Henceforward, we will refer to the noise and artifacts contained in apresentation attack sample as a noise signature.
1.3.1 Problems with the Existing Approaches
The existing works in the literature for presentation attack detection basically explorethree lines of investigation: methods based on texture analysis [117,125,139,141,151,152,181,214,245], based on motion and clues of the scene analysis [8,41,160,176,177,253,267,274], and methods based on image quality [71,72,74,75].
Approaches based on motion and clues of the scene explore the motion informationinside the face region (e.g., eye blinks, small movements in the face region) and outsideof the face region (e.g., background). These methods estimate the motion informationpresent in these two regions and analyze them over time. Although this approach achievedgood results to detect photo-based presentation attacks, the constraints made by thesemethods (e.g., static background) may render the detection of the video-based attemptedattacks unfeasible, in practice. Moreover, the assumption of a background previouslyknown can restrict the use of the approach since in many applications (e.g., web andmobile applications) the data acquisition is performed remotely and, therefore, we cannotassume that. Besides, motion is easily simulated by rotating or bending the photographs,

29
which can potentially deceive the motion detectors. Another disadvantage of approachesbased on motion analysis is that the additional time required to capture some face motionsprevents a fast spoofing detection. For example, a type of motion analysis extensivelyexplored in the literature is the action of eye blink that occurs once every four or sixseconds. However, this rate can decrease to an average of three to eight every six secondsdue to psychological factors [140]. In this case, at least 20 seconds are required to detecteye blinking.
Regarding methods based on texture analysis, their main drawback consists of pre-senting poor results when we consider high-definition attempted attacks such as print-based images with high-quality printouts and video attacks performed with high-resolutionscreens. The attempted attacks performed with low-resolution printed images [36] pro-duce a considerable amount of artifacts, which can be easily detected via texture analysisfrom the original image space. In the video-based attempted attack, these coarse artifactsare practically absent and, therefore, the proposal of more robust methods for detectingthese artifacts is necessary. This evidence was confirmed in the 2nd Competition for FaceSpoofing Attack [42] and is explored in this thesis.
Although existing PAD algorithms showed good performance results for the intra-dataset evaluation protocol, in which the training and test partitions are from the samedataset (i.e., same domain), the main drawbacks of the current PAD algorithms appearwhen we consider more challenging protocols and testing scenarios such as inter-datasetand cross-sensor scenarios. The inter-dataset protocol proposes the validation of a PADalgorithm considering the training and testing stages in a completely different scenarioby establishing partitions for training and testing whose samples come from differentsources. In this case, we have sets for training and testing built in different conditions(e.g., different sensors, different environments, without overlapping of identities, differentillumination conditions, different presentation attack instruments (PAI), different attacktypes, among others). Similarly, the cross-sensor scenario considers testing sets comprisingdata captured with a sensor, or set of sensors, different from those used for capturingthe training data. In this thesis, we also investigate the cross-sensor and inter-datasetscenarios, since such evaluation protocols are more challenging and suitable for reflectinga real operating scenario.
1.3.2 Hypothesis Statements
This thesis introduces alternatives for detecting presentation attacks, taking into accountour understanding of limitations of the current approaches and our understanding of theproblem itself. The thesis hypotheses presented in this section reflect directions of newperspectives to deal with this problem:
Hypothesis 1: Noise signatures extracted of biometric samples contain meaningful tell-tales for an effective presentation attack detection, in comparison to existing methods, dueto artifacts added to the synthetic biometric samples during its manufacturing process.
Hypothesis 2: Supervised feature learning techniques provide an effective representationof data for detecting presentation attacks in different biometric modalities, in comparisonwith existing techniques published in the literature.

30
Hypothesis 3: Facial surfaces estimated with a shape-from-shading technique containdistinguishable artifacts for a robust presentation attack detection, in comparison to exist-ing methods, which are added during the manufacture of synthetic samples and magnifiedthroughout the surface reconstruction.
Hypothesis 4: Shallow Convolutional Neural Networks trained with visual characteri-zations of the intrinsics properties of facial surfaces (i.e., albedo, reflectance, and depthmaps) provide an effective representation of data for detecting presentation attacks incross-domain scenarios, e.g., the inter-dataset scenario, in comparison to existing archi-tectures published in the literature.
1.3.3 Novelties and Rationales Brought in this Thesis
The rationales that motivate us to formulate these hypotheses came from a careful analysisof different results from the literature, which will be briefly explained in the next sectionsand deeply discussed in the remaining chapters of this thesis.
Investigation of approaches based on temporal and spectral analysis
As mentioned before, synthetic biometric samples inevitably contain noise and artifactsgenerated during their manufacture and recapture might be different from any patternfound in real biometric samples. According to Tan et al. [245] and Määttä et al. [151], thereis a deterioration of the facial information and, consequently, a loss of some high frequencycomponents during the manufacture of photographs to be used in spoofing attacks. Inour prior work [193], we highlighted the fact that there is a significant increase of the lowfrequency components due to the blurring effect added during the recapture process ofthe biometric sample displayed in tablets, smartphones and laptop screens. Besides theblurring effect, other artifacts are added such as flickering, Moiré patterns, and bandingeffect [14].
These facts motivated us to propose a solution that takes advantage of the noisesignature contained on such presentation attack samples (Hypothesis 1). Chapters 2and 3 propose a Fourier analysis of the noise signature to capture the information encodedin the frequency, phase and amplitude of the component sinusoids [236]. In these chapters,we use Fourier spectrum to quantify the following artifacts:
• Blurring artifact: In both production and recapture processes, inevitably we have adecrease in the details of biometric samples due to re-quantization and re-samplingof the original signal. This reduction of details is reflected in the increase of lowfrequency components and can be observed in the Fourier domain;
• Flickering effect: It corresponds to the horizontal and vertical lines equally spacedthat appear during the recapture process of samples shown to the acquisition sensorwith the display device. When this artifact appears in biometric samples, there arepeak lines at abscissa and ordinate axes of the Fourier spectrum when the displaydevice is aligned with the acquisition sensor;

31
• Moiré patterns: They are patterns that can appear when a display device is used toperform an attempted attack. In general, this effect is generated when two similarpatterns are overlaid with a small difference in rotation from each other. As a result,we also have the appearance of peaks in different locations in the Fourier spectrumdepending on the frequency and direction of the sinusoid in the spatial domain [236].
The main novelty brought in these studies are two-fold: (i) a new perspective ofusing Fourier analysis to detect presentation attacks, which is performed upon the noisesignature extracted from the biometric sample under analysis; and (ii) novel techniquesfor describing spectral information over time, which led us to propose some time-spectraldescriptors. Previous attempts of using the Fourier analysis in this problem [139,141,245],considered its use on the original image representation, which turns this analysis highlysensitive to illumination conditions and image resolutions [141] since these factors causea considerable disturbance in the frequency components of the Fourier spectrum. On theother hand, our studies demonstrated that the spectral analysis is a powerful mathematicaltool for detecting presentation attacks if we consider the noise signature and discard thecontents of the images under analysis.
Investigation of supervised feature learning techniques for the PAD problemacross different biometric modalities
Inspired by Pinto et al. [196] and Bergstra et al. [21], this research investigated the Hy-pothesis 2 considering three approaches to building convolutional networks: the archi-tecture optimization-based approach, filter optimizations, and an interplay between thesetwo techniques.
The architecture optimization consists of exploring thousands of candidate models byconsidering a search space for the parameters related to the architectural aspect (hyper-parameters) of the networks. To enable a fast evaluation of a set of candidate models, weskipped the filter learning process to the detriment of using filters with random weights.In this work, we evaluate two strategies for searching good hyper-parameters, the randomsearch strategy and the Tree-structured Parzen Estimator Approach (TPE) [21]. On theother hand, the filter optimization process is a traditional method for building convolu-tional networks that consists of learning proper weights for the filters of the convolutionallayers.
Chapter 4 aims to investigate shallow convolutional neural networks (CNN) by con-sidering these two strategies and their combination (Hypothesis 4). This study waspioneered in exploring CNN for the presentation attack detection problem and the nov-elty of this work consists of finding a shallow CNN, named SpoofNet, suitable for the threemodalities considered in this thesis (Hypothesis 2).
Finally, Chapter 5 introduces a methodology to adapt the Visual Geometry Group(VGG) network [233], for automatically learning features for the presentation attack prob-lem also considering the three modalities examined in this thesis (Hypothesis 2). Themain purpose of this chapter is to investigate the feature learning process, using a deepCNN architecture, under the intra- and inter-dataset scenarios.

32
Investigation of telltales of presentation attacks presented in the facial surfacereconstructed using shape-from-shading method
Chapter 6 presents an investigation of a novel approach to PAD based on the opticaland physical properties of the scene captured by the acquisition sensor (Hypothesis 3).Our method takes advantage of the depth, reflection and albedo information, associatingthem with light properties of the scene to detect an attempted attack. For estimatingthese properties, we use a classic technique in computer vision known as shape-from-shading (SfS) [99], which aims to reconstruct the surface of an object based on the shadinginformation present in its surface.
The law of refraction [249] (also known as Snell’s law or Snell–Descartes law) establishan understanding of the physical mechanism of the light refraction, in terms of absorptionand irradiation of the light incident on a surface. Complementary, the reflection’s lawgoverns the reflection of the incident light and states that the incident ray, the reflectedray, and the normal to smooth conducting surfaces (e.g., mirror or polished metal) all liein the same plane [249]. According to refraction and reflection laws, the beam of lightthat affects a flat surface may be absorbed, transmitted, and reflected, and the directionsof the light refracted and reflected can be predicted considering the refraction index of thematerial and the roughness of its surface, i.e., the smoothness or texture of the surface.
When a beam of light affects a truly flat surface, each incident ray is reflected atthe same angle that we have between the surface normal and such incident ray, buton the opposite side of the surface normal. In contrast, when a beam of light affectsrough surfaces, the incident light is reflected in several different directions. An idealdiffuse reflecting surface that reflects the incident light in all directions is said to exhibit aLambertian reflection. These two processes are known as specular and diffuse reflection,respectively. Although many materials can exhibit both types of reflection, some materialsreflect the light in a way that is more diffuse than specular way (e.g., paper fibers, non-absorbing powder such as plaster, poly-crystalline material such as white marble, amongothers) [70, 116, 165, 252], which makes this property very promising to our problem.Chapter 6 discusses this and other properties in detail.
The main novelties brought in this line of investigation include: (i) a novel PADalgorithm able to detect evidence of attempted attacks, taking into account artifactspresent in the reconstructed surface; (ii) the use of the depth information without usingany extra device, which enables the use of our approach in biometric systems equippedwith a single RGB camera; (iii) promising performance results for detection through theintra- and inter-dataset scenarios; and (iv) a novel shallow CNN architecture for learningfeatures from the albedo, reflectance and depth maps (Hypothesis 4, which was also anobject of investigation in Chapter 6).
1.4 Key Contributions
Figure 1.2 summarizes the main contributions of this thesis, as well the main challengesand advancements achieved in each step of this research. The other contributions obtainedalong this thesis will be discussed in their respective chapters.

33
Contribution 1. A new algorithm that takes advantage of the spectral analysis of thenoise signature of the video under analysis and the summarization technique, namely vi-sual rhythm, to generate discriminative texture maps able to reveal attempted attacks.To the best of our knowledge, this is the first method published in the literature thatuses noise signature information to detect face presentation attacks, giving new alterna-tives to solve the problem. We summarize the main progresses obtained in this study inAdvancement 2 and 4, described in Fig. 1.2 (see Chapter 2 for more detail).
Contribution 2. An effective method for face presentation attack detection able to rec-ognize different types of attacks, including video-, photo- and 3-D mask-based attemptedattacks. We present an effective algorithm based on spectral analysis of the noise sig-nature that takes advantage of the spectral and temporal information that outperformsthe current state-of-the-art methods to detect face presentation attacks based on tex-ture and motion analysis. The foremost advance achieved in this work was the designof an effective time-spectral descriptor, showing that the noise signal analysis is in factan important source of evidence for designing new anti-spoofing algorithms. The mostexpressive progresses achieved in this study are summarized in Advancement 3 and 4(see Chapter 3).
Contribution 3. A unified framework able to detect presentation attacks in face-,fingerprint- and iris-based biometric systems based on deep learning techniques. In thiswork, we show effective learning representation strategies for the modalities of biometricswe consider herein. The proposed unified framework was effective when tested with smalldatasets. We proposed three deep feature characterization architectures based on Con-volutional Neural Networks, one for each modality, that outperform several anti-spoofingmethods published in the literature. We summarized the main progresses obtained in thisstudy in Advancement 5 and 7 (see Chapter 4 for more details).
Contribution 4. The proposal of an anti-spoofing solution for the three modalitieswidely employed to design biometric systems, i.e., face, iris, and fingerprint, based onVGG network architecture, a popular deep network originally proposed for the objectrecognition problem. In this study, we showed a methodology to adapt the VGG networkto the two-class presentation attack problem, which was evaluated by considering themost challenging scenarios such as classification across different attack types, biometricsensors, and qualities of samples used during the attacks, besides presenting performanceresults for the intra- and inter-dataset scenarios. The main progresses achieved in thisstudy are presented in Advancement 6 and 7 (see Chapter 5 for more details).
Contribution 5. An effective PAD solution that takes advantage of intrinsic propertiesof the objects of interest (in our case, we deal with faces) such as reflectance, albedoand depth information to a reveal attempted attack. We propose the use of a shape-from-shading technique to reconstruct facial surfaces in order to highlight telltales ofpresentation attacks present in the biometric samples. Our results show that the proposedalgorithm works well for detecting different attack types even considering more challenging

34
operation scenarios, simulated with tests considering the multi-sensor scenario and theinter-dataset protocol evaluation. We summarized the main progresses achieved in thisstudy in Advancement 8 and 9 (see Chapter 6 for more details).
Contribution 6. An effective shallow CNN architecture suitable for learning mean-ingful features from the surfaces reconstructed with a shape-from-shading method. Acomparison between the proposed shallow CNN architecture and some popular deep ar-chitecture that demonstrated the effectiveness of our CNN architecture for learning usefulpatterns to our problem, even considering the multi-sensor and inter-dataset scenarios.The main expressive progresses achieved in this study are summarized in Advancement10 and 11 (see Chapter 6 for more details).
Contribution 7. The creation of a large and publicly available benchmark consider-ing several display devices and different acquisition sensors. This dataset contains 808
valid access videos and 16, 268 videos of video-based presentation attacks, all in full high-definition quality, captured from 404 people1. This is the largest and the first multisensor-based dataset to evaluate face anti-spoofing methods, whose valid access and at-tempted attack videos were captured with six sensors of different manufacturers. Thisdataset allowed us to achieve an important conclusion, not yet reported in the literature,regarding the possible impact/influence of the sensor upon the performance of a presen-tation attack detection system. We summarized the main progress obtained in this studyin Advancement 1 (see Chapter 2 for more details).
1.5 Thesis Organization
We organized this thesis as a compilation of articles published (or submitted for publica-tion) in international scientific venues in the area of Information Forensics and Security,Image Processing and Neural Networks and Learning Systems. In total, we published theresults achieved in this thesis in three journals, one chapter of a book, and one manuscriptsubmitted for publishing, also in a journal. Chapter 2 presents a proposed method forface presentation attack detection based on a summarization technique, namely visualrhythm, which takes advantage of the spectral and temporal information by analyzingthe noise signatures generated by the video acquisition process. Chapter 3 describes aneffective time-spectral descriptor for face presentation attack detection able to character-ize telltales present in both spectral and temporal domains, which proved to be a veryeffective approach to detect attempted attacks performed with different type of attacks(e.g., printed photos, replay attack and 3D mask). Chapters 4 and 5 present a unifiedsolution able to detecting attempted attacks in face-, iris- and fingerprint-based biometricsystems, while Chapter 6 introduces a PAD algorithm that takes advantage of intrin-sic properties of the facial surfaces. Finally, Chapter 7 presents conclusions and finalremarks of the research presented in this thesis.
1The users present in the database formally authorized the release of their data for scientific purposes(see Appendix A).

35
The current public datasets have drawbacks in terms of sample size and diversity in sensors. So, we built a large and public dataset, with more than 17K videos captured with six different sensors of 404 identities.
Advancement 1: The release of a large and public dataset for evaluating anti-spoofing methods for face-based biometrics (Contribution 5, Chapter 2).
Investigation of new representation techniques for noise patterns, based on visual codebook, that incorporates spectral and temporal information of the signal under analysis.
Advancement 2: The proposal of an effective anti-spoofing method for face-based biometric systems based on visual rhythm technique (Contribution 1, Chapter 2).
Advancement 3: The proposal of a new effective strategy for detecting attempted attacks in face authentication systems based on visual condebooks of spectral temporal features (Contribution 2, Chapter 3).
Advancement 4: The achievement of results that corroborate the Hypothesis 1.
The investigation of different approaches to designing a Convolutional Neural Network (CNN) architecture appropriate for the PAD problem, considering the three modalities under investigation in this thesis.
Advancement 5: The proposal of a unified framework to design PAD solutions based on shallow CNN networks, which allow us to find a suitable network, the SpoofNet, able to detect different attack types on different modalities (Contribution 3, Chapter 4).
Advancement 6: A methodology for adapting the VGG network to the two-class presentation attack problem considering several testing scenarios such as different attack types, biometric sensors, and the inter-dataset scenario (Contribution 4, Chapter 5).
Advancement 7: The achievement of results present in Chapters 4 and 5 corroborates the Hypothesis 2.
The investigation of a shape-from-shading technique to reconstruct the face surfaces in order to estimate their properties such as albedo, reflectance, and depth information
Advancement 8: The novel face presentation attack detection algorithm able to identify different attack types, which presented good perfomance results even considering the cross-sensor and inter-dataset scenarios (Contribution 5, Chapter 6).
Advancement 9: The achievement of results that corroborate the Hypothesis 3.
RQ2: How to model the noise signature toward revealing useful telltales for detecting a presentation attack?
Remark: The main challenge is to discover new patterns in the noise signal recaptured from videos useful for the problem.
New question
Action
Action
New question
RQ4: Can the optical and physical properties of the scene allow us to detect differences between synthetic faces (e.g., sintetic materials) and real ones (e.g., skin texture)?
Remark: The main challenge is to infer intrinsic properties of the scene, 3-D structure of the world from 2-D images, in a real problem
RQ3: Is it possible to design an effective algorithm or methodology using representation learning (RL) techniques toward finding a holistic solution able to detect spoofing attacks in face, iris and fingerprint recognition systems?
Remark: The main challenge is how to handle small datasets since that RL needs large datasets to learn discriminative representa-tions.
Action
Action
New question
RQ1: What is the influence of the biometric sensors upon the performance of a system?
Remark: The main challenge is how to deal with data from multiple sources.
RQ5: How to extract meaningful features from the different maps obtained from the face surfaces reconstruction?
Remark: The main challenge is finding holistic method to deal with these different representations.
New question
Action
The investigation of shallow and deep CNN architectures for representation learning from the albedo, reflectance, and depth maps.
Advancement 10: A novel CNN architecture able to learn meaningfull features for the PAD problem considering the different maps obtained from surface reconstruction process (Contribution 6, Chapter 6).
Advancement 11: The achievement of results that corroborate the Hypothesis 4.
Figure 1.2: This roadmap shows the main contributions of this thesis, Research Questions(RQs) driving our research, main challenges and advancements achieved in our work.
36
Chapter 2
Using Visual Rhythms for DetectingVideo-based Facial Spoof Attacks
“When you run by yourself, you go fast; But when you run with others, youcan go so far.”
—Maggie MacDonnell, Global Teacher Prize 2017 Winner
“The art and science of asking questions is the source of all knowledge.”—Thomas Berger, American novelist (1924–2014)
Abstract
Spoofing attacks or impersonation can be easily accomplished in a facial biometric sys-tem wherein users without access privileges attempt to authenticate themselves as validusers, in which an impostor needs only a photograph or a video with facial informa-tion of a legitimate user. Even with recent advances in biometrics, information forensicsand security, vulnerability of facial biometric systems against spoofing attacks is still anopen problem. Even though several methods have been proposed for photo-based spoof-ing attack detection, attacks performed with videos have been vastly overlooked, whichhinders the use of the facial biometric systems in modern applications. In this paper,we present an algorithm for video-based spoofing attack detection through the analysisof global information which is invariant to content, since we discard video contents andanalyze content-independent noise signatures present in the video related to the uniqueacquisition processes. Our approach takes advantage of noise signatures generated by
c©2015 IEEE. Personal use of this material is permitted. Permission from IEEE must be obtainedfor all other uses, in any current or future media, including reprinting/republishing this material foradvertising or promotional purposes, creating new collective works, for resale or redistribution to serversor lists, or reuse of any copyrighted component of this work in other works.Pre-print of article that will appear in T-IFS, vol.10, no.5, pp.1025-1038, May 2015.The published article is available on http://dx.doi.org/10.1109/TIFS.2015.2395139See permission to use the copyrighted material in Appendix C.

37
the recaptured video to distinguish between fake and valid access videos. For that, weuse the Fourier spectrum followed by the computation of video visual rhythms and theextraction of different characterization methods. For evaluation, we consider the novelUnicamp Video-Attack Database (UVAD) which comprises 17,076 videos composed of realaccess and spoofing attack videos. In addition, we evaluate the proposed method usingthe Replay-Attack Database, which contains photo-based and video-based face spoofingattacks.
2.1 Introduction
B IOMETRIC authentication is an important mechanism for access control that hasbeen used in many applications. Traditional methods, including the ones based
on knowledge (e.g., keywords, secret question) or based on tokens (e.g., smart cards),might be ineffective since they are easily shared, lost, stolen or manipulated. In contrast,the biometric access control has been shown as a natural and reliable authenticationmethod [107].
Access control can be seen as a verification problem wherein the authentication of auser is performed by reading and comparing the input biometric data captured by anacquisition sensor (query) with the biometric data of the same user previously stored in adatabase (template). The comparison between the query and the template is performedby a matching algorithm which produces a similarity score used to decide whether or notthe access should be granted to the user.
Although biometric authentication is considered a secure and reliable access controlmechanism, it becomes an easy target for attacks if protective measures are not imple-mented. Fig. 2.1 shows a general biometric authentication system without any protectivemeasure and some points of vulnerabilities. Buhan et al. [33] provide more details aboutabuses in biometric systems.
Spoofing attack is a type of attack wherein an impostor presents a fake biometric datato the acquisition sensor with the goal of authenticating oneself as a legitimate user (thisaction can be seen as an impersonation attack), illustrated in Fig. 2.1(a). Depending onthe biometric trait used by the system, this mode of attack can be easily accomplishedbecause some biometric data can be synthetically reproduced without much effort. Facebiometric systems are highly vulnerable to such attacks since facial traits are widelyavailable on the Internet, on personal websites and social networks such as Facebook1,MySpace2, YouTube3. In addition, we can easily collect facial samples of a person with adigital camera.
In the context of face biometrics, a spoofing attack can be attempted by presentingto the acquisition sensor a photograph, a video or a 3D face model of a legitimate userenrolled in the database. If an impostor succeeds in the attack using any of these ap-proaches, the uniqueness premise of the biometric system or its raison d’être is violated,making the system vulnerable [107].
1http://www.facebook.com2http://www.myspace.com3http://www.youtube.com

38
Figure 2.1: General biometric system and its vulnerability points. (a) a threat resultingfrom an attack on the biometric sensor, presenting a synthetic biometric data (fake); (b),(c) and (d) represent threats resulting from re-submission of a biometric latent signalpreviously stored in the communication channel; (e) attack on the matching algorithmin order to produce a higher or lower score; (f) an attack on the communication channelbetween the enrollment center and the database (the control of this channel allows anattacker to overwrite the template that is sent to the biometric database); (g) an attackon the database itself, which could result in corrupted models, denial of service to theperson associated to the corrupted model, or fraudulent authorization of an individual;(h) an attack that consists of overwriting the output of the matching algorithm, bypassingthe authentication process.
Several methods have been proposed in the literature to detect spoofing attacks basedon photographs, whereas attacks performed with videos and 3D models have been over-looked. Many methods aim at distinguishing real from fake biometric data based on thefact that artifacts are inserted into the printed samples due to printing process, thereforeallowing one to explore attributes related to such artifacts including color, shape andtexture [151, 214, 245]. Since photographs are static, another approach is to detect smallmovements in the face [140,176,263]. Recent works [8,177] investigate context informationof the scene (e.g., background information) to detect face liveness.
We believe that the aforementioned approaches are not suitable for detecting video-based attacks directly, especially in high resolution videos. The difficulty in detectingspoofing performed by video lies in the fact that it is easier to deceive an authenticationsystem through a video since the dynamics of the video makes the biometric data morerealistic. Furthermore, the content of a video is less affected by degradations in terms ofcolor, shape or texture, unlike the printed images. Finally, we have less artifacts generatedduring quantization and discretization of the image captured by the imaging sensor in highresolution videos.
In this paper, we present a method for detecting video-based face spoofing attacksunder the hypothesis that fake and real biometric data contain different acquisition-related

39
noise signatures. To the best of our knowledge, this is the first attempt of dealing withvideo-based face spoofing using analysis of global information that is invariant to the videocontent. Our solution explores the artifacts added to the biometric samples during theviewing process of the videos in the display devices and noise signatures added during therecapture process performed by the acquisition sensor of the biometric system. Throughthe spectral analysis of the noise signature and the use of visual rhythms, we designed afeature characterization process able to incorporate temporal information of the behaviorof the noise signal from the biometric samples.
In a previous work [193], we introduced an anti-spoofing solution that was evaluatedin an extended version of the Print-Attack database [8] given that, in the literature,there was no specific database to video-based face spoofing attacks. Originally, the Print-Attack database was developed to be used in the evaluation of photograph-based spoofingattack detection. As our aim in that work was also at video-based spoofing detection, wesimulated attempts of spoofing attacks using 100 videos of valid access in six monitors,generating 600 attempted attack videos. We reported near-perfect classification results(AUC ≈ 100%). That is due to the low resolution of original videos, which favored thehigh performance of our method, since noise signal was the main information used in it.Furthermore, in a more realistic attack, an impostor probably would create fake biometricsamples with the highest quality possible in order to minimize the differences between realand fake biometric samples.
To contemplate a more realistic scenario, this work extends upon our previous work [193]and also introduces the Unicamp Video-Based Attack Database (UVAD) 4, specificallydeveloped to evaluate video-based attacks in order to verify the following aspects:
• The behavior of the method for attempted attacks with high resolution videos;
• The influence of the display devices in our method;
• The influence of the biometric sensor in the proposed method;
• The best feature characterization to capture the video artifacts;
• Comparison with one of the best anti-spoofing methods for photo-based spoofingattack of notice.
Such verifications can be accomplished due to the diversity of the devices used to createthe database which comprises valid access and attempted attack videos of 404 differentpeople. Each user was filmed in two sections in different scenarios and lighting conditions.The attempted attack videos were produced using seven different display devices and sixdigital cameras from different manufacturers. The database has 808 valid access videosand 16, 268 videos of video-based attempted spoofing attacks, all in full high definitionquality.
In summary, the main contributions of this work are:4This database will be make public and freely available. Users present in the database formally
authorized the release of their data for scientific purposes (see Appendix A).

40
(i) An efficient and effective method for video-based face spoofing attack detection ableto recognize attempted attacks carried out with high-resolution videos;
(ii) The evaluation of the video characterization process considering different imagefeatures such as the Gray-Level Co-occurrence Matrices (GLCM), Histograms ofOriented Gradients (HOG) and Local Binary Patterns Histogram (LBP) featuredescriptors;
(iii) The creation of a large and publicly available benchmark to evaluate anti-spoofingmethods performed with videos considering several display devices and differentacquisition sensors;
(iv) A detailed study of the video-based spoofing attack problem that yielded importantconclusions that certainly will be useful for the proposition of new anti-spoofingmethods for video-based attacks not only in the biometric domain but also in otherapplications analyzing video recapture footprints.
We organize the remainder of this paper into five sections. Section 2.2 discussesstate-of-the-art methods for detecting spoofing attacks to face biometrics. Section 2.3presents the proposed method. Section 2.4 gives details regarding the proposed video-attack database while Section 2.5 shows and discusses the experimental results. Finally,Section 2.6 presents the conclusions obtained with this work.
2.2 Related Work
According to Pan et al. [175], there are four major categories of anti-spoofing methods:data-driven characterization, user behavior modeling, user interaction need, and the pres-ence of additional devices. Solutions that require extra devices are limited due to theirhigh cost, which can prevent large-scale use (e.g., deployment of an anti-spoofing solutionon all ATMs of a banking network). The user cooperation during the biometric authen-tication can also be used to facilitate spoofing attack detection, however, this procedurelessens the transparency and inserts an additional time in the authentication process. Fi-nally, the user behavior modeling approach (e.g., eye blinking, small face movements) hasbeen considered in the literature for photo-based face spoofing detection, nevertheless,this approach might not work well for video-based spoofing attack detection due to thehigh dynamics present in video scenes. Solutions based on data-driven characterizationexplore biometric data by thoroughly searching for evidence and artifacts useful to detectattempted attacks.
In this section, we review the literature on user behavior modeling and data-drivencharacterization methods, since such methods are preferable in practice because they arenon-intrusive and do not require extra devices or human interaction. Therefore, they areeasily integrable with existing face recognition systems. In this category, there are severalmethods for photo-based spoofing attack detection that explore clues such as motion andfrequency analysis, scene information, and texture. Before going any further, however, wefirst present some available face-related spoofing databases in the literature since most ofthe methods use one or some of such reference benchmarks.

41
2.2.1 Existing Databases
NUAA Database
The NUAA Photograph impostor database [245] comprises 5, 105 valid access images and7, 509 fake images collected with a generic webcam. The images of valid access werecollected of 15 identities in three sections in different places and illumination conditions,all with 640 × 480 pixel resolution. The production of the fake samples were done bytaking high resolution photographs of 15 identities with a Canon digital camera. Theauthors simulated two attack modes: (1) printing photographs on photo paper; and (2)printing the photographs on A4 paper using an HP color printer.
Print-Attack Database
The Print-Attack database [8] contains short videos of valid access and photo-based spoof-ing attacks of 50 identities. The valid access videos were generated in controlled and un-controlled illumination conditions. All videos are in 320× 240 pixel resolution, 25 framesper second (fps) and 15 seconds of duration. The attempted attack videos were generatedby taking two high resolution photographs with a Canon PowerShot digital camera of the50 identities printed on common A4 papers. The attempted attack videos were producedshowing the photographs to a webcam considering two attack modes: (1) hand-basedattacks wherein the impostor user presents the photographs using her own hands; and(2) fixed-support attacks in which the photographs were glued on a wall so that theydo not move during the attempted attacks. In total, 200 access valid videos and 200
attempted attack videos were generated.
CASIA Database
The CASIA database [274] comprises 600 video clips of 50 identities. The videos werefilmed in a natural scene with three cameras: a new and an old USB camera both with640 × 480 pixel resolution and a Sony NEX-5 digital camera with 1, 920 × 1, 080 pixelsof resolution. The database contains three attack modes: (1) warped photo attack; (150
640×480-attempted attack videos); (2) cut photo attack (150 640×480-attempted attackvideos); and (3) video playback using an iPad (150 1, 280×720-attempted attack videos).Some limitations of this database include: the authors failed to prevent the downsizingof the videos shown during the simulation of the video-based spoofing attacks. Suchdownsizing adds artifacts to the attempted attack videos that are not present in the validaccess videos, creating an artificial data separability. Furthermore, the small amount ofdata and the use of only one device in the creation of the video-based spoofing attacksprevent more refined investigations.
Replay-Attack Database
The Replay-Attack database [41] contains short video recordings of valid access and at-tempted attacks of 50 identities. Similar to the Print-Attack [8], the videos were generatedwith a low resolution webcam with 320 × 240 pixel resolution, 25 fps and 15 seconds of

42
duration and the video capture process is the same as described in [8]. However, differentfrom [8], two other attempted attack modes are considered: (1) mobile attacks where theimpostor user displays photographs and videos in an iPhone screen produced with thesame iPhone; and (2) high-definition attacks where the impostor user shows high resolu-tion photographs and videos produced with a Canon PowerShot digital camera using thescreen of a 1024× 768-pixel resolution iPad.
2.2.2 Motion Analysis and Clues of the Scene
Motion analysis of the face region was an early approach used to detect the liveness ofbiometric samples. In [176], Pan et al. investigated the action of eye blinking to detectattacks performed with photographs. The authors proposed the use of the undirectedconditional random field framework to model the action of opening and closing eyes.Tests were performed in a database with 80 videos and 20 identities using a webcam. Theauthors reported a false alarm rate smaller than 1%. Similarly, Li et al. [140] proposeda method for detecting a person’s eye blink based on the fact that edges vary homo-responsively to the behavior of eye blink over some scales and orientations. Analyzing thetrends of Gabor response waves in multi-scale and multi-orientation, the authors choosethe five most homo-responsive Gabor response waves to the behavior of eye blink.
In [263], Xu et al. proposed a method for detecting the eye states formulated asa binary classification problem in which the closed state represents the positive classand the open state the negative class. The authors scan the region of the eyes with N
blocks of different sizes for each biometric sample. For each block, three different featurevectors were extracted by using variants of the Local Binary Pattern Histogram method,generating three sets with N feature vectors. The authors collected 11, 165 images fromwhich 5, 786 were used in the training stage. The best reported detection rate was 98.3%.
Tronci et al. [253] explored the motion information and clues that are extracted fromthe scene considering static and video-based analyses. A static analysis consists of cap-turing spatial information of the still images using different visual features as color andedge directivity descriptor, fuzzy color and texture histogram among others. The analysisis motivated by the loss of quality and by the addition of noise in the biometric samplesduring the manufacturing process of the photographs. Video-based analysis is performedas a combination of simple measures of motion such as eye blink, mouth movement, facialexpression change among others. In the end, a classifier is trained for each feature withthe aid of a fusion scheme for determining spoofing attacks.
Pan et al. [177] extended upon [176] by including context information of the scene. Theauthors analyzed clues such as eye blink in the face region. They extracted a set of keypoints and calculated a Local Binary Pattern Histogram (LBP) around such points andused . the χ2 distance function to compare histograms to reference patterns previouslycalculated.
Anjos et al. [8] proposed a database and a method for photo-based spoofing attackdetection assuming a stationary facial recognition system. In this case, the intensity ofthe relative motion between the region of the face and the background can be used as aclue to distinguish valid access of attempted attacks. The authors calculate a measure of

43
motion for each video frame obtaining a one-dimensional signal, which is described by theextraction of five measures to form a feature vector. The authors validated the methodthrough the Print-Attack database (c.f., Sec. 2.2.1).
Yan et al. [267] proposed a method for liveness detection based on three scene clues inboth spatial and temporal spaces. According to the authors, the non-rigid facial motionand the face-background consistency incorporate temporal information that can help thedecision-making process regarding the face liveness. The authors seek a pattern of non-rigid motion in the face region using the batch image alignment method. The face-background consistency is based on the fact that if the face is real, its motion must betotally independent of the background and is performed by separating the region of theface from background and analyzing the motion. Finally, the authors perform a bandingartifact analysis, which are treated as additive noise. For that, the authors calculatedthe first order wavelet decomposition of the image. The authors validated the methodthrough the Print-Attack database (c.f., Sec. 2.2.1) as well as others created by them.Good results were reported.
2.2.3 Texture and Frequency Analysis
Li et al. [141] proposed an anti-spoofing method for photo-based attempted attacks underthe assumption that the faces present in photographs are smaller than the real faces andthat the expressions and poses of the faces in the photographs are invariant. The detectionof an attack through photographs is performed by analyzing the 2-D Fourier spectrum ofthe samples and calculating the energy rate of the high frequency components, which isused as a threshold to decide whether the biometric sample came from a fake face or not.
In [245], Tan et al. dealt with printed photographs attacks by assuming that the surfaceroughness of real and photo-attack classes are different. The authors proposed the use ofthe Variational Retinex-based and Logarithmic Total Variation methods for estimatingthe luminance and reflectance of an input image, respectively. The authors modeledthe detection problem as a binary classification problem and evaluated the use of theSparse Logistic Regression and Sparse Low Rank Bilinear Logistic Regression methods forclassifying the luminance, reflectance, and Fourier spectrum images previously estimated.The authors validated the method through the NUAA Photograph impostor database(c.f., Sec. 2.2.1). Peixoto et al. [181] extended upon [245] by incorporating methodsfor dealing with different illumination conditions. The reported results showed that theproposed extension reduced the misclassification in more than 50% to attempted attackswith high resolution photographs of the NUAA database.
Määttä et al. [151] proposed a method for photo-based spoofing based on the fact thatreal and fake biometric facial samples differ: (1) in how these objects reflect light (humanfaces are 3D objects while printed faces are planar objects); (2) in the pigmentation; and(3) in the quality due to printing defects contained in the photographs. The authors usedthe LBP method for capturing micro-texture information. Thet evaluated the algorithmthrough the NUAA database (c.f. Sec. 2.2.1), obtaining an AUC of 99%. In [152], thesame authors extended their algorithm for considering Histogram of Oriented Gradient(HOG) and the Gabor wavelet descriptors.

44
Schwartz et al. [214] proposed an anti-spoofing solution for photo-based attacks ex-ploring different properties of the face region (texture, color and shape) to obtain a holisticface representation. Considering only the face region, for each frame of the video con-taining the facial information, we generate a feature vector formed by combining differentlow-level feature descriptors as Histogram of Oriented Gradients (HOG), Color Frequency(CF), Gray Level Co-occurrence Matrix (GLCM), and Histograms of Shearlet Coefficients(HSC). Then, the feature vectors are combined into one feature vector containing a richspatial-temporal information of the biometric sample and fed to a Partial Least Squareclassification technique.
In [117], Kim et al. explored two key observations: (1) the difference in the existenceof 3D shapes leads to the difference in low frequency regions which is closely related tothe luminance component; and (2) the difference between real and fake faces generates adisparity in the high frequency information. The motivation for using texture informationlies in the fact that printed faces tend to loose the richness of texture details. Their methodextracts a feature vector from each biometric sample by transforming the images to thefrequency domain and calculating their respective Fourier spectrum on logarithmic scale,from which average values of the energy of 32 concentric rings are extracted.
Recently, Zhang et al. [274] proposed a simple algorithm for detecting photo-based at-tempted spoofing attacks based on the fact that fake faces present lower quality comparedwith real faces. For a given image captured by the acquisition sensor, four Difference ofGaussian filters (DoG) with different values of σ were used to extract high frequencyinformation, generating four new images that were concatenated and used as input of abinary classifier trained using the Support Vector Machine (SVM) technique.
In [41], Anjos et al. conducted a study to investigate the potential of texture de-scriptors based on Local Binary Pattern (LBP), such as LBPu23×3, transitional (tLBP),direction-coded (dLBP) and modified LBP (mLBP). From the histograms generated fromthe descriptors mentioned above, the authors evaluated a simple manner to classify thembased on histogram comparisons through χ2 distance. A set of classifiers was considered,such as Linear Discriminant Analysis (LDA) and Support Vector Machine (SVM) with aradial basis function as kernel. Evaluations were performed on the NUAA, Print-Attack,and Replay-Attack databases (c.f., Sec. 2.2.1).
2.2.4 Other Approaches
Optical flow analysis has also been considered in the literature for photo-based spoofingattack detection. Bao et al. [13] proposed an anti-spoofing solution based on the analysisof the characteristics of the optical flow field generated for a planar and 3D object.
Unlike the faces contained in photographs, which are regular planar objects, real facesare irregular and 3D objects, which lead to a differentiation between the optical flow fieldsgenerated for real and fake faces. In [123], Kollreider et al. analyzed the trajectory ofthree parts of the face: the region between eyes and nose, left ear, and right ear. Usingoptical flow patterns and a model based on Gabor decomposition, the authors note that,in real faces, these parts of the face move differently from fake faces.
Marsico et al. [62] proposed an anti-spoofing solution based on the theory of 3D pro-

45
jective invariants. By the fundamental theorem of the invariant geometry, it is possibleto show that the cross ratio of five points on the same plane are invariant to rotations ifand only if the these points satisfy specific collinearity or co-planarity constrains. Thus,six cross-ratio measures are computed to different configurations of points located in non-coplanar regions of the face (e.g. center of eyes, nose tip and chin). If a pose of the facelocated in front of the acquisition sensor changes, but the computed cross ratio remainsconstant, the points must be coplanar (i.e., they belong to a planar fake face).
Finally, recent works have been developed in order to evaluate spoofing attacks inmulti-modal biometric systems including [3, 4, 25, 26, 157]. In these works, the authorsinvestigate robust fusion schemes for spoofing attacks considering face and fingerprintbiometric traits.
2.2.5 Problems with the Existing Approaches
Approaches based on clues of the scene have strong constraints that make sense only tophoto-based spoofing attacks. In the case of attacks performed by video, such constraintscertainly will fail due to the dynamic nature of the scene in this type of media (e.g.,motion). The static background assumption made in some works described earlier islimited since the face moves independently of the background in a video-based attemptedspoofing attack. Moreover, the assumption of a background previously known restrictsthe use of the method since in many applications (e.g., web and mobile applications)the data acquisition is performed remotely in an environment and, therefore, we can notassume a previously known background. Finally, we can easily change the background ofan image through image manipulation.
In approaches based on optical flow and motion analysis, motion is easily simulatedby rotating or bending the photographs. Moreover, such methods should be evaluatedby considering video-based attempted spoofing attacks since these media carries motioninformation and, therefore, has potential to deceive such methods. Another disadvantageof approaches based on motion analysis is that the additional time required to capturesome face motions prevents a fast spoofing detection. For example, a type of motionanalyses extensively explored in the literature is the action of eye blink that occurs onceevery four or six seconds. However, this rate can be reduced to an average of three toeight every six seconds due to psychological factors [140]. In this case, at least 20 secondsare required to detect eye blinking.
Finally, methods based on texture analysis should consider attempted attacks per-formed with high resolution videos. Photo-based spoofing attacks have a characteristicthat facilitates the detection of this type of attack, which is absent in video-based spoof-ing attacks: the decrease of quality of the biometric sample due to the printing process,since printers have limitations both in terms of resolution and number of colors that canbe produced, which directly influence the texture of the biometric sample, being easilycaptured by texture information.
Finally, the method proposed in this work aims at overcoming such difficulties bycapturing acquisition-related noise information features generated by the video recapture.As the noise signal is independent of the image signal, our method explores this fact by

46
isolating the noise, so it tends to be less dependent of the video content. Furthermore,our method requires only 50 frames (≈ 2 seconds) for detecting an attempted attack.
2.3 Proposed Method
Here, we present an algorithm for video-based attempted spoofing attack detection. Oursolution relies on the fact that the addition of a noise pattern in the samples is inevitableduring the acquisition step of the facial biometric samples.
The acquisition process is performed by a camera that has an imaging sensor withthousands of photosensitive transducers that convert light energy into electrical charges,which are converted into a digital signal by an A/D converter. In [150], Lukäs et al.define two types of noise that can be present in an image: the fixed pattern noise (FPN)and the noise resulting from the photo-responsiveness of non-uniform light-sensitive cells(PRNU). The noise pattern has been widely explored in digital document forensics as inthe problem of identifying the specific camera that acquired a document [150,215].
During a video-based spoofing attack, we have the insertion of artifacts in the biomet-ric samples captured by the acquisition sensor, such as distortions, flickering, mooring,and banding effect [14]. Such artifacts, loosely referenced in this paper as noise, are addedduring the generation and viewing process of the attack video frames in display devicescreens. Thus, the biometric sample extracted from an attack video will probably containmore noise than the real biometric samples. With this in mind, we design a feature char-acterization process based on noise signatures along with video summarization methodsthat are used by a classification algorithm to find a separation decision boundary betweenreal and fake biometric data. Fig. 2.2 summarizes the steps of the proposed method,which are explained in detail in the following sections.
Figure 2.2: Proposed method. Given a training set consisting of videos of valid accesses,video-based spoofs and a test video, we first extract a noise signature of every video(training and testing) and calculate the Fourier Spectrum on logarithmic scale for eachvideo frame and then summarize each video by means of its visual rhythm. Consideringthe training samples, we train a classifier using a summarized version of the visual rhythmsobtained by the estimation of the gray level co-occurrence matrices, as features. With atrained classifier, we are able to test a visual rhythm for a given video under investigationand point out whether it is a valid access or a spoof.

47
2.3.1 Calculation of the Residual Noise Videos
The first step of the algorithm is to isolate the noise information contained in the videosthat were captured by the acquisition sensor, hereinafter referred to as input video ν. Avideo ν in the domain 2D+ t can be defined as a sequence of t frames, where each frameis a function f(x, y) ∈ N2 of the brightness of each pixel in the position (x, y) of the scene.
The extraction of the noise signal of the input video ν is performed as follows. Theframes in video ν are converted into gray-scale and an instance of νGray is submittedto a filtering process using a low-pass filter in order to eliminate noise, generating afiltered video νFiltered. Then, a frame-by-frame subtraction between the νGray and νFilteredis performed, generating a new video that contains, mostly, the noise signal in whichwe are interested, hereinafter named as Residual Noise Video (νNR), as formalized inEquation 2.1.
ν(t)Filtered = f(ν
(t)Gray)
ν(t)NR = ν
(t)Gray − ν
(t)Filtered ∀ t ∈ T = {1, 2, . . . , t},
(2.1)
where ν(t) ∈ N2 is the t-th frame of ν and f a filtering operation.
2.3.2 Calculation of the Fourier Spectrum Videos
The analysis of the noise pattern and possible artifacts contained in the biometric samplesis performed by applying a 2D discrete Fourier transform to each frame of the NoiseResidual Video (νNR) using Equation 2.2. Next, the Fourier spectrum is computed onlogarithmic scale and with origin at the center of the frame (Equation 2.3). As a resultof this process, we end up with a video of the spectra, further on in this documentreferred to as Fourier Spectrum Videos νFS. Fig. 2.3(a) and 2.3(b) depict the logarithmof the Fourier spectrum of a video frame obtained from a valid access video and from anattempted attack video, respectively.
F(v, u) =M−1∑x=0
N−1∑y=0
νNR(x, y)e−j2π[(vx/M)+(uy/N)] (2.2)
|F(v, u)| =√R(v, u)2 + I(v, u)2
νFS(v, u) = log(1 + |F(v, u)|) (2.3)
2.3.3 Calculation of the Visual Rhythms
In order to capture the temporal information contained in the Fourier Spectrum Videos(νFS) and summarize their content, we employ the visual rhythm technique [45]. Visualrhythm is a simplification of a video content in a 2D image obtained by sampling regionsof the video. Applications of this concept can be found in the work by Chun et al. [44]

48
(a) Valid video. (b) Attack video.
Figure 2.3: Example of a video frame of the spectra generated from (a) a valid video and(b) an attack video.
that use visual rhythms for fast text caption localization on video, and Guimarães etal. [89] who propose a method for gradual transition detection in videos. The use ofvisual rhythm in our work is crucial since it allows us to capture patterns that are presentin the Fourier Spectrum Videos providing an effective way of viewing a video as a stillimage.
Considering a video ν in the 2D+ t domain with t frames of dimensions W ×H pixels,the visual rhythm IνR is a representation of the video ν, in which regions of interest ofeach frame are sampled and aggregated to form a new image, called visual rhythm. Theregions of interest must be carefully chosen to capture the patterns contained in νFS.Formally, a visual rhythm IνR of a video ν can be defined by
IνR(z, t) = ν(x(z), y(z), t), (2.4)
where x(z) and y(z) are functions of the independent variable z. The visual rhythm is atwo-dimensional image whose vertical z axis consists of a certain group of pixels extractedfrom video ν and the samples are accumulated along the time t. Therefore, accordingto the mapping of x(z) and y(z), we can generate several types of visual rhythms [45].For instance, the sampling of the central vertical pixels can be performed by applyingIνR(z, t) = ν(x(W
2), y(z), t). Similarly, the central horizontal pixels can be extracted by
applying IνR(z, t) = ν(x(z), y(H2
), t).Given that the lower responses are mainly concentrated at the abscissa and ordinate
axes [236] of the Fourier spectrum (see Fig. 2.3), initially we consider two regions ofinterest in the frames that form the spectrum video in the construction of two types ofvisual rhythms: (i) the horizontal visual rhythm formed by central horizontal lines and(ii) the vertical visual rhythm formed by central vertical lines. In both cases, we cansummarize relevant content of the spectrum video in a single image. Fig. 2.4 depictsthe visual rhythms generated by two regions of interest considering a valid (Fig. 2.4(a)and 2.4(c)) and an attack video (Fig. 2.4(b) and 2.4(d)).
Even though the visual rhythms are different for valid and attack videos, their con-struction disregards the highest responses that are not at the abscissa and ordinate axesand, in some cases, such information is important to make a better distinction betweenvalid access and attempted attack videos, as shown in Fig. 2.5. With this in mind, we

49
(a) Valid video. (b) Attack video. (c) Valid video. (d) Attack video.
Figure 2.4: Visual rhythms constructed from (a)-(b) central horizontal lines and from(c)-(d) central vertical lines. Note that the visual rhythm obtained from horizontal lineshas been rotated 90 degrees for visualization purposes.
extract a third type of visual rhythm by traversing along the frames of Fourier SpectrumVideos (νFS) in a zig-zag scheme. Fig. 2.6 shows the zig-zag visual rhythm generated fora valid access video and an attempted attack video.
(a) Valid video. (b) Attack video.
Figure 2.5: Examples of spectra whose highest responses are not only at the abscissa andordinates axes.
(a) Valid video. (b) Attack video.
Figure 2.6: Examples of visual rhythms constructed in a zig-zag traversal.
2.3.4 Feature Extraction
Once the visual rhythms are computed, we can use machine learning techniques to traina classifier to decide whether a biometric sample is fake or not. However, if the intensity
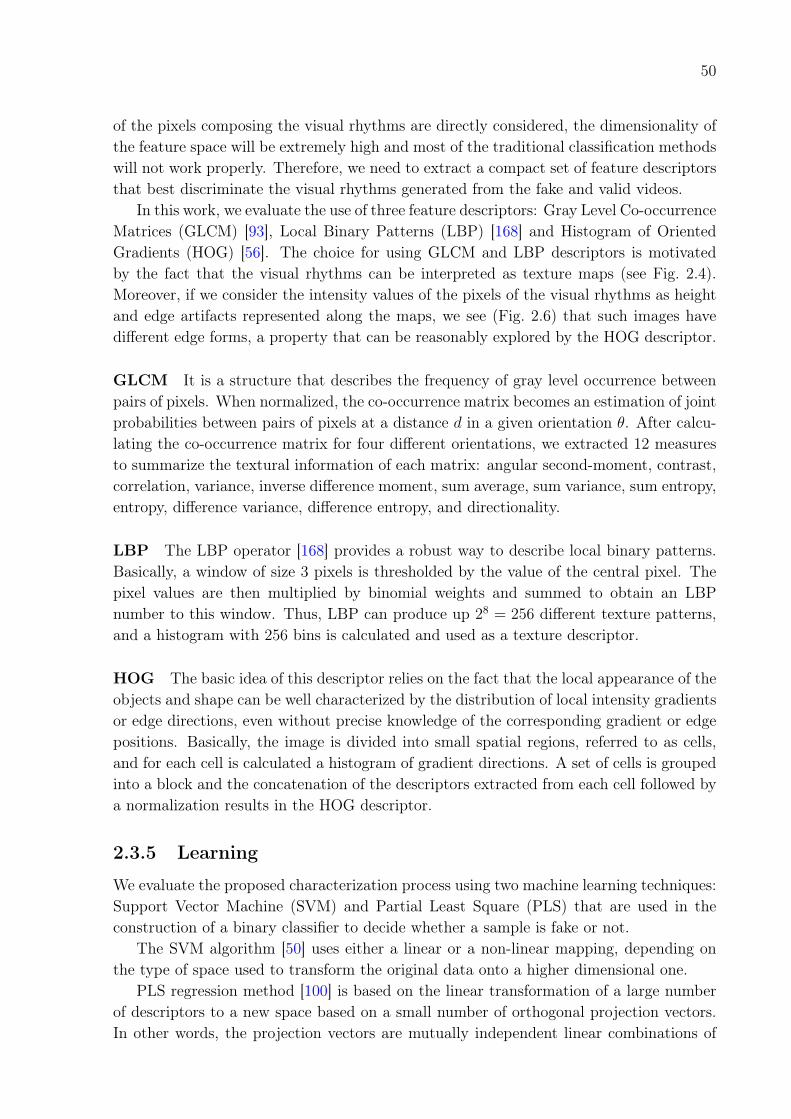
50
of the pixels composing the visual rhythms are directly considered, the dimensionality ofthe feature space will be extremely high and most of the traditional classification methodswill not work properly. Therefore, we need to extract a compact set of feature descriptorsthat best discriminate the visual rhythms generated from the fake and valid videos.
In this work, we evaluate the use of three feature descriptors: Gray Level Co-occurrenceMatrices (GLCM) [93], Local Binary Patterns (LBP) [168] and Histogram of OrientedGradients (HOG) [56]. The choice for using GLCM and LBP descriptors is motivatedby the fact that the visual rhythms can be interpreted as texture maps (see Fig. 2.4).Moreover, if we consider the intensity values of the pixels of the visual rhythms as heightand edge artifacts represented along the maps, we see (Fig. 2.6) that such images havedifferent edge forms, a property that can be reasonably explored by the HOG descriptor.
GLCM It is a structure that describes the frequency of gray level occurrence betweenpairs of pixels. When normalized, the co-occurrence matrix becomes an estimation of jointprobabilities between pairs of pixels at a distance d in a given orientation θ. After calcu-lating the co-occurrence matrix for four different orientations, we extracted 12 measuresto summarize the textural information of each matrix: angular second-moment, contrast,correlation, variance, inverse difference moment, sum average, sum variance, sum entropy,entropy, difference variance, difference entropy, and directionality.
LBP The LBP operator [168] provides a robust way to describe local binary patterns.Basically, a window of size 3 pixels is thresholded by the value of the central pixel. Thepixel values are then multiplied by binomial weights and summed to obtain an LBPnumber to this window. Thus, LBP can produce up 28 = 256 different texture patterns,and a histogram with 256 bins is calculated and used as a texture descriptor.
HOG The basic idea of this descriptor relies on the fact that the local appearance of theobjects and shape can be well characterized by the distribution of local intensity gradientsor edge directions, even without precise knowledge of the corresponding gradient or edgepositions. Basically, the image is divided into small spatial regions, referred to as cells,and for each cell is calculated a histogram of gradient directions. A set of cells is groupedinto a block and the concatenation of the descriptors extracted from each cell followed bya normalization results in the HOG descriptor.
2.3.5 Learning
We evaluate the proposed characterization process using two machine learning techniques:Support Vector Machine (SVM) and Partial Least Square (PLS) that are used in theconstruction of a binary classifier to decide whether a sample is fake or not.
The SVM algorithm [50] uses either a linear or a non-linear mapping, depending onthe type of space used to transform the original data onto a higher dimensional one.
PLS regression method [100] is based on the linear transformation of a large numberof descriptors to a new space based on a small number of orthogonal projection vectors.In other words, the projection vectors are mutually independent linear combinations of
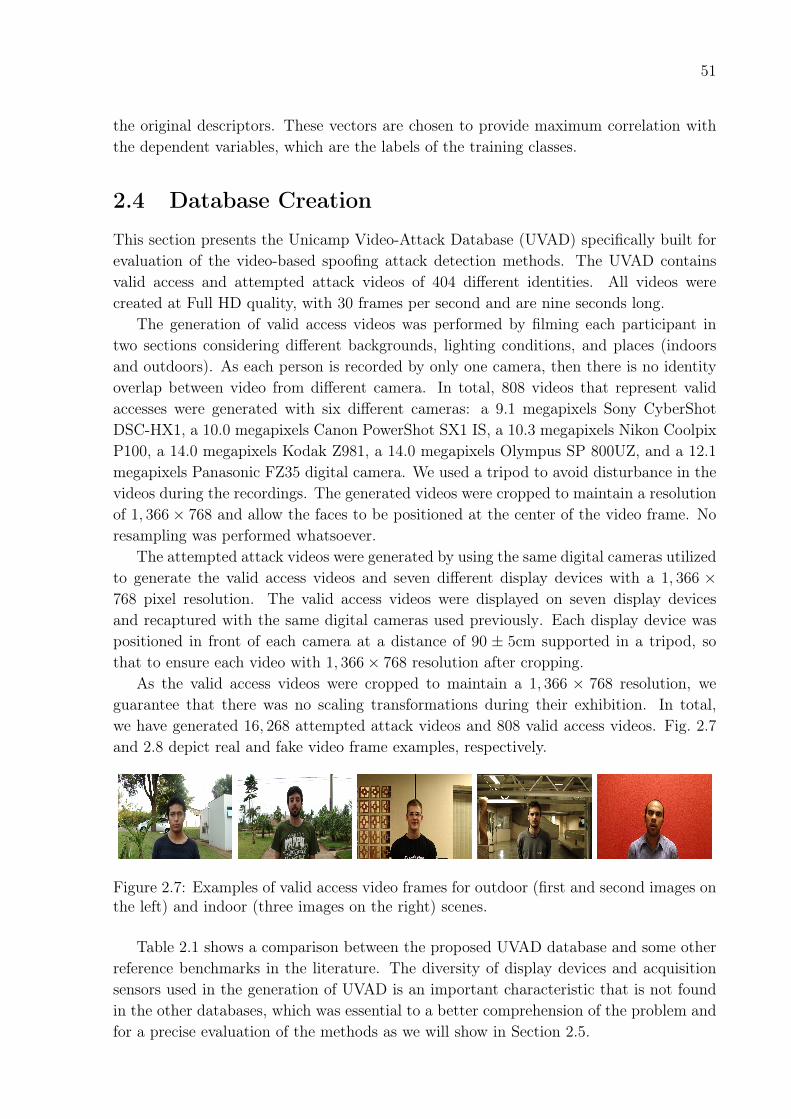
51
the original descriptors. These vectors are chosen to provide maximum correlation withthe dependent variables, which are the labels of the training classes.
2.4 Database Creation
This section presents the Unicamp Video-Attack Database (UVAD) specifically built forevaluation of the video-based spoofing attack detection methods. The UVAD containsvalid access and attempted attack videos of 404 different identities. All videos werecreated at Full HD quality, with 30 frames per second and are nine seconds long.
The generation of valid access videos was performed by filming each participant intwo sections considering different backgrounds, lighting conditions, and places (indoorsand outdoors). As each person is recorded by only one camera, then there is no identityoverlap between video from different camera. In total, 808 videos that represent validaccesses were generated with six different cameras: a 9.1 megapixels Sony CyberShotDSC-HX1, a 10.0 megapixels Canon PowerShot SX1 IS, a 10.3 megapixels Nikon CoolpixP100, a 14.0 megapixels Kodak Z981, a 14.0 megapixels Olympus SP 800UZ, and a 12.1
megapixels Panasonic FZ35 digital camera. We used a tripod to avoid disturbance in thevideos during the recordings. The generated videos were cropped to maintain a resolutionof 1, 366× 768 and allow the faces to be positioned at the center of the video frame. Noresampling was performed whatsoever.
The attempted attack videos were generated by using the same digital cameras utilizedto generate the valid access videos and seven different display devices with a 1, 366 ×768 pixel resolution. The valid access videos were displayed on seven display devicesand recaptured with the same digital cameras used previously. Each display device waspositioned in front of each camera at a distance of 90 ± 5cm supported in a tripod, sothat to ensure each video with 1, 366× 768 resolution after cropping.
As the valid access videos were cropped to maintain a 1, 366 × 768 resolution, weguarantee that there was no scaling transformations during their exhibition. In total,we have generated 16, 268 attempted attack videos and 808 valid access videos. Fig. 2.7and 2.8 depict real and fake video frame examples, respectively.
Figure 2.7: Examples of valid access video frames for outdoor (first and second images onthe left) and indoor (three images on the right) scenes.
Table 2.1 shows a comparison between the proposed UVAD database and some otherreference benchmarks in the literature. The diversity of display devices and acquisitionsensors used in the generation of UVAD is an important characteristic that is not foundin the other databases, which was essential to a better comprehension of the problem andfor a precise evaluation of the methods as we will show in Section 2.5.

52
Figure 2.8: Examples of attempted attack video frames for outdoor (first and secondimages on the left) and indoor (three images on the right) scenes using Sony (first andsecond columns), Canon (third and fourth columns) and Nikon (last column) cameras.
Table 2.1: Comparison of the proposed UVAD database and other available referencebenchmarks in the literature.
Number of Number Number Number Number of devicesDatabase subjects of valid of attacks of attacks used to create
accesses by photo by video the attack videosNUAA [245] 15 5, 105 7, 509 − −Print-Attack [8] 50 200 200 − −CASIA [274] 50 150 300 150 3 cameras and 1 display deviceReplay-Attack [41] 50 200 200 800 2 cameras and 2 display devicesUVAD (proposed) 404 808 −− 16, 268 6 cameras and 7 display devices
2.5 Experimental Results
In this section, we show the details of the experiments and performance evaluations of thedeveloped method. We first consider the UVAD database which was introduced in Sec-tion 2.4 (Experiments I-IV). The diversity of devices used allows us to answer importantquestions regarding some strengths and limitations of the proposed method. In addition,we also evaluate the proposed method with respect to the literature (Experiment V) andthrough the Replay-Attack Database (c.f., Sec. 2.2.1) (Experiment VI).
2.5.1 Protocols for the UVAD Database
In this section, we define appropriate protocols for each experiment.Protocol I. The aim of this protocol is at finding the best configuration of the proposedmethod. In this protocol, we divide the dataset into two sets, hereintofore referred to astraining and test sets. During partition, we guarantee that there is no overlap of datafrom the same capture and display devices between training and test sets, so that we havea proper comparison without experimental bias.
The valid access videos from six cameras were divided into two subsets, A and B . Thevalid access videos in set A were again divided to form two sets of valid access videos:(i) real training set, composed of videos generated by three cameras chosen arbitrarily(Sony, Canon, and Kodak) and (ii) real test set, composed of videos generated by theremaining three cameras (Nikon, Olympus, and Panasonic).
In sequence, the valid access videos in set B were used to generate two sets of attemptedattack videos: (i) the fake training set, in which videos in B generated by the Sony, Canon,and Kodak cameras were displayed on three display devices and recaptured by the samethree cameras, and (ii) the fake test set, whose videos in B generated by the Nikon,

53
Olympus, and Panasonic cameras were displayed on the remaining three display devicesand recaptured by the same cameras.Protocol II. The aim of this protocol is at checking the influence of the biometric sensoron the proposed method. Similarly to the previous protocol, we divide the dataset intotwo sets, training and test sets. However, we create nine training and test sets, changingthe cameras that compose such sets. Again, we guarantee that there is no overlap of datafrom the same cameras and display devices. Our goal with these partitions is to traina classifier with videos from three cameras and test it with the videos from other threecameras that never were used or seen by the classifier.Protocol III. The aim of this protocol is at checking the influence of the display devicesover the detection method. In this protocol, we divide the videos from each camerainto two sets, A and B. Set A contains attempted attacks performed with three displaydevices and set B comprises attempted attacks performed with the three complementarydisplay devices. The partition considering different display devices for both attack setswas carried out to avoid that a classifier takes biased conclusions regarding videos comingfrom devices already seen during the training step. The classification results are given interms of mean of the results obtained in two rounds of experiments by using the set A totrain a classifier and B to test it, and vice versa.
2.5.2 Parameters for the Filtering Process, Visual Rhythm Anal-ysis and Classification
To extract signal noise signature of the videos, as Equation 2.1 shows, we consider theuse of spatial linear and non-linear filters: a Gaussian filter with µ = 0, σ = 2, andsize 7 × 7 and a Median filter with size 7 × 7, respectively. These parameters wereobtained empirically in [193] on a different dataset.
After calculating the noise signature using Equations 2.2 and 2.3, we extract the visualrhythms (horizontal and vertical) of each video considering the first 50 frames and a blockof either 30 columns (vertical) pixels or 30 lines (horizontal). Since the visual vertical andhorizontal rhythms of each video carry different temporal information, we evaluate thetwo types of visual rhythms along with their combinations. The horizontal visual rhythms(H) are in a dimensional space of 1, 366 × 1, 500-d while the vertical visual rhythms (V)are in 768 × 1, 500-d. To generate the zig-zag visual rhythms (Z), we also consider thefirst 50 frames of the Fourier Spectrum transformed videos. We extract block lines of 30
pixels through the traversal of the frames, from left to right, top to bottom. Thus, weobtained visual rhythms that are in a dimensional space of 17, 482× 1, 500-d.
The high dimensionality and large amount of visual rhythms prevent us from usingpixel intensities directly as features. Therefore, we consider the visual rhythms as tex-ture maps and calculate their texture patterns using different characterization methods.For instance, for the standard configuration, we considered the GLCM descriptor withdirections θ ∈ {0o, 45o, 90o, 135o}, distance d = 1 and 16 bins. Table 2.2 shows the dimen-sionality information of each feature. In order to evaluate the robustness of the extractedfeatures, we can use them to train a classifier and generate a model capable of distinguish-

54
Table 2.2: Number of features (dimensions) using either the direct pixel intensities asfeatures or the features extracted by image description methods.
Descriptor DimensionalityName
V H ZPixel Intensity 1, 152, 000 2, 049, 000 26, 223, 000
LBP 256 256 256
GLCM 48 48 48
HOG 36 36 36
ing valid and attack videos, and test the model effectiveness. In this paper, we use twoclassification techniques: SVM and PLS. For SVM, we use the LibSVM [38] implementa-tion and we analyze the radial basis function kernel, whose parameters were found usingLibSVM’s built-in grid search algorithm. For PLS, we use the DetectorPLS method [225]and we analyze different numbers of factors. The factors are latent variables that give usthe best predictive power and they are extracted from a set of independent variables andare used to predict a set of dependent variables. The interested reader may refer to [225]for more details on factor choices in PLS.
2.5.3 Experiment I: Finding the Best Configuration
The objective here is to find the best configuration of our method and to evaluate theclassifiers, visual rhythm setups and filters through the analysis of variance to assess whichof these parameters present higher in influence. In addition, we evaluate other importantfeature characterization methods found in the literature, namely Local Binary PatternHistogram (LBP) and Histogram of Oriented Gradient (HOG) descriptors. Although wehave considered the visual rhythms as texture maps, it is worth analyzing the use ofshape descriptors such as HOG as well. With this experiment, it is possible to discoverwhether considering the visual rhythms as texture maps is the best choice. We carriedout these experiments using the Protocol I and considering the sets of attacks with videosrecaptured by all cameras.
After performing statistical analysis with ANOVA and Tukey’s HSD (Honestly Sig-nificant Difference) test in the results shown in Table 2.3, the following conclusions canbe drawn: (1) GLCM descriptor performance is statistically different from its HOG andLBP counterparts, as shown in Fig. 2.9. As it outperforms the other descriptors withstatistical significance, we can conclude that GLCM was able to extract the most discrim-inative information from the visual rhythms as texture maps better than its counterparts;(2) both Gaussian and Median filters used in this work to generate Noise Residual Videos(νNR) did not produce statistically different results (figure now shown here); (3) meth-ods for building the visual rhythms did not present results with differences statisticallysignificant (See Fig. 2.10); and (4) with respect to the classification algorithm used inthis work, we do not find statistical differences between the use of the SVM and PLSalgorithms (figure not shown here). It is noteworthy that both ANOVA and TukeyHSD’stests allow us to reject the hypothesis of equality between comparisons, but not accept
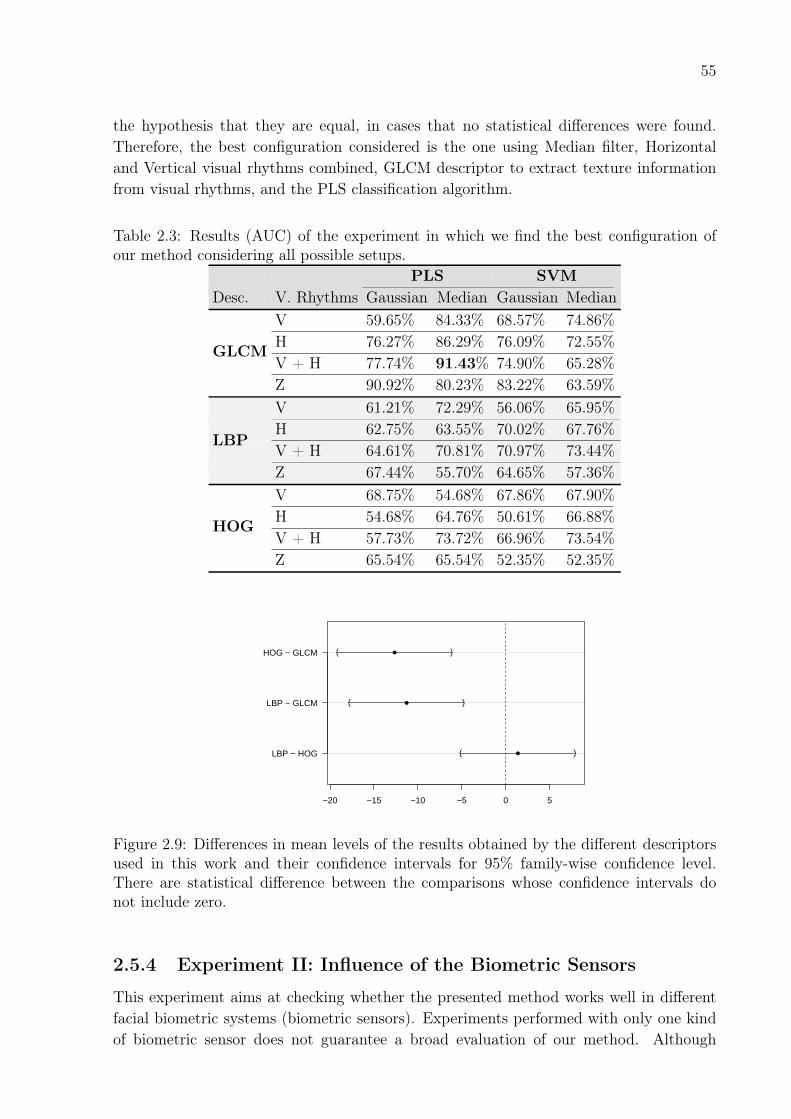
55
the hypothesis that they are equal, in cases that no statistical differences were found.Therefore, the best configuration considered is the one using Median filter, Horizontaland Vertical visual rhythms combined, GLCM descriptor to extract texture informationfrom visual rhythms, and the PLS classification algorithm.
Table 2.3: Results (AUC) of the experiment in which we find the best configuration ofour method considering all possible setups.
PLS SVMDesc. V. Rhythms Gaussian Median Gaussian Median
GLCM
V 59.65% 84.33% 68.57% 74.86%H 76.27% 86.29% 76.09% 72.55%V + H 77.74% 91.43% 74.90% 65.28%Z 90.92% 80.23% 83.22% 63.59%V 61.21% 72.29% 56.06% 65.95%H 62.75% 63.55% 70.02% 67.76%V + H 64.61% 70.81% 70.97% 73.44%
LBP
Z 67.44% 55.70% 64.65% 57.36%
HOG
V 68.75% 54.68% 67.86% 67.90%H 54.68% 64.76% 50.61% 66.88%V + H 57.73% 73.72% 66.96% 73.54%Z 65.54% 65.54% 52.35% 52.35%
−20 −15 −10 −5 0 5
LBP − HOG
LBP − GLCM
HOG − GLCM (
(
(
)
)
)
●
●
●
Figure 2.9: Differences in mean levels of the results obtained by the different descriptorsused in this work and their confidence intervals for 95% family-wise confidence level.There are statistical difference between the comparisons whose confidence intervals donot include zero.
2.5.4 Experiment II: Influence of the Biometric Sensors
This experiment aims at checking whether the presented method works well in differentfacial biometric systems (biometric sensors). Experiments performed with only one kindof biometric sensor does not guarantee a broad evaluation of our method. Although

56
−10 −5 0 5 10
Z − V+H
Z − V
V+H − V
Z − H
V+H − H
V − H (
(
(
(
(
(
)
)
)
)
)
)
●
●
●
●
●
●
Figure 2.10: Differences in mean levels of the results obtained by the visual rhythmsconsidered in this work and their confidence intervals for 95% family-wise confidencelevel. There are statistical difference between the comparisons whose confidence intervalsdo not include zero.
this is not a common practice in the literature, we believe that experiments with severalbiometric sensors is an essential practice to evaluate countermeasure methods, becausethe artifact levels inserted into the biometric samples depend, among other factors, on thequality of the acquisition sensor. Using the Protocol II, we evaluate the proposed methodin its best configuration (see Table 2.4).
Table 2.4: Results (AUC) of the experiment analyzing the influence of the biometricsensors using a PLS Classifier and Median Filter.
Sony Sony Sony Sony Sony Sony Canon Canon CanonCanon Canon Canon Kodak Kodak Olympus Olympus Olympus KodakTrainingKodak Panasonic Olympus Panasonic Olympus Panasonic Panasonic Kodak PanasonicNikon Nikon Nikon Nikon Nikon Canon Sony Sony Sony
Olympus Olympus Kodak Canon Canon Kodak Kodak Nikon NikonTestPanasonic Kodak Panasonic Olympus Panasonic Nikon Nikon Panasonic Olympus
AUC 91.43% 90.48% 86.89% 89.66% 96.12% 91.85% 81.07% 86.84% 84.25%
When we vary the cameras used in the training, we have a variation in the methodgeneralization. For instance, considering the best and worst results shown in the Table 2.4,we have a relative error reduction of 79.50%. Though it is evident the in influence ofthe biometric sensor with this variation in the classification results, we performed theWilcoxon Signed Rank test to prove this influence, with which we obtained a p-value of0.0039 and hence confirmation that the values shown in Table 2.4 are indeed statisticallydifferent.
2.5.5 Experiment III: Influence of the Display Devices
The aim of this experiment is to check whether the presented method is able to detectattacks with different display devices, that is, whether the display devices produce differentamounts of display artifacts (the main artifacts produced are flickering, mooring andbanding effect). This is an important question to be answered because if the method isnot robust to different devices, learning techniques considering an open scenario could be

57
considered [222], given that in this case the classifier should be able to recognize attackswith display devices for which it has no prior knowledge.
Considering Protocol III, this experiment was performed in two rounds: firstly, wetrain a classifier with attacks performed with three display devices and tested it with theother three display devices to evaluate the model found by the classifier. Secondly, weswitch the sets and redo the analysis. In both cases, we considered the best configurationof our method. The results reported in Table 2.5 correspond to the average (x) and stdev(s) of the results obtained in the two rounds for each configuration of the method.
Table 2.5: Results (AUC) of the experiment analyzing the influence of the display devicesusing a PLS Classifier and Median Filter.
Sony Canon Nikon Kodak Olympus PanasonicX 7 7 X 7 X
p–value = 0.0 p–value = 1.0 p–value = 1.0 p–value = 0.0 p–value = 0.574 p–value = 0.015
x = 92.70% x = 99.34% x = 98.61% x = 96.42% x = 84.57% x = 97.53%
s = 0.23% s = 0.91% s = 1.36% s = 0.76% s = 14.33% s = 2.81%
The influence of the display devices are evidenced when the results obtained in the tworounds of experiments are discrepant or whether they are statistically different, indicatingthat the method was not able to detect attempted attacks performed with unknowndisplay devices. To verify whether the differences in the results are statistically significant,we carried out a hypothesis test for two unpaired or independent samples. Once the samplevalues are nominal, the most appropriate statistical test is χ2 test for two samples whosevalues are also shown in all tables, considering a confidence level of 95%. The p-valueproduced for the χ2 tests evaluate whether two samples are statistically different (p-value< 0.05). According to results shown in Table 2.5, we have obtained a p-value lower thanα = 0.05, for some cameras. In these cases, the differences were statistically significant,which leads us to the conclusion that the display device plays an important role in thespoofing detection task.
2.5.6 Experiment IV: Comparison to a State-of-the-Art Methodfor Photo-Based Spoofing Attack Detection
In the final round of experiments concerning the UVAD database, we compare our methodto the one proposed in [214]. We considered the Protocol I to compare both methods. Itwas not possible to run the algorithm by Schwartz et al. by using the same parametersdescribed in [214] due to the high dimensionality of the data their method produces, evenon a machine with 48GB of RAM. The dimensionality of the feature vector generated bythe original algorithm is higher than five million dimensions for each video frame.
In order to reduce the dimensionality of the feature vectors, we applied the HOGdescriptor with blocks of sizes 16 × 16 and 32 × 32 with strides of 16 and 32 pixels,respectively. The other parameters were set as described in [214]. With this, we wereable to reduce the feature vector dimensionality to 8, 880 dimensions. Table 2.6 showsthe results obtained by using the algorithm in [214] and our method, considering theconfiguration that yielded the lowest classification error. Furthermore, the computational

58
time spent by the algorithm in [214] was ≈ 237 hours to process all the data, whereasthe method proposed in this work spent ≈ 72 hours. According to McNemar statisticaltest, the result obtained by the methods are statistically different. All experiments wereconducted on an Intel Xeon E5620, 2.4GHz quad core processor with 48GB of RAM underLinux operating system.
With this experiment, we can conclude that our method better characterized video-based attacks while being more efficient and suitable for different classification techniques,once it provides more compact feature representations.
Table 2.6: Comparison between Schwartz’s approach and the method proposed in thiswork in its best setup (using combined visual rhythm, Median filter and a PLS Classifier).
AUC (%)Schwartz et al. [214] 90.52%
Our method 91.43%
Error Reduction 9.60%
2.5.7 Experiment V: Evaluation of the Method in the Replay-Attack Database
In this experiment, we evaluate our method on the Replay-Attack database (c.f., 2.2.1)which contains photo-based and video-based spoofing attacks. The goal of this experimentis to verify the effectiveness of our method on these several types of attacks. We use theexperimental protocol described in [41], whose results are shown in Table 2.7. Althoughour method is designed for video-based spoofing attack detection, we have obtained apromising AUC of ≈ 93%. For reference, in [41], the authors reported a Half TotalError Rate (HTER) of 34.01% and 15.16%, using a χ2 and SVM classifier, respectively,to classify LBPu23×2 features, while our method yields an HTER of 14.27%. We use aGaussian filter with µ = 0, σ = 0.5 and size 3 × 3, and a Median filter with size 3 × 3.These parameters were empirically obtained by using the Replay-Attack Database. Withthis experiment, we can conclude that the proposed method is able not only to detectvideo-based spoof attacks but also video print-attacks.
Finally, one can notice that, in particular, the zig-zag characterization method doesnot lead to the best result in this dataset. We believe the reason is that the Replay-Attack [41] is a dataset based on print photograph recaptures (still image attacks) which,when recaptured, tend to concentrate visual information in the center of the Fourier trans-formed domain as depicted in Fig. 2.11. This tends to favor the vertical and horizontalvisual rhythms as they concentrate on these areas. The contrary happens with video at-tacks since the peaks in the Fourier transformed domain will be more spatially spread overeach frame, as shown in Fig. 2.5. Result obtained by the TukeyHSD’ test confirm thatdifference between V+H and Z visual rhythms are statistically significant (p-value=0.03).

59
Table 2.7: Results (AUC) for the test set of the Replay-Attack databasePLS classifier SVM classifier
Visual RhythmsMedian Gaussian Median Gaussian
V 83.99% 89.01% 86.26% 91.56%
H 81.98% 85.66% 80.67% 73.36%
V + H 90.69% 92.98% 92.01% 91.81%
Z 78.39% 85.35% 86.56% 77.72%
(a) (b)
Figure 2.11: Example of a video frame of the spectra generated from (a) a valid accessvideo of the Replay-Attack database and (b) a video of an attempted attack of the samedataset. Note a concentration of information on the center rather than spread over as forthe videos case shown in Fig. 2.5.
2.6 Conclusions and Future Work
Biometric authentication systems have been shown to be vulnerable to spoofing attacksin the sense that impostors can gain access privileges to resources as valid users. Spoofingattacks to a face recognition system can be performed by presenting it a photograph, avideo, or a face mask of a legitimate user.
This paper proposed and evaluated a spatio-temporal method for video-based facespoofing detection through the analysis of noise signatures generated by the video ac-quisition process, which can be used to distinguish between valid and fake access videos.Noise properties are captured using Fourier spectrum for each frame of the video. Acompact representation, called visual rhythm, is employed to detect temporal informa-tion in the Fourier spectrum. Three different video traversal strategies were consideredto form the visual rhythms, of which horizontal and vertical combined was shown to bethe most effective. Features were extracted from the visual rhythms through GLCM,LBP and HOG descriptors to allow a proper distinction between fake and real biometricdata. The GLCM method was shown to be the most discriminative and compact featurerepresentation for visual rhythm description.
An extensive data set, containing real access and spoofing attack videos, was createdto evaluate the proposed method, as well as the state-of-the-art approaches. Through theconducted experiments, it is possible to conclude that the display devices and biometricsensors play an important role in the spoofing detection task. These findings are veryimportant in making the future anti-spoofing methods more effective and guiding the

60
development of new databases which must be more realistic, as the UVAD Databaseproposed in this paper. The proposed anti-spoofing method provided competitive or evensuperior results in the tests when compared to state-of-the-art approaches.
Although this paper represents a step toward solving the spoofing problem, it makesit clear that the problem is not fully-solved yet and poses new questions on futuremethods regarding how to better handle and tackle with new attacks due to the ever-growing market of acquisition and display devices such as hight quality monitors, hand-held and smartphone devices. In this sense, the dataset provided in this paper will beavailable at the IEEE Information Forensics and Security Technical Committee website(http://tinyurl.com/pas4t9r) and also registered with a proper DOI through FigShare(http://figshare.com/) in order to advance the frontier of research in spoofing detec-tion.
Future research efforts branch out into devising other spatio-temporal descriptors thatcapture motion telltales associated with the recapture process as well as verifying otherliveness detection problems other than face recognition such as video recapturing, piracydetection, among others [22].
Acknowledgments
We thank the support of CAPES through the DeepEyes project, CNPq (#304352/2012-8and #477662/2013-7), FAPESP (#2010/05647-4 and #2011/22749-8), FAPEMIG andMicrosoft for the support.
61
Chapter 3
Face Spoofing Detection ThroughVisual Codebooks of Spectral Temporal
Cubes
“Profound study of nature is the most fertile source of mathematicaldiscoveries.”
—Joseph Fourier, French mathematician and physicist (1768–1830)
“If you want to find the secrets of the universe, think in terms of energy,frequency and vibration.”
—Nikola Tesla, Serbian-American inventor, electrical engineer, physicist, etc.(1856–1943)
Abstract
Despite important recent advances, the vulnerability of biometric systems to spoofing at-tacks is still an open problem. Spoof attacks occur when impostor users present syntheticbiometric samples of a valid user to the biometric system seeking to deceive it. Consider-ing the case of face biometrics, a spoofing attack consists in presenting a fake sample (e.g.,photograph, digital video or even a 3D mask) to the acquisition sensor with the facialinformation of a valid user. In this paper, we introduce a low-cost and software-basedmethod for detecting spoofing attempts in face recognition systems. Our hypothesis isthat during acquisition there will be inevitable artifacts left behind in the recaptured
c©2015 IEEE. Personal use of this material is permitted. Permission from IEEE must be obtainedfor all other uses, in any current or future media, including reprinting/republishing this material foradvertising or promotional purposes, creating new collective works, for resale or redistribution to serversor lists, or reuse of any copyrighted component of this work in other works.Pre-print of article that will appear in T-IP, vol.24, no.12, pp.4726-4740, Dec. 2015.The published article is available on http://dx.doi.org/10.1109/TIP.2015.2466088See permission to use the copyrighted material in Appendix C.

62
biometric samples allowing us to create a discriminative signature of the video generatedby the biometric sensor. To characterize these artifacts, we extract time-spectral featuredescriptors from the video, which can be understood as a low-level feature descriptor thatgathers temporal and spectral information across the biometric sample and use the visualcodebook concept to find mid-level feature descriptors computed from the low-level ones.Such descriptors are more robust for detecting several kinds of attacks than low-level ones.Experimental results show the effectiveness of the proposed method for detecting differenttypes of attacks in a variety of scenarios and datasets including photos, videos and 3Dmasks.
3.1 Introduction
NOWADAYS, the protection of personal data has become a fundamental requirementof security. According to Tipton [250], information security is concerned with the
development of methods and tools for protecting information and preserving the value ithas for an individual or an organization. For an efficient and effective protection, the useof robust authentication mechanisms is paramount.
Knowledge-based methods (e.g., password, secret question) and token-based methods(e.g., smart cards, token code) are probably the most used authentication mechanismsto date. However, both methods have a critical feature: at the time of authentication,the system does not verify who is requesting access, but rather what the users knowor possess. This renders the system vulnerable, since that knowledge or an object caneasily be lost, shared or manipulated. As an alternative, biometrics is an authenticationmechanism considered more natural and reliable as it focuses on verifying who is theperson requesting the access [109]. Biometrics provides methods for recognizing humansautomatically based on behavior, physical or chemical traits, being fingerprint, face, iris,hand geometry, hand vein, voice and DNA, the most common traits used [109].
Although there are several traits that can be used to perform user authentication, re-searchers are constantly looking for biometric traits with low acquisition and storage costs,that are less invasive, present a high degree of uniqueness and are stable. However, thestatic nature of a stable biometric trait suggests “the paradox of secure biometrics” [167]:
“An authenticator must be stable and distinctive to be considered a good authen-ticator. But, stability leaves no option for compromise recovery, since userscannot change their biometric trait if stolen. Moreover, since a biometric clueis not secret, its information can be learned and copied.”
Although a stable biometric trait is an ideal authenticator, in practice, its use wouldnot work if it were learned or copied. Therefore, researchers have striven to developmethods that detect whether a biometric sample presented to the acquisition sensor isa replica of the original sample. In the literature, the action of presenting a syntheticbiometric sample of some valid user to the acquisition sensor in order to authenticateitself as a legitimate user is known as spoofing attack.

63
Among several forms of biometric, face recognition is of paramount importance withoutstanding solutions presented thus far such as deformable models [262], texture-basedrepresentations [2], and shape-based representations [145]. Although effective in manycases, according to Maltoni et al. [153], face, signature and voice are the easiest biometricsignals to be circumvented. For instance, spoofing attacks can be successfully accom-plished in a face biometric system if an impostor obtains access by presenting to theacquisition sensor a photography, digital video or a 3D model of the target person [109].Even with recent advances in biometrics, information forensics and security, the vulnera-bility of facial biometric systems against spoofing attacks is still an open problem.
During the production of the synthetic biometric data, inevitably, there are noise in-formation and telltales added to the biometric signal that can be captured and furtherprocessed to pinpoint attacks. In fact, in the manufacturing process of a synthetic sample,there are, at least, two re-quantization steps of the original biometric signal. In photo-and mask-based face spoofing attacks, the continuous signal is quantized during the dig-itization process. Then, this digital version is re-quantized due to the printing processwith 2D and 3D printers and again digitized during the presentation of the synthetic datato the acquisition sensor. In video-based face spoofing attacks, the continuous signal isdigitized and recaptured by the acquisition sensor during the attack.
Recent works [151, 193, 245] show that noise and artifacts such as blurring effects,printing artifacts, banding effects, and Moiré patterns are added to the synthetic bio-metric samples during their manufacture and recapture. In this paper, we propose aspatio-temporal algorithm that captures such effects along time to provide an effectivediscriminative signature for valid access and spoofing attempts. In summary, the maincontributions of this paper are:
• a new method for extracting temporal and spectral information from face biometricsamples, referred to as time-spectral descriptors;
• evaluation of the visual codebook model, also referred to as Bag-of-Visual-Wordmodel, for creating a mid-level representation from time-spectral descriptors, re-ferred to as time-spectral visual words; and
• a low-cost solution for spoofing detection, illustrated in Figure 3.1, that does notrely on the user interaction or on extra hardware (e.g., infrared, motion or depthsensors) to detect different types of synthetic samples or attacks (e.g., photos, videosand masks) and is amenable to be implemented in computational devices such asPCs, handheld, and embedded systems.
We organize the remaining of this paper as follows. Section 3.2 discusses state-of-the-art methods for face spoofing attack detection. Section 3.3 presents our method forspoofing attack detection. Section 3.4 shows and discusses the experimental protocol andthe obtained results. Finally, Section 3.5 concludes the paper and discusses possible futurework.
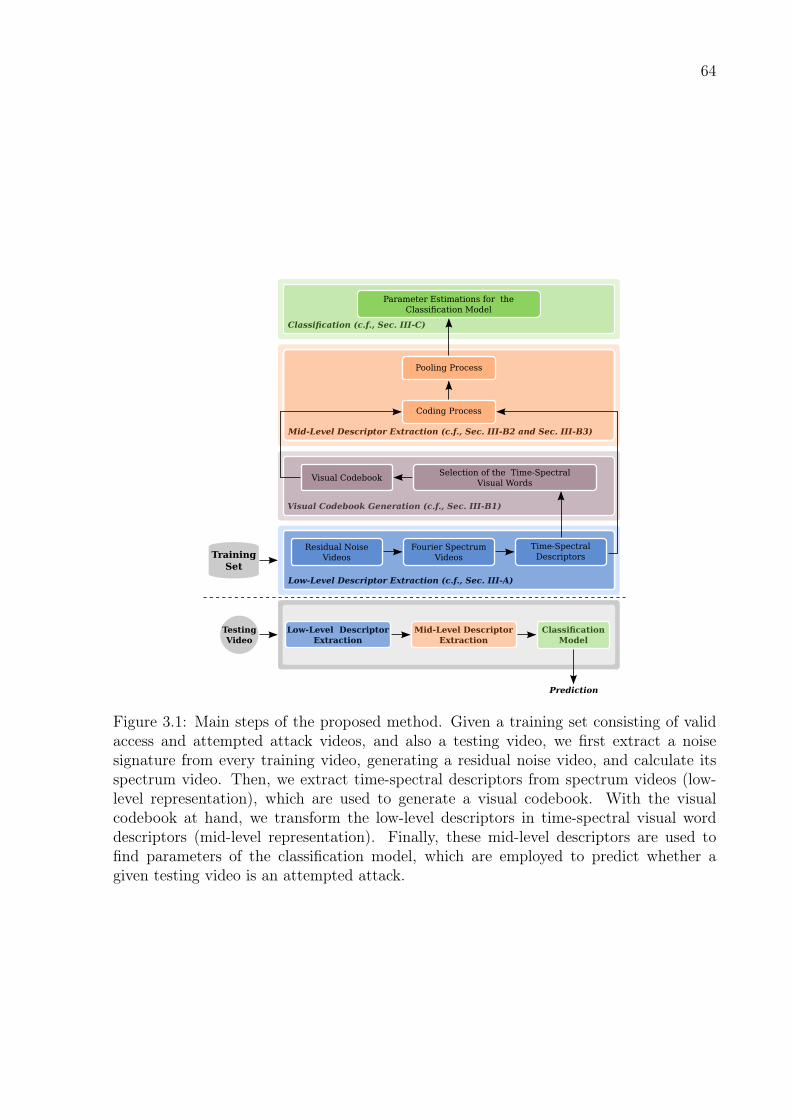
64
Visual Codebook Generation (c.f., Sec. III-B1)
Visual CodebookSelection of the Time-Spectral
Visual Words
Parameter Estimations for the Classification Model
Classification (c.f., Sec. III-C)
Low-Level Descriptor Extraction (c.f., Sec. III-A)
Time-Spectral Descriptors
Fourier SpectrumVideos
Residual NoiseVideos
Mid-Level Descriptor Extraction (c.f., Sec. III-B2 and Sec. III-B3)
Coding Process
Pooling Process
TrainingSet
ClassificationModel
Mid-Level DescriptorExtraction
Low-Level DescriptorExtraction
TestingVideo
Prediction
Figure 3.1: Main steps of the proposed method. Given a training set consisting of validaccess and attempted attack videos, and also a testing video, we first extract a noisesignature from every training video, generating a residual noise video, and calculate itsspectrum video. Then, we extract time-spectral descriptors from spectrum videos (low-level representation), which are used to generate a visual codebook. With the visualcodebook at hand, we transform the low-level descriptors in time-spectral visual worddescriptors (mid-level representation). Finally, these mid-level descriptors are used tofind parameters of the classification model, which are employed to predict whether agiven testing video is an attempted attack.

65
3.2 Related Work
The existing techniques for detecting spoofing on face recognition methods can be roughlycategorized into four groups: user behavior modeling, user cooperation, methods thatrequire additional hardware and methods based on data-driven characterization. Thefirst aims at modeling the user behavior with respect to the acquisition sensor (e.g., eyeblinking or small head and face movements) to decide whether a captured biometric sampleis synthetic. Methods based on user cooperation can be used to detect spoofing by meansof challenge questions or by asking the user to perform specific movements, which addsextra time and removes the naturalness inherent to facial recognition systems. Techniquesthat require extra hardware (e.g., infrared cameras or motion and depth sensors) use theadditional information generated by these sensors to detect possible clues of an attemptedattack. Finally, methods based on data-driven characterization exploit only the datacaptured by the acquisition sensor looking for evidence and artifacts that may reveal anattempted attack.
In [140,176,263], the authors proposed a solution for detecting photo-based attacks byeye blinking modeling under the assumption that an attempted attack with photographsdiffers from valid access by the absence of movements. Bao et al. [13] and Kollreider etal. [123] proposed a method based on the analysis of the characteristics of the optical flowfield generated for living faces and photo-based attacks. As a living face is a 3D objectand a photograph is a planar object, these methods analyze sequential images to detectfacial movements, facial expressions or parts of the face such as mouth and eye. Pan etal. [177] extended upon [176] including contextual information of the scene (clues outsideof the face) and eye blinking (clues inside the face region).
Methods that use extra hardware have also been considered in the literature. Sunet al. [237] proposed a solution based on thermal IR spectrum modeling the face in thecross-modality of thermal IR and visible light spectrum by canonical correlation analysis.Recently, Erdogmus et al. [66] evaluated the behavior of a face biometric system protectedwith anti-spoofing solutions [42,151] and the Microsoft’s Kinect under attempted attacksperformed with static 3D masks. Although these approaches were successful, techniquesrequiring extra hardware devices have the disadvantage of not being possible to implementin computational devices that do not support them, such as smartphones and tablets.
Turning our attention to the data-driven characterization methods, we can identifythree different approaches explored in the literature: methods based on frequency anal-ysis [139, 141, 193], texture analysis [117, 125, 151, 152, 181, 214, 245], and the ones basedon motion and clues of the scene analysis [8, 41, 253, 267, 274]. We shall briefly reviewthese approaches in the next sections. For further reading on the problem, we recommendGalbally et al.’s survey [73] and Marcel et al.’s handbook [158].
3.2.1 Frequency-based approaches
Li et al. [141] explored the fact that faces in photographs are smaller than the real onesand that the expressions and poses of the faces in the photographs are invariant to devisea method for detecting photo-based attempted attacks.

66
Pinto et al. [193] proposed a method for detecting attacks performed with videos usingvisual rhythm analysis. According to the authors, in a video-based spoofing attack, a noisesignature is added to the biometric samples during the recapture of the videos of attacks.The authors isolated the noise signal using a low-pass filter and used the visual rhythmtechnique to capture the temporal information of the video.
Lee et al. [139] proposed a method based on the frequency entropy of image sequences.The authors used a face verification algorithm to find the face region, normalized the RGBchannels using z-score technique, and applied the independent components analysis (ICA)method to remove cross-channel noise caused by interference from the environment. Fi-nally, the authors calculated the power spectrum and analyzed the entropy of the channelsindividually. Based on a threshold, the authors decide whether a biometric sample is syn-thetic or real.
3.2.2 Texture-based approaches
Tan et al. [245] proposed a solution for detecting attacks with printed photographs mo-tivated by the difference of the surface roughness of an attempted attack and a realface. The authors estimate the luminance and reflectance of the image under analysisand classify them using Sparse Low Rank Bilinear Logistic Regression methods. Theirwork was further extended by Peixoto et al. [181] by incorporating measures for differentillumination conditions.
Määttä et al. [151] explored micro textures for spoofing detection through the LocalBinary Pattern (LBP). To find a holistic representation of the face, able to reveal anattempted attack, Schwartz et al. [214] proposed a method that extracts different infor-mation from images (e.g., color, texture and shape of the face). Results of both techniqueswere reported in the Competition on Counter Measures to 2D Facial Spoofing Attacks [36],with an HTER of 0.00% and 0.63%, respectively, upon the Print Attack Database [8].
Chingovska et al. [41] investigated the use of different variations of the LBP opera-tor used in [151], such as LBPu23×3, tLBP , dLBP and mLBP. The histograms generatedfrom these descriptors were classified using χ2 histogram comparison, Linear DiscriminantAnalysis and Support Vector Machine.
Face spoofing attacks performed with static masks have also been considered in theliterature. Erdogmus et al. [65] explored a database with six types of attacks using fa-cial information of four subjects. To detect attempted attacks, the authors used twoalgorithms based on Gabor wavelet [262, 273] with a Gabor-phase based similarity mea-sure [90].
Similarly to Tan et al. [245], Kose et al. [128] evaluated a solution based on reflectanceto detect attacks performed with masks. To decompose the images into components ofillumination and reflectance, the Variational Retinex [5] algorithm was applied.
Pereira et al. [184] proposed a score-level fusion strategy for detecting various types ofattacks. The authors trained classifiers using different databases and used the Q statisticto evaluate the dependency between classifiers. In a follow-up work, Pereira et al. [69]proposed an anti-spoofing solution based on the dynamic texture, a spatio-temporal ver-sion of the original LBP. Results showed that LBP-based dynamic texture description

67
has a higher effectiveness than the original LBP, which reinforces the idea that temporalinformation is of prime importance to detect spoofing attacks.
3.2.3 Motion-based approaches
Tronci et al. [253] explored the motion information and clues that are extracted from thescene by combining two types of processes, referred to as static and video-based analysis.The static analysis consists in combining different visual features such as color, edge,and Gabor textures, whereas the video-based analysis combines simple motion-relatedmeasures such as eye blink, mouth movement, and facial expression change.
Anjos et al. [8] proposed a method for detecting photo-based attacks assuming a sta-tionary facial recognition system. According to the authors, the intensity of the relativemotion between the face region and the background can be used as a clue to distin-guish valid access of attempted attacks, since that motion variations between face andbackground regions exhibit greater correlation in the case of attempted attacks.
In contrast with the methods described in this section, we present in this work a newanti-spoofing solution based on a temporal characterization of the frequency componentsfrom the noise signal extracted from videos. Furthermore, to the best of our knowledge,this was the first attempt of dealing with visual codebooks to find a mid-level represen-tation useful for face spoofing attack detection.
3.3 Proposed Method
In this section, we introduce a method for detecting different forms of face spoofingattacks. The method comprises three main steps: low-level descriptor extraction, mid-level descriptor extraction, and classification. Fig. 3.1 illustrates these steps, which weexplain in details in the following sections.
We designed the algorithm based on the fact that synthetic biometric samples containnoise and artifacts generated during their manufacture and recapture that are differentfrom any pattern found in real biometric samples. According to Tan et al. [245] andMäättä et al. [151], there is a deterioration of the facial information and, consequently,a loss of some high frequency components during the manufacture of photographs to beused in spoofing attacks. In our prior work [193], we highlighted the fact that there isa significant increase of the low frequency components due to the blurring effect addedduring the recapture process of the biometric sample displayed in tablets, smartphonesand laptop screens. Besides the blurring effect, other artifacts are added such as flickering,Moiré patterns, and banding effect [14].
These facts motivated us to propose a solution that takes advantage of the noise andartifacts contained on such fake biometric samples, which heretofore we refer to as a noisesignature. We perform a Fourier analysis of the noise signature to capture the informationencoded in the frequency, phase and amplitude of the component sinusoids [236]. In thispaper, we use Fourier spectrum to quantify the following artifacts:
• blurring artifact: In both the production and recapture processes, inevitably wehave a decrease in the details of biometric samples due to re-quantization of the

68
original signal. This reduction of details is reflected in the increase of low frequencycomponents and can be observed in the Fourier domain;
• flickering effect: It corresponds to the horizontal and vertical lines equally spacedthat appear during the recapture process of the samples shown to the acquisitionsensor with the display device. When this artifact appears in biometric samples,there are peak lines at abscissa and ordinate axes of the Fourier spectrum when thedisplay device is aligned with the acquisition sensor;
• Moiré pattern: They are irregular patterns that can appear when a display deviceis used to perform an attempted attack. As a result, we also have the appearanceof peaks in different locations in the Fourier spectrum depending on the frequencyand direction of the sinusoid in the spatial domain [236].
The novelty of our solution is in the two-tier low and mid-level characterization scheme,called time-spectral visual words, that captures patterns present in such noise signaturesuseful to reveal spoofing attacks. For this, we extract temporal-spectral descriptors fromthe noise signature transformed to the frequency domain and create a mid-level repre-sentation for them using the concept of visual codebooks [12, 235]. Visual codebooks area method for constructing mid-level representations widely employed in several applica-tions in pattern recognition and computer vision, such as object recognition [254], gesturerecognition [96], and information retrieval [182], among others. However, unlike existingmethods, we obtain visual informative features from the noise signature present in thevideos instead of their raw pixels or from objects in the scene.
3.3.1 Low-Level Descriptor Extraction
In our previous work [193], we found that the noise signal is an important source for low-level discriminative features for spoofing detection. When working with the noise signaland discarding the video content, we minimize possible negative impacts on the methodperformance. Next, we present the steps of the proposed method to compute the low-leveldescriptors.
Calculation of the Residual Noise Videos
The low-level representation of the videos is computed through the spectrum analysis ofthe noise signal in the frequency domain. To isolate the noise signal of a given video V ,we filter a copy of V using a Gaussian filter with mean µ, std. σ, and kernel size k× k toremove the high frequency components, generating a filtered video. Then, we perform asubtraction operation between the input video and its filtered version, generating a newvideo, called Residual Noise Video (VRN):
V(t)RN = V (t) − h(V (t)) ∀ t ∈ T = {1, 2, . . . , t}, (3.1)
where V (t) ∈ N2 is the t-th frame of V and h is a filter whose impulse response is aGaussian function.

69
Calculation of the Fourier Spectrum Videos
After calculating the residual noise videos, we can analyze the noise pattern and possibleartifacts contained in the biometric samples by applying the 2D Discrete Fourier Trans-form to each frame of the VRN using Eq. 3.3. In this work, we evaluate two importantcharacteristics of the noise signal in the frequency domain, the magnitude and phase ofthe signal. The analysis of these two characteristics is performed by calculating the mag-nitude spectrum (Eq. 3.5) and phase spectrum (Eq. 3.6), with the origin at the center ofthe frame. In both cases, the result is a Fourier spectrum video.
F(VRN(x, y)) ≡ F (v, u) (3.2)
F (v, u) =M−1∑x=0
N−1∑y=0
VRN(x, y)e−j2π[(vx/M)+(uy/N)] (3.3)
|F (v, u)| =√R(v, u)2 + I(v, u)2 (3.4)
VMS(v, u) = log(1 + |F (v, u)|) (3.5)
VPS(v, u) = arctan
(I(v, u)R(v, u)
)(3.6)
From the Fourier spectrum video, we can extract spectral and temporal informationrelevant to the spoofing attack detection. In the case of the spectral information, we needto capture peaks present in the central region caused by artifacts that reduce some detailsin the scene (e.g., skin marking, edge information) such as blurring effect, defocus, andprinting artifacts and peaks present in the peripheral region of the frame caused mainly byartifacts such as the banding effect and Moiré pattern, which appear during the recaptureof the biometric information during an attack.
Figs. 3.2 and 3.3 show an attempt to depict the temporal disturbances added to thebiometric samples during attacks. In this example, we extract the first ten consecutiveframes of an attack video and of a valid video for the same client, and calculate theirrespective magnitudes spectra from the residual noise video. In addition, Fig. 3.4 showsexamples in which we have frames extracted from valid access videos (a) and spoof attackvideos (b-c). In this figure, we aim at showing the Moiré and blurring effects found inattempted attacks performed with a mobile device. The blurring effect is present in themagnitude spectrum with an increase of the low frequency components, whereas the Moiréeffect is present in the magnitude spectrum with peaks in the horizontal center region ofthe frames. It is hard to find a direct mapping of the effects to the phase spectra, but wecan see clearly that there are disturbances in the phase spectra calculated from attemptedattack frames when compared to phase spectra extracted from valid access frames.
It is important to remark that we are not proposing a method for capturing eachof the artifacts separately. We believe that the presence of one or more artifacts causesdisturbances in the frequency components in the Fourier domain and the proposed methodaims at describing and capturing this disturbance in space and time.
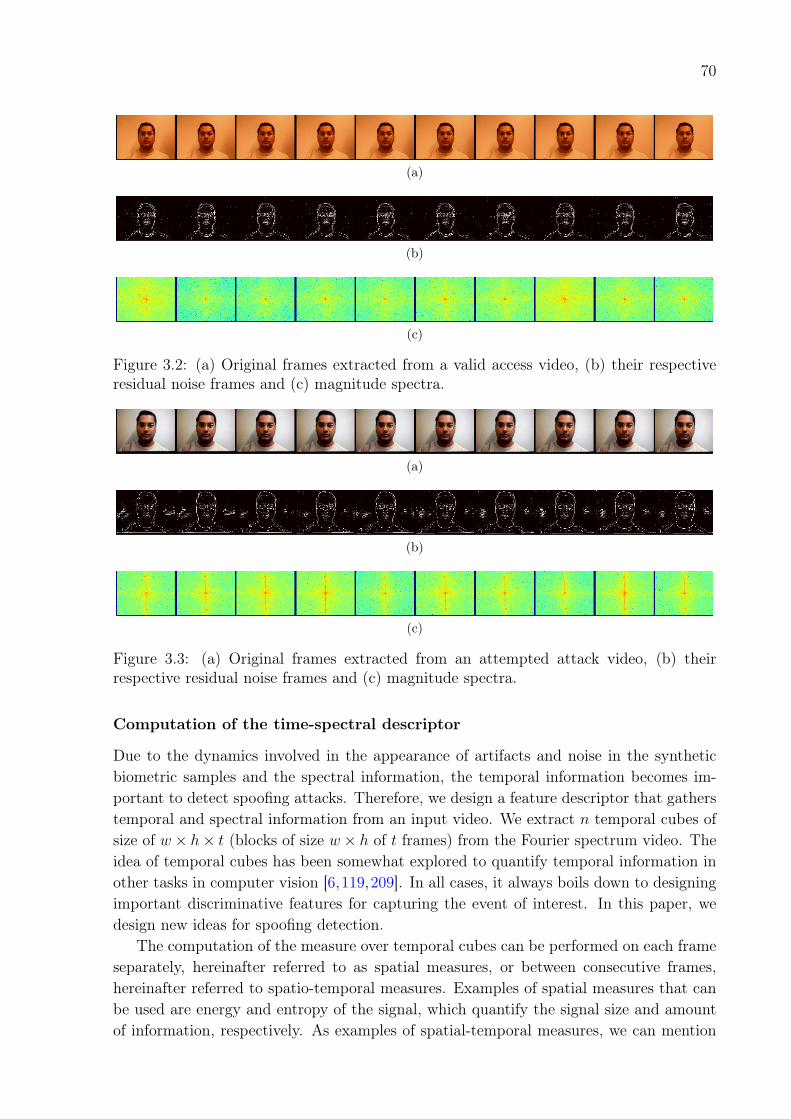
70
(a)
(b)
(c)
Figure 3.2: (a) Original frames extracted from a valid access video, (b) their respectiveresidual noise frames and (c) magnitude spectra.
(a)
(b)
(c)
Figure 3.3: (a) Original frames extracted from an attempted attack video, (b) theirrespective residual noise frames and (c) magnitude spectra.
Computation of the time-spectral descriptor
Due to the dynamics involved in the appearance of artifacts and noise in the syntheticbiometric samples and the spectral information, the temporal information becomes im-portant to detect spoofing attacks. Therefore, we design a feature descriptor that gatherstemporal and spectral information from an input video. We extract n temporal cubes ofsize of w× h× t (blocks of size w× h of t frames) from the Fourier spectrum video. Theidea of temporal cubes has been somewhat explored to quantify temporal information inother tasks in computer vision [6,119,209]. In all cases, it always boils down to designingimportant discriminative features for capturing the event of interest. In this paper, wedesign new ideas for spoofing detection.
The computation of the measure over temporal cubes can be performed on each frameseparately, hereinafter referred to as spatial measures, or between consecutive frames,hereinafter referred to spatio-temporal measures. Examples of spatial measures that canbe used are energy and entropy of the signal, which quantify the signal size and amountof information, respectively. As examples of spatial-temporal measures, we can mention

71
(a) Examples of a frame extracted from valid access video
(b) Examples of frames extracted from a mobile-attack videos. We highlighted the Moiré effect withyellow circle in the original image and its respective residual noise frame. The arrows on the magnitudespectrum indicate the effect of the Moiré effect over Fourier spectrum
(c) Examples of frames extracted from a mobile-attack videos. In this frame, we show a blurring effectin the original image and its effect in the residual noise frame. The arrows on the magnitude spectrumshow the impact of this effect over Fourier spectrum
Figure 3.4: Examples of valid access and attempted attack videos. The first column showsthe original frame extracted from a video and the second column shows the residual noiseframe calculated from the original frames. Finally, the third and fourth columns showthe magnitude and phase spectrum, respectively. Note that the phase spectra calculatedfrom valid access frames are different from attempted attack frames.
correlation and mutual information, which are applied to measure dependence betweenconsecutive frames. At the end of this process, we have a set of n time-spectral descriptorsof t dimensions, for each video. As spatio-temporal measures are applied on consecutiveframes, this process yield n time-spectral descriptors of (t− 1) dimensions each.
3.3.2 Mid-Level Descriptor Extraction
To find a robust representation for the low-level feature descriptors, with less sensitivity tothe intra- and extra-class variations, we use the Bag-of-Visual-Word (BoVW) model [235],which maps the low-level features onto a more discriminative mid-level representation.Methods based on the BoVW model can be understood in the following steps: visualcodebook generation, coding, and pooling.

72
Visual Codebook Generation
The generation of the visual codebook consists in the selection of time-spectral descriptorsthat are more frequent and representative considering all descriptors extracted from train-ing videos. The selected descriptors, called time-spectral visual words, form the visualcodebook. The selection can be performed using two strategies: (1) random selection,whereby all descriptors are pooled and m visual words are randomly chosen using a uni-form distribution; or (2) selection via clustering (e.g., k-means) whereby all descriptorsundergo a clustering process and the m centroids found by the algorithm are used to formthe visual codebook. In both cases, we end up with a single visual codebook, which isused to encode the low-level time-spectral descriptors from videos.
Instead of pooling all descriptors extracted from videos into a training set to builda single visual codebook, we can build class-based visual codebooks. When creatingclass-based visual codebooks, we consider the use of valid access and attempted attackvideo descriptors separately in order to find codebooks in each class. For each class-based codebook, we use the same procedures described above for a single visual codebookcreation. The two visual codebooks are concatenated to create the final codebook.
Coding
The coding process performs a pointwise transformation of the low-level descriptors intoanother representation [31]. There are several strategies for coding being the hard andsoft assignments the most common. Given a visual codebook and a low-level descriptor,the hard assignment transforms such descriptor into a binary vector with only one nonzerocoefficient representing the visual word closest to it. The soft assignment [80], in turn,gives a real valued vector that represents the descriptor as a linear combination of thevisual words of the codebook, whose coefficients give an associativity degree between thedescriptor and the visual words of the codebook [146]. In this paper, we evaluate thesetwo strategies for coding the low-level descriptors.
Pooling
The pooling process aims at summarizing the information contained in the set of n mid-level feature descriptors extracted from an input video into only one feature descriptorto obtain its final representation. In the literature, we have two common techniques todo that, known as sum-pooling (Eq. 3.7) and max-pooling (Eq. 3.8). In this paper, weevaluate these two strategies, as well.
v(j)i =
n∑i=1
u(j)i ∀ j ∈ {1, 2, . . . ,m} (3.7)
v(j)i = maxiu
(j)i ∀ j ∈ {1, 2, . . . ,m} (3.8)
73
3.3.3 Classification
After finding a new space representation for the videos in the database, we use machinelearning algorithms to find a classification model to decide whether a sample is an at-tempted attack or a valid access. In this paper, we evaluate the Partial Least Square(PLS) [101] and Support Vector Machine (SVM) [50] algorithms.
3.4 Experiments and Results
In this section, we present and discuss the experimental results and the validation of theproposed method. Section 3.4.1 shows details of the datasets used in the experiments whileSection 3.4.2 describes the experimental protocols employed in this work. Section 3.4.3shows the experimental setup of the proposed method regarding its parameters. Theexperiments in Section 3.4.4 aim at validating our method and choosing its best parametersetup. In addition, Section 3.4.4 addresses important questions regarding the low- andmid-level descriptor extraction procedures: (1) the best characteristic extracted fromFourier spectrum (e.g., magnitude or phase spectrum); (2) the best measure for spectrumsummarization (e.g., energy, entropy, correlation, mutual information, etc); and (3) thevisual codebook size most appropriate for the problem; among others. The remainingsubsections compare the proposed method with the best methods reported in the literatureincluding a challenging cross-dataset protocol, whereby we train our method using adataset and test it with another dataset.
3.4.1 Datasets
In this work, we consider four datasets:
• Replay-Attack Dataset [41]: This dataset comprises videos of valid accessesand attacks of 50 identities. The videos were generated with a webcam with aresolution of 320× 240 pixels and 25 frames per second (fps). This dataset contains200 valid access videos, 200 print-based attacks, 400 mobile-based attacks using aniPhone, and 400 high-definition attacks using an iPad screen with 1, 024× 768 pixelresolution.
• CASIA Face Anti-Spoofing Dataset [274]: This dataset contains videos ofvalid accesses and attacks of 50 identities and considers different types of attackssuch as warped photo attacks and cut photo attacks, besides the photos and videoattacks. It also considers attacks performed with different image/video quality:(1) low-quality videos captured by a long-time-used USB camera with 480 × 640
pixel resolution; (2) normal-quality videos captured with a new USB camera with480× 640 pixel resolution; and (3) high-quality videos captured with a Sony NEX-5camera with 1, 920 × 1, 080 pixel resolution. In total, it comprises 150 valid accessvideos and 450 video spoofing attacks.

74
• UVAD Dataset [190, 191]1: This dataset contains valid access and attemptedattack videos of 404 different people, all created at Full HD quality, 30 fps, andnine seconds long. It contains 16, 268 attempted attack videos and 808 valid accessvideos. Seven different display devices were used to simulate the attempted attacksperformed upon three acquisition sensors of different manufacturers: a 9.1 megapixel(MP) Sony CyberShot DSC-HX1, a 10.0-MP Canon PowerShot SX1 IS, a 10.3-MPNikon Coolpix P100, a 14.0-MP Kodak Z981, a 14.0-MP Olympus SP 800UZ, and a12.1-MP Panasonic FZ35 digital camera. Figs. 3.5 and 3.6 illustrate some examplesof this dataset.
Figure 3.5: Examples of valid access video frames for outdoor (first and second images onthe left) and indoor (three images on the right) scenes.
Figure 3.6: Examples of attempted attack video frames for outdoor (first and secondimages on the left) and indoor (three images on the right) scenes using Sony (first andsecond columns), Canon (third and fourth columns) and Nikon (last column) cameras.
• 3DMAD Dataset [66]: This dataset comprises valid access and mask attackvideos of 17 different subjects, whose faces were recorded by a Microsoft Kinectsensor. To build a synthetic biometric sample, the authors used frontal and profileface images to make the facial reconstruction. Afterwards, the authors used a 3Dprinter to build a mask containing facial information of the target person. Spoofingattack simulations were performed by presenting the 3D masks to the same Mi-crosoft Kinect sensor. In total, the authors generated 85 valid access videos and 85
attempted attack videos.
3.4.2 Experimental Protocol
We use two measures for performance evaluation: the area under the curve (AUC) and thehalf total error rate (HTER). While the former quantifies the overall ability of a classifierto discriminate between attempted attacks and valid accesses, the latter combines thefalse acceptance rate (FAR) and false rejection rate (FRR) in a specific operating pointof the ROC curve into a single measure. HTER is commonly calculated in the operating
1This dataset is freely available through FigShare (http://figshare.com/articles/visualrhythm_antispoofing/1295453).

75
point in which the FAR is equal to the FRR, known as the Equal Error Rate (EER). Weuse the freely available toolbox Bob [9] to calculate the AUC and HTER values. Finally,the employed evaluation protocols follow the ones proposed by the authors of the Replay-Attack, CASIA, UVAD and 3DMAD datasets. The source code of all proposed methodsare freely available.2
Protocol I
In this experimental protocol, we use the Replay-Attack dataset, which is divided intothree subsets: a training set with 300 attack videos and 60 valid videos; a developmentset with 300 attack videos and 60 valid access videos; and a test set with 400 attemptedattack videos and 80 valid access videos. The training set is used to fit a classificationmodel, the development set to find the EER, whereas the test set is used to report thefinal error rates.
Protocol II
In this protocol, we use CASIA dataset, divided into two disjoint subsets: training andtest sets. Due to the absence of a development set to estimate a threshold to be appliedin the test set and afterwards to calculate the HTER, the official protocol of this datasetrecommends to use the training set to build a classifier and then use the test set to reportthe EER value. To report the results in terms of HTER, the original training set wasdivided into two subsets, named as training and development sets, in the proportion of80% and 20%, respectively. We use the new training set to find the classification modeland the development set to estimate the threshold that gives us the EER, whereas theofficial test set is used to report the final results in terms of HTER.
Protocol III
In this protocol, we use the UVAD dataset, which contains six subsets comprising validaccess and attempted attack videos. Each subset considers attacks against one acquisitionsensor: Sony, Kodak, Olympus, Nikon, Canon and Panasonic. Here, we train a classifierusing the sensors Sony, Kodak and Olympus, and we test it with videos (valid accessand attempted attacks) from three other different manufacturers: Nikon, Canon andPanasonic.
Protocol IV
Here, we use the 3DMAD dataset to evaluate spoofing detection of attacks using 3D masks.The dataset contains 85 RGB videos that represent valid access and 85 RGB videos thatrepresent attempted spoofing attacks. As this dataset does not contain explicit subsets,we randomly partitioned the data into three subsets: training, development and testing,and we use Protocol I for testing.
2The source code is freely available for scientific purposes on GitHub(https://github.com/allansp84/spectralcubes), along with this article.

76
Table 3.1: After the statistical analysis, we have found that the factors highlighted with† are the ones that did not present statistical significance when configuring our method,whereas the levels highlighted in bold are the chosen levels.Factor Levels DescriptionLGF C, and W Strategies for extracting the low-level features from video of phase spec-
trum or video of magnitude spectrum: extraction considering a centralregion (crop) in each frame (C) and the entire/whole frames (W).
M PE, PH, ME, MH,PMI, MMI, PC,and MC
Characteristics of the frequency spectrum evaluated that can be the phase(P) or magnitude (M) and the measures used for summarizing the spec-tral information that can be energy (E), entropy (H), mutual information(MI), or correlation (C).
CS R, and K Mode of selection of the visual words that compose the visual codebooks:Random (R) or using k-means clustering algorithm (K).
SDD† S and D Strategies for generating the visual codebooks: a single visual codebook(S) and class-based visual codebooks (D), one for each data class (spoofingvs non-spoofing).
DS† 80, 120, 160, 200,240, 280, 320, and360
Visual codebook sizes. This is an important parameter because the visualcodebook size gives us visual codebooks with different degrees of specifici-ties because large visual codebooks can incorporate small clusters of datathat appear sometimes in specific cases.
CP hardsum, hardmaxand softmax
We evaluate the combination of two strategies in the coding process (hard-assignment and soft-assignment) and two strategies in the pooling process(max-pooling and sum-pooling).
C SVM and PLS Classification algorithms.
3.4.3 Method Parameterization
For reproducibility purposes, this section discuss the parameters whose values are constantin the setup of our method.
We extract the noise signature from RGB videos using a Gaussian filter with µ =
0, σ = 0.5, and kernel size 3 × 3 (Eq. 3.1). These values were obtained empiricallyin [193]. Next, we extract cuboids of size 32 × 32 × 8 from the Fourier spectrum videos(Eqs. 3.5 and 3.6), whose spatio-temporal location is chosen randomly based on a uniformdistribution.
The use of spatial measures produces low-level 8-dimensional descriptors per chan-nel, whereas the use of spatio-temporal measures produces low-level 7-dimensional de-scriptors per channel, which gives us a final low-level descriptor of 24-dimensional and21-dimensional, respectively. Finally, the number of cubes extracted from videos is deter-mined by dividing the volume of the video with respect to the cube.
Regarding the mid-level descriptors, the only parameters with constant values are theones that define the Gaussian kernel used in the soft-assignment coding technique, whosevalues are µ = 0 and σ = 0.04. Finally, the SVM parameters are found through gridsearch in the training data.
3.4.4 Experimental Design and Analysis
To find the best method configuration, we performed a factorial experiment with replica-tion (N = 3) followed by an analysis of variance (ANOVA) [257]. Each experimental unit

77
is represented as a tuple of n objects, each one with a level of a factor. Considering thereplications, we have a total of 9, 216 tuples, which are used to instantiate the proposedmethod. The instances of the proposed method are evaluated through the measurement ofthe value of the system response variable, the AUC value, after running such instances us-ing the Replay-Attack dataset and Protocol I, using the development set. Next, we collectobtained AUC values and then we performed an ANOVA test to analyze the significanceof the effects of the parameters on the classification results.
With this approach, we can discover which parameters significantly affect the systemresponse variable and also the best configuration of the method [94]. Henceforth, themethod parameters are referred to as factors and their values as levels. Table 3.1 showsa brief description of the factors and their respective levels we consider herein.
Low-Level Descriptor Extraction Parameter Analysis (LGF and M)
The low-level feature extraction has two important parameters: the frequency charac-teristics of the signal (phase or magnitude), and the function used to summarize theinformation of the temporal cubes extracted from a video. In this work, we evaluatemeasures that describe spatial information of the temporal cubes (energy an entropy),and measures that describe the temporal behavior of the cubes (mutual information andcorrelation across time).
To find which levels are statistically different for each factor, we perform the Tukey’sHSD test (see Fig. 3.7). In Figs. 3.7(a)-(b), the pairs in comparison whose confidenceintervals do not intercept the zero value are statistically different. Considering the top-5 method configuration obtained in this experiment, we conclude that the whole framefor extracting features is more interesting than any cropped region in the center of theframe. In addition, the characteristic extracted of the Fourier spectrum and the summa-rization measure used to generate the low-level feature descriptors have a great impact inthe method discriminability (Fig. 3.7(b)), as several comparisons in pairs of features arestatistically significant.
Mid-Level Descriptor Extraction Parameter Analysis (CS, SDD, DS, and CP)
To construct a discriminative visual codebook, we need to choose the best strategy forselecting the words that compose the visual codebooks (CS) as random or clustering-based, the visual codebook size (DS), the policy to create the visual codebooks (SDD) assingle or class-based, and the pooling and coding strategies (CP).
Fig. 3.8 shows the results of the post-hoc test with Tukey’s HSD. In Fig. 3.8(a), wehave the results of the statistical analysis for DS parameter (dictionary size), to whichwas not found statistical significance. Therefore, we recommend that dictionary sizeparameter to be optimized according to the application of interest. In turn, Fig. 3.8(b)shows that different pooling and coding processes causes statistically significant impactson the response variable, and softmax is the recommended choice.
In addition, Fig. 3.8(c) shows that the method used to select the words that composethe visual codebook (random vs. clustering-based selection) also presents results thatare statistically significant with k-means being the recommend choice due to the high

78
−3 −2 −1 0 1
W−C
95% family−wise confidence level
Differences in mean levels of LGF
(a) LGF denotes the region of the framefor extracting the low-level features.
95% family−wise confidence level
Differences in mean levels of M
−30−20−10
0102030
PMI−PH
PMI−PE
PH−PE
PMI−PC
PH−PC
PE−PCPM
I−MM
IPH
−MM
IPE−M
MI
PC−M
MI
PMI−M
HPH
−MH
PE−MH
PC−M
HM
MI−M
HPM
I−ME
PH−M
EPE−M
EPC
−ME
MM
I−ME
MH
−ME
PMI−M
CPH
−MC
PE−MC
PC−M
CM
MI−M
CM
H−M
CM
E−MC
(b) M refers to summarization measure and the video of spectraused to generated the low-level descriptors.
Figure 3.7: Confidence interval on the differences between the means of the levels of thefactors (a) LGF, and (b) M. For each comparison, the Tukey’s HSD test provides anestimation of the differences between mean pairs and their respective confidence intervals,as well the p-value for each comparison. All comparisons whose confidence intervals do notcontain zero value have a p-value lower than 0.05 and, therefore, are statistically differentwith a 95% confidence level. (See Table 3.1 to see the description of levels.)
performance achieved by models built with visual codebooks generated using k-means,during this experiment. Finally, Fig. 3.8(d) shows that the visual codebook creationstrategy (single visual codebook vs. class-based codebooks) does not present statisticaldifference and, therefore, should also be considered in a future optimization process duringthe implementation of the method in a real application.
Classification Step Parameter Analysis (C)
The SVM classifier outperformed PLS classifier with a statistically significant difference(p-value = 0.00). We believe that this happened because of the non-linearity of the dataas we use a non-linear version of SVM the a linear version of PLS.
Analysis of Interaction Effects and Choice of the Best Configuration
After analyzing each factor in isolation, we examine whether there is significant interactionbetween factors. In this case, if a small p-value is obtained in the interaction effect analysisbetween two factors, then we can conclude that these factors do not operate independentlyof each other [94]. Otherwise, there is no evidence of an interaction effect.
First of all, we can see that there is a relationship between the region from whichthe low-level time-spectral features are extracted (factor LGF) and the spectral infor-mation used in the generation of time-spectral descriptors (factor M). When analyzingthe magnitude spectrum of the Fourier transform, we see that there is a concentrationof low frequency components in the abscissa and ordinate axes. Fig. 3.9 shows that thisinteraction between factors LGF and M exists. In addition: (i) we have an increase inthe mean of AUC values for measures MH, PH, PE and PMI, when these measuresare calculated in the center region of the frames; (ii) we have a decrease in the mean of

79
95% family−wise confidence level
Differences in mean levels of DS
360−320360−280320−280360−240320−240280−240360−200320−200280−200240−200360−160320−160280−160240−160200−160360−120320−120280−120240−120200−120160−120
360−80320−80280−80240−80200−80160−80120−80
−1
0
1
2
(a) DS refers to the number of time-spectral visual wordspresent in the visual codebook.
−5 −4 −3 −2 −1 0 1 2softmax−hardsum
softmax−hardmax
hardsum−hardmax
95% family−wise confidence level
Differences in mean levels of CP
(b) CP denotes the coding and pooling strate-gies used to build the mid-level descriptors.
−3 −2 −1 0 1
R−K
95% family−wise confidence level
Differences in mean levels of CS
(c) CS denotes the selection mode of thetime-spectral visual words for composingthe visual codebook.
−1.0 −0.5 0.0 0.5 1.0
S−D
95% family−wise confidence level
Differences in mean levels of SDD
(d) SDD denotes the strategies for gener-ating the visual codebooks, single or class-based visual codebooks.
Figure 3.8: Confidence interval of the differences between the means of the levels of thefactors (a) DS, (b) CP, (c) CS and (d) SDD. All comparisons whose confidence intervalsdo not contain zero value have a p-value lower than 0.05 and, therefore, are statisticallydifferent with a 95% confidence level as it is the case for the comparisons indicated on the(a) x axis and (b-d) y axis. (See Table 3.1 for the description of levels.)
AUC for measure PC; and (iii) we have very small changes in mean values of AUC forMC and MMI when we compare the two strategies for feature extraction.
Finally, the form of selecting the visual words (factor CS) and the method of codingand pooling used in the construction of the dictionaries (factor CP) also presents aninteresting interaction. Both factors significantly influence the results, but not in isolation.Fig. 3.9(b) shows that the results obtained with hardmax, hardsum and softmax are worsewhen the visual words are chosen randomly instead of through clustering.
3.4.5 Summary After Analyzing Different Factors and Levels
The proposed method presents better results using time-spectral features extracted frommagnitude spectrum videos considering the whole frames of a video and using the corre-lation measure from time-spectral features for generating the time-spectral descriptors.
The class-based codebooks outperform the single codebook and the selection strat-egy of the visual words that best fits to the spoofing detection problem is the k-meansclustering. The most appropriate size for codebooks is 320 visual words and the soft-max outperformed the other coding and pooling strategies. With this configuration, we

80
6065
7075
8085
9095
LGF Factor
Mea
n of
AU
C (
%)
●
●
●●
●
●
C W
●
●
●
M Factor
MCPCMEPMIMMIPHPEMH
(a) LGF and M interaction. Notethat we have a slump in the meanof AUC when setting LGF to W anddecrease the number of low-level fea-tures.
7374
7576
7778
CS FactorM
ean
of A
UC
(%
)
K R
CP Factor
softmaxhardmaxhardsum
(b) CS and CP interaction. We havea significant increase in the mean ofAUC with the hard-assignment whenwe use k-means to select the visualwords of the codebooks.
Figure 3.9: Interaction plots between pairs of factors (a) LGF×M and (b) CS×CP. Thefactor LGF denotes the region in the frame considered for extracting the low-level features,while factor M denotes the statistical measures considered for describing the informationof the temporal cubes. Finally, the factor CS denotes the mode of selection of the visualwords from visual codebooks and the factor CP refers to the strategies used in the codingand pooling process. (See Table 3.1 to see the description of levels.)
obtained an AUC of 99.46% and an HTER of 2.75%, considering the test set of theReplay-Attack dataset [41]. Next, we show experiments and results for this method usingthis final configuration.
3.4.6 Results
This section compares the proposed method with others in the literature for the Replay-Attack [41], CASIA [274] and 3DMAD [65] datasets. In all experiments, we used the bestconfiguration of the proposed method as discussed in the last section. The parameters thatdid not present statistical significance (DS and SDD), were fine-tuned for each dataset.
Replay-Attack Dataset
We first consider the validation Protocol I (c.f., Sec. 3.4.2) and the Replay-Attack dataset.Table 3.2 shows the results for the three types of attacks available in this set. Fig. 3.10(a)shows that attacks performed with high-quality samples are more difficult to detect(HTER of 5.94%). This result was expected as high-quality fake samples usually con-tain less artifacts revealing an attack.

81
1 2 5 10 20 40FRR (%)
1
2
5
10
20
40
FAR
(%
)DET Curve
Overall test set
High-definition attacks
Mobile attacks
Print attacks
(a)
1 2 5 10 20 40FRR (%)
1
2
5
10
20
40
FAR
(%
)
DET Curve
Overall test set
Fixed-support attacks
Hand-based attacks
(b)
Figure 3.10: Results obtained on Replay-Attack dataset for each type of attack usingfixed-support (a) in contrast with hand-based attacks (b).
In turn, video-based and photo-based attacks were easily detected (HTER of 0.63%).Note that video-based spoofing attacks are more susceptible to blurring effects, whereasthe photo-based attacks show a large amount of flickering effects due to printing defects.Fig. 3.10(b) shows results obtained considering fixed-support and hand-based attacks,separately. We believe that hand-based attacks are easier to be detected given that smallmovements of the impostor user during the attack generate more artifacts in the biometricsample causing more disturbances in the frequency components.
Table 3.2: Performance results for the Replay-Attack Dataset.Dataset FAR FRR HTER AUC
High-definition attack 10.63 1.25 5.94 98.77
Mobile attack 0.00 1.25 0.63 99.95
Print attack 0.00 1.25 0.63 99.86
Hand-based attack 1.00 1.25 1.13 99.87
Fixed-support attack 7.50 1.25 4.38 99.03
Overall test set 4.25 1.25 2.75 99.46
CASIA Face Anti-Spoofing Dataset
In this experiment, we evaluate the proposed method using the Protocol II (c.f., Sec. 3.4.2)and CASIA dataset.
Table 3.3 shows the results obtained for the seven scenarios of attacks available in thisdataset. Fig. 3.11(a) shows that video-based and warp-photo spoofing attacks are easier tobe detected by the proposed method (HTER of ≈ 8%). On the other hand, the cut-basedspoofing attacks are more difficult to be detected (HTER of 22.22%). One possible reasonfor cut-based attacks to be more difficult for detecting is that during an attempted attackbased on cut-photos, the photographs are practically in the same position during all the
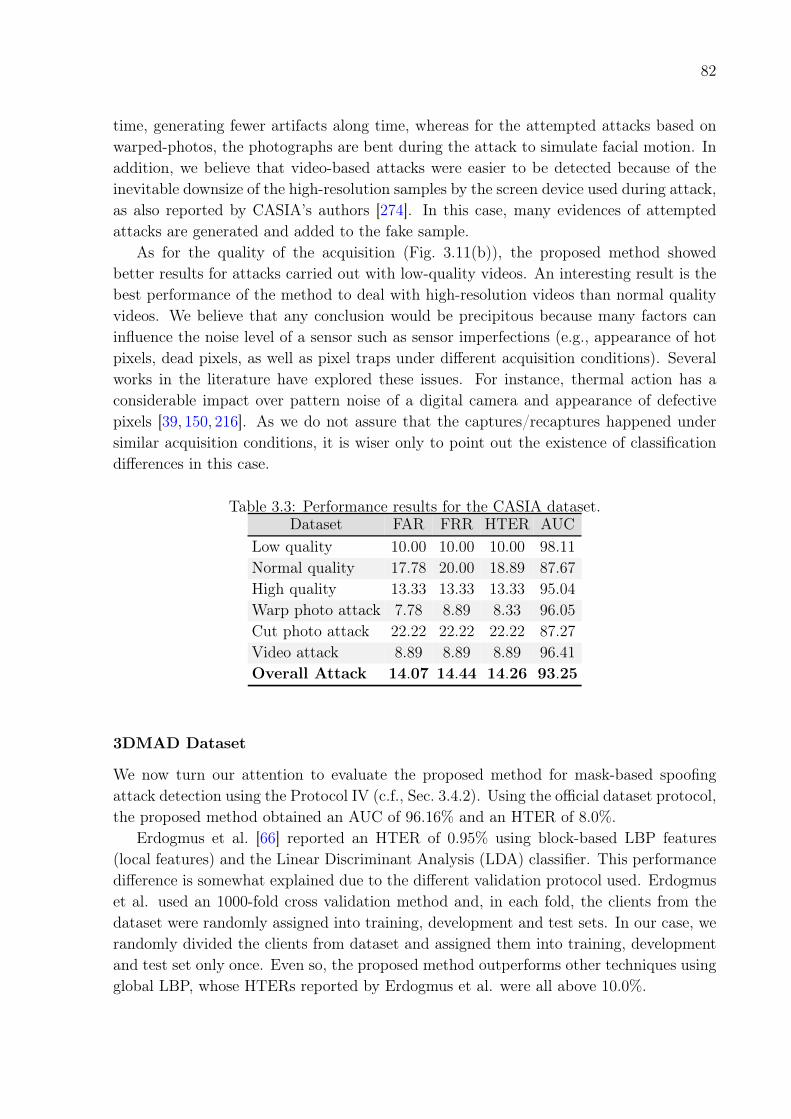
82
time, generating fewer artifacts along time, whereas for the attempted attacks based onwarped-photos, the photographs are bent during the attack to simulate facial motion. Inaddition, we believe that video-based attacks were easier to be detected because of theinevitable downsize of the high-resolution samples by the screen device used during attack,as also reported by CASIA’s authors [274]. In this case, many evidences of attemptedattacks are generated and added to the fake sample.
As for the quality of the acquisition (Fig. 3.11(b)), the proposed method showedbetter results for attacks carried out with low-quality videos. An interesting result is thebest performance of the method to deal with high-resolution videos than normal qualityvideos. We believe that any conclusion would be precipitous because many factors caninfluence the noise level of a sensor such as sensor imperfections (e.g., appearance of hotpixels, dead pixels, as well as pixel traps under different acquisition conditions). Severalworks in the literature have explored these issues. For instance, thermal action has aconsiderable impact over pattern noise of a digital camera and appearance of defectivepixels [39, 150, 216]. As we do not assure that the captures/recaptures happened undersimilar acquisition conditions, it is wiser only to point out the existence of classificationdifferences in this case.
Table 3.3: Performance results for the CASIA dataset.Dataset FAR FRR HTER AUC
Low quality 10.00 10.00 10.00 98.11
Normal quality 17.78 20.00 18.89 87.67
High quality 13.33 13.33 13.33 95.04
Warp photo attack 7.78 8.89 8.33 96.05
Cut photo attack 22.22 22.22 22.22 87.27
Video attack 8.89 8.89 8.89 96.41
Overall Attack 14.07 14.44 14.26 93.25
3DMAD Dataset
We now turn our attention to evaluate the proposed method for mask-based spoofingattack detection using the Protocol IV (c.f., Sec. 3.4.2). Using the official dataset protocol,the proposed method obtained an AUC of 96.16% and an HTER of 8.0%.
Erdogmus et al. [66] reported an HTER of 0.95% using block-based LBP features(local features) and the Linear Discriminant Analysis (LDA) classifier. This performancedifference is somewhat explained due to the different validation protocol used. Erdogmuset al. used an 1000-fold cross validation method and, in each fold, the clients from thedataset were randomly assigned into training, development and test sets. In our case, werandomly divided the clients from dataset and assigned them into training, developmentand test set only once. Even so, the proposed method outperforms other techniques usingglobal LBP, whose HTERs reported by Erdogmus et al. were all above 10.0%.

83
5 10 20 40FRR (%)
5
10
20
40
FAR
(%
)DET Curve
Overall test set
Low quality attacks
Normal quality attacks
High quality attacks
(a)
5 10 20 40FRR (%)
5
10
20
40
FAR
(%
)
DET Curve
Overall test set
Warp attacks
Cut attacks
Video attacks
(b)
Figure 3.11: Results obtained on CASIA dataset for the three type of attacks (a) and forthe three quality of attack (b).
UVAD Dataset
In this experiment, we evaluate the proposed method using the Protocol III (c.f., Sec. 3.4.2)and UVAD dataset. We also evaluate the proposed method considering LBP-based andmotion-based countermeasure methods.
According to Pereira et al. [184], the correlation method presents an HTER of 11.79%
on Replay-Attack. In turn, LBPu28,1 [41] was effective to characterize the artifacts embed-ded in the attack videos on Replay-Attack obtaining an HTER of 15.16%. In the UVADdataset, however, both methods obtained a more modest performance as Table 3.4 shows.With respect to LBPu28,1 method, for instance, the proposed method reduces the classifi-cation error in about 36%.
Table 3.4: Comparison among LBP-based approach, motion-based approach and theproposed method on the UVAD dataset.
Methods FAR (%) FRR (%) HTER (%)Correlation (motion-based approach) [8] 81.60 14.56 48.06
LBPu28,1 [41] 27.41 66.04 46.72
Proposed Method 44.73 15.00 29.87
Comparison with State-of-the-Art Methods for CASIA and Replay-AttackDatasets
In this section, we compare the proposed method with others available in the literaturefor Replay-Attack and CASIA datasets. Table 3.5 shows results for the Replay-AttackDataset. The proposed method outperforms the ones based on texture analysis [41,69,151]and also methods based on motion analysis [8]. It was also more effective than methods

84
based on fusion schemes reported by Pereira et al. [184] and Komulainen et al. [124], witha relative error reduction (RER) of 67.69% and 46.18%, respectively.
Table 3.5: Comparison among the existing methods. The first column shows the HTERsreported by the authors, whereas the second column shows the Relative Error Reduction(RER) obtained with the proposed method. The reported HTERs were obtained usingthe original Replay-Attack Dataset protocol. The results highlighted with † and ‡ werereported by Chingovska et al. and Pereira et al., respectively.
Methods HTER (%) RER (%)Chingovska et al. [41] 15.16 81.86Allan Pinto et al. [190] 14.27 80.73Määttä et al. [151] 13.87† 80.17Anjos and Marcel [8] 11.79‡ 76.68Pereira et al. [184] 8.51 67.69Pereira et al. [69] 7.60 63.82Komulainen et al. [124] 5.11 46.18Proposed Method 2.75 0
Table 3.6 shows a comparison among the proposed method and others reported in theliterature for CASIA dataset. The proposed method is on par with the best ones in theliterature.
Table 3.6: Comparison among the proposed method and others available in the literature.According to the authors of the proposed methods, EERs reported were obtained usingthe original CASIA Dataset protocol.
Methods EER (%)DoG Baseline. [274] 17.0LBPu28,1. [69] 16.0LBP-TOPu28,8,8,1,1,1. [69] 10.0Proposed Method 14.0
Analysis of the Minimum Detection Time
We now analyze the impact of the video length over the method discriminability forCASIA, Replay-Attack and 3DMAD datasets. This experiment evaluates: the minimumnumber of frames required for the method to operate; and the method stability, in termsof HTER(%), for the three different datasets.
Fig. 3.12 indicates that HTER values vary only slightly when we change the videolength for the three datasets and that the proposed method uses about two seconds todetect an attempted attack, thus not compromising the transparency of the authenticationprocess.
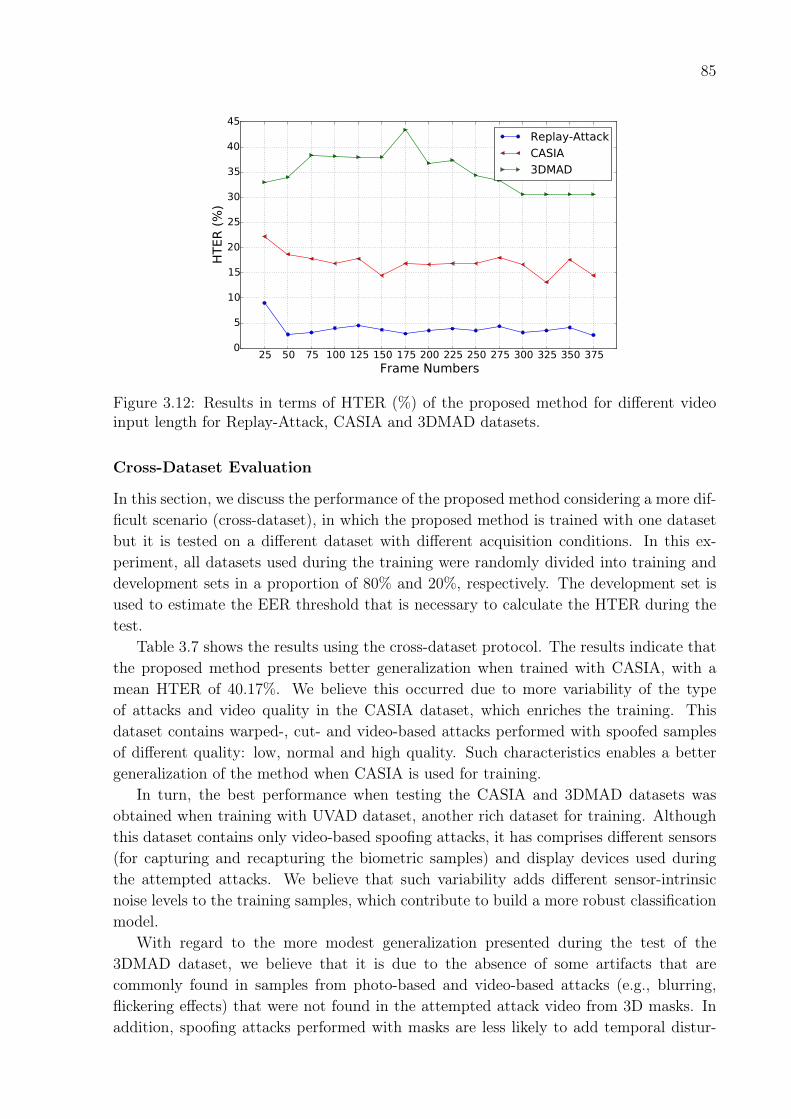
85
25 50 75 100 125 150 175 200 225 250 275 300 325 350 375Frame Numbers
0
5
10
15
20
25
30
35
40
45
HTER
(%
)
Replay-Attack
CASIA
3DMAD
Figure 3.12: Results in terms of HTER (%) of the proposed method for different videoinput length for Replay-Attack, CASIA and 3DMAD datasets.
Cross-Dataset Evaluation
In this section, we discuss the performance of the proposed method considering a more dif-ficult scenario (cross-dataset), in which the proposed method is trained with one datasetbut it is tested on a different dataset with different acquisition conditions. In this ex-periment, all datasets used during the training were randomly divided into training anddevelopment sets in a proportion of 80% and 20%, respectively. The development set isused to estimate the EER threshold that is necessary to calculate the HTER during thetest.
Table 3.7 shows the results using the cross-dataset protocol. The results indicate thatthe proposed method presents better generalization when trained with CASIA, with amean HTER of 40.17%. We believe this occurred due to more variability of the typeof attacks and video quality in the CASIA dataset, which enriches the training. Thisdataset contains warped-, cut- and video-based attacks performed with spoofed samplesof different quality: low, normal and high quality. Such characteristics enables a bettergeneralization of the method when CASIA is used for training.
In turn, the best performance when testing the CASIA and 3DMAD datasets wasobtained when training with UVAD dataset, another rich dataset for training. Althoughthis dataset contains only video-based spoofing attacks, it has comprises different sensors(for capturing and recapturing the biometric samples) and display devices used duringthe attempted attacks. We believe that such variability adds different sensor-intrinsicnoise levels to the training samples, which contribute to build a more robust classificationmodel.
With regard to the more modest generalization presented during the test of the3DMAD dataset, we believe that it is due to the absence of some artifacts that arecommonly found in samples from photo-based and video-based attacks (e.g., blurring,flickering effects) that were not found in the attempted attack video from 3D masks. Inaddition, spoofing attacks performed with masks are less likely to add temporal distur-

86
bances similar to those added when the impostor presents the fake samples, by hand,using a monitor or a photo.
Finally, Table 3.8 shows a comparison among the obtained results reported in the lit-erature. Except for the correlation method, all others present a better performance whenthey are trained with CASIA. Once again, we believe that our method performs betterwhen training with CASIA because such dataset is more heterogeneous than Replay-Attack. The Correlation [8] and LBP-TOP [41] methods aim to characterize temporalinformation, similarly to the proposed method, and the results of both methods empha-size the difficulty in characterizing such information completely. In this protocol, besideshandling data from different sensors, all methods have to deal with different lightingconditions and background.
Table 3.7: Results obtained with the cross-dataset protocol and using the overall test setsof each dataset.
Train Test FAR (%) FRR (%) HTER (%) Mean HTER (%)3DMAD 88.00 4.00 46.00
Replay-Attack 32.50 36.25 34.38CASIAUVAD 38.61 41.67 40.14
40.17%
3DMAD 52.00 44.00 48.00CASIA 0.00 100.0 50.00Replay-AttackUVAD 5.74 83.33 44.54
47.45%
3DMAD 84.00 4.00 44.00CASIA 13.70 63.33 38.52UVAD
Replay-Attack 79.25 6.25 42.7541.76%
3.5 Conclusions and Future Work
In this paper, we proposed an algorithm for detecting spoofing attacks that takes advan-tage of noise and artifacts added to the synthetic biometric samples during their manu-facture and recapture. We showed that the analysis of the behavior of the noise signature,in the frequency domain, is proper to reveal spoofing attacks. For this, we proposed theuse of time-spectral features as low-level descriptors, which gather temporal and spectralinformation in a single feature descriptor. To handle several types of attacks and to obtaina feature descriptor with a suitable generalization, we also proposed the use of the visualcodebook concept to find a mid-level representation from time-spectral descriptors.
The experimental results showed that the magnitude is an important characteristicfrom a signal, in frequency domain, for spoofing attack detection. We also showed howto use the visual codebook concept effectively in order to find a more robust space repre-sentation to the different kinds of attacks and with a good generalization. The obtainedresults demonstrated the effectiveness of the proposed method in detecting different typesof attacks (photo-, video-, and 3D-mask-based ones).
We believe that the frequency-based approach used is effective because we have a de-crease in low frequency components due to information loss caused during manufactureof the fake samples (e.g., information loss during printing) and recapture (e.g., blurring

87
effect) and an increase in some high frequency components in the fake samples during re-capture due to some artifacts added to the fake samples (e.g., printing artifacts, bandingeffect, noise added by the imaging sensor). Moreover, these disturbances in the composi-tion of the components of frequencies are best characterized as we analyze the biometricsample in the frequency domain rather than spatial domain and along time instead of onisolated frames or still images.
Table 3.8: Comparison among different anti-spoofing methods considering cross-datasetprotocol.
Methods Train Test HTER (%)
Proposed MethodReplay-Attack CASIA 50.00CASIA Replay-Attack 34.38Replay-Attack CASIA 48.28
CorrelationCASIA Replay-Attack 50.25
LBP-TOPu28,8,8,1,1,1Replay-Attack CASIA 61.33CASIA Replay-Attack 50.64Replay-Attack CASIA 57.90
LBPu28,1 CASIA Replay-Attack 47.05
Regarding the important cross-dataset validation, the performed experiments demon-strated that the proposed method and other approaches available in the literature stillhave modest generalizations. This is of particular importance for the research communityas it shows that the problem is still far from solved and cross-dataset validation must beconsidered from now on when designing and deploying spoofing detection techniques.
As discussed earlier, we observed that different biometric sensors present differentproperties. Therefore, it is important to train a classifier considering this variability.UVAD dataset comes in hand for this purpose and will surely serve the community in thisregard with more than 15k samples of hundreds of clients and diverse sensors.
Finally, it is worth mentioning that we do not claim to introduce the best methodout there for spoofing detection. On the contrary, our very objective in this paper was toshow that capturing spatio, spectral and temporal features from biometric samples canbe successfully considered in the spoofing detection scenario. That being said, it is likelythat the proposed approach, when combined with existing ones in the literature, mayas well boost the performance since they will likely rely on complementary features forsolving the problem.
Directions for future research include the investigation of new approaches to trans-forming low-level descriptors into mid-level descriptors as Fisher vectors [186] and BossaNova [12]. These strategies for finding mid-level representations could also be exploitedby methods that use texture-based descriptors. In such cases, the goal would be to in-vestigate whether the representation space found by the texture descriptors used in theliterature for detecting face spoofing attacks (e.g., LBP, LBP-TOP, and their variants)could be transformed in a new representation space better adapted to the face spoofingproblem in a scenario with different types of attacks.

88
Acknowledgments
We thank CAPES (DeepEyes Project), FAPESP (#2010/05647-4 and #2011/22749-8), CNPq (#307113/2012-4, #304352/2012-8, #477662/2013-7, #487529/2013-8 and#477457/2013-4), FAPEMIG (APQ-01806-13 and APQ-00567-14), and Microsoft Re-search for the financial support.

89
Chapter 4
Deep Representations for Iris, Face,and Fingerprint Spoofing Detection
“The mediocre teacher tells. The good teacher explains. The superior teacherdemonstrates. The great teacher inspires.”
—William Arthur Ward, American administrator, writer, pastor, and teacher(1921–1994)
“Persistence can change failure into extraordinary achievement.”—Matthew Nicholas Biondi, American swimmer
Abstract
Biometrics systems have significantly improved person identification and authentication,playing an important role in personal, national, and global security. However, thesesystems might be deceived (or “spoofed”) and, despite the recent advances in spoofingdetection, current solutions often rely on domain knowledge, specific biometric readingsystems, and attack types. We assume a very limited knowledge about biometric spoofingat the sensor to derive outstanding spoofing detection systems for iris, face, and fingerprintmodalities based on two deep learning approaches. The first approach consists of learningsuitable convolutional network architectures for each domain, while the second approachfocuses on learning the weights of the network via back-propagation. We consider ninebiometric spoofing benchmarks — each one containing real and fake samples of a givenbiometric modality and attack type — and learn deep representations for each benchmark
c©2015 IEEE. Personal use of this material is permitted. Permission from IEEE must be obtainedfor all other uses, in any current or future media, including reprinting/republishing this material foradvertising or promotional purposes, creating new collective works, for resale or redistribution to serversor lists, or reuse of any copyrighted component of this work in other works.Pre-print of article that will appear in T-IFS, vol.10, no.4, pp.864-879, April 2015.The published article is available on http://dx.doi.org/10.1109/TIFS.2015.2398817See permission to use the copyrighted material in Appendix C.

90
by combining and contrasting the two learning approaches. This strategy not only pro-vides better comprehension of how these approaches interplay, but also creates systemsthat exceed the best known results in eight out of the nine benchmarks. The resultsstrongly indicate that spoofing detection systems based on convolutional networks can berobust to attacks already known and possibly adapted, with little effort, to image-basedattacks that are yet to come.
4.1 Introduction
B IOMETRICS human characteristics and traits can successfully allow people identifi-cation and authentication and have been widely used for access control, surveillance,
and also in national and global security systems [108]. In the last few years, due to therecent technological improvements for data acquisition, storage and processing, and alsothe scientific advances in computer vision, pattern recognition, and machine learning, sev-eral biometric modalities have been largely applied to person recognition, ranging fromtraditional fingerprint to face, to iris, and, more recently, to vein and blood flow. Simul-taneously, various spoofing attacks techniques have been created to defeat such biometricsystems.
There are several ways to spoof a biometric system [204,205]. Indeed, previous studiesshow at least eight different points of attack [76, 203] that can be divided into two maingroups: direct and indirect attacks. The former considers the possibility to generate syn-thetic biometric samples, and is the first vulnerability point of a biometric security systemacting at the sensor level. The latter includes all the remaining seven points of attacksand requires different levels of knowledge about the system, e.g., the matching algorithmused, the specific feature extraction procedure, database access for manipulation, and alsopossible weak links in the communication channels within the system.
Given that the most vulnerable part of a system is its acquisition sensor, attackers havemainly focused on direct spoofing. This is possibly because a number of biometric traitscan be easily forged with the use of common apparatus and consumer electronics to imitatereal biometric readings (e.g., stampers, printers, displays, audio recorders). In responseto that, several biometric spoofing benchmarks have been recently proposed, allowingresearchers to make steady progress in the conception of anti-spoofing systems. Threerelevant modalities in which spoofing detection has been investigated are iris, face, andfingerprint. Benchmarks across these modalities usually share the common characteristicof being image- or video-based.
In the context of irises, attacks are normally performed using printed iris images [229]or, more interestingly, cosmetic contact lenses [32,264]. With faces, impostors can presentto the acquisition sensor a photography, a digital video [41], or even a 3D mask [66] of avalid user. For fingerprints, the most common spoofing method consists of using artificialreplicas [83] created in a cooperative way, where a mold of the fingerprint is acquired withthe cooperation of a valid user and is used to replicate the user’s fingerprint with differentmaterials, including gelatin, latex, play-doh or silicone.
The success of an anti-spoofing method is usually connected to the modality for which
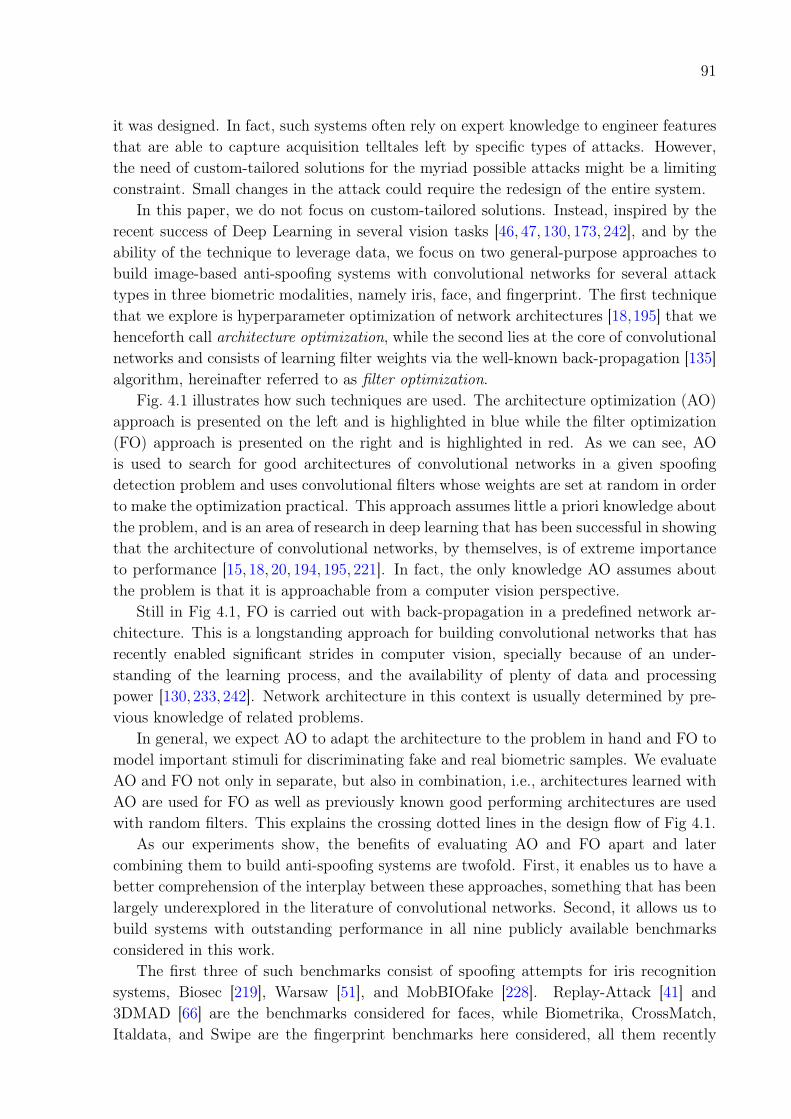
91
it was designed. In fact, such systems often rely on expert knowledge to engineer featuresthat are able to capture acquisition telltales left by specific types of attacks. However,the need of custom-tailored solutions for the myriad possible attacks might be a limitingconstraint. Small changes in the attack could require the redesign of the entire system.
In this paper, we do not focus on custom-tailored solutions. Instead, inspired by therecent success of Deep Learning in several vision tasks [46, 47, 130, 173, 242], and by theability of the technique to leverage data, we focus on two general-purpose approaches tobuild image-based anti-spoofing systems with convolutional networks for several attacktypes in three biometric modalities, namely iris, face, and fingerprint. The first techniquethat we explore is hyperparameter optimization of network architectures [18,195] that wehenceforth call architecture optimization, while the second lies at the core of convolutionalnetworks and consists of learning filter weights via the well-known back-propagation [135]algorithm, hereinafter referred to as filter optimization.
Fig. 4.1 illustrates how such techniques are used. The architecture optimization (AO)approach is presented on the left and is highlighted in blue while the filter optimization(FO) approach is presented on the right and is highlighted in red. As we can see, AOis used to search for good architectures of convolutional networks in a given spoofingdetection problem and uses convolutional filters whose weights are set at random in orderto make the optimization practical. This approach assumes little a priori knowledge aboutthe problem, and is an area of research in deep learning that has been successful in showingthat the architecture of convolutional networks, by themselves, is of extreme importanceto performance [15, 18, 20, 194, 195, 221]. In fact, the only knowledge AO assumes aboutthe problem is that it is approachable from a computer vision perspective.
Still in Fig 4.1, FO is carried out with back-propagation in a predefined network ar-chitecture. This is a longstanding approach for building convolutional networks that hasrecently enabled significant strides in computer vision, specially because of an under-standing of the learning process, and the availability of plenty of data and processingpower [130, 233, 242]. Network architecture in this context is usually determined by pre-vious knowledge of related problems.
In general, we expect AO to adapt the architecture to the problem in hand and FO tomodel important stimuli for discriminating fake and real biometric samples. We evaluateAO and FO not only in separate, but also in combination, i.e., architectures learned withAO are used for FO as well as previously known good performing architectures are usedwith random filters. This explains the crossing dotted lines in the design flow of Fig 4.1.
As our experiments show, the benefits of evaluating AO and FO apart and latercombining them to build anti-spoofing systems are twofold. First, it enables us to have abetter comprehension of the interplay between these approaches, something that has beenlargely underexplored in the literature of convolutional networks. Second, it allows us tobuild systems with outstanding performance in all nine publicly available benchmarksconsidered in this work.
The first three of such benchmarks consist of spoofing attempts for iris recognitionsystems, Biosec [219], Warsaw [51], and MobBIOfake [228]. Replay-Attack [41] and3DMAD [66] are the benchmarks considered for faces, while Biometrika, CrossMatch,Italdata, and Swipe are the fingerprint benchmarks here considered, all them recently

92
real and fake biometric images
anti-spoofing system
convolutional network architecture
hyperparameteroptimization
filter learningvia back-prop
random filterweights
domainknowledge
+ +
architecture optimization
AO
filteroptimization
FO
Figure 4.1: Schematic diagram detailing how anti-spoofing systems are built from spoofingdetection benchmarks. Architecture optimization (AO) is shown on the left and filteroptimization (FO) on the right. In this work, we not only evaluate AO and FO inseparate, but also in combination, as indicated by the crossing dotted lines.
used in the 2013 Fingerprint Liveness Detection Competition (LivDet’13) [83].Results outperform state-of-the-art counterparts in eight of the nine cases and observe
a balance in terms of performance between AO and FO, with one performing better thanthe other depending on the sample size and problem difficulty. In some cases, we alsoshow that when both approaches are combined, we can obtain performance levels thatneither one can obtain by itself. Moreover, by observing the behaviour of AO and FO, wetake advantage of domain knowledge to propose a single new convolutional architecturethat push performance in five problems even further, sometimes by a large margin, as inCrossMatch (68.80% v. 98.23%).
The experimental results strongly indicate that convolutional networks can be readilyused for robust spoofing detection. Indeed, we believe that data-driven solutions based ondeep representations might be a valuable direction to this field of research, allowing theconstruction of systems with little effort even to image-based attack types yet to come.
We organized the remainder of this work into five sections. Section 4.2 presents previ-ous anti-spoofing systems for the three biometric modalities covered in this paper, whileSection 4.3 presents the considered benchmarks. Section 4.4 describes the methodologyadopted for architecture optimization (AO) and filter optimization (FO) while Section 4.5presents experiments, results, and comparisons with state-of-the-art methods. Finally,Section 4.6 concludes the paper and discusses some possible future directions.
93
4.2 Related Work
In this section, we review anti-spoofing related work for iris, face, and fingerprints, ourfocus in this paper.
4.2.1 Iris Spoofing
Daugman [60, Section 8 – Countermeasures against Subterfuge]1 was one of the firstauthors to discuss the feasibility of some attacks on iris recognition systems. The authorproposed the use of Fast Fourier Transform to verify the high frequency spectral magnitudein the frequency domain.
The solutions for iris liveness detection available in the literature range from activesolutions relying on special acquisition hardware [113,137,174] to software-based solutionsrelying on texture analysis of the effects of an attacker using color contact lenses withsomeone else’s pattern printed onto them [259]. Software-based solutions have also ex-plored the effects of cosmetic contact lenses [32,64,120,264]; pupil constriction [102]; andmulti biometrics of electroencephalogram (EEG) and iris together [115], among others.
Galbally et al. [75] investigated 22 image quality measures (e.g., focus, motion, oc-clusion, and pupil dilation). The best features are selected through sequential floatingfeature selection (SFFS) [198] to feed a quadratic discriminant classifier. The authorsvalidated the work on the BioSec [68,219] benchmark. Sequeira et al. [226] also exploredimage quality measures [75] and three classification techniques validating the work onthe BioSec [68, 219] and Clarkson [224] benchmarks and introducing the MobBIOfakebenchmark comprising 800 iris images from the MobBIO multimodal database [228].
Sequeira et al. [227] extended upon previous works also exploring quality measures.They first used a feature selection step on the features of the studied methods to ob-tain the “best features” and then used well-known classifiers for the decision-making. Inaddition, they applied iris segmentation [164] to obtaining the iris contour and adaptedthe feature extraction processes to the resulting non-circular iris regions. The validationconsidered five datasets (BioSec [68,219], MobBIOfake [228], Warsaw [51], Clarkson [224]and NotreDame [63].
Textures have also been explored for iris liveness detection. In the recent MobILive2 [229]iris spoofing detection competition, the winning team explored three texture descriptors:Local Phase Quantization (LPQ) [171], Binary Gabor Pattern [272], and Local BinaryPattern (LBP) [169].
Analyzing printing regularities left in printed irises, Czajka [51] explored some peaksin the frequency spectrum were associated to spoofing attacks. For validation, the authorsintroduced the Warsaw dataset containing 729 fake images and 1,274 images of real eyes.In [224], The First Intl. Iris Liveness Competition in 2013, the Warsaw database was alsoevaluated, however, the best reported result achieved 11.95% of FRR and 5.25% of FARby the University of Porto team.
Sun et al. [238] recently proposed a general framework for iris image classification based1It also appears in a lecture of Daugman at IBC 2004 [58].2MobLive 2014, Intl. Joint Conference on Biometrics (IJCB).
94
on a Hierarchical Visual Codebook (HVC). The HVC encodes the texture primitives ofiris images and is based on two existing bag-of-words models. The method achievedstate-of-the-art performance for iris spoofing detection, among other tasks.
In summary, iris anti-spoofing methods have explored hard-coded features throughimage-quality metrics, texture patterns, bags-of-visual-words and noise artifacts due to therecapturing process. The performance of such solutions vary significantly from dataset todataset. Differently, here we propose the automatically extract vision meaningful featuresdirectly from the data using deep representations.
4.2.2 Face Spoofing
We can categorize the face anti-spoofing methods into four groups [214]: user behaviormodeling, methods relying on extra devices [270], methods relying on user cooperationand, finally, data-driven characterization methods. In this section, we review data-drivencharacterization methods proposed in literature, the focus of our work herein.
Määttä et al. [151] used LBP operator for capturing printing artifacts and micro-texture patterns added in the fake biometric samples during acquisition. Schwartz etal. [214] explored color, texture, and shape of the face region and used them with PartialLeast Square (PLS) classifier for deciding whether a biometric sample is fake or not. Bothworks validated the methods with the Print Attack benchmark [8]. Lee et al. [139] alsoexplored image-based attacks and proposed the frequency entropy analysis for spoofingdetection.
Pinto et al. [193] pioneered research on video-based face spoofing detection. Theyproposed visual rhythm analysis to capture temporal information on face spoofing attacks.
Mask-based face spoofing attacks have also been considered thus far. Erdogmus etal. [65] dealt with the problem through Gabor wavelets: local Gabor binary pattern his-togram sequences [273] and Gabor graphs [262] with a Gabor-phase based similarity mea-sure [90]. Erdogmus & Marcel [66] introduced the 3D Mask Attack database (3DMAD),a public available 3D spoofing database, recorded with Microsoft Kinect sensor.
Kose et al. [127] demonstrated that a face verification system is vulnerable to mask-based attacks and, in another work, Kose et al. [126] evaluated the anti-spoofing methodproposed by Määttä et al. [151] (originally proposed to detect photo-based spoofing at-tacks). Inspired by the work of Tan et al. [245], Kose et al. [128] evaluated a solutionbased on reflectance to detect attacks performed with 3D masks.
Finally, Pereira et al. [184] proposed a score-level fusion strategy in order to detectvarious types of attacks. In a follow-up work, Pereira et al. [69] proposed an anti-spoofingsolution based on the dynamic texture, a spatio-temporal version of the original LBP.Results showed that LBP-based dynamic texture description has a higher effectivenessthan the original LBP.
In summary, similarly to iris spoofing detection methods, the available solutions inthe literature mostly deal with the face spoofing detection problem through texture pat-terns (e.g., LBP-like detectors), acquisition telltales (noise), and image quality metrics.Here, we approach the proplem by extracting meaningful features directly from the dataregardless of the input type (image, video, or 3D masks).

95
4.2.3 Fingerprint Spoofing
We can categorize fingerprint spoofing detection methods roughly into two groups: hardware-based (exploring extra sensors) and software-based solutions (relying only on the infor-mation acquired by the standard acquisition sensor of the authentication system) [83].
Galbally et al. [71] proposed a set of feature for fingerprint liveness detection based onquality measures such as ridge strength or directionality, ridge continuity, ridge clarity, andintegrity of the ridge-valley structure. The validation considered the three benchmarksused in LivDet 2009 – Fingerprint competition [159] captured with different optical sen-sors: Biometrika, CrossMatch, and Identix. Later work [72] explored the method in thepresence of gummy fingers.
Ghiani et al. [82] explored LPQ [171], a method for representing all spectrum char-acteristics in a compact feature representation form. The validation considered the fourbenchmarks used in the LivDet 2011 – Fingerprint competition [266].
Gragnaniello et al. [86] explored the Weber Local Image Descriptor (WLD) for livenessdetection, well suited to high-contrast patterns such as the ridges and valleys of finger-prints images. In addition, WLD is robust to noise and illumination changes. The vali-dation considered the LivDet 2009 and LivDet 2011 – Fingerprint competition datasets.
Jia et al. [112] proposed a liveness detection scheme based on Multi-scale Block LocalTernary Patterns (MBLTP). Differently of the LBP, the Local Ternary Pattern operationis done on the average value of the block instead of the pixels being more robust to noise.The validation considered the LivDet 2011 – Fingerprint competition benchmarks.
Ghiani et al. [81] explored Binarized Statistical Image Features (BSIF) originally pro-posed by Kannala et al. [114]. The BSIF was inspired in the LBP and LPQ methods. Incontrast to LBP and LPQ approaches, BSIF learns a filter set by using statistics of nat-ural images [104]. The validation considered the LivDet 2011 – Fingerprint competitionbenchmarks.
Recent results reported in the LivDet 2013 Fingerprint Liveness Detection Competi-tion [81] show that fingerprint spoofing attack detection task is still an open problem withresults still far from a perfect classification rate.
We notice that most of the groups approach the problem with hard-coded featuressometimes exploring quality metrics related to the modality (e.g., directionality and ridgestrength), general texture patterns (e.g., LBP-, MBLTP-, and LPQ-based methods), andfilter learning through natural image statistics. This last approach seems to open a newresearch trend, which seeks to model the problem learning features directly from thedata. We follow this approach in this work, assuming little a priori knowledge aboutacquisition-level biometric spoofing and exploring deep representations of the data.
4.2.4 Multi-modalities
Recently, Galbally et al. [74] proposed a general approach based on 25 image qualityfeatures to detect spoofing attempts in face, iris, and fingerprint biometric systems. Ourwork is similar to theirs in goals, but radically different with respect to the methods.Instead of relying on prescribed image quality features, we build features that would be

96
hardly thought by a human expert with AO and FO. Moreover, here we evaluate oursystems in more recent and updated benchmarks.
4.3 Benchmarks
In this section, we describe the benchmarks (datasets) that we consider in this work.All them are publicly available upon request and suitable for evaluating countermeasuremethods to iris, face and fingerprint spoofing attacks. Table 4.1 shows the major featuresof each one and in the following we describe their details.
4.3.1 Iris Spoofing Benchmarks
Biosec
This benchmark was created using iris images from 50 users of the BioSec [219]. Intotal, there are 16 images for each user (2 sessions × 2 eyes × 4 images), totalizing800 valid access images. To create spoofing attempts, the original images from Biosecwere preprocessed to improve quality and printed using an HP Deskjet 970cxi and anHP LaserJet 4200L printers. Finally, the iris images were recaptured with the same iriscamera used to capture the original images.
Warsaw
This benchmark contains 1274 images of 237 volunteers representing valid accesses and729 printout images representing spoofing attempts, which were generated by using twoprinters: (1) a HP LaserJet 1320 used to produce 314 fake images with 600 dpi resolution,and (2) a Lexmark C534DN used to produce 415 fake images with 1200 dpi resolution.Both real and fake images were captured by an IrisGuard AD100 biometric device.
MobBIOfake
This benchmark contains live iris images and fake printed iris images captured with thesame acquisition sensor, i.e., a mobile phone. To generate fake images, the authors firstperformed a preprocessing in the original images to enhance the contrast. The prepro-cessed images were then printed with a professional printer on high quality photographicpaper.
4.3.2 Video-based Face Spoofing Benchmarks
Replay-Attack
This benchmark contains short video recordings of both valid accesses and video-based at-tacks of 50 different subjects. To generate valid access videos, each person was recorded intwo sessions in a controlled and in an adverse environment with a regular webcam. Then,spoofing attempts were generated using three techniques: (1) print attack, which presentsto the acquisition sensor hard copies of high-resolution digital photographs printed with

97
Table4.1:
Mainfeatures
ofthebe
nchm
arks
considered
herein.
Mod
ality
Benchmark/
Dataset
Color
Dim
ension
#Tr
aining
#Te
sting
#Develop
ment
cols×rows
Live
Fake
Total
Live
Fake
Total
Live
Fake
Total
Iris
Warsaw
[51]
No
640×
480
228
203
431
624
612
1236
Biosec[219
]No
640×
480
200
200
400
600
600
1200
Mob
BIO
fake
[228
]Yes
250×
200
400
400
800
400
400
800
Face
Replay-Attack[36]
Yes
320×
240
600
3000
3600
4000
800
4800
600
3000
3600
3dMad
[42]
Yes
640×
480
350
350
700
250
250
500
250
250
500
Fingerprint
Biometrika
[83]
No
312×
372
1000
1000
2000
1000
1000
2000
CrossMatch
[83]
No
800×
750
1250
1000
2250
1250
1000
2250
Italda
ta[83]
No
640×
480
1000
1000
2000
1200
1000
2000
Swipe[83]
No
208×
1500
1221
979
2200
1153
1000
2153

98
a Triumph-Adler DCC 2520 color laser printer; (2) mobile attack, which presents to theacquisition sensor photos and videos taken with an iPhone using the iPhone screen; and(3) high-definition attack, in which high resolution photos and videos taken with an iPadare presented to the acquisition sensor using the iPad screen.
3DMAD
This benchmark consists of real videos and fake videos made with people wearing masks.A total of 17 different subjects were recorded with a Microsoft Kinect sensor, and videoswere collected in three sessions. For each session and each person, five videos of 10 secondswere captured. The 3D masks were produced by ThatsMyFace.com using one frontal andtwo profile images of each subject. All videos were recorded by the same acquisitionsensor.
4.3.3 Fingerprint Spoofing Benchmarks
LivDet2013
This dataset contains four sets of real and fake fingerprint readings performed in fouracquisition sensors: Biometrika FX2000, Italdata ET10, Crossmatch L Scan Guardian,and Swipe. For a more realistic scenario, fake samples in Biometrika and Italdata weregenerated without user cooperation, while fake samples in Crossmatch and Swipe weregenerated with user cooperation. Several materials for creating the artificial fingerprintswere used, including gelatin, silicone, latex, among others.
4.3.4 Remark
Images found in these benchmarks can be observed in Fig. 4.5 of Section 4.5. As we cansee, variability exists not only across modalities, but also within modalities. Moreover,it is rather unclear what features might discriminate real from spoofed images, whichsuggests that the use of a methodology able to use data to its maximum advantage mightbe a promising idea to tackle such set of problems in a principled way.
4.4 Methodology
In this section, we present the methodology for architecture optimization (AO) and filteroptimization (FO) as well as details about how benchmark images are preprocessed, howAO and FO are evaluated across the benchmarks, and how these methods are imple-mented.
4.4.1 Architecture Optimization (AO)
Our approach for AO builds upon the work of Pinto et al. [195] and Bergstra et al. [20],i.e., fundamental, feedforward convolutional operations are stacked by means of hyperpa-rameter optimization, leading to effective yet simple convolutional networks that do not

99
require expensive filter optimization and from which prediction is done by linear supportvector machines (SVMs).
Operations in convolutional networks can be viewed as linear and non-linear transfor-mations that, when stacked, extract high level representations of the input. Here we usea well-known set of operations called (i) convolution with a bank of filters, (ii) rectifiedlinear activation, (iii) spatial pooling, and (iv) local normalization. Appendix B providesa detailed definition of these operations.
We denote as layer the combination of these four operations in the order that theyappear in the left panel of Fig. 4.2. Local normalization is optional and its use is governedby an additional “yes/no” hyperparameter. In fact, there are other six hyperparameters,each of a particular operation, that have to be defined in order to instantiate a layer.They are presented in the lower part of the left panel in Fig. 4.2 and are in accordance tothe definitions of Appendix B.
Considering one layer and possible values of each hyperparameter, there are over3,000 possible layer architectures, and this number grows exponentially with the numberof layers, which goes up to three in our case (Fig. 4.2 right panel). In addition, thereare network-level hyperparameters, such as the size of the input image, that expandpossibilities to a myriad potential architectures.
The overall set of possible hyperparameter values is called search space, which inthis case is discrete and contains variables that are only meaningful in combination withothers. For example, hyperparameters of a given layer are just meaningful if the candidatearchitecture has actually that number of layers. In spite of the intrinsic difficulty inoptimizing architectures in this space, random search has played and important role inproblems of this type [18, 195] and it is the strategy of our choice due to its effectivenessand simplicity.
We can see in Fig. 4.2 that a three-layered network has a total of 25 hyperparameters,seven per layer and four at network level. They are all defined in Appendix B with theexception of input size, which seeks to determine the best size of the image’s greatest axis(rows or columns) while keeping its aspect ratio. Concretely, random search in this papercan be described as follows:
1. Randomly — and uniformly, in our case — sample values from the hyperparametersearch space;
2. Extract features from real and fake training images with the candidate architecture;
3. Evaluate the architecture according to an optimization objective based on linearSVM scores;
4. Repeat steps 1–3 until a termination criterion is met;
5. Return the best found convolutional architecture.
Even though there are billions of possible networks in the search space (Fig. 4.2), itis important to remark that not all candidate networks are valid. For example, a large

100
operation hyperparameter valuesconvolution filter size {3, 5, 7, 9}
number of filters {32, 64, 128, 256}activation —pooling size {3, 5, 7, 9}
stride {1, 2, 4, 8}strength {1, 2, 10}
local norm. apply (yes/no) {yes, no}size {3, 5, 7, 9}
hyperparameter valuesinput size {64, 128, 256, original}local norm. {yes, no}local norm. size {3,5,7,9}depth {1, 2, 3}
local norm.
choose
choose
layer 1 layer 1 layer 1
layer 2 layer 2
layer 3
linear SVMlinear SVM linear SVM
real and fake biometric images
loss of candidate model
convolution
activation
pooling
local norm.
choose
networklayer
Figure 4.2: Schematic diagram for architecture optimization (AO) illustrating how oper-ations are stacked in a layer (left) and how the network is instantiated and evaluated ac-cording to possible hyperparameter values (right). Note that a three-layered convolutionalnetwork of this type has a total of 25 hyperparameters governing both its architectureand its overall behaviour through a particular instance of stacked operations.
number of candidate architectures (i.e., points in the search space) would produce rep-resentations with spatial resolution smaller than one pixel. Hence, they are naturallyunfeasible. Additionally, in order to avoid very large representations, we discard in ad-vance candidate architectures whose intermediate layers produce representations of over600K elements or whose output representation has over 30K elements.
Filter weights are randomly generated for AO. This strategy has been successfully usedin the vision literature [111,194,195,221] and is essential to make AO practical, avoidingthe expensive filter optimization (FO) part in the evaluation of candidate architectures.We sample weights from a uniform distribution U(0, 1) and normalize the filters to zeromean and unit norm in order to ensure that they are spread over the unit sphere. Whencoupled with rectified linear activation (Appendix B), this sampling enforces sparsity inthe network by discarding about 50% of the expected filter responses, thereby improvingthe overall robustness of the feature extraction.
A candidate architecture is evaluated by first extracting deep representations fromreal and fake images and later training hard-margin linear SVMs (C=105) on these repre-sentations. We observed that the sensitivity of the performance measure was saturatingwith traditional 10-fold cross validation (CV) in some benchmarks. Therefore, we opted

101
for a different validation strategy. Instead of training on nine folds and validating onone, we train on one fold and validate on nine. Precisely, the optimization objective isthe mean detection accuracy obtained from this adapted cross-validation scheme, whichis maximized during the optimization.
For generating the 10 folds, we took special care in putting all samples of an individualin the same fold to enforce robustness to cross-individual spoofing detection in the opti-mized architectures. Moreover, in benchmarks where we have more than one attack type(e.g., Replay-Attack and LivDet2013, see Section 4.3), we evenly distributed samples ofeach attack type across all folds in order to enforce that candidate architectures are alsorobust to different types of attack.
Finally, the termination criterion of our AO procedure simply consists of counting thenumber of valid candidate architectures and stopping the optimization when this numberreaches 2,000.
4.4.2 Filter Optimization (FO)
convolution
filters 64size 5
layer 1
pooling size 3stride 2
local norm. size 9
layer 3
image
softmax
cuda-convnet-cifar10-11pct (cf10-11)
convolution filters 16size 5
layer 1
pooling size 3stride 2
local norm. size 9
layer 2 layer 3
dense units 2
image
softmax
spoofnet
convolution filters 64size 5
pooling size 3stride 2
local norm. size 9
convolution
filters 64size 5
layer 2
pooling size 3stride 2
local norm. size 9
unshared filters 64local size 3
layer3
dense units 2
unshared filters 64local size 3
convolution
filters 16size 5
layer 1
pooling size 3stride 2
local norm. size 9
layer 3
image
softmax
spoofnet
layer3
dense units 2
convolution
filters 64size 5
layer 2
pooling size 3stride 2
local norm. size 9
32x32
128x128
Figure 4.3: Architecture of convolutional network found in the Cuda-convnet library andhere used as reference for filter optimization (cf10-11, top). Proposed network architectureextending upon cf10-11 to better suiting spoofing detection problems (spoofnet, bottom).Both architectures are typical examples where domain knowledge has been incorporatedfor increased performance.
We now turn our attention to a different approach for tackling the problem. Insteadof optimizing the architecture, we explore the filter weights and how to learn them forbetter characterizing real and fake samples. Our approach for FO is at the origins of

102
convolutional networks and consists of learning filter weights via the well-known back-propagation algorithm [135]. Indeed, due to a refined understanding of the optimizationprocess and the availability of plenty of data and processing power, back-propagationhas been the gold standard method in deep networks for computer vision in the lastyears [130,233,271].
For optimizing filters, we need to have an already defined architecture. We startoptimizing filters with a standard public convolutional network and training procedure.This network is available in the Cuda-convnet library [129] and is currently one of thebest performing architectures in CIFAR-10,3 a popular computer vision benchmark inwhich such network achieves 11% of classification error. Hereinafter, we call this networkcuda-convnet-cifar10-11pct, or simply cf10-11.
Fig. 4.3 depicts the architecture of cf10-11 in the top panel and is a typical examplewhere domain knowledge has been incorporated for increased performance. We can see itas a three-layered network in which the first two layers are convolutional, with operationssimilar to the operations used in architecture optimization (AO). In the third layer, cf10-11 has two sublayers of unshared local filtering and a final fully-connected sublayer ontop of which softmax regression is performed. A detailed explanation of the operations incf10-11 can be found in [129].
In order to train cf10-11 in a given benchmark, we split the training images intofour batches observing the same balance of real and fake images. After that, we followa procedure similar to the original4 for training cf10-11 in all benchmarks, which can bedescribed as follows:
1. For 100 epochs, train the network with a learning rate of 10−3 by considering thefirst three batches for training and the fourth batch for validation;
2. For another 40 epochs, resume training now considering all four batches for training;
3. Reduce the learning rate by a factor of 10, and train the network for another 10epochs;
4. Reduce the learning rate by another factor of 10, and train the network for another10 epochs.
After evaluating filter learning on the cf10-11 architecture, we also wondered how filterlearning could benefit from an optimized architecture incorporating domain-knowledge ofthe problem. Therefore, extending upon the knowledge obtained with AO as well as withtraining cf10-11 in the benchmarks, we derived a new architecture for spoofing detectionthat we call spoofnet. Fig. 4.3 illustrates this architecture in the bottom panel and hasthree key differences as compared to cf10-11. First, it has 16 filters in the first layerinstead of 64. Second, operations in the second layer are stacked in the same order thatwe used when optimizing architectures (AO). Third, we removed the two unshared localfiltering operations in the third layer, as they seem inappropriate in a problem whereobject structure is irrelevant.
3http://www.cs.toronto.edu/~kriz/cifar.html4https://code.google.com/p/cuda-convnet/wiki/Methodology.

103
Table 4.2: Input image dimensionality after basic preprocessing on face and fingerprintimages (highlighted). See Section 4.4.3 for details.
Modality BenchmarkDimensions
columns× rows
IrisWarsaw [51] 640× 480
Biosec [219] 640× 480
MobBIOfake [228] 250× 200
FaceReplay-Attack [36] 200× 200
3DMAD [42] 200× 200
Fingerprint
Biometrika [83] 312× 372
CrossMatch [83] 480× 675
Italdata [83] 384× 432
Swipe [83] 187× 962
These three modifications considerably dropped the number of weights in the networkand this, in turn, allowed us to increase of size of the input images from 32 × 32 to128 × 128. This is the fourth and last modification in spoofnet, and we believe that itmight enable the network to be more sensitive to subtle local patterns in the images.
In order to train spoofnet, the same procedure used to train cf10-11 is consideredexcept for the initial learning rate, which is made 10−4, and for the number of epochsin each step, which is doubled. These modifications were made because of the decreasedlearning capacity of the network.
Finally, in order to reduce overfitting, data augmentation is used for training bothnetworks according to the procedure of [130]. For cf10-11, five 24 × 24 image patchesare cropped out from the 32 × 32 input images. These patches correspond to the fourcorners and central region of the original image, and their horizontal reflections are alsoconsidered. Therefore, ten training samples are generated from a single image. Forspoofnet, the procedure is the same except for the fact that input images have 128× 128
pixels and cropped regions are of 112 × 112 pixels. During prediction, just the centralregion of the test image is considered.
4.4.3 Elementary Preprocessing
A few basic preprocessing operations were executed on face and fingerprint images inorder to properly learn representations for these benchmarks. This preprocessing led toimages with sizes as presented in Table 4.2 and are described in the next two sections.
Face Images
Given that the face benchmarks considered in this work are video-based, we first evenlysubsample 10 frames from each input video. Then, we detect the face position using Viola& Jones [255] and crop a region of 200× 200 pixels centered at the detected window.

104
Fingerprint Images
Given the diverse nature of images captured from different sensors, here the preprocessingis defined according to the sensor type.
1. Biometrika: we cropped the central region of size in columns and rows correspondingto 70% of the original image dimensions.
2. Italdata and CrossMatch: we cropped the central region of size in columns and rowsrespectively corresponding to 60% and 90% of the original image columns and rows.
3. Swipe: As the images acquired by this sensor contain a variable number of blankrows at the bottom, the average number of non-blank rows M was first calculatedfrom the training images. Then, in order to obtain images of a common size withnon-blank rows, we removed their blank rows at the bottom and rescaled them toM rows. Finally, we cropped the central region corresponding to 90% of originalimage columns and M rows.
The rationale for these operations is based on the observation that fingerprint imagesin LivDet2013 tend to have a large portion of background content and therefore we try todiscard such information that could otherwise mislead the representation learning process.The percentage of cropped columns and rows differs among sensors because they captureimages of different sizes with different amounts of background.
For architecture optimization (AO), the decision to use image color information wasmade according to 10-fold validation (see Section 4.4.1), while for filter optimization (FO),color information was considered whenever available for a better approximation with thestandard cf10-11 architecture. Finally, images were resized to 32× 32 or 128× 128 to betaken as input for the cf10-11 and spoofnet architectures, respectively.
4.4.4 Evaluation Protocol
For each benchmark, we learn deep representations from their training images accordingto the methodology described in Section 4.4.1 for architecture optimization (AO) andin Section 4.4.2 for filter optimization (FO). We follow the standard evaluation protocolof all benchmarks and evaluate the methods in terms of detection accuracy (ACC) andhalf total error rate (HTER), as these are the metrics used to assess progress in the setof benchmarks considered herein. Precisely, for a given benchmark and convolutionalnetwork already trained, results are obtained by:
1. Retrieving prediction scores from the testing samples;
2. Calculating a threshold τ above which samples are predicted as attacks;
3. Computing ACC and/or HTER using τ and test predictions.
The way that τ is calculated differs depending on whether the benchmark has a de-velopment set or not (Table 4.1). Both face benchmarks have such a set and, in this

105
case, we simply obtain τ from the predictions of the samples in this set. Iris and finger-print benchmarks have no such a set, therefore τ is calculated depending on whether theconvolutional network was learned with AO or FO.
In case of AO, we calculate τ by joining the predictions obtained from 10-fold validation(see Section 4.4.1) in a single set of positive and negative scores, and τ is computed as thepoint that lead to an equal error rate (EER) on the score distribution under consideration.In case of FO, scores are probabilities and we assume τ = 0.5. ACC and HTER are thentrivially computed with τ on the testing set.
It is worth noting that the Warsaw iris benchmark provides a supplementary testingset that here we merge with the original testing set in order to replicate the protocolof [224]. Moreover, given face benchmarks are video-based and that in our methodologywe treat them as images (Section 4.4.3), we perform a score-level fusion of the samplesfrom the same video according to the max rule [217]. This fusion is done before calculatingτ .
4.4.5 Implementation
Our implementation for architecture optimization (AO) is based on Hyperopt-convnet [17]which in turn is based on Theano [19]. LibSVM [37] is used for learning the linear classifiersvia Scikit-learn.5 The code for feature extraction runs on GPUs due to Theano and theremaining part is multithreaded and runs on CPUs. We extended Hyperopt-convnet inorder to consider the operations and hyperparameters as described in Appendix B andSection 4.4.1 and we will make the source code freely available in [40]. Running times arereported with this software stack and are computed in an Intel i7 @3.5GHz with a TeslaK40 that, on average, takes less than one day to optimize an architecture — i.e., to probe2,000 candidate architectures — for a given benchmark.
As for filter optimization (FO), Cuda-convnet [129] is used. This library has an ex-tremely efficient implementation to train convolutional networks via back-propagationon NVIDIA GPUs. Moreover, it provides us with the cf10-11 convolutional architecturetaken in this work as reference for FO.
4.5 Experiments and Results
In this section, we evaluate the effectiveness of the proposed methods for spoofing detec-tion. We show experiments for the architecture optimization and filter learning approachesalong with their combination for detecting iris, face, and fingerprint spoofing on the ninebenchmarks described in Section 4.3. We also present results for the spoofnet, which in-corporates some domain-knowledge on the problem. We compare all of the results withthe state-of-the-art counterparts. Finally, we discuss the pros and cons of using suchapproaches and their combination along with efforts to understand the type of featureslearned and some effeciency questions when testing the proposed methods.
5http://scikit-learn.org

106
Table4.3:
Overallresultsconsideringrelevant
inform
ationof
thebe
stfoun
darchitectures,
detectionaccuracy
(ACC)an
dHTER
values
accordingto
theevalua
tion
protocol,a
ndstate-of-the
-art
(SOTA
)pe
rforman
ce.
mod
ality
benchm
ark
architecture
optimization(A
O)
ourresults
SOTA
results
time
size
layers
features
objective
ACC
HTER
ACC
HTER
Ref.
(secs.)(pixels)
(#)
(#)
(%)
(%)
(%)
(%)
(%)
iris
Warsaw
52+35
640
210×
15×
64(960
0)98
.21
99.84
0.16
97.50
—[51]
Biosec
80+34
640
32×
5×
256(256
0)97
.56
98.93
1.17
100.00
—[75]
Mob
BIO
fake
18+37
250
25×
7×
256(896
0)98
.94
98.63
1.38
99.75
—[229
]
face
Replay-Attack
69+15
256
23×
3×
256(230
4)94
.65
98.75
0.75
—5.11
[124
]3D
MAD
55+15
128
25×
5×
64(160
0)98
.68
100.00
0.00
—0.95
[65]
fingerprint
Biometrika
66+25
256
22×
2×
256(102
4)90
.11
96.50
3.50
98.30
—[83]
Crossmatch
112+
1267
53
2×
3×
256(153
6)91
.70
92.09
8.44
68.80
—[83]
Italda
ta46
+27
432
316×
13×
128(266
24)
86.89
97.45
2.55
99.40
—[83]
Swipe
97+51
962
253×
3×
32(508
8)90
.32
88.94
11.47
96.47
—[83]
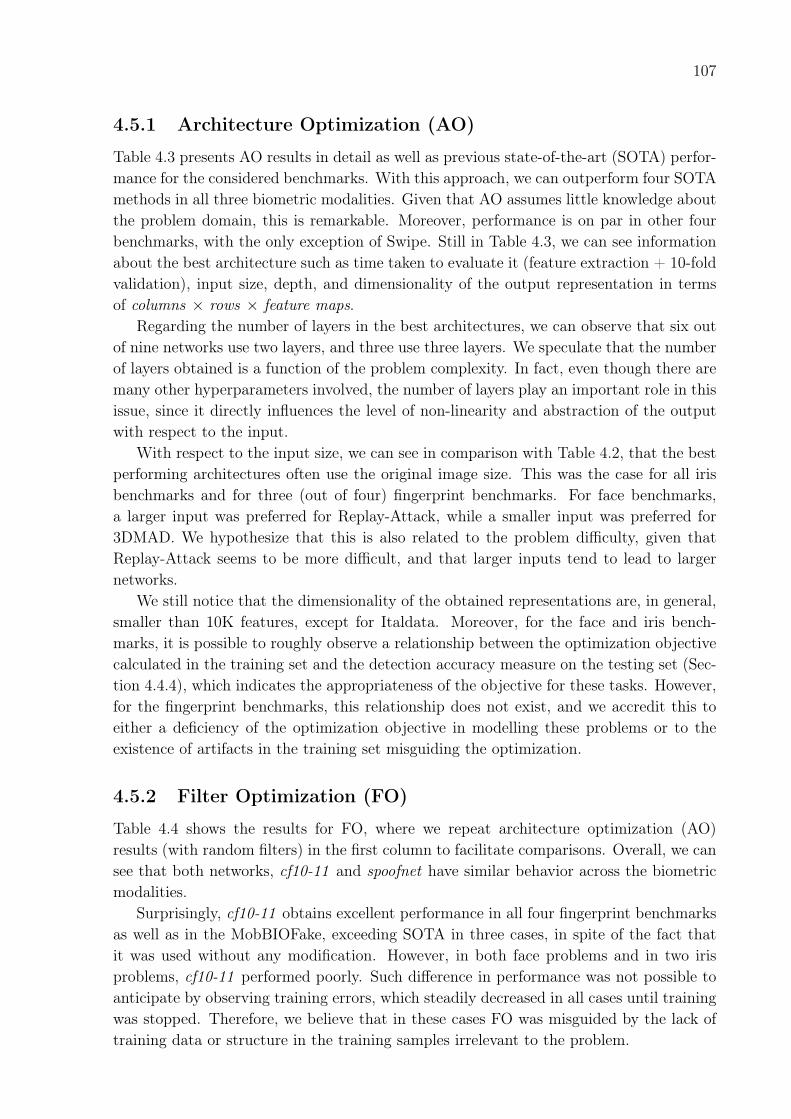
107
4.5.1 Architecture Optimization (AO)
Table 4.3 presents AO results in detail as well as previous state-of-the-art (SOTA) perfor-mance for the considered benchmarks. With this approach, we can outperform four SOTAmethods in all three biometric modalities. Given that AO assumes little knowledge aboutthe problem domain, this is remarkable. Moreover, performance is on par in other fourbenchmarks, with the only exception of Swipe. Still in Table 4.3, we can see informationabout the best architecture such as time taken to evaluate it (feature extraction + 10-foldvalidation), input size, depth, and dimensionality of the output representation in termsof columns × rows × feature maps.
Regarding the number of layers in the best architectures, we can observe that six outof nine networks use two layers, and three use three layers. We speculate that the numberof layers obtained is a function of the problem complexity. In fact, even though there aremany other hyperparameters involved, the number of layers play an important role in thisissue, since it directly influences the level of non-linearity and abstraction of the outputwith respect to the input.
With respect to the input size, we can see in comparison with Table 4.2, that the bestperforming architectures often use the original image size. This was the case for all irisbenchmarks and for three (out of four) fingerprint benchmarks. For face benchmarks,a larger input was preferred for Replay-Attack, while a smaller input was preferred for3DMAD. We hypothesize that this is also related to the problem difficulty, given thatReplay-Attack seems to be more difficult, and that larger inputs tend to lead to largernetworks.
We still notice that the dimensionality of the obtained representations are, in general,smaller than 10K features, except for Italdata. Moreover, for the face and iris bench-marks, it is possible to roughly observe a relationship between the optimization objectivecalculated in the training set and the detection accuracy measure on the testing set (Sec-tion 4.4.4), which indicates the appropriateness of the objective for these tasks. However,for the fingerprint benchmarks, this relationship does not exist, and we accredit this toeither a deficiency of the optimization objective in modelling these problems or to theexistence of artifacts in the training set misguiding the optimization.
4.5.2 Filter Optimization (FO)
Table 4.4 shows the results for FO, where we repeat architecture optimization (AO)results (with random filters) in the first column to facilitate comparisons. Overall, we cansee that both networks, cf10-11 and spoofnet have similar behavior across the biometricmodalities.
Surprisingly, cf10-11 obtains excellent performance in all four fingerprint benchmarksas well as in the MobBIOFake, exceeding SOTA in three cases, in spite of the fact thatit was used without any modification. However, in both face problems and in two irisproblems, cf10-11 performed poorly. Such difference in performance was not possible toanticipate by observing training errors, which steadily decreased in all cases until trainingwas stopped. Therefore, we believe that in these cases FO was misguided by the lack oftraining data or structure in the training samples irrelevant to the problem.

108
Table 4.4: Results for filter optimization (FO) in cf10-11 and spoofnet (Fig. 4.3). Eventhough both networks present similar behavior, spoofnet is able to push performance evenfurther in problems which cf10-11 was already good for. Architecture optimization (AO)results (with random filters) are shown in the first column to facilitate comparisons.
filtermodality random optimized(metric) benchmark AO cf10-11 spoofnet SOTA
iris Warsaw 99.84 67.20 66.42 97.50(ACC) Biosec 98.93 59.08 47.67 100.00
MobBIOfake 98.63 99.13 100.00 99.75face Replay-Attack 0.75 55.13 55.38 5.11
(HTER) 3DMAD 0.00 40.00 24.00 0.95fingerprint Biometrika 96.50 98.50 99.85 98.30(ACC) Crossmatch 92.09 97.33 98.23 68.80
Italdata 97.45 97.35 99.95 99.40Swipe 88.94 98.70 99.08 96.47
To reinforce this claim, we performed experiments with filter optimization (FO) inspoofnet by varying the training set size with 20%, 40%, and 50% of fingerprint bench-marks. As expected, in all cases, the less training examples, the worse is the generalizationof the spoofnet (lower classification accuracies). Considering the training phase, for in-stance, when using 50% of training set or less, the accuracy achieved by the learnedrepresentation is far worse than the one achieved when using 100% of training data. Thisfact reinforces the conclusion presented herein regarding the small sample size problem.Maybe a fine-tuning of some parameters, such as the number of training epochs and thelearning rates, can diminish the impact of the small sample size problem stated here,however, this is an open research topic by itself.
For spoofnet, the outcome is similar. As we expected, the proposed architecture wasable to push performance even further in problems which cf10-11 was already good for,outperforming SOTA in five out of nine benchmarks. This is possibly because we madethe spoofnet architecture simpler, with less parameters, and taking input images with asize better suited to the problem.
As compared to the results in AO, we can observe a good balance between the ap-proaches. In AO, the resulting convolutional networks are remarkable in the face bench-marks. In FO, networks are remarkable in fingerprint problems. While in AO all optimizedarchitectures have good performance in iris problems, FO excelled in one of these prob-lems, MobBIOFake, with a classification accuracy of 100%. In general, AO seems to resultin convolutional networks that are more stable across the benchmarks, while FO shinesin problems in which learning effectively occurs. Considering both AO and FO, we cansee in Table 4.4 that we outperformed SOTA methods in eight out of nine benchmarks.The only benchmark were SOTA performance was not achieved is Biosec, but even in thiscase the result obtained with AO is competitive.
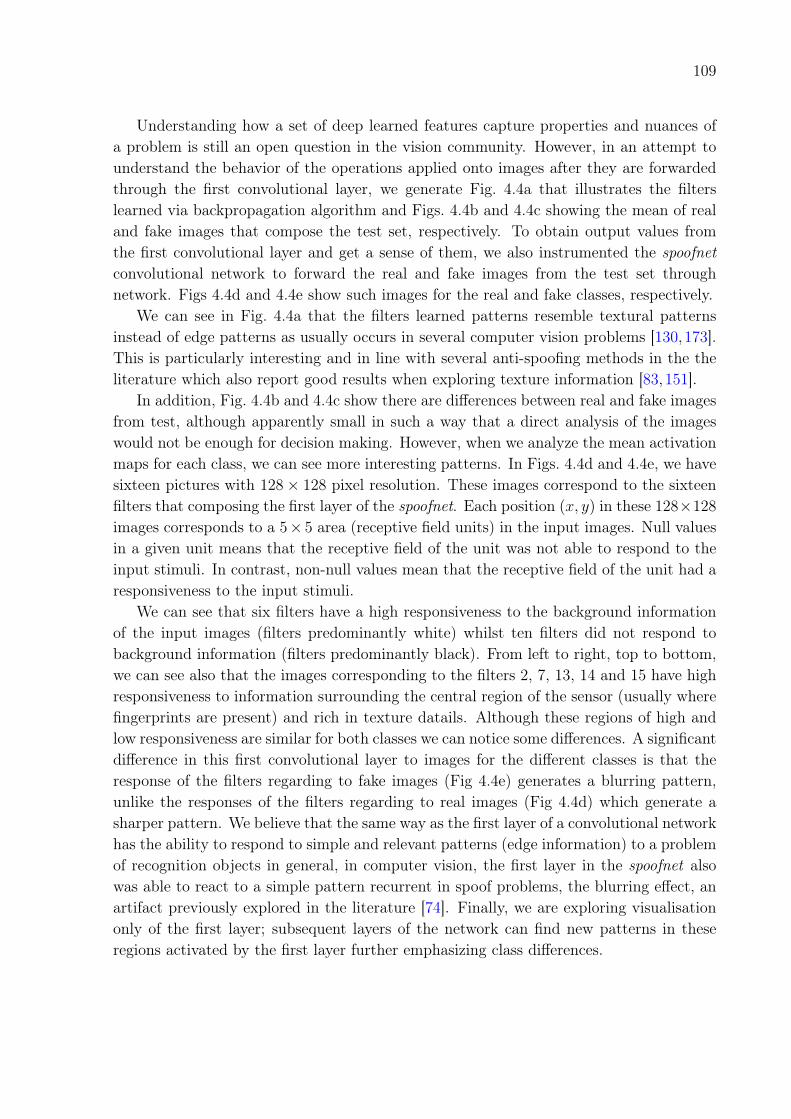
109
Understanding how a set of deep learned features capture properties and nuances ofa problem is still an open question in the vision community. However, in an attempt tounderstand the behavior of the operations applied onto images after they are forwardedthrough the first convolutional layer, we generate Fig. 4.4a that illustrates the filterslearned via backpropagation algorithm and Figs. 4.4b and 4.4c showing the mean of realand fake images that compose the test set, respectively. To obtain output values fromthe first convolutional layer and get a sense of them, we also instrumented the spoofnetconvolutional network to forward the real and fake images from the test set throughnetwork. Figs 4.4d and 4.4e show such images for the real and fake classes, respectively.
We can see in Fig. 4.4a that the filters learned patterns resemble textural patternsinstead of edge patterns as usually occurs in several computer vision problems [130,173].This is particularly interesting and in line with several anti-spoofing methods in the theliterature which also report good results when exploring texture information [83,151].
In addition, Fig. 4.4b and 4.4c show there are differences between real and fake imagesfrom test, although apparently small in such a way that a direct analysis of the imageswould not be enough for decision making. However, when we analyze the mean activationmaps for each class, we can see more interesting patterns. In Figs. 4.4d and 4.4e, we havesixteen pictures with 128× 128 pixel resolution. These images correspond to the sixteenfilters that composing the first layer of the spoofnet. Each position (x, y) in these 128×128
images corresponds to a 5× 5 area (receptive field units) in the input images. Null valuesin a given unit means that the receptive field of the unit was not able to respond to theinput stimuli. In contrast, non-null values mean that the receptive field of the unit had aresponsiveness to the input stimuli.
We can see that six filters have a high responsiveness to the background informationof the input images (filters predominantly white) whilst ten filters did not respond tobackground information (filters predominantly black). From left to right, top to bottom,we can see also that the images corresponding to the filters 2, 7, 13, 14 and 15 have highresponsiveness to information surrounding the central region of the sensor (usually wherefingerprints are present) and rich in texture datails. Although these regions of high andlow responsiveness are similar for both classes we can notice some differences. A significantdifference in this first convolutional layer to images for the different classes is that theresponse of the filters regarding to fake images (Fig 4.4e) generates a blurring pattern,unlike the responses of the filters regarding to real images (Fig 4.4d) which generate asharper pattern. We believe that the same way as the first layer of a convolutional networkhas the ability to respond to simple and relevant patterns (edge information) to a problemof recognition objects in general, in computer vision, the first layer in the spoofnet alsowas able to react to a simple pattern recurrent in spoof problems, the blurring effect, anartifact previously explored in the literature [74]. Finally, we are exploring visualisationonly of the first layer; subsequent layers of the network can find new patterns in theseregions activated by the first layer further emphasizing class differences.

110
(a) Filter weights of the first convolutional layer that were learned usingthe backpropagation algorithm.
(b) Mean for real images(test set).
(c) Mean for fake images(test set).
(d) Activation maps for real images. (e) Activation maps for fake images.
Figure 4.4: Activation maps of the filters that compose the first convolutional layer whenforwarding real and fake images through the network.
4.5.3 Interplay between AO and FO
In the previous experiments, architecture optimization (AO) was evaluated using randomfilters and filter optimization (FO) was carried out in the predefined architectures cf10-11and spoofnet. A natural question that emerges in this context is how these methods wouldperform if we (i) combine AO and FO and if we (ii) consider random filters in cf10-11and spoofnet.
Results from these combinations are available in Table 4.5 and show a clear pattern.When combined with AO, FO again exceeds previous SOTA in all fingerprint benchmarksand performs remarkably good in MobBIOFake. However, the same difficulty found byFO in previous experiments for both face and two iris benchmarks is also observed here.Even though spoofnet performs slightly better than AO in the cases where SOTA isexceeded (Table 4.4), it is important to remark that our AO approach may result inarchitectures with a much larger number of filter weights to be optimized, and this may

111
Table 4.5: Results for architecture and filter optimization (AO+FO) along with cf10-11and spoofnet networks considering random weights. AO+FO show compelling results forfingerprints and one iris benchmark (MobBIOFake). We can also see that spoofnet canbenefit from random filters in situations it was not good for when using filter learning(e.g., Replay-Attack).
filtermodality optimized random(metric) benchmark AO cf10-11 spoofnet SOTA
iris Warsaw 59.55 87.06 96.44 97.50(ACC) Biosec 57.50 97.33 97.42 100.00
MobBIOfake 99.38 77.00 72.00 99.75face Replay-Attack 55.88 5.62 3.50 5.11
(HTER) 3DMAD 40.00 8.00 4.00 0.95fingerprint Biometrika 99.30 77.45 94.70 98.30(ACC) Crossmatch 98.04 83.11 87.82 68.80
Italdata 99.45 76.45 91.05 99.40Swipe 99.08 87.60 96.75 96.47
have benefited spoofnet.It is also interesting to observe in Table 4.5 the results obtained with the use of random
filters in cf10-11 and spoofnet. The overall balance in performance of both networks acrossthe benchmarks is improved, similar to what we have observed with the use of randomfilters in Table 4.3. An striking observation is that spoofnet with random filters exceedprevious SOTA in Replay-Attack, and this supports the idea that the poor performanceof spoofnet in Replay-Attack observed in the FO experiments (Table 4.4) was not a matterof architecture.
4.5.4 Runtime
We estimate time requirements for anti-spoofing systems built with convolutional net-works based on measurements obtained in architecture optimization (AO). We can seein Table 4.3 that the most computationally intensive deep representation is the one foundfor the Swipe benchmark, and demands 148 (97+51) seconds to process 2,200 images.Such a running time is only possible due to the GPU+CPU implementation used (Sec-tion 4.4.5), which is critical for this type of learning task. In a hypothetical operationalscenario, we could ignore the time required for classifier training (51 seconds, in this case).Therefore, we can estimate that, on average, a single image captured by a Swipe sensorwould require approximately 45 milliseconds — plus a little overhead — to be fully pro-cessed in this hypothetical system. Moreover, the existence of much larger convolutionalnetworks running in realtime in budgeted mobile devices [258] also supports the idea thatthe approach is readily applicable in a number of possible scenarios.
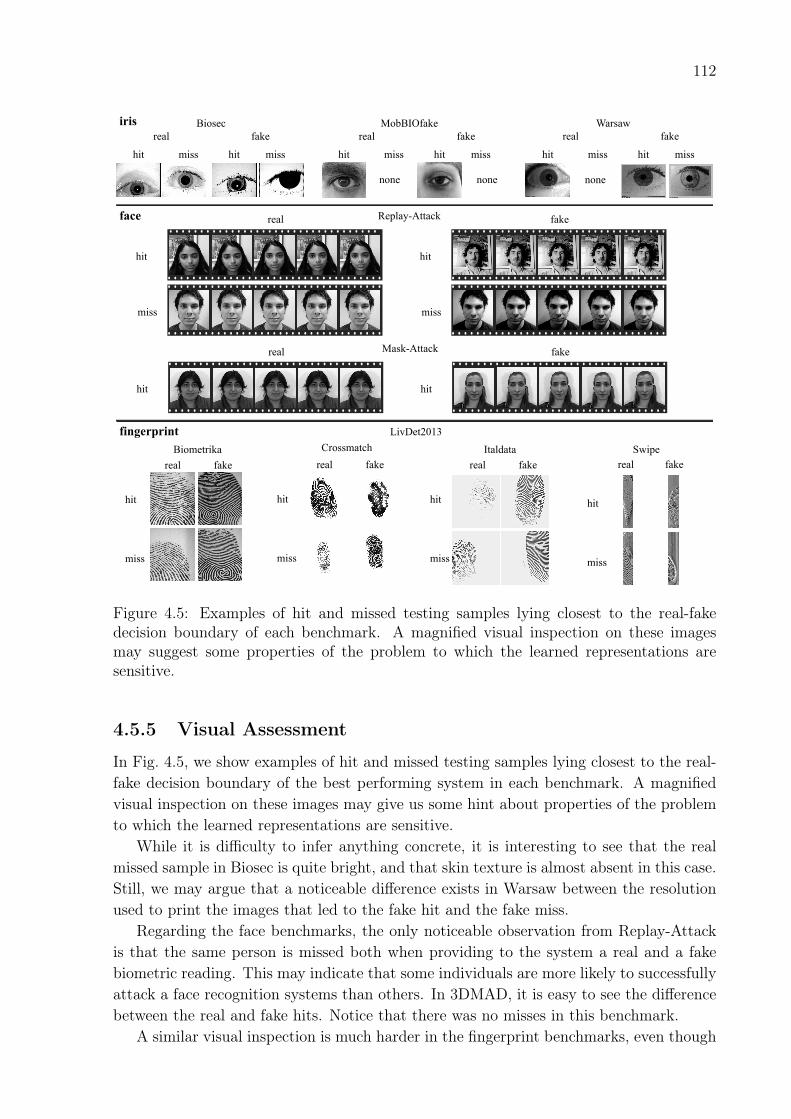
112
iris Biosecreal
hit misshitmiss
fakeMobBIOfake
real
hit misshitmiss
fakeWarsaw
real
hit misshitmiss
fake
none
LivDet2013
Biometrikareal
hit
miss
fakeCrossmatch
real
hit
miss
fakeItaldata
real
hit
miss
fakeSwipe
real
hit
miss
fake
face real
hit
miss
Replay-Attack fake
hit
miss
fingerprint
real
hit
Mask-Attack fake
hit
none none
Figure 4.5: Examples of hit and missed testing samples lying closest to the real-fakedecision boundary of each benchmark. A magnified visual inspection on these imagesmay suggest some properties of the problem to which the learned representations aresensitive.
4.5.5 Visual Assessment
In Fig. 4.5, we show examples of hit and missed testing samples lying closest to the real-fake decision boundary of the best performing system in each benchmark. A magnifiedvisual inspection on these images may give us some hint about properties of the problemto which the learned representations are sensitive.
While it is difficulty to infer anything concrete, it is interesting to see that the realmissed sample in Biosec is quite bright, and that skin texture is almost absent in this case.Still, we may argue that a noticeable difference exists in Warsaw between the resolutionused to print the images that led to the fake hit and the fake miss.
Regarding the face benchmarks, the only noticeable observation from Replay-Attackis that the same person is missed both when providing to the system a real and a fakebiometric reading. This may indicate that some individuals are more likely to successfullyattack a face recognition systems than others. In 3DMAD, it is easy to see the differencebetween the real and fake hits. Notice that there was no misses in this benchmark.
A similar visual inspection is much harder in the fingerprint benchmarks, even though
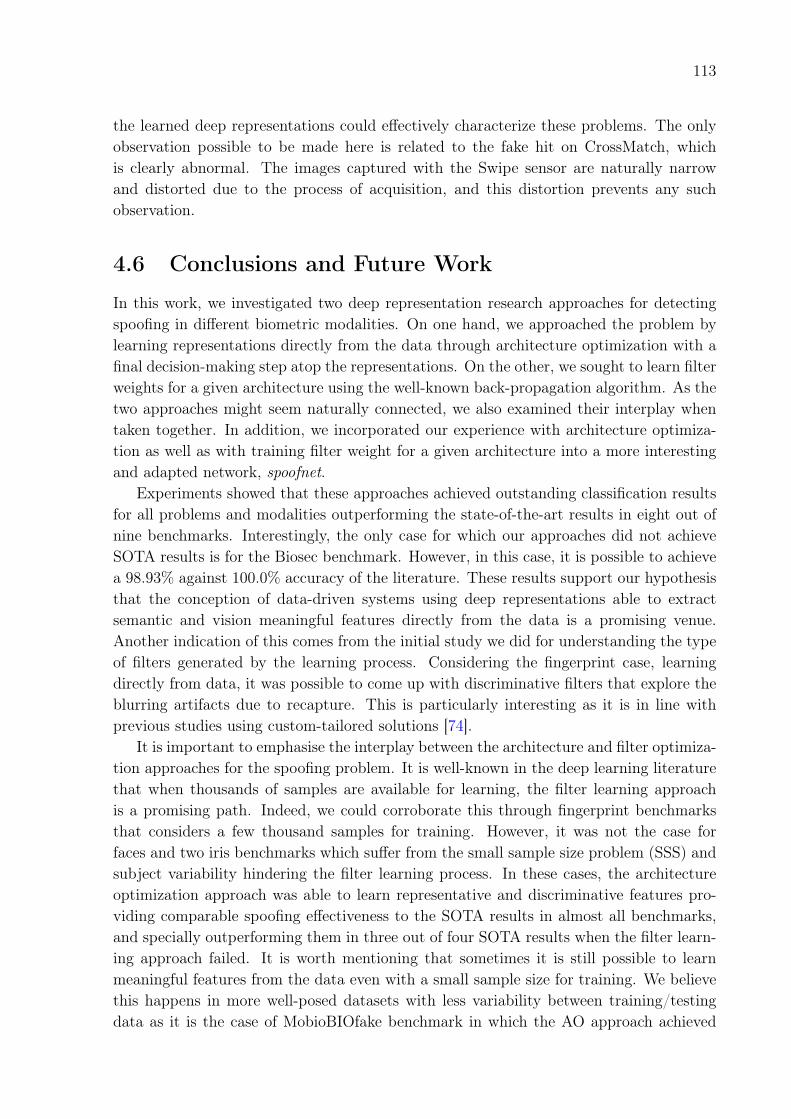
113
the learned deep representations could effectively characterize these problems. The onlyobservation possible to be made here is related to the fake hit on CrossMatch, whichis clearly abnormal. The images captured with the Swipe sensor are naturally narrowand distorted due to the process of acquisition, and this distortion prevents any suchobservation.
4.6 Conclusions and Future Work
In this work, we investigated two deep representation research approaches for detectingspoofing in different biometric modalities. On one hand, we approached the problem bylearning representations directly from the data through architecture optimization with afinal decision-making step atop the representations. On the other, we sought to learn filterweights for a given architecture using the well-known back-propagation algorithm. As thetwo approaches might seem naturally connected, we also examined their interplay whentaken together. In addition, we incorporated our experience with architecture optimiza-tion as well as with training filter weight for a given architecture into a more interestingand adapted network, spoofnet.
Experiments showed that these approaches achieved outstanding classification resultsfor all problems and modalities outperforming the state-of-the-art results in eight out ofnine benchmarks. Interestingly, the only case for which our approaches did not achieveSOTA results is for the Biosec benchmark. However, in this case, it is possible to achievea 98.93% against 100.0% accuracy of the literature. These results support our hypothesisthat the conception of data-driven systems using deep representations able to extractsemantic and vision meaningful features directly from the data is a promising venue.Another indication of this comes from the initial study we did for understanding the typeof filters generated by the learning process. Considering the fingerprint case, learningdirectly from data, it was possible to come up with discriminative filters that explore theblurring artifacts due to recapture. This is particularly interesting as it is in line withprevious studies using custom-tailored solutions [74].
It is important to emphasise the interplay between the architecture and filter optimiza-tion approaches for the spoofing problem. It is well-known in the deep learning literaturethat when thousands of samples are available for learning, the filter learning approachis a promising path. Indeed, we could corroborate this through fingerprint benchmarksthat considers a few thousand samples for training. However, it was not the case forfaces and two iris benchmarks which suffer from the small sample size problem (SSS) andsubject variability hindering the filter learning process. In these cases, the architectureoptimization approach was able to learn representative and discriminative features pro-viding comparable spoofing effectiveness to the SOTA results in almost all benchmarks,and specially outperforming them in three out of four SOTA results when the filter learn-ing approach failed. It is worth mentioning that sometimes it is still possible to learnmeaningful features from the data even with a small sample size for training. We believethis happens in more well-posed datasets with less variability between training/testingdata as it is the case of MobioBIOfake benchmark in which the AO approach achieved

114
99.38% just 0.37% behind the SOTA result.As the data tell it all, the decision to which path to follow can also come from the
data. Using the evaluation/validation set during training, the researcher/developer canopt for optimizing architectures, learn filters or both. If training time is an issue anda solution must be presented overnight, it might be interesting to consider an alreadylearned network that incorporates some additional knowledge in its design. In this sense,spoofnet could be a good choice. In all cases, if the developer can incorporate moretraining examples, the approaches might benefit from such augmented training data.
The proposed approaches can also be adapted to other biometric modalities not di-rectly dealt with herein. The most important difference would be in the input type ofdata since all discussed solutions directly learn their representations from the data.
For the case of iris spoofing detection, here we dealt only with iris spoofing printedattacks and some experimental datasets using cosmetic contact lenses have recently be-come available allowing researchers to study this specific type of spoofing [32, 264]. Forfuture work, we intend to evaluate such datasets using the proposed approaches here andalso consider other biometric modalities such as palm, vein, and gait.
Finally, it is important to take all the results discussed herein with a grain of salt.We are not presenting the final word in spoofing detection. In fact, there are importantadditional research that could finally take this research another step forward. We envisionthe application of deep learning representations on top of pre-processed image featuremaps (e.g., LBP-like feature maps, acquisition-based maps exploring noise signatures,visual rhythm representations, etc.). With an n-layer feature representation, we might beable to explore features otherwise not possible using the raw data. In addition, exploringtemporal coherence and fusion would be also important for video-based attacks.
Acknowledgment
We thank UFOP, Brazilian National Research Counsil – CNPq (Grants #303673/2010-9,#304352/2012-8, #307113/2012-4, #477662/2013-7, #487529/2013-8, #479070/2013-0,and #477457/2013-4), the CAPES DeepEyes project, São Paulo Research Foundation –FAPESP, (Grants #2010/05647-4, #2011/22749-8, #2013/04172-0, and #2013/11359-0),and Minas Gerais Research Foundation – FAPEMIG (Grant APQ-01806-13). D. Menottithanks FAPESP for a grant to acquiring two NVIDIA GeForce GTX Titan Black with6GB each. We also thank NVIDIA for donating five GPUs used in the experiments,a Tesla K40 with 12GB to A. X. Falcão, two GeForce GTX 680 with 2GB each to G.Chiachia, and two GeForce GTX Titan Black with 6GB each to D. Menotti.

115
Chapter 5
Counteracting Presentation Attacks inFace, Fingerprint, and Iris Recognition
“A friend is one that knows you as you are, understands where you have been,accepts what you have become, and still, gently allows you to grow.”
—William Shakespeare, (1564–1616)
“A sweet friendship refreshes the soul.”—Bible, Proverbs 27:9
Abstract
This chapter explores data-driven approaches to presentation attack detection for threebiometric modalities: face, iris and fingerprint. The primary aim of this chapter is to showhow pre-trained deep neural networks can be used to build classifiers that can distinguishbetween authentic images of faces, irises and fingerprints and their static imitations.The most important, publicly available benchmarks representing various attack typeswere used in a unified presentation attack detection framework in both same-datasetand cross-dataset experiments. The pre-trained VGG neural networks, being the coreof this solution, tuned independently for each modality and each dataset present almostperfect accuracy for all three biometric techniques. In turn, low classification accuraciesachieved in cross-dataset evaluations show that models based on deep neural networks aresensitive not only to features specific to biometric imitations, but also to dataset-specificproperties of samples. Thus, such models can provide a rapid solution in scenarios inwhich properties of imitations can be predicted but appropriate feature engineering isdifficult. However, these models will perform worse if the properties of imitations beingdetected are unknown. This chapter includes also a current literature review summarizingup-to-date data-driven solutions to face, iris and finger liveness detection.
See permission to use the copyrighted material in Appendix C.

116
5.1 Introduction
B IOMETRIC authentication is a technology designed to recognize humans automati-cally based on their behavior, physical and chemical traits. Recently, this technology
emerged as an important mechanism for access control in many modern applications, inwhich the traditional methods including the ones based on knowledge (e.g., keywords) orbased on tokens (e.g., smart cards) might be ineffective since they are easily shared, lost,stolen or manipulated [109]. Biometric technologies are increasingly used as the mainauthenticating factor for access control and also jointly with traditional authenticationmechanisms, as a “step-up authentication” factor in two- or three-factor authenticationsystems.
In this context, face, iris and fingerprint are the most commonly-used biometric traits.In fact, the choice of the trait to be used takes into account some issues such as uni-versality, easiness to measure the biometric characteristics, performance, or difficulty tocircumvent the system [109]. However, a common disadvantage of these traits is that animpostor might produce a synthetic replica that can be presented to the biometric sensorto circumvent the authentication process. In the literature, the mechanisms to protect thebiometric system against this type of attack are referred to as spoofing detection, livenessdetection or presentation attack detection (PAD). Hereinafter, we will use the most genericterm, presentation attack detection (PAD), which was initially proposed by SC37 expertsin ISO/IEC 30107 – Presentation Attack Detection – Framework (Part 1), Data Formats(Part 2), and Testing and Reporting (Part 3).
The idea of spoofing biometric recognition is surprisingly older than biometrics itself.A careful reader of the Old Testament can find an impersonation attempt described inthe Book of Genesis, based on presentation of a goat’s fur put on Jacob’s hand to imitateproperties of Esau’s skin, so that Jacob would be blessed by Isaac. A fictitious examplethat is surprisingly realistic is the description of how to copy someone’s fingerprint usinga wax mold and gelatin presented by Austin Freeman in his crime novel “The Red ThumbMark”. The novel appeared in 1907, and the technique described is still used almost100 years later to spoof fingerprint sensors. Note that this description appeared onlyfour years after fingerprints were adopted by Scotland Yard, and long before the firstfingerprint sensor appeared on the market.
Recent scientific studies and open challenges such as LivDet (www.livdet.org) sug-gest that presentation attacks are still an open problem in biometrics. Phan and Boulke-nafet [27,187] suggest that face recognition systems are vulnerable to presentation attackswith an equal error rate (related to distinguishing presentation attacks from genuine sam-ples) reaching as high as 9%. Fingerprint-based recognition systems still face the sameproblem, with an average classification error rate achieving 2.9% [166]. Iris-based authen-tication, considered by many to be one of the most reliable biometrics, awaits efficientPAD methodology. Recent proposals in this area still report an average classification errorrate around 1% [199].
Besides the laboratory testing of the biometric system’s vulnerability to attack, a fewreal cases also confirm the problem. In the small city of Ferraz de Vasconcelos, in theoutskirts of São Paulo, Brazil, a physician of the service of mobile health care and urgency

117
Source Problem Target ProblemInitial Network
Face Identification
Image Classification
Face PAD
Iris PAD
Fingerprint PAD
Fine-TuningDomain Adaptation Final Classification
Figure 5.1: General pipeline exploited in this work. Initial network architectures, orig-inally proposed for other problems, are independently fine-tuned with appropriate PADexamples from different datasets leading to discriminative features. Ultimately, classifiersare trained to separate between authentic images of faces, irises and fingerprints fromtheir presentation attack versions.
was caught red-handed by the police in a scam that used silicone fingers to bypass anauthentication system and confirm the presence several colleagues at work [147]. A similarcase has been investigated by the Brazilian Federal Police in 2014, when workers at theParanaguá Harbor in the Brazilian southern state of Paraná, were suspected of usingsilicone fingers to circumvent a time attendance biometric system [35]. In Germany, thebiometric hacking team in the Chaos Computer Club managed to hack Apple’s iPhoneTouch ID [10] a few days after its launch, demonstrating that a biometric system withoutan adequate protection is unsuitable as a reliable access control method. Other cases ofspoofing surveillance systems with 3-D masks to change their apparent age or race canalso be found in [210,211].
Considering the three aforementioned modalities, when we look at the literature andanalyze the algorithms to prevent presentation attacks, we observe that the most promis-ing in terms of errors and minimum effort of implementation or cost often share an in-teresting feature: they belong to a group of algorithms referred to as data-driven char-acterization algorithms. According to Pinto et al. [189], methods based on data-drivencharacterization exploit only the data that comes from a standard biometric sensor look-ing for evidence of artifacts in the already acquired biometric sample. Such approachesare preferable in practice because they are easily integrable with the existing recognitionsystems, as there is no extra requirement in terms of hardware nor is there the need ofhuman interaction to detect attempted attacks.
Although the existing methods following this idea have led to good detection rates,we note that some aspects still need to be taken into account when evaluating a PADapproach, e.g., different types of attack, variety of devices to perform attempted attacks,and attacks directed to different sensors. Another aspect that is normally overlooked is

118
that most detection methods are custom-tailored to specific types of presentation attacks,in what we refer to as hand-crafting of the features. With the emergence of deep learningmethods and their success in tasks such as image classification, voice recognition andlanguage translation, in this chapter, we set forth the objective of exploiting deep learningsolutions for detecting presentation attacks, using data-driven solutions. In these cases,the biometric designer is responsible for choosing an appropriate architecture for PADand training solely from the existing data available. We believe that this type of solutionis the next step when designing robust presentation attack detectors and also that theycan, if carefully designed, better deal with the challenging cross-dataset scenario. Thecross-dataset scenario arises when the system is trained with a dataset from one sensor orone scenario, and then later tested on data from a different sensor or scenario. Figure 5.1depicts the general pipeline we exploit in this chapter. We start with pre-trained deepneural networks and tune them independently for each modality (face, iris and fingerprint)with different datasets before building the final classifiers to distinguish between authenticimages of faces, irises and fingerprints from their static counterparts.
We organize the rest of this Chapter as follows. Section 5.2 discusses state-of-the-artmethods for PAD considering the three modalities considered in this chapter (face, iris andfingerprint). Section 5.3 details the data-driven PAD solution that we advocate as verypromising for this problem, while Section 5.5 shows the experiments and validations fordifferent biometric spoofing datasets. We close the chapter with some final considerationsin Section 5.6.
5.2 Related Work
In this section, we review some of the most important presentation-attack detection meth-ods published in the literature for iris, face and fingerprint.
5.2.1 Face Presentation Attack Detection
The existing face anti-spoofing techniques can be categorized into four groups [214]: userbehavior modeling [176, 263] (e.g., eye blinking, small face movements), methods thatrequire additional hardware [66] (e.g., infrared cameras and depth sensors), methods basedon user cooperation (e.g., challenge questions) and, finally, data-driven characterizationapproaches, which is the focus of our work herein.
We start this section reviewing frequency-based approaches, which are methods thatrely on analyzing artifacts that are better visible in the frequency domain. Early studiesfollowed this idea [141], and nowadays we have several works that support the effectivenessof this approach in detecting face spoofing. In [141], Li et al. proposed a face spoofingdetection that emerged from the observation that the faces in photographs are smallerthan the real ones and that the expressions and poses of the faces in photographs areinvariant. Based on these observations, the authors devised a threshold-based decisionmethod for detecting photo-based attempted attacks based on the energy rate of thehigh frequency components in the 2-D Fourier spectrum. The major limitation of thetechnique proposed by Li et al. is that the high frequency components are affected by

119
illumination, which makes this frequency band too noisy [141,245]. To reduce that effect,Tan et al. [245] exploited the difference of image variability in the high-middle band. Thisis done using Difference of Gaussian (DoG) bandpass filtering, which keeps as much detailas possible without introducing noisy or aliasing artifacts.
In [193], Pinto et al. introduced an idea seeking to overcome the illumination effectwhen working in the frequency domain. In that work, the authors proposed a face anti-spoofing method for detecting video-based attempted attacks based on Fourier analysisof the noise signature extracted from videos, instead of using the image pixel valuesdirectly. Basically, after isolating the noise signal present in the video frames, the authorstransformed that information to the Fourier domain and used the visual rhythm techniqueto capture the most important frequency components to detect an attempted attack,taking advantage of the spectral and temporal information. In a more recent work [190],the same authors expanded upon this technique taking advantage of the spectral, temporaland spatial information from the noise signature, using the concept of visual codebooks.According to the authors, the new method enabled them to detect different types ofattacks such as print- and mask-based attempted attacks as well.
Lee et al. [139] proposed an anti-spoofing technique based on the cardiac pulse mea-surements using video imaging [197]. The authors extended upon previous work proposedby Poh et al. [197] by adding a threshold-based decision level based on the entropy mea-sure. It was calculated from the power spectrum obtained from normalized RGB channelsafter eliminating the cross-channel noise, caused by the environment interference, usingthe Independent Component Analysis (ICA).
Another expressive branch of face anti-spoofing algorithms reported in the literatureconsists of texture-based approaches. In general, those algorithms exploit textural cuesinserted in the fake biometric samples during its production and presentation to the bio-metric sensor under attack (e.g., printing defects, aliasing and blurring effects). Tan etal. [245] proposed a texture-based approach to detect attacks with printed photographsbased on the difference of the surface roughness of an attempted attack and a real face.The authors estimate the luminance and reflectance of the image under analysis and clas-sify them using Sparse Low Rank Bilinear Logistic Regression methods. Their work wasextended upon by Peixoto et al. [181], who incorporated measures for different illumina-tion conditions.
Similar to Tan et al. [245], Kose et al. [128] evaluated a solution based on reflectance todetect attacks performed with printed masks. To decompose the images into componentsof illumination and reflectance, the Variational Retinex [5] algorithm was applied.
Määttä et al. [151, 152] relied on micro textures for face spoofing detection, inspiredby the characterization of printing artifacts and by differences in light reflection whencomparing real samples and presentation attack samples. The authors proposed a fusionscheme based on the Local Binary Pattern (LBP) [168], Gabor wavelets [61], and His-togram of Oriented Gradients (HOG) [56]. Similarly, to find a holistic representation ofthe face able to reveal an attempted attack, Schwartz et al. [214] proposed a method thatemploys different attributes of the images (e.g., color, texture and shape of the face).
Chingovska et al. [41] investigated the use of different variations of the LBP operatorused in [151]. The histograms generated from these descriptors were classified using χ2

120
histogram comparison, Linear Discriminant Analysis (LDA) and Support Vector Machine(SVM).
Face spoofing attacks performed with static masks have also been considered in theliterature. Erdogmus et al. [65] explored a database with six types of attacks using facialinformation of four subjects. To detect attempted attacks, the authors used two algo-rithms based on Gabor wavelet [138] with a Gabor-phase based similarity measure [90].
Pereira et al. [184] proposed a score-level fusion strategy for detecting various types ofattacks. The authors trained classifiers using different databases and used the Q statisticsto evaluate the dependency between classifiers. In a follow-up work, Pereira et al. [69] pro-posed an anti-spoofing solution based on the dynamic texture, which is a spatiotemporalversion of the original LBP.
Garcia et al. [77] proposed an anti-spoofing method based on detection of the Moirépatterns, which appear due to the overlap of the digital grids. To find these patterns, theauthors used a peak-detector algorithm based on maximum-correlation thresholding, inthat strong peaks reveal an attempted attack. Similar to [77], Patel et al. [179] proposed apresentation attack detection technique also based on the Moiré pattern detection, whichuses the the multi-scale version of the LBP descriptor (M-LBP).
Tronci et al. [253] exploited the motion information and clues that are extracted fromthe scene by combining two types of processes, referred to as static and video-basedanalysis. The static analysis consists of combining different visual features such as color,edge, and Gabor textures, whereas the video-based analysis combines simple motion-related measures such as eye blink, mouth movement, and facial expression change.
Anjos et al. [8] proposed a method for detecting photo-based attacks assuming a sta-tionary facial recognition system. According to the authors, the intensity of the relativemotion between the face region and the background can be used as a clue to distin-guish valid access of attempted attacks, since the motion variations between face andbackground regions exhibit greater correlation in the case of attempted attacks.
Wen et al. [260] proposed a face spoof detection algorithm based on image distortionanalysis (IDA), describing different features such as specular reflection, blurriness, chro-matic moment, and color diversity. These features are concatenated in order to generatefeature vectors, which are used to generate an ensemble classifier, each one specialized todetect a type of attempted attack.
Kim et al. [118] proposed a method based on the diffusion speed of a single image todetect attempted attacks. The authors define the local patterns of the diffusion speed,namely local speed patterns via Total Variation (TV) flow [218], which are used as featurevectors to train a linear classifier, using the SVM, to determine whether the given face isfake. In turn, Boulkenafet et al. [29] proposed an anti-spoofing technique using a colortexture analysis. Basically, the authors perform a micro-texture analysis considering thecolor-texture information from the luminance and the chrominance channels by extractingfeature descriptions from different color spaces.
Different from the previous methods, which focus on defining a presentation attackdetection that does not leverage the identity information present in the gallery, Yang etal. [268] proposed a person-specific face anti-spoofing approach, in which a classifier wasbuilt for each person. According to the authors, this strategy minimizes the interferences

121
among subjects.Virtually all previous methods exploit handcrafted features to analyze possible clues
related to a presentation attack attempt. Whether these features are related to texture,color, gradients, noise or even reflection, blurriness, and chromatic moment, they alwayscome down to the observation of specific artifacts present in the images and how they canbe captured properly. In this regard, LBP stands out as the staple of face-based spoofingresearch thus far. Departing from this hand-crafted characterization modeling strategy, arecent trend in the literature has been devoted to designing and deploying solutions ableto directly learn, from the existing available training data, the intrinsic discriminativefeatures of the classes of interest, the so-called data-driven characterization techniques,probably motivated by the huge success these approaches have been showing in othervision-related problems [131,241]. Out of those, the ones based on deep learning solutionsstand out right away as very promising for being highly adaptive to different situations.
Menotti et al. [162] aimed at hyperparameter optimization of network architectures [16,196] (architecture optimization) and on learning filter weights via the well-known back-propagation algorithm [136] (filter optimization) to design a face spoofing detection ap-proach. The first approach consists of learning suitable convolutional network architec-tures for each domain, whereas the second approach focuses on learning the weights ofthe network via back propagation.
Manjani et al. [154] proposed an anti-spoofing solution based on a deep dictionarylearning technique originally proposed in [246] to detect attempted attacks performed us-ing silicone masks. According to the authors, deep dictionary learning combines conceptsof two most prominent paradigms for representation learning, deep learning and dictio-nary learning, which enabled the authors to achieve a good representation even using asmall data for training.
5.2.2 Fingerprint Presentation Attack Detection
Fingerprint PAD methods can be categorized into two groups: hardware-based andsoftware-based solutions [83]. Methods falling into the first group use information pro-vided from additional sensors to gather artifacts that reveal a spoofing attack that isoutside of the fingerprint image. Software-based techniques rely solely on the informationacquired by the biometric sensor of the fingerprint authentication system.
Based on several quality measures (e.g., ridge strength or directionality, ridge continu-ity), Galbally et al. [71, 72] proposed a set of features aiming at fingerprint presentationattack detection, which were used to feed a Linear Discriminant Analysis (LDA) classifier.
Gragnaniello et al. [86] proposed an anti-spoofing solution based on Weber Local De-scriptor (WLD) operating jointly with other texture descriptors such as Local PhaseQuantization (LPQ) and Local Binary Pattern Descriptor (LBP). The experimental re-sults suggest that WLD and LPQ complement one another, and their joint usage cangreatly improve their discriminating ability, even when compared individually or com-bined with LBP.
Inspired by previous works based on LBP descriptor, Jia et al. [112] proposed a spoof-ing detection scheme based on Multi-scale Block Local Ternary Patterns (MBLTP) [244].

122
According to the authors, the computation of the LTP descriptor is based on averagevalues of block subregions rather than individual pixels, which makes it less sensitive tonoise, since the computation is based on a 3-value code representation and on averagevalues of block subregions, rather than on individual pixels.
Ghiani et al. [81] proposed the use of Binarized Statistical Image Features (BSIF),a textural binary descriptor whose design was inspired by the LBP and LPQ methods.Basically, the BSIF descriptor learns a filter set by using statistics of natural images [104],leading to descriptors better adapted to the problem. The same authors also explored theLPQ descriptor to find a feature space insensitive to blurring effects [82].
In [85], Gottschlich proposed another idea based on filter learning convolution com-parison pattern. To detect a fingerprint spoofing, the authors compute the discrete cosinetransform (DCT) from rotation invariant patches, and compute their binary patterns bycomparing pairs of DCT coefficients. These patterns are gathered in a histogram, whichwas used to feed a linear SVM classifier.
Rattani et al. [206] introduced a scheme for automatic adaptation of a liveness detectorto new spoofing materials in the operational phase. The aim of the proposed approachis to reduce the security risk posed by new spoof materials on an anti-spoofing system.The authors proposed a novel material detector specialized to detect new spoof materials,pointing out the need for retraining the system with the new material spotted.
Similar to [206], Rattani et al. [207] proposed an automatic adaptation anti-spoofingsystem composed of an open-set fingerprint spoofing detector and by a novel materialdetector, both based on Weibull-calibrated SVM (W-SVM) [223]. The novel materialdetector was built with a multi-class W-SVM, composed by an ensemble of pairs of 1-Class and binary SVMs, whereas the open set fingerprint spoofing detector was trainedwith features based on textural [82], physiological [155] and anatomical [243] attributes.
Gragnaniello et al. [88] proposed a fingerprint spoofing detection based on both spa-tial and frequency information, in order to extract local amplitude contrast, and localbehavior of the image, which were synthesized by considering the phase of some selectedtransform coefficients generated by the short-time Fourier transform (STFT). This infor-mation generates a bi-dimensional contrast-phase histogram, which was used to train alinear SVM classifier.
Kumpituck et al. [134] exploited an anti-spoofing schema based on wavelet decompo-sition and LBP operator. In this work, the authors extract LBP histograms from severalwavelet sub-band images, which were concatenated and used to feed an SVM classifier.The authors also evaluated a more conventional approach that consists of calculatingthe energy from wavelet sub-bands instead of the LBP histograms. Experimental resultsshow that wavelet-LBP descriptor achieved a better discrimination than wavelet-energyand LBP descriptors used separately, besides achieving competitive results with the state-of-the-art methods.
Finally, also departing from the traditional modeling, which uses basically texturepatterns to characterize fingerprint images, Nogueira et al. [166] proposed a fingerprintanti-spoofing technique based on the concept of pre-trained convolutional neural net-works. Basically, the authors use well-known CNN architectures in the literature such asAlexNet [131] and VGG [233] as their starting point for learning the network weights for

123
fingerprint spoofing detection.Marasco et al. [156] investigated two well-known CNN architectures, the GoogLeNet [239],
CaffeNet [131], in order to analyze their robustness in detecting unseen spoof materialsand fake samples from new sensors. As mentioned before, Menotti et al. [162] also pro-posed hyperparameter optimization of network architectures along with filter optimizationtechniques for detecting fingerprints presentation attacks.
5.2.3 Iris Presentation Attack Detection
Early work on iris spoofing detection dates back to the 1990’s, when Daugman [59] dis-cussed the feasibility of some attacks on iris recognition systems. In that work, he proposedto detect such attempts using the Fast Fourier Transform to verify the high frequencyspectral magnitude.
According to Czajka [53], solutions for iris liveness detection can be categorized intofour groups, as Cartesian product of two dimensions: type of measurement (passive oractive) and type of model of the object under test (static / dynamic). Passive solutionsmean that the object is not stimulated more than it is needed to acquire an iris imagefor recognition purpose. Hence, it typically means that no extra hardware is requiredto detect an attempted attack. Active solutions try to stimulate an eye and observethe response to that stimuli. It means that typically some extra hardware elements arerequired. In turn, the classification between static and dynamic objects means that thealgorithm can detect an attempted attack using just one (static) image from the biometricsensor or needs to use a sequence of images to observe selected dynamic features. In thissection, we review only passive and static methods, which is the focus of this chapter.
In [174], Pacut et al. introduced three iris liveness detection algorithms based on theanalysis of the image frequency spectrum, controlled light reflection from the cornea andpupil dynamics. These approaches were evaluated with paper printouts produced withdifferent printers and printout carriers, and shown to be able to spoof two commercialiris recognition systems. A small hole was made in the place of the pupil, and thistrick was enough to deceive commercial iris recognition systems used in their study. Theexperimental results obtained on the evaluation set composed of 77 pairs of fake and liveiris images showed that the controlled light reflections and pupil dynamics achieve zero forboth False Acceptance Rate and False Rejection Rate. In turn, two commercial cameraswere not able to detect 73.1% and 15.6% of iris paper printouts and matched them tobiometric references of authentic eyes.
Galbally et al. [75] proposed an approach based on 22 image quality measures (e.g.,focus, occlusion, and pupil dilation). The authors use sequential floating feature selec-tion [198] to single out the best features, which were used to feed a quadratic discriminantclassifier. To validate the proposed approach, the authors used the BioSec [68,219] bench-mark, which contains print-based iris spoofing attacks. Similarly, Sequeira et al. [226] alsoexploited image quality measures [75] and three different classification techniques, vali-dating the work on BioSec [68, 219] and Clarkson [224] benchmarks and introducing theMobBIOfake benchmark comprising 800 iris images. Sequeira et al. [227] extended uponprevious work using a feature selection step to obtain a better representation to detect

124
an attempted attack. The authors also applied iris segmentation [164] to obtain the iriscontour and adapted the feature extraction processes to the resulting non-circular irisregions.
In [259], Wei et al. addressed the problem of iris liveness detection based on threetexture measures: iris edge sharpness (ES), iris-texton feature for characterizing the visualprimitives of iris texture (IT) and using selected features based on co-occurrence matrix(CM). In particular, they used fake iris wearing color and textured contact lenses. Theexperiments showed that the ES feature achieved comparable results to the state of theart methods at that time, and the IT and CM measures outperformed the state of the artalgorithms.
Czajka [51] proposed a solution based on frequency analysis to detect printed irises.The author associated peaks found in the frequency spectrum to regular patterns observedfor printed samples. This method, tuned to achieve close-to-zero false rejection rate (i.e.,not introducing additional false alarms to the entire system), was able to detect 95% ofprinted irises. This paper also introduced the Warsaw LivDet-Iris-2013 dataset containing729 fake images and 1, 274 images of real eyes.
Texture analysis has also been explored for iris spoofing detection. In the MobILive [229]iris spoofing detection competition, the winning team relied upon three texture descrip-tors: LBP [169], LPQ [171] and Binary Gabor Pattern (BGP) [272]. Sun et al. [238]recently proposed a general framework for iris image classification based on a Hierarchi-cal Visual Codebook (HVC). The HVC encodes the texture primitives of iris images andis based on two existing bag-of-words models. The method achieved a state-of-the-artperformance for iris spoofing detection, among other tasks related to iris recognition.
Doyle et al. [64] proposed a solution based on modified Local Binary Patterns(mLBP) [170] descriptor. In this work, the authors show that although it is possibleto obtain good classification results using texture information extracted by the mLBPdescriptor, when lenses produced by different manufacturers are used, the performance ofthis method drops significantly. They report 83% and 96% of correct classification whenmeasured on two separated datasets, and a significant drop in accuracy when the samemethod was trained on the one dataset and tested on the other dataset: 42% and 53%,respectively. This cross-dataset validation has been shown to be very challenging andseems to be recommended in several validation setups for presentation attack detection.Yadav et al. [264] extended upon the previous work by analyzing the effect of soft andtextured contact lenses on iris recognition.
In [200], Raja et al. proposed an anti-spoofing method based on Eulerian Video Mag-nification (EVM) [24], which was applied to enhance the subtle phase information in theeye region. The authors proposed a decision rule based on cumulative phase information,which was applied by using a sliding window approach upon the phase component fordetecting the rate of the change in the phase with respect to time.
Raghavendra et al. [199] proposed a novel spoofing detection scheme based on a multi-scale version of the Binarized Statistical Image Features (BSIF) and linear Support VectorMachine (SVM). Gupta et al. [91] proposed an anti-spoofing technique based on localdescriptors such as LBP [168], HOG [56], and GIST [172], which provide a representationspace by using attributes of the images such as color, texture, position, spatial frequency,

125
and size of objects present in the image. The authors used the feature vectors producedby the three descriptors to feed a nonlinear classifier and decide whether an image underanalysis is fake.
Czajka [52] proposed an iris spoofing detection based on pupil dynamics. In thatwork, the author used the pupil dynamics model proposed by Kohn and Clynes [121] todescribe its reaction after a positive light stimuli. To decide whether the eye is alive,the author used variants of the SVM to classify feature vectors that contain the pupildynamic information of a target user. This work has been further extended to a mixtureof negative and positive light stimuli [53] and presented close-to-perfect recognition ofobjects not reacting to light stimuli as expected for a living eye.
Finally, Lovish et al. [148] proposed a cosmetic contact lens detection method basedon Local Phase Quantization and Binary Gabor Patterns, which combines the benefitsof both LBP and Gabor filters [272]. The histograms produced for both descriptors wereconcatenated and used to build a classification model based on SVM algorithm.
Similarly to the approaches tackling the presentation attack problem in fingerprintand faces, handcrafted texture features seem to be the preferred choice in iris spoofingdetection. Methods inspired by LBP, visual codebooks and quality metrics are the mostpopular methods so far. In this sense, the works of Menotti et al. [162] and Silva etal. [232], which exploit data-driven solutions for this problem, are sufficiently differentfrom the previous methods and present very promising results.
5.2.4 Unified Frameworks to Presentation Attack Detection
Galbally et al. [74] proposed a general approach based on 25 image quality features todetect attempt attacks in face, iris and fingerprint biometric systems simultaneously.Evaluations performed upon popular benchmarks for three modalities show that thisapproach is highly competitive, considering the state-of-the-art methods dedicated forsingle modalities.
In [87], Gragnaniello et al. evaluated several local descriptors for face-, fingerprint-and iris-based biometrics in addition to the investigation of promising descriptors usingthe Bag-of-Visual-Word (BoVW) model [235], Scale-Invariant Feature Transform (SIFT)[149], DAISY [251], and the Shift-Invariant Descriptor (SID) [122].
Menotti et al. [162] (mentioned earlier in this section) showed that the combination ofarchitecture optimization and filter optimization provides better comprehension of howthese approaches interplay for face, iris and fingerprint PAD, and also outperforms thebest known approaches for several benchmarks.
In this chapter, we decided to explore data-driven solutions for spoofing detection indifferent modalities based on deeper architectures than the one used in [162] and evaluatethe effects of such decision. Our objective is to show the potential of this approach butalso highlight its limitations, especially related to cross-dataset experiment.
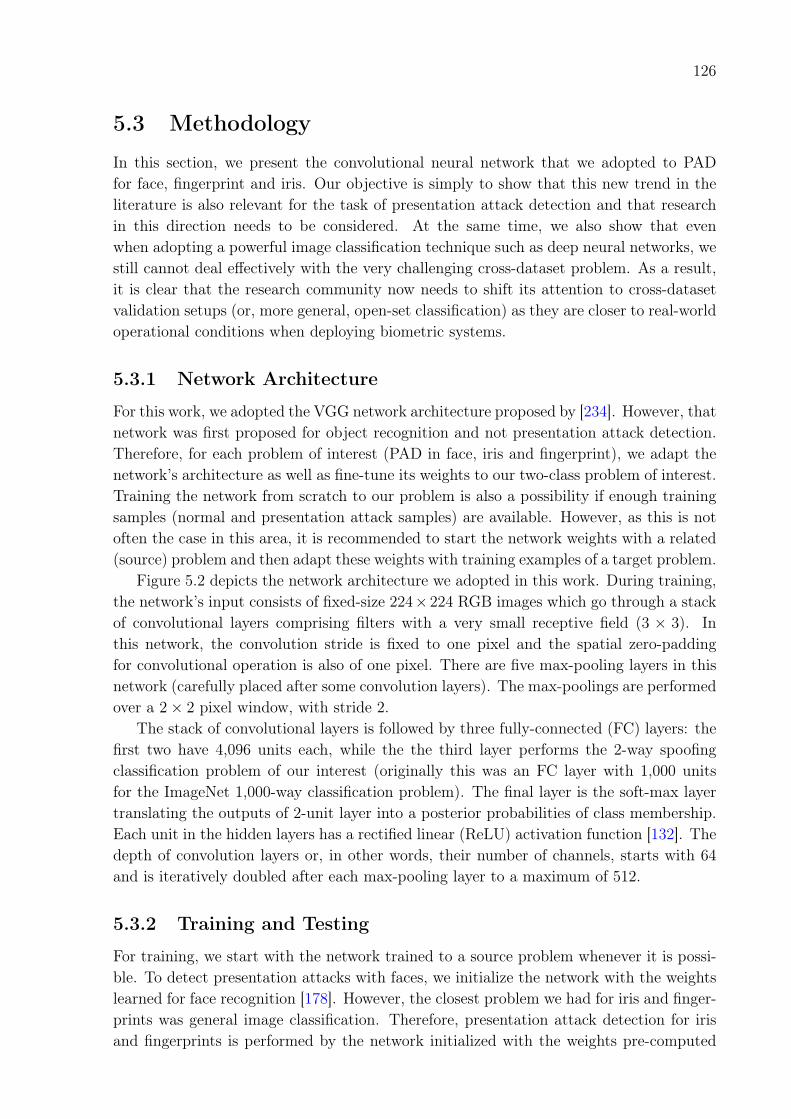
126
5.3 Methodology
In this section, we present the convolutional neural network that we adopted to PADfor face, fingerprint and iris. Our objective is simply to show that this new trend in theliterature is also relevant for the task of presentation attack detection and that researchin this direction needs to be considered. At the same time, we also show that evenwhen adopting a powerful image classification technique such as deep neural networks, westill cannot deal effectively with the very challenging cross-dataset problem. As a result,it is clear that the research community now needs to shift its attention to cross-datasetvalidation setups (or, more general, open-set classification) as they are closer to real-worldoperational conditions when deploying biometric systems.
5.3.1 Network Architecture
For this work, we adopted the VGG network architecture proposed by [234]. However, thatnetwork was first proposed for object recognition and not presentation attack detection.Therefore, for each problem of interest (PAD in face, iris and fingerprint), we adapt thenetwork’s architecture as well as fine-tune its weights to our two-class problem of interest.Training the network from scratch to our problem is also a possibility if enough trainingsamples (normal and presentation attack samples) are available. However, as this is notoften the case in this area, it is recommended to start the network weights with a related(source) problem and then adapt these weights with training examples of a target problem.
Figure 5.2 depicts the network architecture we adopted in this work. During training,the network’s input consists of fixed-size 224×224 RGB images which go through a stackof convolutional layers comprising filters with a very small receptive field (3 × 3). Inthis network, the convolution stride is fixed to one pixel and the spatial zero-paddingfor convolutional operation is also of one pixel. There are five max-pooling layers in thisnetwork (carefully placed after some convolution layers). The max-poolings are performedover a 2× 2 pixel window, with stride 2.
The stack of convolutional layers is followed by three fully-connected (FC) layers: thefirst two have 4,096 units each, while the the third layer performs the 2-way spoofingclassification problem of our interest (originally this was an FC layer with 1,000 unitsfor the ImageNet 1,000-way classification problem). The final layer is the soft-max layertranslating the outputs of 2-unit layer into a posterior probabilities of class membership.Each unit in the hidden layers has a rectified linear (ReLU) activation function [132]. Thedepth of convolution layers or, in other words, their number of channels, starts with 64and is iteratively doubled after each max-pooling layer to a maximum of 512.
5.3.2 Training and Testing
For training, we start with the network trained to a source problem whenever it is possi-ble. To detect presentation attacks with faces, we initialize the network with the weightslearned for face recognition [178]. However, the closest problem we had for iris and finger-prints was general image classification. Therefore, presentation attack detection for irisand fingerprints is performed by the network initialized with the weights pre-computed
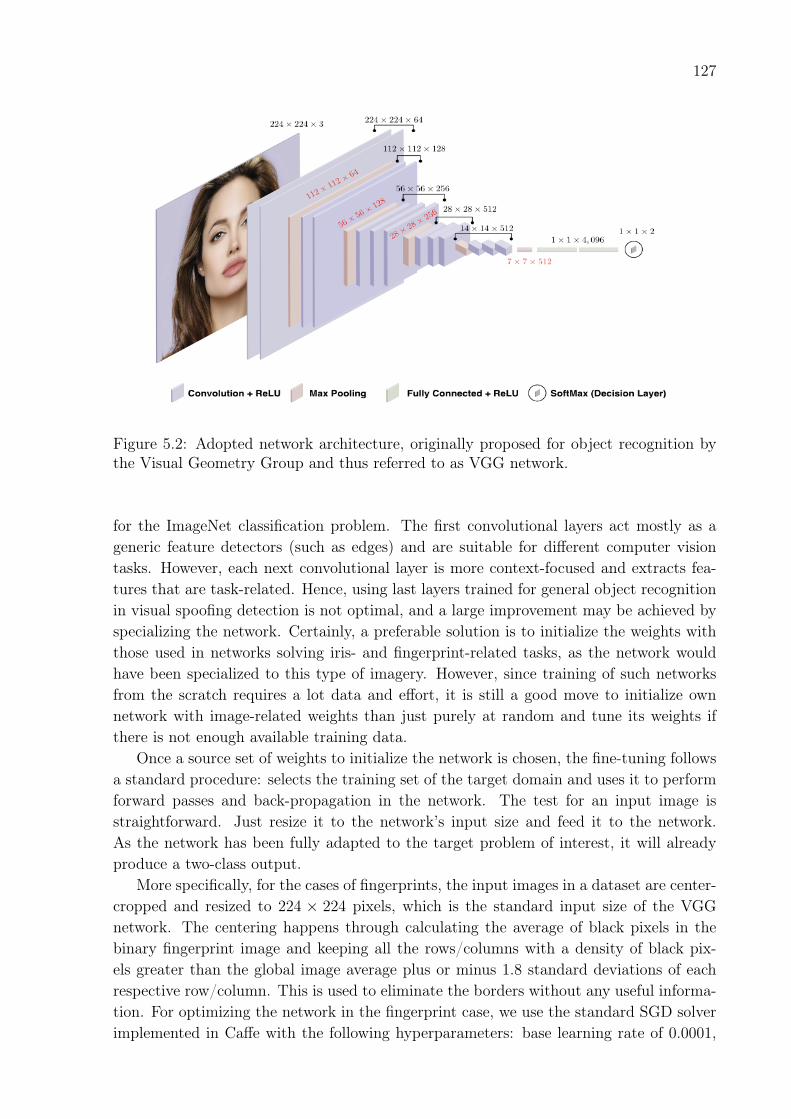
127
Figure 5.2: Adopted network architecture, originally proposed for object recognition bythe Visual Geometry Group and thus referred to as VGG network.
for the ImageNet classification problem. The first convolutional layers act mostly as ageneric feature detectors (such as edges) and are suitable for different computer visiontasks. However, each next convolutional layer is more context-focused and extracts fea-tures that are task-related. Hence, using last layers trained for general object recognitionin visual spoofing detection is not optimal, and a large improvement may be achieved byspecializing the network. Certainly, a preferable solution is to initialize the weights withthose used in networks solving iris- and fingerprint-related tasks, as the network wouldhave been specialized to this type of imagery. However, since training of such networksfrom the scratch requires a lot data and effort, it is still a good move to initialize ownnetwork with image-related weights than just purely at random and tune its weights ifthere is not enough available training data.
Once a source set of weights to initialize the network is chosen, the fine-tuning followsa standard procedure: selects the training set of the target domain and uses it to performforward passes and back-propagation in the network. The test for an input image isstraightforward. Just resize it to the network’s input size and feed it to the network.As the network has been fully adapted to the target problem of interest, it will alreadyproduce a two-class output.
More specifically, for the cases of fingerprints, the input images in a dataset are center-cropped and resized to 224 × 224 pixels, which is the standard input size of the VGGnetwork. The centering happens through calculating the average of black pixels in thebinary fingerprint image and keeping all the rows/columns with a density of black pix-els greater than the global image average plus or minus 1.8 standard deviations of eachrespective row/column. This is used to eliminate the borders without any useful informa-tion. For optimizing the network in the fingerprint case, we use the standard SGD solverimplemented in Caffe with the following hyperparameters: base learning rate of 0.0001,

128
step lr policy, step size of 2,000, momentum of 0.9, weight decay of 0.0002, gamma of 0.5and maximum of 2,001 iterations.
In the case of faces, we center-cropped the images based on the eye coordinates calcu-lated with the aid of Face++1. Upon center-cropping, the image is resized to 224 × 224
pixels. For optimizing the network in the face case, we use the standard SGD solverimplemented in Caffe with the following hyper parameters: base learning rate of 0.001,step lr policy, step size of 1,000, momentum of 0.9, weight decay of 0.0005, gamma of0.001 and maximum number of iterations of 4,000.
For irises, we resize the images to the network’s standard input size of 224×224 pixelsand employ the same parameters as for the face optimization problem.
5.3.3 Memory Footprint
The chosen network has an average size of 140 MB. Most of its parameters (and memory)are in the convolution and fully-connected layers. The first FC layer contains 100Mweights, out of a total of 134M for the entire adapted network.
5.4 Metrics and Datasets
In this section, we describe the benchmarks (datasets) and selected accuracy estimatorsconsidered in this work. All datasets used in this chapter were freely available to usand we believe that it is the case for other researchers upon request sent directly totheir creators. Datasets composing our testing environment are the most commonly usedbenchmarks to evaluate presentation attack detection for face, iris and fingerprints. Sinceall the benchmarks have been already divided by their creators into training and testingsubsets, we decided to follow these divisions. Each training subset was divided by us intotwo disjoint subsets multiple times to perform cross-validation-based training to increasegeneralization capabilities of the winning model and to minimize an overfitting. Theresults reported further in this chapter are those obtained on testing sets. The nextsubsections characterize briefly all datasets and Table 5.1 shows their major features, inparticular the number of samples in each benchmark and their assignment to training andtesting subsets.
5.4.1 Video-based Face Spoofing Benchmarks
In this chapter, we use two benchmarks used to evaluate the performance of PAD al-gorithms for face modality, Replay-Attack [41] and CASIA Face Anti-Spoofing [274]datasets. These datasets contain five types of attempted attacks performed with fakesamples presenting different qualities.
1http://www.faceplusplus.com/
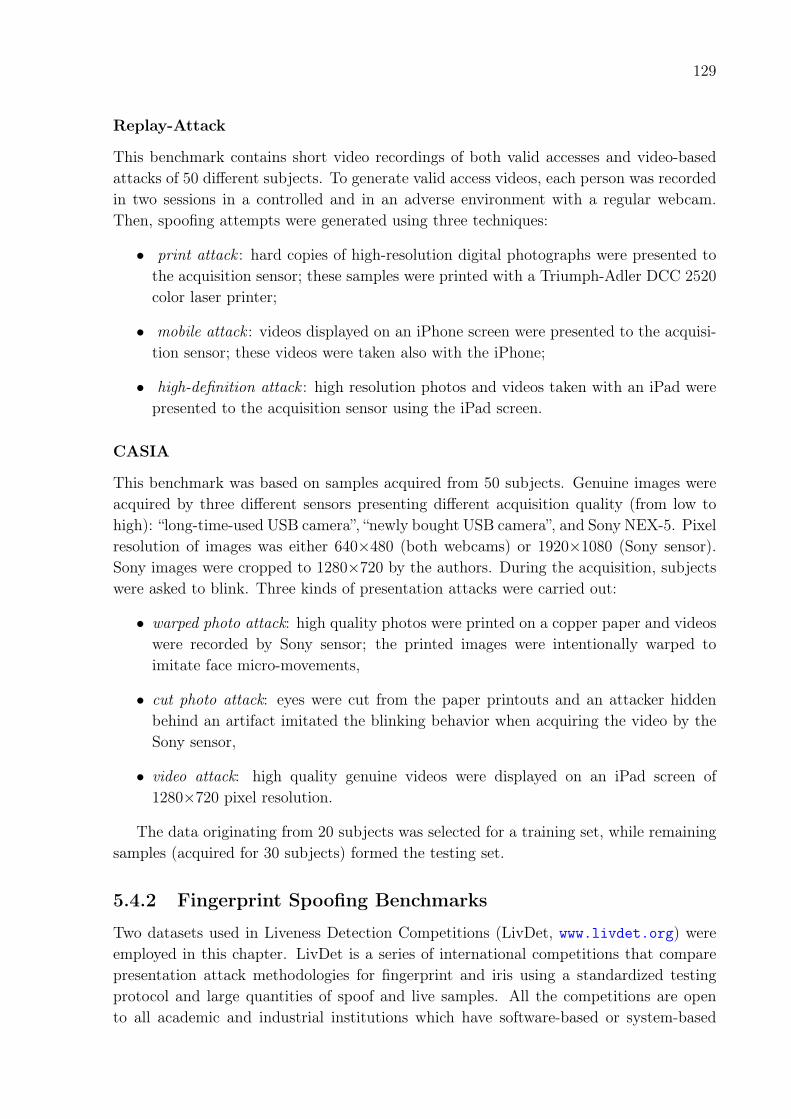
129
Replay-Attack
This benchmark contains short video recordings of both valid accesses and video-basedattacks of 50 different subjects. To generate valid access videos, each person was recordedin two sessions in a controlled and in an adverse environment with a regular webcam.Then, spoofing attempts were generated using three techniques:
• print attack : hard copies of high-resolution digital photographs were presented tothe acquisition sensor; these samples were printed with a Triumph-Adler DCC 2520color laser printer;
• mobile attack : videos displayed on an iPhone screen were presented to the acquisi-tion sensor; these videos were taken also with the iPhone;
• high-definition attack : high resolution photos and videos taken with an iPad werepresented to the acquisition sensor using the iPad screen.
CASIA
This benchmark was based on samples acquired from 50 subjects. Genuine images wereacquired by three different sensors presenting different acquisition quality (from low tohigh): “long-time-used USB camera”, “newly bought USB camera”, and Sony NEX-5. Pixelresolution of images was either 640×480 (both webcams) or 1920×1080 (Sony sensor).Sony images were cropped to 1280×720 by the authors. During the acquisition, subjectswere asked to blink. Three kinds of presentation attacks were carried out:
• warped photo attack: high quality photos were printed on a copper paper and videoswere recorded by Sony sensor; the printed images were intentionally warped toimitate face micro-movements,
• cut photo attack: eyes were cut from the paper printouts and an attacker hiddenbehind an artifact imitated the blinking behavior when acquiring the video by theSony sensor,
• video attack: high quality genuine videos were displayed on an iPad screen of1280×720 pixel resolution.
The data originating from 20 subjects was selected for a training set, while remainingsamples (acquired for 30 subjects) formed the testing set.
5.4.2 Fingerprint Spoofing Benchmarks
Two datasets used in Liveness Detection Competitions (LivDet, www.livdet.org) wereemployed in this chapter. LivDet is a series of international competitions that comparepresentation attack methodologies for fingerprint and iris using a standardized testingprotocol and large quantities of spoof and live samples. All the competitions are opento all academic and industrial institutions which have software-based or system-based

130
biometric liveness detection solutions. For fingerprints, we use datasets released in 2009and 2013.
The LivDet2009 benchmark [159] consists of three subsets of samples acquired byBiometrics FX2000, CrossMatch Verifier 300 LC and Identix DFR2100. Both the spatialscanning resolution and pixel resolution vary across subsets, from 500 DPI to 686 DPI,and from 312×372 to 720×720 pixels, respectively. Three different materials were usedto prepare spoofs: Play-Doh, gelatin and silicone.
The LivDet2013 benchmark [83] contains four subsets of real and fake fingerprintsamples acquired by four sensors: Biometrika FX2000, Italdata ET10, Crossmatch L ScanGuardian, and Swipe. Inclusion of samples from the Swipe sensor is especially interesting,since it requires – as the name suggests – swiping a finger over the small sensor. Thismakes the quality of spoofs relatively different when compared to the regular, flat sensorsrequiring only touching the sensor by the finger. For a more realistic scenario, fake samplesacquired by Biometrika and Italdata were generated without user cooperation, while fakesamples acquired by Crossmatch and Swipe were generated with user cooperation. Severalmaterials for creating the artificial fingerprints were used, including gelatin, silicone, latex,among others. The spatial scanning resolution varies from a small 96 DPI (the Swipesensor) to 569 (the Biometrika sensor). The pixel resolution is also heterogeneous: fromrelatively non-standard 208×1500 to pretty large 800×750. This makes the cross-subsetevaluation quite challenging.
5.4.3 Iris Spoofing Benchmarks
To evaluate our proposed method in detecting iris presentation attack, we used two bench-marks: AVTS [219] and a new dataset Warsaw LivDet2015, which is an extension of War-saw LivDet2013 [51]. These datasets contain attempted attacks performed with printediris images, which were produced using different printers and paper types.
AVTS
This benchmark was based on live samples collected for 50 volunteers under the Europeanproject BioSec (Biometrics and Security). To create spoofing attempts, the authors testedtwo printers (HP Deskjet 970cxi and HP LaserJet 4200L), various paper types (e.g.,cardboard as well as white, recycle, photo, high resolution and butter papers), and anumber of pre-processing operations. The combination that gave the highest probabilityof image acquisition by the LG IrisAccess EOU3000 sensor used in the study was selectedfor a final dataset collection. The authors printed their samples with the inkjet printer (HPDeskjet 970cxi) on a high resolution paper and applied an Open-TopHat pre-processingto each image prior printing. The pixel resolution of each image was 640×480, which isrecommended by ISO/IEC as a standard resolution for iris recognition samples.
Warsaw LivDet2015
This dataset is an extension of the LivDet-Iris 2013 Warsaw Subset [51] and was usedin 2015 edition of LivDet-Iris competition (www.livdet.org). It gathers 2854 images of

131
Table 5.1: Main features of the benchmarks considered herein.
Modality Benchmark Color Dimension # Training # Testingcols× rows Live Fake Total Live Fake Total
FaceReplay-Attack Yes 320× 240 600 3000 3600 4000 800 4800CASIA Yes 1280× 720 120 120 240 180 180 360
IrisWarsaw LivDet2015 No 640× 480 852 815 1667 2002 3890 5892AVTS No 640× 480 200 200 400 600 600 1200
Fingerprint
LivDet2009: CrossMatch No 640× 480 500 500 1000 1500 1500 3000LivDet2009: Identix No 720× 720 375 375 750 1125 1125 2250LivDet2009: Biometrika No 312× 372 500 500 1000 1500 1500 3000LivDet2013: Biometrika No 312× 372 1000 1000 2000 1000 1000 2000LivDet2013: CrossMatch No 800× 750 1250 1000 2250 1250 1000 2250LivDet2013: Italdata No 640× 480 1000 1000 2000 1000 1000 2000LivDet2013: Swipe No 208× 1500 1250 1000 2250 1250 1000 2250
authentic eyes and 4705 images of the paper printouts prepared for almost 400 distincteyes. The photographed paper printouts were used to successfully forge an examplecommercial iris recognition system (i.e., samples used in real and successful presentationattacks). Two printers were used to generate spoofs: HP LaserJet 1320 and LexmarkC534DN. Both real and fake images were captured by an IrisGuard AD100 biometricdevice with liveness detection functionality intentionally switched off. To get a free copyof this dataset follow the instructions given at Warsaw’s lab webpage http://zbum.ia.pw.edu.pl/EN/node/46.
5.4.4 Error Metrics
In this chapter we use the error metrics that are specific to presentation attack detection,and partially considered by ISO/IEC in their PAD-related standards [105].
Attack Presentation Classification Error Rate (APCER): proportion of attackpresentations incorrectly classified as bona fide (genuine) presentations at the PAD sub-system in a specific scenario. This error metric is analogous to false match rate (FMR) inbiometric matching, that is related to false match of samples belonging to two differentsubjects. As FMR, the APCER is a function of a decision threshold τ .
Bona Fide Presentation Classification Error Rate (BPCER): proportion of bonafide (genuine) presentations incorrectly classified as presentation attacks at the PAD sub-system in a specific scenario. This error metric is analogous to false non-match rate(FNMR) in biometric matching, that is related to false non-match of samples belongingto the same subject. Again, the BPCER is a function of a decision threshold τ .
Half Total Error Rate (HTER): combination of APCER and BPCER in a singleerror rate with a decision threshold as an argument:
HTER(τ) =APCER(τ) + BPCER(τ)
2(5.1)

132
5.5 Results
In this section, we present and discuss the experimental results of the proposed method.Sections 5.5.1, 5.5.2 and5.5.3 show the performance results and the experimental protocolsemployed to validate the performance of the proposed methodology.
5.5.1 Face
In this section, we present the results of our proposed PAD for face modality. Theexperiments are conducted considering the original protocol of the datasets used in thischapter (cf., Section 5.4), as well cross-dataset protocol, hereafter referred to as same-dataset and cross-dataset protocols, respectively. In general, a prime requirement ofmost machine learning algorithms is that both training and testing sets are independentand identically distributed. But, unfortunately, it does not always happen in practice– subsets can be identically distributed (e.g., captured using the same sensor and inthe same environment conditions), but totally dependent due to adding of bias in thedata (e.g., some dirt in the biometric sensor used to capture both subsets, identitiespresent in two subsets, artifacts added during the attack simulations, etc.). In addition,the effects of the closed-world assumption [223] may mislead us to believe that a givenapproach is perfect when in fact its performance can be disastrous when deployed inpractice for unknown presentation attacks. In this context, both same-dataset and cross-dataset are key experimental protocols in determining more accurate detection rates ofan anti-spoofing system when operating in less controlled scenarios with different kindsof attacks and sensors.
Same-dataset results. Table 5.2 shows the results for Replay-Attack and CASIAdatasets, considering that training and testing is performed on the same dataset. TheVGG network was able to detect all kinds of attempted attacks present in the Replay-Attack dataset, and also to detect two methods of attempted attacks (hand-based andfixed-support attacks), which were confirmed by the perfect classification result (HTERof 0.0%). Considering the CASIA dataset, the proposed method obtained an HTERof 6.67%. The performance achieved by the proposed method on this dataset can be ex-plained by the high degree of variability present in the CASIA dataset (e.g., different kindsof attack and resolution) that makes this dataset more challenging. In both datasets, weuse the k-fold cross-validation technique (k = 10) to built a classification model using thetraining set, and also the development set whether it is available. Figures 5.3 and 5.4present empirical distributions of the difference between two CNN output nodes and thecorresponding ROC curves.
Cross-dataset results. Table 5.3, Fig. 5.5 and Fig. 5.6 show the results obtained incross-dataset evaluation protocol. We can clearly see a dramatic drop in the performancewhen we train and test on different datasets. Several sources of variability between thedatasets may contribute to this result. The first one is that the datasets contain dif-ferent kinds of attack. The Replay-Attack dataset contains three kinds of attacks (high

133
Table 5.2: Performance results obtained in the same-dataset evaluations of the facePAD. Pointers to plots presenting Receiver Operating Characteristics (ROC) and empir-ical Probability Distribution Functions (ePDF) are added in the last column.
APCER (%) BPCER (%) HTER (%) ROC and ePDFReplay-Attack 0.00 0.00 0.00 Fig. 5.3CASIA 0.00 13.33 6.67 Fig. 5.4
-1 -0.5 0 0.5 1
Difference between the outputs of two last CNN nodes
0
0.1
0.2
0.3
0.4
0.5
0.6
0.7
0.8
0.9
1
Pro
ba
bili
ty
threshold
Authentic samples
Spoof samples
0 0.2 0.4 0.6 0.8 1
APCER
0
0.1
0.2
0.3
0.4
0.5
0.6
0.7
0.8
0.9
1
1-B
PC
ER
EER line
Figure 5.3: Left: Empirical probability distributions (ePDF) of the difference betweentwo CNN output nodes (after softmax) obtained separately for authentic and spoof facesamples. Right: ROC curve. Variant: training on Replay-Attack, testing on Replay-Attack. The threshold shown in blue color on the left plot and the blue dot on the ROCplot correspond to the approach when the predicted label is determined by the node withthe larger output.
-1 -0.5 0 0.5 1
Difference between the outputs of two last CNN nodes
0
0.1
0.2
0.3
0.4
0.5
0.6
0.7
0.8
0.9
1
Pro
ba
bili
ty
threshold
Authentic samples
Spoof samples
0 0.2 0.4 0.6 0.8 1
APCER
0
0.1
0.2
0.3
0.4
0.5
0.6
0.7
0.8
0.9
1
1-B
PC
ER
EER line
Figure 5.4: Same as Fig. 5.3 except the variant: training on CASIA, testing on CASIA.
definition-based, mobile-based and video-based attacks) while the CASIA dataset includesadditional two kinds of attack (warp-based and cut-based photo attacks). Another sourceis the fact that data comes from different sensors, which potentially produce sampleswith different resolutions, color distributions, backgrounds, etc. The VGG architecture

134
finds very specific features and even when it is tuned to the specific problem, it does notgeneralize well to be agnostic to specific properties of data acquisition process.
Table 5.3: Performance results obtained with the cross-dataset evaluations of face PADand using the overall testing set of each dataset.
Training Test APCER (%) BPCER (%) HTER (%) ROC and ePDFReplay-Attack CASIA 42.67 51.67 47.16 Fig. 5.5
CASIA Replay-Attack 89.44 10.0 49.72 Fig. 5.6
-1 -0.5 0 0.5 1
Difference between the outputs of two last CNN nodes
0
0.1
0.2
0.3
0.4
0.5
0.6
0.7
0.8
Pro
ba
bili
ty
threshold
Authentic samples
Spoof samples
0 0.2 0.4 0.6 0.8 1
APCER
0
0.1
0.2
0.3
0.4
0.5
0.6
0.7
0.8
0.9
1
1-B
PC
ER
EER line
Figure 5.5: Same as Fig. 5.3 except the variant: training on Replay-Attack, testing onCASIA (cross-dataset testing).
-1 -0.5 0 0.5 1
Difference between the outputs of two last CNN nodes
0
0.1
0.2
0.3
0.4
0.5
0.6
0.7
0.8
0.9
Pro
ba
bili
ty
threshold
Authentic samples
Spoof samples
0 0.2 0.4 0.6 0.8 1
APCER
0
0.1
0.2
0.3
0.4
0.5
0.6
0.7
0.8
0.9
1
1-B
PC
ER
EER line
Figure 5.6: Same as Fig. 5.3 except the variant: training on CASIA, testing on Replay-Attack.
5.5.2 Fingerprints
This section presents how our VGG-based approaches perform in detection of fingerprintattack presentation. As for experiments with face benchmarks, we used the training

135
subsets (as defined by dataset creators) to make a cross-validation-based training, andseparate testing subsets in final performance evaluation. Fingerprint benchmarks arecomposed of subsets gathering mixed attacks (for instance glue, silicone or gelatin arti-facts) and acquired by different sensors (cf. Table 5.1).
Same-sensor results. In this scenario, samples acquired by different sensors are notmixed together. That is, if the classifier is trained with samples acquired by sensor X,only sensor X samples are used in both the validation and final testing. As in previousexperiments, 10 statistically independent estimation-validation pairs of non-overlappingsubsets were created, and the solution presenting the lowest HTER over ten validationswas selected for testing. Table 5.4 as well as Figures 5.7 and 5.8 show the same-sensortesting results averaged over all sensors (used to build a given dataset) and presented foreach benchmark separately. These results suggest that the older benchmark (LivDet2009)is relatively difficult since almost 20% of spoofing samples were falsely accepted in asolution that falsely rejects only 3.45 % of authentic examples.
Table 5.4: Performance results obtained in same-dataset evaluations of fingerprintPAD using a part of testing samples acquired by the same sensor as in the trainingprocedure. Results are averaged over all subsets representing different sensors.
Training Testing APCER (%) BPCER (%) HTER (%) ROC and ePDFLivDet2009 LivDet2009 19.37 3.45 11.4 Fig. 5.7LivDet2013 LivDet2013 6.8 2.79 4.795 Fig. 5.8
-1 -0.5 0 0.5 1
Difference between the outputs of two last CNN nodes
0
0.1
0.2
0.3
0.4
0.5
0.6
0.7
0.8
0.9
1
Pro
ba
bili
ty
threshold
Authentic samples
Spoof samples
0 0.2 0.4 0.6 0.8 1
APCER
0
0.1
0.2
0.3
0.4
0.5
0.6
0.7
0.8
0.9
1
1-B
PC
ER
EER line
Figure 5.7: Left: Empirical distributions of the difference between two CNN output nodes(after softmax) obtained separately for authentic and spoof fingerprint samples. Right:ROC curve. Variant: training on LivDet2009, testing on LivDet2009. As in previousplots, the threshold shown in blue color on the left plot and the blue dot on the ROC plotcorrespond to the approach when the predicted label is determined by the node with thelarger output.

136
-1 -0.5 0 0.5 1
Difference between the outputs of two last CNN nodes
0
0.1
0.2
0.3
0.4
0.5
0.6
0.7
0.8
0.9P
rob
ab
ility
threshold
Authentic samples
Spoof samples
0 0.2 0.4 0.6 0.8 1
APCER
0
0.1
0.2
0.3
0.4
0.5
0.6
0.7
0.8
0.9
1
1-B
PC
ER
EER line
Figure 5.8: Same as Fig. 5.7 except the variant: training on LivDet2013, testing onLivDet2013.
Cross-sensor results. For cross-sensor analysis, the newer benchmark (LivDet2013)was selected. Each subset (estimation, validation and testing) was divided into two dis-joint subsets of samples: a) acquired by ItalData and Swipe sensors, and b) acquired byBiometrika and CrossMatch sensors. Table 5.5 shows that, as with the other modalities,we can observe serious problems with recognition of both artifacts or genuine samples(two first rows of Table 5.5). Figures 5.10 and 5.9, illustrating these results, suggest thata better balance between APCER and BPCER can be found if there is a possibility toadjust the acceptance threshold.
Table 5.5: Performance results obtained in cross-dataset evaluations of fingerprintPAD using a part of testing samples acquired by different sensor as in the trainingprocedure. All data comes for LivDet2013 fingerprint benchmark. IS = Italdata+Swipe,BC = Biometrika+CrossMatch.
Training Testing APCER (%) BPCER (%) HTER (%) ROC and ePDFIS BC 24.9 4.01 14.1 Fig. 5.9BC IS 2.8 75.6 39.18 Fig. 5.10
IS IS 3.4 2.37 2.88 Fig. 5.11BC BC 2.65 13.1 7.87 Fig. 5.12
For completeness, same-sensor results are also presented on this dataset in two lastrows of Table 5.5, and in Figs. 5.12 and 5.11. As expected, a solution based on deepnetwork achieves much better accuracy when the type of sensor in known.
5.5.3 Iris
This last section presents the results of iris presentation attacks detection. Two iris PADbenchmarks were used, as described in Section 5.4), and both same-dataset and cross-dataset experiments were carried out. Each dataset (Warsaw LivDet2015 and AVTS) arealready split by their creators into training and testing subsets. We followed this split and

137
-1 -0.5 0 0.5 1
Difference between the outputs of two last CNN nodes
0
0.1
0.2
0.3
0.4
0.5
0.6
0.7
0.8
0.9
1P
rob
ab
ility
threshold
Authentic samples
Spoof samples
0 0.2 0.4 0.6 0.8 1
APCER
0
0.1
0.2
0.3
0.4
0.5
0.6
0.7
0.8
0.9
1
1-B
PC
ER
EER line
Figure 5.9: Same as Fig. 5.7 except the variant: training on Italdata+Swipe, testingon Biometrika+CrossMatch.
-1 -0.5 0 0.5 1
Difference between the outputs of two last CNN nodes
0
0.1
0.2
0.3
0.4
0.5
0.6
0.7
0.8
0.9
Pro
ba
bili
ty
threshold
Authentic samples
Spoof samples
0 0.2 0.4 0.6 0.8 1
APCER
0
0.1
0.2
0.3
0.4
0.5
0.6
0.7
0.8
0.9
1
1-B
PC
ER
EER line
Figure 5.10: Same as Fig. 5.7 except the cross-sensor that training is realized on samplescomposed Biometrika+CrossMatch, testing on Italdata+Swipe.
-1 -0.5 0 0.5 1
Difference between the outputs of two last CNN nodes
0
0.1
0.2
0.3
0.4
0.5
0.6
0.7
0.8
0.9
1
Pro
ba
bili
ty
threshold
Authentic samples
Spoof samples
0 0.2 0.4 0.6 0.8 1
APCER
0
0.1
0.2
0.3
0.4
0.5
0.6
0.7
0.8
0.9
1
1-B
PC
ER
EER line
Figure 5.11: Same as Fig. 5.7 except the variant: training on Italdata+Swipe, testingon Italdata+Swipe.

138
-1 -0.5 0 0.5 1
Difference between the outputs of two last CNN nodes
0
0.1
0.2
0.3
0.4
0.5
0.6
0.7
0.8
0.9
1P
rob
ab
ility
threshold
Authentic samples
Spoof samples
0 0.2 0.4 0.6 0.8 1
APCER
0
0.1
0.2
0.3
0.4
0.5
0.6
0.7
0.8
0.9
1
1-B
PC
ER
EER line
Figure 5.12: Same as Fig. 5.7 except the variant: training onBiometrika+CrossMatch, testing on Biometrika+CrossMatch.
used the testing subset only in final performance evaluation. The training subset, usedin method development, was randomly divided 10 times into estimation and validationdisjoint subsets used in cross-validation when training the classifiers.
The average HTER’s over 10 splits calculated for validation subsets were approx.0.0001 and 0.0 for Warsaw and AVTS datasets, respectively. HTER = 0.0 for 5 out of10 splits of Warsaw training dataset. This means that the VGG-based feature extractorfollowed by a classification layer trained on our data was perfect on the AVTS dataset,and also it was perfect on half of the splits of the Warsaw benchmark. Since there is no“best split” for either of two datasets, we picked one trained solution presenting perfectperformance on the training subsets to evaluate them on the test sets.
Same-dataset results. Table 5.6 presents the testing results obtained in the scenariowhen both training and testing sets come from the same benchmark. APCER and BPCERrefer to classification task, that is each sample belonging to the testing set was classifiedto one of two classes (authentic or presentation attack) based on posteriori probabilitiesof class membership estimated by the softmax layer of the trained network. Hence, singleAPCER and BPCER (point estimators) are presented since this protocol is equivalent toa single acceptance threshold. The results obtained in this scenario are astonishing: theclassifiers trained on disjoint subsets of samples originating from the same dataset areeither perfect (ATVS benchmark) or close to perfect (a perfect recognition of spoofingsamples of Warsaw benchmark with only 0.15% of authentic samples falsely rejected).Figures 5.13 and 5.14 present empirical distributions of the difference between two CNNoutput nodes and the corresponding ROC curves. The distributions are well separatedfor both benchmarks, suggesting high performance of the VGG-based solution applied forknown spoofing samples.
Cross-dataset results. Table 5.7 shows how catastrophically bad this method may beif tested on cross-dataset samples. ATVS and Warsaw samples differ significantly interms of image properties such as contrast and visibility of iris texture. Especially, all the

139
Table 5.6: Performance results obtained in same-dataset evaluations of iris PAD usingthe overall testing set of each dataset.
Training Testing APCER (%) BPCER (%) HTER (%) ROC and ePDFWarsaw Warsaw 0.0 0.15 0.075 Fig. 5.13ATVS ATVS 0.0 0.0 0.0 Fig. 5.14
-40 -30 -20 -10 0 10 20 30
Difference between the outputs of two last CNN nodes
0
0.02
0.04
0.06
0.08
0.1
0.12
0.14
0.16
0.18
Pro
babili
ty
threshold
Authentic samples
Spoof samples
0 0.2 0.4 0.6 0.8 1
APCER
0
0.1
0.2
0.3
0.4
0.5
0.6
0.7
0.8
0.9
1
1-B
PC
ER
EER line
Figure 5.13: Left: empirical distributions of the difference between two CNN out-put nodes (before softmax) obtained separately for authentic and spoof iris samples.Right: ROC curve. Variant: training on Warsaw LivDet2015, testing on WarsawLivDet2015. The threshold shown in blue color on the left plot and the blue dot on theROC plot correspond to the approach when the predicted label is determined by the nodewith the larger output.
-40 -30 -20 -10 0 10 20 30
Difference between the outputs of two last CNN nodes
0
0.05
0.1
0.15
0.2
0.25
0.3
0.35
Pro
babili
ty
threshold
Authentic samples
Spoof samples
0 0.2 0.4 0.6 0.8 1
APCER
0
0.1
0.2
0.3
0.4
0.5
0.6
0.7
0.8
0.9
1
1-B
PC
ER
EER line
Figure 5.14: Same as Fig. 5.13 except the variant: training on ATVS, testing on ATVS.
printouts used to produce Warsaw fake samples were able to spoof an example commercialiris recognition system, which is not the case in the ATVS benchmark. Hence, due tonon-accidental quality of Warsaw samples, this database seems to be more realistic andmore difficult to process than the ATVS. Indeed, training on Warsaw (the “difficult”benchmark) and testing on ATVS (the “easier” benchmark) yields good results. Figure

140
5.15 presents well separated empirical distributions of the difference between the outputnodes of the network obtained for authentic samples and spoofs.
Table 5.7: Performance results obtained in cross-dataset evaluations of iris PAD usingthe overall testing set of each dataset.
Training Testing APCER (%) BPCER (%) HTER (%) ROC and ePDFWarsaw ATVS 0.0 0.625 0.312 Fig. 5.15ATVS Warsaw 99.9 0.0 49.99 Fig. 5.16
-40 -30 -20 -10 0 10 20 30
Difference between the outputs of two last CNN nodes
0
0.05
0.1
0.15
0.2
0.25
0.3
0.35
0.4
Pro
babili
ty
threshold
Authentic samples
Spoof samples
0 0.2 0.4 0.6 0.8 1
APCER
0
0.1
0.2
0.3
0.4
0.5
0.6
0.7
0.8
0.9
1
1-B
PC
ER
EER line
Figure 5.15: Same as Fig. 5.13 except the variant: training on Warsaw LivDet2015,testing on ATVS.
However, training on ATVS and testing on Warsaw yields almost null abilities todetect spoofs (APCER = 99.9%). This may suggest that exchanging a single layer put ontop of the VGG-based feature extraction (trained for a different problem than spoofingdetection) is not enough to model various qualities of iris printouts prepared independentlyby different teams and using different acquisition hardware. Fig. 5.15 confirms that almostall scores obtained for spoofing samples are on the same side of the threshold as forauthentic samples. Certainly, if the threshold can be adapted (which is not typically donein the tests), one can find other proportion between APCER and BPCER, for instance athreshold shifted from 0 to -21.9 results in the EER 13.2%.
5.6 Conclusions
In this chapter, we proposed a PAD solution for three modalities widely employed fordesigning biometric systems (i.e., face, iris and fingerprint) based on VGG network ar-chitecture, a deep network architecture originally proposed for object recognition. Weshowed a methodology to adapt the VGG network to the two-class spoofing classificationproblem, which was evaluated using six benchmarks available for scientific purposes. Theexperiments were conducted taking into account the main challenges existing in this re-search field such as classification across different types of attempted attacks, biometric
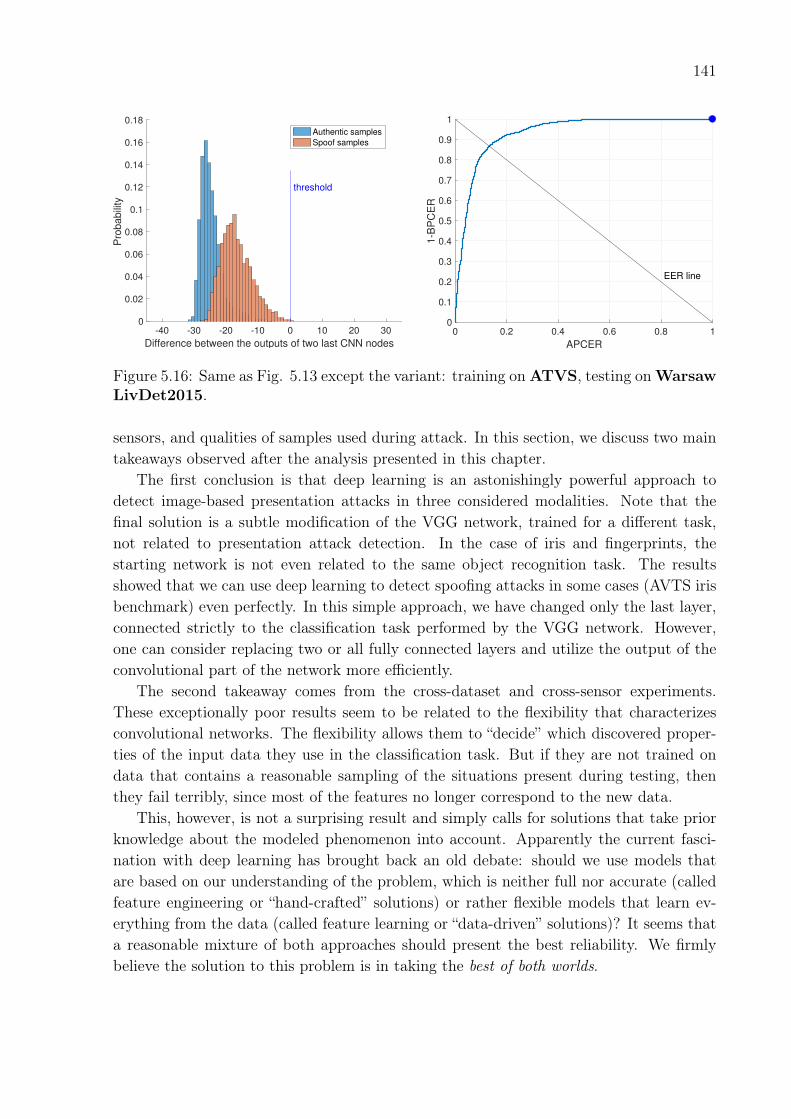
141
-40 -30 -20 -10 0 10 20 30
Difference between the outputs of two last CNN nodes
0
0.02
0.04
0.06
0.08
0.1
0.12
0.14
0.16
0.18P
robabili
ty
threshold
Authentic samples
Spoof samples
0 0.2 0.4 0.6 0.8 1
APCER
0
0.1
0.2
0.3
0.4
0.5
0.6
0.7
0.8
0.9
1
1-B
PC
ER
EER line
Figure 5.16: Same as Fig. 5.13 except the variant: training onATVS, testing onWarsawLivDet2015.
sensors, and qualities of samples used during attack. In this section, we discuss two maintakeaways observed after the analysis presented in this chapter.
The first conclusion is that deep learning is an astonishingly powerful approach todetect image-based presentation attacks in three considered modalities. Note that thefinal solution is a subtle modification of the VGG network, trained for a different task,not related to presentation attack detection. In the case of iris and fingerprints, thestarting network is not even related to the same object recognition task. The resultsshowed that we can use deep learning to detect spoofing attacks in some cases (AVTS irisbenchmark) even perfectly. In this simple approach, we have changed only the last layer,connected strictly to the classification task performed by the VGG network. However,one can consider replacing two or all fully connected layers and utilize the output of theconvolutional part of the network more efficiently.
The second takeaway comes from the cross-dataset and cross-sensor experiments.These exceptionally poor results seem to be related to the flexibility that characterizesconvolutional networks. The flexibility allows them to “decide” which discovered proper-ties of the input data they use in the classification task. But if they are not trained ondata that contains a reasonable sampling of the situations present during testing, thenthey fail terribly, since most of the features no longer correspond to the new data.
This, however, is not a surprising result and simply calls for solutions that take priorknowledge about the modeled phenomenon into account. Apparently the current fasci-nation with deep learning has brought back an old debate: should we use models thatare based on our understanding of the problem, which is neither full nor accurate (calledfeature engineering or “hand-crafted” solutions) or rather flexible models that learn ev-erything from the data (called feature learning or “data-driven” solutions)? It seems thata reasonable mixture of both approaches should present the best reliability. We firmlybelieve the solution to this problem is in taking the best of both worlds.

142
Acknowledgment
We thank Brazilian Coordination for the Improvement of Higher Education Personnel(CAPES) through the DeepEyes project, the São Paulo Research Foundation (FAPESP)through the DéjàVu project (Grant #2015/19222-9), and Microsoft Research for the fi-nancial support.

143
Chapter 6
Leveraging Shape, Reflectance andAlbedo from Shading for FacePresentation Attack Detection
“The true work of art is but a shadow of the divine perfection.”—Michelangelo, Italian sculptor, painter, architect and poet (1475–1564)
“We can easily forgive a child who is afraid of the dark; the real tragedy of lifeis when men are afraid of the light.”
—Plato, Greek author & philosopher in Athens (427 BC–347 BC)
Abstract
Presentation attack detection is a challenging problem in the biometrics that aims atexposing an impostor user that seeks to deceive the authentication process by showing tothe acquisition sensor a synthetic sample containing the biometric data of a genuine userpreviously enrolled in the authentication system. In facial biometrics systems, this kindof attack is performed with a photograph, video, or 3D mask containing the biometricinformation of a genuine identity. In this paper, we investigate a novel approach todetecting face presentation attacks based on intrinsic properties of the scene such asalbedo, depth, and reflectance properties of the facial surfaces, which were recoveredthrough a shape-from-shading (SfS) algorithm. In other to extract meaningful patternsfrom the different maps obtained with the SfS algorithm, we designed a novel shallowCNN architecture for learning features useful for the presentation attack detection (PAD).We conduct the experimental results considering the intra- and inter-dataset evaluationprotocol. The former protocol aims to test a PAD system under a scenario in that theacquisition sensor and the identities are known during the training phase, whereas thelatter protocol aims to test a PAD system in a completely unknown scenario, whichincludes the identities, sensors, and the presentation attack instruments (PAI) used to

144
generate the attempted attacks. Experimental results showed the effectiveness of theproposed method considering several types of the photo- and video-based presentationattacks, and in the cross-sensor scenario, besides achieving competitive results for theinter-dataset evaluation protocol.
6.1 Introduction
B IOMETRICS is an active research field whose today’s challenges go far beyond themaking of a high precision system. Nowadays, the security aspects of a biometric
system are essential for a successful authentication mechanism due to the vast possibilitythat an impostor user has for attacking a biometric system. Among different possibilities,presentation attack is the easiest way to deceive such systems since this kind of attackcan be performed directly on the acquisition sensor without any previous knowledge ofthe internal components of the system. It is characterized by the action of presentinga synthetic biometric sample of some valid user to the acquisition sensor in order toauthenticate itself as a legitimate user. In this kind of attack, the impostor user doesnot need any advanced information about internal components of the system, and theminimum requirement for a successfully accomplished presentation attack is a trustworthycopy of the biometric data of a target user such as photographs, digital video, or even a3D mask [158].
Although several advances have been reported in the literature, face presentationattack problem is still an open problem. According to the IJCB 2017 competition ongeneralized face presentation attack detection (PAD) in mobile [30], the best algorithmfor detecting this kind of attack presented an error detection rate about 10.0%, whichmeans that ten out of every hundred attempted attacks were successfully accomplished,giving to an impostor user unauthorized access to the biometric system. Considering asystem with hundreds of thousands of users, this detection rate makes the authenticationprocess unfeasible in practice.
The major problem with the current solutions for PAD is the lack of ability to work inan uncontrolled environment. In fact, the PAD solutions available in the literature presentimpressive accuracy rates, with near-perfect classification results, for isolated datasets, i.e.,in one specific domain. However, when we consider challenging evaluation scenarios, thosealgorithms present extremely low performance, sometimes becoming worse than random.For this reason, researchers have promoted efforts to report their results considering twoevaluation protocols known as intra- and inter-datasets. Intra-dataset evaluation protocolconsists of testing a PAD algorithm using data that came from the same source as thetraining data with training and testing sets being collected using the same acquisitionsensor or in the same environment. Inter-dataset protocol consists of testing a PADalgorithm using data from a different source as the training data, which means we havedata from a different domain (i.e., different sensor and environment). Such evaluationprotocol is more challenging and more suitable for reflecting a real operating scenario.
According to recent results reported in the literature, the Half Total ErrorRates (HTER) can increase drastically taking into account these evaluation protocols.

145
Pinto et al. [189] proposed a PAD method based on analysis of the noise and artifactsleft in the synthetic biometric sample during its manufacture such as blurring, printingeffect, banding effect among others. Although the authors achieved a low HTER valuefor the intra-dataset evaluation protocol (2.8%), the HTER of this technique increasessignificantly, considering the inter-dataset protocol (34.4%). Even in the state-of-the-arttechniques, values for error rates are still too high. Boulkenafet et al. [28] reported anHTER of 2.9% and 16.7% considering the intra- and inter-dataset protocols, respectively,which means a degradation of about 4×, in terms of HTER, which is far from an accept-able value in practice.
In this paper, we present a novel approach to distinguishing a synthetic face from realones, taking into account the optical and physical properties of the scene captured by theacquisition sensor. Our method takes advantage of the depth information, associatingit with light properties of the scene to detect an attempted attack, using a classic tech-nique in computer vision known as shape-from-shading (SfS). SfS was firstly proposedby Horn et al. [97] and aims to estimate the shape of an object based on the shade in-formation present in its surface. In contrast with the photometric stereo techniques, SfStechniques require only one image of the object under analysis. Moreover, the estimationof the shape using SfS does not require any additional hardware, which makes possiblethe application of our technique in devices equipped with only an RGB camera such assmartphones and webcams. Fig. 6.1 illustrates a face surface reconstruction using theTsai’s algorithm [188], which will be described in details in Section 6.3.
(a) RGB image (b) Depth map (c) Reflectance map (d) Albedo map
Figure 6.1: Example of a facial surface reconstruction using an SfS algorithm for presen-tation attack video frame.
6.1.1 Optical Properties of the Light and Rationale of ProposedApproach
According to the law of refraction [249], the physical mechanism of the light refraction canbe characterized in terms of absorption and irradiation of the light incident in a surface.Complementary, the reflection’s law governs the reflection of the incident light and statesthat the incident ray, the reflected ray, and the normal to smooth conducting surfaces(e.g., mirror or polished metal) all lie in the same plane [249]. Basically, the beam of lightthat affects a flat surface may be absorbed, transmitted, and reflected, and that, the light

146
reflected can be mathematically understood by Snell and reflection laws, which predictthe directions of the light refracted and reflected, respectively, taking into account therefraction index of the material and the roughness of its surface, that is, the smoothnessor texture of the surface.
understanding of the physical mechanism of the light refraction, in terms of absorptionand irradiation of the light incident on a surface, while the reflection’s law governs thereflection of the incident light. According to refraction and reflection laws, the beamof light that affects a flat surface may be absorbed, transmitted, and reflected, and thedirections of the reflected and refracted light can be predicted considering the refractionindex of the material and the roughness of its surface, i.e., the smoothness or texture ofthe surface.
When a beam of light affects a truly flat surface, each incident ray is reflected atthe same angle that we have between the surface normal and such incident ray, buton the opposite side of the surface normal. In contrast, when a beam of light affectsrough surfaces, the incident light is reflected in several different directions. An idealdiffuse reflecting surface that reflects the incident light in all directions is said to exhibit aLambertian reflection. These two processes are known as specular and diffuse reflection,respectively. Although many materials can exhibit both types of reflection, some materialsreflect the light more diffuse than specular way (e.g., paper fibers, non-absorbing powdersuch as plaster, poly-crystalline material such as white marble, among others) [70, 116,165,252].
The reflecting power of the material is another interesting physical property that webelieve to be useful for the presentation attack detection problem. This property is alsoknown as surface albedo and can be defined as a measure of how much light incident ona surface is reflected without being absorbed. In other words, this property measures thereflectivity of a material and gives an estimate of the level of the diffuse reflection [103,275].Thus, the objects that appear white reflect most of the incident light, indicating a highalbedo, whereas the dark objects absorb most of the incident light, indicating a low albedo.
Finally, the last physical property we investigate in this work is the depth informationassociated with an object in the scene. Considering the presentation attack instrumentsknown in the literature (e.g., photograph, video replay, mask), we clearly have a significantloss of depth information, excepting the mask-based presentation attacks. In fact, severalworks published in the literature have successfully investigated features able to charac-terize the depth information of face regions to point out an attempted attack [66,67,84].Basically, these approaches propose to use depth sensor, such as Microsoft’s Kinetic sen-sor, to find an accurate depth map of the scene.
6.1.2 Contributions and Organization
In light of these remarks, we propose a novel method for detecting face presentationattacks using an SfS technique, which is used for recovering the surface details of thefaces captured by the acquisition sensor. Our hypothesis is that the reconstructed surfacefrom the presentation attack samples might contains strong evidence of synthetic patternsin comparison to the RGB images. To the best of our knowledge, this is the first attempt

147
at using this kind of algorithm for the PAD problem. In summary, the main contributionsof this paper are:
• a new method for face presentation attack detection based on intrinsic properties ofthe surfaces reconstructed with an SfS algorithm;
• a new shallow CNN network able for learning discriminant features from the albedo,reflectance, and depth maps for the PAD problem, which achieved competitive re-sults for the intra- and inter-dataset evaluation protocol;
• an investigation of a new data-driven PAD algorithm, where the depth maps arerecovered without any extra hardware, which allows the use of the proposed methodin systems equipped with a single RGB sensor;
• an evaluation of the proposed approach considering challenging protocols such asinter-dataset protocol and the cross-sensor scenario; and
• the investigation of using an SfS technique in a challenging problem upon hundredsof thousands of real images.
We organize the remaining of this paper as follows. Section 6.2 presents some rele-vant related approaches to face presentation attack detection. Section 6.3 describes theproposed method. Section 6.4 presents the datasets and evaluation protocols used in thispaper, besides the experimental results and a comparison with methods available in theliterature. Finally, Section 6.5 presents the conclusions and possible directions for futurework.
6.2 Related Work
Texture analysis is undoubtedly an important and promising line of investigation thatmade possible many progress in this research field toward finds good PAD algorithms.Back to the First Competition on Counter Measures to 2D Facial Spoofing Attacks [36],the best proposed algorithms [151, 214] explored different texture descriptors, such asLocal Binary Patterns (LBP), Gray-Level Co-Occurrence Matrix (GLCM), Histogramof Oriented Gradients (HOG), among others, for detecting printed-based attempted at-tacks [8].
In order to push the state-of-the-art to past the breaking point, the Second Competi-tion on Counter Measures to 2D Face Spoofing Attacks [42] presented to the community anovel dataset (Replay-Attack dataset) [41] containing three different attacks types, print-,photo-, and video-based attacks, where the winner teams addressed the problem througha feature-level fusion of texture- and motion-based features. The Replay-Attack was quitechallenging at that time, making a possible further interesting investigation of other cuesfor detecting face presentation attacks.
Erdogmus and Marcel [65–67] explored depth information for detecting face presenta-tion attacks by analyzing both color and depth data obtained by Microsoft’s Kinect sensor.The authors proposed to use the Local Binary Patterns (LBP) descriptor in both color

148
and depth images to produce feature vectors, which were used to feed a Linear Discrimi-nant Analysis (LDA) classifier to reveal an attempted attack. Pinto et al. [189, 190, 193]also brought alternatives for detecting face presentation attacks exploiting the residualnoise presents in the fake biometric sample left during their recapture and reconstructionsuch as blurring effect, printout artifacts, Moiré patterns, among others. Similar, Gar-cia and Queiroz [77] and Wen et al. [260] explored these and other artifacts related toimage distortions caused mainly by the recapture process of the original biometric signal.
Another cue that has been an object of investigation in the literature is regardingthe reflectance of the objects. Although skin reflectance presents great variation dueto different tonalities of human skin [49, 161], researchers have successively used it inseveral applications [55, 92, 144]. In these cases, however, the reflectance is measuredthrough extra-devices, for instance, thermal infrared imagery and near-infrared imagery.Alternatively, some computational methods for estimating the reflectance map of a scenefrom RGB images [5, 48, 98] have been proposed in the literature to decompose an RGBimage into their reflectance and illumination components [128].
CNN-based techniques also have been considered in the literature. Menotti et al. [162]proposed a framework for optimizing CNN architectures for PAD problem consideringdifferent modality, include face biometrics. The authors also proposed a shallow CNNnetwork was applied for detecting iris, fingerprint, and face presentation attacks. Al-though the authors achieved good results using this technique, this work did not con-sider more challenging protocols such as inter-dataset protocol and cross-sensor scenario.Atoum et al. [11] combines a patch- and depth-based CNN for face PAD, in which theauthors also achieved good results for the intra-dataset evaluation protocol. However,this works also reported their results only in the intra-dataset protocol.
Several works in the literature presented a fine-tuning of existing deep architecturessuch as AlexNet, VGG, VGG-Face, and GoogleLeNet [142, 180, 192, 269]. However, ingeneral, these architectures achieved near-perfect classification results for the intra-datasetand, at same time, very poor results (close to random) for the inter-dataset protocol.Recently, Rehman et al. [208] proposed a new CNN-based anti-spoofing technique usingthe VGG-11 architecture, in which the authors reported impressive results for the intra-and inter-dataset scenario. However, a serious methodological failure described by theauthors in Sec. 4.2.2 of the original paper [208], made any comparison unfeasible. Asmentioned by the authors, part of the testing dataset was used to estimate the thresholdτ , which was used for computing the APCER, BCPER, and HTER values. More precisely,considering the inter-dataset protocol, in which we have a training dataset and a testingdataset, the authors used the training partition contained in the test dataset for estimatingthe threshold τ , which obviously biased the reported results. In contrast to Rehman et al.,this paper and the other ones published in the literature use the testing dataset only toreport the performance results.
Differently from the previous works in the literature, in this work, we propose a PADtechnique that takes advantage of depth, albedo, and reflectance information from RGB-images, without the necessity of any extra-device such as Microsoft’s Kinect or an infraredsensor. Instead of using different methods for computing each one of these components, wepropose to use a shape-from-shading algorithm, which enables us to estimate these three

149
representations from a single RGB image. We also propose a new CNN architecture ableto work in the intra- and inter-dataset scenario. To the best of our knowledge, our work isthe first one to deal with these three schemes simultaneously using a shape-from-shadingtechnique for detecting face presentation attacks.
6.3 Proposed Method
In this section, we present our proposed method for face PAD which is based on intrinsicproperties of the surface such as reflectance, albedo, and shape. As previously described,we propose the use of SfS for measuring these properties and use them as input fora Convolutional Neural Network (CNN) method which learns discriminative features fordetecting presentation attacks. The advantage of using an SfS method, instead of using anextra-device sensor, is two-fold: (i) a shape-from-shading method gives us an estimationof these three properties at once, and (ii) we came up with a completely data-drivenmethod, which enables our method for use in biometric systems equipped with only anRGB camera such as smart-phones.
The human ability for perceiving the shape of the objects from its shading is oneof the most important aspects of the human visual system. This ability is essentialfor the human understanding of the world under a three-dimensional perspective [201].Studies have been published showing that human can accurately use shading cues toinfer changes in the surface orientation [183, 201, 261]. In computer vision, there are twomain classes of methods for estimating the shape from shading: photometric stereo andshape-from-shading methods. An essential difference between them is that photometricstereo methods require two or more images of the same object under different lightingconditions, whereas shape-from-shading methods require only one image of the object toestimate its normal surfaces, making SfS methods very attractive to our problem [240].
We believe that some SfS methods are more appropriate to be applied in our problemsthan others approaches found in the literature, according to assumptions and restrictionsimposed during the formulation of the problem. For instance, methods that add a smooth-ness constraint to the surface might be inadequate to be used in our problem because suchconstraint is not contemplated when recovering the shape of faces due to some cavities.
Our work is based on Tsai’s approach [188], which does not impose any restrictionthat could render its use improper for the PAD problem. Fig. 6.2 illustrates our proposedmethod, which is explained in details next.
6.3.1 Surface Reconstruction: Recovering the Depth, Reflectanceand Albedo maps
The Tsai’s algorithm [188] uses a linear approximation of reflectance function R to es-timate the depth function Z from a single image. The main idea is to apply a discreteapproximation for the surface normal using the finite differences method in order to lin-earize the reflectance function R in terms of Z, and then to solve the linear system throughthe Jacobi iterative method [220].

150
TESTING STAGE
TRAINING STAGE PROPOSED CNN ARCHITECTURE
TrainingSet
SurfaceReconstruction(SfS method)
Feature Learning and Classification
(CNN)
FINAL SCORESTestingSet
Feature Extractionand
Predictions
3x3 Convolutions (16 filters)
9x9 Max-pooling (stride 8)
3x3 Convolutions (32 filters)
9x9 Max-pooling (stride 8)
Droupout
Input images (150x150x3) 3x3 Convolutions (16 filters)
LeakyReLU
LeakyReLU
3x3 Convolutions (32 filters)
+
Droupout
Soft-max (2 units)
Dense (1024 units)
Dense (128 units)
(a) (b) (c)
Figure 6.2: Overview of the proposed method for face presentation attack detection.First, we reconstruct the face surfaces by using the SfS method, which produces estimatesfor the albedo, reflectance, and depth maps. Then, we use a representation learningtechniques based on CNN to learn discriminative features from these maps estimatedfrom the training samples, which give us a classification model to decide if a given testingsample is a bona fide presentation or a presentation attack.
Let us, for instance, suppose that a point at position (x, y, z), in camera coordinates,is at a distance z from the image plane and there is a mapping between points in cameracoordinates onto the image plane created using the parallel projection (not taking intoaccount any sort of distortion). Assuming that depth information is a function of imageplane coordinates Z = Zx,y, then the change in depth δz of the point related to the changein image plane coordinate (x, y) can be expressed by using the Taylor series expansion ofthe function Z about point (x, y) as:
δz ≈∂z
∂xδx+
∂z
∂yδy (6.1)
The gradient of the surface at point (x, y, z) is the vector (p, q) = ( ∂z∂x, ∂z∂y
) and, there-fore, the normal of a surface patch is related to the gradient by n = (p, q, 1), since thegradient vector is orthogonal to the level surface Zx,y.
Now, suppose a Lambertian surface, which has only diffuse reflectance and the bright-ness is proportional to the energy of the incident light. In this case, the amount of lightenergy falling on a surface is proportional to the area of the surface as seen from the lightsource position, which can be expressed as:
Ex,y = R(p, q) = ρI(n · s)
⇒ R(p, q) = ρ(−p,−q, 1)√1 + p2 + q2
·(−ps,−qs, 1)√
1 + p2s + q2s
(6.2)
where Ex,y is the intensity at pixel (x, y), I is the illuminance (or strength of light),n = (−p,−q, 1) is the surface normal, s = (−ps,−qs, 1) is the light source direction, andρ is the albedo of the surface.
The SfS method employed in this work uses a discrete approximation for p and q asshown in Equation 6.3 and performs a linear approximation of Equation 6.4 based on

151
Taylor series expansion considering the first order terms of the function f about a givendepth map Zn−1, which give us a linear system of equations (Equation 6.5).
p =∂z
∂x= Zx,y − Zx−1,y
q =∂z
∂y= Zx,y − Zx,y−1
(6.3)
0 = f(Ex,y, R(∂z/∂x, ∂z/∂y))
0 = Ex,y −R(Zx,y − Zx−1,y, Zx,y − Zx,y−1)(6.4)
0 = f(Zx,y)
≈ f(Zn−1x,y ) + (Zx,y − Zn−1
x,y )d
dZx,yf(Zn−1
x,y )(6.5)
When we consider the Zx,y = Znx,y, that is, the depth at n-th iteration, the Equation 6.5
can be rewritten (Equation 6.6) and solved by using the Jacobi iterative method [220],considering an initial estimate of the depth map Z0
x,y = 0.
Znx,y = Zn−1
x,y +− f(Zn−1
x,y )
df(Zn−1x,y )
dZx,y
(6.6)
The reflectance and albedo maps also can be obtained directly from the Equation 6.2.After find the depth map Zn
x,y at point (x, y), the reflectance map can be computed byusing the Equation 6.7, while the albedo map can be found through the Equation 6.8.
R(p, q) = max
(0, ρ
pps + qqs + 1√1 + p2 + q2
)(6.7)
ρ(n)x,y =Ix,y
n(n)x,y · s
(6.8)
6.3.2 Convolutional Neural Network for Learning Intrinsics Sur-face Properties
Convolutional Neural Networks (CNNs) [133] is a well-known machine learning techniquedesigned to learn discriminative features from input data and also a mapping function forclassification purpose. Their ability to learn an efficient and effective representation spacefrom data has been extensively reported by the scientific community, producing impres-sive results in many applications such as object recognition [239], video analysis [185],presentation attack detection [30,162], among others.
Inspired by Menotti et al. [162] and He et al. [95] approaches, our CNN architecture is

152
composed of a variant of SpoofNet followed by one residual block. The original SpoofNetis a shallow CNN architecture composed of two convolutional layers, containing 16 and64 filters, respectively, with a kernel size of 5 × 5. Each convolutional layer is followedby a max-pooling layer, with a kernel size of 3 × 3 and a stride of 2, and by a localnormalization layer with a kernel size of 9× 9.
In contrast to SpoofNet, our new CNN architecture for face presentation attack de-tection is described in Fig.6.2. Essentially, we propose an ensemble of two shallow CNNarchitectures (Fig. 6.2(a) and Fig. 6.2(b)) containing an identity shortcut link used toconnect the output of these two blocks. Finally, we use two dense layers followed by asoft-max classifier with two units (Fig. 6.2(c)).
6.4 Experimental Results
In this section, we present the experimental results of our proposed approach. Section 6.4.1describes the datasets used in the experiments, whereas Section 6.4.2 describes the ex-perimental protocols used to validate our approach. Section 6.4.3 shows the experimentalsetup of the proposed method regarding its parameters, and Sections 6.4.4 and 6.4.5 showthe obtained results using the maps obtained with the shape-from-shading algorithm andfeature learning process. The remaining sections describe the performance results con-sidering the intra- and inter-dataset evaluation protocol and a comparison among theproposed method and other approaches reported in the literature.
6.4.1 Datasets
We evaluated the proposed method in three datasets freely available in the literature forscientific purpose, which is described in details in the following sections:
Replay-Attack dataset
This dataset contains videos of presentation attacks and bona fide presentations of 50
identities, which were recorded with a webcam with a pixel resolution of 320× 240. Thisdataset provides three types of presentation attacks: print-, mobile- and video- attackswith high definition resolution, which were split into three subsets: the training set with360 videos; the development set containing 360 videos; and testing set with 480 videos,totaling 1, 000 videos of presentation attacks and 200 videos of bona fide presentation.
CASIA dataset
This dataset comprises 600 videos of presentation attacks and bona fide accesses of 50
identities. The authors recorded both presentation attack and bona fide presentationvideos in three different qualities: (i) low-quality videos captured by an old USB camerawith 480× 640 pixel resolution; (ii) normal-quality videos, which were recorded by a newUSB camera with 480× 640 pixel resolution; and (iii) high-quality videos captured witha Sony NEX-5 camera with 1, 920 × 1, 080 pixel resolution. The types of presentationattacks contained in this dataset include warped photo attacks, cut photo attacks, photos

153
and video attacks. Finally, this dataset provides 240 videos for training and 360 videosfor testing, totaling 150 videos of bona fide presentations and 450 videos of presentationattacks.
UVAD dataset
This dataset contains bona fide presentation and presentation attack videos of 404 identi-ties, all created at Full HD quality. The videos were recorded in two sections consideringdifferent illumination conditions and environments. In total, this dataset provides 16, 268
presentation attack videos and 808 bona fide presentation videos, which were recordedthrough six acquisition sensors of different manufacturers (Sony, Kodak, Olympus, Nikon,Canon, and Panasonic). The video attacks were simulated with seven different displaydevices, also with HD and Full HD quality. The authors recommend using the videosfrom Sony, Kodak and Olympus sensors for training, and the videos from Nikon, Canonand Panasonic sensors for testing. This evaluation protocol provides 3, 872 for trainingand 6, 416 for testing, totaling 404 bona fide presentation videos and 9, 884 presentationattack videos.
6.4.2 Experimental Protocols
The performance of the proposed method is measuring by using two metrics recommendedby ISO/IEC 30107-3 [106], Attack Presentation Classification Error Rate (APCER) andthe Bona fide Presentation Classification Error Rate (BPCER), wherein the APCERis the proportion of presentation attack incorrectly classified as bona fide presentationsand the BPCER is the proportion of bona fide presentations incorrectly classified aspresentation attack. Although, the ISO/IEC does not define measures that aggregatethese two measures, in this work we additionally use two measures for that, the EqualError Rate (EER) and Half Total Error Rate (HTER), since the evaluation protocol forsome datasets recommends to use them. The EER value is defined by the threshold inthat the APCER and BPCER rates are equals, and the HTER is the average of APCERand BPCER measures computed in a threshold τ , which must be defined in a developmentset.
We evaluated our approach upon the two experimental protocol, the intra- and inter-dataset protocols. In the intra-dataset scenario, we validate the proposed method intoeach dataset separately, and we follow the official protocols defined in each dataset consid-ered in this work. Therefore, the Replay-Attack dataset is comprised of three subsets: thetraining set, which was used to fit a classification model; the development set used to findthe EER threshold; and the test set, which was used only to report the APCER, BPCER,and HTER values. For the datasets composed of two subsets (CASIA and UVAD), weuse the training set to fit a classification model and to find the EER threshold, and thetest set to report the final results in terms of APCER, BPCER, and HTER. We alsoreported the EER value obtained in the test set for the CASIA dataset, as suggested bythe dataset’s authors. In the inter-dataset scenario, we use one dataset for training theproposed method and a a different dataset to test it .

154
6.4.3 Experimental Setup
This section describes the parameter configurations and implementation details of theproposed method for reproducibility purposes of the results presented in this paper.
Regarding the shape-from-shading algorithm used in this work, the only parameterrequired by this algorithm is the light source direction, whose value has been set to coor-dinate (0, 0, 1). Therefore, we considered that the primary light source is perpendicularto the faces during the acquisition, which is a reasonable choose taking into account thedatasets used in our experiments. As the shape-from-shading algorithm works upon im-ages, we subsample the videos to have about 61 frames per video (≈ 2 seconds). Moreover,we apply the shape-from-shading algorithm to each channel of the RGB frames croppedin the face regions, whose locations were provided by the datasets’ authors. Finally, weresize the maps found by the algorithm to (150× 150), which were used to feed the CNNnetworks.
We conducted the training process of the CNN networks using 150 epochs and batchesof 64. We used the Adadelta solver for minimizing the categorical cross-entropy objectivefunction using a learning rate of 1e−2 without the learning decay strategy. Finally, we usean L2 regularization in the soft-max classifier, whose value was configured to 1e−4. Theseeds were pre-defined in order to obtain reproducibility of our results. Finally, the classdecision (bona fide presentation vs. presentation attack) for an input video was takenconsidering the fusion scores of its 61 frames by computing the median. We use the Keras(version 2.1.3) and Tensorflow (version 1.4.1) frameworks 1 to implement the proposedCNN network and the source code of all proposed methods will be freely available 2.
6.4.4 Evaluation of the Proposed CNN Architecture
In this section, we evaluate the CNN network proposed in this work, which was inspired bythe SpoofNet [162], a shallow network designed for the presentation attack problem andby the Residual Networks (ResNet) [95]. Here, we show the effectiveness of the proposedSpoofNet-based residual block for detecting presentation attacks by comparing our CNNnetwork with the SpoofNet and ResNet, besides of Xception network [43], a relative newCNN architecture that outperforms Inception V3 on the ImageNet dataset [133]. Forboth Xception and ResNet networks, we performed a fine-tuning of a pre-trained versiontrained upon the ImageNet dataset since we do not have much data for training themfrom scratch. Thus, after loading the pre-trained weights, we remove the top layer and wefreeze the remain layers to indicate that such layers will not be trained. Thereafter, weadd a fully connected layer with 1, 024 units followed by a soft-max layer with 2 outputs.
Table 6.1 depicts a comparison among these CNN networks for the CASIA dataset us-ing the intra-dataset protocol. Both the SpoofNet and the proposed network outperformsthe ResNet and Xception networks. We believe that shallow networks are more suitablefor the PAD problem due to nature of the patterns to be learned by the networks, whichcame from the artifacts added in the synthetic samples such as blurring, banding effect,
1https://keras.io and https://www.tensorflow.org2The source code will be public and freely available for scientific purposes on GitHub, upon acceptance
of this paper.

155
Moiré patterns, among others. Noticeably, such patterns can be better understood aslow-level features and deeper networks are suitable for learning high-level features suchas part of complex objects.
Table 6.1: Performance results (in %) for the CASIA dataset considering the intra-datasetevaluation protocol.
Architecture Map Type APCER BPCER HTER Mean HTERAlbedo 68.89 68.89 68.89
ResNet Depth 34.81 48.89 41.85 58.21
Reflectance 65.56 62.22 63.89
Albedo 8.52 78.89 43.70
Xception Depth 18.15 55.56 36.85 38.08
Reflectance 29.63 37.78 33.70
Albedo 8.15 14.44 11.30
SpoofNet Depth 14.44 11.11 12.78 11.11
Reflectance 8.52 10.00 9.26
Albedo 6.67 8.89 7.78
Proposed Method Depth 11.11 5.56 8.33 8.64
Reflectance 15.19 4.44 9.81
6.4.5 How to Feed the Proposed CNN Network with the DifferentMaps?
Table 6.2: Performance results (in %) for the Replay-Attack and CASIA datasets consid-ering the intra-dataset evaluation protocol.
Dataset Map Type HTERAlbedo 8.00
Depth 2.62
Replay-Attack Reflectance 3.87
Majority Vote 3.38
Concatenated Maps 3.12
Albedo 7.78
Depth 8.33
CASIA Reflectance 9.81
Majority Vote 5.37
Concatenated Maps 2.41
In this section, we evaluate two strategies to extract meaningful information fromthe different maps using the proposed CNN network. The experiments presented in thissection were performed using the intra-dataset evaluation protocol. The first strategyconsists of training a CNN network for each one of the three types of maps available(albedo, reflectance and depth maps), which give us three CNN-based classifiers. After,

156
the fusion approach based on the majority vote is employed in order to have a final scoreto decide if a testing sample is a presentation attack or a genuine access. The secondapproach consists of giving to the network the concatenated maps in order to have aninput tensor of 150× 150× 9. Table 6.2 shows the obtained results considering these twostrategies.
According to obtained results, the concatenated maps outperforms the majority fusionstrategy with a relative error reduction of 7.69% for the Replay-Attack dataset and morethan 50.0% for the CASIA dataset. Besides of having a significant reduction in theoverall time consuming for providing the final decision score, once we need to train onlyone model, the concatenated maps strategy also facilitate the training of our CNN-basedclassifier. This is because different maps may behave as a data augmentation approachtowards avoiding possible problems regarding over-fitting.
6.4.6 Intra-dataset Evaluation Protocol
In this section, we present the performance results of our approach for the datasets con-sidered in this work. Here, we followed the evaluation protocol defined for each datasetand we also reported the performance results using the metrics suggested by the datasets’authors.
Replay-Attack Dataset
Fig. 6.3 shows the obtained Detection Error Tradeoff (DET) curves for the different mapsobtained by the shape-from-shading algorithm and for the three type of presentationattacks contained in this dataset. The aims of this experiment are investigating thediscriminability of these maps for detecting the different attack types. The results indicatethat mobile-based presentation attacks were the most easily detected by the proposedalgorithm. Considering the depth map (Fig. 6.3(b)), the proposed approach achieved anHTER of 2.62% considering the overall test set and perfect BPCER rates for all attacktypes. Table 6.3 shows the performance results for the network trained using the depthmaps.
Table 6.3: Performance results (in %) for the Replay-Attack dataset considering thepresentation attacks simulations individually.
Attack Type APCER BPCER HTERHight-Def 4.37 0.00 2.19
Mobile 3.12 0.00 1.56
Print 11.25 0.00 5.63
Overall test 5.25 0.00 2.62
CASIA Dataset
Fig. 6.4 illustrates the obtained DET curves considering the different presentation attacksimulations. Here, the network trained with the concatenated maps achieved the best

157
1 2 5 10 20 40APCER (%)
1
2
5
10
20
40
BPCE
R (%
)
DET CurveOverall test setHigh-definition attackMobile attackPrint attack
(a) Albedo maps
1 2 5 10 20 40APCER (%)
1
2
5
10
20
40
BPCE
R (%
)
DET CurveOverall test setHigh-definition attackMobile attackPrint attack
(b) Depth maps
1 2 5 10 20 40APCER (%)
1
2
5
10
20
40
BPCE
R (%
)
DET CurveOverall test setHigh-definition attackMobile attackPrint attack
(c) Reflectance maps
1 2 5 10 20 40APCER (%)
1
2
5
10
20
40
BPCE
R (%
)
DET CurveOverall test setHigh-definition attackMobile attackPrint attack
(d) Concatenated maps
Figure 6.3: Results obtained on Replay-Attack dataset for the three attack types and forthe different maps obtained with the shape-from-shading algorithm.
performance results for all categories of attack present in this dataset. Furthermore, thewarped- and cut-based attacks were detected easier than video-based attempted attacks.We also notice that network trained with the concatenated maps showed a more robustnessto deal with the different types of presentation attack. Table 6.4 shows the error rates forthis network, which achieved an HTER of 2.41%. For the warped attack simulations, weachieved an APCER rate of 0.00%, which means the network detected all warped photoattack simulations.
Table 6.4: Performance results (in %) for the CASIA dataset considering the presentationattacks simulations individually.
Attack Type APCER BPCER HTER EERWarped photo 0.00 3.33 1.67 2.22
Cut photo 1.11 3.33 2.22 3.33
Video 3.33 3.33 3.33 3.33
Overall test 1.48 3.33 2.41 3.33

158
1 2 5 10 20 40APCER (%)
1
2
5
10
20
40
BPCE
R (%
)
DET CurveOverall test setWarped attackCut attackVideo attack
(a) Albedo maps
1 2 5 10 20 40APCER (%)
1
2
5
10
20
40
BPCE
R (%
)
DET CurveOverall test setWarped attackCut attackVideo attack
(b) Depth maps
1 2 5 10 20 40APCER (%)
1
2
5
10
20
40
BPCE
R (%
)
DET CurveOverall test setWarped attackCut attackVideo attack
(c) Reflectance maps
1 2 5 10 20 40APCER (%)
1
2
5
10
20
40
BPCE
R (%
)
DET CurveOverall test setWarped attackCut attackVideo attack
(d) Concatenated maps
Figure 6.4: Results obtained on CASIA dataset for the different attack types and for thedifferent maps obtained with the shape-from-shading algorithm.
UVAD Dataset
In this section, we evaluate the proposed method in a challenging scenario with presen-tation attacks and bona fine presentations, both captured with different sensors, whichis named in the literature as a cross-sensor scenario [265]. Table 6.5 shows the obtainedresults for the different maps, which indicates that network trained using the depth mapsis the most discriminative network for detecting the presentation attack in this dataset.Although the HTER of 14.51% obtained in this dataset is higher than previous datasets,this result is the lowest achieved in the literature as shown in Section 6.4.8.
Table 6.5: Performance results (in %) for the UVAD dataset considering the differentmaps obtained with the shape-from-shading algorithm.
Map Type APCER BPCER HTERAlbedo 24.58 20.00 22.29
Depth 10.68 18.33 14.51
Reflectance 22.07 31.67 26.87
Concatenated Maps 12.40 21.67 17.03

159
6.4.7 Inter-dataset Evaluation Protocol
Here, we present the obtained results for the inter-dataset evaluation protocol, which is themost challenging evaluation protocol nowadays. The difficulty of this evaluation protocolraises up from the fact that we have a training and testing scenarios quite different interms of acquisition sensors, light conditions, and environment (e.g, different background).
Table 6.6 shows the obtained results of the proposed method trained with the CA-SIA dataset and tested upon the other ones. Surprisingly, the proposed method achievedan outstanding performance result for the Replay-attack dataset when we consider onlythe video-based attempted attack videos for training our CNN network, with an HTERof 9.75%. On the other side, our method achieved an APCER, BPCER, and HTER of34.81%, 24.44%, and 29.63%, respectively, by using the Replay-Attack dataset for trainingand the CASIA dataset for testing and considering the reflectance maps. Finally, con-sidering the UVAD dataset for training and the CASIA dataset for testing, the proposedmethod achieved an APCER, BPCER, and HTER values of 66.67%, 12.22%, and 39.44%,respectively, using the depth maps.
Table 6.6: Results (in %) obtained with the cross-dataset protocol considering both pre-sentation attacks simulations individually and the overall test sets of each dataset.
Training Set Testing SetsCASIA Replay-Attack UVAD
APCER BPCER HTER APCER BPCER HTER
Video 10.75 8.75 9.75 57.93 21.67 39.80
Overall 8.25 51.25 29.75 34.79 36.67 35.73
Warped 65.75 27.50 46.62 36.75 30.00 33.38
Cut 92.00 2.50 47.25 58.07 23.33 40.70
Concatenated Maps Depth Maps
6.4.8 Comparison with State-of-the-Art Methods
In this section, we compare the proposed method with other method available in theliterature. We select the most effective CNN networks designed for the PAD problem,include the networks specifically designed to estimate depth maps from the RGB imageswithout using any kind of extra device [11]. We notice that most effective methods thattake into account the intra-dataset evaluation protocol achieved poor performance resultsin the inter-dataset protocol, as shown in Table 6.7. The proposed method achieved thelowest HTER for the inter-dataset protocol and competitive results for the intra-datasetevaluation protocol, which demonstrates the potential of the proposed method. Consid-ering the complexity of the existing networks, i.e. the number of convolutional layers,the proposed CNN architecture provides a reasonable trade-off between performance andhardware requirement, which can be directly translated into memory consumption andtraining timing of the network.

160
Table6.7:
Com
parisonam
ongtheexisting
CNN-based
metho
dsconsideringtheintra-
andinter-ba
sedevalua
tion
protocolsfortheda
tasets
considered
inthis
work.Method
sIntra-Dataset
Protocol
Inter-Dataset
Protocol
Rep
lay-Attack
CASIA
UVAD
Rep
lay-Attack
CASIA
UVAD
HTER
EER
HTER
HTER
HTER
HTER
HTER
Liet
al.[14
2](F
ine-tunedVGG-Face)
4.30
5.20
−−
−−
−Li
etal.[14
2](D
PCNN)
6.10
4.50
−−
−−
−Atoum
etal.[11
](Patches
andDepth-B
ased
CNNs)
0.72
2.67
2.27
−−
−−
Menottiet
al.[16
2](A
rchitectureOptim
ization)
0.75
−−
−−
−−
Liet
al.[14
3](H
ybridCNNs)
1.60
2.20
−−
−−
−Pinto
etal.[19
2](F
ine-tunedVGG
netw
ork)
0.00
−6.
67−
49.7
247.1
6−
Yan
get
al.[26
9](F
ine-tunedAlexN
et)
2.68
−6.
2541.3
642.0
4−
Patel
etal.[18
0](G
oogL
eNet
+Eye-B
linkDetection
)0.
50−
−12.4
031.6
0−
Propo
sedMetho
d3.
123.
332.
4114.5
19.75
29.63
33.3
8

161
6.4.9 Visual Assessment
In this section, we show a visual assessment of the albedo, reflectance, and depth mapsgenerated by the Tsai’s algorithm, the shape-from-shading algorithm used in this work.Fig. 6.5 depicts these maps computed from a bona fide presentation and from a presen-tation attack video frame. These examples illustrate how the artifacts affect the recon-struction of the surface, specially, in this example, of the depth and reflectance maps.We believe that the way how the Tsai’s algorithm computes the depth might improve thehighlighting of the artifacts present in the presentation attack images. As mentioned inthe Section 6.3.1, this method performs the estimation of the depth locally, which meansthat each point (x, y) is reconstructed interdependently. When the algorithm tries tocompute the first and second order derivative of outliers (e.g., noise or printing artifact),we came up with a situation where the approximation could not be applied, which pro-duces the white spots in the reconstructed maps. Moreover, the first and second orderderivative computations can potentially highlight the printing artifacts, i.e., horizontaland vertical lines. Fig. 6.4.9 shows the details of the reconstructed surface considering avideo frame of both classes of the PAD problem, in which we evidence natural pattern forthe genuine access (e.g., skin roughness) and synthetic patterns for presentation attackimage (e.g., horizontal and vertical lines).
(a) Original frame (b) Depth map (c) Reflectance map (d) Albedo map
(e) Original frame (f) Depth map (g) Reflectance map (h) Albedo map
Figure 6.5: Example of a bona fide presentation video frame (first line) a presentationattack video frame (second line). First column illustrate original frames captured by theacquisition sensor, whereas the other columns show their respective maps.

162
(a) Reconstructed surface of the nose region of abona fide presentation
(b) Reconstructed surface of the nose region of apresentation attack
Figure 6.6: Details of the reconstructed surface for the video frames showed in Fig. 6.5from a genuine access (a) and an attempted attack (b), in which we found strong evidenceof a natural (skin roughness) texture pattern and of a synthetic (horizontal and verticallines) texture pattern for these respective classes.
6.5 Conclusion and Future Work
In this paper, we proposed an algorithm for detecting presentation attacks based onintrinsic properties of the scene such as albedo, reflectance, and depth of the scene. Weshowed that these properties are useful for detecting different types of presentation attackswith satisfactory results in terms of error rates. We also proposed a novel CNN networkspecially designed for learning features from these different maps. The ability of CNNnetworks in learning from data was crucial for our method to achieve the reported results,since the hand-crafting feature engineering of these different maps could take much workeffort.
The experimental results corroborated the effectiveness of our CNN networks trainedusing these different maps. Particularly, the network trained with the depth maps andwith the concatenated maps presented a more robustness for detecting presentation at-tacks taken into account the inter-dataset evaluation protocol. For the intra-dataset eval-uation protocol, the depth map achieved the best performance results for the UVAD andReplay-Attack datasets, whereas the concatenated maps achieved the best performanceresults for the CASIA dataset. We believe there could be some complementarity betweenthese maps, which would allow our CNN network to learn good features and deal withthis complex dataset that contains several kinds of photo and video presentation attacks.
Unquestionably, the inter-dataset evaluation protocol was the hardest scenario forthe proposed method, even considering the cross-sensor scenario, in which we achievedbetter results than the state-of-the-art, as confirmed through the results obtained forthe UVAD dataset. We believe our work could help the community to have a betterunderstanding about this challenging problem, since the proposed method was able tospot strong evidences of presentation attacks considering the photographs- and video-based attempted attacks in the reconstructed surface of the faces.
Future research efforts include the investigation of alternative approaches to combiningthe albedo, reflectance, and depth maps toward extracting complementary patterns. Thisis useful for detecting presentation attacks, as well as the investigation of new approachesto recovering the surface properties from shading by taking into account a reflectancemodel more suitable for our problem, such as Bidirectional reflectance distribution func-tion (BRDF). The study of methods for finding the light source detection that operate in

163
a real scenario (not with synthetic images) could also be a promising investigation pathtoward improving the facial surface reconstruction.
164
Chapter 7
Conclusions and Future Work
“Take delight in the Lord, and he will give you the desires of your heart.”—Bible, Psalm 37:4
“In questions of science, the authority of a thousand is not worth the humblereasoning of a single individual.”
—Galileo Galilei, Italian astronomer, mathematician, physicist, philosopher andprofessor (1564–1642)
“Science knows only one commandment – contribute to science.”—Bertolt Brecht, German theatre practitioner, playwright, and poet (1898–1956)
7.1 Final Remarks
IN this thesis, we proposed a set of algorithms and methodologies for detecting pre-sentation attacks in biometric systems based on face, iris, and fingerprint traits. The
hypotheses presented in Chapter 1 were investigated throughout the other chapters,where we also showed the specific contributions achieved in each work and a discussionregarding the visual assessments of the main approaches presented in this thesis.
The results presented in Chapters 2 and 3 corroborate the Hypothesis 1 in whichwe showed strong evidences of how artifacts affect frequency components of the Fourierspectrum. The Fourier analysis was a powerful tool to recognize strong evidences of theseartifacts and our proposed method for collecting such evidences presented results superiorto or competitive with traditional image analysis approaches, such as texture and motionanalyses. Moreover, the modeling of artifacts collected over time described in Chapter 3demonstrated to be a more effective approach than the visual rhythm-based techniques,presented in Chapter 2.
Regarding the Hypothesis 2, we showed that supervised feature learning techniquesbased on Convolutional Neural Networks (CNN) were able to learn meaningful telltales

165
of presentation attacks for different modalities and attack types. In Chapter 4, wepresented performance results of two methodologies for building convolutional networks,architecture optimization and filter optimization. The architecture optimization method-ology was used to investigate a set of shallow CNN architectures, i.e., number of convolu-tional layers ranging from one to three, whose weights were randomly defined through auniform distribution. On the other hand, the filter optimization was used to investigatethe behavior of these shallow CNNs when operating with filter weights defined throughthe back-propagation mechanism. The results achieved in this work suggest us that theinterplay between these two approaches is a promising strategy for deploying CNN archi-tecture for the PAD problem, which led us to build a promising convolutional network,the SpoofNet, which has inspired several other studies in the literature. In Chapter 5, wedesigned a methodology to use deep neural networks to distinguish presentation attacksfrom bona fide presentations, in different modalities. Our methodology empowered thenetworks to deal with the small datasets available to our problem and learn useful featuresfor detecting attempted attacks in the intra-dataset scenario. Additionally, we showed,in Chapter 5, the limitations of deep architectures for operating in the inter-datasetscenario. The weakness of deep neural networks for modeling the phenomenon related tothe problem from the original image space sharpened our understanding of how to buildflexible convolutional neural networks taking into account other properties inferred fromthe original data.
The findings achieved in Chapters 2 and 3, in which we presented two featureengineering solutions (named “hand-crafted” solutions), and in Chapters 4 and 5, inwhich we presented different approaches based on representation learning (named “data-driven” solutions), have turned our attention for possibilities of how to harmoniously mixthese two approaches in an attempt of taking the best of both approaches.
Lastly, in Chapter 6, we presented a novel approach to face PAD based on intrinsicproperties of face surfaces reconstructed via shape-from-shading technique (i.e., albedo,reflectance and depth information). Furthermore, we designed a novel shallow CNN ar-chitecture suitable for learning meaningful telltales of presentation attacks from the esti-mations of these properties. This solution presented outstanding results considering thecross-sensor and inter-dataset scenarios, corroborating the Hypothesis 4. In this work,we presented a new perspective to deal with the problem by looking more closely intothe surface properties of the skin surface, for the bona fide presentations, and syntheticmaterials such as printed photographs and device screens, for the presentation attacks.The results achieved in this work corroborate the Hypothesis 3, which give us new per-spectives of dealing with the PAD problem since this proposed method reaches the bestperformance results even considering challenging evaluation protocol and scenarios.
7.2 Directions for Future Work
We believe that the guidelines presented in this thesis have contributed to research com-munity by providing a better understanding of how artifacts affect biometric samples andby proposing new methods for capturing patterns and nuances related to these artifacts.

166
Directions for future research include investigations of methods that better quantifydifferent artifacts added during the manufacture and recapture of synthetic samples. Thedesign of methods capable of quantifying the artifacts separately can also yield improve-ments to detect attempted attacks, since such artifacts may change in magnitude overtime, mainly due to the interaction between the acquisition sensor and the presentationattack instruments.
During our investigations, we noticed that we might have cases where artifacts canpotentially cancel each other. For instance, the blurring effect caused by sensor defocuscan decrease the amount of flicking or banding effects. Therefore, we believe that thedesign of algorithms to quantify these artifacts individually and over time has muchpotential to achieve good results, even in cross-sensor and data-set scenarios.
On the other hand, the proposed method based on the intrinsic properties of facialsurfaces can be improved by using modeling that better describes facial skin spectropho-tometry, such as the bidirectional reflectance distribution function [57]. In addition, theinvestigation of methods capable of accurately estimating the light source direction canalso improve the detection rates in the cross-sensor and inter-dataset scenarios in whichwe have a test environment (e.g., illumination conditions) different from the trainingenvironment.
Finally, we believe that the combination of methods and algorithms introduced in thisthesis, toward exploring their possible complementarity, is a promising investigation lineto build robust detectors. In this direction, the visual rhythm introduced in Chapter 2could be used to feed the CNN networks proposed in Chapters 4, 5, and 6 towardbuilding robust PAD solutions. Another promising investigation path to improve thealgorithms and methodologies presented in this thesis is the adoption of patch-basedanalysis [11], mainly CNN-based methods that usually require a greater amount of dataduring the training phase.
7.3 Other Applications to Algorithms Presented in thisThesis
In this section, we present some possible applications in digital forensics that could takeadvantage of the algorithms presented in this thesis along with techniques developed forsolving other problem that could be explored toward improving our algorithms.
7.3.1 Detection of (Illegal) Copyrighted Video Recapture
The recapture detection problem of digital media in general can also benefit from algo-rithms and techniques developed in this research. This is a topic of interest of the videoforensics research field, which is growing active, since recapture is often an indicator oftampering activities [163,215].
Visentini-Scarzanella et al. [256] proposed a method to detect the recapture of videosbased on deformations of the objects in recaptured images. The authors used lens radialdistortion models [7] to extract features that are used in a threshold-based classification

167
scheme. Bestagini et al. [23] proposed a method to detect recaptured images, based on theanalysis of ghosting artifacts, which are added to the images during the recapture process.The authors proposed a ghosting artifact detector based on the analysis of peaks at high-frequencies, in the frequency domain. The authors evaluated the proposed approach in adataset composed of 18 videos (nine originals and nine recaptured), in which the authorsreported an accuracy of 91%.
In recent works, Thongkamwitoon et al. [247, 248] proposed an approach to detectrecaptured images based on learned edge blurriness using the K-singular value decom-position (K-SVD) approach [1] to learn dictionaries using edge-based features, besidespresenting an anti-forensic technique to the our previous work [193], which was designedto detect video-based face spoofing attacks based on cues such as Moiré patterns andaliasing artifacts.
In conclusion, the methods for recapture detection hereby presented aim at modelingartifacts added to the signal during the recapture process. This line of investigationmatches with our works presented in Chapters 2 and 3, and further investigationsregarding the applicability of algorithms and techniques presented in this thesis could beperformed, aiming at possible contributions in this research field as well.
7.3.2 Image Tampering Detection
The image manipulation detection problem is another topic in digital forensic researchfield that can also benefit from the developed algorithm presented in Chapter 6, orvice-versa. The analysis of intrinsic properties of light is a great source of inspiration forseveral algorithms and techniques for detecting image tampering, especially, splicing andcopy-move manipulation [54,212,213]. Riess et al. [212] presented a method for detectingimage manipulation, namely intrinsic contour estimation, that use the reflectance mapcomputed by the algorithms proposed in [78,231] to normalize the images under analysisand so exposing the manipulated candidate regions. Carvalho et al. [54] and Riess [213]proposed algorithms for detecting image tampering based on intrinsic properties of lightpresent in a digital photography under analysis considering the dichromatic reflectancemodel [230], which are more suitable for computing intrinsic properties of human skinand, therefore, the algorithm presented in Chapter 6 could be improved by using thisreflectance model.
7.4 Publications During this Doctoral Research
The results obtained during the doctoral period were published in important scientificcommunication vehicles dedicated to academic and scientific communities related to digi-tal forensics, biometrics and image analysis. We divided the publications into related andnon-related with the thesis subject:
Publications Related with the Thesis Subject
1. Using visual rhythms for detecting video-based facial spoof attacks
168
We presented this work in Chapter 2, which was published in a peer-reviewedJournal, with an impact factor of 5.824;
Reference
Pinto, A., W. Robson Schwartz, H. Pedrini, and A. de Rezende Rocha. Using visual
rhythms for detecting video-based facial spoof attacks. IEEE Transactions on Information
Forensics and Security (T-IFS), 10(5):1025–1038, May 2015
2. Face Spoofing Detection Through Visual Codebooks of Spectral Temporal CubesWe discussed about this work in Chapter 3 and it was also published in a peer-reviewed Journal, with an impact factor of 5.071;
Reference
Pinto, A., H. Pedrini, W. Robson Schwartz, and A. Rocha. Face spoofing detection through
visual codebooks of spectral temporal cubes. IEEE Transactions on Image Processing (T-
IP), 24(12):4726–4740, Dec 2015
3. Deep Representations for Iris, Face, and Fingerprint Spoofing DetectionWe presented this work in Chapter 4 and it was published in a peer-reviewedJournal, with an impact factor of 5.824. Especially, my personal contributionsfor this work include: (1) implementation and execution of experiments involv-ing face and fingerprint modalities; (2) contributions with ideas toward improvingthe performance results of the method during the experiments, based on exper-tise acquired in our previous works; and (3) article writing and execution of extraexperiments during the revisions;
Reference
D. Menotti, G. Chiachia, Pinto, A., W. Robson Schwartz, H. Pedrini, A. Xavier Falcao,
and A. Rocha. Deep representations for iris, face, and fingerprint spoofing detection. IEEE
Transactions on Information Forensics and Security (T-IFS), 10(4):864–879, April 2015
4. Counteracting Presentation Attacks in Face Fingerprint and Iris RecognitionWe presented this work in Chapter 5, which was published in as a Book Chapter.Especially, my personal contributions for this work include : (1) ideas in attempt ofimproving the performance results of the method during the experiments, based onexpertise acquired in our previous works; (2) article writing and text revision. Theexperiments were performed by the undergraduate students Michael Krumdick andBenedict Becker. This work was developed during my one-year doctoral internshipat the University of Notre Dame, USA;
169
Reference
Allan Pinto, Helio Pedrini, Michael Krumdick, Benedict Becker, Adam Czajka, Kevin W.
Bowyer, and Anderson Rocha. Deep Learning in Biometrics, chapter Counteracting Pre-
sentation Attacks in Face Fingerprint and Iris Recognition, page 49. CRC Press, 2018
5. Leveraging Shape, Reflectance and Albedo from Shading for Face Presentation AttackDetectionWe presented this work in Chapter 6 and it was submitted in a peer-reviewedJournal, with an impact factor of 7.982;
Reference
Allan Pinto, Siome Goldenstein, Alexandre Ferreira, Tiago Carvalho, Helio Pedrini, and
Anderson Rocha. Leveraging shape, reflectance and albedo from shading for face presen-
tation attack detection. IEEE Transactions on Neural Networks and Learning Systems
(T-NNLS), pages 1–11, 2018 (submitted)
6. Ensemble of Multi-View Learning Classifiers for Cross-Domain Iris PresentationAttack DetectionThis work does not appear in this thesis, but was partially inspired by the workdiscussed in Chapter 4 and it was published in a peer-reviewed Journal, withan impact factor of 5.824. Especially, my personal contributions for this workinclude: (1) implementation, execution of experiments, and suggestions of exper-imental protocols involving the meta-classification step; (2) Adjusts of SpoofNetarchitecture (Chapter 4) to learn artifacts related to iris presentation attack de-tection problem from Binarized statistical image feature (BSIF) maps [114], insteadof raw data; (3) contributions with ideas toward improving the performance resultsof the method during the experiments, based on expertise acquired in our previousworks; and (4) writing and revision of the article. This work was partially developedduring my one-year doctoral internship at the University of Notre Dame, USA;
Reference
A. Kuehlkamp, A. Pinto, A. Rocha, K. W. Bowyer, and A. Czajka. Ensemble of multi-view
learning classifiers for cross-domain iris presentation attack detection. IEEE Transactions
on Information Forensics and Security (T-IFS), pages 1–13, 2018 (To appear)
Publications Non-Related with the Thesis Subject
7. Provenance filtering for multimedia phylogenyThis work does not appear in this thesis and it was published in a peer-reviewedIntl. Conference. This work was developed during my one-year doctoral intern-ship at the University of Notre Dame, USA;
170
Reference
A. Pinto, D. Moreira, A. Bharati, J. Brogan, K. Bowyer, P. Flynn, W. Scheirer, and
A. Rocha. Provenance filtering for multimedia phylogeny. In IEEE International Conference
on Image Processing (ICIP), pages 1502–1506, Sept 2017
8. Spotting the difference: Context retrieval and analysis for improved forgery detectionand localizationThis work does not appear in this thesis and it was published in a peer-reviewedIntl. Conference. This work was developed during my one-year doctoral intern-ship at the University of Notre Dame, USA;
Reference
J. Brogan, P. Bestagini, A. Bharati, A. Pinto, D. Moreira, K. Bowyer, P. Flynn, A. Rocha,
andW. Scheirer. Spotting the difference: Context retrieval and analysis for improved forgery
detection and localization. In IEEE International Conference on Image Processing (ICIP),
pages 4078–4082, Sept 2017
9. U-Phylogeny: Undirected provenance graph construction in the wildThis work does not appear in this thesis and it was published in a peer-reviewedIntl. Conference. This work was developed during my one-year doctoral intern-ship at the University of Notre Dame, USA;
Reference
A. Bharati, D. Moreira, A. Pinto, J. Brogan, K. Bowyer, P. Flynn, W. Scheirer, and
A. Rocha. U-phylogeny: Undirected provenance graph construction in the wild. In IEEE
International Conference on Image Processing (ICIP), pages 1517–1521, Sept 2017
10. Image Provenance Analysis at ScaleThis work does not appear in this thesis and it was published in a peer-reviewedJournal, with an impact factor of 5.071. This work was partially developedduring my one-year doctoral internship at the University of Notre Dame, USA;
Reference
D. Moreira, A. Bharati, J. Brogan, A. Pinto, M. Parowski, K. W. Bowyer, P. J. Flynn,
A. Rocha, and W. J. Scheirer. Image provenance analysis at scale. IEEE Transactions on
Image Processing (T-IP), 27(12):6109–6123, Dec 2018
Publications by Type of the Scientific Communication Vehicle
Peer-Reviewed Journal . . . . . . . . . . . . . . . . . . . . . . . . . . . . . . . . . . . . . . . . . . . . . . . . . . . . . . . . . 6
Book Chapters . . . . . . . . . . . . . . . . . . . . . . . . . . . . . . . . . . . . . . . . . . . . . . . . . . . . . . . . . . . . . . . . . 1
Papers in Proceedings of Peer-Reviewed Conferences . . . . . . . . . . . . . . . . . . . . . . . . . . . .3

171
7.5 Source Code Available Along with this Thesis
The dataset and source codes of the algorithms and methodologies presented in this thesisare freely and publicly available on GitHub 1 2 and Reasoning for Complex Data (RE-COD) laboratory 3 websites. Please do not hesitate to contact me ([email protected])if you have any trouble or questions about using these codes.
Table 7.1: Source code developed during this thesis and freely available for reproducibilitypurposes.
Technique SourceUVAD dataset (Chapter 2) https://tinyurl.com/ho3ozhxVisual Rhythms (Chapter 2) https://github.com/allansp84/visualrhythm-antispoofingSpectral Cubes (Chapter 3) https://github.com/allansp84/spectralcubesSpoofNet (Chapter 4) https://github.com/allansp84/simple-hp
† These links were visited on November 6th, 2018.
1http://repo.recod.ic.unicamp.br/public/projects2https://github.com/allansp843http://recod.ic.unicamp.br

172
Bibliography
[1] M. Aharon, M. Elad, and A. Bruckstein. k -svd: An algorithm for designing over-complete dictionaries for sparse representation. IEEE Transactions on Signal Pro-cessing (TSP), 54(11):4311–4322, November 2006.
[2] T. Ahonen, A. Hadid, and M. Pietikäinen. Face recognition with local binary pat-terns. In European Conference on Computer Vision, pages 469–481, 2004.
[3] Zahid Akhtar, Giorgio Fumera, Gian Luca Marcialis, and Fabio Roli. Robustnessevaluation of biometric systems under spoof attacks. In International Conferenceon Image Analysis and Processing, pages 159–168, 2011.
[4] Zahid Akhtar, Giorgio Fumera, Gian Luca Marcialis, and Fabio Roli. Evaluationof serial and parallel multibiometric systems under spoofing attacks. In IEEE In-ternational Conference on Biometrics: Theory Applications and Systems, pages 283–288, September 2012.
[5] Nizar Almoussa. Variational retinex and shadow removal. Technical report, Uni-versity of California, Department of Mathematics, 2009.
[6] Jonathan Alon, V. Athitsos, Quan Yuan, and S. Sclaroff. A unified framework forgesture recognition and spatiotemporal gesture segmentation. IEEE Transactionson Pattern Analysis and Machine Intelligence, 31(9):1685–1699, Sept 2009.
[7] L. Alvarez, L. Gómez, and J.R. Sendra. An algebraic approach to lens distortion byline rectification. Journal of Mathematical Imaging and Vision (JMIV), 35(1):36–50, September 2009.
[8] A. Anjos and S. Marcel. Counter-measures to photo attacks in face recognition:A public database and a baseline. In IEEE International Joint Conference onBiometrics, pages 1–7, October 2011.
[9] André Anjos, Laurent El-Shafey, Roy Wallace, Manuel Günther, Christopher Mc-Cool, and Sébastien Marcel. Bob: A free signal processing and machine learningtoolbox for researchers. In ACM Conference on Multimedia Systems, pages 1449–1452, New York, NY, USA, 2012. ACM.
[10] C. Arthur. iPhone 5S fingerprint sensor hacked by germany’s chaos computer club.http://tinyurl.com/pkz59rg, September 2013. Accessed: 2016/02/20.
[11] Y. Atoum, Y. Liu, A. Jourabloo, and X. Liu. Face anti-spoofing using patch anddepth-based cnns. In IEEE International Joint Conference on Biometrics, pages319–328, October 2017.
[12] S. Avila, N. Thome, M. Cord, E. Valle, and A. de A Araujo. Bossa: Extendedbow formalism for image classification. In IEEE International Conference on ImageProcessing, pages 2909–2912, September 2011.
[13] Wei Bao, Hong Li, Nan Li, and Wei Jiang. A liveness detection method for face
173
recognition based on optical flow field. In International Conference on Image Anal-ysis and Signal Processing, pages 233–236, April 2009.
[14] Andy Beach. Real world video compression. Peachpit Press, Berkeley, CA, USA,first edition, 2008.
[15] J. Bergstra, R. Bardenet, Y. Bengio, and B. Kégl. Algorithms for hyper-parameteroptimization. In Advances in Neural Information Processing Systems (NIPS), pages2546–2554, 2011.
[16] J. Bergstra and Y. Bengio. Random search for hyper-parameter optimization. Jour-nal of Machine Learning Research (JMLR), 13:281–305, 2012.
[17] J. Bergstra, D. Tamins, and N. Pinto. Hyperparameter optimization for convolu-tional vision architecture, 2013.
[18] James Bergstra and Yoshua Bengio. Random search for hyper-parameter optimiza-tion. Journal of Machine Learning Research, 13:281–305, 2012.
[19] James Bergstra, Olivier Breuleux, Frédéric Bastien, Pascal Lamblin, Razvan Pas-canu, Guillaume Desjardins, Joseph Turian, David Warde-Farley, and Yoshua Ben-gio. Theano: a CPU and GPU math expression compiler. In The Python forScientific Computing Conference (SciPy), 2010.
[20] James Bergstra, Dan Yamins, and David D. Cox. Making a Science of Model Search:Hyperparameter Optimization in Hundreds of Dimensions for Vision Architectures.In International Conference on Machine Learning, 2013.
[21] James S. Bergstra, Rémi Bardenet, Yoshua Bengio, and Balázs Kégl. Algorithmsfor hyper-parameter optimization. In J. Shawe-Taylor, R. S. Zemel, P. L. Bartlett,F. Pereira, and K. Q. Weinberger, editors, Advances in Neural Information Process-ing Systems (NIPS), pages 2546–2554. Curran Associates, Inc., 2011.
[22] P. Bestagini, M. Visentini-Scarzanella, M. Tagliasacchi, P. L. Dragotti, andS. Tubaro. Video recapture detection based on ghosting artifact analysis. In IEEEInternational Conference on Image Processing, pages 4457–4461, September 2013.
[23] P. Bestagini, M. Visentini-Scarzanella, M. Tagliasacchi, P. L. Dragotti, andS. Tubaro. Video recapture detection based on ghosting artifact analysis. In IEEEInternational Conference on Image Processing, pages 4457–4461, September 2013.
[24] S. Bharadwaj, T.I. Dhamecha, M. Vatsa, and R. Singh. Computationally efficientface spoofing detection with motion magnification. In IEEE Computer Society Con-ference on Computer Vision and Pattern Recognition Workshops, pages 105–110,June 2013.
[25] B. Biggio, Z. Akhtar, G. Fumera, G.L. Marcialis, and F. Roli. Security evaluationof biometric authentication systems under real spoofing attacks. IET Biometrics,1(1):11 –24, March 2012.
[26] B. Biggio, Z. Akthar, G. Fumera, G.L. Marcialis, and F. Roli. Robustness of multi-modal biometric verification systems under realistic spoofing attacks. In IEEEInternational Conference on Biometrics: Theory Applications and Systems, pages1–6, October 2011.
[27] Z. Boulkenafet, J. Komulainen, Xiaoyi Feng, and A. Hadid. Scale space textureanalysis for face anti-spoofing. In IAPR International Conference on Biometrics,pages 1–6, June 2016.

174
[28] Z. Boulkenafet, J. Komulainen, and A. Hadid. Face anti-spoofing based on colortexture analysis. In IEEE International Conference on Image Processing, pages2636–2640, September 2015.
[29] Z. Boulkenafet, J. Komulainen, and A. Hadid. Face spoofing detection usingcolour texture analysis. IEEE Transactions on Information Forensics and Secu-rity, 11(8):1818–1830, August 2016.
[30] Zinelabidine Boulkenafet, Jukka Komulainen, Zahid Akhtar, and Abdenour Hadidet al. A competition on generalized software-based face presentation attack detectionin mobile scenarios. In IEEE International Joint Conference on Biometrics, pages688–696, October 2017.
[31] Y.-L. Boureau, F. Bach, Y. LeCun, and J. Ponce. Learning mid-level features forrecognition. In IEEE International Conference on Computer Vision and PatternRecognition, pages 2559–2566, June 2010.
[32] K.W. Bowyer and J.S. Doyle. Cosmetic contact lenses and iris recognition spoofing.Computer, 47(5):96–98, 2014.
[33] I. R. Buhan and P. H. Hartel. The state of the art in abuse of biometrics. Tech-nical Report TR-CTIT-05-41, Centre for Telematics and Information TechnologyUniversity of Twente, Enschede, September 2005.
[34] P. Campisi. Security and Privacy in Biometrics, chapter Security and Privacy inBiometrics: Towards a Holistic Approach, pages 1–23. Springer, London, 2013.
[35] E.H. Carazzai. Paranaguá Harbor employees used silicone fingers to circumnventbiometric system in Paraná. http://tinyurl.com/hkoj2jg, February 2014. Ac-cessed: 2016/02/20.
[36] M.M. Chakka, A. Anjos, S. Marcel, Tronci, and et al. Competition on CounterMeasures to 2-D Facial Spoofing Attacks. In IEEE International Joint Conferenceon Biometrics, pages 1–6, 2011.
[37] C.-C. Chang and C.-J. Lin. LIBSVM: a library for support vector machines. ACMTransactions on Intelligent Systems and Technology, 2(3):1–27, 2011.
[38] Chih-Chung Chang and Chih-Jen Lin. LIBSVM: A Library for Support VectorMachines. ACM Transactions on Intelligent Systems and Technology, 2:27:1–27:27,2011.
[39] Mo Chen, Jessica Fridrich, Jan Lukáš, and Miroslav Goljan. Imaging sensor noiseas digital x-ray for revealing forgeries. In Teddy Furon, François Cayre, GwenaëlDoërr, and Patrick Bas, editors, Information Hiding, volume 4567 of Lecture Notesin Computer Science, pages 342–358. Springer Berlin Heidelberg, 2007.
[40] Giovani Chiachia. Hyperparameter Optimization made Simple, 2014.[41] I. Chingovska, A. Anjos, and S. Marcel. On the effectiveness of local binary patterns
in face anti-spoofing. In International Conference of the Biometrics Special InterestGroup, pages 1 –7, September 2012.
[42] I. Chingovska, J. Yang, Z. Lei, and D. et al. Yi. The 2nd Competition on CounterMeasures to 2D Face Spoofing Attacks. In IAPR International Conference on Bio-metrics, pages 1–6, June 2013.
[43] Francois Chollet. Xception: Deep learning with depthwise separable convolutions.In IEEE International Conference on Computer Vision and Pattern Recognition,

175
July 2017.[44] Seong Soo Chun, Hyeokman Kim, Kim Jung-Rim, Sangwook Oh, and Sanghoon
Sull. Fast text caption localization on video using visual rhythm. In Shi-KuoChang, Zen Chen, and Suh-Yin Lee, editors, Recent Advances in Visual InformationSystems, pages 259–268, Berlin, Heidelberg, 2002. Springer Berlin Heidelberg.
[45] M.-G. Chung, J. Lee, H. Kim, S. M.-H. Song, and W.-M. Kim. Automatic VideoSegmentation based on Spatio-Temporal Features. Korea Telecom (KT), 1(4):4–14,1999.
[46] D. Ciresan, U. Meier, J. Masci, and J. Schmidhuber. Multi-column deep neuralnetwork for traffic sign classification. Neural Networks, 20(1), 2012.
[47] D. C. Ciresan, U. Meier, L. M. Gambardella, and J. Schmidhuber. Deep big simpleneural nets for handwritten digit recognition. Neural Computation, 22(12):3207–3220, 2010.
[48] R. L. Cook and K. E. Torrance. A reflectance model for computer graphics. ACMTransactions on Graphics, 1(1):7–24, January 1982.
[49] Catherine C. Cooksey, David W. Allen, and Benjamin K. Tsai. Reference data set ofhuman skin reflectance. Journal of Research of the National Institute of Standardsand Technology, 122:1–5, 2017.
[50] Corinna Cortes and Vladimir Vapnik. Support-vector networks. Machine Learning,20(3):273–297, September 1995.
[51] A. Czajka. Database of iris printouts and its application: Development of livenessdetection method for iris recognition. In Int. Conference on Methods and Models inAutomation and Robotics (ICMMAR), pages 28–33, August 2013.
[52] A. Czajka. Pupil dynamics for iris liveness detection. IEEE Transactions on Infor-mation Forensics and Security, 10(4):726–735, April 2015.
[53] Adam Czajka. Iris liveness detection by modeling dynamic pupil features. InKevin W. Bowyer and Mark J. Burge, editors, Handbook of Iris Recognition, pages439–467. Springer London, London, 2016.
[54] T. J. d. Carvalho, C. Riess, E. Angelopoulou, H. Pedrini, and A. d. R. Rocha. Expos-ing digital image forgeries by illumination color classification. IEEE Transactionson Information Forensics and Security, 8(7):1182–1194, July 2013.
[55] Congxia Dai, Yunfei Zheng, and Xin Li. Pedestrian detection and tracking in in-frared imagery using shape and appearance. Computer Vision and Image Under-standing, 106(2):288–299, 2007. Special issue on Advances in Vision Algorithms andSystems beyond the Visible Spectrum.
[56] N. Dalal and B. Triggs. Histograms of oriented gradients for human detection.In IEEE International Conference on Computer Vision and Pattern Recognition,volume 1, pages 886–893, June 2005.
[57] Kristin J. Dana, Bram van Ginneken, Shree K. Nayar, and Jan J. Koenderink.Reflectance and texture of real-world surfaces. ACM Transactions on Graphics,18(1):1–34, January 1999.
[58] J. Daugman. Iris recognition and anti-spoofing countermeasures. In InternationalBiometrics Conference, 2004.
[59] J.G. Daugman. High confidence visual recognition of persons by a test of statistical
176
independence. IEEE Transactions on Pattern Analysis and Machine Intelligence,15(11):1148–1161, 1993.
[60] J.G. Daugman. Recognizing persons by their iris patterns. In Anil Jain, Ruud Bolle,and Sharath Pankanti, editors, Biometrics: Personal Identification in NetworkedSociety, pages 103–121. Kluwer Academic Publishers, 1999.
[61] John G. Daugman. Uncertainty relation for resolution in space, spatial frequency,and orientation optimized by two-dimensional visual cortical filters. J. Opt. Soc.Am. A, 2(7):1160–1169, Jul 1985.
[62] M. De Marsico, M. Nappi, D. Riccio, and J. Dugelay. Moving face spoofing detectionvia 3d projective invariants. In IAPR International Conference on Biometrics, pages73 –78, April 2012.
[63] J. Doyle and K.W. Bowyer. Notre dame image dataset for contact lens detection iniris recognition, 2014. last access on June 2014.
[64] J.S. Doyle, K.W. Bowyer, and P.J. Flynn. Variation in accuracy of textured contactlens detection based on sensor and lens pattern. In IEEE International Conferenceon Biometrics: Theory Applications and Systems, pages 1–7, 2013.
[65] N. Erdogmus and S. Marcel. Spoofing 2D face recognition systems with 3D masks.In International Conference of the Biometrics Special Interest Group, pages 1–8,2013.
[66] N. Erdogmus and S. Marcel. Spoofing in 2D face recognition with 3D masks andanti-spoofing with kinect. In IEEE International Conference on Biometrics: TheoryApplications and Systems, pages 1–6, September 2013.
[67] N. Erdogmus and S. Marcel. Spoofing face recognition with 3d masks. IEEE Trans-actions on Information Forensics and Security, 9(7):1084–1097, July 2014.
[68] J. Fierrez-Aguilar, J. Ortega-garcia, D. Torre-toledano, and J. Gonzalez-rodriguez.Biosec baseline corpus: A multimodal biometric database. Pattern Recognition,40:1389–1392, 2007.
[69] Tiago Freitas Pereira, Jukka Komulainen, Andre Anjos, Jose De Martino, Abde-nour Hadid, Matti Pietikainen, and Sebastien Marcel. Face liveness detection usingdynamic texture. EURASIP Journal on Image and Video Processing, 2014(1):2,2014.
[70] Michael P. Fuller and Peter R. Griffiths. Diffuse reflectance measurements byinfrared fourier transform spectrometry. Analytical Chemistry, 50(13):1906–1910,1978.
[71] J. Galbally, F. Alonso-Fernandez, J. Fierrez, and J. Ortega-Garcia. Fingerprintliveness detection based on quality measures. In Int. Conference on Biometrics,Identity and Security (BIdS), pages 1–8, September 2009.
[72] J. Galbally, F. Alonso-Fernandez, J. Fierrez, and J. Ortega-Garcia. A high per-formance fingerprint liveness detection method based on quality related features.Future Generation Computer Systems (FGCS), 28(1):311–321, 2012.
[73] J. Galbally, S. Marcel, and J. Fierrez. Biometric antispoofing methods: A surveyin face recognition. IEEE Access, 2:1530–1552, 2014.
[74] J. Galbally, S. Marcel, and J. Fierrez. Image quality assessment for fake biometricdetection: Application to iris, fingerprint, and face recognition. IEEE Transactions

177
on Image Processing, 23(2):710–724, February 2014.[75] J. Galbally, J. Ortiz-Lopez, J. Fierrez, and J. Ortega-Garcia. Iris liveness detection
based on quality related features. In IAPR International Conference on Biometrics,pages 271–276, 2012.
[76] Javier Galbally, Julian Fierrez, and Javier Ortega-garcia. Vulnerabilitiesin biometric systems: Attacks and recent advances in liveness detection.Database, 1(3):1–8, 2007. available at http://atvs.ii.uam.es/files/2007_SWB_VulnerabilitiesRecentAdvances_Galbally.pdf.
[77] D.C. Garcia and R.L. de Queiroz. Face-spoofing 2D-detection based on moiré-pattern analysis. IEEE Transactions on Information Forensics and Security,10(4):778–786, April 2015.
[78] Peter Vincent Gehler, Carsten Rother, Martin Kiefel, Lumin Zhang, and BernhardSchölkopf. Recovering intrinsic images with a global sparsity prior on reflectance. InProceedings of the 24th International Conference on Neural Information ProcessingSystems, NIPS’11, pages 765–773, USA, 2011. Curran Associates Inc.
[79] Wilson S. Geisler and Duane G. Albrecht. Cortical neurons: Isolation of contrastgain control. Vision Research, 32(8):1409–1410, 1992.
[80] Jan C. Gemert, Jan-Mark Geusebroek, Cor J. Veenman, and Arnold W. Smeulders.Kernel codebooks for scene categorization. In European Conference on ComputerVision, pages 696–709. Springer-Verlag, 2008.
[81] L. Ghiani, A. Hadid, G.L. Marcialis, and F. Roli. Fingerprint liveness detectionusing binarized statistical image features. In IEEE International Conference onBiometrics: Theory Applications and Systems, pages 1–6, September 2013.
[82] L. Ghiani, G.L. Marcialis, and F. Roli. Fingerprint liveness detection by local phasequantization. In International Conference on Pattern Recognition, pages 537–540,November 2012.
[83] L. Ghiani, D. Yambay, V. Mura, S. Tocco, G.L. Marcialis, F. Roli, and S. Schuckcrs.LivDet 2013 – fingerprint liveness detection competition. In IAPR InternationalConference on Biometrics, pages 1–6, 2013.
[84] G. Goswami, M. Vatsa, and R. Singh. Rgb-d face recognition with texture andattribute features. IEEE Transactions on Information Forensics and Security,9(10):1629–1640, October 2014.
[85] C. Gottschlich. Convolution comparison pattern: An efficient local image descriptorfor fingerprint liveness detection. PLoS ONE, 11(2):12, February 2016.
[86] D. Gragnaniello, G. Poggi, C. Sansone, and L. Verdoliva. Fingerprint liveness de-tection based on weber local image descriptor. In IEEE Workshop on BiometricMeasurements and Systems for Security and Medical Applications (BIOMS), pages46–50, September 2013.
[87] D. Gragnaniello, G. Poggi, C. Sansone, and L. Verdoliva. An investigation of localdescriptors for biometric spoofing detection. IEEE Transactions on InformationForensics and Security, 10(4):849–863, April 2015.
[88] D. Gragnaniello, G. Poggi, C. Sansone, and L. Verdoliva. Local contrast phasedescriptor for fingerprint liveness detection. Pattern Recognition, 48(4):1050–1058,2015.
178
[89] S. J. F. Guimaraes, M. Couprie, N. J. Leite, and A. A. Araujo. A Method forCut Detection Based on Visual Rhythm. In Conference on Graphics, Patterns andImages, pages 297–304, 2001.
[90] Manuel Günther, Dennis Haufe, and Rolf P. Würtz. Face recognition with disparitycorrected gabor phase differences. In International Conference on Artificial NeuralNetworks and Machine Learning, pages 411–418, 2012.
[91] P. Gupta, S. Behera, M. Vatsa, and R. Singh. On iris spoofing using print attack. InInternational Conference on Pattern Recognition, pages 1681–1686, August 2014.
[92] Ju Han and B. Bhanu. Human activity recognition in thermal infrared imagery.In IEEE International Conference on Computer Vision and Pattern Recognition,pages 17–17, June 2005.
[93] R.M. Haralick, K. Shanmugam, and I. Dinstein. Textural features for image classifi-cation. IEEE Transactions on Systems, Man, and Cybernetics, SMC-3(6):610–621,November 1973.
[94] A. Hayter. Probability and Statistics for Engineers and Scientists. Cengage Learn-ing, 4th edition, 2012.
[95] K. He, X. Zhang, S. Ren, and J. Sun. Deep residual learning for image recognition.In IEEE International Conference on Computer Vision and Pattern Recognition,pages 770–778, June 2016.
[96] A. Hernandez-Vela, M.A. Bautista, X. Perez-Sala, V. Ponce, X. Baro, O. Pujol,C. Angulo, and S. Escalera. BoVDW: Bag-of-Visual-and-Depth-Words for gesturerecognition. In International Conference on Pattern Recognition, pages 449–452,November 2012.
[97] B. K.P. Horn. Shape from shading: A method for obtaining the shape of a smoothopaque object from one view. Technical report, Massachusetts Institute of Technol-ogy, Cambridge, MA, USA, 1970.
[98] Berthold K. P. Horn and Robert W. Sjoberg. Calculating the reflectance map.Applied Optics, 18(11):1770–1779, June 1979.
[99] B.K.P. Horn. Shape from shading: A method for obtaining the shape of a smoothopaque object from one view. Technical report, Massachusetts Institute of Technol-ogy (MIT), Cambridge, MA, USA, 1970.
[100] Agnar Hoskuldsson. PLS Regression Methods. Journal of Chemometrics, 2(3):211–228, 1988.
[101] Agnar Hoskuldsson. Pls regression methods. Journal of Chemometrics, 2(3):211–228, 1988.
[102] X. Huang, C. Ti, Q.-Z. Hou, A. Tokuta, and R. Yang. An experimental studyof pupil constriction for liveness detection. In IEEE Workshop on Applications ofComputer Vision (WACV), pages 252–258, 2013.
[103] Tomonori Hyodo. Radiation physics: proceedings of the International Symposiumon Radiation Physics, chapter Backscattering of Gamma Rays, pages 110–118. NBSspecial publication. U.S. Dept. of Commerce, National Bureau of Standards, 1977.
[104] Aapo Hyvrinen, Jarmo Hurri, and Patrick O. Hoyer. Natural Image Statistics: AProbabilistic Approach to Early Computational Vision. Springer Publishing Com-pany, Incorporated, 1st edition, 2009.

179
[105] ISO/IEC. DIS (Draft International Standard) 30107–3, Information technology –Biometric presentation attack detection – Part 3: Testing and reporting, 2016.
[106] ISO/IEC 30107-3:2017. Information technology – Biometric presentation attackdetection – Part 3: Testing and reporting, 2017.
[107] A. K. Jain and A. Ross. Handbook of Biometrics, chapter Introduction to Biometrics,pages 1–22. Springer, 2008.
[108] A. K. Jain and A. Ross. Handbook of Biometrics, chapter Introduction to biometrics,pages 1–22. Springer, 2008.
[109] A.K. Jain, A.A. Ross, and K. Nandakumar. Introduction to Biometrics, chapterIntroduction, pages 1–49. Springer US, Boston, MA, 2011.
[110] Anil K. Jain, Patrick Flynn, and Arun A. Ross. Handbook of Biometrics. SpringerPublishing Company, Incorporated, 1st edition, 2010.
[111] Kevin Jarrett, Koray Kavukcuoglu, Marc’Aurelio Ranzato, and Yann LeCun. Whatis the Best Multi-Stage Architecture for Object Recognition? In IEEE InternationalConference on Computer Vision, pages 2146–2153, 2009.
[112] Xiaofei Jia, Xin Yang, Yali Zang, Ning Zhang, Ruwei Dai, Jie Tian, and JianminZhao. Multi-scale block local ternary patterns for fingerprints vitality detection. InIAPR International Conference on Biometrics, pages 1–6, 2013.
[113] M. Kanematsu, H. Takano, and K. Nakamura. Highly reliable liveness detectionmethod for iris recognition. In SICE Annual Conference (SICE), pages 361–364,2007.
[114] J. Kannala and E. Rahtu. BSIF: Binarized statistical image features. In Interna-tional Conference on Pattern Recognition, pages 1363–1366, Nov 2012.
[115] T. Kathikeyan and B. Sabarigiri. Countermeasures against iris spoofing and live-ness detection using electroencephalogram (eeg). In Int. Conference on Computing,Communication and Applications (ICCA), pages 1–5, 2012.
[116] M. Kazayawoko, J. J. Balatinecz, and R. T. Woodhams. Diffuse reflectance fouriertransform infrared spectra of wood fibers treated with maleated polypropylenes.Journal of Applied Polymer Science, 66(6):1163–1173, 1997.
[117] G. Kim, S. Eum, J.K. Suhr, D.I. Kim, K.R. Park, and J. Kim. Face liveness detectionbased on texture and frequency analyses. In IAPR International Conference onBiometrics, pages 67–72, April 2012.
[118] W. Kim, S. Suh, and J.-J. Han. Face liveness detection from a single image viadiffusion speed model. IEEE Transactions on Image Processing, 24(8):2456–2465,August 2015.
[119] A. Klaeser, M. Marszalek, and C. Schmid. A spatio-temporal descriptor basedon 3D-gradients. In Proceedings of the British Machine Vision Conference, pages99.1–99.10. BMVA Press, 2008. doi:10.5244/C.22.99.
[120] N. Kohli, D. Yadav, M. Vatsa, and R. Singh. Revisiting iris recognition with colorcosmetic contact lenses. In IAPR International Conference on Biometrics, pages1–7, 2013.
[121] M. Kohn and M. Clynes. Color Dynamics of the Pupil. Annals of the New YorkAcademy of Sciences, 156(2):931–950, 1969.
[122] I. Kokkinos and A. Yuille. Scale invariance without scale selection. In IEEE Inter-

180
national Conference on Computer Vision and Pattern Recognition, pages 1–8, June2008.
[123] K. Kollreider, H. Fronthaler, and J. Bigun. Non-intrusive liveness detection by faceimages. Image and Vision Computing (JIVC), 27(3):233–244, 2009.
[124] J. Komulainen, A. Hadid, M. Pietikainen, A. Anjos, and S. Marcel. Complementarycountermeasures for detecting scenic face spoofing attacks. In IAPR InternationalConference on Biometrics, pages 1–7, June 2013.
[125] Jukka Komulainen, Abdenour Hadid, and Matti Pietikäinen. Face spoofing detec-tion using dynamic texture. In ACCV International Workshops, pages 146–157,2013.
[126] Neslihan Kose and Jean-Luc Dugelay. Countermeasure for the protection of facerecognition systems against mask attacks. In IEEE International Conference andWorkshops on Automatic Face and Gesture Recognition, pages 1–6, 2013.
[127] Neslihan Kose and Jean-Luc Dugelay. On the vulnerability of face recognition sys-tems to spoofing mask attacks. In IEEE International Conference on Acoustics,Speech, and Signal Processing, pages 2357–2361, 2013.
[128] Neslihan Kose and Jean-Luc Dugelay. Reflectance analysis based countermeasuretechnique to detect face mask attacks. In International Conference on Digital SignalProcessing, pages 1–6, 2013.
[129] A. Krizhevsky. cuda-convnet: High-performance c++/cuda implementation of con-volutional neural networks, 2012.
[130] A. Krizhevsky, I. Sutskever, and G. E Hinton. ImageNet Classification with DeepConvolutional Neural Networks. In Advances in Neural Information ProcessingSystems (NIPS), 2012.
[131] A. Krizhevsky, I. Sutskever, and G.E. Hinton. ImageNet Classification with DeepConvolutional Neural Networks. In Advances in Neural Information ProcessingSystems (NIPS), 2012.
[132] Alex Krizhevsky, Ilya Sutskever, and Geoffrey E Hinton. Imagenet classification withdeep convolutional neural networks. In Advances in neural information processingsystems, pages 1097–1105, 2012.
[133] Alex Krizhevsky, Ilya Sutskever, and Geoffrey E. Hinton. Imagenet classificationwith deep convolutional neural networks. In Proceedings of the 25th InternationalConference on Neural Information Processing Systems, volume 1 of NIPS’12, pages1097–1105, USA, 2012. Curran Associates Inc.
[134] Supawan Kumpituck, Dongju Li, Hiroaki Kunieda, and Tsuyoshi Isshiki. Fingerprintspoof detection using wavelet based local binary pattern. In International Confer-ence on Graphic and Image Processing (ICGIP), volume 10225, pages 102251C–102251C–8, 2017.
[135] Y. LeCun, L. Bottou, Y. Bengio, and P. Haffner. Gradient-based learning appliedto document recognition. Proceedings of the IEEE, 86(11):2278–2324, 1998.
[136] Y. LeCun, L. Bottou, Y. Bengio, and P. Haffner. Gradient-based learning appliedto document recognition. Proceedings of the IEEE, 86(11):2278–2324, 1998.
[137] E. Lee, K. Park, and J. Kim. Advances in Biometrics (AB), chapter Fake IrisDetection by Using Purkinje Image, pages 397–403. Springer, Berlin, Heidelberg,

181
2005.[138] Tai Sing Lee. Image representation using 2d gabor wavelets. IEEE Transactions on
Pattern Analysis and Machine Intelligence, 18(10):959–971, October 1996.[139] Ting-Wei Lee, Gwo-Hwa Ju, Heng-Sung Liu, and Yu-Shan Wu. Liveness detection
using frequency entropy of image sequences. In IEEE International Conference onAcoustics, Speech, and Signal Processing, pages 2367–2370, 2013.
[140] Jiang-Wei Li. Eye blink detection based on multiple gabor response waves. InInternational Conference on Machine Learning and Cybernetics, volume 5, pages2852 –2856, July 2008.
[141] Jiangwei Li, Yunhong Wang, Tieniu Tan, and Anil K. Jain. Live face detection basedon the analysis of fourier spectra. In Biometric Technology for Human Identification,volume 5404, pages 296–303. Proc. SPIE, 2004.
[142] L. Li, X. Feng, Z. Boulkenafet, Z. Xia, M. Li, and A. Hadid. An original faceanti-spoofing approach using partial convolutional neural network. In InternationalConference on Image Processing Theory, Tools and Applications (IPTA), pages 1–6,December 2016.
[143] L. Li, Z. Xia, L. Li, X. Jiang, X. Feng, and F. Roli. Face anti-spoofing via hybridconvolutional neural network. In International Conference on the Frontiers andAdvances in Data Science (FADS), pages 120–124, October 2017.
[144] S. Z. Li, R. Chu, S. Liao, and L. Zhang. Illumination invariant face recognitionusing near-infrared images. IEEE Transactions on Pattern Analysis and MachineIntelligence, 29(4):627–639, April 2007.
[145] Chengjun Liu and H. Wechsler. A shape- and texture-based enhanced fisher classifierfor face recognition. IEEE Transactions on Image Processing, 10(4):598–608, April2001.
[146] Lingqiao Liu, Lei Wang, and Xinwang Liu. In defense of soft-assignment coding. InIEEE International Conference on Computer Vision, pages 2486–2493, November2011.
[147] F. Lourenço and D. Pires. Video shows Samu’s medical using silicone fingers, inFerraz. http://tinyurl.com/akzcrgw, mar. 2013. Accessed: 2016/02/20.
[148] Lovish, A. Nigam, B. Kumar, and P. Gupta. Robust contact lens detection usinglocal phase quantization and binary gabor pattern. In G. Azzopardi and N. Petkov,editors, Computer Analysis of Images and Patterns, pages 702–714. Springer Inter-national Publishing, 2015.
[149] D.G. Lowe. Distinctive image features from scale-invariant keypoints. InternationalJournal of Computer Vision, 60(2):91–110, 2004.
[150] J. Lukäs, J. Fridrich, and M. Goljan. Digital camera identification from sensorpattern noise. IEEE Transactions on Information Forensics and Security, 1(2):205–214, June 2006.
[151] J. Määttä, A. Hadid, and M. Pietikäinen. Face spoofing detection from singleimages using micro-texture analysis. In IEEE International Joint Conference onBiometrics, pages 1–7, October 2011.
[152] J. Maatta, A. Hadid, and M. Pietikäinen. Face spoofing detection from single imagesusing texture and local shape analysis. IET Biometrics, 1(1):3–10, March 2012.

182
[153] Davide Maltoni, Dario Maio, Anil K. Jain, and Salil Prabhakar. Handbook of Finger-print Recognition. Springer Publishing Company, Incorporated, 2nd edition, 2009.
[154] I. Manjani, S. Tariyal, M. Vatsa, R. Singh, and A. Majumdar. Detecting siliconemask-based presentation attack via deep dictionary learning. IEEE Transactionson Information Forensics and Security, 12(7):1713–1723, July 2017.
[155] E. Marasco and C. Sansone. Combining perspiration- and morphology-based staticfeatures for fingerprint liveness detection. Pattern Recognition Letters, 33(9):1148–1156, 2012.
[156] E. Marasco, P. Wild, and B. Cukic. Robust and interoperable fingerprint spoofdetection via convolutional neural networks. In IEEE Symposium on Technologiesfor Homeland Security (HST), pages 1–6, May 2016.
[157] Emanuela Marasco, Peter Johnson, Carlo Sansone, and Stephanie Schuckers. In-crease the security of multibiometric systems by incorporating a spoofing detectionalgorithm in the fusion mechanism. In International Conference on Multiple Clas-sifier Systems, pages 309–318, 2011.
[158] Sbastien Marcel, Mark S. Nixon, and Stan Z. Li. Handbook of Biometric Anti-Spoofing: Trusted Biometrics Under Spoofing Attacks. Springer Publishing Com-pany, Incorporated, 2014.
[159] Gian Luca Marcialis, Aaron Lewicke, Bozhao Tan, Pietro Coli, Dominic Grimberg,Alberto Congiu, Alessandra Tidu, Fabio Roli, and Stephanie A. C. Schuckers. Livdet2009 – first international fingerprint liveness detection competition. In PasqualeFoggia, Carlo Sansone, and Mario Vento, editors, International Conference on ImageAnalysis and Processing, volume 5716 of Lecture Notes in Computer Science, pages12–23. Springer, 2009.
[160] G.L. Marcialis, F. Roli, and A. Tidu. Analysis of fingerprint pores for vitalitydetection. In International Conference on Pattern Recognition, pages 1289–1292,August 2010.
[161] Stephen R. Marschner, Stephen H. Westin, Eric P. F. Lafortune, Kenneth E. Tor-rance, and Donald P. Greenberg. Reflectance measurements of human skin. Tech-nical Report PCG-99-2, Program of Computer Graphics, Cornell University, 1999.
[162] D. Menotti, G. Chiachia, A. Pinto, W.R. Schwartz, H. Pedrini, A.X. Falcao, andA. Rocha. Deep representations for iris, face, and fingerprint spoofing detection.IEEE Transactions on Information Forensics and Security, 10(4):864–879, April2015.
[163] Simone Milani, Marco Fontani, Paolo Bestagini, Mauro Barni, Alessandro Piva,Marco Tagliasacchi, and Stefano Tubaro. An overview on video forensics. APSIPATransactions on Signal and Information Processing, 1:e2, 2012.
[164] J.C. Monteiro, A.F. Sequeira, H.P. Oliveira, and J.S. Cardoso. Robust iris locali-sation in challenging scenarios. In Communications in Computer and InformationScience (CCIS). Springer-Verlag, 2004.
[165] Kamal Moradi, Christophe Depecker, and Jacques Corset. Diffuse reflectance in-frared spectroscopy: Experimental study of nonabsorbing materials and comparisonwith theories. Applied Spectroscopy, 48(12):1491–1497, December 1994.
[166] R. F. Nogueira, R. de Alencar Lotufo, and R. Campos Machado. Fingerprint liveness
183
detection using convolutional neural networks. IEEE Transactions on InformationForensics and Security, 11(6):1206–1213, June 2016.
[167] L. O’Gorman. Comparing passwords, tokens, and biometrics for user authentication.Proceedings of the IEEE, 91(12):2021–2040, 2003.
[168] T. Ojala, M. Pietikainen, and T. Maenpaa. Multiresolution gray-scale and rotationinvariant texture classification with local binary patterns. IEEE Transactions onPattern Analysis and Machine Intelligence, 24(7):971–987, July 2002.
[169] T. Ojala, M. Pietikainen, and T. Maenpaa. Multiresolution gray-scale and rotationinvariant texture classification with local binary patterns. IEEE Transactions onPattern Analysis and Machine Intelligence, 24(7):971–987, 2002.
[170] Timo Ojala, Matti Pietikäinen, and David Harwood. A comparative study of texturemeasures with classification based on featured distributions. Pattern Recognition,29(1):51 – 59, 1996.
[171] V. Ojansivu and J. Heikkilä. Image and Signal Processing (ISP), chapter BlurInsensitive Texture Classification Using Local Phase Quantization, pages 236–243.Springer Berlin Heidelberg, Berlin, Heidelberg, 2008.
[172] A. Oliva and A. Torralba. Modeling the shape of the scene: A holistic representationof the spatial envelope. International Journal of Computer Vision, 42(3):145–175,2001.
[173] J. Ouyang and X. Wang. Joint deep learning for pedestrian detection. In IEEEInternational Conference on Computer Vision, 2014.
[174] A. Pacut and A. Czajka. Aliveness detection for iris biometrics. In IEEE Int.Carnahan Conferences Security Technology (ICCST), pages 122–129, October 2006.
[175] G. Pan, Z. Wu, and L. Sun. Recent Advances in Face Recognition, chapter Livenessdetection for face recognition, pages 235–252. InTech, 2008.
[176] Gang Pan, Lin Sun, Zhaohui Wu, and Shihong Lao. Eyeblink-based anti-spoofingin face recognition from a generic webcamera. In IEEE International Conferenceon Computer Vision, pages 1–8, October 2007.
[177] Gang Pan, Lin Sun, Zhaohui Wu, and Yueming Wang. Monocular camera-basedface liveness detection by combining eyeblink and scene context. TelecommunicationSystems, 47:215–225, 2011.
[178] Omkar M Parkhi, Andrea Vedaldi, and Andrew Zisserman. Deep face recognition.In British Machine Vision Conference, number 3 in 1, page 6, 2015.
[179] K. Patel, H. Han, A.K. Jain, and G. Ott. Live face video vs. spoof face video: Useof moiré; patterns to detect replay video attacks. In IAPR International Conferenceon Biometrics, pages 98–105, May 2015.
[180] Keyurkumar Patel, Hu Han, and Anil K. Jain. Cross-database face antispoofingwith robust feature representation. In Zhisheng You, Jie Zhou, Yunhong Wang,Zhenan Sun, Shiguang Shan, Weishi Zheng, Jianjiang Feng, and Qijun Zhao, ed-itors, Biometric Recognition, pages 611–619, Cham, 2016. Springer InternationalPublishing.
[181] B. Peixoto, C. Michelassi, and A. Rocha. Face liveness detection under bad illumi-nation conditions. In IEEE International Conference on Image Processing, pages3557–3560, September 2011.

184
[182] Otávio A.B. Penatti, Fernanda B. Silva, Eduardo Valle, Valerie Gouet-Brunet, andRicardo da S. Torres. Visual word spatial arrangement for image retrieval andclassification. Pattern Recognition, 47(2):705–720, 2014.
[183] Alex P. Pentland. Finding the illuminant direction. Journal of the Optical Societyof America, 72(4):448–455, April 1982.
[184] T.F. Pereira, A. Anjos, J.M. de Martino, and S. Marcel. Can face anti-spoofingcountermeasures work in a real world scenario? In IAPR International Conferenceon Biometrics, pages 1–8, 2013.
[185] Mauricio Perez, Sandra Avila, Daniel Moreira, Daniel Moraes, Vanessa Testoni,Eduardo Valle, Siome Goldenstein, and Anderson Rocha. Video pornography de-tection through deep learning techniques and motion information. Neurocomputing,230:279–293, 2017.
[186] Florent Perronnin, Jorge Sánchez, and Thomas Mensink. Improving the fisher kernelfor large-scale image classification. In European Conference on Computer Vision,pages 143–156. Springer-Verlag, 2010.
[187] Q. T. Phan, D. T. Dang-Nguyen, G. Boato, and F. G. B. De Natale. Face spoofingdetection using ldp-top. In IEEE International Conference on Image Processing,pages 404–408, Sept 2016.
[188] Tsai Ping-Sing and Mubarak Shah. Shape from shading using linear approximation.Image and Vision Computing, 12(8):487–498, 1994.
[189] A. Pinto, H. Pedrini, W. R. Schwartz, and A. Rocha. Face spoofing detectionthrough visual codebooks of spectral temporal cubes. IEEE Transactions on ImageProcessing, 24(12):4726–4740, December 2015.
[190] A. Pinto, W. Robson Schwartz, H. Pedrini, and A. Rocha. Using visual rhythmsfor detecting video-based facial spoof attacks. IEEE Transactions on InformationForensics and Security, 10(5):1025–1038, May 2015.
[191] Allan Pinto. A countermeasure method for video-based face spoofing attacks. Mas-ter’s thesis, University of Campinas, October 2013.
[192] Allan Pinto, Helio Pedrini, Michael Krumdick, Benedict Becker, Adam Czajka,Kevin W. Bowyer, and Anderson Rocha. Deep Learning in Biometrics, chap-ter Counteracting Presentation Attacks in Face Fingerprint and Iris Recognition,page 49. CRC Press, 2018.
[193] Allan Pinto, Helio Pedrini, William Robson Schwartz, and Anderson Rocha. Video-based face spoofing detection through visual rhythm analysis. In Conference onGraphics, Patterns and Images, pages 221–228, August 2012.
[194] N. Pinto and D. D. Cox. Beyond simple features: A large-scale feature searchapproach to unconstrained face recognition. In IEEE International Conference andWorkshops on Automatic Face and Gesture Recognition, pages 8–15, 2011.
[195] N. Pinto, D. Doukhan, J. J. DiCarlo, and D. D. Cox. A high-throughput screeningapproach to discovering good forms of biologically-inspired visual representation.PLoS ONE, 5(11):e1000579, 2009.
[196] N. Pinto, D. Doukhan, J.J. DiCarlo, and D.D. Cox. A high-throughput screeningapproach to discovering good forms of biologically-inspired visual representation.PLoS ONE, 5(11):e1000579, 2009.

185
[197] Ming-Zher Poh, Daniel J. McDuff, and RosalindW. Picard. Non-contact, automatedcardiac pulse measurements using video imaging and blind source separation. Opt.Express, 18(10):10762–10774, May 2010.
[198] P. Pudil, J. Novovičová, and J. Kittler. Floating search methods in feature selection.Pattern Recognition Letters, 15(11):1119–1125, 1994.
[199] R. Raghavendra and C. Busch. Robust scheme for iris presentation attack detec-tion using multiscale binarized statistical image features. IEEE Transactions onInformation Forensics and Security, 10(4):703–715, April 2015.
[200] K.B. Raja, R. Raghavendra, and C. Busch. Video presentation attack detection invisible spectrum iris recognition using magnified phase information. IEEE Trans-actions on Information Forensics and Security, 10(10):2048–2056, October 2015.
[201] V. S. Ramachandran. Perception of shape from shading. Nature, 331:163–166,January 1988.
[202] N. K. Ratha, J. H. Connell, and R. M. Bolle. Enhancing security and privacyin biometrics-based authentication systems. IBM Systems Journal, 40(3):614–634,2001.
[203] Nalini K. Ratha, Jonathan H. Connell, and Ruud M. Bolle. An analysis of minu-tiae matching strength. In International Conference on Audio-and Video-BasedBiometric Person Authentication, pages 223–228, 2001.
[204] C. Rathgeb and A. Uhl. Attacking iris recognition: An efficient hill-climbing tech-nique. In IEEE/IAPR International Conference on Pattern Recognition (ICPR),pages 1217–1220, 2010.
[205] C. Rathgeb and A. Uhl. Statistical attack against iris-biometric fuzzy commitmentschemes. In IEEE Computer Society Conference on Computer Vision and PatternRecognition Workshops (CVPRW), pages 23–30, 2011.
[206] A. Rattani and A. Ross. Automatic adaptation of fingerprint liveness detector tonew spoof materials. In IEEE International Joint Conference on Biometrics, pages1–8, Sept 2014.
[207] A. Rattani, W.J. Scheirer, and A. Ross. Open set fingerprint spoof detection acrossnovel fabrication materials. IEEE Transactions on Information Forensics and Se-curity, 10(11):2447–2460, November 2015.
[208] Yasar Abbas Ur Rehman, Lai Man Po, and Mengyang Liu. Livenet: Improvingfeatures generalization for face liveness detection using convolution neural networks.Expert Systems with Applications, 108:159–169, 2018.
[209] W. Ren, S. Singh, M. Singh, and Y.S. Zhu. State-of-the-art on spatio-temporalinformation-based video retrieval. Pattern Recognition, 42(2):267–282, 2009. Learn-ing Semantics from Multimedia Content.
[210] Daily Mail Reporter. Face off: Man arrested after boarding plane as an old man -only to land as youthful refugee. http://tinyurl.com/33l9laz, November 2010.Accessed: 2016/02/20.
[211] Daily Mail Reporter. The white robber who carried out six raids disguised as a blackman (and very nearly got away with it). http://tinyurl.com/2cvuq59, December2010. Accessed: 2016/02/20.
[212] Christian Riess and Elli Angelopoulou. Scene illumination as an indicator of image

186
manipulation. In Rainer Böhme, Philip W. L. Fong, and Reihaneh Safavi-Naini,editors, Information Hiding, pages 66–80, Berlin, Heidelberg, 2010. Springer BerlinHeidelberg.
[213] Christian Riess, Sven Pfaller, and Elli Angelopoulou. Reflectance normalizationin illumination-based image manipulation detection. In Vittorio Murino, EnricoPuppo, Diego Sona, Marco Cristani, and Carlo Sansone, editors, New Trends inImage Analysis and Processing – ICIAP 2015 Workshops, pages 3–10, Cham, 2015.Springer International Publishing.
[214] W. Robson Schwartz, A. Rocha, and H. Pedrini. Face spoofing detection throughpartial least squares and low-level descriptors. In IEEE International Joint Confer-ence on Biometrics, pages 1–8, October 2011.
[215] Anderson Rocha, Walter Scheirer, Terrance Boult, and Siome Goldenstein. Visionof the unseen: Current trends and challenges in digital image and video forensics.ACM Computing Surveys, 43(4):26:1–26:42, October 2011.
[216] Anderson Rocha, Walter Scheirer, Terrance Boult, and Siome Goldenstein. Visionof the unseen: Current trends and challenges in digital image and video forensics.ACM Comput. Surv., 43(4):26:1–26:42, October 2011.
[217] Arun A. Ross, Karthik Nandakumar, and Anil K. Jain. Score level fusion. InHandbook of Multibiometrics, volume 6 of International Series on Biometrics, pages91–142. Springer US, 2006.
[218] M. Rousson, T. Brox, and R. Deriche. Active unsupervised texture segmentationon a diffusion based feature space. In IEEE International Conference on ComputerVision and Pattern Recognition, volume 2, pages 699–704, June 2003.
[219] V. Ruiz-Albacete, P. Tome-Gonzalez, F. Alonso-Fernandez, J. Galbally, J. Fierrez,and J. Ortega-Garcia. Direct attacks using fake images in iris verification. In FirstEuropean Workshop on Biometrics and Identity Management (BioID), volume 5372of Lecture Notes in Computer Science, pages 181–190. Springer, 2008.
[220] Yousef Saad. Iterative Methods for Sparse Linear Systems. Society for Industrialand Applied Mathematics, Philadelphia, PA, USA, 2nd edition, 2003.
[221] Andrew M. Saxe, Pang Wei Koh, Zhenghao Chen, Maneesh Bhand, Bipin Suresh,and Andrew Y. Ng. On Random Weights and Unsupervised Feature Learning. InAdvances in Neural Information Processing Systems (NIPS), 2011.
[222] W. Scheirer, A. Rocha, A. Sapkota, and T. Boult. Towards open set recognition.IEEE Transactions on Pattern Analysis and Machine Intelligence, 35(7):1757–1772,July 2013.
[223] W.J. Scheirer, A. Rocha, A. Sapkota, and T.E. Boult. Toward open set recognition.IEEE Transactions on Pattern Analysis and Machine Intelligence, 35(7):1757–1772,July 2013.
[224] S. Schuckers, K.W. Bowyer, A.C., and D. Yambay. LivDet 2013 - liveness detectioniris competition, 2013.
[225] W.R. Schwartz, A. Kembhavi, D. Harwood, and L.S. Davis. Human Detection UsingPartial Least Squares Analysis. In IEEE International Conference on ComputerVision, 2009.
[226] A.F. Sequeira, J. Murari, and J.S. Cardoso. Iris liveness detection methods in mo-

187
bile applications. In Int. Conference on Computer Vision Theory and Applications(VISAPP), volume 3, pages 22–33, January 2014.
[227] A.F. Sequeira, J. Murari, and J.S. Cardoso. Iris liveness detection methods in themobile biometrics scenario. In Int. Joint Conference on Neural Network (IJCNN),pages 3002–3008, July 2014.
[228] A.F. Sequeira, J. Murari, and J.S. Cardoso. MobBIO a multimodal database cap-tured with a handheld device. In Int. Conference on Computer Vision Theory andApplications (VISAPP), pages 133–139, 2014.
[229] A.F. Sequeira, H.P. Oliveira, J.C. Monteiro, J.P. Monteiro, and J.S. Cardoso. Mo-bILive 2014 - mobile iris liveness detection competition. In IEEE International JointConference on Biometrics, pages 1–6, September 2014.
[230] Steven A. Shafer. Using color to separate reflection components. Color Research &Application, 10(4):210–218, 1985.
[231] L. Shen and C. Yeo. Intrinsic images decomposition using a local and global sparserepresentation of reflectance. In IEEE International Conference on Computer Visionand Pattern Recognition, pages 697–704, June 2011.
[232] Pedro Silva, Eduardo Luz, Rafael Baeta, Helio Pedrini, Alexandre Xavier Falcao,and David Menotti. An approach to iris contact lens detection based on deep imagerepresentations. In Conference on Graphics, Patterns and Images, pages 157–164.IEEE, 2015.
[233] K. Simonyan and A. Zisserman. Very Deep Convolutional Networks for Large-ScaleImage Recognition. ArXiv e-prints, September 2014.
[234] Karen Simonyan and Andrew Zisserman. Very deep convolutional networks forlarge-scale image recognition. arXiv preprint arXiv:1409.1556, 2014.
[235] J. Sivic and A. Zisserman. Video google: a text retrieval approach to object match-ing in videos. In IEEE International Conference on Computer Vision, volume 2,pages 1470–1477, 2003.
[236] Steven W. Smith. The Scientist and Engineer’s Guide to Digital Signal Processing.California Technical Pub., San Diego, CA, USA, 1997.
[237] Lin Sun, WaiBin Huang, and MingHui Wu. TIR/VIS Correlation for LivenessDetection in Face Recognition. In Computer Analysis of Images and Patterns,pages 114–121, 2011.
[238] Z. Sun, H. Zhang, T. Tan, and J. Wang. Iris image classification based on hier-archical visual codebook. IEEE Transactions on Pattern Analysis and MachineIntelligence, 36(6):1120–1133, 2014.
[239] C. Szegedy, Wei Liu, Yangqing Jia, P. Sermanet, S. Reed, D. Anguelov, D. Erhan,V. Vanhoucke, and A. Rabinovich. Going deeper with convolutions. In IEEE Inter-national Conference on Computer Vision and Pattern Recognition, pages 1–9, June2015.
[240] Richard Szeliski. Computer Vision: Algorithms and Applications. Springer-VerlagNew York, Inc., New York, NY, USA, 1st edition, 2010.
[241] Y. Taigman, M. Yang, M. Ranzato, and L. Wolf. Deepface: Closing the gap tohuman-level performance in face verification. In IEEE International Conference onComputer Vision and Pattern Recognition, pages 1701–1708, June 2014.

188
[242] Y. Taigman, M. Yang, M.’A. Ranzato, and L. Wolf. Deepface: Closing the gap tohuman-level performance in face verification. In IEEE International Conference onComputer Vision and Pattern Recognition, 2014.
[243] B. Tan and S. Schuckers. Spoofing protection for fingerprint scanner by fusing ridgesignal and valley noise. Pattern Recognition, 43(8):2845 – 2857, 2010.
[244] X. Tan and B. Triggs. Enhanced local texture feature sets for face recognition underdifficult lighting conditions. IEEE Transactions on Image Processing, 19(6):1635–1650, June 2010.
[245] Xiaoyang Tan, Yi Li, Jun Liu, and Lin Jiang. Face liveness detection from a singleimage with sparse low rank bilinear discriminative model. In European Conferenceon Computer Vision, pages 504–517, 2010.
[246] S. Tariyal, A. Majumdar, R. Singh, and M. Vatsa. Deep dictionary learning. IEEEAccess, 4:10096–10109, 2016.
[247] T. Thongkamwitoon, H. Muammar, and P. L. Dragotti. Robust image recapturedetection using a k-svd learning approach to train dictionaries of edge profiles. InIEEE International Conference on Image Processing, pages 5317–5321, October2014.
[248] T. Thongkamwitoon, H. Muammar, and P. L. Dragotti. An image recapture detec-tion algorithm based on learning dictionaries of edge profiles. IEEE Transactionson Information Forensics and Security, 10(5):953–968, May 2015.
[249] P.A. Tipler and G. Mosca. Physics for Scientists and Engineers. Physics for Scien-tists and Engineers. W. H. Freeman, 2007.
[250] Harold Tipton. Information Security Management Handbook. CRC Press, Inc.,Boca Raton, FL, USA, 5 edition, 2003.
[251] E. Tola, V. Lepetit, and P. Fua. Daisy: An efficient dense descriptor applied to wide-baseline stereo. IEEE Transactions on Pattern Analysis and Machine Intelligence,32(5):815–830, May 2010.
[252] K. E. Torrance and E. M. Sparrow. Theory for off-specular reflection from roughenedsurfaces. Journal of the Optical Society of America, 57(9):1105–1114, September1967.
[253] R. Tronci, D. Muntoni, G. Fadda, M. Pili, N. Sirena, G. Murgia, M. Ristori, andF. Roli. Fusion of multiple clues for photo-attack detection in face recognitionsystems. In IEEE International Joint Conference on Biometrics, pages 1–6, October2011.
[254] D.A.R. Vigo, F. Shahbaz Khan, J. van de Weijer, and T. Gevers. The impactof color on bag-of-words based object recognition. In International Conference onPattern Recognition, pages 1549–1553, 2010.
[255] P. Viola and M. Jones. Robust real-time object detection. International Journal ofComputer Vision, 57(2):137–154, 2001.
[256] M. Visentini-Scarzanella and P.L. Dragotti. Modelling radial distortion chains forvideo recapture detection. In IEEE Int. Workshop on Multimedia Signal Processing(MMSP), pages 412–417, September 2013.
[257] Ronald E. Walpole, Raymond H. Myers, Sharon L. Myers, and Keying Ye. Proba-bility & Statistics for Engineers and Scientists. Pearson Education, Upper Saddle

189
River, 8th edition, 2007.[258] Pete Wardern. The SDK for Jetpac’s iOS Deep Belief image recognition framework,
2014.[259] Z. Wei, X. Qiu, Z. Sun, and T. Tan. Counterfeit iris detection based on texture
analysis. In International Conference on Pattern Recognition, pages 1–4, 2008.[260] D. Wen, H. Han, and A. K. Jain. Face spoof detection with image distortion analysis.
IEEE Transactions on Information Forensics and Security, 10(4):746–761, April2015.
[261] P.H. Winston and B. Horn. The psychology of computer vision. McGraw-Hill com-puter science series. McGraw-Hill, 1975.
[262] L. Wiskott, J.-M. Fellous, N. Kuiger, and C. Von der Malsburg. Face recognition byelastic bunch graph matching. IEEE Transactions on Pattern Analysis and MachineIntelligence, 19(7):775–779, July 1997.
[263] Cui Xu, Ying Zheng, and Zengfu Wang. Eye states detection by boosting localbinary pattern histogram features. In IEEE International Conference on ImageProcessing, pages 1480–1483, October 2008.
[264] D. Yadav, N. Kohli, J.S. Doyle, R. Singh, M. Vatsa, and K.W. Bowyer. Unravelingthe effect of textured contact lenses on iris recognition. IEEE Transactions onInformation Forensics and Security, 9(5):851–862, 2014.
[265] D. Yambay, B. Becker, N. Kohli, D. Yadav, A. Czajka, K. W. Bowyer, S. Schuckers,R. Singh, M. Vatsa, A. Noore, D. Gragnaniello, C. Sansone, L. Verdoliva, L. He,Y. Ru, H. Li, N. Liu, Z. Sun, and T. Tan. Livdet iris 2017 - iris liveness detectioncompetition 2017. In IEEE International Joint Conference on Biometrics, pages733–741, Oct 2017.
[266] D. Yambay, L. Ghiani, P. Denti, G.L. Marcialis, F. Roli, and S. Schuckers. Livdet2011 – fingerprint liveness detection competition. In IAPR International Conferenceon Biometrics, pages 208–215, 2012.
[267] Junjie Yan, Zhiwei Zhang, Zhen Lei, Dong Yi, and Stan Z. Li. Face liveness de-tection by exploring multiple scenic clues. In International Conference on ControlAutomation Robotics and Vision, pages 188–193, Dec 2012.
[268] J. Yang, Z. Lei, D. Yi, and S.Z. Li. Person-specific face antispoofing with subjectdomain adaptation. IEEE Transactions on Information Forensics and Security,10(4):797–809, April 2015.
[269] Jianwei Yang, Zhen Lei, and Stan Z. Li. Learn convolutional neural network forface anti-spoofing. CoRR, abs/1408.5601, 2014.
[270] Dong Yi, Zhen Lei, Zhiwei Zhang, and StanZ. Li. Face anti-spoofing: Multi-spectralapproach. In Sébastien Marcel, Mark S. Nixon, and Stan Z. Li, editors, Handbook ofBiometric Anti-Spoofing, Advances in Computer Vision and Pattern Recognition,pages 83–102. Springer London, 2014.
[271] MatthewD. Zeiler and Rob Fergus. Visualizing and understanding convolutionalnetworks. In European Conference on Computer Vision, 2014.
[272] L. Zhang, Z. Zhou, and H. Li. Binary gabor pattern: An efficient and robustdescriptor for texture classification. In IEEE International Conference on ImageProcessing, pages 81–84, September 2012.

190
[273] Wenchao Zhang, Shiguang Shan, Wen Gao, Xilin Chen, and Hongming Zhang.Local Gabor binary pattern histogram sequence (LGBPHS): a novel non-statisticalmodel for face representation and recognition. In IEEE International Conferenceon Computer Vision, volume 1, pages 786–791, 2005.
[274] Zhiwei Zhang, Junjie Yan, Sifei Liu, Zhen Lei, Dong Yi, and S.Z. Li. A face an-tispoofing database with diverse attacks. In IAPR International Conference onBiometrics, pages 26–31, April 2012.
[275] Q. Zheng and R. Chellappa. Estimation of illuminant direction, albedo, and shapefrom shading. IEEE Transactions on Pattern Analysis and Machine Intelligence,13(7):680–702, July 1991.

191
Appendix A
Ethics Committee Approval
192
UNIVERSIDADE ESTADUAL DE CAMPINAS
INSTITUTO DE COMPUTAÇÃO
Termo de Consentimento Livre e Esclarecido(TCLE)
Campinas, November 21, 2018
Captura de Dados para Avaliação deSegurança
em Sistemas Biométricos de Faces
Pesquisador Responsável: Prof. Dr. Anderson de Rezende Rocha
Diretor do Instituto: Prof. Dr. Hans Kurt Edmund Liesenberg

193
Termo de Consentimento Livre e Esclarecido (TCLE)
Responsável: Prof. Dr. Anderson de Rezende Rocha
Objetivo da pesquisa: A presente pesquisa tem como objetivo a construção de umabase de dados contendo vídeos da face de pessoas adultas para uso científico. Esses dadosserão utilizados no desenvolvimento e na avaliação da eficácia de novas metodologiasque visam detectar procedimentos que tentam burlar o mecanismo de controle de acessoa um sistema de computação, realizado por um sistema de biometria de face. Os dadostambém poderão ser utilizados no desenvolvimento de novos métodos para reconhecimentoe detecção de face de humanos por computador.
Justificativa: Embora existam algumas bases de dados destinadas à avaliação demetodologias que visam burlar sistemas biométricos faciais, como a Print-Attack1, doInstituto de Pesquisa IDIAP, e a o benchmark NUAA2, da Universidade de Aeronáutica eAstronáutica Nanjing, os seus proprietários não permitem a divulgação, feita por terceiros,de dados gerados durante experimentos científicos que utilizam tais bases, o que dificultaa geração e a disseminação de novos conhecimentos adquiridos em pesquisas científicas.Adicionalmente, a existência de bases de dados de vídeos disponíveis para o estudo depossíveis ataques a sistemas de biometria de faces são ainda mais escassos e não temosconhecimento de uma base livre para esse fim.
Procedimentos: Os participantes serão filmados por uma câmera digital, por umperíodo de aproximadamente 2 minutos, em três locais dentro da universidade, com difer-entes condições de iluminação e pose.
Para que a filmagem seja realizada de maneira organizada, diminuindo, ao máximo,o desconforto ou riscos aos participantes, uma fila circular será organizada com a finali-dade de capturar três vídeos de cada participante, com aproximadamente 40 segundos deduração para cada vídeo.
Os locais escolhidos serão internos e externos ao prédio do Instituto de Computação(IC/Unicamp), de modo a permitir a aquisição de vídeos com diferentes condições deiluminação e pose. Tais locais serão arejados, livres de circulação de veículos automotivos,distantes de construções em andamento ou eventos de outra natureza que possam colocarem risco a segurança e a integridade física dos participantes.
As filmagens dos participantes poderão ocorrer durante o dia ou à noite, sendo que,no período diurno, os participantes não ficarão expostos diretamente aos raios solaresdurante a realização da pesquisa.
1A. Anjos and S. Marcel, “Counter-Measures to Photo Attacks in Face Recognition: A Public Databaseand A Baseline,” in International Joint Conference on Biometrics (IJCB’11), 2011.
2X.Tan, Y.Li, J.Liu, and L.Jiang. “Face Liveness Detection from A Single Image with Sparse LowRank Bilinear Discriminative Model,” In Proceedings of 11th European Conference on Computer Vision(ECCV’10), 2010.

194
Desconfortos e riscos: Durante a realização da pesquisa, poderá haver um certocansaço ou fadiga dos participantes, visto que eles ficarão em uma fila aguardando asua vez de participar na coleta em andamento. No entanto, como a duração dos vídeos écurta para cada participante, problemas dessa natureza não deverão trazer desconfortosmais sérios aos participantes. Não há riscos previsíveis.
Benefícios: O participante contribuirá com informações úteis para o desenvolvimento ea avaliação de novos métodos que visam melhorar a segurança dos sistemas de computação,como por exemplo, sistemas que possuem mecanismos de controle de acesso por biometriafacial.
Métodos alternativos: Não há métodos alternativos para a obtenção das informaçõesdesejadas, pois a única forma para obtenção de vídeos da face dos participantes é pormeio de filmagem com uma câmera digital.
Acompanhamento e assistência: Não se aplica.
Esclarecimentos: Em caso de dúvidas, o participante poderá entrar em contato, aqualquer momento, com Prof. Dr. Anderson de Rezende Rocha, pelo telefone (19) 3521-5854 ou pelo e-mail [email protected], responsável por essa pesquisa.
Possibilidade de inclusão em grupo controle ou placebo: Não se aplica.
Possibilidade de desistência: É assegurado ao participante o direito de poder aban-donar a pesquisa a qualquer momento e sem aviso prévio. O participante que assim ofizer não sofrerá penalidade alguma, constrangimento ou represália de qualquer natureza.
Critérios de Inclusão e Exclusão dos Participantes: Os participantes serão convi-dados a participar da pesquisa por meio da divulgação de comunicados que serão afixadosnos quadros de avisos do Instituto de Computação da Unicamp. Adicionalmente, essescomunicados serão enviados por e-mail para os alunos de graduação, pós-graduação e paraos docentes do mesmo instituto. Dado o caráter voluntário da pesquisa, caso o númerode participantes não seja suficiente para a realização da mesma, comunicados serão envi-ados às listas de e-mails dos alunos de graduação e pós-graduação dos outros institutospertencentes à Unicamp. Para participar da pesquisa, o candidato deverá atender aosseguintes critérios: (1) ser maior de 18 anos; e (2) residir na Região Metropolitana deCampinas. Ressalta-se que a participação é voluntária e o interessado pode desistir semprejuízos às partes em qualquer momento sem necessidade de justificativa prévia. Emcaso de desistência de um candidato, o candidato subsequente será chamado sem maioresprejuízos à pesquisa ou às partes envolvidas.
Sigilo de dados confidenciais: Não se aplica.

195
Despesas decorrentes da participação: Os participantes não terão nenhuma despesacom a pesquisa, dessa forma, não está previsto ressarcimento decorrente da participaçãona pesquisa.
Riscos previsíveis: A pesquisa não envolve riscos previsíveis, visto que o participanteserá apenas filmado com um câmera digital comum, procedimento simples que não oferecerisco ou dano à integridade física, psíquica, moral ou de outra natureza.
Ao participante: O participante receberá uma cópia deste Termo de ConsentimentoLivre e Esclarecido (TCLE) para posteriores consultas ou esclarecimentos de dúvidas,contendo a assinatura do responsável pela pesquisa na última página deste termo, bemcomo a sua rubrica em todas as páginas.
Autorização para uso de imagem: O participante autoriza a utilização de sua im-agem apenas para o uso em pesquisas científicas, incluindo a confecção e divulgação detrabalhos científicos em todo o território brasileiro e no exterior. É assegurado ao partici-pante que seus dados capturados não sofrerão nenhuma manipulação que possa lhe causareventuais constrangimentos ou danos morais e psíquicos. As imagens dos participantesserão armazenadas em dispositivos acessíveis apenas pelos pesquisadores envolvidos napesquisa. Caso outros pesquisadores ou grupos de pesquisa tenham interesse em utilizaresses dados em seus trabalhos, os mesmos terão que assinar um termo de responsabilidadesobre a utilização e proteção de tais dados. Ao concordar com este Termo de Consen-timento Livre e Esclarecido (TCLE), o participante estará cedendo permanentemente osdireitos de sua imagem para os fins descritos neste parágrafo.

196
Sobre o responsável: O participante poderá entrar em contato, a qualquer momento,com o responsável pela pesquisa, Prof. Dr. Anderson de Rezende Rocha, por meio dosseguintes canais de comunicação:
Prof. Dr. Anderson de Rezende Rocha
Endereço profissional: Av. Albert Einstein, 1251, Sala 40,Cidade Universitária, Campinas-SP, 13083-852
Telefone: (19) 3521-5854
e-mail: [email protected]
Comitê de ética em pesquisa: Caso o participante tenha alguma denúncia ou recla-mações referentes aos aspectos éticos da presente pesquisa, este deve entrar em contatocom o Comitê de Ética em Pesquisa (CEP) da Faculdade de Ciências Médicas (FCM) daUniversidade Estadual de Campinas (UNICAMP), por e-mail, telefone ou pessoalmente,no seguinte endereço:
Comitê de Ética em Pesquisa (CEP/ FCM/ UNICAMP)
Endereço: Rua Tessália Vieira de Camargo, 126Cidade Universitária, Campinas-SP, 13083-887
Telefone: (19) 3521-8936 ou (19) 3521-7187
e-mail: [email protected]
Sendo assim, eu, . . . . . . . . . . . . . . . . . . . . . . . . . . . . . . . . . . . . . . . . . . . . . . . . . . . . . . . . . . . . . . .,declaro ter lido as cláusulas acima e concordo em participar da pesquisa referente a esteTermo de Consentimento Livre e Esclarecido (TCLE), que está sob a responsabilidadedo Prof. Dr. Anderson de Rezende Rocha, pesquisador e professor do Instituto de Com-putação (IC) da Universidade Estadual de Campinas (UNICAMP).
Participante
Responsável: Prof. Dr. Anderson de Rezende Rocha

197
Appendix B
Convolutional Network Operations
Our networks use classic convolutional operations that can be viewed as linear and non-linear image processing operations. When stacked, these operations essentially extracthigher level representations, named multiband images, whose pixel attributes are concate-nated into high-dimensional feature vectors for later pattern recognition.1
Assuming I = (DI , I) as a multiband image, where DI ⊂ Z2 is the image domain andI(p) = {I1(p), I2(p), . . . , Im(p)} is the attribute vector of am-band pixel p = (xp, yp) ∈ DI ,the aforementioned operations can be described as follows.
Filter Bank Convolution
Let A(p) be a squared region centered at p of size LA × LA, such that A ⊂ DI andq ∈ A(p) iff max(|xq − xp|, |yq − yp|) ≤ (LA − 1)/2. Additionally, let Φ = (A,W ) be afilter with weights W (q) associated with pixels q ∈ A(p). In the case of multiband filters,filter weights can be represented as vectors Wi(q) = {wi,1(q), wi,2(q), . . . , wi,m(q)} for eachfilter i of the bank, and a multiband filter bank Φ = {Φ1,Φ2, . . . ,Φn} is a set of filtersΦi = (A,Wi), i = {1, 2, . . . , n}.
The convolution between an input image I and a filter Φi produces a band i of thefiltered image J = (DJ ,J), where DJ ⊂ DI and J = (J1, J2, . . . , Jn), such that for eachp ∈ DJ ,
Ji(p) =∑∀q∈A(p)
I(q) ·Wi(q). (B.1)
Rectified Linear Activation
Filter activation in this work is performed by rectified linear units (RELUs) of the typepresent in many state-of-the-art convolutional architectures [130,194] and is defined as
Ji(p) = max(Ji(p), 0). (B.2)1This appendix describes convolutional networks from an image processing perspective, therefore the
use of terms like image domain, image band, etc.

198
Spatial Pooling
Spatial pooling is an operation of paramount importance in the literature of convolutionalnetworks [135] that aims at bringing translational invariance to the features by aggregatingactivations from the same filter in a given region.
Let B(p) be a pooling region of size LB × LB centered at pixel p and DK = DJ/s
be a regular subsampling of every s pixels p ∈ DJ . We call s the stride of the poolingoperation. Given that DJ ⊂ Z2, if s = 2, |DK | = |DJ |/4, for example. The poolingoperation resulting in the image K = (DK ,K) is defined as
Ki(p) = α
√ ∑∀q∈B(p)
Ji(q)α, (B.3)
where p ∈ DK are pixels in the new image, i = {1, 2, . . . , n} are the image bands, andα is a hyperparameter that controls the sensitivity of the operation. In other words, ourpooling operation is the Lα-norm of values in B(p). The stride s and the size of thepooling neighborhood defined by LB are other hyperparameters of the operation.
Divisive Normalization
The last operation considered in this work is divisive normalization, a mechanism widelyused in top-performing convolutional networks [130, 194] that is based on gain controlmechanisms found in cortical neurons [79].
This operation is also defined within a squared region C(p) of size LC ×LC centered atpixel p such that
Oi(p) =Ki(p)√∑n
j=1
∑∀q∈C(p)Kj(q)2
(B.4)
for each pixel p ∈ DO ⊂ DK of the resulting image O = (DO,O). Divisive normalizationpromotes competition among pooled filter bands such that high responses will prevail evenmore over low ones, further strengthening the robustness of the output representationO.

199
Appendix C
Copyright Permissions

Title: Using Visual Rhythms for
Detecting Video-Based Facial
Spoof Attacks
Author: Allan Pinto
Publication: Information Forensics and
Security, IEEE Transactions on
Publisher: IEEE
Date: May 2015
Copyright © 2015, IEEE
Logged in as:
Allan Pinto
Account #:
3000911363
Thesis / Dissertation Reuse
The IEEE does not require individuals working on a thesis to obtain a formal reuse license, however,
you may print out this statement to be used as a permission grant:
Requirements to be followed when using any portion (e.g., figure, graph, table, or textual material) of an IEEE
copyrighted paper in a thesis:
1) In the case of textual material (e.g., using short quotes or referring to the work within these papers) users
must give full credit to the original source (author, paper, publication) followed by the IEEE copyright line © 2011
IEEE.
2) In the case of illustrations or tabular material, we require that the copyright line © [Year of original
publication] IEEE appear prominently with each reprinted figure and/or table.
3) If a substantial portion of the original paper is to be used, and if you are not the senior author, also obtain the
senior author's approval.
Requirements to be followed when using an entire IEEE copyrighted paper in a thesis:
1) The following IEEE copyright/ credit notice should be placed prominently in the references: © [year of original
publication] IEEE. Reprinted, with permission, from [author names, paper title, IEEE publication title, and
month/year of publication]
2) Only the accepted version of an IEEE copyrighted paper can be used when posting the paper or your thesis
on-line.
3) In placing the thesis on the author's university website, please display the following message in a prominent
place on the website: In reference to IEEE copyrighted material which is used with permission in this thesis, the
IEEE does not endorse any of [university/educational entity's name goes here]'s products or services. Internal or
personal use of this material is permitted. If interested in reprinting/republishing IEEE copyrighted material for
advertising or promotional purposes or for creating new collective works for resale or redistribution, please go to
http://www.ieee.org/publications_standards/publications/rights/rights_link.html to learn how to obtain a License
from RightsLink.
If applicable, University Microfilms and/or ProQuest Library, or the Archives of Canada may supply single copies
of the dissertation.
Copyright © 2018 Copyright Clearance Center, Inc. All Rights Reserved. Privacy statement. Terms and Conditions.
Comments? We would like to hear from you. E-mail us at [email protected]

Title: Face Spoofing Detection
Through Visual Codebooks of
Spectral Temporal Cubes
Author: Allan Pinto
Publication: Image Processing, IEEE
Transactions on
Publisher: IEEE
Date: Dec. 2015
Copyright © 2015, IEEE
Logged in as:
Allan Pinto
Account #:
3000911363
Thesis / Dissertation Reuse
The IEEE does not require individuals working on a thesis to obtain a formal reuse license, however,
you may print out this statement to be used as a permission grant:
Requirements to be followed when using any portion (e.g., figure, graph, table, or textual material) of an IEEE
copyrighted paper in a thesis:
1) In the case of textual material (e.g., using short quotes or referring to the work within these papers) users
must give full credit to the original source (author, paper, publication) followed by the IEEE copyright line © 2011
IEEE.
2) In the case of illustrations or tabular material, we require that the copyright line © [Year of original
publication] IEEE appear prominently with each reprinted figure and/or table.
3) If a substantial portion of the original paper is to be used, and if you are not the senior author, also obtain the
senior author's approval.
Requirements to be followed when using an entire IEEE copyrighted paper in a thesis:
1) The following IEEE copyright/ credit notice should be placed prominently in the references: © [year of original
publication] IEEE. Reprinted, with permission, from [author names, paper title, IEEE publication title, and
month/year of publication]
2) Only the accepted version of an IEEE copyrighted paper can be used when posting the paper or your thesis
on-line.
3) In placing the thesis on the author's university website, please display the following message in a prominent
place on the website: In reference to IEEE copyrighted material which is used with permission in this thesis, the
IEEE does not endorse any of [university/educational entity's name goes here]'s products or services. Internal or
personal use of this material is permitted. If interested in reprinting/republishing IEEE copyrighted material for
advertising or promotional purposes or for creating new collective works for resale or redistribution, please go to
http://www.ieee.org/publications_standards/publications/rights/rights_link.html to learn how to obtain a License
from RightsLink.
If applicable, University Microfilms and/or ProQuest Library, or the Archives of Canada may supply single copies
of the dissertation.
Copyright © 2018 Copyright Clearance Center, Inc. All Rights Reserved. Privacy statement. Terms and Conditions.
Comments? We would like to hear from you. E-mail us at [email protected]

Title: Deep Representations for Iris,
Face, and Fingerprint Spoofing
Detection
Author: David Menotti
Publication: Information Forensics and
Security, IEEE Transactions on
Publisher: IEEE
Date: April 2015
Copyright © 2015, IEEE
Logged in as:
Allan Pinto
Account #:
3000911363
Thesis / Dissertation Reuse
The IEEE does not require individuals working on a thesis to obtain a formal reuse license, however,
you may print out this statement to be used as a permission grant:
Requirements to be followed when using any portion (e.g., figure, graph, table, or textual material) of an IEEE
copyrighted paper in a thesis:
1) In the case of textual material (e.g., using short quotes or referring to the work within these papers) users
must give full credit to the original source (author, paper, publication) followed by the IEEE copyright line © 2011
IEEE.
2) In the case of illustrations or tabular material, we require that the copyright line © [Year of original
publication] IEEE appear prominently with each reprinted figure and/or table.
3) If a substantial portion of the original paper is to be used, and if you are not the senior author, also obtain the
senior author's approval.
Requirements to be followed when using an entire IEEE copyrighted paper in a thesis:
1) The following IEEE copyright/ credit notice should be placed prominently in the references: © [year of original
publication] IEEE. Reprinted, with permission, from [author names, paper title, IEEE publication title, and
month/year of publication]
2) Only the accepted version of an IEEE copyrighted paper can be used when posting the paper or your thesis
on-line.
3) In placing the thesis on the author's university website, please display the following message in a prominent
place on the website: In reference to IEEE copyrighted material which is used with permission in this thesis, the
IEEE does not endorse any of [university/educational entity's name goes here]'s products or services. Internal or
personal use of this material is permitted. If interested in reprinting/republishing IEEE copyrighted material for
advertising or promotional purposes or for creating new collective works for resale or redistribution, please go to
http://www.ieee.org/publications_standards/publications/rights/rights_link.html to learn how to obtain a License
from RightsLink.
If applicable, University Microfilms and/or ProQuest Library, or the Archives of Canada may supply single copies
of the dissertation.
Copyright © 2018 Copyright Clearance Center, Inc. All Rights Reserved. Privacy statement. Terms and Conditions.
Comments? We would like to hear from you. E-mail us at [email protected]

Taylor and Francis Group LLC Books LICENSE
TERMS AND CONDITIONS
Jul 23, 2018
This is a License Agreement between Allan Pinto ("You") and Taylor and Francis GroupLLC Books ("Taylor and Francis Group LLC Books") provided by Copyright ClearanceCenter ("CCC"). The license consists of your order details, the terms and conditionsprovided by Taylor and Francis Group LLC Books, and the payment terms and conditions.
All payments must be made in full to CCC. For payment instructions, please see
information listed at the bottom of this form.
License Number 4394800794229
License date Jul 20, 2018
Licensed content publisher Taylor and Francis Group LLC Books
Licensed content title Deep Learning in Biometrics
Licensed content date Mar 12, 2018
Type of Use Thesis/Dissertation
Requestor type Academic institution
Format Print, Electronic
Portion chapter/article
Number of pages in
chapter/article
50
The requesting
person/organization is:
Allan da Silva Pinto/University of Campinas
Title or numeric reference of
the portion(s)
Chapter 11
Title of the article or chapter
the portion is from
Counteracting Presentation Attacks in Face, Fingerprint, and Iris
Recognition
Editor of portion(s) N/A
Author of portion(s) Allan Pinto, Helio Pedrini, Michael Krumdick, Benedict Becker, Adam
Czajka, Kevin W. Bowyer, and Anderson Rocha
Volume of serial or
monograph.
N/A
Page range of the portion 11/245-295
Publication date of portion 2018
Rights for Main product
Duration of use Life of current edition
Creation of copies for the no

disabled
With minor editing privileges yes
For distribution to Worldwide
In the following language(s) Original language of publication
With incidental promotional
use
no
The lifetime unit quantity of
new product
Up to 2,000,000
Title Analysis of Intrinsic and Extrinsic Properties of Biometric Samples
for Presentation Attack Detection
Instructor name Prof. Dr. Anderson de Rezende Rocha
Institution name Institute of Computing, University of Campinas
Expected presentation date Sep 2018
Billing Type Invoice
Billing Address Allan Pinto
Av. Albert Einstein, 1251
Cidade Universitária Zeferino Vaz
Campinas, Brazil 13180230
Attn: Allan Pinto
Total (may include CCC user
fee)
0.00 USD
Terms and Conditions
TERMS AND CONDITIONSThe following terms are individual to this publisher:
Taylor and Francis Group and Informa healthcare are division of Informa plc. Permissionwill be void if material exceeds 10% of all the total pages in your publication and over 20%of the original publication. This includes permission granted by Informa plc and all of itssubsidaries.
Other Terms and Conditions:Please make sure the appropriate source is credited. Insert information as appropriate. Eachcopy containing our material must bear a credit line in the following format: Copyright(Insert © Year) From (Insert Title) by (Insert Author/Editor Name). Reproduced bypermission of Taylor and Francis Group, LLC, a division of Informa plc This permissiondoes not cover any third party copyrighted work which may appear in the material requested.
STANDARD TERMS AND CONDITIONS1. Description of Service; Defined Terms. This Republication License enables the User toobtain licenses for republication of one or more copyrighted works as described in detail onthe relevant Order Confirmation (the “Work(s)”). Copyright Clearance Center, Inc. (“CCC”)grants licenses through the Service on behalf of the rightsholder identified on the OrderConfirmation (the “Rightsholder”). “Republication”, as used herein, generally means theinclusion of a Work, in whole or in part, in a new work or works, also as described on the

Order Confirmation. “User”, as used herein, means the person or entity making suchrepublication.2. The terms set forth in the relevant Order Confirmation, and any terms set by theRightsholder with respect to a particular Work, govern the terms of use of Works inconnection with the Service. By using the Service, the person transacting for a republicationlicense on behalf of the User represents and warrants that he/she/it (a) has been dulyauthorized by the User to accept, and hereby does accept, all such terms and conditions onbehalf of User, and (b) shall inform User of all such terms and conditions. In the event suchperson is a “freelancer” or other third party independent of User and CCC, such party shallbe deemed jointly a “User” for purposes of these terms and conditions. In any event, Usershall be deemed to have accepted and agreed to all such terms and conditions if Userrepublishes the Work in any fashion.3. Scope of License; Limitations and Obligations.3.1 All Works and all rights therein, including copyright rights, remain the sole andexclusive property of the Rightsholder. The license created by the exchange of an OrderConfirmation (and/or any invoice) and payment by User of the full amount set forth on thatdocument includes only those rights expressly set forth in the Order Confirmation and inthese terms and conditions, and conveys no other rights in the Work(s) to User. All rights notexpressly granted are hereby reserved.3.2 General Payment Terms: You may pay by credit card or through an account with uspayable at the end of the month. If you and we agree that you may establish a standingaccount with CCC, then the following terms apply: Remit Payment to: Copyright ClearanceCenter, 29118 Network Place, Chicago, IL 60673-1291. Payments Due: Invoices are payableupon their delivery to you (or upon our notice to you that they are available to you fordownloading). After 30 days, outstanding amounts will be subject to a service charge of 1-1/2% per month or, if less, the maximum rate allowed by applicable law. Unless otherwisespecifically set forth in the Order Confirmation or in a separate written agreement signed byCCC, invoices are due and payable on “net 30” terms. While User may exercise the rightslicensed immediately upon issuance of the Order Confirmation, the license is automaticallyrevoked and is null and void, as if it had never been issued, if complete payment for thelicense is not received on a timely basis either from User directly or through a paymentagent, such as a credit card company.3.3 Unless otherwise provided in the Order Confirmation, any grant of rights to User (i) is“one-time” (including the editions and product family specified in the license), (ii) is non-exclusive and non-transferable and (iii) is subject to any and all limitations and restrictions(such as, but not limited to, limitations on duration of use or circulation) included in theOrder Confirmation or invoice and/or in these terms and conditions. Upon completion of thelicensed use, User shall either secure a new permission for further use of the Work(s) orimmediately cease any new use of the Work(s) and shall render inaccessible (such as bydeleting or by removing or severing links or other locators) any further copies of the Work(except for copies printed on paper in accordance with this license and still in User's stock atthe end of such period).3.4 In the event that the material for which a republication license is sought includes thirdparty materials (such as photographs, illustrations, graphs, inserts and similar materials)which are identified in such material as having been used by permission, User is responsiblefor identifying, and seeking separate licenses (under this Service or otherwise) for, any of

such third party materials; without a separate license, such third party materials may not beused.3.5 Use of proper copyright notice for a Work is required as a condition of any licensegranted under the Service. Unless otherwise provided in the Order Confirmation, a propercopyright notice will read substantially as follows: “Republished with permission of[Rightsholder’s name], from [Work's title, author, volume, edition number and year ofcopyright]; permission conveyed through Copyright Clearance Center, Inc. ” Such noticemust be provided in a reasonably legible font size and must be placed either immediatelyadjacent to the Work as used (for example, as part of a by-line or footnote but not as aseparate electronic link) or in the place where substantially all other credits or notices for thenew work containing the republished Work are located. Failure to include the required noticeresults in loss to the Rightsholder and CCC, and the User shall be liable to pay liquidateddamages for each such failure equal to twice the use fee specified in the Order Confirmation,in addition to the use fee itself and any other fees and charges specified.3.6 User may only make alterations to the Work if and as expressly set forth in the OrderConfirmation. No Work may be used in any way that is defamatory, violates the rights ofthird parties (including such third parties' rights of copyright, privacy, publicity, or othertangible or intangible property), or is otherwise illegal, sexually explicit or obscene. Inaddition, User may not conjoin a Work with any other material that may result in damage tothe reputation of the Rightsholder. User agrees to inform CCC if it becomes aware of anyinfringement of any rights in a Work and to cooperate with any reasonable request of CCCor the Rightsholder in connection therewith.4. Indemnity. User hereby indemnifies and agrees to defend the Rightsholder and CCC, andtheir respective employees and directors, against all claims, liability, damages, costs andexpenses, including legal fees and expenses, arising out of any use of a Work beyond thescope of the rights granted herein, or any use of a Work which has been altered in anyunauthorized way by User, including claims of defamation or infringement of rights ofcopyright, publicity, privacy or other tangible or intangible property.5. Limitation of Liability. UNDER NO CIRCUMSTANCES WILL CCC OR THERIGHTSHOLDER BE LIABLE FOR ANY DIRECT, INDIRECT, CONSEQUENTIAL ORINCIDENTAL DAMAGES (INCLUDING WITHOUT LIMITATION DAMAGES FORLOSS OF BUSINESS PROFITS OR INFORMATION, OR FOR BUSINESSINTERRUPTION) ARISING OUT OF THE USE OR INABILITY TO USE A WORK,EVEN IF ONE OF THEM HAS BEEN ADVISED OF THE POSSIBILITY OF SUCHDAMAGES. In any event, the total liability of the Rightsholder and CCC (including theirrespective employees and directors) shall not exceed the total amount actually paid by Userfor this license. User assumes full liability for the actions and omissions of its principals,employees, agents, affiliates, successors and assigns.6. Limited Warranties. THE WORK(S) AND RIGHT(S) ARE PROVIDED “AS IS”. CCCHAS THE RIGHT TO GRANT TO USER THE RIGHTS GRANTED IN THE ORDERCONFIRMATION DOCUMENT. CCC AND THE RIGHTSHOLDER DISCLAIM ALLOTHER WARRANTIES RELATING TO THE WORK(S) AND RIGHT(S), EITHEREXPRESS OR IMPLIED, INCLUDING WITHOUT LIMITATION IMPLIEDWARRANTIES OF MERCHANTABILITY OR FITNESS FOR A PARTICULARPURPOSE. ADDITIONAL RIGHTS MAY BE REQUIRED TO USE ILLUSTRATIONS,GRAPHS, PHOTOGRAPHS, ABSTRACTS, INSERTS OR OTHER PORTIONS OF THEWORK (AS OPPOSED TO THE ENTIRE WORK) IN A MANNER CONTEMPLATED

BY USER; USER UNDERSTANDS AND AGREES THAT NEITHER CCC NOR THERIGHTSHOLDER MAY HAVE SUCH ADDITIONAL RIGHTS TO GRANT.7. Effect of Breach. Any failure by User to pay any amount when due, or any use by User ofa Work beyond the scope of the license set forth in the Order Confirmation and/or theseterms and conditions, shall be a material breach of the license created by the OrderConfirmation and these terms and conditions. Any breach not cured within 30 days ofwritten notice thereof shall result in immediate termination of such license without furthernotice. Any unauthorized (but licensable) use of a Work that is terminated immediately uponnotice thereof may be liquidated by payment of the Rightsholder's ordinary license pricetherefor; any unauthorized (and unlicensable) use that is not terminated immediately for anyreason (including, for example, because materials containing the Work cannot reasonably berecalled) will be subject to all remedies available at law or in equity, but in no event to apayment of less than three times the Rightsholder's ordinary license price for the mostclosely analogous licensable use plus Rightsholder's and/or CCC's costs and expensesincurred in collecting such payment.8. Miscellaneous.8.1 User acknowledges that CCC may, from time to time, make changes or additions to theService or to these terms and conditions, and CCC reserves the right to send notice to theUser by electronic mail or otherwise for the purposes of notifying User of such changes oradditions; provided that any such changes or additions shall not apply to permissions alreadysecured and paid for.8.2 Use of User-related information collected through the Service is governed by CCC’sprivacy policy, available online here:http://www.copyright.com/content/cc3/en/tools/footer/privacypolicy.html.8.3 The licensing transaction described in the Order Confirmation is personal to User.Therefore, User may not assign or transfer to any other person (whether a natural person oran organization of any kind) the license created by the Order Confirmation and these termsand conditions or any rights granted hereunder; provided, however, that User may assignsuch license in its entirety on written notice to CCC in the event of a transfer of all orsubstantially all of User’s rights in the new material which includes the Work(s) licensedunder this Service.8.4 No amendment or waiver of any terms is binding unless set forth in writing and signedby the parties. The Rightsholder and CCC hereby object to any terms contained in anywriting prepared by the User or its principals, employees, agents or affiliates and purportingto govern or otherwise relate to the licensing transaction described in the OrderConfirmation, which terms are in any way inconsistent with any terms set forth in the OrderConfirmation and/or in these terms and conditions or CCC's standard operating procedures,whether such writing is prepared prior to, simultaneously with or subsequent to the OrderConfirmation, and whether such writing appears on a copy of the Order Confirmation or in aseparate instrument.8.5 The licensing transaction described in the Order Confirmation document shall begoverned by and construed under the law of the State of New York, USA, without regard tothe principles thereof of conflicts of law. Any case, controversy, suit, action, or proceedingarising out of, in connection with, or related to such licensing transaction shall be brought, atCCC's sole discretion, in any federal or state court located in the County of New York, Stateof New York, USA, or in any federal or state court whose geographical jurisdiction coversthe location of the Rightsholder set forth in the Order Confirmation. The parties expressly

submit to the personal jurisdiction and venue of each such federal or state court.If you haveany comments or questions about the Service or Copyright Clearance Center, please contactus at 978-750-8400 or send an e-mail to [email protected] 1.1Questions? [email protected] or +1-855-239-3415 (toll free in the US) or
+1-978-646-2777.