Generation and applications of simulated datasets to integrate ...

AlignNemo: A Local Network Alignment Method toIntegrate Homology and TopologyGiovanni Ciriello1*.¤, Marco Mina1., Pietro H. Guzzi2, Mario Cannataro2, Concettina Guerra1,3*
1 Department of Information Engineering, University of Padova, Padova, Italy, 2 Department of Surgical and Medical Sciences, University Magna Graecia of Catanzaro,
Germaneto, Italy, 3 College of Computing, Georgia Institute of Technology, Atlanta, Georgia, United States of America
Abstract
Local network alignment is an important component of the analysis of protein-protein interaction networks that may leadto the identification of evolutionary related complexes. We present AlignNemo, a new algorithm that, given the networks oftwo organisms, uncovers subnetworks of proteins that relate in biological function and topology of interactions. Thediscovered conserved subnetworks have a general topology and need not to correspond to specific interaction patterns, sothat they more closely fit the models of functional complexes proposed in the literature. The algorithm is able to handlesparse interaction data with an expansion process that at each step explores the local topology of the networks beyond theproteins directly interacting with the current solution. To assess the performance of AlignNemo, we ran a series ofbenchmarks using statistical measures as well as biological knowledge. Based on reference datasets of protein complexes,AlignNemo shows better performance than other methods in terms of both precision and recall. We show our solutions tobe biologically sound using the concept of semantic similarity applied to Gene Ontology vocabularies. The binaries ofAlignNemo and supplementary details about the algorithms and the experiments are available at: sourceforge.net/p/alignnemo.
Citation: Ciriello G, Mina M, Guzzi PH, Cannataro M, Guerra C (2012) AlignNemo: A Local Network Alignment Method to Integrate Homology and Topology. PLoSONE 7(6): e38107. doi:10.1371/journal.pone.0038107
Editor: Patrick Aloy, Institute for Research in Biomedicine, Spain
Received June 27, 2011; Accepted May 2, 2012; Published June 12, 2012
Copyright: � 2012 Ciriello et al. This is an open-access article distributed under the terms of the Creative Commons Attribution License, which permitsunrestricted use, distribution, and reproduction in any medium, provided the original author and source are credited.
Funding: This work was funded in part by the CARIPARO project "Systems Biology approaches to infer gene and protein time-series expression data". Thefunders had no role in study design, data collection and analysis, decision to publish, or preparation of the manuscript.
Competing Interests: The authors have declared that no competing interests exist.
* E-mail: [email protected] (GC); [email protected] (CG)
. These authors contributed equally to this work.
¤ Current address: Computational Biology Department, Memorial Sloan-Kettering Cancer Center, New York, New York, United States of America
Introduction
In previous decades researchers have focused on the impact of
the evolution at the genomic scale, i.e. how to reconstruct
evolution by analysing genomic sequences. More recently, the
availability of high-throughput data on protein-protein interac-
tions allowed to look at evolutionary changes by comparing the
map of interactions of proteins, also referred to as interactomes, of
different species [1–3]. Goals of this field include the identification
of conserved patterns of interactions among species as well as the
identification of novel orthology relationships [4]. In this scenario
several algorithms for the comparison of protein-protein interac-
tion (PPI) networks have been developed, often referred to as
network alignment algorithms.
The network alignment problem has two main instances: global
alignment answers an evolutionary question by searching for a single
comprehensive mapping of the whole set of proteins and protein
interactions from different species; local alignment searches for
evolutionary conserved building blocks of the cellular machinery,
disregarding the overall similarity between networks. Formalism
from graph theory provides the best framework to address both.
Within this formalism, PPI networks are represented as graphs (G)
whose nodes (V) are proteins and edges (E) are interactions among
them. The protein network alignment problem is formulated as a
graph alignment problem, i.e. the search for identical or similar
subgraphs between two (pairwise) or more (multiwise) graphs.
Formally: given two input graphs, G1~fV1,E1g and
G2~fV2,E2g, the problem of aligning G1 and G2 can be
formulated as the problem of finding a mapping M between
nodes in G1 and nodes in G2 (M : V�1?V�2 , with
V�1(V1,V�2(V2) that maximizes an associated similarity function
defined on nodes and edges. For the global alignment, M is the
mapping between the whole sets of nodes of the networks. By
contrast for the local alignment, M is defined as the set of
mappings between the most similar subsets of nodes. In this paper
we focus on local alignment of PPI networks and propose a
method that aims at extracting conserved protein complexes in
two PPI networks.
Protein complexes are here defined as groups of proteins
performing similar function or involved in the same biological
process. Existing approaches to detect protein complexes are
generally based on the observation that complexes correspond to
highly interacting sets of proteins and therefore they look for dense
subgraphs in PPI networks. For instance, both versions of
NetworkBLAST [5,6] are based on such hypothesis, evolving
from the initial PathBLAST [7] that focused on conserved paths.
In our proposed approach, we look for relatively dense groups of
nodes, i.e. nodes that have more interactions among themselves
than with the rest of the network, imposing less rigid constraints on
the topologies of complexes. Indeed, while the topology is
PLoS ONE | www.plosone.org 1 June 2012 | Volume 7 | Issue 6 | e38107
informative, it has been shown to be often incomplete and
reflecting a non-uniform knowledge over proteins [8,9]. The
presence of several false negatives leads to sparse graphs and even
sparser sets of conserved interactions between species, causing
approaches looking only for dense subgraphs to fail to detect
conserved complexes.
Several approaches, such as NetworkBLAST, rely for the search
of conserved complexes on a structure called alignment graph. The
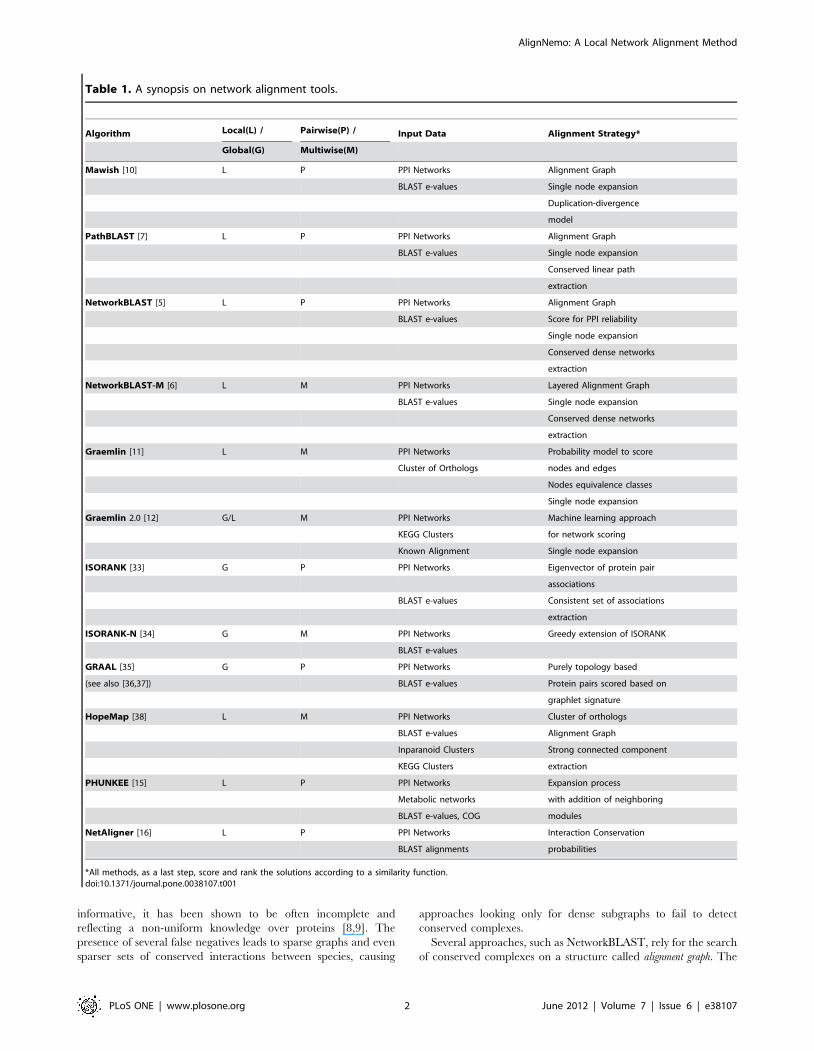
Table 1. A synopsis on network alignment tools.
Algorithm Local(L) / Pairwise(P) / Input Data Alignment Strategy*
Global(G) Multiwise(M)
Mawish [10] L P PPI Networks Alignment Graph
BLAST e-values Single node expansion
Duplication-divergence
model
PathBLAST [7] L P PPI Networks Alignment Graph
BLAST e-values Single node expansion
Conserved linear path
extraction
NetworkBLAST [5] L P PPI Networks Alignment Graph
BLAST e-values Score for PPI reliability
Single node expansion
Conserved dense networks
extraction
NetworkBLAST-M [6] L M PPI Networks Layered Alignment Graph
BLAST e-values Single node expansion
Conserved dense networks
extraction
Graemlin [11] L M PPI Networks Probability model to score
Cluster of Orthologs nodes and edges
Nodes equivalence classes
Single node expansion
Graemlin 2.0 [12] G/L M PPI Networks Machine learning approach
KEGG Clusters for network scoring
Known Alignment Single node expansion
ISORANK [33] G P PPI Networks Eigenvector of protein pair
associations
BLAST e-values Consistent set of associations
extraction
ISORANK-N [34] G M PPI Networks Greedy extension of ISORANK
BLAST e-values
GRAAL [35] G P PPI Networks Purely topology based
(see also [36,37]) BLAST e-values Protein pairs scored based on
graphlet signature
HopeMap [38] L M PPI Networks Cluster of orthologs
BLAST e-values Alignment Graph
Inparanoid Clusters Strong connected component
KEGG Clusters extraction
PHUNKEE [15] L P PPI Networks Expansion process
Metabolic networks with addition of neighboring
BLAST e-values, COG modules
NetAligner [16] L P PPI Networks Interaction Conservation
BLAST alignments probabilities
*All methods, as a last step, score and rank the solutions according to a similarity function.doi:10.1371/journal.pone.0038107.t001
AlignNemo: A Local Network Alignment Method
PLoS ONE | www.plosone.org 2 June 2012 | Volume 7 | Issue 6 | e38107
alignment graph has nodes corresponding to pairs of orthologous
proteins and edges to conserved interactions. To cope with missing
information, NetworkBLAST, as well as similar approaches,
introduced less restrictive definitions of alignment graph, by
allowing nodes to be connected if the respective pairs of
orthologous proteins in the original PPI networks are at distance
less than or equal to k (for NetworkBLAST k~2). However, in this
way several unreliable links may be added to the alignment graph
leading to incorrect solutions even for small values of k.
The method Mawish [10] addresses network alignment as a
maximum weight induced subgraph problem, incorporating
evolutionary models to assess topological similarity. While
effective, this model may be too strict leading, as we observed in
our experiments, to identify only small conserved structures, and
failing in recovering larger complexes.
Other algorithms, such as Graemlin [11] and its new version
Graemlin 2.0 [12], generalize previous approaches by allowing the
search of more general topologies. These methods increase the
ability of detecting meaningful alignments by using, in addition to
orthology information, paralogy relations between proteins from
Inparanoid [13], KEGG pathway annotations [14], and known
alignments. However, these approaches do not fully exploit
topological information, as the local alignment step only examines
the direct neighborhood of each node, grouping the best neighbors
iteratively in a greedy fashion.
PHUNKEE [15] made a step forward in considering locally
conserved subnetworks in a network context: after selecting sets of
putative orthologs, this method explores all adjacent proteins at
the same time looking for highly conserved interaction sets.
However, all interactions have the same reliability and network
context defined by PHUNKEE does not go beyond direct
interactors. Finally, concurrently to the development of this work,
a novel method, NetAligner [16], devised an algorithmic
framework for the alignment of proteomes. NetAligner introduces
a strategy to identify evolutionary conserved interactions, relying
on the principle that interacting proteins evolve at rates
significantly closer than expected by chance.
While a detailed description of available algorithms for both
global and local network alignment is beyond the scope of this
paper, a more extensive synopsis on available tools is provided in
Table 1.
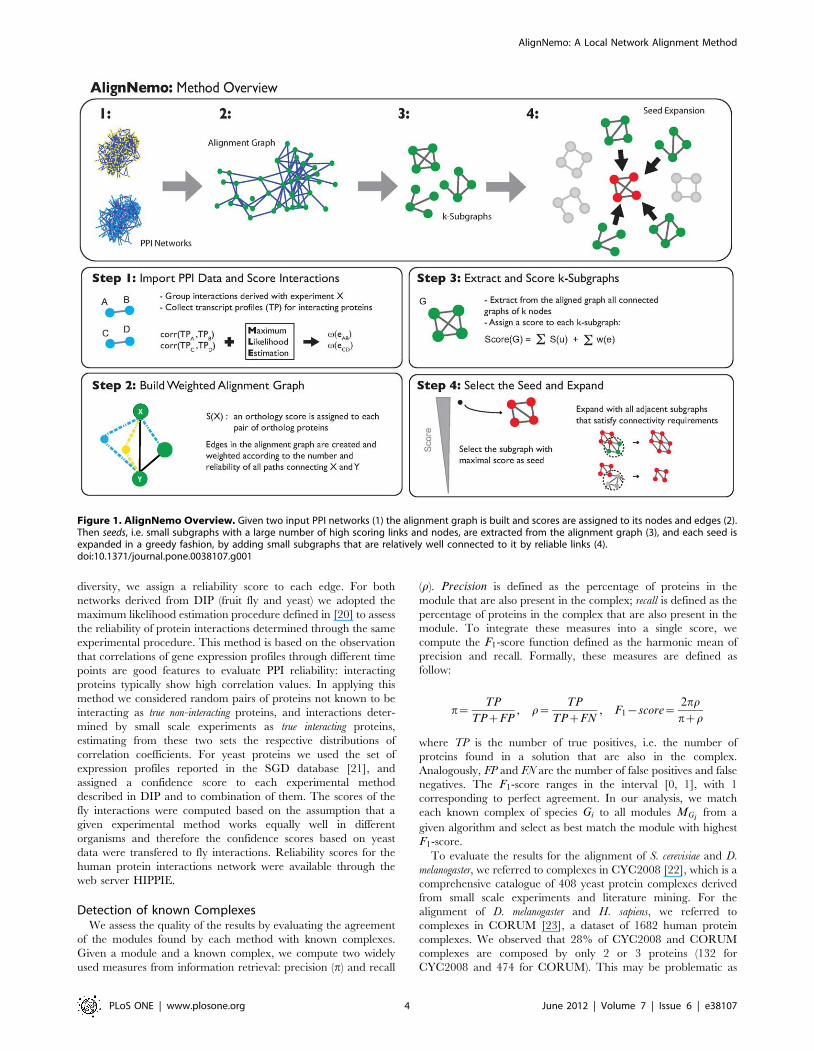
We introduce here a method, AlignNemo (Aligning Network
Modules), that addresses the issues reported above by providing a
general and effective framework for local network alignment.
AlignNemo proceeds through different steps as outlined in
Figure 1. First, it builds a weighted alignment graph from the
input networks. Nodes represent pairs of putative orthologous
proteins and are scored as in Inparanoid, reflecting the confidence
on mapping the protein pairs. Edges, by contrast are weighted
with a novel approach that accounts for the local connectivity in
the input networks (see Methods). Then, we extract all connected
subgraphs of a given size from the alignment graph and rank them
according to weights on nodes and edges. Top ranking fully
connected subgraphs will be used as seeds for the alignment
solution. Finally, we expand each seed in an iterative fashion by
adding multiple subgraphs at each step. This allows us to explore
the network context of a solution beyond its immediate neighbors.
A formal description of the algorithm is provided in the Methods
section.
The main contributions of our approach are: 1) a new strategy
to score the edges of the alignment graph that analyzes the
structure of the input PPI networks through their collections of
paths between two given nodes and estimates their reliability and
local significance; 2) a new iterative expansion procedure, that
starting from a seed, explores the local topology of the alignment
graph at each step beyond direct interactions. This combination
provides a new way to account for both topology and homology,
and proves effective in detecting a large variety of protein
complexes independently of their size or degree of connectivity.
In the next section, we show as a proof of principle results for
the alignment of PPI networks of S.cerevisiae, D.melanogaster, and
H.sapiens. We demonstrate that our alignments have superior
topological and biological quality over other approaches. The
quality of the results is evaluated in various ways: we first show the
ability of AlignNemo to recover known protein complexes by
means of the measures of precision and recall, then we show that
our solutions are biologically sound using the concept of semantic
similarity applied to Gene Ontology vocabularies, finally we show
that the extracted modules preserve high connectivity even with
the less restrictive constraints imposed by the method.
Representative complexes are discussed in details and compar-
isons are provided with local alignment tools such as Network-
BLAST, Mawish, and NetAligner as the only ones for which the
software was available and currently maintained. We selected
NetworkBLAST and Mawish for the main analyses as they are
usable with user defined input data, while we compared
AlignNemo and NetAligner separately as we ran the latter on its
own data and interaction probabilities. AlignNemo, along with
proper documentation and the datasets used in this paper, is
available at http://www.bioinformatics.org/alignnemo.
Results and Discussion
In this section, we evaluate the performance of AlignNemo,
NetworkBLAST, and Mawish on publicly available datasets for D.
melanogaster (fruit fly), S. cerevisiae (baker’s yeast), and H. sapiens
(human). We ran these methods on the same datasets, and each
algorithm produced a set of solutions, or modules, possibly
overlapping. A module M is a subgraph of the alignment graph
containing a set of protein pairs from the two input networks. We
will refer to the set of proteins from network G1 and G2 in M as
MG1and MG2
respectively.
Solutions from each method are evaluated and compared in
terms homology and topology. First, we show that AlignNemo is
able to recapitulate known protein complexes with high precision
and recall. Then, we show that associations of proteins from
different species are biologically sound using the concept of
semantic similarity applied to Gene Ontology vocabularies.
Finally, we prove that our solutions are more densely connected
than expected by chance. We conclude this section by focusing on
few specific cases to highlight weaknesses and strengths of each
method.
Input DataProtein-protein interactions for D. melanogaster and S. cerevisiae
were derived from the Database of Interacting Proteins (DIP -
updated 10/27/2011) [17]. They include 7548 proteins and 22969
interactions in fly, and 5053 proteins and 22254 interactions in
yeast. Inparanoid [13] was used to select 10045 pairs of putative
orthologous proteins from the two networks, involving 1878
proteins from yeast and 1511 proteins from fruit fly. H. sapiens PPI
network was derived from the HIPPIE database [18]; it includes
12113 proteins and 78559 weighted interactions coming from 17
different sources. A set of putative orthologous protein pairs from
human and fly were obtained from the Gerstein Lab [19].
These data sets integrate multiple sources and include
interactions derived from different methodologies including high-
throughput and small scale experiments. To account for such
AlignNemo: A Local Network Alignment Method
PLoS ONE | www.plosone.org 3 June 2012 | Volume 7 | Issue 6 | e38107
diversity, we assign a reliability score to each edge. For both
networks derived from DIP (fruit fly and yeast) we adopted the
maximum likelihood estimation procedure defined in [20] to assess
the reliability of protein interactions determined through the same
experimental procedure. This method is based on the observation
that correlations of gene expression profiles through different time
points are good features to evaluate PPI reliability: interacting
proteins typically show high correlation values. In applying this
method we considered random pairs of proteins not known to be
interacting as true non-interacting proteins, and interactions deter-
mined by small scale experiments as true interacting proteins,
estimating from these two sets the respective distributions of
correlation coefficients. For yeast proteins we used the set of
expression profiles reported in the SGD database [21], and
assigned a confidence score to each experimental method
described in DIP and to combination of them. The scores of the
fly interactions were computed based on the assumption that a
given experimental method works equally well in different
organisms and therefore the confidence scores based on yeast
data were transfered to fly interactions. Reliability scores for the
human protein interactions network were available through the
web server HIPPIE.
Detection of known ComplexesWe assess the quality of the results by evaluating the agreement
of the modules found by each method with known complexes.
Given a module and a known complex, we compute two widely
used measures from information retrieval: precision (p) and recall
(r). Precision is defined as the percentage of proteins in the
module that are also present in the complex; recall is defined as the
percentage of proteins in the complex that are also present in the
module. To integrate these measures into a single score, we
compute the F1-score function defined as the harmonic mean of
precision and recall. Formally, these measures are defined as
follow:
p~TP
TPzFP, r~
TP
TPzFN, F1{score~
2pr
pzr
where TP is the number of true positives, i.e. the number of
proteins found in a solution that are also in the complex.
Analogously, FP and FN are the number of false positives and false
negatives. The F1-score ranges in the interval [0, 1], with 1
corresponding to perfect agreement. In our analysis, we match
each known complex of species Gi to all modules MGifrom a
given algorithm and select as best match the module with highest
F1-score.
To evaluate the results for the alignment of S. cerevisiae and D.
melanogaster, we referred to complexes in CYC2008 [22], which is a
comprehensive catalogue of 408 yeast protein complexes derived
from small scale experiments and literature mining. For the
alignment of D. melanogaster and H. sapiens, we referred to
complexes in CORUM [23], a dataset of 1682 human protein
complexes. We observed that 28% of CYC2008 and CORUM
complexes are composed by only 2 or 3 proteins (132 for
CYC2008 and 474 for CORUM). This may be problematic as
Figure 1. AlignNemo Overview. Given two input PPI networks (1) the alignment graph is built and scores are assigned to its nodes and edges (2).Then seeds, i.e. small subgraphs with a large number of high scoring links and nodes, are extracted from the alignment graph (3), and each seed isexpanded in a greedy fashion, by adding small subgraphs that are relatively well connected to it by reliable links (4).doi:10.1371/journal.pone.0038107.g001
AlignNemo: A Local Network Alignment Method
PLoS ONE | www.plosone.org 4 June 2012 | Volume 7 | Issue 6 | e38107
statistical measures tend to be hardly interpretable for such small
complexes. For this reason, we restrict our analyses to complexes
with at least 4 proteins, but at the same time we verified the ability
of each method to recover small complexes (2–3 proteins). We
considered a small complex to be recovered if at least 2 of its
proteins overlap with an alignment solution, excluding the
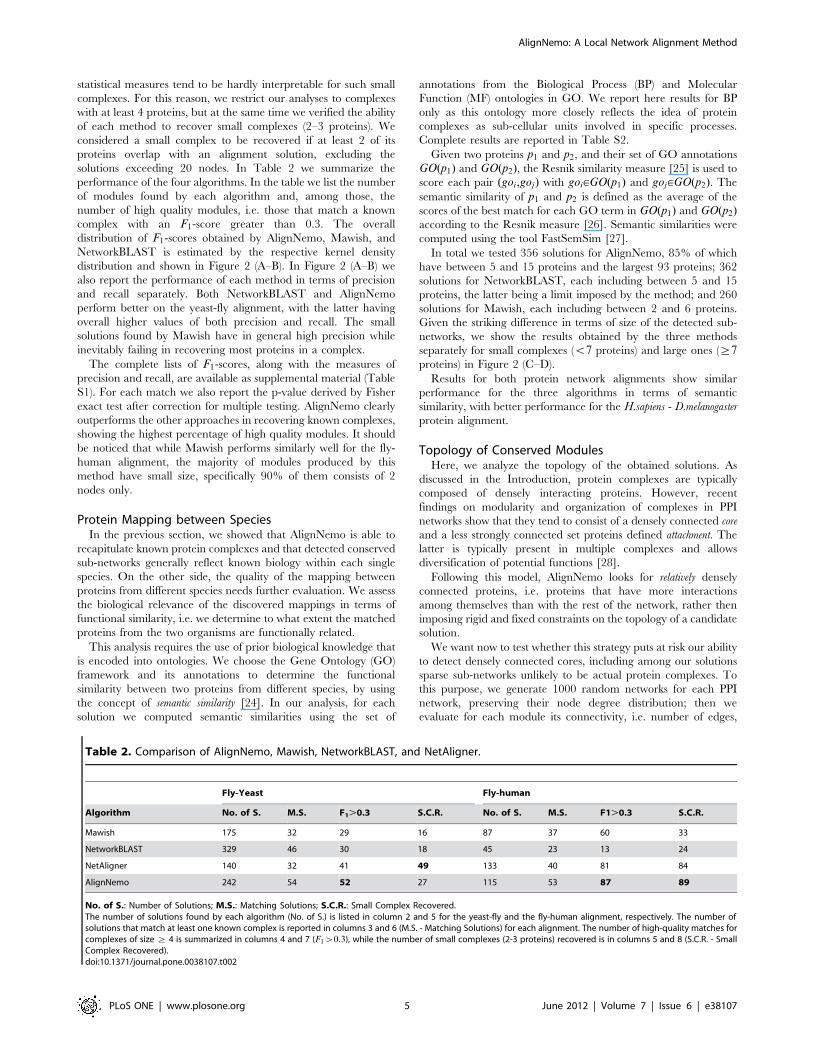
solutions exceeding 20 nodes. In Table 2 we summarize the
performance of the four algorithms. In the table we list the number
of modules found by each algorithm and, among those, the
number of high quality modules, i.e. those that match a known
complex with an F1-score greater than 0.3. The overall
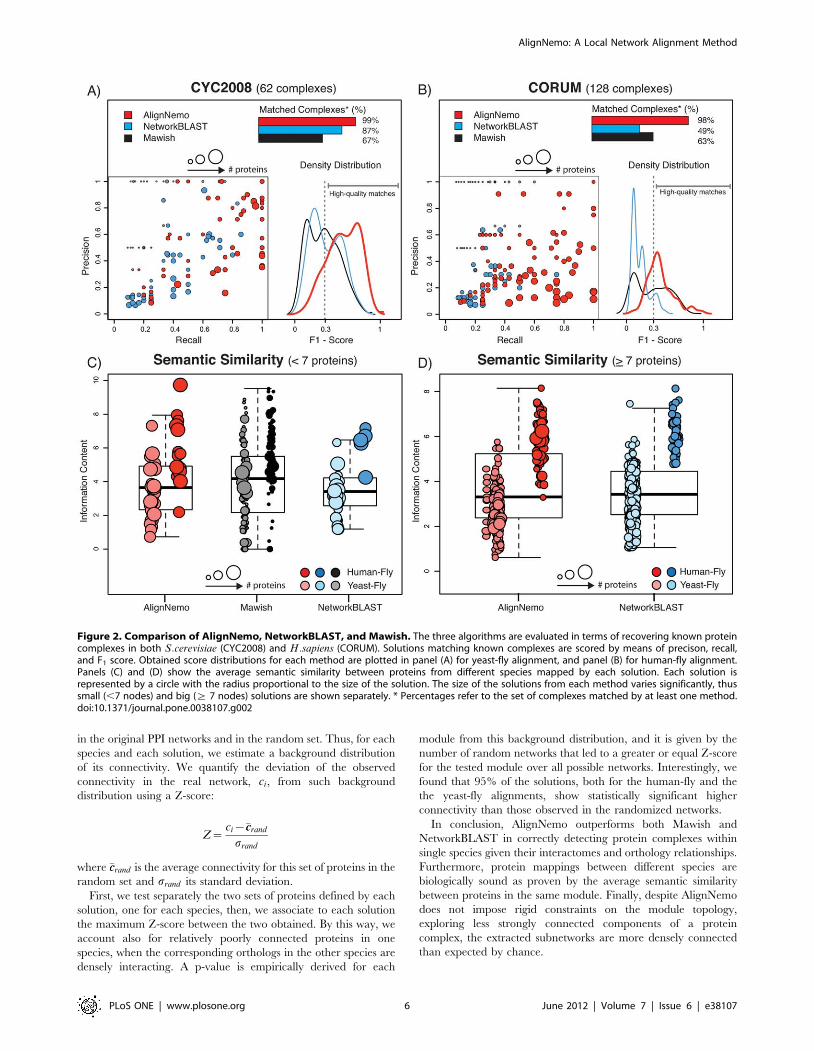
distribution of F1-scores obtained by AlignNemo, Mawish, and
NetworkBLAST is estimated by the respective kernel density
distribution and shown in Figure 2 (A–B). In Figure 2 (A–B) we
also report the performance of each method in terms of precision
and recall separately. Both NetworkBLAST and AlignNemo
perform better on the yeast-fly alignment, with the latter having
overall higher values of both precision and recall. The small
solutions found by Mawish have in general high precision while
inevitably failing in recovering most proteins in a complex.
The complete lists of F1-scores, along with the measures of
precision and recall, are available as supplemental material (Table
S1). For each match we also report the p-value derived by Fisher
exact test after correction for multiple testing. AlignNemo clearly
outperforms the other approaches in recovering known complexes,
showing the highest percentage of high quality modules. It should
be noticed that while Mawish performs similarly well for the fly-
human alignment, the majority of modules produced by this
method have small size, specifically 90% of them consists of 2
nodes only.
Protein Mapping between SpeciesIn the previous section, we showed that AlignNemo is able to
recapitulate known protein complexes and that detected conserved
sub-networks generally reflect known biology within each single
species. On the other side, the quality of the mapping between
proteins from different species needs further evaluation. We assess
the biological relevance of the discovered mappings in terms of
functional similarity, i.e. we determine to what extent the matched
proteins from the two organisms are functionally related.
This analysis requires the use of prior biological knowledge that
is encoded into ontologies. We choose the Gene Ontology (GO)
framework and its annotations to determine the functional
similarity between two proteins from different species, by using
the concept of semantic similarity [24]. In our analysis, for each
solution we computed semantic similarities using the set of
annotations from the Biological Process (BP) and Molecular
Function (MF) ontologies in GO. We report here results for BP
only as this ontology more closely reflects the idea of protein
complexes as sub-cellular units involved in specific processes.
Complete results are reported in Table S2.
Given two proteins p1 and p2, and their set of GO annotations
GO(p1) and GO(p2), the Resnik similarity measure [25] is used to
score each pair (goi,goj) with goi[GO(p1) and goj[GO(p2). The
semantic similarity of p1 and p2 is defined as the average of the
scores of the best match for each GO term in GO(p1) and GO(p2)according to the Resnik measure [26]. Semantic similarities were
computed using the tool FastSemSim [27].
In total we tested 356 solutions for AlignNemo, 85% of which
have between 5 and 15 proteins and the largest 93 proteins; 362
solutions for NetworkBLAST, each including between 5 and 15
proteins, the latter being a limit imposed by the method; and 260
solutions for Mawish, each including between 2 and 6 proteins.
Given the striking difference in terms of size of the detected sub-
networks, we show the results obtained by the three methods
separately for small complexes (v7 proteins) and large ones (§7proteins) in Figure 2 (C–D).
Results for both protein network alignments show similar
performance for the three algorithms in terms of semantic
similarity, with better performance for the H.sapiens - D.melanogaster
protein alignment.
Topology of Conserved ModulesHere, we analyze the topology of the obtained solutions. As
discussed in the Introduction, protein complexes are typically
composed of densely interacting proteins. However, recent
findings on modularity and organization of complexes in PPI
networks show that they tend to consist of a densely connected core
and a less strongly connected set proteins defined attachment. The
latter is typically present in multiple complexes and allows
diversification of potential functions [28].
Following this model, AlignNemo looks for relatively densely
connected proteins, i.e. proteins that have more interactions
among themselves than with the rest of the network, rather then
imposing rigid and fixed constraints on the topology of a candidate
solution.
We want now to test whether this strategy puts at risk our ability
to detect densely connected cores, including among our solutions
sparse sub-networks unlikely to be actual protein complexes. To
this purpose, we generate 1000 random networks for each PPI
network, preserving their node degree distribution; then we
evaluate for each module its connectivity, i.e. number of edges,
Table 2. Comparison of AlignNemo, Mawish, NetworkBLAST, and NetAligner.
Fly-Yeast Fly-human
Algorithm No. of S. M.S. F1.0.3 S.C.R. No. of S. M.S. F1.0.3 S.C.R.
Mawish 175 32 29 16 87 37 60 33
NetworkBLAST 329 46 30 18 45 23 13 24
NetAligner 140 32 41 49 133 40 81 84
AlignNemo 242 54 52 27 115 53 87 89
No. of S.: Number of Solutions; M.S.: Matching Solutions; S.C.R.: Small Complex Recovered.The number of solutions found by each algorithm (No. of S.) is listed in column 2 and 5 for the yeast-fly and the fly-human alignment, respectively. The number ofsolutions that match at least one known complex is reported in columns 3 and 6 (M.S. - Matching Solutions) for each alignment. The number of high-quality matches forcomplexes of size § 4 is summarized in columns 4 and 7 (F1w0:3), while the number of small complexes (2-3 proteins) recovered is in columns 5 and 8 (S.C.R. - SmallComplex Recovered).doi:10.1371/journal.pone.0038107.t002
AlignNemo: A Local Network Alignment Method
PLoS ONE | www.plosone.org 5 June 2012 | Volume 7 | Issue 6 | e38107
in the original PPI networks and in the random set. Thus, for each
species and each solution, we estimate a background distribution
of its connectivity. We quantify the deviation of the observed
connectivity in the real network, ci, from such background
distribution using a Z-score:
Z~ci{�ccrand
srand
where �ccrand is the average connectivity for this set of proteins in the
random set and srand its standard deviation.
First, we test separately the two sets of proteins defined by each
solution, one for each species, then, we associate to each solution
the maximum Z-score between the two obtained. By this way, we
account also for relatively poorly connected proteins in one
species, when the corresponding orthologs in the other species are
densely interacting. A p-value is empirically derived for each
module from this background distribution, and it is given by the
number of random networks that led to a greater or equal Z-score
for the tested module over all possible networks. Interestingly, we
found that 95% of the solutions, both for the human-fly and the
the yeast-fly alignments, show statistically significant higher
connectivity than those observed in the randomized networks.
In conclusion, AlignNemo outperforms both Mawish and
NetworkBLAST in correctly detecting protein complexes within
single species given their interactomes and orthology relationships.
Furthermore, protein mappings between different species are
biologically sound as proven by the average semantic similarity
between proteins in the same module. Finally, despite AlignNemo
does not impose rigid constraints on the module topology,
exploring less strongly connected components of a protein
complex, the extracted subnetworks are more densely connected
than expected by chance.
Figure 2. Comparison of AlignNemo, NetworkBLAST, and Mawish. The three algorithms are evaluated in terms of recovering known proteincomplexes in both S:cerevisiae (CYC2008) and H:sapiens (CORUM). Solutions matching known complexes are scored by means of precison, recall,and F1 score. Obtained score distributions for each method are plotted in panel (A) for yeast-fly alignment, and panel (B) for human-fly alignment.Panels (C) and (D) show the average semantic similarity between proteins from different species mapped by each solution. Each solution isrepresented by a circle with the radius proportional to the size of the solution. The size of the solutions from each method varies significantly, thussmall (,7 nodes) and big (§ 7 nodes) solutions are shown separately. * Percentages refer to the set of complexes matched by at least one method.doi:10.1371/journal.pone.0038107.g002
AlignNemo: A Local Network Alignment Method
PLoS ONE | www.plosone.org 6 June 2012 | Volume 7 | Issue 6 | e38107
Comparison with NetAlignerNetAligner relies on a novel algorithmic approach to compute
probalitities associated to conserved interactions, based on protein
sequence similarity between proteins from different species. Given
two pairs of putative orthologs, NetAligner evaluates the likelihood
that they share a conserved interaction by considering the
difference of evolutionary distances between the two orthologous
pairs. We tested NetAligner under different configurations and
input data, including the original proteomes and homologies
provided with the tool. According to our analysis NetAligner
achieves the best performance when using the predict likely conserved
interactions setting, together with the parameters suggested in its
reference paper [16]. NetAligner extracts a bigger and more
reliable set of alignments on its own dataset. Therefore we decided
to compare AlignNemo and NetAligner each run on its own
dataset.
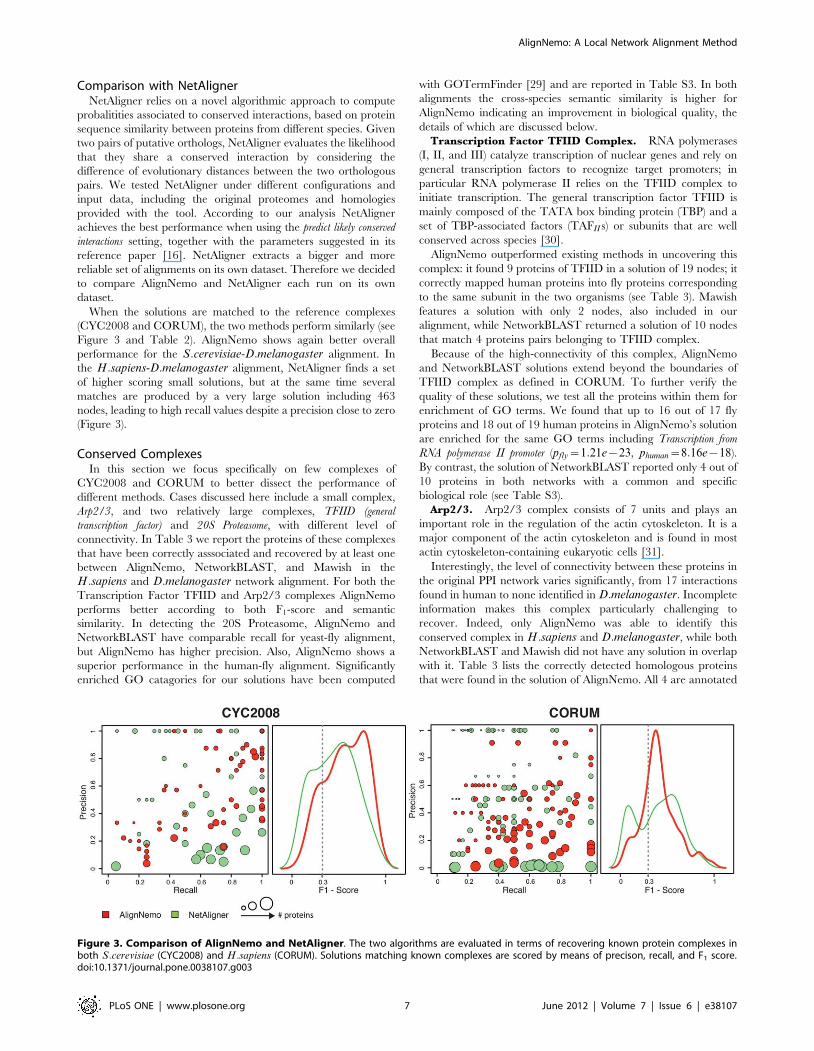
When the solutions are matched to the reference complexes
(CYC2008 and CORUM), the two methods perform similarly (see
Figure 3 and Table 2). AlignNemo shows again better overall
performance for the S:cerevisiae-D:melanogaster alignment. In
the H:sapiens-D:melanogaster alignment, NetAligner finds a set
of higher scoring small solutions, but at the same time several
matches are produced by a very large solution including 463
nodes, leading to high recall values despite a precision close to zero
(Figure 3).
Conserved ComplexesIn this section we focus specifically on few complexes of
CYC2008 and CORUM to better dissect the performance of
different methods. Cases discussed here include a small complex,
Arp2/3, and two relatively large complexes, TFIID (general
transcription factor) and 20S Proteasome, with different level of
connectivity. In Table 3 we report the proteins of these complexes
that have been correctly asssociated and recovered by at least one
between AlignNemo, NetworkBLAST, and Mawish in the
H:sapiens and D:melanogaster network alignment. For both the
Transcription Factor TFIID and Arp2/3 complexes AlignNemo
performs better according to both F1-score and semantic
similarity. In detecting the 20S Proteasome, AlignNemo and
NetworkBLAST have comparable recall for yeast-fly alignment,
but AlignNemo has higher precision. Also, AlignNemo shows a
superior performance in the human-fly alignment. Significantly
enriched GO catagories for our solutions have been computed
with GOTermFinder [29] and are reported in Table S3. In both
alignments the cross-species semantic similarity is higher for
AlignNemo indicating an improvement in biological quality, the
details of which are discussed below.
Transcription Factor TFIID Complex. RNA polymerases
(I, II, and III) catalyze transcription of nuclear genes and rely on
general transcription factors to recognize target promoters; in
particular RNA polymerase II relies on the TFIID complex to
initiate transcription. The general transcription factor TFIID is
mainly composed of the TATA box binding protein (TBP) and a
set of TBP-associated factors (TAFII s) or subunits that are well
conserved across species [30].
AlignNemo outperformed existing methods in uncovering this
complex: it found 9 proteins of TFIID in a solution of 19 nodes; it
correctly mapped human proteins into fly proteins corresponding
to the same subunit in the two organisms (see Table 3). Mawish
features a solution with only 2 nodes, also included in our
alignment, while NetworkBLAST returned a solution of 10 nodes
that match 4 proteins pairs belonging to TFIID complex.
Because of the high-connectivity of this complex, AlignNemo
and NetworkBLAST solutions extend beyond the boundaries of
TFIID complex as defined in CORUM. To further verify the
quality of these solutions, we test all the proteins within them for
enrichment of GO terms. We found that up to 16 out of 17 fly
proteins and 18 out of 19 human proteins in AlignNemo’s solution
are enriched for the same GO terms including Transcription from
RNA polymerase II promoter (pfly~1:21e{23, phuman~8:16e{18).
By contrast, the solution of NetworkBLAST reported only 4 out of
10 proteins in both networks with a common and specific
biological role (see Table S3).
Arp2/3. Arp2/3 complex consists of 7 units and plays an
important role in the regulation of the actin cytoskeleton. It is a
major component of the actin cytoskeleton and is found in most
actin cytoskeleton-containing eukaryotic cells [31].
Interestingly, the level of connectivity between these proteins in
the original PPI network varies significantly, from 17 interactions
found in human to none identified in D:melanogaster. Incomplete
information makes this complex particularly challenging to
recover. Indeed, only AlignNemo was able to identify this
conserved complex in H:sapiens and D:melanogaster, while both
NetworkBLAST and Mawish did not have any solution in overlap
with it. Table 3 lists the correctly detected homologous proteins
that were found in the solution of AlignNemo. All 4 are annotated
Figure 3. Comparison of AlignNemo and NetAligner. The two algorithms are evaluated in terms of recovering known protein complexes inboth S:cerevisiae (CYC2008) and H:sapiens (CORUM). Solutions matching known complexes are scored by means of precison, recall, and F1 score.doi:10.1371/journal.pone.0038107.g003
AlignNemo: A Local Network Alignment Method
PLoS ONE | www.plosone.org 7 June 2012 | Volume 7 | Issue 6 | e38107
with the regulation of actin filament polymerization function GO term
(pfly~3:07e{08 and phuman~1:24e{09). This case nicely points
at the importance of considering conserved paths, rather than only
direct interactions, to complement missing information in one
network.
20S Proteasome Complex. The 20S Proteasome is a large
protein complex present in several organisms, in particular in all
three organisms considered here. According to CYC2008 and
CORUM, the 20S proteasome consists of 14 proteins in yeast and
16 proteins in both human and fly. The topology of the complex is
relatively dense and the interactions are reliable.
For the case of S:cerevisiae-D:melanogaster network alignment
all three methods have comparable values of recall; as for the
precision, NetworkBLAST obtains a much lower value since it
finds several proteins outside the complex. On the other hand,
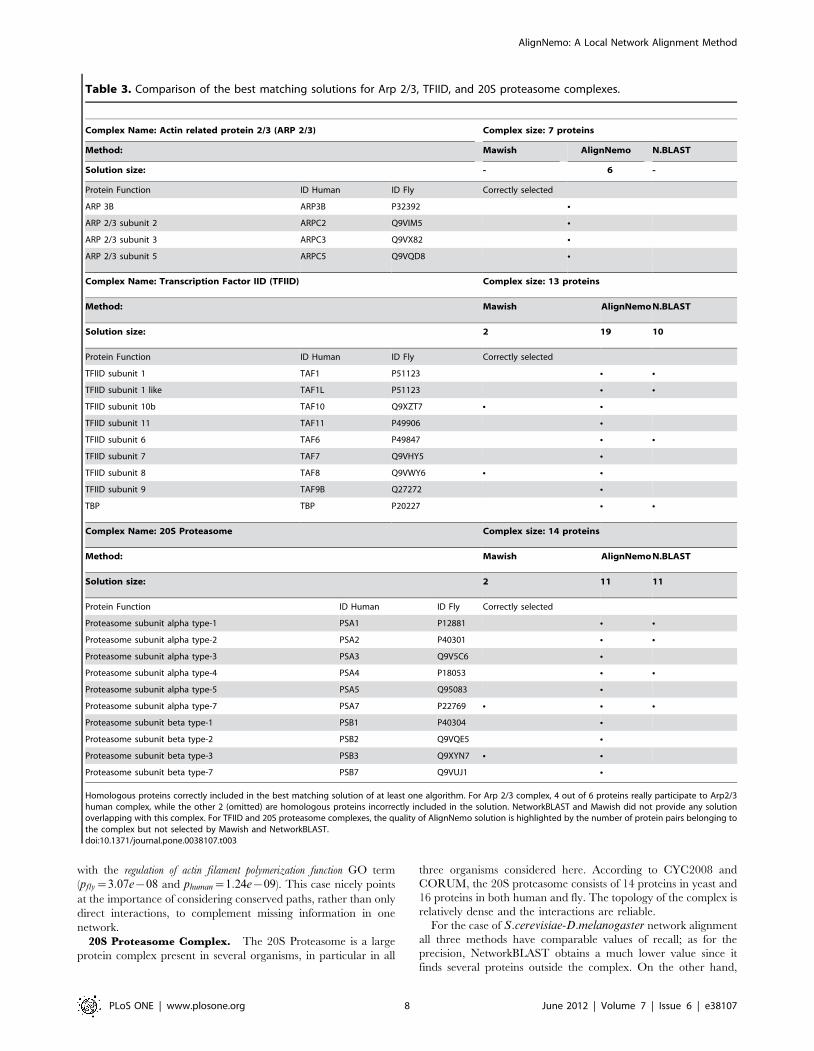
Table 3. Comparison of the best matching solutions for Arp 2/3, TFIID, and 20S proteasome complexes.
Complex Name: Actin related protein 2/3 (ARP 2/3) Complex size: 7 proteins
Method: Mawish AlignNemo N.BLAST
Solution size: - 6 -
Protein Function ID Human ID Fly Correctly selected
ARP 3B ARP3B P32392 N
ARP 2/3 subunit 2 ARPC2 Q9VIM5 N
ARP 2/3 subunit 3 ARPC3 Q9VX82 N
ARP 2/3 subunit 5 ARPC5 Q9VQD8 N
Complex Name: Transcription Factor IID (TFIID) Complex size: 13 proteins
Method: Mawish AlignNemo N.BLAST
Solution size: 2 19 10
Protein Function ID Human ID Fly Correctly selected
TFIID subunit 1 TAF1 P51123 N N
TFIID subunit 1 like TAF1L P51123 N N
TFIID subunit 10b TAF10 Q9XZT7 N N
TFIID subunit 11 TAF11 P49906 N
TFIID subunit 6 TAF6 P49847 N N
TFIID subunit 7 TAF7 Q9VHY5 N
TFIID subunit 8 TAF8 Q9VWY6 N N
TFIID subunit 9 TAF9B Q27272 N
TBP TBP P20227 N N
Complex Name: 20S Proteasome Complex size: 14 proteins
Method: Mawish AlignNemo N.BLAST
Solution size: 2 11 11
Protein Function ID Human ID Fly Correctly selected
Proteasome subunit alpha type-1 PSA1 P12881 N N
Proteasome subunit alpha type-2 PSA2 P40301 N N
Proteasome subunit alpha type-3 PSA3 Q9V5C6 N
Proteasome subunit alpha type-4 PSA4 P18053 N N
Proteasome subunit alpha type-5 PSA5 Q95083 N
Proteasome subunit alpha type-7 PSA7 P22769 N N N
Proteasome subunit beta type-1 PSB1 P40304 N
Proteasome subunit beta type-2 PSB2 Q9VQE5 N
Proteasome subunit beta type-3 PSB3 Q9XYN7 N N
Proteasome subunit beta type-7 PSB7 Q9VUJ1 N
Homologous proteins correctly included in the best matching solution of at least one algorithm. For Arp 2/3 complex, 4 out of 6 proteins really participate to Arp2/3human complex, while the other 2 (omitted) are homologous proteins incorrectly included in the solution. NetworkBLAST and Mawish did not provide any solutionoverlapping with this complex. For TFIID and 20S proteasome complexes, the quality of AlignNemo solution is highlighted by the number of protein pairs belonging tothe complex but not selected by Mawish and NetworkBLAST.doi:10.1371/journal.pone.0038107.t003
AlignNemo: A Local Network Alignment Method
PLoS ONE | www.plosone.org 8 June 2012 | Volume 7 | Issue 6 | e38107
AlignNemo outperforms the other methods in identifying the 20S
Proteasome complex in the H:sapiens-D:melanogaster network
alignment (see Table 3). Indeed, it correctly selected 11 proteins of
the 20S Proteasome in human and 12 in fly, while Network-
BLAST found only 4 in human and 5 in fly and Mawish only 2 in
both networks.
Methods
AlignNemo aims at identifying protein modules or complexes
that are conserved between PPI networks from different species.
The search for conserved modules is performed on the alignment
graph and consists of three major steps.
N First, the alignment graph is constructed from the input
networks. Each node in the alignment graph corresponds to a
pair of putative orthologous proteins, and scores from
Inparanoid are used to weight each node. Each edge of the
alignment graph is weighted according to a scoring strategy
that incorporates information on the network context in terms
of number, reliability and local significance of the paths
connecting its endpoints in the input networks. This strategy is
implemented by means of an auxiliary structure, the union
graph, that is crucial to the overall performance of the method.
N Second, all connected k-subgraphs (here k~4) are extracted
from the alignment graph and scored based on weights of
nodes and edges. Top ranking fully connected k-subgraphs will
be used as seeds for the alignment solution.
N Third, each seed is expanded in an iterative fashion by
exploring the local neighborhood of the current solution
beyond its immediate neighbors. Specifically, we define an
expansion process that adds at each step all subgraphs that are
more tightly connected by reliable interactions to the current
solution than to the rest of the network.
This approach is in line with recent findings on modularity and
organization of complexes in networks, according to which
complexes in PPI networks tend to consist of a core part and
attachments. The core is defined as a small group of proteins that are
functionally similar and have highly correlated transcriptional
profiles. The core is surrounded by less strongly connected
proteins, defined attachments, present in multiple complexes
which allow diversification of potential functions [28]. This
diversification is well reflected by the structure of our solutions.
Indeed, as shown in the previous sections, we identify several
overlapping modules, rather the separated subnetworks with no
intersection.
Alignment GraphThe alignment graph GA~(VA,EA) is a weighted graph, in
which nodes represent pairs of homologous proteins and edges
conserved interactions. As already mentioned, the existing
definitions of the alignment graph differ in the way edges are set
between two nodes. Most representations exploit a limited amount
of topological information from the input since they discard almost
all the nodes not involved in homologous associations and their
interactions.
Our goal is to build an alignment graph that takes into account
as much as possible the structure of the two networks. We designed
a new scoring strategy for the edges of the alignment graph that
incorporates topological information present in the original
networks in terms of number, reliability and significance of paths
of length less than or equal to 2 between two nodes. This strategy
is best described and implemented by introducing an auxiliary
structure that we call union graph. The construction and scoring of
the alignment graph consists of three steps: (i) merge all input
network data into the union graph, (ii) process the union graph to
create a raw alignment graph, and finally (iii) perform some
pruning operations on the raw alignment graph to remove noise
and speed up the overall computation.
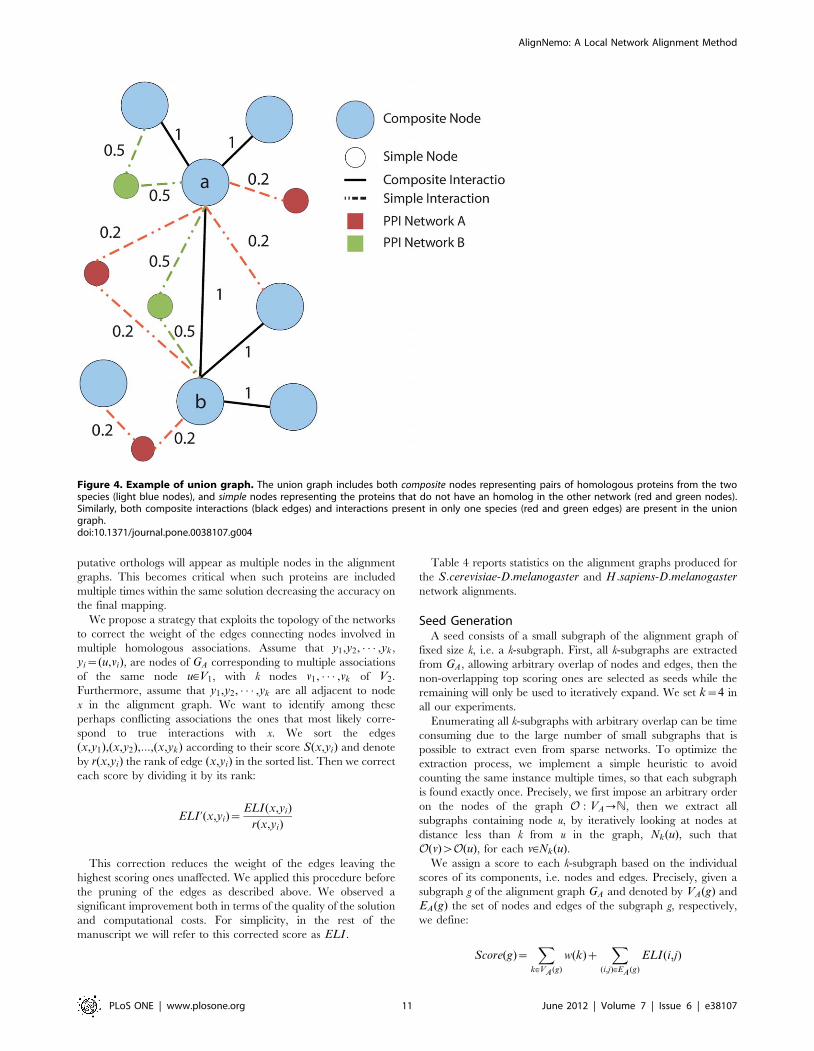
Union graph. The purpose of the union graph is to merge all
input data into a single graph without losing information. Given
two weighted networks G1~(V1,E1) and G2~(V2,E2), and a set
of homologous associations H~ (u,v),u[V1,v[V2f g between the
nodes of G1 and G2, the union graph U(G1,G2,H) contains two
type of nodes: (i) composite nodes representing pairs of homologous
proteins, one from each network, as listed by H, and (ii) simple nodes
representing the proteins of the two input networks that do not
have an homolog in the other network. Any edge contained in one
of the input networks is represented in the union graph by adding
an edge between all pairs of corresponding nodes, either simple or
composite. Formally:
Definition 1. The union graph U(G1,G2,H)~(VU ,EU ) is a
graph having the following structure:
VU~ Vs|Vc
where :
Vs~Vs1|Vs
2 and
Vs1~ i j i[V1 and (i,j) [= H Vj[V2f g
is the set of simple nodes from G1,
Vs2~ i j i[V2 and (h,i) [= H Vh[V1f g
is the set of simple nodes from G2,
Vc~ i~(u,v)[Hf g is the set of composite nodes
EU ~ (i,j)
i[Vs1 , j[Vs
1 and (i,j)[E1,
i[Vs2 , j[Vs
2 and (i,j)[E2,
i~(u,v)[V c, j[V s1 and (u,j)[E1,
i~(u,v)[V c, j[V s2 and (v,j)[E2,
i~(u,v)[V c, j~(x,w)[V c and ((u,x)[E1 and=or (v,w)[E2)
��������������
8>>>>>>>><>>>>>>>>:
9>>>>>>>>=>>>>>>>>;
Assume that each edge e of E1 and E2 is labeled with a reliability
score w(e), and each association k[H is labeled with a reliability
score w(k). Then edge (i,j) in U(G1,G2,H) is assigned a score
w(i,j) given by the score of the corresponding edge in the input
network; the only exception is when both i and j are in Vc, i.e. they
are composite nodes, and there is a corresponding edge in both
input networks, in such a case w(i,j) is the sum of the scores of the
two original edges.
Figure 4 gives an example of the structure of a union graph.
Raw alignment graph. The alignment graph GA~(VA,EA)can be seen as a reduced version of the union graph in which only
composite nodes are retained and an edge connects two nodes if
there is at least one path of length less than or equal to 2 between
the two nodes in the union graph. The intermediate node of a path
of length 2 may be either simple or composite. The most
important part of the definition of the alignment graph consists of
an edge scoring strategy that summarizes the local topology of the
AlignNemo: A Local Network Alignment Method
PLoS ONE | www.plosone.org 9 June 2012 | Volume 7 | Issue 6 | e38107

union graph by taking into account all paths connecting two nodes
in the union graph that satisfy certain criteria. This strategy is
based on the assumption that homologous proteins connected by a
large number of paths are likely to be functionally related. Each
path between the two nodes thus provides additional evidence of
their relatedness.
The choice of considering pairs of nodes at a distance not grater
than 2 in the union graph appears reasonable. On the one hand,
considering only directly connected node pairs is not suited for
aligning evolutionary distant species and it is not robust against
missing interactions in original PPI networks. On the other hand,
adding edges between node pairs at a distance greater than 2
significantly increases the number of edges of the alignment graph,
without providing any benefit in terms of quality of results, as our
experiments showed. It has to be noted that some paths of length 2
in the union graph are spurious, i.e. they do not correspond to a
path in an input network. Such paths are ignored in our analysis.
Paths of length 2, henceforth referred to as indirect paths, take a
major role due to the missing interactions in the original PPI
networks. However, not all the indirect paths have the same
significance. In particular, indirect paths may pass through highly
or loosely interacting proteins. If a node is highly interacting
within the union graph then the probability that two nodes
communicate through it is high. Moreover, the edges composing
different paths could have different confidence scores and might
represent conserved or non-conserved interactions.
To take all these observations into account we devised a new
score based on Jaccard index [32]. Each edge eA~(a,b) in the
alignment graph is scored based on the number of paths of length
2 that link a and b. The final score of the edge between two nodes a
and b of GA is given by the sum of two terms: a direct contribution
S1 and an indirect contribution S2. The direct contribution is
evaluated as the ratio of the score of the direct path (a,b)connecting a and b in the union graph (if it exists) divided by the
sum of the scores of all the direct paths connecting a or b to any
other composite node in the union graph. Analogously, the
indirect contribution is evaluated as the ratio of the score of the
paths of length 2 connecting a and b in the union graph divided by
the sum of the scores of all the paths of length 2 connecting a or b
to any other composite node in the union graph. Formally, we
define this collection of paths connecting two composite nodes as
their extended local interactome and derive a score as follow:
Definition 2 - Extended Local Interactome (ELI) score.Let w(a,b) represent the score of the edge connecting nodes a and
b in the union graph (w(a,b)~0 if (a,b)=[EA) and
w(pab)~w(a,i1)z . . . zw(ik{1,b) be the score of a path of length
k connecting a and b. Then, if Ek(a) is the set of paths connecting a
to its neighbors at distance k, and w(Ek(a)) is the sum of the scores
associated to these paths, we have:
S1(a,b)~w(E1(a)
TE1(b))
w(E1(a)S
E1(b))
S2(a,b)~w(E2(a)
TE2(b))
w(E2(a)S
E2(b))
ELI(a,b)~S1(a,b)zS2(a,b)
The power of this scoring strategy relies in its ability to account
once again for the local neighborhood of aligned nodes: while
methods such as NetworkBLAST or Mawish allow for gaps or
mismatchs to connect conserved proteins at distance 2 in the
aligned graph, we account for the whole set of paths connecting
pairs of conserved proteins and for their reliability.
An example is presented in Figure 4 where for simplicity, we
assume that each solid black edge has score 1, and each edge
present only in the first or second network has a score of 0.5 and
0.2, respectively. Consider nodes labeled a and b. The direct path
connecting a and b has score w(a,b)~1. Node a has 3 composite
nodes connected through conserved edges, and 1 composite node
connected through non-conserved edges. Node b has 3 composite
nodes connected through conserved edges, and 0 composite nodes
connected through unpaired edges. Therefore, the contribution of
direct paths is:
S1(a,b)~1
3 � 1:0z1 � 0:2z3 � 1:0z0~
1
6:2
There are 3 indirect paths between a and b scoring respectively
(0:2z0:2)~0:4,(0:5z0:5)~1,(0:2z1)~1:2. Node a has 6
indirect paths connecting it to other composite nodes, for a total
score of 7.6. Node b has 7 indirect paths connecting it to other
composite nodes, for a total score of 8.2. Therefore, the
contribution of indirect paths between i and j is
S2(a,b)~2:6
7:6z8:2~
2:6
15:8
The final score is ELI(a,b)~S1(a,b)zS2(a,b)~1
6:2z
2:6
15:8~
0:3258.
Pruning the Union Graph. The alignment graphs resulting
from the above construction tend to be very dense with edge scores
spreading over a wide range of values. Removing less reliable
edges is thus necessary for simplifying the alignment graph and
reducing the computational cost in the next steps of the alignment
procedure. Two interesting facts emerge when looking the
distribution of edge scores:
N Few edges have a score significantly higher than the others.
N Edge scores vary considerably across different regions of the
alignment graph and are affected by topological characteris-
tics, such as interaction density. Thus, pruning the edges based
on a global threshold may not be appropriate.
Following these two observations we designed a pruning
strategy that processes all edges incident to the same node at
once, and retains only locally high scoring edges. A simple yet
effective rule has been used:
For each node x[GA, let ELI(x,y�)~maxy[N(x)(ELI(x,y)). For
a given constant t, all the edges (x,y), y[N(x), with score
ELI(x,y)vtELI(x,y�) are deleted.
This pruning strategy is tunable by varying the threshold t, thus
allowing to create denser or sparser networks. In our tests we used
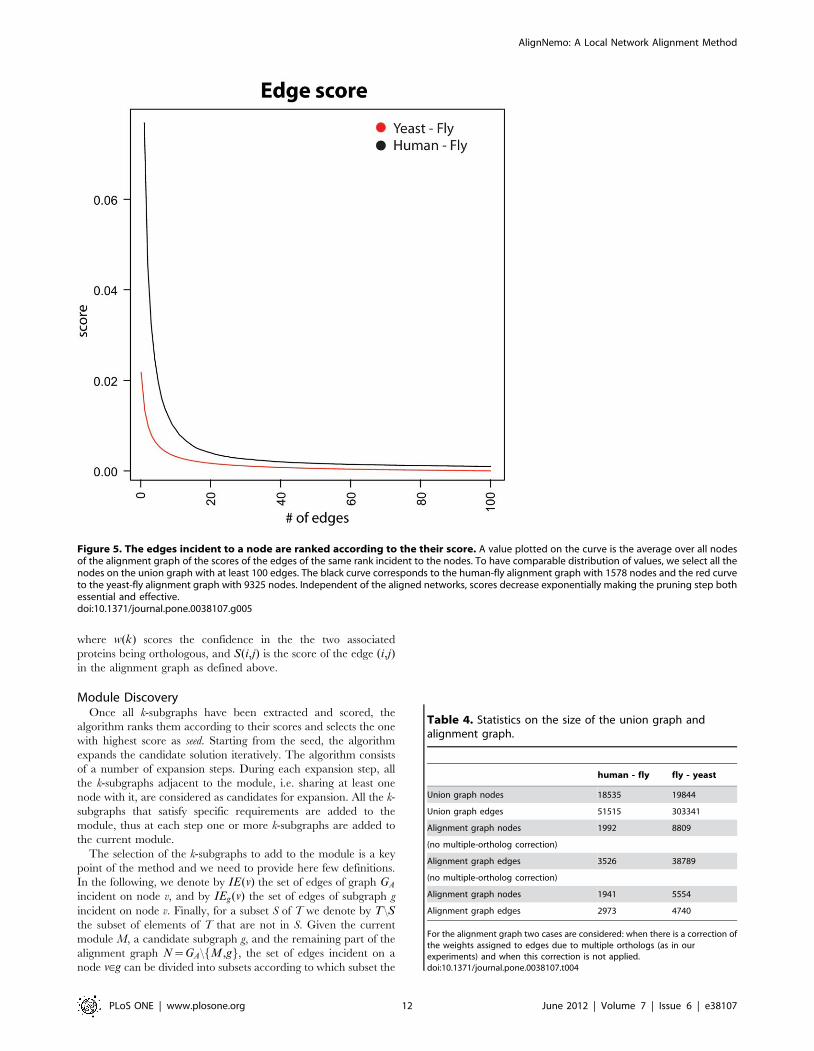
t~0:5. Pruning thresholds t ranging from 0.3 to 0.7 were tested
with similar results. This was expected, since the distance between
high scoring and low scoring edges incident to the same node is
sharp, as clearly visible in Figure 5. On the other hand, not
pruning low scoring edges (t = 0) introduce a huge number of
spurious edges. Indeed, the application of this procedure leads to a
drastic reduction of the number of edges of the alignment graph.
Dealing with multiple orthologs. Homology associations
are tipically many-to-many and proteins associated to many
AlignNemo: A Local Network Alignment Method
PLoS ONE | www.plosone.org 10 June 2012 | Volume 7 | Issue 6 | e38107
putative orthologs will appear as multiple nodes in the alignment
graphs. This becomes critical when such proteins are included
multiple times within the same solution decreasing the accuracy on
the final mapping.
We propose a strategy that exploits the topology of the networks
to correct the weight of the edges connecting nodes involved in
multiple homologous associations. Assume that y1,y2, � � � ,yk,
yi~(u,vi), are nodes of GA corresponding to multiple associations
of the same node u[V1, with k nodes v1, � � � ,vk of V2.
Furthermore, assume that y1,y2, � � � ,yk are all adjacent to node
x in the alignment graph. We want to identify among these
perhaps conflicting associations the ones that most likely corre-
spond to true interactions with x. We sort the edges
(x,y1),(x,y2),:::,(x,yk) according to their score S(x,yi) and denote
by r(x,yi) the rank of edge (x,yi) in the sorted list. Then we correct
each score by dividing it by its rank:
ELI ’(x,yi)~ELI(x,yi)
r(x,yi)
This correction reduces the weight of the edges leaving the
highest scoring ones unaffected. We applied this procedure before
the pruning of the edges as described above. We observed a
significant improvement both in terms of the quality of the solution
and computational costs. For simplicity, in the rest of the
manuscript we will refer to this corrected score as ELI .
Table 4 reports statistics on the alignment graphs produced for
the S:cerevisiae-D:melanogaster and H:sapiens-D:melanogaster
network alignments.
Seed GenerationA seed consists of a small subgraph of the alignment graph of
fixed size k, i.e. a k-subgraph. First, all k-subgraphs are extracted
from GA, allowing arbitrary overlap of nodes and edges, then the
non-overlapping top scoring ones are selected as seeds while the
remaining will only be used to iteratively expand. We set k~4 in
all our experiments.
Enumerating all k-subgraphs with arbitrary overlap can be time
consuming due to the large number of small subgraphs that is
possible to extract even from sparse networks. To optimize the
extraction process, we implement a simple heuristic to avoid
counting the same instance multiple times, so that each subgraph
is found exactly once. Precisely, we first impose an arbitrary order
on the nodes of the graph O : VA?N, then we extract all
subgraphs containing node u, by iteratively looking at nodes at
distance less than k from u in the graph, Nk(u), such that
O(v)wO(u), for each v[Nk(u).
We assign a score to each k-subgraph based on the individual
scores of its components, i.e. nodes and edges. Precisely, given a
subgraph g of the alignment graph GA and denoted by VA(g) and
EA(g) the set of nodes and edges of the subgraph g, respectively,
we define:
Score(g)~X
k[VA(g)
w(k)zX
(i,j)[EA(g)
ELI(i,j)
Figure 4. Example of union graph. The union graph includes both composite nodes representing pairs of homologous proteins from the twospecies (light blue nodes), and simple nodes representing the proteins that do not have an homolog in the other network (red and green nodes).Similarly, both composite interactions (black edges) and interactions present in only one species (red and green edges) are present in the uniongraph.doi:10.1371/journal.pone.0038107.g004
AlignNemo: A Local Network Alignment Method
PLoS ONE | www.plosone.org 11 June 2012 | Volume 7 | Issue 6 | e38107
where w(k) scores the confidence in the the two associated
proteins being orthologous, and S(i,j) is the score of the edge (i,j)in the alignment graph as defined above.
Module DiscoveryOnce all k-subgraphs have been extracted and scored, the
algorithm ranks them according to their scores and selects the one
with highest score as seed. Starting from the seed, the algorithm
expands the candidate solution iteratively. The algorithm consists
of a number of expansion steps. During each expansion step, all
the k-subgraphs adjacent to the module, i.e. sharing at least one
node with it, are considered as candidates for expansion. All the k-
subgraphs that satisfy specific requirements are added to the
module, thus at each step one or more k-subgraphs are added to
the current module.
The selection of the k-subgraphs to add to the module is a key
point of the method and we need to provide here few definitions.
In the following, we denote by IE(v) the set of edges of graph GA
incident on node v, and by IEg(v) the set of edges of subgraph g
incident on node v. Finally, for a subset S of T we denote by T\Sthe subset of elements of T that are not in S. Given the current
module M, a candidate subgraph g, and the remaining part of the
alignment graph N~GA\fM,gg, the set of edges incident on a
node v[g can be divided into subsets according to which subset the
Figure 5. The edges incident to a node are ranked according to the their score. A value plotted on the curve is the average over all nodesof the alignment graph of the scores of the edges of the same rank incident to the nodes. To have comparable distribution of values, we select all thenodes on the union graph with at least 100 edges. The black curve corresponds to the human-fly alignment graph with 1578 nodes and the red curveto the yeast-fly alignment graph with 9325 nodes. Independent of the aligned networks, scores decrease exponentially making the pruning step bothessential and effective.doi:10.1371/journal.pone.0038107.g005
Table 4. Statistics on the size of the union graph andalignment graph.
human - fly fly - yeast
Union graph nodes 18535 19844
Union graph edges 51515 303341
Alignment graph nodes 1992 8809
(no multiple-ortholog correction)
Alignment graph edges 3526 38789
(no multiple-ortholog correction)
Alignment graph nodes 1941 5554
Alignment graph edges 2973 4740
For the alignment graph two cases are considered: when there is a correction ofthe weights assigned to edges due to multiple orthologs (as in ourexperiments) and when this correction is not applied.doi:10.1371/journal.pone.0038107.t004
AlignNemo: A Local Network Alignment Method
PLoS ONE | www.plosone.org 12 June 2012 | Volume 7 | Issue 6 | e38107
other endpoint belongs to, i.e. g, M\g, or N. Formally:
IE(v)~IEg(v)|IEM\g(v)|IEN (v):
First, we define a k-subgraph tightly connected to the module if
IEM\g(v)=1, Vv[g:
Tightly connected subgraphs are always added to the module.
Loosely connected subgraphs are attached if they connect to the
module with more reliable links than to the rest of the network.
Using the notation introduced above, for a given k-subgraph g
we define:
w(IEM (g))~Xv[g
Xe[IEM (v)
ELI(e),
w(IEN (g))~Xv[g
Xe[IEN (v)
ELI(e)
the sum of the weights of edges connecting g to the module, and
the sum of the weights of edges connecting g to the rest of the
network, respectively. Then g is added to the module if:
Dw~w(IEN (g)){w(IEM (g))v0:
At the end of the expansion stage all accepted k-subgraphs are
added to the module at once. The process is repeated until no
more k-subgraphs can be added, thus we do not put upper limit on
the size of obtainable complexes. On the other hand, we require
our solutions to have at least 5 nodes, a limit imposed by the size of
the seed (4 nodes) and the requirement of at least one expansion
step to be completed. It is important to remark that expanding the
module by k-subgraphs rather than by a single node at a time is
not only crucial for the good performance of the method, but it is
the key to account for multiple dependencies between a protein
and its immediate neighbors.
ImplementationAlignNemo is fully implemented in Java and has no dependen-
cies from external libraries. The code and supporting documen-
tation are available at: http://www.bioinformatics.org/alignnemo
and a The alignment of S.cerevisiae and D.melanogaster required
3 minutes and 30 seconds, while the alignment of H.sapiens and
D.melanogaster required 43 seconds. Both NetworkBLAST and
Mawish are written in C, nonetheless the run-times we obtained
are generally comparable to those of NetworkBLAST, while
Mawish showed faster performance requiring 10 seconds for both
the alignments.
Supporting Information
Table S1 Recovery of known complexes. The table reports
known yeast (CYC2008) and human (CORUM) complexes
recovered by each method. Known complexes are identified by
their ID, and for each complex the ID of the best matching
solution for each method is reported. For each complex we report
the total number of proteins, number of proteins in overlap with
the best matching solution, precision, recall and F1-score.
(XLS)
Table S2 Semantic Similarity. The table shows the inter-
species semantic similarity scores of the alignments found by each
method. The semantic similarity is computed with respect to both
the Biological Process and the Molecular Function vocabularies
defined in Gene Ontology.
(XLS)
Table S3 GO Enrichement Analysis. Gene Ontology
enriched categories of the solutions that best match the Arp2–3,
TFIID, and 20S proteasome complexes.
(XLS)
Acknowledgments
Authors thank to the ProteinOn Team for supporting us on the calculation
of the semantic similarities among proteins.
Author Contributions
Conceived and designed the experiments: GC MM CG. Performed the
experiments: GC MM PHG. Analyzed the data: GC MM PHG. Wrote the
paper: GC MM PHG CG. Contributed to critical review of the paper: GC
MM PHG MC CG.
References
1. Giot L, Bader JS, Brouwer C, Chaudhuri A, Kuang B, et al. (2003) A Protein
interaction map of Drosophila melanogaster. Science, 302:1727–36.
2. Uetz P, Giot L, Cagney G, Mansfi TA, Judson RS, et al. (2002) A
comprehensive analysis of protein-protein interactions in Saccharomyces
cerevisiae. Nature, 403:623–7.
3. Yu H, Braun P, Yildirim MA, Lemmens I, Venkatesan K, et al. (2008) High-
Quality Binary Protein Interaction Map of the Yeast Interactome Network.
Science, 322:104–110.
4. Kiemer L, Cesareni G (2007) Comparative interactomics: comparing apples and
pears? Trends in biotechnology 10, 25:448–454.
5. Sharan R, Suthram S, Kelley RM, Kuhn T, McCuine S, et al. (2005) Conserved
patterns of protein interaction in multiple species. Proc. Nat. Acad. Sci. USA,
102:1974–1979.
6. Kalaev M, Bafna V, Sharan R (2008) Fast and accurate alignment of multiple
protein networks. Proc. RECOMB, 246–256.
7. Kelley BP, Yuan B, Lewitter F, Sharan R, and Brent R, et al. (2003) Conserved
pathways within bacteria and yeast as revealed by global protein network
alignment. Proc. Nat. Acad. Sci. USA, 100:11394–11399.
8. de Silva E, Thorne T, Ingram P, Agrafioti I, Swire J, et al. (2006) The effects of
incomplete protein interaction data on structural and evolutionary inferences.
BMC Biology, 4:39.
9. Hakes L, Pinney JW, Robertson D, Lovell SC (2008) Protein-protein interaction
networks and biology - what is the connection? Nature Biotechnology, 26, 1:69–72.
10. Koyuturk M, Grama A, Szpankowski W (2006) Pairwise alignment of protein
interaction networks. J. Comput. Biol., 13:182–199.
11. Flannick J, Novak A, Srinivasan BS, McAdams HH, Batzoglou S (2006)
Graemlin: General and robust alignment of multiple large interaction networks.
Genome Res., 16, 9:1169–1181.
12. Flannick J, Novak A, Do CB, Srinivasan BS, Batzoglou S, et al. (2009)
Automatic parameter learning for multiple local network alignment. J. Comput.
Biol., 16, 8:1001–1022.
13. O’Brien KP, Remm M, Sonnhammer EL (2005) Inparanoid: a comprehensive
database of eukaryotic orthologs. Nucleic Acids Res., 33:D476-D480.
14. Kanehisa M, Goto S (2000) KEGG: Kyoto Encyclopedia of Genes and
Genomes. Nucleic Acids Res., 28:27–30.
15. Cootes AP, Muggleton SH, and Sternberg MJ (2007) The Identification of
Similarities between Biological Networks: Application to the Metabolome and
Interactome. J Mol Biol, 369, 4:1126–39.
16. Pache RA, Aloy P (2012) A Novel Framework fro the Comparative Analysis of
Biological Networks. PLoS ONE, 7, 2:e31220.
17. Salwinski L, Miller CS, Smith AJ, Pettit FK, Bowie JU, et al. (2004) The
Database of Interacting Proteins: 2004 update Nucleic Acids Res., 32 (Suppl 1),
D449–451.
18. Human Integrated Protein-Protein Interaction rEference. Available: http://
cbdm.mdc-berlin.de/tools/hippie/information.php (Accessed 2011)
AlignNemo: A Local Network Alignment Method
PLoS ONE | www.plosone.org 13 June 2012 | Volume 7 | Issue 6 | e38107
19. Ortholog Resources from the Gerstein Lab. Available: http://info.gersteinlab.
org/Ortholog_Resources (Accessed 2011)20. Deng M, Sun F, Chen T (2003) Assessment of the reliability of protein-protein
interactions and protein function prediction. Proc. of Pacific Symposium on
Biocomputing, 8:140–151.21. Engel S, Balakrishnan R, Binkley G, Christie KR, and Costanzo MC, et al.
(2010) SGD: Saccharomyces Genome Database. Nucl. Acid Res., 38 (Suppl 1),D433-D436.
22. Pu S, Wong J, Turner B, Cho E, Wodak SJ (2009) Up-to-date catalogues of yeast
protein complexes. Nucl. Acids Res 37, 3 :825–831.23. Ruepp A, Brauner B, Dunger-Kaltenbach I, Frishman G, Montrone C, et al
(2007) CORUM: the comprehensive resource of mammalian protein complexes.Nucl. Acids Res. 36 (suppl 1), D646-D650.
24. Guzzi PH, Mina M, Guerra C, Cannataro M (2011) Semantic similarity analysisof protein data: assessment with biological features and issues. Brief Bioinform, doi:
10.1093/bib/bbr066.
25. Resnik P (1999) Semantic Similarity in a Taxonomy: An Information-BasedMeasure and its Application to Problems of Ambiguity in Natural Language. J.
of Artificial Intelligence Res., 11:95–130.26. Faria D, Pesquita C, Couto FM, Falcao A (2007) ProteinOn: A web tool for
protein semantic similarity. Department of Informatics, University of Lisbon, Technical
Reports, di-fcul-tr-07–627. Library and tools for semantic similarity measures. Available: http://
sourceforge.net/p/fastsemsim (Version 0.4).28. Gavin AC, Aloy P, Grandi P, Krause P, Boesche P, et al. (2006) Proteome survey
reveals modularity of the yeast cell machinery. Nature, 440, 7084:631–636.
29. Generic Gene Ontology Term Finder. Available: http://go.princeton.edu/cgi-
bin/GOTermFinder (Accessed 2011)
30. Burley SK, Roeder RG (1996) Biochemistry and Structural Biology of
Transcription Factor IID (TFIID). Annu. Rev. Biochem. 65:769–799.
31. Veltman DM, Insall RH (2010) WASP family proteins: their evolution and its
physiological implications. Mol. Biol. Cell, 21, 16:2880–93.
32. Liben-Nowell D, Kleinberg J (2003) The link prediction problem for social
networks. In Proceedings of the Twelfth International Conference on Information and
Knowledge Management, 556–559 New York, NY.
33. Singh R, Xu J, Berger B (2007) Pairwise global alignment of protein interaction
networks by matching neighborhood topology. Research in Computational Molecular
Biology, 16–31, Springer.
34. Singh R, Xu J, and Berger B (2008) Global alignment of multiple protein
interaction networks. Proc. of Pacific Symposium on Biocomputing, 13:303–314.
35. Kuchaiev O, Milenkovic T, Memisevic V, Hayes W, and Przulj N (2010)
Topological network alignment uncovers biological function and phylogeny. J.
R. Soc. Interface, 7, 50:1341–1354.
36. Kuchaiev O, Przulj N (2011) Integrative Network Alignment Reveals Large
Regions of Global Network Similarity in Yeast and Human. Bioinformatics, 27,
10:1390–1396.
37. Milenkovic T, Leong W, Przulj N (2010) Optimal network Alignment with
Graphlet Degree Vectors. Cancer Informatics, 9, 121–137.
38. Tian W, Samatova NF (2009) Pairwise Alignment of interaction networks by fast
identification of maximal conserved patterns. Pacific Symposium on Biocomputing,
14:99–110.
AlignNemo: A Local Network Alignment Method
PLoS ONE | www.plosone.org 14 June 2012 | Volume 7 | Issue 6 | e38107
Copyright © 2022 FDOKUMEN