Airborne differential absorption lidar system for measurements of atmospheric water vapor and...
17
Airborne differential absorption lidar system for measurements of atmospheric water vapor and aerosols Noah S. Higdon, Edward V. Browell, Patrick Ponsardin, Benoist E. Grossmann, Carolyn F. Butler, Thomas H. Chyba, M. Neale Mayo, Robert J. Allen, Alene W. Heuser, William B. Grant, Syed Ismail, Shane D. Mayor, and Arlen F. Carter An airborne differential absorption lidar (DIAL) system has been developed at the NASA Langley Research Center for remote measurements of atmospheric water vapor (H 2 0) and aerosols. A solid-state alexandrite laser with a 1-pm linewidth and > 99.85% spectral purity was used as the on-line transmitter. Solid-state avalanche photodiode detector technology has replaced photomultiplier tubes in the receiver system, providing an average increase by a factor of 1.5-2.5 in the signal-to-noise ratio of the H 2 O measurement. By incorporating advanced diagnostic and data-acquisition instrumentation into other subsystems, we achieved additional improvements in system operational reliability and measure- ment accuracy. Laboratory spectroscopic measurements of H 2 O absorption-line parameters were performed to reduce the uncertainties in our knowledge of the absorption cross sections. Line-center H 2 O absorption cross sections were determined, with errors of 3-6%, for more than 120 lines in the 720-nm region. Flight tests of the system were conducted during 1989-1991 on the NASA Wallops Flight Facility Electra aircraft, and extensive intercomparison measurements were performed with dew-point hygrometers and H 2 0 radiosondes. The H 2 0 distributions measured with the DIAL system differed by • 10% from the profiles determined with the in situ probes in a variety of atmospheric conditions. Key words: Differential absorption lidar, alexandrite laser, water vapor, aerosols. Introduction Water vapor (H 2 0) is the most variable of the major molecular constituents of the atmosphere, and it plays a primary role in many aspects of atmospheric N. S. Higdon, E. V. Browell, W.B. Grant, S. Ismail, and A. F. Carter are with the Atmospheric Sciences Division, NASA Langley Research Center, MS 401A, Hampton, Virginia 23681-0001; P. Ponsardin, C. F. Butler, and S. D. Mayor are with the Science and Applications International Corporation, 1 Enterprise Parkway, Suite 250, Hampton, Virginia 23666. When this work was per- formed, B. E. Grossmann and A. W. Heuser were with STX Corporation, 17 Research Drive, Hampton, Virginia 23665; B. E. Grossmann is now with Thomson-CSF, Rue Guynemer, BP55, 78283 Guyancourt, Cedex, France; A. W. Heuser is now with Harris Corporation, GCSD, M/S 1-52842, P.O. Box 91000, Mel- bourne, Florida 32902. T. H. Chyba is with the National Re- search Council, MS 401A, Hampton, Virginia 23681-0001; N. M. Mayo is with Lockheed Engineering and Sciences Company, 144 Research Drive, Hampton, Virginia 23666; and R. J. Allen is with Allen Associates, 48 Diamond Hill Road, Hampton, Virginia 23666. Received 5 February 1993; revised manuscript received 17 November 1993. 0003-6935/94/276422-17$06.00/0. C 1994 Optical Society of America. physics, including processes involved in meteorology, climate, the Earth's radiation budget, and the global hydrological cycle. In addition, H 2 0 can be used as a tracer in studies of atmospheric transport and chem- istry. Therefore measurements of the spatial and temporal distribution of H 2 0 will lead to a better understanding of the various dynamic and chemical processes that occur in the atmosphere. An air- borne differential absorption lidar (DIAL) can make the necessary high-resolution measurements of H 2 0 and aerosols over large regions of the lower atmo- sphere. This paper describes the design, develop- ment, and application of an airborne H 2 0 DIAL system for the remote detection of H 2 0 and aerosol profiles in the atmosphere. Several researchers have developed and imple- mented ground-based lidar systems to determine the vertical concentration profiles of H 2 0 remotely.1- 5 These facilities include both Raman lidar, which incorporates inelastic backscattering to generate a return signal that is shifted in frequency from the frequency of the transmitted signal, and DIAL, in which elastic backscattering is combined with absorp- tion to produce a range-resolved profile. The capabili- 6422 APPLIED OPTICS / Vol. 33, No. 27 / 20 September 1994
-
Upload
independent -
Category
Documents
-
view
0 -
download
0
Transcript of Airborne differential absorption lidar system for measurements of atmospheric water vapor and...
Airborne differential absorption lidarsystem for measurements of atmosphericwater vapor and aerosols
Noah S. Higdon, Edward V. Browell, Patrick Ponsardin, Benoist E. Grossmann,Carolyn F. Butler, Thomas H. Chyba, M. Neale Mayo, Robert J. Allen, Alene W. Heuser,William B. Grant, Syed Ismail, Shane D. Mayor, and Arlen F. Carter
An airborne differential absorption lidar (DIAL) system has been developed at the NASA LangleyResearch Center for remote measurements of atmospheric water vapor (H20) and aerosols. A solid-statealexandrite laser with a 1-pm linewidth and > 99.85% spectral purity was used as the on-linetransmitter. Solid-state avalanche photodiode detector technology has replaced photomultiplier tubes inthe receiver system, providing an average increase by a factor of 1.5-2.5 in the signal-to-noise ratio of theH2O measurement. By incorporating advanced diagnostic and data-acquisition instrumentation intoother subsystems, we achieved additional improvements in system operational reliability and measure-ment accuracy. Laboratory spectroscopic measurements of H2O absorption-line parameters wereperformed to reduce the uncertainties in our knowledge of the absorption cross sections. Line-centerH2O absorption cross sections were determined, with errors of 3-6%, for more than 120 lines in the720-nm region. Flight tests of the system were conducted during 1989-1991 on the NASA WallopsFlight Facility Electra aircraft, and extensive intercomparison measurements were performed withdew-point hygrometers and H20 radiosondes. The H20 distributions measured with the DIAL systemdiffered by • 10% from the profiles determined with the in situ probes in a variety of atmospheric conditions.
Key words: Differential absorption lidar, alexandrite laser, water vapor, aerosols.
IntroductionWater vapor (H20) is the most variable of the majormolecular constituents of the atmosphere, and itplays a primary role in many aspects of atmospheric
N. S. Higdon, E. V. Browell, W. B. Grant, S. Ismail, and A. F.Carter are with the Atmospheric Sciences Division, NASA LangleyResearch Center, MS 401A, Hampton, Virginia 23681-0001; P.Ponsardin, C. F. Butler, and S. D. Mayor are with the Science andApplications International Corporation, 1 Enterprise Parkway,Suite 250, Hampton, Virginia 23666. When this work was per-formed, B. E. Grossmann and A. W. Heuser were with STXCorporation, 17 Research Drive, Hampton, Virginia 23665; B. E.Grossmann is now with Thomson-CSF, Rue Guynemer, BP55,78283 Guyancourt, Cedex, France; A. W. Heuser is now withHarris Corporation, GCSD, M/S 1-52842, P.O. Box 91000, Mel-bourne, Florida 32902. T. H. Chyba is with the National Re-search Council, MS 401A, Hampton, Virginia 23681-0001; N. M.Mayo is with Lockheed Engineering and Sciences Company, 144Research Drive, Hampton, Virginia 23666; and R. J. Allen is withAllen Associates, 48 Diamond Hill Road, Hampton, Virginia 23666.
Received 5 February 1993; revised manuscript received 17November 1993.
0003-6935/94/276422-17$06.00/0.C 1994 Optical Society of America.
physics, including processes involved in meteorology,climate, the Earth's radiation budget, and the globalhydrological cycle. In addition, H20 can be used as atracer in studies of atmospheric transport and chem-istry. Therefore measurements of the spatial andtemporal distribution of H 20 will lead to a betterunderstanding of the various dynamic and chemicalprocesses that occur in the atmosphere. An air-borne differential absorption lidar (DIAL) can makethe necessary high-resolution measurements of H 20and aerosols over large regions of the lower atmo-sphere. This paper describes the design, develop-ment, and application of an airborne H20 DIALsystem for the remote detection of H20 and aerosolprofiles in the atmosphere.
Several researchers have developed and imple-mented ground-based lidar systems to determine thevertical concentration profiles of H20 remotely.1-5
These facilities include both Raman lidar, whichincorporates inelastic backscattering to generate areturn signal that is shifted in frequency from thefrequency of the transmitted signal, and DIAL, inwhich elastic backscattering is combined with absorp-tion to produce a range-resolved profile. The capabili-
6422 APPLIED OPTICS / Vol. 33, No. 27 / 20 September 1994
ties of many ground-based lidar systems have beenenhanced by having them mounted on mobile plat-forms for measurements in diverse climates andunder various atmospheric conditions.6-8 To in-crease the flexibility of the lidar measurements fur-ther and to provide for mesoscale observations, onecan design lidar systems to operate on airborneplatforms. Because of the low-level return signalsand the long averaging times associated with Ramanlidar measurements, the method that is most adapt-able to performance of high-resolution measure-ments of H2 0 from an aircraft is the DIAL technique.5
Thus all the current airborne lidar systems measureH20 with the DIAL technique.9" The NASA Lan-gley Research Center's (LaRC) airborne H 20 DIALsystem was designed to conduct mesoscale investiga-tions of H20 and aerosol distributions under diversemeteorological conditions during both daytime andnighttime operation.
Measurement MethodologyA comprehensive approach was taken in the H20DIAL research program to ensure that the airborneDIAL system would be capable of providing high-accuracy H2 0 measurements over a large range ofatmospheric conditions. A detailed error analysis ofthe DIAL technique for the measurement of H2 0profiles was performed, and this analysis includedrandom errors caused by lidar signal uncertaintiesand systematic errors caused by uncertainties in ourknowledge of the H20 absorption cross section.Experimental measurements were also conducted toimprove our knowledge of the H20 line parameters.
H20 Concentration Measurement
DIAL TechniqueBecause many authors have already presented thor-ough treatments of the DIAL technique,"" 2 only anoverview of the theory is reviewed here. The DIALprocedure requires that one use high-energy, narrow-linewidth, tunable lasers to achieve accurate range-resolved gas measurements. One laser is tuned toan absorption line of the molecular species of interest(on-line), and the other is tuned to a nearby spectralregion that has little or no absorption by the gas(off-line). The on-line and the off-line pulsed laserbeams are transmitted through the atmosphere, anda portion of the laser radiation is backscattered bymolecules and aerosols to a telescope receiver systemthat is colocated with the laser. The backscatteredpower from range R at the detector is given by
P(R) = PO(cT/2)R- 2A-q1(R)-2
x exp f [un(R) + k(R)]dR}, (1)OR
where P0 is the transmitted power, c is the velocity oflight, T is the laser-pulse duration, R is the range, A isthe receiver area, 1q is the receiver-detector efficiency,P(R) is the atmospheric volume backscatter coeffi-
cient, a is the absorption cross section of the molecu-lar species of interest, n(R) is the number densityprofile of the gas, and k(R) is the atmospheric extinc-tion coefficient resulting from all other attenuationprocesses.
Provided that the on-line and the off-line transmit-ters are close in wavelength (AX < 0.1 nm), we canassume that bon(R) = 1off(R) and that kon(R) = koff(R),and we can solve Eq. (1) for the number densityprofile of the gas:
1 Poff(R 2)Pon(Rl)
n(R) = 2(R 2 - Rl)(on - noff) Poff(Rl)Pon(R2)(2)
where R2 - R, is the range cell for the average gasconcentration, on - uoff is the differential absorptioncross section for the two wavelengths, Pon is thepower received from range R for the on-line wave-length, and Poff is the power received from range R forthe off-line wavelength. One can then convert thenumber density profile to a volume (or mass) mixingratio by dividing the gas number (or mass) density bythe ambient atmospheric number (or mass) density.
DIAL Measurement ErrorsErrors in the measurement of H 20 with the DIALmethod arise from both random and systematicsources. A discussion of these measurement errorsfor DIAL systems is available in the literature,13-15and a detailed discussion of random and systematicerrors for H20 DIAL systems is given in Ref. 16.Random errors are caused by noise in the signal.Variability of the photon statistics in the lidar returnsignal, noise resulting from detector dark current,and noise in the background signal are the mainsources of random error. One can minimize therandom error associated with DIAL measurementsby maximizing the signal-to-noise ratio (S/N). TheS/N increase can be achieved in several ways, includ-ing an increase in laser-pulse energies or pulse repeti-tion rates, an improvement in the optical throughputof the system, the use of a detector system withhigher quantum efficiency or lower dark-current noise,and the selection of a narrow-band optical filter thatrejects most of the day background light and retainshigh optical efficiency. Following acquisition of thelidar data, we minimize random errors in the DIALmeasurement by averaging the data. As a first stepin noise reduction, the signals are averaged by smooth-ing them along the range, followed by averaging of anumber of lidar profiles to enhance the precision ofthe measurement. This averaging of signals alsoresults in a reduction in vertical and horizontalresolution. Thus a trade-off is necessary to achieve abalance between spatial resolution and measurementprecision (typically a vertical range resolution of200-300 m and an averaging of 300-600 laser shotpairs are used in data reduction). Systematic errorsin DIAL measurements are caused by both atmo-spheric and instrumental effects. The DIAL systempresented here is designed and operated to minimize
20 September 1994 / Vol. 33, No. 27 / APPLIED OPTICS 6423
the influences of systematic effects. Selection of thealexandrite on-line laser with a narrow linewidth anda high spectral purity, and its operation at the centerof H20 lines, ensures minimum influences in theDIAL measurement that are caused by the laserspectral distribution. The DIAL system is operatedto avoid signal-overload effects, and the data analysisis restricted to regions that are not significantlyinfluenced by signal overloads, signal nonlinearities,signal-digitization errors, and on-off signal-synchro-nization influences. The H20 line selection ensuresthat negligible influence results from sensitivity ofthe H20 cross section to uncertainity in the knowl-edge of atmospheric temperature. It is estimatedthat the sum of these systematic influences in cleanerregions of the lower troposphere will result in DIALsystematic errors of less than 5%.
H2 0 SpectroscopyClearly, from Eq. (2), uncertainties in the knowledgeof the gas absorption cross section can lead to errorsin the DIAL measurements of gas profiles. Atmo-spheric influences on the effective cross section(i.e., the absorption cross section at the laser wave-length) are caused by the dependence of the absorp-tion linewidth and the absorption line-center positionon pressure and temperature and by the dependenceof the line strength on temperature. A high-resolu-tion spectroscopy experiment that incorporated anarrow-lindwidth tunable dye laser and two multi-pass absorption (White) cells with different pressureor temperature conditions has been used to providemeasurements of H20 absorption-line parameters inthe 720-nm-wavelength region.' 7"18 The use of thetwo multipass cells in parallel ensures that the resultsare insensitive to any laser-frequency drift during themeasurement. Measurements of line strengths, pres-sure broadening, pressure-induced line shifts, andbroadening and shift temperature dependences in therange 300-400 K were made. The pressure-shiftcoefficients in air were found to vary from line to line,and the average value was found to be -0.0170cm-'/atm. The temperature exponent for the airbroadening was found to be J dependent, with thebroader lines (i.e., low-J lines) having the higherexponent. The average exponent value was mea-sured to be 0.67. The temperature-dependence expo-nent for the line shift in air was also found to be Jdependent, but it showed the opposite behavior (i.e.,the high-J lines had the higher exponents). Thetemperature exponent for the line shifting variedbetween 0.4 and 1.2.
Using these laboratory measurements, we accu-rately determined the effective differential absorptioncross section for atmospheric H20, with an absoluteerror of 3-6%, for more than 120 H20 absorptionlines in the 720-nm region. These H20 lines have awide range of absorption cross sections and ground-state energies that can be selected to optimize theDIAL measurement according to the various atmo-spheric conditions encountered during the field experi-ments.
Scattering-Ratio MeasurementAlong with the DIAL H 20 profile measurement, TheDIAL system simultaneously provides informationon the atmospheric aerosol distribution. An atmo-spheric scattering ratio is used to quantify the distri-bution of aerosols in the path of the laser beam. Thescattering ratio is defined" as the ratio of the sum ofthe volume backscatter coefficients 13 for the molecu-lar and the aerosol components of the return to thecoefficient for the molecular signal only:
=m (r) + 13a(r) = 1R(r) = 13m(r) =
P.(r)+ .(r) (3)
To determine the atmospheric scattering ratio, ameasurement is first made in a clean region (13a 0)to establish the relative molecular scattering profile.We then calculate the calibration constant by takingthe ratio of the clean-region lidar return signal to theNational Meteorological Center (NMC) molecular den-sity at that location. The calibration ratio is thenused to normalize the NMC molecular density profileat any other location. This calculated molecularlidar return can be divided into the total lidar returnto give the atmospheric scattering ratio.
Airborne H20 DIAL SystemIn its present configuration,9 the NASA airborne H 20DIAL system uses advanced instrumentation andtechnologies to provide enhanced H 20 measurementcapabilities over the previous dye-laser-based H20DIAL system. 9 20 The system has evolved over thepast 5 years to include tunable solid-state lasertechnology; equipment for accurate wavelength posi-tioning, stabilization, and monitoring; advanced data-acquisition and experiment-control electronics; high-throughput receiver optics; and solid-state detectortechnology. The airborne H 20 DIAL system con-sists of five major subsystems: the laser transmit-ters and transmission optics, the equipment for wave-length positioning and monitoring the receiver opticsand detectors, the timing and control electronics, andthe data-acquisition instrumentation. The lasertransmitters and the transmission optics are con-tained, along with the wavelength-monitoring equip-ment, in a rigid structure that is bolted to the aircraftseat tracks. The receiver system is also attached tothis structure, and it can be mounted for either nadiror zenith operation. Three dual aircraft racks housethe data-acquisition and the experiment-control elec-tronics, the laser power supplies and heat exchangers,and the wavelength-control electronics. A fourthrack, smaller than the dual racks, holds the two colorprinters used for real-time data output. A schematicof the airborne H20 DIAL system in the NASAWallops Flight Facility (WFF) Electra aircraft isshown in Fig. 1.
Laser TransmittersDifferent laser systems are used to generate theon-line and the off-line wavelengths for the H 20
6424 APPLIED OPTICS / Vol. 33, No. 27 / 20 September 1994
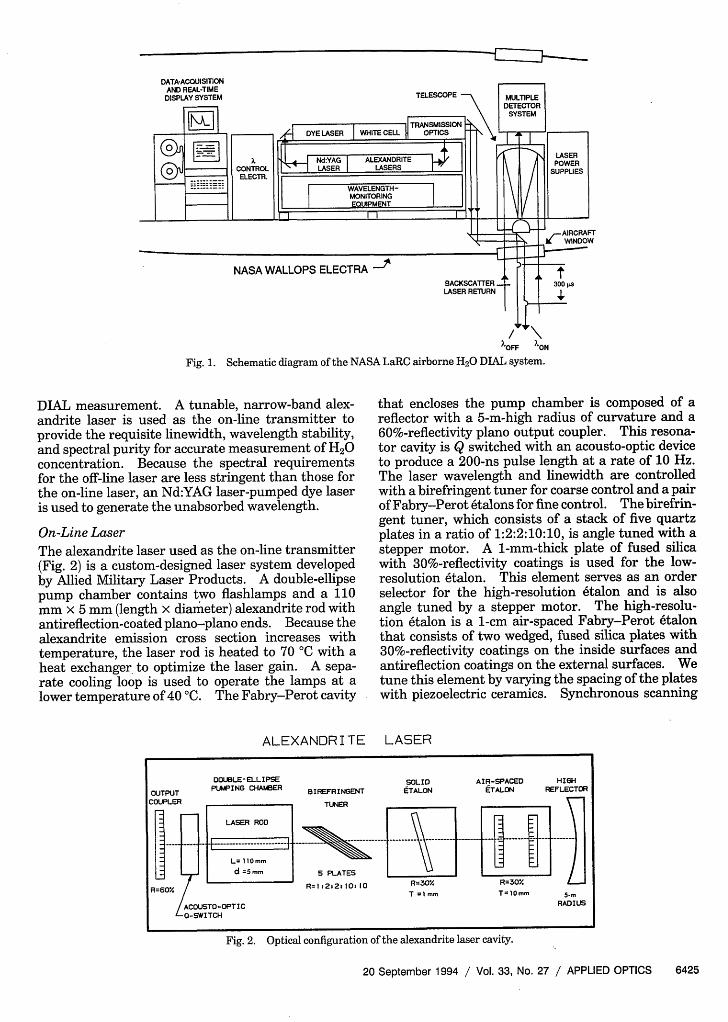
Fig. 1. Schematic diagram of the NASA LaRC airborne H20 DIAL system.
DIAL measurement. A tunable, narrow-band alex-andrite laser is used as the on-line transmitter toprovide the requisite linewidth, wavelength stability,and spectral purity for accurate measurement of H20concentration. Because the spectral requirementsfor the off-line laser are less stringent than those forthe on-line laser, an Nd:YAG laser-pumped dye laseris used to generate the unabsorbed wavelength.
On-Line LaserThe alexandrite laser used as the on-line transmitter(Fig. 2) is a custom-designed laser system developedby Allied Military Laser Products. A double-ellipsepump chamber contains two flashlamps and a 110mm x 5 mm (length x diameter) alexandrite rod withantireflection-coated plano-plano ends. Because thealexandrite emission cross section increases withtemperature, the laser rod is heated to 70 'C with aheat exchanger, to optimize the laser gain. A sepa-rate cooling loop is used to operate the lamps at alower temperature of 40 'C. The Fabry-Perot cavity
ALEXANDR I TE
that encloses the pump chamber is composed of areflector with a 5-m-high radius of curvature and a60%-reflectivity plano output coupler. This resona-tor cavity is Q switched with an acousto-optic deviceto produce a 200-ns pulse length at a rate of 10 Hz.The laser wavelength and linewidth are controlledwith a birefringent tuner for coarse control and a pairof Fabry-Perot 6talons for fine control. Thebirefrin-gent tuner, which consists of a stack of five quartzplates in a ratio of 1:2:2:10:10, is angle tuned with astepper motor. A 1-mm-thick plate of fused silicawith 30%-reflectivity coatings is used for the low-resolution 6talon. This element serves as an orderselector for the high-resolution 6talon and is alsoangle tuned by a stepper motor. The high-resolu-tion 6talon is a 1-cm air-spaced Fabry-Perot 6talonthat consists of two wedged, fused silica plates with30%-reflectivity coatings on the inside surfaces andantireflection coatings on the external surfaces. Wetune this element by varying the spacing of the plateswith piezoelectric ceramics. Synchronous scanning
LASER
Fig. 2. Optical configuration of the alexandrite laser cavity.
20 September 1994 / Vol. 33, No. 27 / APPLIED OPTICS 6425
DOUBLE-ELLIPSE SOLID AIR-SPACED HIGH
OUTPUT PUMPING CHAMBER BIREFRINGENT SALON ETALON REFLECTOR
COUPLER TUNER X[~~m ~LASER ROD
L= 10 m
d =55 PLATES-BR=60% R= 12:2:10:10 R=30. R=30%
T =mm T=lOmm 5-
ACOUSTO-OPTIC RADIUS^ -WTCH
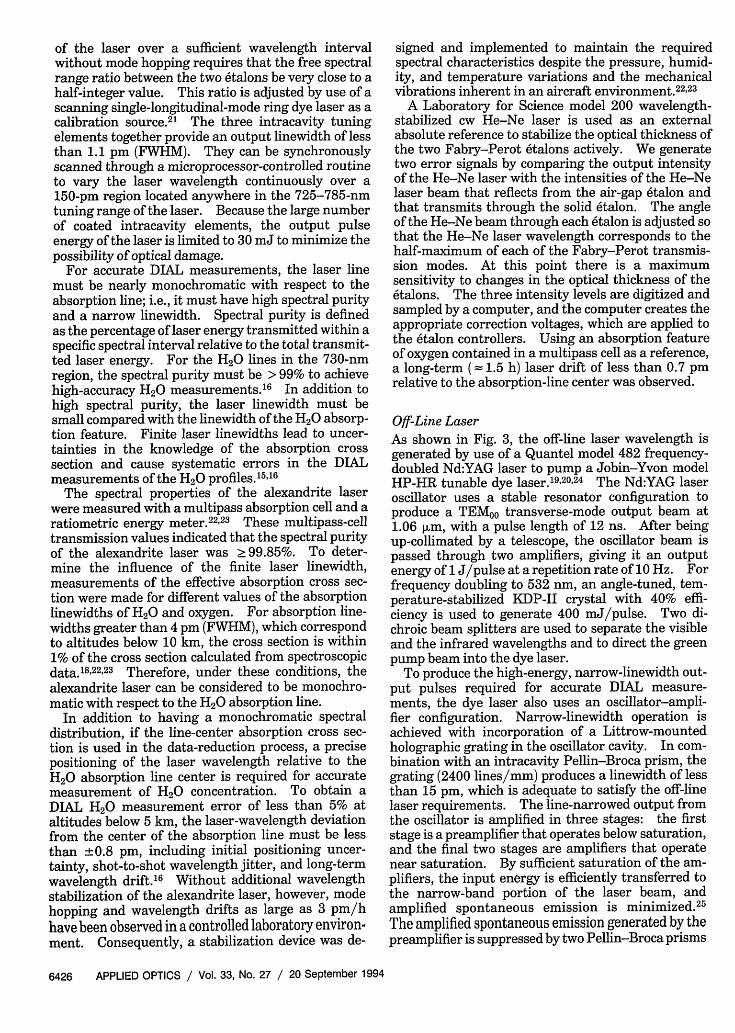
of the laser over a sufficient wavelength intervalwithout mode hopping requires that the free spectralrange ratio between the two 6talons be very close to ahalf-integer value. This ratio is adjusted by use of ascanning single-longitudinal-mode ring dye laser as acalibration source.21 The three intracavity tuningelements together provide an output linewidth of lessthan 1.1 pm (FWHM). They can be synchronouslyscanned through a microprocessor-controlled routineto vary the laser wavelength continuously over a150-pm region located anywhere in the 725-785-nmtuning range of the laser. Because the large numberof coated intracavity elements, the output pulseenergy of the laser is limited to 30 mJ to minimize thepossibility of optical damage.
For accurate DIAL measurements, the laser linemust be nearly monochromatic with respect to theabsorption line; i.e., it must have high spectral purityand a narrow linewidth. Spectral purity is definedas the percentage of laser energy transmitted within aspecific spectral interval relative to the total transmit-ted laser energy. For the H20 lines in the 730-nmregion, the spectral purity must be > 99% to achievehigh-accuracy H 20 measurements.' 6 In addition tohigh spectral purity, the laser linewidth must besmall compared with the linewidth of the H20 absorp-tion feature. Finite laser linewidths lead to uncer-tainties in the knowledge of the absorption crosssection and cause systematic errors in the DIALmeasurements of the H20 profiles.'5"16
The spectral properties of the alexandrite laserwere measured with a multipass absorption cell and aratiometric energy meter.2223 These multipass-celltransmission values indicated that the spectral purityof the alexandrite laser was 99.85%. To deter-mine the influence of the finite laser linewidth,measurements of the effective absorption cross sec-tion were made for different values of the absorptionlinewidths of H20 and oxygen. For absorption line-widths greater than 4 pm (FWHM), which correspondto altitudes below 10 km, the cross section is within1% of the cross section calculated from spectroscopicdata. 822 23 Therefore, under these conditions, thealexandrite laser can be considered to be monochro-matic with respect to the H 20 absorption line.
In addition to having a monochromatic spectraldistribution, if the line-center absorption cross sec-tion is used in the data-reduction process, a precisepositioning of the laser wavelength relative to theH20 absorption line center is required for accuratemeasurement of H20 concentration. To obtain aDIAL H2 0 measurement error of less than 5% ataltitudes below 5 km, the laser-wavelength deviationfrom the center of the absorption line must be lessthan ±0.8 pm, including initial positioning uncer-tainty, shot-to-shot wavelength jitter, and long-termwavelength drift.'6 Without additional wavelengthstabilization of the alexandrite laser, however, modehopping and wavelength drifts as large as 3 pm/hhave been observed in a controlled laboratory environ-ment. Consequently, a stabilization device was de-
signed and implemented to maintain the requiredspectral characteristics despite the pressure, humid-ity, and temperature variations and the mechanicalvibrations inherent in an aircraft environment. 22 23
A Laboratory for Science model 200 wavelength-stabilized cw He-Ne laser is used as an externalabsolute reference to stabilize the optical thickness ofthe two Fabry-Perot 6talons actively. We generatetwo error signals by comparing the output intensityof the He-Ne laser with the intensities of the He-Nelaser beam that reflects from the air-gap 6talon andthat transmits through the solid 6talon. The angleof the He-Ne beam through each 6talon is adjusted sothat the He-Ne laser wavelength corresponds to thehalf-maximum of each of the Fabry-Perot transmis-sion modes. At this point there is a maximumsensitivity to changes in the optical thickness of the6talons. The three intensity levels are digitized andsampled by a computer, and the computer creates theappropriate correction voltages, which are applied tothe 6talon controllers. Using an absorption featureof oxygen contained in a multipass cell as a reference,a long-term ( 1.5 h) laser drift of less than 0.7 pmrelative to the absorption-line center was observed.
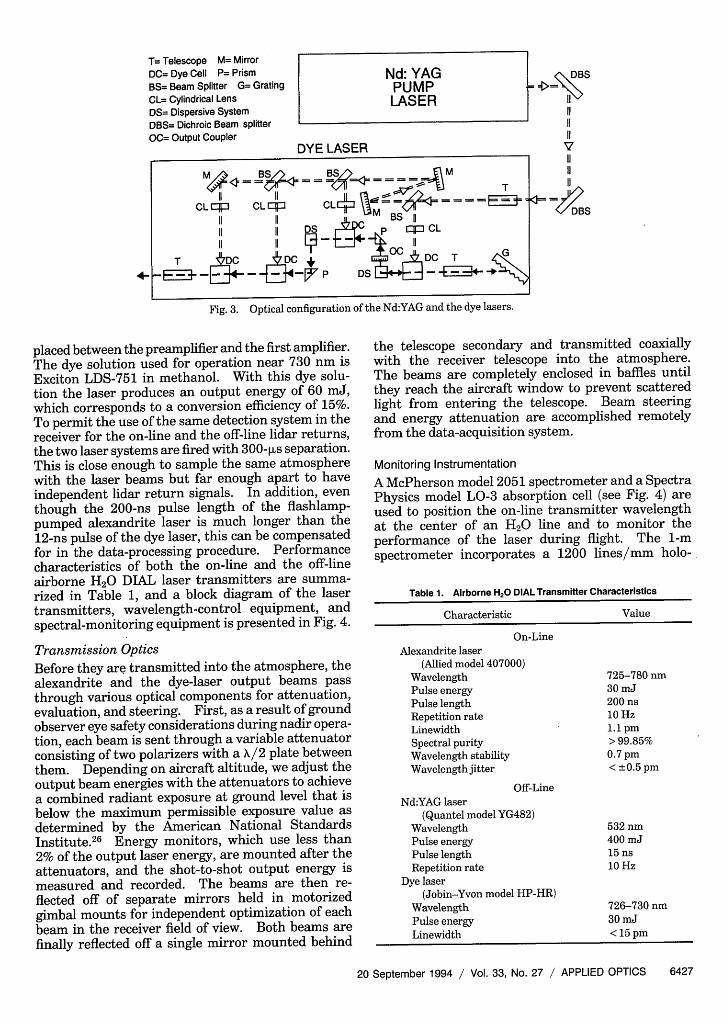
Off-Line LaserAs shown in Fig. 3, the off-line laser wavelength isgenerated by use of a Quantel model 482 frequency-doubled Nd:YAG laser to pump a Jobin-Yvon modelHP-HR tunable dye laser.192024 The Nd:YAG laseroscillator uses a stable resonator configuration toproduce a TEMOO transverse-mode output beam at1.06 pum, with a pulse length of 12 ns. After beingup-collimated by a telescope, the oscillator beam ispassed through two amplifiers, giving it an outputenergy of 1 J/pulse at a repetition rate of 10 Hz. Forfrequency doubling to 532 nm, an angle-tuned, tem-perature-stabilized KDP-II crystal with 40% effi-ciency is used to generate 400 mJ/pulse. Two di-chroic beam splitters are used to separate the visibleand the infrared wavelengths and to direct the greenpump beam into the dye laser.
To produce the high-energy, narrow-linewidth out-put pulses required for accurate DIAL measure-ments, the dye laser also uses an oscillator-ampli-fier configuration. Narrow-linewidth operation isachieved with incorporation of a Littrow-mountedholographic grating in the oscillator cavity. In com-bination with an intracavity Pellin-Broca prism, thegrating (2400 lines/mm) produces a linewidth of lessthan 15 pm, which is adequate to satisfy the off-linelaser requirements. The line-narrowed output fromthe oscillator is amplified in three stages: the firststage is a preamplifier that operates below saturation,and the final two stages are amplifiers that operatenear saturation. By sufficient saturation of the am-plifiers, the input energy is efficiently transferred tothe narrow-band portion of the laser beam, andamplified spontaneous emission is minimized.2 5
The amplified spontaneous emission generated by thepreamplifier is suppressed by two Pellin-Broca prisms
6426 APPLIED OPTICS / Vol. 33, No. 27 / 20 September 1994
T= Telescope M= MirrorDC= Dye Cell P= PrismBS= Beam Splitter G= GratingCL= Cylindrical LensDS= Dispersive SystemDBS= Dichroic Beam splitterOC= Output Coupler
Nd: YAGPUMPLASER
DYE LASER
MaiB BxEAII ~~~~~~~~~~T
CqP CLqP CLI CL M BS II
II II DS D: p XCL
II ii 11GT DC + DC T
_ P DS
Fig. 3. Optical configuration of the Nd:YAG and the dye lasers.
placed between the preamplifier and the first amplifier.The dye solution used for operation near 730 nm isExciton LDS-751 in methanol. With this dye solu-tion the laser produces an output energy of 60 mJ,which corresponds to a conversion efficiency of 15%.To permit the use of the same detection system in thereceiver for the on-line and the off-line lidar returns,the two laser systems are fired with 300-p1s separation.This is close enough to sample the same atmospherewith the laser beams but far enough apart to haveindependent lidar return signals. In addition, eventhough the 200-ns pulse length of the flashlamp-pumped alexandrite laser is much longer than the12-ns pulse of the dye laser, this can be compensatedfor in the data-processing procedure. Performancecharacteristics of both the on-line and the off-lineairborne H 20 DIAL laser transmitters are summa-rized in Table 1, and a block diagram of the lasertransmitters, wavelength-control equipment, andspectral-monitoring equipment is presented in Fig. 4.
Transmission OpticsBefore they are transmitted into the atmosphere, thealexandrite and the dye-laser output beams passthrough various optical components for attenuation,evaluation, and steering. First, as a result of groundobserver eye safety considerations during nadir opera-tion, each beam is sent through a variable attenuatorconsisting of two polarizers with a X/2 plate betweenthem. Depending on aircraft altitude, we adjust theoutput beam energies with the attenuators to achievea combined radiant exposure at ground level that isbelow the maximum permissible exposure value asdetermined by the American National StandardsInstitute.26 Energy monitors, which use less than2% of the output laser energy, are mounted after theattenuators, and the shot-to-shot output energy ismeasured and recorded. The beams are then re-flected off of separate mirrors held in motorizedgimbal mounts for independent optimization of eachbeam in the receiver field of view. Both beams arefinally reflected off a single mirror mounted behind
the telescope secondary and transmitted coaxiallywith the receiver telescope into the atmosphere.The beams are completely enclosed in baffles untilthey reach the aircraft window to prevent scatteredlight from entering the telescope. Beam steeringand energy attenuation are accomplished remotelyfrom the data-acquisition system.
Monitoring Instrumentation
A McPherson model 2051 spectrometer and a SpectraPhysics model LO-3 absorption cell (see Fig. 4) areused to position the on-line transmitter wavelengthat the center of an H20 line and to monitor theperformance of the laser during flight. The 1-mspectrometer incorporates a 1200 lines/mm holo-
Table 1. Airborne H20 DIAL Transmitter Characteristics
Characteristic Value
On-LineAlexandrite laser
(Allied model 407000)Wavelength 725-780 nmPulse energy 30 mJPulse length 200 nsRepetition rate 10 HzLinewidth 1.1 pmSpectral purity > 99.85%Wavelength stability 0.7 pmWavelength jitter < ±0.5 pm
Off-LineNd:YAG laser
(Quantel model YG482)Wavelength 532 nmPulse energy 400 mJPulse length 15 nsRepetition rate 10 Hz
Dye laser(Jobin-Yvon model HP-HR)
Wavelength 726-730 nmPulse energy 30 mJLinewidth < 15 pm
20 September 1994 / Vol. 33, No. 27 / APPLIED OPTICS 6427
<DBS
11
11
V11
1111
<WDBS
4-
Quane 1482 JY HP-HR dye laser ... oeen iarsgaNd:YAG~~~~~~~~- -ae '> Ao. oherent Lidar signalNd:Y laser )Off I time base digitizers
Iis
*a 8r _ _ > Beamlase I te aser steering
optics
He-Ne off reference Scan controi 300 gs
laserI on p
M nochromator I
OMA I AircraftOMIA ~~~~windowcomputer I _ | a window
nntlm;tr _ I iAbsorption ce_..._._ 1{<-/ I
I Absorption cell A_ 7 ;~ Coaxial withtelescope
Fig. 4. Block diagram of the H20 DIAL laser transmitter sub-system including laser transmitters, wavelength-control equip-ment, and spectral-monitoring instruments. JY, Jobin-Young,OMA, optical multichannel analyzer.
graphic grating in a Czerny-Turner optical configura-tion to produce a linear dispersion of approximately0.7 nm/mm at 730 nm. A Princeton Applied Re-search optical multichannel analyzer (OMA), whichconsists of a model 1205D linear array detector headattached to the spectrometer and a model 1205Acontrol unit, is used to evaluate the spectral character-istics of the output beam. The detector has a pixelspacing of 25 ,um, which corresponds to a wavelengthdispersion of 17.5 pm/pixel and provides a wavelength-positioning accuracy of better than ±20 pm.
The multipass absorption cell is of stainless-steelconstruction and has a heating jacket for high-temperature operation. The cell mirrors have dielec-tric coatings with > 99% reflectivity over the range725-790 nm. During operation, the cell is evacu-ated, heated to 60 C, and filled with approximately 40Torr of pure H20. Because the saturation vaporpressure at 60 0C is 150 Torr, the risk of condensationon the mirrors is minimized. A Laser Precisionmodel RJ7200 ratiometric energy meter with modelRJP 765 silicon probes is used to measure the amountof absorption through the multipass cell. A stabilitytest was performed to determine the ratiometerprecision associated with this type of measurement.The ratiometer precision, defined as the variation inthe absorption-cell transmission divided by the aver-age absorption-cell transmission, was determined tobe 1% when we evaluated the reproducibility of thebeam transmission through the evacuated absorptioncell with the laser set at a fixed wavelength.23
Taking into account the ratiometer precision, there issufficient optical depth, with an H20 pressure of 40Torr and a path length of 100 m in the cell, to positionthe alexandrite wavelength accurately at the center ofH20 lines having absorption cross sections greaterthan 4 x 10-24 cm2 /molecule.
Thus the procedure implemented to optimize thealexandrite output on an H20 line is first to set thewavelength as close as possible to the selected H20line by use of the spectrometer-OMA, with an atomic
vapor lamp as a reference. Next, while observing theabsorption-cell transmission on the ratiometer read-out, we vary the laser wavelength by synchronouslyscanning the intracavity tuning elements. When themaximum absorption through the multipass cell isdetected, the laser wavelength is locked on the H20line by use of the stabilization device described above.Using the spectrometer-OMA combination, we setthe off-line wavelength between 60 and 100 pm fromthe on-line wavelength in a region free of otherabsorption features.
Both the spectrometer-OMA combination and theabsorption cell are also used for real-time monitoringof the alexandrite spectral characteristics duringflight operations. A small portion of the output iskicked off and sent through fiber optics to the spec-trometer. Mode hops between adjacent thin 6talonmodes (free spectral range 180 pm) that result from adrift of the birefringent tuner or of the 6talon itselfcan be seen on the OMA display. A beam splitter isalso placed in the beam to reflect 4% of the outputinto the absorption cell. Thus any drift in wave-length that is caused by a variation in the optical paththrough the air-spaced talon will be immediatelydetected by the ratiometer. In addition, a shot-to-shot measurement of the effective absorption crosssection in the absorption cell can be recorded.
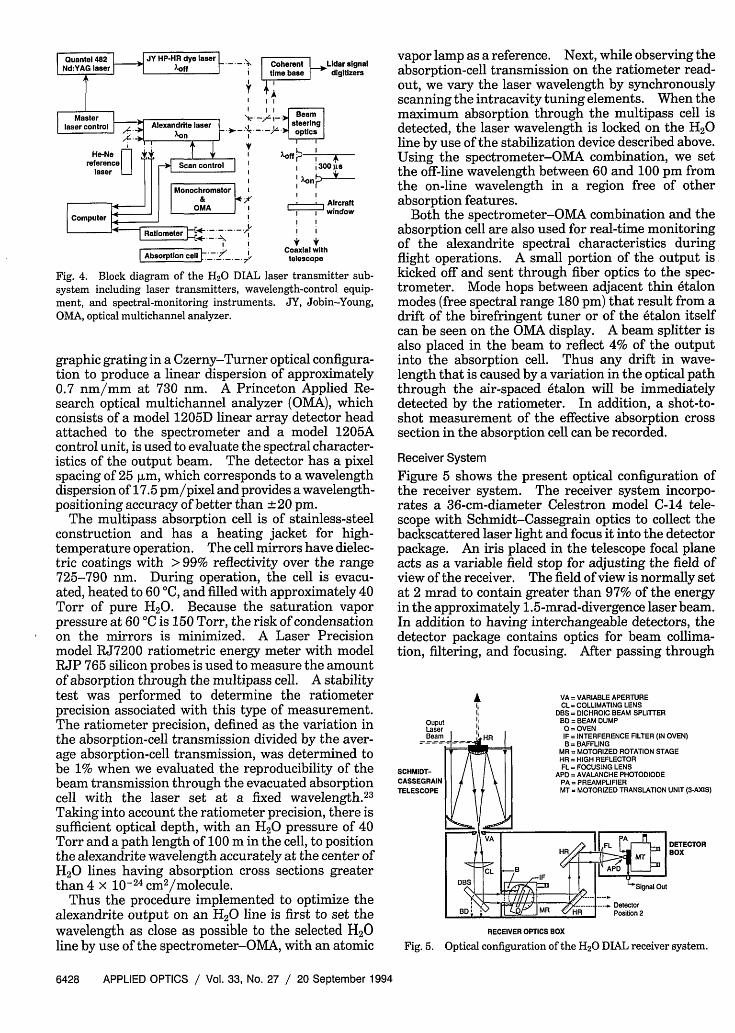
Receiver SystemFigure 5 shows the present optical configuration ofthe receiver system. The receiver system incorpo-rates a 36-cm-diameter Celestron model C-14 tele-scope with Schmidt-Cassegrain optics to collect thebackscattered laser light and focus it into the detectorpackage. An iris placed in the telescope focal planeacts as a variable field stop for adjusting the field ofview of the receiver. The field of view is normally setat 2 mrad to contain greater than 97% of the energyin the approximately 1.5-mrad-divergence laser beam.In addition to having interchangeable detectors, thedetector package contains optics for beam collima-tion, filtering, and focusing. After passing through
OuputLaserBeam
SCHMIDT-CASSEGRAINTELESCOPE
VA = VARIABLE APERTURECL =COLLIMATING LENS
DBS = DICHROIC BEAM SPLITTERBD = BEAM DUMP0= OVENIF = INTERFERENCE FILTER (IN OVEN)B = BAFFLING
MR = MOTORIZED ROTATION STAGEHR = HIGH REFLECTORFL = FOCUSING LENS
APD =AVALANCHE PHOTODIODEPA = PREAMPLIFIERMT = MOTORIZED TRANSLATION UNIT (3-AXIS)
I Out
DetectorPosition 2
RECEIVER OPTICS BOX
Fig. 5. Optical configuration of the H20 DIAL receiver system.
6428 APPLIED OPTICS / Vol. 33, No. 27 / 20 September 1994
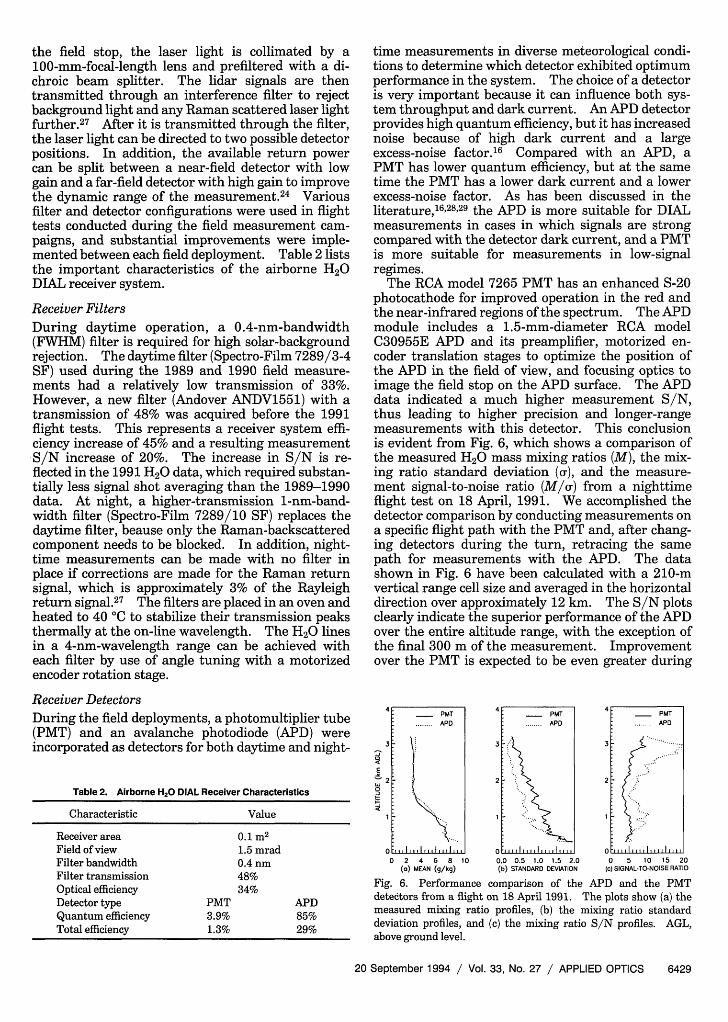
the field stop, the laser light is collimated by a100-mm-focal-length lens and prefiltered with a di-chroic beam splitter. The lidar signals are thentransmitted through an interference filter to rejectbackground light and any Raman scattered laser lightfurther.2 7 After it is transmitted through the filter,the laser light can be directed to two possible detectorpositions. In addition, the available return powercan be split between a near-field detector with lowgain and a far-field detector with high gain to improvethe dynamic range of the measurement. 24 Variousfilter and detector configurations were used in flighttests conducted during the field measurement cam-paigns, and substantial improvements were imple-mented between each field deployment. Table 2 liststhe important characteristics of the airborne H20DIAL receiver system.
Receiver FiltersDuring daytime operation, a 0.4-nm-bandwidth(FWHM) filter is required for high solar-backgroundrejection. The daytime filter (Spectro-Film 7289/3-4SF) used during the 1989 and 1990 field measure-ments had a relatively low transmission of 33%.However, a new filter (Andover ANDV1551) with atransmission of 48% was acquired before the 1991flight tests. This represents a receiver system effi-ciency increase of 45% and a resulting measurementS/N increase of 20%. The increase in S/N is re-flected in the 1991 H20 data, which required substan-tially less signal shot averaging than the 1989-1990data. At night, a higher-transmission 1-nm-band-width filter (Spectro-Film 7289/10 SF) replaces thedaytime filter, beause only the Raman-backscatteredcomponent needs to be blocked. In addition, night-time measurements can be made with no filter inplace if corrections are made for the Raman returnsignal, which is approximately 3% of the Rayleighreturn signal.27 The filters are placed in an oven andheated to 40 C to stabilize their transmission peaksthermally at the on-line wavelength. The H20 linesin a 4-nm-wavelength range can be achieved witheach filter by use of angle tuning with a motorizedencoder rotation stage.
Receiver DetectorsDuring the field deployments, a photomultiplier tube(PMT) and an avalanche photodiode (APD) wereincorporated as detectors for both daytime and night-
Table 2. Airborne H2 0 DIAL Receiver Characteristics
Characteristic Value
Receiver area 0.1 m2
Field of view 1.5 mradFilter bandwidth 0.4 nmFilter transmission 48%Optical efficiency 34%Detector type PMT APDQuantum efficiency 3.9% 85%Total efficiency 1.3% 29%
time measurements in diverse meteorological condi-tions to determine which detector exhibited optimumperformance in the system. The choice of a detectoris very important because it can influence both sys-tem throughput and dark current. An APD detectorprovides high quantum efficiency, but it has increasednoise because of high dark current and a largeexcess-noise factor. 16 Compared with an APD, aPMT has lower quantum efficiency, but at the sametime the PMT has a lower dark current and a lowerexcess-noise factor. As has been discussed in theliterature,16 282 9 the APD is more suitable for DIALmeasurements in cases in which signals are strongcompared with the detector dark current, and a PMTis more suitable for measurements in low-signalregimes.
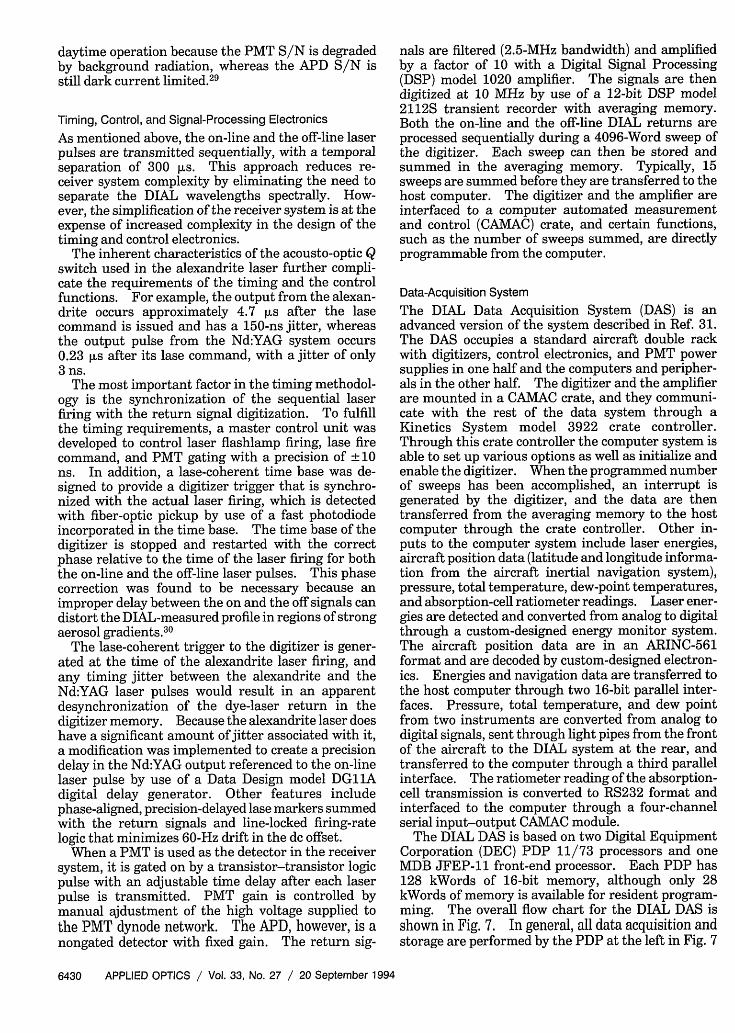
The RCA model 7265 PMT has an enhanced S-20photocathode for improved operation in the red andthe near-infrared regions of the spectrum. The APDmodule includes a 1.5-mm-diameter RCA modelC30955E APD and its preamplifier, motorized en-coder translation stages to optimize the position ofthe APD in the field of view, and focusing optics toimage the field stop on the APD surface. The APDdata indicated a much higher measurement S/N,thus leading to higher precision and longer-rangemeasurements with this detector. This conclusionis evident from Fig. 6, which shows a comparison ofthe measured H20 mass mixing ratios (M), the mix-ing ratio standard deviation (), and the measure-ment signal-to-noise ratio (M/() from a nighttimeflight test on 18 April, 1991. We accomplished thedetector comparison by conducting measurements ona specific flight path with the PMT and, after chang-ing detectors during the turn, retracing the samepath for measurements with the APD. The datashown in Fig. 6 have been calculated with a 210-mvertical range cell size and averaged in the horizontaldirection over approximately 12 km. The S/N plotsclearly indicate the superior performance of the APDover the entire altitude range, with the exception ofthe final 300 m of the measurement. Improvementover the PMT is expected to be even greater during
PMT PMT PMT
3 3: ~~~~~~~~~~~~~~3 .......
2 2
Y31 .. 1i i0 . .0 .. .0
0 2 4 6 8 10 0.o 0. 1.0 1.5 2.0 0 5 10 15 20(o) MEAN (g/kg) (b) STANDARD DEVIATION (c) SIGNAL-TO-NOISE RATIO
Fig. 6. Performance comparison of the APD and the PMTdetectors from a flight on 18 April 1991. The plots show (a) themeasured mixing ratio profiles, (b) the mixing ratio standarddeviation profiles, and (c) the mixing ratio S/N profiles. AGL,above ground level.
20 September 1994 / Vol. 33, No. 27 / APPLIED OPTICS 6429
daytime operation because the PMT S/N is degradedby background radiation, whereas the APD S/N isstill dark current limited.29
Timing, Control, and Signal-Processing ElectronicsAs mentioned above, the on-line and the off-line laserpulses are transmitted sequentially, with a temporalseparation of 300 [Ls. This approach reduces re-ceiver system complexity by eliminating the need toseparate the DIAL wavelengths spectrally. How-ever, the simplification of the receiver system is at theexpense of increased complexity in the design of thetiming and control electronics.
The inherent characteristics of the acousto-optic Qswitch used in the alexandrite laser further compli-cate the requirements of the timing and the controlfunctions. For example, the output from the alexan-drite occurs approximately 4.7 [Ls after the lasecommand is issued and has a 150-ns jitter, whereasthe output pulse from the Nd:YAG system occurs0.23 [Ls after its lase command, with a jitter of only3ns.
The most important factor in the timing methodol-ogy is the synchronization of the sequential laserfiring with the return signal digitization. To fulfillthe timing requirements, a master control unit wasdeveloped to control laser flashlamp firing, lase firecommand, and PMT gating with a precision of ± 10ns. In addition, a lase-coherent time base was de-signed to provide a digitizer trigger that is synchro-nized with the actual laser firing, which is detectedwith fiber-optic pickup by use of a fast photodiodeincorporated in the time base. The time base of thedigitizer is stopped and restarted with the correctphase relative to the time of the laser firing for boththe on-line and the off-line laser pulses. This phasecorrection was found to be necessary because animproper delay between the on and the off signals candistort the DIAL-measured profile in regions of strongaerosol gradients. 30
The lase-coherent trigger to the digitizer is gener-ated at the time of the alexandrite laser firing, andany timing jitter between the alexandrite and theNd:YAG laser pulses would result in an apparentdesynchronization of the dye-laser return in thedigitizer memory. Because the alexandrite laser doeshave a significant amount of jitter associated with it,a modification was implemented to create a precisiondelay in the Nd:YAG output referenced to the on-linelaser pulse by use of a Data Design model DG11Adigital delay generator. Other features includephase-aligned, precision-delayed lase markers summedwith the return signals and line-locked firing-ratelogic that minimizes 60-Hz drift in the dc offset.
When a PMT is used as the detector in the receiversystem, it is gated on by a transistor-transistor logicpulse with an adjustable time delay after each laserpulse is transmitted. PMT gain is controlled bymanual ajdustment of the high voltage supplied tothe PMT dynode network. The APD, however, is anongated detector with fixed gain. The return sig-
nals are filtered (2.5-MHz bandwidth) and amplifiedby a factor of 10 with a Digital Signal Processing(DSP) model 1020 amplifier. The signals are thendigitized at 10 MHz by use of a 12-bit DSP model2112S transient recorder with averaging memory.Both the on-line and the off-line DIAL returns areprocessed sequentially during a 4096-Word sweep ofthe digitizer. Each sweep can then be stored andsummed in the averaging memory. Typically, 15sweeps are summed before they are transferred to thehost computer. The digitizer and the amplifier areinterfaced to a computer automated measurementand control (CAMAC) crate, and certain functions,such as the number of sweeps summed, are directlyprogrammable from the computer.
Data-Acquisition System
The DIAL Data Acquisition System (DAS) is anadvanced version of the system described in Ref. 31.The DAS occupies a standard aircraft double rackwith digitizers, control electronics, and PMT powersupplies in one half and the computers and peripher-als in the other half. The digitizer and the amplifierare mounted in a CAMAC crate, and they communi-cate with the rest of the data system through aKinetics System model 3922 crate controller.Through this crate controller the computer system isable to set up various options as well as initialize andenable the digitizer. When the programmed numberof sweeps has been accomplished, an interrupt isgenerated by the digitizer, and the data are thentransferred from the averaging memory to the hostcomputer through the crate controller. Other in-puts to the computer system include laser energies,aircraft position data (latitude and longitude informa-tion from the aircraft inertial navigation system),pressure, total temperature, dew-point temperatures,and absorption-cell ratiometer readings. Laser ener-gies are detected and converted from analog to digitalthrough a custom-designed energy monitor system.The aircraft position data are in an ARINC-561format and are decoded by custom-designed electron-ics. Energies and navigation data are transferred tothe host computer through two 16-bit parallel inter-faces. Pressure, total temperature, and dew pointfrom two instruments are converted from analog todigital signals, sent through light pipes from the frontof the aircraft to the DIAL system at the rear, andtransferred to the computer through a third parallelinterface. The ratiometer reading of the absorption-cell transmission is converted to RS232 format andinterfaced to the computer through a four-channelserial input-output CAMAC module.
The DIAL DAS is based on two Digital EquipmentCorporation (DEC) PDP 11/73 processors and oneMDB JFEP-11 front-end processor. Each PDP has128 kWords of 16-bit memory, although only 28kWords of memory is available for resident program-ming. The overall flow chart for the DIAL DAS isshown in Fig. 7. In general, all data acquisition andstorage are performed by the PDP at the left in Fig. 7
6430 APPLIED OPTICS / Vol. 33, No. 27 / 20 September 1994
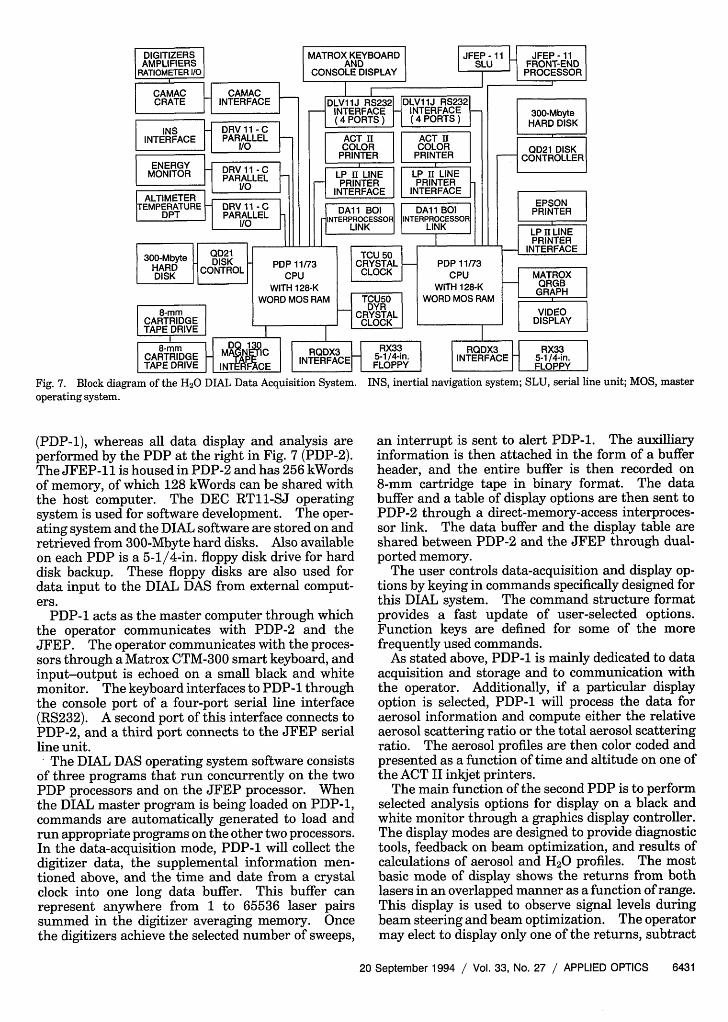
Fig. 7. Block diagram of the H20 DIAL Data Acquisition System. INS, inertial navigation system; SLU, serial line unit; MOS, masteroperating system.
(PDP-1), whereas all data display and analysis areperformed by the PDP at the right in Fig. 7 (PDP-2).The JFEP-1 1 is housed in PDP-2 and has 256 Wordsof memory, of which 128 kWords can be shared withthe host computer. The DEC RT11-SJ operatingsystem is used for software development. The oper-ating system and the DIAL software are stored on andretrieved from 300-Mbyte hard disks. Also availableon each PDP is a 5-1/4-in. floppy disk drive for harddisk backup. These floppy disks are also used fordata input to the DIAL DAS from external comput-ers.
PDP-1 acts as the master computer through whichthe operator communicates with PDP-2 and theJFEP. The operator communicates with the proces-sors through a Matrox CTM-300 smart keyboard, andinput-output is echoed on a small black and whitemonitor. The keyboard interfaces to PDP-1 throughthe console port of a four-port serial line interface(RS232). A second port of this interface connects toPDP-2, and a third port connects to the JFEP serialline unit.
The DIAL DAS operating system software consistsof three programs that run concurrently on the twoPDP processors and on the JFEP processor. Whenthe DIAL master program is being loaded on PDP-1,commands are automatically generated to load andrun appropriate programs on the other two processors.In the data-acquisition mode, PDP-1 will collect thedigitizer data, the supplemental information men-tioned above, and the time and date from a crystalclock into one long data buffer. This buffer canrepresent anywhere from 1 to 65536 laser pairssummed in the digitizer averaging memory. Oncethe digitizers achieve the selected number of sweeps,
an interrupt is sent to alert PDP-1. The auxilliaryinformation is then attached in the form of a bufferheader, and the entire buffer is then recorded on8-mm cartridge tape in binary format. The databuffer and a table of display options are then sent toPDP-2 through a direct-memory-access interproces-sor link. The data buffer and the display table areshared between PDP-2 and the JFEP through dual-ported memory.
The user controls data-acquisition and display op-tions by keying in commands specifically designed forthis DIAL system. The command structure formatprovides a fast update of user-selected options.Function keys are defined for some of the morefrequently used commands.
As stated above, PDP-1 is mainly dedicated to dataacquisition and storage and to communication withthe operator. Additionally, if a particular displayoption is selected, PDP-1 will process the data foraerosol information and compute either the relativeaerosol scattering ratio or the total aerosol scatteringratio. The aerosol profiles are then color coded andpresented as a function of time and altitude on one ofthe ACT II inkjet printers.
The main function of the second PDP is to performselected analysis options for display on a black andwhite monitor through a graphics display controller.The display modes are designed to provide diagnostictools, feedback on beam optimization, and results ofcalculations of aerosol and H20 profiles. The mostbasic mode of display shows the returns from bothlasers in an overlapped manner as a function of range.This display is used to observe signal levels duringbeam steering and beam optimization. The operatormay elect to display only one of the returns, subtract
20 September 1994 / Vol. 33, No. 27 / APPLIED OPTICS 6431
the background, smooth the return (by use of arunning average), correct for range-squared depen-dence, normalize the return for laser energy, andaverage successive returns. Another display modeshows the relative aerosol scattering profile as afunction of altitude with smoothing and averagingoptions. One can also calculate scattering ratios inthis mode by specifying an altitude at which tonormalize the lidar return to a model molecularnumber density profile. A H20 mixing ratio profilecan be calculated from each DIAL signal pair andsuccessive profiles can be averaged to improve themeasurement statistics. The updating average canbe displayed as a function of altitude with range-cellsize, smoothing, and averaging options.
A final display mode is implemented during spiralascents and descents. The H20 mixing ratios arecalculated from in situ dew-point measurements andplotted as a function of altitude. These profiles canthen be compared with inflight DIAL profiles ob-tained over the spiral point to provide validation ofthe DIAL system. Any screen display can be cap-tured at any time and plotted with a dot matrixprinter. Because the screen is stored in memorybefore plotting, there is only a brief pause before thescreen update proceeds.
PDP-2 sends the DIAL returns to the JFEP. TheJFEP stores a running average of DIAL returns andcomputes the DIAL calculation on that average toobtain a H20 mixing ratio profile. Each profile isthen returned to PDP-2, color coded for magnitude,and plotted on an ACT II inkjet printer as a functionof altitude, time, and position. Real-time color crosssections of H20 mixing ratios and aerosol scatteringratios are produced simultaneously by the H20 DIALDAS.
Field MeasurementsDuring 1989-1991, the H20 DIAL system was de-ployed to NASA WFF for three separate flight-testexperiments. Preliminary engineering flights wereperformed in July 1989 to complete system shake-down and to assess system airborne operational reli-ability.32 During March 1990 and April 1991, addi-tional flight tests were conducted in a variety ofmeteorological conditions to verify the performanceof the system and to establish the accuracy of theDIAL-measured H2 0 profiles.9 33 Included in theseengineering and data flights were numerous intercom-parison measurements taken with onboard dew-pointhygrometers and H20 radiosondes launched fromboth NASA LaRC and NASA WFF. Between each ofthe field deployments, many modifications were imple-mented to improve system performance and to auto-mate system operation in flight further.
In Situ Instruments
Two dew-point hygrometers were used on the NASAWFF Electra aircraft to obtain in situ H20 measure-ments: the EG&G model 137-C3 aircraft hygrom-eter and the modified EG&G model 300 microproces-
sor-controlled hygrometer. Both instruments usethe chilled-mirror dew-point condensation principleto determine the H20 concentration outside theaircraft. Details of this technique and of the opera-tion of an EG&G 137-C3 hygrometer in aircraft fieldmeasurements can be found in Ref. 34. This unitincorporates a model SO aircraft-mounted sensorhead with a sampling probe designed to provide astatic pressure sample at the correct mass flow rateacross the chilled mirror. The model 300 hygrom-eter, on the other hand, is a laboratory unit, and wehad to modify its model 53 sensor head by implement-ing a sampling probe for airborne operation. Amajor advantage of this instrument is the applicationof microprocessors and digital techniques to controlthe servoloop that maintains dew or frost in equilib-rium on the mirror surface in the sensor. Thisapproach leads to greater accuracy as well as theability to operate effectively at lower dew points.The accuracy of the model 300 hygrometer is specifiedas ± 0.2 "C, whereas the accuracy of the model 137-C3hygrometer is stated to be ±0.5 C. Conversion ofthe vapor pressures, determined with the dew-pointtemperature measurements, to H20 mixing ratios isaccomplished by making simultaneous measure-ments of the atmospheric pressure. In situ H20mixing ratio profiles were obtained with the dew-point hygrometers by spiraling the Electra down to aminimum altitude of 152.4 m at approximately 304.8m/min.
Other in situ intercomparison profiles were ac-quired by H20 radiosondes launched from groundstations located at NASA LaRC and NASA WFF.The balloons were released approximately 10 minbefore overflight by ground personnel who were inradio contact. Because the balloons typically ascendat approximately 200 m/min, this timing places thesonde at the center of the DIAL measurement alti-tude range when the plane is overhead (neglectinghorizontal movement resulting from winds). Theradiosonde package used for these measurements wasthe Vaisala model RS80, which incorporates solid-state thin-film capacitor sensing technology. Thistype of sonde was chosen because of its sensitivity andaccuracy at relative humidity values below 20% ascompared with the carbon element hygristor tech-nique used in other packages.35 Numerous over-flights of NASA WFF and NASA LaRC were conductedto provide ample opportunity for DIAL-radiosondecomparisons. In addition, a standard landing proce-dure was used at NASA WFF, first to overfly thefacility to obtain a DIAL profile and then to spiral theaircraft down while simultaneously launching a H20radiosonde. This landing procedure allowed us tointercompare all three H 20 profile measurementtechniques.
System Parameters
Two H20 absorption lines near 730 nm were used forthe majority of the DIAL measurements. The stron-ger line, located at 728.7379 nm, has an absorption
6432 APPLIED OPTICS / Vol. 33, No. 27 / 20 September 1994
cross section of 46.0 x 10⁻²⁴ cm2/molecule at groundlevel. This line was used extensively in the flighttests because of the ability to make high-accuracymeasurements from 4 km to the surface over a broadrange of meteorological conditions. The second line,with an absorption cross section of 21.6 x 10⁻²⁴cm2 /molecule at 1 atm, provides approximately afactor-of-2 decrease in the optical depth over therange cell compared with the stronger line. Measure-ments from higher altitudes and at elevated humiditylevels required that we use this weaker line, which islocated at 728.8126 nm. These two H20 absorptionlines were chosen for three primary reasons: (1) Thereceiver daytime filter center wavelength for light atnormal incidence is 729.2 nm; (2) errors resultingfrom temperature sensitivity are small because bothlines have lower energy levels in the temperature-insensitive range for mixing ratio measurements3 6;and (3) the lines are isolated, thus minimizing theerrors caused by overlapping from adjacent lines andfacilitating the positioning of the off-line wavelength.The dye-laser wavelength was placed at approxi-mately 728.90 nm when the weaker line was used andat approximately 728.65 nm when the stronger linewas used. In addition to providing the off-line laserreturn for the DIAL measurement, the dye-laserbackscattered signal is also used to produce theatmospheric scattering-ratio profile.
Data AnalysisThe postmission data analysis was done with a Mi-crovax II computer. The data were first edited byrejection of shots resulting from poor laser energy orsignals that were attenuated by strong near-fieldclouds to ensure that quality lidar return signals wereused in DIAL calculations. The on-line and theoff-line signal profiles were altitude aligned by shift-ing them to compensate for any slight difference inthe altitude registering caused by a relative laser-firing delay. The data were background subtractedto remove the signal bias resulting from the daylightand the detector dark current. The signal profilesused in the calculations were limited to the regionbetween the range past the full detector turn-on andthe ground return or the cloud saturation point.Because of the difference in pulse lengths of theon-line and the off-line laser signals, the smoothingintervals of the two signals were adjusted to ensurean equivalent 300-m running sampling interval (ver-tical range) for DIAL calculations. The effectiveH20 absorption cross-section altitude profile wascalculated with the Voigt profile representation of theline shape,37 spectroscopic parameters of the H20line, and the standard atmospheric model. Thiseffective absorption cross-section profile is then usedto calculate the H20 number density profile by use ofthe DIAL equation [Eq. (2)]. The lidar returns usedfor the DIAL calculations were collected by use ofshot accumulation times of 1 s onboard the aircraft.The 1991 data were further smoothed by use of ahorizontal average of 6 km ( 1 min), and for the
1990 data a variable horizontal interval that rangedfrom 6 km near the aircraft altitude to 30 km near theground was required for the data to retain a good S/Nover the entire altitude range. The DIAL-derivedH20 number density profile was converted to amixing ratio profile by use of a midlatitude atmo-spheric model, and the error bars in the profile plotscorrespond to the standard error of the average H20profile.
Experimental Data
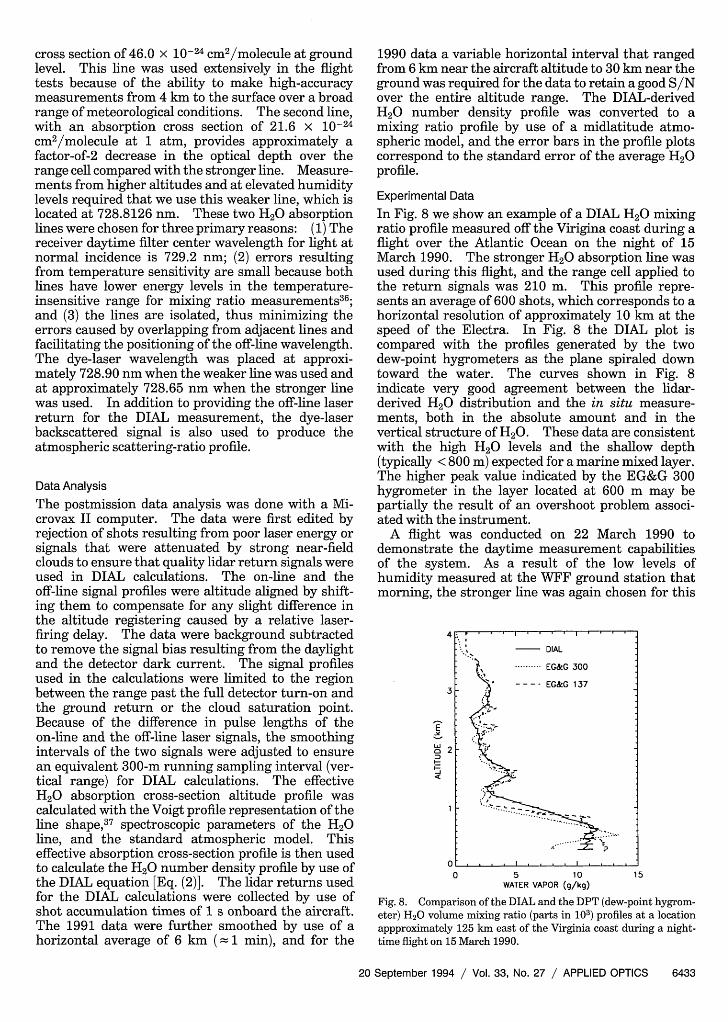
In Fig. 8 we show an example of a DIAL H20 mixingratio profile measured off the Virigina coast during aflight over the Atlantic Ocean on the night of 15March 1990. The stronger H20 absorption line wasused during this flight, and the range cell applied tothe return signals was 210 m. This profile repre-sents an average of 600 shots, which corresponds to ahorizontal resolution of approximately 10 km at thespeed of the Electra. In Fig. 8 the DIAL plot iscompared with the profiles generated by the twodew-point hygrometers as the plane spiraled downtoward the water. The curves shown in Fig. 8indicate very good agreement between the lidar-derived H20 distribution and the in situ measure-ments, both in the absolute amount and in thevertical structure of H20. These data are consistentwith the high H20 levels and the shallow depth(typically < 800 m) expected for a marine mixed layer.The higher peak value indicated by the EG&G 300hygrometer in the layer located at 600 m may bepartially the result of an overshoot problem associ-ated with the instrument.
A flight was conducted on 22 March 1990 todemonstrate the daytime measurement capabilitiesof the system. As a result of the low levels ofhumidity measured at the WFF ground station thatmorning, the stronger line was again chosen for this
4
3
bi'
0 2
0 5 10 15WATER VAPOR (g/kg)
Fig. 8. Comparison of the DIAL and the DPT (dew-point hygrom-eter) H20 volume mixing ratio (parts in 103) profiles at a locationappproximately 125 km east of the Virginia coast during a night-time flight on 15 March 1990.
20 September 1994 / Vol. 33, No. 27 / APPLIED OPTICS 6433
DIAL
-EG&G 300
- EG&G 137
.. '...
_. . . . . . . .
- I
1
n1

flight test. Figure 9 presents an afternoon set ofmeasurements over Emporia, Virginia. Because ofthe significant variations in the boundary layer, onlythe EG&G 300 hygrometer plot is shown for clarity.The difference between the DIAL and the dew-point-hygrometer profiles is < 10% over the entire range ofthe measurements. This agreement with measure-ments made with in situ probes is typical for theDIAL system. These results clearly show the abilityof the DIAL system to make accurate, high-resolutionmeasurements of large variations in the verticaldistribution of H20.
After the Electra returned to flight altitude (4 km)above Emporia, we flew from Emporia to a pointapproximately 120 km off the coast of Virginia andobserved the transition from a continental mixedlayer to a marine mixed layer. Cross sections of theaerosol and the H2 0 distributions encountered onthis flight path are shown in Figs. 10(a) and 10(b),respectively. A 300-m range cell was used, and ahorizontal average that varied with altitude wasapplied to the H2 0 data to ensure that the ratio of thestandard deviation to the mean of the horizontalvalues was < 10%. The aircraft crossed the coast at14:43 h local standard time (LST), and the measuredaerosol and H2 0 distributions clearly show the de-crease in the mixed layer depth from approximately1.7 km over land to less than 1 km over water.Increased H2 0 concentrations can be seen near thecoast in the continental mixed layer as a result of thedaytime seabreeze circulation, and H20 is seen to bepositively correlated with aerosol loading. Theseairborne DIAL measurements show the detailed H2 0and aerosol structures that occur in the free tropo-sphere and in the mixed layer over different land andmarine regimes.
At the end of the 22 March flight test, an overflightand spiral descent were performed at NASA WFFbefore landing the aircraft. This procedure provided
4
3
i, 2
00 1 5
WATER VAPOR (g/kg)
Fig. 9. Comparison of the DIAL and the DPT 300 hygrometermixing ratio profiles over Emporia, Virginia, from an afternoonflight on 22 March 1990.
-IUo
CQa
I-
MU
3-
2-
:1-
U)< 3-
2-us M I-
5 I-"l0
RELATIVE AEROSOL SCATTERING (IR)0 1.5 3 4.5 6 7.5
14 35 14-40 14i45 14-50 14-55
COAST
36.81 36.88 36.92 36.93 36.94III I III I I Ij I I I I I e
-76.73 -76.27 -75.80 -75.33 -74.87(a)
WATER VAPOR (g/kg)0 1 2 3 4 5
14-35 14:40 14-45 4:50 4-55
COAST
36.81 36.88 36.92 36.93 36.94
-76.73 -76.27 -75.80 -75.33 -74.87
LST
3
-2
-1t
N LAT
E LON
LST
-3
-2
-0N LAT
E LON
(b)Fig. 10. Cross sections of (a) relative aerosol backscatter and (b)H20 mass mixing ratio (grams per kilogram) obtained during aflight across the coast of Virginia on 22 March 1990. ASL, abovesea level; LAT, latitude; LON, longitude.
near-simultaneous H2 0 profiles from the DIAL sys-tem, the EG&G 300 dew-point hygrometer, and aradiosonde launched from the WFF ground station.Results from these measurements, which are pre-sented in Fig. 11, verified the capability of the DIALsystem to provide an accurate determination of theH20 distribution from an aircraft altitude of almost 6
3
-'iB0 2
00 2 3 4 5
WATER VAPOR (g/kg)
Fig. 11. Intercomparison of H20 measurements with the DIALsystem, the DPT 300 hygrometer, and a Vaisala radiosonde overthe Wallops Flight Facility (WFF) at the end of the flight on 22March 1990.
6434 APPLIED OPTICS / Vol. 33, No. 27 / 20 September 1994
.. DIAL
* EG&G 300
. .. . ..... ............. ... .. . .
km. In addition, the comparison of the radiosondeand the hygrometer demonstrates good agreementbetween these two measurement techniques andallows us to be confident in using these instrumentsto verify the performance of the DIAL system.
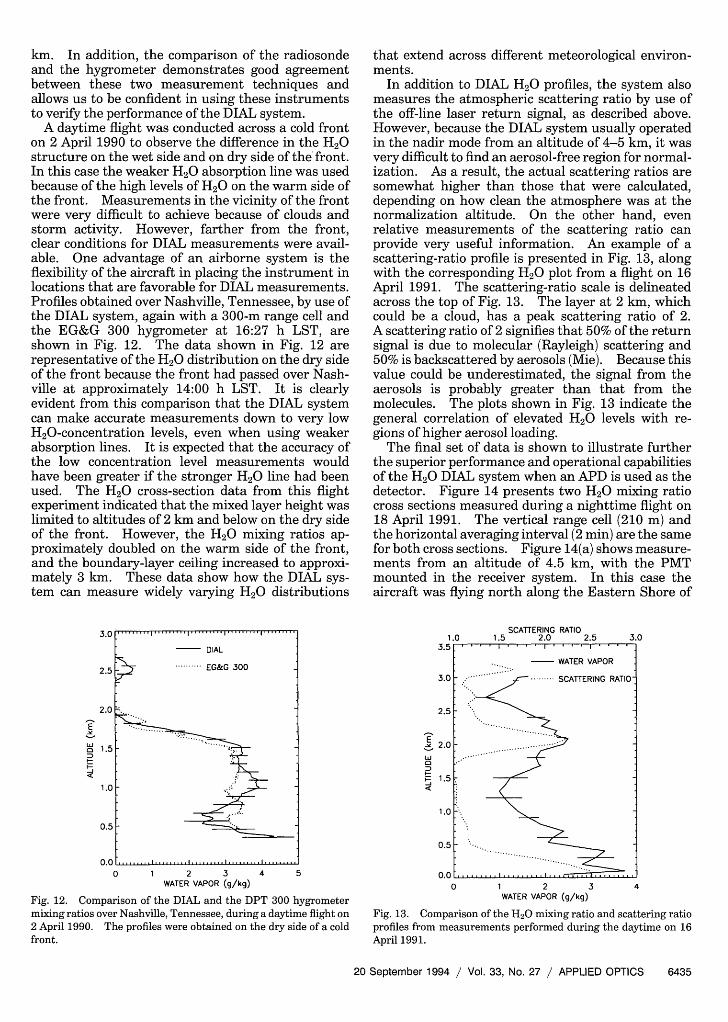
A daytime flight was conducted across a cold fronton 2 April 1990 to observe the difference in the H20structure on the wet side and on dry side of the front.In this case the weaker H20 absorption line was usedbecause of the high levels of H2O on the warm side ofthe front. Measurements in the vicinity of the frontwere very difficult to achieve because of clouds andstorm activity. However, farther from the front,clear conditions for DIAL measurements were avail-able. One advantage of an airborne system is theflexibility of the aircraft in placing the instrument inlocations that are favorable for DIAL measurements.Profiles obtained over Nashville, Tennessee, by use ofthe DIAL system, again with a 300-m range cell andthe EG&G 300 hygrometer at 16:27 h LST, areshown in Fig. 12. The data shown in Fig. 12 arerepresentative of the H2O distribution on the dry sideof the front because the front had passed over Nash-ville at approximately 14:00 h LST. It is clearlyevident from this comparison that the DIAL systemcan make accurate measurements down to very lowH20-concentration levels, even when using weakerabsorption lines. It is expected that the accuracy ofthe low concentration level measurements wouldhave been greater if the stronger H20 line had beenused. The H20 cross-section data from this flightexperiment indicated that the mixed layer height waslimited to altitudes of 2 km and below on the dry sideof the front. However, the H20 mixing ratios ap-proximately doubled on the warm side of the front,and the boundary-layer ceiling increased to approxi-mately 3 km. These data show how the DIAL sys-tem can measure widely varying H20 distributions
3.0 . . . ..
DIAL
2.5 ....... EG&G 300
2. 0
B 1.5
1.0
0.5
0.0 .,, .........0 1 2 3 4 5
WATER VAPOR (g/kg)
Fig. 12. Comparison of the DIAL and the DPT 300 hygrometermixing ratios over Nashville, Tennessee, during a daytime flight on2 April 1990. The profiles were obtained on the dry side of a coldfront.
that extend across different meteorological environ-ments.
In addition to DIAL H 20 profiles, the system alsomeasures the atmospheric scattering ratio by use ofthe off-line laser return signal, as described above.However, because the DIAL system usually operatedin the nadir mode from an altitude of 4-5 km, it wasvery difficult to find an aerosol-free region for normal-ization. As a result, the actual scattering ratios aresomewhat higher than those that were calculated,depending on how clean the atmosphere was at thenormalization altitude. On the other hand, evenrelative measurements of the scattering ratio canprovide very useful information. An example of ascattering-ratio profile is presented in Fig. 13, alongwith the corresponding H20 plot from a flight on 16April 1991. The scattering-ratio scale is delineatedacross the top of Fig. 13. The layer at 2 km, whichcould be a cloud, has a peak scattering ratio of 2.A scattering ratio of 2 signifies that 50% of the returnsignal is due to molecular (Rayleigh) scattering and50% is backscattered by aerosols (Mie). Because thisvalue could be underestimated, the signal from theaerosols is probably greater than that from themolecules. The plots shown in Fig. 13 indicate thegeneral correlation of elevated H20 levels with re-gions of higher aerosol loading.
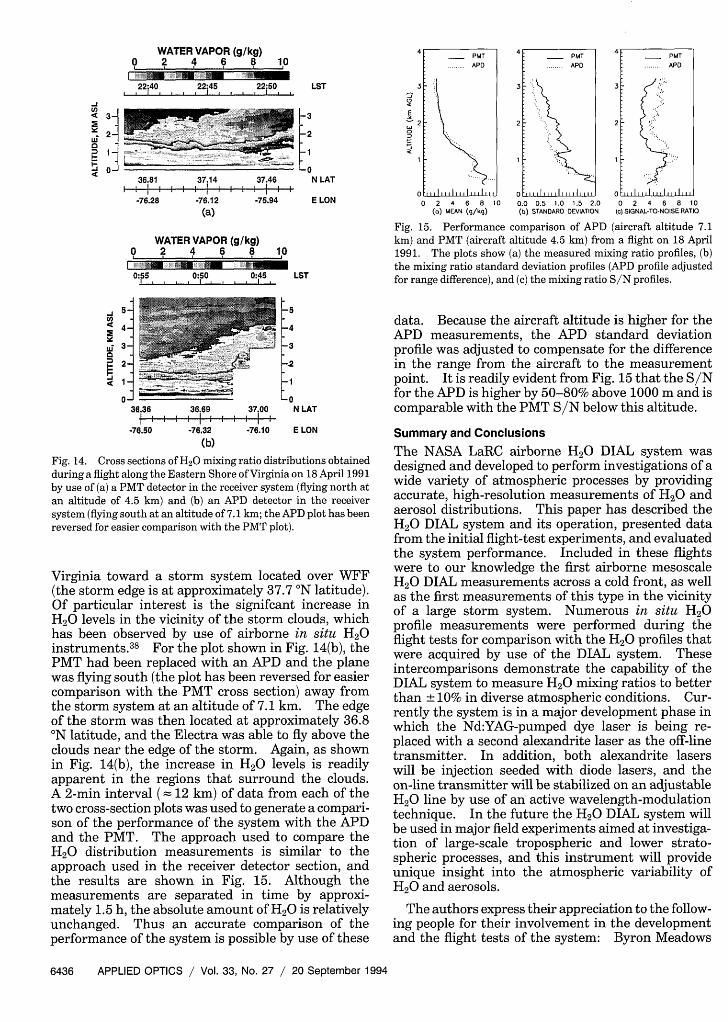
The final set of data is shown to illustrate furtherthe superior performance and operational capabilitiesof the H20 DIAL system when an APD is used as thedetector. Figure 14 presents two H20 mixing ratiocross sections measured during a nighttime flight on18 April 1991. The vertical range cell (210 m) andthe horizontal averaging interval (2 min) are the samefor both cross sections. Figure 14(a) shows measure-ments from an altitude of 4.5 km, with the PMTmounted in the receiver system. In this case theaircraft was flying north along the Eastern Shore of
1.03.51I
I0~
SCATTERING RATIO1.5 2.0 2.5 3.0
0 1 2 3 4WATER VAPOR (g/kg)
Fig. 13. Comparison of the H20 mixing ratio and scattering ratioprofiles from measurements performed during the daytime on 16April 1991.
20 September 1994 / Vol. 33, No. 27 / APPLIED OPTICS 6435
I
-
WATER VAPOR (g/kg)0 2 4 6 8 10
22:40 22-45 22:50 LST
- -
Li 2 ~ - -2o
I
0
36.81 37.14 37.46 N LAT
-76.28 -76.12 -75.94 E LON
(a)
WATER VAPOR (g/kg)0 2 4 6 8 10
0:55 0:50 0:45 LSTI . .. I ... I-
--
6 -
0
36.36 36.69 37.00l I I I I I
3-5-4
l-3
-1
0oN LAT
-76.50 -76.32 -76.10 E LON
(b)
Fig. 14. Cross sections of H20 mixing ratio distributions obtainedduring a flight along the Eastern Shore of Virginia on 18 April 1991by use of (a) a PMT detector in the receiver system (flying north atan altitude of 4.5 km) and (b) an APD detector in the receiversystem (flying south at an altitude of 7.1 km; the APD plot has beenreversed for easier comparison with the PMT plot).
Virginia toward a storm system located over WFF(the storm edge is at approximately 37.7 0N latitude).Of particular interest is the signifcant increase inH20 levels in the vicinity of the storm clouds, whichhas been observed by use of airborne in situ H2 0instruments.3 8 For the plot shown in Fig. 14(b), thePMT had been replaced with an APD and the planewas flying south (the plot has been reversed for easiercomparison with the PMT cross section) away fromthe storm system at an altitude of 7.1 km. The edgeof the storm was then located at approximately 36.8ON latitude, and the Electra was able to fly above theclouds near the edge of the storm. Again, as shownin Fig. 14(b), the increase in H20 levels is readilyapparent in the regions that surround the clouds.A 2-min interval (= 12 km) of data from each of thetwo cross-section plots was used to generate a compari-son of the performance of the system with the APDand the PMT. The approach used to compare theH20 distribution measurements is similar to theapproach used in the receiver detector section, andthe results are shown in Fig. 15. Although themeasurements are separated in time by approxi-mately 1.5 h, the absolute amount of H2 0 is relativelyunchanged. Thus an accurate comparison of theperformance of the system is possible by use of these
4 44- PMT - PMT PMT
.APD AP API
3 3 3
2 2
0 . .0 0'I. . I .Ij J J0 2 4 6 8 10 0.0 0.5 1.0 1.5 2.0 0 2 4 6 8 10
(o) MEAN (g/kg) (b) STANDARD DEVIATION (c) SIGNAL-TO-NOISE RATIO
Fig. 15. Performance comparison of APD (aircraft altitude 7.1km) and PMT (aircraft altitude 4.5 km) from a flight on 18 April1991. The plots show (a) the measured mixing ratio profiles, (b)the mixing ratio standard deviation profiles (APD profile adjustedfor range difference), and (c) the mixing ratio S/N profiles.
data. Because the aircraft altitude is higher for theAPD measurements, the APD standard deviationprofile was adjusted to compensate for the differencein the range from the aircraft to the measurementpoint. It is readily evident from Fig. 15 that the S/Nfor the APD is higher by 50-80% above 1000 m and iscomparable with the PMT S/N below this altitude.
Summary and ConclusionsThe NASA LaRC airborne H20 DIAL system wasdesigned and developed to perform investigations of awide variety of atmospheric processes by providingaccurate, high-resolution measurements of H20 andaerosol distributions. This paper has described theH20 DIAL system and its operation, presented datafrom the initial flight-test experiments, and evaluatedthe system performance. Included in these flightswere to our knowledge the first airborne mesoscaleH20 DIAL measurements across a cold front, as wellas the first measurements of this type in the vicinityof a large storm system. Numerous in situ H20profile measurements were performed during theflight tests for comparison with the H20 profiles thatwere acquired by use of the DIAL system. Theseintercomparisons demonstrate the capability of theDIAL system to measure H20 mixing ratios to betterthan ± 10% in diverse atmospheric conditions. Cur-rently the system is in a major development phase inwhich the Nd:YAG-pumped dye laser is being re-placed with a second alexandrite laser as the off-linetransmitter. In addition, both alexandrite laserswill be injection seeded with diode lasers, and theon-line transmitter will be stabilized on an adjustableH20 line by use of an active wavelength-modulationtechnique. In the future the H 20 DIAL system willbe used in major field experiments aimed at investiga-tion of large-scale tropospheric and lower strato-spheric processes, and this instrument will provideunique insight into the atmospheric variability ofH2 0 and aerosols.
The authors express their appreciation to the follow-ing people for their involvement in the developmentand the flight tests of the system: Byron Meadows
6436 APPLIED OPTICS / Vol. 33, No. 27 / 20 September 1994

for his knowledgeable and dedicated technical assis-tance; Mark Jones, Bill McCabe, and Jerry Williamsfor their skilled technical support; John Barrick forhis assistance in installing and operating the dew-point hygrometers, as well as his helpful commentson interpreting their results; Marta Fenn, SusanKooi, and Greg Nowicki for the DIAL data reductionand analysis; Roger Navarro, Dave Pierce, DougYoung, and the aircraft crew for their cooperation inconducting the flights; Riley Bull and his staff forproviding the radiosonde data at WFF; and CarlPurgold and Bob Wheeler for assisting with the LaRCradiosondes. Special thanks to Joy Duke and San-dra Keyes for their patience in preparing this manu-script. This research was funded by NASA's Atmo-spheric Dynamics Program.
References1. R. M. Schotland, "Some observations of the vertical profile of
water vapor by means of a ground based optical radar,"presented at the Fourth Symposium on Remote Sensing of theEnvironment, Ann Arbor, Mich., 12-14 April 1966.
2. S. H. Melfi, J. D. Lawrence, Jr., and M. P. McCormick,"Observation of Raman scattering by water vapor in theatmosphere," Appl. Phys. Lett. 15, 295-297 (1969).
3. J. A. Cooney, "Remote measurements of atmospheric watervapor profiles using the Raman component of laser backscat-ter," J. Appl. Meteorol. 9, 182-184 (1970).
4. E. V. Browell, J. D. Wilkerson, and T. J. McIlrath, "Watervapor differential absorption lidar development and evalua-tion," Appl. Opt. 18, 3474-3483 (1979).
5. W. B. Grant, "Differential absorption and Raman lidar forwater vapor profile measurements: a review," Opt. Eng. 30,40-48 (1991).
6. C. Cahen, J. L. Lesne, P. Deschamps, and P. Y. Thro, "Testingthe mobile meteorological DIAL system for humidity andtemperature monitoring," presented at the Fourteenth Inter-national Laser Radar Conference, San Candido, Italy, 24-26June 1988.
7. S. H. Melfi, D. Whiteman, and R. Ferrare, "Observations ofatmospheric fronts using Raman lidar moisture measure-ments," J. Appl. Meteorol. 28, 789-806 (1989).
8. J. Boesenberg, "A DIAL system for high resolution watervapor measurements in the troposphere," in Laser and Opti-cal Remote Sensing Instrumentation and Techniques, vol.18 of 1987 OSA Technical Digest Series (Optical Society ofAmerica, Washington, D.C., 1987), pp. 22-25.
9. N. S. Higdon, E. V. Browell, P. Ponsardin, T. H. Chyba, B. E.Grossmann, C. F. Butler, M. A. Fenn, S. D. Mayor, S. Ismail,and W. B. Grant, "Airborne water vapor DIAL research:system development and field measurements," presented atthe Sixteenth International Laser Radar Conference, Boston,Mass., 20-25 July 1992.
10. G. Ehret, C. Kiemle, W. Renger, and G. Simmet, "Airborneremote sensing of tropospheric water vapor with a near-infrared differential absorption lidar system," Appl. Opt. 32,4534-4551 (1993).
11. R. T. H. Collis and P. B. Russell, "Lidar measurement ofparticles and gases by elastic backscattering and differentialabsorption," in Laser Monitoring of the Atmosphere, E. D.Hinkley, ed. (Springer-Verlag, New York, 1976), pp. 117-151.
12. R. M. Measures, Laser Remote Sensing: Fundamentals andApplications (Wiley, New York, 1984).
13. R. M. Schotland, "Errors in the lidar measurement of atmo-spheric gases by differential absorption," J. Appl. Meteorol.13, 71-77 (1974).
14. E. E. Remsberg and L. L. Gordley, "Analysis of differentialabsorption lidar from the Space Shuttle," Appl. Opt. 17,624-630 (1978).
15. C. Cahen and G. Megie, "A spectral limitation of the rangeresolved differential absorption lidar technique," J. Quant.Spectrosc. Radiat. Transfer 25, 151-157 (1981).
16. S. Ismail and E. V. Browell, "Airborne and spaceborne lidarmeasurements of water vapor profiles: a sensitivity analy-sis," Appl. Opt. 28,3603-3615 (1989).
17. B. E. Grossmann and E. V. Browell, "Water vapor linebroadening and shifting by air, nitrogen, oxygen, and argon inthe 720-nm wavelength region," J. Mol. Spectrosc. 138,562-595 (1989).
18. B. E. Grossmann and E. V. Browell, "Spectroscopy of watervapor in the 720-nm wavelength region: line strengths,self-induced pressure broadenings and shifts, and temperaturedependence of linewidths and shifts," J. Mol. Spectrosc. 136,264-294 (1989).
19. E. V. Browell, A. F. Carter, and T. D. Wilkerson, "An airbornedifferential absorption lidar system for water vapor investiga-tions," Opt. Eng. 20, 84-90 (1981).
20. E. V. Browell, "Remote sensing of tropospheric gases andaerosols with an airbornb DIAL system," in Optical LaserRemote Sensing, D. K. Killinger and A. Mooradian, eds.(Springer-Verlag, New York, 1983), pp. 138-147.
21. P. Ponsardin, N. S. Higdon, B. E. Grossmann, and E. V.Browell, "Optimization of the alexandrite laser tuning ele-ments for a water vapor lidar," in Laser Radar V, R. J.Becherer, ed., Proc. Soc. Photo-Opt. Instrum. Eng. 1222,178-182 (1990).
22. P. Ponsardin, N. S. Higdon, B. E. Grossmann, and E. V.Browell, "Stabilization and spectral characterization of analexandrite laser for water vapor lidar measurements," inAdvanced Solid-State Lasers, vol. 10 of OSA Proceedings(Optical Society of America, Washington, D.C., 1991), pp.76-78.
23. P. Ponsardin, N. S. Higdon, B. E. Grossmann, and E. V.Browell, "Spectral control of an alexandrite laser for anairborne water vapor DIAL system," Appl. Opt. 33,6433-6444(1994).
24. E. V. Browell, A. F. Carter, S. T. Shipley, R. J. Allen, C. F.Butler, M. N. Mayo, J. H. Siviter, Jr., and W. M. Hall, "NASAmultipurpose airborne DIAL system and measurements ofozone and aerosol profiles," Appl. Opt. 22, 522-534 (1983).
25. F. Bos, "Versatile high-power single-longitudinal-mode pulseddye laser," Appl. Opt. 20, 1886-1890 (1981).
26. "American National Standard for the Safe Use of Lasers,"ANSI Z136.1-1986 (American National Standards Institute,New York, 1986).
27. S. Ismail and E. V. Browell, "Influence of rotational Ramanscattering in DIAL measurements," presented at the Four-teenth International Laser Radar Conference, San Candido,Italy, 24-26 June 1988.
28. R. L. Kenimer, "Predictions of silicon avalanche photodiodeperformance in water vapor differential absorption lidar, inAirborne and Spaceborne Lasers for Terrestrial GeophysicalSensing, F. Allario, ed., Proc. Soc. Photo-Opt. Instrum. Eng.889, 126-135 (1988).
29. S. Ismail and E. V. Browell, "Recent technology developmentsand their influence on measurements of tropospheric watervapor," J. Atmos. Oceanic Technol. in press
30. S. Ismail, E. V. Browell, W. M. Hall, and R. L. Kenimer,"Signal processing and data smoothing influences in DIALmeasurements," in Optical Remote Sensing of the Atmo-sphere, vol. 4 of OSA Proceedings (Optical Society of America,Washington, D.C., 1990), pp. 243-246.
31. C. F. Butler, "Theory and operation of the real-time dataacquisition system for the NASA LaRC differential absorption
20 September 1994 / Vol. 33, No. 27 / APPLIED OPTICS 6437
lidar (DIAL)," Tech. Rep. GSTR-88-1 (Old Dominion Univer-sity, Norfolk, Va., 1988).
32. N. S. Higdon, E. V. Browell, P. Ponsardin, and B. E. Gross-mann, "Airborne water vapor DIAL system development," inLaser Radar V, R. J. Becherer, ed., Proc. Soc. Photo-Opt.Instrum. Eng. 1222, 183-185 (1990).
33. E. V. Browell, N. S. Higdon, C. F. Butler, M. A. Fenn, B. E.Grossmann, P. Ponsardin, W. B. Grant, and A. S. Bachmeier,"Tropospheric water vapor measurements with an airbornelidar system," presented at the Seventh American Meteorologi-cal Society Symposium on Meteorological Observations andInstrumentation, New Orleans, La, 14-18 January 1991.
34. F. Routhier and D. D. Davis, "Free tropospheric/boundary-layer airborne measurements of H20 over the latitude range of58 S to 70 N: comparison with simultaneous ozone and
carbon monoxide measurements," J. Geophys. Res. 85, 7293-7306 (1980).
35. S. H. Melfi, D. Whiteman, R. Ferrare, and F. Schmidlin,"Comparison of lidar and radiosonde measurements of atmo-spheric moisture profiles," in Optical Remote Sensing of theAtmosphere, vol. 4 of OSA Proceedings (Optical Society ofAmerica, Washington, D.C., 1990), pp. 232-234.
36. E. V. Browell, S. Ismail, and B. E. Grossmann, "Temperaturesensitivity of differential absorption lidar measurements ofwater vapor in the 720-nm region," Appl. Opt. 30, 1517-1524(1991).
37. S. R. Drayson, "Rapid computation of the Voigt profile," J.Quant. Spectrosc. Radiat. Transfer 16, 611-614 (1976).
38. L. F. Radke and P. V. Hobbs, "Humidity and particle fieldsaround some small cumulus clouds," J. Atmos. Sci. 48,1190-1193 (1990).
6438 APPLIED OPTICS / Vol. 33, No. 27 / 20 September 1994