AgroLife Scientific Journal - USAMV
238
AgroLife Scientific Journal Volume 6, No. 2, 2017
-
Upload
khangminh22 -
Category
Documents
-
view
2 -
download
0
Transcript of AgroLife Scientific Journal - USAMV

AgroLifeScientific Journal
Volume 6, No. 2, 2017

University of Agronomic Sciencesand Veterinary Medicine of Bucharest
BucharesTDecember, 2017
AgroLifeScientific Journal
Volume 6, No. 2

EDITORIAL TEAM
General Editor: Prof. PhD Sorin Mihai CÎMPEANU Executive Editor: Prof. PhD Gina FÎNTÎNERU
Deputy Executive Editor: Prof. PhD Doru Ioan MARIN
Members: Adrian ASĂNICĂ, Lenuța Iuliana EPURE, Leonard ILIE, Viorel ION, Sorin IONIȚESCU, Ștefana JURCOANE, Monica Paula MARIN, Aneta POP, Răzvan TEODORESCU, Elena TOMA, Ana VÎRSTA
Linguistic editor: Elena NISTOR
Secretariate: Roxana FRANZUTTI
PUBLISHERS:
University of Agronomic Sciences and Veterinary Medicine of Bucharest Address: 59 Mărăşti Blvd., District 1, Postal Code 011464, Bucharest, Romania
E-mail: [email protected]; Webpage: http://agrolifejournal.usamv.ro
CERES Publishing House Address: 1 Piaţa Presei Libere, District 1, Zip code 013701, Bucharest, Romania
Phone: +40 21 317 90 23 E-mail: [email protected]; Webpage:www.editura-ceres.ro
Copyright 2017 To be cited: AgroLife Sci. J. - Vol. 6, No. 2, 2017
The mission of the AgroLife Scientific Journal is to publish original research relevant to all those involved in different fields of agronomy and life sciences. The publishers are not responsible for the opinions published in the Volume.
They represent the authors’ point of view.
ISSN 2285-5718; ISSN - L 2285-5718

5
EDITORIAL BOARD Bekir Erol AK - University of Harran, Sanliurfa, Turkey Ioan Niculae ALECU - University of Agronomic Sciences and Veterinary Medicine of Bucharest, Romania Adrian ASĂNICĂ - University of Agronomic Sciences and Veterinary Medicine of Bucharest, Romania Sarah BAILLIE - Bristol Veterinary School, University of Bristol, United Kingdom Narcisa Elena BĂBEANU - University of Agronomic Sciences and Veterinary Medicine of Bucharest, Romania Silviu BECIU - University of Agronomic Sciences and Veterinary Medicine of Bucharest, Romania Diego BEGALLI - University of Verona, Italy Laurenţiu-George BENGA - Central Unit for Animal Research and Welfare Affairs at the University Hospital,
Heinrich Heine University Dusseldorf, Germany Stefano CASADEI - University of Perugia, Italy Fulvio CELICO - University of Molise, Italy Gheorghe CIMPOIEŞ - Agrarian State University, Moldova Sorin Mihai CÎMPEANU - University of Agronomic Sciences and Veterinary Medicine of Bucharest, Romania Drago CVIJANOVIC - Institute of Agricultural Economics, Belgrade, Serbia Eric DUCLOS-GENDREU - Spot Image, GEO-Information Services, France André FALISSE - University of Liège, Gembloux Agro-Bio Tech, Gembloux, Belgium Gina FÎNTÎNERU - University of Agronomic Sciences and Veterinary Medicine of Bucharest, Romania Luca Corelli GRAPPADELLI - University of Bologna, Italy Horia GROSU - University of Agronomic Sciences and Veterinary Medicine of Bucharest, Romania Armagan HAYIRLI - Ataturk University, Erzurum, Turkey Jean-Luc HORNICK - Faculté de Médecine Vétérinaire, Université de Liège, Belgium Dorel HOZA - University of Agronomic Sciences and Veterinary Medicine of Bucharest, Romania Mostafa A.R. IBRAHIM - University of Kafrelsheikh, Egypt Viorel ION - University of Agronomic Sciences and Veterinary Medicine of Bucharest, Romania Mariana IONIŢĂ - University of Agronomic Sciences and Veterinary Medicine of Bucharest, Romania Horst Erich KÖNIG - Institute of Anatomy, Histology and Embriology, University of Veterinary Medicine
Vienna, Austria Francois LAURENS - French National Institute for Agricultural Research, France Huub LELIEVELD - GHI Association Netherlands and EFFoST Executive Committee, Netherlands Doru Ioan MARIN - University of Agronomic Sciences and Veterinary Medicine of Bucharest, Romania Monica Paula MARIN - University of Agronomic Sciences and Veterinary Medicine of Bucharest, Romania Mircea MIHALACHE - University of Agronomic Sciences and Veterinary Medicine of Bucharest, Romania Françoise PICARD-BONNAUD - University of Angers, France Aneta POP - University of Agronomic Sciences and Veterinary Medicine of Bucharest, Romania Mona POPA - University of Agronomic Sciences and Veterinary Medicine of Bucharest, Romania Agatha POPESCU - University of Agronomic Sciences and Veterinary Medicine of Bucharest, Romania Sri Bandiati Komar PRAJOGA - Padjadjaran University Bandung, Indonesia Narayanan RANGESAN - University of Nevada, Reno, USA Svend RASMUSSEN - University of Copenhagen, Denmark Peter RASPOR - Faculty of Biotechnology, University of Ljubljana, Slovenia Marco Dalla ROSA - Faculty of Food Technology, Università di Bologna, Polo di Cesena, Italy Sam SAGUY - The Hebrew University of Jerusalem, Israel Philippe SIMONEAU - Université d’Angers, France Vasilica STAN - University of Agronomic Sciences and Veterinary Medicine of Bucharest, Romania Alvaro STANDARDI - University of Perugia, Italy Florin STĂNICĂ - University of Agronomic Sciences and Veterinary Medicine of Bucharest, Romania Răzvan TEODORESCU - University of Agronomic Sciences and Veterinary Medicine of Bucharest, Romania André THEWIS - University of Liège, Gembloux Agro-Bio Tech, Gembloux, Belgium Ana VÎRSTA - University of Agronomic Sciences and Veterinary Medicine of Bucharest, Romania David C. WEINDORF - Texas Tech University, USA


7
CONTENTS
The effect of granting fermented milk, fermented soy milk, and the combination against creatinine and blood glucose levels on broiler - Lovita ADRIANI, Pandu NUGRAHA, Monica MARIN ………………………………………………………………………………………………… 9
Determination of the salt tolerance characteristics of some bread wheat cultivars - Aydın ALP, Sadettin ÇELİK, Döne PARLAK ……………………………………………………………………. 16
The effect of different fibre and starch dietary levels on haematology of post-weaning rabbits - Rosalie BĂLĂCEANU, Liliana STOICA, Marian GHIŢĂ, Laurenț OGNEAN, Ionuţ NEGOIŢĂ, Nicolae DOJANĂ ……………………………………………………………………………………. 22
Greenhouse gas emissions from sunflower cultivation for biofuels and biodiesel production - Irina CALCIU, Olga VIZITIU, Cătălin SIMOTA …………………………………………………………. 27
Research regarding the sustainable development of agritourism in the neighbouring area of Cozia National Park, Romania - Aurel CĂLINA, Jenica CĂLINA, Ion STAN ……………………. 35
Retracted article: Study regarding the influence of fertilization on some physiological indexand biochemical composition of peppermint oils (Mentha piperita L.) - Dorin CAMEN, CarmenDRAGOMIR, Cosmin POPESCU, Tiberiu IANCU, Sorin STANCIU, Roxana LUCA, NicoletaHĂDĂRUGĂ, Mihaela MOATĂR, Eleonora NISTOR, Florin SALA ................................................. 43The antioxidant properties of Gentiana lutea root cultures - Rodica CATANĂ, Irina HOLOBIUC, Monica MITOI ………………………………………………………………………………..…………. 51
Hydraulic models for the infiltrations through a guard levee dyke during a high flood - Esmeralda CHIORESCU, Dan CHIORESCU, Feodor FILIPOV ……………………………………….. 58
Clinical and ultrasound features in dysuric dogs - Mario CODREANU, Alexandra Mihaela POPA, Iuliana CODREANU, Raluca NAE ………………………………………………………………….. 67
The influence of simulated acidic rain on plants volatile organic compounds emission and photosynthetic parameters - Lucian COPOLOVICI, Adelina BAN, Ioana FAUR, Dana COPOLOVICI ………………………………………………………………………………………… 73
Influence of some climatic factors upon powdery mildew attack in oak forests located in Transylvania - Ilie COVRIG, Camelia OROIAN, Petru BURDUHOS, Ioan OROIAN, Antonia ODAGIU ……………………………………………………………………………………………… 77
The influence of Rhizobium inoculation and nitrogen/molybdenum fertilization on the growth characteristics of red clover – Niculae DINCĂ, Daniel DUNEA ……………………..………….. 83
Yield components and grain yield at maize under drought and different crop technology conditions - Marin DUMBRAVĂ, Viorel ION, Adrian Gheorghe BĂȘA, Lenuţa Iuliana EPURE …. 89
Analysis of potential risks in feed production as an integral part of food chain - Olivera ĐURAGIĆ, Ivana ČABARKAPA, Radmilo ČOLOVIĆ ............................. ................................... 97
The effect of nitrogenous fertilizer value and its splitting during the growth period on morphological traits and essence rate of Maticaria chamomilla L. - Mehdi GHASEM BAGLOU, Firouz NAMI, Saeid KHOMARI, Mohammad SEDGHI ……………………………………………… 103
Review on dietary tocopherol accumulation on pork tissues and its membrane antioxidant role against lipid oxidation - Mihaela GHIDURUȘ, Leonard ILIE, Mioara VARGA, Mircea MIHALACHE …………………………………………………………………………………………. 112
8
THE EFFECT OF GRANTING FERMENTED MILK, FERMENTED SOY MILK, AND THE COMBINATION AGAINST CREATININE AND BLOOD
GLUCOSE LEVELS ON BROILER
Lovita ADRIANI1, Pandu NUGRAHA1, Monica MARIN2
1Padjadjaran University, Faculty of Animal Husbandry, Indonesia
2University of Agronomic Sciences and Veterinary Medicine of Bucharest, 59 Marasti Blvd., District 1, Bucharest, Romania
Corresponding author email: [email protected]
Abstract The research has been conducted from January 30 to March 7, 2017. The purpose of this research is to know the influence of addition of fermented milk, fermented soy milk, and the combination, as well as the influential composition to creatinine and blood glucose levels on broiler. The method used is experimental, with a complete random design. There are seven treatments, T1 = without treatment, T2 = milk granted, T3 = fermented milk granted, T4 = fermented soy milk granted, T5 = fermented milk and fermented soy milk granted with ratio 1:1, T6 = fermented milk granted LA + B 1.25%, T7 = fermented milk granted LA + B, 2% dose with four times repetition. Each unit has five farm animals, so the total is 140 broiler chicken, 1-35 days old. Based on the statistic analysis calculation, the effect of granting fermented milk, fermented soy milk, and the combination has a significant effect (P<0.05) to decrease creatinine levels and does not have a significant effect (P>0.05) to decrease blood glucose levels in broiler. The conclusion is by granting fermented milk combined with fermented soy milk with ratio 1:1 can decrease creatinine levels, but does not decrease blood glucose levels in broiler. Key words: broiler, creatinine, blood glucose, fermented milk, fermented soy milk. INTRODUCTION The research is focused on the role of probiotic, including Lactic Acid Bacteria (LAB) in the yoghurt for the enhancement of the gastrointestinal function through the kidney improvement, lactose intolerance (lactase deficiency) reduction, and Lactobacillus acidophilus and Bifidobacteria consumption (Vesa et al., 2000). LAB enables the inhibition of the pathogenic infection through acetic acid, lactic acid, and bacteriocins production (Bianchi-Slvadori, 1986), as well as stabilizing the intestinal microflora after long-term antibiotic usage (Brown et al., 2005). Suppression of the harmful carcinogens is associated with colon cancer (Tavan et al., 2002; Wollowski et al., 1999) and increasing the immune response by producing secretory immunoglobulin (Perdigon, 1995, 2003). This research aims to improve lipid profile and the health of farm animals, one of them is by increasing the probiotic. Beside that, it also
aims to see if probiotic can improve kidney function through creatinine levels. Probiotic function is to press pathogenic bacteria population, to supply the enzyme to help digesting food ingredients, to detox adverse food components and take it out from the digestive track, and to stimulate the intestinal peristaltic activity. Some microbacterias in probiotic can produce compounds that can inhibit fat synthesis, mobilize or reduce it to increase farm animals’ health. Creatinine is mass muscle production that comes from fosfoceratine. Generally, creatinine is produced in the body in the fixed amount and released into the blood. An increase in creatinine levels can be used as an indicator of kidney function disorder and the low ability of glomerulus filtration. On the other hand, blood glucose derived from the absorption of food digestion and the release of glucose from glycogen cell supplies. This research use fermented milk, using probiotic bacteria such as Lactobacillus bulgaricus, Lactobacillus, and Bifidobacterium. The advantages of probiotic is
Research regarding the influence of tuber size and protection systems on the early potato production - Gheorghița HOZA, Maria DINU, Alexandra Dida BECHERESCU, Mariana NEAGU … 120
The influence of the chemical composition of maize, barley and peas hybrids on the digestibility of compound feed for pigs - Monica MARIN, Camelia HODOȘAN, Georgeta DINIȚĂ, Carmen Georgeta NICOLAE …………………………………………………………………………………. 127
Earth observation satellite data in support of water management for agriculture - Iulia Dana NEGULA, Alexandru BADEA, Cristian MOISE, Violeta POENARU …………………….………. 133
Testing the influence of the environmentally friendly phytohormone GIBB A3, upon maize macro- and microelemental content - Camelia OROIAN, Antonia ODAGIU, Iulia MUREȘAN, Andra PORUȚIU, Cristian MĂLINAȘ ……………………………………………………………….. 137
Lactic acid bacteria as metal quenchers to improve food safety and quality - Ami PATEL, Aparna SV, Nihir SHAH, Deepak Kumar VERMA ……………………………………………………………. 146
The prevalence of hematuria in dogs and cats - Alexandra Mihaela POPA, Valentina SIMION, Iuliana CODREANU, Cristina FERNOAGĂ, Mihai CORNILĂ, Mario CODREANU …………….. 155
Levels of persistent organochlorine compounds in sewage sludge from wastewater treatment plants - Mihaela PREDA, Veronica TĂNASE, Nicoleta Olimpia VRÎNCEANU ………………….. 161
Nanovesicles from plants as edible carriers of bioactive compounds - Krizia SAGINI, Lorena URBANELLI, Sandra BURATTA, Leonardo LEONARDI, Carla EMILIANI ................................ 167
Impact of advisory and consultancy work over the project-based development choices of a rural territory - Cosmin SĂLĂȘAN, Sebastian MOISA, Isidora RADULOV …………………………… 172
The influence of anthropic activity on Șomes River water quality - Laura ȘMULEAC, Florin IMBREA, Ioana CORODAN, Anișoara IENCIU, Adrian ȘMULEAC, Dan MANEA ……………….. 178
Chemical diversity of polyphenols from bee pollen and propolis - Roxana SPULBER, Teodora COLȚA, Narcisa BĂBEANU, Ovidiu POPA ................................................................................... 183
Residual effects of fertilization with sewage sludge compost on cropland - Veronica TĂNASE, Nicoleta VRÎNCEANU, Mihaela PREDA, Dumitru Marian MOTELICĂ ………………………….. 195
Antioxidant activities and chemical compositon of different extracts of mosses gathered from Turkey - Ozlem TONGUC YAYINTAS, Ozlem SOGUT, Sibel KONYALIOGLU, Selehattin YILMAZ, Burcu TEPELİ …………………………………………………………………………..….. 205
Impact of kaolin particle film on light extinction coefficient and radiation use efficiency of pistachio (Pistachia vera) - Safieh VATANDOOST, Gholamhossein DAVARYNEJAD, Ali TEHRANIFAR ………………………………………………………………………………………… 214
Soil friability assessment of some agricultural soils in Romania - Olga VIZITIU, Irina CALCIU, Cătălin SIMOTA ……………………………………………………………………………………….. 219
Influence of bentonite, dolomite, natural zeolite and manure on heavy metal immobilization in a contaminated soil - Nicoleta Olimpia VRÎNCEANU, Dumitru Marian MOTELICĂ, Ilie CALCIU, Veronica TĂNASE, Mihaela PREDA, Georgiana PLOPEANU, Iuliana IVANA …………………..…. 227
Epidemiological profile of rabiesin Prahova County, Romania 2010-2015 – Vlad VUTA, Gheorghe BARBOI, Florica BARBUCEANU, Constantin LUPESCU, Gabriel PREDOI, Viorel SURLARU, Constantin VLAGIOIU ………………………………………………………….... 235

9
THE EFFECT OF GRANTING FERMENTED MILK, FERMENTED SOY MILK, AND THE COMBINATION AGAINST CREATININE AND BLOOD
GLUCOSE LEVELS ON BROILER
Lovita ADRIANI1, Pandu NUGRAHA1, Monica MARIN2
1Padjadjaran University, Faculty of Animal Husbandry, Indonesia
2University of Agronomic Sciences and Veterinary Medicine of Bucharest, 59 Marasti Blvd., District 1, Bucharest, Romania
Corresponding author email: [email protected]
Abstract The research has been conducted from January 30 to March 7, 2017. The purpose of this research is to know the influence of addition of fermented milk, fermented soy milk, and the combination, as well as the influential composition to creatinine and blood glucose levels on broiler. The method used is experimental, with a complete random design. There are seven treatments, T1 = without treatment, T2 = milk granted, T3 = fermented milk granted, T4 = fermented soy milk granted, T5 = fermented milk and fermented soy milk granted with ratio 1:1, T6 = fermented milk granted LA + B 1.25%, T7 = fermented milk granted LA + B, 2% dose with four times repetition. Each unit has five farm animals, so the total is 140 broiler chicken, 1-35 days old. Based on the statistic analysis calculation, the effect of granting fermented milk, fermented soy milk, and the combination has a significant effect (P<0.05) to decrease creatinine levels and does not have a significant effect (P>0.05) to decrease blood glucose levels in broiler. The conclusion is by granting fermented milk combined with fermented soy milk with ratio 1:1 can decrease creatinine levels, but does not decrease blood glucose levels in broiler. Key words: broiler, creatinine, blood glucose, fermented milk, fermented soy milk. INTRODUCTION The research is focused on the role of probiotic, including Lactic Acid Bacteria (LAB) in the yoghurt for the enhancement of the gastrointestinal function through the kidney improvement, lactose intolerance (lactase deficiency) reduction, and Lactobacillus acidophilus and Bifidobacteria consumption (Vesa et al., 2000). LAB enables the inhibition of the pathogenic infection through acetic acid, lactic acid, and bacteriocins production (Bianchi-Slvadori, 1986), as well as stabilizing the intestinal microflora after long-term antibiotic usage (Brown et al., 2005). Suppression of the harmful carcinogens is associated with colon cancer (Tavan et al., 2002; Wollowski et al., 1999) and increasing the immune response by producing secretory immunoglobulin (Perdigon, 1995, 2003). This research aims to improve lipid profile and the health of farm animals, one of them is by increasing the probiotic. Beside that, it also
aims to see if probiotic can improve kidney function through creatinine levels. Probiotic function is to press pathogenic bacteria population, to supply the enzyme to help digesting food ingredients, to detox adverse food components and take it out from the digestive track, and to stimulate the intestinal peristaltic activity. Some microbacterias in probiotic can produce compounds that can inhibit fat synthesis, mobilize or reduce it to increase farm animals’ health. Creatinine is mass muscle production that comes from fosfoceratine. Generally, creatinine is produced in the body in the fixed amount and released into the blood. An increase in creatinine levels can be used as an indicator of kidney function disorder and the low ability of glomerulus filtration. On the other hand, blood glucose derived from the absorption of food digestion and the release of glucose from glycogen cell supplies. This research use fermented milk, using probiotic bacteria such as Lactobacillus bulgaricus, Lactobacillus, and Bifidobacterium. The advantages of probiotic is
AgroLife Scientific Journal - Volume 6, Number 2, 2017ISSN 2285-5718; ISSN CD-ROM 2285-5726; ISSN ONLINE 2286-0126; ISSN-L 2285-5718
10
to press pathogenic bacteria population, to supply the enzyme to help digesting food ingredients, to detox adverse food components and take it out from the digestive track, and to stimulate the intestinal peristaltic activity (Adriani, 2009). Creatinine is used to monitor kidney function in blood. An increase in creatinine levels can be caused by some conditions, such as heart failure, dehydration, pyelonefritis, and high urem levels in blood. Creatinine levels in blood can decrease where there is a reduction of the mass of muscle tissue. Creatinine serum is an important indicator of renal health because it is an easily measured by product of muscle metabolism that is excreted unchanged by the kidneys. Creatinine itself is produces through a biological system involving creatine, phosphocreatine, and adenosine triphosphate (ATP, the body’s immediate energy supply). Creatine is synthesized primarily in the liver from the methylation of glycocyamine by S-adenosyl methionine. It is then transported through blood to the other organs, muscle, and brain, where, through phosphorylation, it becomes the high-energy compound phosphocreatine. Creatine conversion to phosphocreatine is catalyzed by creatine kinase, a spontaneous formation of creatinine occurs during the reaction. High creatinine levels are rarely an independent problem. More often, this issue is a symptom of something more serious to decrease the levels permanently and improve human and animal vein. Kidney damage and chronic kidney disease are related to type II Diabetes, and also linked to high creatinine levels in human. Glomerulus is an indication of increasing blood glucose with metabolism changing on poultry. Blood glucose is sugar in blood, which formed from carbohydrate in food and stored as glucose in liver and skeletal muscle. Blood glucose will decrease if the rate absorption by metabolism or stored higher than additional rate. Glucose absorption by cells is stimulated by insulin, which secreted by ß cell from Langerhans Islands. Glucose is spreading from plasma to cells because the concentration of glucose in plasma is higher than in cells. The consumption of fermented soy milk is beneficial to the balance of the ecosystem in
the intestinal tract by increasing probiotic population and decreasing pathogenic bacteria population (Lengkey and Adriani, 2009). One of the component of soy milk that has lots on benefits is isoflavones, which is the intrumental in the improvement in decreasing creatinine and blood glucose. Other components cush as saponins and soy protein also have antioxidant effect. Fermented soy milk can decrease total cholesterol and the accumulation liver triglycerides on oxidative process. Generally, soy milk has vitamin B2, B1, niacin pyridoxine, and vitamin B, E, and K. Soy contains lots of Ca, F, but has less Fe. Soy also contains lots of nutrients, such as isoflavones, saponins, phytosterols, pitat acid, and felonic acid (Anderson and Wolf, 1995). Blood glucose profile is arranged to always be in stable condition in the body through homeostatic process, which involved other glucose resources such as glycogen, fat acid, and amino acid (Lovita et al., 2010). According to Piliang (1996), the constant blood glucose profile is maintained at all times. Homeostatic sugar in blood is reached through some mechanisms that set the speed of glucose conversion to glycogen or fat to be stored and released, then converted to glucose that enter blood circulatory system (Asril, 2002). Probiotic is needed to decrease creatinine and blood glucose levels. Based on the explanation, it is important to do research about giving probiotic that affected creatinine and blood glucose levels on broiler chicken. MATERIALS AND METHODS Farm animals observed in this research are 140 strain Cobb broiler chicken, from starter to finisher phase (1 – 35 days). The research use experimental method with Complete Random Design with seven treatments and four times repetition, so 28 experimental units are retrieved. Drinking water ad libitum is provided during experimental period and feed is given according to needs. It were taken random blood sample from 56 broiler chicken, two from each cage, which analyzed at Physiology and Biochemistry Laboratory, Faculty of Animal Husbandry, Padjadjaran University. The parameter measured is creatinine and blood glucose
levels. The analysis of creatinine levels is measured with kolorimetric method, and the analysis of blood glucose levels is measured with Folin-Wu method. Data collected from the analysis is tested using Anova and the significant result is tested using Tukey test. Probiotic used consists of T0, T1, T2, T3, and T4 is using mixture of three bacteria; L. bulgaricus, L. acidophilus, and Bifidobacteria. T5 and T6 is using mixture of two bacteria: L. acidophilus (LA), and Bifidobacteria (B). T1 = The rations is given ad libitum without fermented milk granting. T2 = The rations is given ad libitum with milk by force feeding with 1.25% from body weight. T3 = The rations is given ad libitum with fermented milk by force feeding with 1.25% from body weight. T4 = The rations is given ad libitum with fermented soy milk by force feeding with 1.25% from body weight. T5 = The rations is given ad libitum with fermented milk and fermented soy milk with ratio 1:1 by force feeding with 1.25% from body weight. T6 = The rations is given ad libitum with fermented milk with LA + B by force feeding with 1.25% from body weight. T7 = The rations is given ad libitum with fermented milk with LA + B by force feeding with 2% from body weight. RESULTS AND DISCUSSIONS The result shows that treatments of fermented milk, fermented soy milk, and the combination of it has significant effect (P<0.05) to decrease creatinine levels (Table 1 and Figure 1). Creatinine levels are significantly different in T4 and T5 compared to other treatments. Normal creatinine levels in broiler blood is ranged from 0.90 – 1.85 mg/dl (Girindra, 1989). An increase in creatinine levels in blood and the amount of creatinine in urine can be used to estimate glomerular filtration rate (Kramer et al., 2004). If the glomerulus filtration is decreasing, the kidney function is also decreasing and the glomerular function in the filtration is reducing. This will cause an increase of creatinine levels in blood.
A decrease in creatinine levels occurs because of lactic acid bacteria contained in probiotic. Because of the lactate production of glucose correlates with glomerular filtration rate, lactate production is also correlates with urine flow rate and sodium resorption (Hohmann et al., 1974). Creatinine serum levels in probiotic addition due to the combination of fermented milk and fermented soy milk ca suppress free radical compunds and fibrosis tissue formation by using antioxidant compunds in the form of vitamin E (α-Tocopherol). Vitamin E is able to inhibit the formation of oxidative stress and protect polyunsaturated fatty acids, such as linoleic, linolenic, and arachidonic acids (Pryor, 2001). Antioxidant in vitamin E can be used as a therapy in the process of curing renal fibrosis disease, by inhibiting the formation of factors that stimulate the production of excess ECM (Extracellular Matrix) components. Free radicals trigger lipid peroxidation that will damage the glomerulus and tubules, and cause inflammation (Peter, 2007). Inflammation leads to activation of fibroblast proliferation. Fibroblasts produce excess ECM and are deposited on the glomerulus and tubules, which in turn, ECM deposition forms a fibrous tissue in the kidneys (Eddy, 2000). Kidney fibrosis results in decreased renal function. The decreased kidney function causes the glomerular filtration rate to fall, resulting in the filtration of some substances, such as damaged creatinine. This will lead to creatinine and non-protein nitrogen substances retention in the kidneys so that the level of creatinine in the blood increases (Razzaque, 2004). Blood glucose in the body serves as a source of energy in order to stay in normal homeostasis conditions. Glucose is the fuel for important tissues such as the brain and red blood cells. The source of blood glucose is feed after meal, the liver oxidizes glucose, and stores its excess as glycogen (Tan et al., 2010). Microbes that live in the chicken intestine have a big effect on regulating blood glucose levels. That is why the addition of probiotics is also beneficial to lower blood glucose levels (Table 2 and Figure 2).

11
to press pathogenic bacteria population, to supply the enzyme to help digesting food ingredients, to detox adverse food components and take it out from the digestive track, and to stimulate the intestinal peristaltic activity (Adriani, 2009). Creatinine is used to monitor kidney function in blood. An increase in creatinine levels can be caused by some conditions, such as heart failure, dehydration, pyelonefritis, and high urem levels in blood. Creatinine levels in blood can decrease where there is a reduction of the mass of muscle tissue. Creatinine serum is an important indicator of renal health because it is an easily measured by product of muscle metabolism that is excreted unchanged by the kidneys. Creatinine itself is produces through a biological system involving creatine, phosphocreatine, and adenosine triphosphate (ATP, the body’s immediate energy supply). Creatine is synthesized primarily in the liver from the methylation of glycocyamine by S-adenosyl methionine. It is then transported through blood to the other organs, muscle, and brain, where, through phosphorylation, it becomes the high-energy compound phosphocreatine. Creatine conversion to phosphocreatine is catalyzed by creatine kinase, a spontaneous formation of creatinine occurs during the reaction. High creatinine levels are rarely an independent problem. More often, this issue is a symptom of something more serious to decrease the levels permanently and improve human and animal vein. Kidney damage and chronic kidney disease are related to type II Diabetes, and also linked to high creatinine levels in human. Glomerulus is an indication of increasing blood glucose with metabolism changing on poultry. Blood glucose is sugar in blood, which formed from carbohydrate in food and stored as glucose in liver and skeletal muscle. Blood glucose will decrease if the rate absorption by metabolism or stored higher than additional rate. Glucose absorption by cells is stimulated by insulin, which secreted by ß cell from Langerhans Islands. Glucose is spreading from plasma to cells because the concentration of glucose in plasma is higher than in cells. The consumption of fermented soy milk is beneficial to the balance of the ecosystem in
the intestinal tract by increasing probiotic population and decreasing pathogenic bacteria population (Lengkey and Adriani, 2009). One of the component of soy milk that has lots on benefits is isoflavones, which is the intrumental in the improvement in decreasing creatinine and blood glucose. Other components cush as saponins and soy protein also have antioxidant effect. Fermented soy milk can decrease total cholesterol and the accumulation liver triglycerides on oxidative process. Generally, soy milk has vitamin B2, B1, niacin pyridoxine, and vitamin B, E, and K. Soy contains lots of Ca, F, but has less Fe. Soy also contains lots of nutrients, such as isoflavones, saponins, phytosterols, pitat acid, and felonic acid (Anderson and Wolf, 1995). Blood glucose profile is arranged to always be in stable condition in the body through homeostatic process, which involved other glucose resources such as glycogen, fat acid, and amino acid (Lovita et al., 2010). According to Piliang (1996), the constant blood glucose profile is maintained at all times. Homeostatic sugar in blood is reached through some mechanisms that set the speed of glucose conversion to glycogen or fat to be stored and released, then converted to glucose that enter blood circulatory system (Asril, 2002). Probiotic is needed to decrease creatinine and blood glucose levels. Based on the explanation, it is important to do research about giving probiotic that affected creatinine and blood glucose levels on broiler chicken. MATERIALS AND METHODS Farm animals observed in this research are 140 strain Cobb broiler chicken, from starter to finisher phase (1 – 35 days). The research use experimental method with Complete Random Design with seven treatments and four times repetition, so 28 experimental units are retrieved. Drinking water ad libitum is provided during experimental period and feed is given according to needs. It were taken random blood sample from 56 broiler chicken, two from each cage, which analyzed at Physiology and Biochemistry Laboratory, Faculty of Animal Husbandry, Padjadjaran University. The parameter measured is creatinine and blood glucose
levels. The analysis of creatinine levels is measured with kolorimetric method, and the analysis of blood glucose levels is measured with Folin-Wu method. Data collected from the analysis is tested using Anova and the significant result is tested using Tukey test. Probiotic used consists of T0, T1, T2, T3, and T4 is using mixture of three bacteria; L. bulgaricus, L. acidophilus, and Bifidobacteria. T5 and T6 is using mixture of two bacteria: L. acidophilus (LA), and Bifidobacteria (B). T1 = The rations is given ad libitum without fermented milk granting. T2 = The rations is given ad libitum with milk by force feeding with 1.25% from body weight. T3 = The rations is given ad libitum with fermented milk by force feeding with 1.25% from body weight. T4 = The rations is given ad libitum with fermented soy milk by force feeding with 1.25% from body weight. T5 = The rations is given ad libitum with fermented milk and fermented soy milk with ratio 1:1 by force feeding with 1.25% from body weight. T6 = The rations is given ad libitum with fermented milk with LA + B by force feeding with 1.25% from body weight. T7 = The rations is given ad libitum with fermented milk with LA + B by force feeding with 2% from body weight. RESULTS AND DISCUSSIONS The result shows that treatments of fermented milk, fermented soy milk, and the combination of it has significant effect (P<0.05) to decrease creatinine levels (Table 1 and Figure 1). Creatinine levels are significantly different in T4 and T5 compared to other treatments. Normal creatinine levels in broiler blood is ranged from 0.90 – 1.85 mg/dl (Girindra, 1989). An increase in creatinine levels in blood and the amount of creatinine in urine can be used to estimate glomerular filtration rate (Kramer et al., 2004). If the glomerulus filtration is decreasing, the kidney function is also decreasing and the glomerular function in the filtration is reducing. This will cause an increase of creatinine levels in blood.
A decrease in creatinine levels occurs because of lactic acid bacteria contained in probiotic. Because of the lactate production of glucose correlates with glomerular filtration rate, lactate production is also correlates with urine flow rate and sodium resorption (Hohmann et al., 1974). Creatinine serum levels in probiotic addition due to the combination of fermented milk and fermented soy milk ca suppress free radical compunds and fibrosis tissue formation by using antioxidant compunds in the form of vitamin E (α-Tocopherol). Vitamin E is able to inhibit the formation of oxidative stress and protect polyunsaturated fatty acids, such as linoleic, linolenic, and arachidonic acids (Pryor, 2001). Antioxidant in vitamin E can be used as a therapy in the process of curing renal fibrosis disease, by inhibiting the formation of factors that stimulate the production of excess ECM (Extracellular Matrix) components. Free radicals trigger lipid peroxidation that will damage the glomerulus and tubules, and cause inflammation (Peter, 2007). Inflammation leads to activation of fibroblast proliferation. Fibroblasts produce excess ECM and are deposited on the glomerulus and tubules, which in turn, ECM deposition forms a fibrous tissue in the kidneys (Eddy, 2000). Kidney fibrosis results in decreased renal function. The decreased kidney function causes the glomerular filtration rate to fall, resulting in the filtration of some substances, such as damaged creatinine. This will lead to creatinine and non-protein nitrogen substances retention in the kidneys so that the level of creatinine in the blood increases (Razzaque, 2004). Blood glucose in the body serves as a source of energy in order to stay in normal homeostasis conditions. Glucose is the fuel for important tissues such as the brain and red blood cells. The source of blood glucose is feed after meal, the liver oxidizes glucose, and stores its excess as glycogen (Tan et al., 2010). Microbes that live in the chicken intestine have a big effect on regulating blood glucose levels. That is why the addition of probiotics is also beneficial to lower blood glucose levels (Table 2 and Figure 2).

12
Table 1. Levels of broiler chicken creatinine (mg/dL) in various treatments
Repeat Treatment T1 T2 T3 T4 T5 T6 T7
1 2.23 2.05 1.67 1.49 1.12 1.86 1.49 2 1.86 1.67 1.58 1.67 1.49 1.49 1.67 3 1.67 1.86 1.67 1.49 1.30 1.67 1.86 4 1.49 1.49 1.86 1.86 1.12 1.86 1.67
Average 1.81±0.32 1.77±0.24 1.70±0.12 1.63±0.18 1.26±0.18 1.72±0.18 1.67±0.15
Figure 1. Average levels of broiler chicken creatinine in various treatments
Table 2. Levels of blood glucose (mg/dL) of broiler chicken in various treatments
Repeat Treatment T1 T2 T3 T4 T5 T6 T7
1 84.42 85.48 84.81 82.98 86.63 86.25 85.00 2 89.71 79.52 85.58 89.62 87.60 83.85 82.69 3 89.81 93.75 82.50 90.10 84.04 82.12 84.42 4 83.75 89.13 86.06 85.48 80.00 88.65 87.79
Average 86.92±3.29 86.97±6.01 84.74±1.58 87.05±3.41 84.57±3.40 85.22±2.85 84.98±2.12
Figure 2. Average levels of broiler chicken blood glucose in various treatments
Probiotics, alias good bacteria, are included in functional food because of its benefits to health. A healthy digestive organ is trusted by experts as the foundation for excellent physical health. As glucose levels increase, glucose output stops, and at high levels occurs as uptake (Martin et al., 1984). These data show that according to Ejtahed et al. (2012), the function of probiotics in lowering glucose is not clear. This is associated with
decreased oxidative stress, which is shown to be present in hyperglycemia (Ferreira et al., 2010). Specific strains of lactic acid bacteria have antioxidant properties (Amaretti et al., 2013). Yadav et al. (2006) reported that fermented milk containing Lactobacillus acidophilus and L. casei delay the development of glucose intolerance, hyperglycemia, and hyperinsulinaemia through decreased oxidative stress, thus, probiotics may modulate the
systemic immune response and low-level inflammation, in particular by reducing cytokines (de Moreno De Leblanc and Perdigon, 2010). And suppress the NF-κB pathway, which mediates microbial activation of the immune system via receptors such as tolls (Shi et al., 2006). Consumption of probiotics can increase plasma antioxidant levels and neutralize the effects of oxygen-reactive species. Furthermore, the stimulation of the immune system decreases the inflammatory state and prevents oxidative stress induced by cytokines (Martarelli et al., 2011). Anti-oxidative and anti-inflammatory properties of probiotics, benefits can be given to the immune system, consequently neutralizing the production of oxygen reactive species (Martarelli et al., 2011). This is consistent with previous studies of the effects of probiotics on renal function by short-term randomized trials and the results show a decrease in blood urea nitrogen (BUN) (Ranganathan et al., 2009). Probiotics contain flavonoid compounds, which are important antioxidants in neutralizing and destroying free radicals that can cause cell damage and also damage biomolecules in the body that can eventually lead to degenerative diseases (Silalahi, 2002). When the amount of free radicals in the body is excessive, creatinine levels also increase, it takes antioxidant that come from outside the body, such as flavonoids, vitamin A, vitamin C, and vitamin E (Pratiwi et al., 2006,). The mechanisms of antioxidants are: 1) interact directly with oxidants, free radicals; 2) prevent the formation of reactive oxygen species; 3) fixed the damage that arises (Ong et al., 1995). Provision of probiotics is the reason for the blood creatinine profile does not increase in a state of stress. The results of Wyss and Kaddurrah (2000) and Adriani et al. (2017) show adequate availability of glucose in muscle cells inhibiting the creatine kinase enzyme to catalyze creatine phosphate to creatinine. Associated with the results of these studies of Wyss and Kaddurrah (2000), it can be explained that probiotics contain glucosamine, a source of glucose as a precursor of energy. So the phosphate creatine decomposition becomes less creatinine. With the provision of fermented
milk as a probiotic in broiler chicken, it will improve kidney function so that kidney function and filtration by glomerulus can increase which is the creatinine levels will decrease at the end. High dose probiotics have been hypothesized to metabolize the nitrogenous waste products. Parameters of blood glucose result of variance analysis shows that the provision of fermented milk has no significant effect (P>0.05) to decrease blood glucose level on broiler chicken. Blood glucose is derived from several sources, such as from food carbohydrates, glycogenic compounds through glycogenogenesis, as well as from liver glycogen by glycogenesis. The guard system of glucose profiles in the blood of livestock through the process of glycolysis, gluconeogenesis, etc. so that the blood glucose concentration will be relatively constant (Poedjiadi, 1994; Adriani et al., 2015). Consumption of probiotics can simply improve glycemic control. Modification of intestinal microbiota by probiotic supplementation may be a method for preventing and controlling hyperglycemia in clinical practice (Yuting et al., 2015). CONCLUSIONS The given of fermented milk and fermented soy milk has a significant effect in decreasing creatinine levels, but had no significant effect in decreasing blood glucose in broiler chicken. The given of fermented milk with mixture of two bacteria – Lactobacillus acidophilus, and Bifidobacteria can decrease creatinine in the highest levels compared to other treatments. REFERENCES Adriani L., Hernawan E., Kamil K.A., Mushawwir A.,
2010. Fisiologi Ternak, Widya Padjajaran, Bandung. Adriani L., Deni Rusmana, Elvia Hernawan, Nenden
Indrayati, Ana Rochana, 2017. Effect of Noni (Morindacitrifolia) Fruit Flour on Antioxidant Status and Hematological Indices of Laying Japanese Quail. Scopus Int. J.Poultr.Sci., 16: p. 93-97.
Adriani L., Tuti Widjastuti, Rizki Dermawan, 2015. The effect of probiotic supplemented ration on broiler abdominal fatty content and final weight. Lucrări Ştiinţifice, vol. 53, Seria Zootehnie.
Amaretti A., di Nunzio M., Pompei A., Raimondi S., Rossi M., Bordoni A., 2013. Antioxidant properties of potentially probiotic bacteria: in vitro and in vivo
13
Table 1. Levels of broiler chicken creatinine (mg/dL) in various treatments
Repeat Treatment T1 T2 T3 T4 T5 T6 T7
1 2.23 2.05 1.67 1.49 1.12 1.86 1.49 2 1.86 1.67 1.58 1.67 1.49 1.49 1.67 3 1.67 1.86 1.67 1.49 1.30 1.67 1.86 4 1.49 1.49 1.86 1.86 1.12 1.86 1.67
Average 1.81±0.32 1.77±0.24 1.70±0.12 1.63±0.18 1.26±0.18 1.72±0.18 1.67±0.15
Figure 1. Average levels of broiler chicken creatinine in various treatments
Table 2. Levels of blood glucose (mg/dL) of broiler chicken in various treatments
Repeat Treatment T1 T2 T3 T4 T5 T6 T7
1 84.42 85.48 84.81 82.98 86.63 86.25 85.00 2 89.71 79.52 85.58 89.62 87.60 83.85 82.69 3 89.81 93.75 82.50 90.10 84.04 82.12 84.42 4 83.75 89.13 86.06 85.48 80.00 88.65 87.79
Average 86.92±3.29 86.97±6.01 84.74±1.58 87.05±3.41 84.57±3.40 85.22±2.85 84.98±2.12
Figure 2. Average levels of broiler chicken blood glucose in various treatments
Probiotics, alias good bacteria, are included in functional food because of its benefits to health. A healthy digestive organ is trusted by experts as the foundation for excellent physical health. As glucose levels increase, glucose output stops, and at high levels occurs as uptake (Martin et al., 1984). These data show that according to Ejtahed et al. (2012), the function of probiotics in lowering glucose is not clear. This is associated with
decreased oxidative stress, which is shown to be present in hyperglycemia (Ferreira et al., 2010). Specific strains of lactic acid bacteria have antioxidant properties (Amaretti et al., 2013). Yadav et al. (2006) reported that fermented milk containing Lactobacillus acidophilus and L. casei delay the development of glucose intolerance, hyperglycemia, and hyperinsulinaemia through decreased oxidative stress, thus, probiotics may modulate the
systemic immune response and low-level inflammation, in particular by reducing cytokines (de Moreno De Leblanc and Perdigon, 2010). And suppress the NF-κB pathway, which mediates microbial activation of the immune system via receptors such as tolls (Shi et al., 2006). Consumption of probiotics can increase plasma antioxidant levels and neutralize the effects of oxygen-reactive species. Furthermore, the stimulation of the immune system decreases the inflammatory state and prevents oxidative stress induced by cytokines (Martarelli et al., 2011). Anti-oxidative and anti-inflammatory properties of probiotics, benefits can be given to the immune system, consequently neutralizing the production of oxygen reactive species (Martarelli et al., 2011). This is consistent with previous studies of the effects of probiotics on renal function by short-term randomized trials and the results show a decrease in blood urea nitrogen (BUN) (Ranganathan et al., 2009). Probiotics contain flavonoid compounds, which are important antioxidants in neutralizing and destroying free radicals that can cause cell damage and also damage biomolecules in the body that can eventually lead to degenerative diseases (Silalahi, 2002). When the amount of free radicals in the body is excessive, creatinine levels also increase, it takes antioxidant that come from outside the body, such as flavonoids, vitamin A, vitamin C, and vitamin E (Pratiwi et al., 2006,). The mechanisms of antioxidants are: 1) interact directly with oxidants, free radicals; 2) prevent the formation of reactive oxygen species; 3) fixed the damage that arises (Ong et al., 1995). Provision of probiotics is the reason for the blood creatinine profile does not increase in a state of stress. The results of Wyss and Kaddurrah (2000) and Adriani et al. (2017) show adequate availability of glucose in muscle cells inhibiting the creatine kinase enzyme to catalyze creatine phosphate to creatinine. Associated with the results of these studies of Wyss and Kaddurrah (2000), it can be explained that probiotics contain glucosamine, a source of glucose as a precursor of energy. So the phosphate creatine decomposition becomes less creatinine. With the provision of fermented
milk as a probiotic in broiler chicken, it will improve kidney function so that kidney function and filtration by glomerulus can increase which is the creatinine levels will decrease at the end. High dose probiotics have been hypothesized to metabolize the nitrogenous waste products. Parameters of blood glucose result of variance analysis shows that the provision of fermented milk has no significant effect (P>0.05) to decrease blood glucose level on broiler chicken. Blood glucose is derived from several sources, such as from food carbohydrates, glycogenic compounds through glycogenogenesis, as well as from liver glycogen by glycogenesis. The guard system of glucose profiles in the blood of livestock through the process of glycolysis, gluconeogenesis, etc. so that the blood glucose concentration will be relatively constant (Poedjiadi, 1994; Adriani et al., 2015). Consumption of probiotics can simply improve glycemic control. Modification of intestinal microbiota by probiotic supplementation may be a method for preventing and controlling hyperglycemia in clinical practice (Yuting et al., 2015). CONCLUSIONS The given of fermented milk and fermented soy milk has a significant effect in decreasing creatinine levels, but had no significant effect in decreasing blood glucose in broiler chicken. The given of fermented milk with mixture of two bacteria – Lactobacillus acidophilus, and Bifidobacteria can decrease creatinine in the highest levels compared to other treatments. REFERENCES Adriani L., Hernawan E., Kamil K.A., Mushawwir A.,
2010. Fisiologi Ternak, Widya Padjajaran, Bandung. Adriani L., Deni Rusmana, Elvia Hernawan, Nenden
Indrayati, Ana Rochana, 2017. Effect of Noni (Morindacitrifolia) Fruit Flour on Antioxidant Status and Hematological Indices of Laying Japanese Quail. Scopus Int. J.Poultr.Sci., 16: p. 93-97.
Adriani L., Tuti Widjastuti, Rizki Dermawan, 2015. The effect of probiotic supplemented ration on broiler abdominal fatty content and final weight. Lucrări Ştiinţifice, vol. 53, Seria Zootehnie.
Amaretti A., di Nunzio M., Pompei A., Raimondi S., Rossi M., Bordoni A., 2013. Antioxidant properties of potentially probiotic bacteria: in vitro and in vivo

14
activities. Applied microbiology and biotechnology, 97(2): p. 809-817.
Anderson R.L., Wolf W.J., 1995. Compositional changes in trypsin inhibitors, phytic acid, saponins and isoflavones related to soybean processing. J. Nutr., 125(3): p. 581S-588S.
Asril B., 2002. Respon Gula Darah Non Atletpada Latihandenganpemberian Gulasebelum Latihan. Program Pascasarjana Universitas Airlangga Surabaya. “Tesis” Tidakdipublikasikan, hlm 19.
Barrow P.A., 1992. Probiotics for chickens. Chapman and Hall, London.
Bianchi-Salvadori B., 1986. Intestinal microflora: The role of yogurt in the equilibrium of the gut ecosystem. Int. J. Immunother., 11: p. 9-18
Brown A.C., Shovic A., Ibrahim S.A., Holck P., 2005. Anon-diary probiotic (poi) influence on changing the gastrointestinal tracts microflora environment. Altern. Ther. Health Med., 11: p. 58-64.
Daghir N.J., 1995. Poultry production in pot climates. CAB International, Wollingford.
Dawson W.R., Whittow G.C., 2000. Regulation of body temperature, in Sturkie’s Avian Physiology, 5th ed., edited by Whittow, G.C. Academic Press, Elsevies Sci.Pub.Co., Sydney.
de Moreno de Leblanc A., Perdigon G., 2010. The application of probiotic fermented milks in cancer and intestinalinflammation. The Proceedings of the Nutrition Society, 69(3): p. 421–428.
Eddy H.M., 2000. Renal Fibrosis: Molecullar Pathomechanism and New Target Treatmant. Blackwell Science Ltd., USA, 1- 45, p. 271-489.
Ejtahed H.S., Mohtadi-Nia J., Homayouni-Rad A., Niafar M., Asghari-Jafarabadi M., Mofid V., 2012. Probiotic yogurt improves antioxidant status in type 2 diabetic patients. Nutrition (Burbank, Los Angeles County, Calif), 28(5): p. 539–43.
Ferreira L., Teixeira-de-Lemos E., Pinto F., Parada B., Mega C., Vala H. et al., 2010. Effects of sitagliptin treatment on dysmetabolism, inflammation, and oxidative stress in an animal model of type 2 diabetes (ZDFrat). Mediators of inflammation, doi: 10.1155/2010/592760 PMID: 20652060; PubMed Central PMCID: PMCPMC2905949.
Fuhrman B., Aviram M., 2001. Flavonoids Protect LDL from Oxidation and Attenuate Atherosclerosis. Curr. Opin. Lipidol., 12:41-8.
Girindra A., 1989. Biokimia Patalogi. Institus Pertanian Bogor, p. 68-74
Hillman P.E., Scot N.R., van Tienhoven A., 2000. Physiological, Responses and Adaptations to Hot and Cold Environments. Di dalam Yousef MK, editor. Stress Physiology in Livestock. Vol. 3, Poultry. Florida: CRC Pr. hal: p. 1-71.
Hohmann B., Frohnert P.P., Kinne R., Baumann K., 1974. Proximal tubular lactate transport in rat kidney: a micropuncture study. Kidney Int., 261: p. 5-11.
Iriyanti N., Efka Aris R., 2001. Inokulasi Probiotik Lactobasillus spp. Asal Ayam Buras sebagai Upaya Perbaikan Performans Ayam Petelur. Laporan Penelitian. Universitas Jenderal Soedirman, Purwokerto.
Kegley E.B., Spears J.W., 1995. Immune response, glucose metabolism, and performance of stressed feeder calves fed inorganic or organic chromium. J. Anim. Sci., 73: p. 2721-2726.
Kramer J.A., Pettiet S.D., Amin R.P., Bertram T.A., Car B., Cunningham M., Curtiss S.W., Davis J.W., Kind C., Lawton M., Naciff J.M., Oreffo V., Roman R.J., Sistare F.D., Steven J., Thompson K., Vickers A., Wild S., Afsharif A., 2004. Overview of the application of transcription profiling using selected nephrotoxicants for toxicology assessment. Environmental Health Perspectives, 112: p. 460-464.
Lee Joyce le Fever (ed)., 2007. Pedoman Pemeriksaan Laboratorium dan diagnostik. Dialihbahasakanoleh: Sari Kurnianingsih. EGC. Jakarta.
Lehninger A.L., 1982. Dasar-Dasar Biokimia. Diterjemahkanoleh Maggy Thenawidjaja. Penerbit Erlangga, Jakarta.
Lendrum D.C, Woodruff R., 2006. Comparative risk assessment of the burden of disease from climate change. Environ Health Perspect., 114: p. 1935-1941.
Lengkey H.A.W., Adriani L., 2009. Effects of milk fermented with Lactobacillus acidophilus and Bifidobacterium spp., on lactic acid and acetic acid content and on Staphylococcus aureus and Pseudomonas aeruginosa. Biotechnology in Animal Husbandry, 25(5-6): p. 719-724.
Mark Dawn B., Markl Allan D., Smith Collen M., 1996. Biokimiakedokterandasar:Sebuahpendekatanklinis. Edisi 1, Jakarta, EGC, 2000.H.513-30.
Martarelli et al., 2011. Effect of a probiotic intake on oxidant and antioxidant parameters in plasma of athletes during intense exercise training. Current Microbiology, 62: p. 1689-1696.
Martin D.W., Mayes P.A., Rodwell V.W., 1984. Biokimia (Harper’s Review of Biochemistry). EGC. Jakarta.
Meyer D.J., Harvey J.W., 2004. Veterinary Laboratory Medicine Interpretation and Diagnosis. Philadelphia: Saunders.
Ong L.M., de Haes J.C., Hoos A.M., Lammes F.B., 1995. Doctor–patient communication: a review of the literature. Soc.Sci.Med., 40: p. 903-918.
Perdigon G., Alvarez S., Rachid M., Aguero G., Gobbato N., 1995. Immune system stimulation by probiotics. J. Dairy Sci., 78: p. 1597-1606.
Perdigon G., Locascio M., Medici M., Holgado A.P.D., Oliver G., 2003. Interaction of Bifidobacteria with gut and their influence in the immune function. Biocell, 27: p. 113-126.
Peter S., 2010. Clinical Nephrology: Principles and Practice of Hepatobiliary Diseases. Springer (02): p. 3391–3407.
Piliang W.G, 1996. Fisiologi Nutrisi. UI Press. Jakarta Poedjiadi Anna, Supriyanti Titin F.M., 1994. Dasar-dasar
Biokimia. Universitas Indonesia. Jakarta. Pratiwi Dewi P., Harapini M., 2006. Nilai peroksida dan
aktivitas anti radikal bebas diphenyl picril hydrazil hydrate (DPPH) ekstrak metanol Knema laurina. Majalah farmasi Indonesia.17(1): p. 32-36.
Priyatno, 2000. Mendirikan Usaha Pemotongan Ayam. Penebar Swadaya. Jakarta.
Pryor, 2001. Vitamin E Antioxydant Therapeutic.
Dialysis International, Vol. 28, Hlm. P. 59-62. Ranganathan N., Friedman E.A., Tam P., Rao V.,
Ranganathan P., Dheer R., 2009. Probiotic dietary supplementation in patients with stage 3 and 4 chronic kidney disease: a 6-month pilot scale trial in Canada. Curr. Med. Res. Opin., 25: p. 1919–30.
Razzaque S., 2004. Fibrogenesis: Cellular and moleculer Basic. Nephrol. Dial. Transplant, (22): p. 3391-3407.
Shi H., Kokoeva M.V., Inouye K., Tzameli I., Yin H., Flier J.S., 2006. TLR4 links innate immunity and fatty acidinducedinsulin resistance. The Journal of clinical investigation, 116 (11): p. 3015-25.
Soewolo, 2000. Pengantar Fisiologi Hewan. Jakarta: DIKTI.
Tan G.Y., Yang L., Fu Y.Q., Feng J.H., Zhang M.H., 2010. Effects of different acute high ambient temperatures on function of hepatic mitochondrial respiration, antioxidative enzymes and oxidative injury in broiler chickens. Poult. Sci., 89: p. 115–122.
Tavan E., Cayuela C., Anroine J.M., Trugnan G., Chaugier C., Cassand P., 2002. Effects of diary products on heterocyclic aromatic amine-induced rat colon carcinogenesis. Carcinogenesis, 23: p. 477-483.
Vesa T.H., Marteau P., Korpela R., 2000. Lactose intolerance. J. Am. Coll. Nutr., 19: p. 165-175.
Wilson M., Shukitt-Hale B., Kalt W., Ingram D.K., Joseph J., Wolkow C., 2006. Blueberry polyphenols increase lifespan and thermotolerance in Caenorhabditis elegans. Aging cell, 5(1): p. 59–68.
Wollowski I., Ji S.T., Bakalinsky A.T., Neudecker C., Pool-Zobel B.L., 1999. Bacteria used for the production of yogurt inactivate carcinogen and prevent DNA damage in the colon of rats. J. Nutr., 129: p. 77-82.
Wyss M., Kaddurah-Daouk R., 2000. Creatine and Creatinine Metabolism. PubMed.gov. Vol. (30):80.
Yadav H., Jain S., Sinha P.R., 2007. Antidiabetic effect of probiotic dahi containing Lactobacillus acidophilus and Lactobacillus casei in high fructose fed rats. Nutrition (Burbank, Los Angeles County, Calif), 23(1): p. 62–68.
Yousef M.K., 1985. Thermoneutral Zone. In: M.K. Yousef (Ed.). Stress Physiology of Livestock, Vol.II, CRC Press, Inc. Boca Raton, Florida, p. 68-69.
Yutting Ruan, Jie Sun, Jie He, Fangyao Chen, Rongping Chen, Hong Chen, 2015. Effect of probiotics on glycemic control: A systematic review and meta-analysis of randomized, controlled trials. Guangzhou, China. Southern Medical University.

15
activities. Applied microbiology and biotechnology, 97(2): p. 809-817.
Anderson R.L., Wolf W.J., 1995. Compositional changes in trypsin inhibitors, phytic acid, saponins and isoflavones related to soybean processing. J. Nutr., 125(3): p. 581S-588S.
Asril B., 2002. Respon Gula Darah Non Atletpada Latihandenganpemberian Gulasebelum Latihan. Program Pascasarjana Universitas Airlangga Surabaya. “Tesis” Tidakdipublikasikan, hlm 19.
Barrow P.A., 1992. Probiotics for chickens. Chapman and Hall, London.
Bianchi-Salvadori B., 1986. Intestinal microflora: The role of yogurt in the equilibrium of the gut ecosystem. Int. J. Immunother., 11: p. 9-18
Brown A.C., Shovic A., Ibrahim S.A., Holck P., 2005. Anon-diary probiotic (poi) influence on changing the gastrointestinal tracts microflora environment. Altern. Ther. Health Med., 11: p. 58-64.
Daghir N.J., 1995. Poultry production in pot climates. CAB International, Wollingford.
Dawson W.R., Whittow G.C., 2000. Regulation of body temperature, in Sturkie’s Avian Physiology, 5th ed., edited by Whittow, G.C. Academic Press, Elsevies Sci.Pub.Co., Sydney.
de Moreno de Leblanc A., Perdigon G., 2010. The application of probiotic fermented milks in cancer and intestinalinflammation. The Proceedings of the Nutrition Society, 69(3): p. 421–428.
Eddy H.M., 2000. Renal Fibrosis: Molecullar Pathomechanism and New Target Treatmant. Blackwell Science Ltd., USA, 1- 45, p. 271-489.
Ejtahed H.S., Mohtadi-Nia J., Homayouni-Rad A., Niafar M., Asghari-Jafarabadi M., Mofid V., 2012. Probiotic yogurt improves antioxidant status in type 2 diabetic patients. Nutrition (Burbank, Los Angeles County, Calif), 28(5): p. 539–43.
Ferreira L., Teixeira-de-Lemos E., Pinto F., Parada B., Mega C., Vala H. et al., 2010. Effects of sitagliptin treatment on dysmetabolism, inflammation, and oxidative stress in an animal model of type 2 diabetes (ZDFrat). Mediators of inflammation, doi: 10.1155/2010/592760 PMID: 20652060; PubMed Central PMCID: PMCPMC2905949.
Fuhrman B., Aviram M., 2001. Flavonoids Protect LDL from Oxidation and Attenuate Atherosclerosis. Curr. Opin. Lipidol., 12:41-8.
Girindra A., 1989. Biokimia Patalogi. Institus Pertanian Bogor, p. 68-74
Hillman P.E., Scot N.R., van Tienhoven A., 2000. Physiological, Responses and Adaptations to Hot and Cold Environments. Di dalam Yousef MK, editor. Stress Physiology in Livestock. Vol. 3, Poultry. Florida: CRC Pr. hal: p. 1-71.
Hohmann B., Frohnert P.P., Kinne R., Baumann K., 1974. Proximal tubular lactate transport in rat kidney: a micropuncture study. Kidney Int., 261: p. 5-11.
Iriyanti N., Efka Aris R., 2001. Inokulasi Probiotik Lactobasillus spp. Asal Ayam Buras sebagai Upaya Perbaikan Performans Ayam Petelur. Laporan Penelitian. Universitas Jenderal Soedirman, Purwokerto.
Kegley E.B., Spears J.W., 1995. Immune response, glucose metabolism, and performance of stressed feeder calves fed inorganic or organic chromium. J. Anim. Sci., 73: p. 2721-2726.
Kramer J.A., Pettiet S.D., Amin R.P., Bertram T.A., Car B., Cunningham M., Curtiss S.W., Davis J.W., Kind C., Lawton M., Naciff J.M., Oreffo V., Roman R.J., Sistare F.D., Steven J., Thompson K., Vickers A., Wild S., Afsharif A., 2004. Overview of the application of transcription profiling using selected nephrotoxicants for toxicology assessment. Environmental Health Perspectives, 112: p. 460-464.
Lee Joyce le Fever (ed)., 2007. Pedoman Pemeriksaan Laboratorium dan diagnostik. Dialihbahasakanoleh: Sari Kurnianingsih. EGC. Jakarta.
Lehninger A.L., 1982. Dasar-Dasar Biokimia. Diterjemahkanoleh Maggy Thenawidjaja. Penerbit Erlangga, Jakarta.
Lendrum D.C, Woodruff R., 2006. Comparative risk assessment of the burden of disease from climate change. Environ Health Perspect., 114: p. 1935-1941.
Lengkey H.A.W., Adriani L., 2009. Effects of milk fermented with Lactobacillus acidophilus and Bifidobacterium spp., on lactic acid and acetic acid content and on Staphylococcus aureus and Pseudomonas aeruginosa. Biotechnology in Animal Husbandry, 25(5-6): p. 719-724.
Mark Dawn B., Markl Allan D., Smith Collen M., 1996. Biokimiakedokterandasar:Sebuahpendekatanklinis. Edisi 1, Jakarta, EGC, 2000.H.513-30.
Martarelli et al., 2011. Effect of a probiotic intake on oxidant and antioxidant parameters in plasma of athletes during intense exercise training. Current Microbiology, 62: p. 1689-1696.
Martin D.W., Mayes P.A., Rodwell V.W., 1984. Biokimia (Harper’s Review of Biochemistry). EGC. Jakarta.
Meyer D.J., Harvey J.W., 2004. Veterinary Laboratory Medicine Interpretation and Diagnosis. Philadelphia: Saunders.
Ong L.M., de Haes J.C., Hoos A.M., Lammes F.B., 1995. Doctor–patient communication: a review of the literature. Soc.Sci.Med., 40: p. 903-918.
Perdigon G., Alvarez S., Rachid M., Aguero G., Gobbato N., 1995. Immune system stimulation by probiotics. J. Dairy Sci., 78: p. 1597-1606.
Perdigon G., Locascio M., Medici M., Holgado A.P.D., Oliver G., 2003. Interaction of Bifidobacteria with gut and their influence in the immune function. Biocell, 27: p. 113-126.
Peter S., 2010. Clinical Nephrology: Principles and Practice of Hepatobiliary Diseases. Springer (02): p. 3391–3407.
Piliang W.G, 1996. Fisiologi Nutrisi. UI Press. Jakarta Poedjiadi Anna, Supriyanti Titin F.M., 1994. Dasar-dasar
Biokimia. Universitas Indonesia. Jakarta. Pratiwi Dewi P., Harapini M., 2006. Nilai peroksida dan
aktivitas anti radikal bebas diphenyl picril hydrazil hydrate (DPPH) ekstrak metanol Knema laurina. Majalah farmasi Indonesia.17(1): p. 32-36.
Priyatno, 2000. Mendirikan Usaha Pemotongan Ayam. Penebar Swadaya. Jakarta.
Pryor, 2001. Vitamin E Antioxydant Therapeutic.
Dialysis International, Vol. 28, Hlm. P. 59-62. Ranganathan N., Friedman E.A., Tam P., Rao V.,
Ranganathan P., Dheer R., 2009. Probiotic dietary supplementation in patients with stage 3 and 4 chronic kidney disease: a 6-month pilot scale trial in Canada. Curr. Med. Res. Opin., 25: p. 1919–30.
Razzaque S., 2004. Fibrogenesis: Cellular and moleculer Basic. Nephrol. Dial. Transplant, (22): p. 3391-3407.
Shi H., Kokoeva M.V., Inouye K., Tzameli I., Yin H., Flier J.S., 2006. TLR4 links innate immunity and fatty acidinducedinsulin resistance. The Journal of clinical investigation, 116 (11): p. 3015-25.
Soewolo, 2000. Pengantar Fisiologi Hewan. Jakarta: DIKTI.
Tan G.Y., Yang L., Fu Y.Q., Feng J.H., Zhang M.H., 2010. Effects of different acute high ambient temperatures on function of hepatic mitochondrial respiration, antioxidative enzymes and oxidative injury in broiler chickens. Poult. Sci., 89: p. 115–122.
Tavan E., Cayuela C., Anroine J.M., Trugnan G., Chaugier C., Cassand P., 2002. Effects of diary products on heterocyclic aromatic amine-induced rat colon carcinogenesis. Carcinogenesis, 23: p. 477-483.
Vesa T.H., Marteau P., Korpela R., 2000. Lactose intolerance. J. Am. Coll. Nutr., 19: p. 165-175.
Wilson M., Shukitt-Hale B., Kalt W., Ingram D.K., Joseph J., Wolkow C., 2006. Blueberry polyphenols increase lifespan and thermotolerance in Caenorhabditis elegans. Aging cell, 5(1): p. 59–68.
Wollowski I., Ji S.T., Bakalinsky A.T., Neudecker C., Pool-Zobel B.L., 1999. Bacteria used for the production of yogurt inactivate carcinogen and prevent DNA damage in the colon of rats. J. Nutr., 129: p. 77-82.
Wyss M., Kaddurah-Daouk R., 2000. Creatine and Creatinine Metabolism. PubMed.gov. Vol. (30):80.
Yadav H., Jain S., Sinha P.R., 2007. Antidiabetic effect of probiotic dahi containing Lactobacillus acidophilus and Lactobacillus casei in high fructose fed rats. Nutrition (Burbank, Los Angeles County, Calif), 23(1): p. 62–68.
Yousef M.K., 1985. Thermoneutral Zone. In: M.K. Yousef (Ed.). Stress Physiology of Livestock, Vol.II, CRC Press, Inc. Boca Raton, Florida, p. 68-69.
Yutting Ruan, Jie Sun, Jie He, Fangyao Chen, Rongping Chen, Hong Chen, 2015. Effect of probiotics on glycemic control: A systematic review and meta-analysis of randomized, controlled trials. Guangzhou, China. Southern Medical University.
16
AgroLife Scientific Journal - Volume 6, Number 2, 2017ISSN 2285-5718; ISSN CD-ROM 2285-5726; ISSN ONLINE 2286-0126; ISSN-L 2285-5718
DETERMINATION OF THE SALT TOLERANCE CHARACTERISTICS OF SOME BREAD WHEAT CULTIVARS
Aidin ALP1, Sadettin ÇELİK2, Döne PARLAK2
1University of Dicle, Faculty of Agriculture, Field Crops Department, 21280, Diyarbakir, Turkey 2University of Kahramanmaraş Sutcu Imam, Faculty of Agriculture, Biotechnology Department,
Kahramanmaras, Turkey
Corresponding author email: [email protected] Abstract The study was performed in 2012-2013 and 2013-2014 vegetation seasons in the Dicle University, Agricultural Faculty, Research and Application Field and open greenhouse conditions. In this study, dry plant weight, K
+/Na
+ rates, Ca, Fe,
and Zn contents in green parts of different 5 bread wheat cultivars of foreign origin, and the standard bread wheat cultivar, which is cultivated commonly in Southeastern Anatolia Region, have been compared under salt stress in pots. In addition, the agricultural characteristics like Number of Heading Days, Plant Height, Plant Grain Yield and Thousand Grain Weight were measured both in field and pot experiments. It has been determined in the study that average dry weight decreased at a rate of 43.5%, and the K
+/Na
+rate
decreased at a rate of 50.1% in all wheat cultivars that are cultivated in salinity conditions. The Calcium (Ca) content of all cultivars increased at a significant level with the salt application. While the zinc (Zn) content of the Muzik cultivar decreases in salt stress, the Zn contents of the other cultivars have increased. Key words: bread wheat cultivars, salinity, salt stress, salt tolerance, agricultural characteristics, plant ion content. INTRODUCTION Turkey has the high potential of breeding varieties and wheat production because of its ecological structure and its being the gene center of wheat. The wheat has an important place as the basis of nutrition for people. Performing the production of quality and resistant wheat cultivars by using proper cultivation techniques are extremely important for producers and the industrialists (Aydemir et al., 2003). Yield and quality in wheat are influenced by genocultivar, environment, and genocultivar X environment interaction at a significant degree. In order to obtain high yield in wheat, the genocultivar must have high yield potential and the environmental conditions must be suitable. Adequate and balanced nutrition of the fast-increasing population with the production obtained from the separating and decreasing agricultural fields is becoming difficult day by day. For this reason, determining the genocultivars that have high yield, quality and resistance properties and that adapted to the ecological conditions well are of vital
importance in covering the increasing need of nutrition. Generally various yield and quality criteria are assessed in bread wheat and durum wheat in plant breeding works. However, the improvements in forming resistance against salinity in plants have been limited so far. Some of the important reasons for this are the plant physiology being influenced by salinity in many ways and the tolerability of plants to salt being a quantitative characteristic defined by multiple genes (Borsani et al., 2003). Today, 20% of the agricultural lands on Earth and 50% of the irrigated lands are influenced by salinity (Zhu, 2001). In our country, on the other hand, it is possible to observe salinity at various levels in 4.49% of the agricultural areas (Munsuz et al., 2001). 7.52% of the land in our country (5.8 million ha) is influenced by drainage problem at various levels. Salinity and alkalinity are observed in many areas, mostly in Central Anatolian Region and in alluvial coastal plains due to the disrupted drainage systems (Anonymous, 2006). When the salinity levels of the soil in Turkey are examined according to the regions it is observed that the slightly salty soils (0.15-0.35%, 1.5-3.5 g/l) are
distributed mostly in Middle-South, Mediterranean, Middle-North and South-Eastern agricultural regions. The salinity problem in the Mediterranean and Southeastern agricultural areas, which cover the Ceyhan Plain and GAP Project, stem from the secondary cause, i.e. the salinity due to irrigation. The negative influences of salinity are observed mostly in arid and semi-arid areas where mainly wheat and other cereal products which cover the food requirement of the world. Salinity causes important losses in crops every year. It has been reported that biotic and abiotic (hot, cold, drought and salinity) stress factors cause nearly 25% loss in crops in annual base (Gill et al., 2004). Salinity limiting the plant production at a significant level may occur due to natural factors (less precipitation, high-level vaporization, and the existence of salty rocks) and incorrect agricultural applications (incorrect irrigation methods, irrigation with salty water, the accumulation of chemical residues from industrial products, high-dose mineral fertilization) (Kalaji and Pietkiewicz, 1993). Global warming, which is the source of the biggest environmental problem encountered by the globe, also cause that the seasonal normal values or temperature and precipitation become irregular and lead to inadequate precipitation and high vaporization eventually leading to salinity of the soil. The simplest influence of the salt on plants is leading to the decrease in the intake of the nutrients in the soil by the plant and the plant cannot make use of the water in the soil (Crawley, 1997). The plants cannot make use of the water due to the increasing osmotic potential in salty soils or the plants can only make use of small amounts of water because of the toxic effects of Na
+ and Cl
- which exist in
excessive amounts in the soil (Greenway, 1973; Flowers and Yeo, 1981). The Na, which accumulates in plants in salt stress, inhibits the potassium intake, and the Cl
- especially inhibits
the NO3 intake and disrupts the ion balance of the plants (Siegel et al., 1980; Kirkby and Knight, 1987; Gunes et al., 1994; Inal et al., 1995). Parallel to the disruption in the ion balance in plants that grow in salty conditions, there also appears changes in mineral concentrations of
the plants that may be accepted as significant. The Na and Cl ions are less in the tissues of the plants that are not influenced or influenced relatively less by the salt stress, and the proline amount is more (Flowers et al., 1977). The disruption in the photosynthesis, respiration and similar activities due to the damage in the cells breaking down the cellular functions by excessive amount of salt is another result of the damages of salt (Leopold and Willing, 1984). The Na
+ and K
+ content of the plant are used as
the criteria of resistance to salt in wheat grown in salinity conditions (Ahsan and Khalid, 1999). Potassium has important effects on photosynthesis, enzymatic activity, turgor potential, cell enlargement, aboveground and underground organs growth, stoma mobility, transpiration and protein synthesis (Tisdale et al., 1993; Marschner, 1995). The increase of potassium concentration of the plant rises the resistance to salt (Hsiao and Lauchli, 1986). In addition, it is known that the high K
+/Na
+ rate
in the plant is in direct proportion with the resistance to salt (Gorham, 1990; Ashraf et al., 1997; Sherif et al., 1998). The plants that are resistance to salt during the developmental stages after germination are extremely sensitive to soil salinity germination period (Tekinel and Çevik, 1983). These characteristics must be taken into consideration in selecting suitable cultivars and species for salty areas. In this study, the agricultural characteristics and some chemical and technologic properties of five different bread wheat cultivars that is cultivated commonly in the region and in dry conditions have been examined, and the plant ion contents of them have been investigated; and the changes in some minerals like K, Na, Ca, Fe and Zn in plants under salt stress have been observed. MATERIALS AND METHODS All of the annual precipitation in Diyarbakır, where the field experiments are performed, falls between October and May. There is almost no precipitation in summer months, and the relative moisture decreases at a significant level. The average annual precipitation as long years has been 488.1 mm, relative moisture is 53%, and average temperature is 15.8°C.

17
DETERMINATION OF THE SALT TOLERANCE CHARACTERISTICS OF SOME BREAD WHEAT CULTIVARS
Aidin ALP1, Sadettin ÇELİK2, Döne PARLAK2
1University of Dicle, Faculty of Agriculture, Field Crops Department, 21280, Diyarbakir, Turkey 2University of Kahramanmaraş Sutcu Imam, Faculty of Agriculture, Biotechnology Department,
Kahramanmaras, Turkey
Corresponding author email: [email protected] Abstract The study was performed in 2012-2013 and 2013-2014 vegetation seasons in the Dicle University, Agricultural Faculty, Research and Application Field and open greenhouse conditions. In this study, dry plant weight, K
+/Na
+ rates, Ca, Fe,
and Zn contents in green parts of different 5 bread wheat cultivars of foreign origin, and the standard bread wheat cultivar, which is cultivated commonly in Southeastern Anatolia Region, have been compared under salt stress in pots. In addition, the agricultural characteristics like Number of Heading Days, Plant Height, Plant Grain Yield and Thousand Grain Weight were measured both in field and pot experiments. It has been determined in the study that average dry weight decreased at a rate of 43.5%, and the K
+/Na
+rate
decreased at a rate of 50.1% in all wheat cultivars that are cultivated in salinity conditions. The Calcium (Ca) content of all cultivars increased at a significant level with the salt application. While the zinc (Zn) content of the Muzik cultivar decreases in salt stress, the Zn contents of the other cultivars have increased. Key words: bread wheat cultivars, salinity, salt stress, salt tolerance, agricultural characteristics, plant ion content. INTRODUCTION Turkey has the high potential of breeding varieties and wheat production because of its ecological structure and its being the gene center of wheat. The wheat has an important place as the basis of nutrition for people. Performing the production of quality and resistant wheat cultivars by using proper cultivation techniques are extremely important for producers and the industrialists (Aydemir et al., 2003). Yield and quality in wheat are influenced by genocultivar, environment, and genocultivar X environment interaction at a significant degree. In order to obtain high yield in wheat, the genocultivar must have high yield potential and the environmental conditions must be suitable. Adequate and balanced nutrition of the fast-increasing population with the production obtained from the separating and decreasing agricultural fields is becoming difficult day by day. For this reason, determining the genocultivars that have high yield, quality and resistance properties and that adapted to the ecological conditions well are of vital
importance in covering the increasing need of nutrition. Generally various yield and quality criteria are assessed in bread wheat and durum wheat in plant breeding works. However, the improvements in forming resistance against salinity in plants have been limited so far. Some of the important reasons for this are the plant physiology being influenced by salinity in many ways and the tolerability of plants to salt being a quantitative characteristic defined by multiple genes (Borsani et al., 2003). Today, 20% of the agricultural lands on Earth and 50% of the irrigated lands are influenced by salinity (Zhu, 2001). In our country, on the other hand, it is possible to observe salinity at various levels in 4.49% of the agricultural areas (Munsuz et al., 2001). 7.52% of the land in our country (5.8 million ha) is influenced by drainage problem at various levels. Salinity and alkalinity are observed in many areas, mostly in Central Anatolian Region and in alluvial coastal plains due to the disrupted drainage systems (Anonymous, 2006). When the salinity levels of the soil in Turkey are examined according to the regions it is observed that the slightly salty soils (0.15-0.35%, 1.5-3.5 g/l) are
distributed mostly in Middle-South, Mediterranean, Middle-North and South-Eastern agricultural regions. The salinity problem in the Mediterranean and Southeastern agricultural areas, which cover the Ceyhan Plain and GAP Project, stem from the secondary cause, i.e. the salinity due to irrigation. The negative influences of salinity are observed mostly in arid and semi-arid areas where mainly wheat and other cereal products which cover the food requirement of the world. Salinity causes important losses in crops every year. It has been reported that biotic and abiotic (hot, cold, drought and salinity) stress factors cause nearly 25% loss in crops in annual base (Gill et al., 2004). Salinity limiting the plant production at a significant level may occur due to natural factors (less precipitation, high-level vaporization, and the existence of salty rocks) and incorrect agricultural applications (incorrect irrigation methods, irrigation with salty water, the accumulation of chemical residues from industrial products, high-dose mineral fertilization) (Kalaji and Pietkiewicz, 1993). Global warming, which is the source of the biggest environmental problem encountered by the globe, also cause that the seasonal normal values or temperature and precipitation become irregular and lead to inadequate precipitation and high vaporization eventually leading to salinity of the soil. The simplest influence of the salt on plants is leading to the decrease in the intake of the nutrients in the soil by the plant and the plant cannot make use of the water in the soil (Crawley, 1997). The plants cannot make use of the water due to the increasing osmotic potential in salty soils or the plants can only make use of small amounts of water because of the toxic effects of Na
+ and Cl
- which exist in
excessive amounts in the soil (Greenway, 1973; Flowers and Yeo, 1981). The Na, which accumulates in plants in salt stress, inhibits the potassium intake, and the Cl
- especially inhibits
the NO3 intake and disrupts the ion balance of the plants (Siegel et al., 1980; Kirkby and Knight, 1987; Gunes et al., 1994; Inal et al., 1995). Parallel to the disruption in the ion balance in plants that grow in salty conditions, there also appears changes in mineral concentrations of
the plants that may be accepted as significant. The Na and Cl ions are less in the tissues of the plants that are not influenced or influenced relatively less by the salt stress, and the proline amount is more (Flowers et al., 1977). The disruption in the photosynthesis, respiration and similar activities due to the damage in the cells breaking down the cellular functions by excessive amount of salt is another result of the damages of salt (Leopold and Willing, 1984). The Na
+ and K
+ content of the plant are used as
the criteria of resistance to salt in wheat grown in salinity conditions (Ahsan and Khalid, 1999). Potassium has important effects on photosynthesis, enzymatic activity, turgor potential, cell enlargement, aboveground and underground organs growth, stoma mobility, transpiration and protein synthesis (Tisdale et al., 1993; Marschner, 1995). The increase of potassium concentration of the plant rises the resistance to salt (Hsiao and Lauchli, 1986). In addition, it is known that the high K
+/Na
+ rate
in the plant is in direct proportion with the resistance to salt (Gorham, 1990; Ashraf et al., 1997; Sherif et al., 1998). The plants that are resistance to salt during the developmental stages after germination are extremely sensitive to soil salinity germination period (Tekinel and Çevik, 1983). These characteristics must be taken into consideration in selecting suitable cultivars and species for salty areas. In this study, the agricultural characteristics and some chemical and technologic properties of five different bread wheat cultivars that is cultivated commonly in the region and in dry conditions have been examined, and the plant ion contents of them have been investigated; and the changes in some minerals like K, Na, Ca, Fe and Zn in plants under salt stress have been observed. MATERIALS AND METHODS All of the annual precipitation in Diyarbakır, where the field experiments are performed, falls between October and May. There is almost no precipitation in summer months, and the relative moisture decreases at a significant level. The average annual precipitation as long years has been 488.1 mm, relative moisture is 53%, and average temperature is 15.8°C.
18
According to the climate data during vegetation period (2012-2014 growing seasons), the re-lative moisture (63.6%) and total precipitation values (537.8 mm) vary at a significant level when compared with the long years average values, and there have not been any differences among years in terms of average temperature. The field studies were performed in 2012-2013 and 2013-2014 vegetation seasons in the Dicle University, Agricultural Faculty, Research and Application Field. The soils where the study was conducted had the inclination of the land varies among different parts, but usually bet-ween 1-2%, clayish loamy soil, slightly alka-line (pH 7.77), slightly calcic (7.81% CaCO3), total salt level was harmless (0.073%), rich in potassium (0.42%), poor in organic matter (1.67%). the experiment area soils contain 2.14 ppm Mn, 0.19 mg kg-1 B and 0.37 ppm Zn. The improved standard bread wheat cultivar (Adana-99) in the region and 5 bread wheat cultivars of foreign origin (Renan, Tigre, Skerzo, Flamenko and Muzik) were used as the material in the studies. The field experiments were planted in complete randomized blocks design with 3 replications. The distance between the rows was 20 cm, and 450 seeds were sown per m2. Phosphorus was given to all parcels with the 6 kg/da ratio when the seeds were sown, and half of the 12 kg/da pure nitrogen need was given when the seeds were sown, and the remaining half was given during stem elongation period. In the study, which was conducted under open greenhouse conditions, the wheat seeds were sown to the pots which contained 1600 g soil with 6 seeds in one pot. Nitrogen was given in ammonium nitrate form at 200 mg N/kg soil level, phosphorus was given at 100 mg/kg soil level, and potassium was given at 125 mg/kg level to all of the pots as basic fertilizers. In order to create salt stress in the soil, 68 mmol (4 g) NaCl/kg soil was applied. After sodium chlorine application, the soil pH was measured as 7.4; Electrical Conductivity as 2.7 mS/cm. After 10-week development period, two plants in a pot were removed with their roots and Wet Plant Weights were weighed. The plant samples were washed with re-distilled water in the laboratory and dried at 70oC for 48 hours to determine their dry plant weights were grinded.
The dried and grinded plant samples were subjected to wet burning in concentrated HNO3/HClO4 (4:1) mixture, and the Ca, Fe, and Zn were determined with Atomic Absorption Spectrophotometer. The K+ and Na+
in green parts were measured with Flame photometric Method (SOLAAR AA Series, Thermo Electron Corporation) (Kacar, 1972), and the determined values were rated. The agricultural characteristics like “Number of Heading Days, Plant Height (cm), Plant Grain Yield (g) and Thousand Grain Weight (g)” were measured both in the field experiments and under open greenhouse conditions. The data’s obtained in the study were subjected to analysis of variance as used the TARIST Statistical Program, and differences between the averages were evaluated by Duncan Test (Duncan, 1955). RESULTS AND DISCUSSIONS It was determined that the average dry weights of the wheat cultivars grown in salinity conditions decreased at a rate of 43.5%, and the average K+/Na+rate decreased at a rate of 50.1%. Although Adana-99 and Tigre cultivars produced the highest amount of dry matter both in salinity and in non-salinity conditions, the cultivars which showed the highest decrease in terms of dry weight in salt stress was Flamenko (51%) and Skerzo (53%) cultivars. The Tigre and Adana-99 wheat cultivars showed the highest K+/Na+rate in salt stress, and the highest decrease was determined in Flamenko (59%) in K+/Na+
rates in salinity conditions. In Muzik and Tigre cultivars, no significant decreases were determined in terms of K+/Na+rate. When the wheat cultivars were examined in terms of calcium contents, it was observed that the Ca contents in all cultivars increased at a rate of 31% with the salt application. No significant differences were determined in terms of Ca contents between the cultivars grown in salinity conditions. While an increase at a rate of 70% was observed in Ca content of Flamenko cultivar, the increase in Adana-99 cultivar was 10 % (Table 1). The decrease in dry matter amount in Adana-99 (31%), which is the standard cultivar of the region; and the Tigre cultivar (34%) was at low
level when compared with the other cultivars in terms of salt stress. It is possible to claim that Adana-99, Tigre and Skerzo cultivars are more advantageous in terms of potassium and sodium rate and ion balance. It was determined that Adana-99 and Tigre cultivars had advan-tages when compared with the other cultivars in terms of calcium content. Significant differences were observed between the wheat cultivars in terms of iron (Fe) and zinc (Zn) contents of plants. The average iron (Fe) content at a rate of 0.63%, and the average zinc (Zn) content at a rate of 3.0% increased in salinity conditions. The Fe contents of Skerzo and Adana-99 cultivars decreased at a significant level in salt stress; however, the Fe content of Muzik cultivar did not change much in salinity and non-salinity conditions, and the Fe contents of Renan, Tigre and Flamenko cultivars increased in salt stress. The Zn content of Muzik cultivar decreased in salt stress, while it increased in other cultivars. The increases in Ca contents depending on salt application in wheat cultivars may be explained with the calcium having an important role in excessive Na existence for carrying the K selectively to enable the plant durable against salt; and therefore, Ca intake also increases
parallel to the increasing Na intake in salty conditions. Kaiser et al. (1983), associated the decrease in growth with the decrease in nutrient and water intake; Wang et al. (2010) associated the harm-ful effects of salinity with water stress, ion toxicity and ion imbalance (inhibitions in K+ intake) or with the combination of these fac-tors. In addition, Wang et al. (2010), claimed that the decrease in photosynthesis was related with the decrease in the stoma conductivity. It was observed in NaCl (-) conditions that the plant grain yield of bread wheat samples varied between 2.60-3.44 g, and the highest plant grain yield was determined in Flamenko and Tigre cultivars, and the lowest plant grain yield was determined in Adana-99 sample, which is the cultivar grown commonly in the area. The plant grain yield of wheat cultivars grown in pots under salt stress vary between 1.67-2.64 g in salinity conditions. Average plant grain yield of wheat cultivars grown in salinity conditions reduced by approximately 0.806 g (26.9%). The most reduction rate was observed about 1.19 g (41.6%) in Skerzo cultivar, 1.15 g (40.3%) in Muzik cultivar, the lowest reduction rate was observed in Adana-99 cultivar (Table 2).
Table 1. Means and groups formed among bread wheat cultivars regarding plant dry weights, K+/Na+ ratio and Ca
contents in NaCl (-) and NaCl (+) conditions Cultivars
Plant Dry Weight (g/plant) K+/Na+ ratio Ca (g/kg) NaCl (-) NaCl (+) Average NaCl (-) NaCl(+) Average NaCl (-) NaCl (+) Average
Renan 0.599 AB 0.318 CD 0.459 BC 1.781 C 0.880 C 1.330 C 3.447 B 4.427 3.937 AB Tigre 0.625 AB 0.412 AB 0.519 AB 2.938 A 1.549 A 2.244 A 3.688 AB 4.298 3.993 AB Flamenko 0.517 C 0.253 D 0.385 D 1.874 C 0.765 C 1.319 C 2.722 C 4.629 3.675 B Skerzo 0.570 BC 0.263 D 0.416 CD 2.244 B 1.064 BC 1.654 BC 3.578 B 4.809 4.194 AB Muzik 0.646 A 0.348 BC 0.497 AB 1.562 C 0.943 C 1.253 C 3.101 BC 4.400 3.750 B Adana-99 0.643 A 0.440 A 0.542 A 2.652 A 1.302 AB 1.977 AB 4.248 A 4.698 4.473 A Average 0.600 A 0.339 B 2.175 A 1.084 B 3.464 B 4.543 A LSD 0.092 0.065 0.589 0.417 1.010 0.714 CV (%) 32.40 45.41 20.51
*The differences between the means shown by the same letter are not significant at the 0.05 level according to LSD test.
Table 2. Means and groups formed among bread wheat cultivars regarding Fe, Zn contents and Plant Grain Yield in NaCl (-) and NaCl (+) conditions
Cultivars
Fe (mg/kg) Zn (mg/kg) Plant Grain Yield (g) NaCl (-) NaCl (+) Ort NaCl (-) NaCl(+) Ort NaCl (-) NaCl(+) Av.
Renan 55.020 C 58.400 AB 56.710 BC 11.718 B 12.112 C 11.915 D 2.88 2.12 BC 2.50 Tigre 56.537 BC 59.599 A 58.068 ABC 13.770 A 14.898 AB 14.334 AB 3.30 2.64 A 2.97 Flamenko 57.979 B 59.676 A 58.828 AB 13.161 AB 13.513 BC 13.337 BC 3.44 2.49 AB 2.96 Skerzo 61.915 A 58.659 A 60.287 A 14.425 A 14.680 AB 14.553 AB 2.86 1.67 C 2.26 Muzik 55.075 C 55.607 B 55.341 C 13.257 AB 12.254 C 12.756 CD 2.85 1.70 C 2.27 Adana-99 61.281 A 58.083 AB 59.682 A 14.449 A 15.748 A 15.099 A 2.60 2.47 AB 2.54 Average 57.968 A 58.337 A 13.463 A 13.867 A 2.988 A 2.182 B LSD 3.926 2.776 1.617 1.143 1.295 0.915 CV (%) 5.01 11.09 31.62
*The differences between the means shown by the same letter are not significant at the 0.05 level according to LSD test.

19
According to the climate data during vegetation period (2012-2014 growing seasons), the re-lative moisture (63.6%) and total precipitation values (537.8 mm) vary at a significant level when compared with the long years average values, and there have not been any differences among years in terms of average temperature. The field studies were performed in 2012-2013 and 2013-2014 vegetation seasons in the Dicle University, Agricultural Faculty, Research and Application Field. The soils where the study was conducted had the inclination of the land varies among different parts, but usually bet-ween 1-2%, clayish loamy soil, slightly alka-line (pH 7.77), slightly calcic (7.81% CaCO3), total salt level was harmless (0.073%), rich in potassium (0.42%), poor in organic matter (1.67%). the experiment area soils contain 2.14 ppm Mn, 0.19 mg kg-1 B and 0.37 ppm Zn. The improved standard bread wheat cultivar (Adana-99) in the region and 5 bread wheat cultivars of foreign origin (Renan, Tigre, Skerzo, Flamenko and Muzik) were used as the material in the studies. The field experiments were planted in complete randomized blocks design with 3 replications. The distance between the rows was 20 cm, and 450 seeds were sown per m2. Phosphorus was given to all parcels with the 6 kg/da ratio when the seeds were sown, and half of the 12 kg/da pure nitrogen need was given when the seeds were sown, and the remaining half was given during stem elongation period. In the study, which was conducted under open greenhouse conditions, the wheat seeds were sown to the pots which contained 1600 g soil with 6 seeds in one pot. Nitrogen was given in ammonium nitrate form at 200 mg N/kg soil level, phosphorus was given at 100 mg/kg soil level, and potassium was given at 125 mg/kg level to all of the pots as basic fertilizers. In order to create salt stress in the soil, 68 mmol (4 g) NaCl/kg soil was applied. After sodium chlorine application, the soil pH was measured as 7.4; Electrical Conductivity as 2.7 mS/cm. After 10-week development period, two plants in a pot were removed with their roots and Wet Plant Weights were weighed. The plant samples were washed with re-distilled water in the laboratory and dried at 70oC for 48 hours to determine their dry plant weights were grinded.
The dried and grinded plant samples were subjected to wet burning in concentrated HNO3/HClO4 (4:1) mixture, and the Ca, Fe, and Zn were determined with Atomic Absorption Spectrophotometer. The K+ and Na+
in green parts were measured with Flame photometric Method (SOLAAR AA Series, Thermo Electron Corporation) (Kacar, 1972), and the determined values were rated. The agricultural characteristics like “Number of Heading Days, Plant Height (cm), Plant Grain Yield (g) and Thousand Grain Weight (g)” were measured both in the field experiments and under open greenhouse conditions. The data’s obtained in the study were subjected to analysis of variance as used the TARIST Statistical Program, and differences between the averages were evaluated by Duncan Test (Duncan, 1955). RESULTS AND DISCUSSIONS It was determined that the average dry weights of the wheat cultivars grown in salinity conditions decreased at a rate of 43.5%, and the average K+/Na+rate decreased at a rate of 50.1%. Although Adana-99 and Tigre cultivars produced the highest amount of dry matter both in salinity and in non-salinity conditions, the cultivars which showed the highest decrease in terms of dry weight in salt stress was Flamenko (51%) and Skerzo (53%) cultivars. The Tigre and Adana-99 wheat cultivars showed the highest K+/Na+rate in salt stress, and the highest decrease was determined in Flamenko (59%) in K+/Na+
rates in salinity conditions. In Muzik and Tigre cultivars, no significant decreases were determined in terms of K+/Na+rate. When the wheat cultivars were examined in terms of calcium contents, it was observed that the Ca contents in all cultivars increased at a rate of 31% with the salt application. No significant differences were determined in terms of Ca contents between the cultivars grown in salinity conditions. While an increase at a rate of 70% was observed in Ca content of Flamenko cultivar, the increase in Adana-99 cultivar was 10 % (Table 1). The decrease in dry matter amount in Adana-99 (31%), which is the standard cultivar of the region; and the Tigre cultivar (34%) was at low
level when compared with the other cultivars in terms of salt stress. It is possible to claim that Adana-99, Tigre and Skerzo cultivars are more advantageous in terms of potassium and sodium rate and ion balance. It was determined that Adana-99 and Tigre cultivars had advan-tages when compared with the other cultivars in terms of calcium content. Significant differences were observed between the wheat cultivars in terms of iron (Fe) and zinc (Zn) contents of plants. The average iron (Fe) content at a rate of 0.63%, and the average zinc (Zn) content at a rate of 3.0% increased in salinity conditions. The Fe contents of Skerzo and Adana-99 cultivars decreased at a significant level in salt stress; however, the Fe content of Muzik cultivar did not change much in salinity and non-salinity conditions, and the Fe contents of Renan, Tigre and Flamenko cultivars increased in salt stress. The Zn content of Muzik cultivar decreased in salt stress, while it increased in other cultivars. The increases in Ca contents depending on salt application in wheat cultivars may be explained with the calcium having an important role in excessive Na existence for carrying the K selectively to enable the plant durable against salt; and therefore, Ca intake also increases
parallel to the increasing Na intake in salty conditions. Kaiser et al. (1983), associated the decrease in growth with the decrease in nutrient and water intake; Wang et al. (2010) associated the harm-ful effects of salinity with water stress, ion toxicity and ion imbalance (inhibitions in K+ intake) or with the combination of these fac-tors. In addition, Wang et al. (2010), claimed that the decrease in photosynthesis was related with the decrease in the stoma conductivity. It was observed in NaCl (-) conditions that the plant grain yield of bread wheat samples varied between 2.60-3.44 g, and the highest plant grain yield was determined in Flamenko and Tigre cultivars, and the lowest plant grain yield was determined in Adana-99 sample, which is the cultivar grown commonly in the area. The plant grain yield of wheat cultivars grown in pots under salt stress vary between 1.67-2.64 g in salinity conditions. Average plant grain yield of wheat cultivars grown in salinity conditions reduced by approximately 0.806 g (26.9%). The most reduction rate was observed about 1.19 g (41.6%) in Skerzo cultivar, 1.15 g (40.3%) in Muzik cultivar, the lowest reduction rate was observed in Adana-99 cultivar (Table 2).
Table 1. Means and groups formed among bread wheat cultivars regarding plant dry weights, K+/Na+ ratio and Ca
contents in NaCl (-) and NaCl (+) conditions Cultivars
Plant Dry Weight (g/plant) K+/Na+ ratio Ca (g/kg) NaCl (-) NaCl (+) Average NaCl (-) NaCl(+) Average NaCl (-) NaCl (+) Average
Renan 0.599 AB 0.318 CD 0.459 BC 1.781 C 0.880 C 1.330 C 3.447 B 4.427 3.937 AB Tigre 0.625 AB 0.412 AB 0.519 AB 2.938 A 1.549 A 2.244 A 3.688 AB 4.298 3.993 AB Flamenko 0.517 C 0.253 D 0.385 D 1.874 C 0.765 C 1.319 C 2.722 C 4.629 3.675 B Skerzo 0.570 BC 0.263 D 0.416 CD 2.244 B 1.064 BC 1.654 BC 3.578 B 4.809 4.194 AB Muzik 0.646 A 0.348 BC 0.497 AB 1.562 C 0.943 C 1.253 C 3.101 BC 4.400 3.750 B Adana-99 0.643 A 0.440 A 0.542 A 2.652 A 1.302 AB 1.977 AB 4.248 A 4.698 4.473 A Average 0.600 A 0.339 B 2.175 A 1.084 B 3.464 B 4.543 A LSD 0.092 0.065 0.589 0.417 1.010 0.714 CV (%) 32.40 45.41 20.51
*The differences between the means shown by the same letter are not significant at the 0.05 level according to LSD test.
Table 2. Means and groups formed among bread wheat cultivars regarding Fe, Zn contents and Plant Grain Yield in NaCl (-) and NaCl (+) conditions
Cultivars
Fe (mg/kg) Zn (mg/kg) Plant Grain Yield (g) NaCl (-) NaCl (+) Ort NaCl (-) NaCl(+) Ort NaCl (-) NaCl(+) Av.
Renan 55.020 C 58.400 AB 56.710 BC 11.718 B 12.112 C 11.915 D 2.88 2.12 BC 2.50 Tigre 56.537 BC 59.599 A 58.068 ABC 13.770 A 14.898 AB 14.334 AB 3.30 2.64 A 2.97 Flamenko 57.979 B 59.676 A 58.828 AB 13.161 AB 13.513 BC 13.337 BC 3.44 2.49 AB 2.96 Skerzo 61.915 A 58.659 A 60.287 A 14.425 A 14.680 AB 14.553 AB 2.86 1.67 C 2.26 Muzik 55.075 C 55.607 B 55.341 C 13.257 AB 12.254 C 12.756 CD 2.85 1.70 C 2.27 Adana-99 61.281 A 58.083 AB 59.682 A 14.449 A 15.748 A 15.099 A 2.60 2.47 AB 2.54 Average 57.968 A 58.337 A 13.463 A 13.867 A 2.988 A 2.182 B LSD 3.926 2.776 1.617 1.143 1.295 0.915 CV (%) 5.01 11.09 31.62
*The differences between the means shown by the same letter are not significant at the 0.05 level according to LSD test.

20
While there were significant differences between the cultivars at a rate of 1%, in terms of heading time it was observed that the heading time of the bread wheats vary between 143-158 days in non-saline field conditions. The latest heading was observed in Renan, Skerzo and Muzik cultivars, and the earliest heading time was observed in Tigre cultivar in non-saline conditions. The heading time of wheat cultivars grown in pots under salt stress vary between 128-136.3 days in salinity conditions. Average heading time of wheat cultivars grown in salinity conditions reduced by approximately 20 days (13%). This reduction rate was about 12 days (7.86%) in Tigre cultivar, 10 days (6.55 %) in Adana-99 cultivar. It was observed that the Thousand Kernels Weight of the bread wheat samples vary between 28.37-60.52 g in NaCl (-) conditions. The highest Thousand Kernels Weight was observed in Flamenko cultivar and the lowest Thousand Kernels Weight was observed in Muzik wheat sample. The thousand kernels weight of wheat cultivars grown in pots under
salt stress vary between 29.27-35.40 g in salinity conditions. Average thousand kernels weight of wheat cultivars grown in salinity conditions reduced by approximately 8.33 g (20%). The most reduction rate was determined about 25.12 g (41.5%) in Flamenko cultivar, but the lowest weight loss with 3.57 g (10.4%) in Adana-99 cultivar. A non-statistically signifi-cant increase was observed in Muzik wheat cultivar. It was observed that the plant heights of the bread wheat cultivars vary between 66.86-93.80 cm, and the highest plant height was observed in Adana-99, and the lowest plant height was determined in Muzik cultivar in NaCl (-) conditions. The plant heights of wheat cultivars grown in pots under salt stress vary between 48.87-67.25 cm in salinity conditions. Average plant height of wheat cultivars grown in salinity conditions reduced by approximately 22.06 cm (27.2%). The most reduction rate was observed about 26.8 cm (28.6%) in Adana-99 cultivar, 26.7 cm (31.2%) in Tigre cultivar (Table 3).
Table 3. Means and groups formed among bread wheat cultivars regarding agricultural properties
in NaCl (-) and NaCl (+) conditions Cultivars
Heading Time (Day) Thousand Kernel Weight (g) Plant Height (cm)
NaCl (-) NaCl (+) Av. NaCl (-) NaCl (+) Av. NaCl (-) NaCl (+) Av. Renan 158.00 A 128.0 B 143.00 AB 41.67 B 34.58 38.12 AB 90.15 AB 67.25 A 78.70 A Tigre 143.00 D 131.3 AB 137.17 C 41.07 B 33.95 37.51 AB 85.46 B 58.73 B 72.10 B Flamenko 153.66 B 134.0 AB 143.83 AB 60.52 A 35.40 47.96 A 71.76 D 52.20 C 61.98 C Skerzo 157.66 A 132.3 AB 145.00 AB 43.35 AB 35.37 39.36 AB 78.43 C 60.06 B 69.25 B Muzik 156.66 A 136.0 A 146.33 A 28.38 B 29.27 28.82 B 66.86 D 48.87 C 57.87 C Adana-99 146.33 C 136.3 A 141.33 BC 34.30 B 30.73 32.52 B 93.80 A 66.97 A 80.38 A Average 152.55 A 133.00 B 41.55 A 33.22 B 81.080 A 59.013 B LSD 6.343 4.485 18.822 13.309 5.832 4.124 CV(%) 07.97 33.29 20.54
*The differences between the means shown by the same letter are not significant at the 0.05 level according to LSD test.
Adana-99 cultivar, which is grown commonly in the area, showed high plant height and high Grain Yield per Unit Area, and these charac-teristics are the indicator for its being preferred by producers in the region in further years. The results of this study revealed that the assessment based merely on grain yield is inadequate. It is observed that Adana-99, Tigre, Flamenko and partly Skerzo cultivars may be preferred in terms of the grain yield values in both NaCl (-) and NaCl (+) conditions.
CONCLUSIONS In conclusion, salt is unwashed and accu-mulate in upper soil. This situation restricts the development of plant roots, causes the formation of abiotic stress in plants. Water intake and transpiration decreased. There are significant differences in terms of growing and mineral matter content of wheat plants in saline conditions. Besides being not used as much water by plants, it can be said that plant growth can also be limited by ion uptake, and particularly by impairments in ion balance.
REFERENCES
Ahsan M. and M. Khalid, 1999. Effects of selecting for
K/Na and grain yield on salinity tolerance in spring wheat. Pakistan Journal of Biological Sciences. 2: p. 679-681.
Anonymous, 2006. Turkey soil water resources and desertification. http:// www. khgm.gov.tr. htm.
Ashraf M., Aasiya K. and Khanum A., 1997. Relationship between ion accumulation and growth in two spring wheat lines differing in salt tolerance at different growth stages. Journal of Agronomy and Crop Science 178: p. 39-51.
Aydemir T., Dönmez Ö., Yılmaz K., Sezer N., 2003. Evaluation of registered durum wheat varieties in terms of yield and quality Turkey. 5th Field Crops Congress. October 13-17, 2003. Diyarbakır. Volume I. p. 172-179.
Borsani O., Valpuesta V. and Botella M.A., 2003. Developing salt tolerant plants in a new century: a molecular biology approach. Plant Cell, Tissue and Organ Culture, 73; p. 101-115.
Crawley M.J., 1997. Life History and Environment. In: Plant Ecology. 2nd ed. (Ed. M.J. Crawley). Blackwell, U.K. p. 73-131.
Duncan D.B., (1955). Multiple range and multiple F tests. Biometrics. 11: p. 1-42.
Flowers T.J., Troke P.F. and Yeo R., 1977. The mechanism of salt tolerance in halophytes. Ann. Rev. Plant Physiol. 28: p. 89- 121.
Flowers T.J. and Yeo A.R., 1981. Variability in the resistance of sodium chloride salinity within rice (Oryza sativa L.) varieties. New Phytol., 88, p. 363-373.
Gill B.S., Appels R., Botha-Oberholster A-M., Buell C.R., Bennetzen J.L., Chalhoub B., Chumley F., Dvorak J., Iwanaga M., Keller B., Li W., McCombie W.R., Ogihara Y., Quetier F. and Sasaki T., 2004. A workshop report on wheat genome sequencing: International genome research on wheat consortium. Genetics, 168; p. 1087-1096.
Gorham J., 1990. Salt tolerance in the Triticeae: Ion discrimination in rye and triticale. Journal of Experimental Botany 41: p. 609-614.
Greenway H., 1973. Salinity, plant growth, and meta-bolism. J. Aust. Inst. Agric. Sci. 39, 24D34.
Guneş A., Post W.H.K., Kirkby E.A. and Aktaş M., 1994. Influence of partial replacement on nitrate by amino acid nitrogen or urea in the nutrient medium on nitrate accumulation in NFT grown winter lettuce. Journal of Plant Nutrition 17, p. 1929-1938, 1994.
Hsiao T.C. and Läuchli A., 1986. Role of Potassium in Plant-Water Relations. In: Advances in Plant Nutrition, Tinker, B. and Läuchli, A. (eds.), Vol. 2. Praeger Scientific, New York, p. 281-312.
Inal A., Güneş A., ve Aktaş M., 1995. Effects of chloride and partial substitution of reduced forms of nitrogen for nitrate in nutrient solution of the nitrate, total nitrogen and chlorine contents of onion. Journal of Plant Nutrition, 18, p. 2219- 2227.
Kacar B., 1972. Plant and Soil Chemical Analysis-II. Plant Analysis. Ankara Univ. Agriculture Fac., Publication No: 453. Ankara.
Kaiser W.M., Weber H. Sauer M., 1983. Pflanzenphysiol. Bd. 1983, 113, p. 15–27.
Kalaji M.H. and Pietkiewicz S., 1993. Salinity effects on plant growth and other physiological processes. Acta Physiologiae Plantarum, 15(2); p. 89-124.
Kirkby E.A. and Knight A.H., 1987. The influence of the level of nitrate nutrition on ion uptake and assimilation, organic acid accumulation and cation anion balance in whole tomato plants. Plant Physiology 60: p. 349-353,
Leopold A.C. and Willing R.P., 1984. Evidence of Toxicity Effects of Salt on Membranes. In: Salinity Tolerance in Plants, (eds. R.C. Staples and G.H. Toenniessen), p. 67-76. John Wiley and Sons, New York.
Marschner H., 1995. Mineral Nutrient of Higher Plant. 2nd ed. London Acedemic, 889 pp.
Munsuz N., Çaycı G. and Sözüdoğru S.O., 2001. Soil Improvement ve Regulators. (Reclamation of saline and alkaline soils). Univercity of Ankara, Faculty of Agriculture, Publication No: 1518. Ankara.
Sherif M.A., El-Beshbeshy T.R. and Richter C., 1998. Response of some Egyptian varieties of wheat (Triticum aestivum L.) to salt stress through potassium application. Bulletin of Faculty of Agriculture, University of Cairo 49: p. 129-151.
Siegel S.M., Siegel B.Z., Massey J., Lahne P. and Chen J., 1980. Growth of Corn in Saline Waters. Physiol. Plant 50: p. 71-73.
Tekinel O. ve Çevik B., 1983. Water Management (Irrigation and Drainage). University of Çukurova, Faculty of Agriculture, Publication No: 166.
Tisdale S.I., Nelson W.L. and Beaton J.D., 1993. Soil Fertility and Fertilizers. Macmillan Pub. Co. New York, p. 249-291.
Wang G.P., Zhang X.Y., Li F., Luo Y., Wang W., 2010. Overaccumulation of glycinebetaine enhances tolerance to drought and heat stres in wheat leaves in the protection of photosynthesis. Photosynthetica. 48, p. 117-126.
Zhu J.K., 2001. Plant salt tolerance. Trends in Plant Science, 6(2); 66-71. Winicov, I. 1996. Characterization of rice (Oryza sativa L.) plants regenerated from salt-tolerant cell lines. Plant Science, 113; p. 105-111.

21
While there were significant differences between the cultivars at a rate of 1%, in terms of heading time it was observed that the heading time of the bread wheats vary between 143-158 days in non-saline field conditions. The latest heading was observed in Renan, Skerzo and Muzik cultivars, and the earliest heading time was observed in Tigre cultivar in non-saline conditions. The heading time of wheat cultivars grown in pots under salt stress vary between 128-136.3 days in salinity conditions. Average heading time of wheat cultivars grown in salinity conditions reduced by approximately 20 days (13%). This reduction rate was about 12 days (7.86%) in Tigre cultivar, 10 days (6.55 %) in Adana-99 cultivar. It was observed that the Thousand Kernels Weight of the bread wheat samples vary between 28.37-60.52 g in NaCl (-) conditions. The highest Thousand Kernels Weight was observed in Flamenko cultivar and the lowest Thousand Kernels Weight was observed in Muzik wheat sample. The thousand kernels weight of wheat cultivars grown in pots under
salt stress vary between 29.27-35.40 g in salinity conditions. Average thousand kernels weight of wheat cultivars grown in salinity conditions reduced by approximately 8.33 g (20%). The most reduction rate was determined about 25.12 g (41.5%) in Flamenko cultivar, but the lowest weight loss with 3.57 g (10.4%) in Adana-99 cultivar. A non-statistically signifi-cant increase was observed in Muzik wheat cultivar. It was observed that the plant heights of the bread wheat cultivars vary between 66.86-93.80 cm, and the highest plant height was observed in Adana-99, and the lowest plant height was determined in Muzik cultivar in NaCl (-) conditions. The plant heights of wheat cultivars grown in pots under salt stress vary between 48.87-67.25 cm in salinity conditions. Average plant height of wheat cultivars grown in salinity conditions reduced by approximately 22.06 cm (27.2%). The most reduction rate was observed about 26.8 cm (28.6%) in Adana-99 cultivar, 26.7 cm (31.2%) in Tigre cultivar (Table 3).
Table 3. Means and groups formed among bread wheat cultivars regarding agricultural properties
in NaCl (-) and NaCl (+) conditions Cultivars
Heading Time (Day) Thousand Kernel Weight (g) Plant Height (cm)
NaCl (-) NaCl (+) Av. NaCl (-) NaCl (+) Av. NaCl (-) NaCl (+) Av. Renan 158.00 A 128.0 B 143.00 AB 41.67 B 34.58 38.12 AB 90.15 AB 67.25 A 78.70 A Tigre 143.00 D 131.3 AB 137.17 C 41.07 B 33.95 37.51 AB 85.46 B 58.73 B 72.10 B Flamenko 153.66 B 134.0 AB 143.83 AB 60.52 A 35.40 47.96 A 71.76 D 52.20 C 61.98 C Skerzo 157.66 A 132.3 AB 145.00 AB 43.35 AB 35.37 39.36 AB 78.43 C 60.06 B 69.25 B Muzik 156.66 A 136.0 A 146.33 A 28.38 B 29.27 28.82 B 66.86 D 48.87 C 57.87 C Adana-99 146.33 C 136.3 A 141.33 BC 34.30 B 30.73 32.52 B 93.80 A 66.97 A 80.38 A Average 152.55 A 133.00 B 41.55 A 33.22 B 81.080 A 59.013 B LSD 6.343 4.485 18.822 13.309 5.832 4.124 CV(%) 07.97 33.29 20.54
*The differences between the means shown by the same letter are not significant at the 0.05 level according to LSD test.
Adana-99 cultivar, which is grown commonly in the area, showed high plant height and high Grain Yield per Unit Area, and these charac-teristics are the indicator for its being preferred by producers in the region in further years. The results of this study revealed that the assessment based merely on grain yield is inadequate. It is observed that Adana-99, Tigre, Flamenko and partly Skerzo cultivars may be preferred in terms of the grain yield values in both NaCl (-) and NaCl (+) conditions.
CONCLUSIONS In conclusion, salt is unwashed and accu-mulate in upper soil. This situation restricts the development of plant roots, causes the formation of abiotic stress in plants. Water intake and transpiration decreased. There are significant differences in terms of growing and mineral matter content of wheat plants in saline conditions. Besides being not used as much water by plants, it can be said that plant growth can also be limited by ion uptake, and particularly by impairments in ion balance.
REFERENCES
Ahsan M. and M. Khalid, 1999. Effects of selecting for
K/Na and grain yield on salinity tolerance in spring wheat. Pakistan Journal of Biological Sciences. 2: p. 679-681.
Anonymous, 2006. Turkey soil water resources and desertification. http:// www. khgm.gov.tr. htm.
Ashraf M., Aasiya K. and Khanum A., 1997. Relationship between ion accumulation and growth in two spring wheat lines differing in salt tolerance at different growth stages. Journal of Agronomy and Crop Science 178: p. 39-51.
Aydemir T., Dönmez Ö., Yılmaz K., Sezer N., 2003. Evaluation of registered durum wheat varieties in terms of yield and quality Turkey. 5th Field Crops Congress. October 13-17, 2003. Diyarbakır. Volume I. p. 172-179.
Borsani O., Valpuesta V. and Botella M.A., 2003. Developing salt tolerant plants in a new century: a molecular biology approach. Plant Cell, Tissue and Organ Culture, 73; p. 101-115.
Crawley M.J., 1997. Life History and Environment. In: Plant Ecology. 2nd ed. (Ed. M.J. Crawley). Blackwell, U.K. p. 73-131.
Duncan D.B., (1955). Multiple range and multiple F tests. Biometrics. 11: p. 1-42.
Flowers T.J., Troke P.F. and Yeo R., 1977. The mechanism of salt tolerance in halophytes. Ann. Rev. Plant Physiol. 28: p. 89- 121.
Flowers T.J. and Yeo A.R., 1981. Variability in the resistance of sodium chloride salinity within rice (Oryza sativa L.) varieties. New Phytol., 88, p. 363-373.
Gill B.S., Appels R., Botha-Oberholster A-M., Buell C.R., Bennetzen J.L., Chalhoub B., Chumley F., Dvorak J., Iwanaga M., Keller B., Li W., McCombie W.R., Ogihara Y., Quetier F. and Sasaki T., 2004. A workshop report on wheat genome sequencing: International genome research on wheat consortium. Genetics, 168; p. 1087-1096.
Gorham J., 1990. Salt tolerance in the Triticeae: Ion discrimination in rye and triticale. Journal of Experimental Botany 41: p. 609-614.
Greenway H., 1973. Salinity, plant growth, and meta-bolism. J. Aust. Inst. Agric. Sci. 39, 24D34.
Guneş A., Post W.H.K., Kirkby E.A. and Aktaş M., 1994. Influence of partial replacement on nitrate by amino acid nitrogen or urea in the nutrient medium on nitrate accumulation in NFT grown winter lettuce. Journal of Plant Nutrition 17, p. 1929-1938, 1994.
Hsiao T.C. and Läuchli A., 1986. Role of Potassium in Plant-Water Relations. In: Advances in Plant Nutrition, Tinker, B. and Läuchli, A. (eds.), Vol. 2. Praeger Scientific, New York, p. 281-312.
Inal A., Güneş A., ve Aktaş M., 1995. Effects of chloride and partial substitution of reduced forms of nitrogen for nitrate in nutrient solution of the nitrate, total nitrogen and chlorine contents of onion. Journal of Plant Nutrition, 18, p. 2219- 2227.
Kacar B., 1972. Plant and Soil Chemical Analysis-II. Plant Analysis. Ankara Univ. Agriculture Fac., Publication No: 453. Ankara.
Kaiser W.M., Weber H. Sauer M., 1983. Pflanzenphysiol. Bd. 1983, 113, p. 15–27.
Kalaji M.H. and Pietkiewicz S., 1993. Salinity effects on plant growth and other physiological processes. Acta Physiologiae Plantarum, 15(2); p. 89-124.
Kirkby E.A. and Knight A.H., 1987. The influence of the level of nitrate nutrition on ion uptake and assimilation, organic acid accumulation and cation anion balance in whole tomato plants. Plant Physiology 60: p. 349-353,
Leopold A.C. and Willing R.P., 1984. Evidence of Toxicity Effects of Salt on Membranes. In: Salinity Tolerance in Plants, (eds. R.C. Staples and G.H. Toenniessen), p. 67-76. John Wiley and Sons, New York.
Marschner H., 1995. Mineral Nutrient of Higher Plant. 2nd ed. London Acedemic, 889 pp.
Munsuz N., Çaycı G. and Sözüdoğru S.O., 2001. Soil Improvement ve Regulators. (Reclamation of saline and alkaline soils). Univercity of Ankara, Faculty of Agriculture, Publication No: 1518. Ankara.
Sherif M.A., El-Beshbeshy T.R. and Richter C., 1998. Response of some Egyptian varieties of wheat (Triticum aestivum L.) to salt stress through potassium application. Bulletin of Faculty of Agriculture, University of Cairo 49: p. 129-151.
Siegel S.M., Siegel B.Z., Massey J., Lahne P. and Chen J., 1980. Growth of Corn in Saline Waters. Physiol. Plant 50: p. 71-73.
Tekinel O. ve Çevik B., 1983. Water Management (Irrigation and Drainage). University of Çukurova, Faculty of Agriculture, Publication No: 166.
Tisdale S.I., Nelson W.L. and Beaton J.D., 1993. Soil Fertility and Fertilizers. Macmillan Pub. Co. New York, p. 249-291.
Wang G.P., Zhang X.Y., Li F., Luo Y., Wang W., 2010. Overaccumulation of glycinebetaine enhances tolerance to drought and heat stres in wheat leaves in the protection of photosynthesis. Photosynthetica. 48, p. 117-126.
Zhu J.K., 2001. Plant salt tolerance. Trends in Plant Science, 6(2); 66-71. Winicov, I. 1996. Characterization of rice (Oryza sativa L.) plants regenerated from salt-tolerant cell lines. Plant Science, 113; p. 105-111.
22
THE EFFECT OF DIFFERENT FIBRE AND STARCH DIETARY LEVELS ON HAEMATOLOGY OF POST-WEANING RABBITS
Rosalie BĂLĂCEANU1, Liliana STOICA1, Marian GHIŢĂ1, Laurenț OGNEAN2,
Ionuţ NEGOIŢĂ1, Nicolae DOJANĂ1
1University of Agronomic Sciences and Veterinary Medicine of Bucharest,
Faculty of Veterinary Medicine, 105 Independentei Street, 050097, Bucharest, Romania 2University of Agricultural Sciences and Veterinary Medicine of Cluj-Napoca,
3-5 Mănăștur Street, 400372, Cluj-Napoca, Romania
Corresponding author email: [email protected]
Abstract
The objective of this study was to evaluate the effect of different fibre and starch dietary levels on the blood parameters of post-weaning rabbits. A control group was fed a post-weaning, growing rabbit diet containing 138 g/kg dry matter (DM) crude fibre and 168 g/kg DM starch. Three rabbit groups were fed diets with 147, 156, or 164 g/kg of DM crude fibre, and three groups were fed diets having 190, 223, or 247 g/kg DM starch. The experiment started with six week-old rabbits and lasted 28 days. Blood glucose levels were, on average, 7% lower in the groups fed fibre-enriched diets (P = 0.048) and 10% higher in the rabbit groups fed starch-enriched diets than in the control. The higher the dietary level for fibre and starch diets, the greater the deviation from normal in glucose levels. Total protein levels were not significantly modified, excepting a 13% increase in the globulin fraction of fibre and starch-diet fed groups and a subsequent decrease (8.3% and, respectively 13.8%) in the albumin/globulin ratio, but no differences according to the level of fibre or starch. Compared to the control, blood urea was 17% lower and 10% higher in rabbits fed the high crude fibre high starch diets respectively. Alanine aminotransferase, aspartate aminotransferase, and alkaline phosphatase showed relatively steady activity regardless of diet. The fibre diet levels were positively correlated with protein (r = 0.87) and HDL cholesterol (r = 0.78), but negatively correlated with glucose (r = −0.72), urea (r = −0.91) and triglycerides (r = −0.78). Contrastingly, dietary starch levels correlated positively with triglycerides (r = 0.92) and LDL cholesterol (r = 0.86). A negligible relationship was found between cholesterol and fibre (r = 0.15) or starch (r = 0.01) enriched diets. Key words: blood biochemistry, diet, fiber, growing rabbit, starch.
INTRODUCTION In rabbit metabolism and nutrition research, diets with differing structures or chemical compositions are often tested. Most dietary studies aim to determine the effects of different levels of protein, starch or fibre on metabolism or nutrition physiology (Eiben et al., 2008; El-Tahan et al., 2012; Wang et al., 2012). The structure and composition of these diets, which sometimes deviate in high degree from the standard diet, could influence blood parameters and subsequently, the physiological status and welfare of individuals (Atansuyi et al., 2012; Ewuola et al., 2012). The aim of this study was to reveal the extent to which different starch or fibre dietary levels could influence the haematology of growing rabbits.
MATERIALS AND METHODS Animals and experimental design Research was performed on 6-week old New Zealand x Californian (males and females) weaned (at 28 days old) rabbits with an average initial weight of 1.038 ± 54 g. Two weeks later, the young rabbits were equally divided into seven groups: a control and six experimental groups (10 rabbits in each one). Rabbits were housed in individual cages (250 × 400 × 300 mm), and maintained at tempe-ratures ranging from 22°C to 26°C. Water and pelleted feeds were provided ad libitum. A light cycle of 12 h from 07:00 h to 19:00.h was maintained throughout the trial. Diets were calculated according to weaned rabbit nutrient requirements described by De
AgroLife Scientific Journal - Volume 6, Number 2, 2017ISSN 2285-5718; ISSN CD-ROM 2285-5726; ISSN ONLINE 2286-0126; ISSN-L 2285-5718 Blas and Mateos (2010): a control diet and
three diets each with increasing crude fibre (FL1, FL2, FL3) and starch (SL1, SL2, SL3) levels respectively (Table 1).
Table 1. Calculated chemical composition of control and experimental post-weaning rabbit group diets
Chemical composition Control Fibre enriched diets Starch enriched diets FL1 FL2 FL3 SL1 SL2 SL3
Dry matter (DM, g/kg) 886 883 882 878 885 892 889 Crude protein (g/kg DM) 127 138 136 135 128 127 119 Crude fibre (g/kg DM) 138 147 156 164 121 123 121 Starch (g/kg DM) 167 149 147 146 190 223 247 Digestible energy (MJ/kg DM)* 10.04 9.93 9.51 9.28 99.34 10.72 10.73
*Calculated according to energetic values of ingredients (tables INRA, 1999) All diets consisted of maize, barley, oats, wheat bran, full-fat soya, sunflower seed meal, dehydrated alfalfa meal, and a vitamin mineral premix. The diet per kg contained 10,000 IU vitamin A, 2,500 IU vitamin D3, 80 IU vitamin E acetate, 2.0 mg thiamine, 4.5 mg riboflavin, 3.4 mg pyridoxine, 10 mg pantothenic acid, 20 mg niacin, 0.030 mg vitamin B12, 100 mg Fe, 100 mg Zn, 52.2 mg Mn, 0.4 mg I, and 0.4 mg Se. We enriched the fibre diets by adding wheat straw and bran in partial substitutions of maize and barley (FL1 = 6.0 % fibre enriched diet, FL2 = 12.7% and FL3 = 18.8%). The starch diets were enriched with the addition of maize starch in partial substitutions of maize and dehydrated alfalfa meal (SL1 = 13.7% starch enriched diet, SL2 = 33.4%, SL3 = 47.4%). The trial lasted 28 days with the rabbits being 42 and 70 days old at the start and end of it respectively. Feed intake, body weight, and clinical parameters of the animals were monitored. Blood sampling and chemical analyses At the end of the experimental feeding period, blood samples were taken at 10:00 h, from the marginal vein of the ears of each rabbit. Fresh blood samples, from 7-8 randomly selected rabbits from the control and each experimental group, were used to analyse the blood morphological parameters: red blood cells (RBC), haemoglobin, packed cell volume (PCV), mean corpuscular haemoglobin concentration (MCHC), mean corpuscular volume (MCV) and mean corpuscular haemoglobin (MCH) using an ABACUS Junior Vet automatic haematology analyser. The blood serum was obtained after blood coagulation, 10 min of centrifugation at
14,000 G, and decantation. The sera were stored at 4°C, until biochemical processing, for no longer than 24 h. The glucose was measured using an enzymatic method (Ashwell, 1957). Total serum protein and serum albumin were determined according to Gornall et al., (1949). Alkaline phosphatase (ALP, EC 3.1.3.1), aspartate aminotransferase (AST, EC 2.6.1.1), and alanine aminotransferase (ALT, EC 2.6.1.2) activities were assayed by spectro-photometric methods as described by Richterich (1967). Triglycerides, total cholesterol, high-density lipoprotein (HDL)-cholesterol, low-density lipoprotein (LDL)-cholesterol, and urea were measured according to Manta et al. (1976). Statistical analysis A two-way ANOVA was performed for the descriptive statistics and statistical comparisons of the blood parameters of each rabbit group using a General Linear Model procedure of SAS (2002). When any null hypothesis was rejected, a Tukey's post hoc test was performed to compare the groups. The relationship between starch or fibre enrichment levels and the blood biochemical parameters were statistically analysed using Pearson correlation (r). The significance level of null hypothesis rejection was declared at P < 0.05. RESULTS AND DISCUSSIONS Results of intake and growth suggested that animals maintained their physiological status regardless of the fibre or starch dietary levels (Table 2). A 13.7% starch supplementation (in SL1) resulted in a 25% and 63% increase in intake and growth respectively. Rabbit groups

23
THE EFFECT OF DIFFERENT FIBRE AND STARCH DIETARY LEVELS ON HAEMATOLOGY OF POST-WEANING RABBITS
Rosalie BĂLĂCEANU1, Liliana STOICA1, Marian GHIŢĂ1, Laurenț OGNEAN2,
Ionuţ NEGOIŢĂ1, Nicolae DOJANĂ1
1University of Agronomic Sciences and Veterinary Medicine of Bucharest,
Faculty of Veterinary Medicine, 105 Independentei Street, 050097, Bucharest, Romania 2University of Agricultural Sciences and Veterinary Medicine of Cluj-Napoca,
3-5 Mănăștur Street, 400372, Cluj-Napoca, Romania
Corresponding author email: [email protected]
Abstract
The objective of this study was to evaluate the effect of different fibre and starch dietary levels on the blood parameters of post-weaning rabbits. A control group was fed a post-weaning, growing rabbit diet containing 138 g/kg dry matter (DM) crude fibre and 168 g/kg DM starch. Three rabbit groups were fed diets with 147, 156, or 164 g/kg of DM crude fibre, and three groups were fed diets having 190, 223, or 247 g/kg DM starch. The experiment started with six week-old rabbits and lasted 28 days. Blood glucose levels were, on average, 7% lower in the groups fed fibre-enriched diets (P = 0.048) and 10% higher in the rabbit groups fed starch-enriched diets than in the control. The higher the dietary level for fibre and starch diets, the greater the deviation from normal in glucose levels. Total protein levels were not significantly modified, excepting a 13% increase in the globulin fraction of fibre and starch-diet fed groups and a subsequent decrease (8.3% and, respectively 13.8%) in the albumin/globulin ratio, but no differences according to the level of fibre or starch. Compared to the control, blood urea was 17% lower and 10% higher in rabbits fed the high crude fibre high starch diets respectively. Alanine aminotransferase, aspartate aminotransferase, and alkaline phosphatase showed relatively steady activity regardless of diet. The fibre diet levels were positively correlated with protein (r = 0.87) and HDL cholesterol (r = 0.78), but negatively correlated with glucose (r = −0.72), urea (r = −0.91) and triglycerides (r = −0.78). Contrastingly, dietary starch levels correlated positively with triglycerides (r = 0.92) and LDL cholesterol (r = 0.86). A negligible relationship was found between cholesterol and fibre (r = 0.15) or starch (r = 0.01) enriched diets. Key words: blood biochemistry, diet, fiber, growing rabbit, starch.
INTRODUCTION In rabbit metabolism and nutrition research, diets with differing structures or chemical compositions are often tested. Most dietary studies aim to determine the effects of different levels of protein, starch or fibre on metabolism or nutrition physiology (Eiben et al., 2008; El-Tahan et al., 2012; Wang et al., 2012). The structure and composition of these diets, which sometimes deviate in high degree from the standard diet, could influence blood parameters and subsequently, the physiological status and welfare of individuals (Atansuyi et al., 2012; Ewuola et al., 2012). The aim of this study was to reveal the extent to which different starch or fibre dietary levels could influence the haematology of growing rabbits.
MATERIALS AND METHODS Animals and experimental design Research was performed on 6-week old New Zealand x Californian (males and females) weaned (at 28 days old) rabbits with an average initial weight of 1.038 ± 54 g. Two weeks later, the young rabbits were equally divided into seven groups: a control and six experimental groups (10 rabbits in each one). Rabbits were housed in individual cages (250 × 400 × 300 mm), and maintained at tempe-ratures ranging from 22°C to 26°C. Water and pelleted feeds were provided ad libitum. A light cycle of 12 h from 07:00 h to 19:00.h was maintained throughout the trial. Diets were calculated according to weaned rabbit nutrient requirements described by De
Blas and Mateos (2010): a control diet and three diets each with increasing crude fibre
(FL1, FL2, FL3) and starch (SL1, SL2, SL3) levels respectively (Table 1).
Table 1. Calculated chemical composition of control and experimental post-weaning rabbit group diets
Chemical composition Control Fibre enriched diets Starch enriched diets FL1 FL2 FL3 SL1 SL2 SL3
Dry matter (DM, g/kg) 886 883 882 878 885 892 889 Crude protein (g/kg DM) 127 138 136 135 128 127 119 Crude fibre (g/kg DM) 138 147 156 164 121 123 121 Starch (g/kg DM) 167 149 147 146 190 223 247 Digestible energy (MJ/kg DM)* 10.04 9.93 9.51 9.28 99.34 10.72 10.73
*Calculated according to energetic values of ingredients (tables INRA, 1999) All diets consisted of maize, barley, oats, wheat bran, full-fat soya, sunflower seed meal, dehydrated alfalfa meal, and a vitamin mineral premix. The diet per kg contained 10,000 IU vitamin A, 2,500 IU vitamin D3, 80 IU vitamin E acetate, 2.0 mg thiamine, 4.5 mg riboflavin, 3.4 mg pyridoxine, 10 mg pantothenic acid, 20 mg niacin, 0.030 mg vitamin B12, 100 mg Fe, 100 mg Zn, 52.2 mg Mn, 0.4 mg I, and 0.4 mg Se. We enriched the fibre diets by adding wheat straw and bran in partial substitutions of maize and barley (FL1 = 6.0 % fibre enriched diet, FL2 = 12.7% and FL3 = 18.8%). The starch diets were enriched with the addition of maize starch in partial substitutions of maize and dehydrated alfalfa meal (SL1 = 13.7% starch enriched diet, SL2 = 33.4%, SL3 = 47.4%). The trial lasted 28 days with the rabbits being 42 and 70 days old at the start and end of it respectively. Feed intake, body weight, and clinical parameters of the animals were monitored. Blood sampling and chemical analyses At the end of the experimental feeding period, blood samples were taken at 10:00 h, from the marginal vein of the ears of each rabbit. Fresh blood samples, from 7-8 randomly selected rabbits from the control and each experimental group, were used to analyse the blood morphological parameters: red blood cells (RBC), haemoglobin, packed cell volume (PCV), mean corpuscular haemoglobin concentration (MCHC), mean corpuscular volume (MCV) and mean corpuscular haemoglobin (MCH) using an ABACUS Junior Vet automatic haematology analyser. The blood serum was obtained after blood coagulation, 10 min of centrifugation at
14,000 G, and decantation. The sera were stored at 4°C, until biochemical processing, for no longer than 24 h. The glucose was measured using an enzymatic method (Ashwell, 1957). Total serum protein and serum albumin were determined according to Gornall et al., (1949). Alkaline phosphatase (ALP, EC 3.1.3.1), aspartate aminotransferase (AST, EC 2.6.1.1), and alanine aminotransferase (ALT, EC 2.6.1.2) activities were assayed by spectro-photometric methods as described by Richterich (1967). Triglycerides, total cholesterol, high-density lipoprotein (HDL)-cholesterol, low-density lipoprotein (LDL)-cholesterol, and urea were measured according to Manta et al. (1976). Statistical analysis A two-way ANOVA was performed for the descriptive statistics and statistical comparisons of the blood parameters of each rabbit group using a General Linear Model procedure of SAS (2002). When any null hypothesis was rejected, a Tukey's post hoc test was performed to compare the groups. The relationship between starch or fibre enrichment levels and the blood biochemical parameters were statistically analysed using Pearson correlation (r). The significance level of null hypothesis rejection was declared at P < 0.05. RESULTS AND DISCUSSIONS Results of intake and growth suggested that animals maintained their physiological status regardless of the fibre or starch dietary levels (Table 2). A 13.7% starch supplementation (in SL1) resulted in a 25% and 63% increase in intake and growth respectively. Rabbit groups

24
fed by starch-enriched forages showed productive performance (weight gain) superior
to control. Similar results were reported by Wang et al. (2012) in growing meat rabbits.
Table 2. Daily gain and feed intake of rabbit fed on increasing fibre or starch dietary level
n= number of animals; *: significant difference from the control group at the level P < 0.05. £: period = 42 to 70-d old. Similarly, different levels of fibre and starch enriched diets did not modify the analysed blood morphological parameters of the rabbits (P>0.05, Table 3). Surprisingly, there seemed to be a correlation between RBC count and dietary levels of starch and fibre. These unchanged physiological features suggest that the hematopoietic process remained in the
normal range, at least during the experimental period and for the tested levels of fibre or starch. This is also in agreement with Ewuola et al. (2012), who reported no significant modifications of blood parameters in rabbit fed on different dietary levels of water spinach leaf meal, but a good intake, growth and health performances were observed.
Table 3. Morpho-haematological parameters in post-weaning rabbits fed for 28 days on increasing levels of a fibre or starch diet
Item Con-trol
Fibre enriched diets P values
r Starch enriched diets P values
r FL1 FL2 FL3 SD SL1 SL2 SL3 SD
n= 8 8 7 8 10 9 9 RBC (106/�L) 6.58 6.65 6.50 6.36 0.43 0.059 0.81 6.50 6.44 5.89 0.41 0.054 0.86 Haemoglobin (g/dL) 10.6 11.0 10.7 9.8 1.5 0.059 0.66 10.0 10.5 10.2 1.0 0.932 0.22 PCV (%) 36.7 37.7 36.4 35.0 2.3 0.069 0.71 36.4 36.8 36.0 3.0 0.060 0.56 MCHC (g/dL of RBC) 28.8 29.1 29.3 28.0 1.3 0.069 - 27.4 28.6 28.3 3.3 0.491 - MCV (fL) 55.7 56.6 56.0 55.8 3.0 0.088 - 56.0 57.1 61.1 2.9 0.059 - MCH (pg) 16.1 16.5 16.4 15.4 0.5 0.831 - 15.3 16.3 17.3 2.5 0.048 -
SD: standard deviation; n = sample size; r = correlation coefficient; RBC = red blood cells; PCV = packet cell volume; MCHC = mean corpuscular haemoglobin concentration; MCV = mean corpuscular volume; MCH = mean corpuscular haemoglobin Fibre diets had a different effect on blood biochemical parameters than the starch diets. Compared to the control, blood glucose levels reduced by 3% in FL1, 12% in FL2, and 7% in FL3, but increased by 12% in SL1, 7% in SL2 and 11% in SL3 (Table 4). Maintaining the normal limits of glucose concentrations regardless of diet showed that rabbits were able to control the intermediary metabolism of carbohydrates for the tested fibre or starch dietary levels. Instead, different levels (and higher versus control) of blood glucose were reported by Ewuola et al. (2012) in rabbits fed on different dietary levels of water spinach leaf meal. Total protein level were only slightly affected by diet with a little increase in the globulin fraction (+13%, in FL1-FL3 and 14% in SL1-SL3 groups), and a subsequent decrease (8% in FL and 14% in SL groups) in the albumin/globulin ratio. A positive correlation
between proteins and globulins with fibre level independent variables were found (r = 0.87 for total protein and r = 0.88 for globulins). This is in contrast with findings by Oboh et al. (2007), where the total protein, albumin and globulin were lowered (P<0.05) in rabbits after eight weeks on a high carbohydrate/low fat diet. Blood urea was lower in all the experimental groups than the control group, regardless of fibre or starch levels. Urea levels decreased in FL and SL groups (−3% in FL1, −22% in FL2 and FL3; −32% in SL1 and SL2, −19% in SL3 [P<0.05]). There was a negative correlation between urea levels and fibre levels (r = −0.91), and, less so, in starch levels (r = −0.51). The decrease in urea levels could suggest a decrease in protein mobilization and the use of protein as a metabolic fuel (Atansuyi et al., 2012; Wang et al., 2012).
Item Control (n=10)
FL1 (n=10)
FL2 (n=10)
FL3 (n=10)
SL1 (n=10)
SL2 (n=10)
SL3 (n=10)
P values
Daily gain (g/d)£ 21.1 28.4 22.4 21.4 34.3* 30.4 20.6 0.005 Feed intake (g/d) 81.5 87.0 79.0 75.5 101.6* 98.8* 94.6 0.019
Table 4. Blood biochemical parameters in post-weaning rabbits fed for 28 days on increasing fibre or starch dietary levels
Item Control Fibre enriched diets SD P values r Starch enriched diets P value r FL1 FL2 FL3 SL1 SL2 SL3 SD n 10 10 10 10 10 10 10
Glucose* 87.0a;b 84.6 77.0a 81.4b 2.2 0.048 0.72 99.0 94.0 97.5 6.60 0.032 0.59 Protein** 7.3 7.3 7.5 7.5 4.4 0.509 0.87 7.7 7.5 7.6 0.40 0.090 0.47 Albumin (A)** 3.7 3.7 3.5 3.6 0.6 0.454 0.65 3.7 3.3 3.6 0.33 0.193 0.52 Globulins (G)** 3.4 3.6 4.0 3.9 0.8 1.054 0.88 3.9 3.9 3.8 0.55 0.232 0.62 A/G ratio 1.08 1.02 0.87 0.92 - - 0.85 0.94 0.85 0.94 - - 0.69 Urea (mmol/L) 6.9a;b;c 6.7 5.5a 5.5b 0.4 0.031 0.91 5.2a 5.2b 5.8c 0.23 0.002 0.51 AST*** 50.3 55.4 52.3 49.4 3.0 0.065 0.24 50.0 52.9 46.4 5.0 0.094 0.38 ALT*** 38.8 36.9 40.1 42.0 1.7 0.298 0.63 35.9 38.4 33.0 3.7 0.059 0.67 ALP*** 104.0 120.4 110.0 96.0 6.4 0.243 0.39 120.1 110.0 114.1 8.6 0.165 0.34 Cholesterol* 89.9 87.7 92.3 89.3 8.8 0.404 0.15 85.0 79.0 92.1 4.4 0.332 0.01 Triglycerides* 60.0a;b 48.1a 46.4 48.3 2.7 0.020 0.78 55.4b 54.5 44.0 1.7 0.044 0.92 HDL chol.* 35.0a;b 29.9 32.0a 30.0 2.4 0.039 0.61 29.0 33.3b 31.3 2.0 0.047 0.33 LDL chol.* 40.2a;b 54.5 50.0a 54.9 6.2 0.033 0.78 46.0b 46.2 48.0 2.3 0.022 0.86
Legend: as in Table 2. Means with the same letter in the same row differ (P<0.05); * mg/dL; ** g/dL; *** IU. The almost steady-state activities of ALT, AST, and ALP may represent the integrity of the liver health parameters and the ability to maintain a constant protein synthesis activity in the liver regardless of the starch or fibre dietary levels. Increasing the fibre or starch levels did not change total cholesterol (P > 0.05) but affected the lipid metabolism profile. Triglycerides and HDL decreased in FL1 (−20% and −17%, respectively) and SL1 (−8% and −17%, respectively). A strong negative relationship between triglycerides and starch diets was found (r = −0.92). On the other hand, LDL increased in FL1 and in SL1 and correlated positively with dietary starch level independent variables (r = 0.86). Variations in triglycerides, HDL or LDL levels were not necessarily proportional to the changes in fibre or starch dietary levels, which could reveal a high physiological capacity of the rabbit to correct the levels of these blood parameters. No relationship was found between cholesterol and fibre (r = 0.15) or starch (r = 0.01) levels. Instead, direct correlations between triglycerides and pancreatic lipase activity have been reported by Dojana et al. (2012).
CONCLUSIONS
Increasing fibre or starch dietary levels had an effect on the blood biochemical parameters of weaned rabbits. Blood glucose and protein levels were slightly modified. Urea was directly correlated with fibre and starch dietary levels. Triglycerides and HDL decreased in
both, fibre and starch enriched diets. Variations in triglycerides, HDL, and LDL levels were not proportional to fibre or starch dietary levels. REFERENCES
Atansuyi A.J., Akinyemi M.B., Omo-Akeju M.O., Chineke C.A., Aletor V.A., 2012. Haematological indices of rabbits fed graded levels of two fibre sources. In: Proc. 10th World Rabbit Congress, 2012, Sharm El-Sheikh, Egypt, p. 713-717.
Ashwell G., 1957. Colorimetric analysis of sugars. In: Methods in enzymology. Kaplan N.O., Colowick S.P. (ed) Acad Press New York, 3, 85.
De Blas J.C., Mateos G.G., 2010. Feed Formulation. In: De Blas C., Wiseman J. (ed) The Nutrition of the rabbit. CABI Publishing, CAB International, Wallingford, Oxfordshire, UK, p. 222-232.
Dojană N., Codreanu I., Preda C., 2012. Enzyme output capacity of the rabbit exocrine pancreas to adapt differently to food substrate concentration changes. Scientific works, C series, Veterinary Medicine, LVIII(3), p. 134-141.
Eiben C., Gippert T., Gódor-Surmann K., Podmaniczky B., Kustos K., 2008. Influence of dietary protein reduction and enzyme and/or amino acid supplementation on fattening performance of rabbits. In: Proc. 9th World Rabbit Congress, June 2008, Verona, Italy, p. 637-641.
El-Tahan H.M., Amber K., Morsy W.A., 2012. Effect of dietary starch levels on performance and digestibility of growing rabbits. In: Proc. 10th World Rabbit Congress, September, 2012, Sharm El-Sheikh, Egypt, p. 501-505.
Ewuola E.O., Jimoh O.A., Atuma O.V., Soipe O.D., 2012. Haematological and serum biochemical response of growing rabbits fed graded levels of Moringa oleifera leaf meal. In: Proc. 10th World Rabbit Congress, 2012, Sharm El-Sheikh, Egypt, p. 679-683.

25
fed by starch-enriched forages showed productive performance (weight gain) superior
to control. Similar results were reported by Wang et al. (2012) in growing meat rabbits.
Table 2. Daily gain and feed intake of rabbit fed on increasing fibre or starch dietary level
n= number of animals; *: significant difference from the control group at the level P < 0.05. £: period = 42 to 70-d old. Similarly, different levels of fibre and starch enriched diets did not modify the analysed blood morphological parameters of the rabbits (P>0.05, Table 3). Surprisingly, there seemed to be a correlation between RBC count and dietary levels of starch and fibre. These unchanged physiological features suggest that the hematopoietic process remained in the
normal range, at least during the experimental period and for the tested levels of fibre or starch. This is also in agreement with Ewuola et al. (2012), who reported no significant modifications of blood parameters in rabbit fed on different dietary levels of water spinach leaf meal, but a good intake, growth and health performances were observed.
Table 3. Morpho-haematological parameters in post-weaning rabbits fed for 28 days on increasing levels of a fibre or starch diet
Item Con-trol
Fibre enriched diets P values
r Starch enriched diets P values
r FL1 FL2 FL3 SD SL1 SL2 SL3 SD
n= 8 8 7 8 10 9 9 RBC (106/�L) 6.58 6.65 6.50 6.36 0.43 0.059 0.81 6.50 6.44 5.89 0.41 0.054 0.86 Haemoglobin (g/dL) 10.6 11.0 10.7 9.8 1.5 0.059 0.66 10.0 10.5 10.2 1.0 0.932 0.22 PCV (%) 36.7 37.7 36.4 35.0 2.3 0.069 0.71 36.4 36.8 36.0 3.0 0.060 0.56 MCHC (g/dL of RBC) 28.8 29.1 29.3 28.0 1.3 0.069 - 27.4 28.6 28.3 3.3 0.491 - MCV (fL) 55.7 56.6 56.0 55.8 3.0 0.088 - 56.0 57.1 61.1 2.9 0.059 - MCH (pg) 16.1 16.5 16.4 15.4 0.5 0.831 - 15.3 16.3 17.3 2.5 0.048 -
SD: standard deviation; n = sample size; r = correlation coefficient; RBC = red blood cells; PCV = packet cell volume; MCHC = mean corpuscular haemoglobin concentration; MCV = mean corpuscular volume; MCH = mean corpuscular haemoglobin Fibre diets had a different effect on blood biochemical parameters than the starch diets. Compared to the control, blood glucose levels reduced by 3% in FL1, 12% in FL2, and 7% in FL3, but increased by 12% in SL1, 7% in SL2 and 11% in SL3 (Table 4). Maintaining the normal limits of glucose concentrations regardless of diet showed that rabbits were able to control the intermediary metabolism of carbohydrates for the tested fibre or starch dietary levels. Instead, different levels (and higher versus control) of blood glucose were reported by Ewuola et al. (2012) in rabbits fed on different dietary levels of water spinach leaf meal. Total protein level were only slightly affected by diet with a little increase in the globulin fraction (+13%, in FL1-FL3 and 14% in SL1-SL3 groups), and a subsequent decrease (8% in FL and 14% in SL groups) in the albumin/globulin ratio. A positive correlation
between proteins and globulins with fibre level independent variables were found (r = 0.87 for total protein and r = 0.88 for globulins). This is in contrast with findings by Oboh et al. (2007), where the total protein, albumin and globulin were lowered (P<0.05) in rabbits after eight weeks on a high carbohydrate/low fat diet. Blood urea was lower in all the experimental groups than the control group, regardless of fibre or starch levels. Urea levels decreased in FL and SL groups (−3% in FL1, −22% in FL2 and FL3; −32% in SL1 and SL2, −19% in SL3 [P<0.05]). There was a negative correlation between urea levels and fibre levels (r = −0.91), and, less so, in starch levels (r = −0.51). The decrease in urea levels could suggest a decrease in protein mobilization and the use of protein as a metabolic fuel (Atansuyi et al., 2012; Wang et al., 2012).
Item Control (n=10)
FL1 (n=10)
FL2 (n=10)
FL3 (n=10)
SL1 (n=10)
SL2 (n=10)
SL3 (n=10)
P values
Daily gain (g/d)£ 21.1 28.4 22.4 21.4 34.3* 30.4 20.6 0.005 Feed intake (g/d) 81.5 87.0 79.0 75.5 101.6* 98.8* 94.6 0.019
Table 4. Blood biochemical parameters in post-weaning rabbits fed for 28 days on increasing fibre or starch dietary levels
Item Control Fibre enriched diets SD P values r Starch enriched diets P value r FL1 FL2 FL3 SL1 SL2 SL3 SD n 10 10 10 10 10 10 10
Glucose* 87.0a;b 84.6 77.0a 81.4b 2.2 0.048 0.72 99.0 94.0 97.5 6.60 0.032 0.59 Protein** 7.3 7.3 7.5 7.5 4.4 0.509 0.87 7.7 7.5 7.6 0.40 0.090 0.47 Albumin (A)** 3.7 3.7 3.5 3.6 0.6 0.454 0.65 3.7 3.3 3.6 0.33 0.193 0.52 Globulins (G)** 3.4 3.6 4.0 3.9 0.8 1.054 0.88 3.9 3.9 3.8 0.55 0.232 0.62 A/G ratio 1.08 1.02 0.87 0.92 - - 0.85 0.94 0.85 0.94 - - 0.69 Urea (mmol/L) 6.9a;b;c 6.7 5.5a 5.5b 0.4 0.031 0.91 5.2a 5.2b 5.8c 0.23 0.002 0.51 AST*** 50.3 55.4 52.3 49.4 3.0 0.065 0.24 50.0 52.9 46.4 5.0 0.094 0.38 ALT*** 38.8 36.9 40.1 42.0 1.7 0.298 0.63 35.9 38.4 33.0 3.7 0.059 0.67 ALP*** 104.0 120.4 110.0 96.0 6.4 0.243 0.39 120.1 110.0 114.1 8.6 0.165 0.34 Cholesterol* 89.9 87.7 92.3 89.3 8.8 0.404 0.15 85.0 79.0 92.1 4.4 0.332 0.01 Triglycerides* 60.0a;b 48.1a 46.4 48.3 2.7 0.020 0.78 55.4b 54.5 44.0 1.7 0.044 0.92 HDL chol.* 35.0a;b 29.9 32.0a 30.0 2.4 0.039 0.61 29.0 33.3b 31.3 2.0 0.047 0.33 LDL chol.* 40.2a;b 54.5 50.0a 54.9 6.2 0.033 0.78 46.0b 46.2 48.0 2.3 0.022 0.86
Legend: as in Table 2. Means with the same letter in the same row differ (P<0.05); * mg/dL; ** g/dL; *** IU. The almost steady-state activities of ALT, AST, and ALP may represent the integrity of the liver health parameters and the ability to maintain a constant protein synthesis activity in the liver regardless of the starch or fibre dietary levels. Increasing the fibre or starch levels did not change total cholesterol (P > 0.05) but affected the lipid metabolism profile. Triglycerides and HDL decreased in FL1 (−20% and −17%, respectively) and SL1 (−8% and −17%, respectively). A strong negative relationship between triglycerides and starch diets was found (r = −0.92). On the other hand, LDL increased in FL1 and in SL1 and correlated positively with dietary starch level independent variables (r = 0.86). Variations in triglycerides, HDL or LDL levels were not necessarily proportional to the changes in fibre or starch dietary levels, which could reveal a high physiological capacity of the rabbit to correct the levels of these blood parameters. No relationship was found between cholesterol and fibre (r = 0.15) or starch (r = 0.01) levels. Instead, direct correlations between triglycerides and pancreatic lipase activity have been reported by Dojana et al. (2012).
CONCLUSIONS
Increasing fibre or starch dietary levels had an effect on the blood biochemical parameters of weaned rabbits. Blood glucose and protein levels were slightly modified. Urea was directly correlated with fibre and starch dietary levels. Triglycerides and HDL decreased in
both, fibre and starch enriched diets. Variations in triglycerides, HDL, and LDL levels were not proportional to fibre or starch dietary levels. REFERENCES
Atansuyi A.J., Akinyemi M.B., Omo-Akeju M.O., Chineke C.A., Aletor V.A., 2012. Haematological indices of rabbits fed graded levels of two fibre sources. In: Proc. 10th World Rabbit Congress, 2012, Sharm El-Sheikh, Egypt, p. 713-717.
Ashwell G., 1957. Colorimetric analysis of sugars. In: Methods in enzymology. Kaplan N.O., Colowick S.P. (ed) Acad Press New York, 3, 85.
De Blas J.C., Mateos G.G., 2010. Feed Formulation. In: De Blas C., Wiseman J. (ed) The Nutrition of the rabbit. CABI Publishing, CAB International, Wallingford, Oxfordshire, UK, p. 222-232.
Dojană N., Codreanu I., Preda C., 2012. Enzyme output capacity of the rabbit exocrine pancreas to adapt differently to food substrate concentration changes. Scientific works, C series, Veterinary Medicine, LVIII(3), p. 134-141.
Eiben C., Gippert T., Gódor-Surmann K., Podmaniczky B., Kustos K., 2008. Influence of dietary protein reduction and enzyme and/or amino acid supplementation on fattening performance of rabbits. In: Proc. 9th World Rabbit Congress, June 2008, Verona, Italy, p. 637-641.
El-Tahan H.M., Amber K., Morsy W.A., 2012. Effect of dietary starch levels on performance and digestibility of growing rabbits. In: Proc. 10th World Rabbit Congress, September, 2012, Sharm El-Sheikh, Egypt, p. 501-505.
Ewuola E.O., Jimoh O.A., Atuma O.V., Soipe O.D., 2012. Haematological and serum biochemical response of growing rabbits fed graded levels of Moringa oleifera leaf meal. In: Proc. 10th World Rabbit Congress, 2012, Sharm El-Sheikh, Egypt, p. 679-683.

26
GREENHOUSE GAS EMISSIONS FROM SUNFLOWER CULTIVATION
FOR BIOFUELS AND BIODIESEL PRODUCTION
Irina CALCIU, Olga VIZITIU, Cătălin SIMOTA
National Research and Development Institute for Soil Science, Agrochemistry and Environment – ICPA Bucharest, 61 Mărăști Blvd, District 1, 011464, Bucharest, Romania,
Phone +4021.318.43.49, Fax +4021.318.43.48, Emails: [email protected], [email protected], [email protected]
Corresponding author email: [email protected]
Abstract Use of renewable energy resources is regulated by EU Directive 2009/28/CE from April 23rd 2009. The reduction of the greenhouse gas emissions coming from the biofuels and bioliquids use is calculated according to the Article 19 of the Directive and is based on typical and default values. In this study the coefficients for sunflower crop (typical emissions of greenhouse gas -g CO2 ech MJ-1) were evaluated at NUTS3 level (county) taking into account the pedoclimatic and technological conditions of Romania. The evaluation of greenhouse gas emissions and of energy consumptions within the whole production chain of biofuels and biodiesel was done by using Carbon Calculator – version 1.1 designed by E4Tech for Renewable Fuels Agency from UK. This program was used for different crop production levels: multiannual national average for the period of 1991-2014 provided by National Institute of Statistics; the lower level of crop production defined as difference between multiannual average and standard deviation of crop production years; the upper level of the crop production defined as sum between multiannual average and standard deviation of crop production years; crop production for which the default values of crop coefficients are given in Annex V/part D. The aggregation of information on greenhouse gas emissions (g CO2 ech MJ-1) at NUTS3 level corresponding to the fourth levels of crop production was done as an average of emissions from each soil-terrain unit under arable land use. The E4Tech model was then used for evaluation of spatial distribution of emissions. It was used the dependence between typical greenhouse gas emissions specific to sunflower crop and crop yield (optimum technology: multiannual average, multiannual average ± standard deviation; actual technology: multiannual average). The aggregation of these results at NUTS3 level showed that the default values for typical emissions included in the Directive are not reached even in case of optimum technology applied in favorable years for sunflower cultivation (average production + standard deviation). The greenhouse gas emissions had the lowest values in Braila, Ialomita and Calarasi counties. The reduction of greenhouse gas emissions within the whole chain of biofuels and biodiesel production from sunflower cultivation, which were evaluated based on multiannual national average for the period of 1991-2014 (actual technology) were 35% in favorable years and 11% in unfavorable years. These values are lower than the typical and default values from Annex V/part D from EU Directive. Key words: greenhouse gas emissions, biofuels, biodiesel, sunflower crop. INTRODUCTION Use of renewable energy resources is regulated by EU Directive 2009/28/CE of European Parliament and of Council from April 23rd 2009 (European Parliament, 2009). According to the article 17 of this Directive either the feedstocks are cultivated within the Community territory or outside it, the energy produced from biofuels and biodiesel is taking into account for: the evaluation of respecting the requirements imposed by Directive for the national tasks; the evaluation of respecting the obligations related to renewable energy; the eligibility related to
financial support for biofuels and biodiesel consumption. These type of energy should be taken into account if the following sustainability criteria are met: (1) beginning with April 1, 2013 the greenhouse gas emissions coming from using biofuels and biodiesel produced by instalations that were working at January 23, 2008 are reduced with at least with 35%; (2) beginning with January 1, 2017, the greenhouse gas emissions coming from using biofuels and biodiesel are reduced with at least 50%; (3) beginning with January 1, 2018, the greenhouse gas emissions coming from using biofuels and biodiesel produced in instalations that have begun to work at or
Gornall A. G., Bardawil C. J., David M.M., 1949. Determination of serum proteins by means of the biuret reagent J. Biol. Chem., 177: p. 751 -766.
Manta I., Cucuianu M., Benga G., Hodârnău A., 1976. Biochemical methods in clinic laboratory. "Dacia" (ed.), Cluj, Romania.
Oboh H.A., Omofoma C.O., Olumese F.E., Eiya B., 2007. Effects of High Carbohydrate Low Fat Nigerian-Like Diet on Biochemical Indices in Rabbits. Pakistan Journal of Nutrition, 6, p. 399-403.
Richterich R., 1967. Chimie clinique, théoretique et pratique. Doin, Paris.
Wang X., Ma M., Sun L., Wang C., Zhu Y., Li F., 2012. Effects of different protein, fibre and energy levels on growth performance and the development of digestive organs in growing meat rabbit. In: Proc. 10th World Rabbit Congress, Sharm El-Sheikh, Egypt, p. 641-645.
***SAS, 2002. SAS/STAT User’s Guide (Version 2.1.3 for Windows). SAS Inst. Inc., Cary, NC, USA.

27
GREENHOUSE GAS EMISSIONS FROM SUNFLOWER CULTIVATION
FOR BIOFUELS AND BIODIESEL PRODUCTION
Irina CALCIU, Olga VIZITIU, Cătălin SIMOTA
National Research and Development Institute for Soil Science, Agrochemistry and Environment – ICPA Bucharest, 61 Mărăști Blvd, District 1, 011464, Bucharest, Romania,
Phone +4021.318.43.49, Fax +4021.318.43.48, Emails: [email protected], [email protected], [email protected]
Corresponding author email: [email protected]
Abstract Use of renewable energy resources is regulated by EU Directive 2009/28/CE from April 23rd 2009. The reduction of the greenhouse gas emissions coming from the biofuels and bioliquids use is calculated according to the Article 19 of the Directive and is based on typical and default values. In this study the coefficients for sunflower crop (typical emissions of greenhouse gas -g CO2 ech MJ-1) were evaluated at NUTS3 level (county) taking into account the pedoclimatic and technological conditions of Romania. The evaluation of greenhouse gas emissions and of energy consumptions within the whole production chain of biofuels and biodiesel was done by using Carbon Calculator – version 1.1 designed by E4Tech for Renewable Fuels Agency from UK. This program was used for different crop production levels: multiannual national average for the period of 1991-2014 provided by National Institute of Statistics; the lower level of crop production defined as difference between multiannual average and standard deviation of crop production years; the upper level of the crop production defined as sum between multiannual average and standard deviation of crop production years; crop production for which the default values of crop coefficients are given in Annex V/part D. The aggregation of information on greenhouse gas emissions (g CO2 ech MJ-1) at NUTS3 level corresponding to the fourth levels of crop production was done as an average of emissions from each soil-terrain unit under arable land use. The E4Tech model was then used for evaluation of spatial distribution of emissions. It was used the dependence between typical greenhouse gas emissions specific to sunflower crop and crop yield (optimum technology: multiannual average, multiannual average ± standard deviation; actual technology: multiannual average). The aggregation of these results at NUTS3 level showed that the default values for typical emissions included in the Directive are not reached even in case of optimum technology applied in favorable years for sunflower cultivation (average production + standard deviation). The greenhouse gas emissions had the lowest values in Braila, Ialomita and Calarasi counties. The reduction of greenhouse gas emissions within the whole chain of biofuels and biodiesel production from sunflower cultivation, which were evaluated based on multiannual national average for the period of 1991-2014 (actual technology) were 35% in favorable years and 11% in unfavorable years. These values are lower than the typical and default values from Annex V/part D from EU Directive. Key words: greenhouse gas emissions, biofuels, biodiesel, sunflower crop. INTRODUCTION Use of renewable energy resources is regulated by EU Directive 2009/28/CE of European Parliament and of Council from April 23rd 2009 (European Parliament, 2009). According to the article 17 of this Directive either the feedstocks are cultivated within the Community territory or outside it, the energy produced from biofuels and biodiesel is taking into account for: the evaluation of respecting the requirements imposed by Directive for the national tasks; the evaluation of respecting the obligations related to renewable energy; the eligibility related to
financial support for biofuels and biodiesel consumption. These type of energy should be taken into account if the following sustainability criteria are met: (1) beginning with April 1, 2013 the greenhouse gas emissions coming from using biofuels and biodiesel produced by instalations that were working at January 23, 2008 are reduced with at least with 35%; (2) beginning with January 1, 2017, the greenhouse gas emissions coming from using biofuels and biodiesel are reduced with at least 50%; (3) beginning with January 1, 2018, the greenhouse gas emissions coming from using biofuels and biodiesel produced in instalations that have begun to work at or
Gornall A. G., Bardawil C. J., David M.M., 1949. Determination of serum proteins by means of the biuret reagent J. Biol. Chem., 177: p. 751 -766.
Manta I., Cucuianu M., Benga G., Hodârnău A., 1976. Biochemical methods in clinic laboratory. "Dacia" (ed.), Cluj, Romania.
Oboh H.A., Omofoma C.O., Olumese F.E., Eiya B., 2007. Effects of High Carbohydrate Low Fat Nigerian-Like Diet on Biochemical Indices in Rabbits. Pakistan Journal of Nutrition, 6, p. 399-403.
Richterich R., 1967. Chimie clinique, théoretique et pratique. Doin, Paris.
Wang X., Ma M., Sun L., Wang C., Zhu Y., Li F., 2012. Effects of different protein, fibre and energy levels on growth performance and the development of digestive organs in growing meat rabbit. In: Proc. 10th World Rabbit Congress, Sharm El-Sheikh, Egypt, p. 641-645.
***SAS, 2002. SAS/STAT User’s Guide (Version 2.1.3 for Windows). SAS Inst. Inc., Cary, NC, USA.
AgroLife Scientific Journal - Volume 6, Number 2, 2017ISSN 2285-5718; ISSN CD-ROM 2285-5726; ISSN ONLINE 2286-0126; ISSN-L 2285-5718

28
after January 1, 2017 are reduced with at least 60%; (4) biofuels and biodiesel are not obtained from feedstock produced on lands with high biodiversity; (5) biofuels and biodiesel are not obtained from biofuels and biodiesel are not obtained from feedstock produced on lands with high carbon stocks; (6) biofuels and biodiesel are not obtained from feedstock produced on lands which in January 2008 were peat bogs, excepting the case when there are proves that there were no soil portions drained by cultivating and harvesting these feedstock which previously were un-drained. The reductions of greenhouse gas emissions are calculated according to the article 19 of Directive 2009/28/CE based on typical and default values. These values are based on data related to production and use of biofuels and biodiesel and on the methodology included in Annex V of the Directive. In part A of Annex V of the Directive typical and default values for production chains whose elements are not specified in the Directive are presented. These values do not include the net carbon emissions as a result of land use change. According to the Directive a “typical value” designates an estimation of a representative reduction of greenhouse gas emissions for certain biofuels production chain. A “default value” means a derived value from a typical value by applying some pre-determined factors and which can, in some conditions mentioned in the Directive, be used instead of a typical value. Typical and default values of the coefficients used in the computing methodology of greenhouse gas emissions from production and using of the fuels for transports, of biofuels and biodiesel (part C of Annex V) are detailed for processes related to plants growth (Table 1, part D of Annex V), its processing (Table 2, part D of Annex V), transport and distribution (Table 3, part D of Annex V). The objective of this study is to evaluate at NUT 3 (county) level the sunflower crop coefficients of which the default values are given in Annex V/part D of the Directive (default greenhouse gas emissions, g CO2 ech MJ-1, for biofuels and biodiesel production chains) under specific pedo-climatic and
agricultural technological conditions of Romania. MATERIALS AND METHODS The evaluation of greenhouse gas emissions and of energetic consumption on the whole biofuels and biodiesel production chain was done by using Carbon Calculator – version 1.1 designed by E4Tech for Renewable Fuels Agency from UK. The program uses pre-defined sequences for biofuels and biodiesel production chains, which may be grouped in the following categories: (1) specific inputs for agricultural farms and vegetal crops; (2) pre-processing; (3) vegetal feedstock transport; (4) processing/conversion; (5) transport of final products (biofuels, biodiesel) to the final users. The calculations were based on default values of computing program for sequences 2-5, mentioning that the feedstock transport is done by track at 50 km distance and with electric train at 100 km distance and the transport of final products is done with the tanker at 200 km distance. It was not taken into account the direct effect induced by land use change, it was considered that the crop structure will not be significantly changed and the lands under different uses (pastures, grasslands, orchards, vineyards) will not be transformed in arable ones. The input parameters related to sequence 1 (specific inputs for agricultural farms and vegetal crops) were introduced according to pedo-climatic and agricultural technological conditions from Romania. The technologies for sunflower crop were provided by the Ministry of Agriculture and Rural Development. These were used in order to establish the input values related to diesel consumptions for soil agricultural tillage and for weeds and diseases control. The mineral fertilizers consumption was calculated based on the coefficients from the Code of Good Agricultural Practices according to estimated crop yield (kg of nutrients per tone of main crop). For sunflower crop, the soil nutrients mean consumption for crop yield formation (kg of nutrients – conventional active substances per tone of main crop yield and corresponding
secondary yield) are 36.5 nitrogen (N), 17.5 phosphorus pentoxide (P2O5), 50.0 potassium oxide (K2O), in a rate seeds : strains of 1:3. The computing program for evaluating the greenhouse gas emissions was used for the following crop yield levels: multiannual national average for the period 1991-2014 provided by National Institute of Statistics; lower level of crop yield defined by the difference between multiannual average (1991-2014) and standard deviation of crop yield series; upper level of crop yield defined by the sum between multiannual average (1991-2014) and standard deviation of crop yield series; crop yield corresponding to default values of crop coefficient mentioned in Annex V / part D from the Directive. In case of sunflower crop the multiannual national average for the period 1991-2014 was 1210 kg/ha and the standard deviation was 228 kg/ha. The crop yield needed for attaining the typical value of crop coefficient from Annex V / part D from Directive 2009/28/CE is 3600 kg/ha. Regressions (power functions) between greenhouse gas emissions (g CO2 ech MJ-1) and main crop yield (t/ha) were established for the chain of biodiesel production. As input data for crop yield the following values were used: (1) multiannual average value of crop yield which was obtained in un-irrigated conditions using an optimum technology (balancing the fertilizer stress by application of mineral fertilizers on the whole crop growing period). These values were evaluated by using ROIMPEL agro-pedoclimatic simulation model coupled with digital soil map of Romania, at 1:200000 scale and with climatic data basis in a grid of 10 x 10 km for the time interval of 1961-2014. The crop yield evaluation was done for each soil polygon under arable use (based on geo-referenced LCCS layer - satellite data from 2002); (2) minimum values of crop yield which was obtained in un-irrigated conditions using an optimum technology, evaluated as difference between multiannual average values and standard deviation computed with ROIMPEL model (same conditions as at point 1); (3) maximum values of crop yield which was obtained in un-irrigated conditions using an optimum technology, evaluated as sum
between multiannual average values and standard deviation computed with ROIMPEL model (same conditions as at point 1); (4) multiannual average value of crop yield which may be obtained in un-irrigated conditions using the actual technology. The aggregation of the information related to greenhouse gas emissions (g CO2 ech MJ-1) at county (NUTS3) level was done for the fourth crop yield levels as an average of the emissions from each soil-terrain unit under arable use. The spatial distribution of greenhouse gas emissions was evaluated by using the dependence between typical greenhouse gas emissions specific to sunflower crop and crop yield (optimum technology: multiannual average, multiannual average ± standard deviation; actual technology: multiannual average) with the following equation:
8156.011
2*3.51 �
�� � thaMJgCO ProductionEmissionsech
RESULTS AND DISCUSSIONS The spatial distribution of the greenhouse gas emissions within the biofuels and biodiesel production chains from sunflower cultivation is presented in Figures 1-4.
Figure 1. Biofuels and biodiesel from sunflower seeds.
Spatial distribution of emissions from feedstock cultivation. Multiannual average production under
optimum technology In case of using as input data for crop yield the multiannual average production under optimum technology, the obtained results showed that the level of greenhouse gas emissions from sunflower cultivation for

29
after January 1, 2017 are reduced with at least 60%; (4) biofuels and biodiesel are not obtained from feedstock produced on lands with high biodiversity; (5) biofuels and biodiesel are not obtained from biofuels and biodiesel are not obtained from feedstock produced on lands with high carbon stocks; (6) biofuels and biodiesel are not obtained from feedstock produced on lands which in January 2008 were peat bogs, excepting the case when there are proves that there were no soil portions drained by cultivating and harvesting these feedstock which previously were un-drained. The reductions of greenhouse gas emissions are calculated according to the article 19 of Directive 2009/28/CE based on typical and default values. These values are based on data related to production and use of biofuels and biodiesel and on the methodology included in Annex V of the Directive. In part A of Annex V of the Directive typical and default values for production chains whose elements are not specified in the Directive are presented. These values do not include the net carbon emissions as a result of land use change. According to the Directive a “typical value” designates an estimation of a representative reduction of greenhouse gas emissions for certain biofuels production chain. A “default value” means a derived value from a typical value by applying some pre-determined factors and which can, in some conditions mentioned in the Directive, be used instead of a typical value. Typical and default values of the coefficients used in the computing methodology of greenhouse gas emissions from production and using of the fuels for transports, of biofuels and biodiesel (part C of Annex V) are detailed for processes related to plants growth (Table 1, part D of Annex V), its processing (Table 2, part D of Annex V), transport and distribution (Table 3, part D of Annex V). The objective of this study is to evaluate at NUT 3 (county) level the sunflower crop coefficients of which the default values are given in Annex V/part D of the Directive (default greenhouse gas emissions, g CO2 ech MJ-1, for biofuels and biodiesel production chains) under specific pedo-climatic and
agricultural technological conditions of Romania. MATERIALS AND METHODS The evaluation of greenhouse gas emissions and of energetic consumption on the whole biofuels and biodiesel production chain was done by using Carbon Calculator – version 1.1 designed by E4Tech for Renewable Fuels Agency from UK. The program uses pre-defined sequences for biofuels and biodiesel production chains, which may be grouped in the following categories: (1) specific inputs for agricultural farms and vegetal crops; (2) pre-processing; (3) vegetal feedstock transport; (4) processing/conversion; (5) transport of final products (biofuels, biodiesel) to the final users. The calculations were based on default values of computing program for sequences 2-5, mentioning that the feedstock transport is done by track at 50 km distance and with electric train at 100 km distance and the transport of final products is done with the tanker at 200 km distance. It was not taken into account the direct effect induced by land use change, it was considered that the crop structure will not be significantly changed and the lands under different uses (pastures, grasslands, orchards, vineyards) will not be transformed in arable ones. The input parameters related to sequence 1 (specific inputs for agricultural farms and vegetal crops) were introduced according to pedo-climatic and agricultural technological conditions from Romania. The technologies for sunflower crop were provided by the Ministry of Agriculture and Rural Development. These were used in order to establish the input values related to diesel consumptions for soil agricultural tillage and for weeds and diseases control. The mineral fertilizers consumption was calculated based on the coefficients from the Code of Good Agricultural Practices according to estimated crop yield (kg of nutrients per tone of main crop). For sunflower crop, the soil nutrients mean consumption for crop yield formation (kg of nutrients – conventional active substances per tone of main crop yield and corresponding
secondary yield) are 36.5 nitrogen (N), 17.5 phosphorus pentoxide (P2O5), 50.0 potassium oxide (K2O), in a rate seeds : strains of 1:3. The computing program for evaluating the greenhouse gas emissions was used for the following crop yield levels: multiannual national average for the period 1991-2014 provided by National Institute of Statistics; lower level of crop yield defined by the difference between multiannual average (1991-2014) and standard deviation of crop yield series; upper level of crop yield defined by the sum between multiannual average (1991-2014) and standard deviation of crop yield series; crop yield corresponding to default values of crop coefficient mentioned in Annex V / part D from the Directive. In case of sunflower crop the multiannual national average for the period 1991-2014 was 1210 kg/ha and the standard deviation was 228 kg/ha. The crop yield needed for attaining the typical value of crop coefficient from Annex V / part D from Directive 2009/28/CE is 3600 kg/ha. Regressions (power functions) between greenhouse gas emissions (g CO2 ech MJ-1) and main crop yield (t/ha) were established for the chain of biodiesel production. As input data for crop yield the following values were used: (1) multiannual average value of crop yield which was obtained in un-irrigated conditions using an optimum technology (balancing the fertilizer stress by application of mineral fertilizers on the whole crop growing period). These values were evaluated by using ROIMPEL agro-pedoclimatic simulation model coupled with digital soil map of Romania, at 1:200000 scale and with climatic data basis in a grid of 10 x 10 km for the time interval of 1961-2014. The crop yield evaluation was done for each soil polygon under arable use (based on geo-referenced LCCS layer - satellite data from 2002); (2) minimum values of crop yield which was obtained in un-irrigated conditions using an optimum technology, evaluated as difference between multiannual average values and standard deviation computed with ROIMPEL model (same conditions as at point 1); (3) maximum values of crop yield which was obtained in un-irrigated conditions using an optimum technology, evaluated as sum
between multiannual average values and standard deviation computed with ROIMPEL model (same conditions as at point 1); (4) multiannual average value of crop yield which may be obtained in un-irrigated conditions using the actual technology. The aggregation of the information related to greenhouse gas emissions (g CO2 ech MJ-1) at county (NUTS3) level was done for the fourth crop yield levels as an average of the emissions from each soil-terrain unit under arable use. The spatial distribution of greenhouse gas emissions was evaluated by using the dependence between typical greenhouse gas emissions specific to sunflower crop and crop yield (optimum technology: multiannual average, multiannual average ± standard deviation; actual technology: multiannual average) with the following equation:
8156.011
2*3.51 �
�� � thaMJgCO ProductionEmissionsech
RESULTS AND DISCUSSIONS The spatial distribution of the greenhouse gas emissions within the biofuels and biodiesel production chains from sunflower cultivation is presented in Figures 1-4.
Figure 1. Biofuels and biodiesel from sunflower seeds.
Spatial distribution of emissions from feedstock cultivation. Multiannual average production under
optimum technology In case of using as input data for crop yield the multiannual average production under optimum technology, the obtained results showed that the level of greenhouse gas emissions from sunflower cultivation for

30
biofuels and bioliquids production exceeds the typical value from Directive 2009/28/EC (19 g CO2 ech./MJ) all over the arable land of the country. The highest values are recorded in southern part of the country (Figure 1). In case of using as input data for crop yield the multiannual average production under optimum technology + standard deviation, the obtained results showed that the level of greenhouse gas emissions from sunflower cultivation for biofuels and biodiesel production exceeds the typical value from Directive 2009/28/EC (19 g CO2 ech./MJ) with highest values in south and south eastern part of the country (Figure 2).
Figure 2. Biofuels and biodiesel from sunflower seeds.
Spatial distribution of emissions from feedstock cultivation. Multiannual average production under
optimum technology + standard deviation (favorable years for sunflower cultivation)
Figure 3. Biofuels and biodiesel from sunflower seeds.
Spatial distribution of emissions from feedstock cultivation. Multiannual average production under
optimum technology - standard deviation (unfavorable years for sunflower cultivation)
In case of using as input data for crop yield the multiannual average production under optimum technology - standard deviation, the obtained results showed that the level of greenhouse gas emissions from sunflower cultivation for biofuels and biodiesel production exceeds the typical value from Directive 2009/28/EC (19 g CO2 ech./MJ), with very high values all over the arable land of the country (Figure 3). In case of using as input data for crop yield the multiannual average production under actual technology, the obtained results showed that the level of greenhouse gas emissions from sunflower cultivation for biofuels and biodiesel production exceeds the typical value from Directive 2009/28/EC (19 g CO2 ech./MJ), with very high values all over the arable land of the country (Figure 4).
Figure 4. Biofuels and biodiesel from sunflower seeds.
Spatial distribution of emissions from feedstock cultivation. Multiannual average production under
actual technology (1991 – 2014) The aggregation of these results at NUTS3 level showed that the default values for typical emissions included in the Directive are not reached even in case of optimum technology applied in favorable years for sunflower cultivation (average production + standard deviation). The greenhouse gas emissions had the lowest values in Braila, Ialomita and Calarasi counties (Table 1). This situation is a consequence of the fact that the level of the crop yields for which the default values from Annex 5 were established are very high (3600 kg/ha), more than double of the average production of sunflower seeds
obtained in EU. By using these values Directive 2008/28/CE discourages the use of sunflower seeds for biofuel and biodiesel production.
Table 1. Emissions from feedstock cultivation. Biofuels and biodiesel from sunflower.
Typical emissions according to Directive 2009/28/CE: 19 g CO2 ech./MJ. Potential average production ±
standard deviation under un-irrigated regime. Recorded average production (1991-2014)
The reduction of greenhouse gas emissions within the whole chain of biofuel and biodiesel production from sunflower cultivation, which were evaluated based on multiannual national average for the period of 1991-2014 (actual technology) were 35% in favorable years and 11% in unfavorable years. These values are lower than the typical and default values (58%, 51% respectively) from Annex V/part D from EU Directive. Similar situation is in case of using as input data for national average production under an optimum technology: the greenhouse gas emissions are just 44%.
At national level, the arable land area for which the values for crop are lower or equal with that’s from Annex V/D (for which the calculated greenhouse gas emissions according to Article 19 are within in the sustainability criteria defined in Article 17 of the Directive 2009/28/CE) is for the multiannual average production obtained under an optimum technology: 19246 ha (1032894 ha in favorable years, 0 ha in unfavorable years). At the level of actual average production (1991 – 2014), there is no any arable land area for which the values for crop are lower or equal with that’s from Annex V/D from Directive 2009/28/CE. CONCLUSIONS In case of using as input data for crop yield the multiannual average production under optimum technology, the obtained results showed that the level of greenhouse gas emissions from sunflower cultivation for biofuels and biodiesel production exceeds the typical value from Directive 2009/28/EC all over the arable land of the country. The highest values were recorded in southern part of the country. In case of using as input data for crop yield the multiannual average production under optimum technology + standard deviation, the obtained results showed that the level of greenhouse gas emissions from sunflower cultivation for biofuels and biodiesel production exceeds the typical value from Directive 2009/28/EC with highest values in south and south eastern part of the country. In case of using as input data for crop yield the multiannual average production under optimum technology - standard deviation, the obtained results showed that the level of greenhouse gas emissions from sunflower cultivation for biofuels and biodiesel production exceeds the typical value from Directive 2009/28/EC, with very high values all over the arable land of the country. In case of using as input data for crop yield the multiannual average production under actual technology, the obtained results showed that the level of greenhouse gas emissions from sunflower cultivation for biofuels and biodiesel production exceeds the
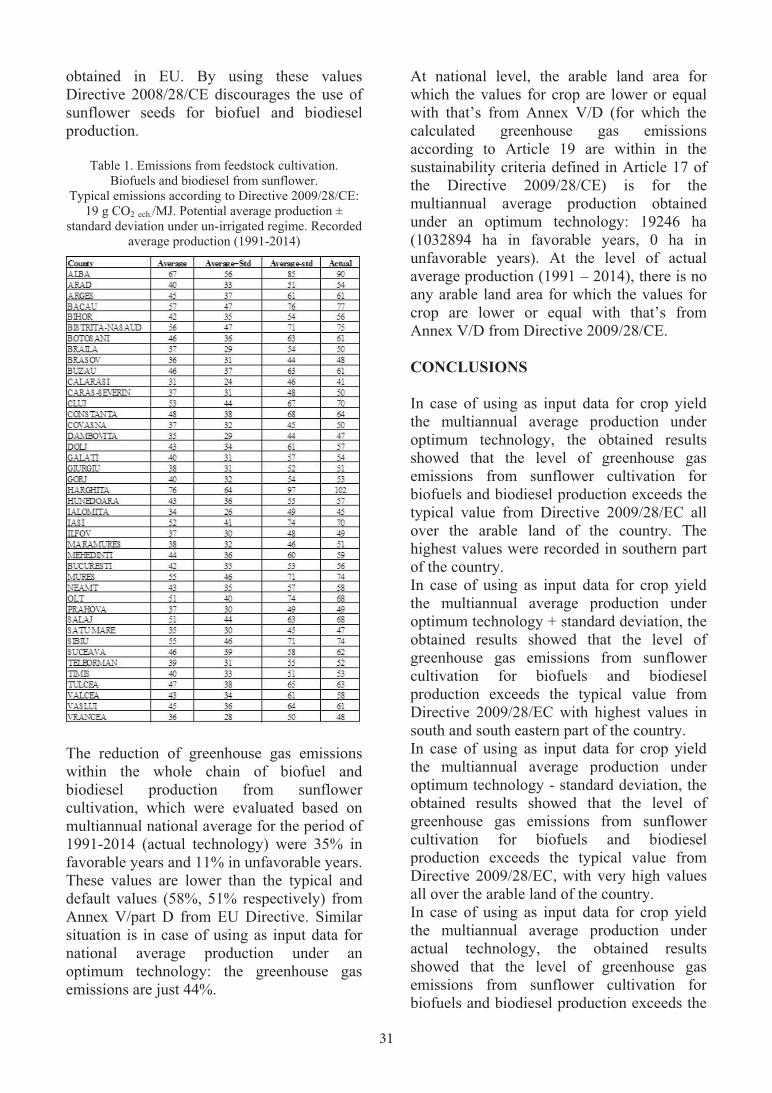
31
biofuels and bioliquids production exceeds the typical value from Directive 2009/28/EC (19 g CO2 ech./MJ) all over the arable land of the country. The highest values are recorded in southern part of the country (Figure 1). In case of using as input data for crop yield the multiannual average production under optimum technology + standard deviation, the obtained results showed that the level of greenhouse gas emissions from sunflower cultivation for biofuels and biodiesel production exceeds the typical value from Directive 2009/28/EC (19 g CO2 ech./MJ) with highest values in south and south eastern part of the country (Figure 2).
Figure 2. Biofuels and biodiesel from sunflower seeds.
Spatial distribution of emissions from feedstock cultivation. Multiannual average production under
optimum technology + standard deviation (favorable years for sunflower cultivation)
Figure 3. Biofuels and biodiesel from sunflower seeds.
Spatial distribution of emissions from feedstock cultivation. Multiannual average production under
optimum technology - standard deviation (unfavorable years for sunflower cultivation)
In case of using as input data for crop yield the multiannual average production under optimum technology - standard deviation, the obtained results showed that the level of greenhouse gas emissions from sunflower cultivation for biofuels and biodiesel production exceeds the typical value from Directive 2009/28/EC (19 g CO2 ech./MJ), with very high values all over the arable land of the country (Figure 3). In case of using as input data for crop yield the multiannual average production under actual technology, the obtained results showed that the level of greenhouse gas emissions from sunflower cultivation for biofuels and biodiesel production exceeds the typical value from Directive 2009/28/EC (19 g CO2 ech./MJ), with very high values all over the arable land of the country (Figure 4).
Figure 4. Biofuels and biodiesel from sunflower seeds.
Spatial distribution of emissions from feedstock cultivation. Multiannual average production under
actual technology (1991 – 2014) The aggregation of these results at NUTS3 level showed that the default values for typical emissions included in the Directive are not reached even in case of optimum technology applied in favorable years for sunflower cultivation (average production + standard deviation). The greenhouse gas emissions had the lowest values in Braila, Ialomita and Calarasi counties (Table 1). This situation is a consequence of the fact that the level of the crop yields for which the default values from Annex 5 were established are very high (3600 kg/ha), more than double of the average production of sunflower seeds
obtained in EU. By using these values Directive 2008/28/CE discourages the use of sunflower seeds for biofuel and biodiesel production.
Table 1. Emissions from feedstock cultivation. Biofuels and biodiesel from sunflower.
Typical emissions according to Directive 2009/28/CE: 19 g CO2 ech./MJ. Potential average production ±
standard deviation under un-irrigated regime. Recorded average production (1991-2014)
The reduction of greenhouse gas emissions within the whole chain of biofuel and biodiesel production from sunflower cultivation, which were evaluated based on multiannual national average for the period of 1991-2014 (actual technology) were 35% in favorable years and 11% in unfavorable years. These values are lower than the typical and default values (58%, 51% respectively) from Annex V/part D from EU Directive. Similar situation is in case of using as input data for national average production under an optimum technology: the greenhouse gas emissions are just 44%.
At national level, the arable land area for which the values for crop are lower or equal with that’s from Annex V/D (for which the calculated greenhouse gas emissions according to Article 19 are within in the sustainability criteria defined in Article 17 of the Directive 2009/28/CE) is for the multiannual average production obtained under an optimum technology: 19246 ha (1032894 ha in favorable years, 0 ha in unfavorable years). At the level of actual average production (1991 – 2014), there is no any arable land area for which the values for crop are lower or equal with that’s from Annex V/D from Directive 2009/28/CE. CONCLUSIONS In case of using as input data for crop yield the multiannual average production under optimum technology, the obtained results showed that the level of greenhouse gas emissions from sunflower cultivation for biofuels and biodiesel production exceeds the typical value from Directive 2009/28/EC all over the arable land of the country. The highest values were recorded in southern part of the country. In case of using as input data for crop yield the multiannual average production under optimum technology + standard deviation, the obtained results showed that the level of greenhouse gas emissions from sunflower cultivation for biofuels and biodiesel production exceeds the typical value from Directive 2009/28/EC with highest values in south and south eastern part of the country. In case of using as input data for crop yield the multiannual average production under optimum technology - standard deviation, the obtained results showed that the level of greenhouse gas emissions from sunflower cultivation for biofuels and biodiesel production exceeds the typical value from Directive 2009/28/EC, with very high values all over the arable land of the country. In case of using as input data for crop yield the multiannual average production under actual technology, the obtained results showed that the level of greenhouse gas emissions from sunflower cultivation for biofuels and biodiesel production exceeds the

32
RESEARCH REGARDING THE SUSTAINABLE DEVELOPMENT
OF AGRITOURISM IN THE NEIGHBOURING AREA OF COZIA NATIONAL PARK, ROMANIA
Aurel CĂLINA, Jenica CĂLINA, Ion STAN
University of Craiova, Faculty of Agronomy, 19 Libertății, 200421 Craiova, Romania
Corresponding author email: [email protected]
Abstract The work was performed based on the research undertaken over a period of more than 20 years on the activity of agritourism and rural tourism in Oltenia, aimed at the touristic and agritourist potential of the neighbouring and protected area of Cozia National Park. Through careful research and SWOT analysis, it was concluded that the studied area possesses a very rich and valuable touristic and anthropic potential, which presently has not been sufficiently utilized. Furthermore, a veritable capacity of attracting tourists was discovered through large quasi-virgin areas, of great originality and variability, which have suffered almost no human intervention. These areas enjoy a rich flora and fauna with unique species in Europe and a relatively large number of touristic attractions and monuments of nature, included on the list of UNESCO world heritage. The research clearly underlines the impact of industrial tourism over time, on the natural and anthropic environment, realising that almost all of its components have been reversibly or irreversibly affected. The final conclusion is that the only viable option of agritourism and tourism that can be practiced in the area of National Parks is based on the principle of ecologic sustainability, which would not damage the natural and built environment and would have a favourable impact on the economic and social-cultural life. In this paper, a series of general recommendations are clearly formulated, on the implementation, strategies, policies, directions and objectives of development of this form of tourism. Key words: agritourism, ecosystem, pollution, protected area, resources. INTRODUCTION The problem of sustainable development takes part on global level in a veritable trend to change the planet, to combat pollution, fight against drainage of resources, protection of varieties of biosphere, saving of species and, is based on a set of new values, mirroring a new cultural mentality as compared to nature embraced especially by the younger generation (Maliţa, 1998). Presently, the concept that enjoys the largest audience among the specialists on a global level is that of sustainable development, which is often used as a synonym along with those of viable development, sustainable, human and even ecological. This represents the manifestation of economic development falling within the scope of using the planet’s natural resources, forms of conventional and non-conventional energy, while at the same time protecting and preserving the environment, representing a trend to save nature and our
natural surroundings (Stănciulescu, 2000; Cândea, 2006). The World Commission on Environment and Development defines sustainable development as being “a development that meets the needs of the present without compromising the ability of future generations to meet their own needs". The Finnish economist Malaska explains more comprehensively: “Human development is ecologically sustainable, in relation to the environment, if the interventions and effects imposed by human activities, whether economical, technological, social or cultural, do not alter the rate of change of nature and ecosystems in a way which is not controllable by nature or in an irreversible way from the point of view of future generations”. Essential for sustainable development is the respect for the interests of those who come after us. The central idea is not to exhaust resources needed, preoccupation which did not characterize the pre-modern or modern economy (Iagăru et al., 2016; Păcurar et al., 2014).
typical value from Directive 2009/28/EC, with very high values all over the arable land of the country. The aggregation of these results at NUTS3 level showed that the default values for typical emissions included in the Directive are not reached even in case of optimum technology applied in favorable years for sunflower cultivation (average production + standard deviation). The greenhouse gas emissions had the lowest values in Braila, Ialomita and Calarasi counties. The reduction of greenhouse gas emissions within the whole chain of biofuel and biodiesel production from sunflower cultivation, which were evaluated based on multiannual national average for the period of 1991-2014 (actual technology) were 35% in favorable years and 11% in unfavorable years. At national level, the arable land area for which the values for crop are lower or equal with that’s from Annex V/D is for the multiannual average production obtained under an optimum technology. At the level of actual average production (1991 - 2014), there is no any arable land area for which the values for crop are lower or equal with that’s from Annex V/D from Directive 2009/28/CE.
REFERENCES Carlo Hamelinck, Klaas Koop, Harry Croezen,
Michele Koper, Bettina Kampman, Geert Bergsma, 2008. Technical Specification: Greenhouse Gas Calculator for Biofuels, Version 2.1b, ECOFYS & CE Delft Report, Netherland, 95 pp.
Jeremy Woods, Gareth Brown, Alexander Estrin, 2005. Bioethanol Greenhouse Gas Calculator, Biomass Energy Group, Centre for Environmental Policy, Imperial College London, User’s Guide, 34 pp.
***European Parliament & Council. EU Directive 2009/28/CE, Official Journal of European Union, L 140, p. 16-62, 2009.
***Renewable Fuels Agency. Carbon and Sustainability Reporting Within The Renewable Transport Fuel Obligation, Technical Guidance Part One Carbon Reporting – Default Values and Fuel Chains, 65 pp., 2009.
***Renewable Fuels Agency. Carbon and Sustainability Reporting Within The Renewable Transport Fuel Obligation, Technical Guidance Part Two Carbon Reporting – Default Values and Fuel Chains, 54 pp., 2009.

33
RESEARCH REGARDING THE SUSTAINABLE DEVELOPMENT
OF AGRITOURISM IN THE NEIGHBOURING AREA OF COZIA NATIONAL PARK, ROMANIA
Aurel CĂLINA, Jenica CĂLINA, Ion STAN
University of Craiova, Faculty of Agronomy, 19 Libertății, 200421 Craiova, Romania
Corresponding author email: [email protected]
Abstract The work was performed based on the research undertaken over a period of more than 20 years on the activity of agritourism and rural tourism in Oltenia, aimed at the touristic and agritourist potential of the neighbouring and protected area of Cozia National Park. Through careful research and SWOT analysis, it was concluded that the studied area possesses a very rich and valuable touristic and anthropic potential, which presently has not been sufficiently utilized. Furthermore, a veritable capacity of attracting tourists was discovered through large quasi-virgin areas, of great originality and variability, which have suffered almost no human intervention. These areas enjoy a rich flora and fauna with unique species in Europe and a relatively large number of touristic attractions and monuments of nature, included on the list of UNESCO world heritage. The research clearly underlines the impact of industrial tourism over time, on the natural and anthropic environment, realising that almost all of its components have been reversibly or irreversibly affected. The final conclusion is that the only viable option of agritourism and tourism that can be practiced in the area of National Parks is based on the principle of ecologic sustainability, which would not damage the natural and built environment and would have a favourable impact on the economic and social-cultural life. In this paper, a series of general recommendations are clearly formulated, on the implementation, strategies, policies, directions and objectives of development of this form of tourism. Key words: agritourism, ecosystem, pollution, protected area, resources. INTRODUCTION The problem of sustainable development takes part on global level in a veritable trend to change the planet, to combat pollution, fight against drainage of resources, protection of varieties of biosphere, saving of species and, is based on a set of new values, mirroring a new cultural mentality as compared to nature embraced especially by the younger generation (Maliţa, 1998). Presently, the concept that enjoys the largest audience among the specialists on a global level is that of sustainable development, which is often used as a synonym along with those of viable development, sustainable, human and even ecological. This represents the manifestation of economic development falling within the scope of using the planet’s natural resources, forms of conventional and non-conventional energy, while at the same time protecting and preserving the environment, representing a trend to save nature and our
natural surroundings (Stănciulescu, 2000; Cândea, 2006). The World Commission on Environment and Development defines sustainable development as being “a development that meets the needs of the present without compromising the ability of future generations to meet their own needs". The Finnish economist Malaska explains more comprehensively: “Human development is ecologically sustainable, in relation to the environment, if the interventions and effects imposed by human activities, whether economical, technological, social or cultural, do not alter the rate of change of nature and ecosystems in a way which is not controllable by nature or in an irreversible way from the point of view of future generations”. Essential for sustainable development is the respect for the interests of those who come after us. The central idea is not to exhaust resources needed, preoccupation which did not characterize the pre-modern or modern economy (Iagăru et al., 2016; Păcurar et al., 2014).
typical value from Directive 2009/28/EC, with very high values all over the arable land of the country. The aggregation of these results at NUTS3 level showed that the default values for typical emissions included in the Directive are not reached even in case of optimum technology applied in favorable years for sunflower cultivation (average production + standard deviation). The greenhouse gas emissions had the lowest values in Braila, Ialomita and Calarasi counties. The reduction of greenhouse gas emissions within the whole chain of biofuel and biodiesel production from sunflower cultivation, which were evaluated based on multiannual national average for the period of 1991-2014 (actual technology) were 35% in favorable years and 11% in unfavorable years. At national level, the arable land area for which the values for crop are lower or equal with that’s from Annex V/D is for the multiannual average production obtained under an optimum technology. At the level of actual average production (1991 - 2014), there is no any arable land area for which the values for crop are lower or equal with that’s from Annex V/D from Directive 2009/28/CE.
REFERENCES Carlo Hamelinck, Klaas Koop, Harry Croezen,
Michele Koper, Bettina Kampman, Geert Bergsma, 2008. Technical Specification: Greenhouse Gas Calculator for Biofuels, Version 2.1b, ECOFYS & CE Delft Report, Netherland, 95 pp.
Jeremy Woods, Gareth Brown, Alexander Estrin, 2005. Bioethanol Greenhouse Gas Calculator, Biomass Energy Group, Centre for Environmental Policy, Imperial College London, User’s Guide, 34 pp.
***European Parliament & Council. EU Directive 2009/28/CE, Official Journal of European Union, L 140, p. 16-62, 2009.
***Renewable Fuels Agency. Carbon and Sustainability Reporting Within The Renewable Transport Fuel Obligation, Technical Guidance Part One Carbon Reporting – Default Values and Fuel Chains, 65 pp., 2009.
***Renewable Fuels Agency. Carbon and Sustainability Reporting Within The Renewable Transport Fuel Obligation, Technical Guidance Part Two Carbon Reporting – Default Values and Fuel Chains, 54 pp., 2009.
AgroLife Scientific Journal - Volume 6, Number 2, 2017ISSN 2285-5718; ISSN CD-ROM 2285-5726; ISSN ONLINE 2286-0126; ISSN-L 2285-5718

34
The general current strategy of international development also led to the development of world tourism, desiring to introduce a new economic world order and to gradually reduce the existent discrepancy between industrialised countries and developing countries. In this respect, tourism and implicitly agritourism are considered a major activity in the lives of nations because of the direct influence on social, cultural, educative and economic sectors with large openness to international exchanges (Bran, 1997, 1998; Comen, 2006). If we refer to the evolution of tourism at present, it is characterised by a profound renewal of world tourism offer, especially by the development of a new tourist product range, higher from the qualitative and quantitative point of view. Tourism, more than any other field of activity, is dependent on the environment, this representing its primary matter, the object and the field of activity and of carrying out of tourism being its framework support, the bearer of its resources. Tourism is carried out in the environment and through the environment, its quality being able to favour or to deny tourist activities. The more the resources are varied and more complex, and especially not altered, with properties as close as possible to the primary ones, the more their tourist's interest is higher, and the activities which are generated by them are more valuable and more attractive, answering to various tourist motivations (Stănciulescu, 2000). The appreciation made by the Swiss specialist professor J. Krippendorf (1987) is very conclusive: „If we can lose, and then rebuild capital in other economic fields, it is not the same thing in tourism, where the basic substance – landscape and land – once lost, is irremediably lost”. MATERIALS AND METHODS The work presents in the first part the quality and favourability of tourist resources in Cozia National Park, in performing agritourism and rural tourism activities, and then an analysis regarding their sustainable development in the researched area is carried out. The methodology used in assessing and diagnosing the agritourist phenomenon in the area is the one presented by Glăvan (2002) and
Călina et al. (2017): observation, getting of information – as basic method, being thus emphasised aspects such as: tourism environment, tourism resources, tourism infrastructure, etc.; description, presentation of facts – as means of rendering, presenting all noticed elements; analysis, investigation – which comprises involvement of a set of instruments, techniques and methods of enhancement and explanation of relations which are established between the elements of tourist phenomenon. Emphasis is put first of all on the 3 interdependent elements of agritourism and rural tourism: attraction towards the beauties of nature, novelties, charm and events specific to life in the countryside; accommodation and meal, without having the expectation to be at hotel standards, but to be of quality and offered with hospitality; transport, access routes to the rural environment are primordial elements to ensure a continuous flow of tourists. The main aspects aimed are particularised by Călina and Călina (2011): 1. Environmental context a) Relief. The studied area comprised in Brezoi – Titeşti inter-Carpathian depression and a part of the Getic perimeter, or the Getic depression formed in the Carpathian geosyncline, where sedimentary, marine and alluvial deposits are predominant, where the system of Olt river with its median direction carved deep valleys, (33% mountains, 45% foothills, 20% sub-Carpathian hills and depressions and 2% flood plains), marked by pronounced fragmentations. The area presents a relief of mountain and hill with sub-Carpathian depressions and plateau hills. The high step is constituted by mountains and comprises Căpăţânii and Lotrului peaks, Cozia massif and, partially, the southern sector of Făgăraş Mountains and Tara Loviştei intermountain depression. b) Climate. As in the territory of the studied area various forms of relief are found, which by their orographic particularities influence the carrying out of thermal, wind and atmospheric rainfall conditions, the climate, although a moderate continental one, has certain nuances which are imposed first of all by the relief in steps, from heights exceeding 2000 m (Suru, Mizgavu) and up to 300-400 m in Drăgăşanilor «plain». Under these circumstances, we meet
oscillations of temperature varying from -2º C (in the mountains) and +11º C (in the southern part of the area), the winters are longer and rich in precipitations, and the summers are sometimes short. The months of July, August and September provide the best conditions to organise trips. The annual average of the temperature in Râmnicu Vâlcea is of 10.2º C. c) Hydrography. The main axle of the entire hydrographic network of the area is Olt river, and its most important tributary is Lotru river, which springs from Parâng Mountains and gathers the waters from the northern versants of Căpăţânii Mountains and the southern ones of Lotru Mountains. It has a length of 80 km and the area of the hydrographic basin is just about 1000 km2, over which a density of hydrographic network of 0.77 km/km2 is overlapped, greater than the entire sector (0.65 km/km2), but specific to a mountain area. In Parâng Mountains, the glacial lakes Câlcescu – from which the Lotru river springs - Găuri, Lacul lui Vidal, Pisari and others originate from the accumulation of water in the cauldrons of former cirque glaciers. Glacial lakes of a rare beauty are also found in Latoriţei – Cioara, Iezeraşul Latoriţei, Muntinul Mic and Singuraticul Mountains (Călina and Călina, 2011). d) Vegetation. The forests cover in 93% of cases the Cozia, Narăţu, Doabra-Călineşti massifs. The main existent levels of vegetation are represented by multi-tiered forests, depending on the altitude, from 300 m to 1667 m. The general composition of the forests in Cozia Natioanl Park is mainly formed of beech (57%), holm (14%), spruce (18%) and mixed species: hornbeam, cherry, lime, manna, etc. (11%). The area of brushes aged over 80 years is of 62%, and the quasi-virgin natural brushes total over 6000 ha. The scientific value of Cozia National Park is constituted by the existence on large areas of forestry ecosystems and natural meadows, slightly altered by human intervention, of great originality and variability. Among the rare plants in the flora of our country, in Cozia – Narutu area grow: sânzâiene (goldenrods) (Galium kitaibelianum Schult.), which are found only in the Romanian Carpathians Mountains, garofiţa albă (white mini-carnation) (Dianthus spiculifolius Schur.), glacial relict which grows only in the
Romanian Carpathians, laleaua (Tulipa) (Fritillaria montana Hoppe ex W.D.J. Koch), gladioli (Gladiolus imbricatus L.), albina (dark-bee orchid) (Ophrys fusca Link.), a Mediterranean orchid which is a Neozoic relict, located here in the most northerly European station and other rare species. Moreover, the Cozia – Narutu mountain area is rich in endemic species whether to Carpathians, or to the entire country. We mention just a few: Dianthus kitaibelii ssp. spiculifolium Schur., Dianthus henteri Heuff. ex Griseb. & Schenk, Centaurea coziensis Nyár. (vinetele de Cozia - Cozia aubergines), Iris hungarica ssp. dacica (Beldie) Prod. et Nyár., Rosa coziae Nyár. or măceşul Coziei (Cozia dogberry) etc. e) Fauna. Fauna, interesting and rich in species of different origins, keeps almost the same spectrum mentioned in the flora, in the sense of the predominance of European elements. The composition and the repartition of fauna on the studied territory are reflected, like in the case of vegetation, by the climatic particularities, by the diversity and the altitudinal tier of the relief. Consequently, the fauna differentiates as follows: Among the elements of central Europe, we mention here: echinus (Erinaceus europaeus L.), mole (Talpa europaea L.), bear (Ursus arctos L.), squirrel (Sciurus vulgaris L.), wolf (Canis lupus L.), lynx (Lynx lynx L.), wild cat (Felis silvestris Schreber), marten (Martes martes L.), weasel (Mustela nivalis L.), deer (Cervus elaphus L.), doe (Capreolus capreolus L.) and badger (Meles meles L.) among the mammals, and among the birds we mention: nutcracker (Nucifraga caryocatactes L.), jay (Garrulus glandarius L.), robin (Erithacus rubecula L.), ox-eye (Troglodytes troglodytes L.), owl (Athene noctua Scopoli), eagle owl (Strix aluco L.) etc. As elements of the Euro–Siberian fauna, we mention: grosbeak (Coccothraustes coccothraustes L.), which comes in the hot season, crossbill (Loxia recurvirostra Vrolik.), megpie (Pica pica L.), sparrow (Passer domesticus L.), crested lark (Galerita cristata L.), chaffinch (Fringilla coelebs L.), blackbird (Turdus merula L.) a.s.o. The fauna of mammals of Cozia Mountains comprises 39 species, out of which two are protected: chamois (Rupicapra rupicapra
35
The general current strategy of international development also led to the development of world tourism, desiring to introduce a new economic world order and to gradually reduce the existent discrepancy between industrialised countries and developing countries. In this respect, tourism and implicitly agritourism are considered a major activity in the lives of nations because of the direct influence on social, cultural, educative and economic sectors with large openness to international exchanges (Bran, 1997, 1998; Comen, 2006). If we refer to the evolution of tourism at present, it is characterised by a profound renewal of world tourism offer, especially by the development of a new tourist product range, higher from the qualitative and quantitative point of view. Tourism, more than any other field of activity, is dependent on the environment, this representing its primary matter, the object and the field of activity and of carrying out of tourism being its framework support, the bearer of its resources. Tourism is carried out in the environment and through the environment, its quality being able to favour or to deny tourist activities. The more the resources are varied and more complex, and especially not altered, with properties as close as possible to the primary ones, the more their tourist's interest is higher, and the activities which are generated by them are more valuable and more attractive, answering to various tourist motivations (Stănciulescu, 2000). The appreciation made by the Swiss specialist professor J. Krippendorf (1987) is very conclusive: „If we can lose, and then rebuild capital in other economic fields, it is not the same thing in tourism, where the basic substance – landscape and land – once lost, is irremediably lost”. MATERIALS AND METHODS The work presents in the first part the quality and favourability of tourist resources in Cozia National Park, in performing agritourism and rural tourism activities, and then an analysis regarding their sustainable development in the researched area is carried out. The methodology used in assessing and diagnosing the agritourist phenomenon in the area is the one presented by Glăvan (2002) and
Călina et al. (2017): observation, getting of information – as basic method, being thus emphasised aspects such as: tourism environment, tourism resources, tourism infrastructure, etc.; description, presentation of facts – as means of rendering, presenting all noticed elements; analysis, investigation – which comprises involvement of a set of instruments, techniques and methods of enhancement and explanation of relations which are established between the elements of tourist phenomenon. Emphasis is put first of all on the 3 interdependent elements of agritourism and rural tourism: attraction towards the beauties of nature, novelties, charm and events specific to life in the countryside; accommodation and meal, without having the expectation to be at hotel standards, but to be of quality and offered with hospitality; transport, access routes to the rural environment are primordial elements to ensure a continuous flow of tourists. The main aspects aimed are particularised by Călina and Călina (2011): 1. Environmental context a) Relief. The studied area comprised in Brezoi – Titeşti inter-Carpathian depression and a part of the Getic perimeter, or the Getic depression formed in the Carpathian geosyncline, where sedimentary, marine and alluvial deposits are predominant, where the system of Olt river with its median direction carved deep valleys, (33% mountains, 45% foothills, 20% sub-Carpathian hills and depressions and 2% flood plains), marked by pronounced fragmentations. The area presents a relief of mountain and hill with sub-Carpathian depressions and plateau hills. The high step is constituted by mountains and comprises Căpăţânii and Lotrului peaks, Cozia massif and, partially, the southern sector of Făgăraş Mountains and Tara Loviştei intermountain depression. b) Climate. As in the territory of the studied area various forms of relief are found, which by their orographic particularities influence the carrying out of thermal, wind and atmospheric rainfall conditions, the climate, although a moderate continental one, has certain nuances which are imposed first of all by the relief in steps, from heights exceeding 2000 m (Suru, Mizgavu) and up to 300-400 m in Drăgăşanilor «plain». Under these circumstances, we meet
oscillations of temperature varying from -2º C (in the mountains) and +11º C (in the southern part of the area), the winters are longer and rich in precipitations, and the summers are sometimes short. The months of July, August and September provide the best conditions to organise trips. The annual average of the temperature in Râmnicu Vâlcea is of 10.2º C. c) Hydrography. The main axle of the entire hydrographic network of the area is Olt river, and its most important tributary is Lotru river, which springs from Parâng Mountains and gathers the waters from the northern versants of Căpăţânii Mountains and the southern ones of Lotru Mountains. It has a length of 80 km and the area of the hydrographic basin is just about 1000 km2, over which a density of hydrographic network of 0.77 km/km2 is overlapped, greater than the entire sector (0.65 km/km2), but specific to a mountain area. In Parâng Mountains, the glacial lakes Câlcescu – from which the Lotru river springs - Găuri, Lacul lui Vidal, Pisari and others originate from the accumulation of water in the cauldrons of former cirque glaciers. Glacial lakes of a rare beauty are also found in Latoriţei – Cioara, Iezeraşul Latoriţei, Muntinul Mic and Singuraticul Mountains (Călina and Călina, 2011). d) Vegetation. The forests cover in 93% of cases the Cozia, Narăţu, Doabra-Călineşti massifs. The main existent levels of vegetation are represented by multi-tiered forests, depending on the altitude, from 300 m to 1667 m. The general composition of the forests in Cozia Natioanl Park is mainly formed of beech (57%), holm (14%), spruce (18%) and mixed species: hornbeam, cherry, lime, manna, etc. (11%). The area of brushes aged over 80 years is of 62%, and the quasi-virgin natural brushes total over 6000 ha. The scientific value of Cozia National Park is constituted by the existence on large areas of forestry ecosystems and natural meadows, slightly altered by human intervention, of great originality and variability. Among the rare plants in the flora of our country, in Cozia – Narutu area grow: sânzâiene (goldenrods) (Galium kitaibelianum Schult.), which are found only in the Romanian Carpathians Mountains, garofiţa albă (white mini-carnation) (Dianthus spiculifolius Schur.), glacial relict which grows only in the
Romanian Carpathians, laleaua (Tulipa) (Fritillaria montana Hoppe ex W.D.J. Koch), gladioli (Gladiolus imbricatus L.), albina (dark-bee orchid) (Ophrys fusca Link.), a Mediterranean orchid which is a Neozoic relict, located here in the most northerly European station and other rare species. Moreover, the Cozia – Narutu mountain area is rich in endemic species whether to Carpathians, or to the entire country. We mention just a few: Dianthus kitaibelii ssp. spiculifolium Schur., Dianthus henteri Heuff. ex Griseb. & Schenk, Centaurea coziensis Nyár. (vinetele de Cozia - Cozia aubergines), Iris hungarica ssp. dacica (Beldie) Prod. et Nyár., Rosa coziae Nyár. or măceşul Coziei (Cozia dogberry) etc. e) Fauna. Fauna, interesting and rich in species of different origins, keeps almost the same spectrum mentioned in the flora, in the sense of the predominance of European elements. The composition and the repartition of fauna on the studied territory are reflected, like in the case of vegetation, by the climatic particularities, by the diversity and the altitudinal tier of the relief. Consequently, the fauna differentiates as follows: Among the elements of central Europe, we mention here: echinus (Erinaceus europaeus L.), mole (Talpa europaea L.), bear (Ursus arctos L.), squirrel (Sciurus vulgaris L.), wolf (Canis lupus L.), lynx (Lynx lynx L.), wild cat (Felis silvestris Schreber), marten (Martes martes L.), weasel (Mustela nivalis L.), deer (Cervus elaphus L.), doe (Capreolus capreolus L.) and badger (Meles meles L.) among the mammals, and among the birds we mention: nutcracker (Nucifraga caryocatactes L.), jay (Garrulus glandarius L.), robin (Erithacus rubecula L.), ox-eye (Troglodytes troglodytes L.), owl (Athene noctua Scopoli), eagle owl (Strix aluco L.) etc. As elements of the Euro–Siberian fauna, we mention: grosbeak (Coccothraustes coccothraustes L.), which comes in the hot season, crossbill (Loxia recurvirostra Vrolik.), megpie (Pica pica L.), sparrow (Passer domesticus L.), crested lark (Galerita cristata L.), chaffinch (Fringilla coelebs L.), blackbird (Turdus merula L.) a.s.o. The fauna of mammals of Cozia Mountains comprises 39 species, out of which two are protected: chamois (Rupicapra rupicapra
36
carpatica Couturier), recently returned, especially in Narutu Massif, and the lynx (Lynx lynx L.), species that in the last decade increased their number in this part of the country. Of the total of mentioned mammals, 16 species pertain to Rodentia order, and 12 species pertain to Fissipedia order. Habitual of these are the mammals specific to Carpathians: bear, Carpathian deer, pine marten, forest dormouse (Dryomys nitedula Pallas), echinus. The aquatic fauna of Cozia Massif comprises over 130 species, out of which the majority (84) pertain to Passeriformes order, the predominant and qualitative, not only quantitative group of birds. Aquatic fauna is represented by a huge number of invertebrates and over 30 species of fish specific to mountain rivers, such as: trout – Salmo trutta fario L., bullhead – Cotus gobio L., minnow - Phoxynus phoxynus L., nase – Chondrostoma nasus L., barbell – Barbus barbus L., carp – Cyprinus carpio L., Romanian loach – Sabanejewia romanica Băcescu, the last one being endemic in Romania and thus it is imposed to ensure not only the survival of the species as is, but also its survival in as many basins in the country as possible. 2. Position and accessibility - Attractive geographic position between the Danube and the Carpathians; - The region is crossed by 3 European Roads (10,000 km of roads): E 70; E 79; E 81; 4th European Corridor; 5 ports on the Danube and Craiova International Airport. 3. Economical-social and cultural framework - Agriculture and forestry represent 51.2% of the economic activities of the population in the region; - Preponderantly rural population-54.6% of the population in the regions lives in rural environment; - Representative ethnographic centres of the regions are as follows: Horezu, Vaideeni, Polovragi, Ştefăneşti, Bărbăteşti, Somăneşti; - From the cultural point of view, the thesaurus is completed by museums, house museums, historical monuments, monuments of laic, religious arts, archaeological sites etc; moreover, the area is considered to be a land of monasteries, churches and hermitages, being
the second region, after Moldova, as number and importance (Călina and Călina, 2011). In Romania, the problems related to evaluation of the impact on the environment were regulated by Law no. 135/1996, where the detailed provisions to elaborate the environment agreements and balances with the participation of environment agents, and specialized companies in environment issues were established. In the WTO publication “Tourism in the year 2010” it is specified as follows: “Sustainable tourism develops the idea of meeting the needs of present tourists and the tourist industry while protecting and enhancing opportunities for the future. It is envisaged as a leading management of all resources in such a way that we can fulfil economic, social, and aesthetic needs while maintaining cultural integrity, essential ecological processes, biological diversity and life support systems”. RESULTS AND DISCUSSIONS Based on the research and on pursued objectives in the research methodology, the team of experts carried out the SWOT analysis, through which all positive and negative aspects were very clearly, realistically and pertinently emphasized, which may favour or prevent development of sustainable agritourism and tourism in the researched area. Strengths: - richness of natural patrimony of Cozia National Park; - access infrastructure in the protected area insufficiently artificialized; - diversity of natural tourist resources; - fauna and flora rich in species which are unique in Europe; - existence of wild areas, not affected by human intervention; - relatively large number of tourist objectives included in the UNESCO world heritage; - existence of the legislative framework which allows the development of the network of protected areas and their preservation, as well as the necessary conditions to establish the administration for protected areas, in view of initiating their management. Weaknesses: - precarious information and lack of awareness/education in respect to the natural
heritage, of its importance at present, but especially in the future; - chaotic location of constructions and extension of the built-up area in the space in the immediate proximity or even inside the protected natural area, aiming at developing and further execution of buildings or even tourist resorts; - reduced perception of local community near the natural park of the importance of practicing sustainable agritourism and tourism, as supplemental financial source both for the individual and for the local community; - reduced level of training of tourist guides in sustainable agritourism and tourism, as well as of the specialty staff administering the accommodation structures; - the offer of activities and services, as well as the accommodation capacity at the level of the protected area is reduced, and the defective administration of tourist facilities already existent produce large quantities of waste; - the lack of sewers, with wastewater treatment plants – leads to the pollution of brooks; - the irrational exploitation of natural resources by massive felling of trees and inappropriate storage of sawdust, by inadequate grazing and overgrazing, poaching, uncontrolled tourism, etc.; - the lack of an effective administration to initiate a management of sustainable development of the protected area, as well as modern marketing through which its true value, both on a local/regional level may be emphasised, as well as on national/international level. Opportunities: - the increase of the number of internal and external tourists/ visitors who have as motivation sustainable agritourism and tourism, based on ecological principles; - the diversification of specialty offer on sustainable agritourism and tourism, based on ecological principles, by including some representative tourist objectives of Cozia Mountains; - the discovery, diversification and promotion of some events based on „nature calendars” (e.g.: clopping of deer, dance of the grouse, blossom of mountain peony, etc.); - providing facilities to investors in national/natural parks by the administration of
parks, or even by the competent ministries in our country. Threats: - competition on a national and international level in respect to the offer in the field of sustainable agritourism and tourism, based on ecological principles; - superior and high performance systems to manage waste in protected areas and their neighbouring areas, existent in other areas in the country or in the countries in the region; -process of accentuated urbanization of rural population with direct implications in losing immaterial/material cultural heritage existent in the National Park; - probability of decrease of income of communities from the park or in its neighbouring space as result of the restriction of some economic activities specific to the areas, if they are not compensated by the new business opportunities that appear by practicing sustainable agritourism and tourism, based on ecological principles; - proliferation, near Cozia National Park, of some forms of industrial tourism, to make unfair competition, due to the non-observance of the minimum conditions to protect natural and built environment; Moreover, research carried out on the tourism potential of Cozia National Park and especially on natural and anthropic tourist resources, aimed the identification, inventory and analysis of main types of impact caused to the natural and built environment as follows in table 1 (phenomenon also stressed out by Bran et al., 1997, 1998; Bălteanu et al., 2008). From the analysis of data collected on site, it was established that the main factors which significantly contributed to the increase of agritourism implicitly, are as follows, factors also found by Lieth &Whttaker (1995): - substantial increase of tourist circulation and of the number of tourists on a local, regional or even national and international level; - emersion of complex developments and facilities in the area, for winter sports or spa treatment; - increase of the number of tourist structures of different types and sizes, as well as of those of public food; - substantial increase of road and railway traffic, in particular, and less of air traffic;
37
carpatica Couturier), recently returned, especially in Narutu Massif, and the lynx (Lynx lynx L.), species that in the last decade increased their number in this part of the country. Of the total of mentioned mammals, 16 species pertain to Rodentia order, and 12 species pertain to Fissipedia order. Habitual of these are the mammals specific to Carpathians: bear, Carpathian deer, pine marten, forest dormouse (Dryomys nitedula Pallas), echinus. The aquatic fauna of Cozia Massif comprises over 130 species, out of which the majority (84) pertain to Passeriformes order, the predominant and qualitative, not only quantitative group of birds. Aquatic fauna is represented by a huge number of invertebrates and over 30 species of fish specific to mountain rivers, such as: trout – Salmo trutta fario L., bullhead – Cotus gobio L., minnow - Phoxynus phoxynus L., nase – Chondrostoma nasus L., barbell – Barbus barbus L., carp – Cyprinus carpio L., Romanian loach – Sabanejewia romanica Băcescu, the last one being endemic in Romania and thus it is imposed to ensure not only the survival of the species as is, but also its survival in as many basins in the country as possible. 2. Position and accessibility - Attractive geographic position between the Danube and the Carpathians; - The region is crossed by 3 European Roads (10,000 km of roads): E 70; E 79; E 81; 4th European Corridor; 5 ports on the Danube and Craiova International Airport. 3. Economical-social and cultural framework - Agriculture and forestry represent 51.2% of the economic activities of the population in the region; - Preponderantly rural population-54.6% of the population in the regions lives in rural environment; - Representative ethnographic centres of the regions are as follows: Horezu, Vaideeni, Polovragi, Ştefăneşti, Bărbăteşti, Somăneşti; - From the cultural point of view, the thesaurus is completed by museums, house museums, historical monuments, monuments of laic, religious arts, archaeological sites etc; moreover, the area is considered to be a land of monasteries, churches and hermitages, being
the second region, after Moldova, as number and importance (Călina and Călina, 2011). In Romania, the problems related to evaluation of the impact on the environment were regulated by Law no. 135/1996, where the detailed provisions to elaborate the environment agreements and balances with the participation of environment agents, and specialized companies in environment issues were established. In the WTO publication “Tourism in the year 2010” it is specified as follows: “Sustainable tourism develops the idea of meeting the needs of present tourists and the tourist industry while protecting and enhancing opportunities for the future. It is envisaged as a leading management of all resources in such a way that we can fulfil economic, social, and aesthetic needs while maintaining cultural integrity, essential ecological processes, biological diversity and life support systems”. RESULTS AND DISCUSSIONS Based on the research and on pursued objectives in the research methodology, the team of experts carried out the SWOT analysis, through which all positive and negative aspects were very clearly, realistically and pertinently emphasized, which may favour or prevent development of sustainable agritourism and tourism in the researched area. Strengths: - richness of natural patrimony of Cozia National Park; - access infrastructure in the protected area insufficiently artificialized; - diversity of natural tourist resources; - fauna and flora rich in species which are unique in Europe; - existence of wild areas, not affected by human intervention; - relatively large number of tourist objectives included in the UNESCO world heritage; - existence of the legislative framework which allows the development of the network of protected areas and their preservation, as well as the necessary conditions to establish the administration for protected areas, in view of initiating their management. Weaknesses: - precarious information and lack of awareness/education in respect to the natural
heritage, of its importance at present, but especially in the future; - chaotic location of constructions and extension of the built-up area in the space in the immediate proximity or even inside the protected natural area, aiming at developing and further execution of buildings or even tourist resorts; - reduced perception of local community near the natural park of the importance of practicing sustainable agritourism and tourism, as supplemental financial source both for the individual and for the local community; - reduced level of training of tourist guides in sustainable agritourism and tourism, as well as of the specialty staff administering the accommodation structures; - the offer of activities and services, as well as the accommodation capacity at the level of the protected area is reduced, and the defective administration of tourist facilities already existent produce large quantities of waste; - the lack of sewers, with wastewater treatment plants – leads to the pollution of brooks; - the irrational exploitation of natural resources by massive felling of trees and inappropriate storage of sawdust, by inadequate grazing and overgrazing, poaching, uncontrolled tourism, etc.; - the lack of an effective administration to initiate a management of sustainable development of the protected area, as well as modern marketing through which its true value, both on a local/regional level may be emphasised, as well as on national/international level. Opportunities: - the increase of the number of internal and external tourists/ visitors who have as motivation sustainable agritourism and tourism, based on ecological principles; - the diversification of specialty offer on sustainable agritourism and tourism, based on ecological principles, by including some representative tourist objectives of Cozia Mountains; - the discovery, diversification and promotion of some events based on „nature calendars” (e.g.: clopping of deer, dance of the grouse, blossom of mountain peony, etc.); - providing facilities to investors in national/natural parks by the administration of
parks, or even by the competent ministries in our country. Threats: - competition on a national and international level in respect to the offer in the field of sustainable agritourism and tourism, based on ecological principles; - superior and high performance systems to manage waste in protected areas and their neighbouring areas, existent in other areas in the country or in the countries in the region; -process of accentuated urbanization of rural population with direct implications in losing immaterial/material cultural heritage existent in the National Park; - probability of decrease of income of communities from the park or in its neighbouring space as result of the restriction of some economic activities specific to the areas, if they are not compensated by the new business opportunities that appear by practicing sustainable agritourism and tourism, based on ecological principles; - proliferation, near Cozia National Park, of some forms of industrial tourism, to make unfair competition, due to the non-observance of the minimum conditions to protect natural and built environment; Moreover, research carried out on the tourism potential of Cozia National Park and especially on natural and anthropic tourist resources, aimed the identification, inventory and analysis of main types of impact caused to the natural and built environment as follows in table 1 (phenomenon also stressed out by Bran et al., 1997, 1998; Bălteanu et al., 2008). From the analysis of data collected on site, it was established that the main factors which significantly contributed to the increase of agritourism implicitly, are as follows, factors also found by Lieth &Whttaker (1995): - substantial increase of tourist circulation and of the number of tourists on a local, regional or even national and international level; - emersion of complex developments and facilities in the area, for winter sports or spa treatment; - increase of the number of tourist structures of different types and sizes, as well as of those of public food; - substantial increase of road and railway traffic, in particular, and less of air traffic;

38
- increase of the degree of dissatisfaction of local population due to the irrational development of tourist activities, leading to illegal expropriations and processing of natural resources;
- continuous degradation of the landscape and environment; - extremely reduced number or even the absence of minimum facilities to stop or limit pollution (water treatment plants, incineration of household refuse and others).
Table 1. Types of impact caused to natural and built environment
Impact on natural environment Impact on anthropic environment a. Changes in the composition of flora and fauna species - destruction of valuable vegetal species to crop plants and to valorise wood and cutting of natural vegetation to realise tourist facilities; - restraining the areas of natural reservations, of sanctuaries with wild life; - destruction of the habitat of the species and hunting of animals for pleasure, gastronomic curiosities and souvenirs market; - acting on the internal and external migration of animals. b. Pollution - pollution of soil; - pollution of atmosphere; - pollution of water by discharge of wastewater, discharging of petroleum substances; - sound pollution due to tourist activities and transportations. c. Erosion - increase of the phenomenon and degree of landslides; - trampling and compaction of ground, resulting in the increase of discharge of pluvial water and superficial erosion; - emphasising of processes that trigger avalanches; - affecting o special geological forms and sites (caves, sinkholes); - increase of the level of shore erosion on the main watercourses. d. Natural resources - diminution of the debit of water sources by over-solicitation and over-exploitation; - diminution of classical fuel resources for the necessary energy to support tourist activities; - increase of risk for natural fire. e. Visual impact - tourist structures and facilities (hotels, recreational constructions, auxiliary services); - garbage and waste resulting from tourist circulation.
a. Urban forms - emphasising the contrast between the urban area arranged from the tourist point of view and other residential areas; - modifications in urban structures (industrial areas, residential) and other utilities (leisure, structures to receive tourists) - transformations in equipments and urban furniture (streets, surfacing of roads, paving, lighting) b. Urban environment - set aside of lands: - modification of hydrological, climatic regime. c. Infrastructure - occurrence of new facilities of general and specific infrastructure; - increase or over-loading with elements of infrastructure (roads, railways, parking, electric grills, communication systems, water supply); - re-orientation of environment management, to adapt areas for tourist purposes (winter sports, hiking, escalades, cycling tourism). d. Restoration and competition - re-use and restoration of old urban sites, of historical buildings; - restoration and renovation of old buildings as a second residence; - decline of some tourist attractions or of a region because of the emersion of other attractions or the change of motivation or of tourist habits. e. Visual impact - significant increase of areas occupied by constructions; - new architectural concepts and projects, not harmonised with the existent ones and with the environment; - conglomeration of population and goods.
In order to solve the problems approached within the research theme, from the beginning, the plans of common actions were established, being correlated with those of WTO (World Trade Organisation), WTTC (World Travel and Tourism Council) and the National Strategy for Tourism Development, which are supposed to know and approach the following problems: - first of all, by the research methods, all natural and cultural particularities were inventoried, which may constitute the basis of tourism potential and analysis of all the aspects; - then, all the values and opportunities that may form the basis of sustainable tourism, in protected natural areas with tourism potential were identified;
- clear specification, from the beginning, of the purposes for protection for the protected natural area, with participation of specialists and all interested parties in its tourist exploitation; - multidisciplinary working teams were established and conditions were ensured for a better collaboration with local population, with regional and local organizations interested in tourism; - carrying out of a study regarding the launching in protected natural areas of a new tourist product, based on the amplification of the educational, teaching and scientific role; - analysis of the capacity to support different areas, components of natural areas with tourism potential, to ensure quality at the level of international standards;
-analysis of the degree of exploitation of resources, taking into account the requirements for environment protection and creation of conditions to implement the plans of complex economic arrangement and exploitation; -implementation in the area of a new technical management, appropriate to develop systems of sustainable transportation and a promotional and communication strategy to promote the idea of protected natural area, within the context of creation of new tourism products; -then, the internal and international markets regarding the diversification and the development of tourist activities in protected areas were pursued and analysed and a final appreciation was made concerning all the impacted aspects; -moreover, the programmes that monitor information about natural areas regarding tourist circulation were established, the consequences and the periodical review of plans of tourism development in order to observe environment quality standards; -in the end, specialty consultancy will be provided in supporting travel agents or economic agents, interested in the development of activities that are compliant with the national and local policy on environment protection. General recommendations to achieve sustainable agritourism and tourism Keeping all the tourist-based functions of the national parks and of the biosphere, reservations must have as basis the drafting of specific tourist development plans, which should not be limited to these natural spaces and to be inscribed in a much wider regional context. The isolated actions of partial establishment exclude the achievement of a sustainable tourism. Means of transport, which should be as noiseless as possible, have to be developed and promoted, by using alternative energy sources, and the tourist endowments and equipment must be achieved in such a way and on such a scale, that the fullest harmony with the local environment be achieved, by using local and traditional construction materials. This is demanded for future types of holidays which require low energy costs and which could exploit the least amount of existing resources
and at the same time which should contribute to the environment preservation and safety. Both for tourists and for the local population it is important too that the role and the method of putting into practice the sustainable tourism be explained, as well as the gradual achievement of a life style compatible with the environment international safety standards, something which is very useful for the future generations development requirements. Complying with these basic requirements necessitates a political and economic commitment from all the units interested in the tourism development, providing actual financial support, opening partnerships between the international, national and local bodies. Following these partnership activities, the following measures which are useful in the achievement of a sustainable tourism for the protected natural areas can be elaborated: -rigorous instruments and law provisions on the running legal status consolidation of the national parks and biosphere reservation; -European Charter drafting of practicing sustainable tourism within and outside the protected natural areas; -elaborating a European Action Program for the sustainable tourism which should include putting into practice certain pilot priorities which should prove the touristic and ecologic efficiency of this type of tourism. The impact of the agritourism and rural tourism development in the researched area on the economic, social and cultural life The implementation and development of agritourism and rural tourism in the neighbouring areas and in the Cozia National Park had a particularly favourable effect on all the aspects, but especially upon the inhabitants’ economic, social and cultural life, the mentioned effect being showed by the following: -providing durable and sustainable development of the rural localities by rationally using all the resources, wastes decrease and removal, recycling, providing environment preservation and safety, decrease of the process of taking agricultural and sylvan lands from the agricultural and sylvan circuit, impact also noticed by Louwagie et al. (2009); -stopping the population exodus from the rural areas towards the urban ones, especially of the

39
- increase of the degree of dissatisfaction of local population due to the irrational development of tourist activities, leading to illegal expropriations and processing of natural resources;
- continuous degradation of the landscape and environment; - extremely reduced number or even the absence of minimum facilities to stop or limit pollution (water treatment plants, incineration of household refuse and others).
Table 1. Types of impact caused to natural and built environment
Impact on natural environment Impact on anthropic environment a. Changes in the composition of flora and fauna species - destruction of valuable vegetal species to crop plants and to valorise wood and cutting of natural vegetation to realise tourist facilities; - restraining the areas of natural reservations, of sanctuaries with wild life; - destruction of the habitat of the species and hunting of animals for pleasure, gastronomic curiosities and souvenirs market; - acting on the internal and external migration of animals. b. Pollution - pollution of soil; - pollution of atmosphere; - pollution of water by discharge of wastewater, discharging of petroleum substances; - sound pollution due to tourist activities and transportations. c. Erosion - increase of the phenomenon and degree of landslides; - trampling and compaction of ground, resulting in the increase of discharge of pluvial water and superficial erosion; - emphasising of processes that trigger avalanches; - affecting o special geological forms and sites (caves, sinkholes); - increase of the level of shore erosion on the main watercourses. d. Natural resources - diminution of the debit of water sources by over-solicitation and over-exploitation; - diminution of classical fuel resources for the necessary energy to support tourist activities; - increase of risk for natural fire. e. Visual impact - tourist structures and facilities (hotels, recreational constructions, auxiliary services); - garbage and waste resulting from tourist circulation.
a. Urban forms - emphasising the contrast between the urban area arranged from the tourist point of view and other residential areas; - modifications in urban structures (industrial areas, residential) and other utilities (leisure, structures to receive tourists) - transformations in equipments and urban furniture (streets, surfacing of roads, paving, lighting) b. Urban environment - set aside of lands: - modification of hydrological, climatic regime. c. Infrastructure - occurrence of new facilities of general and specific infrastructure; - increase or over-loading with elements of infrastructure (roads, railways, parking, electric grills, communication systems, water supply); - re-orientation of environment management, to adapt areas for tourist purposes (winter sports, hiking, escalades, cycling tourism). d. Restoration and competition - re-use and restoration of old urban sites, of historical buildings; - restoration and renovation of old buildings as a second residence; - decline of some tourist attractions or of a region because of the emersion of other attractions or the change of motivation or of tourist habits. e. Visual impact - significant increase of areas occupied by constructions; - new architectural concepts and projects, not harmonised with the existent ones and with the environment; - conglomeration of population and goods.
In order to solve the problems approached within the research theme, from the beginning, the plans of common actions were established, being correlated with those of WTO (World Trade Organisation), WTTC (World Travel and Tourism Council) and the National Strategy for Tourism Development, which are supposed to know and approach the following problems: - first of all, by the research methods, all natural and cultural particularities were inventoried, which may constitute the basis of tourism potential and analysis of all the aspects; - then, all the values and opportunities that may form the basis of sustainable tourism, in protected natural areas with tourism potential were identified;
- clear specification, from the beginning, of the purposes for protection for the protected natural area, with participation of specialists and all interested parties in its tourist exploitation; - multidisciplinary working teams were established and conditions were ensured for a better collaboration with local population, with regional and local organizations interested in tourism; - carrying out of a study regarding the launching in protected natural areas of a new tourist product, based on the amplification of the educational, teaching and scientific role; - analysis of the capacity to support different areas, components of natural areas with tourism potential, to ensure quality at the level of international standards;
-analysis of the degree of exploitation of resources, taking into account the requirements for environment protection and creation of conditions to implement the plans of complex economic arrangement and exploitation; -implementation in the area of a new technical management, appropriate to develop systems of sustainable transportation and a promotional and communication strategy to promote the idea of protected natural area, within the context of creation of new tourism products; -then, the internal and international markets regarding the diversification and the development of tourist activities in protected areas were pursued and analysed and a final appreciation was made concerning all the impacted aspects; -moreover, the programmes that monitor information about natural areas regarding tourist circulation were established, the consequences and the periodical review of plans of tourism development in order to observe environment quality standards; -in the end, specialty consultancy will be provided in supporting travel agents or economic agents, interested in the development of activities that are compliant with the national and local policy on environment protection. General recommendations to achieve sustainable agritourism and tourism Keeping all the tourist-based functions of the national parks and of the biosphere, reservations must have as basis the drafting of specific tourist development plans, which should not be limited to these natural spaces and to be inscribed in a much wider regional context. The isolated actions of partial establishment exclude the achievement of a sustainable tourism. Means of transport, which should be as noiseless as possible, have to be developed and promoted, by using alternative energy sources, and the tourist endowments and equipment must be achieved in such a way and on such a scale, that the fullest harmony with the local environment be achieved, by using local and traditional construction materials. This is demanded for future types of holidays which require low energy costs and which could exploit the least amount of existing resources
and at the same time which should contribute to the environment preservation and safety. Both for tourists and for the local population it is important too that the role and the method of putting into practice the sustainable tourism be explained, as well as the gradual achievement of a life style compatible with the environment international safety standards, something which is very useful for the future generations development requirements. Complying with these basic requirements necessitates a political and economic commitment from all the units interested in the tourism development, providing actual financial support, opening partnerships between the international, national and local bodies. Following these partnership activities, the following measures which are useful in the achievement of a sustainable tourism for the protected natural areas can be elaborated: -rigorous instruments and law provisions on the running legal status consolidation of the national parks and biosphere reservation; -European Charter drafting of practicing sustainable tourism within and outside the protected natural areas; -elaborating a European Action Program for the sustainable tourism which should include putting into practice certain pilot priorities which should prove the touristic and ecologic efficiency of this type of tourism. The impact of the agritourism and rural tourism development in the researched area on the economic, social and cultural life The implementation and development of agritourism and rural tourism in the neighbouring areas and in the Cozia National Park had a particularly favourable effect on all the aspects, but especially upon the inhabitants’ economic, social and cultural life, the mentioned effect being showed by the following: -providing durable and sustainable development of the rural localities by rationally using all the resources, wastes decrease and removal, recycling, providing environment preservation and safety, decrease of the process of taking agricultural and sylvan lands from the agricultural and sylvan circuit, impact also noticed by Louwagie et al. (2009); -stopping the population exodus from the rural areas towards the urban ones, especially of the

40
young population, because of the lack of occupation (impact also notified by Comen, 2006; Moinet, 2006); -considerably enhancing the number and volume of investments in the area – in the infrastructure, agriculture, trade and tourism, phenomenon also stressed by Călina et al. (2017); -increasing the level of education, culture and civilisation of the inhabitants from the villages, because by practicing agritourism they need to study, keep themselves updated and continuously perfecting, in order to be up to the level of demands of the guests coming from different social media and countries; -improving of the inhabiting space, the endowment with material elements of modern civilisation (restrooms, running cold and warm water indoors, sewage system, telephone, fax, television, etc.), which represents a true revolution of the degree of material civilisation of the Romanian rural space after the communist period (aspect also found by Stoian 2006); -significant increase of the jobs percentage, especially those occupied by the female personnel, preponderantly attracted in the agritourism activity (Glăvan, 2002; Moinet, 2006); -direct source of capitalization and modernisation of the agricultural exploitations, because the incomes reach directly to the agriculturalist families; -acquiring new professional competence, distinct from that of an agriculturalist - in the field of providing tourist services (impact also found by Giudici & Dessi, 2011); -keeping and perpetuating traditional jobs and crafts such as: pottering, artisanal processing of wood and leather, weaving, painting on glass, handicraft and embroidery, etc.; -substantial decrease of the unemployment rate in the rural space and increase of the incomes of the rural farms and farmsteads engaged in such an activity (also noticed by Marques, 2006); -increasing the standard of living of inhabitants from the rural areas where it developed rapidly and tirelessly (phenomenon also notified by Goodwin, 2003); -recovery of the agricultural building stock and capitalisation of all the cultural traditions from
the rural world and of the typical products from the agriculture and of the traditional gastronomy in the region (Bitsani & Kavoura, 2012); -the possibility to capitalise as efficiently as possible on the elements of representative architecture, civilisation, religion, art and culture, which express a certain cultural identity and develops the tolerance spirit (impact also found by McGehee, 2004); -substantial decrease of the gap between the way of habitation from the rural environment as compared to the urban one. The strategy and policies of sustainable development of agritourism and rural tourism in the researched area of the Cozia National Park Regarding the strategy and policy in the researched area there is the need that modernisation and development of the infrastructure be taken as primary measures and endowment of the area and of localities, the rebuilding and safety of both the natural and built area, of both the spiritual and cultural thesaurus, making population aware and keeping them updated as well as the tourists, privatisation, revitalisation and a wider promotion of tourism. The National Institute of Research and Development in Tourism, based on the studies made, proposes a few primary lines of tourism development, within the global and social and economic strategy of the area, in the context of the environment safety and of the tourist resources and of institutional and organisational regulations of the tourism activity. In order to comply to the demands of I.N.C.D.T. (National Institute for Research and Development in Tourism), it is required, within the sustainable development of agritourism, that in the sustainable development of agritourism and rural tourism, a series of global strategies at the level of the region with rigorous policies and programs should be adopted, based on the partnership between the government, the local authorities and the public and private actors. All these needs to be oriented towards the creation of a responsible administration and of a rigorous and efficient institutional and legislative climate, which can contribute in a decisive manner to the need of
environment safety and rehabilitation, on the territory of the Cozia National Park. The required policies and strategies are as follows: -firstly, promotion policies at the level of all the educational institutions, as well as informing the population regarding the need to practice sustainable tourism and agritourism in the researched area; -policies on the modernisation and development of the general infrastructure and territory and localities endowment; - rigorous policies and a protectionist character on the removal of pollution sources, of ecologic reconstruction and sustainable development, of the natural and built environment safety, of the priceless cultural, historical and spiritual thesaurus; -policies which could favour the sustainable development of tourism and agritourism, as well as their restructuring and modernisation. The development lines of tourism are: -it is primary the development and promotion of specific forms of specialised tourism: scientific (in natural reservations); ecotourism (both in the protected areas, and in the neighbouring areas), speotourism (in the mountains areas), horse riding, etc; -revitalisation and development of the wellness and spa treatment tourism by persistently promoting the prophylactic cure and of fitness in all the tourist resorts; -consolidation and development of repose and relaxation tourism, with emphasis on the diversification of the holiday and recreation offer; -development of the transit tourism, by achieving modern infrastructures for the road and railways traffic, which should not affect in any way the protected area; -promotion of the itinerant tourism with cultural and religious traits; -the maximum capitalisation of the tourist potential of some rural localities; -implementation and promotion in the nearest vicinity of the business and reunions tourism. The objectives which must be included in the development strategy are as follows: -tourist offer diversification; -development of the tourism within the territory and introduction into the circuit of new tourist areas and values:
-restructuring and modernisation of the tourism activity; -achieving an adequate institutional and organisational frame of the tourist activity; -environment and tourist resources safety. CONCLUSIONS From the study of tourism potential of the researched area, we determined that Cozia National Park has a very valuable natural and anthropic tourism potential, represented by the various climate, rich flora, fauna and relief resources, which have not been used and promoted at their true value and beauty in the activity of sustainable tourism and agritourism, both on a local and national level. Practicing of industrial tourism and agritourism, not based on sustainable and ecological principles, led to the manifestation, in protected areas as well as in the neighbouring areas, of negative aspect with strong and almost irreversible impact on the natural and built environment, influencing in a decisive manner the decisions of the research team to rigorously and scientifically study and the necessity of implementation of sustainable tourism and agritourism. With an experience of more than 25 years in the evolution of tourism, in general, and of agritourism in particular, we came to the conclusion that these activities had a very unfavourable impact on the protected areas as, between 1990-2000 the so-called wild tourism was practiced, which rapidly and chaotically developed, with no respect for the natural and anthropic environment. Subsequently with the creation of a legislation in the field and the increase in the level of knowledge and information of the local population and authorities, the foundations of a new type of tourism was establish, based on sustainable and ecological principles, which served to obtain advantages both for the environment as well as for the local population. Paying close attention and balancing the negative aspects caused by the impact of the tourism activity in general on the environment and the advantages which are gained by practicing this new type of tourism with revolutionary aspects, based on ecological principles, we determined that the two concepts, preservation of natural and anthropic environment and tourism, may be compatible

41
young population, because of the lack of occupation (impact also notified by Comen, 2006; Moinet, 2006); -considerably enhancing the number and volume of investments in the area – in the infrastructure, agriculture, trade and tourism, phenomenon also stressed by Călina et al. (2017); -increasing the level of education, culture and civilisation of the inhabitants from the villages, because by practicing agritourism they need to study, keep themselves updated and continuously perfecting, in order to be up to the level of demands of the guests coming from different social media and countries; -improving of the inhabiting space, the endowment with material elements of modern civilisation (restrooms, running cold and warm water indoors, sewage system, telephone, fax, television, etc.), which represents a true revolution of the degree of material civilisation of the Romanian rural space after the communist period (aspect also found by Stoian 2006); -significant increase of the jobs percentage, especially those occupied by the female personnel, preponderantly attracted in the agritourism activity (Glăvan, 2002; Moinet, 2006); -direct source of capitalization and modernisation of the agricultural exploitations, because the incomes reach directly to the agriculturalist families; -acquiring new professional competence, distinct from that of an agriculturalist - in the field of providing tourist services (impact also found by Giudici & Dessi, 2011); -keeping and perpetuating traditional jobs and crafts such as: pottering, artisanal processing of wood and leather, weaving, painting on glass, handicraft and embroidery, etc.; -substantial decrease of the unemployment rate in the rural space and increase of the incomes of the rural farms and farmsteads engaged in such an activity (also noticed by Marques, 2006); -increasing the standard of living of inhabitants from the rural areas where it developed rapidly and tirelessly (phenomenon also notified by Goodwin, 2003); -recovery of the agricultural building stock and capitalisation of all the cultural traditions from
the rural world and of the typical products from the agriculture and of the traditional gastronomy in the region (Bitsani & Kavoura, 2012); -the possibility to capitalise as efficiently as possible on the elements of representative architecture, civilisation, religion, art and culture, which express a certain cultural identity and develops the tolerance spirit (impact also found by McGehee, 2004); -substantial decrease of the gap between the way of habitation from the rural environment as compared to the urban one. The strategy and policies of sustainable development of agritourism and rural tourism in the researched area of the Cozia National Park Regarding the strategy and policy in the researched area there is the need that modernisation and development of the infrastructure be taken as primary measures and endowment of the area and of localities, the rebuilding and safety of both the natural and built area, of both the spiritual and cultural thesaurus, making population aware and keeping them updated as well as the tourists, privatisation, revitalisation and a wider promotion of tourism. The National Institute of Research and Development in Tourism, based on the studies made, proposes a few primary lines of tourism development, within the global and social and economic strategy of the area, in the context of the environment safety and of the tourist resources and of institutional and organisational regulations of the tourism activity. In order to comply to the demands of I.N.C.D.T. (National Institute for Research and Development in Tourism), it is required, within the sustainable development of agritourism, that in the sustainable development of agritourism and rural tourism, a series of global strategies at the level of the region with rigorous policies and programs should be adopted, based on the partnership between the government, the local authorities and the public and private actors. All these needs to be oriented towards the creation of a responsible administration and of a rigorous and efficient institutional and legislative climate, which can contribute in a decisive manner to the need of
environment safety and rehabilitation, on the territory of the Cozia National Park. The required policies and strategies are as follows: -firstly, promotion policies at the level of all the educational institutions, as well as informing the population regarding the need to practice sustainable tourism and agritourism in the researched area; -policies on the modernisation and development of the general infrastructure and territory and localities endowment; - rigorous policies and a protectionist character on the removal of pollution sources, of ecologic reconstruction and sustainable development, of the natural and built environment safety, of the priceless cultural, historical and spiritual thesaurus; -policies which could favour the sustainable development of tourism and agritourism, as well as their restructuring and modernisation. The development lines of tourism are: -it is primary the development and promotion of specific forms of specialised tourism: scientific (in natural reservations); ecotourism (both in the protected areas, and in the neighbouring areas), speotourism (in the mountains areas), horse riding, etc; -revitalisation and development of the wellness and spa treatment tourism by persistently promoting the prophylactic cure and of fitness in all the tourist resorts; -consolidation and development of repose and relaxation tourism, with emphasis on the diversification of the holiday and recreation offer; -development of the transit tourism, by achieving modern infrastructures for the road and railways traffic, which should not affect in any way the protected area; -promotion of the itinerant tourism with cultural and religious traits; -the maximum capitalisation of the tourist potential of some rural localities; -implementation and promotion in the nearest vicinity of the business and reunions tourism. The objectives which must be included in the development strategy are as follows: -tourist offer diversification; -development of the tourism within the territory and introduction into the circuit of new tourist areas and values:
-restructuring and modernisation of the tourism activity; -achieving an adequate institutional and organisational frame of the tourist activity; -environment and tourist resources safety. CONCLUSIONS From the study of tourism potential of the researched area, we determined that Cozia National Park has a very valuable natural and anthropic tourism potential, represented by the various climate, rich flora, fauna and relief resources, which have not been used and promoted at their true value and beauty in the activity of sustainable tourism and agritourism, both on a local and national level. Practicing of industrial tourism and agritourism, not based on sustainable and ecological principles, led to the manifestation, in protected areas as well as in the neighbouring areas, of negative aspect with strong and almost irreversible impact on the natural and built environment, influencing in a decisive manner the decisions of the research team to rigorously and scientifically study and the necessity of implementation of sustainable tourism and agritourism. With an experience of more than 25 years in the evolution of tourism, in general, and of agritourism in particular, we came to the conclusion that these activities had a very unfavourable impact on the protected areas as, between 1990-2000 the so-called wild tourism was practiced, which rapidly and chaotically developed, with no respect for the natural and anthropic environment. Subsequently with the creation of a legislation in the field and the increase in the level of knowledge and information of the local population and authorities, the foundations of a new type of tourism was establish, based on sustainable and ecological principles, which served to obtain advantages both for the environment as well as for the local population. Paying close attention and balancing the negative aspects caused by the impact of the tourism activity in general on the environment and the advantages which are gained by practicing this new type of tourism with revolutionary aspects, based on ecological principles, we determined that the two concepts, preservation of natural and anthropic environment and tourism, may be compatible
42
STUDY REGARDING THE INFLUENCE OF FERTILIZATION ON SOME PHYSIOLOGICAL INDEX AND BIOCHEMICAL COMPOSITION OF PEPPERMINT OILS (Mentha piperita L.)
Dorin CAMEN, Carmen DRAGOMIR, Cosmin POPESCU, Tiberiu IANCU, Sorin STANCIU, Roxana LUCA, Nicoleta HĂDĂRUGĂ, Mihaela MOATĂR,
Eleonora NISTOR, Florin SALA
Banat`s University of Agricultural Sciences and Veterinary Medicine “King Michael I of Romania”, 119 Calea Aradului, 300645, Timişoara, Romania
Corresponding author email: [email protected]
Abstract Essential oils and other aromatic compounds from peppermint (Mentha piperita L.) are widely used for their medicinal and aromotherapeutic properties in health care, traditional medicines, in preparing pharmaceuticals and cosmetics or for culinary purposes. The present study evaluated the variation of certain physiological indices (rate of photorespiration – E; stem dry matter – SDM; leaf dry matter content - LDM; chlorophyll molecules Chl; rate of photosynthesis – PSN) and quality of essential oil from peppermint cultivated under controlled environmental conditions based on Hoagland nutrient solution with addition of P and K. It was recorded the variation of physiological indexes, in relation with Hoagland solution changes. Accordingly, for rate of photorespiration was found a medium positive correlation with potassium (r = 0.672), and a strong relationship with chlorophyll (r = -0.841). Stem dry matter and phosphorus were strong negative correlated (r = -0.898). The leaf dry matter was very strong negative (r = -0.999) influenced by P, and weak correlated with K (r = 0.536). Chlorophyll was very strong and negative influenced by K (r = -0.966). The rate of photosynthesis and stem dry matter were weak correlated (r = - 0.441). PSN and chlorophyll were very strong negative correlated (r = -0.966), and contrary the rate of photorespiration was strongly and positive correlated with PSN (r = 0.952). K had a strong and positive influence on PSN (r = 0.866). Amid these interdependencies of the nutrition conditions and physiological indices were identified high levels of special compounds in the peppermint essential oil: menthone 17%, menthol 33%, izometil acetate 5%, limonene 2%, pulegone 1.8% and from sesquiterpenes was determined β-caryophyllene with a 1.2% concentration. Key words: compounds, essential oil, herb, Hoagland solution, peppermint. INTRODUCTION Peppermint (Mentha piperita L.) is a species of special importance in the pharmaceutical, healthcare, cosmetic, food industry, etc, for essential oils and specific compounds involved in various treatments, alternative and complementary therapies (Ali et al., 2015). The compounds of mint (herbs) and essential oil have been identified with antioxidant and antibacterial activity (Singh et al., 2015). Peppermint has been cultivated and studied in relation to different types of nutritive media, soil, biosolids (Scavroni et al., 2005) nutrient solutions for hydroponic systems or nutrient layer (Garlet et al., 2013). Peppermint relationship with nutrients was studied concerning the herb and oil production. Jeliazkova et al. (1999) evaluated the influence
of NPK in different doses on the production of peppermint oil and recorded increases between 23-86% compared to variant control. The influence of nutrition or fertilizer has been studied both in medicinal and aromatic plants in relation to plant growth, biomass (herb), essential oils quantity and their content in nutrients (Khalid, 2012). Brown et al. (2003) studying the nutrients management influence in the peppermint production, found out that P and K are accumulated in peppermint plants during the growing season with a high correlation (R2 = 0.838) for P and (R2 = 0.894) for K. Tabatabaie and Nazari (2007) studied the influence of nutrients concentration and salinity on some physiological indices and essential oil production in peppermint and lemon verbena, and found out that increased levels of electrical
only if the latter is implemented and developed on healthy principles, which do not prejudice in any way the natural and built environment. Moreover, the research team, based on practical knowledge and experience gained over the years of research, formulated several general recommendations which may influence in a positive manner the development of tourism, and elaborated a plan of strategies and policies aiming at promoting, on the level of all educational and local administration institutions, the necessity to practice sustainable tourism and agritourism, the development of general infrastructure and fitting of the territory and the localities, protectionist policing regarding elimination of pollution sources and the invaluable cultural-historical and spiritual thesaurus. A particularly important contribution regarding the research is shaping the direction of tourism development in general, which mainly aims at practicing scientific tourism, focused on knowledge and protection of environment of protected areas, ecological tourism, itinerant tourism with cultural and religious valences, likewise that which is based on making the best use of cultural, historical and ethnographic heritage of rural localities in the neighbouring areas of the National Park. At the same time, the objectives that must be included in their future development strategy must be very clearly and correctly established. REFERENCES Bălteanu D., Dincă A. I., Surugiu C., Dumitraşcu M.,
Micu D., Felciuc M., 2008. Ecotourism and Environmental Change in the Romanian Carpathians. Global Environmental Research, 2, p. 161-172.
Bitsani E., Kavoura A., 2012. Connecting oenological and gastronomic tourism at the wine roads, Veneto, Italy for the promotion and development of agrotourism. J. of Vacation Mark. 18(4), p. 301-312.
Bran F., Dinu M., Şimon T., 1977. Rural Tourism. European Model. Economic Publishing, Bucharest.
Bran F., Toderoiu F., Diaconu G., 1998. The economy and environmental protection. Economic Tribune, Publishing House, Bucharest, p. 54 -56.
Călina A., Călina J., 2011. Study Regarding the Determination of the Agro Tourism Resources in Cozia National Park and the Impact of This Activity Development on the Contiguous Rural Space. Bulletin UASVM Cluj, Agric., 68(2), p. 103-109.
Călina A., Călina J., Iancu T., 2017. Research regarding the implementation, development and impact of agritourism on Romania's rural areas between 1990 and 2015. Environmental Engineering and Management Journal, 16(1), p. 157-168.
Cândea M., Simion T., 2006. Tourist potential of Romania. University Press, Bucharest, p. 23-27.
Comen T., 2006. Rural tourism – best practices guide for owners of boarding houses. Institute for Integrated Rural Tourism, Vermont, SUA, p. 43-44.
Giudici E., Dessi S., 2011. A new approach is born: the slow philosophy via agri-tourism. Review of business research, 11(5), p. 85-94.
Glăvan V., 2002. Agritourism Ecotourism. Alma Mater Publishing, Sibiu, p. 90-105.
Goodwin H., 2002. Local community involvement in tourism around national parks: Opportunities and constrains. Current Issues in tourism 5(3-4), p. 338-360.
Iagăru R., Florescu N., Iagăru P., 2016. Strategic management of sustainable development in the countryside of Sibiu Depression - basic of environmental protection. Environmental Engineering and Manag. J. 15(6): p. 1337-1347.
Krippendorf J., 1987. Ecological approach to marketing. Tourism Management, 8(2), p. 174-176.
Lieth H., Whttaker R., 1995. Primary Productivity of the Biosphere. New York Springer Berlin Heidelberg, p. 7-16.
Louwagie G., Gay S.H., Burre A., 2009. Addressing soil degradation in EU agriculture: relevant processes, practices and policies. Report on the project “Sustainable Agric. and Soil Cons. (SoCo)”, p. 41-44.
Maliţa M., 1998. Ten thousand cultures, one civilization - to the geomodernity of the XXIst century. Nemira Publishing House, Bucharest, p. 216-215.
Marques H., 2006. Searching for complementarities between agriculture and tourism – the demarcated wine-producing regions of northern Portugal. Tourism Economics, 12, p. 147–155.
McGehee N.G., Kim K., 2004. Motivation for agri-tourism entrepreneurship. Jo of Travel Research, 43, p. 161–170.
Moinet F., 2006. Le tourisme rural. Editions France Agricole, Paris, p. 205-278.
Păcurar F., Rotar I., Reif A., Vidican R., Stoian V., Stefanie M., Gärtner S., Robert B., Allen R., 2014. Impact of Climate on Vegetation Change in a Mountain Grassland – Succession and Fluctuation. Not Bot Horti Agrobo, 42(2), p. 347-356.
Stănciulescu G., 2000. Management of sustainable tourism in the Black Sea countries. Allbeck Publishing, Bucharest, p. 1-6.
Stoian M., 2006. Management of the pension, manual and legislative supplement, ANTREC Publication, p. 204 -206.
***WTO (World Trade Organisation), 1999. World Trade Organisation Estimates. www.ecotourism.org.
***WTTC (World Travel and Tourism Council), 1995. Travel and Tourism: A New Economic Perspective. Pergamon, Oxford.

43
only if the latter is implemented and developed on healthy principles, which do not prejudice in any way the natural and built environment. Moreover, the research team, based on practical knowledge and experience gained over the years of research, formulated several general recommendations which may influence in a positive manner the development of tourism, and elaborated a plan of strategies and policies aiming at promoting, on the level of all educational and local administration institutions, the necessity to practice sustainable tourism and agritourism, the development of general infrastructure and fitting of the territory and the localities, protectionist policing regarding elimination of pollution sources and the invaluable cultural-historical and spiritual thesaurus. A particularly important contribution regarding the research is shaping the direction of tourism development in general, which mainly aims at practicing scientific tourism, focused on knowledge and protection of environment of protected areas, ecological tourism, itinerant tourism with cultural and religious valences, likewise that which is based on making the best use of cultural, historical and ethnographic heritage of rural localities in the neighbouring areas of the National Park. At the same time, the objectives that must be included in their future development strategy must be very clearly and correctly established. REFERENCES Bălteanu D., Dincă A. I., Surugiu C., Dumitraşcu M.,
Micu D., Felciuc M., 2008. Ecotourism and Environmental Change in the Romanian Carpathians. Global Environmental Research, 2, p. 161-172.
Bitsani E., Kavoura A., 2012. Connecting oenological and gastronomic tourism at the wine roads, Veneto, Italy for the promotion and development of agrotourism. J. of Vacation Mark. 18(4), p. 301-312.
Bran F., Dinu M., Şimon T., 1977. Rural Tourism. European Model. Economic Publishing, Bucharest.
Bran F., Toderoiu F., Diaconu G., 1998. The economy and environmental protection. Economic Tribune, Publishing House, Bucharest, p. 54 -56.
Călina A., Călina J., 2011. Study Regarding the Determination of the Agro Tourism Resources in Cozia National Park and the Impact of This Activity Development on the Contiguous Rural Space. Bulletin UASVM Cluj, Agric., 68(2), p. 103-109.
Călina A., Călina J., Iancu T., 2017. Research regarding the implementation, development and impact of agritourism on Romania's rural areas between 1990 and 2015. Environmental Engineering and Management Journal, 16(1), p. 157-168.
Cândea M., Simion T., 2006. Tourist potential of Romania. University Press, Bucharest, p. 23-27.
Comen T., 2006. Rural tourism – best practices guide for owners of boarding houses. Institute for Integrated Rural Tourism, Vermont, SUA, p. 43-44.
Giudici E., Dessi S., 2011. A new approach is born: the slow philosophy via agri-tourism. Review of business research, 11(5), p. 85-94.
Glăvan V., 2002. Agritourism Ecotourism. Alma Mater Publishing, Sibiu, p. 90-105.
Goodwin H., 2002. Local community involvement in tourism around national parks: Opportunities and constrains. Current Issues in tourism 5(3-4), p. 338-360.
Iagăru R., Florescu N., Iagăru P., 2016. Strategic management of sustainable development in the countryside of Sibiu Depression - basic of environmental protection. Environmental Engineering and Manag. J. 15(6): p. 1337-1347.
Krippendorf J., 1987. Ecological approach to marketing. Tourism Management, 8(2), p. 174-176.
Lieth H., Whttaker R., 1995. Primary Productivity of the Biosphere. New York Springer Berlin Heidelberg, p. 7-16.
Louwagie G., Gay S.H., Burre A., 2009. Addressing soil degradation in EU agriculture: relevant processes, practices and policies. Report on the project “Sustainable Agric. and Soil Cons. (SoCo)”, p. 41-44.
Maliţa M., 1998. Ten thousand cultures, one civilization - to the geomodernity of the XXIst century. Nemira Publishing House, Bucharest, p. 216-215.
Marques H., 2006. Searching for complementarities between agriculture and tourism – the demarcated wine-producing regions of northern Portugal. Tourism Economics, 12, p. 147–155.
McGehee N.G., Kim K., 2004. Motivation for agri-tourism entrepreneurship. Jo of Travel Research, 43, p. 161–170.
Moinet F., 2006. Le tourisme rural. Editions France Agricole, Paris, p. 205-278.
Păcurar F., Rotar I., Reif A., Vidican R., Stoian V., Stefanie M., Gärtner S., Robert B., Allen R., 2014. Impact of Climate on Vegetation Change in a Mountain Grassland – Succession and Fluctuation. Not Bot Horti Agrobo, 42(2), p. 347-356.
Stănciulescu G., 2000. Management of sustainable tourism in the Black Sea countries. Allbeck Publishing, Bucharest, p. 1-6.
Stoian M., 2006. Management of the pension, manual and legislative supplement, ANTREC Publication, p. 204 -206.
***WTO (World Trade Organisation), 1999. World Trade Organisation Estimates. www.ecotourism.org.
***WTTC (World Travel and Tourism Council), 1995. Travel and Tourism: A New Economic Perspective. Pergamon, Oxford.
Retracted article: STUDY REGARDING THE INFLUENCE OFFERTILIZATION ON SOME PHYSIOLOGICAL INDEX AND BIOCHEMICAL
COMPOSITION OF PEPPERMINT OILS (Mentha piperita L.) Dorin CAMEN, Carmen DRAGOMIR, Cosmin POPESCU, Tiberiu IANCU, Sorin STANCIU, Roxana LUCA, Nicoleta HŀDŀRUGŀ, Mihaela MOATŀR, Eleonora NISTOR, Florin SALA

44
1 s-1 for mass spectrometry, 50-300 amu/s scan range; spectra obtained were compared with a NIST/EPA/NIH Mass Spectral Library 2.0 database (2002). Hewlett Packard Enhanced Data Analysis software was used for data processing of gas chromatography and waterspectrometry and Hewlett Packard Enhanced ChemStation software G1701BA ver. B.01.00 / 1998, was used for data acquisition. Determination of Kovats (KI) retention indices. For the identification of compounds was performed GC-MS analysis, together with the identification based on MS spectra and also with Kovats retention indices (KI); in this way were identified important mono- and sesquiterpenoids. Type of columns used influences the value of the indices, while the temperature schedule, gas flow, or injector and detector temperature does not influence this parameter. Correlation of retention time obtained from the GC analysis with conventional Kovats indices (Table 2) resulted in a standard polynomial curve used for determining the amount of the compounds studied by interpreting the corresponding retention time (resulting from GC analysis) on the KI vs RT chart. Retention
time (RT) was determined after confirming (based on MS spectra) alkaline linear structures separated by the GC analysis (Figure 1).
Table 2. Kovats retention indices values (KI) and retention times (RT) for linear alkali C8-C20
No. linear alkali KI RT (min) 1 octane, C8 800 3.07 2 nonane, C9 900 4.37 3 decane, C10 1000 6.23 4 undecane, C11 1100 8.44 5 dodecane, C12 1200 10.76 6 tridecane, C13 1300 13.06 7 tetradecane, C14 1400 15.28 8 pentadecane, C15 1500 17.39 9 hexadecane, C16 1600 19.39
10 heptadecane, C17 1700 21.3 11 octadecane, C18 1800 23.11 12 nonadecane, C19 1900 24.83 13 eicosane, C20 2000 26.48
Experimental data processing. Analysis of experimental data and general processing was performed by statistical module EXCEL application, series Office 2007. Correlation analysis was performed with PAST software (Hammer et al., 2001), and some graphical representations were realised by Statistics v. 10.
Figure 1. Gas chromatogram of the standard mixture of C8-C20 linear alkali, used to determine the Kovats retention indices
RESULTS AND DISCUSSIONS In order to assess the performance of the plant material in accordance with differentiated conditions provided by standard Hoagland solution, and the variations created by the addition of K and P were determined indices
and physiological processes. It has been found that a higher percentage of dry matter was added to samples derived from stem as compared with those derived from the leaf. It was also observed that for the leaf fragments there were no significant differences between the experimental variants studied,
4 . 0 0 6 . 0 0 8 . 0 0 1 0 . 0 01 2 . 0 01 4 . 0 01 6 . 0 01 8 . 0 02 0 . 0 02 2 . 0 02 4 . 0 02 6 . 0 02 8 . 0 03 0 . 0 03 2 . 0 0
5 0 0 0 0
1 0 0 0 0 0
1 5 0 0 0 0
2 0 0 0 0 0
2 5 0 0 0 0
3 0 0 0 0 0
3 5 0 0 0 0
4 0 0 0 0 0
T i m e - - >
A b u n d a n c e
T I C : A L C A N I . D
3 . 0 7 4 . 3 7
6 . 2 3
8 . 4 4 1 0 . 7 6 1 3 . 0 6 1 5 . 2 8 1 7 . 3 9 1 9 . 3 9 2 1 . 3 0 2 3 . 1 1 2 4 . 8 3
2 6 . 4 8
Retracted article: STUDY REGARDING THE INFLUENCE OFFERTILIZATION ON SOME PHYSIOLOGICAL INDEX AND BIOCHEMICAL
COMPOSITION OF PEPPERMINT OILS (Mentha piperita L.) Dorin CAMEN, Carmen DRAGOMIR, Cosmin POPESCU, Tiberiu IANCU, Sorin STANCIU, Roxana LUCA, Nicoleta HŀDŀRUGŀ, Mihaela MOATŀR, Eleonora NISTOR, Florin SALA

45
conductivity (EC) and NaCl have reduced the amount of fresh biomass in both studied species. Influence of Fe concentration in relation with the essential oil production in peppermint Japanese, was studied by Misra and Sharma (1991) which found an optimum concentration of 5.6 �g.l-1 Fe. In Japanese mint, has been also studied the influence of water stress and was observed significant reduction in gas exchange, the assimilation area, fresh and dry matter content, chlorophyll, carotenoids, micronutrients and essential oil production. Pande et al. (2007) studied the individual and combined influence of Fe and Zn on herbs production and essential oil in peppermint, highlighting the better influence of iron com-pared to zinc in individual application, and more favourable when both trace elements are applied at once in concentration of 5 mg Zn kg-1
and 10 mg Fe kg-1 respectively. Characterization and purification of peppermint oils were discussed in different studies, due to the importance for the cosmetics, pharma-ceutical, healthcare industry, etc. (Kavrayan and Aydemir, 2001). Some studies have evaluated the alteration of the peppermint essential oils chemical composition under the influence of amendments and organic waste (and Kumar Patra, 2012). This study aimed the assessing of potassium and phosphorus differ-rent amounts on some physiological indices and quality of peppermint oil cultivated under controlled environmental conditions based on Hoagland nutrient solution. MATERIALS AND METHODS Plant material consists of genotype mint (Mentha piperita L.). Plants were grown in pots with perlite and peat mixture (ratio 1: 3) under controlled environmental conditions. Nutrients were provided by Hoagland nutrient solution in three versions: V0 - control, basic Hoagland solution; V1 - Hoagland solution with additional K and V2 - Hoagland solution with the addition of P, according to Table 1. Physiological indices. The intensity of photorespiration (E) was determined by successive weighing of plant organs (leaves) at specified time intervals. The dry matter accumulated in the stems (SDM) and leaves (LDM) was determined using Kern MLS 50
thermo-balance, by the difference between the plant moisture and its fresh weight. Chlorophyll pigments (Chl) were determined quantitatively by leaf chlorophyll meter readings with Konica Minolta clorofilmeter. The rate of photosynthesis (PSN) was determined by gas exchange method that involves the measuring of CO2 concentration with an infrared analyzer (CO2 ANALYSIS PACKAGE Qubit Systems - Canada).
Table 1. Hoagland solution in experimental variants Components Supply
solutions ml Supply solutions /1L
V0 V1 V2
2M KN 3 202 g/L 2.5 5 2.5
2M Ca(NO 3 ) 2 x 4H 2 O 236 g/0.5 L 2.5 2.5 2.5
Fier 15 g/L 1.5 1.5 1.5
2M MgSO 4 x 7H 2 O 493 g/L 1 1 1
1M NH 4 NO 3 80 g/L 1 1 1
Trace elements
H 3 BO 3 2.86 g/L 0.5 0.5 0.5
MnCl 2 x 4H 2 O 1.81 g/L 0.5 0.5 0.5
ZnSO 4 x 7H 2 O 0.22 g/L 0.5 0.5 0.5
CuSO 4 0.051 g/L 0.5 0.5 0.5
H 3 MoO 4 x H 2 O 0.09 g/L 0.5 0.5 0.5
1M KH 2 PO 4 136 g/L 0.5 0.5 1
Photosynthesis rate was determined by measuring the initial and final concentration of CO2 and reported to the unit time and per unit leaf area determined on the model proposed by Sala et al. (2015). Qualitative indices for volatile oils. For determining the composition of peppermint essential oil samples were diluted with hexane (GC purity, Sigma) and to determine Kovats indices, related to volatile compounds was used a linear alkali solution of i C8-C20 (Fluka Chemie AG). Analysis of peppermint essential oils were carried out by gas chromatographic method coupled with mass spectrometry detection. The equipment used was the GC Hewlett Packard HP 6890 Series with a mass spectrometer Hewlett Packard 5973 Mass Selective Detector. GC analysis conditions: injection volume of 2 μl; He carrier gas; injector temperature 280°C; HP-5 MS column, length 30 m, inner diameter 0.25 mm, film thickness of 0.25 μm; detector temperature 280°C; temperature program 50°C to 250°C at a rate of 6°C/min. For MS detector was used an energy of EI 70 eV, source temperature of 150°C, scan rate of
Retracted article: STUDY REGARDING THE INFLUENCE OFFERTILIZATION ON SOME PHYSIOLOGICAL INDEX AND BIOCHEMICAL
COMPOSITION OF PEPPERMINT OILS (Mentha piperita L.) Dorin CAMEN, Carmen DRAGOMIR, Cosmin POPESCU, Tiberiu IANCU, Sorin STANCIU, Roxana LUCA, Nicoleta HŀDŀRUGŀ, Mihaela MOATŀR, Eleonora NISTOR, Florin SALA

46
Figure 4. 3D representation of the photosynthesis intensity corresponding to the chlorophyll and respiration,
after modification caused by the P and K changes in Hoagland solution
Table 3. Correlations among variation factors in Hoagland solution (P and K) and physiological indices
0 K P SDM LDM Chl E PSN K 0 0.66667 0.95733 0.63979 0.1669 0.53093 0.33333 P -0.500 0 0.29066 0.026878 0.83357 0.8024 1
SDM 0.067 -0.898 0 0.31754 0.87577 0.51175 0.70934 LDM 0.536 -0.999 0.878 0 0.80669 0.82928 0.97312 Chl -0.966 0.258 0.194 -0.299 0 0.36403 0.16643 E 0.672 0.305 -0.694 -0.265 -0.841 0 0.1976
PSN 0.866 0.000 -0.441 0.042 -0.966 0.952 0
Figure 5. Gas chromatogram of GC-MS analysis of peppermint essential oil samples
5 . 0 0 1 0 . 0 0 1 5 . 0 0 2 0 . 0 0 2 5 . 0 0 3 0 . 0 0 3 5 . 0 0 4 0 . 0 0 4 5 . 0 0
5 0 0 0 0 0
1 0 0 0 0 0 0
1 5 0 0 0 0 0
2 0 0 0 0 0 0
2 5 0 0 0 0 0
3 0 0 0 0 0 0
3 5 0 0 0 0 0
4 0 0 0 0 0 0
4 5 0 0 0 0 0
5 0 0 0 0 0 0
5 5 0 0 0 0 0
6 0 0 0 0 0 0
6 5 0 0 0 0 0
T i m e - - >
A b u n d a n c e
T I C : 1 6 A - M E N . D \ d a t a . m s
5 . 7 1 4
6 . 7 4 5
6 . 8 3 3
7 . 3 9 6
8 . 2 3 1
8 . 3 6 6
8 . 4 4 8
9 . 7 3 61 0 . 2 3 81 0 . 7 0 6
1 2 . 6 1 2
1 2 . 9 0 3
1 3 . 2 4 9
1 3 . 5 3 41 3 . 7 5 11 3 . 8 7 3
1 4 . 4 7 71 5 . 2 3 6
1 5 . 4 4 7
1 5 . 7 9 9
1 7 . 0 9 5
1 8 . 6 0 7
1 9 . 9 5 72 0 . 2 0 1
2 2 . 4 2 6
2 5 . 9 5 2
2 8 . 4 4 1
Retracted article: STUDY REGARDING THE INFLUENCE OFFERTILIZATION ON SOME PHYSIOLOGICAL INDEX AND BIOCHEMICAL
COMPOSITION OF PEPPERMINT OILS (Mentha piperita L.) Dorin CAMEN, Carmen DRAGOMIR, Cosmin POPESCU, Tiberiu IANCU, Sorin STANCIU, Roxana LUCA, Nicoleta HŀDŀRUGŀ, Mihaela MOATŀR, Eleonora NISTOR, Florin SALA

47
while in the case of fragments from stem, a higher percentage of the dry matter was registered in variant V2 with the addition of P. Between the dry matter from the stems and phosphorus was registered a strong negative correlation (r = -0.898) while between the dry matter from leaf was established a very strong negative correlation with P (r = -0.999) and a weak correlation with K (r = 0.536). The distribution of the values is graphical represented in Figure 2.
Figure 2. Percentage of dry matter - peppermint
Perspiration as physiological process was expressed by the amount of water removed reported on the weight of fresh plant per time unit (perspiration rate). In the study were found differences between the experimental variants; a higher rate of perspiration was recorded in the variant V2 (with the addition of phosphorus) compared with the control, which registered a lower value (Figure 3).
Figure 3. Content of total chlorophyll (SPAD)
For the perspiration rate was found a positive correlation of medium intensity with the addition of potassium (r = 0.672), and a strong negative correlation with the chlorophyll (r = -0.841). This is explained because of the phosphorus contribution in stimulating
metabolic processes of plants (Sala, 2011). As concerns the total chlorophyll content in units SPAD, has been registered a very strong negative correlation with K (r = -0.966); a higher amount of chlorophyll was recorded for version control (34.6 SPAD units), followed by variant V2, while a lower value was recorded in variant V1 (30.5 ADP), Figure 3. The intesity of photosynthesis evaluated by the gas exchange method (CO2 assimilation and O2 release) had differentiated values in all three variants; a higher intensity was recorded forvariant V1 (with the phosphorus addition), followed by variant V2 (with added K) compared with the control, Figure 4. The rate of photosynthesis was weak correlated with stems dry matter (r = - 0.441), and very strong negative with chlorophyll (r = -0.966); in the same time was strong positive correlated with K (r = 0.866) and very strong correlated with rate of photorespiration (r = 0.952). Statistical analysis of the correlation between the modified elements in the Hoagland (P and K) solution and physiological indices (SDM - stem dry matter; LDM - leaves dry matter; Chl - chlorophyll content; E - perspiration; PSN – rate of photosynthesis) facilitated the highlighting of differentiated levels of correlation between variants. High correlations were identified between K and leaf dry matter content, and chlorophyll content respectively; high correlations between P and stems dry matter, the stems and leaf dry matter, the perspiration and chlorophyll content correlations are shown in Table 3. Were also identified other less important correlations between physiological indices and determining factors (P, K). Gas-chromatographic analysis of peppermint essential oil (Figure 5) coupled with mass spectrometry has enabled the separation of more than 50 volatile compounds, of which the most important were identified based on their mass spectra and Kovats indices. Thus, were identified in high concentrations menthone (17%), menthol (33%) and limonene (2%), pulegone (1.8%) and izomentil acetate (5%). Among sesquiterpene was determined β-caryophyllene at a concentration of 1.2% (Table 4).
Retracted article: STUDY REGARDING THE INFLUENCE OFFERTILIZATION ON SOME PHYSIOLOGICAL INDEX AND BIOCHEMICAL
COMPOSITION OF PEPPERMINT OILS (Mentha piperita L.) Dorin CAMEN, Carmen DRAGOMIR, Cosmin POPESCU, Tiberiu IANCU, Sorin STANCIU, Roxana LUCA, Nicoleta HŀDŀRUGŀ, Mihaela MOATŀR, Eleonora NISTOR, Florin SALA

48
spectrometry. Were identified over 50 volatile compounds, of which the most important were identified based on their mass spectra and Kovats indices. ACKNOWLADGEMENT Funded research project or another internal. REFERENCES Ali B., Al-Wabel N.A., Shams S., Ahamad A., Khan
S.A., Anwar F., 2015. Essential oils used in aromatherapy: A systemic review. Asian Pacific Journal of Tropical Biomedicine 5(8): p. 601-611.
Alizadeh A., Khoshkhui M., Javidnia K., Firuzi O., Tafazoli E., Khalighi A., 2010. Effects of fertilizer on yield, essential oil composition, total phenolic content and antioxidant activity in Satureja hortensis L. (Lamiaceae) cultivated in Iran. J. Med. Plants Res. 4(1), p. 33-40.
Aziz E.E., El-Ashry S.M., 2009. Efficiency of slow release urea fertilizer on herb yield and essential oil production of lemon balm (Melissa officinalis L.) plant. Am-Euras. J. Agric. Environ. Sci. 5(2), p. 141–147.
Baj T., Kowalski R., Ĝwiątek À., Modzelewska M., Wolski T. 2010. Chemical composition and antioxidant activity of the essentials oil of hyssop (Hyssopus officinalis L. ssp. officinalis). Annales UMCS, sec. DDD, Pharmacia 23, 3(7), p. 55-61.
Brown B., Hart J.M., Wescott M.P., Christensen N.W. 2003. The critical role of nutrient management in mint production. Better Crops 87(4): p. 9-11.
Camen D., Hadaruga N., Luca R., Dobrei A., Nistor E., Posta D., Dobrei A., Sala F., 2016. Research concerning the influence of fertilization on some physiological processes and biochemical composition of lavender (Lavandula angustifolia L.). Agriculture and Agricultural Science Procedia 10(2016), p. 198-205.
Costa A.G., Bertolucci S.K.V., Chagas J.H., Ferraz E.O., Pinto J.E.B.P., 2013. Biomass production, yield and chemical composition of peppermint essential oil using different organic fertilizer sources. Ciência e Agrotechnologia 37(3): p. 202-210.
Daneshian A., Gurbuz B., Cosge B., Ipek A., 2009. Chemical components of essential oils from basil (Ocimum basilicum L.) grown at different nitrogen levels. Internat. J. Nat. Eng. Sci. 3(3), p. 8–12.
Daneshkhah M., Mohsen K., Nikbakht A., 2007. Effects of different levels of nitrogen and potassium fertilizers on flower yield and essential oil content of Rosa damascena Mill. from Barzok of Kashan. Iranian J. Hortic. Sci. Technol. Summ. 8(2), p. 83-90.
Dzida K., 2010. Biological value and essential oil content in sweet basil (Ocimum basilicum L.) depending on calcium fertilization and cultivar. Acta Sci. Pol. Hort. Cult. 9(4), p. 153-161.
El-Masry M.H., Morales M.R., Charles D.J. & Simon J.E., 2009. Effect of potassium rates on
hydroponically-grown peppermint (Mentha x piperita). African Journal of Traditional, Complementary and Alternative medicines (AJTCAM) 6: 426.
Ganjewala D., Luthra R., 2007. Essential oil biosynthesis and metabolism of geranyl acetate and geraniol in developing Cymbopogon flexuosus (Nees ex Steud) Wats Mutant cv. GRL 1 leaf. Am. J. Plant Physiol. 2(4), p. 269-275.
Garlet T.M.B., Paulus D., Flores R., 2013. Production and chemical composition of Mentha x Piperita var. Citrata (Ehrh.) Briq. essential oil regarding to different potassium concentrations in the hyd roponic solution. Journal of Biotechnology and Biodiversity 4(3): p. 200-206.
Jabbari R., Dehaghi M.A., Sanavi A.M.M., Agahi K., 2011. Nitrogen and iron fertilization methods affecting essential oil and chemical composition of thyme (Thymus vulgaris L.) medical plant. Adv. Environ. Biol. 5(2), p. 433-438.
Jeliazkova E.A., Zheljazkov V.D., Craker L.E., Yankov B. and Georgieva T., 1999. NPK fertilizer and yields of peppermint, Mentha x piperita. Acta Hortic. 502, p. 231-236
Hammer Ø., Harper D.A.T., Ryan P.D., 2001. PAST: paleontological statistics software package for education and data analysis. Palaeontologia Electronica, 4(1): p. 1–9.
Kandil M.A.M., Khatab M.E., Ahmed S.S., Schnug E., 2009. Herbal and essential oil yield of Genovese basil (Ocimum basilicum L.) grown with mineral and organic fertilizer sources in Egypt. J. Kulturpfl. 61(12), p. 443-449.
Kavrayan D., Aydemir T., 2001. Partial purification and characterization of polyphenoloxidase from peppermint (Mentha piperita). Food Chemistry 74(2): p. 147-154.
Khalid K.A., 2012. Effect of NP and foliar spray on growth and chemical compositions of some medicinal Apiaceae plants grow in arid regions in Egypt. Journal of Soil Science and Plant Nutrition 12(3): p. 581-596.
Kumar K.V., Patra D.D., 2012. Alteration in yield and chemical composition of essential oil of Mentha piperita L. plant: Effect of fly ash amendments and organic wastes. Ecological Engineering 47: p. 237-241.
Lattoo S.K., Dhar R.S., Dhar A.K., Sharma P.R., Agarwal S.G., 2006. Dynamics of essential oil biosynthesis in relation to inflorescence and glandular ontogeny in Salvia sclarea. Flavour Frag. J. 21, p. 817–821.
Mahfouz S.A., Sharaf-Eldin M.A., 2007. Effect of mineral vs. biofertilizer on growth, yield, and essential oil content of fennel (Foeniculum vulgare Mill.). Int. Agroph. 21, p. 361-366.
Meneghini A., Pocceschi N., Venanzi G., Tomaselli P.B., 1998. Effect of nitrogen fertilization on photosynthetic rate, nitrogenous metabolites and ȕ-asarone accumulation in triploid Acorus calamus L. leaves. Flavour Fragr. J. 13, p. 319-323.
Mumivand H., Babalar M., Hadian J., Fakhr-Tabatabaei M., 2011. Plant growth and essential oil content and
Retracted article: STUDY REGARDING THE INFLUENCE OFFERTILIZATION ON SOME PHYSIOLOGICAL INDEX AND BIOCHEMICAL
COMPOSITION OF PEPPERMINT OILS (Mentha piperita L.) Dorin CAMEN, Carmen DRAGOMIR, Cosmin POPESCU, Tiberiu IANCU, Sorin STANCIU, Roxana LUCA, Nicoleta HŀDŀRUGŀ, Mihaela MOATŀR, Eleonora NISTOR, Florin SALA

49
Table 4. GC-MS analysis results (MS identification and relative percentage concentrations) for the peppermint essential oil
Nr. RT (min)
Kovats Indices
MS identification
Area (peppermint)
(%) 1 5.702 936 α-Pinene 0.727 2 6.739 975 β-Phellandrene 0.189 3 6.827 978 β-Pinene 0.576 4 7.227 993 β-Pinene 0.090 5 8.347 1030 Limonene 1.954 6 8.408 1032 Eucalyptol 0.309 7 12.911 1171 p-Menthone 17.223 8 13.406 1185 Menthol 32.852 9 15.291 1242 Pulegone 1.778
10 17.123 1297 Isomenthyl acetate 5.004 11 21.036 1420 β-Caryophyllene 1.157
Other compounds 38.14
Studies on the peppermint growth and develop-ment linked with the potassium variation rate were made by Valmorbida and Boaro (2007). They studies were on nutrient solutions with potassium between 6.0, 3.0 and 1.5 mmol l-1 K limits, on Hoagland and Arnon's no.2 and have shown that plants grown under conditions of 1.5 and 3.0 mmol l-1 K had the better develop-ment of leaf area, biomass and dry matter. Similar studies were conducted by El-Masry and et al. (2008). They evaluated the influence of six rates of potassium sulphate (25, 150, 217, 300, 450 and 600 g/l) on peppermint physiological indices in hydroponic conditions. Garlet et al (2013) also found the favourable influence of potassium supplemented in four doses (276, 414, 552 and 690 mg l-1), on the fresh mass of leaves, stems and biomass in peppermint and on the quality of peppermint oil under hydroponics system NFT (Nutrient Film Technique). The quality of the peppermint essential oil has been studied in relation to certain types of nutrients, mineral or organic fertilizers in various researches of Zheljazkov et al. (2010), Costa et al. (2013) and in relation to the plants age and the harvesting time of the herbs. The variation of essential oils and their active principles according to the growing system and to nutrients was also reported in Lavandula angustifolia L. studies (Camen et al., 2016), Satureja hortensis L. (Alizadeh et al., 2010), Melissa officinalis L. (Aziz El-Ashry and 2009;
Sharafzadeh et al., 2011), Hyssopus officinalis L. ssp. officinalis (Baj et al., 2010), Ocimum basilicum L. (Daneshian et al., 2009; Kandil et al., 2009; Dzida, 2010; Said-Al Ah land Mahmoud, 2010; Nurzyńska-Wierdak and Borowski, 2011), Ocimum americanum L. (Omer et al., 2008), Rosa damascena Mill. (Daneshkhan et al., 2007), Cymbopogon flexuosus (Ganjewala and Luthra, 2007), Thymus vulgaris L. (Jabbari et al., 2011), Salvia sclarea (Lattoo et al., 2006), Foeniculum vulgare Mill. (Mahfouz and Sharaf-Eldin, 2007), Acorus calamus L. (Meneghini et al., 1998), Satureja hortensis L. cv. Saturn (Mumivand et al., 2011), Carum carvi L. var. annua (Valkovszki and Nemeth-Zambori, 2011), and various other species (NurzyĔska-Wierdak, 2013). CONCLUSIONS Different solutions of Hoagland through addition of P and K influence the physiological indices such as stems dry matter (SDM) and leaves (LDM), the rate of perspiration (E), the chlorophyll content (Chl) and the rate of photosynthesis (PSN) in peppermint (Mentha piperita L.), with statistically significance. Given all these interdependencies between nutrition and physiological indices were identified high levels of essential oils compounds from peppermint through the gas-chromatographic method coupled with mass
Retracted article: STUDY REGARDING THE INFLUENCE OFFERTILIZATION ON SOME PHYSIOLOGICAL INDEX AND BIOCHEMICAL
COMPOSITION OF PEPPERMINT OILS (Mentha piperita L.) Dorin CAMEN, Carmen DRAGOMIR, Cosmin POPESCU, Tiberiu IANCU, Sorin STANCIU, Roxana LUCA, Nicoleta HŀDŀRUGŀ, Mihaela MOATŀR, Eleonora NISTOR, Florin SALA

50
THE ANTIOXIDANT PROPERTIES OF Gentiana lutea ROOT CULTURES
Rodica CATANĂ, Irina HOLOBIUC, Monica MITOI
Romanian Academy, Institute of Biology, Plant and Animal Cytobiology Department,
Bucharest, 296 Splaiul Independenței, 060031 Bucharest, P.O. Box 56-53, Phone + 4 021 2219202, Fax + 4 021 2219071
Corresponding author email: [email protected]
Abstract Gentiana lutea is known as one of the most valuable medicinal plant, most of the chemical compounds being synthesized in the roots. The aim of this study was to evaluate the antioxidant properties based on total phenolic content, flavonoids concentration and reducing capacity of the extracts from in vitro differentiated roots of the protected plant species G. lutea. Explants represented by leaf and root fragments originated in a six years old culture of somatic embryos, were inoculated on liquid and solid nutritive Murashige & Skoog media variant supplemented with mannitol. 3% mannitol in liquid media was able to induce the best result concerning number of roots and root length, but a higher antioxidant capacity correlated with flavonoids oncntraation was founded in the root cultures induced on solid medium variant. A viable method for root culture should be use for improving the biomass of the gentian and exploitation of the secondary metabolites. In this way, the protection of the endangered species is ensured.
Key words: flavonoids, mannitol, protected plant species root culture. INTRODUCTION Gentiana species play an important role in ethnobotany, pharmacology and horticulture (Hayta et al., 2011), G. lutea being one of the most valuable medicinal plant (Sava, 2015). Different in vitro studies showed that gentian extracts have antimicrobial, antispasmodic, anti-inflammatory, antioxidant, choleric and secretory activities (Nastasijević et al., 2012). The main chemical compounds of this species are represented by bitter terpenes, xanthones, alkaloids, small amounts of tannins, sugar, essential oils mainly being synthesized in roots (Edwards et al., 2015). For a good exploitation of active ingredients, the gentian roots have to be collected after 4-5 years (Heltmann and Silva, 1970). Taking into account the importance of G. lutea and other relatives, several studies were made during time concerning characterization, ecology, biotechnology and applications sum-marized in two volumes of The Gentianaceae book (Rybczyński et al., 2014, 2015). Over the world, there was an increasing demand for raw material (1,500 tons of gentian roots); this reason caused a significant damage
in their natural habitats (Ando et al., 2007). Nearly 100 species of Gentiana genus are protected by law in many European countries (Mikula et al., 2005). In Romania, G. lutea is a protected plant species, listed as critically endangered (Oprea, 2005), collection and exploitation in the natural habitats being restricted under national and international regulations. Despite the large amount of seeds, plant development and reproduction is influenced by its biological peculiarities: low seed germi-nation, pest and diseases, soils and climatic conditions requirements, specific pollinators and mycorrhizal fungi (Drobyk et al., 2015). In this way, an alternative technique for providing plant material for pharmaceutical industry is represented by biotechnological approaches, applied for sustainable use of endangered and/or protected medicinal and also for conservation of these species. The biotechnological approaches used for medicinal plants are based on in vitro techniques (to multiplicated the plant material) and biochemical or molecular techniques (to analyses the secondary metabolites with medicinal properties).
Retracted article: STUDY REGARDING THE INFLUENCE OFFERTILIZATION ON SOME PHYSIOLOGICAL INDEX AND BIOCHEMICAL
COMPOSITION OF PEPPERMINT OILS (Mentha piperita L.) Dorin CAMEN, Carmen DRAGOMIR, Cosmin POPESCU, Tiberiu IANCU, Sorin STANCIU, Roxana LUCA, Nicoleta HŀDŀRUGŀ, Mihaela MOATŀR, Eleonora NISTOR, Florin SALA

51
THE ANTIOXIDANT PROPERTIES OF Gentiana lutea ROOT CULTURES
Rodica CATANĂ, Irina HOLOBIUC, Monica MITOI
Romanian Academy, Institute of Biology, Plant and Animal Cytobiology Department,
Bucharest, 296 Splaiul Independenței, 060031 Bucharest, P.O. Box 56-53, Phone + 4 021 2219202, Fax + 4 021 2219071
Corresponding author email: [email protected]
Abstract Gentiana lutea is known as one of the most valuable medicinal plant, most of the chemical compounds being synthesized in the roots. The aim of this study was to evaluate the antioxidant properties based on total phenolic content, flavonoids concentration and reducing capacity of the extracts from in vitro differentiated roots of the protected plant species G. lutea. Explants represented by leaf and root fragments originated in a six years old culture of somatic embryos, were inoculated on liquid and solid nutritive Murashige & Skoog media variant supplemented with mannitol. 3% mannitol in liquid media was able to induce the best result concerning number of roots and root length, but a higher antioxidant capacity correlated with flavonoids oncntraation was founded in the root cultures induced on solid medium variant. A viable method for root culture should be use for improving the biomass of the gentian and exploitation of the secondary metabolites. In this way, the protection of the endangered species is ensured.
Key words: flavonoids, mannitol, protected plant species root culture. INTRODUCTION Gentiana species play an important role in ethnobotany, pharmacology and horticulture (Hayta et al., 2011), G. lutea being one of the most valuable medicinal plant (Sava, 2015). Different in vitro studies showed that gentian extracts have antimicrobial, antispasmodic, anti-inflammatory, antioxidant, choleric and secretory activities (Nastasijević et al., 2012). The main chemical compounds of this species are represented by bitter terpenes, xanthones, alkaloids, small amounts of tannins, sugar, essential oils mainly being synthesized in roots (Edwards et al., 2015). For a good exploitation of active ingredients, the gentian roots have to be collected after 4-5 years (Heltmann and Silva, 1970). Taking into account the importance of G. lutea and other relatives, several studies were made during time concerning characterization, ecology, biotechnology and applications sum-marized in two volumes of The Gentianaceae book (Rybczyński et al., 2014, 2015). Over the world, there was an increasing demand for raw material (1,500 tons of gentian roots); this reason caused a significant damage
in their natural habitats (Ando et al., 2007). Nearly 100 species of Gentiana genus are protected by law in many European countries (Mikula et al., 2005). In Romania, G. lutea is a protected plant species, listed as critically endangered (Oprea, 2005), collection and exploitation in the natural habitats being restricted under national and international regulations. Despite the large amount of seeds, plant development and reproduction is influenced by its biological peculiarities: low seed germi-nation, pest and diseases, soils and climatic conditions requirements, specific pollinators and mycorrhizal fungi (Drobyk et al., 2015). In this way, an alternative technique for providing plant material for pharmaceutical industry is represented by biotechnological approaches, applied for sustainable use of endangered and/or protected medicinal and also for conservation of these species. The biotechnological approaches used for medicinal plants are based on in vitro techniques (to multiplicated the plant material) and biochemical or molecular techniques (to analyses the secondary metabolites with medicinal properties).
composition of Satureja hortensis L. cv. Saturn in response to calciumcarbonate and nitrogen application rates. J. Med. Pl. Res. 5(10), p. 1859-1866.
Misra A., Sharma S., 1991. Critical concentration of iron in relation to essential oil yield and quality parameters of Japanese mint. Soil Science and Plant Nutrition 37(2): p. 185-190.
Misra A., Srivastava N.K., 2000. Influence of Water Stress on Japanese Mint. Journal of Herbs, Spices & Medicinal Plants 7(1): p. 51-58.
Nurzyńska-Wierdak R., Borowski B., 2011. Changes in the content and chemical composition of sweet basil essential oil under the influence of fertilization of plants with nitrogen and potassium. Annales UMCS, sec. DDD, Pharmacia 24, 3(15), p. 133-145
Nurzyńska-Wierdak R., 2013. Does mineral fertilization modify essential oil content and chemical composition in medicinal plants? Acta Sci. Pol., Hortorum Cultus 12(5): p. 3-16.
Omer E.A., Elsayed A.G.A., El-Lathy A., Khattab M.E., Sabra A.S., 2008. Effect of the nitrogen fertilizer forms and time of their application on the yield of herb and essential oil from Ocimum americanum L. Herba Pol. 54(1), p. 34-46.
Pande P., Anwar M., Chand S., Yadav V.K., Patra D.D., 2007. Optimal Level of Iron and Zinc in Relation to Its Influence on Herb Yield and Production of Essential Oil in Menthol Mint. Communications in Soil Science and Plant Analysis 38(5-6): p. 561-578.
Said-Al Ahl H.A.H., Mahmoud A.A., 2010. Effects of zinc and / or iron foliar application on growth and essential oil of sweet basil (Ocimum basilicum L.) under salt stress. Ozean J. Appl. Sci. 3(1), p. 97-111.
Sala F., 2011. Agrochimie. Ed. EUROBIT, Timișoara, pp. 37-38, p. 288-293.
Sala F., Arsene G.G., Iordănescu O., Boldea M., 2015. Leaf area constant model in optimizing foliar area measurement in plants: A case study in apple tree. Scientia Horticulturae, 193: p. 218-224.
Scavroni J., Boaro C.S.F., Marques M.O.M., Ferreira L.C., 2005. Yield and composition of the essential oil of Mentha piperita L. (Lamiaceae) grown with biosolid. Brazilian Journal of Plant Physiology 17(4): p. 345-352.
Sharafzadeh S., Khosh-Khui M., Javidnia K., 2011b. Effect of nutrients on essential oil components, pigments and total phenolic content of lemon balm (Melissa officinalis L.). Adv. Environ. Biol. 5(4), p. 639–646.
Singh R., Shushni M.A.M., Belkheir A., 2015. Antibacterial and antioxidant activities of Mentha piperita L. Arabian Journal of Chemistry 8(3): p. 322-328.
Tabatabaie S.J., Nazari J., 2007. Influence of Nutrient Concentrations and NaCl Salinity on the Growth, Photosynthesis, and Essential Oil Content of Peppermint and Lemon Verbena. Turk J Agric For 31: p. 245-253.
Valkovszki N.J., Nemeth-Zambori E., 2011. Effects of growing conditions on content and composition of the essential oil of annual caraway (Carum carvi L. var. annua). Acta Aliment. 40(2), p. 235-246
Valmorbida J., Boaro C.S.F., 2007. Growth and development of Mentha piperita L. in nutrient solution as affected by rates of potassium. Brazilian Archives of Biology and Technology 50(3): p. 379-384.
Zheljazkov V.D., Cantrell C.L., Astatkie T., Ebelhar M.W., 2010. Peppermint productivity and oil composition as a function of nitrogen, growth stage, and harvest time. Agron. J. 102(1), p. 124-128.
AgroLife Scientific Journal - Volume 6, Number 2, 2017ISSN 2285-5718; ISSN CD-ROM 2285-5726; ISSN ONLINE 2286-0126; ISSN-L 2285-5718

52
The aim of our study was to evaluate the antioxidant properties based on total phenolic content, flavonoids concentration and reducing capacity of extracts from in vitro differentiated roots induced in moderate osmotic stress of the protected plant species G. lutea. MATERIALS AND METHODS Root cultures were established starting from leave and root fragments detached from germinated somatic embryos (Figure 1).
Figure 1. Six years - old highly embryogenesis
culture used as explants source
A six year - old highly embryogenesis culture maintained in condition of moderate osmotic stress induced by 3% mannitol (Holobiuc and Catană, 2012) represent the source of somatic embryos. The recurrent somatic embryos cultures were maintained on solid (M2) MS medium (Murashige and Skoog, 1962) supplemented with Gamborg vitamins (Gamborg et al., 1968), 3% sucrose and 3% mannitol. No plant growth factors were used. To increase the number of roots, a liquid variant of the same medium was used. The pH was adjusted to 5.8. The solid media variants were solidified with 8 g/l Plant agar. A GFL 3017 Orbital shaker (110 rpm) was used to perform liquid root cultures. A solid MS without mannitol was used as control (M1) variant. The conditions for maintaining of in vitro cultures were represented by a 16 h light/8 h dark photoperiod, with light intensity of 27 µmol*m-2*sec-1 and temperature 24±2°C.
Survival percentage of the explants (%), percentage of rooted explants (%), number of roots/explant and mean roots length (cm) represents the evaluated parameters of the in vitro root cultures. The results were recorded after 4 weeks. The survival percentage was calculated as the number of viable explants after 4 weeks of culture on media variants/ total of initial explants * 100. To check the statistical significance, one-way analyse of variance was used. Tukey test was used for multiple comparations (http://xltoolbox.sourceforge.net).
The extraction of G. lutea antioxidant compounds. Differentiated roots were dried on filter paper, grounded with quartz sand and extracted in a ratio of 1: 1 (v/v) with 100% methanol for 24 hours. The homogenates were centrifuged at 10000 G, for 20 minutes and the supernatant were used for the subsequent analysis.
Determination of the total phenolic content (TPC). TPC was determined according to the method described by Mihailovic et al., 2013 with some changes. The reaction mixture (0.5 ml of suitably diluted extract, 2.5 ml Folin-Ciocalteu reagent diluted 11-fold, 2 ml of 7.5% Na2CO3) was kept 30 minutes at room tem-perature. After that the absorbance was measured at 765 nm. Three repetitions of the same variant were made and the average represents total phenol content expressed as gallic acid/fresh weight (EAG mg/g sample).
Determination of the flavonoids. Estimated flavonoid content of methanol extracts was performed using a protocol described by Zhishen et al., 1999, with minor adjustments. Thus, suitably diluted 0.5 ml methanol extract of each sample was added with 2 ml of distilled water and 5% NaNO2 solution and the mixture was equilibrated for 5 min. Then 150 μl of 10% AlCl3 solution was added, and after 6 minutes of reaction was added 1 ml of 4% NaOH and brought to a total volume of 5 mL with distilled water. Optical density at 510 nm was recorded against blank and flavonoid concentration estimation was done according to a calibration curve using the standard routine. Three repetitions of the
same variable were made and the average of flavonoid content was expressed as rutin equivalent/ f fresh weight (ERU mg/g sample). Determination of antioxidant capacity by DPPH method. According to the method proposed by Marxen et al., 2007, corresponding diluted 100μl extract was mixed with 2.25 ml of methanol and 150 µl methanol solution of 1.27 mM DPPH. At the same time, control was replaced with the extraction solvent. After 30 minutes of incubation at room temperature and darkness absorbance was read at 515nm. Antioxidant capacity represented differences between the samples and control against a standard curve that used Trolox (synthetic antioxidant α-tocopherol analogue) as standard antioxidant. Three repetitions of the same variable were done and the average readings representing antioxidant capacity, expressed as Trolox/ fresh weight (mM Trolox/g sample). Measurement of reducing power or determination of Fe3+ ions reduction. The reduction of Fe3+ to Fe2+ ions by the methanol extract was carried out according to the method described by Gursoy et al., 2009. The reaction mixture consisted in 1 ml of the diluted extract, 1 ml of 1% K3Fe(CN)6 and 1 ml of 0.2 M Na phosphate buffer, pH 6.6, incubated for 20 min at 50°C. 10% TCA was added and centrifuged at 10000 RCF, 10 min at room temperature. Subsequently, 1 ml supernatant was mixed with 1 ml of distilled water and 0.5 ml 0.1% FeCl3 and absorbance was measured at 700 nm. The measurement of reducing power was deter-mined by reference to a standard curve with Trolox as a reducing agent. Three repetitions were made and the average of reducing power has been expressed in Trolox equivalents/fresh weight (mg Trolox/g sample). RESULTS AND DISCUSSIONS The root system of G. lutea from nature is forbidden to harvest being a protected plant species. In this way, an in vitro root culture was applied for roots induction and for the analyses of the antioxidant properties. In our case, it was observed that rooting response varied in terms of survival percentage of the explants, rooted explants (Table 1).
Table 1. Survival and rooting percentages of explants on media variants tested
M1
(control)
M2 (solid
variant)
M3 (liquid variant)
Survival percentage 16.66 100 100
Rooting percentage 0 60 50
Legend: M2 and M3 – media variants added with 3% mannitol. Both explants type (root and leaf fragments) cultivated on solid and liquid media variants added with 3% mannitol showed a 100% survival percentage. On the control, medium variant without mannitol, only 16.66% of explants survived (Table 1). The rooting process started about 14 days after the initiation of root cultures. Moderate stress induced by 3% mannitol was able to initiate and sustain the roots development with no significant differences (p<0.05) between solid (M2) and liquid (M3) media variants. No roots induction was observed on control variant. These data suggested that the combination of sucrose and mannitol sustain the root developmental. Our results are in accordance with results concerning shoot multiplication in a root tip culture of garlic, where MS media variant added with 0.8% mannitol and 3% sucrose had a better result than all the sucrose concen-trations tested (Haque et al., 2003). Number of roots/explant and roots length showed significant differences (p<0.05) between liquid and solid media variants added with 3% mannitol (Table 2).
Table 2. Number of roots and root length of G. lutea developed on the solid and liquid media variants
M2 (solid variant)
M3 (liquid
variant) No. of roots/explant 1.16±0.93 3.91±0.9*
Root length 0.87±0.37 1.23 ± 0.21*
Data followed by * are significant different according to Tukey test (p<0.05).
During time, the importance of growth media variant and incubation conditions to produce specific medicinal compounds at a rate similar

53
The aim of our study was to evaluate the antioxidant properties based on total phenolic content, flavonoids concentration and reducing capacity of extracts from in vitro differentiated roots induced in moderate osmotic stress of the protected plant species G. lutea. MATERIALS AND METHODS Root cultures were established starting from leave and root fragments detached from germinated somatic embryos (Figure 1).
Figure 1. Six years - old highly embryogenesis
culture used as explants source
A six year - old highly embryogenesis culture maintained in condition of moderate osmotic stress induced by 3% mannitol (Holobiuc and Catană, 2012) represent the source of somatic embryos. The recurrent somatic embryos cultures were maintained on solid (M2) MS medium (Murashige and Skoog, 1962) supplemented with Gamborg vitamins (Gamborg et al., 1968), 3% sucrose and 3% mannitol. No plant growth factors were used. To increase the number of roots, a liquid variant of the same medium was used. The pH was adjusted to 5.8. The solid media variants were solidified with 8 g/l Plant agar. A GFL 3017 Orbital shaker (110 rpm) was used to perform liquid root cultures. A solid MS without mannitol was used as control (M1) variant. The conditions for maintaining of in vitro cultures were represented by a 16 h light/8 h dark photoperiod, with light intensity of 27 µmol*m-2*sec-1 and temperature 24±2°C.
Survival percentage of the explants (%), percentage of rooted explants (%), number of roots/explant and mean roots length (cm) represents the evaluated parameters of the in vitro root cultures. The results were recorded after 4 weeks. The survival percentage was calculated as the number of viable explants after 4 weeks of culture on media variants/ total of initial explants * 100. To check the statistical significance, one-way analyse of variance was used. Tukey test was used for multiple comparations (http://xltoolbox.sourceforge.net).
The extraction of G. lutea antioxidant compounds. Differentiated roots were dried on filter paper, grounded with quartz sand and extracted in a ratio of 1: 1 (v/v) with 100% methanol for 24 hours. The homogenates were centrifuged at 10000 G, for 20 minutes and the supernatant were used for the subsequent analysis.
Determination of the total phenolic content (TPC). TPC was determined according to the method described by Mihailovic et al., 2013 with some changes. The reaction mixture (0.5 ml of suitably diluted extract, 2.5 ml Folin-Ciocalteu reagent diluted 11-fold, 2 ml of 7.5% Na2CO3) was kept 30 minutes at room tem-perature. After that the absorbance was measured at 765 nm. Three repetitions of the same variant were made and the average represents total phenol content expressed as gallic acid/fresh weight (EAG mg/g sample).
Determination of the flavonoids. Estimated flavonoid content of methanol extracts was performed using a protocol described by Zhishen et al., 1999, with minor adjustments. Thus, suitably diluted 0.5 ml methanol extract of each sample was added with 2 ml of distilled water and 5% NaNO2 solution and the mixture was equilibrated for 5 min. Then 150 μl of 10% AlCl3 solution was added, and after 6 minutes of reaction was added 1 ml of 4% NaOH and brought to a total volume of 5 mL with distilled water. Optical density at 510 nm was recorded against blank and flavonoid concentration estimation was done according to a calibration curve using the standard routine. Three repetitions of the
same variable were made and the average of flavonoid content was expressed as rutin equivalent/ f fresh weight (ERU mg/g sample). Determination of antioxidant capacity by DPPH method. According to the method proposed by Marxen et al., 2007, corresponding diluted 100μl extract was mixed with 2.25 ml of methanol and 150 µl methanol solution of 1.27 mM DPPH. At the same time, control was replaced with the extraction solvent. After 30 minutes of incubation at room temperature and darkness absorbance was read at 515nm. Antioxidant capacity represented differences between the samples and control against a standard curve that used Trolox (synthetic antioxidant α-tocopherol analogue) as standard antioxidant. Three repetitions of the same variable were done and the average readings representing antioxidant capacity, expressed as Trolox/ fresh weight (mM Trolox/g sample). Measurement of reducing power or determination of Fe3+ ions reduction. The reduction of Fe3+ to Fe2+ ions by the methanol extract was carried out according to the method described by Gursoy et al., 2009. The reaction mixture consisted in 1 ml of the diluted extract, 1 ml of 1% K3Fe(CN)6 and 1 ml of 0.2 M Na phosphate buffer, pH 6.6, incubated for 20 min at 50°C. 10% TCA was added and centrifuged at 10000 RCF, 10 min at room temperature. Subsequently, 1 ml supernatant was mixed with 1 ml of distilled water and 0.5 ml 0.1% FeCl3 and absorbance was measured at 700 nm. The measurement of reducing power was deter-mined by reference to a standard curve with Trolox as a reducing agent. Three repetitions were made and the average of reducing power has been expressed in Trolox equivalents/fresh weight (mg Trolox/g sample). RESULTS AND DISCUSSIONS The root system of G. lutea from nature is forbidden to harvest being a protected plant species. In this way, an in vitro root culture was applied for roots induction and for the analyses of the antioxidant properties. In our case, it was observed that rooting response varied in terms of survival percentage of the explants, rooted explants (Table 1).
Table 1. Survival and rooting percentages of explants on media variants tested
M1
(control)
M2 (solid
variant)
M3 (liquid variant)
Survival percentage 16.66 100 100
Rooting percentage 0 60 50
Legend: M2 and M3 – media variants added with 3% mannitol. Both explants type (root and leaf fragments) cultivated on solid and liquid media variants added with 3% mannitol showed a 100% survival percentage. On the control, medium variant without mannitol, only 16.66% of explants survived (Table 1). The rooting process started about 14 days after the initiation of root cultures. Moderate stress induced by 3% mannitol was able to initiate and sustain the roots development with no significant differences (p<0.05) between solid (M2) and liquid (M3) media variants. No roots induction was observed on control variant. These data suggested that the combination of sucrose and mannitol sustain the root developmental. Our results are in accordance with results concerning shoot multiplication in a root tip culture of garlic, where MS media variant added with 0.8% mannitol and 3% sucrose had a better result than all the sucrose concen-trations tested (Haque et al., 2003). Number of roots/explant and roots length showed significant differences (p<0.05) between liquid and solid media variants added with 3% mannitol (Table 2).
Table 2. Number of roots and root length of G. lutea developed on the solid and liquid media variants
M2 (solid variant)
M3 (liquid
variant) No. of roots/explant 1.16±0.93 3.91±0.9*
Root length 0.87±0.37 1.23 ± 0.21*
Data followed by * are significant different according to Tukey test (p<0.05).
During time, the importance of growth media variant and incubation conditions to produce specific medicinal compounds at a rate similar
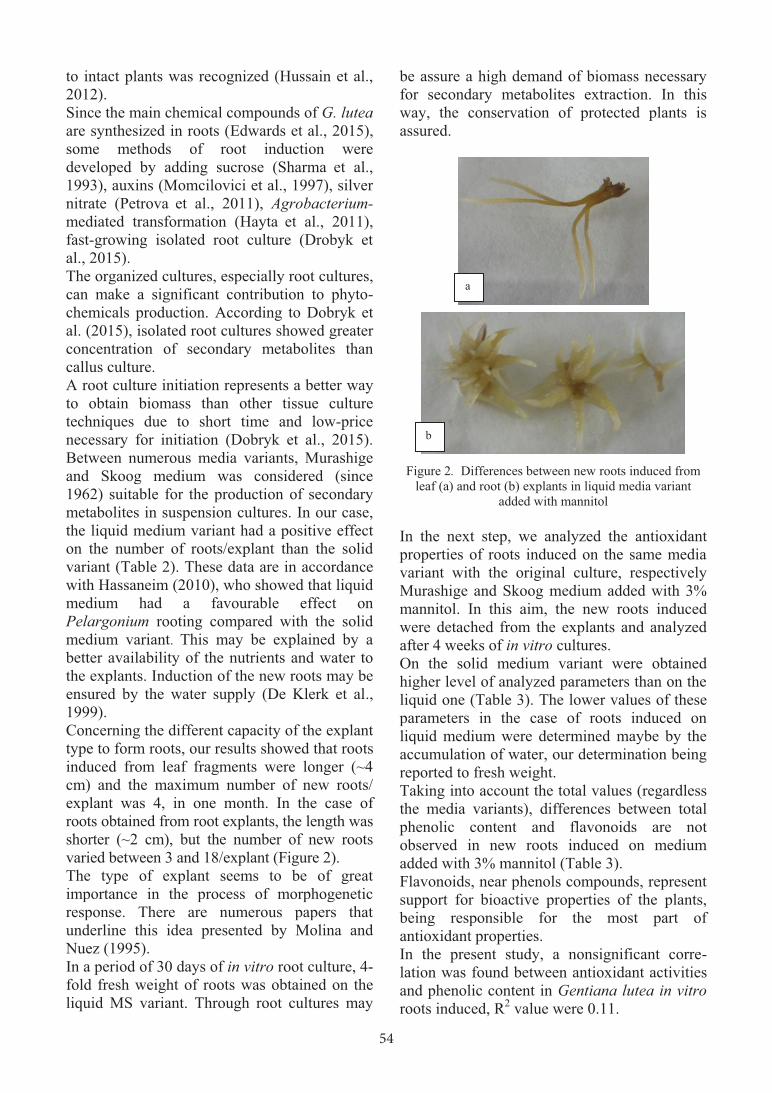
54
to intact plants was recognized (Hussain et al., 2012). Since the main chemical compounds of G. lutea are synthesized in roots (Edwards et al., 2015), some methods of root induction were developed by adding sucrose (Sharma et al., 1993), auxins (Momcilovici et al., 1997), silver nitrate (Petrova et al., 2011), Agrobacterium- mediated transformation (Hayta et al., 2011), fast-growing isolated root culture (Drobyk et al., 2015). The organized cultures, especially root cultures, can make a significant contribution to phyto-chemicals production. According to Dobryk et al. (2015), isolated root cultures showed greater concentration of secondary metabolites than callus culture. A root culture initiation represents a better way to obtain biomass than other tissue culture techniques due to short time and low-price necessary for initiation (Dobryk et al., 2015). Between numerous media variants, Murashige and Skoog medium was considered (since 1962) suitable for the production of secondary metabolites in suspension cultures. In our case, the liquid medium variant had a positive effect on the number of roots/explant than the solid variant (Table 2). These data are in accordance with Hassaneim (2010), who showed that liquid medium had a favourable effect on Pelargonium rooting compared with the solid medium variant. This may be explained by a better availability of the nutrients and water to the explants. Induction of the new roots may be ensured by the water supply (De Klerk et al., 1999). Concerning the different capacity of the explant type to form roots, our results showed that roots induced from leaf fragments were longer (~4 cm) and the maximum number of new roots/ explant was 4, in one month. In the case of roots obtained from root explants, the length was shorter (~2 cm), but the number of new roots varied between 3 and 18/explant (Figure 2). The type of explant seems to be of great importance in the process of morphogenetic response. There are numerous papers that underline this idea presented by Molina and Nuez (1995). In a period of 30 days of in vitro root culture, 4-fold fresh weight of roots was obtained on the liquid MS variant. Through root cultures may
be assure a high demand of biomass necessary for secondary metabolites extraction. In this way, the conservation of protected plants is assured.
Figure 2. Differences between new roots induced from leaf (a) and root (b) explants in liquid media variant
added with mannitol
In the next step, we analyzed the antioxidant properties of roots induced on the same media variant with the original culture, respectively Murashige and Skoog medium added with 3% mannitol. In this aim, the new roots induced were detached from the explants and analyzed after 4 weeks of in vitro cultures. On the solid medium variant were obtained higher level of analyzed parameters than on the liquid one (Table 3). The lower values of these parameters in the case of roots induced on liquid medium were determined maybe by the accumulation of water, our determination being reported to fresh weight. Taking into account the total values (regardless the media variants), differences between total phenolic content and flavonoids are not observed in new roots induced on medium added with 3% mannitol (Table 3). Flavonoids, near phenols compounds, represent support for bioactive properties of the plants, being responsible for the most part of antioxidant properties. In the present study, a nonsignificant corre-lation was found between antioxidant activities and phenolic content in Gentiana lutea in vitro roots induced, R2 value were 0.11.
a
b
Between antioxidant capacity and flavonoid content the R2 value was 0.96. These results suggested that flavonoid compounds were responsible for antioxidant capacity in our case.
Table 3. Total phenolic content, flavonoids concentration, antioxidant activity, reduction power of G. lutea roots induced in the presence of 3% mannitol
Solid media variant
Liquid media variant
Total
Total phenolic content (EAG mg/g FW)
1.035 ± 1.10
0.321 ± 0.118
1.356 ± 1.219
Flavonoid concentration (ERU mg/g FW)
1.471 ± 0.83
0.211 ± 0.088
1.682 ± 0.471
Antioxidant capacity (mM Trolox/g)
4.095 ± 0.72
1.055 ± 0.374
5.15 ± 1.102
Reduction power (mg Trolox/g FW)
4.165 ± 1.83
0.555 ± 0.148
4.72 ± 1.979
These data are not in accordance with previous reports, where the antioxidant activity of G. lutea correlates with the phenolic content (Bayliac et al., 2016; Nastasijević et al., 2012). There are studies which showed good correlation between phenolic content and antioxidant activity (Deighton et al., 2000) whereas another found no correlation (Gazzani et al., 1998). Although our results showed that the antioxidant capacity is not correlated with total phenolic content, the reducing power showed that these compounds may act as primary and secondary antioxidants (Chanda and Dave, 2009). The reducing power reflects the electron donating capacity of bioactive compounds, being associated with antioxidant activity. Fe (III) reduction is often used as an indicator of electron- donating activity, which is an important mechanism of phenolic antioxidant action (Nabavi et al., 2009). The primary antioxidants term refer to those which actively inhibit oxidation reactions, and secondary antioxidants refer to those which inhibit oxidation indirectly, by mechanisms such as oxygen-scavenging, binding pro-oxidants, etc.) (Shashidi and Wanasundara, 1992). Rice-Evans et al. (1997) considered phenolics to operate as secondary oxidants due to their ability to bind with potentially pro-oxidative metal ions.
Some papers were mentioned to evaluate the antioxidant activity of Gentian roots. Screening the antioxidant activity of G. lutea commercially dried root, Azman et al. (2014) obtained 12.3 g GAE/g DW total phenolic content and 15.89 μmol of TE/g DW antioxidant activity. In our case, the total value of phenolic content was lower (1.35 mg GAE/g FW and 5.15 mM Trolox/g FW DPPH activity). The quantitative differences might be referred to the environmental factors and current growth stage, our cultures were grown only for 4 weeks, whereas the commercially dried root was over three years old. A comparative analysis of metabolites in G. scarba roots from different sources (2 months old normal roots grown in greenhouse and two different perennial Gentiana dried herbs available in the market) showed that secondary metabolite contents are greatly affected by age and source of origin of the plants (Huang et al., 2014). Concerning type of explant, differences were observed not only at morphological but also at biochemical level. Differences of biosynthetic potential of organ cultures derived from various explants, plant genotypes, and structural and functional rearrangement of cell genomes in in vitro culture represent some factors which can caused changes in secondary metabolism (Kunakh, 2005). Roots induced from leaf explants were characterized by higher flavonoid concentration (Figure 3).
Figure 3. Total phenolic content and flavonoids concentration of roots induced from different explants
These results are due to the distribution of flavonoids virtually in all plant parts, particularly the photosynthesizing plant cells (Kumar and Pandey, 2013). Higher flavonoid
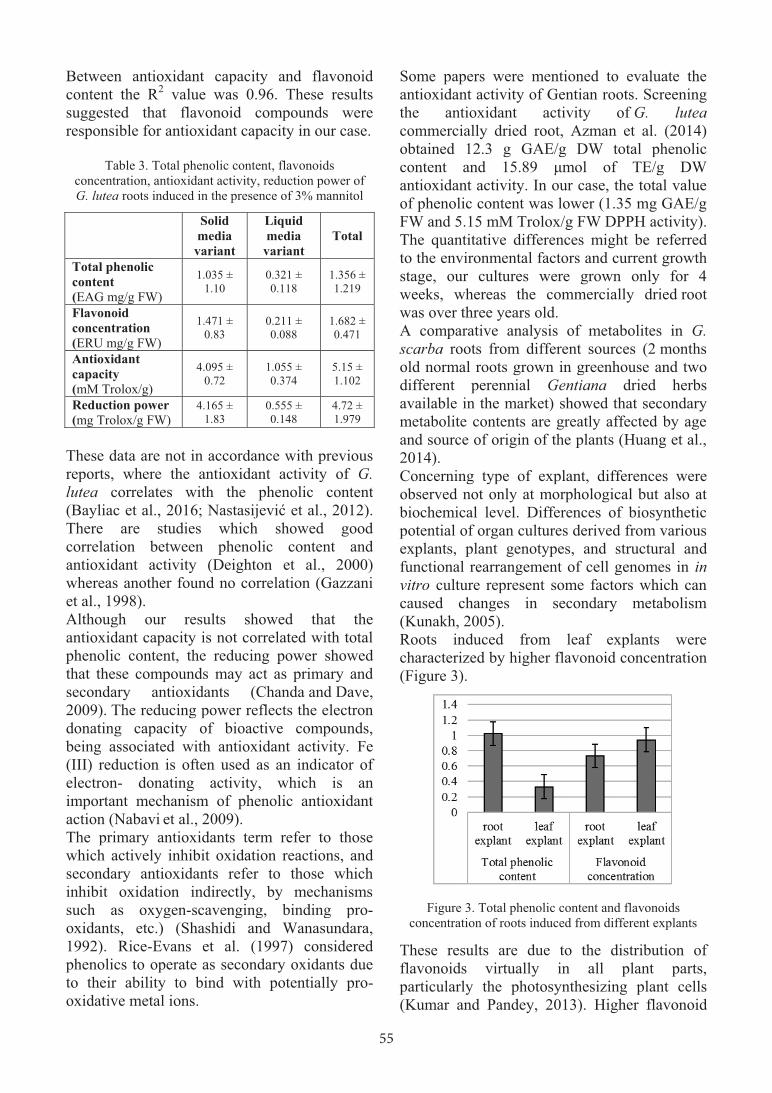
55
to intact plants was recognized (Hussain et al., 2012). Since the main chemical compounds of G. lutea are synthesized in roots (Edwards et al., 2015), some methods of root induction were developed by adding sucrose (Sharma et al., 1993), auxins (Momcilovici et al., 1997), silver nitrate (Petrova et al., 2011), Agrobacterium- mediated transformation (Hayta et al., 2011), fast-growing isolated root culture (Drobyk et al., 2015). The organized cultures, especially root cultures, can make a significant contribution to phyto-chemicals production. According to Dobryk et al. (2015), isolated root cultures showed greater concentration of secondary metabolites than callus culture. A root culture initiation represents a better way to obtain biomass than other tissue culture techniques due to short time and low-price necessary for initiation (Dobryk et al., 2015). Between numerous media variants, Murashige and Skoog medium was considered (since 1962) suitable for the production of secondary metabolites in suspension cultures. In our case, the liquid medium variant had a positive effect on the number of roots/explant than the solid variant (Table 2). These data are in accordance with Hassaneim (2010), who showed that liquid medium had a favourable effect on Pelargonium rooting compared with the solid medium variant. This may be explained by a better availability of the nutrients and water to the explants. Induction of the new roots may be ensured by the water supply (De Klerk et al., 1999). Concerning the different capacity of the explant type to form roots, our results showed that roots induced from leaf fragments were longer (~4 cm) and the maximum number of new roots/ explant was 4, in one month. In the case of roots obtained from root explants, the length was shorter (~2 cm), but the number of new roots varied between 3 and 18/explant (Figure 2). The type of explant seems to be of great importance in the process of morphogenetic response. There are numerous papers that underline this idea presented by Molina and Nuez (1995). In a period of 30 days of in vitro root culture, 4-fold fresh weight of roots was obtained on the liquid MS variant. Through root cultures may
be assure a high demand of biomass necessary for secondary metabolites extraction. In this way, the conservation of protected plants is assured.
Figure 2. Differences between new roots induced from leaf (a) and root (b) explants in liquid media variant
added with mannitol
In the next step, we analyzed the antioxidant properties of roots induced on the same media variant with the original culture, respectively Murashige and Skoog medium added with 3% mannitol. In this aim, the new roots induced were detached from the explants and analyzed after 4 weeks of in vitro cultures. On the solid medium variant were obtained higher level of analyzed parameters than on the liquid one (Table 3). The lower values of these parameters in the case of roots induced on liquid medium were determined maybe by the accumulation of water, our determination being reported to fresh weight. Taking into account the total values (regardless the media variants), differences between total phenolic content and flavonoids are not observed in new roots induced on medium added with 3% mannitol (Table 3). Flavonoids, near phenols compounds, represent support for bioactive properties of the plants, being responsible for the most part of antioxidant properties. In the present study, a nonsignificant corre-lation was found between antioxidant activities and phenolic content in Gentiana lutea in vitro roots induced, R2 value were 0.11.
a
b
Between antioxidant capacity and flavonoid content the R2 value was 0.96. These results suggested that flavonoid compounds were responsible for antioxidant capacity in our case.
Table 3. Total phenolic content, flavonoids concentration, antioxidant activity, reduction power of G. lutea roots induced in the presence of 3% mannitol
Solid media variant
Liquid media variant
Total
Total phenolic content (EAG mg/g FW)
1.035 ± 1.10
0.321 ± 0.118
1.356 ± 1.219
Flavonoid concentration (ERU mg/g FW)
1.471 ± 0.83
0.211 ± 0.088
1.682 ± 0.471
Antioxidant capacity (mM Trolox/g)
4.095 ± 0.72
1.055 ± 0.374
5.15 ± 1.102
Reduction power (mg Trolox/g FW)
4.165 ± 1.83
0.555 ± 0.148
4.72 ± 1.979
These data are not in accordance with previous reports, where the antioxidant activity of G. lutea correlates with the phenolic content (Bayliac et al., 2016; Nastasijević et al., 2012). There are studies which showed good correlation between phenolic content and antioxidant activity (Deighton et al., 2000) whereas another found no correlation (Gazzani et al., 1998). Although our results showed that the antioxidant capacity is not correlated with total phenolic content, the reducing power showed that these compounds may act as primary and secondary antioxidants (Chanda and Dave, 2009). The reducing power reflects the electron donating capacity of bioactive compounds, being associated with antioxidant activity. Fe (III) reduction is often used as an indicator of electron- donating activity, which is an important mechanism of phenolic antioxidant action (Nabavi et al., 2009). The primary antioxidants term refer to those which actively inhibit oxidation reactions, and secondary antioxidants refer to those which inhibit oxidation indirectly, by mechanisms such as oxygen-scavenging, binding pro-oxidants, etc.) (Shashidi and Wanasundara, 1992). Rice-Evans et al. (1997) considered phenolics to operate as secondary oxidants due to their ability to bind with potentially pro-oxidative metal ions.
Some papers were mentioned to evaluate the antioxidant activity of Gentian roots. Screening the antioxidant activity of G. lutea commercially dried root, Azman et al. (2014) obtained 12.3 g GAE/g DW total phenolic content and 15.89 μmol of TE/g DW antioxidant activity. In our case, the total value of phenolic content was lower (1.35 mg GAE/g FW and 5.15 mM Trolox/g FW DPPH activity). The quantitative differences might be referred to the environmental factors and current growth stage, our cultures were grown only for 4 weeks, whereas the commercially dried root was over three years old. A comparative analysis of metabolites in G. scarba roots from different sources (2 months old normal roots grown in greenhouse and two different perennial Gentiana dried herbs available in the market) showed that secondary metabolite contents are greatly affected by age and source of origin of the plants (Huang et al., 2014). Concerning type of explant, differences were observed not only at morphological but also at biochemical level. Differences of biosynthetic potential of organ cultures derived from various explants, plant genotypes, and structural and functional rearrangement of cell genomes in in vitro culture represent some factors which can caused changes in secondary metabolism (Kunakh, 2005). Roots induced from leaf explants were characterized by higher flavonoid concentration (Figure 3).
Figure 3. Total phenolic content and flavonoids concentration of roots induced from different explants
These results are due to the distribution of flavonoids virtually in all plant parts, particularly the photosynthesizing plant cells (Kumar and Pandey, 2013). Higher flavonoid

56
concentration in leaf than root where found in Rhus pentaphylla extracts (Itidel et al., 2013). In or case, a higher total phenolic content was observed in the case of roots induced from root explant. These data are in accordance with those founded in Rhus tripartita and R. pentaphylla, where the total phenolic content was higher in stem cortex than in other plant parts (Itidel et al., 2013). CONCLUSIONS The root induction is depending on type of explant and the media variant used. The MS liquid media variant added with 3% mannitol was able to induce a higher result concerning number of roots and roots length. 4-fold fresh weight of roots was obtained on liquid MS variant in 30 days. Since root culture is less expensive, required less growth period and eco-friendly method, it might be a good alternative for production of important medicinal ingredients from protected Gentiana. Roots obtained on solid medium variant showed a higher antioxidant activity correlated with flavonoids content. ACKNOWLEDGEMENTS This study was funded by Romanian Academy Research project RO1567-IBB06/2016. REFERENCES Ando H., Hiral Y., Fuji M., Hori Y., Fukumur M., Niiho
Y., Nakajima Y., Shibata T., Toriizuka K., Ida Y., 2007. The chemical constituents of fresh Gentiana roots. Journal of Natural Medicines, 61, p. 269–279.
Azman N.A.M., Segovia F., Martínez-Farré X., Gil E., Almajano M.P., 2015. Screening of antioxidant activity of Gentian lutea root and its application in oil-in-water emulsions. Antioxidants, 3, p. 455-471.
Bayliak M.M., Burdyliuk N.I., Lushchak V.I., 2016. Effects of pH on antioxidant and prooxidant properties of common medicinal herbs. Open Life Science, 11(1), p. 298-307.
Chanda S., Dave R., 2009. In vitro models for antioxi-dant activity evaluation and some medicinal plants possessing antioxidant properties: An overview. African Journal of Microbiology Research, 3(13), p. 981‐996.
De Klerk G.J., Van Der Krieken W., De Jong J.C., 1999. The formation of adventitious roots: new concepts, new possibilities. In vitro Cellular and Develop-mental Biology- Plant, 35, p. 189–199.
Deighton N., Brennan R., Finn C., Davies H.V., 2000. Antioxidant properties of domesticated and wild Rubus species. Journal of the Science of Food and Agriculture, 80, p. 1307–1313.
Drobyk N.M., Hrytsak L.R., Mel’nyk V.M., Kravets N.B., Konvalyuk I.I., Twardovska O., Kunakh V.A., 2015. In vitro manipulation and propagation of Gentiana L. species from the Ukrainian Flora. In: The Gentianaceae - Volume 2: Biotechnology and Applications. Edited by Rybczyński J.J. et al. (Springer-Verlag Berlin Heidelberg). P. 45-79.
Drobyk N.M., Mel’nyk V.M., Twardovska M.O., Konvalyuk I.I., Kunakh V.A., 2015. Tissue and Organ Cultures of Gentians as Potential Sources of Xanthones and Flavonoids. In: The Gentianaceae - Volume 2: Biotechnology and Applications. Edited by Rybczyński J.J. et al. (Springer-Verlag Berlin Heidelberg), p. 307-317.
Edwards S.E., Costa R.I., Williamson E.M., Heinrich M., 2015. Phytopharmacy: An evidence-based guide to Herbal Medicinal Products. (John Wiley & Sons) Science. 46.
Gamborg O.L., Miller R.A., Ojima K., 1968. Nutrient requirements of suspension cultures of soybean root cells. Experimental Cell Research, 50, 151.
Gazzani G., Papetti A., Massolini G., Daglia M., 1998. Anti- and prooxidant activity of water soluble components of some common diet vegetables and the effect of thermal treatment. Journal of Agricultural and Food Chemistry, 46, p. 4118-4122.
Gursoy N., Sarikurikcu C., Cengiz M., Solak M.H., 2009. Antioxidant activities, metal contents, total phenolics and flavonoids of seven Morchella species. Food and Chemical Toxicology, 47, p. 2381- 2388.
Hassaneim A.M.A., 2010. Establishment of efficient in vitro method for drought tolerance evaluation in Pelargonium. Journal of Horticultural Science, 2(1), p. 8-15.
Hayta S., Gurel A., Akgun I.H., Altan F., Ganzera M., Tanyolac B., Bedir E., 2011. Induction of Gentiana cruciata hairy roots and their secondary metabolites. Biologia, 66/4, p. 618-625.
Haque M.S., Tomikichi W., Hattori K., 2003. Effects of sucrose, mannitol and KH2PO4 on proliferation of root tip derived shoots and subsequent bulblet formation in garlic. Asian Journal of Plant Sciences, 2, p. 903-908.
Heltmann H., Silva F., 1970. Zur Zuchtung leistungsfahiger Inzuchtlinien fur eine synthetische Mohnsorte. Herba Hungarica.
Holobiuc I., Catană R., 2012. Recurrent somatic embryogenesis in long-term cultures of Gentiana lutea L. as a source for synthetic seed production for medium-term preservation. Archives of Biological Science, Belgrade, 64 (2), p. 809-817.
http://xltoolbox.sourceforge.net Huang S.H., Vishwakarma R.K., Lee T.T, Chan H.S.,
Hsin-Sheng Tsay H.S., 2014. Establishment of hairy root lines and analysis of iridoids and secoiridoids in the medicinal plant Gentiana scabra. Botanical Studies An International Journal, 55, p. 17-25
Hussain S., Fareed S., Ansari S., Rahman A., Ahmed I.Z., Saeed M., 2012. Current approaches toward
production of secondary plant metabolites. Journal of Pharmacy and Bioallied Science, 4(1), p. 10-20.
Itidel C., Chokri M., Mohamed B., Yosr Z., 2013. Antioxidant activity, total phenolic and flavonoid content variation among Tunisian natural populations of Rhus tripartita (Ucria) Grande and Rhus pentaphylla Desf. Industrial Crops and Products, 51, p. 171–177.
Kumar S., Pandey A.K., 2013. Chemistry and Biological Activities of Flavonoids: An Overview, Hindawi Publishing Corporation. The Scientific World Journal, 16.
Kunakh V.A., 2005. Biotehnology of medicinal plants. Enetic, physiological and biochemical basis. Logos, Kyiv.
Marxen K., Vanselow K.H., Lippemeier S., Hintze R., Ruser A., Hansen U.P., 2007. Determination of DPPH radical oxidation caused by methanolic extracts of some microalgal species by linear regression analysis of spectrophotometric measurements. Sensors, 7, p. 2080-2095.
Mikula A., Rybczynski J.J., Skierski J., Latkowska M.J., Fiuk A., 2005. Somatic embryogenesis of Gentiana genus IV. Characterization of Gentiana cruciata and Gentiana tibetica embryogenic cell suspensions, In: Hvoslef-Eide A.K. & Preil W. (eds), Liquid Culture Systems for in vitro Plant Propagation, Springer, The Netherlands, p. 345–358.
Mihailović V., Matić S., Mišić D., Solujić S., Stanić S., Katanić J., Stanković N., 2013, Chemical composition, antioxidant and antigenotoxic activities of different fractions of Gentiana asclepiadea L. roots extract. EXCLI Journal, 12, p. 807-823.
Molina R.V., Nuez F., 1995. Correlated response of in vitro regeneration capacity from different source of explants in Cucumis melo. Plant Cell Reports, 15(1-2), p. 129-132.
Momcilovic I., Grubisik D., Neskovic M., 1997. Micropropagation of four Gentiana species (Gentiana lutea, G. cruciata, G. purpurea and G. acaulis). Plant Cell, Tissue and Organ culture, 49, 2, p. 141-144.
Murashige T., Skoog F., 1962. Revised medium for rapid growth and bioassays with tobacco tissue cultures. Physiology Plantarum, 15(3), p. 473-497.
Nabavi S.M., Ebrahimzadeh M.A., Nabavi S.F., Fazelian M., Eslami B., 2009. In vitro antioxidant and free radical scavenging activity of Diospyros lotus and Pyrus boissieriana growing in Iran. Pharmacognosy Magazine, 4(18), p. 122-126.
Nastasijević B., Lazarević-Pašti T., Dimitrijević-Branković S., Pašti I., Vujačić A., Joksić G., Vasić V., 2012. Inhibition of myeloperoxidase and antioxidative activity of Gentiana lutea extracts. Journal of Pharmaceutical and Biomedical Analysis, 66, p. 191-196.
Oprea A., 2005. Lista Critica a Plantelor Vasculare din România. Univ.”Al. Ioan Cuza”, Iași.
Petrova M., Zayova E., Vitkova A., 2011. Effect of silver nitrate on in vitro root formation of Gentiana lutea. Romanian Biotechnological Letters, 16(6), p. 53-58.
Rice-Evans C.A., Miller N.J., Paganga G., 1997. Antioxidant properties of phenolic compounds. Trends in Plant Sci., 2, p. 152–59.
Rybczyński J.J., Davey M.R., Mikula A., 2015. The Gentianaceae - Volume 2: Biotechnology and Applications. Springer-Verlag Berlin Heidelberg 452.
Rybczyński J.J., Michael R.D., Mikula A., 2014. The Gentianaceae - Volume 1: Characterization and Ecology. Springer-Verlag Berlin Heidelberg, 329.
Sava Sand C., 2015. Peculiarities for agricultural technology of Gentiana lutea. Scientific Papers Series Management, Economic Engineering in Agriculture and Rural Development, 15(1), p. 449-454.
Shahidi F., Wanasundara P.K.J.P.D., 1992. Phenolic antioxidants. Critical Reviews in Food Science and Nutrition, 32, p. 67-103.
Sharma N., Chandel K.P.S., Anderson P., 1993. Research note in vitro propagation of Gentiana kurroo - an indigenous threatened plant of medicinal importance. Plant Cell, Tissue and Organ Culture, 34, p. 307-309.
Zhishen J., Mengcheng T., Jianming W., 1999. The determination of flavonoid content in mulberry and their scavenging effects on superoxide radicals. Food Chemistry, 64, p. 555-559.
57
concentration in leaf than root where found in Rhus pentaphylla extracts (Itidel et al., 2013). In or case, a higher total phenolic content was observed in the case of roots induced from root explant. These data are in accordance with those founded in Rhus tripartita and R. pentaphylla, where the total phenolic content was higher in stem cortex than in other plant parts (Itidel et al., 2013). CONCLUSIONS The root induction is depending on type of explant and the media variant used. The MS liquid media variant added with 3% mannitol was able to induce a higher result concerning number of roots and roots length. 4-fold fresh weight of roots was obtained on liquid MS variant in 30 days. Since root culture is less expensive, required less growth period and eco-friendly method, it might be a good alternative for production of important medicinal ingredients from protected Gentiana. Roots obtained on solid medium variant showed a higher antioxidant activity correlated with flavonoids content. ACKNOWLEDGEMENTS This study was funded by Romanian Academy Research project RO1567-IBB06/2016. REFERENCES Ando H., Hiral Y., Fuji M., Hori Y., Fukumur M., Niiho
Y., Nakajima Y., Shibata T., Toriizuka K., Ida Y., 2007. The chemical constituents of fresh Gentiana roots. Journal of Natural Medicines, 61, p. 269–279.
Azman N.A.M., Segovia F., Martínez-Farré X., Gil E., Almajano M.P., 2015. Screening of antioxidant activity of Gentian lutea root and its application in oil-in-water emulsions. Antioxidants, 3, p. 455-471.
Bayliak M.M., Burdyliuk N.I., Lushchak V.I., 2016. Effects of pH on antioxidant and prooxidant properties of common medicinal herbs. Open Life Science, 11(1), p. 298-307.
Chanda S., Dave R., 2009. In vitro models for antioxi-dant activity evaluation and some medicinal plants possessing antioxidant properties: An overview. African Journal of Microbiology Research, 3(13), p. 981‐996.
De Klerk G.J., Van Der Krieken W., De Jong J.C., 1999. The formation of adventitious roots: new concepts, new possibilities. In vitro Cellular and Develop-mental Biology- Plant, 35, p. 189–199.
Deighton N., Brennan R., Finn C., Davies H.V., 2000. Antioxidant properties of domesticated and wild Rubus species. Journal of the Science of Food and Agriculture, 80, p. 1307–1313.
Drobyk N.M., Hrytsak L.R., Mel’nyk V.M., Kravets N.B., Konvalyuk I.I., Twardovska O., Kunakh V.A., 2015. In vitro manipulation and propagation of Gentiana L. species from the Ukrainian Flora. In: The Gentianaceae - Volume 2: Biotechnology and Applications. Edited by Rybczyński J.J. et al. (Springer-Verlag Berlin Heidelberg). P. 45-79.
Drobyk N.M., Mel’nyk V.M., Twardovska M.O., Konvalyuk I.I., Kunakh V.A., 2015. Tissue and Organ Cultures of Gentians as Potential Sources of Xanthones and Flavonoids. In: The Gentianaceae - Volume 2: Biotechnology and Applications. Edited by Rybczyński J.J. et al. (Springer-Verlag Berlin Heidelberg), p. 307-317.
Edwards S.E., Costa R.I., Williamson E.M., Heinrich M., 2015. Phytopharmacy: An evidence-based guide to Herbal Medicinal Products. (John Wiley & Sons) Science. 46.
Gamborg O.L., Miller R.A., Ojima K., 1968. Nutrient requirements of suspension cultures of soybean root cells. Experimental Cell Research, 50, 151.
Gazzani G., Papetti A., Massolini G., Daglia M., 1998. Anti- and prooxidant activity of water soluble components of some common diet vegetables and the effect of thermal treatment. Journal of Agricultural and Food Chemistry, 46, p. 4118-4122.
Gursoy N., Sarikurikcu C., Cengiz M., Solak M.H., 2009. Antioxidant activities, metal contents, total phenolics and flavonoids of seven Morchella species. Food and Chemical Toxicology, 47, p. 2381- 2388.
Hassaneim A.M.A., 2010. Establishment of efficient in vitro method for drought tolerance evaluation in Pelargonium. Journal of Horticultural Science, 2(1), p. 8-15.
Hayta S., Gurel A., Akgun I.H., Altan F., Ganzera M., Tanyolac B., Bedir E., 2011. Induction of Gentiana cruciata hairy roots and their secondary metabolites. Biologia, 66/4, p. 618-625.
Haque M.S., Tomikichi W., Hattori K., 2003. Effects of sucrose, mannitol and KH2PO4 on proliferation of root tip derived shoots and subsequent bulblet formation in garlic. Asian Journal of Plant Sciences, 2, p. 903-908.
Heltmann H., Silva F., 1970. Zur Zuchtung leistungsfahiger Inzuchtlinien fur eine synthetische Mohnsorte. Herba Hungarica.
Holobiuc I., Catană R., 2012. Recurrent somatic embryogenesis in long-term cultures of Gentiana lutea L. as a source for synthetic seed production for medium-term preservation. Archives of Biological Science, Belgrade, 64 (2), p. 809-817.
http://xltoolbox.sourceforge.net Huang S.H., Vishwakarma R.K., Lee T.T, Chan H.S.,
Hsin-Sheng Tsay H.S., 2014. Establishment of hairy root lines and analysis of iridoids and secoiridoids in the medicinal plant Gentiana scabra. Botanical Studies An International Journal, 55, p. 17-25
Hussain S., Fareed S., Ansari S., Rahman A., Ahmed I.Z., Saeed M., 2012. Current approaches toward
production of secondary plant metabolites. Journal of Pharmacy and Bioallied Science, 4(1), p. 10-20.
Itidel C., Chokri M., Mohamed B., Yosr Z., 2013. Antioxidant activity, total phenolic and flavonoid content variation among Tunisian natural populations of Rhus tripartita (Ucria) Grande and Rhus pentaphylla Desf. Industrial Crops and Products, 51, p. 171–177.
Kumar S., Pandey A.K., 2013. Chemistry and Biological Activities of Flavonoids: An Overview, Hindawi Publishing Corporation. The Scientific World Journal, 16.
Kunakh V.A., 2005. Biotehnology of medicinal plants. Enetic, physiological and biochemical basis. Logos, Kyiv.
Marxen K., Vanselow K.H., Lippemeier S., Hintze R., Ruser A., Hansen U.P., 2007. Determination of DPPH radical oxidation caused by methanolic extracts of some microalgal species by linear regression analysis of spectrophotometric measurements. Sensors, 7, p. 2080-2095.
Mikula A., Rybczynski J.J., Skierski J., Latkowska M.J., Fiuk A., 2005. Somatic embryogenesis of Gentiana genus IV. Characterization of Gentiana cruciata and Gentiana tibetica embryogenic cell suspensions, In: Hvoslef-Eide A.K. & Preil W. (eds), Liquid Culture Systems for in vitro Plant Propagation, Springer, The Netherlands, p. 345–358.
Mihailović V., Matić S., Mišić D., Solujić S., Stanić S., Katanić J., Stanković N., 2013, Chemical composition, antioxidant and antigenotoxic activities of different fractions of Gentiana asclepiadea L. roots extract. EXCLI Journal, 12, p. 807-823.
Molina R.V., Nuez F., 1995. Correlated response of in vitro regeneration capacity from different source of explants in Cucumis melo. Plant Cell Reports, 15(1-2), p. 129-132.
Momcilovic I., Grubisik D., Neskovic M., 1997. Micropropagation of four Gentiana species (Gentiana lutea, G. cruciata, G. purpurea and G. acaulis). Plant Cell, Tissue and Organ culture, 49, 2, p. 141-144.
Murashige T., Skoog F., 1962. Revised medium for rapid growth and bioassays with tobacco tissue cultures. Physiology Plantarum, 15(3), p. 473-497.
Nabavi S.M., Ebrahimzadeh M.A., Nabavi S.F., Fazelian M., Eslami B., 2009. In vitro antioxidant and free radical scavenging activity of Diospyros lotus and Pyrus boissieriana growing in Iran. Pharmacognosy Magazine, 4(18), p. 122-126.
Nastasijević B., Lazarević-Pašti T., Dimitrijević-Branković S., Pašti I., Vujačić A., Joksić G., Vasić V., 2012. Inhibition of myeloperoxidase and antioxidative activity of Gentiana lutea extracts. Journal of Pharmaceutical and Biomedical Analysis, 66, p. 191-196.
Oprea A., 2005. Lista Critica a Plantelor Vasculare din România. Univ.”Al. Ioan Cuza”, Iași.
Petrova M., Zayova E., Vitkova A., 2011. Effect of silver nitrate on in vitro root formation of Gentiana lutea. Romanian Biotechnological Letters, 16(6), p. 53-58.
Rice-Evans C.A., Miller N.J., Paganga G., 1997. Antioxidant properties of phenolic compounds. Trends in Plant Sci., 2, p. 152–59.
Rybczyński J.J., Davey M.R., Mikula A., 2015. The Gentianaceae - Volume 2: Biotechnology and Applications. Springer-Verlag Berlin Heidelberg 452.
Rybczyński J.J., Michael R.D., Mikula A., 2014. The Gentianaceae - Volume 1: Characterization and Ecology. Springer-Verlag Berlin Heidelberg, 329.
Sava Sand C., 2015. Peculiarities for agricultural technology of Gentiana lutea. Scientific Papers Series Management, Economic Engineering in Agriculture and Rural Development, 15(1), p. 449-454.
Shahidi F., Wanasundara P.K.J.P.D., 1992. Phenolic antioxidants. Critical Reviews in Food Science and Nutrition, 32, p. 67-103.
Sharma N., Chandel K.P.S., Anderson P., 1993. Research note in vitro propagation of Gentiana kurroo - an indigenous threatened plant of medicinal importance. Plant Cell, Tissue and Organ Culture, 34, p. 307-309.
Zhishen J., Mengcheng T., Jianming W., 1999. The determination of flavonoid content in mulberry and their scavenging effects on superoxide radicals. Food Chemistry, 64, p. 555-559.
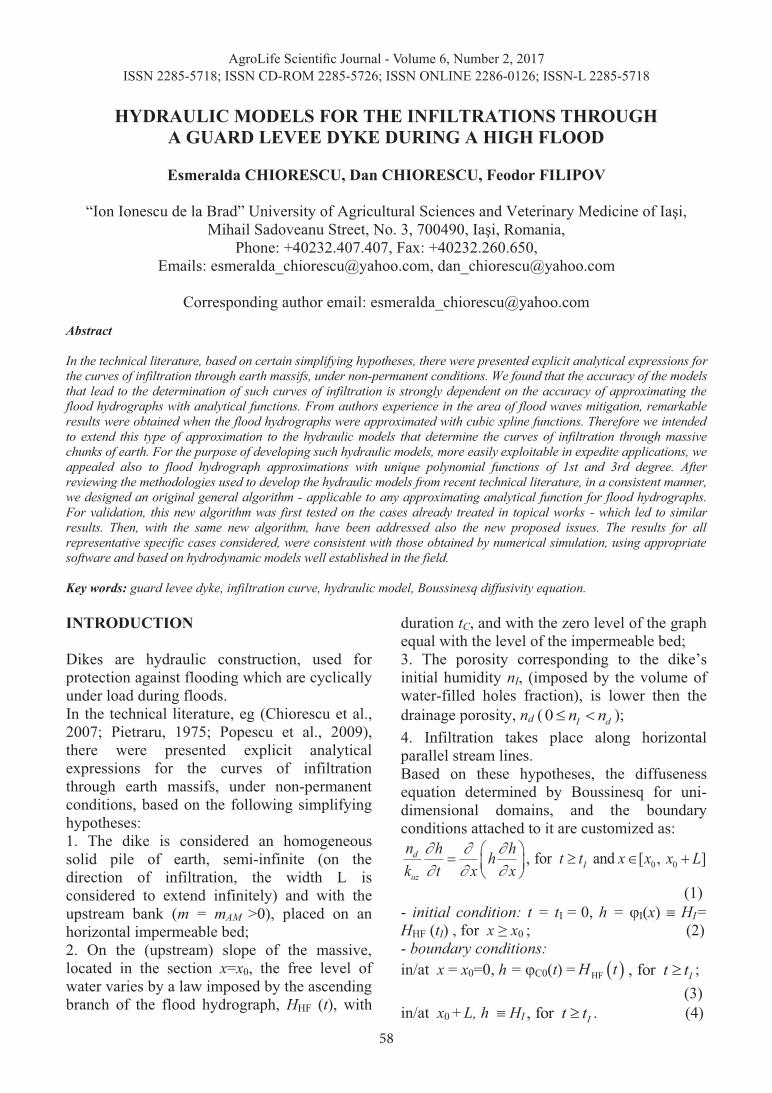
58
AgroLife Scientific Journal - Volume 6, Number 2, 2017ISSN 2285-5718; ISSN CD-ROM 2285-5726; ISSN ONLINE 2286-0126; ISSN-L 2285-5718
HYDRAULIC MODELS FOR THE INFILTRATIONS THROUGH A GUARD LEVEE DYKE DURING A HIGH FLOOD
Esmeralda CHIORESCU, Dan CHIORESCU, Feodor FILIPOV
“Ion Ionescu de la Brad” University of Agricultural Sciences and Veterinary Medicine of Iaşi,
Mihail Sadoveanu Street, No. 3, 700490, Iaşi, Romania, Phone: +40232.407.407, Fax: +40232.260.650,
Emails: [email protected], [email protected]
Corresponding author email: [email protected]
Abstract In the technical literature, based on certain simplifying hypotheses, there were presented explicit analytical expressions for the curves of infiltration through earth massifs, under non-permanent conditions. We found that the accuracy of the models that lead to the determination of such curves of infiltration is strongly dependent on the accuracy of approximating the flood hydrographs with analytical functions. From authors experience in the area of flood waves mitigation, remarkable results were obtained when the flood hydrographs were approximated with cubic spline functions. Therefore we intended to extend this type of approximation to the hydraulic models that determine the curves of infiltration through massive chunks of earth. For the purpose of developing such hydraulic models, more easily exploitable in expedite applications, we appealed also to flood hydrograph approximations with unique polynomial functions of 1st and 3rd degree. After reviewing the methodologies used to develop the hydraulic models from recent technical literature, in a consistent manner, we designed an original general algorithm - applicable to any approximating analytical function for flood hydrographs. For validation, this new algorithm was first tested on the cases already treated in topical works - which led to similar results. Then, with the same new algorithm, have been addressed also the new proposed issues. The results for all representative specific cases considered, were consistent with those obtained by numerical simulation, using appropriate software and based on hydrodynamic models well established in the field. Key words: guard levee dyke, infiltration curve, hydraulic model, Boussinesq diffusivity equation. INTRODUCTION Dikes are hydraulic construction, used for protection against flooding which are cyclically under load during floods. In the technical literature, eg (Chiorescu et al., 2007; Pietraru, 1975; Popescu et al., 2009), there were presented explicit analytical expressions for the curves of infiltration through earth massifs, under non-permanent conditions, based on the following simplifying hypotheses: 1. The dike is considered an homogeneous solid pile of earth, semi-infinite (on the direction of infiltration, the width L is considered to extend infinitely) and with the upstream bank (m = mAM >0), placed on an horizontal impermeable bed; 2. On the (upstream) slope of the massive, located in the section x=x0, the free level of water varies by a law imposed by the ascending branch of the flood hydrograph, HHF (t), with
duration tC, and with the zero level of the graph equal with the level of the impermeable bed; 3. The porosity corresponding to the dike’s initial humidity nI, (imposed by the volume of water-filled holes fraction), is lower then the drainage porosity, nd ( 0 I dn n� � ); 4. Infiltration takes place along horizontal parallel stream lines. Based on these hypotheses, the diffuseness equation determined by Boussinesq for uni-dimensional domains, and the boundary conditions attached to it are customized as:
0 0, for and [ , ]dI
oz
n h hh t t x x x Lk t x x
� � �� � �
� �� � � �� �� �
(1)
- initial condition: t = tI = 0, h = �I(x) � HI= HHF (tI) , for x ≥ x0 ; (2) - boundary conditions: in/at x = x0=0, h = �C0(t) = � �HFH t , for It t� ; (3) in/at x0 + L, h � HI , for It t� . (4)
In the expressions above, unspecified (directly into text) symbols, have the following meanings: t - independent time variable; tI - initial moment; x - independent space variable; x0 and x0 + L – the limits of space domain; h = h(x, t) - water depth (free level of water above the impermeable bed); koz - hydraulic conductivity at saturation, on horizontal direction. Within the same simplifying hypotheses, in work (Chiorescu et al., 2007; Popescu et al., 2009) there was inferred the diffuseness equation of the infiltration as a differential equation with separable variables: � �� � � �HFd dd I ozn n x mh x k H t h t� �� � � �� � (5) Particular solutions of the equation can be obtained for the contour conditions (3), and are presented explicit in the following general form:
0x mh� , ht t� , with I h I ct t t t� � � (6)
In the expressions above, th represents the time when the flood wave reaches the imposed load on h and satisfies the equations:
� �HF 0hH t h� � or � �1HFht H h�� ,
with CI h It t t t� � �
(7) In (Chiorescu et al., 2007) and (Popescu et al., 2009) was first determined the general solution of differential equation (5) and then using the contour condition (6), was evaluated the appropriate integration constant for the particular solution. In the present work this particular solution was obtained directly - by introducing contour condition (6) within the limits of integration of equation (5):
� � � � � �d d 0h
x t
c I oz Viitmh tn n mh k H h� � � �� �� � � � �� �� �
(8) thus resulting, in succession:
� � � � � �
� �� � � � � �
2HF
2 2 2HF
0.5 d 0,
2 2 2 d 0.
h
h
toz ozh t
d I d It
d I oz h oz t
x
mhk kmh h t t H
n n n n
n n x mxh m h k h t t k H
� � � �
� �
� � � � �� �
� � � � � � �
�
�
(9)
Accordingly, to find the equation for the curves of infiltration under non-permanent regime in implicit general form: � �, , 0h x t� � (10)
where t is considered as a parameter, one has simply to solve the equation (7) with th as unknown, to obtain the analytical expression for the primitive function � �HFH t and then to evaluate the integral defined by (9),
� �HF dh
t
tJ H � �� �
(11)
Given the above, in Table 1 were centralized the following: in column 2 - the formal type of analytical expressions for the hydrograph
� �HFH t ; in column 3 - cases where already have been obtained or proposed, analytical solutions of the form (10); in column 5 - cases of the analytical solutions for the equation Bousinesq (1); in columns 4 and 6 - verification by numerical methods, undertaken by the authors, for the analytical solutions from columns 3 and 5.
Table 1. Particular solutions of diffuseness equations (1) and (5)
No. � �HFH t analytical, for (5)
numerical, for (5)
analytical, for (1)
numerical, for (1)
1 2 3 4 5 6 1 linear, reduced form mAM≥0, [1] - mAM=0, [2] - 2 periodic, cosinusoidal mAM≥0, [5] mAM=0, [5] mAM=0, [5]
3(* linear, full form mAM≥0 mAM=0 mAM=0 4(* polynomial of the 3rd degree mAM≥0 mAM=0 5(* natural cubic spline function mAM≥0 mAM=0
(*issues addressed and resolved with this work
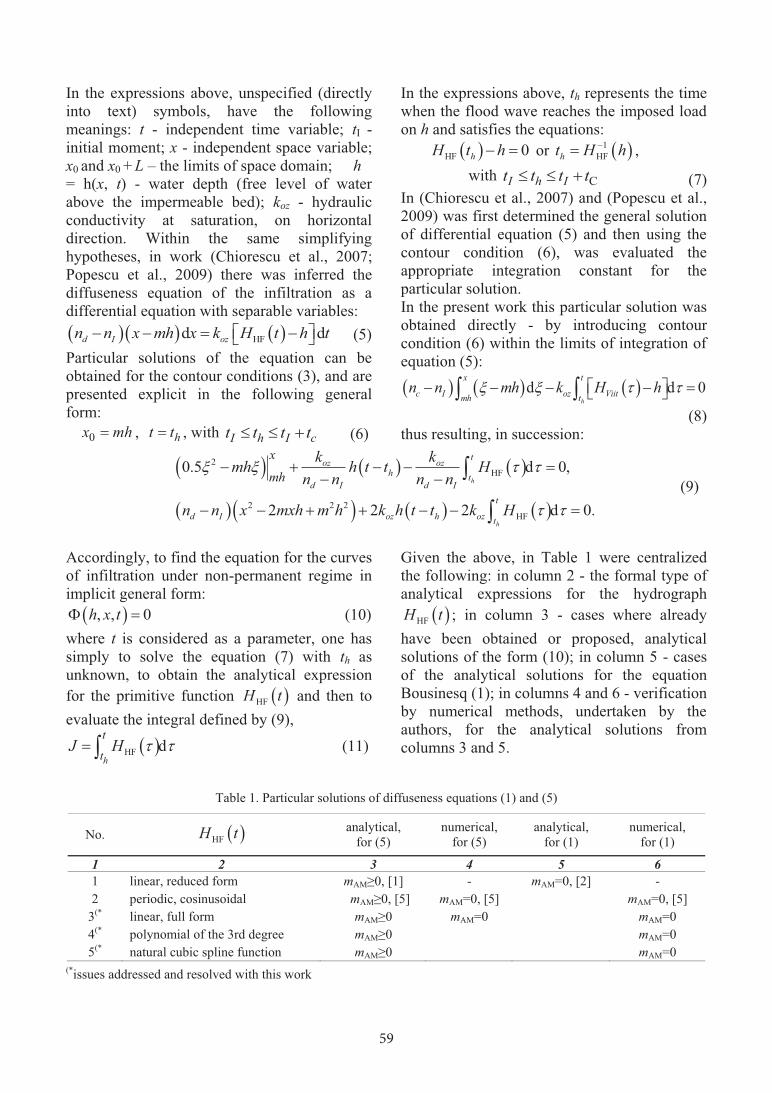
59
HYDRAULIC MODELS FOR THE INFILTRATIONS THROUGH A GUARD LEVEE DYKE DURING A HIGH FLOOD
Esmeralda CHIORESCU, Dan CHIORESCU, Feodor FILIPOV
“Ion Ionescu de la Brad” University of Agricultural Sciences and Veterinary Medicine of Iaşi,
Mihail Sadoveanu Street, No. 3, 700490, Iaşi, Romania, Phone: +40232.407.407, Fax: +40232.260.650,
Emails: [email protected], [email protected]
Corresponding author email: [email protected]
Abstract In the technical literature, based on certain simplifying hypotheses, there were presented explicit analytical expressions for the curves of infiltration through earth massifs, under non-permanent conditions. We found that the accuracy of the models that lead to the determination of such curves of infiltration is strongly dependent on the accuracy of approximating the flood hydrographs with analytical functions. From authors experience in the area of flood waves mitigation, remarkable results were obtained when the flood hydrographs were approximated with cubic spline functions. Therefore we intended to extend this type of approximation to the hydraulic models that determine the curves of infiltration through massive chunks of earth. For the purpose of developing such hydraulic models, more easily exploitable in expedite applications, we appealed also to flood hydrograph approximations with unique polynomial functions of 1st and 3rd degree. After reviewing the methodologies used to develop the hydraulic models from recent technical literature, in a consistent manner, we designed an original general algorithm - applicable to any approximating analytical function for flood hydrographs. For validation, this new algorithm was first tested on the cases already treated in topical works - which led to similar results. Then, with the same new algorithm, have been addressed also the new proposed issues. The results for all representative specific cases considered, were consistent with those obtained by numerical simulation, using appropriate software and based on hydrodynamic models well established in the field. Key words: guard levee dyke, infiltration curve, hydraulic model, Boussinesq diffusivity equation. INTRODUCTION Dikes are hydraulic construction, used for protection against flooding which are cyclically under load during floods. In the technical literature, eg (Chiorescu et al., 2007; Pietraru, 1975; Popescu et al., 2009), there were presented explicit analytical expressions for the curves of infiltration through earth massifs, under non-permanent conditions, based on the following simplifying hypotheses: 1. The dike is considered an homogeneous solid pile of earth, semi-infinite (on the direction of infiltration, the width L is considered to extend infinitely) and with the upstream bank (m = mAM >0), placed on an horizontal impermeable bed; 2. On the (upstream) slope of the massive, located in the section x=x0, the free level of water varies by a law imposed by the ascending branch of the flood hydrograph, HHF (t), with
duration tC, and with the zero level of the graph equal with the level of the impermeable bed; 3. The porosity corresponding to the dike’s initial humidity nI, (imposed by the volume of water-filled holes fraction), is lower then the drainage porosity, nd ( 0 I dn n� � ); 4. Infiltration takes place along horizontal parallel stream lines. Based on these hypotheses, the diffuseness equation determined by Boussinesq for uni-dimensional domains, and the boundary conditions attached to it are customized as:
0 0, for and [ , ]dI
oz
n h hh t t x x x Lk t x x
� � �� � �
� �� � � �� �� �
(1)
- initial condition: t = tI = 0, h = �I(x) � HI= HHF (tI) , for x ≥ x0 ; (2) - boundary conditions: in/at x = x0=0, h = �C0(t) = � �HFH t , for It t� ; (3) in/at x0 + L, h � HI , for It t� . (4)
In the expressions above, unspecified (directly into text) symbols, have the following meanings: t - independent time variable; tI - initial moment; x - independent space variable; x0 and x0 + L – the limits of space domain; h = h(x, t) - water depth (free level of water above the impermeable bed); koz - hydraulic conductivity at saturation, on horizontal direction. Within the same simplifying hypotheses, in work (Chiorescu et al., 2007; Popescu et al., 2009) there was inferred the diffuseness equation of the infiltration as a differential equation with separable variables: � �� � � �HFd dd I ozn n x mh x k H t h t� �� � � �� � (5) Particular solutions of the equation can be obtained for the contour conditions (3), and are presented explicit in the following general form:
0x mh� , ht t� , with I h I ct t t t� � � (6)
In the expressions above, th represents the time when the flood wave reaches the imposed load on h and satisfies the equations:
� �HF 0hH t h� � or � �1HFht H h�� ,
with CI h It t t t� � �
(7) In (Chiorescu et al., 2007) and (Popescu et al., 2009) was first determined the general solution of differential equation (5) and then using the contour condition (6), was evaluated the appropriate integration constant for the particular solution. In the present work this particular solution was obtained directly - by introducing contour condition (6) within the limits of integration of equation (5):
� � � � � �d d 0h
x t
c I oz Viitmh tn n mh k H h� � � �� �� � � � �� �� �
(8) thus resulting, in succession:
� � � � � �
� �� � � � � �
2HF
2 2 2HF
0.5 d 0,
2 2 2 d 0.
h
h
toz ozh t
d I d It
d I oz h oz t
x
mhk kmh h t t H
n n n n
n n x mxh m h k h t t k H
� � � �
� �
� � � � �� �
� � � � � � �
�
�
(9)
Accordingly, to find the equation for the curves of infiltration under non-permanent regime in implicit general form: � �, , 0h x t� � (10)
where t is considered as a parameter, one has simply to solve the equation (7) with th as unknown, to obtain the analytical expression for the primitive function � �HFH t and then to evaluate the integral defined by (9),
� �HF dh
t
tJ H � �� �
(11)
Given the above, in Table 1 were centralized the following: in column 2 - the formal type of analytical expressions for the hydrograph
� �HFH t ; in column 3 - cases where already have been obtained or proposed, analytical solutions of the form (10); in column 5 - cases of the analytical solutions for the equation Bousinesq (1); in columns 4 and 6 - verification by numerical methods, undertaken by the authors, for the analytical solutions from columns 3 and 5.
Table 1. Particular solutions of diffuseness equations (1) and (5)
No. � �HFH t analytical, for (5)
numerical, for (5)
analytical, for (1)
numerical, for (1)
1 2 3 4 5 6 1 linear, reduced form mAM≥0, [1] - mAM=0, [2] - 2 periodic, cosinusoidal mAM≥0, [5] mAM=0, [5] mAM=0, [5]
3(* linear, full form mAM≥0 mAM=0 mAM=0 4(* polynomial of the 3rd degree mAM≥0 mAM=0 5(* natural cubic spline function mAM≥0 mAM=0
(*issues addressed and resolved with this work

60
Next, there will be presented specific analytical expressions of this function and how to determine them in the case of a flood hydrograph determined based on hydrometric measurements, then we'll summarize the main results obtained in work (Chiorescu et al., 2007) and (Popescu et al., 2009), and address the problems listed in (Table 1) - lines 1 ... 3. Finally, in a specific case study, there will be a comparative assessment of the technical performance of each analytical solution for the differential equations (5), accepting as reference the numerical solution obtained using the established computer software package, FEFLOW. MATERIALS AND METHODS Analytical expressions for flood hydrographs For the types of functions that approximate the ascending branch of the flood hydrograph (Table 1) - 2nd column, real analytic expressions for the function � �HFH t , are tabulated in (Table 2) - 3rd column.
To mention that the cubic spline function has been used successfully in the flood hydrograph approximation models for flood mitigation (Popescu, 2000). The ascending branch of a given flood hydrograph, � �HFH t , with � �I I C,t t t t� � , it is usually represented by 2N � pairs of values: � � � � � �1 1 I I C max0, , , , , , ,j j N Nt H H t H t t t H H� � � � ��� I� � I� �� II� �� � �� � �� � �� � � II� � � III� �
(17) In determining the correlation coefficients (12), ..., (15), the best results were obtained by the method of least squares of Gauss (Popescu et al., 2009). For polynomial correlations (14) and (15) there were used (directly) the MATLAB functions poyfit, employed, respectively, in the forms,
polyfit (t, H, 1) and polyfit (t, H, 3), (18) where t and H are vectors, containing each N elements of pairs (17), t = {t1, t2,…, tN } and H = {H1, H2,…, HN }.
(19)
Table 2. Approximating functions for the ascending branch of a flood hydrograph
No. Approximating function
� �HFH t ,
for � �C,I It t t t� �Eq. no. Observations
1 2 3 4 5 1 linear, reduced form
LVv t (12) vLV – growth speed of water level (W.L.)
2 periodic, cosinusoidal
CcosH t
t�
� �H cos � (13) HH - temporary average load � - amplitude
3(* linear, full formLV Iv t H�
(14) vLV - growth speed of W.L. HI - load at the tI moment
4(* polynomial of the 3rd degree
3 2at bt ct d� � � (15) a, b, c, d - polynomial coefficients
5(* natural cubic spline function
� � � �� � � �2 3
j j j j
j j j j
P t a b t t
c t t d t t
� � � �
� � �
1 for ,j jt t t �� ��� � and
j =1,2,…, N-1
(16)
1 It t�
N I Ct t t� �
� �1
1 C1
, ,N
j j I Ij
t t t t t�
��
� � � �� � ������� �t t ����� �j j 1, 1t j , 1��t t 1j j 1, 1
Correlation coefficients (12) and (13) were derived by direct application of the method of least squares, thus resulting:
� �2
LV 1 1
N Nj j jj j
v t H t� �
�� � or LVv H t� (20)
which has to be verified numerically, and then according to (Popescu et al., 2009),
� �
� � � � � �
C1 1
2C C C1 1 1
cos
cos cos cos
N Nj jj j
N N Nj j j jj j j
NH t t H
H t t t t H t t
�
� � �
� �
� � �
� �� ���� �� ��
� �� � �
NH �NN
NH�N cosN (21)
Accuracy of approximating function can be assessed using mean squared deviation, deduced with the relationship:
� � � �2
HF11N
j jjH t H N�
�� �� � �� �� .
(22)
Spline function coefficients (16) were determined using the following set of two MATLAB functions: Pp = spline(t, H), pj=fnbrk(pp,j), with j = 1,2,…,N-1.
(23)
Since for the spline functions, the conditions are met,
� � � �HF j j j jH t P t a H� � � , for j =
1,2,…,N-1, and � � � �HF 1N N NH t P t�� , (24)
the expression (22) becomes:
� �1 1N N NP t H N� �� �� � �� � . (25) (25)
Analytical expressions for existing (in)filtration curves To test the process of inference for the analytical solutions of the form � �, , 0h x t� � ,
process described in the introductory section and based on solving the equation (7) and on the integral relations (8) and (9), one has resumed solving the cases included in (Table 1) - column 3, at row no. 1 and 2. Hydrograph shaped by a linear function, reduced form Introducing the expression (12) of the hydrograph (Table 2) - row no. 1, column 3, in the equation (7) and in the integral (11), will result, successively:
LV 0hv t h� � and LVht h v� . (26)
� � 2HF LV LV
LVd d 0.5
h h
t t
t t
t
h vH v v� � � � �� �
� � � �2HF LV LVd 0.5
h
t
tH v t h v� � �� . (27)
Substituting expression (27) in relation (9), is found equation (14) from work (Chiorescu et al., 2007):
2 2 2 2LV
LV
1 1 1 1 02 2 2
oz oz
d I d I
k kx mxh ht v t h mn n v n n
� �� �� � � � � �� �� � � �. (28)
Hydrograph shaped by a periodic, cosinusoidal function Introducing the expression (13) of the hydrograph (Table 2) - row no. 2, column 3, in
the equation (7) and in the integral (11), will result, successively:
� �Ccos 0hH t t h��� � ��H ��cos � , � � � �Ccos ht t H h� � � ��h ��H h ;
� � � � 2Csin 1ht t H h� � �� � � �� �
��H h�H h �����H h�H h and � � � �arccosh ct t H h� � �� � �� ��h�H h �
����H h�H h ; (29)
� � � �� � � � � �HF C Cd cos d | sin |h h
h h
t t
ct t
t tt tH H t H t t� � �� � � � ��� �� � � � � ��d |� �� t � � i� � sinsinsinsincos d |� �� � �cos d |cos d |d |cos d |� ��� � �CCCC� ��� � �� �� � ;
� �2
C CHF
C
d arccos s in 1h
t ct
t t tH h H hH H t tt�� �
� � �� � � �� �
� � � � � � � �� �� � � �
2� � �H h H hCCtt tCC Ht t ��H hCC� t ar . (30)
Substituting expression (30) in relation (9), leads to the same equation that would be obtained by (Popescu et al., 2009), by
substitution of the constant of integration C(h), given by (29) in the general solution (26):

61
Next, there will be presented specific analytical expressions of this function and how to determine them in the case of a flood hydrograph determined based on hydrometric measurements, then we'll summarize the main results obtained in work (Chiorescu et al., 2007) and (Popescu et al., 2009), and address the problems listed in (Table 1) - lines 1 ... 3. Finally, in a specific case study, there will be a comparative assessment of the technical performance of each analytical solution for the differential equations (5), accepting as reference the numerical solution obtained using the established computer software package, FEFLOW. MATERIALS AND METHODS Analytical expressions for flood hydrographs For the types of functions that approximate the ascending branch of the flood hydrograph (Table 1) - 2nd column, real analytic expressions for the function � �HFH t , are tabulated in (Table 2) - 3rd column.
To mention that the cubic spline function has been used successfully in the flood hydrograph approximation models for flood mitigation (Popescu, 2000). The ascending branch of a given flood hydrograph, � �HFH t , with � �I I C,t t t t� � , it is usually represented by 2N � pairs of values: � � � � � �1 1 I I C max0, , , , , , ,j j N Nt H H t H t t t H H� � � � ��� I� � I� �� II� �� � �� � �� � �� � � II� � � III� �
(17) In determining the correlation coefficients (12), ..., (15), the best results were obtained by the method of least squares of Gauss (Popescu et al., 2009). For polynomial correlations (14) and (15) there were used (directly) the MATLAB functions poyfit, employed, respectively, in the forms,
polyfit (t, H, 1) and polyfit (t, H, 3), (18) where t and H are vectors, containing each N elements of pairs (17), t = {t1, t2,…, tN } and H = {H1, H2,…, HN }.
(19)
Table 2. Approximating functions for the ascending branch of a flood hydrograph
No. Approximating function
� �HFH t ,
for � �C,I It t t t� �Eq. no. Observations
1 2 3 4 5 1 linear, reduced form
LVv t (12) vLV – growth speed of water level (W.L.)
2 periodic, cosinusoidal
CcosH t
t�
� �H cos � (13) HH - temporary average load � - amplitude
3(* linear, full formLV Iv t H�
(14) vLV - growth speed of W.L. HI - load at the tI moment
4(* polynomial of the 3rd degree
3 2at bt ct d� � � (15) a, b, c, d - polynomial coefficients
5(* natural cubic spline function
� � � �� � � �2 3
j j j j
j j j j
P t a b t t
c t t d t t
� � � �
� � �
1 for ,j jt t t �� ��� � and
j =1,2,…, N-1
(16)
1 It t�
N I Ct t t� �
� �1
1 C1
, ,N
j j I Ij
t t t t t�
��
� � � �� � ������� �t t ����� �j j 1, 1t j , 1��t t 1j j 1, 1
Correlation coefficients (12) and (13) were derived by direct application of the method of least squares, thus resulting:
� �2
LV 1 1
N Nj j jj j
v t H t� �
�� � or LVv H t� (20)
which has to be verified numerically, and then according to (Popescu et al., 2009),
� �
� � � � � �
C1 1
2C C C1 1 1
cos
cos cos cos
N Nj jj j
N N Nj j j jj j j
NH t t H
H t t t t H t t
�
� � �
� �
� � �
� �� ���� �� ��
� �� � �
NH �NN
NH�N cosN (21)
Accuracy of approximating function can be assessed using mean squared deviation, deduced with the relationship:
� � � �2
HF11N
j jjH t H N�
�� �� � �� �� .
(22)
Spline function coefficients (16) were determined using the following set of two MATLAB functions: Pp = spline(t, H), pj=fnbrk(pp,j), with j = 1,2,…,N-1.
(23)
Since for the spline functions, the conditions are met,
� � � �HF j j j jH t P t a H� � � , for j =
1,2,…,N-1, and � � � �HF 1N N NH t P t�� , (24)
the expression (22) becomes:
� �1 1N N NP t H N� �� �� � �� � . (25) (25)
Analytical expressions for existing (in)filtration curves To test the process of inference for the analytical solutions of the form � �, , 0h x t� � ,
process described in the introductory section and based on solving the equation (7) and on the integral relations (8) and (9), one has resumed solving the cases included in (Table 1) - column 3, at row no. 1 and 2. Hydrograph shaped by a linear function, reduced form Introducing the expression (12) of the hydrograph (Table 2) - row no. 1, column 3, in the equation (7) and in the integral (11), will result, successively:
LV 0hv t h� � and LVht h v� . (26)
� � 2HF LV LV
LVd d 0.5
h h
t t
t t
t
h vH v v� � � � �� �
� � � �2HF LV LVd 0.5
h
t
tH v t h v� � �� . (27)
Substituting expression (27) in relation (9), is found equation (14) from work (Chiorescu et al., 2007):
2 2 2 2LV
LV
1 1 1 1 02 2 2
oz oz
d I d I
k kx mxh ht v t h mn n v n n
� �� �� � � � � �� �� � � �. (28)
Hydrograph shaped by a periodic, cosinusoidal function Introducing the expression (13) of the hydrograph (Table 2) - row no. 2, column 3, in
the equation (7) and in the integral (11), will result, successively:
� �Ccos 0hH t t h��� � ��H ��cos � , � � � �Ccos ht t H h� � � ��h ��H h ;
� � � � 2Csin 1ht t H h� � �� � � �� �
��H h�H h �����H h�H h and � � � �arccosh ct t H h� � �� � �� ��h�H h �
����H h�H h ; (29)
� � � �� � � � � �HF C Cd cos d | sin |h h
h h
t t
ct t
t tt tH H t H t t� � �� � � � ��� �� � � � � ��d |� �� t � � i� � sinsinsinsincos d |� �� � �cos d |cos d |d |cos d |� ��� � �CCCC� ��� � �� �� � ;
� �2
C CHF
C
d arccos s in 1h
t ct
t t tH h H hH H t tt�� �
� � �� � � �� �
� � � � � � � �� �� � � �
2� � �H h H hCCtt tCC Ht t ��H hCC� t ar . (30)
Substituting expression (30) in relation (9), leads to the same equation that would be obtained by (Popescu et al., 2009), by
substitution of the constant of integration C(h), given by (29) in the general solution (26):

62
� � � �
2 2 2
2C C
C
1 12 2
arccos s in 1 0oz c
d I
x mxh m h
k t t tH h tt h H H hn n t
�� � �
� � �
� �� �� � �� � � � � � � � � �� �� � � �� �� � ����� 0
�2Ctt� C � � ��
1C� C Ct� C C� C ��� ���1sins in� C C� C� C �� �� �� (31)
Analytical expressions proposed for (in)filtration curves First we have inferred hydraulic models based on approximating flood hydrographs with unique polynomial functions - easy to use for expedite applications, but more precise than those presented in (Table 2) - row no. 1 and eq. (28). Then, due to an outstanding performance with the models for floods mitigation (Popescu, 2000), we extended the process of flood hydrograph approximation with spline functions, to the hydraulic models that determine the curves of (in)filtration through earth massifs. In these cases also, the deduction of the family of (in)filtration curves, with the
time, t, as parameter, is based on the algorithm established with the relations (7) and (8) - algorithm already implemented for the models described by the eqs. (28) and (31). Hydrograph shaped by a linear function, full form Obviously, the accuracy of the approximation by a linear function, full form, is at least equal to that obtained by using the reduced form, containing the first degree term only. Introducing the expression (14) of the hydrograph (Table 2) - row no. 3, column 3, in the equation (7) and in the integral (11), will result, successively:
LV I 0hv t H h� � � şi � �I LVht h H v� � ; (32)
� � � � � �� �I
2HF LV I LV I
LVd d 0.5
h h
t t
t t h H
t
vH v H v H� � � � � �
�� � � �� � ;
� � � � � �� �22HF LV I LV I I LVd 0.5
h
t
tH v t h H v H t h H v� � � �� � � � �� ��� . (33)
Substituting expression (33) in relation (9), will finally result in:
� � � �22 2 2 2I
2 1 12 02
oz ozI NIV
C I NIV C I
k kx mxh h H t v t m h h Hn n v n n
� �� � � � � � � �� �� �� � (34)
A partial verification of the result, represented by equation (34), is that by introducing the condition of reduced linear law, HI=0, in equations (33) and (34), one will find, respectively, the equations (27) and (28). Hydrograph shaped by a polynomial of the 3rd degree One has substituted the expression (15) of the hydrograph (Table 2) - row no. 4, column 3, in
the equation (7) and in the integral (11). Thus the time th represents the real root from the following equation of the 3rd degree, with th as unknown and which, in addition, meets all the conditions from inequalities (7):
3 2 0h h hat bt ct d h� � � � � . (35)
while, at the same time, from the integral (11) results successively:
� � � �3 2HF d d
h h
t t
t tH a b c d� � � � � �� � � �� � ;
� � � � � � � � � �3 2HF d 4 3 2
h
t
h h h htH t t a t t b t t c t t d� � � �� � � � � � � �� �� (36)
Substituting expression (36) in relation (9), will finally result in:
� � � � � � � �2 2 2
3 2 02 2 4 3 2
ozh h h h
d I
kx m h a b cmxh t t h t t t t t t dn n
� �� � � � � � � � � � � �� �� � �. (37)
Hydrograph shaped by a cubic spline function One has substituted the expression (16) of the hydrograph (Table 2) - row no. 5, column 3, in the equation (7) and in the integral (11).
Thus the time th represents the real root of the following equation of the 3rd degree, with th as unknown:
� � � � � �2 3
* * * * * * * 0j j h j j h j j h ja b t t c t t d t t h� � � � � � � � , (38)
where for the index j* , � � * 1,2, , 1j N� � �, 1,, , h is required to satisfy the condition,
* * 1,j jh H H �� ��� � . (39)
thus resulting that,
* * 1,h j jt t t �� ��� � , (40)
which, evidently, meets all the conditions from inequalities (7). With the proper notations, specific to MATLAB’s own language and programming environment, such as, th=t_h, the solution for the equation (38), which satisfies the condition
(40), can be obtained directly with the following two specialized MATLAB functions: pp=spline(t, H-h) şi t_h=fnzeros(pp, [t_I, t_I +t_C]) .
(41)
With the substitution indicated above, for any given time t,
� �* * 1,k kt t t �� , with * * 1j k N� � � , (42)
and applying the additivity property on the limits (of integration) for the definite integrals, integral (11) becomes:
� �� �
� � � � � �* 1 1
* **
HF * 1 * ** ** 1
, for d
, for
h
jh
h k
t
jt t
t t tt kj kjt t t
P d k jH
P d P d P d k j�
���
� �� �
� � � � � �� ��
� �
� � � �
� � � � � � ��
��
�� � � (43)
Since,
� � � � � � � � � �2 32 3 4u
tP d u t a b u t c u t d u t� � � � � � � � �
�� � � �� � � � � � � � � �� ,
and with the notation,
� � � � � � � � � �2 32 3 4u u t a b u t c u t d u t� � � � � � � � �� �� � � � � � � � � � �
, (44)
the relation (43), finally, becomes:
� �� � � �
� � � � � � � �
* ** *
* 1 * ** * 1 * 1 ** 1
, for d
, for h
t j j hkViitt
j j j h kj
t t k jH
t t t t k j� ��
� � �
� �� �
� � �� � � �� �� � � �� � �
� �. (45)
Obviously, according with the algorithm presented by the equations (7) and (9) and used in all other hydraulic models outlined above, true relations for the filtration curves (10), when the flood hydrograph is approximated by the spline functions (16), are given by the eq. (9) where the integral presents the form (45). In order to apply the results obtained in this section was developed the MATLAB program Filtration_Curves _Dig2.m from (Chiorescu et al., 2007).
CASE STUDY Input data for this case study from the work (Popescu et al., 2008) are taken: HD=4.55 m, bD=4.0 m – high and width at the top of dike; m=mAM=3.0, mAV=2.5; nd=0.35, nI=0.05, kOZ=10.0 m/d; increasing branch of the real flood hydrograph HHF(t) is done in (Table 3).
Table 3. Increasing branch of the real flood hydrograph
t, [d] 0=tI 1 2 3 4 5 6 7 HHF, [m] 0=HI 0.02 0.11 0.67 1.83 2.55 2.83 2.99
t, [d] 8 9 10 11 12 13 14 15=tI+tC HHF, [m] 3.12 3.21 3.30 3.45 3.70 4.06 4.20 4.22=Hmax

63
� � � �
2 2 2
2C C
C
1 12 2
arccos s in 1 0oz c
d I
x mxh m h
k t t tH h tt h H H hn n t
�� � �
� � �
� �� �� � �� � � � � � � � � �� �� � � �� �� � ����� 0
�2Ctt� C � � ��
1C� C Ct� C C� C ��� ���1sins in� C C� C� C �� �� �� (31)
Analytical expressions proposed for (in)filtration curves First we have inferred hydraulic models based on approximating flood hydrographs with unique polynomial functions - easy to use for expedite applications, but more precise than those presented in (Table 2) - row no. 1 and eq. (28). Then, due to an outstanding performance with the models for floods mitigation (Popescu, 2000), we extended the process of flood hydrograph approximation with spline functions, to the hydraulic models that determine the curves of (in)filtration through earth massifs. In these cases also, the deduction of the family of (in)filtration curves, with the
time, t, as parameter, is based on the algorithm established with the relations (7) and (8) - algorithm already implemented for the models described by the eqs. (28) and (31). Hydrograph shaped by a linear function, full form Obviously, the accuracy of the approximation by a linear function, full form, is at least equal to that obtained by using the reduced form, containing the first degree term only. Introducing the expression (14) of the hydrograph (Table 2) - row no. 3, column 3, in the equation (7) and in the integral (11), will result, successively:
LV I 0hv t H h� � � şi � �I LVht h H v� � ; (32)
� � � � � �� �I
2HF LV I LV I
LVd d 0.5
h h
t t
t t h H
t
vH v H v H� � � � � �
�� � � �� � ;
� � � � � �� �22HF LV I LV I I LVd 0.5
h
t
tH v t h H v H t h H v� � � �� � � � �� ��� . (33)
Substituting expression (33) in relation (9), will finally result in:
� � � �22 2 2 2I
2 1 12 02
oz ozI NIV
C I NIV C I
k kx mxh h H t v t m h h Hn n v n n
� �� � � � � � � �� �� �� � (34)
A partial verification of the result, represented by equation (34), is that by introducing the condition of reduced linear law, HI=0, in equations (33) and (34), one will find, respectively, the equations (27) and (28). Hydrograph shaped by a polynomial of the 3rd degree One has substituted the expression (15) of the hydrograph (Table 2) - row no. 4, column 3, in
the equation (7) and in the integral (11). Thus the time th represents the real root from the following equation of the 3rd degree, with th as unknown and which, in addition, meets all the conditions from inequalities (7):
3 2 0h h hat bt ct d h� � � � � . (35)
while, at the same time, from the integral (11) results successively:
� � � �3 2HF d d
h h
t t
t tH a b c d� � � � � �� � � �� � ;
� � � � � � � � � �3 2HF d 4 3 2
h
t
h h h htH t t a t t b t t c t t d� � � �� � � � � � � �� �� (36)
Substituting expression (36) in relation (9), will finally result in:
� � � � � � � �2 2 2
3 2 02 2 4 3 2
ozh h h h
d I
kx m h a b cmxh t t h t t t t t t dn n
� �� � � � � � � � � � � �� �� � �. (37)
Hydrograph shaped by a cubic spline function One has substituted the expression (16) of the hydrograph (Table 2) - row no. 5, column 3, in the equation (7) and in the integral (11).
Thus the time th represents the real root of the following equation of the 3rd degree, with th as unknown:
� � � � � �2 3
* * * * * * * 0j j h j j h j j h ja b t t c t t d t t h� � � � � � � � , (38)
where for the index j* , � � * 1,2, , 1j N� � �, 1,, , h is required to satisfy the condition,
* * 1,j jh H H �� ��� � . (39)
thus resulting that,
* * 1,h j jt t t �� ��� � , (40)
which, evidently, meets all the conditions from inequalities (7). With the proper notations, specific to MATLAB’s own language and programming environment, such as, th=t_h, the solution for the equation (38), which satisfies the condition
(40), can be obtained directly with the following two specialized MATLAB functions: pp=spline(t, H-h) şi t_h=fnzeros(pp, [t_I, t_I +t_C]) .
(41)
With the substitution indicated above, for any given time t,
� �* * 1,k kt t t �� , with * * 1j k N� � � , (42)
and applying the additivity property on the limits (of integration) for the definite integrals, integral (11) becomes:
� �� �
� � � � � �* 1 1
* **
HF * 1 * ** ** 1
, for d
, for
h
jh
h k
t
jt t
t t tt kj kjt t t
P d k jH
P d P d P d k j�
���
� �� �
� � � � � �� ��
� �
� � � �
� � � � � � ��
��
�� � � (43)
Since,
� � � � � � � � � �2 32 3 4u
tP d u t a b u t c u t d u t� � � � � � � � �
�� � � �� � � � � � � � � �� ,
and with the notation,
� � � � � � � � � �2 32 3 4u u t a b u t c u t d u t� � � � � � � � �� �� � � � � � � � � � �
, (44)
the relation (43), finally, becomes:
� �� � � �
� � � � � � � �
* ** *
* 1 * ** * 1 * 1 ** 1
, for d
, for h
t j j hkViitt
j j j h kj
t t k jH
t t t t k j� ��
� � �
� �� �
� � �� � � �� �� � � �� � �
� �. (45)
Obviously, according with the algorithm presented by the equations (7) and (9) and used in all other hydraulic models outlined above, true relations for the filtration curves (10), when the flood hydrograph is approximated by the spline functions (16), are given by the eq. (9) where the integral presents the form (45). In order to apply the results obtained in this section was developed the MATLAB program Filtration_Curves _Dig2.m from (Chiorescu et al., 2007).
CASE STUDY Input data for this case study from the work (Popescu et al., 2008) are taken: HD=4.55 m, bD=4.0 m – high and width at the top of dike; m=mAM=3.0, mAV=2.5; nd=0.35, nI=0.05, kOZ=10.0 m/d; increasing branch of the real flood hydrograph HHF(t) is done in (Table 3).
Table 3. Increasing branch of the real flood hydrograph
t, [d] 0=tI 1 2 3 4 5 6 7 HHF, [m] 0=HI 0.02 0.11 0.67 1.83 2.55 2.83 2.99
t, [d] 8 9 10 11 12 13 14 15=tI+tC HHF, [m] 3.12 3.21 3.30 3.45 3.70 4.06 4.20 4.22=Hmax

64
Table 4. Values for the parametrs of the approximating functions and coresponding mean squaered deviation, σ
Approximating function Numeric values of the parameters σ
1 linear eq.(12) vLV= 0.326056 [m/d] 0.50905
2 periodic, eq. (13) HH =2.516250 [m], � =1.877469 [m], tC= 15 [d]
0.54461
3 linear, full form eq. (14) vLV =0.301059 [m/d], HI =0.258309 [m] 0.48950
4 polynomial of the 3rd degree, eq. (15)
a=0.000542589, b= -0.0312664, c=0.657847, d = -0.482789 0.31547
5 cubic spline , eq. (16) Table 5. -2.2933e-16
Table 5. Natural cubic spline function coefficients
j dj cj bj aj [tj, tj+1], [d]
1 0.06171046 0.15013137 0.10842091 0.000 [0, 1] 2 0.06171046 0.03500000 -0.00671046 0.020 [1, 2] 3 0.09144771 0.22013137 0.24842091 0.110 [2, 3] 4 -0.29750131 0.49447451 0.96302680 0.670 [3, 4] 5 0.05855753 -0.39802942 1.05947189 1.830 [4, 5] 6 0.06327120 -0.22235684 0.43908561 2.550 [5, 6] 7 0.00835766 -0.03254323 0.18418563 2.830 [6, 7] 8 -0.00670000 -0.00750000 0.14420005 2.990 [7, 8] 9 0.00844978 -0.02757582 0.10912602 3.120 [8, 9]
10 0.01290274 -0.00222648 0.07932374 3.210 [9, 10] 11 -6.0734e-05 0.03648074 0.11358001 3.300 [10, 11] 12 0.02734020 0.03629953 0.18636033 3.450 [11, 12] 13 -0.09930005 0.11832012 0.34097991 3.700 [12, 13] 14 0.03986001 -0.17958003 0.27972005 4.060 [13, 14]15 0.03986001 -0.06000000 0.04013999 4.200 [14, 15]
RESULTS AND DISCUSSIONS We found that the accuracy of the hydraulic models that lead to the determination of the curves of infiltration is strongly dependent on the accuracy of approximating the flood hydrographs with analytical function (Figure1). After reviewing the methodologies used to develop the hydraulic models, in a consistent manner, we designed an original general
algorithm applicable to any approximating analytical function for flood hydrographs. For validation, this new algorithm was first tested on the cases already treated in topical works-which led to similar results (Figure 2). In (Figure 3) the eight infiltration curves are represented through the study case dyke obtained using the proposed hydraulic model with spline function.
Figure 1. Given flood hydrograph and its fit with 5 approximating functions
Figure 2. The validation of the proposed hydraulic model with spline function
Figure 3. The eight infiltration curves through the study case dyke obtained using the proposed hydraulic model with spline function

65
Table 4. Values for the parametrs of the approximating functions and coresponding mean squaered deviation, σ
Approximating function Numeric values of the parameters σ
1 linear eq.(12) vLV= 0.326056 [m/d] 0.50905
2 periodic, eq. (13) HH =2.516250 [m], � =1.877469 [m], tC= 15 [d]
0.54461
3 linear, full form eq. (14) vLV =0.301059 [m/d], HI =0.258309 [m] 0.48950
4 polynomial of the 3rd degree, eq. (15)
a=0.000542589, b= -0.0312664, c=0.657847, d = -0.482789 0.31547
5 cubic spline , eq. (16) Table 5. -2.2933e-16
Table 5. Natural cubic spline function coefficients
j dj cj bj aj [tj, tj+1], [d]
1 0.06171046 0.15013137 0.10842091 0.000 [0, 1] 2 0.06171046 0.03500000 -0.00671046 0.020 [1, 2] 3 0.09144771 0.22013137 0.24842091 0.110 [2, 3] 4 -0.29750131 0.49447451 0.96302680 0.670 [3, 4] 5 0.05855753 -0.39802942 1.05947189 1.830 [4, 5] 6 0.06327120 -0.22235684 0.43908561 2.550 [5, 6] 7 0.00835766 -0.03254323 0.18418563 2.830 [6, 7] 8 -0.00670000 -0.00750000 0.14420005 2.990 [7, 8] 9 0.00844978 -0.02757582 0.10912602 3.120 [8, 9]
10 0.01290274 -0.00222648 0.07932374 3.210 [9, 10] 11 -6.0734e-05 0.03648074 0.11358001 3.300 [10, 11] 12 0.02734020 0.03629953 0.18636033 3.450 [11, 12] 13 -0.09930005 0.11832012 0.34097991 3.700 [12, 13] 14 0.03986001 -0.17958003 0.27972005 4.060 [13, 14]15 0.03986001 -0.06000000 0.04013999 4.200 [14, 15]
RESULTS AND DISCUSSIONS We found that the accuracy of the hydraulic models that lead to the determination of the curves of infiltration is strongly dependent on the accuracy of approximating the flood hydrographs with analytical function (Figure1). After reviewing the methodologies used to develop the hydraulic models, in a consistent manner, we designed an original general
algorithm applicable to any approximating analytical function for flood hydrographs. For validation, this new algorithm was first tested on the cases already treated in topical works-which led to similar results (Figure 2). In (Figure 3) the eight infiltration curves are represented through the study case dyke obtained using the proposed hydraulic model with spline function.
Figure 1. Given flood hydrograph and its fit with 5 approximating functions
Figure 2. The validation of the proposed hydraulic model with spline function
Figure 3. The eight infiltration curves through the study case dyke obtained using the proposed hydraulic model with spline function
66
CLINICAL AND ULTRASOUND FEATURES IN DYSURIC DOGS
Mario CODREANU, Alexandra Mihaela POPA, Iuliana CODREANU, Raluca NAE
University of Agronomic Sciences and Veterinary Medicine of Bucharest, 59 Mărăşti Blvd., District 1,
011464, Bucharest, Romania, Phone: +4021.318.25.64, Fax: + 4021.318.25.67, Email: [email protected]
Corresponding author email: [email protected]
Abstract
This article briefly indicates basic definitions and determining causes (neurogenic and non-neurogenic). The survey was accomplished in Faculty of Veterinary Medicine, Bucharest, on a total of 25 dogs between octomber 2016 and february 2017. Ultrasound was performed using Esaote Pie Medical. The clinical signs that drew attention, were dominated by pollakiurie, stranguria (associated with the phenomena of bladder stones and the obstructive urethral, especially in males) and hematuria (recurrent haematuria, and/or persistent, appeared in lithiasic condition). Urinary retention has been shown to be, in most cases (62.06%) of neurogenic origin. Proliferative parietal modifications, were consecutive to neoplasia, in form of formations tumor type pedicle, and type diffuse infiltrative. According to our study, most common bladder disorders detected in the ultrasound examination were the inflammatory type, especially the acute form, determined, in a large proportion by microlithiasis and macrolithiasis.
Key words: dysuria, dogs, pollakiuria, stranguria.
INTRODUCTION
This article has the purpose to indicate basic definitions, determining causes and to accu-mulate scientific dates which are most repre-sentative from the terms of clinical aspects with a detailed presentation of parietal modifications suffered,viewed and diagnosed with ultrasound. Dysuria is a urinary tract disorder which is commonly known as painful urination and is characterized by the frequent, straining, and, sometimes, failure to urinate (Holt, 2008) Typically dysuria isassociated with stranguria and pollakuria (Holt, 2008 ) Stranguria represents a slow urinary discharge with effort, accompanied by pain - in the form of drops or by eliminating a very thin jet (Newman, et al., 2014) Pollakiuria consists in eliminating urine frequently, but in small amounts, so the distinction being made towards polyuria (associated with an increased urine volume) (Holt, 2008). Disorders related to the act of micturition presents a series of possible causes that can have the following origins: A. non-neurogenic B. neurogenic
A. Non-neurogenic causes: - Lower urinary tract infections (cystitis, urethritis); - Inflammation of reproductive organs (vaginitis, prostatitis); - Prostate disorders: benign prostatic hyper-plasia, intra-prostatic abscesses, paraprostatic cysts; - Urolithiasis - bladder, urethral; - Neoplasms - bladder, urethra, prostate, vagina; - Iatrogeniccauses - bladder catheterization, urethrostomy; It is possible that two or more of these causes to coexist ex. urolithiasis or neoplasms may predispose to secondary bacterial infections (urinary tract infections or vice versa can lead to the formation of struvite due to alkalinisation of urine) (Holt, 1990). B. Neurogenic causes: Consist in: - Damage of lower motor neurons; - Affecting the upper motor neurons; - Detrusor sphincter dyssynergia. Affecting the lower motor neurons, causes atonic bladder by damaging the spinal cord or pelvic nerve in the sacral area, including disc
CONCLUSIONS Unlike the algorithm used by (Chiorescu et al., 2007) and (Popescu et al., 2009), the new method to obtain analytical solutions for the curves of the (in)filtration through earth massifs, proposed in the present paper, could be applied successfully also at reproducing the flood hydrographs by piecewise polynomial approximation. Hydraulic models for the curves of (in)filtration through earth massifs outlined in this paper, unlike the uni-dimensional Boussinesq hydrodynamic model, can be applied, with sufficient precision, not only for upstream vertical banks but also for any kind of slope, natural or artificial met in the hydrotechnical field.
REFERENCES Chiorescu E., Popescu Şt., Vlad L., 2007. Contributions
to design the infiltration curves through earth dykes, Romanian Agriculture in the EU–Opportunities and Perspectives. Seria Agronomie, Vol. 50, U.S.A.M.V. Iaşi, p. 120-126.
Pietraru V., 1975. Calculul infiltraţiilor. Ed. Ceres, Romania, p. 117-125.
Popescu St., 2000. Aplicaţii informatice în hidraulica sistemelor hidrotehnice. Ed. Cermi, Romania, p. 163-195.
Popescu Şt., Vlad L., Chiorescu E., 2008. Simulare numerică a infiltraţiei prin digul de protecţie Albiţa–Fălciu în perioada inundaţiilor august–septembrie 2005. Conferinta CI.MDP.03, Romania, p. 99-112.
Popescu St., Vlad L., Bartha I. & Author N.B., 2009. Theoretic contributions to the calculus of infiltration through earth dikes. Conference on Modelling Fluid Flow (CMFF’09), Hungary, p. 85-91.

67
CLINICAL AND ULTRASOUND FEATURES IN DYSURIC DOGS
Mario CODREANU, Alexandra Mihaela POPA, Iuliana CODREANU, Raluca NAE
University of Agronomic Sciences and Veterinary Medicine of Bucharest, 59 Mărăşti Blvd., District 1,
011464, Bucharest, Romania, Phone: +4021.318.25.64, Fax: + 4021.318.25.67, Email: [email protected]
Corresponding author email: [email protected]
Abstract
This article briefly indicates basic definitions and determining causes (neurogenic and non-neurogenic). The survey was accomplished in Faculty of Veterinary Medicine, Bucharest, on a total of 25 dogs between octomber 2016 and february 2017. Ultrasound was performed using Esaote Pie Medical. The clinical signs that drew attention, were dominated by pollakiurie, stranguria (associated with the phenomena of bladder stones and the obstructive urethral, especially in males) and hematuria (recurrent haematuria, and/or persistent, appeared in lithiasic condition). Urinary retention has been shown to be, in most cases (62.06%) of neurogenic origin. Proliferative parietal modifications, were consecutive to neoplasia, in form of formations tumor type pedicle, and type diffuse infiltrative. According to our study, most common bladder disorders detected in the ultrasound examination were the inflammatory type, especially the acute form, determined, in a large proportion by microlithiasis and macrolithiasis.
Key words: dysuria, dogs, pollakiuria, stranguria.
INTRODUCTION
This article has the purpose to indicate basic definitions, determining causes and to accu-mulate scientific dates which are most repre-sentative from the terms of clinical aspects with a detailed presentation of parietal modifications suffered,viewed and diagnosed with ultrasound. Dysuria is a urinary tract disorder which is commonly known as painful urination and is characterized by the frequent, straining, and, sometimes, failure to urinate (Holt, 2008) Typically dysuria isassociated with stranguria and pollakuria (Holt, 2008 ) Stranguria represents a slow urinary discharge with effort, accompanied by pain - in the form of drops or by eliminating a very thin jet (Newman, et al., 2014) Pollakiuria consists in eliminating urine frequently, but in small amounts, so the distinction being made towards polyuria (associated with an increased urine volume) (Holt, 2008). Disorders related to the act of micturition presents a series of possible causes that can have the following origins: A. non-neurogenic B. neurogenic
A. Non-neurogenic causes: - Lower urinary tract infections (cystitis, urethritis); - Inflammation of reproductive organs (vaginitis, prostatitis); - Prostate disorders: benign prostatic hyper-plasia, intra-prostatic abscesses, paraprostatic cysts; - Urolithiasis - bladder, urethral; - Neoplasms - bladder, urethra, prostate, vagina; - Iatrogeniccauses - bladder catheterization, urethrostomy; It is possible that two or more of these causes to coexist ex. urolithiasis or neoplasms may predispose to secondary bacterial infections (urinary tract infections or vice versa can lead to the formation of struvite due to alkalinisation of urine) (Holt, 1990). B. Neurogenic causes: Consist in: - Damage of lower motor neurons; - Affecting the upper motor neurons; - Detrusor sphincter dyssynergia. Affecting the lower motor neurons, causes atonic bladder by damaging the spinal cord or pelvic nerve in the sacral area, including disc
CONCLUSIONS Unlike the algorithm used by (Chiorescu et al., 2007) and (Popescu et al., 2009), the new method to obtain analytical solutions for the curves of the (in)filtration through earth massifs, proposed in the present paper, could be applied successfully also at reproducing the flood hydrographs by piecewise polynomial approximation. Hydraulic models for the curves of (in)filtration through earth massifs outlined in this paper, unlike the uni-dimensional Boussinesq hydrodynamic model, can be applied, with sufficient precision, not only for upstream vertical banks but also for any kind of slope, natural or artificial met in the hydrotechnical field.
REFERENCES Chiorescu E., Popescu Şt., Vlad L., 2007. Contributions
to design the infiltration curves through earth dykes, Romanian Agriculture in the EU–Opportunities and Perspectives. Seria Agronomie, Vol. 50, U.S.A.M.V. Iaşi, p. 120-126.
Pietraru V., 1975. Calculul infiltraţiilor. Ed. Ceres, Romania, p. 117-125.
Popescu St., 2000. Aplicaţii informatice în hidraulica sistemelor hidrotehnice. Ed. Cermi, Romania, p. 163-195.
Popescu Şt., Vlad L., Chiorescu E., 2008. Simulare numerică a infiltraţiei prin digul de protecţie Albiţa–Fălciu în perioada inundaţiilor august–septembrie 2005. Conferinta CI.MDP.03, Romania, p. 99-112.
Popescu St., Vlad L., Bartha I. & Author N.B., 2009. Theoretic contributions to the calculus of infiltration through earth dikes. Conference on Modelling Fluid Flow (CMFF’09), Hungary, p. 85-91.
AgroLife Scientific Journal - Volume 6, Number 2, 2017ISSN 2285-5718; ISSN CD-ROM 2285-5726; ISSN ONLINE 2286-0126; ISSN-L 2285-5718
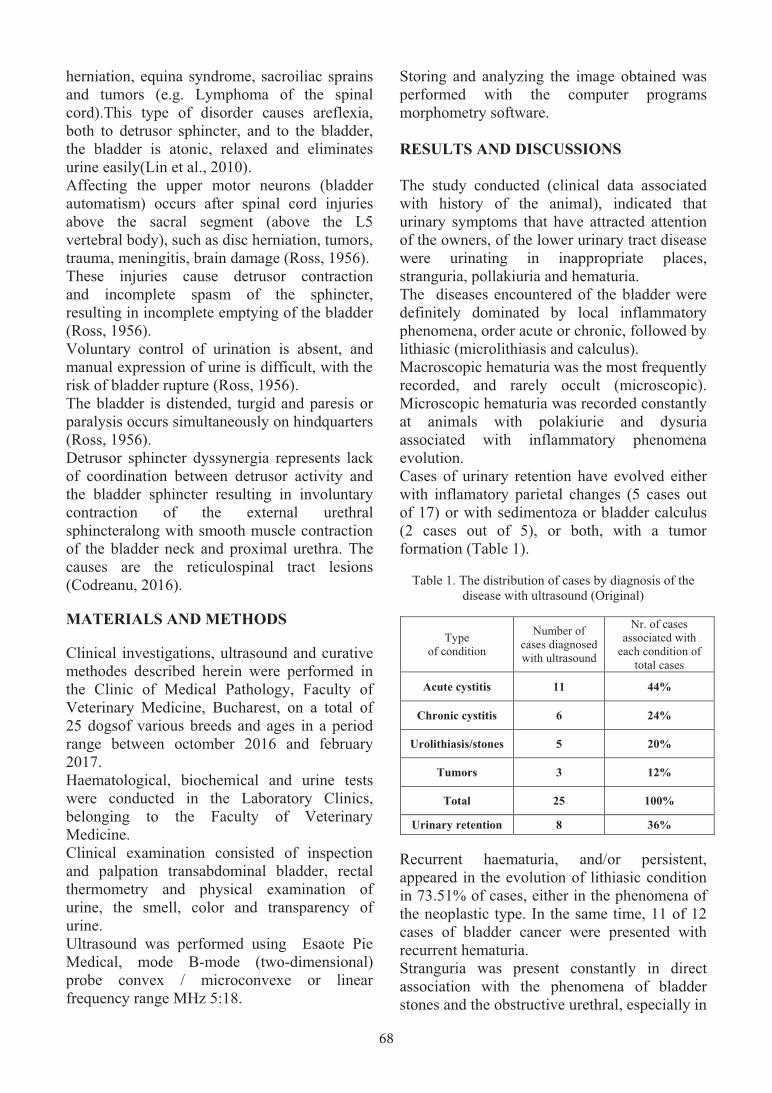
68
herniation, equina syndrome, sacroiliac sprains and tumors (e.g. Lymphoma of the spinal cord).This type of disorder causes areflexia, both to detrusor sphincter, and to the bladder, the bladder is atonic, relaxed and eliminates urine easily(Lin et al., 2010). Affecting the upper motor neurons (bladder automatism) occurs after spinal cord injuries above the sacral segment (above the L5 vertebral body), such as disc herniation, tumors, trauma, meningitis, brain damage (Ross, 1956). These injuries cause detrusor contraction and incomplete spasm of the sphincter, resulting in incomplete emptying of the bladder (Ross, 1956). Voluntary control of urination is absent, and manual expression of urine is difficult, with the risk of bladder rupture (Ross, 1956). The bladder is distended, turgid and paresis or paralysis occurs simultaneously on hindquarters (Ross, 1956). Detrusor sphincter dyssynergia represents lack of coordination between detrusor activity and the bladder sphincter resulting in involuntary contraction of the external urethral sphincteralong with smooth muscle contraction of the bladder neck and proximal urethra. The causes are the reticulospinal tract lesions (Codreanu, 2016).
MATERIALS AND METHODS
Clinical investigations, ultrasound and curative methodes described herein were performed in the Clinic of Medical Pathology, Faculty of Veterinary Medicine, Bucharest, on a total of 25 dogsof various breeds and ages in a period range between octomber 2016 and february 2017. Haematological, biochemical and urine tests were conducted in the Laboratory Clinics, belonging to the Faculty of Veterinary Medicine. Clinical examination consisted of inspection and palpation transabdominal bladder, rectal thermometry and physical examination of urine, the smell, color and transparency of urine. Ultrasound was performed using Esaote Pie Medical, mode B-mode (two-dimensional) probe convex / microconvexe or linear frequency range MHz 5:18.
Storing and analyzing the image obtained was performed with the computer programs morphometry software. RESULTS AND DISCUSSIONS The study conducted (clinical data associated with history of the animal), indicated that urinary symptoms that have attracted attention of the owners, of the lower urinary tract disease were urinating in inappropriate places, stranguria, pollakiuria and hematuria. The diseases encountered of the bladder were definitely dominated by local inflammatory phenomena, order acute or chronic, followed by lithiasic (microlithiasis and calculus). Macroscopic hematuria was the most frequently recorded, and rarely occult (microscopic). Microscopic hematuria was recorded constantly at animals with polakiurie and dysuria associated with inflammatory phenomena evolution. Cases of urinary retention have evolved either with inflamatory parietal changes (5 cases out of 17) or with sedimentoza or bladder calculus (2 cases out of 5), or both, with a tumor formation (Table 1).
Table 1. The distribution of cases by diagnosis of the
disease with ultrasound (Original)
Recurrent haematuria, and/or persistent, appeared in the evolution of lithiasic condition in 73.51% of cases, either in the phenomena of the neoplastic type. In the same time, 11 of 12 cases of bladder cancer were presented with recurrent hematuria. Stranguria was present constantly in direct association with the phenomena of bladder stones and the obstructive urethral, especially in
Type of condition
Number of cases diagnosed with ultrasound
Nr. of cases associated with
each condition of total cases
Acute cystitis 11 44%
Chronic cystitis 6 24%
Urolithiasis/stones 5 20%
Tumors 3 12%
Total 25 100%
Urinary retention 8 36%
males (97.81% of cases), in females was associated with the development of a tumor process in the bladder and only in 2 cases with multiple bladder stones. Consecutive of these results it can be seen that a significant proportion of dogs that have been diagnosed with ultrasound with a primary lesion, shows an overlap of two or more morbidprocesses, evolving simultaneously. In this regard, following ultrasound results, we found that a significant number of patients had a combination of at least two lesions in the bladder. We also encountered a association in 44% of cases (11 cases out of 25), of the phenomena lithiasic with inflammation, the probability of evolving separately as single entity, each of the two pathological processes, is very low, in the case of bladder stones, but with maximum in the case of cystitis, particularly of acute (11 cases out of 25).Also the cases that presented urinary retention associated with bladder stones, both were males, proving the actual existence of the problem of high frequency of urethral blockage on males due to the anatomical peculiarities of the urethra. Urinary retention has been shown to be, in most cases (62.06%) of neurogenic origin respectively consecutive the paralysis of the bladder with different etiology (18 cases out of 29). At a percentage of 37.94%, urinary retention it was determined by obstructive phenomena in the urethra, respectively urethral calculus. Of the 49 cases with urinary stones, 21 were assessed after ultrasound examination, as the type microlithiasis (42.85%), respectively a total of 28 dogs were diagnosed with macrolithiasis (57.15%). Parietal modifications, identified in the ultrasound examination, were predominantly type-infiltration, with uniform aspect, maintaining the architecture of the parietal specific and were not affected the deeper layers, indicating the existence of a acute inflammatory phenomenon (51 cases out of 77, of which 39.27% were consecutive microlithiasis) and also an inconstant aspect, type scleroatrophic, with loss of parietal specific architecture and with deep layers affected (26 cases out of 77, of which 57.69% were consecutive macrolitihiasis).
Proliferative parietal modifications, were consecutive to neoplasia, were at a percentage of 44.44% (4 cases out of 12), in form of formations tumor type pedicle,and a rate of 66.66% of type diffuse infiltrative with thickening of the parietal and loss of specific parietal stratification (8 cases out of 12) in the form of tumor proliferation of sessile type. The following are ultrasound images, consi-dered to be representative of all cases presented and fully evaluated, each is accompanied by an interpretation. We chose, for each diagnosis established with the help of ultrasound a number of 12 photos. In regard to dysuria determined by non-neurogenic causes we decided to attach in this article, a number of 10 ultrasound pictures (Figures 1-10).
Figure 1. Acute cystitis. Thickening of wall bladder (reaction - type uniform, maintaining the parietal
specific architecture). Numerous corpuscular elements in suspension and sediment (Original)
Figure 2. Bladder stones - secondary cystitis. Intravesical are identified echogenic mass, well
defined, accompanied by artefactual phenomenon specific distal enhancement. Important parietal
reaction (secondary cystitis) (Original)
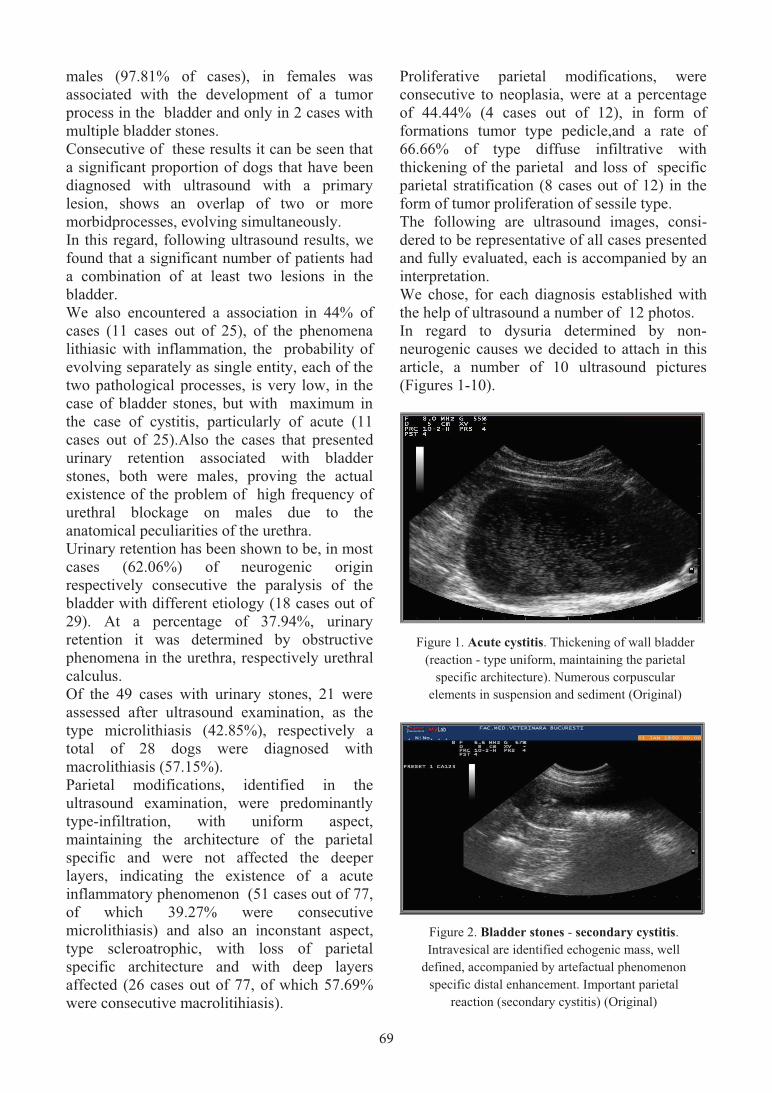
69
herniation, equina syndrome, sacroiliac sprains and tumors (e.g. Lymphoma of the spinal cord).This type of disorder causes areflexia, both to detrusor sphincter, and to the bladder, the bladder is atonic, relaxed and eliminates urine easily(Lin et al., 2010). Affecting the upper motor neurons (bladder automatism) occurs after spinal cord injuries above the sacral segment (above the L5 vertebral body), such as disc herniation, tumors, trauma, meningitis, brain damage (Ross, 1956). These injuries cause detrusor contraction and incomplete spasm of the sphincter, resulting in incomplete emptying of the bladder (Ross, 1956). Voluntary control of urination is absent, and manual expression of urine is difficult, with the risk of bladder rupture (Ross, 1956). The bladder is distended, turgid and paresis or paralysis occurs simultaneously on hindquarters (Ross, 1956). Detrusor sphincter dyssynergia represents lack of coordination between detrusor activity and the bladder sphincter resulting in involuntary contraction of the external urethral sphincteralong with smooth muscle contraction of the bladder neck and proximal urethra. The causes are the reticulospinal tract lesions (Codreanu, 2016).
MATERIALS AND METHODS
Clinical investigations, ultrasound and curative methodes described herein were performed in the Clinic of Medical Pathology, Faculty of Veterinary Medicine, Bucharest, on a total of 25 dogsof various breeds and ages in a period range between octomber 2016 and february 2017. Haematological, biochemical and urine tests were conducted in the Laboratory Clinics, belonging to the Faculty of Veterinary Medicine. Clinical examination consisted of inspection and palpation transabdominal bladder, rectal thermometry and physical examination of urine, the smell, color and transparency of urine. Ultrasound was performed using Esaote Pie Medical, mode B-mode (two-dimensional) probe convex / microconvexe or linear frequency range MHz 5:18.
Storing and analyzing the image obtained was performed with the computer programs morphometry software. RESULTS AND DISCUSSIONS The study conducted (clinical data associated with history of the animal), indicated that urinary symptoms that have attracted attention of the owners, of the lower urinary tract disease were urinating in inappropriate places, stranguria, pollakiuria and hematuria. The diseases encountered of the bladder were definitely dominated by local inflammatory phenomena, order acute or chronic, followed by lithiasic (microlithiasis and calculus). Macroscopic hematuria was the most frequently recorded, and rarely occult (microscopic). Microscopic hematuria was recorded constantly at animals with polakiurie and dysuria associated with inflammatory phenomena evolution. Cases of urinary retention have evolved either with inflamatory parietal changes (5 cases out of 17) or with sedimentoza or bladder calculus (2 cases out of 5), or both, with a tumor formation (Table 1).
Table 1. The distribution of cases by diagnosis of the
disease with ultrasound (Original)
Recurrent haematuria, and/or persistent, appeared in the evolution of lithiasic condition in 73.51% of cases, either in the phenomena of the neoplastic type. In the same time, 11 of 12 cases of bladder cancer were presented with recurrent hematuria. Stranguria was present constantly in direct association with the phenomena of bladder stones and the obstructive urethral, especially in
Type of condition
Number of cases diagnosed with ultrasound
Nr. of cases associated with
each condition of total cases
Acute cystitis 11 44%
Chronic cystitis 6 24%
Urolithiasis/stones 5 20%
Tumors 3 12%
Total 25 100%
Urinary retention 8 36%
males (97.81% of cases), in females was associated with the development of a tumor process in the bladder and only in 2 cases with multiple bladder stones. Consecutive of these results it can be seen that a significant proportion of dogs that have been diagnosed with ultrasound with a primary lesion, shows an overlap of two or more morbidprocesses, evolving simultaneously. In this regard, following ultrasound results, we found that a significant number of patients had a combination of at least two lesions in the bladder. We also encountered a association in 44% of cases (11 cases out of 25), of the phenomena lithiasic with inflammation, the probability of evolving separately as single entity, each of the two pathological processes, is very low, in the case of bladder stones, but with maximum in the case of cystitis, particularly of acute (11 cases out of 25).Also the cases that presented urinary retention associated with bladder stones, both were males, proving the actual existence of the problem of high frequency of urethral blockage on males due to the anatomical peculiarities of the urethra. Urinary retention has been shown to be, in most cases (62.06%) of neurogenic origin respectively consecutive the paralysis of the bladder with different etiology (18 cases out of 29). At a percentage of 37.94%, urinary retention it was determined by obstructive phenomena in the urethra, respectively urethral calculus. Of the 49 cases with urinary stones, 21 were assessed after ultrasound examination, as the type microlithiasis (42.85%), respectively a total of 28 dogs were diagnosed with macrolithiasis (57.15%). Parietal modifications, identified in the ultrasound examination, were predominantly type-infiltration, with uniform aspect, maintaining the architecture of the parietal specific and were not affected the deeper layers, indicating the existence of a acute inflammatory phenomenon (51 cases out of 77, of which 39.27% were consecutive microlithiasis) and also an inconstant aspect, type scleroatrophic, with loss of parietal specific architecture and with deep layers affected (26 cases out of 77, of which 57.69% were consecutive macrolitihiasis).
Proliferative parietal modifications, were consecutive to neoplasia, were at a percentage of 44.44% (4 cases out of 12), in form of formations tumor type pedicle,and a rate of 66.66% of type diffuse infiltrative with thickening of the parietal and loss of specific parietal stratification (8 cases out of 12) in the form of tumor proliferation of sessile type. The following are ultrasound images, consi-dered to be representative of all cases presented and fully evaluated, each is accompanied by an interpretation. We chose, for each diagnosis established with the help of ultrasound a number of 12 photos. In regard to dysuria determined by non-neurogenic causes we decided to attach in this article, a number of 10 ultrasound pictures (Figures 1-10).
Figure 1. Acute cystitis. Thickening of wall bladder (reaction - type uniform, maintaining the parietal
specific architecture). Numerous corpuscular elements in suspension and sediment (Original)
Figure 2. Bladder stones - secondary cystitis. Intravesical are identified echogenic mass, well
defined, accompanied by artefactual phenomenon specific distal enhancement. Important parietal
reaction (secondary cystitis) (Original)

70
Figure 3. Chronic cystitis. Global damage to the bladder wall, dominated by uniform thickening of
the wall. The content presents rare corpuscular elements in suspension. Obvious distal
enhancement phenomena (Original)
Figure 4. Bladder tumor. Parietal thickening (7.3 mm), uneven loss of specific architecture. The presence of a pedicle formations, with echogenic appearance and irregular outline. Urine with increased cellularity
(hematuric aspect) (Original)
Figure 5. Bladder tumors. Sesil type with parietal hyperecougenous and obvious tendency to invade intralumenal. The content is uniform anechogenic
with distal enhancement (Original)
Figure 6. Urinary retention, type mechanical - is identified a mass tissue that reflects and compresses the bladder neck and generates urinary stasis(Original)
Figure 7. Urinary retention and intraprostatic urethral distension. Intraprostatic hemochist
(right side of image) with urinary retention, relaxed and hypotonic aspect of intraprostatic urethra (Original)
Figure 8. Suspected bladder tumor. Patchy parietal thickening type (loss parietal architecture specific) - Suspected bladder tumor (sessile). Urine with many
particles in suspension, without tendency to sedimentation (Original)
Concerning the dysuria provoked by neurogenic causes we present 2 ecographic images (Figures 11-12).
CONCLUSIONS Clinical investigations and ultrasounds in canine bladderaffections, captured a wide range of pathological processes expressing dysuria, associated with inflammatory, lithiasic and neoplastic disorders. The clinical signs that drew attention, were do-minated by pollakiurie, stranguria and hema-turia, therefore ultrasound investigations have been conducted in order to confirm and assessing the degree, type and extension of pathological process. Pollakiuria was clinical dominant in acute cystitis, accompanied by changes in the urine (terminal hematuria and the presence in urine sediment of the urothelial cells) and specific behavior changes. Hematuria recurrent and/or persistent consis-tently been associated with the existence of phenomena lithiasic and neoplastic. Stranguria was associated in males with bladder stones and urinary retention phenomena, determined by urethral obstruction, expressing with urinary retention (mechanical, spastic and paralytic). According to our study, most common bladder disorders detected in the ultrasound exami-nation were the inflammatory type, especially the acute form, determined, in a large pro-portion by microlithiasis and macrolithiasis.
Figure 11. Acute cystitis. Paralytic retention. Hypotonic aspect, obvious parietal reaction (parietal thickening),
increased cellularity (urine echogenic) (Original)
Figure 12. Urinary retention, posttraumatic chronic cystitis. Distended bladder by abundant
content, corpuscular elements in suspension (echogenic mass, without tendency to sedimentation),
parietal thickening, hypotonic aspect (Original)
Figure 9. Giant bladder stone, urine echogenic. highly echogenic mass (hyperechoic) localised
intraluminal (2.23 cm). Many corpuscular elements in suspension - no tendency to sedimentation (Original)
Figure 10. Tumor bladder. Obvious parietal thickening with diffuse infiltrative appearance,
accompanied by loss of parietal specific architecture. Lumen bladder is invaded by an echogenic mass with
starting point parietal (Original)
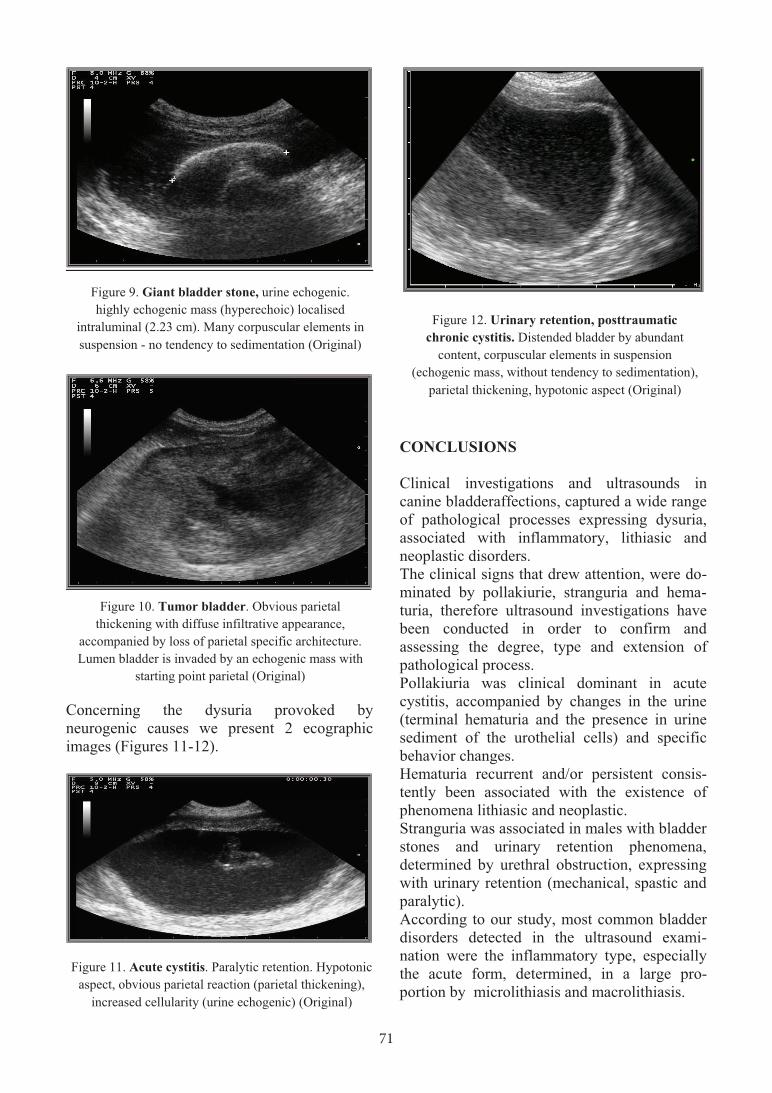
71
Figure 3. Chronic cystitis. Global damage to the bladder wall, dominated by uniform thickening of
the wall. The content presents rare corpuscular elements in suspension. Obvious distal
enhancement phenomena (Original)
Figure 4. Bladder tumor. Parietal thickening (7.3 mm), uneven loss of specific architecture. The presence of a pedicle formations, with echogenic appearance and irregular outline. Urine with increased cellularity
(hematuric aspect) (Original)
Figure 5. Bladder tumors. Sesil type with parietal hyperecougenous and obvious tendency to invade intralumenal. The content is uniform anechogenic
with distal enhancement (Original)
Figure 6. Urinary retention, type mechanical - is identified a mass tissue that reflects and compresses the bladder neck and generates urinary stasis(Original)
Figure 7. Urinary retention and intraprostatic urethral distension. Intraprostatic hemochist
(right side of image) with urinary retention, relaxed and hypotonic aspect of intraprostatic urethra (Original)
Figure 8. Suspected bladder tumor. Patchy parietal thickening type (loss parietal architecture specific) - Suspected bladder tumor (sessile). Urine with many
particles in suspension, without tendency to sedimentation (Original)
Concerning the dysuria provoked by neurogenic causes we present 2 ecographic images (Figures 11-12).
CONCLUSIONS Clinical investigations and ultrasounds in canine bladderaffections, captured a wide range of pathological processes expressing dysuria, associated with inflammatory, lithiasic and neoplastic disorders. The clinical signs that drew attention, were do-minated by pollakiurie, stranguria and hema-turia, therefore ultrasound investigations have been conducted in order to confirm and assessing the degree, type and extension of pathological process. Pollakiuria was clinical dominant in acute cystitis, accompanied by changes in the urine (terminal hematuria and the presence in urine sediment of the urothelial cells) and specific behavior changes. Hematuria recurrent and/or persistent consis-tently been associated with the existence of phenomena lithiasic and neoplastic. Stranguria was associated in males with bladder stones and urinary retention phenomena, determined by urethral obstruction, expressing with urinary retention (mechanical, spastic and paralytic). According to our study, most common bladder disorders detected in the ultrasound exami-nation were the inflammatory type, especially the acute form, determined, in a large pro-portion by microlithiasis and macrolithiasis.
Figure 11. Acute cystitis. Paralytic retention. Hypotonic aspect, obvious parietal reaction (parietal thickening),
increased cellularity (urine echogenic) (Original)
Figure 12. Urinary retention, posttraumatic chronic cystitis. Distended bladder by abundant
content, corpuscular elements in suspension (echogenic mass, without tendency to sedimentation),
parietal thickening, hypotonic aspect (Original)
Figure 9. Giant bladder stone, urine echogenic. highly echogenic mass (hyperechoic) localised
intraluminal (2.23 cm). Many corpuscular elements in suspension - no tendency to sedimentation (Original)
Figure 10. Tumor bladder. Obvious parietal thickening with diffuse infiltrative appearance,
accompanied by loss of parietal specific architecture. Lumen bladder is invaded by an echogenic mass with
starting point parietal (Original)

72
THE INFLUENCE OF SIMULATED ACIDIC RAIN
ON PLANTS VOLATILE ORGANIC COMPOUNDS EMISSION AND PHOTOSYNTHETIC PARAMETERS
Lucian COPOLOVICI, Adelina BAN, Ioana FAUR, Dana COPOLOVICI
“Aurel Vlaicu” University, Faculty of Food Engineering, Tourism and Environmental
Protection, Research Center in Technical and Natural Sciences, Romania, 2 Elena Dragoi, Arad 310330, Romania
Corresponding author email: [email protected]
Abstract Acidic rain has received increasing interest due to the raising emissions of SO2 and NOx which determine a decrease of rain water pH under 5. The influence of such water deposition on plants leaf includes necrosis and nutrient losses. In this study the influence of simulated acidic rain on Phaseolus vulgaris L plants has been studied. In order to simulate the acidic rain, we used three different pH values (4, 4.5 and 5) of sulphuric acid solution which could occurred in the nature. The photosynthetic parameters decrease in the first 24 hours after stress application but recovered at the initial values after but only in the case of an acidic rain with pH higher than 5. The green leaf volatiles emission scale with strength stress and terpenes emission has been shown to have some protective effect. The visible symptoms of damage (chlorosis and necrosis) have been highlighted using light microscopy. Key words: acidic rain, terpenes, photosynthesis, Phaseolus vulgaris L. INTRODUCTION
Acidic rain is one of the severest problems which affect the ecosystems which occur in Europa, North America and China (Rodhe et al., 2002). Burton and Aherne (2012) have been shown a high sulphate deposition in small lakes from Ireland. Furthermore, due to the protocol of Convention on Long-range Transboundary Air Pollution the concentrations of different acidic ions decrease in the US and all European country (see Lajtha and Jones, 2013, for an overview). On the other hand, acidic deposition in East Asia increased in the last years, large regions from South and East China being strong affected since 2010 (Duan et al., 2011). In Taiwan, a survey from 1991 to 2006 indicated that the rain water pH had been around 4.5 (Lu, 2007). Plants suffer from acidic rain not only visible damage as necrosis or chlorosis but also invisible ones as nutrient loss from leaves epicuticular wax destruction or photosynthesis alteration (Oguntimehin et al., 2010). Low value of the soil pH could decrease the plants grow (Reid and Watmough, 2014) and lowers evapotranspiration of different trees (Green et al., 2013).
Even more it have been demonstrated that two species Q. alba and A. rubrum react different to acidic pH but acidic deposition could also play an important role in determining future species ranges (Medeiros et al., 2016). In a previous paper, it has been demonstrated that acidic rain induced oxidative stress related to membrane damage but did not cause irreversible changes (Velikova et al., 2000). Oxidative stress could induce emission of volatile organic compounds as green leaf volatiles which are formed in a process where free octadecanoid fatty acids are released from plant membranes by phospholipases (Matsui, 2006) and terpenes formed in 2-C-methyl-D-erythritol 4-phosphate pathway (Baldwin et al., 2006). Such emission has been shown for other oxidative stress as ozone, drought or flooding (Copolovici and Niinemets, 2016; Mochizuki et al., 2017; Yuan et al., 2016). In the same direction oxidative stress decrease photosynthetic parameters including assimi-lation rate and stomatal conductance (Copolovici and Niinemets, 2010) The aim of the present paper was to investigate the effect of simulated acidic rain with different values of pH on volatile organic compounds and photosynthetic parameters.
REFERENCES Codreanu M.D., Nae R.,2016. Coordinates and clinical
diagnostic in the main urological disorders. Veterinary practice, VII, No. 22, p. 16-22.
Holt P.E., 1990. Dysuria in the dog. Part 1: management of the dysuric animal. In Practice Vol.12, No. 3, p.121, 123-125.
Holt P.E., 2008.Urological Disorders of the Dog and Cat: Investigation, Diagnosis, Treatment. Manson Publishing. Barcelona.
Laborde A., 2009. Dysuria and stranguria in a 7-year-old dog. Le Nouveau Praticien Vétérinaire Canine - Féline No. 42 p. 4, 77.
Lin H., Hou C., Chen A. & Xu Z., 2010. Reinnervation of atonic bladder after conus medullaris injury using a modified nerve crossover technique in canines. World Neurosurgery, 73(5), p. 582–586. https://doi.org/10.1016/j.wneu.2010.02.020.
Newman M., Evans N., Podadera J., Beijerink N. & Voss K., 2014. Urethral defect with suspected corpus spongiosum herniation as a cause of stranguria and urethral haemorrhage in a dog. Veterinary Record Case Reports, 2(1), e000111. https://doi.org/10.1136/vetreccr-2014-000111
Ross J.C., 1956. Treatment of the bladder in paraplegia. British Journal of Urology, 28(1), p. 14–23.
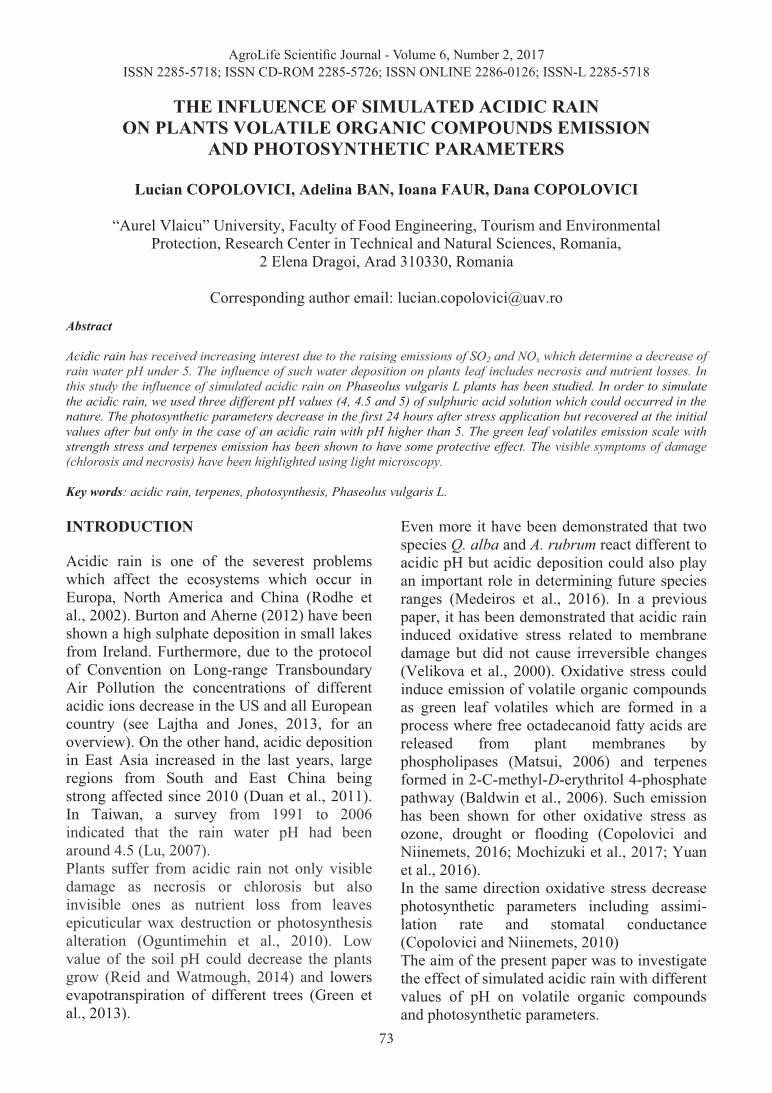
73
THE INFLUENCE OF SIMULATED ACIDIC RAIN
ON PLANTS VOLATILE ORGANIC COMPOUNDS EMISSION AND PHOTOSYNTHETIC PARAMETERS
Lucian COPOLOVICI, Adelina BAN, Ioana FAUR, Dana COPOLOVICI
“Aurel Vlaicu” University, Faculty of Food Engineering, Tourism and Environmental
Protection, Research Center in Technical and Natural Sciences, Romania, 2 Elena Dragoi, Arad 310330, Romania
Corresponding author email: [email protected]
Abstract Acidic rain has received increasing interest due to the raising emissions of SO2 and NOx which determine a decrease of rain water pH under 5. The influence of such water deposition on plants leaf includes necrosis and nutrient losses. In this study the influence of simulated acidic rain on Phaseolus vulgaris L plants has been studied. In order to simulate the acidic rain, we used three different pH values (4, 4.5 and 5) of sulphuric acid solution which could occurred in the nature. The photosynthetic parameters decrease in the first 24 hours after stress application but recovered at the initial values after but only in the case of an acidic rain with pH higher than 5. The green leaf volatiles emission scale with strength stress and terpenes emission has been shown to have some protective effect. The visible symptoms of damage (chlorosis and necrosis) have been highlighted using light microscopy. Key words: acidic rain, terpenes, photosynthesis, Phaseolus vulgaris L. INTRODUCTION
Acidic rain is one of the severest problems which affect the ecosystems which occur in Europa, North America and China (Rodhe et al., 2002). Burton and Aherne (2012) have been shown a high sulphate deposition in small lakes from Ireland. Furthermore, due to the protocol of Convention on Long-range Transboundary Air Pollution the concentrations of different acidic ions decrease in the US and all European country (see Lajtha and Jones, 2013, for an overview). On the other hand, acidic deposition in East Asia increased in the last years, large regions from South and East China being strong affected since 2010 (Duan et al., 2011). In Taiwan, a survey from 1991 to 2006 indicated that the rain water pH had been around 4.5 (Lu, 2007). Plants suffer from acidic rain not only visible damage as necrosis or chlorosis but also invisible ones as nutrient loss from leaves epicuticular wax destruction or photosynthesis alteration (Oguntimehin et al., 2010). Low value of the soil pH could decrease the plants grow (Reid and Watmough, 2014) and lowers evapotranspiration of different trees (Green et al., 2013).
Even more it have been demonstrated that two species Q. alba and A. rubrum react different to acidic pH but acidic deposition could also play an important role in determining future species ranges (Medeiros et al., 2016). In a previous paper, it has been demonstrated that acidic rain induced oxidative stress related to membrane damage but did not cause irreversible changes (Velikova et al., 2000). Oxidative stress could induce emission of volatile organic compounds as green leaf volatiles which are formed in a process where free octadecanoid fatty acids are released from plant membranes by phospholipases (Matsui, 2006) and terpenes formed in 2-C-methyl-D-erythritol 4-phosphate pathway (Baldwin et al., 2006). Such emission has been shown for other oxidative stress as ozone, drought or flooding (Copolovici and Niinemets, 2016; Mochizuki et al., 2017; Yuan et al., 2016). In the same direction oxidative stress decrease photosynthetic parameters including assimi-lation rate and stomatal conductance (Copolovici and Niinemets, 2010) The aim of the present paper was to investigate the effect of simulated acidic rain with different values of pH on volatile organic compounds and photosynthetic parameters.
REFERENCES Codreanu M.D., Nae R.,2016. Coordinates and clinical
diagnostic in the main urological disorders. Veterinary practice, VII, No. 22, p. 16-22.
Holt P.E., 1990. Dysuria in the dog. Part 1: management of the dysuric animal. In Practice Vol.12, No. 3, p.121, 123-125.
Holt P.E., 2008.Urological Disorders of the Dog and Cat: Investigation, Diagnosis, Treatment. Manson Publishing. Barcelona.
Laborde A., 2009. Dysuria and stranguria in a 7-year-old dog. Le Nouveau Praticien Vétérinaire Canine - Féline No. 42 p. 4, 77.
Lin H., Hou C., Chen A. & Xu Z., 2010. Reinnervation of atonic bladder after conus medullaris injury using a modified nerve crossover technique in canines. World Neurosurgery, 73(5), p. 582–586. https://doi.org/10.1016/j.wneu.2010.02.020.
Newman M., Evans N., Podadera J., Beijerink N. & Voss K., 2014. Urethral defect with suspected corpus spongiosum herniation as a cause of stranguria and urethral haemorrhage in a dog. Veterinary Record Case Reports, 2(1), e000111. https://doi.org/10.1136/vetreccr-2014-000111
Ross J.C., 1956. Treatment of the bladder in paraplegia. British Journal of Urology, 28(1), p. 14–23.
AgroLife Scientific Journal - Volume 6, Number 2, 2017ISSN 2285-5718; ISSN CD-ROM 2285-5726; ISSN ONLINE 2286-0126; ISSN-L 2285-5718

74
MATERIALS AND METHODS For measurements bean plants Phaseolus vulgaris L. (Minodor, Agrosel Campia Turzii) has been grown in the laboratory for 3 weeks under artificial light intensity of 300 µmol m-2 s-1. Period light / dark was 12-12 hours and the temperature 25oC. To simulate acid rain, three solutions of H2SO4 were prepared at pH 4; 4.5 and 5 respectively. Every plant has been sprayed with corresponded acidic solution one time and the controls plants have been sprayed with distill water. Photosynthetic characteristics were determined with a portable gas exchange system GFS-3000 (Waltz, Effeltrich, Germany) as described in (Niinemets et al., 2010). Volatile organic compounds (VOC) were sampled via the outlet of the gas-exchange cuvette in a multibead stainless steel cartridge filled with different carbotraps. The adsorbent cartridges were analyzed for green leaf volatiles, (GLV) and terpenes using a Shimadzu TD20 automated cartridge desorber integrated with a Shimadzu 2010 Plus GC-MS instrument (Shimadzu Corporation, Kyoto, Japan) using a method described in (Kannaste et al., 2014). Fresh leaves from several plants were visualized with methylene blue staining by using an Axio Scope A1 light microscope equipped with Axio Cam MRc 5, ZEN lite 2012 software (Zeiss, Germany). at magni-fication 5x. RESULTS AND DISCUSSIONS Germination tests The tests were carried out on the seed germination of Phaseolus vulgaris L. in both water and soultions with various pH values. It could be observe that the number of seeds that germinate decreases with the increasing of acidity (Tabel 1).
Table 1. The seeds of Phaseolus vulgaris L. germinated in environments with various pHs
Treatments % of seeds germination Control 100
pH 5 100 pH 4.5 10% pH 4 0%
Photosynthetic parameters The photosynthetic parameters decreased drastically after plants have been sprayed with acidic solutions of pH 4 and 4.5. After 2 hours assimilation rates recovered at the initial values (see Figure 1 for plants sprayed with acidic water at pH 4) while stomata conductance increased at higher values.
0.0
0.5
1.0
1.5
2.0
2.5
3.0
3.5
Assim
ilatio
n ra
te (n
mol
m-2 s-1
)
Plant sprayed with acidic water pH 4
0 50 100 150 200 2500
20
40
60
Plant sprayed with acidic water pH 4
Stom
atal
con
duct
ance
( �
mol
m-2 s
-1)
Time (min.) Figure 1. Evolution of photosynthetic parameters of
plants sprayed with acidic water at pH 4
Even more, assimilation rate and stomatal conductance at 48 hours and 7 days after treatment with pH 4.5 and 5 recovered at the initial values. The influence of light on stomatal conductance and assimilation rate have been show that plants which suffer from an episode of acidic rain are more sensitive to light than control (Figure 2).
-1
0
1
2
3
4
control pH5 pH4.5
Assi
mila
tion
rate
(�m
ol m
-2 s
-1)
0 500 1000 1500 20000
25
50
75
Stom
atal
con
duct
ance
(mm
ol m
-2 s
-1)
PAR (�mol m-2 s-1)
Figure 2. The influence of light on photosynthetic
parameters Volatile organic compounds emission Sprayed plants with acidic water have been monitored for 168 hours. The emission of volatile organic compounds depends on the time with a maximum at 1 hour (Figure 3). The emission decreased after 2 days those we could presume that the formation of volatile compounds could be associate with a protection response of the plants.
0 1 2 3 4 50 100 150 2000.0
0.1
0.2
0.3
0.4
0.5
3-hexen-al alpha-pinene camphene 3-carene limonene
Emis
sion
rate
(nm
ol m
-2 s
-1)
Time (h)Figure 3. Emission rate of different volatile organic compounds from Phaseolus vulgaris L. leaves after
spraying with acidic water at pH 4.5 The relatively high concentrations of 3-hexen-al appeared at the beginning of the period of stress could be due to the cell membrane destruction associated with activation of lipoxygenase pathway. Furthermore, the emission of different volatiles could be associated with a stress signal (see Copolovici and Niinemets, 2016). The emission of green leaf compounds increases with increasing of plant stress strength (pH becomes more acid) while total
emissions of monoterpenes do not depend by pH being significantly increased for all plants under stress (Figure 4). Plants microscopy All leaves have been inoculated with methylene blue for a better visualisation of necrosis (Figure 5).
control pH 5 pH 4.5 pH 40.0
0.2
0.4
0.6
0.8
1.0
Emis
sion
rate
(nm
ol m
-2 s
-1) 3-hexen-al
monoterpene
Figure 4. The emission of volatile organic compounds
after 2 hours of acidic rain sprayed
a) b)
c) d)
Figure 5. Microscopically samples for Phaseolus vulgaris L. after treatment with a) water (control);
b) pH = 5; c) pH = 4.5; d) pH = 4
The blue area (which corresponds to dead cells) is bigger for plants which have been treated with solution with pH 4 but even at pH 5 there are spots with necrosis. CONCLUSIONS It have been showed that photosynthesis parameter values decreased in the first hours after applying the stress then recovered completely after 24 hours.

75
MATERIALS AND METHODS For measurements bean plants Phaseolus vulgaris L. (Minodor, Agrosel Campia Turzii) has been grown in the laboratory for 3 weeks under artificial light intensity of 300 µmol m-2 s-1. Period light / dark was 12-12 hours and the temperature 25oC. To simulate acid rain, three solutions of H2SO4 were prepared at pH 4; 4.5 and 5 respectively. Every plant has been sprayed with corresponded acidic solution one time and the controls plants have been sprayed with distill water. Photosynthetic characteristics were determined with a portable gas exchange system GFS-3000 (Waltz, Effeltrich, Germany) as described in (Niinemets et al., 2010). Volatile organic compounds (VOC) were sampled via the outlet of the gas-exchange cuvette in a multibead stainless steel cartridge filled with different carbotraps. The adsorbent cartridges were analyzed for green leaf volatiles, (GLV) and terpenes using a Shimadzu TD20 automated cartridge desorber integrated with a Shimadzu 2010 Plus GC-MS instrument (Shimadzu Corporation, Kyoto, Japan) using a method described in (Kannaste et al., 2014). Fresh leaves from several plants were visualized with methylene blue staining by using an Axio Scope A1 light microscope equipped with Axio Cam MRc 5, ZEN lite 2012 software (Zeiss, Germany). at magni-fication 5x. RESULTS AND DISCUSSIONS Germination tests The tests were carried out on the seed germination of Phaseolus vulgaris L. in both water and soultions with various pH values. It could be observe that the number of seeds that germinate decreases with the increasing of acidity (Tabel 1).
Table 1. The seeds of Phaseolus vulgaris L. germinated in environments with various pHs
Treatments % of seeds germination Control 100
pH 5 100 pH 4.5 10% pH 4 0%
Photosynthetic parameters The photosynthetic parameters decreased drastically after plants have been sprayed with acidic solutions of pH 4 and 4.5. After 2 hours assimilation rates recovered at the initial values (see Figure 1 for plants sprayed with acidic water at pH 4) while stomata conductance increased at higher values.
0.0
0.5
1.0
1.5
2.0
2.5
3.0
3.5
Assim
ilatio
n ra
te (n
mol
m-2 s-1
)
Plant sprayed with acidic water pH 4
0 50 100 150 200 2500
20
40
60
Plant sprayed with acidic water pH 4
Stom
atal
con
duct
ance
( �
mol
m-2 s
-1)
Time (min.) Figure 1. Evolution of photosynthetic parameters of
plants sprayed with acidic water at pH 4
Even more, assimilation rate and stomatal conductance at 48 hours and 7 days after treatment with pH 4.5 and 5 recovered at the initial values. The influence of light on stomatal conductance and assimilation rate have been show that plants which suffer from an episode of acidic rain are more sensitive to light than control (Figure 2).
-1
0
1
2
3
4
control pH5 pH4.5
Assi
mila
tion
rate
(�m
ol m
-2 s
-1)
0 500 1000 1500 20000
25
50
75
Stom
atal
con
duct
ance
(mm
ol m
-2 s
-1)
PAR (�mol m-2 s-1)
Figure 2. The influence of light on photosynthetic
parameters Volatile organic compounds emission Sprayed plants with acidic water have been monitored for 168 hours. The emission of volatile organic compounds depends on the time with a maximum at 1 hour (Figure 3). The emission decreased after 2 days those we could presume that the formation of volatile compounds could be associate with a protection response of the plants.
0 1 2 3 4 50 100 150 2000.0
0.1
0.2
0.3
0.4
0.5
3-hexen-al alpha-pinene camphene 3-carene limonene
Emis
sion
rate
(nm
ol m
-2 s
-1)
Time (h)Figure 3. Emission rate of different volatile organic compounds from Phaseolus vulgaris L. leaves after
spraying with acidic water at pH 4.5 The relatively high concentrations of 3-hexen-al appeared at the beginning of the period of stress could be due to the cell membrane destruction associated with activation of lipoxygenase pathway. Furthermore, the emission of different volatiles could be associated with a stress signal (see Copolovici and Niinemets, 2016). The emission of green leaf compounds increases with increasing of plant stress strength (pH becomes more acid) while total
emissions of monoterpenes do not depend by pH being significantly increased for all plants under stress (Figure 4). Plants microscopy All leaves have been inoculated with methylene blue for a better visualisation of necrosis (Figure 5).
control pH 5 pH 4.5 pH 40.0
0.2
0.4
0.6
0.8
1.0
Emis
sion
rate
(nm
ol m
-2 s
-1) 3-hexen-al
monoterpene
Figure 4. The emission of volatile organic compounds
after 2 hours of acidic rain sprayed
a) b)
c) d)
Figure 5. Microscopically samples for Phaseolus vulgaris L. after treatment with a) water (control);
b) pH = 5; c) pH = 4.5; d) pH = 4
The blue area (which corresponds to dead cells) is bigger for plants which have been treated with solution with pH 4 but even at pH 5 there are spots with necrosis. CONCLUSIONS It have been showed that photosynthesis parameter values decreased in the first hours after applying the stress then recovered completely after 24 hours.

76
INFLUENCE OF SOME CLIMATIC FACTORS UPON POWDERY MILDEW
ATTACK IN OAK FORESTS LOCATED IN TRANSYLVANIA
Ilie COVRIG, Camelia OROIAN, Petru BURDUHOS, Ioan OROIAN, Antonia ODAGIU
University of Agricultural Sciences and Veterinary Medicine Cluj-Napoca,
3-5 Calea Mănăștur, 400372 Cluj-Napoca, Romania
Corresponding author email: [email protected]
Abstract The threats of diseases against forests, together with climatic factors, are of highest concern worldwide. In common oak, powdery mildew is one of the most harmful diseases. In Romania, it is considered to be produced by Microsphaera abbreviata Peck sin. Erysiphe abbreviata Peck. In our trial, we aimed to test the influence of temperature, air relative humidity, and wind velocity characteristic for two areas in Cluj and Maramureș Counties; we tested their influence on the Microsphaera abbreviata Peck attack upon common oak and we quantified the relationships identified between the mentioned climatic factors and the Microsphaera abbreviata Peck attack degree between May 15thand June 14th 2016.Within that period, the Microsphaera abbreviata Peck attack was reported in both experimental fields. A larger mean attack degree and share of attacked oak trees were found in the experimental forest located in Maramureș County, compared to the reports from the experimental oak forest located in Cluj County. The results of our research emphasized the interrelationships between the considered environmental parameters and the Microsphaera abbreviata Peck attack degree on oak trees. The quantification of these relationships showed stronger values in the experimental field located in Cluj County, compared to the experimental field located in Maramureș County. Key words: air relative humidity, Erysiphe abbreviata Peck, statistics, temperature, wind velocity. INTRODUCTION Forest productivity continues to remain a highly appreciated whish for all those concerned. In this context, the threats of forest pests and pathogens, together with those brought by climatic changes, constitutes a broad range of subjects to be investigated (Bontemps and Bouriaud, 2014; Lindner et al., 2010; Sturrock et al., 2011). Even though climate may be defined as a statistical picture of the evolutions of temperature, wind, air relative humidity, precipitations, etc. over a typically 30 years period (Pachauri and Reisinger, 2007), it has become a common place to express the evolutions of different pathogens and mites virulence in terms of temperature, wind, air relative humidity, etc., considered as climatic traits for a shorter period of time. Because common oak (Quercus robur L.) provides not only beautiful landscapes but also wood for different lucrative aims and feeding for mammals and birds thate at the acorn, special concern is focused on the health status of the oak forests.
The occurrence of the powdery mildew infections is one of the concerns regarding the health status of the oak forests not only worldwide but also in Romania (Copolovici et al., 2014; Man et al., 2012; Marçais and Desprez – Loustau, 2014). The disease has become more effective when abiotic stressors such as high temperature, increased relative humidity and poor air circulation characterize the concerned environment.The disease may be easily identified because of its distinctive traits (white powdery patches) on oak leaves, shoots, stems, buds, or flowers (Dillan et al., 2017). Research shows that oak is the host of a high diversity of powdery mildew pathogens caused by Erysiphe spp. In Romania, the disease is considered to be caused by Microsphaera abbreviata Peck sin. Erysiphe abbreviata Peck (Braun et al., 2007; Dillan et al., 2017; Rossman and Palm – Hernández, 2008). Our research was developed in order to test the Microsphaera abbreviata Peck attack upon common oak (Quercus robur L.) under the influence of temperature, air relative humidity,
The emission of green leaf volatiles increases with the intensity of stress (a lower value of pH) while total monoterpenes are not affected by stress strength. Microscopic evidence shows that there are a number of cells in areas where acidic rain drops have fall even with pH 5. ACKNOWLEDGEMENTS Funding for this study has been provided by The European Commission and The Romanian Government (project POSCCE 621/2014). REFERENCES Baldwin I.T., Halitschke R., Paschold A., von Dahl C.C.,
Preston C.A., 2006. Volatile signaling in plant-plant interactions: "Talking trees" in the genomics era. Science 311: p. 812-815.
Burton A.W., Aherne J., 2012. Changes in the Chemistry of Small Irish lakes. Ambio 41: p. 170-179.
Copolovici L., Niinemets U., 2010. Flooding induced emissions of volatile signalling compounds in three tree species with differing waterlogging tolerance. Plant Cell and Environment 33: p. 1582-1594.
Copolovici L., Niinemets Ü., 2016. Environmental impacts on plant volatile emission, in: Blande, J.D., Glinwood, R. (Eds.), Deciphering chemical language of plant communication. Springer, New York.
Duan L., Ma X., Larssen T., Mulder J., Hao J., 2011. Response of surface water acidification in upper Yangtze River to SO2 emissions abatement in China. Environmental Science & Technology 45: p. 3275-3281.
Green M.B., Bailey A.S., Bailey S.W., Battles J.J., Campbell J.L., Driscoll C.T., Fahey T.J., Lepine L.C., Likens G.E., Ollinger S.V., Schaberg P.G., 2013. Decreased water flowing from a forest amended with calcium silicate. Proceedings of the National Academy of Sciences of the United States of America 110: p. 5999-6003.
Kannaste A., Copolovici L., Niinemets U., 2014. Gas Chromatography-Mass Spectrometry method for determination of biogenic volatile organic compounds emitted by plants. Plant Isoprenoids: Methods and Protocols, p. 161-169.
Lajtha K., Jones J., 2013. Trends in cation, nitrogen, sulfate and hydrogen ion concentrations in precipitation in the United States and Europe from 1978 to 2010: a new look at an old problem. Biogeochemistry 116: p. 303-334.
Lu S.C., 2007. Acid rain monitoring and assessment of acidic deposition in Taiwan. Taiwan Environmental Protection Agency.
Matsui K., 2006. Green leaf volatiles: hydroperoxide lyase pathway of oxylipin metabolism. Current Opinion in Plant Biology 9: p. 274-280.
Medeiros J.S., Tomeo N.J., Hewins C.R., Rosenthal, D.M., 2016. Fast-growing Acer rubrum differs from slow-growing Quercus alba in leaf, xylem and hydraulic trait coordination responses to simulated acid rain. Tree Physiol. 36: p. 1032-1044.
Mochizuki T., Watanabe M., Koike T., Tani A., 2017. Monoterpene emissions from needles of hybrid larch F1 (Larix gmelinii var. japonica x Larix kaempferi) grown under elevated carbon dioxide and ozone. Atmos. Environ. 148: p. 197-202.
Niinemets Ü., Copolovici L., Hüve K., 2010. High within-canopy variation in isoprene emission potentials in temperate trees: implications for predicting canopy-scale isoprene fluxes. Journal of Geophysical Research - Biogeosciences 115:G04029.
Oguntimehin I., Eissa F., Sakugawa H., 2010. Simultaneous ozone fumigation and fluoranthene sprayed as mists negatively affected cherry tomato (Lycopersicon esculentum Mill). Ecotoxicology and Environmental Safety 73: p. 1028-1033.
Reid C., Watmough S.A., 2014. Evaluating the effects of liming and wood-ash treatment on forest ecosystems through systematic meta-analysis. Canadian Journal of Forest Research-Revue Canadienne De Recherche Forestiere 44: p. 867-885.
Rodhe H., Dentener F., Schulz M., 2002. The global distribution of acidifying wet deposition. Environmental Science & Technology 36: p. 4382-4388.
Velikova V., Yordanov I., Edreva A., 2000. Oxidative stress and some antioxidant systems in acid rain-treated bean plants - Protective role of exogenous polyamines. Plant Science 151: p. 59-66.
Yuan X., Calatayud V., Gao F., Fares S., Paoletti E., Tian Y., Feng Z., 2016. Interaction of drought and ozone exposure on isoprene emission from extensively cultivated poplar. Plant Cell and Environment 39: p. 2276-2287.

77
INFLUENCE OF SOME CLIMATIC FACTORS UPON POWDERY MILDEW
ATTACK IN OAK FORESTS LOCATED IN TRANSYLVANIA
Ilie COVRIG, Camelia OROIAN, Petru BURDUHOS, Ioan OROIAN, Antonia ODAGIU
University of Agricultural Sciences and Veterinary Medicine Cluj-Napoca,
3-5 Calea Mănăștur, 400372 Cluj-Napoca, Romania
Corresponding author email: [email protected]
Abstract The threats of diseases against forests, together with climatic factors, are of highest concern worldwide. In common oak, powdery mildew is one of the most harmful diseases. In Romania, it is considered to be produced by Microsphaera abbreviata Peck sin. Erysiphe abbreviata Peck. In our trial, we aimed to test the influence of temperature, air relative humidity, and wind velocity characteristic for two areas in Cluj and Maramureș Counties; we tested their influence on the Microsphaera abbreviata Peck attack upon common oak and we quantified the relationships identified between the mentioned climatic factors and the Microsphaera abbreviata Peck attack degree between May 15thand June 14th 2016.Within that period, the Microsphaera abbreviata Peck attack was reported in both experimental fields. A larger mean attack degree and share of attacked oak trees were found in the experimental forest located in Maramureș County, compared to the reports from the experimental oak forest located in Cluj County. The results of our research emphasized the interrelationships between the considered environmental parameters and the Microsphaera abbreviata Peck attack degree on oak trees. The quantification of these relationships showed stronger values in the experimental field located in Cluj County, compared to the experimental field located in Maramureș County. Key words: air relative humidity, Erysiphe abbreviata Peck, statistics, temperature, wind velocity. INTRODUCTION Forest productivity continues to remain a highly appreciated whish for all those concerned. In this context, the threats of forest pests and pathogens, together with those brought by climatic changes, constitutes a broad range of subjects to be investigated (Bontemps and Bouriaud, 2014; Lindner et al., 2010; Sturrock et al., 2011). Even though climate may be defined as a statistical picture of the evolutions of temperature, wind, air relative humidity, precipitations, etc. over a typically 30 years period (Pachauri and Reisinger, 2007), it has become a common place to express the evolutions of different pathogens and mites virulence in terms of temperature, wind, air relative humidity, etc., considered as climatic traits for a shorter period of time. Because common oak (Quercus robur L.) provides not only beautiful landscapes but also wood for different lucrative aims and feeding for mammals and birds thate at the acorn, special concern is focused on the health status of the oak forests.
The occurrence of the powdery mildew infections is one of the concerns regarding the health status of the oak forests not only worldwide but also in Romania (Copolovici et al., 2014; Man et al., 2012; Marçais and Desprez – Loustau, 2014). The disease has become more effective when abiotic stressors such as high temperature, increased relative humidity and poor air circulation characterize the concerned environment.The disease may be easily identified because of its distinctive traits (white powdery patches) on oak leaves, shoots, stems, buds, or flowers (Dillan et al., 2017). Research shows that oak is the host of a high diversity of powdery mildew pathogens caused by Erysiphe spp. In Romania, the disease is considered to be caused by Microsphaera abbreviata Peck sin. Erysiphe abbreviata Peck (Braun et al., 2007; Dillan et al., 2017; Rossman and Palm – Hernández, 2008). Our research was developed in order to test the Microsphaera abbreviata Peck attack upon common oak (Quercus robur L.) under the influence of temperature, air relative humidity,
The emission of green leaf volatiles increases with the intensity of stress (a lower value of pH) while total monoterpenes are not affected by stress strength. Microscopic evidence shows that there are a number of cells in areas where acidic rain drops have fall even with pH 5. ACKNOWLEDGEMENTS Funding for this study has been provided by The European Commission and The Romanian Government (project POSCCE 621/2014). REFERENCES Baldwin I.T., Halitschke R., Paschold A., von Dahl C.C.,
Preston C.A., 2006. Volatile signaling in plant-plant interactions: "Talking trees" in the genomics era. Science 311: p. 812-815.
Burton A.W., Aherne J., 2012. Changes in the Chemistry of Small Irish lakes. Ambio 41: p. 170-179.
Copolovici L., Niinemets U., 2010. Flooding induced emissions of volatile signalling compounds in three tree species with differing waterlogging tolerance. Plant Cell and Environment 33: p. 1582-1594.
Copolovici L., Niinemets Ü., 2016. Environmental impacts on plant volatile emission, in: Blande, J.D., Glinwood, R. (Eds.), Deciphering chemical language of plant communication. Springer, New York.
Duan L., Ma X., Larssen T., Mulder J., Hao J., 2011. Response of surface water acidification in upper Yangtze River to SO2 emissions abatement in China. Environmental Science & Technology 45: p. 3275-3281.
Green M.B., Bailey A.S., Bailey S.W., Battles J.J., Campbell J.L., Driscoll C.T., Fahey T.J., Lepine L.C., Likens G.E., Ollinger S.V., Schaberg P.G., 2013. Decreased water flowing from a forest amended with calcium silicate. Proceedings of the National Academy of Sciences of the United States of America 110: p. 5999-6003.
Kannaste A., Copolovici L., Niinemets U., 2014. Gas Chromatography-Mass Spectrometry method for determination of biogenic volatile organic compounds emitted by plants. Plant Isoprenoids: Methods and Protocols, p. 161-169.
Lajtha K., Jones J., 2013. Trends in cation, nitrogen, sulfate and hydrogen ion concentrations in precipitation in the United States and Europe from 1978 to 2010: a new look at an old problem. Biogeochemistry 116: p. 303-334.
Lu S.C., 2007. Acid rain monitoring and assessment of acidic deposition in Taiwan. Taiwan Environmental Protection Agency.
Matsui K., 2006. Green leaf volatiles: hydroperoxide lyase pathway of oxylipin metabolism. Current Opinion in Plant Biology 9: p. 274-280.
Medeiros J.S., Tomeo N.J., Hewins C.R., Rosenthal, D.M., 2016. Fast-growing Acer rubrum differs from slow-growing Quercus alba in leaf, xylem and hydraulic trait coordination responses to simulated acid rain. Tree Physiol. 36: p. 1032-1044.
Mochizuki T., Watanabe M., Koike T., Tani A., 2017. Monoterpene emissions from needles of hybrid larch F1 (Larix gmelinii var. japonica x Larix kaempferi) grown under elevated carbon dioxide and ozone. Atmos. Environ. 148: p. 197-202.
Niinemets Ü., Copolovici L., Hüve K., 2010. High within-canopy variation in isoprene emission potentials in temperate trees: implications for predicting canopy-scale isoprene fluxes. Journal of Geophysical Research - Biogeosciences 115:G04029.
Oguntimehin I., Eissa F., Sakugawa H., 2010. Simultaneous ozone fumigation and fluoranthene sprayed as mists negatively affected cherry tomato (Lycopersicon esculentum Mill). Ecotoxicology and Environmental Safety 73: p. 1028-1033.
Reid C., Watmough S.A., 2014. Evaluating the effects of liming and wood-ash treatment on forest ecosystems through systematic meta-analysis. Canadian Journal of Forest Research-Revue Canadienne De Recherche Forestiere 44: p. 867-885.
Rodhe H., Dentener F., Schulz M., 2002. The global distribution of acidifying wet deposition. Environmental Science & Technology 36: p. 4382-4388.
Velikova V., Yordanov I., Edreva A., 2000. Oxidative stress and some antioxidant systems in acid rain-treated bean plants - Protective role of exogenous polyamines. Plant Science 151: p. 59-66.
Yuan X., Calatayud V., Gao F., Fares S., Paoletti E., Tian Y., Feng Z., 2016. Interaction of drought and ozone exposure on isoprene emission from extensively cultivated poplar. Plant Cell and Environment 39: p. 2276-2287.
AgroLife Scientific Journal - Volume 6, Number 2, 2017ISSN 2285-5718; ISSN CD-ROM 2285-5726; ISSN ONLINE 2286-0126; ISSN-L 2285-5718

78
and wind velocity characteristic for two Transylvanian areas located in Cluj and Maramureș Counties. In the meantime, we conducted our trial with the aim of quantify the relationships identified between temperature, air relative humidity, wind velocity, and the Microsphaera abbreviata Peck attack degree. MATERIALS AND METHODS The study area Research was conducted in two counties of the Romanian region Transylvania, Cluj and Maramureș, respectively, for one month period, between May 15thand June 14th, 2016. The oak forests with trees aged of 30 years, were monitored in both experimental areas. They were located in Production Unity II, arrangement unit 5A (46° 46’ N, and 23° 35’ E), Cluj County, and in Production Unity IV, arrangement unit 34 (47° 30’ N, and 23° 28’ E), Maramureș County. Biological material Our study focuses on the common oak (Quercus robur L.). 50 oak trees were randomly selected from each experimental area located in the forests of Cluj and Maramureș Counties in order to study the attack of Microsphaera abbreviata Peck that causes the powdery mildew disease. Methodology Circular sample areas were considered in order to collect raw data on the Microsphaera abbreviate Peck attack degrees, and the number of concerned trees (Methodology for Monitoring Soil – Forestry Vegetation for Forestry, 2002). We developed the observational study of the attack intensity and frequency two times by week, and we calculated the attack degree (Oroian, 2008). The climatic factors taken into study in this research, i.e. temperature, air relative humidity, and wind velocity, were automatically recorded with mobile monitoring stations WG – GP1 type, from Delta-T Devices Ltd. UK. One station was placed in each experimental field, and the data were collected at three days’ intervals. Statistical analysis STATISTICA v.8.0 for Windows was the software package used for data processing. The descriptive statistics option was implemented in
order to calculate the basic statistical parameters for temperature, air relative humidity, wind velocity, and Microsphaera abbreviata Peck attack degrees - means, standard errors of means, standard deviations and coefficients of variation, respectively. The significance of differences between the above mentioned parameters reported in the experimental areas was tested by using the “t” test (Student test) at a confidence interval of 95%. The distributions of Microsphaera abbreviata Peck attack degrees in the experimental areas were revealed by using the Box-plot diagrams. The response area graphic representations and multiple regression options were selected in order to emphasize the interrelationships between environmental temperature, air relative humidity and wind velocity on one hand, and the Microsphaera abbreviata Peck attack degrees on the other hand. RESULTS AND DISCUSSIONS During the experimental period (May 15th – June 14th 2016), in theforests located in Cluj County,the descriptive statistics emphasized a mean temperature of 16.03°C, mean air relative humidity of 68.84%, and mean wind velocity of 7.74 m/s, while during the same period, in the experimental areal located in Maramureș County, the concerned climatic parameters reached the following means: temperature – 16.84°C, relative air humidity - 69.32%, and wind velocity – 7.16 m/s (Table 1). In both the experimental areas, the dispersion parameters emphasized a normal distribution of data. In terms of temperature and air relative humidity, the values of the variability (CV%) suggested good data homogeneity and representativeness of the means. Concerning wind velocity, even though the values of variability (23.34% for the experimental areal located in the Cluj County, and 29.53 % for the experimental areal located in the Maramureș County) emphasized only a moderate data homogeneity, the means were representative (Table 1). The increase of powdery mildew incidence in the studied trees, with an increase of mean in the environmental temperature, which was over 16°C, was an observation consistent with data
from literature (Desprez-Lousteau et al., 2016 a; Desprez-Lousteau et al., 2016 b). Even though all analyzed climatic parameters differed from one region to another, the differences were not statistically assured at the significance threshold of 5% (Table 1). The powdery Microsphaera abbreviata Pecksin. Erysiphe abbreviata Peck, expressed by the entire experimental period in the monitored
area, was more effective in the oak experimental field located in the forest of Maramureș County, where 14 trees (28%) of the total of 50 monitored were attacked, compared to the oak experimental field located in the forest monitored in Cluj County. Thus, in the latter, there were only 11 attacked trees, i.e. 22% of the total of 50 monitored (Figure 1).
Table 1. Descriptive statistics for some climatic factors affecting Microsphaera abbreviata Peck attack on oak forests located in Cluj and Maramureș Counties May 15th – June 14th, 2016
Issue Cluj County Maramureș County p
(t, °C) p
(H, %)
p (Vwind m/s) t, °C H, % vwind m/s t, °C H, % vwind m/s
N 31 31 31 31 31 31
0.691
0.254
0.393
16.03ns 68.84ns 7.74 ns 16.84 69.32 7.16 0.49 1.85 0.32 0.53 2.28 0.38
s 2.73 10.30 1.81 2.93 12.71 2.11 Min. 10.00 53.00 5.00 10.00 49.00 5.00 Max. 20.00 92.00 13.00 21.00 97.00 13.00 CV% 17.00 14.96 23.34 17.42 18.34 29.53
T – temperature, H – air relative humidity; vwind – wind velocity. N – number of cases; mean; s – standard deviation; – standard error of mean; CV% – coefficient of variation; Min. – minimum value; Max. – maximum value; p – probability; ns – p > 0.05.
Figure 1. Share of the oak trees attacked by Microsphaera abbreviata L. in forests located in Cluj and Maramureș Counties, May 15th – June 14th, 2016
The mean value of 31.6% was reported for the Microsphaera abbreviata Peck mean attack degree in the experimental field located in the Cluj County, and 33.86% in the experimental field located in Maramureș County, but the differences between these attack degrees were not statistically assured at the significance threshold of 5% (Figure 2).
We also noted that larger dispersion and variability (CV = 22.96%) were reported in the experimental field located in Cluj County, compared to the experimental field located in Maramureș County where smaller dispersion and variability (CV = 13.76%) were emphasized (Figure 2).
50 50
[VALUE] (22%) [VALUE] (28%)
05
10152025303540455055606570
County of Cluj County of Maramureș
AD
, %
Location Total trees Attacked trees
[VVVVVVVVVVV[V[V[VVVVVV[VVVV[V[VVV[V[V[VVVVVV[VVVVVVVVVV[VVVVVVVVVVV[VVV[V[V[VV[VVVVVVVVV[VV[VV[V[V[[VVVV[[[[[[VVVVV[VVVVVVV[VVV
County of
[V[[V[V[VVV[V[V[V[V[V[V[[V[V[V[V[[[V[[V[VV[VV[V[[VV[VVVVVV[V[V[V[V[VV[VVV[[V[VV[VVV[V[V[[V[V[[VV[V[V[V[VVV[VVVV[[VV[V[V[[VVVV[VVVV[[[[[V[VVVVV[V[VVV[[VV[[VVVVVV
CoCoCCoCoooCoCoooCoCoCCooCCCooCooCoooCoCCoCCoooCoCoCooCoCoCoCCoCCoCoCCCCoCooCooCoouuuuuunuuuuuuuuuuuuuuuuuuuuuuuuuuuuuuuuuuuuuu ty of Mara

79
and wind velocity characteristic for two Transylvanian areas located in Cluj and Maramureș Counties. In the meantime, we conducted our trial with the aim of quantify the relationships identified between temperature, air relative humidity, wind velocity, and the Microsphaera abbreviata Peck attack degree. MATERIALS AND METHODS The study area Research was conducted in two counties of the Romanian region Transylvania, Cluj and Maramureș, respectively, for one month period, between May 15thand June 14th, 2016. The oak forests with trees aged of 30 years, were monitored in both experimental areas. They were located in Production Unity II, arrangement unit 5A (46° 46’ N, and 23° 35’ E), Cluj County, and in Production Unity IV, arrangement unit 34 (47° 30’ N, and 23° 28’ E), Maramureș County. Biological material Our study focuses on the common oak (Quercus robur L.). 50 oak trees were randomly selected from each experimental area located in the forests of Cluj and Maramureș Counties in order to study the attack of Microsphaera abbreviata Peck that causes the powdery mildew disease. Methodology Circular sample areas were considered in order to collect raw data on the Microsphaera abbreviate Peck attack degrees, and the number of concerned trees (Methodology for Monitoring Soil – Forestry Vegetation for Forestry, 2002). We developed the observational study of the attack intensity and frequency two times by week, and we calculated the attack degree (Oroian, 2008). The climatic factors taken into study in this research, i.e. temperature, air relative humidity, and wind velocity, were automatically recorded with mobile monitoring stations WG – GP1 type, from Delta-T Devices Ltd. UK. One station was placed in each experimental field, and the data were collected at three days’ intervals. Statistical analysis STATISTICA v.8.0 for Windows was the software package used for data processing. The descriptive statistics option was implemented in
order to calculate the basic statistical parameters for temperature, air relative humidity, wind velocity, and Microsphaera abbreviata Peck attack degrees - means, standard errors of means, standard deviations and coefficients of variation, respectively. The significance of differences between the above mentioned parameters reported in the experimental areas was tested by using the “t” test (Student test) at a confidence interval of 95%. The distributions of Microsphaera abbreviata Peck attack degrees in the experimental areas were revealed by using the Box-plot diagrams. The response area graphic representations and multiple regression options were selected in order to emphasize the interrelationships between environmental temperature, air relative humidity and wind velocity on one hand, and the Microsphaera abbreviata Peck attack degrees on the other hand. RESULTS AND DISCUSSIONS During the experimental period (May 15th – June 14th 2016), in theforests located in Cluj County,the descriptive statistics emphasized a mean temperature of 16.03°C, mean air relative humidity of 68.84%, and mean wind velocity of 7.74 m/s, while during the same period, in the experimental areal located in Maramureș County, the concerned climatic parameters reached the following means: temperature – 16.84°C, relative air humidity - 69.32%, and wind velocity – 7.16 m/s (Table 1). In both the experimental areas, the dispersion parameters emphasized a normal distribution of data. In terms of temperature and air relative humidity, the values of the variability (CV%) suggested good data homogeneity and representativeness of the means. Concerning wind velocity, even though the values of variability (23.34% for the experimental areal located in the Cluj County, and 29.53 % for the experimental areal located in the Maramureș County) emphasized only a moderate data homogeneity, the means were representative (Table 1). The increase of powdery mildew incidence in the studied trees, with an increase of mean in the environmental temperature, which was over 16°C, was an observation consistent with data
from literature (Desprez-Lousteau et al., 2016 a; Desprez-Lousteau et al., 2016 b). Even though all analyzed climatic parameters differed from one region to another, the differences were not statistically assured at the significance threshold of 5% (Table 1). The powdery Microsphaera abbreviata Pecksin. Erysiphe abbreviata Peck, expressed by the entire experimental period in the monitored
area, was more effective in the oak experimental field located in the forest of Maramureș County, where 14 trees (28%) of the total of 50 monitored were attacked, compared to the oak experimental field located in the forest monitored in Cluj County. Thus, in the latter, there were only 11 attacked trees, i.e. 22% of the total of 50 monitored (Figure 1).
Table 1. Descriptive statistics for some climatic factors affecting Microsphaera abbreviata Peck attack on oak forests located in Cluj and Maramureș Counties May 15th – June 14th, 2016
Issue Cluj County Maramureș County p
(t, °C) p
(H, %)
p (Vwind m/s) t, °C H, % vwind m/s t, °C H, % vwind m/s
N 31 31 31 31 31 31
0.691
0.254
0.393
16.03ns 68.84ns 7.74 ns 16.84 69.32 7.16 0.49 1.85 0.32 0.53 2.28 0.38
s 2.73 10.30 1.81 2.93 12.71 2.11 Min. 10.00 53.00 5.00 10.00 49.00 5.00 Max. 20.00 92.00 13.00 21.00 97.00 13.00 CV% 17.00 14.96 23.34 17.42 18.34 29.53
T – temperature, H – air relative humidity; vwind – wind velocity. N – number of cases; mean; s – standard deviation; – standard error of mean; CV% – coefficient of variation; Min. – minimum value; Max. – maximum value; p – probability; ns – p > 0.05.
Figure 1. Share of the oak trees attacked by Microsphaera abbreviata L. in forests located in Cluj and Maramureș Counties, May 15th – June 14th, 2016
The mean value of 31.6% was reported for the Microsphaera abbreviata Peck mean attack degree in the experimental field located in the Cluj County, and 33.86% in the experimental field located in Maramureș County, but the differences between these attack degrees were not statistically assured at the significance threshold of 5% (Figure 2).
We also noted that larger dispersion and variability (CV = 22.96%) were reported in the experimental field located in Cluj County, compared to the experimental field located in Maramureș County where smaller dispersion and variability (CV = 13.76%) were emphasized (Figure 2).
50 50
[VALUE] (22%) [VALUE] (28%)
05
10152025303540455055606570
County of Cluj County of Maramureș
AD
, %
Location Total trees Attacked trees
[VVVVVVVVVVV[V[V[VVVVVV[VVVV[V[VVV[V[V[VVVVVV[VVVVVVVVVV[VVVVVVVVVVV[VVV[V[V[VV[VVVVVVVVV[VV[VV[V[V[[VVVV[[[[[[VVVVV[VVVVVVV[VVV
County of
[V[[V[V[VVV[V[V[V[V[V[V[[V[V[V[V[[[V[[V[VV[VV[V[[VV[VVVVVV[V[V[V[V[VV[VVV[[V[VV[VVV[V[V[[V[V[[VV[V[V[V[VVV[VVVV[[VV[V[V[[VVVV[VVVV[[[[[V[VVVVV[V[VVV[[VV[[VVVVVV
CoCoCCoCoooCoCoooCoCoCCooCCCooCooCoooCoCCoCCoooCoCoCooCoCoCoCCoCCoCoCCCCoCooCooCoouuuuuunuuuuuuuuuuuuuuuuuuuuuuuuuuuuuuuuuuuuuu ty of Mara
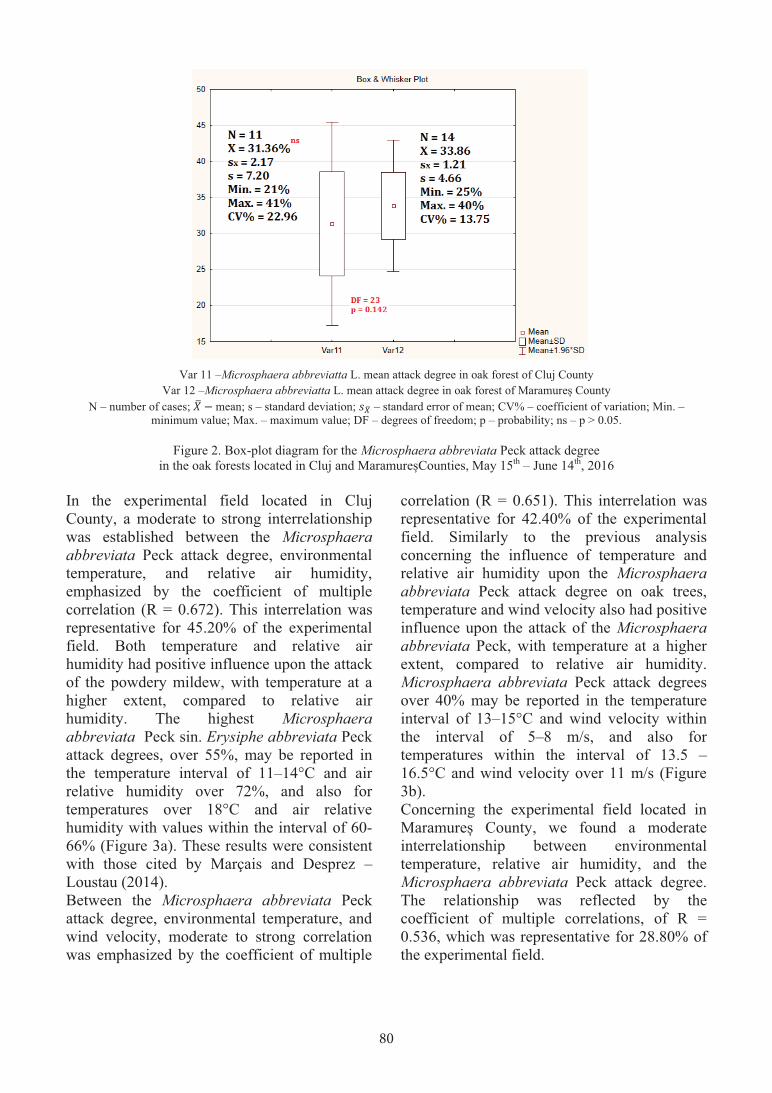
80
Var 11 –Microsphaera abbreviatta L. mean attack degree in oak forest of Cluj County
Var 12 –Microsphaera abbreviatta L. mean attack degree in oak forest of Maramureș County N – number of cases; mean; s – standard deviation; – standard error of mean; CV% – coefficient of variation; Min. –
minimum value; Max. – maximum value; DF – degrees of freedom; p – probability; ns – p > 0.05.
Figure 2. Box-plot diagram for the Microsphaera abbreviata Peck attack degree
in the oak forests located in Cluj and MaramureșCounties, May 15th – June 14th, 2016 In the experimental field located in Cluj County, a moderate to strong interrelationship was established between the Microsphaera abbreviata Peck attack degree, environmental temperature, and relative air humidity, emphasized by the coefficient of multiple correlation (R = 0.672). This interrelation was representative for 45.20% of the experimental field. Both temperature and relative air humidity had positive influence upon the attack of the powdery mildew, with temperature at a higher extent, compared to relative air humidity. The highest Microsphaera abbreviata Peck sin. Erysiphe abbreviata Peck attack degrees, over 55%, may be reported in the temperature interval of 11–14°C and air relative humidity over 72%, and also for temperatures over 18°C and air relative humidity with values within the interval of 60-66% (Figure 3a). These results were consistent with those cited by Marçais and Desprez – Loustau (2014). Between the Microsphaera abbreviata Peck attack degree, environmental temperature, and wind velocity, moderate to strong correlation was emphasized by the coefficient of multiple
correlation (R = 0.651). This interrelation was representative for 42.40% of the experimental field. Similarly to the previous analysis concerning the influence of temperature and relative air humidity upon the Microsphaera abbreviata Peck attack degree on oak trees, temperature and wind velocity also had positive influence upon the attack of the Microsphaera abbreviata Peck, with temperature at a higher extent, compared to relative air humidity. Microsphaera abbreviata Peck attack degrees over 40% may be reported in the temperature interval of 13–15°C and wind velocity within the interval of 5–8 m/s, and also for temperatures within the interval of 13.5 – 16.5°C and wind velocity over 11 m/s (Figure 3b). Concerning the experimental field located in Maramureș County, we found a moderate interrelationship between environmental temperature, relative air humidity, and the Microsphaera abbreviata Peck attack degree. The relationship was reflected by the coefficient of multiple correlations, of R = 0.536, which was representative for 28.80% of the experimental field.
AD(%) = 16.781 + 0.823 t (°C) +0.512 H (%)
R = 0.672; R2 = 0.452 AD(%) = 13.779 + 0.548 t (°C) +0.383 H (%)
R = 0.651; R2 = 0.424
Var 1 – temperature, °C; Var 2 – relative air humidity, %.
a – Cluj County Var 1 – temperature, °C; Var 3 – wind velocity, m/s.
b – Cluj County
AD(%) = 10.825 + 0.536 t (°C) +0.212 H (%) R = 0.536; R2 = 0.288
AD(%) = 19.259 + 0.480 t (°C) +0.332 H (%)
R = 0.488; R2 = 0.239
Var5 – temperature, °C; Var 6 – relative air humidity, %.
c – Maramureș County Var5 – temperature, °C; Var 7 – wind velocity, m/s.
d – Maramureș County
Figure 3. Response area plots emphasizing the relationships established between temperature, air relative humidity, wind velocity, and theMicrosphaera abbreviata Peck attack degrees in the oak forests
located in Cluj and Maramureș Counties, May 15th – June 14th, 2016 The influence of temperature and relative air humidity upon the Microsphaera abbreviata Peck attack was positive. Temperature had bigger contribution to powdery mildew attack degree, compared to relative air humidity. Highest Microsphaera abbreviata Peck attack degrees, over 55%, may be reported in the temperature interval of 8–12°C and air relative humidity within the interval of 54-58%, and also for temperatures within the interval of
14-16°C and air relative humidity with values over 81% (Figure 3c). The interrelationship between the Microsphaera abbreviata Peck attack degree in the experimental field locate din Maramureș County, environmental temperature, and wind velocity was moderate, being emphasized by the coefficient of multiple correlations, of R = 0.488, which had a representativeness of 23.90%. Temperature and wind velocity had positive influence upon the Microsphaera
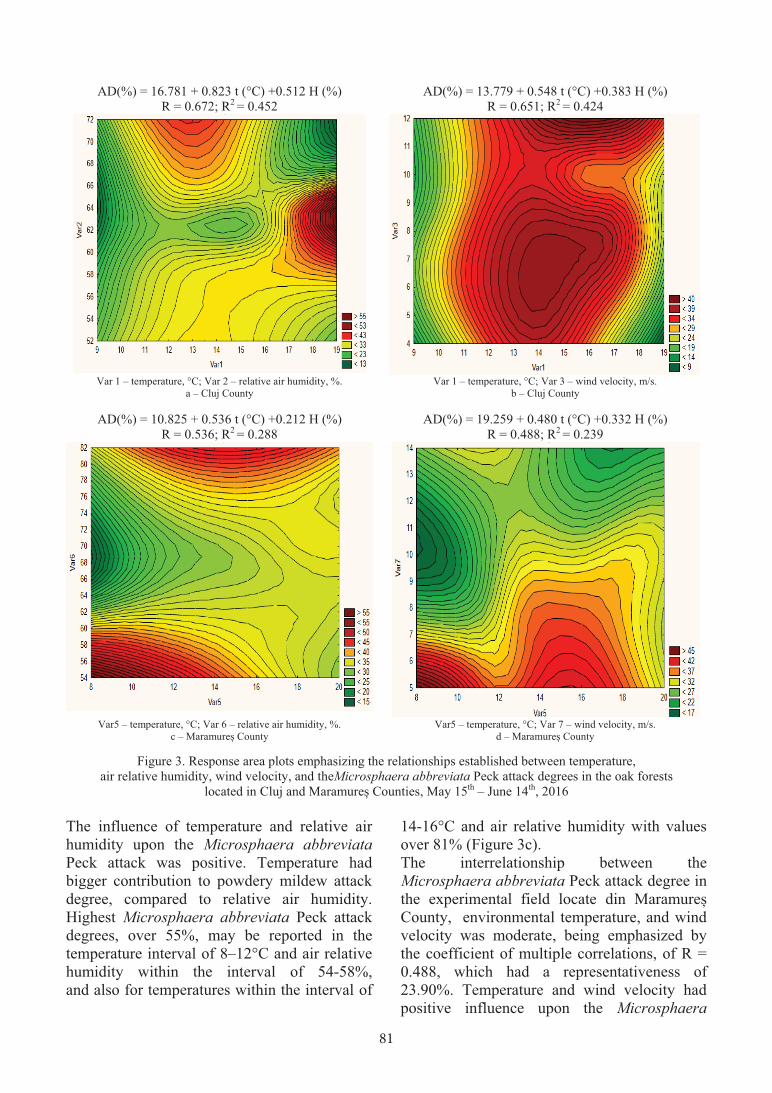
81
Var 11 –Microsphaera abbreviatta L. mean attack degree in oak forest of Cluj County
Var 12 –Microsphaera abbreviatta L. mean attack degree in oak forest of Maramureș County N – number of cases; mean; s – standard deviation; – standard error of mean; CV% – coefficient of variation; Min. –
minimum value; Max. – maximum value; DF – degrees of freedom; p – probability; ns – p > 0.05.
Figure 2. Box-plot diagram for the Microsphaera abbreviata Peck attack degree
in the oak forests located in Cluj and MaramureșCounties, May 15th – June 14th, 2016 In the experimental field located in Cluj County, a moderate to strong interrelationship was established between the Microsphaera abbreviata Peck attack degree, environmental temperature, and relative air humidity, emphasized by the coefficient of multiple correlation (R = 0.672). This interrelation was representative for 45.20% of the experimental field. Both temperature and relative air humidity had positive influence upon the attack of the powdery mildew, with temperature at a higher extent, compared to relative air humidity. The highest Microsphaera abbreviata Peck sin. Erysiphe abbreviata Peck attack degrees, over 55%, may be reported in the temperature interval of 11–14°C and air relative humidity over 72%, and also for temperatures over 18°C and air relative humidity with values within the interval of 60-66% (Figure 3a). These results were consistent with those cited by Marçais and Desprez – Loustau (2014). Between the Microsphaera abbreviata Peck attack degree, environmental temperature, and wind velocity, moderate to strong correlation was emphasized by the coefficient of multiple
correlation (R = 0.651). This interrelation was representative for 42.40% of the experimental field. Similarly to the previous analysis concerning the influence of temperature and relative air humidity upon the Microsphaera abbreviata Peck attack degree on oak trees, temperature and wind velocity also had positive influence upon the attack of the Microsphaera abbreviata Peck, with temperature at a higher extent, compared to relative air humidity. Microsphaera abbreviata Peck attack degrees over 40% may be reported in the temperature interval of 13–15°C and wind velocity within the interval of 5–8 m/s, and also for temperatures within the interval of 13.5 – 16.5°C and wind velocity over 11 m/s (Figure 3b). Concerning the experimental field located in Maramureș County, we found a moderate interrelationship between environmental temperature, relative air humidity, and the Microsphaera abbreviata Peck attack degree. The relationship was reflected by the coefficient of multiple correlations, of R = 0.536, which was representative for 28.80% of the experimental field.
AD(%) = 16.781 + 0.823 t (°C) +0.512 H (%)
R = 0.672; R2 = 0.452 AD(%) = 13.779 + 0.548 t (°C) +0.383 H (%)
R = 0.651; R2 = 0.424
Var 1 – temperature, °C; Var 2 – relative air humidity, %.
a – Cluj County Var 1 – temperature, °C; Var 3 – wind velocity, m/s.
b – Cluj County
AD(%) = 10.825 + 0.536 t (°C) +0.212 H (%) R = 0.536; R2 = 0.288
AD(%) = 19.259 + 0.480 t (°C) +0.332 H (%)
R = 0.488; R2 = 0.239
Var5 – temperature, °C; Var 6 – relative air humidity, %.
c – Maramureș County Var5 – temperature, °C; Var 7 – wind velocity, m/s.
d – Maramureș County
Figure 3. Response area plots emphasizing the relationships established between temperature, air relative humidity, wind velocity, and theMicrosphaera abbreviata Peck attack degrees in the oak forests
located in Cluj and Maramureș Counties, May 15th – June 14th, 2016 The influence of temperature and relative air humidity upon the Microsphaera abbreviata Peck attack was positive. Temperature had bigger contribution to powdery mildew attack degree, compared to relative air humidity. Highest Microsphaera abbreviata Peck attack degrees, over 55%, may be reported in the temperature interval of 8–12°C and air relative humidity within the interval of 54-58%, and also for temperatures within the interval of
14-16°C and air relative humidity with values over 81% (Figure 3c). The interrelationship between the Microsphaera abbreviata Peck attack degree in the experimental field locate din Maramureș County, environmental temperature, and wind velocity was moderate, being emphasized by the coefficient of multiple correlations, of R = 0.488, which had a representativeness of 23.90%. Temperature and wind velocity had positive influence upon the Microsphaera

82
THE INFLUENCE OF Rhizobium INOCULATION
AND NITROGEN/MOLYBDENUM FERTILIZATION ON THE GROWTH CHARACTERISTICS OF RED CLOVER
Niculae DINCĂ1, Daniel DUNEA2
1University of Agronomic Sciences and Veterinary Medicine of Bucharest, 59 Marasti Blvd.,
District 1, 011464, Bucharest, Romania 2Valahia University of Targoviste, Campus, Aleea Sinaia no.13, RO-130004, Targoviste, Romania
Corresponding author email: [email protected]
Abstract This paper presents the individual and combined effects of inoculation and nitrogen (N)/molybdenum (Mo) fertilization (8 treatments) on the biological efficiency of red clover in controlled conditions. The rationale of the study was to establish the influence of Mo on the biological efficiency of red clover in the presence or the absence of N fertilization and inoculation of Rhizobium leguminosarum biovar. trifolii, and whether the results can lead to the improvement of classical crop technologies and the fertilization plan for obtaining superior forage yields. The effects of the treatments were evaluated using 5 replicatesbased on the average height, the dry weight, the density and the number of nodules on the roots of the red clover plants. Diploid cultivar Violettawas seeded in vegetation pots with the same amount of seeds and maintained 60 days in controlled conditions of a growth chamber. In the inoculation variants (5-8), the seeds were bacterized with R. trifolii-treated strains using the Nitragin® product (B type) using 7.5 g Nitragin/kg clover seed, dissolved in about 25 mL cold water. After pre-homogenization of the seed in the resulting solution, it was sown with the same quantity in all the repetitions of the variants. The bacterial solution contains at least 100 million viable cells g-1 of R. trifolii. Nitric fertilization was done with ammonium nitrate (34.5% N) supplied prior to sowing in an equivalent dose of 100 kg N ha-1. Molybdenum (0.02 Mo) was supplied using a uniform foliar spraying with three applications. Descending ranking and multiple comparisons (Duncan test) of treatments were performed. The seed inoculation, without nitrogen fertilization provided relatively equivalent biomass yieldsto fertilized variants. Foliar fertilization with molybdenum did not determine higher dry weight amounts, but when combined with nitrogen established significant amounts of dry matter per plant. From the yield formation point of view, the variants in which a large number of nodules were formed did not correlate positively with dry matter accumulation; however, they can have a particular importance in improving the reserves of assimilable nitrogen available in the soil. Key words: red clover, inoculation, molybdenum fertilization, morphological traits, controlled conditions. INTRODUCTION Red clover (Trifolium pratense L.) is one of the most valuable forage species from temperate regions providing benefits to the soil improving characteristics. It is well known that the symbiosis of red clover and various Rhizobium strains produces large quantities of nitrogen (N) in soil (Bărbulescu et al., 1991). The approximated amount of fixed N varied between 76 and 389 kg ha-1 in the various locations at global level (Taylor and Quesenberry, 1996). Detailed discussions regarding the Rhizobium relationships in red clover can be found in Burton (1985) and Taylor and Quesenberry (1996). Experimental research has shown that the formation of root nodules and the symbiotic
activity of molecular N fixation are negatively influenced when N is available in large quantities for leguminous plants (Streeter, 1988; Motcă et al., 1994; Dunea, 2006). Experiences in controlled environments have pointed out that N reduces both the biomass of nodules on the plant and N fixation rates in relation with plant biomass or its roots (Boller and Nosberger, 1987; Hellsten and Huss-Danell, 2001; Carlsson, 2005). In contrast to N fertilization, several researchers (Fedorova, 1984; Collins and Lang, 1985; Chalamet et al., 1987, cited by Taylor and Quesenberry, 1996) have reported the beneficial effect of molybdenum (Mo) on nitrogenase activity and the growth of forage yield. Mo is important in the metabolism of N in legumes. By ensuring Mo for the plant
abbreviata Peck. attack. According to the regression line (Figure 3d), compared to wind velocity, temperature contributed to a higher extent to the increase of the Microsphaera abbreviata Peck attack degree. The Microsphaera abbreviata Peck attack degrees over 45% may be reported in the temperature interval of 8–10°C and wind velocity within the interval of 5–6 m/s and also for temperatures within the interval of 15-16°C and wind velocity with values around 5 m/s (Figure 3d). CONCLUSIONS Within the experimental period, May 15th – June 14th 2016, the Microsphaera abbreviata Peck attack was reported in both experimental fields. Larger mean attack degree (33.86%), and larger share of attacked oak trees (28%) were found in the experimental oak forest located in Maramureș County, characterized by larger means of temperature (16.03°C) and air relative humidity (68.84%), but lower wind velocity (7.74 m/s), compared to reports from the experimental oak forest located in Cluj County, where the mean attack degree (31.36%), share of attacked oak trees (28%), mean temperature (16.03°C), and air relative humidity (68.84%) were smaller, while wind velocity (7.74 m/s) was larger. Our research provides evidence of the interrelationships between environmental temperature, air relative humidity and wind velocity upon the intensity and frequency of the Microsphaera abbreviata Peck attack on the oak trees from forests located in specific Transylvanian climatic conditions. Stronger relationships were emphasized in the experimental field located in Cluj County, characterized by lower mean temperature, air relative humidity, wind velocity, and Microsphaera abbreviata Peck attack degree, compared to the experimental field located in Maramureș County. Further research is neededto clarify these mechanisms which represent the basis of the influence of climatic factors upon the intensity and frequency of Microsphaera abbreviata Peck attack on oak trees.
REFERENCES Bontemps J.D., Bouriaud O., 2014. Predictive
approaches to forest site productivity: recent trends, challenges and future perspectives. Forestry, 87, p. 109–128.
Braun U., Shi A., Mmbaga M., Takamatsu S., Divarangkoon R., Chen P., 200. Erysiphe abbreviata on cherry bark oak - morphology, phylogeny, and taxonomy. Mycologia 99(5), p. 655-663.
Desprez-Loustau M.L., Robin C., Reynaud G., Déqué M., Badeau V., Piou D., Husson C., Marçais B., 2010. Simulating the effects of a climate change scenario on geographical range and activity of forest pathogenic fungi. In: Loustau D (ed) Response of temperate and Mediterranean forests to climate change: effects on carbon cycle, productivity and vulnerability. QUAE, Paris, p. 253–280.
Dillen M., Smit C., Buyse M., Höfte, De Clercq P., Verheyen K., 2017, Stronger diversity effects with increased environmental stress: A study of multitrophic interactions between oak, powdery mildew and ladybirds, PLoS ONE, 12(4), e0176104. https://doi.org/10.1371/journal.pone.0176104.
Copolovici L., Väärtnōu, Estrada M.P., Niinemets Ü., 2014. Oak powdery mildew (Erysiphe alphitoides) induced volatile emissions scale with the degree of infection in Querus robur. Tree Physiology, 34(12), p. 1399-1410.
Lindner M., Maroschek M., Netherer S., Kremer A., Barbati A., Garcia-Gonzalo J., 2010. Climate change impacts, adaptive capacity, and vulnerability of European forest ecosystems. Forest Ecology and Management, 259, p. 698–709.
Man S.R., Oroian I., Odagiu A., Man A., Brașovean I., 2012. Influence of Fertilization upon the Intensity of Microsphaera abbreviata Attack in Oak Nurseries. Bulletin of UASVM Agriculture, 60(2), p. 148-151.
Marçais B., Desprez – Loustau M.L., 2014. European oak powdery mildew: impact on trees, effects of environmental factors, and potential effects of climate change. Annals of Forest Science, 71, p. 633-642.
Oroian I., 2008. Plant Protection and environment. Todesco Publishing House, Cluj-Napoca [In Romanian].
Pachauri R.K., Reisinger A., 2007. Climate Change 2007: Synthesis Report. Contribution of Working Groups I, II and III to the Fourth Assessment Report of the Intergovernmental Panel on Climate Change. Geneva, Switzerland: IPCC.
Rossman A.Y., Palm-Hernández M.E., 2008. Systematics of Plant Pathogenic Fungi: Why It Matters. Plant Disease, 92(10), p. 1376-1386.
Sturrock R.N., Frankel S.J., Brown A.V., Hennon P.E., Kliejunas J.T., Lewis K.J., Worrall J.J., Woods A.J., 2011. Climate Change and forest diseases. Plant Pathology, 60, p. 133-149
***2002, Methodology for Monitoring Soil – Forestry Vegetation for Forestry, Romanian Official Gazette, no. 831 from November 19th 2002 [In Romanian].

83
THE INFLUENCE OF Rhizobium INOCULATION
AND NITROGEN/MOLYBDENUM FERTILIZATION ON THE GROWTH CHARACTERISTICS OF RED CLOVER
Niculae DINCĂ1, Daniel DUNEA2
1University of Agronomic Sciences and Veterinary Medicine of Bucharest, 59 Marasti Blvd.,
District 1, 011464, Bucharest, Romania 2Valahia University of Targoviste, Campus, Aleea Sinaia no.13, RO-130004, Targoviste, Romania
Corresponding author email: [email protected]
Abstract This paper presents the individual and combined effects of inoculation and nitrogen (N)/molybdenum (Mo) fertilization (8 treatments) on the biological efficiency of red clover in controlled conditions. The rationale of the study was to establish the influence of Mo on the biological efficiency of red clover in the presence or the absence of N fertilization and inoculation of Rhizobium leguminosarum biovar. trifolii, and whether the results can lead to the improvement of classical crop technologies and the fertilization plan for obtaining superior forage yields. The effects of the treatments were evaluated using 5 replicatesbased on the average height, the dry weight, the density and the number of nodules on the roots of the red clover plants. Diploid cultivar Violettawas seeded in vegetation pots with the same amount of seeds and maintained 60 days in controlled conditions of a growth chamber. In the inoculation variants (5-8), the seeds were bacterized with R. trifolii-treated strains using the Nitragin® product (B type) using 7.5 g Nitragin/kg clover seed, dissolved in about 25 mL cold water. After pre-homogenization of the seed in the resulting solution, it was sown with the same quantity in all the repetitions of the variants. The bacterial solution contains at least 100 million viable cells g-1 of R. trifolii. Nitric fertilization was done with ammonium nitrate (34.5% N) supplied prior to sowing in an equivalent dose of 100 kg N ha-1. Molybdenum (0.02 Mo) was supplied using a uniform foliar spraying with three applications. Descending ranking and multiple comparisons (Duncan test) of treatments were performed. The seed inoculation, without nitrogen fertilization provided relatively equivalent biomass yieldsto fertilized variants. Foliar fertilization with molybdenum did not determine higher dry weight amounts, but when combined with nitrogen established significant amounts of dry matter per plant. From the yield formation point of view, the variants in which a large number of nodules were formed did not correlate positively with dry matter accumulation; however, they can have a particular importance in improving the reserves of assimilable nitrogen available in the soil. Key words: red clover, inoculation, molybdenum fertilization, morphological traits, controlled conditions. INTRODUCTION Red clover (Trifolium pratense L.) is one of the most valuable forage species from temperate regions providing benefits to the soil improving characteristics. It is well known that the symbiosis of red clover and various Rhizobium strains produces large quantities of nitrogen (N) in soil (Bărbulescu et al., 1991). The approximated amount of fixed N varied between 76 and 389 kg ha-1 in the various locations at global level (Taylor and Quesenberry, 1996). Detailed discussions regarding the Rhizobium relationships in red clover can be found in Burton (1985) and Taylor and Quesenberry (1996). Experimental research has shown that the formation of root nodules and the symbiotic
activity of molecular N fixation are negatively influenced when N is available in large quantities for leguminous plants (Streeter, 1988; Motcă et al., 1994; Dunea, 2006). Experiences in controlled environments have pointed out that N reduces both the biomass of nodules on the plant and N fixation rates in relation with plant biomass or its roots (Boller and Nosberger, 1987; Hellsten and Huss-Danell, 2001; Carlsson, 2005). In contrast to N fertilization, several researchers (Fedorova, 1984; Collins and Lang, 1985; Chalamet et al., 1987, cited by Taylor and Quesenberry, 1996) have reported the beneficial effect of molybdenum (Mo) on nitrogenase activity and the growth of forage yield. Mo is important in the metabolism of N in legumes. By ensuring Mo for the plant
abbreviata Peck. attack. According to the regression line (Figure 3d), compared to wind velocity, temperature contributed to a higher extent to the increase of the Microsphaera abbreviata Peck attack degree. The Microsphaera abbreviata Peck attack degrees over 45% may be reported in the temperature interval of 8–10°C and wind velocity within the interval of 5–6 m/s and also for temperatures within the interval of 15-16°C and wind velocity with values around 5 m/s (Figure 3d). CONCLUSIONS Within the experimental period, May 15th – June 14th 2016, the Microsphaera abbreviata Peck attack was reported in both experimental fields. Larger mean attack degree (33.86%), and larger share of attacked oak trees (28%) were found in the experimental oak forest located in Maramureș County, characterized by larger means of temperature (16.03°C) and air relative humidity (68.84%), but lower wind velocity (7.74 m/s), compared to reports from the experimental oak forest located in Cluj County, where the mean attack degree (31.36%), share of attacked oak trees (28%), mean temperature (16.03°C), and air relative humidity (68.84%) were smaller, while wind velocity (7.74 m/s) was larger. Our research provides evidence of the interrelationships between environmental temperature, air relative humidity and wind velocity upon the intensity and frequency of the Microsphaera abbreviata Peck attack on the oak trees from forests located in specific Transylvanian climatic conditions. Stronger relationships were emphasized in the experimental field located in Cluj County, characterized by lower mean temperature, air relative humidity, wind velocity, and Microsphaera abbreviata Peck attack degree, compared to the experimental field located in Maramureș County. Further research is neededto clarify these mechanisms which represent the basis of the influence of climatic factors upon the intensity and frequency of Microsphaera abbreviata Peck attack on oak trees.
REFERENCES Bontemps J.D., Bouriaud O., 2014. Predictive
approaches to forest site productivity: recent trends, challenges and future perspectives. Forestry, 87, p. 109–128.
Braun U., Shi A., Mmbaga M., Takamatsu S., Divarangkoon R., Chen P., 200. Erysiphe abbreviata on cherry bark oak - morphology, phylogeny, and taxonomy. Mycologia 99(5), p. 655-663.
Desprez-Loustau M.L., Robin C., Reynaud G., Déqué M., Badeau V., Piou D., Husson C., Marçais B., 2010. Simulating the effects of a climate change scenario on geographical range and activity of forest pathogenic fungi. In: Loustau D (ed) Response of temperate and Mediterranean forests to climate change: effects on carbon cycle, productivity and vulnerability. QUAE, Paris, p. 253–280.
Dillen M., Smit C., Buyse M., Höfte, De Clercq P., Verheyen K., 2017, Stronger diversity effects with increased environmental stress: A study of multitrophic interactions between oak, powdery mildew and ladybirds, PLoS ONE, 12(4), e0176104. https://doi.org/10.1371/journal.pone.0176104.
Copolovici L., Väärtnōu, Estrada M.P., Niinemets Ü., 2014. Oak powdery mildew (Erysiphe alphitoides) induced volatile emissions scale with the degree of infection in Querus robur. Tree Physiology, 34(12), p. 1399-1410.
Lindner M., Maroschek M., Netherer S., Kremer A., Barbati A., Garcia-Gonzalo J., 2010. Climate change impacts, adaptive capacity, and vulnerability of European forest ecosystems. Forest Ecology and Management, 259, p. 698–709.
Man S.R., Oroian I., Odagiu A., Man A., Brașovean I., 2012. Influence of Fertilization upon the Intensity of Microsphaera abbreviata Attack in Oak Nurseries. Bulletin of UASVM Agriculture, 60(2), p. 148-151.
Marçais B., Desprez – Loustau M.L., 2014. European oak powdery mildew: impact on trees, effects of environmental factors, and potential effects of climate change. Annals of Forest Science, 71, p. 633-642.
Oroian I., 2008. Plant Protection and environment. Todesco Publishing House, Cluj-Napoca [In Romanian].
Pachauri R.K., Reisinger A., 2007. Climate Change 2007: Synthesis Report. Contribution of Working Groups I, II and III to the Fourth Assessment Report of the Intergovernmental Panel on Climate Change. Geneva, Switzerland: IPCC.
Rossman A.Y., Palm-Hernández M.E., 2008. Systematics of Plant Pathogenic Fungi: Why It Matters. Plant Disease, 92(10), p. 1376-1386.
Sturrock R.N., Frankel S.J., Brown A.V., Hennon P.E., Kliejunas J.T., Lewis K.J., Worrall J.J., Woods A.J., 2011. Climate Change and forest diseases. Plant Pathology, 60, p. 133-149
***2002, Methodology for Monitoring Soil – Forestry Vegetation for Forestry, Romanian Official Gazette, no. 831 from November 19th 2002 [In Romanian].
AgroLife Scientific Journal - Volume 6, Number 2, 2017ISSN 2285-5718; ISSN CD-ROM 2285-5726; ISSN ONLINE 2286-0126; ISSN-L 2285-5718

84
growth process is often disproportionate to plant requirements for this microelement. Of the essential microelements, except for copper (Cu), Mo is found in most plant tissues in very small quantities. To compensate for Mo deficiency and to ensure effective Mo enzyme activity, foliar fertilization with this mineral element is often recommended (Dunea and Dincă, 2014). The nitrogenase of the symbiotic bacteria enzyme is composed of two subunits, of which the MoFe protein is directly involved in the reduction of N2 to NH3 (Kaiser et al., 2005). In order to maintain the symbiotic activity in these species, the provision of Mo and iron (Fe) in bacteroids is a key regulatory component. The molybdates provided by the plant must cross the cell membranes of the node as well as the bacteroid membranes (external and internal) to reach the bacterial nitrogenous complex (Kaiser et al., 2005). The control mechanism of the molybdates transport in the nodules is mostly unknown. However, a positive correlation was found between the development of nodules and Mo availability (Anderson, 1956). The tendency of legumes to maintain a high concentration of Mo in the nodules was experimentally determined (Hewitt and Bolle-Jones, 1952). Mo partitioning was predominantly directed towards the nodules and reproductive organs compared to othertissues of the plant (Gurley and Giddens, 1969, Franco and Munns, 1981, Ishizuka 1982; Giller, 1991, cited by Kaiser et al., 2005). Nodules are believed to act as "substantial" reservoirs of Mo, but it is not known whether this is a consequence of the nitrogenase activity. Experiments on various species of legumes have shown that Mo fertilization substantially improves the symbiotic mechanism of molecular N fixation by forming larger nodules and increased nitrogenase activity (Kaiser et al., 2005). The rationale of the study was to establish the influence of Mo on the biological efficiency of red clover in the presence or the absence of N fertilization and inoculation of Rhizobium leguminosarum biovar trifolii, and whether the results can lead to the improvement of classical crop technologies and the fertilization plan for obtaining superior forage yields. In this regard,
some preliminary results were obtained in an experiment in which red clover plants were maintained for 60 days in agrowth chamber in order to determine the individual and combined effect of inoculation with Rhizobium trifolii, N and Mo fertilization on the morphological characteristics and the formation of nodulesin red clover. There is a growing interest in reducing the quantities of chemical fertilizers as inputs in cropping systems (Dunea et al., 2014). The use of seed inoculation with strains has become a preferred practice especially in organic farming. Nowadays, there are numerous commercial products e.g., Nitragin Gold pre-inoculant from Monsanto BioAg. The aim of the study was to determine the effect of applied treatments in controlled conditions on the following characteristics of red clover: average plant height, average plant weight, average plant density and number of nodules on roots. These variables have been considered as indicators of biological efficiency for yield formation. MATERIALS AND METHODS The experiments were carried out in controlled environment (Conviron plant growth chamber) using the Violetta diploid red clover cultivar. In order to assess the effects of treatments on the observed biological traits, the treatments were ranked in descending order, followed by the multiple comparison method i.e., the Duncan's multiple range test (DMRT). The testing of the biological response of the plants comprised 8 variants showed in Table 1. The sowing was carried out with the same amount of seed in 5 L vegetation pots filled with sterilized perlite using 5 replicates. To ensure the nutrients needed for plants after emergence, the same amount of mineral fertilizer NPK (5-15-15) was supplied in all variants. In the inoculation variants (5-8), the seeds were bacterized with R. trifolii-treated strains using the Nitragin® product (B type) using 7.5 g Nitragin/kg clover seed, dissolved in about 25 mL cold water. After pre-homogenization of the seed in the resulting solution, it was sown with the same quantity in all the repetitions of the variants.
The bacterial solution contains at least 100 million viable cells g-1 of R. trifolii. Nitric fertilization was done with ammonium nitrate (33.5% N) supplied prior to sowing in an equivalent dose of 100 kg N ha-1.
Table 1. Variants of the experiment with/without seed inoculation and fertilization with Nitrogen (N) and
Molybdenum (Mo) in Violetta diploid cultivar
Variants without Nitragin� treatment
Variants with Nitragin�treatment
1 - no Rhizobium inoculation; Fertilization
N + Mo
5 - Rhizobium inoculation; Fertilization
N + Mo 2 - no Rhizobium
inoculation; Fertilization Mo without N
6 - Rhizobium inoculation; Fertilization Mo without
N 3 - no Rhizobium
inoculation; Fertilization N without Mo
7 - Rhizobium inoculation; Fertilization N without
Mo 4 - no Rhizobium
inoculation; no fertilization 8 - Rhizobium inoculation;
no fertilization Molybdenum (0.02 Mo) was supplied in a single-dose using a uniform foliar sprayingwith three applications. Observations regarding the formation of nodules were performed after 6 weeks from plants’ emergence, by immersing the roots in water followed by the estimation of the number of formed nodules. Proper nodulation involves the existence of specific formations on the pivotal root and lateral ramifications. After cutting the nodules, the color was assessed visually appreciating the effectiveness of the inoculation: white-green: inefficient; pink-red: efficient. The aboveground part of the harvested plants was dried in the oven at 80° C for 24 hours to determine the accumulated aerial dry matter (DM). The dried material was weighed with a Sartorius precision electronic balance. The setup of the controlled conditions in the growth chamber was as follow: Light - the light intensity was pre-selected on the cyclic control system providing 1200 µmoles/m2/s by using PAR lamps; Temperature: +25° C ± 0.5°C in lights on period; Relative Humidity (RH): 85% on lights on ±5% RH. StatGraphics Plus program was used to perform the statistical analysis of the results. We used
the Duncan's multiple range test (DMRT), which is a multiple comparison procedure that uses the studentized range statistic qr to compare sets of means. The result of the test is a set of subsets of means, where in each subset means have been found not to be significantly different from one another (Duncan, 1955). DMRT is commonly used in agricultural research as a multiple comparison procedure. With this method, at the 99.0% confidence level, there is a 1.0% risk of calling one or more pairs significantly different when their actual difference equals 0. The response of the test is presented in box-and-whisker plots for each morphological trait. A plot is constructed in the following manner: the box is drawn extending from the lower quartile of the sample to the upper quartile; a vertical line is drawn at the median; a plus sign represents the location of the sample mean.
RESULTS AND DISCUSSIONS The experimental results presented contrasting aspects regarding the correlation of the yield formation elements (weight, height, and density of clover plants) with the dynamics of the symbiotic nodule formation. The classification of the variants in decreasing order (Table 2) allowed a preliminary overview of the effects of treatment on the considered biological indicators. The coefficients of variation (CV%) and the average of the five replicates of the indicators are presented within the group of treatments. Depending on the ranking results, the positioning of each variant within the treatment group has provided useful information on the: - yield elements (height and weight of clover
plants): the variants 1, 7 and 5 were located at the upper end, in which nitrogen was supplied;
- nodule formation: variants 6 and 8 in which the seeds were bacterized and no nitrogen was applied;
- density: variants 4 and 1 without inoculation, without fertilization with nitrogen.

85
growth process is often disproportionate to plant requirements for this microelement. Of the essential microelements, except for copper (Cu), Mo is found in most plant tissues in very small quantities. To compensate for Mo deficiency and to ensure effective Mo enzyme activity, foliar fertilization with this mineral element is often recommended (Dunea and Dincă, 2014). The nitrogenase of the symbiotic bacteria enzyme is composed of two subunits, of which the MoFe protein is directly involved in the reduction of N2 to NH3 (Kaiser et al., 2005). In order to maintain the symbiotic activity in these species, the provision of Mo and iron (Fe) in bacteroids is a key regulatory component. The molybdates provided by the plant must cross the cell membranes of the node as well as the bacteroid membranes (external and internal) to reach the bacterial nitrogenous complex (Kaiser et al., 2005). The control mechanism of the molybdates transport in the nodules is mostly unknown. However, a positive correlation was found between the development of nodules and Mo availability (Anderson, 1956). The tendency of legumes to maintain a high concentration of Mo in the nodules was experimentally determined (Hewitt and Bolle-Jones, 1952). Mo partitioning was predominantly directed towards the nodules and reproductive organs compared to othertissues of the plant (Gurley and Giddens, 1969, Franco and Munns, 1981, Ishizuka 1982; Giller, 1991, cited by Kaiser et al., 2005). Nodules are believed to act as "substantial" reservoirs of Mo, but it is not known whether this is a consequence of the nitrogenase activity. Experiments on various species of legumes have shown that Mo fertilization substantially improves the symbiotic mechanism of molecular N fixation by forming larger nodules and increased nitrogenase activity (Kaiser et al., 2005). The rationale of the study was to establish the influence of Mo on the biological efficiency of red clover in the presence or the absence of N fertilization and inoculation of Rhizobium leguminosarum biovar trifolii, and whether the results can lead to the improvement of classical crop technologies and the fertilization plan for obtaining superior forage yields. In this regard,
some preliminary results were obtained in an experiment in which red clover plants were maintained for 60 days in agrowth chamber in order to determine the individual and combined effect of inoculation with Rhizobium trifolii, N and Mo fertilization on the morphological characteristics and the formation of nodulesin red clover. There is a growing interest in reducing the quantities of chemical fertilizers as inputs in cropping systems (Dunea et al., 2014). The use of seed inoculation with strains has become a preferred practice especially in organic farming. Nowadays, there are numerous commercial products e.g., Nitragin Gold pre-inoculant from Monsanto BioAg. The aim of the study was to determine the effect of applied treatments in controlled conditions on the following characteristics of red clover: average plant height, average plant weight, average plant density and number of nodules on roots. These variables have been considered as indicators of biological efficiency for yield formation. MATERIALS AND METHODS The experiments were carried out in controlled environment (Conviron plant growth chamber) using the Violetta diploid red clover cultivar. In order to assess the effects of treatments on the observed biological traits, the treatments were ranked in descending order, followed by the multiple comparison method i.e., the Duncan's multiple range test (DMRT). The testing of the biological response of the plants comprised 8 variants showed in Table 1. The sowing was carried out with the same amount of seed in 5 L vegetation pots filled with sterilized perlite using 5 replicates. To ensure the nutrients needed for plants after emergence, the same amount of mineral fertilizer NPK (5-15-15) was supplied in all variants. In the inoculation variants (5-8), the seeds were bacterized with R. trifolii-treated strains using the Nitragin® product (B type) using 7.5 g Nitragin/kg clover seed, dissolved in about 25 mL cold water. After pre-homogenization of the seed in the resulting solution, it was sown with the same quantity in all the repetitions of the variants.
The bacterial solution contains at least 100 million viable cells g-1 of R. trifolii. Nitric fertilization was done with ammonium nitrate (33.5% N) supplied prior to sowing in an equivalent dose of 100 kg N ha-1.
Table 1. Variants of the experiment with/without seed inoculation and fertilization with Nitrogen (N) and
Molybdenum (Mo) in Violetta diploid cultivar
Variants without Nitragin� treatment
Variants with Nitragin�treatment
1 - no Rhizobium inoculation; Fertilization
N + Mo
5 - Rhizobium inoculation; Fertilization
N + Mo 2 - no Rhizobium
inoculation; Fertilization Mo without N
6 - Rhizobium inoculation; Fertilization Mo without
N 3 - no Rhizobium
inoculation; Fertilization N without Mo
7 - Rhizobium inoculation; Fertilization N without
Mo 4 - no Rhizobium
inoculation; no fertilization 8 - Rhizobium inoculation;
no fertilization Molybdenum (0.02 Mo) was supplied in a single-dose using a uniform foliar sprayingwith three applications. Observations regarding the formation of nodules were performed after 6 weeks from plants’ emergence, by immersing the roots in water followed by the estimation of the number of formed nodules. Proper nodulation involves the existence of specific formations on the pivotal root and lateral ramifications. After cutting the nodules, the color was assessed visually appreciating the effectiveness of the inoculation: white-green: inefficient; pink-red: efficient. The aboveground part of the harvested plants was dried in the oven at 80° C for 24 hours to determine the accumulated aerial dry matter (DM). The dried material was weighed with a Sartorius precision electronic balance. The setup of the controlled conditions in the growth chamber was as follow: Light - the light intensity was pre-selected on the cyclic control system providing 1200 µmoles/m2/s by using PAR lamps; Temperature: +25° C ± 0.5°C in lights on period; Relative Humidity (RH): 85% on lights on ±5% RH. StatGraphics Plus program was used to perform the statistical analysis of the results. We used
the Duncan's multiple range test (DMRT), which is a multiple comparison procedure that uses the studentized range statistic qr to compare sets of means. The result of the test is a set of subsets of means, where in each subset means have been found not to be significantly different from one another (Duncan, 1955). DMRT is commonly used in agricultural research as a multiple comparison procedure. With this method, at the 99.0% confidence level, there is a 1.0% risk of calling one or more pairs significantly different when their actual difference equals 0. The response of the test is presented in box-and-whisker plots for each morphological trait. A plot is constructed in the following manner: the box is drawn extending from the lower quartile of the sample to the upper quartile; a vertical line is drawn at the median; a plus sign represents the location of the sample mean.
RESULTS AND DISCUSSIONS The experimental results presented contrasting aspects regarding the correlation of the yield formation elements (weight, height, and density of clover plants) with the dynamics of the symbiotic nodule formation. The classification of the variants in decreasing order (Table 2) allowed a preliminary overview of the effects of treatment on the considered biological indicators. The coefficients of variation (CV%) and the average of the five replicates of the indicators are presented within the group of treatments. Depending on the ranking results, the positioning of each variant within the treatment group has provided useful information on the: - yield elements (height and weight of clover
plants): the variants 1, 7 and 5 were located at the upper end, in which nitrogen was supplied;
- nodule formation: variants 6 and 8 in which the seeds were bacterized and no nitrogen was applied;
- density: variants 4 and 1 without inoculation, without fertilization with nitrogen.

86
Table 2. Descending ranking of the variants after 60 days in controlled conditions (1-4 variants without
Rhizobium inoculation; 5-8 variants with Rhizobium inoculation); CV – Coefficient of Variation
Number of variant 1 7 5 2 6 8 3 4 Average plant
height(cm) CV = 30.79%
25.4 23.82 22.4 14.68 14.61 14.52 13.97 11.07
Number of variant 1 7 5 8 3 2 4 6 Average dry weight (g
plant-1) CV = 57.43%
10.43 7.79 6.22 4.58 3.21 2.87 2.79 2.36
Number of variant 4 1 6 3 5 8 7 2 Plant density
(plants per pot) CV =13.68%
14.6 14 13.6 12.8 12.4 12.4 10.8 9.4
Number of variant 6 8 7 4 1 2 3 5 Number of nodules
CV = 167.49% 22.72 21 3.33 2.3 0 0 0 0
Overall, the variants presented different values of the CVs, depending on the measured characteristic. If, in terms of plant density and average plant height, no significant amplitudes of CV% were found, at the level of nodule formation (167.49%) and dry matter accumulation (57.43%), a larger variability was noticed. From the ANOVA test regarding the dry matter accumulation observations, it was found that the F value (20.16) showed a statistically significant difference (p< 0.05) between the results of the 8 treatments. The Duncan test at 99% confidence level was applied to highlight the significant differences between variants (Figure1). For plant height, the F value (31.71) of the sample showed a statistically significant difference (p< 0.05) between the averages of the 8 treatments. There is a close relationship between plant height and accumulation of dry matter, expressed by a statistically significant Pearson correlation coefficient (R = 0.9289; p< 0.01). The 99%-level Duncan test determined statistically significant differences (p<0.01) in the case of the average height of red clover plants (Figure 2). In terms of plant density as a result of application of treatments, no statistically significant differences were found using the Duncan test at 95%-confidence level (Figure 3), compared to variants 1-2 (+4.6 plants); 2-4 (-5.2 plants) and 2-6 (-4.2 plants). The potential of symbiotic activity expressed by the mean number of formed nodules on the
roots of individual plants was observed in variants 6, 7, 8 and very poor in variant 4. The other variants (1, 2, 3 and 5) did not present these formations specific to the symbiosis (Figure 4).
Figure 1. Results of Duncan test (99% confidence level) applied to the variant averages of dry weight showing the
distribution on each variant among five repetitions (Y axe: 1-8 number of variant; X axe – grams/plant); vertical line of the box represent the median; the plus
sign represents the location of the sample mean; * shows the significant differences between treatments
The response of the red clover plants to the inoculation with bacterial product was affected by the nitrogen fertilization. Consequently, the process of nodules’ development was favorably influenced by the foliar fertilization with Mo in the absence of N (22.72 nodules) or in the absence of any fertilization (21 nodules). The differences between these values were not statistically significant (p> 0.05). The use of nitrogen in the variants where the seeds have been bacterized caused a negative influence,
resulting the obstruction or elimination of the process of nodules formation. In variant (4) - without inoculation, and without fertilization there were nodules, although the seeds were not bacterized.
Figure 2. Results of Duncan test (99% confidence level) applied to the variant averages of plant height showing
the distribution on each variant among five repetitions (Y axe: 1-8 number of variant; X axe – cm); vertical line of the box represent the median; the plus sign represents the
location of the sample mean; * shows the significant differences between treatments
Figure 3. Results of Duncan test (95% confidence level) applied to the variant averages of plant density showing
the distribution on each variant among five repetitions (Y axe: 1-8 number of variant; X axe – plants/pot); no
significant differences between treatments were found
A possible explanation lies in the presence of native strains of the macrosymbiot existing on the seed coat that have somehow become active in the absence of fertilization. The correlation test between the accumulated dry matter and the number of formed nodules indicated the lack of statistical significance (p> 0.05). Mineral N treatment has provided a significant effect on the growth of red clover plants at the expense of the formation of symbiotic-specific nodules on the pivotal root and its lateral
ramifications. The exception was variant 3, where nitrogen was supplied without foliar fertilization with Mo and without seed inoculation.
Figure 4. Effect of treatments on the number of nodules formed through symbiosis in each variant (variants 1, 2,
3 and 5 did not form nodules) Compared to the results obtained by Fabian and Moga (1988), in which the mineral nitrogen variant (6.08 g DM pl-1) exceeded the symbiotic-nitrogen variant (4.05 g DM pl-1) by 50%, we have observed the dry matter accumulations presented in Table 3. Our experimental results indicated values close to the previous experiment, namely 4.58 g DM pl-1 in the symbiotic-nitrogen variant and 10.43 g DM pl-1 in the variant of foliar fertilization with mineral nitrogen with molybdenum. The exclusive use of mineral N resulted in a low DM yield (3.21 g DM pl-1). Table 3.The influence of symbiotic and mineral nitrogen
on red clover productivity in controlled conditions
Treatments Inoculation with Nitragin� g pl.-1 %
Fertilization N + Mo 6.22 100 Fertilization Mo 2.36 100 Fertilization N 7.79 100 No fertilization 4.58 100 Without Nitragin� inoculation Fertilization N + Mo 10.43 167.6 Fertilization Mo 2.87 121.2 Fertilization N 3.21 41.2 No fertilization 2.79 60.9
A non-productive consumption regime might occur in the N-fertilized variants, i.e., plants continue to absorb significant amounts of nitrogen over their requirements, quantities that were not reflected in yield increases.
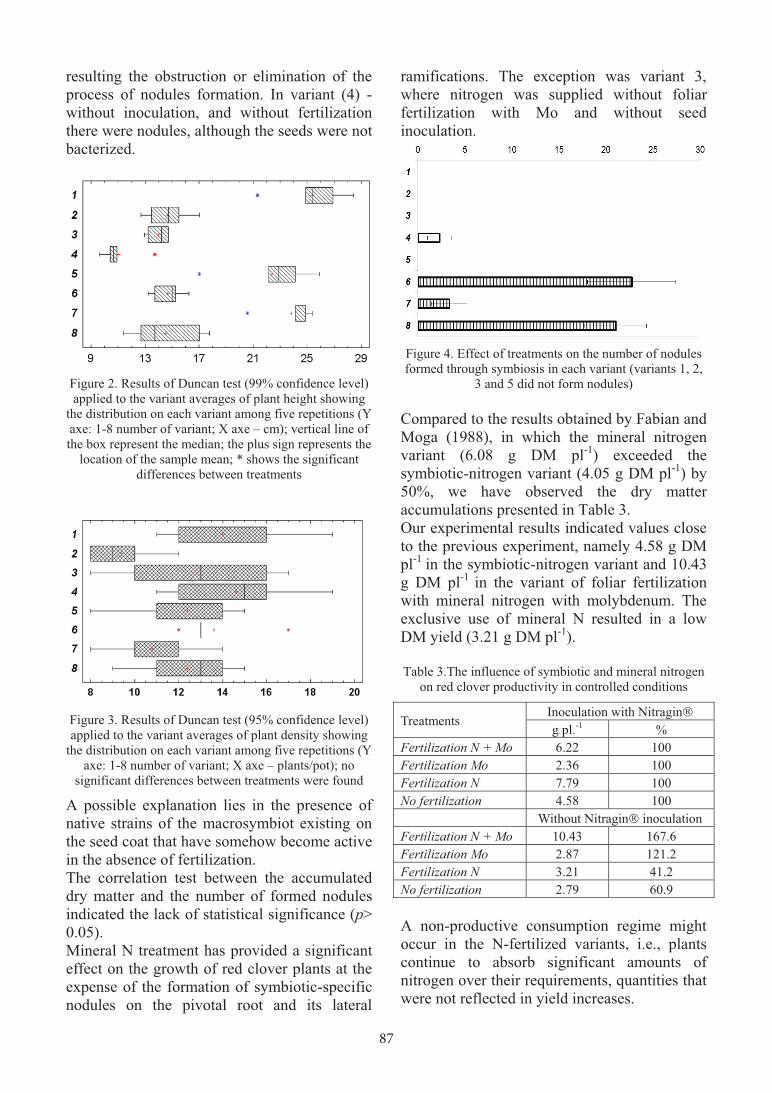
87
Table 2. Descending ranking of the variants after 60 days in controlled conditions (1-4 variants without
Rhizobium inoculation; 5-8 variants with Rhizobium inoculation); CV – Coefficient of Variation
Number of variant 1 7 5 2 6 8 3 4 Average plant
height(cm) CV = 30.79%
25.4 23.82 22.4 14.68 14.61 14.52 13.97 11.07
Number of variant 1 7 5 8 3 2 4 6 Average dry weight (g
plant-1) CV = 57.43%
10.43 7.79 6.22 4.58 3.21 2.87 2.79 2.36
Number of variant 4 1 6 3 5 8 7 2 Plant density
(plants per pot) CV =13.68%
14.6 14 13.6 12.8 12.4 12.4 10.8 9.4
Number of variant 6 8 7 4 1 2 3 5 Number of nodules
CV = 167.49% 22.72 21 3.33 2.3 0 0 0 0
Overall, the variants presented different values of the CVs, depending on the measured characteristic. If, in terms of plant density and average plant height, no significant amplitudes of CV% were found, at the level of nodule formation (167.49%) and dry matter accumulation (57.43%), a larger variability was noticed. From the ANOVA test regarding the dry matter accumulation observations, it was found that the F value (20.16) showed a statistically significant difference (p< 0.05) between the results of the 8 treatments. The Duncan test at 99% confidence level was applied to highlight the significant differences between variants (Figure1). For plant height, the F value (31.71) of the sample showed a statistically significant difference (p< 0.05) between the averages of the 8 treatments. There is a close relationship between plant height and accumulation of dry matter, expressed by a statistically significant Pearson correlation coefficient (R = 0.9289; p< 0.01). The 99%-level Duncan test determined statistically significant differences (p<0.01) in the case of the average height of red clover plants (Figure 2). In terms of plant density as a result of application of treatments, no statistically significant differences were found using the Duncan test at 95%-confidence level (Figure 3), compared to variants 1-2 (+4.6 plants); 2-4 (-5.2 plants) and 2-6 (-4.2 plants). The potential of symbiotic activity expressed by the mean number of formed nodules on the
roots of individual plants was observed in variants 6, 7, 8 and very poor in variant 4. The other variants (1, 2, 3 and 5) did not present these formations specific to the symbiosis (Figure 4).
Figure 1. Results of Duncan test (99% confidence level) applied to the variant averages of dry weight showing the
distribution on each variant among five repetitions (Y axe: 1-8 number of variant; X axe – grams/plant); vertical line of the box represent the median; the plus
sign represents the location of the sample mean; * shows the significant differences between treatments
The response of the red clover plants to the inoculation with bacterial product was affected by the nitrogen fertilization. Consequently, the process of nodules’ development was favorably influenced by the foliar fertilization with Mo in the absence of N (22.72 nodules) or in the absence of any fertilization (21 nodules). The differences between these values were not statistically significant (p> 0.05). The use of nitrogen in the variants where the seeds have been bacterized caused a negative influence,
resulting the obstruction or elimination of the process of nodules formation. In variant (4) - without inoculation, and without fertilization there were nodules, although the seeds were not bacterized.
Figure 2. Results of Duncan test (99% confidence level) applied to the variant averages of plant height showing
the distribution on each variant among five repetitions (Y axe: 1-8 number of variant; X axe – cm); vertical line of the box represent the median; the plus sign represents the
location of the sample mean; * shows the significant differences between treatments
Figure 3. Results of Duncan test (95% confidence level) applied to the variant averages of plant density showing
the distribution on each variant among five repetitions (Y axe: 1-8 number of variant; X axe – plants/pot); no
significant differences between treatments were found
A possible explanation lies in the presence of native strains of the macrosymbiot existing on the seed coat that have somehow become active in the absence of fertilization. The correlation test between the accumulated dry matter and the number of formed nodules indicated the lack of statistical significance (p> 0.05). Mineral N treatment has provided a significant effect on the growth of red clover plants at the expense of the formation of symbiotic-specific nodules on the pivotal root and its lateral
ramifications. The exception was variant 3, where nitrogen was supplied without foliar fertilization with Mo and without seed inoculation.
Figure 4. Effect of treatments on the number of nodules formed through symbiosis in each variant (variants 1, 2,
3 and 5 did not form nodules) Compared to the results obtained by Fabian and Moga (1988), in which the mineral nitrogen variant (6.08 g DM pl-1) exceeded the symbiotic-nitrogen variant (4.05 g DM pl-1) by 50%, we have observed the dry matter accumulations presented in Table 3. Our experimental results indicated values close to the previous experiment, namely 4.58 g DM pl-1 in the symbiotic-nitrogen variant and 10.43 g DM pl-1 in the variant of foliar fertilization with mineral nitrogen with molybdenum. The exclusive use of mineral N resulted in a low DM yield (3.21 g DM pl-1). Table 3.The influence of symbiotic and mineral nitrogen
on red clover productivity in controlled conditions
Treatments Inoculation with Nitragin� g pl.-1 %
Fertilization N + Mo 6.22 100 Fertilization Mo 2.36 100 Fertilization N 7.79 100 No fertilization 4.58 100 Without Nitragin� inoculation Fertilization N + Mo 10.43 167.6 Fertilization Mo 2.87 121.2 Fertilization N 3.21 41.2 No fertilization 2.79 60.9
A non-productive consumption regime might occur in the N-fertilized variants, i.e., plants continue to absorb significant amounts of nitrogen over their requirements, quantities that were not reflected in yield increases.

88
YIELD COMPONENTS AND GRAIN YIELD AT MAIZE UNDER
DROUGHT AND DIFFERENT CROP TECHNOLOGY CONDITIONS
Marin DUMBRAVĂ, Viorel ION, Adrian Gheorghe BĂȘA, Lenuţa Iuliana EPURE
University of Agronomic Sciences and Veterinary Medicine of Bucharest, 59 Mărăşti Blvd., District 1, 011464, Bucharest, Romania
Corresponding author email: [email protected]
Abstract The yielding capacity is given for each maize hybrid by its genetics, but it is also influenced by the growth conditions. As drought is the main yield constraints especially in South Romania, which is the most important Romanian growing area for maize, it is of great importance for farmers but also for scientists to better understand the maize plant responses to drought under different technological conditions. The preceding crop, nitrogen rate and row spacing represent crop technology elements that the maize grower can manipulate according to his production objective, this being even more of interest in drought conditions. From this perspective, the aim of this paper is to present the results regarding the yield components and the grain yield at maize under drought and different crop technology conditions (two preceding crops, two row spacing and four nitrogen rates) in the specific growing conditions from South Romania. In this respect, a field experiment was performed in 2016 in South Romania (44o29’ N latitude and 26o15’ E longitude), under rainfed conditions. Five maize hybrids were studied under two preceding crops (sunflower and maize), two row spacing (70 and 50 cm) and four nitrogen rates (0 kg.ha-1; 50 kg.ha-1; 100 kg.ha-1; 50+50 kg.ha-1). Under the drought conditions of 2016, application of nitrogen and increasing of nitrogen rate from 50 to 100 kg.ha-1 increased the grain yield and values of the yield components (except TGW). Generally, grain yield and yielding components (except TGW) registered higher values at row spacing of 50 cm when the preceding crop was maize and at row spacing of 70 cm when the preceding crop was sunflower. Yielding components (except TGW) registered higher values in the case of maize as preceding crop, while TGW and grain yield registered higher values when sunflower was the preceding crop. Key words: maize, yield components, grain yield, preceding crop, nitrogen rate, row spacing, drought. INTRODUCTION Maize (Zea mays L.) is a crop with a high yielding capacity. The yielding capacity is determined by the yield components, which are the elements participating to the yield formation (Ion et al., 2013). The yielding capacity is given for each maize hybrid by its genetics, but it is also influenced by the growth conditions, respectively by the environmental factors, mainly soil and climatic conditions, as well as by the crop technology used by the maize grower. Yield potential can be diminished as a consequence of insufficient water supply to meet crop water demand (Grassini et al., 2009). But severe drought stress is affecting in a very significant way the yielding capacity of the maize plants, even leading in extreme conditions to the loss of the yielding capacity. Drought is the main yield constraints especially in South Romania, which is the most important Romanian growing area for maize.
Rainfed crop management systems need to be optimized to provide more resilient options in order to cope with the decrease in mean precipitation and more frequent extreme drought periods (Cociu and Cizmaș, 2015). Therefore, it is of great importance for farmers but also for scientists to better understand the maize plant responses to drought under different technological conditions. Farmers growing maize must consider crop technology as a tool for a maximum use of resources and for diminishing the effects of limitative environmental factors (Dumbrava et al., 2015). Preceding crop is among the important crop technology measures with a significant influence upon the yield, respectively upon the yield components (Ion et al., 2015). The effect of crop rotation on maize yield is inversely proportional to the ratio of the maize in the crop rotation (Šeremešić et al., 2013). Despite the fact the benefits of crop rotation for land and water resource protection and productivity
CONCLUSIONS The experiments performed in controlled con-ditions allowed the evaluation of the biological response of the red clover to various treatments considered to have a potential impact on the growth and development of the plants’ canopy. Seed inoculation, in the absence of fertilization, leads to relatively equivalent yields obtained from the mineral N fertilizer application. Foliar fertilization exclusively using molyb-denum did not provide significant yield in-creases, but when it was combined with nitro-gen fertilization, it helped to achieve higher yields. The "image" of the biological yield of plants excludes the aspects related to the nitrogenase activity that is responsible for the symbiotic nitrogen fixation. From the yield formation point of view, the variants in which a large number of nodules were formed did not correlate positively with dry matter accumulation; however, they can have a particular importance in improving the reserves of assimilable nitrogen available in the soil. REFERENCES Anderson A.J., 1956. Molybdenum deficiencies in
legumes in Australia. Soil Science81, p. 173-192. Bărbulescu C., Puia I., Motcă Gh., Moisiuc Al., 1991.
Cultura pajiştilor şi a plantelor furajere. Ed. Didactică şi Pedagogică, Bucureşti.
Boller B.C., Nosberger J., 1987. Symbiotically fixed nitrogen from field-grown white and red clover mixed with ryegrasses at low levels of 15N fertilization. Plant and Soil. 104, p. 219-226.
Burton J.C., 1985. Rhizobium relationships. In: Taylor, N. L. ed. Clover science and technology. Madison, American Society of Agronomy, Inc. Crop Science Society of America, Inc., Soil Science Society of America, Inc.,p. 161-184.
Carlsson G., 2005. Input of Nitrogen from N2 Fixation to Northern Grasslands. Doctoral thesis Swedish University of Agricultural Sciences Umeå.
Duncan D.B., 1955. Multiple range and multiple F tests. Biometrics 11, 1-42. doi:10.2307/3001478
Dunea D., 2006. Cercetări privind bioconversia energiei solare la Trifolium pratense L. în câmpia piemontană a Târgoviştei. Teză de doctorat, Universitatea de Ştiinte Agronomice și Medicină Veterinară din Bucureşti.
Dunea D., Iordache Ş., Pohoaţă A., Frăsin L.B.N., 2014. Investigation and Selection of Remediation Technologies for Petroleum-Contaminated Soils Using a Decision Support System. Water, Air& Soil Pollution, 225(7): p. 1-18.
Dunea D., Dincă N., 2014. Improving land utilization using intensive grass-clover mixtures in forage production systems. Romanian Agricultural Res., 31, p. 147-158.
Fabian I., Moga I., 1988. Influence of symbiotic and combined nitrogen on lucerne and red clover growth. Analele Institutului de Cercetări pentru Cereale şi Plante Tehnice Fundulea. 56, p. 391-400.
Hewitt E.J., Bolle-Jones E.W., 1952. Molybdenum as a plant nutrient. II. The effects of molybdenum deficiency on some horticultural and agricultural crop plants in sand culture. Journal of Horticultural Science, 27,p. 257-265.
Hellsten A, Huss-Danell K., 2001. Interaction effects of nitrogen and phosphorus on nodulation in red clover (Trifolium pratense L.). Acta Agriculturae Scandinavica. Section B, Soil and Plant Science, 50,p. 135-142.
Kaiser B.N., Kate L. Gridley, Joanne Ngaire Brady, Phillips T., Tyerman S.D., 2005. The Role of Molybdenum in Agricultural Plant Production. Annals of Botany, 96(5),p. 745-754.
Motcă Gh., Oancea I., Geamănu L.I., 1994. Pajiştile României, tipologie şi tehnologie. Ed. Tehnică Agricolă, Bucureşti.
Streeter J., 1988. Inhibition of legume nodule formation and N2 fixation by nitrate. CRC Critical Reviews in Plant Sciences, 7, p. 1-23.
Taylor N.L., Quesenberry K.H., 1996. Red Clover Science. Kluwer Academic Publishers, Dordrecht.
***Nitragin North America: http://www.nitragin.com. *** StatGraphics Plus: http://www.statgraphics.com/.
89
YIELD COMPONENTS AND GRAIN YIELD AT MAIZE UNDER
DROUGHT AND DIFFERENT CROP TECHNOLOGY CONDITIONS
Marin DUMBRAVĂ, Viorel ION, Adrian Gheorghe BĂȘA, Lenuţa Iuliana EPURE
University of Agronomic Sciences and Veterinary Medicine of Bucharest, 59 Mărăşti Blvd., District 1, 011464, Bucharest, Romania
Corresponding author email: [email protected]
Abstract The yielding capacity is given for each maize hybrid by its genetics, but it is also influenced by the growth conditions. As drought is the main yield constraints especially in South Romania, which is the most important Romanian growing area for maize, it is of great importance for farmers but also for scientists to better understand the maize plant responses to drought under different technological conditions. The preceding crop, nitrogen rate and row spacing represent crop technology elements that the maize grower can manipulate according to his production objective, this being even more of interest in drought conditions. From this perspective, the aim of this paper is to present the results regarding the yield components and the grain yield at maize under drought and different crop technology conditions (two preceding crops, two row spacing and four nitrogen rates) in the specific growing conditions from South Romania. In this respect, a field experiment was performed in 2016 in South Romania (44o29’ N latitude and 26o15’ E longitude), under rainfed conditions. Five maize hybrids were studied under two preceding crops (sunflower and maize), two row spacing (70 and 50 cm) and four nitrogen rates (0 kg.ha-1; 50 kg.ha-1; 100 kg.ha-1; 50+50 kg.ha-1). Under the drought conditions of 2016, application of nitrogen and increasing of nitrogen rate from 50 to 100 kg.ha-1 increased the grain yield and values of the yield components (except TGW). Generally, grain yield and yielding components (except TGW) registered higher values at row spacing of 50 cm when the preceding crop was maize and at row spacing of 70 cm when the preceding crop was sunflower. Yielding components (except TGW) registered higher values in the case of maize as preceding crop, while TGW and grain yield registered higher values when sunflower was the preceding crop. Key words: maize, yield components, grain yield, preceding crop, nitrogen rate, row spacing, drought. INTRODUCTION Maize (Zea mays L.) is a crop with a high yielding capacity. The yielding capacity is determined by the yield components, which are the elements participating to the yield formation (Ion et al., 2013). The yielding capacity is given for each maize hybrid by its genetics, but it is also influenced by the growth conditions, respectively by the environmental factors, mainly soil and climatic conditions, as well as by the crop technology used by the maize grower. Yield potential can be diminished as a consequence of insufficient water supply to meet crop water demand (Grassini et al., 2009). But severe drought stress is affecting in a very significant way the yielding capacity of the maize plants, even leading in extreme conditions to the loss of the yielding capacity. Drought is the main yield constraints especially in South Romania, which is the most important Romanian growing area for maize.
Rainfed crop management systems need to be optimized to provide more resilient options in order to cope with the decrease in mean precipitation and more frequent extreme drought periods (Cociu and Cizmaș, 2015). Therefore, it is of great importance for farmers but also for scientists to better understand the maize plant responses to drought under different technological conditions. Farmers growing maize must consider crop technology as a tool for a maximum use of resources and for diminishing the effects of limitative environmental factors (Dumbrava et al., 2015). Preceding crop is among the important crop technology measures with a significant influence upon the yield, respectively upon the yield components (Ion et al., 2015). The effect of crop rotation on maize yield is inversely proportional to the ratio of the maize in the crop rotation (Šeremešić et al., 2013). Despite the fact the benefits of crop rotation for land and water resource protection and productivity
CONCLUSIONS The experiments performed in controlled con-ditions allowed the evaluation of the biological response of the red clover to various treatments considered to have a potential impact on the growth and development of the plants’ canopy. Seed inoculation, in the absence of fertilization, leads to relatively equivalent yields obtained from the mineral N fertilizer application. Foliar fertilization exclusively using molyb-denum did not provide significant yield in-creases, but when it was combined with nitro-gen fertilization, it helped to achieve higher yields. The "image" of the biological yield of plants excludes the aspects related to the nitrogenase activity that is responsible for the symbiotic nitrogen fixation. From the yield formation point of view, the variants in which a large number of nodules were formed did not correlate positively with dry matter accumulation; however, they can have a particular importance in improving the reserves of assimilable nitrogen available in the soil. REFERENCES Anderson A.J., 1956. Molybdenum deficiencies in
legumes in Australia. Soil Science81, p. 173-192. Bărbulescu C., Puia I., Motcă Gh., Moisiuc Al., 1991.
Cultura pajiştilor şi a plantelor furajere. Ed. Didactică şi Pedagogică, Bucureşti.
Boller B.C., Nosberger J., 1987. Symbiotically fixed nitrogen from field-grown white and red clover mixed with ryegrasses at low levels of 15N fertilization. Plant and Soil. 104, p. 219-226.
Burton J.C., 1985. Rhizobium relationships. In: Taylor, N. L. ed. Clover science and technology. Madison, American Society of Agronomy, Inc. Crop Science Society of America, Inc., Soil Science Society of America, Inc.,p. 161-184.
Carlsson G., 2005. Input of Nitrogen from N2 Fixation to Northern Grasslands. Doctoral thesis Swedish University of Agricultural Sciences Umeå.
Duncan D.B., 1955. Multiple range and multiple F tests. Biometrics 11, 1-42. doi:10.2307/3001478
Dunea D., 2006. Cercetări privind bioconversia energiei solare la Trifolium pratense L. în câmpia piemontană a Târgoviştei. Teză de doctorat, Universitatea de Ştiinte Agronomice și Medicină Veterinară din Bucureşti.
Dunea D., Iordache Ş., Pohoaţă A., Frăsin L.B.N., 2014. Investigation and Selection of Remediation Technologies for Petroleum-Contaminated Soils Using a Decision Support System. Water, Air& Soil Pollution, 225(7): p. 1-18.
Dunea D., Dincă N., 2014. Improving land utilization using intensive grass-clover mixtures in forage production systems. Romanian Agricultural Res., 31, p. 147-158.
Fabian I., Moga I., 1988. Influence of symbiotic and combined nitrogen on lucerne and red clover growth. Analele Institutului de Cercetări pentru Cereale şi Plante Tehnice Fundulea. 56, p. 391-400.
Hewitt E.J., Bolle-Jones E.W., 1952. Molybdenum as a plant nutrient. II. The effects of molybdenum deficiency on some horticultural and agricultural crop plants in sand culture. Journal of Horticultural Science, 27,p. 257-265.
Hellsten A, Huss-Danell K., 2001. Interaction effects of nitrogen and phosphorus on nodulation in red clover (Trifolium pratense L.). Acta Agriculturae Scandinavica. Section B, Soil and Plant Science, 50,p. 135-142.
Kaiser B.N., Kate L. Gridley, Joanne Ngaire Brady, Phillips T., Tyerman S.D., 2005. The Role of Molybdenum in Agricultural Plant Production. Annals of Botany, 96(5),p. 745-754.
Motcă Gh., Oancea I., Geamănu L.I., 1994. Pajiştile României, tipologie şi tehnologie. Ed. Tehnică Agricolă, Bucureşti.
Streeter J., 1988. Inhibition of legume nodule formation and N2 fixation by nitrate. CRC Critical Reviews in Plant Sciences, 7, p. 1-23.
Taylor N.L., Quesenberry K.H., 1996. Red Clover Science. Kluwer Academic Publishers, Dordrecht.
***Nitragin North America: http://www.nitragin.com. *** StatGraphics Plus: http://www.statgraphics.com/.
AgroLife Scientific Journal - Volume 6, Number 2, 2017ISSN 2285-5718; ISSN CD-ROM 2285-5726; ISSN ONLINE 2286-0126; ISSN-L 2285-5718
90
have been identified, many of the rotation factors, processes and mechanisms responsible for increased yield and other benefits need to be better understood (Berzsenyi et al., 2000). Nitrogen application are among the management methods that can increase maize grain yields (Stanger and Lauer, 2008). Maize is known to be a heavy feeder of nitrogen fertilizer (Muhamman et al., 2014). Nevertheless, at high application rates the efficiency of nitrogen use is reduced and the risk of nitrogen loss in soil-plant systems is increased (Chakwizira et al., 2016). Therefore, best nitrogen management practices are the pre-requisite to warrant high maize yield (Wasaya et al., 2012). Generally, maize is cultivated in wide spaced rows (Nik et al., 2011), but decreasing the distance between neighbour rows at any particular plant population has several potential advantages (Sangoi et al., 2001). Planting maize in narrow rows results in a more equidistant spacing of plants, which theoretically assumes to minimize the competition among plants for water, nutrients and sunlight (Gobeze et al., 2012). Preceding crop, nitrogen rate and row spacing represent crop technology elements that the maize grower can manipulate according to his production objective, this being even more of interest in drought conditions. From this perspective, the aim of this paper is to present the results regarding the yield components and the grain yield at maize under drought and different crop technology conditions (two preceding crops, two row spacing and four nitrogen rates) in the specific growing conditions from South Romania. MATERIALS AND METHODS Researches were performed in a field experiment in the year 2016, under rainfed conditions. The field experiment was located in South Romania (44o29’ N latitude and 26o15’ E longitude), within Moara Domnească Experimental Farm belonging to the University of Agronomic Sciences and Veterinary Medicine of Bucharest. In the field experiments there were sowed five maize hybrids, respectively: Aristide (FAO precocity group 400), LG 34.90 (FAO
precocity group 490), Janett (FAO precocity group 550), ES Feria (FAO precocity group 550), Mikado (FAO precocity group 550). Each of the five maize hybrids were sowed in the conditions of two preceding crops (sunflower and maize), two row spacing (70 and 50 cm) and four nitrogen rates (0 kg.ha-1; 50 kg.ha-1; 100 kg.ha-1; 50+50 kg.ha-1). Nitrogen fertilization was done immediately after sowing, except for the experimental variant 50+50 kg.ha-1 for which half of rate (50 kg.ha-1) was applied immediately after sowing and the other half (50 kg.ha-1) was applied in the vegetation period, in the growth stage of eight leaves. As fertilizer, it was used the ammonium nitrite with 33.5% nitrogen content. Soil tillage consisted in ploughing performed on 30th of October 2015, followed by a disc harrow work performed in the next spring, on 18th of March 2016. The seedbed was prepared before sowing by the help of a combinatory. Sowing was performed on 8th of April 2016 and the plant density was of 70,000 plants.ha-1. The weed control was performed by the help of herbicides applied on 19th of May 2016, when the maize plants were in the stage of four leaves. It was used the herbicide Dicopur Top 464 SL (active substance acid 2.4D 344 g.l-1 + dicamba 120 g.l-1) applied in a rate of 1 l.ha-1, which was applied together with the herbicide Titus 25 DF (active substance rimsulfuron metil 250 g.kg-1) in a rate of 50 g.ha-1. Also, it was added together with the herbicides the adjuvant Trend 90 in a rate of 200 ml.ha-1. The soil from the field experiment area is reddish preluvosoil, which has a humus content of 2.2-2.8%, a pH between 6.2 and 6.6, and a clay loam texture. The climatic conditions for the period April-August, respectively for the growing period of maize plants, are characterised by the multiannual average temperature of 18.5oC and the multiannual average rainfall of 313.2 mm, while the values registered in 2016 were of 20.1oC and respectively 284 mm. As a result, the year 2016 is characterised as a warmer and drier year for the studying area. At full maturity stage, the ears from one square meter in each experimental variant were analysed. The following determinations of the yield components were performed: ear length (cm), number of grains on ear, ear weight (g),
grain weight on ear (g), and thousand grain weight – TGW (g). Also, the grain moisture content was determined by the help of a moisture analyser. The grain yield was calculated in kg.ha-1 and it was reported at 14% moisture content. The obtained data were statistically processed by analysis of variance (ANOVA). As control, there were taken the variants with the nitrogen rate of 0 kg.ha-1 for each row spacing and preceding crop. The data presented and analysed in the paper represents the average values for the five studied maize hybrids. RESULTS AND DISCUSSIONS Ear length. In average for all experimental variants, the ear length was of 11.8 cm. Application of nitrogen and increasing of nitrogen rate from 50 to 100 kg.ha-1 increased the ear length, with differences statistically significant obtained at the nitrogen rate of 100 kg.ha-1, except after sunflower as preceding crop and at row spacing of 50 cm. The increasing of ear length determined by nitrogen application is more important in the case of sunflower as preceding crop than in the case of maize as preceding crop (Figure 1). In the case of sunflower as preceding crop, differences statistically significant for row
spacing of 70 cm were registered at nitrogen rate of 50 kg.ha-1, while applying more nitrogen (rate of 100 kg.ha-1) has not conducted to a significant increase in the ear length. Compared to the values of ear length obtained at the nitrogen rate of 100 kg.ha-1, dividing of nitrogen rate of 100 kg.ha-1 in two applications, respectively half of rate (50 kg.ha-1) applied immediately after sowing and half of rate (50 kg.ha-1) applied in the growth stage of eight leaves, decreased the ear length regardless of the preceding crop and row spacing. Ear length registered higher values after maize as preceding crop (12.3 cm in average) than after sunflower as preceding crop (11.3 cm in average). As concerning the row spacing, the values of the ear length were higher at row spacing of 50 cm compared to those obtained at 70 cm when the preceding crop was maize and vice versa when the preceding crop was sunflower. The highest value of the ear length (13.6 cm) was registered under maize as preceding crop, at row spacing of 50 cm and at nitrogen rate of 100 kg.ha-1. The smallest value of the ear length (10.0 cm) was registered under sunflower as preceding crop, without nitrogen application and regardless of the row spacing.
Figure 1. Ear length in different conditions of preceding crops (a- maize, b- sunflower), row spacing (70 cm and 50 cm)
and nitrogen rates (0, 50, 100, and 50+50 kg.ha-1) Number of grains on ear. In average for all experimental variants, the number of grains on ear was of 227. As in the case of ear length, application of nitrogen and increasing of nitrogen rate from 50 to 100 kg.ha-1 increased the number of
grains on ear, with differences statistically significant obtained at the rate of 100 kg.ha-1. The increasing of the number of grains on ear determined by nitrogen application is more important in the case of sunflower as preceding
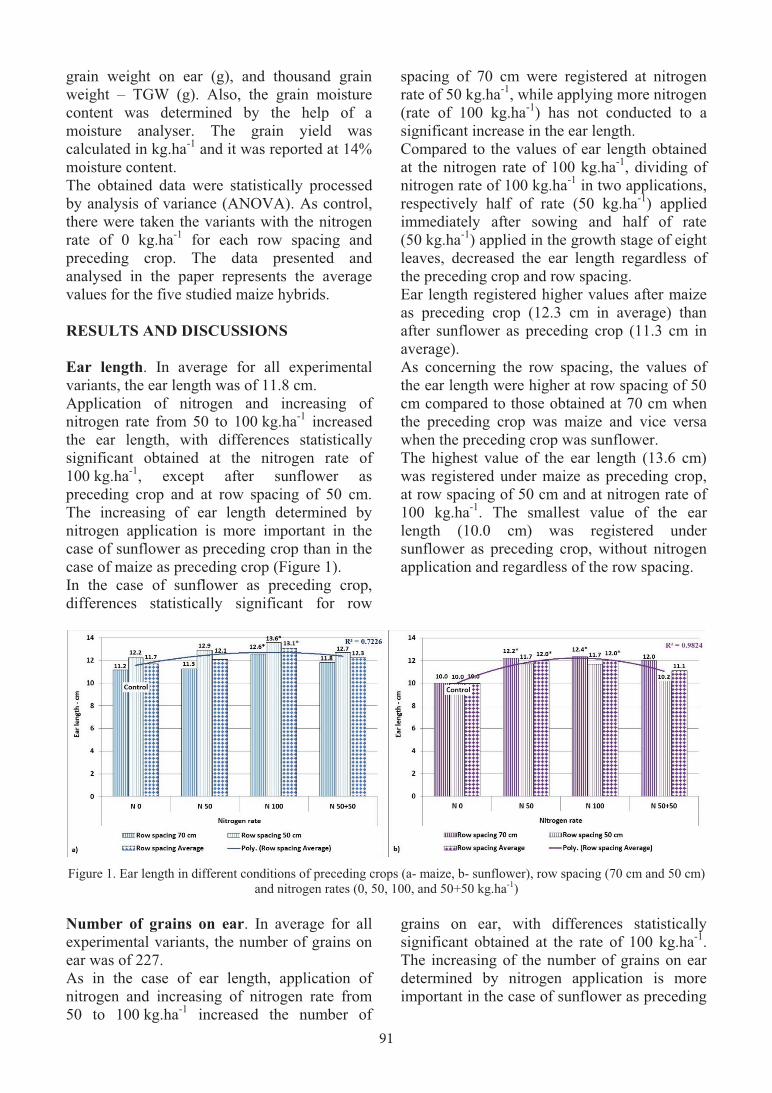
91
have been identified, many of the rotation factors, processes and mechanisms responsible for increased yield and other benefits need to be better understood (Berzsenyi et al., 2000). Nitrogen application are among the management methods that can increase maize grain yields (Stanger and Lauer, 2008). Maize is known to be a heavy feeder of nitrogen fertilizer (Muhamman et al., 2014). Nevertheless, at high application rates the efficiency of nitrogen use is reduced and the risk of nitrogen loss in soil-plant systems is increased (Chakwizira et al., 2016). Therefore, best nitrogen management practices are the pre-requisite to warrant high maize yield (Wasaya et al., 2012). Generally, maize is cultivated in wide spaced rows (Nik et al., 2011), but decreasing the distance between neighbour rows at any particular plant population has several potential advantages (Sangoi et al., 2001). Planting maize in narrow rows results in a more equidistant spacing of plants, which theoretically assumes to minimize the competition among plants for water, nutrients and sunlight (Gobeze et al., 2012). Preceding crop, nitrogen rate and row spacing represent crop technology elements that the maize grower can manipulate according to his production objective, this being even more of interest in drought conditions. From this perspective, the aim of this paper is to present the results regarding the yield components and the grain yield at maize under drought and different crop technology conditions (two preceding crops, two row spacing and four nitrogen rates) in the specific growing conditions from South Romania. MATERIALS AND METHODS Researches were performed in a field experiment in the year 2016, under rainfed conditions. The field experiment was located in South Romania (44o29’ N latitude and 26o15’ E longitude), within Moara Domnească Experimental Farm belonging to the University of Agronomic Sciences and Veterinary Medicine of Bucharest. In the field experiments there were sowed five maize hybrids, respectively: Aristide (FAO precocity group 400), LG 34.90 (FAO
precocity group 490), Janett (FAO precocity group 550), ES Feria (FAO precocity group 550), Mikado (FAO precocity group 550). Each of the five maize hybrids were sowed in the conditions of two preceding crops (sunflower and maize), two row spacing (70 and 50 cm) and four nitrogen rates (0 kg.ha-1; 50 kg.ha-1; 100 kg.ha-1; 50+50 kg.ha-1). Nitrogen fertilization was done immediately after sowing, except for the experimental variant 50+50 kg.ha-1 for which half of rate (50 kg.ha-1) was applied immediately after sowing and the other half (50 kg.ha-1) was applied in the vegetation period, in the growth stage of eight leaves. As fertilizer, it was used the ammonium nitrite with 33.5% nitrogen content. Soil tillage consisted in ploughing performed on 30th of October 2015, followed by a disc harrow work performed in the next spring, on 18th of March 2016. The seedbed was prepared before sowing by the help of a combinatory. Sowing was performed on 8th of April 2016 and the plant density was of 70,000 plants.ha-1. The weed control was performed by the help of herbicides applied on 19th of May 2016, when the maize plants were in the stage of four leaves. It was used the herbicide Dicopur Top 464 SL (active substance acid 2.4D 344 g.l-1 + dicamba 120 g.l-1) applied in a rate of 1 l.ha-1, which was applied together with the herbicide Titus 25 DF (active substance rimsulfuron metil 250 g.kg-1) in a rate of 50 g.ha-1. Also, it was added together with the herbicides the adjuvant Trend 90 in a rate of 200 ml.ha-1. The soil from the field experiment area is reddish preluvosoil, which has a humus content of 2.2-2.8%, a pH between 6.2 and 6.6, and a clay loam texture. The climatic conditions for the period April-August, respectively for the growing period of maize plants, are characterised by the multiannual average temperature of 18.5oC and the multiannual average rainfall of 313.2 mm, while the values registered in 2016 were of 20.1oC and respectively 284 mm. As a result, the year 2016 is characterised as a warmer and drier year for the studying area. At full maturity stage, the ears from one square meter in each experimental variant were analysed. The following determinations of the yield components were performed: ear length (cm), number of grains on ear, ear weight (g),
grain weight on ear (g), and thousand grain weight – TGW (g). Also, the grain moisture content was determined by the help of a moisture analyser. The grain yield was calculated in kg.ha-1 and it was reported at 14% moisture content. The obtained data were statistically processed by analysis of variance (ANOVA). As control, there were taken the variants with the nitrogen rate of 0 kg.ha-1 for each row spacing and preceding crop. The data presented and analysed in the paper represents the average values for the five studied maize hybrids. RESULTS AND DISCUSSIONS Ear length. In average for all experimental variants, the ear length was of 11.8 cm. Application of nitrogen and increasing of nitrogen rate from 50 to 100 kg.ha-1 increased the ear length, with differences statistically significant obtained at the nitrogen rate of 100 kg.ha-1, except after sunflower as preceding crop and at row spacing of 50 cm. The increasing of ear length determined by nitrogen application is more important in the case of sunflower as preceding crop than in the case of maize as preceding crop (Figure 1). In the case of sunflower as preceding crop, differences statistically significant for row
spacing of 70 cm were registered at nitrogen rate of 50 kg.ha-1, while applying more nitrogen (rate of 100 kg.ha-1) has not conducted to a significant increase in the ear length. Compared to the values of ear length obtained at the nitrogen rate of 100 kg.ha-1, dividing of nitrogen rate of 100 kg.ha-1 in two applications, respectively half of rate (50 kg.ha-1) applied immediately after sowing and half of rate (50 kg.ha-1) applied in the growth stage of eight leaves, decreased the ear length regardless of the preceding crop and row spacing. Ear length registered higher values after maize as preceding crop (12.3 cm in average) than after sunflower as preceding crop (11.3 cm in average). As concerning the row spacing, the values of the ear length were higher at row spacing of 50 cm compared to those obtained at 70 cm when the preceding crop was maize and vice versa when the preceding crop was sunflower. The highest value of the ear length (13.6 cm) was registered under maize as preceding crop, at row spacing of 50 cm and at nitrogen rate of 100 kg.ha-1. The smallest value of the ear length (10.0 cm) was registered under sunflower as preceding crop, without nitrogen application and regardless of the row spacing.
Figure 1. Ear length in different conditions of preceding crops (a- maize, b- sunflower), row spacing (70 cm and 50 cm)
and nitrogen rates (0, 50, 100, and 50+50 kg.ha-1) Number of grains on ear. In average for all experimental variants, the number of grains on ear was of 227. As in the case of ear length, application of nitrogen and increasing of nitrogen rate from 50 to 100 kg.ha-1 increased the number of
grains on ear, with differences statistically significant obtained at the rate of 100 kg.ha-1. The increasing of the number of grains on ear determined by nitrogen application is more important in the case of sunflower as preceding

92
crop than in the case of maize as preceding crop (Figure 2). In the case of sunflower as preceding crop, differences statistically significant for row spacing of 70 cm were registered at nitrogen rate of 50 kg.ha-1. Applying more nitrogen (rate of 100 kg.ha-1) has conducted to a significant increase in the number of grains on ear. Compared to the values of the number of grains on ear obtained at the nitrogen rate of 100 kg.ha-1, dividing of nitrogen rate of 100 kg.ha-1 in two applications (half of rate applied immediately after sowing and half of rate applied in the growth stage of eight leaves) decreased the number of grains on ear regardless of the preceding crop and row spacing. However, dividing of nitrogen rate of 100 kg.ha-1 in the case of sunflower as preceding crop has not determined important reduction of the number of grains on ear for the row spacing of 70 cm, while for the row spacing of 50 cm the differences were very important.
Number of grains on ear registered higher values after maize as preceding crop (278 in average) than after sunflower as preceding crop (255 in average). As concerning the row spacing, the values of the number of grains on ear were higher at row spacing of 50 cm than at row spacing of 70 cm when the preceding crop was maize and vice versa when the preceding crop was sunflower. In has to be underlined that in the case of sunflower as preceding crop, dividing of the nitrogen rate of 100 kg.ha-1 in two applications led to important differences between the two row spacing in favour of 70 cm between rows. The highest value of the number of grains on ear (358) was registered under maize as preceding crop, at row spacing of 50 cm and at nitrogen rate of 100 kg.ha-1. The smallest value of the number of grains on ear (195) was registered under sunflower as preceding crop, without nitrogen application and at row spacing of 50 cm.
Figure 2. Number of grains on ear in different conditions of preceding crops (a- maize, b- sunflower), row spacing
(70 cm and 50 cm) and nitrogen rates (0, 50, 100, and 50+50 kg.ha-1) Ear weight. In average for all experimental variants, the ear weight was of 62.1 g. Administration of nitrogen and increasing of nitrogen rate from 50 to 100 kg.ha-1 increased the ear weight, with differences statistically significant obtained at the rate of 100 kg.ha-1, except for the situation when the preceding crop was maize and the row spacing was of 50 cm. The increasing of ear weight determined by nitrogen application is more important in the case of sunflower as preceding crop than in the case of maize as preceding crop (Figure 3). In the case of sunflower as preceding crop, differences statistically significant were
registered also at nitrogen rate of 50 kg.ha-1 for row spacing of 50 cm. Compared to the values of the ear weight obtained at the nitrogen rate of 100 kg.ha-1, dividing of nitrogen rate of 100 kg.ha-1 in two applications (half of rate applied immediately after sowing and half of rate applied in the growth stage of eight leaves) decreased the ear weight regardless of the preceding crop and row spacing. However, dividing of nitrogen rate of 100 kg.ha-1 in the case of sunflower as preceding crop and row spacing of 70 cm has not determined important reduction of the ear
weight, while for the row spacing of 50 cm the differences were very important. Ear weight registered higher values in the case of maize as preceding crop (62.4 g in average) than in the case of sunflower as preceding crop (61.8 g in average). However, by application of nitrogen the ear weight gets higher values after sunflower as preceding crop than after maize as preceding crop (Figure 3). As concerning the row spacing, the values of ear weight were higher at row spacing of 50 cm than at row spacing of 70 cm when the preceding crop was maize and vice versa when the preceding crop was sunflower except for
the row spacing of 70 cm at nitrogen rate of 50 kg.ha-1. In has to be underlined that in the case of sunflower as preceding crop, the nitrogen rate of 100 kg.ha-1, but especially dividing this nitrogen rate in two applications led to important differences between the two row spacing in favour of 70 cm between rows. The highest value of the ear weight (77.83 g) was registered under sunflower as preceding crop, at row spacing of 70 cm and at a nitrogen rate of 100 kg.ha-1. The smallest value of the ear weight (44.59 g) was registered under sunflower as preceding crop, without nitrogen application and at row spacing of 50 cm.
Figure 3. Ear weight in different conditions of preceding crops (a- maize, b- sunflower), row spacing (70 cm and 50 cm)
and nitrogen rates (0, 50, 100, and 50+50 kg.ha-1) Grain weight on ear. In average for all experimental variants, the grain weight on ear was of 52.0 g. Application of nitrogen and increasing of nitrogen rate from 50 to 100 kg.ha-1 increased the grain weight on ear, with differences statistically significant obtained at the rate of 100 kg.ha-1. The increasing of grain weight on ear determined by nitrogen application is more important in the case of sunflower as preceding crop than in the case of maize as preceding crop (Figure 4). In the case of sunflower as preceding crop, differences statistically significant were registered also at nitrogen rate of 50 kg.ha-1. Compared to the values of the grain weight on ear obtained at the nitrogen rate of 100 kg.ha-1, dividing of nitrogen rate of 100 kg.ha-1 in two applications (half of rate applied immediately after sowing and half of rate applied in the growth stage of eight leaves) decreased the grain weight on ear regardless of the preceding
crop and row spacing. However, dividing of nitrogen rate of 100 kg.ha-1 after sunflower as preceding crop and row spacing of 70 cm has not determined important reduction of the grain weight on ear, while for the row spacing of 50 cm the differences were very important. Grain weight on ear registered higher values after maize as preceding crop (52.2 g in average) than after sunflower as preceding crop (51.9 g in average). However, by application of nitrogen the grain weight on ear gets higher values after sunflower as preceding crop than after maize as preceding crop. As concerning the row spacing, the values of the grain weight on ear were higher at row spacing of 50 cm than at row spacing of 70 cm when the preceding crop was maize and vice versa when the preceding crop was sunflower. In has to be underlined that in the case of sunflower as preceding crop, dividing of nitrogen rate of 100 kg.ha-1 in two applications

93
crop than in the case of maize as preceding crop (Figure 2). In the case of sunflower as preceding crop, differences statistically significant for row spacing of 70 cm were registered at nitrogen rate of 50 kg.ha-1. Applying more nitrogen (rate of 100 kg.ha-1) has conducted to a significant increase in the number of grains on ear. Compared to the values of the number of grains on ear obtained at the nitrogen rate of 100 kg.ha-1, dividing of nitrogen rate of 100 kg.ha-1 in two applications (half of rate applied immediately after sowing and half of rate applied in the growth stage of eight leaves) decreased the number of grains on ear regardless of the preceding crop and row spacing. However, dividing of nitrogen rate of 100 kg.ha-1 in the case of sunflower as preceding crop has not determined important reduction of the number of grains on ear for the row spacing of 70 cm, while for the row spacing of 50 cm the differences were very important.
Number of grains on ear registered higher values after maize as preceding crop (278 in average) than after sunflower as preceding crop (255 in average). As concerning the row spacing, the values of the number of grains on ear were higher at row spacing of 50 cm than at row spacing of 70 cm when the preceding crop was maize and vice versa when the preceding crop was sunflower. In has to be underlined that in the case of sunflower as preceding crop, dividing of the nitrogen rate of 100 kg.ha-1 in two applications led to important differences between the two row spacing in favour of 70 cm between rows. The highest value of the number of grains on ear (358) was registered under maize as preceding crop, at row spacing of 50 cm and at nitrogen rate of 100 kg.ha-1. The smallest value of the number of grains on ear (195) was registered under sunflower as preceding crop, without nitrogen application and at row spacing of 50 cm.
Figure 2. Number of grains on ear in different conditions of preceding crops (a- maize, b- sunflower), row spacing
(70 cm and 50 cm) and nitrogen rates (0, 50, 100, and 50+50 kg.ha-1) Ear weight. In average for all experimental variants, the ear weight was of 62.1 g. Administration of nitrogen and increasing of nitrogen rate from 50 to 100 kg.ha-1 increased the ear weight, with differences statistically significant obtained at the rate of 100 kg.ha-1, except for the situation when the preceding crop was maize and the row spacing was of 50 cm. The increasing of ear weight determined by nitrogen application is more important in the case of sunflower as preceding crop than in the case of maize as preceding crop (Figure 3). In the case of sunflower as preceding crop, differences statistically significant were
registered also at nitrogen rate of 50 kg.ha-1 for row spacing of 50 cm. Compared to the values of the ear weight obtained at the nitrogen rate of 100 kg.ha-1, dividing of nitrogen rate of 100 kg.ha-1 in two applications (half of rate applied immediately after sowing and half of rate applied in the growth stage of eight leaves) decreased the ear weight regardless of the preceding crop and row spacing. However, dividing of nitrogen rate of 100 kg.ha-1 in the case of sunflower as preceding crop and row spacing of 70 cm has not determined important reduction of the ear
weight, while for the row spacing of 50 cm the differences were very important. Ear weight registered higher values in the case of maize as preceding crop (62.4 g in average) than in the case of sunflower as preceding crop (61.8 g in average). However, by application of nitrogen the ear weight gets higher values after sunflower as preceding crop than after maize as preceding crop (Figure 3). As concerning the row spacing, the values of ear weight were higher at row spacing of 50 cm than at row spacing of 70 cm when the preceding crop was maize and vice versa when the preceding crop was sunflower except for
the row spacing of 70 cm at nitrogen rate of 50 kg.ha-1. In has to be underlined that in the case of sunflower as preceding crop, the nitrogen rate of 100 kg.ha-1, but especially dividing this nitrogen rate in two applications led to important differences between the two row spacing in favour of 70 cm between rows. The highest value of the ear weight (77.83 g) was registered under sunflower as preceding crop, at row spacing of 70 cm and at a nitrogen rate of 100 kg.ha-1. The smallest value of the ear weight (44.59 g) was registered under sunflower as preceding crop, without nitrogen application and at row spacing of 50 cm.
Figure 3. Ear weight in different conditions of preceding crops (a- maize, b- sunflower), row spacing (70 cm and 50 cm)
and nitrogen rates (0, 50, 100, and 50+50 kg.ha-1) Grain weight on ear. In average for all experimental variants, the grain weight on ear was of 52.0 g. Application of nitrogen and increasing of nitrogen rate from 50 to 100 kg.ha-1 increased the grain weight on ear, with differences statistically significant obtained at the rate of 100 kg.ha-1. The increasing of grain weight on ear determined by nitrogen application is more important in the case of sunflower as preceding crop than in the case of maize as preceding crop (Figure 4). In the case of sunflower as preceding crop, differences statistically significant were registered also at nitrogen rate of 50 kg.ha-1. Compared to the values of the grain weight on ear obtained at the nitrogen rate of 100 kg.ha-1, dividing of nitrogen rate of 100 kg.ha-1 in two applications (half of rate applied immediately after sowing and half of rate applied in the growth stage of eight leaves) decreased the grain weight on ear regardless of the preceding
crop and row spacing. However, dividing of nitrogen rate of 100 kg.ha-1 after sunflower as preceding crop and row spacing of 70 cm has not determined important reduction of the grain weight on ear, while for the row spacing of 50 cm the differences were very important. Grain weight on ear registered higher values after maize as preceding crop (52.2 g in average) than after sunflower as preceding crop (51.9 g in average). However, by application of nitrogen the grain weight on ear gets higher values after sunflower as preceding crop than after maize as preceding crop. As concerning the row spacing, the values of the grain weight on ear were higher at row spacing of 50 cm than at row spacing of 70 cm when the preceding crop was maize and vice versa when the preceding crop was sunflower. In has to be underlined that in the case of sunflower as preceding crop, dividing of nitrogen rate of 100 kg.ha-1 in two applications

94
led to important differences between the two row spacing in favour of 70 cm between rows. The highest value of the grain weight on ear (63.13 g) was registered under sunflower as preceding crop, at row spacing of 70 cm and at
a nitrogen rate of 100 kg.ha-1. The smallest value of the grain weight on ear (38.12 g) was registered under sunflower as preceding crop, without nitrogen application and at row spacing of 50 cm.
Figure 4. Grain weight on ear in different conditions of preceding crops (a- maize, b- sunflower), row spacing (70 cm
and 50 cm) and nitrogen rates (0, 50, 100, and 50+50 kg.ha-1) Thousand grain weight (TGW). In average for all experimental variants, TGW was of 204 g. If all the other yielding components have registered significant smaller values than normal ones for the studied area because of the drought conditions registered in 2016, the TGW is just at low limits for the studied areas. Application of nitrogen and increasing of nitrogen rate from 50 to 100 kg.ha-1 decreased the TGW, but without differences statistically significant. The decrease was more important in the case of maize as preceding crop and less important in the case of sunflower as preceding crop (Figure 5). Contrary to the situation recorded for all the other yielding components, TGW registered higher values in the case of sunflower as preceding crop (211 g in average) than in the case of maize as preceding crop (197 g in average). Also contrary to the situation recorded for all the other yielding components, the values of TGW were higher at row spacing of 70 cm than at 50 cm when the preceding crop was maize, but also when the preceding crop was sunflower at nitrogen rate of 100 kg.ha-1 (in both one and two applications). The highest value of the TGW (224 g) was registered under sunflower as preceding crop, at row spacing of 70 cm and at no nitrogen application. The smallest value of the TGW
(181 g) was registered under maize as preceding crop, with nitrogen rate of 50 kg.ha-1 and at row spacing of 50 cm. Grain yield at 14% moisture content. In average for all experimental variants, the grain yield was of 3,761 kg.ha-1. Application of nitrogen and increasing of nitrogen rate from 50 to 100 kg.ha-1 increased the grain yield, with differences statistically significant obtained at the rate of 100 kg.ha-1 (Figure 6). Compared to the values of the grain yield obtained at the nitrogen rate of 100 kg.ha-1, dividing of nitrogen rate of 100 kg.ha-1 in two applications (half of rate applied immediately after sowing and half of rate applied in the growth stage of eight leaves) decreased the grain yield. It happened regardless of the preceding crop and row spacing except for sunflower as preceding crop and row spacing of 70 cm, when dividing of nitrogen rate increased the grain yield, while at row spacing of 50 cm the grain yield decreased significantly. Grain yield registered higher values in the case of sunflower as preceding crop (3,952 kg.ha-1 in average) than in the case of maize as preceding crop (3,570 kg.ha-1 in average). It has to be emphasized that without nitrogen application, sunflower as preceding crop leaded to an average grain yield (3,107 kg.ha-1) higher
than that obtained in the case of maize as preceding crop (2,588 kg.ha-1). As concerning the row spacing, the values of the grain yield were higher at row spacing of 50 cm than at row spacing of 70 cm when the preceding crop was maize and vice versa when the preceding crop was sunflower, but with smaller differences between the two row spacing, except for the dividing of the nitrogen rate of 100 kg.ha-1.
The highest value of the grain yield (5,214 kg.ha-1) was registered under sunflower as preceding crop, at row spacing of 70 cm and at a nitrogen rate of 100 kg.ha-1 divided in tow application. The smallest value of the grain yield (2,182 kg.ha-1) was registered under maize as preceding crop, without nitrogen application and at row spacing of 70 cm.
Figure 5. Thousand grain weight (TGW) in different conditions of preceding crops (a- maize, b- sunflower), row
spacing (70 cm and 50 cm) and nitrogen rates (0, 50, 100, and 50+50 kg.ha-1)
Figure 6. Grain yield at 14% moisture content in different conditions of preceding crops (a- maize, b- sunflower), row
spacing (70 cm and 50 cm) and nitrogen rates (0, 50, 100, and 50+50 kg.ha-1) CONCLUSIONS The obtained values of yield components and the grain yield are smaller than normal ones for the studied area because of the drought conditions registered in the year 2016. Application of nitrogen and increasing of nitrogen rate from 50 to 100 kg.ha-1 increased the grain yield and the values of the yield components except for TGW, generally with
differences statistically significant obtained at the rate of 100 kg.ha-1. Contrary to all the other yielding components, TGW decreased by application of nitrogen and increasing of nitrogen rate from 50 to 100 kg.ha-1. Generally, the increasing of the values of the yielding components (except TGW) determined by nitrogen application is more important in the
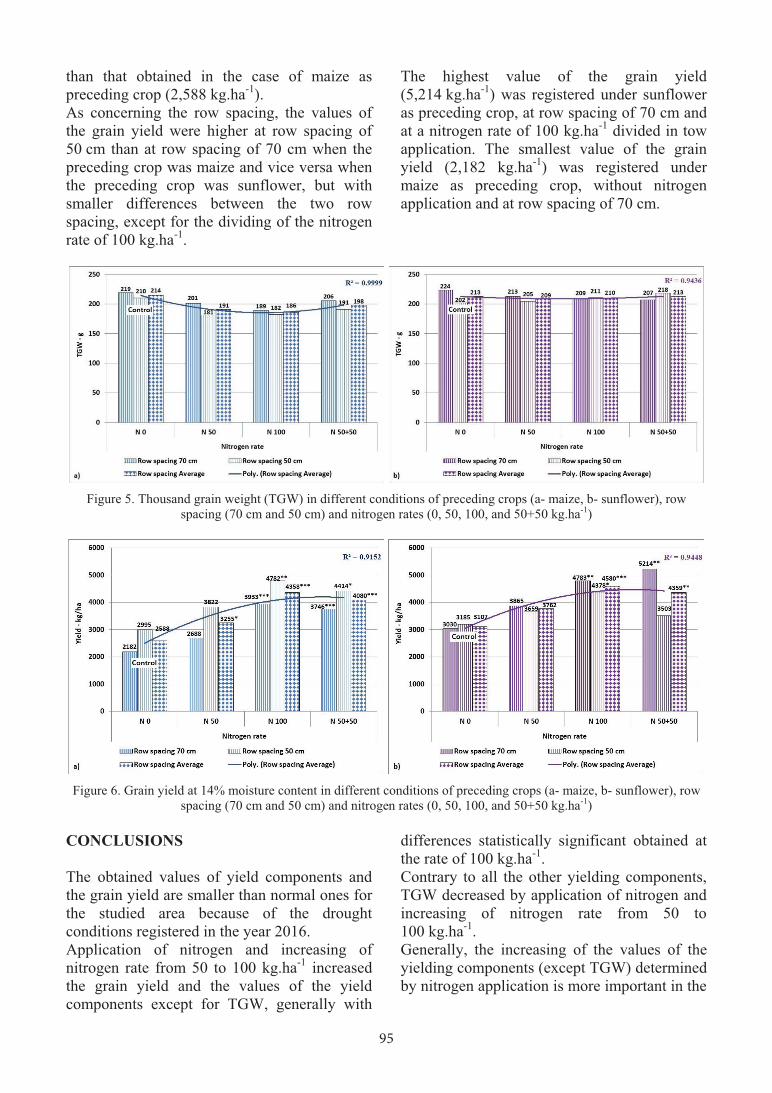
95
led to important differences between the two row spacing in favour of 70 cm between rows. The highest value of the grain weight on ear (63.13 g) was registered under sunflower as preceding crop, at row spacing of 70 cm and at
a nitrogen rate of 100 kg.ha-1. The smallest value of the grain weight on ear (38.12 g) was registered under sunflower as preceding crop, without nitrogen application and at row spacing of 50 cm.
Figure 4. Grain weight on ear in different conditions of preceding crops (a- maize, b- sunflower), row spacing (70 cm
and 50 cm) and nitrogen rates (0, 50, 100, and 50+50 kg.ha-1) Thousand grain weight (TGW). In average for all experimental variants, TGW was of 204 g. If all the other yielding components have registered significant smaller values than normal ones for the studied area because of the drought conditions registered in 2016, the TGW is just at low limits for the studied areas. Application of nitrogen and increasing of nitrogen rate from 50 to 100 kg.ha-1 decreased the TGW, but without differences statistically significant. The decrease was more important in the case of maize as preceding crop and less important in the case of sunflower as preceding crop (Figure 5). Contrary to the situation recorded for all the other yielding components, TGW registered higher values in the case of sunflower as preceding crop (211 g in average) than in the case of maize as preceding crop (197 g in average). Also contrary to the situation recorded for all the other yielding components, the values of TGW were higher at row spacing of 70 cm than at 50 cm when the preceding crop was maize, but also when the preceding crop was sunflower at nitrogen rate of 100 kg.ha-1 (in both one and two applications). The highest value of the TGW (224 g) was registered under sunflower as preceding crop, at row spacing of 70 cm and at no nitrogen application. The smallest value of the TGW
(181 g) was registered under maize as preceding crop, with nitrogen rate of 50 kg.ha-1 and at row spacing of 50 cm. Grain yield at 14% moisture content. In average for all experimental variants, the grain yield was of 3,761 kg.ha-1. Application of nitrogen and increasing of nitrogen rate from 50 to 100 kg.ha-1 increased the grain yield, with differences statistically significant obtained at the rate of 100 kg.ha-1 (Figure 6). Compared to the values of the grain yield obtained at the nitrogen rate of 100 kg.ha-1, dividing of nitrogen rate of 100 kg.ha-1 in two applications (half of rate applied immediately after sowing and half of rate applied in the growth stage of eight leaves) decreased the grain yield. It happened regardless of the preceding crop and row spacing except for sunflower as preceding crop and row spacing of 70 cm, when dividing of nitrogen rate increased the grain yield, while at row spacing of 50 cm the grain yield decreased significantly. Grain yield registered higher values in the case of sunflower as preceding crop (3,952 kg.ha-1 in average) than in the case of maize as preceding crop (3,570 kg.ha-1 in average). It has to be emphasized that without nitrogen application, sunflower as preceding crop leaded to an average grain yield (3,107 kg.ha-1) higher
than that obtained in the case of maize as preceding crop (2,588 kg.ha-1). As concerning the row spacing, the values of the grain yield were higher at row spacing of 50 cm than at row spacing of 70 cm when the preceding crop was maize and vice versa when the preceding crop was sunflower, but with smaller differences between the two row spacing, except for the dividing of the nitrogen rate of 100 kg.ha-1.
The highest value of the grain yield (5,214 kg.ha-1) was registered under sunflower as preceding crop, at row spacing of 70 cm and at a nitrogen rate of 100 kg.ha-1 divided in tow application. The smallest value of the grain yield (2,182 kg.ha-1) was registered under maize as preceding crop, without nitrogen application and at row spacing of 70 cm.
Figure 5. Thousand grain weight (TGW) in different conditions of preceding crops (a- maize, b- sunflower), row
spacing (70 cm and 50 cm) and nitrogen rates (0, 50, 100, and 50+50 kg.ha-1)
Figure 6. Grain yield at 14% moisture content in different conditions of preceding crops (a- maize, b- sunflower), row
spacing (70 cm and 50 cm) and nitrogen rates (0, 50, 100, and 50+50 kg.ha-1) CONCLUSIONS The obtained values of yield components and the grain yield are smaller than normal ones for the studied area because of the drought conditions registered in the year 2016. Application of nitrogen and increasing of nitrogen rate from 50 to 100 kg.ha-1 increased the grain yield and the values of the yield components except for TGW, generally with
differences statistically significant obtained at the rate of 100 kg.ha-1. Contrary to all the other yielding components, TGW decreased by application of nitrogen and increasing of nitrogen rate from 50 to 100 kg.ha-1. Generally, the increasing of the values of the yielding components (except TGW) determined by nitrogen application is more important in the

96
ANALYSIS OF POTENTIAL RISKS IN FEED PRODUCTION AS AN INTEGRAL PART OF FOOD CHAIN
Olivera ĐURAGIĆ, Ivana ČABARKAPA, Radmilo ČOLOVIĆ
University of Novi Sad, Institute of Food Technology, Bulevar Cara Lazara 1, Novi Sad, Serbia
Corresponding author email: [email protected]
Abstract In order to ensure food safety, it is necessary to consider all aspects of the agri-food chain, from the primary agricultural production, including animal feed production to consumer supply, since each of these links in the chain may affect the safety of final products. In the feed production, each unit operation can contribute to the quality and safety risk of feed products. This paper isfocused on the identification and monitoring of critical points in the technological process of feed production, which are usually not covered by the HACCP quality assurance systems. Results of homogeneity and carry over in the critical control points showed that about 25 % of tested feed mills have a problem with residues in the process, which could be potential risk for cross contamination. In the three feed mills level of carry-over was slightly above limits, which may result in the creation of conditions for contamination of the subsequent batch. Additionally, results of the monitoring of Salmonella spp., Escherichia coli, and Staphylococcus aureus presence on the surfaces in feed millsshowed that feed factory environment might also represent one of the potential sources of final product contamination. Results showed that 7% of samples were positive to Salmonella sp. and even 50% of samples were positive on other bacterial contaminants. Introducing adequate control system will contribute to the identification of microbiological contaminants at all stages of production chain (feed-animal-food-human chain), as well on their prevention, which will have a direct impact on food safety and animal and human health. Key words: feed, safety, risk, food chain, Salmonella. INTRODUCTION
Food is considered as a basic human need and the food supply chain cannot be a part of the free market. Food safety is always in a focus of the public, non-governmental organizations, professional associations, international trading partners and international trade organizations. It is necessary to ensure that all stake holdersraise a vote for open and transparent discussion on food legislation and to take steps to inform the public about possible health risk (Sredanovic et al., 2012). In order to ensure food safety, it is necessary to consider all aspects of the agri-food chain, from the primary agricultural production, including animal feed production to consumer supply, since each of these links in the chain may affect the safety of food. Nowadays it is generally accepted that the animal feed production is very important link in the production of safe food of animal origin. Food chain organization includes primary agricultural producers and feed producers, food processors, operators and contractors in transportation and storage, retail
sales and provision of services related to food (together with organizations related to this sector such as manufacturers of vehicles, packaging material, cleaning, and ingredients) (Ryan, 2017). Feed production is an important link of the food chain which should provide sustainable, safe and valuable food products. Feed produ-cers have to ensure systematic control in all stages of production, processing and distri-bution in accordance with EU legislation as well as with good manufacturing practice and other quality systems (HACCP, GMP+, etc.). In the feed production, each unit operation can contribute to the quality and safety risk of feed products. Equipment like transporters, dividers, extractors, cells and bins, mills, scales, mixers, equipment for hydrothermal and mechanical treatments (conditioners, pellet mills, extruders, expanders), coolers, dryers, could be considered as a critical points in the production process from the safety aspect. Potential contamination places can be formed by
case of sunflower as preceding crop than in the case of maize as preceding crop. Compared to the nitrogen rate of 100 kg.ha-1, dividing of nitrogen rate of 100 kg.ha-1 in two applications (half of rate applied immediately after sowing and half of rate applied in the growth stage of eight leaves), decreased the grain yield and yield components (except TGW) regardless of the preceding crop and row spacing. An exception was registered for the grain yield when sunflower was the preceding crop and at row spacing of 70 cm, case when the grain yield increased. Also, dividing of nitrogen rate of 100 kg.ha-1 in two applications when the sunflower was the preceding crop led to important differences between the two row spacing in favour of 70 cm between rows concerning the grain yield as well as yielding components (except TGW). Generally, the values of the grain yield and yielding components (except TGW) were higher at row spacing of 50 cm than at row spacing of 70 cm when the preceding crop was maize and vice versa when the preceding crop was sunflower. Yielding components (except TGW) registered higher values in the case of maize as preceding crop, while TGW and grain yield registered higher values in the case of sunflower as preceding crop. ACKNOWLEDGEMENTS Researches carried out for the elaboration of the present paper were supported by the Romanian Program “Partnerships for Priority Domains”, project PN-II-PT-PCCA-2011-3.2-1778, Contract 45/2012, and by the Faculty of Agriculture, University of Agronomic Sciences and Veterinary Medicine of Bucharest. REFERENCES Berzsenyi Z., Györffy B., Lap D.Q., 2000. Effect of crop
rotation and fertilisation on maize and wheat yields and yield stability in a long-term experiment. European Journal of Agronomy, 13: p. 225-244.
Băşa A.G., Ion V., Dumbravă M., Temocico G., Epure L.I., Ştefan D., 2016. Grain yield and yield components at maize under different preceding crops and nitrogen fertilization conditions. Agriculture and Agricultural Science Procedia, Vol. 10, p. 104-111.
Chakwizira E., Teixeira E.I., de Ruiter J.M., Maley S., George M.J., 2016. Harvest index for biomass and nitrogen in maize crops limited by nitrogen and
water. Proceedings of the 2016 International Nitrogen Initiative Conference, "Solutions to improve nitrogen use efficiency for the world", 4-8 December, Melbourne, Australia, p. 1-5.
Cociu A., Cizmaș G.D., 2015, Maize yield and its stability as affected by tillage and crop residue management in the eastern Romanian Danube Plain. Scientific Papers. Series "AgroLife Journal", Vol. 4 Issue 1, p. 46-51.
Dumbrava M., Basa A.G., Ion V., Dobrin I., 2015. Analysis of the yield components at maize under the specific conditions from South Romanian. Book of Proceedings, Sixth International Scientific Agricultural Symposium „Agrosym 2015“, p. 291-295.
Gobeze Y.L., Ceronio G.M., Van Rensburg L.D., 2012. Effect of row spacing and plant density on yield and yield component of maize (Zea mays L.) under irrigation. Journal of Agricultural Science and Technology B 2, p. 263-271.
Grassini P., Yang H., Cassman K.G., 2009. Limits to Maize Productivity in Western Corn-Belt: A Simulation Analysis for Fully Irrigated and Rainfed Conditions. Agricultural and Forest Meteorology, 149, p. 1254-1265.
Ion V., Dicu G., State D., Fintineru G., Epure L.I., Basa A.G., Toader M., 2013. Yield components of different hybrids of maize (Zea mays L.) cultivated in South Romania under drought conditions. Scientific Papers. Series A. Agonomy, Vol. LVI, p. 276-283.
Ion V., Băşa A.G., Dumbravă M., Epure L.I., Dincă N., Toader M., 2015. Grain yield and yield components at maize under different preceding crops and soil tillage conditions. AgroLife Scientific Journal, Vol. 4, Nr. 2, p. 27-32.
Muhamman M.A., Auwalu B.M., Mohammed S.G., 2014. Response of maize (Zea mays L.) to aqueous extract of moringa (Moringa oleifera Lam.) and nitrogen rates. Part II. Scientific Papers. Series A. Agronomy, Vol. LVII, p. 264-271.
Nik M.M., Babaeian M., Tavassoli A., Asgharzade A., 2011. Effect of Plant Density on Yield and Yield Components of Corn Hybrids (Zea mays). Scientific Research and Essays, 6 (22), p. 4821-4825.
Sangoi L., Ender M., Guidolin A.F., Almeida M.L., Heberle P.C., 2001. Influence of Row Spacing Reduction on Maize Grain Yield in Regions with a Short Summer. Pesq. Agropec. Bras., Vol. 36, No. 6, p. 861-869.
Šeremešić S., Đalović I., Milošev D., Jocković D., Pejić B., 2013. Maize (Zea mays L.) yield stability dependence on crop rotation, fertilization and climatic conditions in a long-term experiment on Haplic Chernozem. Zemdirbyste-Agriculture, 100 (2): p. 137-142.
Stanger T.F., Lauer J.G., 2008. Corn grain yield response to crop rotation and nitrogen over 35 years. Agronomy Journal, Vol. 100 (3): p. 643-650.
Wasaya A., Tahir M., Tanveer A., Yaseen M., 2012. Response of maize to tillage and nitrogen management. The Journal of Animal & Plant Sciences, 22(2), p. 452-456.
97
ANALYSIS OF POTENTIAL RISKS IN FEED PRODUCTION AS AN INTEGRAL PART OF FOOD CHAIN
Olivera ĐURAGIĆ, Ivana ČABARKAPA, Radmilo ČOLOVIĆ
University of Novi Sad, Institute of Food Technology, Bulevar Cara Lazara 1, Novi Sad, Serbia
Corresponding author email: [email protected]
Abstract In order to ensure food safety, it is necessary to consider all aspects of the agri-food chain, from the primary agricultural production, including animal feed production to consumer supply, since each of these links in the chain may affect the safety of final products. In the feed production, each unit operation can contribute to the quality and safety risk of feed products. This paper isfocused on the identification and monitoring of critical points in the technological process of feed production, which are usually not covered by the HACCP quality assurance systems. Results of homogeneity and carry over in the critical control points showed that about 25 % of tested feed mills have a problem with residues in the process, which could be potential risk for cross contamination. In the three feed mills level of carry-over was slightly above limits, which may result in the creation of conditions for contamination of the subsequent batch. Additionally, results of the monitoring of Salmonella spp., Escherichia coli, and Staphylococcus aureus presence on the surfaces in feed millsshowed that feed factory environment might also represent one of the potential sources of final product contamination. Results showed that 7% of samples were positive to Salmonella sp. and even 50% of samples were positive on other bacterial contaminants. Introducing adequate control system will contribute to the identification of microbiological contaminants at all stages of production chain (feed-animal-food-human chain), as well on their prevention, which will have a direct impact on food safety and animal and human health. Key words: feed, safety, risk, food chain, Salmonella. INTRODUCTION
Food is considered as a basic human need and the food supply chain cannot be a part of the free market. Food safety is always in a focus of the public, non-governmental organizations, professional associations, international trading partners and international trade organizations. It is necessary to ensure that all stake holdersraise a vote for open and transparent discussion on food legislation and to take steps to inform the public about possible health risk (Sredanovic et al., 2012). In order to ensure food safety, it is necessary to consider all aspects of the agri-food chain, from the primary agricultural production, including animal feed production to consumer supply, since each of these links in the chain may affect the safety of food. Nowadays it is generally accepted that the animal feed production is very important link in the production of safe food of animal origin. Food chain organization includes primary agricultural producers and feed producers, food processors, operators and contractors in transportation and storage, retail
sales and provision of services related to food (together with organizations related to this sector such as manufacturers of vehicles, packaging material, cleaning, and ingredients) (Ryan, 2017). Feed production is an important link of the food chain which should provide sustainable, safe and valuable food products. Feed produ-cers have to ensure systematic control in all stages of production, processing and distri-bution in accordance with EU legislation as well as with good manufacturing practice and other quality systems (HACCP, GMP+, etc.). In the feed production, each unit operation can contribute to the quality and safety risk of feed products. Equipment like transporters, dividers, extractors, cells and bins, mills, scales, mixers, equipment for hydrothermal and mechanical treatments (conditioners, pellet mills, extruders, expanders), coolers, dryers, could be considered as a critical points in the production process from the safety aspect. Potential contamination places can be formed by
case of sunflower as preceding crop than in the case of maize as preceding crop. Compared to the nitrogen rate of 100 kg.ha-1, dividing of nitrogen rate of 100 kg.ha-1 in two applications (half of rate applied immediately after sowing and half of rate applied in the growth stage of eight leaves), decreased the grain yield and yield components (except TGW) regardless of the preceding crop and row spacing. An exception was registered for the grain yield when sunflower was the preceding crop and at row spacing of 70 cm, case when the grain yield increased. Also, dividing of nitrogen rate of 100 kg.ha-1 in two applications when the sunflower was the preceding crop led to important differences between the two row spacing in favour of 70 cm between rows concerning the grain yield as well as yielding components (except TGW). Generally, the values of the grain yield and yielding components (except TGW) were higher at row spacing of 50 cm than at row spacing of 70 cm when the preceding crop was maize and vice versa when the preceding crop was sunflower. Yielding components (except TGW) registered higher values in the case of maize as preceding crop, while TGW and grain yield registered higher values in the case of sunflower as preceding crop. ACKNOWLEDGEMENTS Researches carried out for the elaboration of the present paper were supported by the Romanian Program “Partnerships for Priority Domains”, project PN-II-PT-PCCA-2011-3.2-1778, Contract 45/2012, and by the Faculty of Agriculture, University of Agronomic Sciences and Veterinary Medicine of Bucharest. REFERENCES Berzsenyi Z., Györffy B., Lap D.Q., 2000. Effect of crop
rotation and fertilisation on maize and wheat yields and yield stability in a long-term experiment. European Journal of Agronomy, 13: p. 225-244.
Băşa A.G., Ion V., Dumbravă M., Temocico G., Epure L.I., Ştefan D., 2016. Grain yield and yield components at maize under different preceding crops and nitrogen fertilization conditions. Agriculture and Agricultural Science Procedia, Vol. 10, p. 104-111.
Chakwizira E., Teixeira E.I., de Ruiter J.M., Maley S., George M.J., 2016. Harvest index for biomass and nitrogen in maize crops limited by nitrogen and
water. Proceedings of the 2016 International Nitrogen Initiative Conference, "Solutions to improve nitrogen use efficiency for the world", 4-8 December, Melbourne, Australia, p. 1-5.
Cociu A., Cizmaș G.D., 2015, Maize yield and its stability as affected by tillage and crop residue management in the eastern Romanian Danube Plain. Scientific Papers. Series "AgroLife Journal", Vol. 4 Issue 1, p. 46-51.
Dumbrava M., Basa A.G., Ion V., Dobrin I., 2015. Analysis of the yield components at maize under the specific conditions from South Romanian. Book of Proceedings, Sixth International Scientific Agricultural Symposium „Agrosym 2015“, p. 291-295.
Gobeze Y.L., Ceronio G.M., Van Rensburg L.D., 2012. Effect of row spacing and plant density on yield and yield component of maize (Zea mays L.) under irrigation. Journal of Agricultural Science and Technology B 2, p. 263-271.
Grassini P., Yang H., Cassman K.G., 2009. Limits to Maize Productivity in Western Corn-Belt: A Simulation Analysis for Fully Irrigated and Rainfed Conditions. Agricultural and Forest Meteorology, 149, p. 1254-1265.
Ion V., Dicu G., State D., Fintineru G., Epure L.I., Basa A.G., Toader M., 2013. Yield components of different hybrids of maize (Zea mays L.) cultivated in South Romania under drought conditions. Scientific Papers. Series A. Agonomy, Vol. LVI, p. 276-283.
Ion V., Băşa A.G., Dumbravă M., Epure L.I., Dincă N., Toader M., 2015. Grain yield and yield components at maize under different preceding crops and soil tillage conditions. AgroLife Scientific Journal, Vol. 4, Nr. 2, p. 27-32.
Muhamman M.A., Auwalu B.M., Mohammed S.G., 2014. Response of maize (Zea mays L.) to aqueous extract of moringa (Moringa oleifera Lam.) and nitrogen rates. Part II. Scientific Papers. Series A. Agronomy, Vol. LVII, p. 264-271.
Nik M.M., Babaeian M., Tavassoli A., Asgharzade A., 2011. Effect of Plant Density on Yield and Yield Components of Corn Hybrids (Zea mays). Scientific Research and Essays, 6 (22), p. 4821-4825.
Sangoi L., Ender M., Guidolin A.F., Almeida M.L., Heberle P.C., 2001. Influence of Row Spacing Reduction on Maize Grain Yield in Regions with a Short Summer. Pesq. Agropec. Bras., Vol. 36, No. 6, p. 861-869.
Šeremešić S., Đalović I., Milošev D., Jocković D., Pejić B., 2013. Maize (Zea mays L.) yield stability dependence on crop rotation, fertilization and climatic conditions in a long-term experiment on Haplic Chernozem. Zemdirbyste-Agriculture, 100 (2): p. 137-142.
Stanger T.F., Lauer J.G., 2008. Corn grain yield response to crop rotation and nitrogen over 35 years. Agronomy Journal, Vol. 100 (3): p. 643-650.
Wasaya A., Tahir M., Tanveer A., Yaseen M., 2012. Response of maize to tillage and nitrogen management. The Journal of Animal & Plant Sciences, 22(2), p. 452-456.
AgroLife Scientific Journal - Volume 6, Number 2, 2017ISSN 2285-5718; ISSN CD-ROM 2285-5726; ISSN ONLINE 2286-0126; ISSN-L 2285-5718

98
inadequate construction of equipment, mal-function, damage or unprofessional conduction of the process (Verstraete, 2013). It is necessary to achieve working accuracy of the whole animal feed production process by risk reduction and avoiding of accumulation of the raw materials and products in critical points of process line. Working accuracy involves maintaining the stability of the dry mixture and avoiding variations in concentration of ingredients and losses due to the retention of the ingredients in whole process line (not only in the mixer). Therefore, the criteria for proving the working accuracy includes three components: • concentration of the additive in the final
product in relation to the declared level; • homogeneity of the additives in the final
mixure; • level of carry over and possible contamination
of the subsequent batch (Djuragic et al., 2007; Vukmirovic et al., 2010).
Taking into account the allowed tolerances, experimentally determined concentration must be within � 10% of the declared concentration and not to exceed the permissible coefficient of variation for homogeneity of the mixture (Djuragic et al., 2009). A deviation of the uniform distribution can have a negative effect on animal health. For example, excessive doses can be fatal to the animals or can leave residues in meat, milk and eggs and throughout excreta can cause environmental pollution. Carry over is the form of contamination which occurs when a substance is transferred from one batch to another. The undesired substances, such as high concentrations of drugs used in a medicated feed or microbiologically contami-nated crusts and residues, should be prevented to contaminate the subsequent batch in a production line. Carry over can occur in a single piece of equipment, or as a result of a combination of residues in the whole produc-tion system. As soon as operators determine the source of carry over, corrective measures can be taken (O’Mahony, 2014). Apart from the above mentioned, the highest microbiological risk in animal feed represents contamination with bacteria from the genus Salmonella spp. With respect to feed safety, preventing Salmonella spp. to enter the agri-
food chain have a great importance in mini-mizing safety risk, since their presence in animal feed is associated with a high risk of animal infection and, consequently throughout animal products, human infections. Therefore it is considered as a major microbial hazard in animal feed (Jones, 2011). The link between Salmonella in animal feed and human salmo-nellosis has been well known for many years. It is widely recognized that, in response to different environmental conditions, bacteria such as Salmonella spp. have developed a variety of strategies to adapt and survive. The formation of multicellular communities, known as biofilms, is one such strategy, which is generally associated with the survival and persistence in different environmental condi-tions (de la Fuente-Núñez et al., 2013; Hall-Stoodley et al., 2004). Contamination of feed production plants with biofilm producing strains usually occurs through contaminated raw material. Contamination may occur at any point from the field to the final product, by aerosol and the human factor. As potential sites for biofilm development, the most often identified are: receiving bin for raw materials, walls, ceilings, drains, pipes, ventilation sys-tems, working area, conveyor belts, the outer and inner surface of processing equipment (especially in blind spots and pockets), cavities, joints, cracks and areas prone to condensation. Although the feed production is mainly based on the "dry food" production, which conside-rably limits the growth and development of microorganisms, due to temperature variations within the production process, in certain areas condensation may occur which can provide sufficient humidity to promote the development of bacterial biofilms, including Salmonella. Studies have shown that microorganisms, especially Salmonella spp. overcome the tem-perature and humidity fluctuation in the equipment of the feed industry by entering into viable but nonculturable (VBNC) stage (Habimana et al., 2010; Habimana et al., 2014; Møretrø et al., 2009). In northern Serbia, in the region of AP Vojvodina, analysis of the presence of Salmonella spp. in samples of animal feed in 2014 and 2015, which were delivered to the Scientific Veterinary Institute in Novi Sad, revealed that Salmonella spp. was detected in 146 samples. In 2014, 101 (19.71%)
out of a total of 1952 analyzed samples, were positive to this bacteria. In the reduction in the number of positive samples occurred since. In 2015 a total of 1612 samples were analyzed, from which 45 (2.7%) were positive to the presence of Salmonella. These findings confirm the fact that the feed and raw materials may represent a significant source of contamination with Salmonella, and place where these severe contaminants can enter the agri-food chain. In favor of the topic, data published by the EFSA (European Food Safety Authority) showed that for European countries (EFSA state) the overall level of Salmonella-positive units in animal- and vegetable-derived feed material in 2015 was 5.13%. In 2014 and 2013, prevalence of 3.8% and 1.4% was reported, respectively, and thus, a slight increase in prevalence of Salmonella-positive units in feed material was observed in 2015 (EFSA, 2016). EFSA also reported that among different matrices, the most commonly tested feed material was soya (bean)-derived feed material with 3,404 samples tested and a mean Salmonella prevalence of 3.7%. Also, high prevalence was reported for meat meal (290 tested, 16.7% positives). In the finished feed for animals (compound feedstuffs), the prevalence of Salmonella-positive units in 2015 was low to very low for all animal species: 1.20% of 2,248 tested samples for cattle, 0.51% of 2,754 tested samples for pigs and 0.67% of 7,961 tested samples for poultry (EFSA, 2016). Next to the raw materials, feed factory environment might also represent one of the potential sources of final product contami-nation. Salmonella spp. can enter the final product by contact with contaminated proce-ssing equipment. Therefore, the aim of this study was to analyze potential risks for the safety in animal feed production and agri-food chain, such as unacceptable working accuracy in the feed mills and bacterial contaminants presence in feed samples and on the surface of the equipment.
MATERIALS AND METHODS Research was focused on the identification and monitoring of critical points of the techno-logical process of feed production, usually not covered by the HACCP quality assurance
systems. Those points were identified as potentially critical points in the technological process as a risk for formation of a hetero-geneous mixture, the cross-contamination and microbial contamination. Following safety parameters were tested: • working accuracy of the whole feed
manufacturing process; • level of carry over and cross-contami-
nation; • microbiological analysis of the swabs taken
from the technological equipment Tests were carried out at feed plants within the territory of Province of Vojvodina. Samples were taken at different points in process (poten-tially critical zones) depending on the pro-duction process. Samples were taken from mixers, hopper, conveyors, chain conveyors, screw conveyors and surge bins as well as du-ring packaging into bags. Determination of homogeneity and carry over level was done by Microtracer® method (Micro Tracers, Inc., San Francisco, CA 94124) as a physical method of homogeneity testing. A sufficient amount of iron filings (Microtracer RF, blue), colored with a soluble die, is added to the mix in mi-xing ratio 1:10.000 (100 g/t).After main batch with Microtracer, two rinsing batches for de-termination of carry over level were performed and samples were taken from the same points. Microbiological analysis of the working surfaces was performed in accordance with the guide for taking swabs from surface area (ISO standard 18593: 2004). Swabs were taken on the surfaces that have been flagged as potentially critical locations in the process, from the surface of 10x10 cm, after they were converted in number of microorganisms per unit area (1 cm2). RESULTS AND DISCUSSIONS Results of homogeneity testing performed in various feed mills in order to check homo-geneity during the whole production process are shown in the Figure 1. It has been shown that in some feed mills homogeneity which was achieved in mixer is slightly changed in the downstream equipment depending on the sampling point. Dry mixtures manipulation within some equipment, such as elevators, long transporting paths, loading bins or chain

99
inadequate construction of equipment, mal-function, damage or unprofessional conduction of the process (Verstraete, 2013). It is necessary to achieve working accuracy of the whole animal feed production process by risk reduction and avoiding of accumulation of the raw materials and products in critical points of process line. Working accuracy involves maintaining the stability of the dry mixture and avoiding variations in concentration of ingredients and losses due to the retention of the ingredients in whole process line (not only in the mixer). Therefore, the criteria for proving the working accuracy includes three components: • concentration of the additive in the final
product in relation to the declared level; • homogeneity of the additives in the final
mixure; • level of carry over and possible contamination
of the subsequent batch (Djuragic et al., 2007; Vukmirovic et al., 2010).
Taking into account the allowed tolerances, experimentally determined concentration must be within � 10% of the declared concentration and not to exceed the permissible coefficient of variation for homogeneity of the mixture (Djuragic et al., 2009). A deviation of the uniform distribution can have a negative effect on animal health. For example, excessive doses can be fatal to the animals or can leave residues in meat, milk and eggs and throughout excreta can cause environmental pollution. Carry over is the form of contamination which occurs when a substance is transferred from one batch to another. The undesired substances, such as high concentrations of drugs used in a medicated feed or microbiologically contami-nated crusts and residues, should be prevented to contaminate the subsequent batch in a production line. Carry over can occur in a single piece of equipment, or as a result of a combination of residues in the whole produc-tion system. As soon as operators determine the source of carry over, corrective measures can be taken (O’Mahony, 2014). Apart from the above mentioned, the highest microbiological risk in animal feed represents contamination with bacteria from the genus Salmonella spp. With respect to feed safety, preventing Salmonella spp. to enter the agri-
food chain have a great importance in mini-mizing safety risk, since their presence in animal feed is associated with a high risk of animal infection and, consequently throughout animal products, human infections. Therefore it is considered as a major microbial hazard in animal feed (Jones, 2011). The link between Salmonella in animal feed and human salmo-nellosis has been well known for many years. It is widely recognized that, in response to different environmental conditions, bacteria such as Salmonella spp. have developed a variety of strategies to adapt and survive. The formation of multicellular communities, known as biofilms, is one such strategy, which is generally associated with the survival and persistence in different environmental condi-tions (de la Fuente-Núñez et al., 2013; Hall-Stoodley et al., 2004). Contamination of feed production plants with biofilm producing strains usually occurs through contaminated raw material. Contamination may occur at any point from the field to the final product, by aerosol and the human factor. As potential sites for biofilm development, the most often identified are: receiving bin for raw materials, walls, ceilings, drains, pipes, ventilation sys-tems, working area, conveyor belts, the outer and inner surface of processing equipment (especially in blind spots and pockets), cavities, joints, cracks and areas prone to condensation. Although the feed production is mainly based on the "dry food" production, which conside-rably limits the growth and development of microorganisms, due to temperature variations within the production process, in certain areas condensation may occur which can provide sufficient humidity to promote the development of bacterial biofilms, including Salmonella. Studies have shown that microorganisms, especially Salmonella spp. overcome the tem-perature and humidity fluctuation in the equipment of the feed industry by entering into viable but nonculturable (VBNC) stage (Habimana et al., 2010; Habimana et al., 2014; Møretrø et al., 2009). In northern Serbia, in the region of AP Vojvodina, analysis of the presence of Salmonella spp. in samples of animal feed in 2014 and 2015, which were delivered to the Scientific Veterinary Institute in Novi Sad, revealed that Salmonella spp. was detected in 146 samples. In 2014, 101 (19.71%)
out of a total of 1952 analyzed samples, were positive to this bacteria. In the reduction in the number of positive samples occurred since. In 2015 a total of 1612 samples were analyzed, from which 45 (2.7%) were positive to the presence of Salmonella. These findings confirm the fact that the feed and raw materials may represent a significant source of contamination with Salmonella, and place where these severe contaminants can enter the agri-food chain. In favor of the topic, data published by the EFSA (European Food Safety Authority) showed that for European countries (EFSA state) the overall level of Salmonella-positive units in animal- and vegetable-derived feed material in 2015 was 5.13%. In 2014 and 2013, prevalence of 3.8% and 1.4% was reported, respectively, and thus, a slight increase in prevalence of Salmonella-positive units in feed material was observed in 2015 (EFSA, 2016). EFSA also reported that among different matrices, the most commonly tested feed material was soya (bean)-derived feed material with 3,404 samples tested and a mean Salmonella prevalence of 3.7%. Also, high prevalence was reported for meat meal (290 tested, 16.7% positives). In the finished feed for animals (compound feedstuffs), the prevalence of Salmonella-positive units in 2015 was low to very low for all animal species: 1.20% of 2,248 tested samples for cattle, 0.51% of 2,754 tested samples for pigs and 0.67% of 7,961 tested samples for poultry (EFSA, 2016). Next to the raw materials, feed factory environment might also represent one of the potential sources of final product contami-nation. Salmonella spp. can enter the final product by contact with contaminated proce-ssing equipment. Therefore, the aim of this study was to analyze potential risks for the safety in animal feed production and agri-food chain, such as unacceptable working accuracy in the feed mills and bacterial contaminants presence in feed samples and on the surface of the equipment.
MATERIALS AND METHODS Research was focused on the identification and monitoring of critical points of the techno-logical process of feed production, usually not covered by the HACCP quality assurance
systems. Those points were identified as potentially critical points in the technological process as a risk for formation of a hetero-geneous mixture, the cross-contamination and microbial contamination. Following safety parameters were tested: • working accuracy of the whole feed
manufacturing process; • level of carry over and cross-contami-
nation; • microbiological analysis of the swabs taken
from the technological equipment Tests were carried out at feed plants within the territory of Province of Vojvodina. Samples were taken at different points in process (poten-tially critical zones) depending on the pro-duction process. Samples were taken from mixers, hopper, conveyors, chain conveyors, screw conveyors and surge bins as well as du-ring packaging into bags. Determination of homogeneity and carry over level was done by Microtracer® method (Micro Tracers, Inc., San Francisco, CA 94124) as a physical method of homogeneity testing. A sufficient amount of iron filings (Microtracer RF, blue), colored with a soluble die, is added to the mix in mi-xing ratio 1:10.000 (100 g/t).After main batch with Microtracer, two rinsing batches for de-termination of carry over level were performed and samples were taken from the same points. Microbiological analysis of the working surfaces was performed in accordance with the guide for taking swabs from surface area (ISO standard 18593: 2004). Swabs were taken on the surfaces that have been flagged as potentially critical locations in the process, from the surface of 10x10 cm, after they were converted in number of microorganisms per unit area (1 cm2). RESULTS AND DISCUSSIONS Results of homogeneity testing performed in various feed mills in order to check homo-geneity during the whole production process are shown in the Figure 1. It has been shown that in some feed mills homogeneity which was achieved in mixer is slightly changed in the downstream equipment depending on the sampling point. Dry mixtures manipulation within some equipment, such as elevators, long transporting paths, loading bins or chain

100
conveyers, had negative influence on mixture stability. In considerable number of feed mills coefficient of variation for homogeneity of mixture was lower than 10%, which is accep-table from the quality and safety point of view. However, results of homogeneity in the three feed mills (feed mills no. 5, 9, and 10) it can be seen that coefficient of variation was higher than 10% from the beginning of process (from
the mixer) and through the whole production line. Such results are indicating that in these mills level of some ingredients in complete mixtures might exceed prescript values, which impose a potential risk for negative effect on an animal health. Furthermore, results of homogeneity also in the line with the carry over results (Table 1).
Figure 1. Homogeneity of production line in different feed mills
Table 1 shows the results of the level of carry over in the tested feed mills. When compare the results from both technological tests an increased level of carry-over was detected in places where there was no satisfactory homo-geneity. Unlike the homogeneity, according to Serbian legislation, there is no declared level for carry over in feed production. Based on European research and experience in some of the EU countries, it is considered that the level of carry over should not exceed 4% in the production of compound feed and up to 1% in premix production.
As was the case with the homogeneity tests, in the feed mills no. 5, 9, and 10, level of carry-over was slightly above those limits, which may result in the creation of conditions for contamination of the subsequent batch.As was already pointed out, depending on the environmental conditions (temperature, humidity), feed mills could be suspected to microbial contamination which one of the major threats that can negatively affect food chain security.
Table 1. Results of carry over tests in feed mills
Place of sampling 1 2 3 4 5 6 7 8 9 10 11 12 Level of carry over, % Mixer 1.2 0.1 3.4 0.8 3.9 0. 9 1.4 0 3.4 3.9 1.3 0.5 Bin after mixer 1.1 0.5 3.0 0.7 3.6 0.6 1.1 0.5 3.3 4.5 1.0 0.9 Elevator 2.3 1.1 2.4 0.8 3.9 - 0.8 0.6 4.1 4.4 1.1 1.0 Chain conveyer - - 2.4 - 4.1 - - - - 2.9 - - Screw conveyer 1.2 0.9 - - - 0.5 0.9 - - - - - Packaging 1.4 1.1 3.8 2.0 4.3 0.9 1.5 0.1 5.2 4.9 1.2 0.8 Mean value 1.44 0.74 3.0 1.07 3.96 0.66 1.14 0.3 4.0 4.12 1.15 0.8
Results of monitoring environmental hygiene in feed factory environments are presented in Table 2. Out of 100 analyzed samples collected
from various parts of feed factories, 10 were positive to presence of E. coli, and 7 to Salmonella spp. Presence of S. aureus was not
identified. Enterobacteriaceae in the amount of >100 cfu/cm2 were detected in 23 analyzed samples. Therefore, the monitoring of microor-ganisms contamination, especially the Salmonella spp. on the surfaces within feed factories, confirmed that the environment might also represent one of the potential sources of final product contamination. The presence of other types of microorganisms, other than Salmonella spp., is important in terms of their ability to form biofilms. Research conducted by Davies and Wray (1997) is in line with the results of this study. These researchers also suggested a link between Salmonella contamination within feed mills and management or environment.
In Western Balkan region, a permanent monitoring of feed factory environments and bacterial contamination of animal feed is still not adequately integrated into the programs for monitoring microbial contamination of pro-ducts of animal origin for human consumption and the occurrence of human alimentary infections. Introducing adequate control system like in some Scandinavian countries will contribute to the identification of microbiological contaminants at all stages of production chain (feed-animal-food-human chain), as well on their prevention, which will have a direct impact on food safety and public health.
Table 2. Monitoring environmental hygiene in feed factory environments
No. Surface area Number of tested sample
Enterobacteriaceae >100
E. coli (+/-)
S. aureus (+/-)
Salmonella (+/-)
Number of positive sample according to criteria
1. Elevator for raw materials 5 3 1 0 1 2. Screw transporter that follows elevator 5 3 1 0 0 3. Elevator between scale and mixer 5 3 2 0 0 4. Mixer 5 4 3 0 3 5. Receiving hopper below mixer 5 1 0 0 0 6. Elevator between mixer 5 2 2 0 0 7. Surge bin 5 2 0 0 1 8. Conditioner before pellet press 5 2 0 0 1 9. Pellet press 5 0 0 0 0 10. Cooler 5 3 1 0 1
Σ 100 23 10 0 7
CONCLUSIONS Based on the obtained results, it can be concluded that in the 25% feed mills homogeneity in the process was not satisfactory, since coefficient of variation of series of samples, was higher than 10%. In all of feed mills with high coefficient of variation, homogeneity nor been achieved in the mixer, neither was improved during downstream processing. Insufficient homogeneity was prerequisite for carry over in the subsequent batches and potential risk for animal health. Results of microbiological swabs have shown presence of some bacterial species in the feed mills, 7% of samples were positive on Salmonella spp. while totally 50% of tested samples were positive on other Enterobacteriaceae including E. coli. Presence of these contaminants on the equipment
surfaces might cause risk for the feed products contamination, and throughout the animal products, potential risk for the contamination of food. ACKNOWLEDGEMENTS This research work was carried out with the support of Provincial Secretary for Higher Education and Scientific Research and funded by project APV No. 142-451-2518/2017-01/02. REFERENCES Adolphs J., Kleinjung F., Numata J., Mielke H.,
Abraham K., Schafft H., Müller-Graf C., Greiner M., 2013. A probabilistic model for the carry-over of PCDD/Fs from feed to growing pigs. Chemosphere, Volume 93, Issue 3, p. 474-479.
Davies R.H., Wales A.D., 2013. Salmonella contamination of cereal ingredients for animal feeds. Veterinary Microbiology, Volume 166, Issues 3–4, p. 543-549.
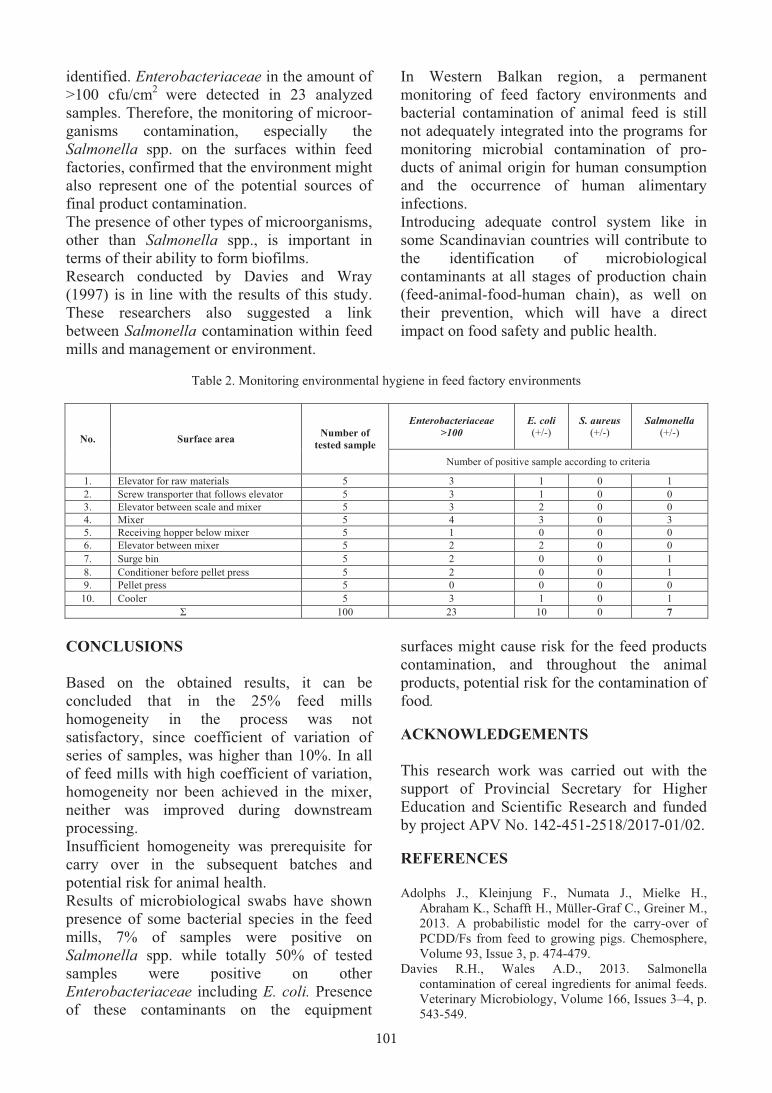
101
conveyers, had negative influence on mixture stability. In considerable number of feed mills coefficient of variation for homogeneity of mixture was lower than 10%, which is accep-table from the quality and safety point of view. However, results of homogeneity in the three feed mills (feed mills no. 5, 9, and 10) it can be seen that coefficient of variation was higher than 10% from the beginning of process (from
the mixer) and through the whole production line. Such results are indicating that in these mills level of some ingredients in complete mixtures might exceed prescript values, which impose a potential risk for negative effect on an animal health. Furthermore, results of homogeneity also in the line with the carry over results (Table 1).
Figure 1. Homogeneity of production line in different feed mills
Table 1 shows the results of the level of carry over in the tested feed mills. When compare the results from both technological tests an increased level of carry-over was detected in places where there was no satisfactory homo-geneity. Unlike the homogeneity, according to Serbian legislation, there is no declared level for carry over in feed production. Based on European research and experience in some of the EU countries, it is considered that the level of carry over should not exceed 4% in the production of compound feed and up to 1% in premix production.
As was the case with the homogeneity tests, in the feed mills no. 5, 9, and 10, level of carry-over was slightly above those limits, which may result in the creation of conditions for contamination of the subsequent batch.As was already pointed out, depending on the environmental conditions (temperature, humidity), feed mills could be suspected to microbial contamination which one of the major threats that can negatively affect food chain security.
Table 1. Results of carry over tests in feed mills
Place of sampling 1 2 3 4 5 6 7 8 9 10 11 12 Level of carry over, % Mixer 1.2 0.1 3.4 0.8 3.9 0. 9 1.4 0 3.4 3.9 1.3 0.5 Bin after mixer 1.1 0.5 3.0 0.7 3.6 0.6 1.1 0.5 3.3 4.5 1.0 0.9 Elevator 2.3 1.1 2.4 0.8 3.9 - 0.8 0.6 4.1 4.4 1.1 1.0 Chain conveyer - - 2.4 - 4.1 - - - - 2.9 - - Screw conveyer 1.2 0.9 - - - 0.5 0.9 - - - - - Packaging 1.4 1.1 3.8 2.0 4.3 0.9 1.5 0.1 5.2 4.9 1.2 0.8 Mean value 1.44 0.74 3.0 1.07 3.96 0.66 1.14 0.3 4.0 4.12 1.15 0.8
Results of monitoring environmental hygiene in feed factory environments are presented in Table 2. Out of 100 analyzed samples collected
from various parts of feed factories, 10 were positive to presence of E. coli, and 7 to Salmonella spp. Presence of S. aureus was not
identified. Enterobacteriaceae in the amount of >100 cfu/cm2 were detected in 23 analyzed samples. Therefore, the monitoring of microor-ganisms contamination, especially the Salmonella spp. on the surfaces within feed factories, confirmed that the environment might also represent one of the potential sources of final product contamination. The presence of other types of microorganisms, other than Salmonella spp., is important in terms of their ability to form biofilms. Research conducted by Davies and Wray (1997) is in line with the results of this study. These researchers also suggested a link between Salmonella contamination within feed mills and management or environment.
In Western Balkan region, a permanent monitoring of feed factory environments and bacterial contamination of animal feed is still not adequately integrated into the programs for monitoring microbial contamination of pro-ducts of animal origin for human consumption and the occurrence of human alimentary infections. Introducing adequate control system like in some Scandinavian countries will contribute to the identification of microbiological contaminants at all stages of production chain (feed-animal-food-human chain), as well on their prevention, which will have a direct impact on food safety and public health.
Table 2. Monitoring environmental hygiene in feed factory environments
No. Surface area Number of tested sample
Enterobacteriaceae >100
E. coli (+/-)
S. aureus (+/-)
Salmonella (+/-)
Number of positive sample according to criteria
1. Elevator for raw materials 5 3 1 0 1 2. Screw transporter that follows elevator 5 3 1 0 0 3. Elevator between scale and mixer 5 3 2 0 0 4. Mixer 5 4 3 0 3 5. Receiving hopper below mixer 5 1 0 0 0 6. Elevator between mixer 5 2 2 0 0 7. Surge bin 5 2 0 0 1 8. Conditioner before pellet press 5 2 0 0 1 9. Pellet press 5 0 0 0 0 10. Cooler 5 3 1 0 1
Σ 100 23 10 0 7
CONCLUSIONS Based on the obtained results, it can be concluded that in the 25% feed mills homogeneity in the process was not satisfactory, since coefficient of variation of series of samples, was higher than 10%. In all of feed mills with high coefficient of variation, homogeneity nor been achieved in the mixer, neither was improved during downstream processing. Insufficient homogeneity was prerequisite for carry over in the subsequent batches and potential risk for animal health. Results of microbiological swabs have shown presence of some bacterial species in the feed mills, 7% of samples were positive on Salmonella spp. while totally 50% of tested samples were positive on other Enterobacteriaceae including E. coli. Presence of these contaminants on the equipment
surfaces might cause risk for the feed products contamination, and throughout the animal products, potential risk for the contamination of food. ACKNOWLEDGEMENTS This research work was carried out with the support of Provincial Secretary for Higher Education and Scientific Research and funded by project APV No. 142-451-2518/2017-01/02. REFERENCES Adolphs J., Kleinjung F., Numata J., Mielke H.,
Abraham K., Schafft H., Müller-Graf C., Greiner M., 2013. A probabilistic model for the carry-over of PCDD/Fs from feed to growing pigs. Chemosphere, Volume 93, Issue 3, p. 474-479.
Davies R.H., Wales A.D., 2013. Salmonella contamination of cereal ingredients for animal feeds. Veterinary Microbiology, Volume 166, Issues 3–4, p. 543-549.

102
De la Fuente-Núñez, C., Reffuveille, F., Fernández, L., Hancock, R.E.W., 2013. Bacterial biofilm development as a multicellular adaptation: antibiotic resistance and new therapeutic strategies. Curr Opin Microbiol 16, p. 580-589.
Djuragic O., Levic J., Sredanović S., Levic Lj., 2009. Evaluation of Homogeneity in Feed by Method of Microtracers®. Archiva Zootechnica, vol. 12, br. 4, p. 85-91.
Djuragic O., Levic J., Sredanovic S., Palic D., Vukasinovic M., 2007. Evaluation of accuracy in feed manufacturing process. XII International Feed Symposium, Novi Sad 13-16. November, p. 69-74.
Habimana O., Møretrø T., Langsrud S., Vestby L., Nesse L., Heir E., 2010. Micro ecosystems from feed industry surfaces: a survival and biofilm study of Salmonella versus host resident flora strains. BMC veterinary research 6, p. 1-10.
Habimana O., Nesse L.L., Møretrø T., Berg K., Heir E., Vestby L.K., Langsrud S., 2014. The persistence of Salmonella following desiccation under feed processing environmental conditions: a subject of relevance. Letters in Applied Microbiology 59, p. 464-470.
Hall-Stoodley L., Costerton J.W., Stoodley P., 2004. Bacterial biofilms: from the Natural environment to infectious diseases. Nat Rev Micro 2, p. 95-108.
Jones F.T., 2011. A review of practical Salmonella control measures in animal feed. The Journal of Applied Poultry Research 20, p. 102-113.
Møretrø T., Vestby L.K., Nesse L.L., Storheim S.E., Kotlarz K., Langsrud S., 2009. Evaluation of efficacy of disinfectants against Salmonella from the feed industry. Journal of Applied Microbiology 106, p. 1005-1012.
O’Mahony J., Moloney M., Whelan M., Danaher M., 2014. Feed additives and veterinary drugs as contaminants in animal feed - the problem of cross-contamination during feed production. Animal Feed Contamination, https://doi.org/10.1533/9780857093615.4.385.
Ryan J., 2017. Preventing cross-contamination through the supply chain. Validating Preventive Food Safety and Quality Controls. https://doi.org/10.1016/B978-0-12-810994-6.00006-7.
Shirota K., Katoh H., Ito T., Otsuki K., 2000. Salmonella Contamination in Commercial Layer Feed in Japan. J. of Veterinary Medical Science 62, p. 789-791.
Sredanović S. , Levic J., Djuragic O., Ivanov D., Kokic B, Colovic R., Vukmirovic Dj., 2012. Measuring of cross contamination in feed processing. 4th international feed safety conference Beijing, China Agricultural University, pp. 99.
Untermann F., 2014. Hazard Appraisal And Critical Control Point (HACCP) The Overall Concept. Reference Module in Food Science, from Encyclopedia of Food Microbiology (Second Edition), p. 125-132.
Verstraete F., 2013. Risk management of undesirable substances in feed following updated risk assessments. Contemporary Issues in Toxicology, 270, p. 230-247.
Vukmirovic Dj., Djuragic O., Colovic R., Kokic B., Peno N., Levic J., 2010. Determination of alternative and working accuracy in feed production. 2nd
International FEED for HEALTH Conference, 14-15 june 2010, Tromsø, Norway, pp. 31.
de la Fuente-Núñez C., Reffuveille F., Fernández L., Hancock R.E.W., 2013. Bacterial biofilm development as a multicellular adaptation: antibiotic resistance and new therapeutic strategies. Curr. Opin. Microbiol. 16, p. 580-589.
Habimana O., Møretrø T., Langsrud S., Vestby L., Nesse L., Heir E., 2010. Micro ecosystems from feed industry surfaces: a survival and biofilm study of Salmonella versus host resident flora strains. BMC veterinary research 6, p. 1-10.
Habimana O., Nesse L.L., Møretrø T., Berg K., Heir E., Vestby L.K., Langsrud S., 2014. The persistence of Salmonella following desiccation under feed processing environmental conditions: a subject of relevance. Letters in Applied Microbiology 59, p. 464-470.
Hall-Stoodley L., Costerton J.W., Stoodley P., 2004. Bacterial biofilms: from the Natural environment to infectious diseases. Nat Rev Micro 2, p. 95-108.
Møretrø T., Vestby L.K., Nesse L.L., Storheim S.E., Kotlarz K., Langsrud S., 2009. Evaluation of efficacy of disinfectants against Salmonella from the feed industry. Journal of Applied Microbiology 106, p. 1005-1012.
***EFSA, 2016. The European Union summary report on trends and sources of zoonoses, zoonotic agents and food-borne outbreaks in 2015. EFSA Journal 14, 4634.
THE EFFECT OF NITROGENOUS FERTILIZER VALUE AND ITS SPLITTING DURING THE GROWTH PERIOD ON MORPHOLOGICAL
TRAITS AND ESSENCE RATE OF Maticaria chamomilla L.
Mehdi GHASEM BAGLOU1, Firouz NAMI2, Saeid KHOMARI1, Mohammad SEDGHI1
1University of Mohaghegh Ardabili, Department of Agronomy and Plant Breeding, Ardabil, Iran, Phone: +98 914.300.0876, Fax: +9841.434.52.750, Email: [email protected]
Phone: +98.914.642.9737, Email: [email protected] Phone: +98.914.317.4164, Email: [email protected]
2University of Tabriz, Department of Plant Eco-physiology, Faculty of Agriculture, Tabriz, Iran, Phone: +98. 914.25.64, Fax: +9841.3244.07.80, Email: [email protected]
Corresponding author email: [email protected]
Abstract In order to examine the effect of nitrogenous fertilizer value and its splitting during the growth period on morphological traits and essence rate of Maticaria chamomilla L. in spring cultivation in Tabriz, Iran, a factorial, random whole-block experiment was conducted in triplicates during cultivating year 2009-2010 in Research and Promotive Farm of Basmenj Agriculture Research Center. The treatments in this experiment include three rates of nitrogenous fertilizer 50, 100 and 150 kg/ha along with control one and fertilizing time in four three-phase splitting (b1) 100 percent at cultivation phase, zero at the beginning of flowering, and zero at the middle of flowering, (b2) 50 percent at cultivation phase, 50 percent at the beginning of flowering, and zero at the middle flowering, (b3) 25 percent at cultivation phase, 50 percent at the beginning of flowering, and 25 percent at the middle of flowering, and (b4) zero at cultivation, 100 percent at the beginning of flowering, and zero at the middle of flowering. In general, the results of experiment indicate that, splitting procedure of nitrogenous fertilizer does not have significant effects on the number of pedicle stem diameter, bush height, number of lateral stems, and tiller number. Regarding the effect of nitrogen consumption level on measured traits in the present research, it was determined that, total traits were affected by different levels of nitrogen (on probability 5%). The review of mutual effect between splitting procedure and different levels of nitrogenous fertilizer on essence rate and essence weight of Matricaria chamomilla L. was meaningful, so that, the highest essence weight was obtained in third treatment and by using 150 kg/ha net nitrogen and also highest rate of essence was related to third treatment with 150kg/ha net nitrogen. Therefore, based on the results of the present research, it appears that the cultivation of Matricaria chamomilla L. along with consumption of 150 kg/ha net nitrogen is suitable in climatic conditions of Tabriz through splitting procedure including 25 percent at cultivation, 50 percent at the beginning of flowering and 25 percent at the middle of flowering. It is expected that the maximum yield of Matricaria chamomilla L. is obtained under conditions of Tabriz along with consumption of nitrogenous fertilize lower than 150 kg/ha. Key words: essence, Matricaria chamomilla L, nitrogenous fertilizer, splitting procedure. INTRODUCTION Administration of synthetic chemical drugs for human diseases has been the source of several adverse effects. In some cases, these effects confine drug use or even eliminate some drugs. From the other side, high adaption of herbal drugs with human body has brought pharmaceutical plants to the focus of attention again. As a result, it is apparently indispensable to renew cultivation of these plants and to investigate about breeding and better management of these plants. In this regard, determination the optimum fertilizer dose for
the maximum yield and active substances is a major problem. Chamomile is among the most important pharmaceutical plants recognized so far (Naderidarbaghshahi et al., 2012). The German chamomile (Matricaria chamomilla L.) is primarily grown for its essential oil. Belonging to the family Asteraceae, chamomile is a famous medicinal plant usually mentioned as the ‘‘star among medicinal species’’. As a medicinal plant, this species is currently highly favored and broadly used in traditional medicine. It has been established that this plant possesses multi-therapeutic, cosmetic, and nutritional values (Singh et al., 2011).

103
De la Fuente-Núñez, C., Reffuveille, F., Fernández, L., Hancock, R.E.W., 2013. Bacterial biofilm development as a multicellular adaptation: antibiotic resistance and new therapeutic strategies. Curr Opin Microbiol 16, p. 580-589.
Djuragic O., Levic J., Sredanović S., Levic Lj., 2009. Evaluation of Homogeneity in Feed by Method of Microtracers®. Archiva Zootechnica, vol. 12, br. 4, p. 85-91.
Djuragic O., Levic J., Sredanovic S., Palic D., Vukasinovic M., 2007. Evaluation of accuracy in feed manufacturing process. XII International Feed Symposium, Novi Sad 13-16. November, p. 69-74.
Habimana O., Møretrø T., Langsrud S., Vestby L., Nesse L., Heir E., 2010. Micro ecosystems from feed industry surfaces: a survival and biofilm study of Salmonella versus host resident flora strains. BMC veterinary research 6, p. 1-10.
Habimana O., Nesse L.L., Møretrø T., Berg K., Heir E., Vestby L.K., Langsrud S., 2014. The persistence of Salmonella following desiccation under feed processing environmental conditions: a subject of relevance. Letters in Applied Microbiology 59, p. 464-470.
Hall-Stoodley L., Costerton J.W., Stoodley P., 2004. Bacterial biofilms: from the Natural environment to infectious diseases. Nat Rev Micro 2, p. 95-108.
Jones F.T., 2011. A review of practical Salmonella control measures in animal feed. The Journal of Applied Poultry Research 20, p. 102-113.
Møretrø T., Vestby L.K., Nesse L.L., Storheim S.E., Kotlarz K., Langsrud S., 2009. Evaluation of efficacy of disinfectants against Salmonella from the feed industry. Journal of Applied Microbiology 106, p. 1005-1012.
O’Mahony J., Moloney M., Whelan M., Danaher M., 2014. Feed additives and veterinary drugs as contaminants in animal feed - the problem of cross-contamination during feed production. Animal Feed Contamination, https://doi.org/10.1533/9780857093615.4.385.
Ryan J., 2017. Preventing cross-contamination through the supply chain. Validating Preventive Food Safety and Quality Controls. https://doi.org/10.1016/B978-0-12-810994-6.00006-7.
Shirota K., Katoh H., Ito T., Otsuki K., 2000. Salmonella Contamination in Commercial Layer Feed in Japan. J. of Veterinary Medical Science 62, p. 789-791.
Sredanović S. , Levic J., Djuragic O., Ivanov D., Kokic B, Colovic R., Vukmirovic Dj., 2012. Measuring of cross contamination in feed processing. 4th international feed safety conference Beijing, China Agricultural University, pp. 99.
Untermann F., 2014. Hazard Appraisal And Critical Control Point (HACCP) The Overall Concept. Reference Module in Food Science, from Encyclopedia of Food Microbiology (Second Edition), p. 125-132.
Verstraete F., 2013. Risk management of undesirable substances in feed following updated risk assessments. Contemporary Issues in Toxicology, 270, p. 230-247.
Vukmirovic Dj., Djuragic O., Colovic R., Kokic B., Peno N., Levic J., 2010. Determination of alternative and working accuracy in feed production. 2nd
International FEED for HEALTH Conference, 14-15 june 2010, Tromsø, Norway, pp. 31.
de la Fuente-Núñez C., Reffuveille F., Fernández L., Hancock R.E.W., 2013. Bacterial biofilm development as a multicellular adaptation: antibiotic resistance and new therapeutic strategies. Curr. Opin. Microbiol. 16, p. 580-589.
Habimana O., Møretrø T., Langsrud S., Vestby L., Nesse L., Heir E., 2010. Micro ecosystems from feed industry surfaces: a survival and biofilm study of Salmonella versus host resident flora strains. BMC veterinary research 6, p. 1-10.
Habimana O., Nesse L.L., Møretrø T., Berg K., Heir E., Vestby L.K., Langsrud S., 2014. The persistence of Salmonella following desiccation under feed processing environmental conditions: a subject of relevance. Letters in Applied Microbiology 59, p. 464-470.
Hall-Stoodley L., Costerton J.W., Stoodley P., 2004. Bacterial biofilms: from the Natural environment to infectious diseases. Nat Rev Micro 2, p. 95-108.
Møretrø T., Vestby L.K., Nesse L.L., Storheim S.E., Kotlarz K., Langsrud S., 2009. Evaluation of efficacy of disinfectants against Salmonella from the feed industry. Journal of Applied Microbiology 106, p. 1005-1012.
***EFSA, 2016. The European Union summary report on trends and sources of zoonoses, zoonotic agents and food-borne outbreaks in 2015. EFSA Journal 14, 4634.
AgroLife Scientific Journal - Volume 6, Number 2, 2017ISSN 2285-5718; ISSN CD-ROM 2285-5726; ISSN ONLINE 2286-0126; ISSN-L 2285-5718
THE EFFECT OF NITROGENOUS FERTILIZER VALUE AND ITS SPLITTING DURING THE GROWTH PERIOD ON MORPHOLOGICAL
TRAITS AND ESSENCE RATE OF Maticaria chamomilla L.
Mehdi GHASEM BAGLOU1, Firouz NAMI2, Saeid KHOMARI1, Mohammad SEDGHI1
1University of Mohaghegh Ardabili, Department of Agronomy and Plant Breeding, Ardabil, Iran, Phone: +98 914.300.0876, Fax: +9841.434.52.750, Email: [email protected]
Phone: +98.914.642.9737, Email: [email protected] Phone: +98.914.317.4164, Email: [email protected]
2University of Tabriz, Department of Plant Eco-physiology, Faculty of Agriculture, Tabriz, Iran, Phone: +98. 914.25.64, Fax: +9841.3244.07.80, Email: [email protected]
Corresponding author email: [email protected]
Abstract In order to examine the effect of nitrogenous fertilizer value and its splitting during the growth period on morphological traits and essence rate of Maticaria chamomilla L. in spring cultivation in Tabriz, Iran, a factorial, random whole-block experiment was conducted in triplicates during cultivating year 2009-2010 in Research and Promotive Farm of Basmenj Agriculture Research Center. The treatments in this experiment include three rates of nitrogenous fertilizer 50, 100 and 150 kg/ha along with control one and fertilizing time in four three-phase splitting (b1) 100 percent at cultivation phase, zero at the beginning of flowering, and zero at the middle of flowering, (b2) 50 percent at cultivation phase, 50 percent at the beginning of flowering, and zero at the middle flowering, (b3) 25 percent at cultivation phase, 50 percent at the beginning of flowering, and 25 percent at the middle of flowering, and (b4) zero at cultivation, 100 percent at the beginning of flowering, and zero at the middle of flowering. In general, the results of experiment indicate that, splitting procedure of nitrogenous fertilizer does not have significant effects on the number of pedicle stem diameter, bush height, number of lateral stems, and tiller number. Regarding the effect of nitrogen consumption level on measured traits in the present research, it was determined that, total traits were affected by different levels of nitrogen (on probability 5%). The review of mutual effect between splitting procedure and different levels of nitrogenous fertilizer on essence rate and essence weight of Matricaria chamomilla L. was meaningful, so that, the highest essence weight was obtained in third treatment and by using 150 kg/ha net nitrogen and also highest rate of essence was related to third treatment with 150kg/ha net nitrogen. Therefore, based on the results of the present research, it appears that the cultivation of Matricaria chamomilla L. along with consumption of 150 kg/ha net nitrogen is suitable in climatic conditions of Tabriz through splitting procedure including 25 percent at cultivation, 50 percent at the beginning of flowering and 25 percent at the middle of flowering. It is expected that the maximum yield of Matricaria chamomilla L. is obtained under conditions of Tabriz along with consumption of nitrogenous fertilize lower than 150 kg/ha. Key words: essence, Matricaria chamomilla L, nitrogenous fertilizer, splitting procedure. INTRODUCTION Administration of synthetic chemical drugs for human diseases has been the source of several adverse effects. In some cases, these effects confine drug use or even eliminate some drugs. From the other side, high adaption of herbal drugs with human body has brought pharmaceutical plants to the focus of attention again. As a result, it is apparently indispensable to renew cultivation of these plants and to investigate about breeding and better management of these plants. In this regard, determination the optimum fertilizer dose for
the maximum yield and active substances is a major problem. Chamomile is among the most important pharmaceutical plants recognized so far (Naderidarbaghshahi et al., 2012). The German chamomile (Matricaria chamomilla L.) is primarily grown for its essential oil. Belonging to the family Asteraceae, chamomile is a famous medicinal plant usually mentioned as the ‘‘star among medicinal species’’. As a medicinal plant, this species is currently highly favored and broadly used in traditional medicine. It has been established that this plant possesses multi-therapeutic, cosmetic, and nutritional values (Singh et al., 2011).

104
As a familiar traditional drug, chamomile is nominated by several names, such as Baboonig, Babuna, Babuna camornile, Babunj, Camomilla, pinheads, scented mayweed, English chamomile, German chamomile, Hungarian chamomile, Roman chamomile, Flos chamomile, Single chamomile, and sweet false chamomile, suggesting its ubiquitous application (Singh et al., 2011). Chamomile essential oil contains almost 40 different compounds among which the most important ones are chamanzulene, sesquiterpenes, bisabolo oxide A, b-farenzn, and bisabolo oxide B (Ghaedi Jeshni et al., 2017). Chamomile was originally endemic in central Asia and Mediterranean regions. This plant is also widely spread across Iran, from West to East and from North to the center of the country. With a direct stem, its height is in the range of 30-80 cm depending on the climatic conditions. The flower a diameter also ranges from 0.6 to 1.6 cm and rarely reaches 2.2 cm. The flowers are hermaphrodite with a self-pollinated plant (Bernath, 2000). The most important compounds affecting the biological activity of chamomile include flavonoids, luteolin, apigenin, patuletin, quercetin, and the ingredients of essential oil such as α-bisabolol and its oxides and azulenes (Kawthar et al., 2017). Chamomile possesses bacteriostatic, antimicrobial, antiseptic, anti-inflammatory, deodorant, carminative, sedative, and spasmo-lytic effects. It can treat sleep problems. These effects are mostly due to its essential oils (Kawthar et al., 2017). Flowers of chamomile have been extensively used by Greek, Indian, and Middle Eastern physicians (Omidbeigi, 2005; Letchamo et al., 2006). In 1993, Letchamo showed that increasing nitrogenous fertilizer concentration increased flower yield and the amount and percentage of active substances. He reported that the increase in nitrogen and phosphorus dose increased the essence but more potassium concentration had the reverse outcome. environmental factors such as temperature, moisture, nutrients,
genetic factors and also the interactions between two types of factors can affect dry matter buildup by chamomile (Salamon and Abou-zied, 2006; Vildova et al., 2006). Poor nutrient content is the characteristic of sandy soils, negatively influencing the growth and yield of medicinal and aromatic plants including chamomile (Kawthar et al., 2017). Optimal growth and development of plants necessitates a variety of nutrients. Nitrogen has most remarkable effect on the quantitative and qualitative plant productivity (Maleki et al., 2014). Numerous researches have reported the significant effects of this element on the yield and other traits of different medicinal plants such as pot marigold (Calendula officinalis) and German chamomile (Matricaria chamomilla L.) (Rahmati et al., 2009; Ameri et al., 2007). Meawad and colleagues (1984) reported the positive effect of nitrogen, potassium, and some growth regulators on the yield of chamomile flowers (Meawad et al., 1984). Considering the potential importance of German chamomile among pharmaceutical plants of the world (and Iran), the present investigation was conducted to examine the effects of nitrogenous fertilizer value and its splitting on quantitative and qualitative traits of German chamomile, to evaluate the effect of different concentrations of nitrogenous fertilizers on this plant’s traits, and to study the interactions between experimental treatments and different quantitative and qualitative traits of German chamomile. MATERIALS AND METHODS The present study was conducted on Research and Promotive Farm of Basmenj Agriculture Research Center located on kilometer 15 of Tabriz-Ahar Road in East Azarbaijan Province at the longitude of 46 degrees and 2 minutes and latitude of 37 degrees and 58 minutes. The physicochemical properties of soil are summarized in Table 1. The experiment was carried out in the form of factorial completely randomized blocks with two factors.
Table 1. Mechanical and chemical analysis of cultivated soil
N% Soil texture Sand% Silt% Clay% O.C% pH EC×103 Depth 0.02 Silty 46 34 20 0.62 8.1 1.53 0-30
The field preparation operation was done at the beginning of 2010. The operation included field selection, running the soil tests, early plowing, and finally, leveling and plotting for transplanting. During the field preparation operation, seedling planting was done with 1100 pots in the form of paper cups. The pots were planted on April 24, 2010 in nursery. Noticing the ideal temperature and humidity conditions in greenhouse, the bushes were transferred to the field on May 19, 2010 after reaching six-leaf stage and the approximate height of 8 cm. The row spacing was 30 cm at field with margins of 25 cm and the space between bushes was 10 cm in rows. The first stage of fertilization was manual before the first field irrigation. The next stages of fertilization splitting were also manual. The strain studied in the present work was German chamomile, which was an imported strain purchased from Pakanbazr, Isfahan, Iran. The fertilizer treatments used included nitrogen fertilizer at four levels of 50, 100, and 150 Kg per hectare along with control and fertilization period in four three-stage splits (b1) 100% at cultivation and beginning of zero flowering and middles of zero flowering, (b2) 50% at cultivation, 50% at be3ginning of flowering and middles of zero flowering, (b3) 25% at cultivation, 50% at beginning of flowering, and 25% at middles of flowering, (b4) zero at cultivation, 100% at beginning of flowering, and zero at middles of flowering. There were 12 treatment combinations with controls at each replicate with total sum of 39 experimental units for all replicates. Noting that chamomile flowers maturate gradually, each time the flowers maturated, they were harvested and the number of flowers in each harvest was recorded. The sampling was conducted on morphologic, phonologic, and physiological traits of the plant. So that subjecting the margins, five plants were selected from the middle of each plot to randomly measure the height and other morphologic traits. The traits examined in this experiment included the height of plant at flowering time, the number of lateral stalks at each plant, the number of leaves at each plant, the total number of flowers, wet weight of flower, dry weight of flowers, essence percentage of flowers, and essence rate of flowers. To measure the flower essence, the
harvested flowers were dried at 70°C for 48 hours and immediately weighed after leaving the oven and 30 g of dried flower was set aside for essence extraction. Essence extraction was performed on Laboratory of Agricultural and Natural Resources Research Center of Tabriz using water distillation method by Clevenger apparatus for two hours (Baydar and Baydar, 2005). To measure the essence, 25 g of dried flowers was ground. Then, 600 ml water and 10 g sodium chloride were added for complete essence extraction and the apparatus temperature was set initially at 100°C and then at 70°C. The essence phase was readily separated from salt-water phase through addition of diethylether (the solvent for chamomile essence). The solution of diethylether and essence was put into 45°C hot water bath to evaporate diethylether (Ghasemi Dehkordi et al., 1375). The data was analyzed by MSTATC and SPSS software and the mean values were compared through Duncan’s test at probability level of 5%. The Figures were plotted by Microsoft Excel. RESULTS AND DISCUSSIONS Based on the results acquired from table of variance analysis (Table 2), the effect of nitrogenous fertilizer and its significant interactions with number of flowers, wet weight of flowers, dry weight of flowers, essence percentage, and essence weight were calculated at probability levels 1% and 5%. The effect of nitrogenous fertilizer content was also significant at probability level 1% on different flower traits such as number of flowers, wet weight of flowers, dry weight of flowers, plant height, number of stalks, diameter of stalks, number of tillers, number of minor stalks, essence weight, and essence percentage, indicating the effect of different fertilizer concentrations on making significant differences in the extent of the traits mentioned. However, the effect of nitrogenous fertilizer content was insignificant on the number of days until budding and 100% and 50% flowering rates. The interaction of nitrogenous fertilizer content on the splitting of nitrogenous fertilizer also indicated that the number of flowers and essence percentage were under the effect on the

105
As a familiar traditional drug, chamomile is nominated by several names, such as Baboonig, Babuna, Babuna camornile, Babunj, Camomilla, pinheads, scented mayweed, English chamomile, German chamomile, Hungarian chamomile, Roman chamomile, Flos chamomile, Single chamomile, and sweet false chamomile, suggesting its ubiquitous application (Singh et al., 2011). Chamomile essential oil contains almost 40 different compounds among which the most important ones are chamanzulene, sesquiterpenes, bisabolo oxide A, b-farenzn, and bisabolo oxide B (Ghaedi Jeshni et al., 2017). Chamomile was originally endemic in central Asia and Mediterranean regions. This plant is also widely spread across Iran, from West to East and from North to the center of the country. With a direct stem, its height is in the range of 30-80 cm depending on the climatic conditions. The flower a diameter also ranges from 0.6 to 1.6 cm and rarely reaches 2.2 cm. The flowers are hermaphrodite with a self-pollinated plant (Bernath, 2000). The most important compounds affecting the biological activity of chamomile include flavonoids, luteolin, apigenin, patuletin, quercetin, and the ingredients of essential oil such as α-bisabolol and its oxides and azulenes (Kawthar et al., 2017). Chamomile possesses bacteriostatic, antimicrobial, antiseptic, anti-inflammatory, deodorant, carminative, sedative, and spasmo-lytic effects. It can treat sleep problems. These effects are mostly due to its essential oils (Kawthar et al., 2017). Flowers of chamomile have been extensively used by Greek, Indian, and Middle Eastern physicians (Omidbeigi, 2005; Letchamo et al., 2006). In 1993, Letchamo showed that increasing nitrogenous fertilizer concentration increased flower yield and the amount and percentage of active substances. He reported that the increase in nitrogen and phosphorus dose increased the essence but more potassium concentration had the reverse outcome. environmental factors such as temperature, moisture, nutrients,
genetic factors and also the interactions between two types of factors can affect dry matter buildup by chamomile (Salamon and Abou-zied, 2006; Vildova et al., 2006). Poor nutrient content is the characteristic of sandy soils, negatively influencing the growth and yield of medicinal and aromatic plants including chamomile (Kawthar et al., 2017). Optimal growth and development of plants necessitates a variety of nutrients. Nitrogen has most remarkable effect on the quantitative and qualitative plant productivity (Maleki et al., 2014). Numerous researches have reported the significant effects of this element on the yield and other traits of different medicinal plants such as pot marigold (Calendula officinalis) and German chamomile (Matricaria chamomilla L.) (Rahmati et al., 2009; Ameri et al., 2007). Meawad and colleagues (1984) reported the positive effect of nitrogen, potassium, and some growth regulators on the yield of chamomile flowers (Meawad et al., 1984). Considering the potential importance of German chamomile among pharmaceutical plants of the world (and Iran), the present investigation was conducted to examine the effects of nitrogenous fertilizer value and its splitting on quantitative and qualitative traits of German chamomile, to evaluate the effect of different concentrations of nitrogenous fertilizers on this plant’s traits, and to study the interactions between experimental treatments and different quantitative and qualitative traits of German chamomile. MATERIALS AND METHODS The present study was conducted on Research and Promotive Farm of Basmenj Agriculture Research Center located on kilometer 15 of Tabriz-Ahar Road in East Azarbaijan Province at the longitude of 46 degrees and 2 minutes and latitude of 37 degrees and 58 minutes. The physicochemical properties of soil are summarized in Table 1. The experiment was carried out in the form of factorial completely randomized blocks with two factors.
Table 1. Mechanical and chemical analysis of cultivated soil
N% Soil texture Sand% Silt% Clay% O.C% pH EC×103 Depth 0.02 Silty 46 34 20 0.62 8.1 1.53 0-30
The field preparation operation was done at the beginning of 2010. The operation included field selection, running the soil tests, early plowing, and finally, leveling and plotting for transplanting. During the field preparation operation, seedling planting was done with 1100 pots in the form of paper cups. The pots were planted on April 24, 2010 in nursery. Noticing the ideal temperature and humidity conditions in greenhouse, the bushes were transferred to the field on May 19, 2010 after reaching six-leaf stage and the approximate height of 8 cm. The row spacing was 30 cm at field with margins of 25 cm and the space between bushes was 10 cm in rows. The first stage of fertilization was manual before the first field irrigation. The next stages of fertilization splitting were also manual. The strain studied in the present work was German chamomile, which was an imported strain purchased from Pakanbazr, Isfahan, Iran. The fertilizer treatments used included nitrogen fertilizer at four levels of 50, 100, and 150 Kg per hectare along with control and fertilization period in four three-stage splits (b1) 100% at cultivation and beginning of zero flowering and middles of zero flowering, (b2) 50% at cultivation, 50% at be3ginning of flowering and middles of zero flowering, (b3) 25% at cultivation, 50% at beginning of flowering, and 25% at middles of flowering, (b4) zero at cultivation, 100% at beginning of flowering, and zero at middles of flowering. There were 12 treatment combinations with controls at each replicate with total sum of 39 experimental units for all replicates. Noting that chamomile flowers maturate gradually, each time the flowers maturated, they were harvested and the number of flowers in each harvest was recorded. The sampling was conducted on morphologic, phonologic, and physiological traits of the plant. So that subjecting the margins, five plants were selected from the middle of each plot to randomly measure the height and other morphologic traits. The traits examined in this experiment included the height of plant at flowering time, the number of lateral stalks at each plant, the number of leaves at each plant, the total number of flowers, wet weight of flower, dry weight of flowers, essence percentage of flowers, and essence rate of flowers. To measure the flower essence, the
harvested flowers were dried at 70°C for 48 hours and immediately weighed after leaving the oven and 30 g of dried flower was set aside for essence extraction. Essence extraction was performed on Laboratory of Agricultural and Natural Resources Research Center of Tabriz using water distillation method by Clevenger apparatus for two hours (Baydar and Baydar, 2005). To measure the essence, 25 g of dried flowers was ground. Then, 600 ml water and 10 g sodium chloride were added for complete essence extraction and the apparatus temperature was set initially at 100°C and then at 70°C. The essence phase was readily separated from salt-water phase through addition of diethylether (the solvent for chamomile essence). The solution of diethylether and essence was put into 45°C hot water bath to evaporate diethylether (Ghasemi Dehkordi et al., 1375). The data was analyzed by MSTATC and SPSS software and the mean values were compared through Duncan’s test at probability level of 5%. The Figures were plotted by Microsoft Excel. RESULTS AND DISCUSSIONS Based on the results acquired from table of variance analysis (Table 2), the effect of nitrogenous fertilizer and its significant interactions with number of flowers, wet weight of flowers, dry weight of flowers, essence percentage, and essence weight were calculated at probability levels 1% and 5%. The effect of nitrogenous fertilizer content was also significant at probability level 1% on different flower traits such as number of flowers, wet weight of flowers, dry weight of flowers, plant height, number of stalks, diameter of stalks, number of tillers, number of minor stalks, essence weight, and essence percentage, indicating the effect of different fertilizer concentrations on making significant differences in the extent of the traits mentioned. However, the effect of nitrogenous fertilizer content was insignificant on the number of days until budding and 100% and 50% flowering rates. The interaction of nitrogenous fertilizer content on the splitting of nitrogenous fertilizer also indicated that the number of flowers and essence percentage were under the effect on the
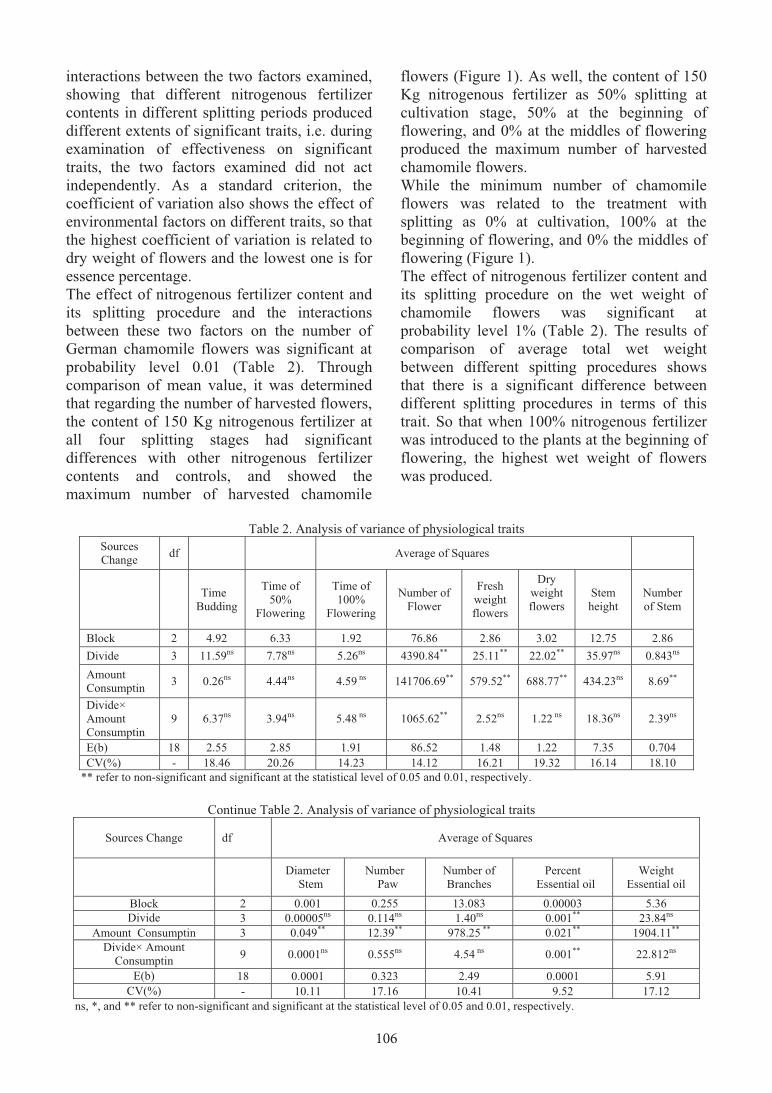
106
interactions between the two factors examined, showing that different nitrogenous fertilizer contents in different splitting periods produced different extents of significant traits, i.e. during examination of effectiveness on significant traits, the two factors examined did not act independently. As a standard criterion, the coefficient of variation also shows the effect of environmental factors on different traits, so that the highest coefficient of variation is related to dry weight of flowers and the lowest one is for essence percentage. The effect of nitrogenous fertilizer content and its splitting procedure and the interactions between these two factors on the number of German chamomile flowers was significant at probability level 0.01 (Table 2). Through comparison of mean value, it was determined that regarding the number of harvested flowers, the content of 150 Kg nitrogenous fertilizer at all four splitting stages had significant differences with other nitrogenous fertilizer contents and controls, and showed the maximum number of harvested chamomile
flowers (Figure 1). As well, the content of 150 Kg nitrogenous fertilizer as 50% splitting at cultivation stage, 50% at the beginning of flowering, and 0% at the middles of flowering produced the maximum number of harvested chamomile flowers. While the minimum number of chamomile flowers was related to the treatment with splitting as 0% at cultivation, 100% at the beginning of flowering, and 0% the middles of flowering (Figure 1). The effect of nitrogenous fertilizer content and its splitting procedure on the wet weight of chamomile flowers was significant at probability level 1% (Table 2). The results of comparison of average total wet weight between different spitting procedures shows that there is a significant difference between different splitting procedures in terms of this trait. So that when 100% nitrogenous fertilizer was introduced to the plants at the beginning of flowering, the highest wet weight of flowers was produced.
Table 2. Analysis of variance of physiological traits
Average of Squares df Sources Change
Number of Stem
Stem height
Dry weight flowers
Fresh weight flowers
Number of Flower
Time of 100%
Flowering
Time of 50%
Flowering
Time Budding
2.86 12.75 3.02 2.86 76.86 1.92 6.33 4.92 2 Block 0.843ns 35.97ns 22.02** 25.11** 4390.84** 5.26ns 7.78ns 11.59ns 3 Divide
8.69** 434.23ns 688.77** 579.52** 141706.69** 4.59 ns 4.44ns 0.26ns 3 Amount Consumptin
2.39ns 18.36ns 1.22 ns 2.52ns 1065.62** 5.48 ns 3.94ns 6.37ns 9 Divide× Amount Consumptin
0.704 7.35 1.22 1.48 86.52 1.91 2.85 2.55 18 E(b) 18.10 16.14 19.32 16.21 14.12 14.23 20.26 18.46 - CV(%)
** refer to non-significant and significant at the statistical level of 0.05 and 0.01, respectively.
Continue Table 2. Analysis of variance of physiological traits
Average of Squares df Sources Change
Weight Essential oil
Percent Essential oil
Number of Branches
Number Paw
Diameter Stem
5.36 0.00003 13.083 0.255 0.001 2 Block 23.84ns 0.001** 1.40ns 0.114ns 0.00005ns 3 Divide
1904.11** 0.021** 978.25 ** 12.39** 0.049** 3 Amount Consumptin
22.812ns 0.001** 4.54 ns 0.555ns 0.0001ns 9 Divide× Amount Consumptin
5.91 0.0001 2.49 0.323 0.0001 18 E(b) 17.12 9.52 10.41 17.16 10.11 - CV(%)
ns, *, and ** refer to non-significant and significant at the statistical level of 0.05 and 0.01, respectively.
Figure 1. The effect of nitrogenous fertilizer content and its splitting procedure during growth period on the number of flowers
However, when 100% nitrogenous fertilizer was introduced to the plants at cultivation, the lowest wet weight of flowers (73 g) was produced. Noticing, the maximum wet weight of flowers also resulted from consumption of 150 kg in hectare of nitrogenous fertilizer. The effect of nitrogenous fertilizer content and its splitting procedure on the dry weight of chamomile flowers was significant at probability level 0.01. Noticing, the highest rate of dry weight of flowers resulted when 100% nitrogenous fertilizer was applied at the beginning of flowering and the lowest rate was related to application of 150 kg nitrogenous fertilizer, which was the highest rate in comparison with other treatment and control levels. In general, during the present investigation, it was observed that consumption of above 50 kg per hectare of nitrogenous fertilizer had significant effects on the number of flowers and consequently, dry and wet weights of German chamomile flowers and an almost increasing trend is detectable in the number of flowers, wet weight, and dry weight. The effect of nitrogenous fertilizer content was statistically meaningful on stalk height at probability level 1%. In comparison of average stalk height with consumption of 150 kg of nitrogenous fertilizer, the maximum stalk height resulted. The results of the present study have revealed that through application of below 75 kg per hectare of nitrogen, the sufficient
concentration of this element is available to reach the maximum height of German chamomile plant and higher amounts of nitrogen had no effects on plant height. In other words, limitations in genetic potential of this plant inhibits higher rates of plant height at the above contents of nitrogenous fertilizer. The interactions between consumption rate and the procedure of splitting the nitrogenous fertilizer was also significant for stalk height. The effect of nitrogenous fertilizer content was statistically meaningful on the number of major stalks at probability level 1%. Noticing, application of 150 kg nitrogenous fertilizer dramatically increased the number of major stalks in chamomile plants. The stalk diameter was affected by application of nitrogenous fertilizer, but the effect of splitting the nitrogenous fertilizer and their interaction on stalk diameter was not significant. Noticing, through application of 150 kg nitrogenous fertilizer, the highest stalk diameter was approached, which could be attributed to increased growth of vegetative cells. The effect of application of nitrogenous fertilizer was statistically meaningful on the number of tillers per plant. Increasing nitrogenous fertilizer concentration above 50 kg caused a significant increase in the number of tillers per plant, so that the highest number of tillers was related to 150 kg per hectare of nitrogenous fertilizer. The effect of different values of nitrogenous
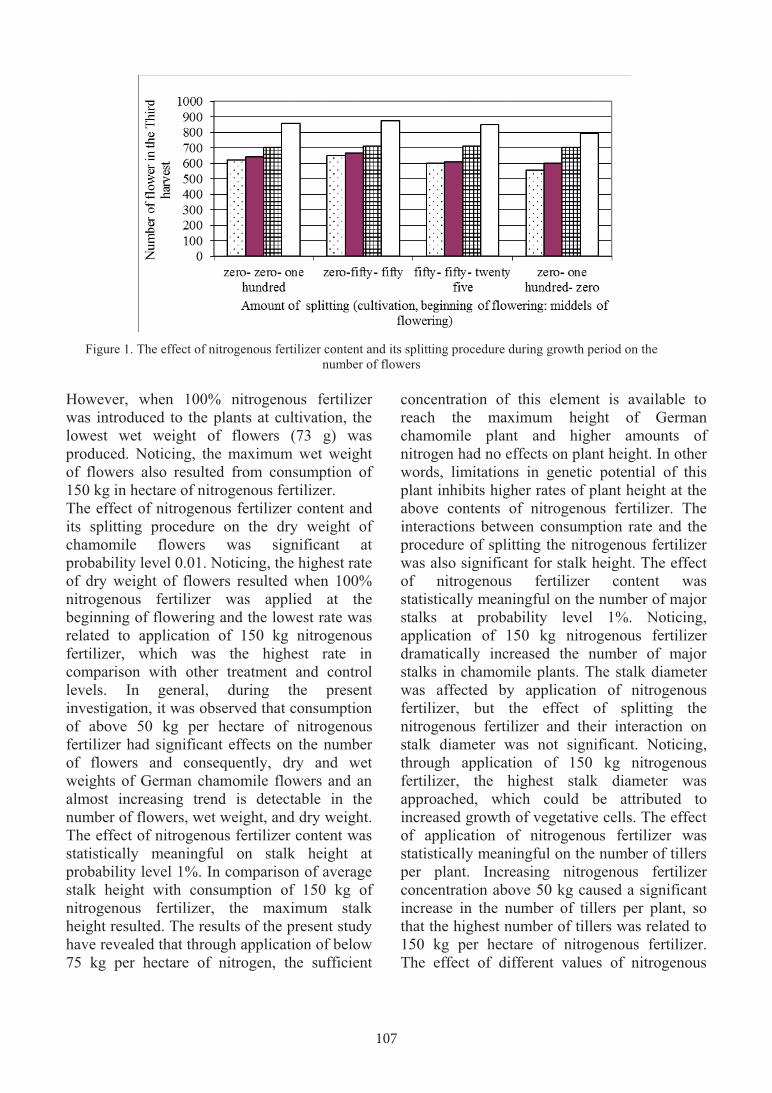
107
interactions between the two factors examined, showing that different nitrogenous fertilizer contents in different splitting periods produced different extents of significant traits, i.e. during examination of effectiveness on significant traits, the two factors examined did not act independently. As a standard criterion, the coefficient of variation also shows the effect of environmental factors on different traits, so that the highest coefficient of variation is related to dry weight of flowers and the lowest one is for essence percentage. The effect of nitrogenous fertilizer content and its splitting procedure and the interactions between these two factors on the number of German chamomile flowers was significant at probability level 0.01 (Table 2). Through comparison of mean value, it was determined that regarding the number of harvested flowers, the content of 150 Kg nitrogenous fertilizer at all four splitting stages had significant differences with other nitrogenous fertilizer contents and controls, and showed the maximum number of harvested chamomile
flowers (Figure 1). As well, the content of 150 Kg nitrogenous fertilizer as 50% splitting at cultivation stage, 50% at the beginning of flowering, and 0% at the middles of flowering produced the maximum number of harvested chamomile flowers. While the minimum number of chamomile flowers was related to the treatment with splitting as 0% at cultivation, 100% at the beginning of flowering, and 0% the middles of flowering (Figure 1). The effect of nitrogenous fertilizer content and its splitting procedure on the wet weight of chamomile flowers was significant at probability level 1% (Table 2). The results of comparison of average total wet weight between different spitting procedures shows that there is a significant difference between different splitting procedures in terms of this trait. So that when 100% nitrogenous fertilizer was introduced to the plants at the beginning of flowering, the highest wet weight of flowers was produced.
Table 2. Analysis of variance of physiological traits
Average of Squares df Sources Change
Number of Stem
Stem height
Dry weight flowers
Fresh weight flowers
Number of Flower
Time of 100%
Flowering
Time of 50%
Flowering
Time Budding
2.86 12.75 3.02 2.86 76.86 1.92 6.33 4.92 2 Block 0.843ns 35.97ns 22.02** 25.11** 4390.84** 5.26ns 7.78ns 11.59ns 3 Divide
8.69** 434.23ns 688.77** 579.52** 141706.69** 4.59 ns 4.44ns 0.26ns 3 Amount Consumptin
2.39ns 18.36ns 1.22 ns 2.52ns 1065.62** 5.48 ns 3.94ns 6.37ns 9 Divide× Amount Consumptin
0.704 7.35 1.22 1.48 86.52 1.91 2.85 2.55 18 E(b) 18.10 16.14 19.32 16.21 14.12 14.23 20.26 18.46 - CV(%)
** refer to non-significant and significant at the statistical level of 0.05 and 0.01, respectively.
Continue Table 2. Analysis of variance of physiological traits
Average of Squares df Sources Change
Weight Essential oil
Percent Essential oil
Number of Branches
Number Paw
Diameter Stem
5.36 0.00003 13.083 0.255 0.001 2 Block 23.84ns 0.001** 1.40ns 0.114ns 0.00005ns 3 Divide
1904.11** 0.021** 978.25 ** 12.39** 0.049** 3 Amount Consumptin
22.812ns 0.001** 4.54 ns 0.555ns 0.0001ns 9 Divide× Amount Consumptin
5.91 0.0001 2.49 0.323 0.0001 18 E(b) 17.12 9.52 10.41 17.16 10.11 - CV(%)
ns, *, and ** refer to non-significant and significant at the statistical level of 0.05 and 0.01, respectively.
Figure 1. The effect of nitrogenous fertilizer content and its splitting procedure during growth period on the number of flowers
However, when 100% nitrogenous fertilizer was introduced to the plants at cultivation, the lowest wet weight of flowers (73 g) was produced. Noticing, the maximum wet weight of flowers also resulted from consumption of 150 kg in hectare of nitrogenous fertilizer. The effect of nitrogenous fertilizer content and its splitting procedure on the dry weight of chamomile flowers was significant at probability level 0.01. Noticing, the highest rate of dry weight of flowers resulted when 100% nitrogenous fertilizer was applied at the beginning of flowering and the lowest rate was related to application of 150 kg nitrogenous fertilizer, which was the highest rate in comparison with other treatment and control levels. In general, during the present investigation, it was observed that consumption of above 50 kg per hectare of nitrogenous fertilizer had significant effects on the number of flowers and consequently, dry and wet weights of German chamomile flowers and an almost increasing trend is detectable in the number of flowers, wet weight, and dry weight. The effect of nitrogenous fertilizer content was statistically meaningful on stalk height at probability level 1%. In comparison of average stalk height with consumption of 150 kg of nitrogenous fertilizer, the maximum stalk height resulted. The results of the present study have revealed that through application of below 75 kg per hectare of nitrogen, the sufficient
concentration of this element is available to reach the maximum height of German chamomile plant and higher amounts of nitrogen had no effects on plant height. In other words, limitations in genetic potential of this plant inhibits higher rates of plant height at the above contents of nitrogenous fertilizer. The interactions between consumption rate and the procedure of splitting the nitrogenous fertilizer was also significant for stalk height. The effect of nitrogenous fertilizer content was statistically meaningful on the number of major stalks at probability level 1%. Noticing, application of 150 kg nitrogenous fertilizer dramatically increased the number of major stalks in chamomile plants. The stalk diameter was affected by application of nitrogenous fertilizer, but the effect of splitting the nitrogenous fertilizer and their interaction on stalk diameter was not significant. Noticing, through application of 150 kg nitrogenous fertilizer, the highest stalk diameter was approached, which could be attributed to increased growth of vegetative cells. The effect of application of nitrogenous fertilizer was statistically meaningful on the number of tillers per plant. Increasing nitrogenous fertilizer concentration above 50 kg caused a significant increase in the number of tillers per plant, so that the highest number of tillers was related to 150 kg per hectare of nitrogenous fertilizer. The effect of different values of nitrogenous

108
fertilizer on the number minor stalks was significant at probability level 1%. Comparison of different values of nitrogen showed that the minimum number of minor stalks belonged to levels 50 and 100 kg fertilizer per hectare, which were 66.1 and 66.8, respectively. The maximum number of minor stalks (82.1) was related to fertilizer levels 150 kg. In the results gained from fertilizer levels 100 and 50 Kg per hectare along with 0 Kg of nitrogenous fertilizer, decreased number of minor stalks was observed, whose reason is not clearly understood; however, it seems that other parameters such as environmental parameters could involve in this case. The effect of consumption rate, splitting procedure of nitrogenous fertilizer, and its interaction on essence percentage was statistically significant
in chamomile plant. Based on Figure 2, when at cultivation, of 100% specific fertilizer content of treatment 150 kg per hectare given to the plants, 58% essence was produced, which included the highest essence value in comparison with two fertilizer contents of 50 and 100 Kg per hectare applied on neither growth stages. When 100 kg nitrogenous fertilizer was completely given to the plant, the resultant essence percentage rate was at the same statistical level as the conditions under which the nitrogenous fertilizer was not applied at cultivation stage. The effect of consumption rate on essence weight in chamomile plant was statistically significant at probability level 1%. The highest essence weight was generated through application of 150 kg nitrogenous fertilizer per hectare.
Figure 2. The effect of nitrogenous fertilizer content and its splitting procedure during growth period on essence percentage
Correlation Coefficient of the Traits Investigated According to the table of correlation coefficient (3), there was a meaningful and positive correlation between the number of flowers on plants and most of the traits investigated. So that the highest correlation of the number of flowers was with wet and dry weight of flowers, stalk diameter, and essence weight. This indicates that increasing the number of flowers caused an increase in each of the traits mentioned. Also the correlation between wet weight of flowers and dry weight of flowers, stalk diameter, and essence weight had the highest value. The wet weight of flower had also the highest correlation with traits such as stalk diameter and the number of minor stalks. Stalk diameter had the highest correlation with the number of minor stalks, showing that with
increasing stalk diameter, the number of minor stalks increased significantly. In examination of the results of analysis of variance, the effect of nitrogenous fertilizer consumption rate was significant at probability level 1% on several traits including the number of flowers, wet weight of flowers, dry weight of flowers, plant height, number of stalks, stalk diameter, number of tillers, number of minor stalks, essence weight, and essence percentage. These findings are in accordance with the results of investigations done during 2008 (Zeynali et al., 2008). Based on the results summarized in Table 2, some researchers also proved that increased nitrogenous fertilizer levels caused higher growth of aerial organs and number of flowers and finally, leads in increased
00,10,20,30,40,50,60,7
zero- zero- onehundred
zero- fifty- fifty twenty five- fifty-twenty five
zero- one hundred-zero
Esse
nce p
erce
ntag
e
accumulation of dry material (Letchamo et al., 1993; Franz and Kirsch, 1974). Comparison between nitrogenous fertilizer levels was conducted in a study showing that via increasing the nitrogen content up to 225 kg per hectare, there was a significant increase in the number of flowers on each plant (Zeynali et al., 2008). During 1974, it was reported that nitrogen played a key role in the growth and development of German chamomile and its shortage at every stage of growth caused decreased number of flowers on each minor stalk by disrupted material synthesis and as a result, lower yield in chamomile. Generally, strains of chamomile with higher productivity and desired resistance to lodging have the potential of higher yield by increased content of nitrogenous fertilizer (Franz and Kirsch, 1974). Letchamo and coworkers (1993) reported that by increased nitrogen application, the number of flowers increased dramatically in German chamomile (Letchamo et al., 1993). The results presented in Figure 2 and 3 are compatible with the findings of Zeynali et al. (2008). They indicated that the application of nitrogen at the beginning of chamomile flowering caused increased growth of plant’s reproductive organs and as a result, its higher wet weight. They also stated that the application of nitrogen at the beginning of flowering caused relatively increased accumulation of dry material in flowers (Zeynali et al., 2008). Letchamo and coworkers (1993) reported that through elevating the nitrogen content, wet weight of flowers increased remarkably in German chamomile (Letchamo et al., 1993). Franz and Kirsch, 1974, and Meawad et al., 1984, also reported similar results. Findings reported through 1974 to 1984 show that by increasing nitrogenous fertilizer up to 150 kg per hectare, the number of flowers increases. Letchamo also reported that the rate of fertilization should be fit to plant genotype. He stated that in some species resistant to wind blow, it was meaningful to apply higher fertilizer values (Letchamo et al., 1993). However in some genotypes, higher levels of nitrogenous fertilizer will not lead in remarkably different number of flowers and this accordant with the results pf the present study (Franz and Kirsch, 1974 Meawad et al.,1984). Some reports have stated the required amount of fertilization as 60
kg of net nitrogen per hectare for autumn chamomile (Uori et al., 2000; Sheibanivaziri, 1998). Fernandez (1993) reported that 80 kg of net nitrogen per hectare was suitable for autumn chamomile (Fernandez et al., 1993). In comparison of average stalk height, the maximum height resulted from 150 kg per hectare of nitrogenous fertilizer. The results of Letchamo (1993) showed that by increased nitrogen application, the stalk height significantly increased in German chamomile (Letchamo et al., 1993). Franz and Kirsch, 1974, and Meawad et al., 1984, also reported similar results. Increasing nitrogenous fertilizer via altering the available soil nitrogen during growth season has great effects on height and usually parallel to its elevation, the plant height increases (Mirshekari et al., 2008). Principally, the reason for increased height as a result of applying nitrogenous fertilizer can be attributed to the synergistic effects of nitrogen on vegetative growth and cell divisions in plant organs, especially the stalks. Indicated that because of applying nitrogen, leaf and stalk weight increased. Consequently, it is expected that the plant produces more photosynthetic material and this sets the stage for stalk elongation (Broujerdi, 2002). In a study on autumn chamomile during 2002, it was concluded that by elevating nitrogen from 0 to 150 kg per hectare, there was an increase in stalk height. The maximum (52.1 cm) and minimum (38.3 cm) stalk height were related to 150 and 0 kg per hectare of net nitrogen, respectively and there was a significant difference among levels of nitrogenous fertilizer (Broujerdi, 2002). Figure 7 shows that application of 150 Kg nitrogenous fertilizer causes a significant increase in the number of major stalks in chamomile, which can be attributed to the synergistic effects of nitrogen on vegetative growth, cell divisions in plant organs, specially the stalk. As a consequence of nitrogen application, the number of leaves and stalks increases. Therefore, it is expected that the plant produces more photosynthetic material and this sets the stage for increased number of major stalks (Broujerdi, 2002). The results of investigations conducted by other researchers reveal that by increased nitrogen application, the number of flowering stalks increases significantly in German chamomile

109
fertilizer on the number minor stalks was significant at probability level 1%. Comparison of different values of nitrogen showed that the minimum number of minor stalks belonged to levels 50 and 100 kg fertilizer per hectare, which were 66.1 and 66.8, respectively. The maximum number of minor stalks (82.1) was related to fertilizer levels 150 kg. In the results gained from fertilizer levels 100 and 50 Kg per hectare along with 0 Kg of nitrogenous fertilizer, decreased number of minor stalks was observed, whose reason is not clearly understood; however, it seems that other parameters such as environmental parameters could involve in this case. The effect of consumption rate, splitting procedure of nitrogenous fertilizer, and its interaction on essence percentage was statistically significant
in chamomile plant. Based on Figure 2, when at cultivation, of 100% specific fertilizer content of treatment 150 kg per hectare given to the plants, 58% essence was produced, which included the highest essence value in comparison with two fertilizer contents of 50 and 100 Kg per hectare applied on neither growth stages. When 100 kg nitrogenous fertilizer was completely given to the plant, the resultant essence percentage rate was at the same statistical level as the conditions under which the nitrogenous fertilizer was not applied at cultivation stage. The effect of consumption rate on essence weight in chamomile plant was statistically significant at probability level 1%. The highest essence weight was generated through application of 150 kg nitrogenous fertilizer per hectare.
Figure 2. The effect of nitrogenous fertilizer content and its splitting procedure during growth period on essence percentage
Correlation Coefficient of the Traits Investigated According to the table of correlation coefficient (3), there was a meaningful and positive correlation between the number of flowers on plants and most of the traits investigated. So that the highest correlation of the number of flowers was with wet and dry weight of flowers, stalk diameter, and essence weight. This indicates that increasing the number of flowers caused an increase in each of the traits mentioned. Also the correlation between wet weight of flowers and dry weight of flowers, stalk diameter, and essence weight had the highest value. The wet weight of flower had also the highest correlation with traits such as stalk diameter and the number of minor stalks. Stalk diameter had the highest correlation with the number of minor stalks, showing that with
increasing stalk diameter, the number of minor stalks increased significantly. In examination of the results of analysis of variance, the effect of nitrogenous fertilizer consumption rate was significant at probability level 1% on several traits including the number of flowers, wet weight of flowers, dry weight of flowers, plant height, number of stalks, stalk diameter, number of tillers, number of minor stalks, essence weight, and essence percentage. These findings are in accordance with the results of investigations done during 2008 (Zeynali et al., 2008). Based on the results summarized in Table 2, some researchers also proved that increased nitrogenous fertilizer levels caused higher growth of aerial organs and number of flowers and finally, leads in increased
00,10,20,30,40,50,60,7
zero- zero- onehundred
zero- fifty- fifty twenty five- fifty-twenty five
zero- one hundred-zero
Esse
nce p
erce
ntag
e
accumulation of dry material (Letchamo et al., 1993; Franz and Kirsch, 1974). Comparison between nitrogenous fertilizer levels was conducted in a study showing that via increasing the nitrogen content up to 225 kg per hectare, there was a significant increase in the number of flowers on each plant (Zeynali et al., 2008). During 1974, it was reported that nitrogen played a key role in the growth and development of German chamomile and its shortage at every stage of growth caused decreased number of flowers on each minor stalk by disrupted material synthesis and as a result, lower yield in chamomile. Generally, strains of chamomile with higher productivity and desired resistance to lodging have the potential of higher yield by increased content of nitrogenous fertilizer (Franz and Kirsch, 1974). Letchamo and coworkers (1993) reported that by increased nitrogen application, the number of flowers increased dramatically in German chamomile (Letchamo et al., 1993). The results presented in Figure 2 and 3 are compatible with the findings of Zeynali et al. (2008). They indicated that the application of nitrogen at the beginning of chamomile flowering caused increased growth of plant’s reproductive organs and as a result, its higher wet weight. They also stated that the application of nitrogen at the beginning of flowering caused relatively increased accumulation of dry material in flowers (Zeynali et al., 2008). Letchamo and coworkers (1993) reported that through elevating the nitrogen content, wet weight of flowers increased remarkably in German chamomile (Letchamo et al., 1993). Franz and Kirsch, 1974, and Meawad et al., 1984, also reported similar results. Findings reported through 1974 to 1984 show that by increasing nitrogenous fertilizer up to 150 kg per hectare, the number of flowers increases. Letchamo also reported that the rate of fertilization should be fit to plant genotype. He stated that in some species resistant to wind blow, it was meaningful to apply higher fertilizer values (Letchamo et al., 1993). However in some genotypes, higher levels of nitrogenous fertilizer will not lead in remarkably different number of flowers and this accordant with the results pf the present study (Franz and Kirsch, 1974 Meawad et al.,1984). Some reports have stated the required amount of fertilization as 60
kg of net nitrogen per hectare for autumn chamomile (Uori et al., 2000; Sheibanivaziri, 1998). Fernandez (1993) reported that 80 kg of net nitrogen per hectare was suitable for autumn chamomile (Fernandez et al., 1993). In comparison of average stalk height, the maximum height resulted from 150 kg per hectare of nitrogenous fertilizer. The results of Letchamo (1993) showed that by increased nitrogen application, the stalk height significantly increased in German chamomile (Letchamo et al., 1993). Franz and Kirsch, 1974, and Meawad et al., 1984, also reported similar results. Increasing nitrogenous fertilizer via altering the available soil nitrogen during growth season has great effects on height and usually parallel to its elevation, the plant height increases (Mirshekari et al., 2008). Principally, the reason for increased height as a result of applying nitrogenous fertilizer can be attributed to the synergistic effects of nitrogen on vegetative growth and cell divisions in plant organs, especially the stalks. Indicated that because of applying nitrogen, leaf and stalk weight increased. Consequently, it is expected that the plant produces more photosynthetic material and this sets the stage for stalk elongation (Broujerdi, 2002). In a study on autumn chamomile during 2002, it was concluded that by elevating nitrogen from 0 to 150 kg per hectare, there was an increase in stalk height. The maximum (52.1 cm) and minimum (38.3 cm) stalk height were related to 150 and 0 kg per hectare of net nitrogen, respectively and there was a significant difference among levels of nitrogenous fertilizer (Broujerdi, 2002). Figure 7 shows that application of 150 Kg nitrogenous fertilizer causes a significant increase in the number of major stalks in chamomile, which can be attributed to the synergistic effects of nitrogen on vegetative growth, cell divisions in plant organs, specially the stalk. As a consequence of nitrogen application, the number of leaves and stalks increases. Therefore, it is expected that the plant produces more photosynthetic material and this sets the stage for increased number of major stalks (Broujerdi, 2002). The results of investigations conducted by other researchers reveal that by increased nitrogen application, the number of flowering stalks increases significantly in German chamomile

110
(Letchamo et al., 1993). As can be readily seen in Figure 2, the maximum stalk diameter was observed with 150 kg nitrogenous fertilizer per hectare. The reason is behind increased growth of vegetative cells. More than 50 kg increase in nitrogenous fertilizer caused a significant increase in the number of tillers and the highest number of tillers was produced by applying 150 Kg per hectare of nitrogenous fertilizer. Broujerdi (2002) and Fernandez and Krisch (1974) stated that the levels of nitrogenous fertilizer were meaningful on chamomile. Noting this significance, it can be concluded that the increased tiller number along with increased levels of nitrogenous fertilizer is meaningfully different between various genotypes. However, regarding the same strain used during the present study, it seems that environmental parameters have caused these alterations. Some reports of tillering were presented in 1990, which stated branching and tillering after the first harvest (Letchamo, 1990). Letchamo et al. (1993) reported that through increased nitrogen application, the number of tillers was significantly increased in German chamomile (Letchamo et al., 1993). Through comparison of different average nitrogen levels, it is inferred that the least number of minor stalks belongs to 50 and 100 Kg per hectare, with 66.1 and 66.8, respectively. The highest number of minor stalks (82.1) is related to 150 kg. looking at the results, the vegetative growth enhances by increasing nitrogenous fertilizer, which leads in increased branching and number of minor stalks. Franz and Kirsch (1974) also got similar results. In the results of fertilizer levels 100 and 50 kg per hectare along with zero of nitrogenous fertilizer content, we observed a decreased number of minor stalks, whose reason was not clear, but it seems that other factors such as environmental ones have been involved in this case (Franz and Kirsch, 1974). According to the findings of Sheibanivaziri (1997), the nitrogenous fertilization content of 60 kg per hectare yields the best and the highest essence rate in Chamzulene (Sheibanivaziri, 1998). Increasing the nitrogen content over 60 kg per hectare did not lead in significant differences in the essence rate (Bagheri et al., 2003). Investigations of Omidbaigi (2003) indicated that the cultivation time had a key
role in essence and chamazulene rate of chamomile flowers, so that the plants cultivated during the spring had higher essence and chamazulene rate than ones cultivated in autumn. He stated that the role of nitrogen along with cultivation date is essential for increasing the essence rate (Omidbaigi, 2003). In some studies, the average essence percentage was reported to be 0.58% in total of treatments and the highest essence rate was reported for the treatment with net nitrogenous fertilizer level of 135 kg per hectare (Madani, 2006). Our results are in accordance with the results reported by Meawad and coworkers (Meawad, 1984). The claimed that increasing the nitrogen content caused higher essence production. CONCLUSIONS It could be concluded that the consumption rate of nitrogenous fertilizer had significant effects on all of the traits examined in German chamomile. Also through increasing the rate of nitrogenous fertilizer consumption, the valuse of traits such as number of tillers, number of major and minor stalks,and essence weight increased. Applying nitrogenous fertilizer with the ratio of 25:50:25 percent led in increased essence percentage and effective traits in chamomile. Also fertilization level of 150 kg per hectare with the pattern of 25% at cultivation: 50% at the beginning of flowering: 25% at the middles of flowering could have the greatest effect on increasing essence percentage and most of the traits examined had positive and meaningful relations with each other. REFERENCES Abou-Zeid E.N., El-Sherbeeny S.S., 1974. A preliminary
study on the effect of GA on quality of volatile oil of Matricaria chamomilla L. Egyptian Journal of Physiological Sciences, 1, p. 63-70.
Abd-Allah A.M., Adam S.M., Abou-Hadid A.F., 2001. Productivity of green cowpea in sandy soil as influenced by different organic manure rates and sources. Egyption Journal of Horticultural Sciences, 28 (3), p. 331-340.
Ameri A., Nasiri M., Rezvani P., 2007. Effect of different nitrogen levels and plant density on flower, essential oil and extract production and nitrogen use efficiency of pot marigold (Calendula officinalis L.). Journal of Iranian Field Crop Research, 5(2), p. 315-325.
Broojerdi N., 2002. Effect of nitrogen and row spacing on the product and active ingredient chamomile. Master's thesis. Isfahan University of Technology, p. 30-40.
Bernath J., 2000. Medicinal and Aromatic Plants. Mezo Pub. Budapest, 667 pp.
Baydar H., Baydar N.G., 2005. The effects of harvest date, fermentation duration and Tween treatment on essential oil content and composition of industrial oil rose (Rosa damascena Mill.). Industrial Crops and Products, 21, p. 251-255.
Franz Ch., Kirsch C., 1974. Growth and flower formation of Matricaria chamomilla L. is dependence on varied nitrogen and potassium nutrition (in German). HortScience, 21, p. 11-19.
Fernandez R., Scull R., Gonzales J.L., Crespo M., Sanches E., Carballo C., 1993. Effect of fertilization on yield and quality of Matricaria recutita L. Aspect of mineral nutrition of the crop. 2nd Ed.
Ghasemi Dehkordi N., Mir Jalili M., Maghomi M., 1996. Extraction and Identification Matrisin chamomile flowers and stability in the alcoholic extract. Journal of Research and Construction, p. 11-20.
Ghaedi Jeshni M., Mousavinik M., Khammari, I., Rahimi M., 2017. The changes of yield and essential oil components of German Chamomile (Matricaria recutita L.) under application of phosphorus and zinc fertilizers and drought stress conditions. J. of the Saudi Society of Agricultural Sciences, 16, p. 60-65.
Jaymand K., Rezaee M.B., 2001. Essential oil and essence oil making equipment. Iranian J. of Medic. and Aromatic Plants Research, 9, p. 105-125.
Kawthar A.E., Rabie H., Ashour M., Fatma Ali S.I., 2017. Growth Characters and some Chemical Constituents of Matricaria chamomilla L. Plants in Relation to Green Manure and Compost Fertilizer in Sandy Soil. Middle East Journal of Agricultural Research, 6(1), p. 76-86.
Letchamo W., 1990. Nitrogen application affects yield and content of the active substances in Chamomile genotypes. In: Janich, J. and J. E. Simon (Eds.). New Crops. Wiley. New York, p. 636-639.
Letchamo W., Marquard R., Palevitch D., 1993. The pattern of active substances accumulation in camomile genotype:under difficult and harvesting frequencies. Acta–Horti. 331, p. 357-364.
Letchamo W., Gosselin A., Lisin G., 2006. Chamomile varieties and quality improvement issues. Program and Abstract book of the 1th. International Symposium on chamomile Research, Development and Production. Presov University in Presov.
Madani H., 2006. The effect of nitrogen and phosphorus fertilizer on yield and essential oil of chamomile.
Symposium of Medicinal Plants, Islamic Azad University of Shahr-e Kord.
Mirshekari M., Darbandi S. and Ejlali L., 2007. The effect of irrigation intervals, the amount and split application of nitrogen fertilizer on German chamomile essential oil. Journal of Crop Sciences, 9(2), p. 11-15.
Maleki A., Feizolahi A., Daneshian J., Naseri, R., Rashnavadi R., 2014. Effect of different sources of nitrogen and zinc sulfate on grain yield and its associated traits in marigold (Calendula officinalis L.). International J. of Biosciences, 4(6), p. 45-52.
Meawad A.A., Awad A.E., Afify A., 1984. The combined effect on N-fertilization and some growth regulators on chamomile plants. Acta Hort, 144, p. 123-134.
Naderidarbaghshahi M.R., Monemian M., Zeynali H., Bahari B., 2012. Effects of different levels of nitrogen, phosphorus and potassium fertilizers on some agro morphological and biochemical traits of German chamomile (Matricaria chamomilla L.). Journal of Medicinal Plants Research, 6(2), p. 277-283.
Omidbeigi R., 2005. Pharmaceutical plants production. Fekr-e-Rooz press. Iran, p. 150.
Omidbaigi R., Hassani A., Sefidkon F., 2003. Essential oil content and composition of sweet basil (Ocimum basilicum) at different irrigation regimes. Jeobp, 6, p. 104-108.
Rahmati M., Azizi M., Khayat MH., Neamati, H., 2009. The effects of different level of nitrogen and plant density on the agro morphological characters yield and essential oil content of improved chamomile (Matricaria chamomilla L.) cultivar ʻʻBodogoldʼʼ. Journal of horticultural Sciences, 23(1), p. 27-35.
Sheibanivaziri M., 1998. Study of effect of N.P.K on essential oil and chamazulene of chamomile. Ph.D. Thesis. Isfahan University of Medical Science.
Singh O., Khanam Z., Misra N., Srivastava M.K., 2011. Chamomile (Matricaria chamomilla L.): an overview. Pharmacognosy Reviews, 5 (9), p. 82-95.
Uori J.I., Sayre K.D., Rajaram S., McMahon M., 2000. Genetic progress in wheat yield and nitrogen use efficiency under four nitrogen rates. Crop Science, 37, p. 898-904.
Zeinali H., Bagheri kholnjani M., Gol parvar M.R., Jafar poor M., Shirani Rad A.H., 2008. The effect of sowing date and different levels of nitrogen on yield and its components in German chamomile (Matricaria recutita L). flowers. Journal of Crop Sciences, 10(3), 20-4.

111
(Letchamo et al., 1993). As can be readily seen in Figure 2, the maximum stalk diameter was observed with 150 kg nitrogenous fertilizer per hectare. The reason is behind increased growth of vegetative cells. More than 50 kg increase in nitrogenous fertilizer caused a significant increase in the number of tillers and the highest number of tillers was produced by applying 150 Kg per hectare of nitrogenous fertilizer. Broujerdi (2002) and Fernandez and Krisch (1974) stated that the levels of nitrogenous fertilizer were meaningful on chamomile. Noting this significance, it can be concluded that the increased tiller number along with increased levels of nitrogenous fertilizer is meaningfully different between various genotypes. However, regarding the same strain used during the present study, it seems that environmental parameters have caused these alterations. Some reports of tillering were presented in 1990, which stated branching and tillering after the first harvest (Letchamo, 1990). Letchamo et al. (1993) reported that through increased nitrogen application, the number of tillers was significantly increased in German chamomile (Letchamo et al., 1993). Through comparison of different average nitrogen levels, it is inferred that the least number of minor stalks belongs to 50 and 100 Kg per hectare, with 66.1 and 66.8, respectively. The highest number of minor stalks (82.1) is related to 150 kg. looking at the results, the vegetative growth enhances by increasing nitrogenous fertilizer, which leads in increased branching and number of minor stalks. Franz and Kirsch (1974) also got similar results. In the results of fertilizer levels 100 and 50 kg per hectare along with zero of nitrogenous fertilizer content, we observed a decreased number of minor stalks, whose reason was not clear, but it seems that other factors such as environmental ones have been involved in this case (Franz and Kirsch, 1974). According to the findings of Sheibanivaziri (1997), the nitrogenous fertilization content of 60 kg per hectare yields the best and the highest essence rate in Chamzulene (Sheibanivaziri, 1998). Increasing the nitrogen content over 60 kg per hectare did not lead in significant differences in the essence rate (Bagheri et al., 2003). Investigations of Omidbaigi (2003) indicated that the cultivation time had a key
role in essence and chamazulene rate of chamomile flowers, so that the plants cultivated during the spring had higher essence and chamazulene rate than ones cultivated in autumn. He stated that the role of nitrogen along with cultivation date is essential for increasing the essence rate (Omidbaigi, 2003). In some studies, the average essence percentage was reported to be 0.58% in total of treatments and the highest essence rate was reported for the treatment with net nitrogenous fertilizer level of 135 kg per hectare (Madani, 2006). Our results are in accordance with the results reported by Meawad and coworkers (Meawad, 1984). The claimed that increasing the nitrogen content caused higher essence production. CONCLUSIONS It could be concluded that the consumption rate of nitrogenous fertilizer had significant effects on all of the traits examined in German chamomile. Also through increasing the rate of nitrogenous fertilizer consumption, the valuse of traits such as number of tillers, number of major and minor stalks,and essence weight increased. Applying nitrogenous fertilizer with the ratio of 25:50:25 percent led in increased essence percentage and effective traits in chamomile. Also fertilization level of 150 kg per hectare with the pattern of 25% at cultivation: 50% at the beginning of flowering: 25% at the middles of flowering could have the greatest effect on increasing essence percentage and most of the traits examined had positive and meaningful relations with each other. REFERENCES Abou-Zeid E.N., El-Sherbeeny S.S., 1974. A preliminary
study on the effect of GA on quality of volatile oil of Matricaria chamomilla L. Egyptian Journal of Physiological Sciences, 1, p. 63-70.
Abd-Allah A.M., Adam S.M., Abou-Hadid A.F., 2001. Productivity of green cowpea in sandy soil as influenced by different organic manure rates and sources. Egyption Journal of Horticultural Sciences, 28 (3), p. 331-340.
Ameri A., Nasiri M., Rezvani P., 2007. Effect of different nitrogen levels and plant density on flower, essential oil and extract production and nitrogen use efficiency of pot marigold (Calendula officinalis L.). Journal of Iranian Field Crop Research, 5(2), p. 315-325.
Broojerdi N., 2002. Effect of nitrogen and row spacing on the product and active ingredient chamomile. Master's thesis. Isfahan University of Technology, p. 30-40.
Bernath J., 2000. Medicinal and Aromatic Plants. Mezo Pub. Budapest, 667 pp.
Baydar H., Baydar N.G., 2005. The effects of harvest date, fermentation duration and Tween treatment on essential oil content and composition of industrial oil rose (Rosa damascena Mill.). Industrial Crops and Products, 21, p. 251-255.
Franz Ch., Kirsch C., 1974. Growth and flower formation of Matricaria chamomilla L. is dependence on varied nitrogen and potassium nutrition (in German). HortScience, 21, p. 11-19.
Fernandez R., Scull R., Gonzales J.L., Crespo M., Sanches E., Carballo C., 1993. Effect of fertilization on yield and quality of Matricaria recutita L. Aspect of mineral nutrition of the crop. 2nd Ed.
Ghasemi Dehkordi N., Mir Jalili M., Maghomi M., 1996. Extraction and Identification Matrisin chamomile flowers and stability in the alcoholic extract. Journal of Research and Construction, p. 11-20.
Ghaedi Jeshni M., Mousavinik M., Khammari, I., Rahimi M., 2017. The changes of yield and essential oil components of German Chamomile (Matricaria recutita L.) under application of phosphorus and zinc fertilizers and drought stress conditions. J. of the Saudi Society of Agricultural Sciences, 16, p. 60-65.
Jaymand K., Rezaee M.B., 2001. Essential oil and essence oil making equipment. Iranian J. of Medic. and Aromatic Plants Research, 9, p. 105-125.
Kawthar A.E., Rabie H., Ashour M., Fatma Ali S.I., 2017. Growth Characters and some Chemical Constituents of Matricaria chamomilla L. Plants in Relation to Green Manure and Compost Fertilizer in Sandy Soil. Middle East Journal of Agricultural Research, 6(1), p. 76-86.
Letchamo W., 1990. Nitrogen application affects yield and content of the active substances in Chamomile genotypes. In: Janich, J. and J. E. Simon (Eds.). New Crops. Wiley. New York, p. 636-639.
Letchamo W., Marquard R., Palevitch D., 1993. The pattern of active substances accumulation in camomile genotype:under difficult and harvesting frequencies. Acta–Horti. 331, p. 357-364.
Letchamo W., Gosselin A., Lisin G., 2006. Chamomile varieties and quality improvement issues. Program and Abstract book of the 1th. International Symposium on chamomile Research, Development and Production. Presov University in Presov.
Madani H., 2006. The effect of nitrogen and phosphorus fertilizer on yield and essential oil of chamomile.
Symposium of Medicinal Plants, Islamic Azad University of Shahr-e Kord.
Mirshekari M., Darbandi S. and Ejlali L., 2007. The effect of irrigation intervals, the amount and split application of nitrogen fertilizer on German chamomile essential oil. Journal of Crop Sciences, 9(2), p. 11-15.
Maleki A., Feizolahi A., Daneshian J., Naseri, R., Rashnavadi R., 2014. Effect of different sources of nitrogen and zinc sulfate on grain yield and its associated traits in marigold (Calendula officinalis L.). International J. of Biosciences, 4(6), p. 45-52.
Meawad A.A., Awad A.E., Afify A., 1984. The combined effect on N-fertilization and some growth regulators on chamomile plants. Acta Hort, 144, p. 123-134.
Naderidarbaghshahi M.R., Monemian M., Zeynali H., Bahari B., 2012. Effects of different levels of nitrogen, phosphorus and potassium fertilizers on some agro morphological and biochemical traits of German chamomile (Matricaria chamomilla L.). Journal of Medicinal Plants Research, 6(2), p. 277-283.
Omidbeigi R., 2005. Pharmaceutical plants production. Fekr-e-Rooz press. Iran, p. 150.
Omidbaigi R., Hassani A., Sefidkon F., 2003. Essential oil content and composition of sweet basil (Ocimum basilicum) at different irrigation regimes. Jeobp, 6, p. 104-108.
Rahmati M., Azizi M., Khayat MH., Neamati, H., 2009. The effects of different level of nitrogen and plant density on the agro morphological characters yield and essential oil content of improved chamomile (Matricaria chamomilla L.) cultivar ʻʻBodogoldʼʼ. Journal of horticultural Sciences, 23(1), p. 27-35.
Sheibanivaziri M., 1998. Study of effect of N.P.K on essential oil and chamazulene of chamomile. Ph.D. Thesis. Isfahan University of Medical Science.
Singh O., Khanam Z., Misra N., Srivastava M.K., 2011. Chamomile (Matricaria chamomilla L.): an overview. Pharmacognosy Reviews, 5 (9), p. 82-95.
Uori J.I., Sayre K.D., Rajaram S., McMahon M., 2000. Genetic progress in wheat yield and nitrogen use efficiency under four nitrogen rates. Crop Science, 37, p. 898-904.
Zeinali H., Bagheri kholnjani M., Gol parvar M.R., Jafar poor M., Shirani Rad A.H., 2008. The effect of sowing date and different levels of nitrogen on yield and its components in German chamomile (Matricaria recutita L). flowers. Journal of Crop Sciences, 10(3), 20-4.

112
AgroLife Scientific Journal - Volume 6, Number 2, 2017ISSN 2285-5718; ISSN CD-ROM 2285-5726; ISSN ONLINE 2286-0126; ISSN-L 2285-5718
REVIEW ON DIETARY TOCOPHEROL ACCUMULATION
ON PORK TISSUES AND ITS MEMBRANE ANTIOXIDANT ROLE AGAINST LIPID OXIDATION
Mihaela GHIDURUȘ, Leonard ILIE, Mioara VARGA, Mircea MIHALACHE
University of Agronomic Sciences and Veterinary Medicine of Bucharest,
59 Mărăști Blvd., 011464, District 1, Bucharest, Romania
Corresponding author email: [email protected]
Abstract Lipid oxidation prejudices meat quality by degrading polyunsaturated fatty acids to volatile short chain compounds that are the source of undesirable flavours and odours which reduce the appeal of products to consumers. The current review is a comprehensive study dealing with the effect the way tocopherol is absorbed by direct incorporation into diet in the intestine and then transported to the liver and distributed throughout the body, reaching out the highest amount in microsomes and mitochondria. Cumulative results of previous studies and experiments indicates that the susceptibility of meat to lipid oxidation is influenced by the α-tocopherol content of meat and PUFA content of the membrane phospholipids. Within the frame of the review we provide confirmation of the positive effect of dietary vitamin E levels on lipid oxidation by studying and analyzing published experiments where lipid oxidation was measured and where vitamin E accumulation was evaluated, established a quantitative relationship between dietary vitamin E alone and in conjunction with other antioxidants and its effects on pork meat quality. Key words: vitamin E, tocopherol, meat, quality, oxidation. IMPLICATIONS Changes of the national and international consumer behavior have brought new challenges for pig production. This is not only because new legislations are continuously established, but also because the consumers are becoming increasingly conscious. Nowadays, more consumers are concerned about the wellbeing aspects and ask for health promoting produced meat and meat products. The review is defining the perspective of using vitamin E as an antioxidant ensuring in this way the required dosage which will endow the producers with the appropriate know how to use those antioxidants to meet consumer expectations in term of pork meat quality. INTRODUCTION Quality (Latin for character, nature, property) is the measurable entirety of character traits, nature or quality grade of a product or service. Thus, quality traits distinguish products from other products either to their merits or
deficiencies. The term meat quality concerns both the meat as a product (product quality) and the way the meat was produced (production quality) (Heyer et al., 2004). Pig meat quality is determined by many aspects, among which odour and taste are the most important attributes. Further, product quality can be divided into technological, nutritional, hygienic and sensory quality. Measurement of each of these four meat quality traits and the production quality demand different assessments and are also of varying importance for the meat purchaser. The meat processing industry might be most concerned with technological meat quality, whereas the consumer is concerned with sensory and healthy meat quality as well as production quality (Lundström et al., 2009). A reasonable answer to these demands required by the market trend refers to a type food that contains added, technologically developed ingredients with a specific health benefit (Niva, 2007; Bhat and H. Bhat, 2011). These are food-type products that contain significant levels of biologically active components that influence specific physiological functions in the body, thereby providing benefits to health, well-being
or performance, beyond regular nutrition and are marketed and consumed for this value added property (Bhat and H. Bhat, 2011). The food industry is adopting various methods designed to maintain the quality, among those they include the use of antioxidants (Ghidurus and Varga, 2017). A multitude of studies have shown that dietary antioxidants can alleviate oxidative stress in livestock and improve the quality of animal products (Salami et al., 2016). Therefore antioxidant vitamins are essential in the animal diet for normal health (Fiego et al., 2004). Previous studies shows that slaughter randament, the chemical composition of meat and the blood content in total cholesterol were not influenced by the type of fat introduced into the compound feed (Marin et al., 2015). The oxidative stability of muscle depends upon the balance between antioxidants, such as α-tocopherol and prooxidants including the free iron in the muscle and concentrations of polyunsaturated fatty acids (PUFA) (Yang et al., 2002). Vitamin E plays a fundamental role in the prevention of radical formation in biological systems like plasma, membranes and tissues. Vitamin E is the collective name for the eight naturally occurring forms α, β, γ and δ-tocopherols and α β, γ and δ-tocotrienols. Historically, α-tocopherol was reported to have the highest biological activity (Niculita et al., 2007). α-tocopherol and its derivatives are lipid-soluble antioxidants that suppress peroxidation of membrane lipids (Chow, 1991), it protects cells from oxygen radicals in vivo (Miller and Brzezinska-Slebodzinska, 1993) and in vitro, and is believed to be the primary free radical scavenger in mammalian cell membranes (Saikhun et al., 2008). Swine nutritional aspects: dosage and duration of administration of tocopherol in pigs Regarding the period of administration of the dietary supplement it was observed that the tocopherol was significantly higher in the muscles of pigs fed supplement of 200 mg �-tocopheryl acetate/kg feed for a period of 126 days before slaughter compared with pigs that were administered a low concentration of 20 mg/kg (� tocopheryl acetate/kg feed) for 91
days (Morrissey, 1996). Niculita et al. (2007) concluded that supplementation with vitamin E augment α-tocopherol levels in blood serum and muscles from pig samples receiving 300 mg/kg feed. Onibi et al. (2000) suggested that pig tissues become saturated with α-tocopherol at supplemented α-tocopheryl acetate concen-trations of 200 to 500 mg/kg of diet, and α-tocopherol is no longer proportional to the dietary supply at greater concentrations. The accumulation of � tocopherol does not reach the limits of saturation in muscle of pigs fed with 700 mg/kg �-tocopheryl acetate (Jensen et al., 1997). In conclusion, vitamin E concentration in muscle is directly proportional to the concentration administered via animal feed and the period during which the supplement is administered vitamin E. Minimum nutritional requirements have been set in growing-finishing pigs at 11 IU/kg for vitamin E (Olivares et al., 2009; National Research Council (NRC), 1998). Absorption and distribution of vitamin E in the tissues The composition of biological tissues can be modified through diet, either by direct incorporation of the absorbed compounds or by their interactions with anabolic and catabolic pathways (Tres et al., 2009). Absorption of natural or synthetic form of vitamin E occurs in the small intestine. Tocopherol acetate is transformed into a tocopherol in the intestine before or during absorption. The largest portion of the tocopherol ester is hydrolyzed by esterases in the intestinal mucosa and the rest by duodenal or intraluminal esterases (Pinelli-Saavedra, 2003). Dietary tocopherol absorption is done mainly through the lymphatic system where they are transported to the chylomicrons rich in triglycerides and from here transferred to the liver. Thus vitamin E is then secreted by the liver, incorporated into very low density lipoproteins (VLDL) and finally transported to the low density lipoprotein (LDL) after previously recognized by specific LDL receptors from plasma (Herrera and Barbas, 2001). Vitamin E is also found in red blood cells and platelet cells and thus distributed throughout the body, but the highest amount of
113
REVIEW ON DIETARY TOCOPHEROL ACCUMULATION
ON PORK TISSUES AND ITS MEMBRANE ANTIOXIDANT ROLE AGAINST LIPID OXIDATION
Mihaela GHIDURUȘ, Leonard ILIE, Mioara VARGA, Mircea MIHALACHE
University of Agronomic Sciences and Veterinary Medicine of Bucharest,
59 Mărăști Blvd., 011464, District 1, Bucharest, Romania
Corresponding author email: [email protected]
Abstract Lipid oxidation prejudices meat quality by degrading polyunsaturated fatty acids to volatile short chain compounds that are the source of undesirable flavours and odours which reduce the appeal of products to consumers. The current review is a comprehensive study dealing with the effect the way tocopherol is absorbed by direct incorporation into diet in the intestine and then transported to the liver and distributed throughout the body, reaching out the highest amount in microsomes and mitochondria. Cumulative results of previous studies and experiments indicates that the susceptibility of meat to lipid oxidation is influenced by the α-tocopherol content of meat and PUFA content of the membrane phospholipids. Within the frame of the review we provide confirmation of the positive effect of dietary vitamin E levels on lipid oxidation by studying and analyzing published experiments where lipid oxidation was measured and where vitamin E accumulation was evaluated, established a quantitative relationship between dietary vitamin E alone and in conjunction with other antioxidants and its effects on pork meat quality. Key words: vitamin E, tocopherol, meat, quality, oxidation. IMPLICATIONS Changes of the national and international consumer behavior have brought new challenges for pig production. This is not only because new legislations are continuously established, but also because the consumers are becoming increasingly conscious. Nowadays, more consumers are concerned about the wellbeing aspects and ask for health promoting produced meat and meat products. The review is defining the perspective of using vitamin E as an antioxidant ensuring in this way the required dosage which will endow the producers with the appropriate know how to use those antioxidants to meet consumer expectations in term of pork meat quality. INTRODUCTION Quality (Latin for character, nature, property) is the measurable entirety of character traits, nature or quality grade of a product or service. Thus, quality traits distinguish products from other products either to their merits or
deficiencies. The term meat quality concerns both the meat as a product (product quality) and the way the meat was produced (production quality) (Heyer et al., 2004). Pig meat quality is determined by many aspects, among which odour and taste are the most important attributes. Further, product quality can be divided into technological, nutritional, hygienic and sensory quality. Measurement of each of these four meat quality traits and the production quality demand different assessments and are also of varying importance for the meat purchaser. The meat processing industry might be most concerned with technological meat quality, whereas the consumer is concerned with sensory and healthy meat quality as well as production quality (Lundström et al., 2009). A reasonable answer to these demands required by the market trend refers to a type food that contains added, technologically developed ingredients with a specific health benefit (Niva, 2007; Bhat and H. Bhat, 2011). These are food-type products that contain significant levels of biologically active components that influence specific physiological functions in the body, thereby providing benefits to health, well-being
or performance, beyond regular nutrition and are marketed and consumed for this value added property (Bhat and H. Bhat, 2011). The food industry is adopting various methods designed to maintain the quality, among those they include the use of antioxidants (Ghidurus and Varga, 2017). A multitude of studies have shown that dietary antioxidants can alleviate oxidative stress in livestock and improve the quality of animal products (Salami et al., 2016). Therefore antioxidant vitamins are essential in the animal diet for normal health (Fiego et al., 2004). Previous studies shows that slaughter randament, the chemical composition of meat and the blood content in total cholesterol were not influenced by the type of fat introduced into the compound feed (Marin et al., 2015). The oxidative stability of muscle depends upon the balance between antioxidants, such as α-tocopherol and prooxidants including the free iron in the muscle and concentrations of polyunsaturated fatty acids (PUFA) (Yang et al., 2002). Vitamin E plays a fundamental role in the prevention of radical formation in biological systems like plasma, membranes and tissues. Vitamin E is the collective name for the eight naturally occurring forms α, β, γ and δ-tocopherols and α β, γ and δ-tocotrienols. Historically, α-tocopherol was reported to have the highest biological activity (Niculita et al., 2007). α-tocopherol and its derivatives are lipid-soluble antioxidants that suppress peroxidation of membrane lipids (Chow, 1991), it protects cells from oxygen radicals in vivo (Miller and Brzezinska-Slebodzinska, 1993) and in vitro, and is believed to be the primary free radical scavenger in mammalian cell membranes (Saikhun et al., 2008). Swine nutritional aspects: dosage and duration of administration of tocopherol in pigs Regarding the period of administration of the dietary supplement it was observed that the tocopherol was significantly higher in the muscles of pigs fed supplement of 200 mg �-tocopheryl acetate/kg feed for a period of 126 days before slaughter compared with pigs that were administered a low concentration of 20 mg/kg (� tocopheryl acetate/kg feed) for 91
days (Morrissey, 1996). Niculita et al. (2007) concluded that supplementation with vitamin E augment α-tocopherol levels in blood serum and muscles from pig samples receiving 300 mg/kg feed. Onibi et al. (2000) suggested that pig tissues become saturated with α-tocopherol at supplemented α-tocopheryl acetate concen-trations of 200 to 500 mg/kg of diet, and α-tocopherol is no longer proportional to the dietary supply at greater concentrations. The accumulation of � tocopherol does not reach the limits of saturation in muscle of pigs fed with 700 mg/kg �-tocopheryl acetate (Jensen et al., 1997). In conclusion, vitamin E concentration in muscle is directly proportional to the concentration administered via animal feed and the period during which the supplement is administered vitamin E. Minimum nutritional requirements have been set in growing-finishing pigs at 11 IU/kg for vitamin E (Olivares et al., 2009; National Research Council (NRC), 1998). Absorption and distribution of vitamin E in the tissues The composition of biological tissues can be modified through diet, either by direct incorporation of the absorbed compounds or by their interactions with anabolic and catabolic pathways (Tres et al., 2009). Absorption of natural or synthetic form of vitamin E occurs in the small intestine. Tocopherol acetate is transformed into a tocopherol in the intestine before or during absorption. The largest portion of the tocopherol ester is hydrolyzed by esterases in the intestinal mucosa and the rest by duodenal or intraluminal esterases (Pinelli-Saavedra, 2003). Dietary tocopherol absorption is done mainly through the lymphatic system where they are transported to the chylomicrons rich in triglycerides and from here transferred to the liver. Thus vitamin E is then secreted by the liver, incorporated into very low density lipoproteins (VLDL) and finally transported to the low density lipoprotein (LDL) after previously recognized by specific LDL receptors from plasma (Herrera and Barbas, 2001). Vitamin E is also found in red blood cells and platelet cells and thus distributed throughout the body, but the highest amount of

114
vitamin E is found in microsomes and mitochondria, which are membrane-bound organelles (Lodge, 2005). Tocopherol concentrations in plasma and tissues are proportional to the logarithm of the amount given in the diet. Studies in mice and pigs have demonstrated that, in general, liver, skeletal muscle and fat tissue increased proportionally with increasing the dose of supplement administered from 16 to 421 mg/kg feed (Jensen et al., 1988; Niculita et al., 2007). It has been found experimentally that the level of α-tocopherol in tissues of pigs was influenced by the amount of tocopherol acetate administered in the diet of animals. Amazan et al., 2014, studied the influence of vitamin E supplementation source (natural form in water versus the synthetic form in feed) and dose administrated to piglets and/or sows on serum α-tocopherol concentration and antioxidant capacity on weaned piglets. He found that oral supplementation to sow with natural vitamin E as d α-tocopherol at the lowest dose produced similar concentration of α-tocopherol in serum at days 2, 4 and 28 postpartum to those supplemented with threefold higher dose of the synthetic form in feed. After 39 days of age neither piglet supplementation source nor dose affected α-tocopherol accumulation in the serum, muscle subcutaneous fat or liver. Asghar et al. (1991a) have quantified vitamin E isomers in the tissues of pigs fed a daily diet of all-rac tocopherol acetate. It has been found that only α-tocopherol was present in the muscle, adipose tissues and in subcellular fractions of the muscle. γ and δ isomers of vitamin E were not detectable. At subcellular level the largest amount of α-tocopherol was found in mitochondria, followed by microsomes. α-tocopherol accumulation in these cellular organelles increased linearly with level of vitamin E supplemented in swine diet. �-tocopherol accumulation in various types of tissues varies as follows: kidney tissue<lung tissue<heart tissue<liver (Monahan et al., 1994; Asghar et al., 1991a). Moreover �-tocopherol content is absorbed significantly different in the mitochondria of white muscles compared to red muscles. Trefan et al. (2011) found after a number of standardization procedures, a nonlinear relationship between the
supplementary vitamin E and the accumulation of α-tocopherol in pork which approached a maximum value of 6.4 μg/g tissues. The amount of vitamin E accumulated in the muscle depends on the type of muscle fibers, their distribution, as well as their metabolic activity. O'Sullivan et al. (1997) observed that the thoracic muscles had the highest amount of vitamin E absorbed followed by cervical musculature, pelvis and shoulders. However, longissimus dorsi muscles are the most studied when aiming to establish a relationship between the levels of vitamin E administrated into diet and vitamin E concentration in the muscle. This is because tocopheryl acetate will trigger an increase of � tocopherol in longissimus dorsi muscles of the swine (Trefan et al., 2011). Asghar et al. (1991b) analyzed the quantity of tocopherol in longissimus dorsi muscles and found that this muscle had the highest content of �-tocopherol. Although we have already substantial information on the action, effects and metabolism of vitamin E, there are still several questions open. The most intriguing is its interaction with other antioxidants that may explain how foods containing small amounts of vitamin E provide greater benefits than larger doses of vitamin E alone (Herrera and Barbas, 2001). An interesting finding was reported by Ching et al. (2002), regarding the accumulation of vitamin E when administrated along with vitamin A. The result of the experiment shows that dietary vitamin E sources had no effect on serum or liver retinol concentrations. These results demonstrated that both supplemental vitamin A and vitamin E increased in the blood as their dietary levels increased. However, as dietary vitamin A level increased, serum and liver α-tocopherol concentrations declined, suggesting a reduced absorption and retention of α-tocopherol when weaned pigs were fed high dietary vitamin A levels. Olivares et al. (2009) found that in fattening pigs, feeding very high levels of vitamin A (such as 100 000 IU/kg diet) negatively affects �-tocopherol concentration in pig tissues and increases susceptibility of muscle tissue to oxidation. Muscle, adipose tissue and liver �-tocopherol concentration is not affected by dVitA in the
range 1300 to 13 000 IU/kg, but liver �-tocopherol concentration is higher if vitamin A is removed from the vitamin mix 5 weeks prior to slaughter. This suggests an interesting alternative to enhancing α-tocopherol in pig tissues. Future research is needed to establish the most adequate time/dose combination of dietary vitamin A and E in order to ensure meat quality characteristics in pigs. The role of vitamin E in the metabolic processes and its membrane antioxidant role In the last decade, a high number of so-called novel functions of almost all forms of vitamin E have been described, including regulation of cellular signaling and gene expression. α-tocopherol appears to be most involved in gene regulation, whereas gamma-tocopherol appears to be highly effective in preventing cancer-related processes (Brigelius-Flohé, 2006). Vitamin E is a lipid-soluble antioxidant important for the maturation and function of the immune system (Nakamura and Omaye, 2009; Hedemann et al., 2011). The most important role, however, is that in vivo antioxidant, which protects against free radical attack fat (Hennekens, 1998). �-tocopherol is an efficient scavenger of lipid peroxyl radicals and, hence, it is able to break peroxyl chain propagation reactions. The unpaired electron of the tocopheroxyl radical thus formed tends to be delocalized rendering the radical more stable. The radical form may be converted back to �-tocopherol in redox cycle reactions involving coenzyme Q. The regeneration of alpha-tocopherol from its tocopheroxyloxyl radical greatly enhances the turnover efficiency of �-tocopherol in its role as a lipid antioxidant (Wang and Quinn, 1999). Most of the novel functions of individual forms of vitamin E have been demonstrated in vitro only and require in vivo confirmation. The distinct bioactivities of the various vitamins are discussed, considering their metabolism and the potential functions of metabolites (Brigelius-Flohé, 2006). Among the vitamin E isomers, RRR-α-tocopherol (α-T) has the highest in vivo bioavailability and bioactivity tested with different protocols, and also shows the highest H-donating activity in vitro. In the liver tissue,
it is bound by a specific transport proteinthe α-tocopherol transfer protein (α-TTP) for distribution in circulation and thus in peripheral tissues (Galli et al., 2017). This preferential binding appears to protect this form excretion and catabolism as it occurs for the other forms. In this respect, the different forms are discriminated by the liver so that only α-T is retained and distributed to the cellular membranes of tissues, whereas the other forms are rapidly metabolized and excreted with the same mechanism of long-chain fatty acids and lipophilic xenobiotics (Ambrogini et al., 2016). �-tocopherol protects fatty highly unsaturated against peroxidation by free radicals produced by NADPH oxidase enzymes (Benzie, 1996). By using enzymatic antioxidant mechanisms body protects itself from ROS (reactive oxygen species). The antioxidant enzymes reduce the levels of lipid hydroperoxide and H2O2, thus they are important in the prevention of lipid peroxidation and maintaining the structure and function of cell membranes (Nimse, 2015). Important to note is that the addition of �-tocopherol post-mortem meat is not as effec-tive as when it is used as a nutritional sup-plement, since the added post-mortem �-tocopherol cannot be incorporated directly into at the membrane level where the oxidation process is carried out (Schaefer et al., 1995). However �-tocopherol preserves the integrity of muscle cell membranes, inhibiting the passage of sarcoplasmic fluid through it, as well as acting as a radical-quenching antioxi-dant, consequently preventing drip loss and the oxidation of membrane phospholipids during storage when added into the diet (Asghar et al., 1991b; Gray et al., 1996; Faustman et al., 1998; Nassu et al., 2011). The antioxidant effects of vitamin E on pork meat quality The alteration of the meat may be a consequence of lipid and pigment oxidation in the meat (Alvares et al., 2008). Oxidation in biological tissues should be avoided because some negative biological effects have been attributed to lipid oxidation products (Guardiola et al., 2002; Niki et al., 2005; Spiteller, 2006; Tres et al., 2009). In meat and food products, oxidation might lead to a
115
vitamin E is found in microsomes and mitochondria, which are membrane-bound organelles (Lodge, 2005). Tocopherol concentrations in plasma and tissues are proportional to the logarithm of the amount given in the diet. Studies in mice and pigs have demonstrated that, in general, liver, skeletal muscle and fat tissue increased proportionally with increasing the dose of supplement administered from 16 to 421 mg/kg feed (Jensen et al., 1988; Niculita et al., 2007). It has been found experimentally that the level of α-tocopherol in tissues of pigs was influenced by the amount of tocopherol acetate administered in the diet of animals. Amazan et al., 2014, studied the influence of vitamin E supplementation source (natural form in water versus the synthetic form in feed) and dose administrated to piglets and/or sows on serum α-tocopherol concentration and antioxidant capacity on weaned piglets. He found that oral supplementation to sow with natural vitamin E as d α-tocopherol at the lowest dose produced similar concentration of α-tocopherol in serum at days 2, 4 and 28 postpartum to those supplemented with threefold higher dose of the synthetic form in feed. After 39 days of age neither piglet supplementation source nor dose affected α-tocopherol accumulation in the serum, muscle subcutaneous fat or liver. Asghar et al. (1991a) have quantified vitamin E isomers in the tissues of pigs fed a daily diet of all-rac tocopherol acetate. It has been found that only α-tocopherol was present in the muscle, adipose tissues and in subcellular fractions of the muscle. γ and δ isomers of vitamin E were not detectable. At subcellular level the largest amount of α-tocopherol was found in mitochondria, followed by microsomes. α-tocopherol accumulation in these cellular organelles increased linearly with level of vitamin E supplemented in swine diet. �-tocopherol accumulation in various types of tissues varies as follows: kidney tissue<lung tissue<heart tissue<liver (Monahan et al., 1994; Asghar et al., 1991a). Moreover �-tocopherol content is absorbed significantly different in the mitochondria of white muscles compared to red muscles. Trefan et al. (2011) found after a number of standardization procedures, a nonlinear relationship between the
supplementary vitamin E and the accumulation of α-tocopherol in pork which approached a maximum value of 6.4 μg/g tissues. The amount of vitamin E accumulated in the muscle depends on the type of muscle fibers, their distribution, as well as their metabolic activity. O'Sullivan et al. (1997) observed that the thoracic muscles had the highest amount of vitamin E absorbed followed by cervical musculature, pelvis and shoulders. However, longissimus dorsi muscles are the most studied when aiming to establish a relationship between the levels of vitamin E administrated into diet and vitamin E concentration in the muscle. This is because tocopheryl acetate will trigger an increase of � tocopherol in longissimus dorsi muscles of the swine (Trefan et al., 2011). Asghar et al. (1991b) analyzed the quantity of tocopherol in longissimus dorsi muscles and found that this muscle had the highest content of �-tocopherol. Although we have already substantial information on the action, effects and metabolism of vitamin E, there are still several questions open. The most intriguing is its interaction with other antioxidants that may explain how foods containing small amounts of vitamin E provide greater benefits than larger doses of vitamin E alone (Herrera and Barbas, 2001). An interesting finding was reported by Ching et al. (2002), regarding the accumulation of vitamin E when administrated along with vitamin A. The result of the experiment shows that dietary vitamin E sources had no effect on serum or liver retinol concentrations. These results demonstrated that both supplemental vitamin A and vitamin E increased in the blood as their dietary levels increased. However, as dietary vitamin A level increased, serum and liver α-tocopherol concentrations declined, suggesting a reduced absorption and retention of α-tocopherol when weaned pigs were fed high dietary vitamin A levels. Olivares et al. (2009) found that in fattening pigs, feeding very high levels of vitamin A (such as 100 000 IU/kg diet) negatively affects �-tocopherol concentration in pig tissues and increases susceptibility of muscle tissue to oxidation. Muscle, adipose tissue and liver �-tocopherol concentration is not affected by dVitA in the
range 1300 to 13 000 IU/kg, but liver �-tocopherol concentration is higher if vitamin A is removed from the vitamin mix 5 weeks prior to slaughter. This suggests an interesting alternative to enhancing α-tocopherol in pig tissues. Future research is needed to establish the most adequate time/dose combination of dietary vitamin A and E in order to ensure meat quality characteristics in pigs. The role of vitamin E in the metabolic processes and its membrane antioxidant role In the last decade, a high number of so-called novel functions of almost all forms of vitamin E have been described, including regulation of cellular signaling and gene expression. α-tocopherol appears to be most involved in gene regulation, whereas gamma-tocopherol appears to be highly effective in preventing cancer-related processes (Brigelius-Flohé, 2006). Vitamin E is a lipid-soluble antioxidant important for the maturation and function of the immune system (Nakamura and Omaye, 2009; Hedemann et al., 2011). The most important role, however, is that in vivo antioxidant, which protects against free radical attack fat (Hennekens, 1998). �-tocopherol is an efficient scavenger of lipid peroxyl radicals and, hence, it is able to break peroxyl chain propagation reactions. The unpaired electron of the tocopheroxyl radical thus formed tends to be delocalized rendering the radical more stable. The radical form may be converted back to �-tocopherol in redox cycle reactions involving coenzyme Q. The regeneration of alpha-tocopherol from its tocopheroxyloxyl radical greatly enhances the turnover efficiency of �-tocopherol in its role as a lipid antioxidant (Wang and Quinn, 1999). Most of the novel functions of individual forms of vitamin E have been demonstrated in vitro only and require in vivo confirmation. The distinct bioactivities of the various vitamins are discussed, considering their metabolism and the potential functions of metabolites (Brigelius-Flohé, 2006). Among the vitamin E isomers, RRR-α-tocopherol (α-T) has the highest in vivo bioavailability and bioactivity tested with different protocols, and also shows the highest H-donating activity in vitro. In the liver tissue,
it is bound by a specific transport proteinthe α-tocopherol transfer protein (α-TTP) for distribution in circulation and thus in peripheral tissues (Galli et al., 2017). This preferential binding appears to protect this form excretion and catabolism as it occurs for the other forms. In this respect, the different forms are discriminated by the liver so that only α-T is retained and distributed to the cellular membranes of tissues, whereas the other forms are rapidly metabolized and excreted with the same mechanism of long-chain fatty acids and lipophilic xenobiotics (Ambrogini et al., 2016). �-tocopherol protects fatty highly unsaturated against peroxidation by free radicals produced by NADPH oxidase enzymes (Benzie, 1996). By using enzymatic antioxidant mechanisms body protects itself from ROS (reactive oxygen species). The antioxidant enzymes reduce the levels of lipid hydroperoxide and H2O2, thus they are important in the prevention of lipid peroxidation and maintaining the structure and function of cell membranes (Nimse, 2015). Important to note is that the addition of �-tocopherol post-mortem meat is not as effec-tive as when it is used as a nutritional sup-plement, since the added post-mortem �-tocopherol cannot be incorporated directly into at the membrane level where the oxidation process is carried out (Schaefer et al., 1995). However �-tocopherol preserves the integrity of muscle cell membranes, inhibiting the passage of sarcoplasmic fluid through it, as well as acting as a radical-quenching antioxi-dant, consequently preventing drip loss and the oxidation of membrane phospholipids during storage when added into the diet (Asghar et al., 1991b; Gray et al., 1996; Faustman et al., 1998; Nassu et al., 2011). The antioxidant effects of vitamin E on pork meat quality The alteration of the meat may be a consequence of lipid and pigment oxidation in the meat (Alvares et al., 2008). Oxidation in biological tissues should be avoided because some negative biological effects have been attributed to lipid oxidation products (Guardiola et al., 2002; Niki et al., 2005; Spiteller, 2006; Tres et al., 2009). In meat and food products, oxidation might lead to a
116
reduction of the sensory and nutritional quality (Gray et al., 1996). Nevertheless this depends on multiple factors, the most noteworthy being the systems of conservation used and the level of antioxidants present. The increase in �-tocopherol concentration in meat can be achieved through vitamin E supplementation in the animals’ diet at higher levels than the nutritional requirements (Alvares et al., 2008). In order for fattening pigs to reach an optimum development under common environmental conditions, it is recommended to supplement their diet with vitamin E amounts of 15-40 mg �-tocopheryl acetate/kg fodder (Albers et al., 1984). However it has been observed that nutritional supplementation with �-tocopheryl beyond nutritional limits is an effective method to improve the quality and stability of pork meat during storage. The tocopherol accumulated in the muscles is not being degraded during the technological process thus it is exercising the effect during processing also during the storage of meat and meat products (King et al., 1995; Miller et al., 1994). Thiobarbituric acid reactive substances (TBARS) are often used as markers for the detection of odors in meat and therefore they are used in this study as markers for the detection of oxidative degradation process. The detection limit of rancid odor in refrigerated pork meat was determined by panelists is 0.50 mg (TBARS) expressed in terms of malonic aldehyde (MA)/kg (Tarladgis et al., 1960). During administration a quantity of � tocopheryl acetate, 0-10 mg/kg feed, the critical limit of 0.50 mg TBARS expressed as MA/kg was reached after 6 days of storage under refrigeration (0.50 to 2.96 mg) (Asghar et al., 1991b; Monahan et al., 1993). In this sense, the results obtained in a study conducted by Ventanas, Tejeda and Estevez (2017) regarding the induced lipid oxidation in the muscle biceps femoris at different times of incubation for MA content founded that the presence of high levels of �-tocopherol in Iberian pigs muscles contributed to the lower amount of MA in muscle homogenates. The protective effect of α-tocopherol supplementation against iron-induced lipid peroxidation has been previously described in
Iberian pigs (Cava et al., 2000; Daza et al., 2005). Sensory analysis of the meat had been reported in a few experiments, but recently it has been shown that �-tocopherol may be used in the characterization of sensory pork chops and preparations of pork chilled (freshness, softness and juicy) (Dirinck et al., 1996). Exposure to light of meat samples accelerates lipid oxidation. This negative effect produced by light can be eliminated by administering vitamin E in pig feed, as nutritional supplement. Vitamin E (DL-α-tocopherol) which is primarily active as an antioxidant has been reported to protect PUFA from free radical attack in vivo and post-mortem in animal tissues (Morrissey et al., 1994; Gabryszuk et al., 2007; Mapiye et al., 2012). It was noted that 6 days of refrigeration in the absence of light, pork chops from animals which have not been administered the vitamin E supplement TBARS reached the level of 0.42 mg equivalent MA/kg while the addition of vitamin E (�-tocopheryl ethyl 200 mg/kg feed) TBARS reached the value of 0.21 mg which represents a 50% reduction in the amount of TBARS of the first group (Buckley et al., 1995). Various studies provide the evidence regarding the fact that dietary vitamin E supplementation decreases lipid oxidation in pork (Buckley et al., 1995; Lahucky et al., 2000; Pettigrew and Esnaola, 2001; Rosenvold and Andersen, 2003; Dunshea et al., 2005; Lahucky et al., 2005; Dikeman, 2007; Trefan et al., 2011). CONCLUSIONS The supplementation of animal feeds with vitamin E induces an increase in the content of vitamin E in the muscles in post-mortem phase. The amount of vitamin E is dependent on the type of muscle, the quantity of supplement administered (dose), and by the duration of administration. An elevated level of endogenous vitamin E ensures optimum quality for pork meat and meat products. One of the major advantages is that vitamin E reduces the rate of oxidative degradation process measured as TBARS values, thus improving the quality
and stability of meat and meat products during storage. The protective effect that vitamin E exerts over oxidation in refrigerated meat and meat products is very pronounced. Different factors during processing have an impact on shelf-life, quality characteristics and organoleptic of final product (Lengkey et al., 2016). The process of lipid peroxidation does not affect fresh meat as it is distributed and consumed in a short period of time. However a longer period of storage or refrigeration failure as far as optimum temperature for storage is concerned can accelerate the oxidation process. An important role in maintaining the quality of meat products it is the vitamin E in animal nutrition. The protective effect of vitamin E appears to successfully complete other preservation methods.
REFERENCES Alvarez I., De la Fuente J., Dıaz M.T., Lauzurica S.,
Perez C. and Caneque V., 2008. Estimation of α-tocopherol concentration necessary to optimize lamb meat quality stability during storage in high-oxygen modified atmosphere using broken-line regression analysis. Animal 2:9, p. 1405-1411.
Amazan D., Cordero G., López-Bote C.J., Lauridsen C. & Rey A.I., 2014. Effects of oral micellized natural vitamin E (D-α-tocopherol) v. synthetic vitamin E (DL-α-tocopherol) in feed on α-tocopherol levels, stereoisomer distribution, oxidative stress and the immune response in piglets. Animal 8(03), p. 410-419.
Ambrogini P., Betti M., Galati C., Palma M., Lattanzi D., Savelli D., Galli F., Cuppini R. and Minelli A., 2016. α-Tocopherol and Hippocampal Neural Plasticity in Physiological and Pathological Conditions. International Journal of Molecular Sciences 17, p. 1-32.
Asghar A., Fin C.F., Gray J.I., Miller E.R., Ku P.K., Booren A.M. and Buckley D.J., 1991a. Influence of supranutritional vitamin E supplementation in the feed on swine growth performance and deposition in different tissues. Journal of the Science of Food and Agriculture 57, p. 19-29.
Asghar A., Gray J.I., Booren A.M., Gomaa E.A., Abouzied M.M., Miller E.R. and Buckley D.J., 1991b. Influence of supranutritional dietary vitamin E levels on subcellular deposition of alpha-tocopherol in the muscle and on pork quality. Journal of the Science of Food and Agriculture 57, p. 31-41.
Benzie I.F.F., 1996. Lipid peroxidation: a review of causes, consequences, measurement and dietary influences. International Journal of Food Science and Nutrition 47, p. 233-261.
Bhat Z.F. and Bhat H., 2011. Functional Meat Products: A Review. International Journal of Meat Science1, p. 1-14.
Brigelius-Flohé R., 2006. Bioactivity of vitamin E. Nutrition Research Reviews 19(2), p. 174-86.
Brigelius-Flohé R., 2006. Bioactivity of vitamin E. Nutrition Research Reviews 19(2), p. 174-86.
Buckley D.J., Morissey P.A., Grey J.I., 1995. Influence of dietary vitamin E on oxidative stability and quality of pig meat. Journal of Animal Science 73, p. 3122-30.
Cava R., Ventanas J., Tejeda J.F., Ruiz J. and Antequera T., 2000. Effect of free-range rearing and a-tocopherol and copper supplementation on fatty acid profiles and susceptibility to lipid oxidation of fresh meat from Iberian pigs. Food Chemistry 68, p. 51-59.
Ching S., Mahan D.C., Wiseman T.G. and Fastinger N.D., 2002. Evaluating the antioxidant status of weanling pigs fed dietary vitamins A and E. Journal of Animal Science 80, p. 2396-2401.
Chow C.K., 1991. Vitamin E and oxidative stress. Free Radical Biology and Medicine 11, p. 215-232.
Daza A., Rey A.I., Ruiz J. and Lopez-Bote C.J., 2005. Effects of feeding in free-range conditions or in confinement with different dietary MUFA/PUFA ratios and a-tocopheryl acetate, on antioxidants accumulation and oxidative stability in Iberian pigs. Meat Science 69, p. 151-163.
Dikeman M.E., 2007. Effects of metabolic modifiers on carcass traits and meat quality. Meat Science 77, p. 121-35.
Dunshea F.R., D’Souza D.N., Pethick D.W., Harper G.S., Warner R.D., 2005. Effects of dietary factors and other metabolic modifiers on quality and nutritional value of meat. Meat Science 71, 38.
Faustman C., Chan W.K.M., Schaefer D.M. and Havens A., 1998. Beef color update: the role for vitamin E. Journal of Animal Science 76, p. 1019-1026.
Fiego D.P., Lo Santoro P., Macchioni P., Mazzoni D., Piattoni F., Tassone F., De Leonibus E., 2004. The effect of dietary supplementation of vitamins C and E on the a-tocopherol content of muscles, liver and kidney, on the stability of lipids, and on certain meat quality parameters of the Longissimus dorsi of rabbits. Meat Science 67, p. 319-327.
Gabryszuk M., Czauderna M., Baranowski A., Strzakowska N., Jozwik A. and Krzyzewski J., 2007. The effect of diet supplementation with Se, Zn and vitamin E on cholesterol, CLA and fatty acid contents of meat and liver of lambs. Animal Science Papers and Reports 25, p. 25-33.
Galli F., Azzi A., Birringer M., Cook-Mills J.M., Eggersdorfer M., Frank J., Cruciani G., Lorkowski S., Kartal Özer N., 2017. Vitamin E: Emerging aspects and new directions. Free Radical Biology and Medicine 102, p. 16-36.
Ghidurus M., Varga M., 2017. Natural antioxidants used in frying oils to minimize the accumulation of toxic compounds. AgroLife Scientific Journal, Vol. 6, Number 1, ISSN 2285-5718, p. 119-124.

117
reduction of the sensory and nutritional quality (Gray et al., 1996). Nevertheless this depends on multiple factors, the most noteworthy being the systems of conservation used and the level of antioxidants present. The increase in �-tocopherol concentration in meat can be achieved through vitamin E supplementation in the animals’ diet at higher levels than the nutritional requirements (Alvares et al., 2008). In order for fattening pigs to reach an optimum development under common environmental conditions, it is recommended to supplement their diet with vitamin E amounts of 15-40 mg �-tocopheryl acetate/kg fodder (Albers et al., 1984). However it has been observed that nutritional supplementation with �-tocopheryl beyond nutritional limits is an effective method to improve the quality and stability of pork meat during storage. The tocopherol accumulated in the muscles is not being degraded during the technological process thus it is exercising the effect during processing also during the storage of meat and meat products (King et al., 1995; Miller et al., 1994). Thiobarbituric acid reactive substances (TBARS) are often used as markers for the detection of odors in meat and therefore they are used in this study as markers for the detection of oxidative degradation process. The detection limit of rancid odor in refrigerated pork meat was determined by panelists is 0.50 mg (TBARS) expressed in terms of malonic aldehyde (MA)/kg (Tarladgis et al., 1960). During administration a quantity of � tocopheryl acetate, 0-10 mg/kg feed, the critical limit of 0.50 mg TBARS expressed as MA/kg was reached after 6 days of storage under refrigeration (0.50 to 2.96 mg) (Asghar et al., 1991b; Monahan et al., 1993). In this sense, the results obtained in a study conducted by Ventanas, Tejeda and Estevez (2017) regarding the induced lipid oxidation in the muscle biceps femoris at different times of incubation for MA content founded that the presence of high levels of �-tocopherol in Iberian pigs muscles contributed to the lower amount of MA in muscle homogenates. The protective effect of α-tocopherol supplementation against iron-induced lipid peroxidation has been previously described in
Iberian pigs (Cava et al., 2000; Daza et al., 2005). Sensory analysis of the meat had been reported in a few experiments, but recently it has been shown that �-tocopherol may be used in the characterization of sensory pork chops and preparations of pork chilled (freshness, softness and juicy) (Dirinck et al., 1996). Exposure to light of meat samples accelerates lipid oxidation. This negative effect produced by light can be eliminated by administering vitamin E in pig feed, as nutritional supplement. Vitamin E (DL-α-tocopherol) which is primarily active as an antioxidant has been reported to protect PUFA from free radical attack in vivo and post-mortem in animal tissues (Morrissey et al., 1994; Gabryszuk et al., 2007; Mapiye et al., 2012). It was noted that 6 days of refrigeration in the absence of light, pork chops from animals which have not been administered the vitamin E supplement TBARS reached the level of 0.42 mg equivalent MA/kg while the addition of vitamin E (�-tocopheryl ethyl 200 mg/kg feed) TBARS reached the value of 0.21 mg which represents a 50% reduction in the amount of TBARS of the first group (Buckley et al., 1995). Various studies provide the evidence regarding the fact that dietary vitamin E supplementation decreases lipid oxidation in pork (Buckley et al., 1995; Lahucky et al., 2000; Pettigrew and Esnaola, 2001; Rosenvold and Andersen, 2003; Dunshea et al., 2005; Lahucky et al., 2005; Dikeman, 2007; Trefan et al., 2011). CONCLUSIONS The supplementation of animal feeds with vitamin E induces an increase in the content of vitamin E in the muscles in post-mortem phase. The amount of vitamin E is dependent on the type of muscle, the quantity of supplement administered (dose), and by the duration of administration. An elevated level of endogenous vitamin E ensures optimum quality for pork meat and meat products. One of the major advantages is that vitamin E reduces the rate of oxidative degradation process measured as TBARS values, thus improving the quality
and stability of meat and meat products during storage. The protective effect that vitamin E exerts over oxidation in refrigerated meat and meat products is very pronounced. Different factors during processing have an impact on shelf-life, quality characteristics and organoleptic of final product (Lengkey et al., 2016). The process of lipid peroxidation does not affect fresh meat as it is distributed and consumed in a short period of time. However a longer period of storage or refrigeration failure as far as optimum temperature for storage is concerned can accelerate the oxidation process. An important role in maintaining the quality of meat products it is the vitamin E in animal nutrition. The protective effect of vitamin E appears to successfully complete other preservation methods.
REFERENCES Alvarez I., De la Fuente J., Dıaz M.T., Lauzurica S.,
Perez C. and Caneque V., 2008. Estimation of α-tocopherol concentration necessary to optimize lamb meat quality stability during storage in high-oxygen modified atmosphere using broken-line regression analysis. Animal 2:9, p. 1405-1411.
Amazan D., Cordero G., López-Bote C.J., Lauridsen C. & Rey A.I., 2014. Effects of oral micellized natural vitamin E (D-α-tocopherol) v. synthetic vitamin E (DL-α-tocopherol) in feed on α-tocopherol levels, stereoisomer distribution, oxidative stress and the immune response in piglets. Animal 8(03), p. 410-419.
Ambrogini P., Betti M., Galati C., Palma M., Lattanzi D., Savelli D., Galli F., Cuppini R. and Minelli A., 2016. α-Tocopherol and Hippocampal Neural Plasticity in Physiological and Pathological Conditions. International Journal of Molecular Sciences 17, p. 1-32.
Asghar A., Fin C.F., Gray J.I., Miller E.R., Ku P.K., Booren A.M. and Buckley D.J., 1991a. Influence of supranutritional vitamin E supplementation in the feed on swine growth performance and deposition in different tissues. Journal of the Science of Food and Agriculture 57, p. 19-29.
Asghar A., Gray J.I., Booren A.M., Gomaa E.A., Abouzied M.M., Miller E.R. and Buckley D.J., 1991b. Influence of supranutritional dietary vitamin E levels on subcellular deposition of alpha-tocopherol in the muscle and on pork quality. Journal of the Science of Food and Agriculture 57, p. 31-41.
Benzie I.F.F., 1996. Lipid peroxidation: a review of causes, consequences, measurement and dietary influences. International Journal of Food Science and Nutrition 47, p. 233-261.
Bhat Z.F. and Bhat H., 2011. Functional Meat Products: A Review. International Journal of Meat Science1, p. 1-14.
Brigelius-Flohé R., 2006. Bioactivity of vitamin E. Nutrition Research Reviews 19(2), p. 174-86.
Brigelius-Flohé R., 2006. Bioactivity of vitamin E. Nutrition Research Reviews 19(2), p. 174-86.
Buckley D.J., Morissey P.A., Grey J.I., 1995. Influence of dietary vitamin E on oxidative stability and quality of pig meat. Journal of Animal Science 73, p. 3122-30.
Cava R., Ventanas J., Tejeda J.F., Ruiz J. and Antequera T., 2000. Effect of free-range rearing and a-tocopherol and copper supplementation on fatty acid profiles and susceptibility to lipid oxidation of fresh meat from Iberian pigs. Food Chemistry 68, p. 51-59.
Ching S., Mahan D.C., Wiseman T.G. and Fastinger N.D., 2002. Evaluating the antioxidant status of weanling pigs fed dietary vitamins A and E. Journal of Animal Science 80, p. 2396-2401.
Chow C.K., 1991. Vitamin E and oxidative stress. Free Radical Biology and Medicine 11, p. 215-232.
Daza A., Rey A.I., Ruiz J. and Lopez-Bote C.J., 2005. Effects of feeding in free-range conditions or in confinement with different dietary MUFA/PUFA ratios and a-tocopheryl acetate, on antioxidants accumulation and oxidative stability in Iberian pigs. Meat Science 69, p. 151-163.
Dikeman M.E., 2007. Effects of metabolic modifiers on carcass traits and meat quality. Meat Science 77, p. 121-35.
Dunshea F.R., D’Souza D.N., Pethick D.W., Harper G.S., Warner R.D., 2005. Effects of dietary factors and other metabolic modifiers on quality and nutritional value of meat. Meat Science 71, 38.
Faustman C., Chan W.K.M., Schaefer D.M. and Havens A., 1998. Beef color update: the role for vitamin E. Journal of Animal Science 76, p. 1019-1026.
Fiego D.P., Lo Santoro P., Macchioni P., Mazzoni D., Piattoni F., Tassone F., De Leonibus E., 2004. The effect of dietary supplementation of vitamins C and E on the a-tocopherol content of muscles, liver and kidney, on the stability of lipids, and on certain meat quality parameters of the Longissimus dorsi of rabbits. Meat Science 67, p. 319-327.
Gabryszuk M., Czauderna M., Baranowski A., Strzakowska N., Jozwik A. and Krzyzewski J., 2007. The effect of diet supplementation with Se, Zn and vitamin E on cholesterol, CLA and fatty acid contents of meat and liver of lambs. Animal Science Papers and Reports 25, p. 25-33.
Galli F., Azzi A., Birringer M., Cook-Mills J.M., Eggersdorfer M., Frank J., Cruciani G., Lorkowski S., Kartal Özer N., 2017. Vitamin E: Emerging aspects and new directions. Free Radical Biology and Medicine 102, p. 16-36.
Ghidurus M., Varga M., 2017. Natural antioxidants used in frying oils to minimize the accumulation of toxic compounds. AgroLife Scientific Journal, Vol. 6, Number 1, ISSN 2285-5718, p. 119-124.

118
Gray J.I., Gomaa E.A. and Buckley D.J., 1996. Oxidative quality and shelf life of meats. Meat Science 43, p. 111-123.
Guardiola F., Dutta P.C., Codony R. and Savage G.P., 2002. Cholesterol and phytosterol oxidation products: analysis, occurrence, and biological effects. AOCS Press, Champaign, IL.
Hedemann M.S., Clausen T.N. and Jensen S.K., 2011. Changes in digestive enzyme activity, intestine morphology, mucin characteristics and tocopherol status in mink kits (Mustela neovision) during the weaning period. Animal 5:3, p. 394-402.
Herrera E., Barbas C., 2001. Vitamin E: action, metabolism and perspectives. Journal of Physiology and Biochemistry 57(1), p. 43-56.
Heyer A., Andersson H.K., Rydhmer Land Lundström K., 2004. Carcass quality and technological and sensory meat quality of once bred gilts in a season al outdoor rearing system. Acta Agriculturae Scandinavica Section A, 54, p. 103-111.
Jensen M., Hakkarainen J., Lindholm A. and Jonsson L., 1988. Vitamin E requirement of growing swine. Journal of Animal Science 66, p. 3101-3111.
Lahucky R., Krska P., Küchenmeister U., Nürnberg K., Bahelka I., Demo P., Ender K., 2000. Effect of vitamin E on changes in phosphorus compounds assessed by 31P NMR spectroscopy and ATPase from post mortem muscle samples and meat quality of pigs. Archives Animal Breeding43, p. 487-97.
Lahucky R., Kuechenmeister U., Bahelka I., Novotna K., Vasickova K., Ender K., 2005. Effects of vitamin E by dietary supplementation and of calcium ascorbate by post mortem injection in muscle on the ant oxidative status and meat quality of pigs. Archives Animal Breeding 48, p. 592-600.
Lengkey H.A.W., Garnida D., Siwi J.A., Edianingsih P., Wulandari E., Pratama A., 2016. The effect of carrageenan on shelf-life, quality improvement and organoleptic qualities of spent chicken sausages. Agrolife Scientific Journal, Vol. 5, Number 1, ISSN 2285-5718, p. 115-120.
Lodge J.K., 2005.Vitamin E bioavailability in humans. Journal of Plant Physiology, 162(7), p. 790-796.
Lundström K., Matthews K.R., Haugen J.E., 2009. Pig meat quality from entire males. Animal 3(11), p. 1497-1507.
Mapiye C., Dugan M.E.R., Juarez M., Basarab J.A., Baron V.S., Turner T., Yang X., Aldai N. and Aalhus J.L., 2012. Influence of a-tocopherol supplementation on trans-18:1 and conjugated linoleic acid profiles in beef from steers fed a barley-based diet. Animal 6:11, p. 1888-1896.
Marin M., Drăgotoiu D., Nicolae C.G., Diniţă G., 2015. Research on the influence of the oregano oil use over the productive performances and quality of duck meat. AgroLife Scientific Journal, Vol. 4, Number 2, ISSN 2285-5718, p. 48-51.
Miller J.K. and Brzezinska-Slebodzinska E., 1993. Oxidative stress, antioxidants and animal function. Journal of Dairy Science 76, p. 2812-2823.
Monahan F.J., Asghar A., Gray J.I., and Buckley D.J., 1994. Effect of oxidized Dietary Lipid and Vitamin E
on the Colour Stability of Pork Chops. Meat Science 37, p. 205-215.
Morrissey P.A., Quinn P.B. and Sheehy P.J.A., 1994. Newer aspects of micronutrients in chronic disease: vitamin E. Proceedings of the Nutrition Society 53, p. 571-582.
Nakamura Y.K. and Omaye S.T., 2009. Vitamin E-modulated gene expression associated with ROS generation. Journal of Functional Foods 1, p. 241-252.
Nassu R.T., Dugan M.E., Juarez M., Basarab J.A., Baron V.S. and Aalhus J.L., 2011. Effect of a-tocopherol tissue levels on beef quality. Animal 5:12, p. 2010-2018.
Niculita P., Popa M., Ghidurus M., Turtoi M., 2007. The effect of vitamin E in swine diet on animal growth performance and meat quality parameters. Journal of Food and Nutrition Sciences, Poland, 16/57 No. 1, p. 125-130.
Niki E., Yoshida Y., Saito Y. and Noguchi N., 2005. Lipid peroxidation: mechanisms, inhibition, and biological effects. Biochemical and Biophysical Research Communications 338, p. 668-676.
Nimse S.B. and Palb D., 2015. Free radicals, natural antioxidants, and their reaction mechanisms. RSC Advances5, p. 27986-28006.
Niva M., 2007. All foods affect health: Understandings of functional foods and healthy eating among health-oriented Finns. Appetite 48, p. 384-393.
National Research Council, 1998. Nutrient requirement of swine, 10th edition. NRC, National Academy Press, Washington, DC, USA.
Olivares A., Rey A.I., Daza A. and Lopez-Bote C.J., 2009. High dietary vitamin A interferes with tissue a-tocopherol concentrations in fattening pigs: a study that examines administration and withdrawal times. Animal, 3:9, p. 1264-1270.
Onibi G.E., Scaife J.R., Murray I. and Fowler V.R., 2000. Supplementary α-tocopherol acetate in full-fat rapeseed-based diets for pigs: Influence on tissue α-tocopherol content, fatty acid profiles and lipid oxidation. Journal of Science of Food and Agriculture 80, p. 1625-1632.
Pettigrew J.E., Esnaola M.A., 2001. Swine nutrition and pork quality: A review. Journal of Animal Sciences 79, p. 316-342.
Pinelli-Saavedra A., 2003. Vitamin E in immunity and reproductive performance in pigs. Reproduction Nutrition Development, EDP Sciences 43(5), p. 397-408.
Rosenvold K., Andersen H.J., 2003. Factors of significance for pork quality-a review. Meat Science 64, p. 219-237.
Saikhun K., Faisaikarm T., Ming Z., Lu K.H. and Kitiyanant Y., 2008. a-Tocopherol and L-ascorbic acid increase the in vitro development of IVM/IVF swamp buffalo (Bubalus bubalis) embryos. Animal, 2:10, p. 1486-1490.
Salami S.A., Guinguina A., Agboola J.O., Omede A.A., Agbonlahor E.M. and Tayyab U., 2016. In vivo and post-mortem effects of feed antioxidants in livestock: a review of the implications on authorization of
antioxidant feed additives. Animal 10:8, p. 1375-1390.
Schaefer D.M., Liu Q., Faustman Cand Yin M.C., 1995. Supranutritional Administration of Vitamin E and C Improves Oxidative Stability of Beef. Journal of Nutritrion 125, p. 1792-1798.
Spiteller G., 2006. Peroxyl radicals: inductors of neurodegenerative and other inflammatory diseases. Their origin and how they transform cholesterol, phospholipids, plasmalogens, polyunsaturated fatty acids, sugars, and proteins into deleterious products. Free Radical Biology and Medicine 41, p. 362-387.
Trefan L., Bünger L., Blom-Hansen J., Rooke J.A., Salmi B.C., Larzul C., Terlouw and Doeschl-Wilson A., 2011. Meta-analysis of the effects of dietary vitamin E supplementation on α-tocopherol concentration and lipid oxidation in pork. Meat Science 87, p. 305-314.
Tres A., Bou R., Codony R. and Guardiola F., 2009. Dietary n-6- or n-3-rich vegetable fats and α-tocopheryl acetate: effects on fatty acid composition and stability of rabbit plasma, liver and meat. Animal 3:10, p. 1408-1419.
Ventanas S., Tejeda J.F. and Estevez M., 2008. Chemical composition and oxidative status of tissues from Iberian pigs as affected by diets: extensive feeding v. oleic acid- and tocopherol-enriched mixed diets. Animal 2:4, p. 621-630.
Wang X., Quinn P.J., 1999. Vitamin E and its function in membranes. Progress in Lipid Research 38:4, p. 309-36.
Yang A., Brewster M.J., Lanari M.C., Tume R.K., 2002. Effect of vitamin E supplementation on α-tocopherol and β-carotene concentrations in tissues from pasture- and grain-fed cattle. Meat Science 60, p. 35-40.
119
Gray J.I., Gomaa E.A. and Buckley D.J., 1996. Oxidative quality and shelf life of meats. Meat Science 43, p. 111-123.
Guardiola F., Dutta P.C., Codony R. and Savage G.P., 2002. Cholesterol and phytosterol oxidation products: analysis, occurrence, and biological effects. AOCS Press, Champaign, IL.
Hedemann M.S., Clausen T.N. and Jensen S.K., 2011. Changes in digestive enzyme activity, intestine morphology, mucin characteristics and tocopherol status in mink kits (Mustela neovision) during the weaning period. Animal 5:3, p. 394-402.
Herrera E., Barbas C., 2001. Vitamin E: action, metabolism and perspectives. Journal of Physiology and Biochemistry 57(1), p. 43-56.
Heyer A., Andersson H.K., Rydhmer Land Lundström K., 2004. Carcass quality and technological and sensory meat quality of once bred gilts in a season al outdoor rearing system. Acta Agriculturae Scandinavica Section A, 54, p. 103-111.
Jensen M., Hakkarainen J., Lindholm A. and Jonsson L., 1988. Vitamin E requirement of growing swine. Journal of Animal Science 66, p. 3101-3111.
Lahucky R., Krska P., Küchenmeister U., Nürnberg K., Bahelka I., Demo P., Ender K., 2000. Effect of vitamin E on changes in phosphorus compounds assessed by 31P NMR spectroscopy and ATPase from post mortem muscle samples and meat quality of pigs. Archives Animal Breeding43, p. 487-97.
Lahucky R., Kuechenmeister U., Bahelka I., Novotna K., Vasickova K., Ender K., 2005. Effects of vitamin E by dietary supplementation and of calcium ascorbate by post mortem injection in muscle on the ant oxidative status and meat quality of pigs. Archives Animal Breeding 48, p. 592-600.
Lengkey H.A.W., Garnida D., Siwi J.A., Edianingsih P., Wulandari E., Pratama A., 2016. The effect of carrageenan on shelf-life, quality improvement and organoleptic qualities of spent chicken sausages. Agrolife Scientific Journal, Vol. 5, Number 1, ISSN 2285-5718, p. 115-120.
Lodge J.K., 2005.Vitamin E bioavailability in humans. Journal of Plant Physiology, 162(7), p. 790-796.
Lundström K., Matthews K.R., Haugen J.E., 2009. Pig meat quality from entire males. Animal 3(11), p. 1497-1507.
Mapiye C., Dugan M.E.R., Juarez M., Basarab J.A., Baron V.S., Turner T., Yang X., Aldai N. and Aalhus J.L., 2012. Influence of a-tocopherol supplementation on trans-18:1 and conjugated linoleic acid profiles in beef from steers fed a barley-based diet. Animal 6:11, p. 1888-1896.
Marin M., Drăgotoiu D., Nicolae C.G., Diniţă G., 2015. Research on the influence of the oregano oil use over the productive performances and quality of duck meat. AgroLife Scientific Journal, Vol. 4, Number 2, ISSN 2285-5718, p. 48-51.
Miller J.K. and Brzezinska-Slebodzinska E., 1993. Oxidative stress, antioxidants and animal function. Journal of Dairy Science 76, p. 2812-2823.
Monahan F.J., Asghar A., Gray J.I., and Buckley D.J., 1994. Effect of oxidized Dietary Lipid and Vitamin E
on the Colour Stability of Pork Chops. Meat Science 37, p. 205-215.
Morrissey P.A., Quinn P.B. and Sheehy P.J.A., 1994. Newer aspects of micronutrients in chronic disease: vitamin E. Proceedings of the Nutrition Society 53, p. 571-582.
Nakamura Y.K. and Omaye S.T., 2009. Vitamin E-modulated gene expression associated with ROS generation. Journal of Functional Foods 1, p. 241-252.
Nassu R.T., Dugan M.E., Juarez M., Basarab J.A., Baron V.S. and Aalhus J.L., 2011. Effect of a-tocopherol tissue levels on beef quality. Animal 5:12, p. 2010-2018.
Niculita P., Popa M., Ghidurus M., Turtoi M., 2007. The effect of vitamin E in swine diet on animal growth performance and meat quality parameters. Journal of Food and Nutrition Sciences, Poland, 16/57 No. 1, p. 125-130.
Niki E., Yoshida Y., Saito Y. and Noguchi N., 2005. Lipid peroxidation: mechanisms, inhibition, and biological effects. Biochemical and Biophysical Research Communications 338, p. 668-676.
Nimse S.B. and Palb D., 2015. Free radicals, natural antioxidants, and their reaction mechanisms. RSC Advances5, p. 27986-28006.
Niva M., 2007. All foods affect health: Understandings of functional foods and healthy eating among health-oriented Finns. Appetite 48, p. 384-393.
National Research Council, 1998. Nutrient requirement of swine, 10th edition. NRC, National Academy Press, Washington, DC, USA.
Olivares A., Rey A.I., Daza A. and Lopez-Bote C.J., 2009. High dietary vitamin A interferes with tissue a-tocopherol concentrations in fattening pigs: a study that examines administration and withdrawal times. Animal, 3:9, p. 1264-1270.
Onibi G.E., Scaife J.R., Murray I. and Fowler V.R., 2000. Supplementary α-tocopherol acetate in full-fat rapeseed-based diets for pigs: Influence on tissue α-tocopherol content, fatty acid profiles and lipid oxidation. Journal of Science of Food and Agriculture 80, p. 1625-1632.
Pettigrew J.E., Esnaola M.A., 2001. Swine nutrition and pork quality: A review. Journal of Animal Sciences 79, p. 316-342.
Pinelli-Saavedra A., 2003. Vitamin E in immunity and reproductive performance in pigs. Reproduction Nutrition Development, EDP Sciences 43(5), p. 397-408.
Rosenvold K., Andersen H.J., 2003. Factors of significance for pork quality-a review. Meat Science 64, p. 219-237.
Saikhun K., Faisaikarm T., Ming Z., Lu K.H. and Kitiyanant Y., 2008. a-Tocopherol and L-ascorbic acid increase the in vitro development of IVM/IVF swamp buffalo (Bubalus bubalis) embryos. Animal, 2:10, p. 1486-1490.
Salami S.A., Guinguina A., Agboola J.O., Omede A.A., Agbonlahor E.M. and Tayyab U., 2016. In vivo and post-mortem effects of feed antioxidants in livestock: a review of the implications on authorization of
antioxidant feed additives. Animal 10:8, p. 1375-1390.
Schaefer D.M., Liu Q., Faustman Cand Yin M.C., 1995. Supranutritional Administration of Vitamin E and C Improves Oxidative Stability of Beef. Journal of Nutritrion 125, p. 1792-1798.
Spiteller G., 2006. Peroxyl radicals: inductors of neurodegenerative and other inflammatory diseases. Their origin and how they transform cholesterol, phospholipids, plasmalogens, polyunsaturated fatty acids, sugars, and proteins into deleterious products. Free Radical Biology and Medicine 41, p. 362-387.
Trefan L., Bünger L., Blom-Hansen J., Rooke J.A., Salmi B.C., Larzul C., Terlouw and Doeschl-Wilson A., 2011. Meta-analysis of the effects of dietary vitamin E supplementation on α-tocopherol concentration and lipid oxidation in pork. Meat Science 87, p. 305-314.
Tres A., Bou R., Codony R. and Guardiola F., 2009. Dietary n-6- or n-3-rich vegetable fats and α-tocopheryl acetate: effects on fatty acid composition and stability of rabbit plasma, liver and meat. Animal 3:10, p. 1408-1419.
Ventanas S., Tejeda J.F. and Estevez M., 2008. Chemical composition and oxidative status of tissues from Iberian pigs as affected by diets: extensive feeding v. oleic acid- and tocopherol-enriched mixed diets. Animal 2:4, p. 621-630.
Wang X., Quinn P.J., 1999. Vitamin E and its function in membranes. Progress in Lipid Research 38:4, p. 309-36.
Yang A., Brewster M.J., Lanari M.C., Tume R.K., 2002. Effect of vitamin E supplementation on α-tocopherol and β-carotene concentrations in tissues from pasture- and grain-fed cattle. Meat Science 60, p. 35-40.
120
RESEARCH REGARDING THE INFLUENCE OF TUBER SIZE AND PROTECTION SYSTEMS ON THE EARLY POTATO PRODUCTION
Gheorghița HOZA1, Maria DINU2, Alexandra Dida BECHERESCU3, Mariana NEAGU1
1University of Agronomic Sciences and Veterinary Medicine of Bucharest, 59 Marasti Blvd.,
District 1, Bucharest, Romania 2University of Craiova, 13 Alexandru Ioan Cuza Street, Craiova, Romania
3Banat’s University of Agricultural Sciences and Veterinary Medicine “King Michael I of Romania” Timişoara, Aradului Street 119, Timişoara, Romania
Corresponding author email: [email protected]
Abstract Research was made in Lunguletu, Dâmbovita County, an area in Romania with tradition in early potato culture. The biological material used was the Carrera variety, with tubers of two size categories (35-45 mm and 45-55 mm) and tuber fractions with 2-3 buds, cultivated in three culture systems (unprotected, protected with agril on the soil and protected with a tunnel made of agril), both sprouted and unsprouted. The results showed that the 35-45 mm tubers formed shorter stems compared to the 45-55 mm tubers and fractions, the plants’ growth being influenced also by the protection system. Thus, at the beginning, the plants protected by the agril tunnel recorded heights between 12.7 cm and 24.9cm, followed by the ones protected with agril on the soil, between 7.1 cm and 22 cm, while for the unprotected ones the height of the stems had values between 4 cm and 10.6 cm. The number of tubers per nest was larger for the 45-55 mm tubers for all culture variants, having values between 12 and 14.6. The tuber production was influenced by the tuber preparation method and the culture system, the best results being obtained for the sprouted tubers for all studied variants, with values between 3919 g for the unsprouted tubers protected with agril on the soil and 8848 g for the sprouted tuber fractions protected with the agril tunnel. Key words: early production, potatoes, protection system. INTRODUCTION The potato, considered Romania’s second bread, native to South America, is one of the most cultivated species in various areas around the globe thanks to its high ecological plasticity, having an essential role in feeding the planet’s inhabitants. The level of potato production is influenced by the use of high quality biological material (health condition, integrity and biological value, (Galfi et al., 2002), applying culture systems that improve the obtained results and the use of varieties with high productive potential and genetic resistance to disease and pests, by the climate conditions of the area where the culture is located (Masarirambi et al., 2012) and the used technology (Fabeiro et al., 2001; Ierna and Parisi, 2014; Marin et al., 2014). The research made by Diaconu, 1999 for some varieties, quoted by Donescu, 2002, shows that there is tight connection between the variety, number of eyes, number of sprouts, number of stems
and tuber production. Moreover, the tuber size influences the spring of the plants; the bigger tubers have a higher spring percentage and form a larger number of main stems and more tubers in the nest (Bărdaș, 2001). Although many studies have been conducted on this species the relationships between potato cultivars and the dimension of the tubers still have significant information to offer. Some important studies were made a few decades ago (Bremner and Taha, 1966) while others are barely recent (Khan et al., 2010), constantly offering new data due to the versatility of this species. Early potato culture in lower covered shelters using sprouted tubers resulted in the highest production compared to other culture systems and proved economically efficient (Topan et al., 2006). The physiological condition of the tuber highly influences the spring process and its intensity, the uniformity of the spring, plant growth and tuber formation. Thus, for the early and very early potato culture, sprouted tubers are used,
AgroLife Scientific Journal - Volume 6, Number 2, 2017ISSN 2285-5718; ISSN CD-ROM 2285-5726; ISSN ONLINE 2286-0126; ISSN-L 2285-5718 for which the tuber formation occurs earlier,
leading to a shorter vegetation period; for the cultures destined for industrialization, storing and consumption during autumn-winter, non-sprouted tubers are used, which elongate the vegetation period (Vârcan et al., 2002). In order to reduce the cost of seedling material it is recommended to section the tubers of over 60 mm in diameter. In this situation the planting must be done at the same distances used in the case of middle-sized tubers (Hossain et al., 2011). Research made for the potato plants led to elaborating a modern technology for potato production for seeds, including for in vitro reproduction of potato varieties that resist to climatic conditions in Romania, varieties with genetic resistance to viruses and other pathogens, which require less treatment against diseases and pests, varieties more resistant to thermic-hydric stress, water excess and fertilizers. It is a known fact that the planting material (potato for seeds) that fulfills the biological, phyto-sanitary and physic requirements represents the key to a large, constant and qualitative production. Obtaining micro tubers in vitro through meris-tems cultures, free of viruses and within a shorter period of time compared to classical methods, is also performed in Romania (Chiru, 2002), but it is a technology well spread in countries that are large producers of potatoes for seeds such as Holland, France, Germany etc. Minitubers obtained using biotechnology are between 5-35 mm, can be produced during the entire year and are recommended for obtai-ning high quality seeds (Chiru and Antofie, 1997). In addition, by using biotechnology for potatoes, gene transfer can be performed in order to obtain high quality genetic material (Philippa and Barrella, 2013). After conducting numerous studies as a general statement it can be said that micro tubers obtai-ned in vitro, regardless of size and variety, can successfully produce mini-tubers in direct field conditions which in turn facilitates the produc-tion of quality seeds (Srivastava et al., 2015). MATERIALS AND METHODS The experiment regarding the culture of early potato was conducted in Lungulețu, Dâmbovița county, on an non evolved alluvial soil, with
loamy-sandy texture and thickness of the A horizon of 21 cm. Soil analyses before the culture showed that the soil had a content of total soluble salts of 0.06%, N 15.4 ppm, P 288 ppm, K 400 ppm, content in humus 1.56% and pH 7.56. For the research, the Dutch variety Carrera was used, having tubers from two categories of size and fractions of 2-3 buds, cultivated in three systems (Figure 1), sprouted and non-sprouted. The experiment was organized according to the subdivided parcels method, with 18 experi-mental variants, each one with 3 repetitions, 30 plants per repetition, an area of 285 m2 per experiment, according to the experimental scheme (Table 1). Soil preparation was made through mechanical works for loosening and grinding and basic fertilization with manure of 30 t/ha and mineral fertilizers N 120 kg/ha, P2O5 40 kg/ha and K2O 50 kg /ha, incorporated through soil preparation works. A part of potato tubers were put aside to shoot for 12 days, the other part was stored, to be used as non-sprouted. In the planting day, the large tubers were divided in fractions with 2-3 buds.
Table 1. Experimental scheme
Culture protection
system Variant Tuber size
(mm) Preparation
of tubers
Not protected
V1 35-45 Sprouted V2 35-45 Non-sprouted V3 45-55 Sprouted V4 45-55 Non-sprouted
V5 Tuber fractions Sprouted
V6 Tuber fractions Non-sprouted
Protected with agril on the
soil
V7 35-45 Sprouted V8 35-45 Non-sprouted V9 45-55 Sprouted
V10 45-55 Non-sprouted
V11 Tuber fractions Sprouted
V12 Tuber fractions Non-sprouted
Protected with lower tunnel, covered with
agril
V13 35-45 Sprouted V14 35-45 Non-sprouted V15 45-55 Sprouted V16 45-55 Non-sprouted
V17 Tuber fractions Sprouted
V18 Tuber fractions Non-sprouted

121
RESEARCH REGARDING THE INFLUENCE OF TUBER SIZE AND PROTECTION SYSTEMS ON THE EARLY POTATO PRODUCTION
Gheorghița HOZA1, Maria DINU2, Alexandra Dida BECHERESCU3, Mariana NEAGU1
1University of Agronomic Sciences and Veterinary Medicine of Bucharest, 59 Marasti Blvd.,
District 1, Bucharest, Romania 2University of Craiova, 13 Alexandru Ioan Cuza Street, Craiova, Romania
3Banat’s University of Agricultural Sciences and Veterinary Medicine “King Michael I of Romania” Timişoara, Aradului Street 119, Timişoara, Romania
Corresponding author email: [email protected]
Abstract Research was made in Lunguletu, Dâmbovita County, an area in Romania with tradition in early potato culture. The biological material used was the Carrera variety, with tubers of two size categories (35-45 mm and 45-55 mm) and tuber fractions with 2-3 buds, cultivated in three culture systems (unprotected, protected with agril on the soil and protected with a tunnel made of agril), both sprouted and unsprouted. The results showed that the 35-45 mm tubers formed shorter stems compared to the 45-55 mm tubers and fractions, the plants’ growth being influenced also by the protection system. Thus, at the beginning, the plants protected by the agril tunnel recorded heights between 12.7 cm and 24.9cm, followed by the ones protected with agril on the soil, between 7.1 cm and 22 cm, while for the unprotected ones the height of the stems had values between 4 cm and 10.6 cm. The number of tubers per nest was larger for the 45-55 mm tubers for all culture variants, having values between 12 and 14.6. The tuber production was influenced by the tuber preparation method and the culture system, the best results being obtained for the sprouted tubers for all studied variants, with values between 3919 g for the unsprouted tubers protected with agril on the soil and 8848 g for the sprouted tuber fractions protected with the agril tunnel. Key words: early production, potatoes, protection system. INTRODUCTION The potato, considered Romania’s second bread, native to South America, is one of the most cultivated species in various areas around the globe thanks to its high ecological plasticity, having an essential role in feeding the planet’s inhabitants. The level of potato production is influenced by the use of high quality biological material (health condition, integrity and biological value, (Galfi et al., 2002), applying culture systems that improve the obtained results and the use of varieties with high productive potential and genetic resistance to disease and pests, by the climate conditions of the area where the culture is located (Masarirambi et al., 2012) and the used technology (Fabeiro et al., 2001; Ierna and Parisi, 2014; Marin et al., 2014). The research made by Diaconu, 1999 for some varieties, quoted by Donescu, 2002, shows that there is tight connection between the variety, number of eyes, number of sprouts, number of stems
and tuber production. Moreover, the tuber size influences the spring of the plants; the bigger tubers have a higher spring percentage and form a larger number of main stems and more tubers in the nest (Bărdaș, 2001). Although many studies have been conducted on this species the relationships between potato cultivars and the dimension of the tubers still have significant information to offer. Some important studies were made a few decades ago (Bremner and Taha, 1966) while others are barely recent (Khan et al., 2010), constantly offering new data due to the versatility of this species. Early potato culture in lower covered shelters using sprouted tubers resulted in the highest production compared to other culture systems and proved economically efficient (Topan et al., 2006). The physiological condition of the tuber highly influences the spring process and its intensity, the uniformity of the spring, plant growth and tuber formation. Thus, for the early and very early potato culture, sprouted tubers are used,
for which the tuber formation occurs earlier, leading to a shorter vegetation period; for the cultures destined for industrialization, storing and consumption during autumn-winter, non-sprouted tubers are used, which elongate the vegetation period (Vârcan et al., 2002). In order to reduce the cost of seedling material it is recommended to section the tubers of over 60 mm in diameter. In this situation the planting must be done at the same distances used in the case of middle-sized tubers (Hossain et al., 2011). Research made for the potato plants led to elaborating a modern technology for potato production for seeds, including for in vitro reproduction of potato varieties that resist to climatic conditions in Romania, varieties with genetic resistance to viruses and other pathogens, which require less treatment against diseases and pests, varieties more resistant to thermic-hydric stress, water excess and fertilizers. It is a known fact that the planting material (potato for seeds) that fulfills the biological, phyto-sanitary and physic requirements represents the key to a large, constant and qualitative production. Obtaining micro tubers in vitro through meris-tems cultures, free of viruses and within a shorter period of time compared to classical methods, is also performed in Romania (Chiru, 2002), but it is a technology well spread in countries that are large producers of potatoes for seeds such as Holland, France, Germany etc. Minitubers obtained using biotechnology are between 5-35 mm, can be produced during the entire year and are recommended for obtai-ning high quality seeds (Chiru and Antofie, 1997). In addition, by using biotechnology for potatoes, gene transfer can be performed in order to obtain high quality genetic material (Philippa and Barrella, 2013). After conducting numerous studies as a general statement it can be said that micro tubers obtai-ned in vitro, regardless of size and variety, can successfully produce mini-tubers in direct field conditions which in turn facilitates the produc-tion of quality seeds (Srivastava et al., 2015). MATERIALS AND METHODS The experiment regarding the culture of early potato was conducted in Lungulețu, Dâmbovița county, on an non evolved alluvial soil, with
loamy-sandy texture and thickness of the A horizon of 21 cm. Soil analyses before the culture showed that the soil had a content of total soluble salts of 0.06%, N 15.4 ppm, P 288 ppm, K 400 ppm, content in humus 1.56% and pH 7.56. For the research, the Dutch variety Carrera was used, having tubers from two categories of size and fractions of 2-3 buds, cultivated in three systems (Figure 1), sprouted and non-sprouted. The experiment was organized according to the subdivided parcels method, with 18 experi-mental variants, each one with 3 repetitions, 30 plants per repetition, an area of 285 m2 per experiment, according to the experimental scheme (Table 1). Soil preparation was made through mechanical works for loosening and grinding and basic fertilization with manure of 30 t/ha and mineral fertilizers N 120 kg/ha, P2O5 40 kg/ha and K2O 50 kg /ha, incorporated through soil preparation works. A part of potato tubers were put aside to shoot for 12 days, the other part was stored, to be used as non-sprouted. In the planting day, the large tubers were divided in fractions with 2-3 buds.
Table 1. Experimental scheme
Culture protection
system Variant Tuber size
(mm) Preparation
of tubers
Not protected
V1 35-45 Sprouted V2 35-45 Non-sprouted V3 45-55 Sprouted V4 45-55 Non-sprouted
V5 Tuber fractions Sprouted
V6 Tuber fractions Non-sprouted
Protected with agril on the
soil
V7 35-45 Sprouted V8 35-45 Non-sprouted V9 45-55 Sprouted
V10 45-55 Non-sprouted
V11 Tuber fractions Sprouted
V12 Tuber fractions Non-sprouted
Protected with lower tunnel, covered with
agril
V13 35-45 Sprouted V14 35-45 Non-sprouted V15 45-55 Sprouted V16 45-55 Non-sprouted
V17 Tuber fractions Sprouted
V18 Tuber fractions Non-sprouted

122
Figure 1. The systems of culture
The planting was mechanically made on billons with 2 MPC + U 445 on March 9th 2016, at a distance of 0.7 m/0.25 m, resulting a density of 5.7 plants/m2. Temperature at planting was 100C in the air and 60C at soil level. Maintenance works were performed in order to create favourable conditions for the growth and development of potato plants. The treatment against weeds was made with Arcade, a selective herbicide, applied on the surface, pre-emergent against annual grassy and dicotyledonous weeds, with a combat rate of over 90%. Phyto-sanitary protection was made by applying 5 treatments for disease combat and one for the potato bug, at a time interval of 7 days, with Bravo 500 SC, Revus 250 SC, Ridomil Gold MZ 68 WG + Actara 25 WG, Consento 450 SC and Shirlan 500 SC. During the research, observations were made regarding the phenology of potato plants, number of stems/nest, number of tubers/nest, number of tubers/m², average weight of tubers, tuber production per nest and per m². RESULTS AND DISCUSSIONS After processing the field data, it was noted that plant spring was influenced both by the tuber size and by the crop protection system. For the variants grown in an unprotected system, the spring occurred later due to lower temperature and the larger difference between day and night, both for the sprouted and the non-sprouted tubers, i.e. 30 and 34 days, respectively. For crops protected with agril on the soil, sprouted tubers sprang after 25 days and the non-sprouted tubers after 30 days. The tunnel made from agril led to plants springing
3 days earlier, compared to the covering of the soil with agril for the sprouted tubers, and 8 days earlier, compared to the sprouted tubers from unprotected systems. These differences in springing between the protection systems were also noticeable for the non-sprouted tubers, but the spring occurred 4-8 days later than the sprouted tubers (Figure 2).
Figure 2. Tuber spring duration (days)
Analyzing the dynamics of stem growth during three weeks, it was observed the influence of the size of the planting material, of the protection system and of tuber preparation method for planting (Figure 3).
Figure 3. Stem growth dynamics (cm)
At the beginning of the plant growth period, it was observed that from the tubers with 35-45 mm calibre shorter stems formed, compared to the 45-55 mm tubers and from fractions, for all protection variants. As the environmental conditions improved, the growth differences between the studied variants lowered; still, 45-55 mm tubers and the fractions led to a more vigorous stem growth. Regarding the protection system, it was noticed that the plants protected with tunnels made from agril had higher heights because a
favourable microclimate was created, with heat accumulation that accelerates their growth, the height values being between 12.7 cm and 24.9 cm, for protection with agril on the soil the values were between 7.1 cm and 22 cm, while for the unprotected, the stems were between 4 cm and 10.6 cm. The influence of tuber preparation was obvious; for sprouted tubers the stem growth was larger compared to the unsprouted tubers, regardless of the tuber size or protection system. The average number of stems per plant (Table 2) was within the limits of the specialized literature, between 2 and 5, results also obtained by (Masarirambi et al., 2012). Analyzing the influence of tuber size on the number of formed stems, it was noted that 45-55 calibre tubers and some fractions formed a larger number of stems compared to 35-45 mm calibre tubers that have a lower quantity of nutrients and a lower vigour. Hossain et al., 2011, in a study conducted in Bangladesh at the Agriculture Research Institute noticed that the large tubers formed a big number of stems in comparison with the middle-sized and small tubers. The protection system slightly influenced the number of formed stems, the largest number of stems being recorded for the protection with agril on soil and agril tunnel. Using the sprouted and unsprouted tubers influenced the stem formation, for the unprotected system the best results being very significant positive for the 45-55 mm tubers (V3) and distinct positive for V2, V4 and V5 on nonprotected culture (Figure 4). For protection with agril on soil (Figure 5) were obtained results very significant positive for the sprouted tubers and unsprouted of 45-55 mm calibre, while for the tunnel protection the results (Figure 6) were very significant positive for the variants with 45-55 mm tubers and fractions (V15, V16, V17, V18). The tuber formation was influenced by the studied factors (Table 3). Analyzing the influence of the size of the planting material on the tuber formation, it was observed that the planting material of 35-45 mm calibre produced a lower number of tubers for the agril tunnel protection system (8.6
tubers/plant), while for the agril on soil protection method the number was slightly larger, respectively 9.6 tubers/plant and 11 tubers/plant. The 45-55 mm calibre planting material produced the best results, the number of tubers per plant being the largest for all protection systems.
Figure 4. The culture nonprotected
Figure 5. The culture protected
with agril on the soil
Figure 6. The culture protected with tunnel covered with agril
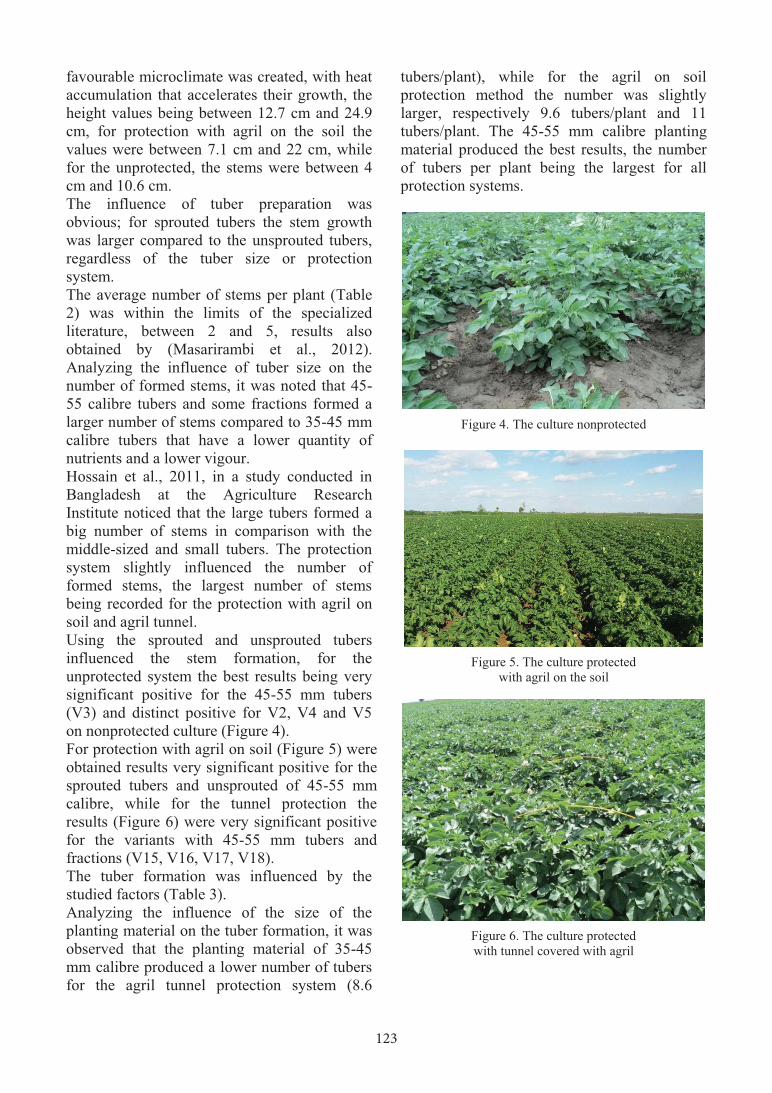
123
Figure 1. The systems of culture
The planting was mechanically made on billons with 2 MPC + U 445 on March 9th 2016, at a distance of 0.7 m/0.25 m, resulting a density of 5.7 plants/m2. Temperature at planting was 100C in the air and 60C at soil level. Maintenance works were performed in order to create favourable conditions for the growth and development of potato plants. The treatment against weeds was made with Arcade, a selective herbicide, applied on the surface, pre-emergent against annual grassy and dicotyledonous weeds, with a combat rate of over 90%. Phyto-sanitary protection was made by applying 5 treatments for disease combat and one for the potato bug, at a time interval of 7 days, with Bravo 500 SC, Revus 250 SC, Ridomil Gold MZ 68 WG + Actara 25 WG, Consento 450 SC and Shirlan 500 SC. During the research, observations were made regarding the phenology of potato plants, number of stems/nest, number of tubers/nest, number of tubers/m², average weight of tubers, tuber production per nest and per m². RESULTS AND DISCUSSIONS After processing the field data, it was noted that plant spring was influenced both by the tuber size and by the crop protection system. For the variants grown in an unprotected system, the spring occurred later due to lower temperature and the larger difference between day and night, both for the sprouted and the non-sprouted tubers, i.e. 30 and 34 days, respectively. For crops protected with agril on the soil, sprouted tubers sprang after 25 days and the non-sprouted tubers after 30 days. The tunnel made from agril led to plants springing
3 days earlier, compared to the covering of the soil with agril for the sprouted tubers, and 8 days earlier, compared to the sprouted tubers from unprotected systems. These differences in springing between the protection systems were also noticeable for the non-sprouted tubers, but the spring occurred 4-8 days later than the sprouted tubers (Figure 2).
Figure 2. Tuber spring duration (days)
Analyzing the dynamics of stem growth during three weeks, it was observed the influence of the size of the planting material, of the protection system and of tuber preparation method for planting (Figure 3).
Figure 3. Stem growth dynamics (cm)
At the beginning of the plant growth period, it was observed that from the tubers with 35-45 mm calibre shorter stems formed, compared to the 45-55 mm tubers and from fractions, for all protection variants. As the environmental conditions improved, the growth differences between the studied variants lowered; still, 45-55 mm tubers and the fractions led to a more vigorous stem growth. Regarding the protection system, it was noticed that the plants protected with tunnels made from agril had higher heights because a
favourable microclimate was created, with heat accumulation that accelerates their growth, the height values being between 12.7 cm and 24.9 cm, for protection with agril on the soil the values were between 7.1 cm and 22 cm, while for the unprotected, the stems were between 4 cm and 10.6 cm. The influence of tuber preparation was obvious; for sprouted tubers the stem growth was larger compared to the unsprouted tubers, regardless of the tuber size or protection system. The average number of stems per plant (Table 2) was within the limits of the specialized literature, between 2 and 5, results also obtained by (Masarirambi et al., 2012). Analyzing the influence of tuber size on the number of formed stems, it was noted that 45-55 calibre tubers and some fractions formed a larger number of stems compared to 35-45 mm calibre tubers that have a lower quantity of nutrients and a lower vigour. Hossain et al., 2011, in a study conducted in Bangladesh at the Agriculture Research Institute noticed that the large tubers formed a big number of stems in comparison with the middle-sized and small tubers. The protection system slightly influenced the number of formed stems, the largest number of stems being recorded for the protection with agril on soil and agril tunnel. Using the sprouted and unsprouted tubers influenced the stem formation, for the unprotected system the best results being very significant positive for the 45-55 mm tubers (V3) and distinct positive for V2, V4 and V5 on nonprotected culture (Figure 4). For protection with agril on soil (Figure 5) were obtained results very significant positive for the sprouted tubers and unsprouted of 45-55 mm calibre, while for the tunnel protection the results (Figure 6) were very significant positive for the variants with 45-55 mm tubers and fractions (V15, V16, V17, V18). The tuber formation was influenced by the studied factors (Table 3). Analyzing the influence of the size of the planting material on the tuber formation, it was observed that the planting material of 35-45 mm calibre produced a lower number of tubers for the agril tunnel protection system (8.6
tubers/plant), while for the agril on soil protection method the number was slightly larger, respectively 9.6 tubers/plant and 11 tubers/plant. The 45-55 mm calibre planting material produced the best results, the number of tubers per plant being the largest for all protection systems.
Figure 4. The culture nonprotected
Figure 5. The culture protected
with agril on the soil
Figure 6. The culture protected with tunnel covered with agril

124
Table 2. Average number of stems/nest Experimental variant Average number of stems/variant (nest) Significance
V 1 2.4 Mt V 2 3 ** V 3 3.6 *** V 4 3 ** V 5 3 ** V 6 2.6 N
LSD 5%= 0.33 piece, LSD 1%= 0.47 piece, LSD 0.1% =0.68 piece V 7 2.6 Mt V 8 2.4 N V 9 5 ***
V 10 4 *** V 11 2.8 N V 12 2.4 N
LSD 5%= 0.28 piece, LSD 1% =0.41 piece, LSD 0.1%= 0.59 piece V 13 2 Mt V 14 2 N V 15 4 *** V 16 3 *** V 17 3.6 *** V 18 3 ***
LSD 5% =0.29 piece, LSD 1% =0.42 piece, LSD 0.1% =0.61 piece
The tuber preparation method recorded a very weak influence on this production indicator. The number of obtained tubers per sqm was directly correlated with the number of tubers obtained per plant, varying between 42.8-74.2 for the unprotected system, 45.6-82.7 for the agril on the soil and between 51.3-84.2 for the agril tunnel. Analyzing the results obtained from a statistically point of view regarding the average number of tubers per nest, it was observed that
for the unprotected system the results were very significantly positive for the 45-55 mm tubers, both sprouted and unsprouted while the smallest results, very significantly negative, being recorded for the tuber fractions, both sprouted and unsprouted; similar results were obtained for the protection system with agril on the soil, while for the agril tunnel protection system very significantly positive results were obtained for the fractions and 45-55 mm tubers.
Table 3. Average number of tubers/nest and per m2
Experimental variant Tubers /nest Tubers/m² Significance
V 1 11 62.8 Mt V 2 11 62.8 N V 3 12.6 71.3 *** V 4 13 74.2 *** V 5 9.6 54.2 000 V 6 7.4 42.8 000
LSD 5% =2.76 piece, LSD 1% =3.94 piece, LSD 0.1% =5.70 piece V 7 9.6 54.2 Mt V 8 9.6 54.2 N V 9 14.6 82.7 *** V 10 13 74.2 *** V 11 8.6 48.5 00 V 12 8 45.6 000
LSD 5% =3.92piece, LSD 1%= 5.59 piece, LSD 0.1% =8.08 piece V 13 9 51.3 Mt V 14 8.6 56.5 * V 15 13 84.2 *** V 16 12 78.5 *** V 17 11.6 65.6 *** V 18 9.6 62.2 ***
Average LSD 5% =4.32 piece, LSD 1%= 6.14 piece, LSD 0.1% =8.89 piece
Tuber production (Table 4) was influenced by the size of the planting material, the largest production being obtained for the 45-55 mm calibre tubers and tuber fractions, results also obtained by Masarirambi et al., 2012. Crop protection had a positive influence on the potato production, the largest production being recorded for the crops protected by agril
tunnels, with sprouted tuber fractions (8388 g/m2), being statistically ensured, followed by the protection with agril on the soil (V11, V12). It was noted that the tuber pre-ploughing method influenced tuber production, as the production for the sprouted tubers was larger than the unsprouted ones.
Table 4. Average tuber production/nest and per m2
CONCLUSIONS The average number of tubers per nest was influenced by the size of the tubers used for planting, the best results being obtained for the 45-55 mm tubers for all protection variants, that were statistically ensured. Tuber fractions protected by agril tunnel produced a large number of tubers per nest, the results being statistically ensured. The largest number of tubers per m2 was obtained for the tunnel protection, followed by the agril on soil and unprotected system. Potato production was influenced by the size of the tubers used for planting, the largest production being obtained for the tuber fractions and 45-55 mm tubers. Crop protection influenced the growth the potation production, the largest production
being obtained for the protection system with agril tunnel (V17). The springing of the tubers before planting represents a favourable factor for increased potato production. This element was visible in all protection systems, including the unprotected ones. REFERENCES Bărdaş M., 2001. Rezultate privind influenţa mărimii
minituberculior şi a desimii de plantare asupra unor elemente de productivitate a cartofului. Analele Institulul de cercetare-dezvoltare pentru cartof, Vol. XXVIII, Brasov, 53.
Bremner T. and Taha M.A., 1966. Studies in potato agronomy: The effects of variety, seed size and spacing on growth, development and yield. Agric. Sci. J. (London), 66, p. 241–252.
Chiru Nicoleta, 2002. Cercetări privind culturile de ţesuturi "in vitro" la cartof. Anale Institulul de cercetare- dezvoltare pentru cartof, Vol. XXIX, 37.
Experimental variant Prod./nest (g)
Production/m² (g) Significance
V 1 950.5 5431.0 Mt
V 2 807 4611.0 000
V 3 927.5 5299.0 N
V 4 774.0 4422.0 000
V 5 935.5 5345.0 N
V 6 872.5 4985.0 000
LSD 5% =185 g, LSD 1% =264 g, LSD 0.1% =382 g V 7 886.5 5065.0 Mt V 8 686.0 3919.0 000 V 9 1044 596.0 ***
V 10 888.5 5076.0 N V 11 1119.5 6396.0 *** V 12 1115.0 6371.0 ***
LSD 5% =373 g, LSD 1% =531 g, LSD 0.,1% =
V 13 939.0 5365.0 Mt
V 14 838 4788 .0 000
V 15 1095.5 6259.0 ***
V 16 972.0 5554.0 * V 17 1468.0 8388.0 *** V 18 1027.5 5871.0 ***
LSD 5% =185 g, LSD 1% =264 g, LSD 0.1% =382 g

125
Table 2. Average number of stems/nest Experimental variant Average number of stems/variant (nest) Significance
V 1 2.4 Mt V 2 3 ** V 3 3.6 *** V 4 3 ** V 5 3 ** V 6 2.6 N
LSD 5%= 0.33 piece, LSD 1%= 0.47 piece, LSD 0.1% =0.68 piece V 7 2.6 Mt V 8 2.4 N V 9 5 ***
V 10 4 *** V 11 2.8 N V 12 2.4 N
LSD 5%= 0.28 piece, LSD 1% =0.41 piece, LSD 0.1%= 0.59 piece V 13 2 Mt V 14 2 N V 15 4 *** V 16 3 *** V 17 3.6 *** V 18 3 ***
LSD 5% =0.29 piece, LSD 1% =0.42 piece, LSD 0.1% =0.61 piece
The tuber preparation method recorded a very weak influence on this production indicator. The number of obtained tubers per sqm was directly correlated with the number of tubers obtained per plant, varying between 42.8-74.2 for the unprotected system, 45.6-82.7 for the agril on the soil and between 51.3-84.2 for the agril tunnel. Analyzing the results obtained from a statistically point of view regarding the average number of tubers per nest, it was observed that
for the unprotected system the results were very significantly positive for the 45-55 mm tubers, both sprouted and unsprouted while the smallest results, very significantly negative, being recorded for the tuber fractions, both sprouted and unsprouted; similar results were obtained for the protection system with agril on the soil, while for the agril tunnel protection system very significantly positive results were obtained for the fractions and 45-55 mm tubers.
Table 3. Average number of tubers/nest and per m2
Experimental variant Tubers /nest Tubers/m² Significance
V 1 11 62.8 Mt V 2 11 62.8 N V 3 12.6 71.3 *** V 4 13 74.2 *** V 5 9.6 54.2 000 V 6 7.4 42.8 000
LSD 5% =2.76 piece, LSD 1% =3.94 piece, LSD 0.1% =5.70 piece V 7 9.6 54.2 Mt V 8 9.6 54.2 N V 9 14.6 82.7 *** V 10 13 74.2 *** V 11 8.6 48.5 00 V 12 8 45.6 000
LSD 5% =3.92piece, LSD 1%= 5.59 piece, LSD 0.1% =8.08 piece V 13 9 51.3 Mt V 14 8.6 56.5 * V 15 13 84.2 *** V 16 12 78.5 *** V 17 11.6 65.6 *** V 18 9.6 62.2 ***
Average LSD 5% =4.32 piece, LSD 1%= 6.14 piece, LSD 0.1% =8.89 piece
Tuber production (Table 4) was influenced by the size of the planting material, the largest production being obtained for the 45-55 mm calibre tubers and tuber fractions, results also obtained by Masarirambi et al., 2012. Crop protection had a positive influence on the potato production, the largest production being recorded for the crops protected by agril
tunnels, with sprouted tuber fractions (8388 g/m2), being statistically ensured, followed by the protection with agril on the soil (V11, V12). It was noted that the tuber pre-ploughing method influenced tuber production, as the production for the sprouted tubers was larger than the unsprouted ones.
Table 4. Average tuber production/nest and per m2
CONCLUSIONS The average number of tubers per nest was influenced by the size of the tubers used for planting, the best results being obtained for the 45-55 mm tubers for all protection variants, that were statistically ensured. Tuber fractions protected by agril tunnel produced a large number of tubers per nest, the results being statistically ensured. The largest number of tubers per m2 was obtained for the tunnel protection, followed by the agril on soil and unprotected system. Potato production was influenced by the size of the tubers used for planting, the largest production being obtained for the tuber fractions and 45-55 mm tubers. Crop protection influenced the growth the potation production, the largest production
being obtained for the protection system with agril tunnel (V17). The springing of the tubers before planting represents a favourable factor for increased potato production. This element was visible in all protection systems, including the unprotected ones. REFERENCES Bărdaş M., 2001. Rezultate privind influenţa mărimii
minituberculior şi a desimii de plantare asupra unor elemente de productivitate a cartofului. Analele Institulul de cercetare-dezvoltare pentru cartof, Vol. XXVIII, Brasov, 53.
Bremner T. and Taha M.A., 1966. Studies in potato agronomy: The effects of variety, seed size and spacing on growth, development and yield. Agric. Sci. J. (London), 66, p. 241–252.
Chiru Nicoleta, 2002. Cercetări privind culturile de ţesuturi "in vitro" la cartof. Anale Institulul de cercetare- dezvoltare pentru cartof, Vol. XXIX, 37.
Experimental variant Prod./nest (g)
Production/m² (g) Significance
V 1 950.5 5431.0 Mt
V 2 807 4611.0 000
V 3 927.5 5299.0 N
V 4 774.0 4422.0 000
V 5 935.5 5345.0 N
V 6 872.5 4985.0 000
LSD 5% =185 g, LSD 1% =264 g, LSD 0.1% =382 g V 7 886.5 5065.0 Mt V 8 686.0 3919.0 000 V 9 1044 596.0 ***
V 10 888.5 5076.0 N V 11 1119.5 6396.0 *** V 12 1115.0 6371.0 ***
LSD 5% =373 g, LSD 1% =531 g, LSD 0.,1% =
V 13 939.0 5365.0 Mt
V 14 838 4788 .0 000
V 15 1095.5 6259.0 ***
V 16 972.0 5554.0 * V 17 1468.0 8388.0 *** V 18 1027.5 5871.0 ***
LSD 5% =185 g, LSD 1% =264 g, LSD 0.1% =382 g
126
THE INFLUENCE OF THE CHEMICAL COMPOSITION OF MAIZE, BARLEY AND PEAS HYBRIDS ON THE DIGESTIBILITY
OF COMPOUND FEED FOR PIGS
Monica MARIN, Camelia HODOȘAN, Georgeta DINIȚĂ, Carmen Georgeta NICOLAE
University of Agronomic Sciences and Veterinary Medicine of Bucharest, 59 Marasti Blvd.,
District 1, Bucharest, Romania
Corresponding author email: [email protected] Abstract The development of animal production is a priority because it provides the most important food resources from the nutrition point of view for the entire population, and the demographic explosion and rise of living standard have led to the increased demand for food of animal origin. The profitability of pig growth is influenced by their rational feeding. It is known that food production expenses have the largest share in food production, varying between 60 and 80% of the total of these expenditure. As a result, particular attention should be paid to the maximum efficiency of compound feed in order to make it transformed in human food products with an as high as possible percentage. To achieve this goal, the nutrients from the ratio should be correlated with the physiological requirements of the animals. For this purpose, in this paper was analyzed the influence of maize, barley and peas hybrids on the apparent digestibility of nutrients from the compound feeds for pregnant sows, lactating sows and piglets during weaning. The preparation of recipes for mixed feeds requires a good understanding of the basic principles of nutrition and how diet should be individualized based on age, gender, physiological status. The apparent digestibility of the analyzed organic substances (crude protein, crude fat, crude fiber) from the compound feed recipes was influenced by the chemical composition of the compound feeds used, especially the crude fiber content, as well as the swine physiological state. Key words: digestibility, pig, nutritive substances, hybrids of mayze, barley, peas. INTRODUCTION The need to achieve higher results in the animal husbandry domain has resulted in artificial breeding conditions, especially for pigs. In parallel with this, the widening of the range of fodder feed components of compound feed used in the feeding of these species, the introduction of new qualitatively differentiated ingredients (new hybrids of cereals or oil plants) has required the reassessment of the nutritional potential of fodder on new bases. Based on the knowledge gained in the field of animal nutrition, technical and scientific progress has led both to the development of biochemical testing methods and methodologies, as well as the use of new procedures to elucidate some morpho-productive aspects of animals. Among these, it is of particular importance to know the way in which animal nutrients are used by animals (Marin et al., 2016). One of the most important factors which determine the nutritional value of a fodder is its
digestibility. The apparent or actual digestibility values can provide an overview of the proper feeding of animals. Of the various techniques that have been used so far, conventional digestibility experiments are the safest method for measuring feed digestibility. However, generally, these methods are generally quite costly and require a relatively long time. The time and expenses involved in digestion experiments can be saved by using the inertial indicator method. The digestibility of nutrients in a fodder composition can also be assessed on the basis of the chemical composition of the feed (Șara and Bențea, 2011). In order to determine the level of amino acids to be provided through compound feed for pigs, a number of techniques have been developed to allow the appreciation of apparent and real digestibility of protein and amino acids in the small intestine (Gâlcă and Drăgotoiu, 2003). It is important to consider when it is appreciated the fodder digestibility, the fact that it is influenced by a number of feed-dependent
Chiru Nicoleta şi Antofie Adriana, 1997. Utilizarea biotehnologiei în cultura cartofului. Anale Institulul de cercetare-dezvoltare pentru cartof, Vol. jub. XXIV, p. 75-84.
Donescu V., Maria Ianosi, Daniela Donescu, 2002. Aportul cercetărilor de tehnologie la cultura cartofului. Anale Institulul de cercetare-dezvoltare pentru cartof, Vol. XXIX, 65.
Fabeiro C., Martı́n de Santa Olalla F., de Juan J.A., 2001. Yield and size of deficit irrigated potatoes. Agricultural Water Management, 48 (3), p. 255–266.
Galfi N., Zsofia Karsai, Rozalia Gyorgy, Stankovszky A., Szabo I., 2002. Realizări în domeniul ameliorării şi producerii materialului de plantat în cadrul S.C.D.C. Miercurea Ciuc. Anale Institulul de cercetare-dezvoltare pentru cartof, Vol. XXIX, 93.
Hossain M.S., Zakaria M., Hossain MM., Rashid M.H., 2011. Effect of Seed Size and Cutting Methods on the Yield and Profitability of Potato. The Agriculturists 9(1&2): p. 54-62.
Ierna A., Parisi B., 2014. Crop growth and tuber yield of “early” potato crop under organic and conventional farming. Scientia Horticulturae, Vol. 165, p. 260-265.
Khan S.A., Rahman Jamro M.M. and Arain M.Y., 2010. Determination of suitable planting geometry for different true potato tuberlet grades. Pakistan J. Agric. Res., 23: p. 42–45.
Marin D.I., Jeni Veronica Țiu, Dincă N., Bolohan C., 2014. Potato crop production in peri-urban Bucharest area (Moara Domneasca - Ilfov). AgroLife Scientific Journal 3(1): p. 100-103.
Masarirambi M.T., Mandisodza F.C., Mashingaidze A.B. and Bhebhe E., 2012. Influence of plant population and seed tuber size on growth and yield components of potato (Solanum tuberosum). Int. J. Agric. Biol., 14: p. 545–549.
Philippa J., Barrell1, Sathiyamoorthy Meiyalaghan, Jeanne M.E., Jacobs1,2 and Anthony J.C., 2013. Applications of biotechnology and genomics in potato improvement. Plant Biotechnology Journal 11, p. 907–920
Sara Lombardo, Antonino Lo Monaco, Gaetano Pandino, Bruno Parisi, Giovanni Mauromicale, 2013. The phenology, yield and tuber composition of „early” crop potatoes: A comparison between organic and conventional cultivation systems. Renewable Agriculture and Food Systems, 28, p. 50-58.
Srivastava A.K., Yadav S.K., Diengdoh L.D., Rai R., Bag T.K., 2015. Effect of cultivars and seed size on field performance of potato micro-tubers in North Eastern Himalayan region in India. Journal of Applied and Natural Science 7 (1): p. 335 –338.
Topan C., Morar G., Vâtcă S.D., Camelia Sîrbu, 2006. Research concerning the posibility to produce early potatoes cultivars in Cluj area. Buletin USAMV-CN, 62, p. 159-163.
Vârcan P., Aurelia Diaconu, Domnica Ene, Săninoiu M., Rotaru L., 2002. Contribuţia Staţiunii de Cercetare-Dezvoltare pentru Cartof - Mârşani la răspândirea şi modernizarea producţiei de cartof timpuriu în sudul României. Anale Institulul de cercetare-dezvoltare pentru cartof, Vol. XXIX, 105.
127
THE INFLUENCE OF THE CHEMICAL COMPOSITION OF MAIZE, BARLEY AND PEAS HYBRIDS ON THE DIGESTIBILITY
OF COMPOUND FEED FOR PIGS
Monica MARIN, Camelia HODOȘAN, Georgeta DINIȚĂ, Carmen Georgeta NICOLAE
University of Agronomic Sciences and Veterinary Medicine of Bucharest, 59 Marasti Blvd.,
District 1, Bucharest, Romania
Corresponding author email: [email protected] Abstract The development of animal production is a priority because it provides the most important food resources from the nutrition point of view for the entire population, and the demographic explosion and rise of living standard have led to the increased demand for food of animal origin. The profitability of pig growth is influenced by their rational feeding. It is known that food production expenses have the largest share in food production, varying between 60 and 80% of the total of these expenditure. As a result, particular attention should be paid to the maximum efficiency of compound feed in order to make it transformed in human food products with an as high as possible percentage. To achieve this goal, the nutrients from the ratio should be correlated with the physiological requirements of the animals. For this purpose, in this paper was analyzed the influence of maize, barley and peas hybrids on the apparent digestibility of nutrients from the compound feeds for pregnant sows, lactating sows and piglets during weaning. The preparation of recipes for mixed feeds requires a good understanding of the basic principles of nutrition and how diet should be individualized based on age, gender, physiological status. The apparent digestibility of the analyzed organic substances (crude protein, crude fat, crude fiber) from the compound feed recipes was influenced by the chemical composition of the compound feeds used, especially the crude fiber content, as well as the swine physiological state. Key words: digestibility, pig, nutritive substances, hybrids of mayze, barley, peas. INTRODUCTION The need to achieve higher results in the animal husbandry domain has resulted in artificial breeding conditions, especially for pigs. In parallel with this, the widening of the range of fodder feed components of compound feed used in the feeding of these species, the introduction of new qualitatively differentiated ingredients (new hybrids of cereals or oil plants) has required the reassessment of the nutritional potential of fodder on new bases. Based on the knowledge gained in the field of animal nutrition, technical and scientific progress has led both to the development of biochemical testing methods and methodologies, as well as the use of new procedures to elucidate some morpho-productive aspects of animals. Among these, it is of particular importance to know the way in which animal nutrients are used by animals (Marin et al., 2016). One of the most important factors which determine the nutritional value of a fodder is its
digestibility. The apparent or actual digestibility values can provide an overview of the proper feeding of animals. Of the various techniques that have been used so far, conventional digestibility experiments are the safest method for measuring feed digestibility. However, generally, these methods are generally quite costly and require a relatively long time. The time and expenses involved in digestion experiments can be saved by using the inertial indicator method. The digestibility of nutrients in a fodder composition can also be assessed on the basis of the chemical composition of the feed (Șara and Bențea, 2011). In order to determine the level of amino acids to be provided through compound feed for pigs, a number of techniques have been developed to allow the appreciation of apparent and real digestibility of protein and amino acids in the small intestine (Gâlcă and Drăgotoiu, 2003). It is important to consider when it is appreciated the fodder digestibility, the fact that it is influenced by a number of feed-dependent
Chiru Nicoleta şi Antofie Adriana, 1997. Utilizarea biotehnologiei în cultura cartofului. Anale Institulul de cercetare-dezvoltare pentru cartof, Vol. jub. XXIV, p. 75-84.
Donescu V., Maria Ianosi, Daniela Donescu, 2002. Aportul cercetărilor de tehnologie la cultura cartofului. Anale Institulul de cercetare-dezvoltare pentru cartof, Vol. XXIX, 65.
Fabeiro C., Martı́n de Santa Olalla F., de Juan J.A., 2001. Yield and size of deficit irrigated potatoes. Agricultural Water Management, 48 (3), p. 255–266.
Galfi N., Zsofia Karsai, Rozalia Gyorgy, Stankovszky A., Szabo I., 2002. Realizări în domeniul ameliorării şi producerii materialului de plantat în cadrul S.C.D.C. Miercurea Ciuc. Anale Institulul de cercetare-dezvoltare pentru cartof, Vol. XXIX, 93.
Hossain M.S., Zakaria M., Hossain MM., Rashid M.H., 2011. Effect of Seed Size and Cutting Methods on the Yield and Profitability of Potato. The Agriculturists 9(1&2): p. 54-62.
Ierna A., Parisi B., 2014. Crop growth and tuber yield of “early” potato crop under organic and conventional farming. Scientia Horticulturae, Vol. 165, p. 260-265.
Khan S.A., Rahman Jamro M.M. and Arain M.Y., 2010. Determination of suitable planting geometry for different true potato tuberlet grades. Pakistan J. Agric. Res., 23: p. 42–45.
Marin D.I., Jeni Veronica Țiu, Dincă N., Bolohan C., 2014. Potato crop production in peri-urban Bucharest area (Moara Domneasca - Ilfov). AgroLife Scientific Journal 3(1): p. 100-103.
Masarirambi M.T., Mandisodza F.C., Mashingaidze A.B. and Bhebhe E., 2012. Influence of plant population and seed tuber size on growth and yield components of potato (Solanum tuberosum). Int. J. Agric. Biol., 14: p. 545–549.
Philippa J., Barrell1, Sathiyamoorthy Meiyalaghan, Jeanne M.E., Jacobs1,2 and Anthony J.C., 2013. Applications of biotechnology and genomics in potato improvement. Plant Biotechnology Journal 11, p. 907–920
Sara Lombardo, Antonino Lo Monaco, Gaetano Pandino, Bruno Parisi, Giovanni Mauromicale, 2013. The phenology, yield and tuber composition of „early” crop potatoes: A comparison between organic and conventional cultivation systems. Renewable Agriculture and Food Systems, 28, p. 50-58.
Srivastava A.K., Yadav S.K., Diengdoh L.D., Rai R., Bag T.K., 2015. Effect of cultivars and seed size on field performance of potato micro-tubers in North Eastern Himalayan region in India. Journal of Applied and Natural Science 7 (1): p. 335 –338.
Topan C., Morar G., Vâtcă S.D., Camelia Sîrbu, 2006. Research concerning the posibility to produce early potatoes cultivars in Cluj area. Buletin USAMV-CN, 62, p. 159-163.
Vârcan P., Aurelia Diaconu, Domnica Ene, Săninoiu M., Rotaru L., 2002. Contribuţia Staţiunii de Cercetare-Dezvoltare pentru Cartof - Mârşani la răspândirea şi modernizarea producţiei de cartof timpuriu în sudul României. Anale Institulul de cercetare-dezvoltare pentru cartof, Vol. XXIX, 105.
AgroLife Scientific Journal - Volume 6, Number 2, 2017ISSN 2285-5718; ISSN CD-ROM 2285-5726; ISSN ONLINE 2286-0126; ISSN-L 2285-5718
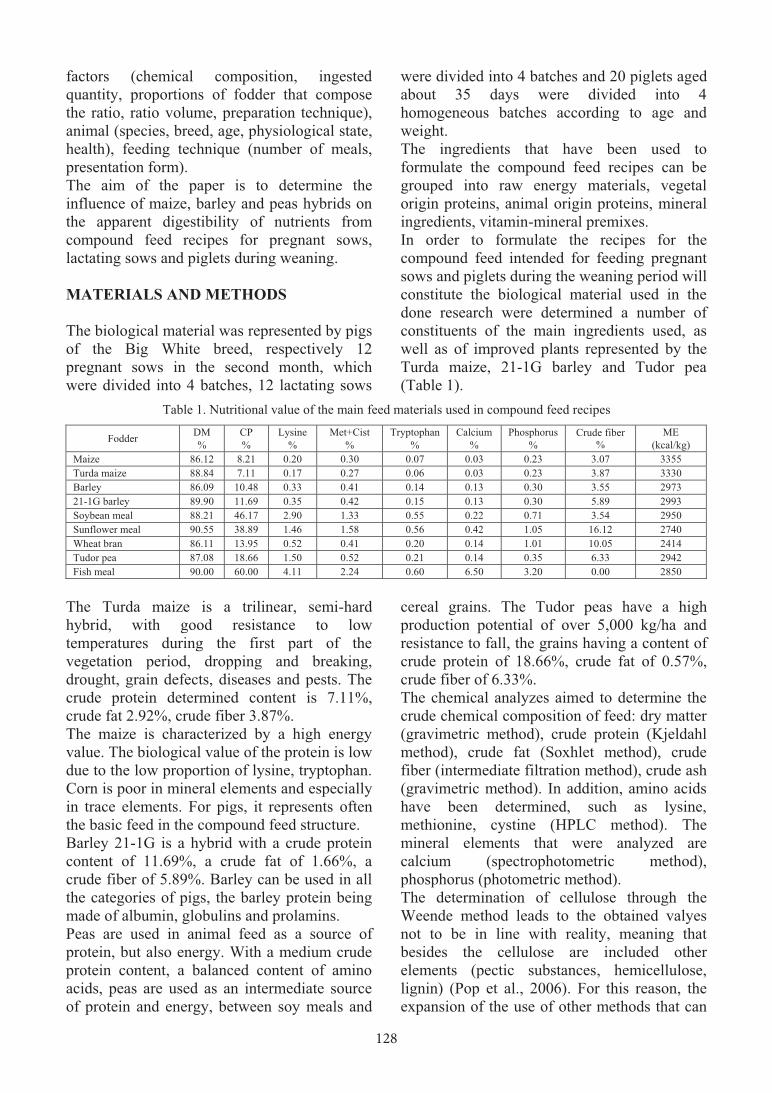
128
factors (chemical composition, ingested quantity, proportions of fodder that compose the ratio, ratio volume, preparation technique), animal (species, breed, age, physiological state, health), feeding technique (number of meals, presentation form). The aim of the paper is to determine the influence of maize, barley and peas hybrids on the apparent digestibility of nutrients from compound feed recipes for pregnant sows, lactating sows and piglets during weaning. MATERIALS AND METHODS The biological material was represented by pigs of the Big White breed, respectively 12 pregnant sows in the second month, which were divided into 4 batches, 12 lactating sows
were divided into 4 batches and 20 piglets aged about 35 days were divided into 4 homogeneous batches according to age and weight. The ingredients that have been used to formulate the compound feed recipes can be grouped into raw energy materials, vegetal origin proteins, animal origin proteins, mineral ingredients, vitamin-mineral premixes. In order to formulate the recipes for the compound feed intended for feeding pregnant sows and piglets during the weaning period will constitute the biological material used in the done research were determined a number of constituents of the main ingredients used, as well as of improved plants represented by the Turda maize, 21-1G barley and Tudor pea (Table 1).
Table 1. Nutritional value of the main feed materials used in compound feed recipes
Fodder DM %
CP %
Lysine %
Met+Cist %
Tryptophan %
Calcium %
Phosphorus %
Crude fiber %
ME (kcal/kg)
Maize 86.12 8.21 0.20 0.30 0.07 0.03 0.23 3.07 3355 Turda maize 88.84 7.11 0.17 0.27 0.06 0.03 0.23 3.87 3330 Barley 86.09 10.48 0.33 0.41 0.14 0.13 0.30 3.55 2973 21-1G barley 89.90 11.69 0.35 0.42 0.15 0.13 0.30 5.89 2993 Soybean meal 88.21 46.17 2.90 1.33 0.55 0.22 0.71 3.54 2950 Sunflower meal 90.55 38.89 1.46 1.58 0.56 0.42 1.05 16.12 2740 Wheat bran 86.11 13.95 0.52 0.41 0.20 0.14 1.01 10.05 2414 Tudor pea 87.08 18.66 1.50 0.52 0.21 0.14 0.35 6.33 2942 Fish meal 90.00 60.00 4.11 2.24 0.60 6.50 3.20 0.00 2850
The Turda maize is a trilinear, semi-hard hybrid, with good resistance to low temperatures during the first part of the vegetation period, dropping and breaking, drought, grain defects, diseases and pests. The crude protein determined content is 7.11%, crude fat 2.92%, crude fiber 3.87%. The maize is characterized by a high energy value. The biological value of the protein is low due to the low proportion of lysine, tryptophan. Corn is poor in mineral elements and especially in trace elements. For pigs, it represents often the basic feed in the compound feed structure. Barley 21-1G is a hybrid with a crude protein content of 11.69%, a crude fat of 1.66%, a crude fiber of 5.89%. Barley can be used in all the categories of pigs, the barley protein being made of albumin, globulins and prolamins. Peas are used in animal feed as a source of protein, but also energy. With a medium crude protein content, a balanced content of amino acids, peas are used as an intermediate source of protein and energy, between soy meals and
cereal grains. The Tudor peas have a high production potential of over 5,000 kg/ha and resistance to fall, the grains having a content of crude protein of 18.66%, crude fat of 0.57%, crude fiber of 6.33%. The chemical analyzes aimed to determine the crude chemical composition of feed: dry matter (gravimetric method), crude protein (Kjeldahl method), crude fat (Soxhlet method), crude fiber (intermediate filtration method), crude ash (gravimetric method). In addition, amino acids have been determined, such as lysine, methionine, cystine (HPLC method). The mineral elements that were analyzed are calcium (spectrophotometric method), phosphorus (photometric method). The determination of cellulose through the Weende method leads to the obtained valyes not to be in line with reality, meaning that besides the cellulose are included other elements (pectic substances, hemicellulose, lignin) (Pop et al., 2006). For this reason, the expansion of the use of other methods that can
separate cellulose from other components, such as the method proposed by Van Soest, which determines the acid detergent fiber (ADF), which is cellulose and lignin from a fodder, and neutral detergent fiber (NDF), which contains in its composition cellulose, hemicellulose and lignin from fodder.
Table 2. Content in ADF and NDF of tested feeds
Fodder ADF (% from DM)
NDF (% from DM)
Maize 2.98 7.85 Turda maize 3.11 8.54 Barley 2.84 7.93 21-1G barley 4.36 11.71 Soybean meal 7.58 12.01 Sunflower meal 15.03 39.25 Wheat bran 14.21 30.17 Tudor pea 6.25 14.59
Close results are presented by Sauvant et al. (2002) in the research undertaken. The digestibility of the compound feed was determined in the simple in vivo experiments that involved the determination of ingested and faecal quantities. By doing the difference, the digested quantity for each nutrient is obtained (Drăgotoiu, 2014). The tested foods were provided in appropriate quantities for the entire experimental period, and optimum storage conditions were maintained to maintain the chemical composition and nutrition value unchanged. The spaces in which the animals were housed have made it possible to accurately measure the amounts of daily feed consumed, the possible food remainings, the faeces removed. The digestibility experiments had a duration of 17 days and included 2 periods, respectively one preparatory (7 days) and one for control (10 days). During the preparatory period, the batches of the animals are to be organized as homogeneously as possible, dewormed and dehilminise, as well as the health and behavior of the animals are monitored. Moreover, it is aimed to habituate animals to the experimental fodder, it is determined the amount of ration to be administered during the control period (in principle the ration must be consumed entirety), and ensure the removal of undigested residues from the food previously administered, so that the faeces produced effectively to represent the undigested parts of the tested feed (Pop, 2006).
During the control period, the amount of feed administered daily to the animals is registered, and are weighted after each and every meed, the eventual unspent food scraps, as well as the faeces produced. From food and faeces are taken samples to perform chemical analyzes. For the analyzed constituent nutrients of the compound feed, the apparent digestibility coefficients (aDC) were calculated according to the formula:
aDC(%)= Ingested substance - Faeces substance x 100 Ingested substance
The recipes of the compound feed have been developed for the three swine categories, namely pregnant sows in lactation and piglets aged about 35 days. The recipes are similar in terms of energy content, crude protein, amino acids, lysine, methionine + cystine, macroelements (Ca and P), crude fiber. The compound feeds have been formulated to meet the nutritional requirements of animals (Drăgotoiu et al., 2014). The variables from the compound feed formulations were represented by the breeded plants included in the recipes, namely the Turda maize, 21-1G barley and Tudor peas (Tables 3, 4, 5).
Table 3. Recipes of compound feed intended for pregnant sows used during the experimental period
Specification Compound feed recipes
C E1 E2 E3 Maize 50.00 0.00 50.00 40.40 Turda maize 0.00 50.00 0.00 0.00 Barley 20.00 10.00 0.00 20.20 21-1G Barley 0.00 0.00 20.00 0.00 Tudor peas 0.00 0.00 0.00 12.00 Soya meal 0,00 3.00 0.00 0.00 Sunflower meal 17.50 14.50 16.50 13.00 Wheat bran 8.00 18.00 9.00 10.50 L-lysine 0.18 0.14 0.18 0.04 Carbonate calcium 1.82 1.80 1.82 1.61 Dicalcium phosphate
1.50 1.52 1.50 1.45
Vitamino-mineral premix
0.50 0.50 0.50 0.50
Salt 0.50 0.50 0.50 0.50 Total 100.00 100.00 100.00 100.00
Recipes parameters Metabolisable energy (kcal/kg)
2944 2883 2945 2913
Crude protein (%) 14.12 14.13 14.11 14.17 Lysine (%) 0.60 0.62 0.59 0.60 Methion.+cyst. (%) 0.54 0.52 0.53 0.51 Calcium (%) 1.17 1.17 1.17 1.08 Phosphorus (%) 0.72 0.78 0.72 0.70 Crude fiber (%) 5.87 6.54 6.28 5.86
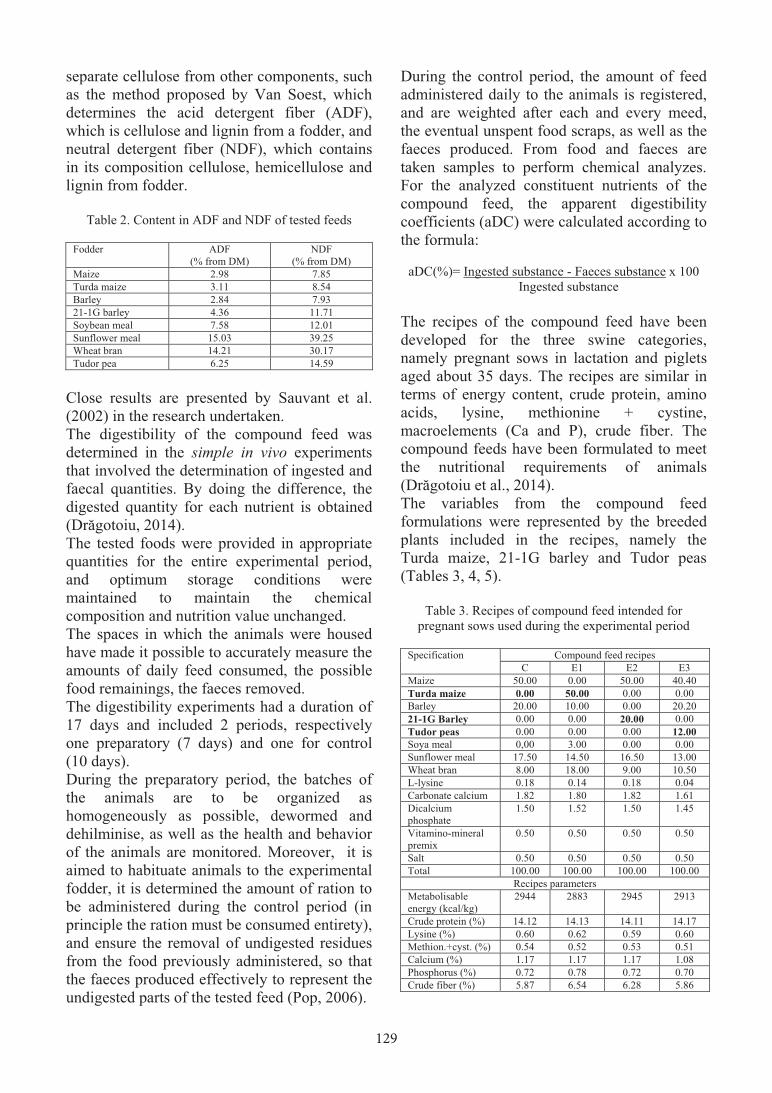
129
factors (chemical composition, ingested quantity, proportions of fodder that compose the ratio, ratio volume, preparation technique), animal (species, breed, age, physiological state, health), feeding technique (number of meals, presentation form). The aim of the paper is to determine the influence of maize, barley and peas hybrids on the apparent digestibility of nutrients from compound feed recipes for pregnant sows, lactating sows and piglets during weaning. MATERIALS AND METHODS The biological material was represented by pigs of the Big White breed, respectively 12 pregnant sows in the second month, which were divided into 4 batches, 12 lactating sows
were divided into 4 batches and 20 piglets aged about 35 days were divided into 4 homogeneous batches according to age and weight. The ingredients that have been used to formulate the compound feed recipes can be grouped into raw energy materials, vegetal origin proteins, animal origin proteins, mineral ingredients, vitamin-mineral premixes. In order to formulate the recipes for the compound feed intended for feeding pregnant sows and piglets during the weaning period will constitute the biological material used in the done research were determined a number of constituents of the main ingredients used, as well as of improved plants represented by the Turda maize, 21-1G barley and Tudor pea (Table 1).
Table 1. Nutritional value of the main feed materials used in compound feed recipes
Fodder DM %
CP %
Lysine %
Met+Cist %
Tryptophan %
Calcium %
Phosphorus %
Crude fiber %
ME (kcal/kg)
Maize 86.12 8.21 0.20 0.30 0.07 0.03 0.23 3.07 3355 Turda maize 88.84 7.11 0.17 0.27 0.06 0.03 0.23 3.87 3330 Barley 86.09 10.48 0.33 0.41 0.14 0.13 0.30 3.55 2973 21-1G barley 89.90 11.69 0.35 0.42 0.15 0.13 0.30 5.89 2993 Soybean meal 88.21 46.17 2.90 1.33 0.55 0.22 0.71 3.54 2950 Sunflower meal 90.55 38.89 1.46 1.58 0.56 0.42 1.05 16.12 2740 Wheat bran 86.11 13.95 0.52 0.41 0.20 0.14 1.01 10.05 2414 Tudor pea 87.08 18.66 1.50 0.52 0.21 0.14 0.35 6.33 2942 Fish meal 90.00 60.00 4.11 2.24 0.60 6.50 3.20 0.00 2850
The Turda maize is a trilinear, semi-hard hybrid, with good resistance to low temperatures during the first part of the vegetation period, dropping and breaking, drought, grain defects, diseases and pests. The crude protein determined content is 7.11%, crude fat 2.92%, crude fiber 3.87%. The maize is characterized by a high energy value. The biological value of the protein is low due to the low proportion of lysine, tryptophan. Corn is poor in mineral elements and especially in trace elements. For pigs, it represents often the basic feed in the compound feed structure. Barley 21-1G is a hybrid with a crude protein content of 11.69%, a crude fat of 1.66%, a crude fiber of 5.89%. Barley can be used in all the categories of pigs, the barley protein being made of albumin, globulins and prolamins. Peas are used in animal feed as a source of protein, but also energy. With a medium crude protein content, a balanced content of amino acids, peas are used as an intermediate source of protein and energy, between soy meals and
cereal grains. The Tudor peas have a high production potential of over 5,000 kg/ha and resistance to fall, the grains having a content of crude protein of 18.66%, crude fat of 0.57%, crude fiber of 6.33%. The chemical analyzes aimed to determine the crude chemical composition of feed: dry matter (gravimetric method), crude protein (Kjeldahl method), crude fat (Soxhlet method), crude fiber (intermediate filtration method), crude ash (gravimetric method). In addition, amino acids have been determined, such as lysine, methionine, cystine (HPLC method). The mineral elements that were analyzed are calcium (spectrophotometric method), phosphorus (photometric method). The determination of cellulose through the Weende method leads to the obtained valyes not to be in line with reality, meaning that besides the cellulose are included other elements (pectic substances, hemicellulose, lignin) (Pop et al., 2006). For this reason, the expansion of the use of other methods that can
separate cellulose from other components, such as the method proposed by Van Soest, which determines the acid detergent fiber (ADF), which is cellulose and lignin from a fodder, and neutral detergent fiber (NDF), which contains in its composition cellulose, hemicellulose and lignin from fodder.
Table 2. Content in ADF and NDF of tested feeds
Fodder ADF (% from DM)
NDF (% from DM)
Maize 2.98 7.85 Turda maize 3.11 8.54 Barley 2.84 7.93 21-1G barley 4.36 11.71 Soybean meal 7.58 12.01 Sunflower meal 15.03 39.25 Wheat bran 14.21 30.17 Tudor pea 6.25 14.59
Close results are presented by Sauvant et al. (2002) in the research undertaken. The digestibility of the compound feed was determined in the simple in vivo experiments that involved the determination of ingested and faecal quantities. By doing the difference, the digested quantity for each nutrient is obtained (Drăgotoiu, 2014). The tested foods were provided in appropriate quantities for the entire experimental period, and optimum storage conditions were maintained to maintain the chemical composition and nutrition value unchanged. The spaces in which the animals were housed have made it possible to accurately measure the amounts of daily feed consumed, the possible food remainings, the faeces removed. The digestibility experiments had a duration of 17 days and included 2 periods, respectively one preparatory (7 days) and one for control (10 days). During the preparatory period, the batches of the animals are to be organized as homogeneously as possible, dewormed and dehilminise, as well as the health and behavior of the animals are monitored. Moreover, it is aimed to habituate animals to the experimental fodder, it is determined the amount of ration to be administered during the control period (in principle the ration must be consumed entirety), and ensure the removal of undigested residues from the food previously administered, so that the faeces produced effectively to represent the undigested parts of the tested feed (Pop, 2006).
During the control period, the amount of feed administered daily to the animals is registered, and are weighted after each and every meed, the eventual unspent food scraps, as well as the faeces produced. From food and faeces are taken samples to perform chemical analyzes. For the analyzed constituent nutrients of the compound feed, the apparent digestibility coefficients (aDC) were calculated according to the formula:
aDC(%)= Ingested substance - Faeces substance x 100 Ingested substance
The recipes of the compound feed have been developed for the three swine categories, namely pregnant sows in lactation and piglets aged about 35 days. The recipes are similar in terms of energy content, crude protein, amino acids, lysine, methionine + cystine, macroelements (Ca and P), crude fiber. The compound feeds have been formulated to meet the nutritional requirements of animals (Drăgotoiu et al., 2014). The variables from the compound feed formulations were represented by the breeded plants included in the recipes, namely the Turda maize, 21-1G barley and Tudor peas (Tables 3, 4, 5).
Table 3. Recipes of compound feed intended for pregnant sows used during the experimental period
Specification Compound feed recipes
C E1 E2 E3 Maize 50.00 0.00 50.00 40.40 Turda maize 0.00 50.00 0.00 0.00 Barley 20.00 10.00 0.00 20.20 21-1G Barley 0.00 0.00 20.00 0.00 Tudor peas 0.00 0.00 0.00 12.00 Soya meal 0,00 3.00 0.00 0.00 Sunflower meal 17.50 14.50 16.50 13.00 Wheat bran 8.00 18.00 9.00 10.50 L-lysine 0.18 0.14 0.18 0.04 Carbonate calcium 1.82 1.80 1.82 1.61 Dicalcium phosphate
1.50 1.52 1.50 1.45
Vitamino-mineral premix
0.50 0.50 0.50 0.50
Salt 0.50 0.50 0.50 0.50 Total 100.00 100.00 100.00 100.00
Recipes parameters Metabolisable energy (kcal/kg)
2944 2883 2945 2913
Crude protein (%) 14.12 14.13 14.11 14.17 Lysine (%) 0.60 0.62 0.59 0.60 Methion.+cyst. (%) 0.54 0.52 0.53 0.51 Calcium (%) 1.17 1.17 1.17 1.08 Phosphorus (%) 0.72 0.78 0.72 0.70 Crude fiber (%) 5.87 6.54 6.28 5.86

130
Table 4. Recipes of compound feed for lactating sows
used during the experimental period
Specification Compound feed recipes C E1 E2 E3
Maize 62.00 0.00 62.00 58.00 Turda maize 0.00 62.00 0.00 0.00 Barley 10.00 8.00 0.00 7.50 21-1G Barley 0.00 0.00 10.00 0.00 Tudor peas 0.00 0.00 0.00 12.00 Soya meal 15.50 17.50 15.50 13.00 Wheat bran 3.00 3.00 3.00 0.00 Fish meal 6.00 6.00 6.00 6.00 L-lysine 0.18 0.13 0.13 0.09 Carbonate calcium 0.80 0.80 0.80 0.81 Dicalcium phosphate
1.52 1.57 1.57 1.81
Vitamino-mineral premix
0.50 0.50 0.50 0.50
Salt 0.50 0.50 0.50 0.50 Total 100.00 100.00 100.00 100.00
Recipes parameters Metabolisable energy (kcal/kg)
3078 3062 3080 3076
Crude protein (%) 17.31 17.34 17.43 17.39
Lysine (%) 1.01 1.00 1.01 1.01
Methionine+cystine (%)
0.58 0.58 0.58 0.57
Calcium (%) 1.13 1.14 1.13 1.12
Phosphorus (%) 0.79 0.80 0.79 0.81
Crude fiber (%) 3.11 3.60 3.34 3.26
Table 5. Recipes of compound feed for piglets used
during the experimental period
Specification Compound feed recipes C E1 E2 E3
Maize 62.00 0.00 62.00 60.00 Turda maize 0.00 62.00 0.00 0.00 Barley 10.00 8.00 0.00 3.00 21-1G Barley 0.00 0.00 10.00 0.00 Tudor peas 0.00 0.00 0.00 12.00 Soya meal 15.50 17.50 15.50 12.50 Fish meal 8.00 8.00 8.00 8.00 Vegetal oil 1.70 1.70 1.70 1.70 L-lysine 0.27 0.25 0.27 0.21 DL-methionine 0.10 0.10 0.10 0.10 Dicalcium phosphate
1.13 1.15 1.13 1.19
Vitamino-mineral premix
1.00 1.00 1.00 1.00
Salt 0.30 0.30 0.30 0.30 Total 100.00 100.00 100.00 100.00
Recipes parameters Metabolisable energy (kcal/kg)
3205 3189 3207 3195
Crude protein (%) 18.09 18.13 18.21 18.05
Lysine (%) 1.15 1.17 1.17 1.17
Methionine+cystine (%)
0.70 0.70 0.70 0.71
Calcium (%) 0.86 0.86 0.86 0.87
Phosphorus (%) 0.75 0.76 0.75 0.75
Crude fiber (%) 2.81 3.30 3.04 3.15
The results obtained have been statistically tested using the Student test to prove the differences between the environments.
RESULTS AND DISCUSSIONS Following the performed digestibility experiments on the three swine categories, the digestibility coefficients were obtained for the 12 types of compound feed recipes (Table 6). Table 6. Apparent digestibility of organic substances in
the compound feed recipes for pigs
Compound feed Apparent digestibility (%) PB GB CB
For pregnant sows Control recipe 83.3
+9.12 64.0
+8.53 35.7
+4.12 E1 recipe 83.1
+8.12 63.5
+7.39 33.8
+7.22 E2 recipe 85.1
+8.55 63.1
+9.12 32.8
+5.44 E3 recipe 82.9
+7.69 63.8
+6.06 35.4
+5.96 For lactating sows Control recipe 88.3
+7.14 62.8
+5.14 38.9
+5.12 E1 recipe 85.2
+8.03 63.5
+7.22 37.7
+6.03 E2 recipe 86.4
+8.54 62.9
+6.45 37.0
+4.38 E3 recipe 87.7
+6.67 63.5
+7.87 38.5
+4.14 For piglets Control recipe 83.3
+7.83 60.4
+5.27 33.6
+3.77 E1 recipe 80.4
+8.42 58.2
+4.69 30.4
+5.32 E2 recipe 82.4
+7.26 61.4
+7.17 31.8
+4.46 E3 recipe 81.1
+7.54 59.6
+4.95 32.4
+3.69
For pregnant sows, if the variable in the compound feed recipe was Tudor maize (Table 3), soybean meal was added in combination with the one of sunflower for balancing the protein from recipes. If in the compound feed recipe was added the 21-1G barley, which replaced the barley, the nutritional balancing of the experimental recipes to the control was made by modifying the proportion of sunflower grain and wheat bran participation. By introducing Tudor pea into the compound feed recipe, it was required an adjustment of the share of maize (a decrease of 9.60%), a reduction in the proportion of vegetable protein feed (sunflower meal and wheat bran), and the reduction of synthetic lysine (from 0.18% at the control recipe to 0.04% at E3). It is also noted that the use of 21-2G barley improved the apparent digestibility of crude protein over other recipes, with significant differences (Table 6). The digestibility of the crude fat did not show significant differences between batches, varying between 63.1% and
64%, while the digestibility of the fiber registered the lowest value in the case of the 21-1G barley (32.8%), the differences being significant compared to the control batch and E3. For lactating sows, the compound feed recipes in which the Turda maize was used (Table 4) to replace the maize with a protein content of 8.21% required a protein balance by increasing the share of soybean meal by 2% at the E1 batch, in parallel with the reduction of L-lysine addition from 0.18% (at the control batch) to 0.13% (at E1). The recipe in which the barley was replaced with the 21-1G barley did not require adjustments to balance nutritional parameters. In the compound feed recipe with added Tudor peas, for the formulation of isocaloric and isoproteic recipes, no wheat bran was introduced, the proportion of participation was reduced compared to the control batch for maize by 4%, for barley by 2.50%, for soybean meal by 1.50%. Regarding the apparent digestibility of the analyzed organic substances (Table 6), it was observed a diminution of the crude protein digestibility coefficient for the batch where the 21-1G barley was used due to the higher proportion of the crude fiber. The structure of compound feed recipes for piglets during the weaning period, as well as their quality indexes were appropriate for the age category by respecting the nutritional requirements (Table 5). In order to ensure a protein level of 18.05-18.21% CP and energy level of 3189-3207 kcal ME/kg, in the case of use of Turda maize in recipes, it was necessary to reduce the participation proportion of barley by 2% (E1) and increase the participation of the soybean meal by 2% in the experimental recipe compared to the control. In the case of replacing the barley with the 21-1G barley in the compound feed recipe for piglets, the proportions of ingredients have not changed since the parameters of the recipes have been kept within the limits recommended for this category. The compound feed recipe in which the Tudor pea was introduced to ensure the nutritional balance of the piglets required a reduction in the proportion of maize by 2%, of barley by 7%, of soybean meal by 3%, as well as for the addition of synthetic lysine by 0.06%.
The apparent digestibility of the crude protein (Table 6) showed diminished values while using the Tudor maize due to an increase in the crude fiber of the compound feed recipe, situation which was maintained in the case of crude fat and brute fiber. Close results have been obtained by Lowell et al. (2015), who introduced in the compound feed recipes corn, wheat, sorghum, and combinations of corn and soybean meal, canola meal, distillers dried grains, corn germ meal, corn bran, wheat middlings, and soybean hulls. The results of this research indicate that the apparent digestibility values of CP and GE obtained in gestating sows are greater than the values obtained in growing pigs, but apparently the digestibility of the fiber obtained in growing pigs is not different from the digestibilities in gestating sows. Differences of apparent digestibility between adult and young swine have been observed by Le Goff and Noblet (2001), Guilloteau et al. (2010), Hanczakowska si Świątkiewicz (2014), because the older animals have better developed digestive tract and thus can digest fibre more efficiently. CONCLUSIONS For the efficient use of feeds both in terms of quality and quantity (improved performance), several aspects need to be combined, respectively the compound feed recipes should be balanced in terms of nutritional principles. The compound feed recipes must incorporate all the categories of raw materials to give them added value, enabling them to improve the quality of the products obtained. The weight of inclusion of the improved raw material should be optimal for the structure formulated by the compound feed according to the nutritional recommendations specific to the animal species, age category etc. The apparent chemical digestibility differences of the analyzed organic substances (crude protein, crude fat, crude fiber) were influenced by the chemical composition of the feeds used, namely Turda maize, 21-1G barley and Tudor peas that were introduced into the compound feed recipes, the determinant being the crude fiber content.
131
Table 4. Recipes of compound feed for lactating sows
used during the experimental period
Specification Compound feed recipes C E1 E2 E3
Maize 62.00 0.00 62.00 58.00 Turda maize 0.00 62.00 0.00 0.00 Barley 10.00 8.00 0.00 7.50 21-1G Barley 0.00 0.00 10.00 0.00 Tudor peas 0.00 0.00 0.00 12.00 Soya meal 15.50 17.50 15.50 13.00 Wheat bran 3.00 3.00 3.00 0.00 Fish meal 6.00 6.00 6.00 6.00 L-lysine 0.18 0.13 0.13 0.09 Carbonate calcium 0.80 0.80 0.80 0.81 Dicalcium phosphate
1.52 1.57 1.57 1.81
Vitamino-mineral premix
0.50 0.50 0.50 0.50
Salt 0.50 0.50 0.50 0.50 Total 100.00 100.00 100.00 100.00
Recipes parameters Metabolisable energy (kcal/kg)
3078 3062 3080 3076
Crude protein (%) 17.31 17.34 17.43 17.39
Lysine (%) 1.01 1.00 1.01 1.01
Methionine+cystine (%)
0.58 0.58 0.58 0.57
Calcium (%) 1.13 1.14 1.13 1.12
Phosphorus (%) 0.79 0.80 0.79 0.81
Crude fiber (%) 3.11 3.60 3.34 3.26
Table 5. Recipes of compound feed for piglets used
during the experimental period
Specification Compound feed recipes C E1 E2 E3
Maize 62.00 0.00 62.00 60.00 Turda maize 0.00 62.00 0.00 0.00 Barley 10.00 8.00 0.00 3.00 21-1G Barley 0.00 0.00 10.00 0.00 Tudor peas 0.00 0.00 0.00 12.00 Soya meal 15.50 17.50 15.50 12.50 Fish meal 8.00 8.00 8.00 8.00 Vegetal oil 1.70 1.70 1.70 1.70 L-lysine 0.27 0.25 0.27 0.21 DL-methionine 0.10 0.10 0.10 0.10 Dicalcium phosphate
1.13 1.15 1.13 1.19
Vitamino-mineral premix
1.00 1.00 1.00 1.00
Salt 0.30 0.30 0.30 0.30 Total 100.00 100.00 100.00 100.00
Recipes parameters Metabolisable energy (kcal/kg)
3205 3189 3207 3195
Crude protein (%) 18.09 18.13 18.21 18.05
Lysine (%) 1.15 1.17 1.17 1.17
Methionine+cystine (%)
0.70 0.70 0.70 0.71
Calcium (%) 0.86 0.86 0.86 0.87
Phosphorus (%) 0.75 0.76 0.75 0.75
Crude fiber (%) 2.81 3.30 3.04 3.15
The results obtained have been statistically tested using the Student test to prove the differences between the environments.
RESULTS AND DISCUSSIONS Following the performed digestibility experiments on the three swine categories, the digestibility coefficients were obtained for the 12 types of compound feed recipes (Table 6). Table 6. Apparent digestibility of organic substances in
the compound feed recipes for pigs
Compound feed Apparent digestibility (%) PB GB CB
For pregnant sows Control recipe 83.3
+9.12 64.0
+8.53 35.7
+4.12 E1 recipe 83.1
+8.12 63.5
+7.39 33.8
+7.22 E2 recipe 85.1
+8.55 63.1
+9.12 32.8
+5.44 E3 recipe 82.9
+7.69 63.8
+6.06 35.4
+5.96 For lactating sows Control recipe 88.3
+7.14 62.8
+5.14 38.9
+5.12 E1 recipe 85.2
+8.03 63.5
+7.22 37.7
+6.03 E2 recipe 86.4
+8.54 62.9
+6.45 37.0
+4.38 E3 recipe 87.7
+6.67 63.5
+7.87 38.5
+4.14 For piglets Control recipe 83.3
+7.83 60.4
+5.27 33.6
+3.77 E1 recipe 80.4
+8.42 58.2
+4.69 30.4
+5.32 E2 recipe 82.4
+7.26 61.4
+7.17 31.8
+4.46 E3 recipe 81.1
+7.54 59.6
+4.95 32.4
+3.69
For pregnant sows, if the variable in the compound feed recipe was Tudor maize (Table 3), soybean meal was added in combination with the one of sunflower for balancing the protein from recipes. If in the compound feed recipe was added the 21-1G barley, which replaced the barley, the nutritional balancing of the experimental recipes to the control was made by modifying the proportion of sunflower grain and wheat bran participation. By introducing Tudor pea into the compound feed recipe, it was required an adjustment of the share of maize (a decrease of 9.60%), a reduction in the proportion of vegetable protein feed (sunflower meal and wheat bran), and the reduction of synthetic lysine (from 0.18% at the control recipe to 0.04% at E3). It is also noted that the use of 21-2G barley improved the apparent digestibility of crude protein over other recipes, with significant differences (Table 6). The digestibility of the crude fat did not show significant differences between batches, varying between 63.1% and
64%, while the digestibility of the fiber registered the lowest value in the case of the 21-1G barley (32.8%), the differences being significant compared to the control batch and E3. For lactating sows, the compound feed recipes in which the Turda maize was used (Table 4) to replace the maize with a protein content of 8.21% required a protein balance by increasing the share of soybean meal by 2% at the E1 batch, in parallel with the reduction of L-lysine addition from 0.18% (at the control batch) to 0.13% (at E1). The recipe in which the barley was replaced with the 21-1G barley did not require adjustments to balance nutritional parameters. In the compound feed recipe with added Tudor peas, for the formulation of isocaloric and isoproteic recipes, no wheat bran was introduced, the proportion of participation was reduced compared to the control batch for maize by 4%, for barley by 2.50%, for soybean meal by 1.50%. Regarding the apparent digestibility of the analyzed organic substances (Table 6), it was observed a diminution of the crude protein digestibility coefficient for the batch where the 21-1G barley was used due to the higher proportion of the crude fiber. The structure of compound feed recipes for piglets during the weaning period, as well as their quality indexes were appropriate for the age category by respecting the nutritional requirements (Table 5). In order to ensure a protein level of 18.05-18.21% CP and energy level of 3189-3207 kcal ME/kg, in the case of use of Turda maize in recipes, it was necessary to reduce the participation proportion of barley by 2% (E1) and increase the participation of the soybean meal by 2% in the experimental recipe compared to the control. In the case of replacing the barley with the 21-1G barley in the compound feed recipe for piglets, the proportions of ingredients have not changed since the parameters of the recipes have been kept within the limits recommended for this category. The compound feed recipe in which the Tudor pea was introduced to ensure the nutritional balance of the piglets required a reduction in the proportion of maize by 2%, of barley by 7%, of soybean meal by 3%, as well as for the addition of synthetic lysine by 0.06%.
The apparent digestibility of the crude protein (Table 6) showed diminished values while using the Tudor maize due to an increase in the crude fiber of the compound feed recipe, situation which was maintained in the case of crude fat and brute fiber. Close results have been obtained by Lowell et al. (2015), who introduced in the compound feed recipes corn, wheat, sorghum, and combinations of corn and soybean meal, canola meal, distillers dried grains, corn germ meal, corn bran, wheat middlings, and soybean hulls. The results of this research indicate that the apparent digestibility values of CP and GE obtained in gestating sows are greater than the values obtained in growing pigs, but apparently the digestibility of the fiber obtained in growing pigs is not different from the digestibilities in gestating sows. Differences of apparent digestibility between adult and young swine have been observed by Le Goff and Noblet (2001), Guilloteau et al. (2010), Hanczakowska si Świątkiewicz (2014), because the older animals have better developed digestive tract and thus can digest fibre more efficiently. CONCLUSIONS For the efficient use of feeds both in terms of quality and quantity (improved performance), several aspects need to be combined, respectively the compound feed recipes should be balanced in terms of nutritional principles. The compound feed recipes must incorporate all the categories of raw materials to give them added value, enabling them to improve the quality of the products obtained. The weight of inclusion of the improved raw material should be optimal for the structure formulated by the compound feed according to the nutritional recommendations specific to the animal species, age category etc. The apparent chemical digestibility differences of the analyzed organic substances (crude protein, crude fat, crude fiber) were influenced by the chemical composition of the feeds used, namely Turda maize, 21-1G barley and Tudor peas that were introduced into the compound feed recipes, the determinant being the crude fiber content.

132
EARTH OBSERVATION SATELLITE DATA IN SUPPORT
OFWATER MANAGEMENT FOR AGRICULTURE
Iulia Dana NEGULA1,2, Alexandru BADEA1, Cristian MOISE1,2, Violeta POENARU1,2
1Romanian Space Agency, Mendeleev Street No. 21-25, District 1, Bucharest, Romania
2University of Agronomic Sciences and Veterinary Medicine of Bucharest, 59 Marasti Blvd., District 1, Bucharest, Romania
Corresponding author email: [email protected]
Abstract The Earth Observation (EO) satellite data provided within the Copernicus Programme supports the monitoring and sustainable management of agriculture. For example, satellite data are useful for agriculture mapping, crop health monitoring, land planning, disease mitigation, crop yields estimation, precise agriculture, and sustainable irrigation water management. The identification of non-authorised water abstractions for irrigation is of high importance since the drought phenomenon is increasingly in the past decades due to climate change. This aspect is addressed by DIANA – “Detection and Integrated Assessment of Non-authorised water Abstractions using EO", a project funded by the European Commission in the frame of H2020 (European Union Framework Programme for Research and Innovation). The project will integrate data acquired by the Sentinel missions (Sentinel-1, Sentinel-2 and Sentinel-3) and as well Landsat and MODIS. Other types of data (meteorological, land use/land cover, digital elevation models, soil, etc.) will support the satellite data processing and the generation of value-added products. In addition, the project aims at significantly improve the monitoring and assessment of the water management policies and practices. As the project is in its initial phase, the results presented in this article are preliminary. The project will demonstrate the relevance of EO data for sustainable agriculture management and will bring societal and environmental benefits to the end users. Key words: Earth Observation satellite data, agriculture, water management, DIANA project, Copernicus Programme. INTRODUCTION Today, Earth Observation (EO) satellite imagery represents an invaluable source of information that enables the assessment and monitoring of certain natural phenomena or anthropogenic processes on our planet. With more than forty-five years of continuous satellite acquisitions, evolution trends can be identified, thus the implementation of coherent and informed agricultural and environmental management programmes can be achieved based on a consistent background. Extensive scientific research has been conducted to extract meaningful information from long-term series of satellite data acquired by different remote sensing sensors in terms of imaging systems and resolution. But the transition from scientific research to operational services is of utmost importance. EO satellite data are increasingly exploited for operational agricultural services, covering a wide range of topics such as parcel and crop identification, crop growth and health monitoring and assessment, yield estimation and prediction,
fertilization and pest management, land use and land cover change detection, soil mapping, water resources management, policy monitoring and control, etc. Hence, EO satellite imagery plays an important role in precision agriculture by providing accurate information with high frequency, over wide areas. Likewise, the identification of the irrigated area sand the estimation of the abstracted water volumes using EO satellite data represent a reliable basis for farmers, agronomists and responsible authorities in support of sustainable water management. Moreover, EO satellite imagery is beneficial in identifying the illegally irrigated areas and the non-authorised water abstractions for irrigation considering that it allows a significant reduction of the traditional field inspection costs for the detection and monitoring of the illegal activities. In this context, the Sentinel-1 and Sentinel-2 satellite missions of the Copernicus Programme provide timely and easily accessible information for regular land monitoring. The present study is developed within the H2020 DIANA Project that aims at leveraging the EO Copernicus data
The apparent digestibility of organic substances in the compound feed recipes was further influenced by the age and the physiological state of the swine. ACKNOWLEDGEMENTS This research work was financed from Project ADER 6.1.1./2015 “Nutritional innovative technologies based on the use in animal feed of raw materials recently improved, with implications over the safety and quality of products”. REFERENCES Drăgotoiu D., Pogurschi Elena, Marin Monica, 2014.
Nutriția și alimentația animalelor. Caiet de lucrări practice. Ed. Granada, București.
Gâlcă I., Drăgotoiu D., 2003. Tehnologii de creștere și exploatare a animalelor. Ed. ECA.
Guilloteau P., Zabielski R., Hammon H.M., Metges C.C., 2010. Nutritional programming of gastrointestinal tract development. Is the pig a good model for man? Nutr. Res. Rev., 23, p. 4–22.
Hanczakowska Ewa, Świątkiewicz Małgorzata, 2014. Legume seeds and rapeseed press cake as replacers of soybean meal in feed for fattening pigs. Ann. Anim. Sci., Vol. 14(4): p. 921–934.
Le Goff G., Noblet J., 2001. Comparative digestibility of dietary energy and nutrients in growing pigs and adult sows. J. Anim. Sci., 79, p. 2418-2427.
Lowell Jessica Erin, Liu Y., Stein H.H., 2015. Comparative digestibility of energy and nutrients in diets fed to sows and growing pigs. Arch Anim Nutr., 69(2): p. 79-97.
Marin Monica, Hodoșan Camelia, Nicolae Carmen, Diniță Georgeta, Drăgotoiu Tomița, Nistor Lucica, 2016. Researches regarding the chemical composition and gross energy of sorghum in comparison to other forages for feeding cattle and pigs. Scientific Papers, Series D, Animal Science, Vol. LIX, 95-98, ISSN 2285-5750.
Pop I.M., Halga P., Avarvarei Teona, 2006. Nutriția și alimentația animalelor, Vol. I, II, III. Ed. Tipo Moldova, Iași.
Sauvant D., Perez J.M., Tran G., 2002. Tables de composition et de valeur nutritive des matieres premieres destinees aux animaux d`elevage. In: Porcs, Volailles, Bovines, Ovins, Caprins, Lapins, Chevaux and Poisons, INRA, Versailles.
Șara A., Bențea M., 2011. Alimentația animalelor. Ed. Risoprint, Cluj-Napoca.

133
EARTH OBSERVATION SATELLITE DATA IN SUPPORT
OFWATER MANAGEMENT FOR AGRICULTURE
Iulia Dana NEGULA1,2, Alexandru BADEA1, Cristian MOISE1,2, Violeta POENARU1,2
1Romanian Space Agency, Mendeleev Street No. 21-25, District 1, Bucharest, Romania
2University of Agronomic Sciences and Veterinary Medicine of Bucharest, 59 Marasti Blvd., District 1, Bucharest, Romania
Corresponding author email: [email protected]
Abstract The Earth Observation (EO) satellite data provided within the Copernicus Programme supports the monitoring and sustainable management of agriculture. For example, satellite data are useful for agriculture mapping, crop health monitoring, land planning, disease mitigation, crop yields estimation, precise agriculture, and sustainable irrigation water management. The identification of non-authorised water abstractions for irrigation is of high importance since the drought phenomenon is increasingly in the past decades due to climate change. This aspect is addressed by DIANA – “Detection and Integrated Assessment of Non-authorised water Abstractions using EO", a project funded by the European Commission in the frame of H2020 (European Union Framework Programme for Research and Innovation). The project will integrate data acquired by the Sentinel missions (Sentinel-1, Sentinel-2 and Sentinel-3) and as well Landsat and MODIS. Other types of data (meteorological, land use/land cover, digital elevation models, soil, etc.) will support the satellite data processing and the generation of value-added products. In addition, the project aims at significantly improve the monitoring and assessment of the water management policies and practices. As the project is in its initial phase, the results presented in this article are preliminary. The project will demonstrate the relevance of EO data for sustainable agriculture management and will bring societal and environmental benefits to the end users. Key words: Earth Observation satellite data, agriculture, water management, DIANA project, Copernicus Programme. INTRODUCTION Today, Earth Observation (EO) satellite imagery represents an invaluable source of information that enables the assessment and monitoring of certain natural phenomena or anthropogenic processes on our planet. With more than forty-five years of continuous satellite acquisitions, evolution trends can be identified, thus the implementation of coherent and informed agricultural and environmental management programmes can be achieved based on a consistent background. Extensive scientific research has been conducted to extract meaningful information from long-term series of satellite data acquired by different remote sensing sensors in terms of imaging systems and resolution. But the transition from scientific research to operational services is of utmost importance. EO satellite data are increasingly exploited for operational agricultural services, covering a wide range of topics such as parcel and crop identification, crop growth and health monitoring and assessment, yield estimation and prediction,
fertilization and pest management, land use and land cover change detection, soil mapping, water resources management, policy monitoring and control, etc. Hence, EO satellite imagery plays an important role in precision agriculture by providing accurate information with high frequency, over wide areas. Likewise, the identification of the irrigated area sand the estimation of the abstracted water volumes using EO satellite data represent a reliable basis for farmers, agronomists and responsible authorities in support of sustainable water management. Moreover, EO satellite imagery is beneficial in identifying the illegally irrigated areas and the non-authorised water abstractions for irrigation considering that it allows a significant reduction of the traditional field inspection costs for the detection and monitoring of the illegal activities. In this context, the Sentinel-1 and Sentinel-2 satellite missions of the Copernicus Programme provide timely and easily accessible information for regular land monitoring. The present study is developed within the H2020 DIANA Project that aims at leveraging the EO Copernicus data
The apparent digestibility of organic substances in the compound feed recipes was further influenced by the age and the physiological state of the swine. ACKNOWLEDGEMENTS This research work was financed from Project ADER 6.1.1./2015 “Nutritional innovative technologies based on the use in animal feed of raw materials recently improved, with implications over the safety and quality of products”. REFERENCES Drăgotoiu D., Pogurschi Elena, Marin Monica, 2014.
Nutriția și alimentația animalelor. Caiet de lucrări practice. Ed. Granada, București.
Gâlcă I., Drăgotoiu D., 2003. Tehnologii de creștere și exploatare a animalelor. Ed. ECA.
Guilloteau P., Zabielski R., Hammon H.M., Metges C.C., 2010. Nutritional programming of gastrointestinal tract development. Is the pig a good model for man? Nutr. Res. Rev., 23, p. 4–22.
Hanczakowska Ewa, Świątkiewicz Małgorzata, 2014. Legume seeds and rapeseed press cake as replacers of soybean meal in feed for fattening pigs. Ann. Anim. Sci., Vol. 14(4): p. 921–934.
Le Goff G., Noblet J., 2001. Comparative digestibility of dietary energy and nutrients in growing pigs and adult sows. J. Anim. Sci., 79, p. 2418-2427.
Lowell Jessica Erin, Liu Y., Stein H.H., 2015. Comparative digestibility of energy and nutrients in diets fed to sows and growing pigs. Arch Anim Nutr., 69(2): p. 79-97.
Marin Monica, Hodoșan Camelia, Nicolae Carmen, Diniță Georgeta, Drăgotoiu Tomița, Nistor Lucica, 2016. Researches regarding the chemical composition and gross energy of sorghum in comparison to other forages for feeding cattle and pigs. Scientific Papers, Series D, Animal Science, Vol. LIX, 95-98, ISSN 2285-5750.
Pop I.M., Halga P., Avarvarei Teona, 2006. Nutriția și alimentația animalelor, Vol. I, II, III. Ed. Tipo Moldova, Iași.
Sauvant D., Perez J.M., Tran G., 2002. Tables de composition et de valeur nutritive des matieres premieres destinees aux animaux d`elevage. In: Porcs, Volailles, Bovines, Ovins, Caprins, Lapins, Chevaux and Poisons, INRA, Versailles.
Șara A., Bențea M., 2011. Alimentația animalelor. Ed. Risoprint, Cluj-Napoca.
AgroLife Scientific Journal - Volume 6, Number 2, 2017ISSN 2285-5718; ISSN CD-ROM 2285-5726; ISSN ONLINE 2286-0126; ISSN-L 2285-5718
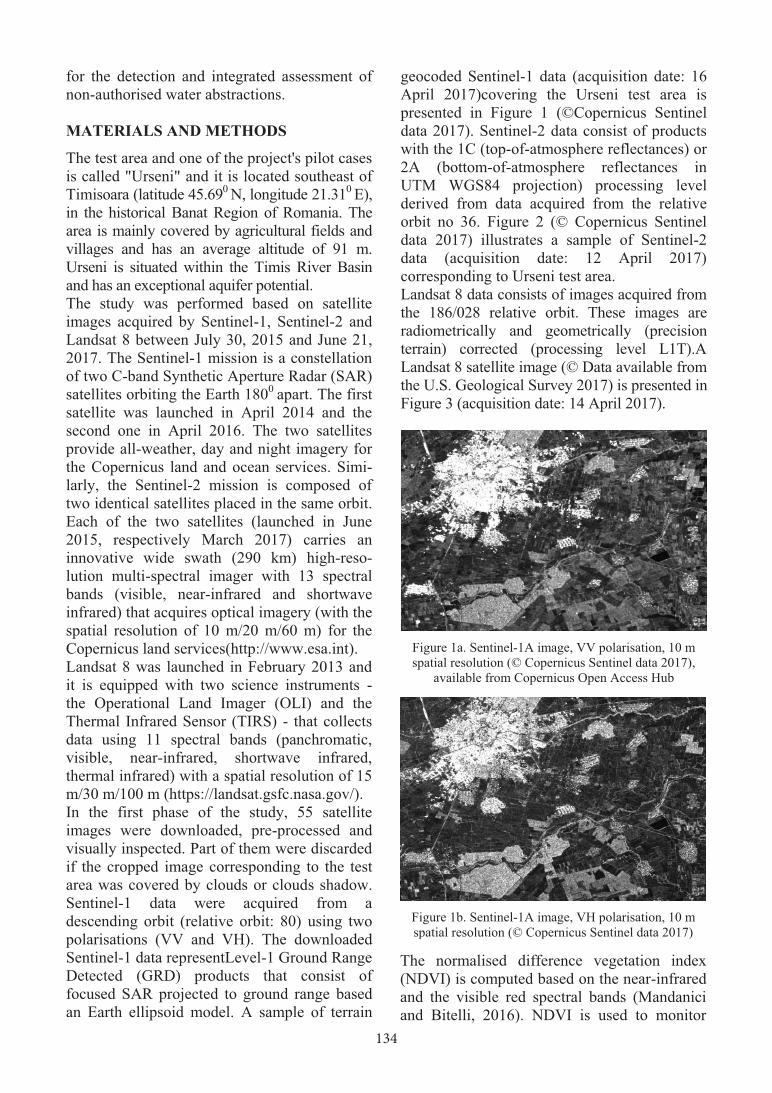
134
for the detection and integrated assessment of non-authorised water abstractions. MATERIALS AND METHODS
The test area and one of the project's pilot cases is called "Urseni" and it is located southeast of Timisoara (latitude 45.690 N, longitude 21.310 E), in the historical Banat Region of Romania. The area is mainly covered by agricultural fields and villages and has an average altitude of 91 m. Urseni is situated within the Timis River Basin and has an exceptional aquifer potential. The study was performed based on satellite images acquired by Sentinel-1, Sentinel-2 and Landsat 8 between July 30, 2015 and June 21, 2017. The Sentinel-1 mission is a constellation of two C-band Synthetic Aperture Radar (SAR) satellites orbiting the Earth 1800 apart. The first satellite was launched in April 2014 and the second one in April 2016. The two satellites provide all-weather, day and night imagery for the Copernicus land and ocean services. Simi-larly, the Sentinel-2 mission is composed of two identical satellites placed in the same orbit. Each of the two satellites (launched in June 2015, respectively March 2017) carries an innovative wide swath (290 km) high-reso-lution multi-spectral imager with 13 spectral bands (visible, near-infrared and shortwave infrared) that acquires optical imagery (with the spatial resolution of 10 m/20 m/60 m) for the Copernicus land services(http://www.esa.int). Landsat 8 was launched in February 2013 and it is equipped with two science instruments - the Operational Land Imager (OLI) and the Thermal Infrared Sensor (TIRS) - that collects data using 11 spectral bands (panchromatic, visible, near-infrared, shortwave infrared, thermal infrared) with a spatial resolution of 15 m/30 m/100 m (https://landsat.gsfc.nasa.gov/). In the first phase of the study, 55 satellite images were downloaded, pre-processed and visually inspected. Part of them were discarded if the cropped image corresponding to the test area was covered by clouds or clouds shadow. Sentinel-1 data were acquired from a descending orbit (relative orbit: 80) using two polarisations (VV and VH). The downloaded Sentinel-1 data representLevel-1 Ground Range Detected (GRD) products that consist of focused SAR projected to ground range based an Earth ellipsoid model. A sample of terrain
geocoded Sentinel-1 data (acquisition date: 16 April 2017)covering the Urseni test area is presented in Figure 1 (©Copernicus Sentinel data 2017). Sentinel-2 data consist of products with the 1C (top-of-atmosphere reflectances) or 2A (bottom-of-atmosphere reflectances in UTM WGS84 projection) processing level derived from data acquired from the relative orbit no 36. Figure 2 (© Copernicus Sentinel data 2017) illustrates a sample of Sentinel-2 data (acquisition date: 12 April 2017) corresponding to Urseni test area. Landsat 8 data consists of images acquired from the 186/028 relative orbit. These images are radiometrically and geometrically (precision terrain) corrected (processing level L1T).A Landsat 8 satellite image (© Data available from the U.S. Geological Survey 2017) is presented in Figure 3 (acquisition date: 14 April 2017).
Figure 1a. Sentinel-1A image, VV polarisation, 10 m spatial resolution (© Copernicus Sentinel data 2017),
available from Copernicus Open Access Hub
Figure 1b. Sentinel-1A image, VH polarisation, 10 m spatial resolution (© Copernicus Sentinel data 2017)
The normalised difference vegetation index (NDVI) is computed based on the near-infrared and the visible red spectral bands (Mandanici and Bitelli, 2016). NDVI is used to monitor
crop phenology and condition and to estimate the potential yield for the current season in comparison with the historical average (Leslie et al., 2017).
Figure 2. Sentinel-2A image, false-colour composition,
10 m spatial resolution (© Copernicus Sentinel data 2017), available from Copernicus Open Access Hub
Figure 3. Landsat image, natural colours composition, 30 m spatial resolution (© data available from the U.S.
Geological Survey2017), USGS Glovis The scientific literature contains a very large number of papers studies dedicated to NDVI as it is the most widely used remote sensing vegetation index. Relevant examples include (but are not limited to) research related to the combined use of time series acquired by Sentinel-2 and Landsat 8 sensors given their spectral differences (Mandanici and Bitelli, 2016) and comparison of NDVI from Sentinel-2 and Landsat-8, for same-day acquisitions (Flood, 2017). The use of NDVI and other derived vegetation indices for the detection of non-authorised water abstractions is thoroughly described in (Lookwood et al., 2014). The all-weather capability and sensitivity to surface characteristics endorse the use of SAR
data for crop monitoring. For example, the ac-curate mapping of rice has been demonstrated using Sentinel-1 multitemporal data (Torbick et al., 2017). Also, the performance of Sentinel-1 has been proven for the monitoring of cereals (wheat and barley) and oilseed rapes crops, whereas the crop backscattering response has been correlated with the phenology cycle and the structural plant changes (Minchella, 2015). The main objective of the present study is to find whether the radar backscatter is correlated with the NVDI values in case of the crops that are present within the test area, using time-series of Sentinel-1 and Sentinel-2/Landsat 8 data. This research subject has been approached for sugarcane monitoring (Davidse, 2015), irrigated maize assessment (Rolim et al., 2016), mountain crops evaluation (Notarnicola et al., 2017) etc. RESULTS AND DISCUSSIONS The preliminary results (Figures 4-6) indicate that the VH polarisation backscattering time series are more similar with NDVI in com-parison with the ones resulting from the VV polarisation. Sentinel-1 images (VH and VV) are calibrated, speckle filtered and geocoded. Future work includes an investigation related to the potential of SAR data in monitoring dif-ferent types of crops considering that the backscatter signal contains information on both vegetation and soil condition. Moreover, the intensity of the SAR backscatter depends on the surface roughness and soil moisture. For this scope, ground-truth data and detailed phono-logic informational are mandatory. As demonstrated also by the previous studies, the NDVI derived from multitemporal optical satellite imagery (in this study, Sentinel-2 and Landsat 8) enables an accurate identification of the crop growth stages.
Figure 4. NVDI – S2/L8 (5 different crops)

135
for the detection and integrated assessment of non-authorised water abstractions. MATERIALS AND METHODS
The test area and one of the project's pilot cases is called "Urseni" and it is located southeast of Timisoara (latitude 45.690 N, longitude 21.310 E), in the historical Banat Region of Romania. The area is mainly covered by agricultural fields and villages and has an average altitude of 91 m. Urseni is situated within the Timis River Basin and has an exceptional aquifer potential. The study was performed based on satellite images acquired by Sentinel-1, Sentinel-2 and Landsat 8 between July 30, 2015 and June 21, 2017. The Sentinel-1 mission is a constellation of two C-band Synthetic Aperture Radar (SAR) satellites orbiting the Earth 1800 apart. The first satellite was launched in April 2014 and the second one in April 2016. The two satellites provide all-weather, day and night imagery for the Copernicus land and ocean services. Simi-larly, the Sentinel-2 mission is composed of two identical satellites placed in the same orbit. Each of the two satellites (launched in June 2015, respectively March 2017) carries an innovative wide swath (290 km) high-reso-lution multi-spectral imager with 13 spectral bands (visible, near-infrared and shortwave infrared) that acquires optical imagery (with the spatial resolution of 10 m/20 m/60 m) for the Copernicus land services(http://www.esa.int). Landsat 8 was launched in February 2013 and it is equipped with two science instruments - the Operational Land Imager (OLI) and the Thermal Infrared Sensor (TIRS) - that collects data using 11 spectral bands (panchromatic, visible, near-infrared, shortwave infrared, thermal infrared) with a spatial resolution of 15 m/30 m/100 m (https://landsat.gsfc.nasa.gov/). In the first phase of the study, 55 satellite images were downloaded, pre-processed and visually inspected. Part of them were discarded if the cropped image corresponding to the test area was covered by clouds or clouds shadow. Sentinel-1 data were acquired from a descending orbit (relative orbit: 80) using two polarisations (VV and VH). The downloaded Sentinel-1 data representLevel-1 Ground Range Detected (GRD) products that consist of focused SAR projected to ground range based an Earth ellipsoid model. A sample of terrain
geocoded Sentinel-1 data (acquisition date: 16 April 2017)covering the Urseni test area is presented in Figure 1 (©Copernicus Sentinel data 2017). Sentinel-2 data consist of products with the 1C (top-of-atmosphere reflectances) or 2A (bottom-of-atmosphere reflectances in UTM WGS84 projection) processing level derived from data acquired from the relative orbit no 36. Figure 2 (© Copernicus Sentinel data 2017) illustrates a sample of Sentinel-2 data (acquisition date: 12 April 2017) corresponding to Urseni test area. Landsat 8 data consists of images acquired from the 186/028 relative orbit. These images are radiometrically and geometrically (precision terrain) corrected (processing level L1T).A Landsat 8 satellite image (© Data available from the U.S. Geological Survey 2017) is presented in Figure 3 (acquisition date: 14 April 2017).
Figure 1a. Sentinel-1A image, VV polarisation, 10 m spatial resolution (© Copernicus Sentinel data 2017),
available from Copernicus Open Access Hub
Figure 1b. Sentinel-1A image, VH polarisation, 10 m spatial resolution (© Copernicus Sentinel data 2017)
The normalised difference vegetation index (NDVI) is computed based on the near-infrared and the visible red spectral bands (Mandanici and Bitelli, 2016). NDVI is used to monitor
crop phenology and condition and to estimate the potential yield for the current season in comparison with the historical average (Leslie et al., 2017).
Figure 2. Sentinel-2A image, false-colour composition,
10 m spatial resolution (© Copernicus Sentinel data 2017), available from Copernicus Open Access Hub
Figure 3. Landsat image, natural colours composition, 30 m spatial resolution (© data available from the U.S.
Geological Survey2017), USGS Glovis The scientific literature contains a very large number of papers studies dedicated to NDVI as it is the most widely used remote sensing vegetation index. Relevant examples include (but are not limited to) research related to the combined use of time series acquired by Sentinel-2 and Landsat 8 sensors given their spectral differences (Mandanici and Bitelli, 2016) and comparison of NDVI from Sentinel-2 and Landsat-8, for same-day acquisitions (Flood, 2017). The use of NDVI and other derived vegetation indices for the detection of non-authorised water abstractions is thoroughly described in (Lookwood et al., 2014). The all-weather capability and sensitivity to surface characteristics endorse the use of SAR
data for crop monitoring. For example, the ac-curate mapping of rice has been demonstrated using Sentinel-1 multitemporal data (Torbick et al., 2017). Also, the performance of Sentinel-1 has been proven for the monitoring of cereals (wheat and barley) and oilseed rapes crops, whereas the crop backscattering response has been correlated with the phenology cycle and the structural plant changes (Minchella, 2015). The main objective of the present study is to find whether the radar backscatter is correlated with the NVDI values in case of the crops that are present within the test area, using time-series of Sentinel-1 and Sentinel-2/Landsat 8 data. This research subject has been approached for sugarcane monitoring (Davidse, 2015), irrigated maize assessment (Rolim et al., 2016), mountain crops evaluation (Notarnicola et al., 2017) etc. RESULTS AND DISCUSSIONS The preliminary results (Figures 4-6) indicate that the VH polarisation backscattering time series are more similar with NDVI in com-parison with the ones resulting from the VV polarisation. Sentinel-1 images (VH and VV) are calibrated, speckle filtered and geocoded. Future work includes an investigation related to the potential of SAR data in monitoring dif-ferent types of crops considering that the backscatter signal contains information on both vegetation and soil condition. Moreover, the intensity of the SAR backscatter depends on the surface roughness and soil moisture. For this scope, ground-truth data and detailed phono-logic informational are mandatory. As demonstrated also by the previous studies, the NDVI derived from multitemporal optical satellite imagery (in this study, Sentinel-2 and Landsat 8) enables an accurate identification of the crop growth stages.
Figure 4. NVDI – S2/L8 (5 different crops)

136
TESTING THE INFLUENCE OF THE ENVIRONMENTALLY FRIENDLY PHYTOHORMONE GIBB A3, UPON MAIZE MACRO-
AND MICROELEMENTAL CONTENT
Camelia OROIAN, Antonia ODAGIU, Iulia MUREȘAN, Andra PORUȚIU, Cristian MĂLINAȘ
University of Agricultural Sciences and Veterinary Medicine Cluj-Napoca,
3-5 Calea Mănăștur, 400372 Cluj-Napoca, Romania
Corresponding author email: [email protected]
Abstract Ourdays, the identification of friendly solutions in order to enhance physiological development of cereals is one of the main priorities of agriculture. This approach, also contributes to the promotion of the practices of the sustainable agriculture. A practice, which occupies more and more space is the use of endogenous type substances, as phytohormones, in order to increase cereals’ physiological development, and nutritional traits. This is the context where the aim of our study is placed, meaning that we focused on determining the effects of GIBB A3 phytohormone on two maize hybrids content in macro-, and microelements, within specific environmental conditions of Transylvania. Two maize hybrids were studied, Turda Star, and Turda 200, respectively, and their elemental content was quantified by AAS, and raw data were processed with IBM SPSS Version 20. The results of our trial show the influence of GIBB A3 hormone upon the analyzed macro- (K, P, S, Cl, Mg, Ca), and microelemental (Fe, Mn, Zn) content of studied maize hybrids, mainly K, and P, which may also be considered as indicators of physiological status of the plant. Key words: AAS spectrometry, hybrid, indicator, physiology, statistics. INTRODUCTION In time, it has been shown that plants need for their growth and development, besides exogenous factors (soil, water, mineral substances, temperature, light, etc.), also some substances, which result from internal metabolic mechanisms, and who are generically named growing substances, of phytohormones, growth stimulators or regulators (Kefeli and Kalevitch, 2013). Starting from the concept, introduced since 1910 by Fitting, we must underline that phytohormones or growing regulators are organic compounds, which, in low, and very low concentrations, stimulate, inhibit, or qualitatively modify the plant growing and development, also playing role in stress regulation (Iqbal et al., 2014; Pandey et al., 2017; Tripathi et al., 2017). The physiological efficiency of a certain hormone depends on its concentration, and sensitivity of the cells. This sensitivity, is, on its turn, determined by the number of the receptor
molecules, their affinity against the hormones, and efficiency of the transduction of the signal initiated by receptor - hormone complex. New trends are reported in engineering phytohormones for enhancing abiotic stress in crops (Weyers and Paterson, 2001; Wani et al., 2016). The phytohormones play an important role in control of plant growing ad development mechanisms, and, as consequence, plays an important role in reproduction processes (Lambers et al., 2008). The most important classes of vegetal hormones described by literature, are: auxins, gibberellins, cytokines, ethylene, abscisic acid, jasmonate and brassinolides, which can be identified using a large diversity of methods (Durgbansi et al., 2005; Kazan, 2015; Liu et al., 2013; Mori et al., 2017; Yin et al., 2015). According to literature, the vegetal hormones are classified as follows (Lambers et al., 2008; Liu et al., 2013; Rajkumar Biology: A guide for 11th&12th CBSE Students): � primary hormones: auxins, gibberellins,
cytokinins, ethylene, abscisic acid;
Figure 5. SAR backscatter – S1, VH (5 different crops)
Figure 6. SAR backscatter – S1, VV (5 different crops)
CONCLUSIONS The high temporal resolution provided by the Sentinel missions allows an accurate monitoring of the crops. The data acquired by Sentinel-1 are useful especially when the use of optical satellite imagery is limited due to atmospheric conditions or cloud cover. Although further thorough research is necessary, an integrated approach that combines optical (Sentinel-2, Landsat) and SAR (Sentinel-1) satellite data might be the optimal solution for the identification of non-authorised water abstractions for irrigation. Nevertheless, the use of Earth Observation satellite data for an efficient water management in support of sustainable precision agriculture has definite benefits and it will bring societal and environmental benefits to the end users that will have access to monitoring data and forecasts. ACKNOWLEDGEMENTS This work has been conducted within DIANA project – “Detection and Integrated Assessment of Non-authorised water Abstractions using EO”. This project has received funding from the European Union's Horizon 2020 research
and innovation programme under grant agreement No 730109. REFERENCES Davidse J., 2015. The relation between the NDVI and
backscatter of Sentinel-1 for sugarcane monitoring (Case study in South Africa). Master course Geo-Information Science, Wageningen University, Netherlands.
Flood N., 2017. Comparing Sentinel-2A and Landsat 7 and 8 Using Surface Reflectance over Australia. MDPI - Remote Sensing, 2017, 9(7), 659, EISSN 2072-4292, doi:10.3390/rs9070659.
Leslie C., Serbina L., Miller H., 2017. Landsat and agriculture - Case studies on the uses and benefits of Landsat imagery in agricultural monitoring and production. U.S. Geological Survey Open-File Report 2017–1034, 27 p., ISSN 2331-1258 (online), https:// doi.org/10.3133/ofr20171034, Reston, Virginia.
Lookwood S., Sarteel M., Mudgal S., Osann A., Calera, A., 2014. Applying Earth observation to support the detection of non-authorised water abstractions, Report for the European Commission, DG Environment, Bio by Deloitte, Universidad de Castilla-La Mancha, pp. 52.
Mandanici E., Bitelli G., 2016. Preliminary Comparison of Sentinel-2 and Landsat 8 Imagery for a Combined Use, MDPI - Remote Sensing, 2016, 8, 1014, ISSN 2072-4292, doi:10.3390/rs8121014.
Minchella A., 2015. Open satellite data in agriculture, Workshop on Open Satellite Data for Agriculture, Satellite Applications Catapult, Harwell, Oxfordshire.
Notarnicola C., Asam S., Jacob A., Marin C., Rossi M., Stendardi L., Pascual I., 2017. Mountain crop monitoring with multitemporal Sentinel-1 and Sentinel-2 imagery. MultiTemp Conference, Bruges.
Rolim J., Navarro A., Saraiva C., Vilar P., Catalaob, J., 2016. Using optical and SAR data for crops characterisation and identification. 22nd IACS/CAP Conference, Lisbon, Portugal.
Torbick N., Chowdhury D., Salas W., Qi J., 2017. Monitoring Rice Agriculture across Myanmar Using Time Series Sentinel-1 Assisted by Landsat-8 and PALSAR-2. MDPI - Remote Sensing, 2017, 9, 119, doi:10.3390/rs9020119.
***ESA: Our Activities, Observing the Earth, Copernicus, Sentinel-1, Introducing Sentinel-1. http://www.esa.int/Our_Activities/Observing_the_Earth/Copernicus/Sentinel-1/Introducing_Sentinel-1, accessed August 2017.
***ESA: Our Activities, Observing the Earth, Copernicus, Sentinel-2. Introducing Sentinel-2, http://www.esa.int/Our_Activities/Observing_the_Earth/Copernicus/Sentinel-2/Introducing_Sentinel-2, accessed August 2017.
***NASA: Landsat Science, Landsat 8, Landsat 8 Overview. https://landsat.gsfc.nasa.gov/landsat-8/landsat-8-overview/, accessed May 2017.

137
TESTING THE INFLUENCE OF THE ENVIRONMENTALLY FRIENDLY PHYTOHORMONE GIBB A3, UPON MAIZE MACRO-
AND MICROELEMENTAL CONTENT
Camelia OROIAN, Antonia ODAGIU, Iulia MUREȘAN, Andra PORUȚIU, Cristian MĂLINAȘ
University of Agricultural Sciences and Veterinary Medicine Cluj-Napoca,
3-5 Calea Mănăștur, 400372 Cluj-Napoca, Romania
Corresponding author email: [email protected]
Abstract Ourdays, the identification of friendly solutions in order to enhance physiological development of cereals is one of the main priorities of agriculture. This approach, also contributes to the promotion of the practices of the sustainable agriculture. A practice, which occupies more and more space is the use of endogenous type substances, as phytohormones, in order to increase cereals’ physiological development, and nutritional traits. This is the context where the aim of our study is placed, meaning that we focused on determining the effects of GIBB A3 phytohormone on two maize hybrids content in macro-, and microelements, within specific environmental conditions of Transylvania. Two maize hybrids were studied, Turda Star, and Turda 200, respectively, and their elemental content was quantified by AAS, and raw data were processed with IBM SPSS Version 20. The results of our trial show the influence of GIBB A3 hormone upon the analyzed macro- (K, P, S, Cl, Mg, Ca), and microelemental (Fe, Mn, Zn) content of studied maize hybrids, mainly K, and P, which may also be considered as indicators of physiological status of the plant. Key words: AAS spectrometry, hybrid, indicator, physiology, statistics. INTRODUCTION In time, it has been shown that plants need for their growth and development, besides exogenous factors (soil, water, mineral substances, temperature, light, etc.), also some substances, which result from internal metabolic mechanisms, and who are generically named growing substances, of phytohormones, growth stimulators or regulators (Kefeli and Kalevitch, 2013). Starting from the concept, introduced since 1910 by Fitting, we must underline that phytohormones or growing regulators are organic compounds, which, in low, and very low concentrations, stimulate, inhibit, or qualitatively modify the plant growing and development, also playing role in stress regulation (Iqbal et al., 2014; Pandey et al., 2017; Tripathi et al., 2017). The physiological efficiency of a certain hormone depends on its concentration, and sensitivity of the cells. This sensitivity, is, on its turn, determined by the number of the receptor
molecules, their affinity against the hormones, and efficiency of the transduction of the signal initiated by receptor - hormone complex. New trends are reported in engineering phytohormones for enhancing abiotic stress in crops (Weyers and Paterson, 2001; Wani et al., 2016). The phytohormones play an important role in control of plant growing ad development mechanisms, and, as consequence, plays an important role in reproduction processes (Lambers et al., 2008). The most important classes of vegetal hormones described by literature, are: auxins, gibberellins, cytokines, ethylene, abscisic acid, jasmonate and brassinolides, which can be identified using a large diversity of methods (Durgbansi et al., 2005; Kazan, 2015; Liu et al., 2013; Mori et al., 2017; Yin et al., 2015). According to literature, the vegetal hormones are classified as follows (Lambers et al., 2008; Liu et al., 2013; Rajkumar Biology: A guide for 11th&12th CBSE Students): � primary hormones: auxins, gibberellins,
cytokinins, ethylene, abscisic acid;
Figure 5. SAR backscatter – S1, VH (5 different crops)
Figure 6. SAR backscatter – S1, VV (5 different crops)
CONCLUSIONS The high temporal resolution provided by the Sentinel missions allows an accurate monitoring of the crops. The data acquired by Sentinel-1 are useful especially when the use of optical satellite imagery is limited due to atmospheric conditions or cloud cover. Although further thorough research is necessary, an integrated approach that combines optical (Sentinel-2, Landsat) and SAR (Sentinel-1) satellite data might be the optimal solution for the identification of non-authorised water abstractions for irrigation. Nevertheless, the use of Earth Observation satellite data for an efficient water management in support of sustainable precision agriculture has definite benefits and it will bring societal and environmental benefits to the end users that will have access to monitoring data and forecasts. ACKNOWLEDGEMENTS This work has been conducted within DIANA project – “Detection and Integrated Assessment of Non-authorised water Abstractions using EO”. This project has received funding from the European Union's Horizon 2020 research
and innovation programme under grant agreement No 730109. REFERENCES Davidse J., 2015. The relation between the NDVI and
backscatter of Sentinel-1 for sugarcane monitoring (Case study in South Africa). Master course Geo-Information Science, Wageningen University, Netherlands.
Flood N., 2017. Comparing Sentinel-2A and Landsat 7 and 8 Using Surface Reflectance over Australia. MDPI - Remote Sensing, 2017, 9(7), 659, EISSN 2072-4292, doi:10.3390/rs9070659.
Leslie C., Serbina L., Miller H., 2017. Landsat and agriculture - Case studies on the uses and benefits of Landsat imagery in agricultural monitoring and production. U.S. Geological Survey Open-File Report 2017–1034, 27 p., ISSN 2331-1258 (online), https:// doi.org/10.3133/ofr20171034, Reston, Virginia.
Lookwood S., Sarteel M., Mudgal S., Osann A., Calera, A., 2014. Applying Earth observation to support the detection of non-authorised water abstractions, Report for the European Commission, DG Environment, Bio by Deloitte, Universidad de Castilla-La Mancha, pp. 52.
Mandanici E., Bitelli G., 2016. Preliminary Comparison of Sentinel-2 and Landsat 8 Imagery for a Combined Use, MDPI - Remote Sensing, 2016, 8, 1014, ISSN 2072-4292, doi:10.3390/rs8121014.
Minchella A., 2015. Open satellite data in agriculture, Workshop on Open Satellite Data for Agriculture, Satellite Applications Catapult, Harwell, Oxfordshire.
Notarnicola C., Asam S., Jacob A., Marin C., Rossi M., Stendardi L., Pascual I., 2017. Mountain crop monitoring with multitemporal Sentinel-1 and Sentinel-2 imagery. MultiTemp Conference, Bruges.
Rolim J., Navarro A., Saraiva C., Vilar P., Catalaob, J., 2016. Using optical and SAR data for crops characterisation and identification. 22nd IACS/CAP Conference, Lisbon, Portugal.
Torbick N., Chowdhury D., Salas W., Qi J., 2017. Monitoring Rice Agriculture across Myanmar Using Time Series Sentinel-1 Assisted by Landsat-8 and PALSAR-2. MDPI - Remote Sensing, 2017, 9, 119, doi:10.3390/rs9020119.
***ESA: Our Activities, Observing the Earth, Copernicus, Sentinel-1, Introducing Sentinel-1. http://www.esa.int/Our_Activities/Observing_the_Earth/Copernicus/Sentinel-1/Introducing_Sentinel-1, accessed August 2017.
***ESA: Our Activities, Observing the Earth, Copernicus, Sentinel-2. Introducing Sentinel-2, http://www.esa.int/Our_Activities/Observing_the_Earth/Copernicus/Sentinel-2/Introducing_Sentinel-2, accessed August 2017.
***NASA: Landsat Science, Landsat 8, Landsat 8 Overview. https://landsat.gsfc.nasa.gov/landsat-8/landsat-8-overview/, accessed May 2017.
AgroLife Scientific Journal - Volume 6, Number 2, 2017ISSN 2285-5718; ISSN CD-ROM 2285-5726; ISSN ONLINE 2286-0126; ISSN-L 2285-5718

138
� secondary hormones: jasmonic acid and brassinosteroids, juglone, salicylic acid, polyamides;
� other hormones: peptide hormones, oligosaccharides, phospholipids, ARNm or protein; strigolactones.
The gibberellins are natural phytohormones, isoprene derivatives, widely spread in nature, which stimulated both division and elongation of the vegetal cells. Because of their important action upon plant growth and development, they have numerous practical uses in plant improvement, for obtaining new pant lines, hybrids, and varieties. They may also be used for intensive development of agriculture, horticulture, forestry, medicinal plants, etc. (Davière and Achard, 2013; Lambers et al., 2008). The gibberelin was discovered in Japan, in 898, when Hotoaro Hori realized that excesive long rice plants were exposed to a Gibberella fujikuroi fungus. The fungus water extract produced similar symptoms in tested plants, and this led to the idea that fungus conains a substance responsible of this effect. The first identified gibberelin was the gibberelinic acid, or G3. This first discovery was fallowed by the discovery of other gibberellins, until in plants and fungi were identyied, in total, about fifty gibberellins. In practice, the used gibberellins are purifired products of synthesis. The most used gibberellin is G3, and less used are the mixture GA4+GA7 or GA7. The synthetic gibberellins were obtained in the ’80s, and they are environmentally friendly solutions for plants development (Gupta and Chakrabarty, 2013; Hedden and Sponsel, 2015; Lambers et al., 2008). The main alterations appeared in the metabolism of plants due to gibberellin actions are: the intensification of transpiration, and increase of the water consumption, the intensification of photosynthesis, the stimulation of the seed respiration during germination, the delay of the ageing process of the vegetal tissues, the correction of the negative effects produced by virosis and Botrytis, decrease of the starch content in plants and germinated seeds (Gupta and Chakrabarty, 2013; Hedden and Thomas, 2012; Hedden and Sponsel, 2015; Lambers et al., 2008; Zawaski and Busov, 2014).
Macro- and microelements content of plants, generally speaking, and of maize hybrids, in particular, play important role in enzymes activity, but may also be considered as real indicators of their physiology. This study was carried out with the aim of identifying the action of an environmentally friendly solution of fertilization, with the GIBB A3 phytohormone on several macroelements (K, P, Ca, Mg, S, Cl) and microelements (Fe, Mn, Zn) from two maize hybrids reared in specific conditions of Transylvania. MATERIALS AND METHODS The study area The trial was carried out in pedo-climatic conditions of Transylvania, meaning the experimental field of the Station of Research and Development for Agriculture Jucu (46º 51'18’’ N and 23º 47' 35’’ E), County of Cluj, during spring and summer of 2016. The biological material Two maize hybrids Turda Star and Turda 200 are used. Turda Star is a semi-early triple hybrid, recorded in 1976, FAO group 370, with good resistance to low temperatures encountered in the first period of vegetation, and also to mechanical damages (falling, and/or frightening), draught, high temperatures, mites, and diseases. In 2000, it was introduced again in the Official Register. The grain is yellow, dentate, 310 g MMB, 79 – 92% ratio grain/cob, rich in starch, about 70 – 71%, and 10,000 – 12,800 kg/ha, yield potential. Turda 200 is an early double hybrid, also recorded in 1976, and introduced again in the Official Register, in 2000. The plant is of moderate size, with 13 -15 leaves, semi-erected to inclined. The cob is of cylinder - conic shape, with moderate length, and rachis of intense red color, with 14 – 6 layers of grains. The grain is dentate, golden yellow, 260 – 33 g and MMB. The grain has the following chemical composition: 11.8 – 14.4% protein, 4 – 5.4% fat, and 67.7 – 70.3% starch. The chemical and biological materials The chemical materials used for seed treatment are the fungicides Royal Flo 42 S (Arysta) and Vitavax 200 (Chemtura). Royal Flo 42 S (active ingredient: Tiuram 480 g/L) was in
doses of 3 L/t (http://www.agrovet1.ro/royal-flo-42-s-arysta/), and Vitavax 200 (active ingredients: Carboxin 200 g/L+ tiram 200 g/L), in doses of 2.5 L/t (http://www.pestcontrol-expert.ro/chemtura-vitavax-200-ff.html). The GIBB A3 is a commercial product destined to fertilization. It is presented as pills, with 5g x 20% content in gibberellin acid, and 8 minutes time of solving in solution. In order to obtain maximum product efficacy, the solutions must be applied on cultures in maximum time interval of 36 hours from preparation, otherwise the ”hardness” of used water will affect the quality of product. The product administration on cool weather (in the morning or in the evening) is recommended. The administration when sun is strong must be avoided. When in term of 8 hours from administration, strong rains are reported, the product action may be affected. In this case, the administration of another treatment, with 50% concentration of previous, is recommended. The GIBB A3 must be foliar administered in 2 - 3 treatments, as solutions in doses of 500 L/Ha by each treatment (www.giberelina.ro). The methodology Both cultures were sowed in 28.04.2016, with beans as pre-emergent culture. Before sowing, herbicidation was performed with Glyphosate, in doses of 3L/Ha. The seed used within our experiment, is deli-vered by the crops of the previous year, 2015. The seed treatments against mites and diseases was performed with Royal Flo 42 S in Turda 200, and with Vitavax 200 in Turda Star. The treatments with GIBB A3 was performed in two phases
� First treatment was applied in phase with 3 – 4 leaves (after two weeks from sowing, 13.05.2015), in doses of 0.5 g/20 L water.
� The second treatment was applied after two weeks from the first treatment, in doses of 1 g/20 L water.
Four groups are organized, as follows: � Control group 1 (Turda Star hybrid, no
phytohormone treatment),
� Experimental group 1 (Turda Star hybrid treatment with phytohormone GIBB 3A),
� Control group 2 (Turda 200 hybrid, no phytohormone treatment),
� Experimental group 2 (Turda 200 hybrid treatment with phytohormone GIBB 3A).
The laboratory analysis The maize leaves samples were conditioned and analyzed in the Laboratory of the Control of the Environmental Quality and Plant Protection, from the University of Agricultural Sciences and Veterinary Medicine Cluj-Napoca. The macro- (K, P, Ca, Mg, S, Cl), and microelemental (Fe, Mn, Zn) content of foliar tissue of maize samples was quantified by AAS spectrometry with graphite furnace. The statistical analysis The software package IBM-SPPS Statistics 20 was used for performing descriptive statistics (means, standard deviations and standard errors) establishing correlations (Pearson’s correlations) between microelements, and implementing the Principal Components Analyze (PCA) for emphasizing the principal components (factors) of our study, and correspondent factor loadings, variables, respectively. RESULTS AND DISCUSSIONS In Turda Star maize hybrid Control Group 1, K is the macroelement with higher concentration (1.51%), while if analyzing microelements, biggest mean concentration is reported for Mn (0.23%). Bigger concentrations, compared to Control Group 1, are reported in Experimental Group 1, where Turda Star hybrid was treated with gibberellin phytohormone, GIBB A3, in K, and all microelements, Zn, Fe, Mn, respectively (Table 1). Except the differences between S, Zn and Mn contents, quantified in studied, groups that are statistically not significant (p > 0.05), those between other analyzed macro-and microele-ments are statistically assured at different thresholds of significance (Table 1).

139
� secondary hormones: jasmonic acid and brassinosteroids, juglone, salicylic acid, polyamides;
� other hormones: peptide hormones, oligosaccharides, phospholipids, ARNm or protein; strigolactones.
The gibberellins are natural phytohormones, isoprene derivatives, widely spread in nature, which stimulated both division and elongation of the vegetal cells. Because of their important action upon plant growth and development, they have numerous practical uses in plant improvement, for obtaining new pant lines, hybrids, and varieties. They may also be used for intensive development of agriculture, horticulture, forestry, medicinal plants, etc. (Davière and Achard, 2013; Lambers et al., 2008). The gibberelin was discovered in Japan, in 898, when Hotoaro Hori realized that excesive long rice plants were exposed to a Gibberella fujikuroi fungus. The fungus water extract produced similar symptoms in tested plants, and this led to the idea that fungus conains a substance responsible of this effect. The first identified gibberelin was the gibberelinic acid, or G3. This first discovery was fallowed by the discovery of other gibberellins, until in plants and fungi were identyied, in total, about fifty gibberellins. In practice, the used gibberellins are purifired products of synthesis. The most used gibberellin is G3, and less used are the mixture GA4+GA7 or GA7. The synthetic gibberellins were obtained in the ’80s, and they are environmentally friendly solutions for plants development (Gupta and Chakrabarty, 2013; Hedden and Sponsel, 2015; Lambers et al., 2008). The main alterations appeared in the metabolism of plants due to gibberellin actions are: the intensification of transpiration, and increase of the water consumption, the intensification of photosynthesis, the stimulation of the seed respiration during germination, the delay of the ageing process of the vegetal tissues, the correction of the negative effects produced by virosis and Botrytis, decrease of the starch content in plants and germinated seeds (Gupta and Chakrabarty, 2013; Hedden and Thomas, 2012; Hedden and Sponsel, 2015; Lambers et al., 2008; Zawaski and Busov, 2014).
Macro- and microelements content of plants, generally speaking, and of maize hybrids, in particular, play important role in enzymes activity, but may also be considered as real indicators of their physiology. This study was carried out with the aim of identifying the action of an environmentally friendly solution of fertilization, with the GIBB A3 phytohormone on several macroelements (K, P, Ca, Mg, S, Cl) and microelements (Fe, Mn, Zn) from two maize hybrids reared in specific conditions of Transylvania. MATERIALS AND METHODS The study area The trial was carried out in pedo-climatic conditions of Transylvania, meaning the experimental field of the Station of Research and Development for Agriculture Jucu (46º 51'18’’ N and 23º 47' 35’’ E), County of Cluj, during spring and summer of 2016. The biological material Two maize hybrids Turda Star and Turda 200 are used. Turda Star is a semi-early triple hybrid, recorded in 1976, FAO group 370, with good resistance to low temperatures encountered in the first period of vegetation, and also to mechanical damages (falling, and/or frightening), draught, high temperatures, mites, and diseases. In 2000, it was introduced again in the Official Register. The grain is yellow, dentate, 310 g MMB, 79 – 92% ratio grain/cob, rich in starch, about 70 – 71%, and 10,000 – 12,800 kg/ha, yield potential. Turda 200 is an early double hybrid, also recorded in 1976, and introduced again in the Official Register, in 2000. The plant is of moderate size, with 13 -15 leaves, semi-erected to inclined. The cob is of cylinder - conic shape, with moderate length, and rachis of intense red color, with 14 – 6 layers of grains. The grain is dentate, golden yellow, 260 – 33 g and MMB. The grain has the following chemical composition: 11.8 – 14.4% protein, 4 – 5.4% fat, and 67.7 – 70.3% starch. The chemical and biological materials The chemical materials used for seed treatment are the fungicides Royal Flo 42 S (Arysta) and Vitavax 200 (Chemtura). Royal Flo 42 S (active ingredient: Tiuram 480 g/L) was in
doses of 3 L/t (http://www.agrovet1.ro/royal-flo-42-s-arysta/), and Vitavax 200 (active ingredients: Carboxin 200 g/L+ tiram 200 g/L), in doses of 2.5 L/t (http://www.pestcontrol-expert.ro/chemtura-vitavax-200-ff.html). The GIBB A3 is a commercial product destined to fertilization. It is presented as pills, with 5g x 20% content in gibberellin acid, and 8 minutes time of solving in solution. In order to obtain maximum product efficacy, the solutions must be applied on cultures in maximum time interval of 36 hours from preparation, otherwise the ”hardness” of used water will affect the quality of product. The product administration on cool weather (in the morning or in the evening) is recommended. The administration when sun is strong must be avoided. When in term of 8 hours from administration, strong rains are reported, the product action may be affected. In this case, the administration of another treatment, with 50% concentration of previous, is recommended. The GIBB A3 must be foliar administered in 2 - 3 treatments, as solutions in doses of 500 L/Ha by each treatment (www.giberelina.ro). The methodology Both cultures were sowed in 28.04.2016, with beans as pre-emergent culture. Before sowing, herbicidation was performed with Glyphosate, in doses of 3L/Ha. The seed used within our experiment, is deli-vered by the crops of the previous year, 2015. The seed treatments against mites and diseases was performed with Royal Flo 42 S in Turda 200, and with Vitavax 200 in Turda Star. The treatments with GIBB A3 was performed in two phases
� First treatment was applied in phase with 3 – 4 leaves (after two weeks from sowing, 13.05.2015), in doses of 0.5 g/20 L water.
� The second treatment was applied after two weeks from the first treatment, in doses of 1 g/20 L water.
Four groups are organized, as follows: � Control group 1 (Turda Star hybrid, no
phytohormone treatment),
� Experimental group 1 (Turda Star hybrid treatment with phytohormone GIBB 3A),
� Control group 2 (Turda 200 hybrid, no phytohormone treatment),
� Experimental group 2 (Turda 200 hybrid treatment with phytohormone GIBB 3A).
The laboratory analysis The maize leaves samples were conditioned and analyzed in the Laboratory of the Control of the Environmental Quality and Plant Protection, from the University of Agricultural Sciences and Veterinary Medicine Cluj-Napoca. The macro- (K, P, Ca, Mg, S, Cl), and microelemental (Fe, Mn, Zn) content of foliar tissue of maize samples was quantified by AAS spectrometry with graphite furnace. The statistical analysis The software package IBM-SPPS Statistics 20 was used for performing descriptive statistics (means, standard deviations and standard errors) establishing correlations (Pearson’s correlations) between microelements, and implementing the Principal Components Analyze (PCA) for emphasizing the principal components (factors) of our study, and correspondent factor loadings, variables, respectively. RESULTS AND DISCUSSIONS In Turda Star maize hybrid Control Group 1, K is the macroelement with higher concentration (1.51%), while if analyzing microelements, biggest mean concentration is reported for Mn (0.23%). Bigger concentrations, compared to Control Group 1, are reported in Experimental Group 1, where Turda Star hybrid was treated with gibberellin phytohormone, GIBB A3, in K, and all microelements, Zn, Fe, Mn, respectively (Table 1). Except the differences between S, Zn and Mn contents, quantified in studied, groups that are statistically not significant (p > 0.05), those between other analyzed macro-and microele-ments are statistically assured at different thresholds of significance (Table 1).
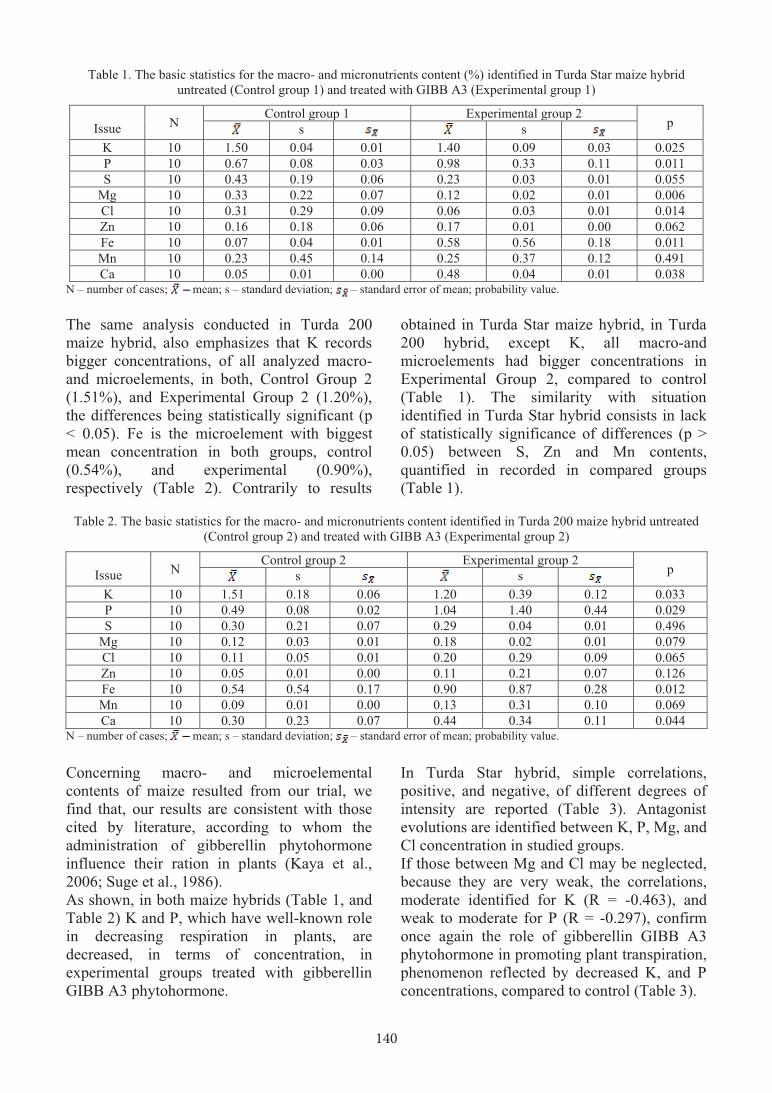
140
Table 1. The basic statistics for the macro- and micronutrients content (%) identified in Turda Star maize hybrid untreated (Control group 1) and treated with GIBB A3 (Experimental group 1)
Issue
N Control group 1 Experimental group 2
p s s
K 10 1.50 0.04 0.01 1.40 0.09 0.03 0.025 P 10 0.67 0.08 0.03 0.98 0.33 0.11 0.011 S 10 0.43 0.19 0.06 0.23 0.03 0.01 0.055
Mg 10 0.33 0.22 0.07 0.12 0.02 0.01 0.006 Cl 10 0.31 0.29 0.09 0.06 0.03 0.01 0.014 Zn 10 0.16 0.18 0.06 0.17 0.01 0.00 0.062 Fe 10 0.07 0.04 0.01 0.58 0.56 0.18 0.011 Mn 10 0.23 0.45 0.14 0.25 0.37 0.12 0.491 Ca 10 0.05 0.01 0.00 0.48 0.04 0.01 0.038
N – number of cases; mean; s – standard deviation; – standard error of mean; probability value.
The same analysis conducted in Turda 200 maize hybrid, also emphasizes that K records bigger concentrations, of all analyzed macro-and microelements, in both, Control Group 2 (1.51%), and Experimental Group 2 (1.20%), the differences being statistically significant (p < 0.05). Fe is the microelement with biggest mean concentration in both groups, control (0.54%), and experimental (0.90%), respectively (Table 2). Contrarily to results
obtained in Turda Star maize hybrid, in Turda 200 hybrid, except K, all macro-and microelements had bigger concentrations in Experimental Group 2, compared to control (Table 1). The similarity with situation identified in Turda Star hybrid consists in lack of statistically significance of differences (p > 0.05) between S, Zn and Mn contents, quantified in recorded in compared groups (Table 1).
Table 2. The basic statistics for the macro- and micronutrients content identified in Turda 200 maize hybrid untreated
(Control group 2) and treated with GIBB A3 (Experimental group 2)
Issue
N Control group 2 Experimental group 2
p s s
K 10 1.51 0.18 0.06 1.20 0.39 0.12 0.033 P 10 0.49 0.08 0.02 1.04 1.40 0.44 0.029 S 10 0.30 0.21 0.07 0.29 0.04 0.01 0.496
Mg 10 0.12 0.03 0.01 0.18 0.02 0.01 0.079 Cl 10 0.11 0.05 0.01 0.20 0.29 0.09 0.065 Zn 10 0.05 0.01 0.00 0.11 0.21 0.07 0.126 Fe 10 0.54 0.54 0.17 0.90 0.87 0.28 0.012 Mn 10 0.09 0.01 0.00 0.13 0.31 0.10 0.069 Ca 10 0.30 0.23 0.07 0.44 0.34 0.11 0.044
N – number of cases; mean; s – standard deviation; – standard error of mean; probability value.
Concerning macro- and microelemental contents of maize resulted from our trial, we find that, our results are consistent with those cited by literature, according to whom the administration of gibberellin phytohormone influence their ration in plants (Kaya et al., 2006; Suge et al., 1986). As shown, in both maize hybrids (Table 1, and Table 2) K and P, which have well-known role in decreasing respiration in plants, are decreased, in terms of concentration, in experimental groups treated with gibberellin GIBB A3 phytohormone.
In Turda Star hybrid, simple correlations, positive, and negative, of different degrees of intensity are reported (Table 3). Antagonist evolutions are identified between K, P, Mg, and Cl concentration in studied groups. If those between Mg and Cl may be neglected, because they are very weak, the correlations, moderate identified for K (R = -0.463), and weak to moderate for P (R = -0.297), confirm once again the role of gibberellin GIBB A3 phytohormone in promoting plant transpiration, phenomenon reflected by decreased K, and P concentrations, compared to control (Table 3).
Table 3. The correlation matrix between the macro- and micronutrients content identified in Turda Star maize hybrid untreated (Control group 1) and treated with GIBB A3 (Experimental group 1)
Control/ Experimental
K P S Mg Cl Zn Fe Mn Ca
K -0.463 P -0.297 S 0.212
Mg -0.095 Cl -0.091 Zn 0.441 Fe 0.873 Mn 0.607 Ca 0.603
Because correlations are identified between studied parameters in Turda Star hybrid, we may implement the Principal Components Analysis (PCA). The factor reducing emphasize the presence of 2 main factors, Factor 1 – the technology of culture, and Factor 2 – biostimulation approach.
While Factor 1 explains 53.28% of variance, Factor 2 explains only about 18.17% (Table 4). Stronger correlations are revealed between the Factor 1 (technology of culture) and experimental variables (macro- and microelemental content of Turda Star maize hybrid), compared to those resulted between no biostimulating practice (Factor 2), and the same variables (Table 5).
Table 4. The total variance explained for Turda Star maize hybrid
Issue Eigenvalue % Total - variance Cumulative - Eigenvalue Cumulative - %
Factor 1 9.590 53.281 9.590 53.281 Factor 2 3.272 18.179 12.862 71.460
Table 5. The factor loadings in Turda Star maize hybrid
Issue Factor – 1 Technology
Factor – 2 Biosimulation Issue Factor – 1
Technology Factor – 2
Biosimulation
Var121 0.930104 -0.172381 Var141 -0.552429 -0.185375
Var122 -0.983212 -0.018388 Var142 -0.954307 -0.039950
Var123 -0.981154 0.115799 Var143 0.393854 -0.499895
Var124 -0.993875 -0.002027 Var144 -0.198676 -0.806977
Var125 0.011230 0.968878 Var145 0.836721 -0.114616
Var126 -0.774575 0.063597 Var146 0.755269 -0.566412
Var127 -0.948085 0.164455 Var147 0.928971 -0.007254
Var128 0.350953 0.918269 Var148 -0.707243 -0.069726
Var129 0.270132 0.466006 Var149 -0.685963 -0.549811
Explained variance 5.477346 2.073661 Explained variance 4.514730 1.578233
The projections of the variables on PC1 x PC2 plane of the PCA (Figure 1) shows that K, Mn and Ca concentrations emphasized in Turda Star maize hybrid in both biostimulated and no-biostimulated experimental variants, and P concentration in experimental variant (biostimulated with GIBB A3 phytohormone) are mainly influenced by the biostimulation
practice (Factor 2). The evolutions of the Cl concentrations, in both experimental variants (with and no biostimulation), Mg, and Zn concentrations in experimental variant where the phytohormone GIBB A3 was administered, are influenced by both principal factors, technology of culture and biostimulation practice, respectively (Figure 1).

141
Table 1. The basic statistics for the macro- and micronutrients content (%) identified in Turda Star maize hybrid untreated (Control group 1) and treated with GIBB A3 (Experimental group 1)
Issue
N Control group 1 Experimental group 2
p s s
K 10 1.50 0.04 0.01 1.40 0.09 0.03 0.025 P 10 0.67 0.08 0.03 0.98 0.33 0.11 0.011 S 10 0.43 0.19 0.06 0.23 0.03 0.01 0.055
Mg 10 0.33 0.22 0.07 0.12 0.02 0.01 0.006 Cl 10 0.31 0.29 0.09 0.06 0.03 0.01 0.014 Zn 10 0.16 0.18 0.06 0.17 0.01 0.00 0.062 Fe 10 0.07 0.04 0.01 0.58 0.56 0.18 0.011 Mn 10 0.23 0.45 0.14 0.25 0.37 0.12 0.491 Ca 10 0.05 0.01 0.00 0.48 0.04 0.01 0.038
N – number of cases; mean; s – standard deviation; – standard error of mean; probability value.
The same analysis conducted in Turda 200 maize hybrid, also emphasizes that K records bigger concentrations, of all analyzed macro-and microelements, in both, Control Group 2 (1.51%), and Experimental Group 2 (1.20%), the differences being statistically significant (p < 0.05). Fe is the microelement with biggest mean concentration in both groups, control (0.54%), and experimental (0.90%), respectively (Table 2). Contrarily to results
obtained in Turda Star maize hybrid, in Turda 200 hybrid, except K, all macro-and microelements had bigger concentrations in Experimental Group 2, compared to control (Table 1). The similarity with situation identified in Turda Star hybrid consists in lack of statistically significance of differences (p > 0.05) between S, Zn and Mn contents, quantified in recorded in compared groups (Table 1).
Table 2. The basic statistics for the macro- and micronutrients content identified in Turda 200 maize hybrid untreated
(Control group 2) and treated with GIBB A3 (Experimental group 2)
Issue
N Control group 2 Experimental group 2
p s s
K 10 1.51 0.18 0.06 1.20 0.39 0.12 0.033 P 10 0.49 0.08 0.02 1.04 1.40 0.44 0.029 S 10 0.30 0.21 0.07 0.29 0.04 0.01 0.496
Mg 10 0.12 0.03 0.01 0.18 0.02 0.01 0.079 Cl 10 0.11 0.05 0.01 0.20 0.29 0.09 0.065 Zn 10 0.05 0.01 0.00 0.11 0.21 0.07 0.126 Fe 10 0.54 0.54 0.17 0.90 0.87 0.28 0.012 Mn 10 0.09 0.01 0.00 0.13 0.31 0.10 0.069 Ca 10 0.30 0.23 0.07 0.44 0.34 0.11 0.044
N – number of cases; mean; s – standard deviation; – standard error of mean; probability value.
Concerning macro- and microelemental contents of maize resulted from our trial, we find that, our results are consistent with those cited by literature, according to whom the administration of gibberellin phytohormone influence their ration in plants (Kaya et al., 2006; Suge et al., 1986). As shown, in both maize hybrids (Table 1, and Table 2) K and P, which have well-known role in decreasing respiration in plants, are decreased, in terms of concentration, in experimental groups treated with gibberellin GIBB A3 phytohormone.
In Turda Star hybrid, simple correlations, positive, and negative, of different degrees of intensity are reported (Table 3). Antagonist evolutions are identified between K, P, Mg, and Cl concentration in studied groups. If those between Mg and Cl may be neglected, because they are very weak, the correlations, moderate identified for K (R = -0.463), and weak to moderate for P (R = -0.297), confirm once again the role of gibberellin GIBB A3 phytohormone in promoting plant transpiration, phenomenon reflected by decreased K, and P concentrations, compared to control (Table 3).
Table 3. The correlation matrix between the macro- and micronutrients content identified in Turda Star maize hybrid untreated (Control group 1) and treated with GIBB A3 (Experimental group 1)
Control/ Experimental
K P S Mg Cl Zn Fe Mn Ca
K -0.463 P -0.297 S 0.212
Mg -0.095 Cl -0.091 Zn 0.441 Fe 0.873 Mn 0.607 Ca 0.603
Because correlations are identified between studied parameters in Turda Star hybrid, we may implement the Principal Components Analysis (PCA). The factor reducing emphasize the presence of 2 main factors, Factor 1 – the technology of culture, and Factor 2 – biostimulation approach.
While Factor 1 explains 53.28% of variance, Factor 2 explains only about 18.17% (Table 4). Stronger correlations are revealed between the Factor 1 (technology of culture) and experimental variables (macro- and microelemental content of Turda Star maize hybrid), compared to those resulted between no biostimulating practice (Factor 2), and the same variables (Table 5).
Table 4. The total variance explained for Turda Star maize hybrid
Issue Eigenvalue % Total - variance Cumulative - Eigenvalue Cumulative - %
Factor 1 9.590 53.281 9.590 53.281 Factor 2 3.272 18.179 12.862 71.460
Table 5. The factor loadings in Turda Star maize hybrid
Issue Factor – 1 Technology
Factor – 2 Biosimulation Issue Factor – 1
Technology Factor – 2
Biosimulation
Var121 0.930104 -0.172381 Var141 -0.552429 -0.185375
Var122 -0.983212 -0.018388 Var142 -0.954307 -0.039950
Var123 -0.981154 0.115799 Var143 0.393854 -0.499895
Var124 -0.993875 -0.002027 Var144 -0.198676 -0.806977
Var125 0.011230 0.968878 Var145 0.836721 -0.114616
Var126 -0.774575 0.063597 Var146 0.755269 -0.566412
Var127 -0.948085 0.164455 Var147 0.928971 -0.007254
Var128 0.350953 0.918269 Var148 -0.707243 -0.069726
Var129 0.270132 0.466006 Var149 -0.685963 -0.549811
Explained variance 5.477346 2.073661 Explained variance 4.514730 1.578233
The projections of the variables on PC1 x PC2 plane of the PCA (Figure 1) shows that K, Mn and Ca concentrations emphasized in Turda Star maize hybrid in both biostimulated and no-biostimulated experimental variants, and P concentration in experimental variant (biostimulated with GIBB A3 phytohormone) are mainly influenced by the biostimulation
practice (Factor 2). The evolutions of the Cl concentrations, in both experimental variants (with and no biostimulation), Mg, and Zn concentrations in experimental variant where the phytohormone GIBB A3 was administered, are influenced by both principal factors, technology of culture and biostimulation practice, respectively (Figure 1).

142
Var 121 – K Control Group 1; Var 122 – P Control Group 1; Var 123 – S Control Group 1; Var 124 – Mg Control Group 1; Var 125 – Cl Control Group 1; Var 126 – Zn Control Group 1; Var 127 – Fe Control Group 1; Var 128 – Mn Control Group 1; Var 129 – Ca Control Group 1; Var 130 – K Experimental Group 1; Var 131 – P Experimental Group 1; Var 132 – S Experimental Group 1; Var 133 – Mg Experimental Group 1; Var 134 – Cl Experimental Group 1; Var 135 – Zn Experimental Group 1; Var 136 – Fe Experimental Group 1; Var 137 – Mn Experimental Group 1; Var 138 – Ca Experimental Group 1.
Figure 1. The projections of the variables (on PC1 x PC2 plane) of the Principal Components Analysis applied to Turda
Star maize hybrid content in macro- and microelements within experimental conditions
Weak to very strong simple correlations, positive, and negative are emphasized between studied macro- and microelements concentrations in Turda 200 hybrid, simple correlations (Table 6). Similarly with data resulted from analyze performed in Turda Star hybrid, negative moderate, and weak to moderate correlations resulted between K (R = -0.534), and P (R = -0.279). Here, it also results that gibberellin GIBB A3 phytohormone promotes decrease of K, and P concentrations, compared to control (Table 6). The simple correlations resulted between studied macro- and microelements studied in Turda 200 maize hybrid allow us to apply the Principal Components Analysis (PCA). The same as situation reported in Turda Star hybrid, two main factors, Factor 1 – the technology of
culture, and Factor 2 – biostimulation are identified. Factor 1, the technology of culture, respectively explains 51.12% of variance, while Factor 2, biostimulation practice, explains only 15.13% of variance (Table 7). Also, similarly to results of the PCA analysis conducted in Turda Star hybrid, stronger correlations are reported between the technology of culture - Factor 1, and experimental variables (macro- and microelemental content of Turda 200 maize hybrid), while between no biostimulating practice - Factor 2, and macro- and microelemental content of Turda 200 maize hybrid, they are weaker (Table 8).
Table 6. The correlation matrix between the macro- and micronutrients content identified in Turda 200 maize hybrid untreated (Control group 2) and treated with GIBB A3 (Experimental group 2)
Control/ Experimental
K P S Mg Cl Zn Fe Mn Ca
K -0.534 P -0.279 S 0.192
Mg 0.254 Cl 0.211 Zn 0.233 Fe 0.966 Mn 0.657 Ca 0.692
The PC1 x PC2 plane of the PCA (Fig. 2) reveals that Cl and Mn content of Turda 200 maize hybrid that receive no biostimulation, K, and Zn concentrations in Turda 200 maize hybrid that receive biostimulation with GIBB A3 phytohormone are mainly influenced by the
biostimulation practice (Factor 2), while Turda 200 maize hybrid concentrations of Mg in both experimental variants, P, S, Cl and Mn, in experimental variant biostimulated, are influenced by technology of culture and also biostimulation practice (Figure 2).
Table 7. The total variance explained for Turda 200 maize hybrid
ssue Eigenvalue % Total - variance Cumulative - Eigenvalue Cumulative - % Factor 1 9.203 51.128 9.203 51.128 Factor 2 2.724 15.136 11.927 66.264
Table 8. The factor loadings for Turda 200 maize hybrid
Issue Factor – 1 Technology
Factor – 2 Biosimulation
Issue Factor – 1 Technology
Factor – 2 Biosimulation
Var121 0.602741 0.553260 Var141 0.969620 -0.011768 Var122 0.934739 -0.214311 Var142 -0.326305 -0.894258 Var123 0.478382 -0.631391 Var143 0.518196 -0.664544 Var124 0.866911 0.126160 Var144 0.496141 -0.186586 Var125 -0.879318 -0.086397 Var145 -0.298415 -0.906257 Var126 0.912178 0.337125 Var146 0.646876 -0.251975 Var127 0.973873 -0.051860 Var147 -0.901819 -0.046954 Var128 -0.335501 0.689975 Var148 -0.372569 0.187739 Var129 0.972559 -0.043151 Var149 -0.892006 -0.085991
Explained variance 5.829545 1.368331 Explained variance 3.816583 2.205909
Var 151 – K Control Group 2; Var 152 – P Control Group 2; Var 153 – S Control Group 2; Var 154 – Mg Control Group 2; Var 155 – Cl Control Group 2; Var 156 – Zn Control Group 2; Var 157 – Fe Control Group 2; Var 158 – Mn Control Group 2; Var 159 – Ca Control Group 2; Var 160
– K Experimental Group 2; Var 161 – P Experimental Group 2; Var 162 – S Experimental Group 2; Var 163 – Mg Experimental Group 2; Var 164 – Cl Experimental Group 2; Var 165 – Zn Experimental Group 2; Var 166 – Fe Experimental Group 2; Var 167 – Mn Experimental Group 2;
Var 168 – Ca Experimental Group 2. Figure 2. The projections of the active variables (on PC1 x PC2 plane) of the Principal Components Analysis applied to
Turda 200 maize hybrid content in macro- and microelements within

143
Var 121 – K Control Group 1; Var 122 – P Control Group 1; Var 123 – S Control Group 1; Var 124 – Mg Control Group 1; Var 125 – Cl Control Group 1; Var 126 – Zn Control Group 1; Var 127 – Fe Control Group 1; Var 128 – Mn Control Group 1; Var 129 – Ca Control Group 1; Var 130 – K Experimental Group 1; Var 131 – P Experimental Group 1; Var 132 – S Experimental Group 1; Var 133 – Mg Experimental Group 1; Var 134 – Cl Experimental Group 1; Var 135 – Zn Experimental Group 1; Var 136 – Fe Experimental Group 1; Var 137 – Mn Experimental Group 1; Var 138 – Ca Experimental Group 1.
Figure 1. The projections of the variables (on PC1 x PC2 plane) of the Principal Components Analysis applied to Turda
Star maize hybrid content in macro- and microelements within experimental conditions
Weak to very strong simple correlations, positive, and negative are emphasized between studied macro- and microelements concentrations in Turda 200 hybrid, simple correlations (Table 6). Similarly with data resulted from analyze performed in Turda Star hybrid, negative moderate, and weak to moderate correlations resulted between K (R = -0.534), and P (R = -0.279). Here, it also results that gibberellin GIBB A3 phytohormone promotes decrease of K, and P concentrations, compared to control (Table 6). The simple correlations resulted between studied macro- and microelements studied in Turda 200 maize hybrid allow us to apply the Principal Components Analysis (PCA). The same as situation reported in Turda Star hybrid, two main factors, Factor 1 – the technology of
culture, and Factor 2 – biostimulation are identified. Factor 1, the technology of culture, respectively explains 51.12% of variance, while Factor 2, biostimulation practice, explains only 15.13% of variance (Table 7). Also, similarly to results of the PCA analysis conducted in Turda Star hybrid, stronger correlations are reported between the technology of culture - Factor 1, and experimental variables (macro- and microelemental content of Turda 200 maize hybrid), while between no biostimulating practice - Factor 2, and macro- and microelemental content of Turda 200 maize hybrid, they are weaker (Table 8).
Table 6. The correlation matrix between the macro- and micronutrients content identified in Turda 200 maize hybrid untreated (Control group 2) and treated with GIBB A3 (Experimental group 2)
Control/ Experimental
K P S Mg Cl Zn Fe Mn Ca
K -0.534 P -0.279 S 0.192
Mg 0.254 Cl 0.211 Zn 0.233 Fe 0.966 Mn 0.657 Ca 0.692
The PC1 x PC2 plane of the PCA (Fig. 2) reveals that Cl and Mn content of Turda 200 maize hybrid that receive no biostimulation, K, and Zn concentrations in Turda 200 maize hybrid that receive biostimulation with GIBB A3 phytohormone are mainly influenced by the
biostimulation practice (Factor 2), while Turda 200 maize hybrid concentrations of Mg in both experimental variants, P, S, Cl and Mn, in experimental variant biostimulated, are influenced by technology of culture and also biostimulation practice (Figure 2).
Table 7. The total variance explained for Turda 200 maize hybrid
ssue Eigenvalue % Total - variance Cumulative - Eigenvalue Cumulative - % Factor 1 9.203 51.128 9.203 51.128 Factor 2 2.724 15.136 11.927 66.264
Table 8. The factor loadings for Turda 200 maize hybrid
Issue Factor – 1 Technology
Factor – 2 Biosimulation
Issue Factor – 1 Technology
Factor – 2 Biosimulation
Var121 0.602741 0.553260 Var141 0.969620 -0.011768 Var122 0.934739 -0.214311 Var142 -0.326305 -0.894258 Var123 0.478382 -0.631391 Var143 0.518196 -0.664544 Var124 0.866911 0.126160 Var144 0.496141 -0.186586 Var125 -0.879318 -0.086397 Var145 -0.298415 -0.906257 Var126 0.912178 0.337125 Var146 0.646876 -0.251975 Var127 0.973873 -0.051860 Var147 -0.901819 -0.046954 Var128 -0.335501 0.689975 Var148 -0.372569 0.187739 Var129 0.972559 -0.043151 Var149 -0.892006 -0.085991
Explained variance 5.829545 1.368331 Explained variance 3.816583 2.205909
Var 151 – K Control Group 2; Var 152 – P Control Group 2; Var 153 – S Control Group 2; Var 154 – Mg Control Group 2; Var 155 – Cl Control Group 2; Var 156 – Zn Control Group 2; Var 157 – Fe Control Group 2; Var 158 – Mn Control Group 2; Var 159 – Ca Control Group 2; Var 160
– K Experimental Group 2; Var 161 – P Experimental Group 2; Var 162 – S Experimental Group 2; Var 163 – Mg Experimental Group 2; Var 164 – Cl Experimental Group 2; Var 165 – Zn Experimental Group 2; Var 166 – Fe Experimental Group 2; Var 167 – Mn Experimental Group 2;
Var 168 – Ca Experimental Group 2. Figure 2. The projections of the active variables (on PC1 x PC2 plane) of the Principal Components Analysis applied to
Turda 200 maize hybrid content in macro- and microelements within
144
CONCLUSIONS According to results of our study, result several conclusions: � In both studied maize hybrids, Turda Star
and Turda 200, K and P are the studied macroelements with highest concentration in both variants (without, and with biostimulation), with smaller concentration in biostimulated variants, compared to control, which is no treated with GIBB A3 gibberellin phytohormone. The differences between macro- and microelements concentrations in both studied maize hybrids (Turda Star and Turda 200) are statistically assured at different significance thresholds, for majority of macro- and macroelements analyzed in this study.
� Simple correlations, of different intensities, from very weak to very strong, are emphasized in studied maize hybrids, Turda Star and Turda 200. Negative moderate correlations are reported between K concentrations in biostimulated and no biostimulated experimental variants in both Turda Star (R = -0.463) and Turda 200 (R = -0.534) hybrids, while between P concentrations, also negative but weak to moderate correlations are established in Turda Star (R = -0.297) and Turda 200 (R = -0.279).
� The PCA shows, in both studied maize hybrids, Turda Star, and Turda 200, respectively that the same two principal factors are identified. In both cases, Factor 1 is represented by the technology of culture, explains the biggest part of variance (53.28% in Turda Star hybrid, and 51.12% in Turda 200 hybrid), and it is stronger correlated to experimental variables (studied macroelements – K, P, S, Mg, Cl, Ca, and microelements – Fe, Mn, Zn), compared to the other principal factor, Factor 2. This last one, Factor 2, represented by the biostimulation practice, performed in our case with GIBB A3 gibberellin phytohormone, explains 18.17% of variance in Turda Star maize hybrid, and 15.13% in Turda 200 Maize hybrid. Whatever maize hybrid, the biostimulation practice influences at greater extent the K
concentrations in maize. Our results, also show the influence of biostimulation with GIBB A3 gibberellin phytohormone on plant physiology, reflected by decrease of K, and P concentrations, with role in plant transpiration.
� Further research is needed in order to establish correlations, and explain interrelationships between maize hybrids development, plant macro- and microelemental content, and physiological traits, and also.
REFERENCES Davière J.M., Achard P., 2013. Gibberellin signaling
plants. Developmet, 140, p. 1147-1151. Durgbansi A., Arbona V., Pozo O., Miersch O., Sancho
J.V., Cadenas A.G., 2005. Simultaneous Determination of Multiple Phytohormones in Plant Extracts by liquid Chromatography-Electrospray Tandem Mass Spectrosopy. Journal of Agricultural and Food Chemistry, 53 (22), p. 8437-8442.
Gupta R., Chakrabarty S.K., 2013. Gibberelinic acid in plant. Plant Signaling&Behavior, 8(9), e255041-255045
Hedden P., Thomas S.G., 2012. Gibberellin biosynthesis and its regulation. Biochemical Jurnal, 444 (1), p. 11-25.
Hedden P., Sponsel V., 2015. A Centrury of Gibberellin Research. Journal of Plant Growth Regulation, 34, p. 740-760.
Iqbal N., Umar S., Khan N.A., Khan M.I.R., 2014. A new perspective of phytohormones in salinity tolerance: regulation of proline metabolism. Environmental and Experimental Botany, 100, p. 34-42.
Kazan K., 2015. Diverse roles of jasmonates and ethylene in abiotic stress tolerance. Trends in Plant Science, 20, p. 219–229.
Kaya C., Tuna A.L., Alves A.A.C., 2006. Gibberellinic acid impoves water deficit tolerance in maize plants. Acta Physiologiae Plantarum, 28 (4), p. 331-337.
Kefeli V.I., Kalevitch, 2013. Natural Growth Inhibitors and Phytohormones in Plants and Environment, 2010. Kluwer Academic Publishers, Dordrecht/Boston/London.
Lambers H., Chapin III F.S., Pons T.L., 2008. Plant Physiological Ecology. Springer Science + Business Media, LLC.
Liu S., Chen W., Qu L., gai Y., Jiang X., 2013. Simultaneous determination of 24 or more acidic and alkaline phtohormones in femtomole quantities of plant tissues by high-performance liquid-chromatography-electrospray ionization-in trap mass spectrometry. Analytical and Bioanalytical Chemistry, 405 94), p. 1275-1266.
Mori I.C., Ikeda Y., Matsuura T., Hirayama T., Mikami K., 2017. Phytohormones in red seaweeds: a technical review of methods for analysis and a consideration of genomic data. Botanica Marina, 60 (2), p. 153-170.
Pandey N., Iqbal Z., Pandey B.K., Sawant S.V., 2017. Phytohormones and Drought Stress: Plant Responses to Transcriptional Regulation, in Mechanism of Plant Hormone Signaling under Stress. In: (Pandey G.K. (Ed.), John Wiley & Sons, Inc., John Wiley & Sons, Inc., Hoboken, NJ, USA. doi: 10.1002/9781118889022.ch34.
Suge H., Arita S., Takahashi H., Takaki H., 1986. Gibberellin Relationships in Zinc-Deficient Plants. Plant and Cell Physiology, 27 (6), p. 1005-1012.
Tripathi D., Thakuri B. K. C. Kumar D., 2017. Role of Multiple Phytohormones in Regulating Stress Responses in Plants, in Mechanism of Plant Hormone Signaling under Stress. In: Pandey G.K. (Ed.), John Wiley & Sons, Inc., Hoboken, NJ, USA. doi: 10.1002/9781118889022.ch33.
Wani S.H., Kumar V., Shriram V., Sah S.K., 2016, Phytohormones and their metabolic engineering for abiotic stress tolerance in crop plants. The Crop Journal, 4, p. 162-176.
Weyers J.D.B., Paterson N.V., 2001. Plant hormones and the control of physiological processes. Ne Phytologist, 152 (3), p. 375-407.
Yin C.C., Ma B., Collinge D.P., Pogson B.J., He S.J., Xiong Q., Zhang J.S., 2015. Ethylene responses in rice roots and coleoptiles are differentially regulated by a carotenoid isomerase-mediated abscisic acid pathway. Plant Cell, 27, p. 1061–1081.
Zawaski C., Busov V.B., 2014. Roles of Gibberellin Catabolism and Signaling in Growth and Physiological response to Drought and Short-Day.
***Photoperiods in Populus Trees, PLoS ONE 9(1): 1-12***, Rajkumar Biology: A guide for 11th&12th CBSE Students, http://rajkumarbiology.weebly.com/ class-11-chap-15.html.
***http://www.agrovet1.ro/royal-flo-42-s-arysta/. ***http://www.giberelina.ro. ***http://www.pestcontrol-expert.ro/chemtura-vitavax-
200-ff.html.

145
CONCLUSIONS According to results of our study, result several conclusions: � In both studied maize hybrids, Turda Star
and Turda 200, K and P are the studied macroelements with highest concentration in both variants (without, and with biostimulation), with smaller concentration in biostimulated variants, compared to control, which is no treated with GIBB A3 gibberellin phytohormone. The differences between macro- and microelements concentrations in both studied maize hybrids (Turda Star and Turda 200) are statistically assured at different significance thresholds, for majority of macro- and macroelements analyzed in this study.
� Simple correlations, of different intensities, from very weak to very strong, are emphasized in studied maize hybrids, Turda Star and Turda 200. Negative moderate correlations are reported between K concentrations in biostimulated and no biostimulated experimental variants in both Turda Star (R = -0.463) and Turda 200 (R = -0.534) hybrids, while between P concentrations, also negative but weak to moderate correlations are established in Turda Star (R = -0.297) and Turda 200 (R = -0.279).
� The PCA shows, in both studied maize hybrids, Turda Star, and Turda 200, respectively that the same two principal factors are identified. In both cases, Factor 1 is represented by the technology of culture, explains the biggest part of variance (53.28% in Turda Star hybrid, and 51.12% in Turda 200 hybrid), and it is stronger correlated to experimental variables (studied macroelements – K, P, S, Mg, Cl, Ca, and microelements – Fe, Mn, Zn), compared to the other principal factor, Factor 2. This last one, Factor 2, represented by the biostimulation practice, performed in our case with GIBB A3 gibberellin phytohormone, explains 18.17% of variance in Turda Star maize hybrid, and 15.13% in Turda 200 Maize hybrid. Whatever maize hybrid, the biostimulation practice influences at greater extent the K
concentrations in maize. Our results, also show the influence of biostimulation with GIBB A3 gibberellin phytohormone on plant physiology, reflected by decrease of K, and P concentrations, with role in plant transpiration.
� Further research is needed in order to establish correlations, and explain interrelationships between maize hybrids development, plant macro- and microelemental content, and physiological traits, and also.
REFERENCES Davière J.M., Achard P., 2013. Gibberellin signaling
plants. Developmet, 140, p. 1147-1151. Durgbansi A., Arbona V., Pozo O., Miersch O., Sancho
J.V., Cadenas A.G., 2005. Simultaneous Determination of Multiple Phytohormones in Plant Extracts by liquid Chromatography-Electrospray Tandem Mass Spectrosopy. Journal of Agricultural and Food Chemistry, 53 (22), p. 8437-8442.
Gupta R., Chakrabarty S.K., 2013. Gibberelinic acid in plant. Plant Signaling&Behavior, 8(9), e255041-255045
Hedden P., Thomas S.G., 2012. Gibberellin biosynthesis and its regulation. Biochemical Jurnal, 444 (1), p. 11-25.
Hedden P., Sponsel V., 2015. A Centrury of Gibberellin Research. Journal of Plant Growth Regulation, 34, p. 740-760.
Iqbal N., Umar S., Khan N.A., Khan M.I.R., 2014. A new perspective of phytohormones in salinity tolerance: regulation of proline metabolism. Environmental and Experimental Botany, 100, p. 34-42.
Kazan K., 2015. Diverse roles of jasmonates and ethylene in abiotic stress tolerance. Trends in Plant Science, 20, p. 219–229.
Kaya C., Tuna A.L., Alves A.A.C., 2006. Gibberellinic acid impoves water deficit tolerance in maize plants. Acta Physiologiae Plantarum, 28 (4), p. 331-337.
Kefeli V.I., Kalevitch, 2013. Natural Growth Inhibitors and Phytohormones in Plants and Environment, 2010. Kluwer Academic Publishers, Dordrecht/Boston/London.
Lambers H., Chapin III F.S., Pons T.L., 2008. Plant Physiological Ecology. Springer Science + Business Media, LLC.
Liu S., Chen W., Qu L., gai Y., Jiang X., 2013. Simultaneous determination of 24 or more acidic and alkaline phtohormones in femtomole quantities of plant tissues by high-performance liquid-chromatography-electrospray ionization-in trap mass spectrometry. Analytical and Bioanalytical Chemistry, 405 94), p. 1275-1266.
Mori I.C., Ikeda Y., Matsuura T., Hirayama T., Mikami K., 2017. Phytohormones in red seaweeds: a technical review of methods for analysis and a consideration of genomic data. Botanica Marina, 60 (2), p. 153-170.
Pandey N., Iqbal Z., Pandey B.K., Sawant S.V., 2017. Phytohormones and Drought Stress: Plant Responses to Transcriptional Regulation, in Mechanism of Plant Hormone Signaling under Stress. In: (Pandey G.K. (Ed.), John Wiley & Sons, Inc., John Wiley & Sons, Inc., Hoboken, NJ, USA. doi: 10.1002/9781118889022.ch34.
Suge H., Arita S., Takahashi H., Takaki H., 1986. Gibberellin Relationships in Zinc-Deficient Plants. Plant and Cell Physiology, 27 (6), p. 1005-1012.
Tripathi D., Thakuri B. K. C. Kumar D., 2017. Role of Multiple Phytohormones in Regulating Stress Responses in Plants, in Mechanism of Plant Hormone Signaling under Stress. In: Pandey G.K. (Ed.), John Wiley & Sons, Inc., Hoboken, NJ, USA. doi: 10.1002/9781118889022.ch33.
Wani S.H., Kumar V., Shriram V., Sah S.K., 2016, Phytohormones and their metabolic engineering for abiotic stress tolerance in crop plants. The Crop Journal, 4, p. 162-176.
Weyers J.D.B., Paterson N.V., 2001. Plant hormones and the control of physiological processes. Ne Phytologist, 152 (3), p. 375-407.
Yin C.C., Ma B., Collinge D.P., Pogson B.J., He S.J., Xiong Q., Zhang J.S., 2015. Ethylene responses in rice roots and coleoptiles are differentially regulated by a carotenoid isomerase-mediated abscisic acid pathway. Plant Cell, 27, p. 1061–1081.
Zawaski C., Busov V.B., 2014. Roles of Gibberellin Catabolism and Signaling in Growth and Physiological response to Drought and Short-Day.
***Photoperiods in Populus Trees, PLoS ONE 9(1): 1-12***, Rajkumar Biology: A guide for 11th&12th CBSE Students, http://rajkumarbiology.weebly.com/ class-11-chap-15.html.
***http://www.agrovet1.ro/royal-flo-42-s-arysta/. ***http://www.giberelina.ro. ***http://www.pestcontrol-expert.ro/chemtura-vitavax-
200-ff.html.
146
ion exchange. The major contaminants encountered in milk and other food products chiefly include pesticide residues, heavy metals, and aflatoxin M1. Milk may get contaminated before milking from the cattle feed, sources/materials employed during the milk processing and inappropriate handling of milk during the pre- and post-processing period. It will ultimately lead to magnification of the specific metal or related contaminants in the finished product. The bioquenching/biosorption abilities of LAB will help to formulate natural treatments to decrease metal toxicity from drinking water, dairy and food products as well as within human body through development of functional foods and nutraceuticals. Key words: heavy metals, lactobacilli, gut microbiota, bioquenching, biosorption, detoxification. INTRODUCTION Heavy metals are widespread in nature. The rapid development of industrialization has resulted significant quantities of heavy metals release into the environment which is a serious hazard for mankind as well as animals. Cadmium (Cd+2), copper (Cu+2), lead (Pb+2), zinc (Zn+2), chromium (Cr+2), arsenic (As+2), mercury (Hg) and nickel (Ni+2) are highly toxic metals ions to which people are exposed primarily through food and water. Heavy metal depositions are associated with a wide range of sources such as industries, vehicles and pesticides which can significantly affect the safety and quality of food (Fertmann et al., 2004). With rapid increase in the consumption of canned food products throughout the world, the possibility of food contamination with different metals is expected. Metals used in food packaging material or food processing equipment may contribute to contamination. Migration of compounds from packaging materials like metal cans into packaged food is well known (Mrvcic et al., 2012). Increased
environmental metallic load is of serious concern. Prolonged consumption of unsafe concentrations of heavy metals in foodstuffs may disrupt the normal functioning of human body. Heavy metal accumulation gives rise to toxic concentrations in the body, while a number of elements (e.g. cadmium, chromium, arsenic) act as carcinogens and others (e.g. mercury and lead) are associated with develop-mental abnormalities in children (Canfield et al., 2003; Jarup and Alfven, 2004). Methods for removing metal ions from aqueous solution mainly consist of physical, chemical and biological technologies. Conventional methods like ion exchange, precipitation, floc-culation, membrane filtration etc., are employ-yed for removal of metals from water at low concentrations. However, these available methods claimed to be expensive and ineffi-cient, especially for developing nations where major pollution occurs. This has led researchers to seek alternative solutions for deconta-minating heavy metals from surrounddings. Over past decade, a vast array of natural biolo-gical material, especially bacteria, algae, yeasts
AgroLife Scientific Journal - Volume 6, Number 2, 2017ISSN 2285-5718; ISSN CD-ROM 2285-5726; ISSN ONLINE 2286-0126; ISSN-L 2285-5718 and fungi has gained much attention for resol-
ving problem of heavy metal contamination. Bacterial species, such as Bacillus, Pseudomonas, Escherichia, Micrococcus, etc., have been tested for uptake of metals or organics. Bacteria may either possess the capacity for biosorption of many elements or, alternatively, may be element specific depen-ding on the species (Wang and Chen, 2009). Biosorption can be described as the process to remove metal or metalloid types, compounds and particulates from solution by biological material (Gadd, 1993). Use of inactivated microbial biomass as an adsorbent or biosorp-tive agent, has been suggested as an effective and cost-effective alternative for the exclusion of heavy metals from water, and the removal of a number of different minerals by altering microbiota have has been studied (Davis et al., 2003; Mehta and Gaur, 2005). These biosor-bents possess metal-sequestering traits and can be employed to reduce the concentration of heavy metal ions in solution from ppm to ppb level. Biosorbent can efficiently sequester dissolved metal ions out of dilute complex solutions with high efficiency and swiftly, thus it can considered as an ideal candidate for the treatment of high volume and low concentration complex wastewaters (Wang and Chen, 2006). Many researchers have described the bioquenching or chelating property as an efficient and economical alternative in heavy metal removal from water and food (Bezawada and Rao, 2011). However, when it comes to food industry, it is of much concern regarding food safety and quality. Hence, approaches made to select metal ions induced stress resistant food grade bacterial group. In this context, one of the significant food grade bacterial groups known as lactic acid bacteria (LAB), appears a vital alternate. LAB as starter culture in food industry must be suitable for large-scale industrial production and possesses the ability to survive in unfavourable processes and storage conditions. In current scenario, much attention is devoted to research of health aspects of LAB related to food fermentations or as probiotics. Above all, LAB has gained Generally Regarded as Safe (GRAS) status. It has been described that probiotic bacteria have the capacity to bind many toxic compounds like food-borne
mutagens (Turbic et al., 2002), microbial toxins such as aflatoxins and microcystin-LR (Haskard et al., 2001; Meriluoto et al., 2005; Zoghi et al., 2014) in aqueous solution. Moreover, within the microenvironment of gastro-intestinal tract also several probiotic bacteria could bind with aflatoxin B1 (El-Nezami et al., 2000, 2006) and food-borne mutagen Trp-P-2 (Orrhage et al., 2002), thereby reducing their uptake. Few studies reported metal chelating properties of LAB. Probiotic LAB had proven to bind cadmium from water (Halttunen et al., 2003). On the other hand, the LAB interactions with metal ions and their possible applications have received less attention. Binding of heavy metals on the LAB could be a promising solution for the removal of toxic heavy metals from water, liquid food and from the body (Schut et al., 2011) while leaching of trace elements could enhances the value of fermented foods. The significance of food grade bacteria as metal quenchers in dairy and food industry is schematically represented in Figure 1. Current review briefly discusses results demonstrating the new field of LAB application in detoxification processes as well as enhancing the nutritional value of food.
Figure 1. Functions of Food grade bacteria as metal
quenchers to improve food safety and quality MECHANISMS PROPOSED FOR BIOQUENCHING OF HEAVY METALS IN LACTIC ACID BACTERIA The interaction of microorganism with metals to remove heavy metals from contaminated sites represents a unique process. Microorga-nisms have evolved several strategies to either transform the element to a less harmful form, or

147
LACTIC ACID BACTERIA AS METAL QUENCHERS TO IMPROVE FOOD SAFETY AND QUALITY
Ami PATEL1, Aparna SV1, Nihir SHAH1, Deepak Kumar VERMA2
1Division of Dairy and Food Microbiology, Mansinhbhai Institute of Dairy & Food Technology-MIDFT, Dudhsagar Dairy campus, Mehsana-384 002, Gujarat state, India
2Agricultural and Food Engineering Department, Indian Institute of Technology Kharagpur, Kharagpur 721 302, West Bengal, India
Emails: [email protected]; [email protected]; [email protected]; [email protected]
Corresponding author email: [email protected] Abstract Lactic acid bacteria (LAB) have long history of safe use in diverse fermented dairy and food products and offers health enlivening possessions as probiotics. Apart from this, recently, several Lactobacillus and Bifidobacterium spp. have been found to bind with metal ions through metabolism independent mechanism like surface binding by adsorption and ion exchange. The major contaminants encountered in milk and other food products chiefly include pesticide residues, heavy metals, and aflatoxin M1. Milk may get contaminated before milking from the cattle feed, sources/materials employed during the milk processing and inappropriate handling of milk during the pre- and post-processing period. It will ultimately lead to magnification of the specific metal or related contaminants in the finished product. The bioquenching/biosorption abilities of LAB will help to formulate natural treatments to decrease metal toxicity from drinking water, dairy and food products as well as within human body through development of functional foods and nutraceuticals. Key words: heavy metals, lactobacilli, gut microbiota, bioquenching, biosorption, detoxification. INTRODUCTION Heavy metals are widespread in nature. The rapid development of industrialization has resulted significant quantities of heavy metals release into the environment which is a serious hazard for mankind as well as animals. Cadmium (Cd+2), copper (Cu+2), lead (Pb+2), zinc (Zn+2), chromium (Cr+2), arsenic (As+2), mercury (Hg) and nickel (Ni+2) are highly toxic metals ions to which people are exposed primarily through food and water. Heavy metal depositions are associated with a wide range of sources such as industries, vehicles and pesticides which can significantly affect the safety and quality of food (Fertmann et al., 2004). With rapid increase in the consumption of canned food products throughout the world, the possibility of food contamination with different metals is expected. Metals used in food packaging material or food processing equipment may contribute to contamination. Migration of compounds from packaging materials like metal cans into packaged food is well known (Mrvcic et al., 2012). Increased
environmental metallic load is of serious concern. Prolonged consumption of unsafe concentrations of heavy metals in foodstuffs may disrupt the normal functioning of human body. Heavy metal accumulation gives rise to toxic concentrations in the body, while a number of elements (e.g. cadmium, chromium, arsenic) act as carcinogens and others (e.g. mercury and lead) are associated with develop-mental abnormalities in children (Canfield et al., 2003; Jarup and Alfven, 2004). Methods for removing metal ions from aqueous solution mainly consist of physical, chemical and biological technologies. Conventional methods like ion exchange, precipitation, floc-culation, membrane filtration etc., are employ-yed for removal of metals from water at low concentrations. However, these available methods claimed to be expensive and ineffi-cient, especially for developing nations where major pollution occurs. This has led researchers to seek alternative solutions for deconta-minating heavy metals from surrounddings. Over past decade, a vast array of natural biolo-gical material, especially bacteria, algae, yeasts
and fungi has gained much attention for resol-ving problem of heavy metal contamination. Bacterial species, such as Bacillus, Pseudomonas, Escherichia, Micrococcus, etc., have been tested for uptake of metals or organics. Bacteria may either possess the capacity for biosorption of many elements or, alternatively, may be element specific depen-ding on the species (Wang and Chen, 2009). Biosorption can be described as the process to remove metal or metalloid types, compounds and particulates from solution by biological material (Gadd, 1993). Use of inactivated microbial biomass as an adsorbent or biosorp-tive agent, has been suggested as an effective and cost-effective alternative for the exclusion of heavy metals from water, and the removal of a number of different minerals by altering microbiota have has been studied (Davis et al., 2003; Mehta and Gaur, 2005). These biosor-bents possess metal-sequestering traits and can be employed to reduce the concentration of heavy metal ions in solution from ppm to ppb level. Biosorbent can efficiently sequester dissolved metal ions out of dilute complex solutions with high efficiency and swiftly, thus it can considered as an ideal candidate for the treatment of high volume and low concentration complex wastewaters (Wang and Chen, 2006). Many researchers have described the bioquenching or chelating property as an efficient and economical alternative in heavy metal removal from water and food (Bezawada and Rao, 2011). However, when it comes to food industry, it is of much concern regarding food safety and quality. Hence, approaches made to select metal ions induced stress resistant food grade bacterial group. In this context, one of the significant food grade bacterial groups known as lactic acid bacteria (LAB), appears a vital alternate. LAB as starter culture in food industry must be suitable for large-scale industrial production and possesses the ability to survive in unfavourable processes and storage conditions. In current scenario, much attention is devoted to research of health aspects of LAB related to food fermentations or as probiotics. Above all, LAB has gained Generally Regarded as Safe (GRAS) status. It has been described that probiotic bacteria have the capacity to bind many toxic compounds like food-borne
mutagens (Turbic et al., 2002), microbial toxins such as aflatoxins and microcystin-LR (Haskard et al., 2001; Meriluoto et al., 2005; Zoghi et al., 2014) in aqueous solution. Moreover, within the microenvironment of gastro-intestinal tract also several probiotic bacteria could bind with aflatoxin B1 (El-Nezami et al., 2000, 2006) and food-borne mutagen Trp-P-2 (Orrhage et al., 2002), thereby reducing their uptake. Few studies reported metal chelating properties of LAB. Probiotic LAB had proven to bind cadmium from water (Halttunen et al., 2003). On the other hand, the LAB interactions with metal ions and their possible applications have received less attention. Binding of heavy metals on the LAB could be a promising solution for the removal of toxic heavy metals from water, liquid food and from the body (Schut et al., 2011) while leaching of trace elements could enhances the value of fermented foods. The significance of food grade bacteria as metal quenchers in dairy and food industry is schematically represented in Figure 1. Current review briefly discusses results demonstrating the new field of LAB application in detoxification processes as well as enhancing the nutritional value of food.
Figure 1. Functions of Food grade bacteria as metal
quenchers to improve food safety and quality MECHANISMS PROPOSED FOR BIOQUENCHING OF HEAVY METALS IN LACTIC ACID BACTERIA The interaction of microorganism with metals to remove heavy metals from contaminated sites represents a unique process. Microorga-nisms have evolved several strategies to either transform the element to a less harmful form, or

148
bind the metal intra- or extra-cellularly thereby preventing any harmful interactions in the host cell or by actively transporting the metal out of the cell cytosol. Metal ions quenching by LAB, as well as other microorganisms, is a complex process that depends on the two basic mecha-nisms; (i) biosorption—the passive no metabo-lically mediated binding process of metal ions to the LAB cell wall, and (ii) bioaccu-mulation—process associated with metabolism in which metal ions pass the cell membrane and accumulate inside the cell (Mrvcic et al., 2012). Usually Gram-positive bacteria have high adsorptive capacity, particularly due to high peptidoglycan and teichoic acid content in their cell walls. Certain Gram-positive gut micro-flora like lactobacilli used in food applications may potentially be an adjunct for reducing metal toxicity in individuals. Generally such bacteria have resistance mechanisms which are effective in preventing damage to cell itself and they can attach and sequester metal ions to cell surfaces (Sinha et al., 2011). Hydroxyl groups from the peptidoglycan and functional groups (mainly carboxyl group) of proteins have the important roles in metal ions binding by LAB, too (Mrvcic et al., 2012; Lin et al., 2005; Gerbino et al., 2011). Physical forces like electrostatic interactions are also responsible for passive binding of heavy metals on LAB surface (Salim et al., 2011). LAB metabolites including organic acids, exopolysaccharides, etc. also enhanced heavy metal biosorption efficacy of specific strains. Organic acids may chelate toxic metals (Gavin et al., 1998), producing metallo-organic molecules. Organic acids reduce the pH of environment, which lead to increases the solubilisation of metal compounds and leaching of metals from their surfaces whereas it is predicted that functional carboxyl groups found on microbial polymers can be biosorbed or complexed with heavy metals (Perpetuo et al., 2011). Apart from the cell wall structure, some physicochemical parameters such as initial concentration of metal ions, pH, biosorbent concentration, contact time, and variation of temperature can also affect the biosorption process (Mrvcic et al., 2012). The detoxification of organic mercury in bacteria involves conversion of methylated mercury to inorganic mercury (Hg+2), which does not
absorbed well in the GI tract, and then to Hg0, which is poorly absorbed (Monachese et al., 2012). STUDIES REGARDING BIOQUENCHING OF HEAVY METALS IN LACTIC ACID BACTERIA Urban and Kuthan, in 2004 reported xenobiotic detoxification therapy by probiotic. Authors assumed that probiotic bacteria could be used to decrease the heavy metals intake in humans directly in the lumen of intestine. Halttunen and co-workers (2003), have extensively investigated cadmium, lead and arsenic binding by different LAB and indicated that food and water are the primary sources of this metal ions exposure among the non-smoking population. Halttunen et al. (2007) carried out work on removal of cadmium and lead by specific LAB; Lactobacillus rhamnosus GG (ATCC 53103), L. casei Shirota, L. fermentum ME3, Bifidobacterium longum 2C, B. longum 46 and B. lactis Bb12, and two commercial starter cultures: FVDVS XT-303-eXact (Lactococcus lactis subsp. cremoris, Lc. lactis subsp. lactis, Leuconostoc mesenteroides subsp. cremoris, Leuc. pseudomesenteroides and Lc. lactis subsp. lactis biovar. diacetylactis) and YO-MIX 401 (Streptococcus thermophilus and L. bulgaricus) from water. They found signi-ficant removal which was found to be more specific to strain and metal, both. The removal was a rapid, metabolism-independent surface process. It was also strongly influenced by pH, indicative of involvement of ion exchange mechanisms. The most effective metal removers were B. longum 46, L. fermentum ME3 and B. lactis Bb12. The highest maximum cadmium and lead removal capacities obtained for strain B. longum 46 were 54.7 and 175.7 mg metal per g of dry biomass, respectively. Kumar and Rao (2011) compared the efficiency of free and immobilized cells of Saccharomyces cerevisiae and L. sporogenes for the removal of heavy metals (Cu+2 and Pb+2 ions) from the aqueous system. The key factors such as pH, temperature, incubation time, and initial concentration of biomass were verified for process optimization. The best results were obtained for co-immobilized and immobilized cells than free cells. Selected micro-organisms exhibited maximum removal at an optimum
concentration of 1 mg/mL, optimal time of 180 min, optimum temperature of 350C and pH 4-6. In a recent study, Rayes (2012) examined the effect of probiotic lactic acid bacteria; L. rhamnosus GG, L. fermentum ME3, L. bulgaricus (Commercial strain) and L. acidophilus X 37 in removal of lead, cadmium and copper from cultured water in fish farming system for marine tilapia T. spilurus, and in addition he studied the effect of heavy metals lead and cadmium and copper on genotoxicity of tilapia fish as bio-indicator for heavy metal toxicity. The highest total concentration of removal obtained for L. acidophilus X37 (97.6) and subsequently followed by L. rhamnosus GG (74.8), L. fermentum ME3 (71.16) and L. bulgaricus (61.00). It was found that the optimal pH for L. fermentum ME3, L. rhamnosus GG, and L. acidophilus X37 was 6.0 while for L. bulgaricus, it was 5.0. The percentage removal of heavy metals depend on temperature where, the highest activity obtained at temperature between 25oC and 37oC then the activity was declined at 43oC. Bhakta and co-workers (2012) found out in their study that 26 probiotic LAB exhibited remarkable variations in their metal resistance as well as metal removal aptitudes. Of 26, seven strains (Cd54-2, Cd61-7, Cd69-12, Cd70-13, Pb82-8, Pb96-19 and Cd109-16) and four strains (Pb71-1, Pb73-2, Pb85-9 and Pb96-19) displayed relatively elevated cadmium- and lead-removal competences from water, respect-tively, in compared to the remaining strains. Strains Cd70-13 showed the highest cadmium (25%) and Pb71-1 showed the highest lead (59%) removal capacity from MRS (De Man, Rogosa and Sharpe) culture medium among all tested strains and demonstrated superior adhesive ability on fish mucus. A phylogenetic investigation of 16S rDNA sequences suggested that the two strains Cd70-13 and Pb71-1 were belonged to L. reuteri. The surface molecules of LAB have been reported to bind with heavy metals passively mainly through electrostatic interactions. The supplementation of LAB to heavy metals treated group of rats, considerably enhanced the glutathione peroxidise activity together with the ratio of body weight and feed efficiency; and also lifted up liver and kidney functions (Salim et al., 2011). Beneficial health effects of LAB
may be attributed to their aptitude to bind cadmium and lead that led to remove metal toxicity. On the other hand, Battikh et al. (2011) established a reduction in negative effects of cadmium on the iron distribution in tissues and organs of broiler chicken in the presence of LAB. Copper bioquenching In a study performed by Mrvcic et al. (2012), L. brevis was found to be the most resistant strain to copper; accumulated high concentration of Cu among all other tested strains. In previous study by the same researchers L. brevis was the most effective in copper binding with 26.5 mg/g followed by Leuc. mesenteroides (26 mg/g) and L. plantarum (15.5 mg/g) (Mrvcic et al., 2009a, b). On the other hand, Yilmaz et al., (2010) reported highest removal by E. faecium (106 mg/g). During cheese manufacturing, the influence of copper ions on LAB is highly significant. Swiss cheese Emmental is produced in particular vats made up of copper metal; thus, during cheese manufacturing process the copper ions can leach out in milk and influenced the growth of LAB due to acid production (Rodriguez and Alatossava, 2008). While determining antioxidant potential of few LAB, Lee et al., (2005) revealed that L. casei strains showed a wide range of Fe+2 and Cu+2 chelating ability, from 1.1 to 10.6 ppm and from 1.35 to 21.8 ppm among the tested strains. In that, L. casei KCTC 3260 exhibited the higher metal ion chelating ability followed by L. rhamnosus GG. Conversely, strain L. casei KCTC 3109 showed lower chelating activity for both Fe+2 and Cu+2 metal ions at 1.1 ppm and 1.35 ppm, respectively. Chang and Kikuchi, (2013) developed an environmental friendly process in that heavy metals like chromium, copper, and arsenic in the Chromated Copper Arsenate (CCA)-treated wood were able to be extracted through organic acids, in particular pyruvate and lactate produced by Str. thermophilus NBRC13957, L. acidophilus NBRC13951, L. bulgaricus NBRC13953, and L. plantarum NBRC15891. Iron and Zinc bioquenching LAB were considered to be a bacterial group having no iron requirement. LAB belonging to Lactobacillus, Carnobacterium, Lactococcus,

149
bind the metal intra- or extra-cellularly thereby preventing any harmful interactions in the host cell or by actively transporting the metal out of the cell cytosol. Metal ions quenching by LAB, as well as other microorganisms, is a complex process that depends on the two basic mecha-nisms; (i) biosorption—the passive no metabo-lically mediated binding process of metal ions to the LAB cell wall, and (ii) bioaccu-mulation—process associated with metabolism in which metal ions pass the cell membrane and accumulate inside the cell (Mrvcic et al., 2012). Usually Gram-positive bacteria have high adsorptive capacity, particularly due to high peptidoglycan and teichoic acid content in their cell walls. Certain Gram-positive gut micro-flora like lactobacilli used in food applications may potentially be an adjunct for reducing metal toxicity in individuals. Generally such bacteria have resistance mechanisms which are effective in preventing damage to cell itself and they can attach and sequester metal ions to cell surfaces (Sinha et al., 2011). Hydroxyl groups from the peptidoglycan and functional groups (mainly carboxyl group) of proteins have the important roles in metal ions binding by LAB, too (Mrvcic et al., 2012; Lin et al., 2005; Gerbino et al., 2011). Physical forces like electrostatic interactions are also responsible for passive binding of heavy metals on LAB surface (Salim et al., 2011). LAB metabolites including organic acids, exopolysaccharides, etc. also enhanced heavy metal biosorption efficacy of specific strains. Organic acids may chelate toxic metals (Gavin et al., 1998), producing metallo-organic molecules. Organic acids reduce the pH of environment, which lead to increases the solubilisation of metal compounds and leaching of metals from their surfaces whereas it is predicted that functional carboxyl groups found on microbial polymers can be biosorbed or complexed with heavy metals (Perpetuo et al., 2011). Apart from the cell wall structure, some physicochemical parameters such as initial concentration of metal ions, pH, biosorbent concentration, contact time, and variation of temperature can also affect the biosorption process (Mrvcic et al., 2012). The detoxification of organic mercury in bacteria involves conversion of methylated mercury to inorganic mercury (Hg+2), which does not
absorbed well in the GI tract, and then to Hg0, which is poorly absorbed (Monachese et al., 2012). STUDIES REGARDING BIOQUENCHING OF HEAVY METALS IN LACTIC ACID BACTERIA Urban and Kuthan, in 2004 reported xenobiotic detoxification therapy by probiotic. Authors assumed that probiotic bacteria could be used to decrease the heavy metals intake in humans directly in the lumen of intestine. Halttunen and co-workers (2003), have extensively investigated cadmium, lead and arsenic binding by different LAB and indicated that food and water are the primary sources of this metal ions exposure among the non-smoking population. Halttunen et al. (2007) carried out work on removal of cadmium and lead by specific LAB; Lactobacillus rhamnosus GG (ATCC 53103), L. casei Shirota, L. fermentum ME3, Bifidobacterium longum 2C, B. longum 46 and B. lactis Bb12, and two commercial starter cultures: FVDVS XT-303-eXact (Lactococcus lactis subsp. cremoris, Lc. lactis subsp. lactis, Leuconostoc mesenteroides subsp. cremoris, Leuc. pseudomesenteroides and Lc. lactis subsp. lactis biovar. diacetylactis) and YO-MIX 401 (Streptococcus thermophilus and L. bulgaricus) from water. They found signi-ficant removal which was found to be more specific to strain and metal, both. The removal was a rapid, metabolism-independent surface process. It was also strongly influenced by pH, indicative of involvement of ion exchange mechanisms. The most effective metal removers were B. longum 46, L. fermentum ME3 and B. lactis Bb12. The highest maximum cadmium and lead removal capacities obtained for strain B. longum 46 were 54.7 and 175.7 mg metal per g of dry biomass, respectively. Kumar and Rao (2011) compared the efficiency of free and immobilized cells of Saccharomyces cerevisiae and L. sporogenes for the removal of heavy metals (Cu+2 and Pb+2 ions) from the aqueous system. The key factors such as pH, temperature, incubation time, and initial concentration of biomass were verified for process optimization. The best results were obtained for co-immobilized and immobilized cells than free cells. Selected micro-organisms exhibited maximum removal at an optimum
concentration of 1 mg/mL, optimal time of 180 min, optimum temperature of 350C and pH 4-6. In a recent study, Rayes (2012) examined the effect of probiotic lactic acid bacteria; L. rhamnosus GG, L. fermentum ME3, L. bulgaricus (Commercial strain) and L. acidophilus X 37 in removal of lead, cadmium and copper from cultured water in fish farming system for marine tilapia T. spilurus, and in addition he studied the effect of heavy metals lead and cadmium and copper on genotoxicity of tilapia fish as bio-indicator for heavy metal toxicity. The highest total concentration of removal obtained for L. acidophilus X37 (97.6) and subsequently followed by L. rhamnosus GG (74.8), L. fermentum ME3 (71.16) and L. bulgaricus (61.00). It was found that the optimal pH for L. fermentum ME3, L. rhamnosus GG, and L. acidophilus X37 was 6.0 while for L. bulgaricus, it was 5.0. The percentage removal of heavy metals depend on temperature where, the highest activity obtained at temperature between 25oC and 37oC then the activity was declined at 43oC. Bhakta and co-workers (2012) found out in their study that 26 probiotic LAB exhibited remarkable variations in their metal resistance as well as metal removal aptitudes. Of 26, seven strains (Cd54-2, Cd61-7, Cd69-12, Cd70-13, Pb82-8, Pb96-19 and Cd109-16) and four strains (Pb71-1, Pb73-2, Pb85-9 and Pb96-19) displayed relatively elevated cadmium- and lead-removal competences from water, respect-tively, in compared to the remaining strains. Strains Cd70-13 showed the highest cadmium (25%) and Pb71-1 showed the highest lead (59%) removal capacity from MRS (De Man, Rogosa and Sharpe) culture medium among all tested strains and demonstrated superior adhesive ability on fish mucus. A phylogenetic investigation of 16S rDNA sequences suggested that the two strains Cd70-13 and Pb71-1 were belonged to L. reuteri. The surface molecules of LAB have been reported to bind with heavy metals passively mainly through electrostatic interactions. The supplementation of LAB to heavy metals treated group of rats, considerably enhanced the glutathione peroxidise activity together with the ratio of body weight and feed efficiency; and also lifted up liver and kidney functions (Salim et al., 2011). Beneficial health effects of LAB
may be attributed to their aptitude to bind cadmium and lead that led to remove metal toxicity. On the other hand, Battikh et al. (2011) established a reduction in negative effects of cadmium on the iron distribution in tissues and organs of broiler chicken in the presence of LAB. Copper bioquenching In a study performed by Mrvcic et al. (2012), L. brevis was found to be the most resistant strain to copper; accumulated high concentration of Cu among all other tested strains. In previous study by the same researchers L. brevis was the most effective in copper binding with 26.5 mg/g followed by Leuc. mesenteroides (26 mg/g) and L. plantarum (15.5 mg/g) (Mrvcic et al., 2009a, b). On the other hand, Yilmaz et al., (2010) reported highest removal by E. faecium (106 mg/g). During cheese manufacturing, the influence of copper ions on LAB is highly significant. Swiss cheese Emmental is produced in particular vats made up of copper metal; thus, during cheese manufacturing process the copper ions can leach out in milk and influenced the growth of LAB due to acid production (Rodriguez and Alatossava, 2008). While determining antioxidant potential of few LAB, Lee et al., (2005) revealed that L. casei strains showed a wide range of Fe+2 and Cu+2 chelating ability, from 1.1 to 10.6 ppm and from 1.35 to 21.8 ppm among the tested strains. In that, L. casei KCTC 3260 exhibited the higher metal ion chelating ability followed by L. rhamnosus GG. Conversely, strain L. casei KCTC 3109 showed lower chelating activity for both Fe+2 and Cu+2 metal ions at 1.1 ppm and 1.35 ppm, respectively. Chang and Kikuchi, (2013) developed an environmental friendly process in that heavy metals like chromium, copper, and arsenic in the Chromated Copper Arsenate (CCA)-treated wood were able to be extracted through organic acids, in particular pyruvate and lactate produced by Str. thermophilus NBRC13957, L. acidophilus NBRC13951, L. bulgaricus NBRC13953, and L. plantarum NBRC15891. Iron and Zinc bioquenching LAB were considered to be a bacterial group having no iron requirement. LAB belonging to Lactobacillus, Carnobacterium, Lactococcus,

150
Leuconostoc, and Pediococcus genera do not produce siderophores (Pandey et al., 1994). Also, there was no noteworthy growth stimulation when lactic cultures were grown in either iron supplemented or iron depleted media (Imbert and Blondeau, 1998). Recently, genome sequences of L. sakei 23 K and L. lactis MG1363 have shown that LAB have genetic equipment involved in iron transport. The strain L. sakei 23 K had shown to possess some putative iron transport systems plus transcriptional regulators belonging to the Fur family. Iron is dispensable for the growth of L. sakei, but as suggested by Duhutrel et al., (2010) during sausage fermentation, iron sources present in the meat are highly beneficial for L. sakei sustaining long-term survival in such meat products. Zinc is both vital in trace amounts and toxic at high concentrations like some other metals. The emergence of new knowledge about the beneficial effects of zinc on human health is also interesting (Stefanidou, 2006). A group of researchers observed that zinc can increase L. plantarum probiotic effect in the intestine as the number of pathogenic E. coli was significantly reduced if Zn-sulphate and Zn-propionate was added with L. plantarum in laboratory mice (Mudronova et al., 2004). In another study, Leuc. mesenteroides was the most effective in zinc binding with 27 mg/g as compared to L. brevis and L. plantarum, 20 and 10 mg/g respectively (Mrvcic et al., 2009a, b). In model lactic strain, Lc. lactis IL1403, ZitSQP is an ABC transporter supposed to be involved in high-affinity zinc uptake (Bolotin et al., 2001). However, very little information is available on systems for zinc uptake, storage and efflux in LAB. In a recent experiment, Sofu et al., (2015) ob-served 90-100% Fe+2 and 70-90 % Zn+2 removal with all tested biomasses of LAB (L. delbrueckii ssp. bulgaricus Lb-12, Str. thermophilus STM-7) under optimal value of process parameters.
Arsenic, Cadmium and Lead bioquenching When arsenic-contaminated water is used for irrigation, arsenic accumulates in crops prior to consumption and can reach dangerous levels in finished food. In contrast to arsenic, lead and cadmium are cationic. Although they are
unique elements with different molecular weights, as well as difference in physiological effects and occurrences in nature, studies on lead and cadmium are often conducted together, as the elements seem to react alike with bacterial species. Lead contamination of drinking water is frequently due to corrosion of lead-containing plumbing while food is the most important source of cadmium exposure among the non-smoking population. In particular, children are exposed to lead via ingestion of dust, soil and lead containing paints. Lead (Wyatt et al., 1998; Fertmann et al., 2004), but rarely cadmium, is found in drinking water at concentrations greater than WHO (2004) guidelines viz.10 μg/l for Pb and 3 μg/l for Cd. Both, cadmium and lead are also found in substantial amount as a result of point contamination, e.g. from industry. Oral exposure to Cd may have many consequences on human health, such as osteoporosis (Jarup and Alfven, 2004), renal damage (Satarug et al., 2011), renal cancer (Waalkes et al., 1999) and possibly prostate cancer (Waalkes et al., 1991). Chronic exposure to even very low cadmium level may perhaps also trigger adverse renal (Jarup et al., 2000) and negative bone effects (Jarup and Alfven, 2004). Alternatively, lead disturbs synthesis of hemoglobin, renal function and causes neurological and behavioural disorder in children (WHO, 1995). In children, very little blood lead concentrations have been linked with intellectual impairment (Canfield et al., 2003). Few strains of L. acidophilus and L. crispatus DSM20584 are known to produce S-layer proteins, which may explain their activity against arsenic (Schar-Zammaretti and Ubbink, 2003). Singh and Sharma (2010) showed that L. acidophilus was competent to bind arsenic and reduce it from water at 50 to 1,000 ppb levels, and the maximum removal occurred within 4 h of exposure in a concentration-dependent manner. In a separate study, Bhakta et al. (2010) employed six strains of probiotic LAB (As99-1, As100-2, As101-3, As102-4, As105-7, and As112-9) for total removal of As, Cd, and Pb which was varied from 25.47 to 41 μg/l, 692.53 to 804.73 μg/l, and 2598 to 4609 μg/l, respectively. The As uptake efficiency of strain
As102-4 (0.006 μg/h/mg wet weight of cell) was higher (17 – 209%) compared to remaining LAB and 16S rDNA sequencing data revealed 97 to 99% (340 bp) homology to Pediococcus dextrinicus or Pd. acidilactici for these six isolates. Ibrahim et al. (2006) also compared the abilities of Propionibacterium freudenreichii and L. rhamnosus LC-705 to bind and absorb cadmium and lead in aqueous solution. They reported a rapid effect of the bacteria to bind maximal amounts of metal after only 1 h of exposure; this was found to influence by pH. Using electron microscopy and Fourier transform infrared spectroscopy (FTIR), for two strains of L. kefir CIDCA 8348 and JCM 5818, the metal precipitations in the cell S-layer and alteration in the secondary structure of the S-layer have been observed in terms of protein arrangement and structure after metal absorption (Gerbino et al., 2011). In a separate study, Zhai et al. (2013) investigated protective effects of L. plantarum CCFM8610 against acute cadmium toxicity in mice. Results revealed that CCFM8610 treatment can effectively decrease intestinal cadmium absorption, reduce accumulation of cadmium in tissues, alleviate renal and hepatic oxidative stress, and ameliorate hepatic histopathological changes as compared to the mice that received cadmium only. Administered living CCFM8610 cells after cadmium exposure offered the most significant protection. Recently, a group of researchers investigated the capability of selected strains of LAB to remove cadmium, lead and arsenic as well as aflatoxin B1 (AFB1) from contaminated water (Elsanhoty et al., 2016). Among all tested LAB, L. acidophilus and B. anglulatum were detected as the most effective heavy metal removers. Chromium, Mercury and Selenium bioquenching Chromium exposure for longer period can generate resistant lactobacilli strains able to better tolerate metals (Upreti et al., 2011). Shrivastava et al. (2003) showed that lactobacilli and other gut-associated bacteria, along with some human immune cells, can transform chromium to its less-toxic form. Studies in mice revealed gut microbiota provided the first line of defence to the body by
converting toxic Cr(VI) to a less-toxic Cr(III). In a recent study, exopolysaccharide obtained from Lactobacillus isolate showed 70% decrease in the concentration of Cr+2 after 20 day incubation period with the heavy metal from waste water (Khan and Dona, 2015). Mercury has a long history of use in human applications, yet due to high toxicity its presence in many products has been phased out. Preliminary studies in laboratory have shown that certain strains of lactobacilli appear to sequester mercury (Monachese et al., 2012). However, no published scientific data on the ability of LAB or gut microbiota to bind and absorb mercury exist yet. Recently, the cell surface proteins of Weissella viridescens MYU 205 showed binding to mercury (Hg+2) using the Hg (II) column assay and later authors identified, a 14 kDa protein that might be acted as mercury binding proteins (Kinoshita et al.,2013). Moreover, W. viridescens MYU 205 showed high biosorption rate for Hg+2 (about 80%) followed by Cd+2 and very low for Zn+2
(Kinoshita et al., 2013; Kinoshita et al., 2015). L. plantarum and L. bulgaricus seems to be the most promising bacteria for nutraceuticals relevance of selenium-enriched lactobacilli (Diowksz et al., 1999; Xia et al., 2007). LAB can accumulate selenium in elemental form owing to activate detoxification mechanism that includes reduction of tetravalent selenium to elemental selenium. In the food industry, the nutritional value of the food product can be enhanced through LAB mediated biotransformation of inorganic form of Se to the organic form (Alzate et al., 2008; Perez-Corona et al., 2011; Penas et al., 2012). During the growth and lactic acid fermentation process, inorganic selenium, which is potentially toxic and poorly bio-available, is transformed to the harmless and highly bio-accessible organic form. Yogurt, cheese, kefir, sauerkraut, bread and wine are the few examples of food products fruitfully enriched with organic selenium by LAB and yeast during the fermentation of Se-enriched raw material. The maximum Se concentration that allows kefir to be fermented was found to be 2.5 µg/g, much lower than the 50 µg/g found for yogurt (Alzate et al., 2008). As suggested by Famularo et al., (2005), the regular intake of probiotic preparations or LAB containing foods may
151
Leuconostoc, and Pediococcus genera do not produce siderophores (Pandey et al., 1994). Also, there was no noteworthy growth stimulation when lactic cultures were grown in either iron supplemented or iron depleted media (Imbert and Blondeau, 1998). Recently, genome sequences of L. sakei 23 K and L. lactis MG1363 have shown that LAB have genetic equipment involved in iron transport. The strain L. sakei 23 K had shown to possess some putative iron transport systems plus transcriptional regulators belonging to the Fur family. Iron is dispensable for the growth of L. sakei, but as suggested by Duhutrel et al., (2010) during sausage fermentation, iron sources present in the meat are highly beneficial for L. sakei sustaining long-term survival in such meat products. Zinc is both vital in trace amounts and toxic at high concentrations like some other metals. The emergence of new knowledge about the beneficial effects of zinc on human health is also interesting (Stefanidou, 2006). A group of researchers observed that zinc can increase L. plantarum probiotic effect in the intestine as the number of pathogenic E. coli was significantly reduced if Zn-sulphate and Zn-propionate was added with L. plantarum in laboratory mice (Mudronova et al., 2004). In another study, Leuc. mesenteroides was the most effective in zinc binding with 27 mg/g as compared to L. brevis and L. plantarum, 20 and 10 mg/g respectively (Mrvcic et al., 2009a, b). In model lactic strain, Lc. lactis IL1403, ZitSQP is an ABC transporter supposed to be involved in high-affinity zinc uptake (Bolotin et al., 2001). However, very little information is available on systems for zinc uptake, storage and efflux in LAB. In a recent experiment, Sofu et al., (2015) ob-served 90-100% Fe+2 and 70-90 % Zn+2 removal with all tested biomasses of LAB (L. delbrueckii ssp. bulgaricus Lb-12, Str. thermophilus STM-7) under optimal value of process parameters.
Arsenic, Cadmium and Lead bioquenching When arsenic-contaminated water is used for irrigation, arsenic accumulates in crops prior to consumption and can reach dangerous levels in finished food. In contrast to arsenic, lead and cadmium are cationic. Although they are
unique elements with different molecular weights, as well as difference in physiological effects and occurrences in nature, studies on lead and cadmium are often conducted together, as the elements seem to react alike with bacterial species. Lead contamination of drinking water is frequently due to corrosion of lead-containing plumbing while food is the most important source of cadmium exposure among the non-smoking population. In particular, children are exposed to lead via ingestion of dust, soil and lead containing paints. Lead (Wyatt et al., 1998; Fertmann et al., 2004), but rarely cadmium, is found in drinking water at concentrations greater than WHO (2004) guidelines viz.10 μg/l for Pb and 3 μg/l for Cd. Both, cadmium and lead are also found in substantial amount as a result of point contamination, e.g. from industry. Oral exposure to Cd may have many consequences on human health, such as osteoporosis (Jarup and Alfven, 2004), renal damage (Satarug et al., 2011), renal cancer (Waalkes et al., 1999) and possibly prostate cancer (Waalkes et al., 1991). Chronic exposure to even very low cadmium level may perhaps also trigger adverse renal (Jarup et al., 2000) and negative bone effects (Jarup and Alfven, 2004). Alternatively, lead disturbs synthesis of hemoglobin, renal function and causes neurological and behavioural disorder in children (WHO, 1995). In children, very little blood lead concentrations have been linked with intellectual impairment (Canfield et al., 2003). Few strains of L. acidophilus and L. crispatus DSM20584 are known to produce S-layer proteins, which may explain their activity against arsenic (Schar-Zammaretti and Ubbink, 2003). Singh and Sharma (2010) showed that L. acidophilus was competent to bind arsenic and reduce it from water at 50 to 1,000 ppb levels, and the maximum removal occurred within 4 h of exposure in a concentration-dependent manner. In a separate study, Bhakta et al. (2010) employed six strains of probiotic LAB (As99-1, As100-2, As101-3, As102-4, As105-7, and As112-9) for total removal of As, Cd, and Pb which was varied from 25.47 to 41 μg/l, 692.53 to 804.73 μg/l, and 2598 to 4609 μg/l, respectively. The As uptake efficiency of strain
As102-4 (0.006 μg/h/mg wet weight of cell) was higher (17 – 209%) compared to remaining LAB and 16S rDNA sequencing data revealed 97 to 99% (340 bp) homology to Pediococcus dextrinicus or Pd. acidilactici for these six isolates. Ibrahim et al. (2006) also compared the abilities of Propionibacterium freudenreichii and L. rhamnosus LC-705 to bind and absorb cadmium and lead in aqueous solution. They reported a rapid effect of the bacteria to bind maximal amounts of metal after only 1 h of exposure; this was found to influence by pH. Using electron microscopy and Fourier transform infrared spectroscopy (FTIR), for two strains of L. kefir CIDCA 8348 and JCM 5818, the metal precipitations in the cell S-layer and alteration in the secondary structure of the S-layer have been observed in terms of protein arrangement and structure after metal absorption (Gerbino et al., 2011). In a separate study, Zhai et al. (2013) investigated protective effects of L. plantarum CCFM8610 against acute cadmium toxicity in mice. Results revealed that CCFM8610 treatment can effectively decrease intestinal cadmium absorption, reduce accumulation of cadmium in tissues, alleviate renal and hepatic oxidative stress, and ameliorate hepatic histopathological changes as compared to the mice that received cadmium only. Administered living CCFM8610 cells after cadmium exposure offered the most significant protection. Recently, a group of researchers investigated the capability of selected strains of LAB to remove cadmium, lead and arsenic as well as aflatoxin B1 (AFB1) from contaminated water (Elsanhoty et al., 2016). Among all tested LAB, L. acidophilus and B. anglulatum were detected as the most effective heavy metal removers. Chromium, Mercury and Selenium bioquenching Chromium exposure for longer period can generate resistant lactobacilli strains able to better tolerate metals (Upreti et al., 2011). Shrivastava et al. (2003) showed that lactobacilli and other gut-associated bacteria, along with some human immune cells, can transform chromium to its less-toxic form. Studies in mice revealed gut microbiota provided the first line of defence to the body by
converting toxic Cr(VI) to a less-toxic Cr(III). In a recent study, exopolysaccharide obtained from Lactobacillus isolate showed 70% decrease in the concentration of Cr+2 after 20 day incubation period with the heavy metal from waste water (Khan and Dona, 2015). Mercury has a long history of use in human applications, yet due to high toxicity its presence in many products has been phased out. Preliminary studies in laboratory have shown that certain strains of lactobacilli appear to sequester mercury (Monachese et al., 2012). However, no published scientific data on the ability of LAB or gut microbiota to bind and absorb mercury exist yet. Recently, the cell surface proteins of Weissella viridescens MYU 205 showed binding to mercury (Hg+2) using the Hg (II) column assay and later authors identified, a 14 kDa protein that might be acted as mercury binding proteins (Kinoshita et al.,2013). Moreover, W. viridescens MYU 205 showed high biosorption rate for Hg+2 (about 80%) followed by Cd+2 and very low for Zn+2
(Kinoshita et al., 2013; Kinoshita et al., 2015). L. plantarum and L. bulgaricus seems to be the most promising bacteria for nutraceuticals relevance of selenium-enriched lactobacilli (Diowksz et al., 1999; Xia et al., 2007). LAB can accumulate selenium in elemental form owing to activate detoxification mechanism that includes reduction of tetravalent selenium to elemental selenium. In the food industry, the nutritional value of the food product can be enhanced through LAB mediated biotransformation of inorganic form of Se to the organic form (Alzate et al., 2008; Perez-Corona et al., 2011; Penas et al., 2012). During the growth and lactic acid fermentation process, inorganic selenium, which is potentially toxic and poorly bio-available, is transformed to the harmless and highly bio-accessible organic form. Yogurt, cheese, kefir, sauerkraut, bread and wine are the few examples of food products fruitfully enriched with organic selenium by LAB and yeast during the fermentation of Se-enriched raw material. The maximum Se concentration that allows kefir to be fermented was found to be 2.5 µg/g, much lower than the 50 µg/g found for yogurt (Alzate et al., 2008). As suggested by Famularo et al., (2005), the regular intake of probiotic preparations or LAB containing foods may

152
serve to enhance the bioavailability of essential elements and proteins with simultaneous reduction of toxic metals in food. CONCLUSIONS AND FUTURE PROSPECTS Lactic acid bacteria have an established role as starter cultures and probiotics in the dairy and food industry. These eco-friendly food grade organisms can be used as an effective bioquen-ching/biosorptive agent to reduce the toxicity of heavy metals from foods and water and ultimately preventing their absorption in the human body. Further, their application in food may improve the bioavailability of trace ele-ments. Though very limited information is available in this direction, the outcomes of different investigations done so far are encou-raging and indicative of prospective use of LAB as detoxifying agent. Nevertheless, exten-sive investigation has to be done to make these processes suitable for industrial applications. CONFLICTS OF INTEREST All contributing authors declare no conflicts of interest. REFERENCES Alzate A., Fernandez-Fernandez A., Perez-Conde C.,
Gutierrez A.M. & Camara C., 2008. Comparison of biotransformation of inorganic selenium by Lactobacillus and Saccharomyces in lactic fermentation process of yogurt and kefir. Journal of Agricultural and Food Chemistry, 56, p. 8728–8736.
Battikh E., Safa A., Niccola M.K. & Aagha S.I., 2011. Effect of Cd and Lactobacillus levels on iron concentration in different organs and meat of broiler chicken Journal of the University of Chemical Technology and Metallurgy, 46(4), p. 381–388.
Bezawada M.K. & Rao V.G., 2011. Removal of Cu2+ and Pb2+ ions from aqueous solutions by free, immobilized and co-immobilized cells of Saccharomyces cerevisiae and Lactobacillus sporogenes. International Journal of Science & Emerging Technologies, 2(3), p. 80-86.
Bhakta J.N., Ohnishi K., Munekage Y. & Iwasaki K., 2010. Isolation and probiotic characterization of arsenic-resistant lactic acid bacteria for uptaking arsenic. International Journal of Chemical and Biological Engineering, 3(4), p. 167-174.
Bhakta J.N., Ohnishi K., Munekage Y., Iwasaki K. & Wei M.Q., 2012. Characterization of lactic acid bacteria based probiotics as potential heavy metal
sorbents. Journal of applied microbiology, 112(6), p. 1193-1206.
Bolotin A., Wincker P., Mauger S., Jaillon O., Malarme K., Weissenbach J. & Sorokin A., 2001. The complete genome sequence of the lactic acid bacterium Lactococcus lactis ssp. lactis IL1403. Genome research, 11(5), p. 731-753.
Canfield R.L., Henderson Jr., C.R., Cory-Slechta D.A., Cox C., Jusko T.A. & Lanphear B.P., 2003. Intellectual impairment in children with blood lead concentrations below 10 μg per deciliter. New England journal of medicine, 348(16), p. 1517-1526.
Chang Y.C. & Kikuchi S., 2013. Extraction of Heavy Metals from CCA Preservative-Treated Wood Waste Using Lactic Acid Bacteria: An Environment-Friendly Technology. Journal of Bioremediation & Biodegradation, doi,10.4172/2155-6199.1000e126.
Davis T.A., Volesky B. & Mucci A., 2003. A review of the biochemistry of heavy metal biosorption by brown algae. Water research, 37(18), p. 4311-4330.
Diowksz A., Ambroziak W. & Wlodarczyk M., 1999. Investigation of the ability of selenium accumulation by lactic acid bacteria of Lactobacillus species and yeast Saccharomyces cerevisiae. Polish journal of food and nutrition sciences, 1(08), p. 17-22.
Duhutrel P., Bordat C., Wu T.D., Zagorec M., Guerquin-Kern J.L. & Champomier-Vergès M.C., 2010. Iron sources used by the nonpathogenic lactic acid bacterium Lactobacillus sakei as revealed by electron energy loss spectroscopy and secondary-ion mass spectrometry. Applied and Environmental Microbiology, 76(2), p. 560-565.
El-Nezami H., Mykkänen H., Kankaanpää P., Salminen S. & Ahokas J., 2000. Ability of Lactobacillus and Propionibacterium strains to remove aflatoxin B1 from the chicken duodenum. Journal of Food Protection, 63(4), p. 549-552.
El-Nezami H.S., Polychronaki N.N., Ma J., Zhu H., Ling W., Salminen E.K. & Mykkänen H.M., 2006. Probiotic supplementation reduces a biomarker for increased risk of liver cancer in young men from Southern China. The American journal of clinical nutrition, 83(5), p. 1199-1203.
Elsanhoty R.M., Al-Turki I.A. & Ramadan M.F., 2016. Application of lactic acid bacteria in removing heavy metals and aflatoxin B1 from contaminated water. Water Science and Technology, wst2016255. DOI, 10.2166/wst.2016.255.
Famularo G., De Simone C., Pandey V., Sahu A.R. & Minisola G., 2005. Probiotic lactobacilli: an innovative tool to correct the malabsorption syndrome of vegetarians? Medical hypotheses, 65(6), p. 1132-1135.
Fertmann R., Hentschel S., Dengler D., Janßen U. & Lommel A., 2004. Lead exposure by drinking water: an epidemiologial study in Hamburg, Germany. International journal of hygiene and environmental health, 207(3), p. 235-244.
Gadd G.M., 1993. Interactions of fungi with toxic metals. New Phytologist 124, p. 25-60.
Gavin I.M., Melnik S.M., Yurina N.P., Khabarova M.I., & Bavykin S.G., 1998. Zero-length protein–nucleic acid crosslinking by radical-generating coordination
complexes as a probe for analysis of protein–dna interactionsin vitroandin vivo. Analytical biochemistry, 263(1), p. 26-30.
Gerbino E., Mobili P., Tymczyszyn E., Fausto R. & Gómez-Zavaglia A., 2011. FTIR spectroscopy structural analysis of the interaction between Lactobacillus kefir S-layers and metal ions. Journal of Molecular Structure, 987(1), p. 186-192.
Halttunen T., Kankaanpää P., Tahvonen R., Salminen S. & Ouwehand A.C., 2003. Cadmium removal by lactic acid bacteria. Bioscience and Microflora, 22(3), p. 93-97.
Halttunen T., Salminen S. & Tahvonen R., 2007. Rapid removal of lead and cadmium from water by specific lactic acid bacteria. International journal of food microbiology, 114(1), p. 30-35.
Haskard C.A., El-Nezami H.S., Kankaanpää P.E., Salminen S. & Ahokas J.T., 2001. Surface binding of aflatoxin B1 by lactic acid bacteria. Applied and Environmental Microbiology, 67(7), p. 3086-3091.
Ibrahim F., Halttunen T., Tahvonen R. & Salminen S., 2006. Probiotic bacteria as potential detoxification tools: assessing their heavy metal binding isotherms. Canadian journal of microbiology, 52(9), p. 877-885.
Imbert M. & Blondeau R., 1998. On the iron requirement of lactobacilli grown in chemically defined medium. Current microbiology, 37(1), p. 64-66.
Jarup L. & Alfven T., 2004. Low level cadmium exposure, renal and bone effects-the OSCAR study. Biometals, 17(5), p. 505-509.
Jarup L., Hellstrom L., Alfven T., Carlsson M.D., Grubb A., Persson B. & Elinder C.G., 2000. Low level exposure to cadmium and early kidney damage: the OSCAR study. Occupational and Environmental Medicine, 57(10), p. 668-672.
Khan R. & Dona J., 2015. Extraction and optimization of exopolysaccharide production from lactic acid bacteria and its application in biosorption of chromium from waste water. European Academic Research III (4), p. 4576-4588.
Kinoshita H., Ohtake F., Ariga Y., & Kimura K., 2015. Comparison and characterization of biosorption by Weissella viridescens MYU 205 of periodic group 12 metal ions. Animal Science Journal, 87(2), 271-6.
Kinoshita H., Sohma Y., Ohtake F., Ishida M., Kawai Y., Kitazawa H. & Kimura K., 2013. Biosorption of heavy metals by lactic acid bacteria and identification of mercury binding protein. Research in Microbiology, 164(7), p. 701-709.
Kumar B.M. & Rao V.G., 2011. Removal of Cu2+ and Pb2+ ions from aqueous solutions by free, immobilized and co-immobilized cells of Saccharomyces cerevisiae and Lactobacillus sporogenes. International Journal of Science & Emerging Technologies, 2, p. 23-28.
Lee J., Hwang K.T., Chung M.Y., Cho D.H. & Park C.S., 2005. Resistance of Lactobacillus casei KCTC 3260 to reactive oxygen species (ROS): role for a metal ion chelating effect. Journal of Food Science, 70(8), p. 388-391.
Lin Z., Zhou C., Wu J., Zhou J. & Wang L., 2005. A further insight into the mechanism of Ag+ biosorption by Lactobacillus sp. strain A09. Spectrochimica Acta
Part A: Molecular and Biomolecular Spectroscopy, 61(6), p. 1195-1200.
Mehta S.K. & Gaur J.P., 2005. Use of algae for removing heavy metal ions from wastewater: progress and prospects. Critical reviews in biotechnology, 25(3), p. 113-152.
Meriluoto J., Gueimonde M., Haskard C.A., Spoof L., Sjövall O. & Salminen S., 2005. Removal of the cyanobacterial toxin microcystin-LR by human probiotics. Toxicon, 46(1), p. 111-114.
Monachese M., Burton J.P. & Reid G., 2012. Bioremediation and tolerance of humans to heavy metals through microbial processes: a potential role for probiotics? Applied and environmental microbiology, 78(18), p. 6397-6404.
Mrvcic J., Prebeg T., Barisic L., Stanzer D., Bacun-Druzina V. & Stehlik-Tomas V., 2009a. Zinc Binding by Lactic Acid Bacteria. Food Technology & Biotechnology, 47(4).
Mrvcic J., Stanzer D., Bacun-Druzina V. & Stehlik-Tomas V., 2009b. Copper binding by lactic acid bacteria (LAB). Bioscience and Microflora, 28(1), p. 1-6.
Mrvcic J., Stanzer D., Solic E. & Stehlik-Tomas V., 2012. Interaction of lactic acid bacteria with metal ions: opportunities for improving food safety and quality. World Journal of Microbiology and Biotechnology, 28(9), p. 2771-2782.
Mudronová D., Nemcova R., Gancarcíkova S., Bomba A. & Gyoryova K., 2004. Influence of Zn 2 and Lactobacillus plantarum CCM 7102 on the composition of intestinal microflora in laboratory mice. University of veterinary medicine, Komenskeho 73, 041 81 Kosice, Slovak Republic.
Orrhage K.M., Annas A., Nord C.E., Brittebo E.B. & Rafter J.J., 2002. Effects of lactic acid bacteria on the uptake and distribution of the food mutagen Trp-P-2 in mice. Scandinavian journal of Gastroenterology, 37(2), p. 215-221.
Pandey A., Bringel F. & Meyer J.M., 1994. Iron requirement and search for siderophores in lactic acid bacteria. Applied Microbiology and Biotechnology, 40(5), p. 735-739.
Penas E., Martinez-Villaluenga C., Frias J., Sánchez-Martínez M.J., Pérez-Corona M.T., Madrid Y. et al., 2012. Se improves indole glucosinolate hydrolysis products content, Se-methyl selenocysteine content, antioxidant capacity and potential anti-inflammatory properties of sauerkraut. Food Chemistry, 132(2), p. 907-914.
Perez-Corona M.T., Sanchez-Martínez M., Valderrama, M.J., Rodríguez M.E., Camara C. & Madrid Y., 2011. Selenium biotransformation by Saccharomyces cerevisiae and Saccharomyces bayanus during white wine manufacture: laboratory-scale experiments. Food chemistry, 124(3), p. 1050-1055.
Perpetuo E.A., Nascimento C.A.O. & Souza C.B., 2011. Engineering bacteria for bioremediation. INTECH Open Access Publisher. DOI, 10.5772/19546.
Rayes A.A.H., 2012. Field studies on the removal of lead, cadmium and copper by the use of probiotic lactic acid bacteria from the water for culturing
153
serve to enhance the bioavailability of essential elements and proteins with simultaneous reduction of toxic metals in food. CONCLUSIONS AND FUTURE PROSPECTS Lactic acid bacteria have an established role as starter cultures and probiotics in the dairy and food industry. These eco-friendly food grade organisms can be used as an effective bioquen-ching/biosorptive agent to reduce the toxicity of heavy metals from foods and water and ultimately preventing their absorption in the human body. Further, their application in food may improve the bioavailability of trace ele-ments. Though very limited information is available in this direction, the outcomes of different investigations done so far are encou-raging and indicative of prospective use of LAB as detoxifying agent. Nevertheless, exten-sive investigation has to be done to make these processes suitable for industrial applications. CONFLICTS OF INTEREST All contributing authors declare no conflicts of interest. REFERENCES Alzate A., Fernandez-Fernandez A., Perez-Conde C.,
Gutierrez A.M. & Camara C., 2008. Comparison of biotransformation of inorganic selenium by Lactobacillus and Saccharomyces in lactic fermentation process of yogurt and kefir. Journal of Agricultural and Food Chemistry, 56, p. 8728–8736.
Battikh E., Safa A., Niccola M.K. & Aagha S.I., 2011. Effect of Cd and Lactobacillus levels on iron concentration in different organs and meat of broiler chicken Journal of the University of Chemical Technology and Metallurgy, 46(4), p. 381–388.
Bezawada M.K. & Rao V.G., 2011. Removal of Cu2+ and Pb2+ ions from aqueous solutions by free, immobilized and co-immobilized cells of Saccharomyces cerevisiae and Lactobacillus sporogenes. International Journal of Science & Emerging Technologies, 2(3), p. 80-86.
Bhakta J.N., Ohnishi K., Munekage Y. & Iwasaki K., 2010. Isolation and probiotic characterization of arsenic-resistant lactic acid bacteria for uptaking arsenic. International Journal of Chemical and Biological Engineering, 3(4), p. 167-174.
Bhakta J.N., Ohnishi K., Munekage Y., Iwasaki K. & Wei M.Q., 2012. Characterization of lactic acid bacteria based probiotics as potential heavy metal
sorbents. Journal of applied microbiology, 112(6), p. 1193-1206.
Bolotin A., Wincker P., Mauger S., Jaillon O., Malarme K., Weissenbach J. & Sorokin A., 2001. The complete genome sequence of the lactic acid bacterium Lactococcus lactis ssp. lactis IL1403. Genome research, 11(5), p. 731-753.
Canfield R.L., Henderson Jr., C.R., Cory-Slechta D.A., Cox C., Jusko T.A. & Lanphear B.P., 2003. Intellectual impairment in children with blood lead concentrations below 10 μg per deciliter. New England journal of medicine, 348(16), p. 1517-1526.
Chang Y.C. & Kikuchi S., 2013. Extraction of Heavy Metals from CCA Preservative-Treated Wood Waste Using Lactic Acid Bacteria: An Environment-Friendly Technology. Journal of Bioremediation & Biodegradation, doi,10.4172/2155-6199.1000e126.
Davis T.A., Volesky B. & Mucci A., 2003. A review of the biochemistry of heavy metal biosorption by brown algae. Water research, 37(18), p. 4311-4330.
Diowksz A., Ambroziak W. & Wlodarczyk M., 1999. Investigation of the ability of selenium accumulation by lactic acid bacteria of Lactobacillus species and yeast Saccharomyces cerevisiae. Polish journal of food and nutrition sciences, 1(08), p. 17-22.
Duhutrel P., Bordat C., Wu T.D., Zagorec M., Guerquin-Kern J.L. & Champomier-Vergès M.C., 2010. Iron sources used by the nonpathogenic lactic acid bacterium Lactobacillus sakei as revealed by electron energy loss spectroscopy and secondary-ion mass spectrometry. Applied and Environmental Microbiology, 76(2), p. 560-565.
El-Nezami H., Mykkänen H., Kankaanpää P., Salminen S. & Ahokas J., 2000. Ability of Lactobacillus and Propionibacterium strains to remove aflatoxin B1 from the chicken duodenum. Journal of Food Protection, 63(4), p. 549-552.
El-Nezami H.S., Polychronaki N.N., Ma J., Zhu H., Ling W., Salminen E.K. & Mykkänen H.M., 2006. Probiotic supplementation reduces a biomarker for increased risk of liver cancer in young men from Southern China. The American journal of clinical nutrition, 83(5), p. 1199-1203.
Elsanhoty R.M., Al-Turki I.A. & Ramadan M.F., 2016. Application of lactic acid bacteria in removing heavy metals and aflatoxin B1 from contaminated water. Water Science and Technology, wst2016255. DOI, 10.2166/wst.2016.255.
Famularo G., De Simone C., Pandey V., Sahu A.R. & Minisola G., 2005. Probiotic lactobacilli: an innovative tool to correct the malabsorption syndrome of vegetarians? Medical hypotheses, 65(6), p. 1132-1135.
Fertmann R., Hentschel S., Dengler D., Janßen U. & Lommel A., 2004. Lead exposure by drinking water: an epidemiologial study in Hamburg, Germany. International journal of hygiene and environmental health, 207(3), p. 235-244.
Gadd G.M., 1993. Interactions of fungi with toxic metals. New Phytologist 124, p. 25-60.
Gavin I.M., Melnik S.M., Yurina N.P., Khabarova M.I., & Bavykin S.G., 1998. Zero-length protein–nucleic acid crosslinking by radical-generating coordination
complexes as a probe for analysis of protein–dna interactionsin vitroandin vivo. Analytical biochemistry, 263(1), p. 26-30.
Gerbino E., Mobili P., Tymczyszyn E., Fausto R. & Gómez-Zavaglia A., 2011. FTIR spectroscopy structural analysis of the interaction between Lactobacillus kefir S-layers and metal ions. Journal of Molecular Structure, 987(1), p. 186-192.
Halttunen T., Kankaanpää P., Tahvonen R., Salminen S. & Ouwehand A.C., 2003. Cadmium removal by lactic acid bacteria. Bioscience and Microflora, 22(3), p. 93-97.
Halttunen T., Salminen S. & Tahvonen R., 2007. Rapid removal of lead and cadmium from water by specific lactic acid bacteria. International journal of food microbiology, 114(1), p. 30-35.
Haskard C.A., El-Nezami H.S., Kankaanpää P.E., Salminen S. & Ahokas J.T., 2001. Surface binding of aflatoxin B1 by lactic acid bacteria. Applied and Environmental Microbiology, 67(7), p. 3086-3091.
Ibrahim F., Halttunen T., Tahvonen R. & Salminen S., 2006. Probiotic bacteria as potential detoxification tools: assessing their heavy metal binding isotherms. Canadian journal of microbiology, 52(9), p. 877-885.
Imbert M. & Blondeau R., 1998. On the iron requirement of lactobacilli grown in chemically defined medium. Current microbiology, 37(1), p. 64-66.
Jarup L. & Alfven T., 2004. Low level cadmium exposure, renal and bone effects-the OSCAR study. Biometals, 17(5), p. 505-509.
Jarup L., Hellstrom L., Alfven T., Carlsson M.D., Grubb A., Persson B. & Elinder C.G., 2000. Low level exposure to cadmium and early kidney damage: the OSCAR study. Occupational and Environmental Medicine, 57(10), p. 668-672.
Khan R. & Dona J., 2015. Extraction and optimization of exopolysaccharide production from lactic acid bacteria and its application in biosorption of chromium from waste water. European Academic Research III (4), p. 4576-4588.
Kinoshita H., Ohtake F., Ariga Y., & Kimura K., 2015. Comparison and characterization of biosorption by Weissella viridescens MYU 205 of periodic group 12 metal ions. Animal Science Journal, 87(2), 271-6.
Kinoshita H., Sohma Y., Ohtake F., Ishida M., Kawai Y., Kitazawa H. & Kimura K., 2013. Biosorption of heavy metals by lactic acid bacteria and identification of mercury binding protein. Research in Microbiology, 164(7), p. 701-709.
Kumar B.M. & Rao V.G., 2011. Removal of Cu2+ and Pb2+ ions from aqueous solutions by free, immobilized and co-immobilized cells of Saccharomyces cerevisiae and Lactobacillus sporogenes. International Journal of Science & Emerging Technologies, 2, p. 23-28.
Lee J., Hwang K.T., Chung M.Y., Cho D.H. & Park C.S., 2005. Resistance of Lactobacillus casei KCTC 3260 to reactive oxygen species (ROS): role for a metal ion chelating effect. Journal of Food Science, 70(8), p. 388-391.
Lin Z., Zhou C., Wu J., Zhou J. & Wang L., 2005. A further insight into the mechanism of Ag+ biosorption by Lactobacillus sp. strain A09. Spectrochimica Acta
Part A: Molecular and Biomolecular Spectroscopy, 61(6), p. 1195-1200.
Mehta S.K. & Gaur J.P., 2005. Use of algae for removing heavy metal ions from wastewater: progress and prospects. Critical reviews in biotechnology, 25(3), p. 113-152.
Meriluoto J., Gueimonde M., Haskard C.A., Spoof L., Sjövall O. & Salminen S., 2005. Removal of the cyanobacterial toxin microcystin-LR by human probiotics. Toxicon, 46(1), p. 111-114.
Monachese M., Burton J.P. & Reid G., 2012. Bioremediation and tolerance of humans to heavy metals through microbial processes: a potential role for probiotics? Applied and environmental microbiology, 78(18), p. 6397-6404.
Mrvcic J., Prebeg T., Barisic L., Stanzer D., Bacun-Druzina V. & Stehlik-Tomas V., 2009a. Zinc Binding by Lactic Acid Bacteria. Food Technology & Biotechnology, 47(4).
Mrvcic J., Stanzer D., Bacun-Druzina V. & Stehlik-Tomas V., 2009b. Copper binding by lactic acid bacteria (LAB). Bioscience and Microflora, 28(1), p. 1-6.
Mrvcic J., Stanzer D., Solic E. & Stehlik-Tomas V., 2012. Interaction of lactic acid bacteria with metal ions: opportunities for improving food safety and quality. World Journal of Microbiology and Biotechnology, 28(9), p. 2771-2782.
Mudronová D., Nemcova R., Gancarcíkova S., Bomba A. & Gyoryova K., 2004. Influence of Zn 2 and Lactobacillus plantarum CCM 7102 on the composition of intestinal microflora in laboratory mice. University of veterinary medicine, Komenskeho 73, 041 81 Kosice, Slovak Republic.
Orrhage K.M., Annas A., Nord C.E., Brittebo E.B. & Rafter J.J., 2002. Effects of lactic acid bacteria on the uptake and distribution of the food mutagen Trp-P-2 in mice. Scandinavian journal of Gastroenterology, 37(2), p. 215-221.
Pandey A., Bringel F. & Meyer J.M., 1994. Iron requirement and search for siderophores in lactic acid bacteria. Applied Microbiology and Biotechnology, 40(5), p. 735-739.
Penas E., Martinez-Villaluenga C., Frias J., Sánchez-Martínez M.J., Pérez-Corona M.T., Madrid Y. et al., 2012. Se improves indole glucosinolate hydrolysis products content, Se-methyl selenocysteine content, antioxidant capacity and potential anti-inflammatory properties of sauerkraut. Food Chemistry, 132(2), p. 907-914.
Perez-Corona M.T., Sanchez-Martínez M., Valderrama, M.J., Rodríguez M.E., Camara C. & Madrid Y., 2011. Selenium biotransformation by Saccharomyces cerevisiae and Saccharomyces bayanus during white wine manufacture: laboratory-scale experiments. Food chemistry, 124(3), p. 1050-1055.
Perpetuo E.A., Nascimento C.A.O. & Souza C.B., 2011. Engineering bacteria for bioremediation. INTECH Open Access Publisher. DOI, 10.5772/19546.
Rayes A.A.H., 2012. Field studies on the removal of lead, cadmium and copper by the use of probiotic lactic acid bacteria from the water for culturing

154
marine tilapia T. spilurus. New York Science Journal, 5(11), p. 74-82.
Rodríguez L.M. & Alatossava T., 2008. Effects of copper supplement on growth and viability of strains used as starters and adjunct cultures for Emmental cheese manufacture. Journal of applied microbiology, 105(4), p. 1098-1106.
Salim A.B., Badawy I.H. & Kassem S.S., 2011. Effect of lactic acid bacteria against heavy metals toxicity in rats. J. Am. Sci., 7(4), p. 264-274.
Satarug S., Garrett S.H., Sens M.A. & Sens D.A., 2011. Cadmium, environmental exposure, and health outcomes. Ciencia & saude coletiva, 16(5), p. 2587-2602.
Schar-Zammaretti P. & Ubbink J., 2003. The cell wall of lactic acid bacteria: surface constituents and macromolecular conformations. Biophysical Journal, 85(6), p. 4076-4092.
Schut S., Zauner S., Hampel G., König H. & Claus H., 2011. Biosorption of copper by wine-relevant lactobacilli. International journal of food microbiology, 145(1), p. 126-131.
Shrivastava R., Upreti R.K. & Chaturvedi U.C., 2003. Various cells of the immune system and intestine differ in their capacity to reduce hexavalent chromium. FEMS Immunology & Medical Microbiology, 38(1), p. 65-70.
Singh A.L. & Sharma P.N., 2010. Removal of arsenic (III) from waste water using Lactobacillus acidophilus. Bioremediation Journal, 14, p. 92-97.
Sinha V., Mishra R., Kumar A., Kannan A. & Upreti R.K., 2011. Amplification of arsH gene in Lactobacillus acidophilus resistant to arsenite. Biotechnology, 10(1), p. 101-107.
Sofu A., Sayilgan E. & Guney G., 2015. Experimental Design for Removal of Fe (II) and Zn (II) Ions by Different Lactic Acid Bacteria Biomasses. International Journal of Environmental Research, 9(1), p. 93-100.
Stefanidou M., Maravelias C., Dona A. & Spiliopoulou C., 2006. Zinc: a multipurpose trace element. Archives of toxicology, 80(1), p. 1-9.
Turbic A., Ahokas J.T. & Haskard C.A., 2002. Selective in vitro binding of dietary mutagens, individually or in combination, by lactic acid bacteria. Food Additives & Contaminants, 19(2), p. 144-152.
Upreti R.K., Sinha V., Mishra R. & Kannan A., 2011. In vitro development of resistance to arsenite and chromium-VI in Lactobacilli strains as perspective attenuation of gastrointestinal disorder.
Urban P.L. & Kuthan R.T., 2004. Application of probiotics in the xenobiotic detoxification therapy. Nukleonika 49, p. 43–45.
Waalkes M.P., Anver M.R. & Diwan B.A., 1999. Chronic toxic and carcinogenic effects of oral cadmium in the Noble (NBL/Cr) rat: induction of neoplastic and proliferative lesions of the adrenal, kidney, prostate, and testes. Journal of Toxicology and Environmental Health Part A, 58(4), p. 199-214.
Waalkes M.P., Kovatch R. & Rehm S., 1991. Effect of chronic dietary zinc deficiency on cadmium toxicity and carcinogenesis in the male Wistar [Hsd:(WI) BR] rat. Toxicology and applied pharmacology, 108(3), p. 448-456.
Wang J. & Chen C., 2009. Biosorbents for heavy metals removal and their future. Biotechnology Advances 27, p. 195-226.
Wyatt C.J., Fimbres C., Romo L., Mendez R.O. & Grijalva M., 1998. Incidence of heavy metal contamination in water supplies in Northern Mexico. Environmental Research, 76(2), p. 114-119.
Xia K.S., Chen L. & Liang J.Q., 2007. Enriched selenium and its effects on growth and biochemical composition in L. bulgaricus. Journal of Agricultural and Food Chemistry 55, p. 2413–2417.
Yilmaz M., Tay T., Kivanc M. & Turk H., 2010. Removal of corper (II) Ions from aqueous solution by a lactic acid bacterium. Brazilian Journal of Chemical Engineering, 27(2), p. 309-314.
Zhai Q., Wang G., Zhao J., Liu X., Tian F., Zhang H. & Chen W., 2013. Protective effects of Lactobacillus plantarum CCFM8610 against acute cadmium toxicity in mice. Applied and Environmental Microbiology, 79(5), p. 1508-1515.
Zoghi A., Khosravi-Darani K. & Sohrabvandi S., 2014. Surface binding of toxins and heavy metals by probiotics. Medicinal Chemistry 14(1), p. 84-98.
***WHO, 1995. Environmental Health Criteria 165, Inorganic lead. Geneva. http//www.inchem.org/documents/ehc/ehc/ehc165.htm (accessed on Jan 2016).
THE PREVALENCE OF HEMATURIA IN DOGS AND CATS
Alexandra Mihaela POPA, Valentina SIMION, Iuliana CODREANU
Cristina FERNOAGĂ, Mihai CORNILĂ, Mario CODREANU
University of Agronomic Sciences and Veterinary Medicine of Bucharest, 59 Mărăşti Blvd., District 1,
011464, Bucharest, Romania, Phone: +4021.318.25.64, Fax: + 4021.318.25.67, Email: [email protected]
Corresponding author email: [email protected]
Abstract This paper briefly reviews the basic definitions of hematuria, the common causes and the prevalence of this simptom on dogs and cats. This study was conducted in the Clinic of Faculty of Veterinary Medicine in the period between 1.10. 2016 – 1.02.2017 using IDEXX UA dipstick, IDEXX VetLab UA, Refractometer RHCN-200ATC and Grant Bio PCV-2400 Combined Centrifuge.Data collected recorded 65 animals,with felines obtaining a precentage of 42% and canine 28% in regard of hematuria prevlance by species.In case of hematuria prevalence based on gender we registered 62% males and 38% females.In hematuria prevalence by age we listed 32% of animales cu age range between 6-10 years, 31% with 1-5 years, and also 31% over 10 years, and 6% less than a year. From a total of 51 urinary dipstick who tested positive, we discovered on the examination of urine sediment that 46 samples confirms, and 5 samples offered a false - positive. Of the 71 samples analyzed 76% were within the macroscopic hematuria and 24% to microscopic hematuria, and 28% of the samples showed no hematuria. As a conlcusion hematuria is a common finding of urological pathology and it is important to known the risk factors of every species. Key words: hematuria, prevalence, gross hematuria, microhematuria.
INTRODUCTION
Hematuria is defined as the presence of five or more RBCs per high-power (40x) field in a fresh, centrifuged specimens obtained by eithermanual compression of the bladder catheterisation, or cystocentesis (Reine at al.,2005). Healthy animals can excrete as many as 3 red blood cells per high-power field (Chew, 2011). Hematuria is commonly subdivided according to its type asmacroscopic hematuria (i.e., visible, named gross hematuria) and microscopic hematuria (Figure 1, Figure 3) (i.e., nonvisible detected with a microscope), time of micturition (initial, terminal or total), duration (intermittent or persistent) and the clinical form - symptomatic or asymptomatic (Costache, 2005). Initial hematuria indicates the origin in urethra or prostate (males), total hematuria – in bladder, ureter, and kidneys, and terminal hematuria, bladder or prostate (Mazhari, 2002) (Figure 2). Gross hematuria is suspected when urine is has an abnormal color, usually red or tea-colored. In evaluating gross hematuria, it is
important to confirm the presence of RBCs by microscopy (Massengill, 2008) Microhematuria is often detected during investigation of symptoms such as dysuria, urinary frequency, or flank pain (Massengill, 2008)
Figure 2. Hematuria. Time of micturition
www.kidneyservicechina.com/pkd-symptoms/4325.html
Gross hematuria Microscopic hematuria
Figure 1. Gross hematuria vs. Microhematuria https://www.drugs.com/health-guide/hematuria.html
Initial hematuria
Terminal hematuria
Total hematuria
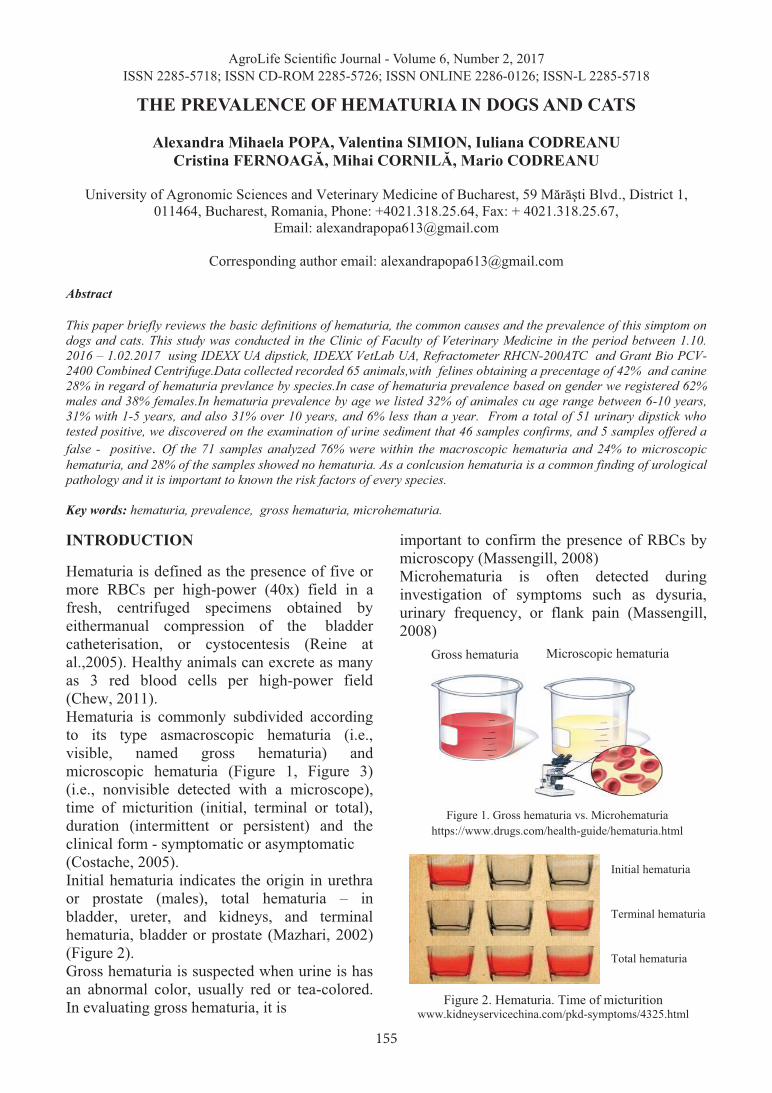
155
marine tilapia T. spilurus. New York Science Journal, 5(11), p. 74-82.
Rodríguez L.M. & Alatossava T., 2008. Effects of copper supplement on growth and viability of strains used as starters and adjunct cultures for Emmental cheese manufacture. Journal of applied microbiology, 105(4), p. 1098-1106.
Salim A.B., Badawy I.H. & Kassem S.S., 2011. Effect of lactic acid bacteria against heavy metals toxicity in rats. J. Am. Sci., 7(4), p. 264-274.
Satarug S., Garrett S.H., Sens M.A. & Sens D.A., 2011. Cadmium, environmental exposure, and health outcomes. Ciencia & saude coletiva, 16(5), p. 2587-2602.
Schar-Zammaretti P. & Ubbink J., 2003. The cell wall of lactic acid bacteria: surface constituents and macromolecular conformations. Biophysical Journal, 85(6), p. 4076-4092.
Schut S., Zauner S., Hampel G., König H. & Claus H., 2011. Biosorption of copper by wine-relevant lactobacilli. International journal of food microbiology, 145(1), p. 126-131.
Shrivastava R., Upreti R.K. & Chaturvedi U.C., 2003. Various cells of the immune system and intestine differ in their capacity to reduce hexavalent chromium. FEMS Immunology & Medical Microbiology, 38(1), p. 65-70.
Singh A.L. & Sharma P.N., 2010. Removal of arsenic (III) from waste water using Lactobacillus acidophilus. Bioremediation Journal, 14, p. 92-97.
Sinha V., Mishra R., Kumar A., Kannan A. & Upreti R.K., 2011. Amplification of arsH gene in Lactobacillus acidophilus resistant to arsenite. Biotechnology, 10(1), p. 101-107.
Sofu A., Sayilgan E. & Guney G., 2015. Experimental Design for Removal of Fe (II) and Zn (II) Ions by Different Lactic Acid Bacteria Biomasses. International Journal of Environmental Research, 9(1), p. 93-100.
Stefanidou M., Maravelias C., Dona A. & Spiliopoulou C., 2006. Zinc: a multipurpose trace element. Archives of toxicology, 80(1), p. 1-9.
Turbic A., Ahokas J.T. & Haskard C.A., 2002. Selective in vitro binding of dietary mutagens, individually or in combination, by lactic acid bacteria. Food Additives & Contaminants, 19(2), p. 144-152.
Upreti R.K., Sinha V., Mishra R. & Kannan A., 2011. In vitro development of resistance to arsenite and chromium-VI in Lactobacilli strains as perspective attenuation of gastrointestinal disorder.
Urban P.L. & Kuthan R.T., 2004. Application of probiotics in the xenobiotic detoxification therapy. Nukleonika 49, p. 43–45.
Waalkes M.P., Anver M.R. & Diwan B.A., 1999. Chronic toxic and carcinogenic effects of oral cadmium in the Noble (NBL/Cr) rat: induction of neoplastic and proliferative lesions of the adrenal, kidney, prostate, and testes. Journal of Toxicology and Environmental Health Part A, 58(4), p. 199-214.
Waalkes M.P., Kovatch R. & Rehm S., 1991. Effect of chronic dietary zinc deficiency on cadmium toxicity and carcinogenesis in the male Wistar [Hsd:(WI) BR] rat. Toxicology and applied pharmacology, 108(3), p. 448-456.
Wang J. & Chen C., 2009. Biosorbents for heavy metals removal and their future. Biotechnology Advances 27, p. 195-226.
Wyatt C.J., Fimbres C., Romo L., Mendez R.O. & Grijalva M., 1998. Incidence of heavy metal contamination in water supplies in Northern Mexico. Environmental Research, 76(2), p. 114-119.
Xia K.S., Chen L. & Liang J.Q., 2007. Enriched selenium and its effects on growth and biochemical composition in L. bulgaricus. Journal of Agricultural and Food Chemistry 55, p. 2413–2417.
Yilmaz M., Tay T., Kivanc M. & Turk H., 2010. Removal of corper (II) Ions from aqueous solution by a lactic acid bacterium. Brazilian Journal of Chemical Engineering, 27(2), p. 309-314.
Zhai Q., Wang G., Zhao J., Liu X., Tian F., Zhang H. & Chen W., 2013. Protective effects of Lactobacillus plantarum CCFM8610 against acute cadmium toxicity in mice. Applied and Environmental Microbiology, 79(5), p. 1508-1515.
Zoghi A., Khosravi-Darani K. & Sohrabvandi S., 2014. Surface binding of toxins and heavy metals by probiotics. Medicinal Chemistry 14(1), p. 84-98.
***WHO, 1995. Environmental Health Criteria 165, Inorganic lead. Geneva. http//www.inchem.org/documents/ehc/ehc/ehc165.htm (accessed on Jan 2016).
AgroLife Scientific Journal - Volume 6, Number 2, 2017ISSN 2285-5718; ISSN CD-ROM 2285-5726; ISSN ONLINE 2286-0126; ISSN-L 2285-5718
THE PREVALENCE OF HEMATURIA IN DOGS AND CATS
Alexandra Mihaela POPA, Valentina SIMION, Iuliana CODREANU
Cristina FERNOAGĂ, Mihai CORNILĂ, Mario CODREANU
University of Agronomic Sciences and Veterinary Medicine of Bucharest, 59 Mărăşti Blvd., District 1,
011464, Bucharest, Romania, Phone: +4021.318.25.64, Fax: + 4021.318.25.67, Email: [email protected]
Corresponding author email: [email protected]
Abstract This paper briefly reviews the basic definitions of hematuria, the common causes and the prevalence of this simptom on dogs and cats. This study was conducted in the Clinic of Faculty of Veterinary Medicine in the period between 1.10. 2016 – 1.02.2017 using IDEXX UA dipstick, IDEXX VetLab UA, Refractometer RHCN-200ATC and Grant Bio PCV-2400 Combined Centrifuge.Data collected recorded 65 animals,with felines obtaining a precentage of 42% and canine 28% in regard of hematuria prevlance by species.In case of hematuria prevalence based on gender we registered 62% males and 38% females.In hematuria prevalence by age we listed 32% of animales cu age range between 6-10 years, 31% with 1-5 years, and also 31% over 10 years, and 6% less than a year. From a total of 51 urinary dipstick who tested positive, we discovered on the examination of urine sediment that 46 samples confirms, and 5 samples offered a false - positive. Of the 71 samples analyzed 76% were within the macroscopic hematuria and 24% to microscopic hematuria, and 28% of the samples showed no hematuria. As a conlcusion hematuria is a common finding of urological pathology and it is important to known the risk factors of every species. Key words: hematuria, prevalence, gross hematuria, microhematuria.
INTRODUCTION
Hematuria is defined as the presence of five or more RBCs per high-power (40x) field in a fresh, centrifuged specimens obtained by eithermanual compression of the bladder catheterisation, or cystocentesis (Reine at al.,2005). Healthy animals can excrete as many as 3 red blood cells per high-power field (Chew, 2011). Hematuria is commonly subdivided according to its type asmacroscopic hematuria (i.e., visible, named gross hematuria) and microscopic hematuria (Figure 1, Figure 3) (i.e., nonvisible detected with a microscope), time of micturition (initial, terminal or total), duration (intermittent or persistent) and the clinical form - symptomatic or asymptomatic (Costache, 2005). Initial hematuria indicates the origin in urethra or prostate (males), total hematuria – in bladder, ureter, and kidneys, and terminal hematuria, bladder or prostate (Mazhari, 2002) (Figure 2). Gross hematuria is suspected when urine is has an abnormal color, usually red or tea-colored. In evaluating gross hematuria, it is
important to confirm the presence of RBCs by microscopy (Massengill, 2008) Microhematuria is often detected during investigation of symptoms such as dysuria, urinary frequency, or flank pain (Massengill, 2008)
Figure 2. Hematuria. Time of micturition
www.kidneyservicechina.com/pkd-symptoms/4325.html
Gross hematuria Microscopic hematuria
Figure 1. Gross hematuria vs. Microhematuria https://www.drugs.com/health-guide/hematuria.html
Initial hematuria
Terminal hematuria
Total hematuria

156
a b c Figure 3. a Normal urine; b microscopic hematuria
(+++); c macroscopic hematuria (Barrat, 2007).
“Dipstick hematuria” and “dipstick microhe-maturia” is a nondiagnostic screening test offering a positive result due to oxidation of a test-strip reagent (Rao and Jones, 2008). This paper briefly reviews thebasic definitions of hematuria, the common causes and the prevalence of this simptom on dogs and cats. There are many causes of hematuria, and is a priority in the medical act for the doctor to discover the origin of hematuria by establishing whether its nature is renal or non-renal (Table 1).
Table 1. Causes of hematuria
Intrinsic Renal Disease Non-Renal Disease
Glomerulonephropathy Ureteric (stones,tumor) Cystic disease Bladder Renal tumors Interstitial disease Interstitial nephritisPapillary necrosis/analgesics Stones or crystals Acute infection
- tumors - stones - Cystitis) Prostate (carcinoma - Prostatitis)
Atrioventricular malformation Urethral lesions
(After: Fine, 2002) Diagnosis of hematuria can be pronounced easily by using urine strips which evaluates for pyuria, proteinuria, heme positivity, and urinary concentrating defects (Table 2) and using microscopic examination of urine sediment by evaluating for white blood cells and clumps, RBC morphology, crystals, and casts. Crystalluria can be determined by calcium oxalate, calcium phosphate, uric acid, or cystine crystals. Hypercalciuria isthe most common cause of crystalluria (Massengill, 2008).
A reagent strip, also called a dipstick, is a narrow strip of plastic with small pads attached to it. Each pad contains reagents for a different reaction, thus allowing for the simultaneous determination of several tests. The colors generated on each reagent pad vary according to the concentration of the analyte present. Colors generated by each pad are visually compared against a range of colors on brandspecific color charts (Bataille et al., 2016). Urine dipstick is used to test for the peroxidase activity of erythrocytes (Robert, 2007).
Table 2. Substances tested for by urine dipsticks
Commonly assessed Less commonly assessed
Commonly assessed Less commonly assessed
Blood Ketones Blood Ketones
Protein Urobilinogen Protein Urobilinogen
Glucose Bilirubin Glucose Bilirubin
Leukocyte esterase Specific gravity
Leukocyte esterase Specific gravity
(After: Barrat, 2007) Urine culture is performed in cases that have clinical symptoms or laboratory evidence (pyuria, hematuria, bacteriuria, positive nitrites) of a urinary tract infection (Bataille et al., 2016). Also in the assessment of patients that express hematuria, complementary tests should be performed such as blood pressure, evaluation of renal functional parameters and proteinuria (Van Der Molen et al., 2012). If the test is positive for hematuria unaccom-panied by urine abnormality it is necessary to determine serum creatinine. If it has a high value more tests will be done. The normal values of serum creatinine indicates the need for an ultrasound (Fine, 2002). MATERIALS AND METHODS
This study was conducted in the Clinic of Faculty of Veterinary Medicine in the period between 1.10. 2016 – 1.02.2017. In order to establish the prevalence of hematuria in dogs and cats, fresh midstream urine samples (5-10 mL) were obtained from animals with urologic signs.
We evaluated 71 samples, 27 from feline and 18 from canine, 40 being males and 25 females, with age range between 4.5 months and 17 years. The urine samples were first evaluated macroscopically, and its color and clarity were recorded; than we used IDEXX UA dipstick for detecting the blood in IDEXX VetLab UA Analyzer and Clinical Refractometer RHCN-200ATC for measuring the urine specific gravity. The change in the color were noted an compared with standard provided. After the macroscopic evaluation the samples were prepared for urine sediment examination by centrifugation for 10 minutes at 6000x in a Grant Bio PCV-2400 Combined Centrifuge. The supernatant fluid was decanted and a drop of sediment was transferred to a glass slide and a coverslip was placed on the specimen. The slides were examined at 400 magnification for red blood cells. Hematuria was considered to be present at five or more RBCs per high-power (40x) field. RESULTS AND DISCUSSIONS In the study prevalence of hematuria on dogs and cats, we have taken in consideration parametres that influence the result and conclusion, such as species, age and gender. In regard of hematuria prevalence survey considering species, our result was that 65 animals participated, and felines obtained a precentage of 42% and canine 28%. Giving this result and from the diagnosis established, the felines are more prone to express hematuria, being liable to develop FUS (feline urological syndrome), urinary lithiasis and cystitis (Figure 4). In case of hematuria prevalence based on gender we recorded a significant proportion of males which have registered a percentage of 62% followed by 38% females. Based on the diagnosis discovered the per-centage 62% males with hematuria is slightly predictable being well known the frequency of urological pathology in males due to anatomical features of lower urinary tract (Figure 5).
Figure 4. Hematuria prevalence by species (Original)
The males who participated in this survey most were diagnosticated with urinary lithiasis and FUS. Females who manifested hematuria were diagnosticated majority of them with cystitis, microlithiasis and just one case with glomerulonephritis and FUS.
Figure 5. Hematuria prevalence by gender (Original)
Hematuria was encountred in different ages of the subjects, in a prevalence of 32% of animales cu age range between 6-10 years, 31% with 1-5 years, and also 31% over 10 years, and 6% less than a year (Figure 6). Other studies have concluded that risk-factors for stone formation, are age, gender and breed, together with influences such as geographical location, presence of UTI and dietary history (Syme, 2012). Cystine urolithiasis occurs preponderantly (98%) in male dogs and are not common in very young dogs but tend to occur in middle-age (Syme, 2012).
42%
28%
Hematuria prevalence by species
Feline
Canine
62%
38%
Hematuria prevalence by gender
Males
Females

157
a b c Figure 3. a Normal urine; b microscopic hematuria
(+++); c macroscopic hematuria (Barrat, 2007).
“Dipstick hematuria” and “dipstick microhe-maturia” is a nondiagnostic screening test offering a positive result due to oxidation of a test-strip reagent (Rao and Jones, 2008). This paper briefly reviews thebasic definitions of hematuria, the common causes and the prevalence of this simptom on dogs and cats. There are many causes of hematuria, and is a priority in the medical act for the doctor to discover the origin of hematuria by establishing whether its nature is renal or non-renal (Table 1).
Table 1. Causes of hematuria
Intrinsic Renal Disease Non-Renal Disease
Glomerulonephropathy Ureteric (stones,tumor) Cystic disease Bladder Renal tumors Interstitial disease Interstitial nephritisPapillary necrosis/analgesics Stones or crystals Acute infection
- tumors - stones - Cystitis) Prostate (carcinoma - Prostatitis)
Atrioventricular malformation Urethral lesions
(After: Fine, 2002) Diagnosis of hematuria can be pronounced easily by using urine strips which evaluates for pyuria, proteinuria, heme positivity, and urinary concentrating defects (Table 2) and using microscopic examination of urine sediment by evaluating for white blood cells and clumps, RBC morphology, crystals, and casts. Crystalluria can be determined by calcium oxalate, calcium phosphate, uric acid, or cystine crystals. Hypercalciuria isthe most common cause of crystalluria (Massengill, 2008).
A reagent strip, also called a dipstick, is a narrow strip of plastic with small pads attached to it. Each pad contains reagents for a different reaction, thus allowing for the simultaneous determination of several tests. The colors generated on each reagent pad vary according to the concentration of the analyte present. Colors generated by each pad are visually compared against a range of colors on brandspecific color charts (Bataille et al., 2016). Urine dipstick is used to test for the peroxidase activity of erythrocytes (Robert, 2007).
Table 2. Substances tested for by urine dipsticks
Commonly assessed Less commonly assessed
Commonly assessed Less commonly assessed
Blood Ketones Blood Ketones
Protein Urobilinogen Protein Urobilinogen
Glucose Bilirubin Glucose Bilirubin
Leukocyte esterase Specific gravity
Leukocyte esterase Specific gravity
(After: Barrat, 2007) Urine culture is performed in cases that have clinical symptoms or laboratory evidence (pyuria, hematuria, bacteriuria, positive nitrites) of a urinary tract infection (Bataille et al., 2016). Also in the assessment of patients that express hematuria, complementary tests should be performed such as blood pressure, evaluation of renal functional parameters and proteinuria (Van Der Molen et al., 2012). If the test is positive for hematuria unaccom-panied by urine abnormality it is necessary to determine serum creatinine. If it has a high value more tests will be done. The normal values of serum creatinine indicates the need for an ultrasound (Fine, 2002). MATERIALS AND METHODS
This study was conducted in the Clinic of Faculty of Veterinary Medicine in the period between 1.10. 2016 – 1.02.2017. In order to establish the prevalence of hematuria in dogs and cats, fresh midstream urine samples (5-10 mL) were obtained from animals with urologic signs.
We evaluated 71 samples, 27 from feline and 18 from canine, 40 being males and 25 females, with age range between 4.5 months and 17 years. The urine samples were first evaluated macroscopically, and its color and clarity were recorded; than we used IDEXX UA dipstick for detecting the blood in IDEXX VetLab UA Analyzer and Clinical Refractometer RHCN-200ATC for measuring the urine specific gravity. The change in the color were noted an compared with standard provided. After the macroscopic evaluation the samples were prepared for urine sediment examination by centrifugation for 10 minutes at 6000x in a Grant Bio PCV-2400 Combined Centrifuge. The supernatant fluid was decanted and a drop of sediment was transferred to a glass slide and a coverslip was placed on the specimen. The slides were examined at 400 magnification for red blood cells. Hematuria was considered to be present at five or more RBCs per high-power (40x) field. RESULTS AND DISCUSSIONS In the study prevalence of hematuria on dogs and cats, we have taken in consideration parametres that influence the result and conclusion, such as species, age and gender. In regard of hematuria prevalence survey considering species, our result was that 65 animals participated, and felines obtained a precentage of 42% and canine 28%. Giving this result and from the diagnosis established, the felines are more prone to express hematuria, being liable to develop FUS (feline urological syndrome), urinary lithiasis and cystitis (Figure 4). In case of hematuria prevalence based on gender we recorded a significant proportion of males which have registered a percentage of 62% followed by 38% females. Based on the diagnosis discovered the per-centage 62% males with hematuria is slightly predictable being well known the frequency of urological pathology in males due to anatomical features of lower urinary tract (Figure 5).
Figure 4. Hematuria prevalence by species (Original)
The males who participated in this survey most were diagnosticated with urinary lithiasis and FUS. Females who manifested hematuria were diagnosticated majority of them with cystitis, microlithiasis and just one case with glomerulonephritis and FUS.
Figure 5. Hematuria prevalence by gender (Original)
Hematuria was encountred in different ages of the subjects, in a prevalence of 32% of animales cu age range between 6-10 years, 31% with 1-5 years, and also 31% over 10 years, and 6% less than a year (Figure 6). Other studies have concluded that risk-factors for stone formation, are age, gender and breed, together with influences such as geographical location, presence of UTI and dietary history (Syme, 2012). Cystine urolithiasis occurs preponderantly (98%) in male dogs and are not common in very young dogs but tend to occur in middle-age (Syme, 2012).
42%
28%
Hematuria prevalence by species
Feline
Canine
62%
38%
Hematuria prevalence by gender
Males
Females

158
The prevalence of cystine calculi is highly dependent on geographical location, with a higher reported prevalence in dogs in Europe than dogs from the USA (Syme, 2012).
Figure 6. Hematuria prevalence by age (Original)
We evaluated 65 animals from which we colected 71 samples on a period of 5 months; the result we obtained using urinary dipstick IDEXX UA, was 51 tested positive for RBC/ hemoglobin/ myoglobin - urine is discolored but no RBC are noted on microscopic examination (Figure 7).
Figure 7. Numbers of dipstick test and positive samples
for hematuria (Original)
It is been noted that microscopic hematuria is present when more than five red blood cells (RBCs)/high power field are found (Fine, 2002). Dipstick testing is the initial test for detecting hematuria. It is very sensitive and will pick up one to two RBCs/hpf (Fine, 2002). Dipstick testing will register positive in a urine that has microscopic hematuria allowed to stand for too long (i.e., with hemolyzed RBCs) in spite of few or no red cells being seen on the film. In some cases, dipstick tests provides a false negative or false positive (Choi, 2003).
Table 3 summarizes the main causes in appearance of urine strips errors (Fine, 2002).
Table 3. Reasons in appearance of urine strips errors*
Reasons blood shows on dipstick urinalysis but not on microscopic exam (false positive)
Reasons blood doesn’t show on dipstick urinalysis but is present on microscopic exam (false negative)
Exercise Captopril Vitamin C
Dehydration Acidic urine (pH <1.5)
Hemoglobin (part of red blood cell) Myoglobin (break down product of red blood cell)
Concentrated urine Protein in the urine dipstick exposed to air
(After: O’Brien et al., 2014). The protocol in the diagnosis of hematuria includes first testing with urinary strip and if it is positive urine should be sent for urinalysis. If the patient has more than five RBCs/hpf, microscopic hematuria is present. The American Urologic Association declares “evaluation should be based solely on findings from microscopic examination of urine sediment and not on a dipstick reading.” (O’Brien et al., 2014). From a total of 51 urinary dipstick who tested positive, we discovered on the examination of urine sediment that 46 samples confirms the presence of more five red blood cells (RBCs)/high power field, and 5 samples offered a false - positive (Figure 8). Positive dipstick for hematuria with negative microscopy are often due to false negative microscopy. With bright field microscopy, negative results may occur as a result of spontaneous lysis of red cells or by failure to detect ‘ghost’ forms (Choi, 2003).
Figure 8. Urine dipstick positive vs. Urine sediment
microscope positive (Original)
Of the 71 samples analyzed it was determined that 76% were within the macroscopic
6% 31%
32%
31%
Hematuria prevalence by age
> 1 year1 - 5 years6-10 years< 10 years
0
20
40
60
80
100
71 51
Numbers ofdipstick tests
Positive samplesfor hematuria
0,00
20,00
40,00
60,00
Red blood cells
51 46 Urinarydipstickpositive
Urine sedimentmicroscopepositive
hematuria and 24% to microscopic hematuria, and 28% of the samples showed no hematuria (Figure 9). In assessing gross hematuria, it is important to verify the presence of RBCs by microscopy. After centrifugation of the urine, the finding of red urinary sediment with a positive strip test for hemoglobin it suggest hematuria, whereas red supernatant with negative dipstick testing for hemoglobin is indicative of myoglobinuria, hemoglobinuria, or other causes of discolored urine (Veerreddy, 2013).The overwhelming result in which macrohe-maturia is triple to microscopic hematuria is probably due to the fact that most of the diagnosis established implies o advanced pathological disorder in which bleeding is a common sign. Concerning the micturition moment, terminal hematuria records a higher proportion, being an element suggesting the involvement of the lower urinary tract.
Figure 9. Gross hematuria and microhematuria (Original)
CONCLUSIONS Hematuria is a common finding of urological pathology as we discovered in our study. Hematuria in dogs and cats has a wide differential diagnosis, with different therapeutic approaches compared to human patients. It is important that in the first evaluation of the animals the clinician takes account of the risk factors of every species. Knowing that felines with male gender are prone to develop urological disorders that express macroscopic hematuria such as FUS,
urolithiasis and cystitis, can help the clinician to pursue a reduced number of methods of investigation offering a fast diagnosis. More often than not, owners, demand an immediate diagnosis, particularly when there is macroscopic hematuria due to the impact of blood in the urine that alarms them. A simple and practical approach to the animal who presents hematuria should consists in a fewer invasive studies, a less costly evaluation, and a accurate diagnosis. Our results suggest that asymptomatic micros-copic hematuria in dogs and cats is rarely associated withclinically significant disease of the urinary tract, but is mandatory to keep under observations the animals. Gross hematuria is more commonly and is associated with urinary tract disease, such that a thorough evaluation for determination of the bleeding origin is justified and recommended. REFERENCES Barratt J., 2007. What to do with patients with abnormal
dipstick urinalysis. Medicine, 35(7), p. 365–367. https://doi.org/10.1016/j.mpmed.2007.04.009
Bataille A., Wetzstein M., Hertig A., Vimont S., Rondeau E. & Galichon P., 2016. Evidence of dip-stick superiority over urine microscopy analysis for detection of hematuria. BMC Research Notes, 9(1), 435. https://doi.org/10.1186/s13104-016-2240-y.
Chew D.J., DiBartola S.P., & Schenck P.A., 2011. Urinalysis. Canine and Feline Nephrology and Urology, p. 1–31.
Choi K., 2003. Approach to Proteinuria and Hematuria in General Practice Urine microscopy – the Liquid Biopsy . Hematuria, p. 1–7
Costache C., 2005. Hematuria - algoritm de diagnostic. 1(3), p. 265–270. https://doi.org/10.1038/ki.1982.16
Fine B. A., 2002. Hematuria. p. 143–147. https://doi.org/10.1016/B978-0-7216-8178-8.10001-6
Massengill S.F.,2008. Hematuria. Pediatrics in Review, 29(10), p. 342–348. https://doi.org/10.1542/pir.29-10-342.
Mazhari R. & Kimmel P.L., 2002. Hematuria: An algorithmic.69(11).
O’Brien W., O’Connor K., Lailas N., Schenk G., Young J., Pruna C., Starks C., Spencer J., Tamburro K., age K., Parker M., 2014. The urology group, 30, 2011.
Rao P.K. & Jones J.S., 2008. How to evaluate “dipstick hematuria”: What to do before you refer. Cleveland Clinic Journal of Medicine, 75(3), p. 227–233.
Syme H.M., 2012. Stones in cats and dogs: What can be learnt from them? Arab Journal of Urology, 10(3), p. 230–239.
Reine N.J.& Langston C.E., 2005. Urinalysis inter-pretation: How to squeeze out the maximum
0%10%20%30%40%50%60%70%80%90%
100%
76% 24% 28%
Grosshematuria
Microscopichematuria

159
The prevalence of cystine calculi is highly dependent on geographical location, with a higher reported prevalence in dogs in Europe than dogs from the USA (Syme, 2012).
Figure 6. Hematuria prevalence by age (Original)
We evaluated 65 animals from which we colected 71 samples on a period of 5 months; the result we obtained using urinary dipstick IDEXX UA, was 51 tested positive for RBC/ hemoglobin/ myoglobin - urine is discolored but no RBC are noted on microscopic examination (Figure 7).
Figure 7. Numbers of dipstick test and positive samples
for hematuria (Original)
It is been noted that microscopic hematuria is present when more than five red blood cells (RBCs)/high power field are found (Fine, 2002). Dipstick testing is the initial test for detecting hematuria. It is very sensitive and will pick up one to two RBCs/hpf (Fine, 2002). Dipstick testing will register positive in a urine that has microscopic hematuria allowed to stand for too long (i.e., with hemolyzed RBCs) in spite of few or no red cells being seen on the film. In some cases, dipstick tests provides a false negative or false positive (Choi, 2003).
Table 3 summarizes the main causes in appearance of urine strips errors (Fine, 2002).
Table 3. Reasons in appearance of urine strips errors*
Reasons blood shows on dipstick urinalysis but not on microscopic exam (false positive)
Reasons blood doesn’t show on dipstick urinalysis but is present on microscopic exam (false negative)
Exercise Captopril Vitamin C
Dehydration Acidic urine (pH <1.5)
Hemoglobin (part of red blood cell) Myoglobin (break down product of red blood cell)
Concentrated urine Protein in the urine dipstick exposed to air
(After: O’Brien et al., 2014). The protocol in the diagnosis of hematuria includes first testing with urinary strip and if it is positive urine should be sent for urinalysis. If the patient has more than five RBCs/hpf, microscopic hematuria is present. The American Urologic Association declares “evaluation should be based solely on findings from microscopic examination of urine sediment and not on a dipstick reading.” (O’Brien et al., 2014). From a total of 51 urinary dipstick who tested positive, we discovered on the examination of urine sediment that 46 samples confirms the presence of more five red blood cells (RBCs)/high power field, and 5 samples offered a false - positive (Figure 8). Positive dipstick for hematuria with negative microscopy are often due to false negative microscopy. With bright field microscopy, negative results may occur as a result of spontaneous lysis of red cells or by failure to detect ‘ghost’ forms (Choi, 2003).
Figure 8. Urine dipstick positive vs. Urine sediment
microscope positive (Original)
Of the 71 samples analyzed it was determined that 76% were within the macroscopic
6% 31%
32%
31%
Hematuria prevalence by age
> 1 year1 - 5 years6-10 years< 10 years
0
20
40
60
80
100
71 51
Numbers ofdipstick tests
Positive samplesfor hematuria
0,00
20,00
40,00
60,00
Red blood cells
51 46 Urinarydipstickpositive
Urine sedimentmicroscopepositive
hematuria and 24% to microscopic hematuria, and 28% of the samples showed no hematuria (Figure 9). In assessing gross hematuria, it is important to verify the presence of RBCs by microscopy. After centrifugation of the urine, the finding of red urinary sediment with a positive strip test for hemoglobin it suggest hematuria, whereas red supernatant with negative dipstick testing for hemoglobin is indicative of myoglobinuria, hemoglobinuria, or other causes of discolored urine (Veerreddy, 2013).The overwhelming result in which macrohe-maturia is triple to microscopic hematuria is probably due to the fact that most of the diagnosis established implies o advanced pathological disorder in which bleeding is a common sign. Concerning the micturition moment, terminal hematuria records a higher proportion, being an element suggesting the involvement of the lower urinary tract.
Figure 9. Gross hematuria and microhematuria (Original)
CONCLUSIONS Hematuria is a common finding of urological pathology as we discovered in our study. Hematuria in dogs and cats has a wide differential diagnosis, with different therapeutic approaches compared to human patients. It is important that in the first evaluation of the animals the clinician takes account of the risk factors of every species. Knowing that felines with male gender are prone to develop urological disorders that express macroscopic hematuria such as FUS,
urolithiasis and cystitis, can help the clinician to pursue a reduced number of methods of investigation offering a fast diagnosis. More often than not, owners, demand an immediate diagnosis, particularly when there is macroscopic hematuria due to the impact of blood in the urine that alarms them. A simple and practical approach to the animal who presents hematuria should consists in a fewer invasive studies, a less costly evaluation, and a accurate diagnosis. Our results suggest that asymptomatic micros-copic hematuria in dogs and cats is rarely associated withclinically significant disease of the urinary tract, but is mandatory to keep under observations the animals. Gross hematuria is more commonly and is associated with urinary tract disease, such that a thorough evaluation for determination of the bleeding origin is justified and recommended. REFERENCES Barratt J., 2007. What to do with patients with abnormal
dipstick urinalysis. Medicine, 35(7), p. 365–367. https://doi.org/10.1016/j.mpmed.2007.04.009
Bataille A., Wetzstein M., Hertig A., Vimont S., Rondeau E. & Galichon P., 2016. Evidence of dip-stick superiority over urine microscopy analysis for detection of hematuria. BMC Research Notes, 9(1), 435. https://doi.org/10.1186/s13104-016-2240-y.
Chew D.J., DiBartola S.P., & Schenck P.A., 2011. Urinalysis. Canine and Feline Nephrology and Urology, p. 1–31.
Choi K., 2003. Approach to Proteinuria and Hematuria in General Practice Urine microscopy – the Liquid Biopsy . Hematuria, p. 1–7
Costache C., 2005. Hematuria - algoritm de diagnostic. 1(3), p. 265–270. https://doi.org/10.1038/ki.1982.16
Fine B. A., 2002. Hematuria. p. 143–147. https://doi.org/10.1016/B978-0-7216-8178-8.10001-6
Massengill S.F.,2008. Hematuria. Pediatrics in Review, 29(10), p. 342–348. https://doi.org/10.1542/pir.29-10-342.
Mazhari R. & Kimmel P.L., 2002. Hematuria: An algorithmic.69(11).
O’Brien W., O’Connor K., Lailas N., Schenk G., Young J., Pruna C., Starks C., Spencer J., Tamburro K., age K., Parker M., 2014. The urology group, 30, 2011.
Rao P.K. & Jones J.S., 2008. How to evaluate “dipstick hematuria”: What to do before you refer. Cleveland Clinic Journal of Medicine, 75(3), p. 227–233.
Syme H.M., 2012. Stones in cats and dogs: What can be learnt from them? Arab Journal of Urology, 10(3), p. 230–239.
Reine N.J.& Langston C.E., 2005. Urinalysis inter-pretation: How to squeeze out the maximum
0%10%20%30%40%50%60%70%80%90%
100%
76% 24% 28%
Grosshematuria
Microscopichematuria

160
information from a small sample. Clinical Techniques in Small Animal Practice, 20(1 SPEC.ISS.), p. 2–10. https://doi.org/10.1053/j.ctsap.2004.12.002
https://doi.org/10.1016/j.aju.2012.06.006 Roberts J.R., 2007. Urine Dipstick Testing : Everything
You Need to Know Urinalysis: A Comprehensive Review. Emergency Med. News, 29(June), p. 24-27. https://doi.org/10.1097/01.EEM.0000279130.93159.d9.
Van Der Molen A.J. & Hovius M.C., 2012. Hematuria: A problem-based imaging algorithm illustrating the
recent Dutch Guidelines on Hematuria. American Journal of Roentgenology, 198(6), p. 1256–1265. https://doi.org/10.2214/AJR.11.8255.
Veerreddy P., 2013. Hemoglobinuria misidentified as hematuria: Review of discolored urine and paroxysmal nocturnal hemoglobinuria. Clinical Medicine Insights: Blood Disorders, 6, p. 7–17. https://doi.org/10.4137/CMBD.S11517.
https://www.drugs.com/health-guide/hematuria.html.
LEVELS OF PERSISTENT ORGANOCHLORINE COMPOUNDS IN SEWAGE SLUDGE FROM WASTEWATER TREATMENT PLANTS
Mihaela PREDA, Veronica TĂNASE, Nicoleta Olimpia VRÎNCEANU
National Research and Development Institute for Soil Science, Agrochemistry
and Environment, Marasti 61, 011464, District 1, Bucharest, phone: +40-0213184458, fax: +40-0213184348,
Emails: [email protected], [email protected], [email protected], [email protected]
Corresponding author email: [email protected]
Abstract
The use of sewage sludge as fertilizer in agricultural soils is considered an economical way to use the high amounts produced by wastewater treatment plants. Besides the benefit, meaning high content of organic matter and nutrients, sewage sludge can have a negative impact on environment because it can contain persistent organic pollutants or heavy metals. The aim of this study is to establish the level of polychlorinated biphenyls (PCBs) and organochlorine insecticides in sewage sludge collected from 10 wastewater treatment plants. The PCB IUPAC no. 28, 52, 101, 118, 138, 153, 180 and ten organochlorines were extracted with organic solvents, purified with copper and silicagel and analysed by gas chromatography/time of flight mass spectrometry. The concentration of total PCBs ranged from 3ng/g to 59.2ng/g dry weight, levels below the upper limit for land application according to Romanian legislation law for agricultural use. The predominant congeners found in sewage sludge were PCB 28, PCB 52 and PCB 138. PCB homologue profiles are dominated by Tri-CBs and Tetra-CBs. The contamination of sewage sludge samples with organochlorine insecticides refers only to the presence of DDE and dieldrin. The other insecticides (aldrin, HCH, ppDDT and ppDDD) are undetectable.
Key words: organochlorine insecticides, PCBs, sewage sludge. INTRODUCTION Sewage sludge is a by-product of the waste water treatment processes. It contains nutrients and organic matter that can improve soil productivity, so it is widely used as soil amendments. Land application of treated sewage sludge has been adopted worldwide as a sustainable and economical option for sewage management. Besides the benefit, sewage sludge can have a negative impact on environment because it can contain persistent organic pollutants or heavy metals. Thus, sewage sludge can be a source of polychlorinated biphenyls. Polychlorinated biphenyls (PCBs) and organo-chlorine insecticides (OCLs) constitute two classes of compounds which are of prime concern due to their extreme persistence in the environment and potential for biomag-nification. They also could be responsible for a series of negative effects on life and environment even at low concentrations (Jones et al., 1991).
PCBs have an unusual high chemical stability, high electrical resistance, low volatility and resistance to degradation in the presence of high temperatures, so they have numerous industrial applications. Thus, PCBs were used as dielectric fluids in capacitors and transformers, as hydraulic fluids in mining equipment, as heat transfer fluids or vacuum pumps; they were also used as plasticizers and additives, as lubricating and cutting oils (Jones et al., 1991). Because of their lipophilic nature, PCBs and OCLspreferentially partition on sludge during wastewater treatment. It seems that these organic pollutants enter the wastewater stream by direct or indirect release from household or industry or by atmospheric deposition on surface and then runoff into the wastewater treatment system (Blanchard et al., 2001). In 1973 it was thought that PCBs are 210 compounds that differ in number and position of chlorine atoms (Jones et al., 1991). Later, the scientists considered the theoretical existence of 209 isomers of PCBs, of which about 150

161
information from a small sample. Clinical Techniques in Small Animal Practice, 20(1 SPEC.ISS.), p. 2–10. https://doi.org/10.1053/j.ctsap.2004.12.002
https://doi.org/10.1016/j.aju.2012.06.006 Roberts J.R., 2007. Urine Dipstick Testing : Everything
You Need to Know Urinalysis: A Comprehensive Review. Emergency Med. News, 29(June), p. 24-27. https://doi.org/10.1097/01.EEM.0000279130.93159.d9.
Van Der Molen A.J. & Hovius M.C., 2012. Hematuria: A problem-based imaging algorithm illustrating the
recent Dutch Guidelines on Hematuria. American Journal of Roentgenology, 198(6), p. 1256–1265. https://doi.org/10.2214/AJR.11.8255.
Veerreddy P., 2013. Hemoglobinuria misidentified as hematuria: Review of discolored urine and paroxysmal nocturnal hemoglobinuria. Clinical Medicine Insights: Blood Disorders, 6, p. 7–17. https://doi.org/10.4137/CMBD.S11517.
https://www.drugs.com/health-guide/hematuria.html.
AgroLife Scientific Journal - Volume 6, Number 2, 2017ISSN 2285-5718; ISSN CD-ROM 2285-5726; ISSN ONLINE 2286-0126; ISSN-L 2285-5718
LEVELS OF PERSISTENT ORGANOCHLORINE COMPOUNDS IN SEWAGE SLUDGE FROM WASTEWATER TREATMENT PLANTS
Mihaela PREDA, Veronica TĂNASE, Nicoleta Olimpia VRÎNCEANU
National Research and Development Institute for Soil Science, Agrochemistry
and Environment, Marasti 61, 011464, District 1, Bucharest, phone: +40-0213184458, fax: +40-0213184348,
Emails: [email protected], [email protected], [email protected], [email protected]
Corresponding author email: [email protected]
Abstract
The use of sewage sludge as fertilizer in agricultural soils is considered an economical way to use the high amounts produced by wastewater treatment plants. Besides the benefit, meaning high content of organic matter and nutrients, sewage sludge can have a negative impact on environment because it can contain persistent organic pollutants or heavy metals. The aim of this study is to establish the level of polychlorinated biphenyls (PCBs) and organochlorine insecticides in sewage sludge collected from 10 wastewater treatment plants. The PCB IUPAC no. 28, 52, 101, 118, 138, 153, 180 and ten organochlorines were extracted with organic solvents, purified with copper and silicagel and analysed by gas chromatography/time of flight mass spectrometry. The concentration of total PCBs ranged from 3ng/g to 59.2ng/g dry weight, levels below the upper limit for land application according to Romanian legislation law for agricultural use. The predominant congeners found in sewage sludge were PCB 28, PCB 52 and PCB 138. PCB homologue profiles are dominated by Tri-CBs and Tetra-CBs. The contamination of sewage sludge samples with organochlorine insecticides refers only to the presence of DDE and dieldrin. The other insecticides (aldrin, HCH, ppDDT and ppDDD) are undetectable.
Key words: organochlorine insecticides, PCBs, sewage sludge. INTRODUCTION Sewage sludge is a by-product of the waste water treatment processes. It contains nutrients and organic matter that can improve soil productivity, so it is widely used as soil amendments. Land application of treated sewage sludge has been adopted worldwide as a sustainable and economical option for sewage management. Besides the benefit, sewage sludge can have a negative impact on environment because it can contain persistent organic pollutants or heavy metals. Thus, sewage sludge can be a source of polychlorinated biphenyls. Polychlorinated biphenyls (PCBs) and organo-chlorine insecticides (OCLs) constitute two classes of compounds which are of prime concern due to their extreme persistence in the environment and potential for biomag-nification. They also could be responsible for a series of negative effects on life and environment even at low concentrations (Jones et al., 1991).
PCBs have an unusual high chemical stability, high electrical resistance, low volatility and resistance to degradation in the presence of high temperatures, so they have numerous industrial applications. Thus, PCBs were used as dielectric fluids in capacitors and transformers, as hydraulic fluids in mining equipment, as heat transfer fluids or vacuum pumps; they were also used as plasticizers and additives, as lubricating and cutting oils (Jones et al., 1991). Because of their lipophilic nature, PCBs and OCLspreferentially partition on sludge during wastewater treatment. It seems that these organic pollutants enter the wastewater stream by direct or indirect release from household or industry or by atmospheric deposition on surface and then runoff into the wastewater treatment system (Blanchard et al., 2001). In 1973 it was thought that PCBs are 210 compounds that differ in number and position of chlorine atoms (Jones et al., 1991). Later, the scientists considered the theoretical existence of 209 isomers of PCBs, of which about 150
162
was found in the environment (Larsen and Bowardt, 1993). PCB isomers have different toxicities. Non-ortho substituted PCBs (IUPAC no. 77, 81, 126 and 169) belong to the group with the highest toxicity, the mono-ortho substituted (60, 105, 110, 114, 118, 156, 157, 167) are moderately toxic, while the remaining 197 are relatively nontoxic (Soniassy et al., 1994). Among these congeners, 12 have similar toxicity to that of dioxins (PCDD/Fs) and to avoid the complexity involved in the determination, 7 indicator have been selected to monitor PCBs (PCB with IUPAC no. 28, 52, 101, 118, 138, 153, 180). Of the large number of insecticidal compunds produced, the HCH isomer, lindane (�-hexa-chlorocyclohexane), aldrin, dieldrin, and dichlorodipheniltrichloroethane (DDT isomers and metabolites) have been those most frequently detected in environmental samples (Babish et al., 1981) although these residues have declined in recent years as a result of legislative proscription of their use. Due to these properties PCBs and part of OCLs were included on the list of Priority Organic Pollutants (POPs), adopted at Stochkolm Convention in 2001. The occurence of PCBs in waste waters may arise from a number of sources, both industrial and domestic (Lester, 1983), including aqueous effluents from transformer and capacitormanu-facturing, investment cating plants, waste paper recyclingoperations (McIntyre and Lester, 1984). One of the first reports of PCBs in sludge was of six USA sewage sludges (Bergh and Peoples, 1977). The concentration are very high compared with another studies, about 756000 ng/g, probably because at that time, PCBs were still commonly used (Clarke et al., 2010). In 1990s, the concentrations of PCBs in sludges were declining and were often below 1000 ng/g. For example, italian sludges analysed had PCB concentration between 210 and 1010 ng/g (Ottaviani et al., 1993). By the new millenium, the concentration of PCBs in sewage sludge had decreased to 500ng/g. For example, in a survey of Canadian sludges PCBs were not detected in any of the samples (Bright and Healey, 2003). A survey of Spanish sludges from twenty waste water plants reprted low PCB concentration ranging between 3 and 60 �g/kg (Abad et al., 2005).
This is below the European recommended limit of 800 �g/kg. In fact, all European studies had concentrations lower than the European contaminant limit. Regarding OCLs, theymay enter the waste water treatment plants process from industrial discharge or as a component of urban runoff or drainage into the system. However, little researh has been carried out to investigate the environmental pathways and source of these compounds in sludge. Clarke et al. in 2010 considered that the most iluminating work was a study by Nylund etal., in 1997 that measured the concentration of organic contaminants in sewage sludge during a dry and rainy period. They found that the concentrations of DDT increased from 39 �g/kg in a dry period to 68 �g/kg in a wet period and suggested that atmospheric deposition facilitates the move-ment of this pesticides to the wastewater treat-ment plants. This suggests that a significant portion of DDT are either washed out of the atmosphere with rain or rainfall washes out pesticide residues from the urban environment. The concentration of lindane was not signi-ficantly different between the two periods (8.7 and 7.8��g/kg) which suggests that precipi-tations does not play an important role in the movement of lindane. Also, it was reported that 67±10% of lindane can be effectively removed by wastewater because it has a higher vapour pressure so it could be volatilised particularly in an aeration basin of an activated sludge (Kipopoulou et al., 2004). Another study was developed by McIntyre and Lester in 1984 in UK.They reported the following concentration: lindan - 340 ng/g; aldrin - 30 ng/g; and dieldrin:- 500 ng/g.Also, in an analysis of digested sludge from fourteen UK waste water treatment plants, HCH, HCB, endosulfan, DDT, DDE, DDD and chlordan were often below the detectable limit (Stevans et al., 2003). The concentration of two of the compounds above the detection limit were HCB and DDE. This observation is related to declining use of OCLs in Europe. HCB, like other chlorobenzenes, has industrial applications, which may account for its continuing presence in all the samples (Clarke et al., 2010). Another report of sewage sludge analysed for OCLs came from data collected from 31 waste water plants from China. Concentration of
HCH (all four isomers) were not regularly detected and the concentration was below limit of detection for all isomers (Wang et al., 2007). The presence of DDT was detected frequently and HCB was detected in all samples. The source of DDT may be diclofol which is still used in China, and HCB is associated with the production of pentachloronitrobenzene (Wang et al., 2007).
MATERIALS AND METHODS Thesewage sludge samples were collected from 10 wastewater plants situated in urban and industrialized areas. From each plants were collected ten treated sewage sludge samples. Because both PCBs and OCLs are lipophilic compounds, their adsorption on solid particles depends on organic matter. Thus, an important propertie who has to be determined is organic carbon which has high values ranged between 19,2% and 30%. pH range between 5.4 and 7.2. Samples were packed in aluminium foil and directly delivered to the laboratory and stored in a refrigerator. The determination of the PCBs (IUPAC no. 28, 52, 101, 118, 138, 153 and 180) and OCLs (�, �, �, �-HCH, aldrin, dieldrin, pp DDE, ppDDT, ppDDD) were performed according with SR EN 15308 and EPA 8081, respectively. 10 g of air-dried sample was mixed with anhydrous sodium sulphate, placed in extrac-tion thimble and Soxhlet extracted for a minimum of 100 extraction cycles with appro-ximately 150 ml acetone/hexane mixture. Acetone is removed with water and organic extract is reduced to an appropriate volume. The extract clean-up is a very important step and involved purification with copper (to remove sulfur), sulfuric acid (to remove lipids). The resulting extract is separated on silicagel column and it is divided in two fractions. The first fraction contain PCBs, aldrin and DDT, and the second fraction contains HCH and dieldrin. The final extract is injected in a gas chromatograf coupled with time of flight mass spectrometer. Separation and identification of the target compounds were performed with an Agilent 7890A gas chromatograph coupled with a time-of-flight mass spectrometer TruTOFTMHT. This system operate with a non-polar stationary phase cappillary column (DB-5MS with 60 m x
0.25 mm x 0.25 �m) with programmed tempe-rature (from 100°C to 330°C with 20°C/minute). The injector and transfer line temperatures were 250°C and 270°C, respectively. The carrier gas was helium 6.0 at 1ml/min. Injection volume was 1�l in splitless mode. HRMS was operated in selected ion monitoring (SIM) mode. The calibration curve is made from at least five standard solutions with equidistant concen-trations. All solvents are high purity grade for chro-matographycompliyng with SR EN 15308 and EPA 8081. Quality control is assured through the use of a certified reference material (LG6184). All samples are analyzed in three replicates and to avoid the contamination, a blank is running parallel with the samples. The blank shall be less than 50% of the lowest reporting limit. Also, before extraction, Soxhlet equipment were washed for 6 hours with 250 ml hexane. RESULTS AND DISCUSSIONS The analytical results of PCBs concentration in sewage sludge samples collected from waste-water plants (W) are presented below (Table 1). The total concentration of PCBs ranged from 3 ng/g to 59.2 ng/g. The highest levels were detected at W5, were all isomers are presents, suggesting a possible industrial effluent discharge source. According to Romanian Regulation (Order no. 344/2004) PCBs levels should be less than 0.8mg/kg dry weight for agricultural use. We have to mention that, from all PCB compounds, in this study were quantified only seven. Regarding the isomers concentration, it can be observed that trichloro- and tetrachloro-biphenyls (PCB 28 and PCB 52) are the most dominant (21.8% - 46.8% for PCB 28 and 20.7% - 53.3% for PCB 52). Contribution of pentachlorobiphenyls (PCB 101 and PCB 118) at total concentration is less than 17% and hexachlorobiphenyls (PCB 138 and PCB 153) represents less than 25% from total concentration of PCBs. The higher concentration of PCB 180 (isomer with seven chlorine atoms) is 5.2 ng/g and it was detected in W5 (Figure 1).

163
was found in the environment (Larsen and Bowardt, 1993). PCB isomers have different toxicities. Non-ortho substituted PCBs (IUPAC no. 77, 81, 126 and 169) belong to the group with the highest toxicity, the mono-ortho substituted (60, 105, 110, 114, 118, 156, 157, 167) are moderately toxic, while the remaining 197 are relatively nontoxic (Soniassy et al., 1994). Among these congeners, 12 have similar toxicity to that of dioxins (PCDD/Fs) and to avoid the complexity involved in the determination, 7 indicator have been selected to monitor PCBs (PCB with IUPAC no. 28, 52, 101, 118, 138, 153, 180). Of the large number of insecticidal compunds produced, the HCH isomer, lindane (�-hexa-chlorocyclohexane), aldrin, dieldrin, and dichlorodipheniltrichloroethane (DDT isomers and metabolites) have been those most frequently detected in environmental samples (Babish et al., 1981) although these residues have declined in recent years as a result of legislative proscription of their use. Due to these properties PCBs and part of OCLs were included on the list of Priority Organic Pollutants (POPs), adopted at Stochkolm Convention in 2001. The occurence of PCBs in waste waters may arise from a number of sources, both industrial and domestic (Lester, 1983), including aqueous effluents from transformer and capacitormanu-facturing, investment cating plants, waste paper recyclingoperations (McIntyre and Lester, 1984). One of the first reports of PCBs in sludge was of six USA sewage sludges (Bergh and Peoples, 1977). The concentration are very high compared with another studies, about 756000 ng/g, probably because at that time, PCBs were still commonly used (Clarke et al., 2010). In 1990s, the concentrations of PCBs in sludges were declining and were often below 1000 ng/g. For example, italian sludges analysed had PCB concentration between 210 and 1010 ng/g (Ottaviani et al., 1993). By the new millenium, the concentration of PCBs in sewage sludge had decreased to 500ng/g. For example, in a survey of Canadian sludges PCBs were not detected in any of the samples (Bright and Healey, 2003). A survey of Spanish sludges from twenty waste water plants reprted low PCB concentration ranging between 3 and 60 �g/kg (Abad et al., 2005).
This is below the European recommended limit of 800 �g/kg. In fact, all European studies had concentrations lower than the European contaminant limit. Regarding OCLs, theymay enter the waste water treatment plants process from industrial discharge or as a component of urban runoff or drainage into the system. However, little researh has been carried out to investigate the environmental pathways and source of these compounds in sludge. Clarke et al. in 2010 considered that the most iluminating work was a study by Nylund etal., in 1997 that measured the concentration of organic contaminants in sewage sludge during a dry and rainy period. They found that the concentrations of DDT increased from 39 �g/kg in a dry period to 68 �g/kg in a wet period and suggested that atmospheric deposition facilitates the move-ment of this pesticides to the wastewater treat-ment plants. This suggests that a significant portion of DDT are either washed out of the atmosphere with rain or rainfall washes out pesticide residues from the urban environment. The concentration of lindane was not signi-ficantly different between the two periods (8.7 and 7.8��g/kg) which suggests that precipi-tations does not play an important role in the movement of lindane. Also, it was reported that 67±10% of lindane can be effectively removed by wastewater because it has a higher vapour pressure so it could be volatilised particularly in an aeration basin of an activated sludge (Kipopoulou et al., 2004). Another study was developed by McIntyre and Lester in 1984 in UK.They reported the following concentration: lindan - 340 ng/g; aldrin - 30 ng/g; and dieldrin:- 500 ng/g.Also, in an analysis of digested sludge from fourteen UK waste water treatment plants, HCH, HCB, endosulfan, DDT, DDE, DDD and chlordan were often below the detectable limit (Stevans et al., 2003). The concentration of two of the compounds above the detection limit were HCB and DDE. This observation is related to declining use of OCLs in Europe. HCB, like other chlorobenzenes, has industrial applications, which may account for its continuing presence in all the samples (Clarke et al., 2010). Another report of sewage sludge analysed for OCLs came from data collected from 31 waste water plants from China. Concentration of
HCH (all four isomers) were not regularly detected and the concentration was below limit of detection for all isomers (Wang et al., 2007). The presence of DDT was detected frequently and HCB was detected in all samples. The source of DDT may be diclofol which is still used in China, and HCB is associated with the production of pentachloronitrobenzene (Wang et al., 2007).
MATERIALS AND METHODS Thesewage sludge samples were collected from 10 wastewater plants situated in urban and industrialized areas. From each plants were collected ten treated sewage sludge samples. Because both PCBs and OCLs are lipophilic compounds, their adsorption on solid particles depends on organic matter. Thus, an important propertie who has to be determined is organic carbon which has high values ranged between 19,2% and 30%. pH range between 5.4 and 7.2. Samples were packed in aluminium foil and directly delivered to the laboratory and stored in a refrigerator. The determination of the PCBs (IUPAC no. 28, 52, 101, 118, 138, 153 and 180) and OCLs (�, �, �, �-HCH, aldrin, dieldrin, pp DDE, ppDDT, ppDDD) were performed according with SR EN 15308 and EPA 8081, respectively. 10 g of air-dried sample was mixed with anhydrous sodium sulphate, placed in extrac-tion thimble and Soxhlet extracted for a minimum of 100 extraction cycles with appro-ximately 150 ml acetone/hexane mixture. Acetone is removed with water and organic extract is reduced to an appropriate volume. The extract clean-up is a very important step and involved purification with copper (to remove sulfur), sulfuric acid (to remove lipids). The resulting extract is separated on silicagel column and it is divided in two fractions. The first fraction contain PCBs, aldrin and DDT, and the second fraction contains HCH and dieldrin. The final extract is injected in a gas chromatograf coupled with time of flight mass spectrometer. Separation and identification of the target compounds were performed with an Agilent 7890A gas chromatograph coupled with a time-of-flight mass spectrometer TruTOFTMHT. This system operate with a non-polar stationary phase cappillary column (DB-5MS with 60 m x
0.25 mm x 0.25 �m) with programmed tempe-rature (from 100°C to 330°C with 20°C/minute). The injector and transfer line temperatures were 250°C and 270°C, respectively. The carrier gas was helium 6.0 at 1ml/min. Injection volume was 1�l in splitless mode. HRMS was operated in selected ion monitoring (SIM) mode. The calibration curve is made from at least five standard solutions with equidistant concen-trations. All solvents are high purity grade for chro-matographycompliyng with SR EN 15308 and EPA 8081. Quality control is assured through the use of a certified reference material (LG6184). All samples are analyzed in three replicates and to avoid the contamination, a blank is running parallel with the samples. The blank shall be less than 50% of the lowest reporting limit. Also, before extraction, Soxhlet equipment were washed for 6 hours with 250 ml hexane. RESULTS AND DISCUSSIONS The analytical results of PCBs concentration in sewage sludge samples collected from waste-water plants (W) are presented below (Table 1). The total concentration of PCBs ranged from 3 ng/g to 59.2 ng/g. The highest levels were detected at W5, were all isomers are presents, suggesting a possible industrial effluent discharge source. According to Romanian Regulation (Order no. 344/2004) PCBs levels should be less than 0.8mg/kg dry weight for agricultural use. We have to mention that, from all PCB compounds, in this study were quantified only seven. Regarding the isomers concentration, it can be observed that trichloro- and tetrachloro-biphenyls (PCB 28 and PCB 52) are the most dominant (21.8% - 46.8% for PCB 28 and 20.7% - 53.3% for PCB 52). Contribution of pentachlorobiphenyls (PCB 101 and PCB 118) at total concentration is less than 17% and hexachlorobiphenyls (PCB 138 and PCB 153) represents less than 25% from total concentration of PCBs. The higher concentration of PCB 180 (isomer with seven chlorine atoms) is 5.2 ng/g and it was detected in W5 (Figure 1).

164
Table 1. Mean concentration (ng/g) of PCBs in sludge from waste water plants (W)
PCB congener W1 W2 W3 W4 W5 W6 W7 W8 W9 W10
PCB 28 5.8 2.8 3.8 8.9 15.4 2.3 1.4 1.4 3.4 2.8
PCB 52 6.5 2.7 4.3 5.8 21.6 2.1 2.6 1.6 3.4 2.4
PCB 101 1.5 1.7 1.6 1.2 5.8 0.3 0.8 - 1.9 0.8
PCB 118 - 0.4 - 0.1 0.4 - - - 0.3 -
PCB 138 0.6 1.9 - 1.5 2.6 0.8 0.7 - 1.6 0.3
PCB 153 0.8 1.1 - 0.6 8.2 0.6 0.4 - 1.4 0.6
PCB 180 1.3 2.4 - 0.9 5.2 0.2 0.5 - 1.3 0.2
Total PCB 16.5 13 9.7 19 59.2 6.3 6.4 3 13.3 7.1 Similar concentration were reported in sludge in Beijing were the isomers concentration ranged between 7.5-19.4 ng/g (Guo Li et al., 2009). Another studies gave contents between 0.19 ng/g and 72.5ng/g (Souze Pereira and Kuch, 2005). The concentrations founded in this study are lower than those founded in Germany were the
PCBs concentration range between 60 ng/g and 212 ng/g (Lindholm-Lehto et al., 2016). Regarding the profiles of PCB isomers, this study indicate similar results with those obtained by the researchers from Valencia who also observed that PCBs in sludge samples were dominated by low chlorinated compounds (Gomez-Rico et al., 2007).
Figure 1. PCB homologue profiles of the sewage sludge samples
Regarding the contamination of sewage sludge with organochlorine insecticides it can be observed that HCH isomers, aldrin, ppDDD and ppDDTare not detectable in all samples. Dieldrin was found sporadically only in two samples with concentrations 26 ng/g, respectively 28 ng/g. ppDDE contaminate 4 samples with concentrations ranged between 18 ng/g and 56 ng/g.
Total DDT is a sum of ppDDE, ppDDD and ppDDT, so it is reasonable to assume that the contribution of total DDT is comprised of ppDDE. The presence of DDE in sewage sludge samples may be connected to breakdown of DDT to DDE in environment (Figure 2).
0
5
10
15
20
25
1 2 3 4 5 6 7 8 9 10
Tri-CBs
Tetra-CBs
Penta-CBs
Hexa-CBs
Hepta-CBs
ng/g
Figure 2. Distribution of organochlorine insecticides in sewage sludge samples CONCLUSIONS The present sudy indicate a low contamination of sewage sludge with PCBs and organochlorine insecticide. PCB homologue profiles are dominated by trichloro biphenyls (PCB 28) and tetrachloro biphenyls (PCB 52). HCH isomers, aldrin, pp DDT and pp DDD were not detected in any sewage sludge samples, instead DDE contaminate 4 samples. The presence of pp DDE is connected with breakdown of pp DDT. Dieldrin was only sporadically detected. The presence of these organic pollutants in sewage sludge samples, even at low levels, draws attention to the necessity of monitoring its content in sludge in order to avoid contamination of land and to assure human and environmental safety. REFERENCES Abad E., Martinez K., Planas C., Palacios O., Caixach J.,
Rivera J.,. 2005. Priority organic pollutant assessment of sludges for agricultural purposes. Chemosphere, 61, p. 1358-1369.
Babish J.G., Lisk D.J., Stoewsand G.S., Wilkinson C., 1981. Organic Toxicants and Pathogens in Sewage Sludge and their Environmental Effects. Cornell University, Special Report No. 42, 5 pp.
Bergh A.K., Peoples R.S., 1977. Distribution of polychlorinated biphenyls in a municipal waste water treatment plant and environs. Sci. Total Environ. 8 (3), p. 197-204.
Blanchard M., Teil M.J., Ollivon D., Garban B., Chesterikoff C., Chevreuil M., 2001. Origin and distribution of polyaromatic hydrocarbons and polychloro biphenyls in the urban effluents to waste water treatment plants of the Paris area (France). Water Research, 35(15),p. 3679-3687.
Bright D.A., Healey N., 2003. Contaminant risks from biosolids land application: contemporary organic contaminant levels in digested sewages ludge from five treatment plants in Greater Vancouver. British Columbi. Environ. Pollut., 126,p. 39-49.
Clarke B.O., Porter N.A., Marriott P. J., Blackbeard J.R., 2010. Investigating the levels and trends of organochlorine pesticides and polychlorinated biphenyl in sewages ludge. Environment International 36, p. 323-329.
Gomez-Rico M.F., Font R., Aracil I., Fullana A., 2007. Analysis of organic pollutants in sewages ludge from the Valencian community (Spain). Environmental Contamination and Toxicology, 52 (3), p. 306-316.
Guo L., Zhang B., Xiao K., Zhang Q., Zheng M., 2009. Levels and distributions of polychlorinated biphenyls in sewages ludge of urban waste water treatment plants. Journal of Environmental Sciences, 21, p. 468-473.
Jones K.C., Burnett V., Duarte-Davidson R. and Waterhouse K.S., 1991.PCBs in the Environment. Chemistry in Britain, 27, p. 435-438.
Kipopoulou A.M., Zouboulis A., Samara C., Kouimtzis T., 2004. The fate of lindane in the conventional activated sludge treatment process. Chemosphere, 55,p. 81-91.
Larsen B. and Bowardt S., 1993. HRGC Separation of PCB Congeners. The State-of-the-Art. Fifteenth International Symposium on Cappilarry Chromatography, Riva del Garda, Italy, vol. 1, p. 503-511.
Lester J.N., 1983. Presence of Organic Micropollutants in Sewage Sludges, Paper presented at the 3rd
International Symposium on Processing and Use of Sewage Sludge, Department of the
1 2 3 4 5 6 7 8 9 100
10
20
30
40
50
60
dieldrin
pp DDE
ng/g

165
Table 1. Mean concentration (ng/g) of PCBs in sludge from waste water plants (W)
PCB congener W1 W2 W3 W4 W5 W6 W7 W8 W9 W10
PCB 28 5.8 2.8 3.8 8.9 15.4 2.3 1.4 1.4 3.4 2.8
PCB 52 6.5 2.7 4.3 5.8 21.6 2.1 2.6 1.6 3.4 2.4
PCB 101 1.5 1.7 1.6 1.2 5.8 0.3 0.8 - 1.9 0.8
PCB 118 - 0.4 - 0.1 0.4 - - - 0.3 -
PCB 138 0.6 1.9 - 1.5 2.6 0.8 0.7 - 1.6 0.3
PCB 153 0.8 1.1 - 0.6 8.2 0.6 0.4 - 1.4 0.6
PCB 180 1.3 2.4 - 0.9 5.2 0.2 0.5 - 1.3 0.2
Total PCB 16.5 13 9.7 19 59.2 6.3 6.4 3 13.3 7.1 Similar concentration were reported in sludge in Beijing were the isomers concentration ranged between 7.5-19.4 ng/g (Guo Li et al., 2009). Another studies gave contents between 0.19 ng/g and 72.5ng/g (Souze Pereira and Kuch, 2005). The concentrations founded in this study are lower than those founded in Germany were the
PCBs concentration range between 60 ng/g and 212 ng/g (Lindholm-Lehto et al., 2016). Regarding the profiles of PCB isomers, this study indicate similar results with those obtained by the researchers from Valencia who also observed that PCBs in sludge samples were dominated by low chlorinated compounds (Gomez-Rico et al., 2007).
Figure 1. PCB homologue profiles of the sewage sludge samples
Regarding the contamination of sewage sludge with organochlorine insecticides it can be observed that HCH isomers, aldrin, ppDDD and ppDDTare not detectable in all samples. Dieldrin was found sporadically only in two samples with concentrations 26 ng/g, respectively 28 ng/g. ppDDE contaminate 4 samples with concentrations ranged between 18 ng/g and 56 ng/g.
Total DDT is a sum of ppDDE, ppDDD and ppDDT, so it is reasonable to assume that the contribution of total DDT is comprised of ppDDE. The presence of DDE in sewage sludge samples may be connected to breakdown of DDT to DDE in environment (Figure 2).
0
5
10
15
20
25
1 2 3 4 5 6 7 8 9 10
Tri-CBs
Tetra-CBs
Penta-CBs
Hexa-CBs
Hepta-CBs
ng/g
Figure 2. Distribution of organochlorine insecticides in sewage sludge samples CONCLUSIONS The present sudy indicate a low contamination of sewage sludge with PCBs and organochlorine insecticide. PCB homologue profiles are dominated by trichloro biphenyls (PCB 28) and tetrachloro biphenyls (PCB 52). HCH isomers, aldrin, pp DDT and pp DDD were not detected in any sewage sludge samples, instead DDE contaminate 4 samples. The presence of pp DDE is connected with breakdown of pp DDT. Dieldrin was only sporadically detected. The presence of these organic pollutants in sewage sludge samples, even at low levels, draws attention to the necessity of monitoring its content in sludge in order to avoid contamination of land and to assure human and environmental safety. REFERENCES Abad E., Martinez K., Planas C., Palacios O., Caixach J.,
Rivera J.,. 2005. Priority organic pollutant assessment of sludges for agricultural purposes. Chemosphere, 61, p. 1358-1369.
Babish J.G., Lisk D.J., Stoewsand G.S., Wilkinson C., 1981. Organic Toxicants and Pathogens in Sewage Sludge and their Environmental Effects. Cornell University, Special Report No. 42, 5 pp.
Bergh A.K., Peoples R.S., 1977. Distribution of polychlorinated biphenyls in a municipal waste water treatment plant and environs. Sci. Total Environ. 8 (3), p. 197-204.
Blanchard M., Teil M.J., Ollivon D., Garban B., Chesterikoff C., Chevreuil M., 2001. Origin and distribution of polyaromatic hydrocarbons and polychloro biphenyls in the urban effluents to waste water treatment plants of the Paris area (France). Water Research, 35(15),p. 3679-3687.
Bright D.A., Healey N., 2003. Contaminant risks from biosolids land application: contemporary organic contaminant levels in digested sewages ludge from five treatment plants in Greater Vancouver. British Columbi. Environ. Pollut., 126,p. 39-49.
Clarke B.O., Porter N.A., Marriott P. J., Blackbeard J.R., 2010. Investigating the levels and trends of organochlorine pesticides and polychlorinated biphenyl in sewages ludge. Environment International 36, p. 323-329.
Gomez-Rico M.F., Font R., Aracil I., Fullana A., 2007. Analysis of organic pollutants in sewages ludge from the Valencian community (Spain). Environmental Contamination and Toxicology, 52 (3), p. 306-316.
Guo L., Zhang B., Xiao K., Zhang Q., Zheng M., 2009. Levels and distributions of polychlorinated biphenyls in sewages ludge of urban waste water treatment plants. Journal of Environmental Sciences, 21, p. 468-473.
Jones K.C., Burnett V., Duarte-Davidson R. and Waterhouse K.S., 1991.PCBs in the Environment. Chemistry in Britain, 27, p. 435-438.
Kipopoulou A.M., Zouboulis A., Samara C., Kouimtzis T., 2004. The fate of lindane in the conventional activated sludge treatment process. Chemosphere, 55,p. 81-91.
Larsen B. and Bowardt S., 1993. HRGC Separation of PCB Congeners. The State-of-the-Art. Fifteenth International Symposium on Cappilarry Chromatography, Riva del Garda, Italy, vol. 1, p. 503-511.
Lester J.N., 1983. Presence of Organic Micropollutants in Sewage Sludges, Paper presented at the 3rd
International Symposium on Processing and Use of Sewage Sludge, Department of the
1 2 3 4 5 6 7 8 9 100
10
20
30
40
50
60
dieldrin
pp DDE
ng/g

166
NANOVESICLES FROM PLANTS AS EDIBLE CARRIERS
OF BIOACTIVE COMPOUNDS
Krizia SAGINI, Lorena URBANELLI, Sandra BURATTA, Leonardo LEONARDI, Carla EMILIANI
University of Perugia, via del Giochetto, Department of Chemistry,
Biology and Biotechnology, 06123 Perugia, Italy
Corresponding author email: [email protected] Abstract Nanosized vesicles are released by animal cells in the extracellular environment and have been retrieved in body fluids. Their small dimensions and relative stability as compared to synthetic liposomes has prompted their use as drug and gene delivery vehicles. However, the use of animal vesicles originating from cultured cells is hampered by safety issues. Recent findings have shown that edible plant-derived nanovesicles with a biochemical content resembling that of vesicles isolated from animal cells and body fluids could be obtained from vegetal sources, such as grape and grapefruit juices. These nanovesicles improved the stability and bioavailability of orally administered bioactive compounds such as curcumin and have been proposed as a therapeutic approach for the treatment of cancer and immunological disorders of the digestive tract. Furthermore, they have also shown therapeutic efficacy by themselves, being able to stimulate signaling pathways in intestinal target cells and demonstrating a cross-kingdom ability to transmit signals between vegetal and animal cells, that foster their use as nutriceuticals. Key words: plant edible nanovesicles, exosomes, drug delivery, therapeutic carriers, nutriceuticals. INTRODUCTION Animal cells release in the extracellular environment membrane surrounded extracellular vesicles (EVs) of different subcellular origin and dimensions. Most of these vesicles originate either from the outward budding of the plasma membrane (microvesicles or ectosomes) or are Intraluminal vesicles (ILVs) contained in Multivesicular Bodies (MVBs) of the late endosomal compartment, which are released outside the cell upon fusion of the MVB with the plasma membrane (exosomes). Microvesicles are characterized by heterogenous shape and dimensions ranging from 100 nm to 1000 nm, whereas exosomes are smaller, with a diameter between 30 nm and 120 nm (Urbanelli et al., 2013). After being released extracellularly, EVs end up in biological fluids and over the last 30 years, they have been isolated from many sources, namely blood, urine, saliva, cerebrospinal and amniotic fluid, breast milk (Yanez Mo et al., 2015). From a physiological point of view, they have been initially considered as disposal bags for unnecessary substances, but it has later
emerged that they actually have important functions in cell-to cell communication and must be considered an additional manner to transmit signals outside the cell, even in distant districts of the body and across biological barriers. EVs have a peculiar and complex biochemical composition, which is reminiscent of the cell of origin. In addition to lipids and proteins, they have raised considerable interest because they contain nucleic acids, namely mRNA and miRNA. To this regard, they have also been demonstrated to be a vehicle for horizontal gene transfer, as after transfer of exosomal mRNA, new proteins were found in the recipient cells, indicating that transferred exosomal mRNA are translated (Valadi et al., 2007). The size, biochemical features and widespread distribution of EVs have suggested many potential applications (Urbanelli et al., 2015). From a therapeutic point of view, EVs are able to present antigens and have been employed as immunostimulatory agents. More recently, it has been demonstrated that many regenerative properties of stem cells can be mimicked by stem cell released EVs, thus fostering their use in regenerative medicine. The presence of EVs
Environment/Commission of the European Commu-nities, Brighton, U. K.
Lindholm-Lehto P.C., Ahkola H.S., Knuutinen J.S., Herve S.H., 2016. Widespread occurrence and seasonal variation of pharmaceuticals in surface waters and municipal waste water treatment plants in central Finland. Environ. Sci. Pollut. Res., 23 (8), p. 7985–7997.
McIntyre A., Lester J., 1984. Occurrence and distribution of persistent organochlorine compounds in U.K. sewage sludge. Water Air Soil Pollut., 23, p. 397-415.
Nylund K., Asplund L., Jansson B., Jonsson P., Litzen K., Sellstrom U., 1992. Analysis of some polyhalogenated organic pollutants in sediment and sewage sludge. Chemosphere, 24, p. 1721-1730.
Ottaviani M., Crebelli R., Fuselli S., Larocca C., Baldassarri L.T., 1993.Chemical and mutagenic eva-luation of sludge from a large wastewater treatment plant. Ecotoxicol Environ. Saf. , 26, p.18-32.
Soniassy R., SandraP., SchlettC., 1994. Water Analysis, Organic Micropolluants, Germany. Hewlett-Packard.
Souza Pereira M., Kuch B., 2005. Heavy metals, PCDD/F and PCB in sewage sludge samples from two wastewater treatment facilities in Rio de Janeiro State, Brazil. Chemosphere 60(7), p. 844-853.
Stevens J.L., Northcott G.I., Stern G.A., Tomy G.T., Jones K.C., 2003. PAHs, PCBs, PCNs, organo-chlorine pesticides, synthetic musks, and polychlorinated n-alkanes in U.K. sewage sludge: Survey results and implications. Environ. Sci. Technol. 37, p. 462-467.
Wang Y., Zhang Q., Lv J., Li A., Liu H., Li G., Jiang G., 2007. Polybrominated diphenyl ethers and organo-chlorine pesticides in sewage sludge of wastewater treatment plants in China. Chemosphere 68 (9), p. 1683-1691.

167
NANOVESICLES FROM PLANTS AS EDIBLE CARRIERS
OF BIOACTIVE COMPOUNDS
Krizia SAGINI, Lorena URBANELLI, Sandra BURATTA, Leonardo LEONARDI, Carla EMILIANI
University of Perugia, via del Giochetto, Department of Chemistry,
Biology and Biotechnology, 06123 Perugia, Italy
Corresponding author email: [email protected] Abstract Nanosized vesicles are released by animal cells in the extracellular environment and have been retrieved in body fluids. Their small dimensions and relative stability as compared to synthetic liposomes has prompted their use as drug and gene delivery vehicles. However, the use of animal vesicles originating from cultured cells is hampered by safety issues. Recent findings have shown that edible plant-derived nanovesicles with a biochemical content resembling that of vesicles isolated from animal cells and body fluids could be obtained from vegetal sources, such as grape and grapefruit juices. These nanovesicles improved the stability and bioavailability of orally administered bioactive compounds such as curcumin and have been proposed as a therapeutic approach for the treatment of cancer and immunological disorders of the digestive tract. Furthermore, they have also shown therapeutic efficacy by themselves, being able to stimulate signaling pathways in intestinal target cells and demonstrating a cross-kingdom ability to transmit signals between vegetal and animal cells, that foster their use as nutriceuticals. Key words: plant edible nanovesicles, exosomes, drug delivery, therapeutic carriers, nutriceuticals. INTRODUCTION Animal cells release in the extracellular environment membrane surrounded extracellular vesicles (EVs) of different subcellular origin and dimensions. Most of these vesicles originate either from the outward budding of the plasma membrane (microvesicles or ectosomes) or are Intraluminal vesicles (ILVs) contained in Multivesicular Bodies (MVBs) of the late endosomal compartment, which are released outside the cell upon fusion of the MVB with the plasma membrane (exosomes). Microvesicles are characterized by heterogenous shape and dimensions ranging from 100 nm to 1000 nm, whereas exosomes are smaller, with a diameter between 30 nm and 120 nm (Urbanelli et al., 2013). After being released extracellularly, EVs end up in biological fluids and over the last 30 years, they have been isolated from many sources, namely blood, urine, saliva, cerebrospinal and amniotic fluid, breast milk (Yanez Mo et al., 2015). From a physiological point of view, they have been initially considered as disposal bags for unnecessary substances, but it has later
emerged that they actually have important functions in cell-to cell communication and must be considered an additional manner to transmit signals outside the cell, even in distant districts of the body and across biological barriers. EVs have a peculiar and complex biochemical composition, which is reminiscent of the cell of origin. In addition to lipids and proteins, they have raised considerable interest because they contain nucleic acids, namely mRNA and miRNA. To this regard, they have also been demonstrated to be a vehicle for horizontal gene transfer, as after transfer of exosomal mRNA, new proteins were found in the recipient cells, indicating that transferred exosomal mRNA are translated (Valadi et al., 2007). The size, biochemical features and widespread distribution of EVs have suggested many potential applications (Urbanelli et al., 2015). From a therapeutic point of view, EVs are able to present antigens and have been employed as immunostimulatory agents. More recently, it has been demonstrated that many regenerative properties of stem cells can be mimicked by stem cell released EVs, thus fostering their use in regenerative medicine. The presence of EVs
Environment/Commission of the European Commu-nities, Brighton, U. K.
Lindholm-Lehto P.C., Ahkola H.S., Knuutinen J.S., Herve S.H., 2016. Widespread occurrence and seasonal variation of pharmaceuticals in surface waters and municipal waste water treatment plants in central Finland. Environ. Sci. Pollut. Res., 23 (8), p. 7985–7997.
McIntyre A., Lester J., 1984. Occurrence and distribution of persistent organochlorine compounds in U.K. sewage sludge. Water Air Soil Pollut., 23, p. 397-415.
Nylund K., Asplund L., Jansson B., Jonsson P., Litzen K., Sellstrom U., 1992. Analysis of some polyhalogenated organic pollutants in sediment and sewage sludge. Chemosphere, 24, p. 1721-1730.
Ottaviani M., Crebelli R., Fuselli S., Larocca C., Baldassarri L.T., 1993.Chemical and mutagenic eva-luation of sludge from a large wastewater treatment plant. Ecotoxicol Environ. Saf. , 26, p.18-32.
Soniassy R., SandraP., SchlettC., 1994. Water Analysis, Organic Micropolluants, Germany. Hewlett-Packard.
Souza Pereira M., Kuch B., 2005. Heavy metals, PCDD/F and PCB in sewage sludge samples from two wastewater treatment facilities in Rio de Janeiro State, Brazil. Chemosphere 60(7), p. 844-853.
Stevens J.L., Northcott G.I., Stern G.A., Tomy G.T., Jones K.C., 2003. PAHs, PCBs, PCNs, organo-chlorine pesticides, synthetic musks, and polychlorinated n-alkanes in U.K. sewage sludge: Survey results and implications. Environ. Sci. Technol. 37, p. 462-467.
Wang Y., Zhang Q., Lv J., Li A., Liu H., Li G., Jiang G., 2007. Polybrominated diphenyl ethers and organo-chlorine pesticides in sewage sludge of wastewater treatment plants in China. Chemosphere 68 (9), p. 1683-1691.
AgroLife Scientific Journal - Volume 6, Number 2, 2017ISSN 2285-5718; ISSN CD-ROM 2285-5726; ISSN ONLINE 2286-0126; ISSN-L 2285-5718

168
in easily accessible circulating biofluids has prompted their use for diagnosis and prognostic purposes, in particular as biomarkers in cancer. Furthermore, another property has attracted the interest of the scientific community for EVs: they are relatively stable in biological fluids, i.e. much more resistant to degradation than synthetic liposomes, and their surface can be modified to increase their ability to target specific tissues or pass important barriers. This feature has suggested their use as drug delivery carriers for small molecules as well as for nucleic acids. As a matter of fact, EVs are nanovectors that protect their own nucleic acid content from degradation in biological fluids. EVs have been successfully loaded with many important drugs, such as paclitaxel, doxorubicin and methotrexate or with nucleic acids such as siRNA and miRNA (Pérez-Bermúdez et al., 2017), showing the ability to increase the stability and bioavailability of these therapeutic agents in vivo. Nevertheless, some problems related to the use of EVs as drug delivery carriers remain. Isolation and characterization procedures are far from being standardized and although safety risks for EVs are reduced with respect to cell-based therapies, their use require standard preparation protocols and imply regulatory issues that must be addressed. This evidence has prompted the search for a safer source of EVs for therapeutic purposes. A possible approach is the use of EVs synthetic mimetics, i.e. liposome with a lipid composition and surface charge based on the lipid composition and surface charge of EVs. However, the recent isolation of nanovesicles (NVs) in edible plants with structure and composition that appear comparable to mammalian cell-derived small EVs, i.e. exosomes, has opened a new perspective for the therapeutic application of EVs as nanocarriers. NANOVESICLES FROM EDIBLE PLANTS Recent studies have shown in plants the exocytosis of NVs structurally resembling mammalian exosomes. Plant MVBs implicated in the release of anti-microbial compounds to fight against fungal infections and to help fertilization have been described (Yañez-Mó et
al., 2015). Moreover, there is evidence that vesicles may be involved not only in plant-cell communication but also in cross-kingdom communication between plants and animals: a plant-derived miRNA such as miR-168 from rice has been reported to enter the circulation of rice-fed mice enclosed in vesicles (Zhang et al., 2012). Currently, NVs have been isolated from different edible plants (grapefruits, grapes, ginger, carrots and citrus limon) and their structure and function have been characterized (Ju et al., 2013; Mu et al., 2014; Wang et al., 2014; Raimondo et al., 2015). Since they are round-shaped and have a structure closely related to mammalian exosomes, they have been often called exosome-like nanovesicles or exosome-like nanoparticles. Plant-derived NVs have been usually isolated by differential centrifugation followed by a density gradient centrifugation step using plant juices as starting material, a protocol already used for the isolation of mammalian exosomes. Biophysical approaches (electron microscopy, nanoparticle tracking analysis and dynamic light scattering) have shown that these nanovesicles are exosome-like structures whose average diameter depends on the vegetal source. In fact, the diameter of nanovesicles from lemon juice was between 50 and 70 nm (Raimondo et al., 2015), whereas NVs with a larger diameter were observed in grape (~400 nm), grapefruit and ginger (~250 nm) (Ju et al., 2013; Wang et al., 2014; Mu et al., 2014). The size of NVs is an important parameter as it influences their interaction with recipient cells, namely with intestinal mucus cells (Zhang et al., 2016). As mammalian exosomes, plant-derived NVs usually show negative surface charge (-49.2 to 1.52 mV zeta potentials), indicating that they exhibit mutual repulsion and no tendency toward aggregation (Zhang et al., 2016). Further analyses have been also carried out to test the stability of plant-derived NVs in stomach-like and intestinal-like conditions by resuspending the NVs either in water or in stomach-like and intestinal-like solutions, then analysing their size and surface charge. Results have demonstrated that the size and charge of the plant-derived NVs are modified in pH-dependent manner (Mu et al., 2014; Wang et
al., 2014), but the modification of these biophysical parameters depends on the vegetable source. Mu and coworkers (2014) showed that grape-derived NVs became smaller in size in stomach-like and intestine-like solutions, whereas in the case of ginger NVs, a subset of the population enlarged in size was generated in stomach-like and intestinal-like solutions. The size distribution of NVs derived from grapefruit and carrots was modified in stomach-like solution, but not in intestinal-like solution. pH-depended changes of NVs surface charge were also observed (Mu et al., 2014; Wang et al., 2014). Specifically, the surface charge of the NVs derived from different vegetal sources was still negative in intestinal-like solution whereas a remarkable reduction in negative charge was observed in stomach-like solution (Mu et al., 2014; Wang et al., 2014). Wang and coworkers (2014) also evaluated the stability of grapefruit-derived NVs after serial digestion in gastric and intestinal enzymatic solutions and demonstrated that these NVs are resistant to digestion by both gastric and intestinal solution. The biochemical composition of plant-derived NVs shows peculiarities with respect to mammalian exosomes and is strictly dependent on the vegetable origin. For this reason, it is not surprising that NVs from different plants have different biological effects on recipient mammalian cells (Mu et al., 2014). Firstly, plant-derived NVs contain RNA and specifically a substantial amount of small-sized RNAs, thus indicating that plant-derived NV preparations are enriched in exosome-like nanoparticles resembling animal exosomes (Ju et al., 2013; Mu et al., 2014). NVs miRNA profile indicated that vesicles contain miRNA and specifically grape-derived NVs contain miRNA enriched for the miRNA169 family (Ju et al., 2013). Proteomic analyses allowed to identify 28 proteins in NVs from grapes (Ju et al., 2013) and 137 proteins in NVs from grapefruit (Wang et al., 2014). The protein profile indicated that a number of these proteins regulate carbohydrate and lipid metabolism (Wang et al., 2014). Interestingly, in the apoplastic fluid of sunflower a protein showing 68% identity with human Rab11a GTPase (a mammalian
exosome protein) has been identified, indirectly confirming the similarities between plant and mammalian nanovesicles (Yañez-Mó M. et al., 2015). Lipidomic analyses demonstrated differences in lipid composition of NVs of different origin. Like mammalian exosomes, grapefruit NVs are enriched in PE (~ 45%) and PC (~ 28%); in particular, they are rich of PE (34:2) and PC (34:2) molecular species (Wang et al., 2014). A peculiar lipid composition was observed in grape NVs that are enriched in PA (~53%) and PE (~26%) (Ju et al., 2014). PLANT-DERIVED NANOVESICLES AS THERAPEUTIC TOOLS Studies reported in the previous section not only investigated the structure and the biological composition of plant-derived NVs, but also determined their biological effect on mammalian cells. Results demonstrated that these nanoparticles are taken up by intestinal cells and influence intestinal regeneration and anti-inflammatory responses (Ju et al., 2013; Mu et al., 2014; Wang et al., 2014). The first demonstration that plant-derived NVs can penetrate the intestinal mucus barrier derived from the study of Ju and coworkers (2013). This study showed that grape NVs are taken up by mouse intestinal stem cells and subsequently strongly promote the proliferation of intestinal stem cells through the Wnt/β-catenin pathway. In addition, it has been provided evidence that the oral administration of NVs leads to protection of mice from dextran sulphate sodium (DSS)-induced colitis via induction of intestinal stem cells proliferation. NV lipids seems play an important role in targeting intestinal stem cells and in the promotion of their proliferation. Mu and coworkers (2014) showed that NVs isolated from four edible plants (ginger, carrot, grape and grapefruit) are taken up by intestinal macrophages and stem cells and exerted biological effects acting on different intracellular targets. The four plant-derived NVs induced in macrophages the activation of anti-inflammatory and anti-oxidant processes, whereas only ginger NVs were able to induce

169
in easily accessible circulating biofluids has prompted their use for diagnosis and prognostic purposes, in particular as biomarkers in cancer. Furthermore, another property has attracted the interest of the scientific community for EVs: they are relatively stable in biological fluids, i.e. much more resistant to degradation than synthetic liposomes, and their surface can be modified to increase their ability to target specific tissues or pass important barriers. This feature has suggested their use as drug delivery carriers for small molecules as well as for nucleic acids. As a matter of fact, EVs are nanovectors that protect their own nucleic acid content from degradation in biological fluids. EVs have been successfully loaded with many important drugs, such as paclitaxel, doxorubicin and methotrexate or with nucleic acids such as siRNA and miRNA (Pérez-Bermúdez et al., 2017), showing the ability to increase the stability and bioavailability of these therapeutic agents in vivo. Nevertheless, some problems related to the use of EVs as drug delivery carriers remain. Isolation and characterization procedures are far from being standardized and although safety risks for EVs are reduced with respect to cell-based therapies, their use require standard preparation protocols and imply regulatory issues that must be addressed. This evidence has prompted the search for a safer source of EVs for therapeutic purposes. A possible approach is the use of EVs synthetic mimetics, i.e. liposome with a lipid composition and surface charge based on the lipid composition and surface charge of EVs. However, the recent isolation of nanovesicles (NVs) in edible plants with structure and composition that appear comparable to mammalian cell-derived small EVs, i.e. exosomes, has opened a new perspective for the therapeutic application of EVs as nanocarriers. NANOVESICLES FROM EDIBLE PLANTS Recent studies have shown in plants the exocytosis of NVs structurally resembling mammalian exosomes. Plant MVBs implicated in the release of anti-microbial compounds to fight against fungal infections and to help fertilization have been described (Yañez-Mó et
al., 2015). Moreover, there is evidence that vesicles may be involved not only in plant-cell communication but also in cross-kingdom communication between plants and animals: a plant-derived miRNA such as miR-168 from rice has been reported to enter the circulation of rice-fed mice enclosed in vesicles (Zhang et al., 2012). Currently, NVs have been isolated from different edible plants (grapefruits, grapes, ginger, carrots and citrus limon) and their structure and function have been characterized (Ju et al., 2013; Mu et al., 2014; Wang et al., 2014; Raimondo et al., 2015). Since they are round-shaped and have a structure closely related to mammalian exosomes, they have been often called exosome-like nanovesicles or exosome-like nanoparticles. Plant-derived NVs have been usually isolated by differential centrifugation followed by a density gradient centrifugation step using plant juices as starting material, a protocol already used for the isolation of mammalian exosomes. Biophysical approaches (electron microscopy, nanoparticle tracking analysis and dynamic light scattering) have shown that these nanovesicles are exosome-like structures whose average diameter depends on the vegetal source. In fact, the diameter of nanovesicles from lemon juice was between 50 and 70 nm (Raimondo et al., 2015), whereas NVs with a larger diameter were observed in grape (~400 nm), grapefruit and ginger (~250 nm) (Ju et al., 2013; Wang et al., 2014; Mu et al., 2014). The size of NVs is an important parameter as it influences their interaction with recipient cells, namely with intestinal mucus cells (Zhang et al., 2016). As mammalian exosomes, plant-derived NVs usually show negative surface charge (-49.2 to 1.52 mV zeta potentials), indicating that they exhibit mutual repulsion and no tendency toward aggregation (Zhang et al., 2016). Further analyses have been also carried out to test the stability of plant-derived NVs in stomach-like and intestinal-like conditions by resuspending the NVs either in water or in stomach-like and intestinal-like solutions, then analysing their size and surface charge. Results have demonstrated that the size and charge of the plant-derived NVs are modified in pH-dependent manner (Mu et al., 2014; Wang et
al., 2014), but the modification of these biophysical parameters depends on the vegetable source. Mu and coworkers (2014) showed that grape-derived NVs became smaller in size in stomach-like and intestine-like solutions, whereas in the case of ginger NVs, a subset of the population enlarged in size was generated in stomach-like and intestinal-like solutions. The size distribution of NVs derived from grapefruit and carrots was modified in stomach-like solution, but not in intestinal-like solution. pH-depended changes of NVs surface charge were also observed (Mu et al., 2014; Wang et al., 2014). Specifically, the surface charge of the NVs derived from different vegetal sources was still negative in intestinal-like solution whereas a remarkable reduction in negative charge was observed in stomach-like solution (Mu et al., 2014; Wang et al., 2014). Wang and coworkers (2014) also evaluated the stability of grapefruit-derived NVs after serial digestion in gastric and intestinal enzymatic solutions and demonstrated that these NVs are resistant to digestion by both gastric and intestinal solution. The biochemical composition of plant-derived NVs shows peculiarities with respect to mammalian exosomes and is strictly dependent on the vegetable origin. For this reason, it is not surprising that NVs from different plants have different biological effects on recipient mammalian cells (Mu et al., 2014). Firstly, plant-derived NVs contain RNA and specifically a substantial amount of small-sized RNAs, thus indicating that plant-derived NV preparations are enriched in exosome-like nanoparticles resembling animal exosomes (Ju et al., 2013; Mu et al., 2014). NVs miRNA profile indicated that vesicles contain miRNA and specifically grape-derived NVs contain miRNA enriched for the miRNA169 family (Ju et al., 2013). Proteomic analyses allowed to identify 28 proteins in NVs from grapes (Ju et al., 2013) and 137 proteins in NVs from grapefruit (Wang et al., 2014). The protein profile indicated that a number of these proteins regulate carbohydrate and lipid metabolism (Wang et al., 2014). Interestingly, in the apoplastic fluid of sunflower a protein showing 68% identity with human Rab11a GTPase (a mammalian
exosome protein) has been identified, indirectly confirming the similarities between plant and mammalian nanovesicles (Yañez-Mó M. et al., 2015). Lipidomic analyses demonstrated differences in lipid composition of NVs of different origin. Like mammalian exosomes, grapefruit NVs are enriched in PE (~ 45%) and PC (~ 28%); in particular, they are rich of PE (34:2) and PC (34:2) molecular species (Wang et al., 2014). A peculiar lipid composition was observed in grape NVs that are enriched in PA (~53%) and PE (~26%) (Ju et al., 2014). PLANT-DERIVED NANOVESICLES AS THERAPEUTIC TOOLS Studies reported in the previous section not only investigated the structure and the biological composition of plant-derived NVs, but also determined their biological effect on mammalian cells. Results demonstrated that these nanoparticles are taken up by intestinal cells and influence intestinal regeneration and anti-inflammatory responses (Ju et al., 2013; Mu et al., 2014; Wang et al., 2014). The first demonstration that plant-derived NVs can penetrate the intestinal mucus barrier derived from the study of Ju and coworkers (2013). This study showed that grape NVs are taken up by mouse intestinal stem cells and subsequently strongly promote the proliferation of intestinal stem cells through the Wnt/β-catenin pathway. In addition, it has been provided evidence that the oral administration of NVs leads to protection of mice from dextran sulphate sodium (DSS)-induced colitis via induction of intestinal stem cells proliferation. NV lipids seems play an important role in targeting intestinal stem cells and in the promotion of their proliferation. Mu and coworkers (2014) showed that NVs isolated from four edible plants (ginger, carrot, grape and grapefruit) are taken up by intestinal macrophages and stem cells and exerted biological effects acting on different intracellular targets. The four plant-derived NVs induced in macrophages the activation of anti-inflammatory and anti-oxidant processes, whereas only ginger NVs were able to induce
170
the expression of the antioxidation gene heme oxygenase-1 and of the anti-inflammatory cytokine IL-10. Furthermore, all the different NVs considered in this paper induces an activation of Wnt signalling, which is crucial for maintaining intestinal homeostasis. Recently a role of plant-derived NVs in influencing cancer progression has been demonstrated. In this regard, Raimondo and coworkers (2015) showed that NVs from citrus lemon juice inhibit cell proliferation in different tumor cell lines by activating TRAIL-mediated apoptotic cell death. Authors also demonstrated, using an in vivo xenograft model of chronic myeloid leukemia, that citron lemon NVs reached the tumor site and suppressed tumor growth by activating TRAIL-mediated apoptotic cell processes and inhibiting of angiogenic processes. The identification of exosome-like nanoparticles in plants, with a structure and composition not distant from that of mammalian derived exosomes, has suggested their use as an alternative tool for drug and gene delivery. This approach is based on vesicles prepared from edible plants, and shows evident benefits in terms of safety and cost. Vesicles isolated from fruit juices (e.g., grape, grapefruit, and tomatoes) or from Actaea species have been loaded with different therapeutic drugs for the treatment of cancer and inflammatory disorders (Urbanelli et al., 2015). In two studies, it was also demonstrated that chemotherapeutic drugs such as methotrexate as well as siRNAs can be encapsulated into plant NVs (Wang et al., 2013; Wang et al, 2014). More recently, the capability of a grapefruit-derived nanovector to carry miR-17 for therapeutic treatment of mouse brain tumor has also been shown, providing the proof of principle that these vesicles can be used to deliver a miRNA across the blood–brain barrier via an unconventional route, i.e. intranasal delivery (Zhuang et al., 2016). In the case of curcumin, its improved stability and bioavailability once encapsulated in plant NVs has led to ongoing clinical trials investigating the ability of such nanocarriers to deliver curcumin to normal and colon cancer tissue (https:// clinicaltrials.gov/ct2/show/ NCT01294072).
CONCLUSIONS The isolation of nanovesicles from plants suggest many relevant applications. Nanovesicles from plant appear to communicate with the entire digestive tracts of mammals and mediate important physiological functions, representing a tool for cell communication between plants and animals. Their structural and biochemical features will prompt their therapeutic use not only as carriers for bioactive compounds and nutriceuticals, but also as drug delivery vehicles, that can be loaded with drugs or genes to improve the stability and bioavailability of these therapeutics. ACKNOWLEDGEMENTS This work was supported by Fondazione Cassa di Risparmio di Perugia Grant 2016.0050.021 to Prof. Carla Emiliani. REFERENCES Ju S., Mu J., Dokland T., Zhuang X., Wang Q., Jiang H.,
Xiang X., Deng Z.B., Wang B., Zhang L., Roth M., Welti R., Mobley J., Jun Y., Miller D., Zhang H.G., 2013. Grape exosome-like nanoparticles induce intestinal stem cells and protect mice from DSS-induced colitis. Mol Ther. 21: p. 1345-1357.
Mu J., Zhuang X., Wang Q., Jiang H., Deng Z.B., Wang B., Zhang L., Kakar S., Jun Y., Miller D., Zhang H.G., 2014. Interspecies communication between plant and mouse gut host cells through edible plant derived exosome-like nanoparticles. Mol Nutr Food Res. 58: p. 1561-1573.
Pérez-Bermúdez P., Blesa J., Soriano J.M., Marcilla A., 2017. Extracellular vesicles in food: Experimental evidence of their secretion in grape fruits. Eur J Pharm Sci. 98: p. 40-50.
Raimondo S., Naselli F., Fontana S., Monteleone F., Lo Dico A., Saieva L., Zito G., Flugy A., Manno M., Di Bella M.A., De Leo G., Alessandro R., 2015. Citrus limon-derived nanovesicles inhibit cancer cell proliferation and suppress CML xenograft growth by inducing TRAIL-mediated cell death. Oncotarget 6: p. 19514-19527.
Urbanelli L., Magini A., Buratta S., Brozzi A., Sagini K., Polchi A., Tancini T., Emiliani C., 2013. Signaling Pathways in Exosomes Biogenesis, Secretion and Fate. Genes 4: p. 152-170.
Urbanelli L., Buratta S., Sagini K., Ferrara G., Lanni M., Emiliani C., 2015 Exosome-based strategies for Diagnosis and Therapy. Recent Pat CNS Drug Discov. 10: p. 10-27.
Wang Q., Zhuang X., Mu J., Deng Z.B., Jiang H., Zhang L., Xiang X., Wang B., Yan J., Miller D., Zhang
H.G., 2013. Delivery of therapeutic agents by nanoparticles made of grapefruit-derived lipids. Nat. Commun. 4: 1867.
Wang B., Zhuang X., Deng Z.B., Jiang H., Mu J., Wang Q., Xiang X., Guo H., Zhang L., Dryden G., Yan J., Miller D., Zhang H.G., 2014. Targeted drug delivery to intestinal macrophages by bioactive nanovesicles released from grapefruit. Mol Ther. 22: p. 522-534.
Yañez-Mó M. et al., 2015. Biological properties of extracellular vesicles and their physiological functions. Journal of Extracellular Vesicles 4: 27066.
Zhang L., Hou D., Chen X., Li D., Zhu L., Zhang Y., Li J., Bian Z., Liang X., Cai X., Yin Y., Wang C., Zhang T., Zhu D., Zhang D., Xu J., Chen Q., Ba Y., Liu J., Wang Q., Chen J., Wang J., Wang M., Zhang
Q., Zhang J., Zen K., Zhang C.Y., 2012. Exogenous plant MIR168a specifically targets mammalian. LDLRAP1: evidence of cross-kingdom regulation by micro-RNA. Cell Res. 22: p. 107-126.
Zhang M., Viennois E., Xu C., Merlin D., 2016. Plant derived edible nanoparticles as a new therapeutic approach against diseases. Tissue Barriers 4: e1134415.
Zhuang X., Teng Y., Samykutty A., Mu J., Deng Z., Zhang L., Cao P., Rong Y., Yan J., Miller D., Zhang H.G., 2016. Grapefruit-derived Nanovectors Delivering Therapeutic miR17 Through an Intranasal Route Inhibit Brain Tumor Progression. Mol Ther. 24: p. 96-105.

171
the expression of the antioxidation gene heme oxygenase-1 and of the anti-inflammatory cytokine IL-10. Furthermore, all the different NVs considered in this paper induces an activation of Wnt signalling, which is crucial for maintaining intestinal homeostasis. Recently a role of plant-derived NVs in influencing cancer progression has been demonstrated. In this regard, Raimondo and coworkers (2015) showed that NVs from citrus lemon juice inhibit cell proliferation in different tumor cell lines by activating TRAIL-mediated apoptotic cell death. Authors also demonstrated, using an in vivo xenograft model of chronic myeloid leukemia, that citron lemon NVs reached the tumor site and suppressed tumor growth by activating TRAIL-mediated apoptotic cell processes and inhibiting of angiogenic processes. The identification of exosome-like nanoparticles in plants, with a structure and composition not distant from that of mammalian derived exosomes, has suggested their use as an alternative tool for drug and gene delivery. This approach is based on vesicles prepared from edible plants, and shows evident benefits in terms of safety and cost. Vesicles isolated from fruit juices (e.g., grape, grapefruit, and tomatoes) or from Actaea species have been loaded with different therapeutic drugs for the treatment of cancer and inflammatory disorders (Urbanelli et al., 2015). In two studies, it was also demonstrated that chemotherapeutic drugs such as methotrexate as well as siRNAs can be encapsulated into plant NVs (Wang et al., 2013; Wang et al, 2014). More recently, the capability of a grapefruit-derived nanovector to carry miR-17 for therapeutic treatment of mouse brain tumor has also been shown, providing the proof of principle that these vesicles can be used to deliver a miRNA across the blood–brain barrier via an unconventional route, i.e. intranasal delivery (Zhuang et al., 2016). In the case of curcumin, its improved stability and bioavailability once encapsulated in plant NVs has led to ongoing clinical trials investigating the ability of such nanocarriers to deliver curcumin to normal and colon cancer tissue (https:// clinicaltrials.gov/ct2/show/ NCT01294072).
CONCLUSIONS The isolation of nanovesicles from plants suggest many relevant applications. Nanovesicles from plant appear to communicate with the entire digestive tracts of mammals and mediate important physiological functions, representing a tool for cell communication between plants and animals. Their structural and biochemical features will prompt their therapeutic use not only as carriers for bioactive compounds and nutriceuticals, but also as drug delivery vehicles, that can be loaded with drugs or genes to improve the stability and bioavailability of these therapeutics. ACKNOWLEDGEMENTS This work was supported by Fondazione Cassa di Risparmio di Perugia Grant 2016.0050.021 to Prof. Carla Emiliani. REFERENCES Ju S., Mu J., Dokland T., Zhuang X., Wang Q., Jiang H.,
Xiang X., Deng Z.B., Wang B., Zhang L., Roth M., Welti R., Mobley J., Jun Y., Miller D., Zhang H.G., 2013. Grape exosome-like nanoparticles induce intestinal stem cells and protect mice from DSS-induced colitis. Mol Ther. 21: p. 1345-1357.
Mu J., Zhuang X., Wang Q., Jiang H., Deng Z.B., Wang B., Zhang L., Kakar S., Jun Y., Miller D., Zhang H.G., 2014. Interspecies communication between plant and mouse gut host cells through edible plant derived exosome-like nanoparticles. Mol Nutr Food Res. 58: p. 1561-1573.
Pérez-Bermúdez P., Blesa J., Soriano J.M., Marcilla A., 2017. Extracellular vesicles in food: Experimental evidence of their secretion in grape fruits. Eur J Pharm Sci. 98: p. 40-50.
Raimondo S., Naselli F., Fontana S., Monteleone F., Lo Dico A., Saieva L., Zito G., Flugy A., Manno M., Di Bella M.A., De Leo G., Alessandro R., 2015. Citrus limon-derived nanovesicles inhibit cancer cell proliferation and suppress CML xenograft growth by inducing TRAIL-mediated cell death. Oncotarget 6: p. 19514-19527.
Urbanelli L., Magini A., Buratta S., Brozzi A., Sagini K., Polchi A., Tancini T., Emiliani C., 2013. Signaling Pathways in Exosomes Biogenesis, Secretion and Fate. Genes 4: p. 152-170.
Urbanelli L., Buratta S., Sagini K., Ferrara G., Lanni M., Emiliani C., 2015 Exosome-based strategies for Diagnosis and Therapy. Recent Pat CNS Drug Discov. 10: p. 10-27.
Wang Q., Zhuang X., Mu J., Deng Z.B., Jiang H., Zhang L., Xiang X., Wang B., Yan J., Miller D., Zhang
H.G., 2013. Delivery of therapeutic agents by nanoparticles made of grapefruit-derived lipids. Nat. Commun. 4: 1867.
Wang B., Zhuang X., Deng Z.B., Jiang H., Mu J., Wang Q., Xiang X., Guo H., Zhang L., Dryden G., Yan J., Miller D., Zhang H.G., 2014. Targeted drug delivery to intestinal macrophages by bioactive nanovesicles released from grapefruit. Mol Ther. 22: p. 522-534.
Yañez-Mó M. et al., 2015. Biological properties of extracellular vesicles and their physiological functions. Journal of Extracellular Vesicles 4: 27066.
Zhang L., Hou D., Chen X., Li D., Zhu L., Zhang Y., Li J., Bian Z., Liang X., Cai X., Yin Y., Wang C., Zhang T., Zhu D., Zhang D., Xu J., Chen Q., Ba Y., Liu J., Wang Q., Chen J., Wang J., Wang M., Zhang
Q., Zhang J., Zen K., Zhang C.Y., 2012. Exogenous plant MIR168a specifically targets mammalian. LDLRAP1: evidence of cross-kingdom regulation by micro-RNA. Cell Res. 22: p. 107-126.
Zhang M., Viennois E., Xu C., Merlin D., 2016. Plant derived edible nanoparticles as a new therapeutic approach against diseases. Tissue Barriers 4: e1134415.
Zhuang X., Teng Y., Samykutty A., Mu J., Deng Z., Zhang L., Cao P., Rong Y., Yan J., Miller D., Zhang H.G., 2016. Grapefruit-derived Nanovectors Delivering Therapeutic miR17 Through an Intranasal Route Inhibit Brain Tumor Progression. Mol Ther. 24: p. 96-105.
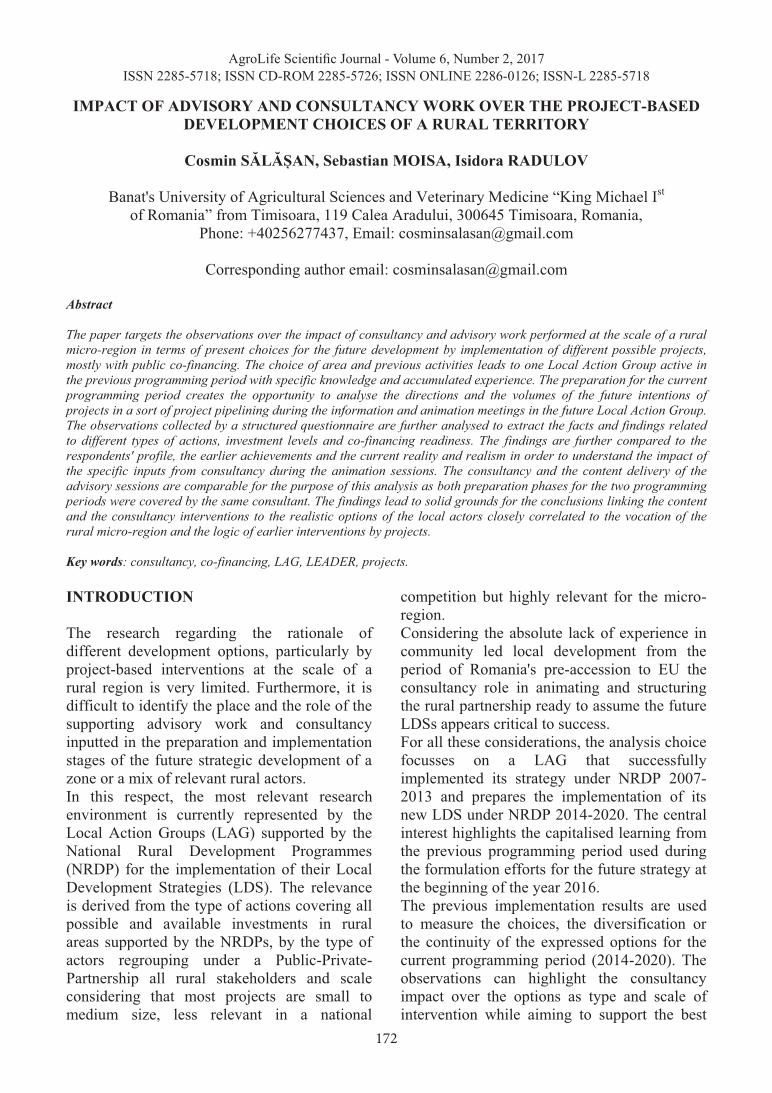
172
AgroLife Scientific Journal - Volume 6, Number 2, 2017ISSN 2285-5718; ISSN CD-ROM 2285-5726; ISSN ONLINE 2286-0126; ISSN-L 2285-5718
IMPACT OF ADVISORY AND CONSULTANCY WORK OVER THE PROJECT-BASED
DEVELOPMENT CHOICES OF A RURAL TERRITORY
Cosmin SĂLĂȘAN, Sebastian MOISA, Isidora RADULOV
Banat's University of Agricultural Sciences and Veterinary Medicine “King Michael Ist of Romania” from Timisoara, 119 Calea Aradului, 300645 Timisoara, Romania,
Phone: +40256277437, Email: [email protected]
Corresponding author email: [email protected] Abstract The paper targets the observations over the impact of consultancy and advisory work performed at the scale of a rural micro-region in terms of present choices for the future development by implementation of different possible projects, mostly with public co-financing. The choice of area and previous activities leads to one Local Action Group active in the previous programming period with specific knowledge and accumulated experience. The preparation for the current programming period creates the opportunity to analyse the directions and the volumes of the future intentions of projects in a sort of project pipelining during the information and animation meetings in the future Local Action Group. The observations collected by a structured questionnaire are further analysed to extract the facts and findings related to different types of actions, investment levels and co-financing readiness. The findings are further compared to the respondents' profile, the earlier achievements and the current reality and realism in order to understand the impact of the specific inputs from consultancy during the animation sessions. The consultancy and the content delivery of the advisory sessions are comparable for the purpose of this analysis as both preparation phases for the two programming periods were covered by the same consultant. The findings lead to solid grounds for the conclusions linking the content and the consultancy interventions to the realistic options of the local actors closely correlated to the vocation of the rural micro-region and the logic of earlier interventions by projects. Key words: consultancy, co-financing, LAG, LEADER, projects. INTRODUCTION The research regarding the rationale of different development options, particularly by project-based interventions at the scale of a rural region is very limited. Furthermore, it is difficult to identify the place and the role of the supporting advisory work and consultancy inputted in the preparation and implementation stages of the future strategic development of a zone or a mix of relevant rural actors. In this respect, the most relevant research environment is currently represented by the Local Action Groups (LAG) supported by the National Rural Development Programmes (NRDP) for the implementation of their Local Development Strategies (LDS). The relevance is derived from the type of actions covering all possible and available investments in rural areas supported by the NRDPs, by the type of actors regrouping under a Public-Private-Partnership all rural stakeholders and scale considering that most projects are small to medium size, less relevant in a national
competition but highly relevant for the micro-region. Considering the absolute lack of experience in community led local development from the period of Romania's pre-accession to EU the consultancy role in animating and structuring the rural partnership ready to assume the future LDSs appears critical to success. For all these considerations, the analysis choice focusses on a LAG that successfully implemented its strategy under NRDP 2007-2013 and prepares the implementation of its new LDS under NRDP 2014-2020. The central interest highlights the capitalised learning from the previous programming period used during the formulation efforts for the future strategy at the beginning of the year 2016. The previous implementation results are used to measure the choices, the diversification or the continuity of the expressed options for the current programming period (2014-2020). The observations can highlight the consultancy impact over the options as type and scale of intervention while aiming to support the best
choices in terms of proportionality, interest and development vocation for the territory.
MATERIALS AND METHODS Since the observation environment had to provide a diversity of options for project-based development in a rural area that has benefited consistently from advice and consultancy support with a complete range of eligible rural stakeholders the best choice for a micro-region was offered by the 163 Local Action Groups from the 2007-2013 period that have completed the implementation of their strategies at the end of 2015. The NRDP 2007-2013 (MARD, 2015) by its fourth LEADER dedicated axis brought for the first time the possibility to introduce a community led local development approach. The learning process had to be implemented on-the-fly with no previous experience, not even similarities from the earlier developments, with untrained staff and poorly informed rural population. That situation offered perfect grounds for the consultancy to support the formulation and the later implementation of the required Local Development Strategies. These inputs are measured in the current paper two-fold: implementation success of the first round of LDSs, and the link and foundation of the present choices for the current LDSs. The second measurement gives the substance to the capitalised learning from the earlier LDS (LAG LMJ, 2014) as reflected by the rationality of the expressed options for development. Technically, the information and the animation sessions, as part of the current setup of next generation of LAGs and LDSs (AFRI, 2016) were concluded with a brief questionnaire structured in questions with open answers as detailed bellow. The choice of the application moment was driven by the need of fresh, relevant, concise and precise information regarding the development framework as set by the EU (EC, 2013) and national regulations (MARD, 2016). The structured questionnaire asked seven questions of which the first three are of interest in the present analysis: 1- What projects do you expect to implement with the support of the future LAG? What is the total value/amount for each of these projects? What is the level of
your own financial contribution that you are prepared to allocate for these projects? The aim was to link and compile the collected answers in the sense of capturing the highest interest in further development, the economic size of the future projects in terms of amounts and the readiness to support the investments by co-financing the public contribution to the projects. In order to provide the respondents with sufficient freedom of decision each question included three possible answers. Offering multiple potential directions made possible an inner ranking of development priorities and allowed the self-priorities to come straight from the concerned rural actors instead of extrapolating and articulating multiple answers. The directions and options, the amounts needed for the targeted projects and the level of contribution by co-financing are corroborated to illustrate the current state and orientations of the project promoters and further connected with the results from the first programming period (LAG LMJ, 2015). These results lead to the conclusions proposed by the present paper highlighting the rationality of the participants, the development vocation of the territory and the impact of the consultancy over the choice' formulation process and not the nature or the type of choices made. RESULTS AND DISCUSSIONS The selected LAG territory has a high favourability for both agriculture and rural economy, being well connected in terms of communication and transport infrastructure and therefore presenting a multiplication factor in terms of development opportunities. These elements of high favourability were needed in order to ensure a positive balance of implementation results for the projects from the NRDP 2007-2013. This success is considered to be critical to the learning experience of the rural actors and has a consistent influence over the present and future development options. The LAG LMJ (Lunca Muresului de Jos) developed in a partnership of 14 rural and 1 urban localities covering 1308 km2 and 69253 inhabitants. These figures become highly relevant when the implementation results are introduced.

173
IMPACT OF ADVISORY AND CONSULTANCY WORK OVER THE PROJECT-BASED
DEVELOPMENT CHOICES OF A RURAL TERRITORY
Cosmin SĂLĂȘAN, Sebastian MOISA, Isidora RADULOV
Banat's University of Agricultural Sciences and Veterinary Medicine “King Michael Ist of Romania” from Timisoara, 119 Calea Aradului, 300645 Timisoara, Romania,
Phone: +40256277437, Email: [email protected]
Corresponding author email: [email protected] Abstract The paper targets the observations over the impact of consultancy and advisory work performed at the scale of a rural micro-region in terms of present choices for the future development by implementation of different possible projects, mostly with public co-financing. The choice of area and previous activities leads to one Local Action Group active in the previous programming period with specific knowledge and accumulated experience. The preparation for the current programming period creates the opportunity to analyse the directions and the volumes of the future intentions of projects in a sort of project pipelining during the information and animation meetings in the future Local Action Group. The observations collected by a structured questionnaire are further analysed to extract the facts and findings related to different types of actions, investment levels and co-financing readiness. The findings are further compared to the respondents' profile, the earlier achievements and the current reality and realism in order to understand the impact of the specific inputs from consultancy during the animation sessions. The consultancy and the content delivery of the advisory sessions are comparable for the purpose of this analysis as both preparation phases for the two programming periods were covered by the same consultant. The findings lead to solid grounds for the conclusions linking the content and the consultancy interventions to the realistic options of the local actors closely correlated to the vocation of the rural micro-region and the logic of earlier interventions by projects. Key words: consultancy, co-financing, LAG, LEADER, projects. INTRODUCTION The research regarding the rationale of different development options, particularly by project-based interventions at the scale of a rural region is very limited. Furthermore, it is difficult to identify the place and the role of the supporting advisory work and consultancy inputted in the preparation and implementation stages of the future strategic development of a zone or a mix of relevant rural actors. In this respect, the most relevant research environment is currently represented by the Local Action Groups (LAG) supported by the National Rural Development Programmes (NRDP) for the implementation of their Local Development Strategies (LDS). The relevance is derived from the type of actions covering all possible and available investments in rural areas supported by the NRDPs, by the type of actors regrouping under a Public-Private-Partnership all rural stakeholders and scale considering that most projects are small to medium size, less relevant in a national
competition but highly relevant for the micro-region. Considering the absolute lack of experience in community led local development from the period of Romania's pre-accession to EU the consultancy role in animating and structuring the rural partnership ready to assume the future LDSs appears critical to success. For all these considerations, the analysis choice focusses on a LAG that successfully implemented its strategy under NRDP 2007-2013 and prepares the implementation of its new LDS under NRDP 2014-2020. The central interest highlights the capitalised learning from the previous programming period used during the formulation efforts for the future strategy at the beginning of the year 2016. The previous implementation results are used to measure the choices, the diversification or the continuity of the expressed options for the current programming period (2014-2020). The observations can highlight the consultancy impact over the options as type and scale of intervention while aiming to support the best
choices in terms of proportionality, interest and development vocation for the territory.
MATERIALS AND METHODS Since the observation environment had to provide a diversity of options for project-based development in a rural area that has benefited consistently from advice and consultancy support with a complete range of eligible rural stakeholders the best choice for a micro-region was offered by the 163 Local Action Groups from the 2007-2013 period that have completed the implementation of their strategies at the end of 2015. The NRDP 2007-2013 (MARD, 2015) by its fourth LEADER dedicated axis brought for the first time the possibility to introduce a community led local development approach. The learning process had to be implemented on-the-fly with no previous experience, not even similarities from the earlier developments, with untrained staff and poorly informed rural population. That situation offered perfect grounds for the consultancy to support the formulation and the later implementation of the required Local Development Strategies. These inputs are measured in the current paper two-fold: implementation success of the first round of LDSs, and the link and foundation of the present choices for the current LDSs. The second measurement gives the substance to the capitalised learning from the earlier LDS (LAG LMJ, 2014) as reflected by the rationality of the expressed options for development. Technically, the information and the animation sessions, as part of the current setup of next generation of LAGs and LDSs (AFRI, 2016) were concluded with a brief questionnaire structured in questions with open answers as detailed bellow. The choice of the application moment was driven by the need of fresh, relevant, concise and precise information regarding the development framework as set by the EU (EC, 2013) and national regulations (MARD, 2016). The structured questionnaire asked seven questions of which the first three are of interest in the present analysis: 1- What projects do you expect to implement with the support of the future LAG? What is the total value/amount for each of these projects? What is the level of
your own financial contribution that you are prepared to allocate for these projects? The aim was to link and compile the collected answers in the sense of capturing the highest interest in further development, the economic size of the future projects in terms of amounts and the readiness to support the investments by co-financing the public contribution to the projects. In order to provide the respondents with sufficient freedom of decision each question included three possible answers. Offering multiple potential directions made possible an inner ranking of development priorities and allowed the self-priorities to come straight from the concerned rural actors instead of extrapolating and articulating multiple answers. The directions and options, the amounts needed for the targeted projects and the level of contribution by co-financing are corroborated to illustrate the current state and orientations of the project promoters and further connected with the results from the first programming period (LAG LMJ, 2015). These results lead to the conclusions proposed by the present paper highlighting the rationality of the participants, the development vocation of the territory and the impact of the consultancy over the choice' formulation process and not the nature or the type of choices made. RESULTS AND DISCUSSIONS The selected LAG territory has a high favourability for both agriculture and rural economy, being well connected in terms of communication and transport infrastructure and therefore presenting a multiplication factor in terms of development opportunities. These elements of high favourability were needed in order to ensure a positive balance of implementation results for the projects from the NRDP 2007-2013. This success is considered to be critical to the learning experience of the rural actors and has a consistent influence over the present and future development options. The LAG LMJ (Lunca Muresului de Jos) developed in a partnership of 14 rural and 1 urban localities covering 1308 km2 and 69253 inhabitants. These figures become highly relevant when the implementation results are introduced.

174
The profile of the participants to the information and animation sessions and therefore of the respondents in our analysis reflects the general shares of interest and professions in the territory. In this respect, half of the respondents were farmers and the other half was uneven split between rural entrepreneurs (30%) and NGOs, initiative groups and public entities (20%). The composition of the groups is highly relevant to the study since the answers rarely point outside the immediate and direct professional interest. This is to say that farmers interested in developing entrepreneurial actions in non-agricultural rural economy have manifested their interest and the results are captured in answers. Still there is no case of rural entrepreneur interested in investing in agriculture at this point, at least not reflected by the collected answers. The open answers were meant to give complete freedom to the respondents in formulating their options and intentions. One major decision factor in this case was represented by the moment of collection when most of the measures in the NRDP 2014-2020 (MARD, 2016) were in a very early stage of formulation. This level of development could have created sufficient confusion for the relevant rural actors and the stakeholders in the absence of coherent consultancy support making permanent reference to the EU framework (EC, 2013) as the general pillar of orientation for rural development actions in the current period. A general observation across the three questions can indicate that the participants have developed a two-step level of priorities with a coherent build-up yet the third level is rather unclear, not consolidated or even developing according to the first two actions. This observation is based on the relative reduced number of collected answers and might question the validity of their orientations when applied to the entire territory. For these reasons the focus shifts to the first two options along the three questions. The freely formulated answers for the directions of the future projects were later checked for errors, processed, interrelated, cross-linked and interpreted. The resulting answers from the first question are presented bellow (Table 1) as complete set of data in
order to enable the observers by offering the complete picture of directions and intentions. As it can be observed the quasi-majority of the participants (189/200 respondents) answered with a first option for a future project. Almost 2/3 of these respondents (61%) have presented a second project intention and almost 1/3 of them have even a third project intention (31%).
Table 1. Options for projects/investments (No. of respondents)
Options / Question 1a 1b 1c No. of respondents 189 116 56 Not answered 0 73 133 Non-agricultural activities, services, rural business 40 26 12
Cultural activities and sport 7 2 3 Social activities 4 1 0 Modernising agriculture 45 22 6 Modernising fruit production 0 0 0 Modernising winery 1 1 0 Modernising animal husbandry 8 10 4 Agricultural infrastructure 7 1 3 Social infrastructure 6 4 1 Cultural and sport infrastructure 8 5 3 Food processing 8 6 4 Non-agricultural infrastructure 0 1 0 Public physical infrastructure 9 5 6 Beekeeping 5 1 1 Vegetables, flowers and special crop production 3 2 3
Support to young farmers 6 3 0 Fruit production 11 4 2 Marketing and agro-markets 2 1 0 Fishery 0 1 0 Conditioning and storage 14 10 2 Alternative energy 3 5 2 Information, dissemination and communication 0 2 0 Exchange and know-how 0 1 0 Association and producer groups 1 1 3 Support to small farms 1 1 1
In order to facilitate the general observation in terms of orientations the first five directions as preferred by the respondents are presented bellow (Table 2). The first three categories represent systematically more than 50% of the provided answers for the first or the second project intention.
Table 2. Main options for projects/investments (No. of respondents)
Option / Question 1a 1b 1c Non-agricultural activities, services, rural business 40 26 12
Modernising agriculture 45 22 6 Conditioning and storage 14 10 2 Modernising animal husbandry 8 10 4 Non-agricultural infrastructure 9 5 6
Also, the total number of potential projects in the first two categories is absolutely
comparable where 78 answers count for projects in non-agricultural activities, services and rural business and 73 answers indicate projects in modernising agriculture. Since the differences between the first two categories are around 2% however we compare them, in total, as first or second project intention we can conclude that these directions are equally of main interest for the respondents. Also, the large differences between the first two and the following expressed options indicate a specific weight of these categories that are not complementary. The expected amounts for completing the implementation of the announced project intentions are relatively dispersed among segmented values (Table 3).
Table 3. Expected amounts of total financing for the projects (No. of respondents)
Amounts / Question 2a 2b 2c No. of respondents 163 74 32 Not answered 26 115 157 3000 € 1 0 0 4000 € 0 1 0 5000 € 5 4 4 7000 € 1 1 0 8000 € 3 1 0 10000 € 9 4 0 15000 € 5 1 0 20000 € 4 5 2 21000 € 1 0 0 25000 € 6 1 1 30000 € 1 4 2 35000 € 1 0 0 40000 € 10 4 2 50000 € 24 7 2 60000 € 5 2 1 70000 € 4 1 1 80000 € 3 1 0 90000 € 2 0 0 100000 € 34 13 3 120000 € 1 0 1 150000 € 2 6 2 180000 € 1 1 0 200000 € 22 4 3 250000 € 3 0 1 300000 € 2 4 0 400000 € 3 1 1 500000 € 8 3 1 600000 € 0 1 0 1000000 € 0 3 1 1200000 € 1 0 0 1500000 € 0 0 1 2000000 € 1 1 2
The levels as illustrated in the table above are those advanced directly by the respondents. Within such a large range of dispersion it might prove difficult to observe a potential trend. To this aim the various amounts are regrouped in coherent categories (Table 4). The categories are meant to increase with the amounts instead of maintaining uniform classes in order to highlight eventual concentrations instead of simply reducing the scale of the dispersion.
Table 4. Regrouped ranges of total financing for the projects (No. of respondents)
question 2a 2b 2c <20000 € 24 12 4 20000-49000 € 23 14 7 50000-99000 € 38 11 4 100000-199000 € 38 20 6 200000-499000 € 30 9 5 500000-999000 € 8 4 1 >1000000 € 2 4 4
A first observation refers to the polarisation around the category 100000-199000 €. Most answers across all three options (64 respondents, or 33% of total) most options within the first (23%) and the second options (27%) place this range among the most likely level of the project' total expenditure. This category is followed by the range of 50000-99000 € relatively close to the first one and equal at the level of the first project intention, while the other categories disperse almost Gaussian from the above revealed peak. If crossed with the types of projects promoted and the expected amounts for the implementation the main development options consolidate further their position of core interest (Table 5). The highest total amounts as expressed per options or in the consolidated total indicate the investments in modernising agriculture as dominant followed by the rural entrepreneurship. This observation consolidates the earlier findings linked to the main orientations.
Table 5. Cumulated total amounts for the main options for investments (€)
Options / Amounts 2a 2b 2c Non-agricultural activities, services, rural business (€) 4910000 2157000 700000
Modernising agriculture (€) 6536000 2640000 665000 Conditioning and storage €) 1204000 1975000 - TOTAL (€) 12650000 6772000 1365000
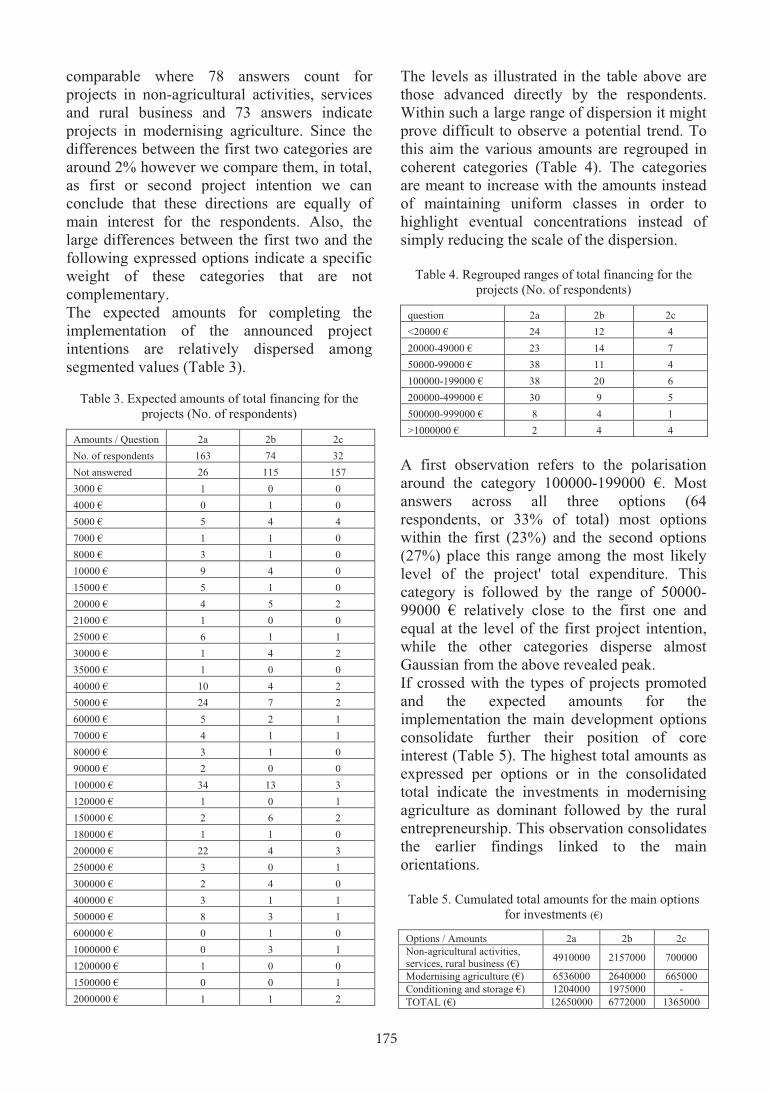
175
The profile of the participants to the information and animation sessions and therefore of the respondents in our analysis reflects the general shares of interest and professions in the territory. In this respect, half of the respondents were farmers and the other half was uneven split between rural entrepreneurs (30%) and NGOs, initiative groups and public entities (20%). The composition of the groups is highly relevant to the study since the answers rarely point outside the immediate and direct professional interest. This is to say that farmers interested in developing entrepreneurial actions in non-agricultural rural economy have manifested their interest and the results are captured in answers. Still there is no case of rural entrepreneur interested in investing in agriculture at this point, at least not reflected by the collected answers. The open answers were meant to give complete freedom to the respondents in formulating their options and intentions. One major decision factor in this case was represented by the moment of collection when most of the measures in the NRDP 2014-2020 (MARD, 2016) were in a very early stage of formulation. This level of development could have created sufficient confusion for the relevant rural actors and the stakeholders in the absence of coherent consultancy support making permanent reference to the EU framework (EC, 2013) as the general pillar of orientation for rural development actions in the current period. A general observation across the three questions can indicate that the participants have developed a two-step level of priorities with a coherent build-up yet the third level is rather unclear, not consolidated or even developing according to the first two actions. This observation is based on the relative reduced number of collected answers and might question the validity of their orientations when applied to the entire territory. For these reasons the focus shifts to the first two options along the three questions. The freely formulated answers for the directions of the future projects were later checked for errors, processed, interrelated, cross-linked and interpreted. The resulting answers from the first question are presented bellow (Table 1) as complete set of data in
order to enable the observers by offering the complete picture of directions and intentions. As it can be observed the quasi-majority of the participants (189/200 respondents) answered with a first option for a future project. Almost 2/3 of these respondents (61%) have presented a second project intention and almost 1/3 of them have even a third project intention (31%).
Table 1. Options for projects/investments (No. of respondents)
Options / Question 1a 1b 1c No. of respondents 189 116 56 Not answered 0 73 133 Non-agricultural activities, services, rural business 40 26 12
Cultural activities and sport 7 2 3 Social activities 4 1 0 Modernising agriculture 45 22 6 Modernising fruit production 0 0 0 Modernising winery 1 1 0 Modernising animal husbandry 8 10 4 Agricultural infrastructure 7 1 3 Social infrastructure 6 4 1 Cultural and sport infrastructure 8 5 3 Food processing 8 6 4 Non-agricultural infrastructure 0 1 0 Public physical infrastructure 9 5 6 Beekeeping 5 1 1 Vegetables, flowers and special crop production 3 2 3
Support to young farmers 6 3 0 Fruit production 11 4 2 Marketing and agro-markets 2 1 0 Fishery 0 1 0 Conditioning and storage 14 10 2 Alternative energy 3 5 2 Information, dissemination and communication 0 2 0 Exchange and know-how 0 1 0 Association and producer groups 1 1 3 Support to small farms 1 1 1
In order to facilitate the general observation in terms of orientations the first five directions as preferred by the respondents are presented bellow (Table 2). The first three categories represent systematically more than 50% of the provided answers for the first or the second project intention.
Table 2. Main options for projects/investments (No. of respondents)
Option / Question 1a 1b 1c Non-agricultural activities, services, rural business 40 26 12
Modernising agriculture 45 22 6 Conditioning and storage 14 10 2 Modernising animal husbandry 8 10 4 Non-agricultural infrastructure 9 5 6
Also, the total number of potential projects in the first two categories is absolutely
comparable where 78 answers count for projects in non-agricultural activities, services and rural business and 73 answers indicate projects in modernising agriculture. Since the differences between the first two categories are around 2% however we compare them, in total, as first or second project intention we can conclude that these directions are equally of main interest for the respondents. Also, the large differences between the first two and the following expressed options indicate a specific weight of these categories that are not complementary. The expected amounts for completing the implementation of the announced project intentions are relatively dispersed among segmented values (Table 3).
Table 3. Expected amounts of total financing for the projects (No. of respondents)
Amounts / Question 2a 2b 2c No. of respondents 163 74 32 Not answered 26 115 157 3000 € 1 0 0 4000 € 0 1 0 5000 € 5 4 4 7000 € 1 1 0 8000 € 3 1 0 10000 € 9 4 0 15000 € 5 1 0 20000 € 4 5 2 21000 € 1 0 0 25000 € 6 1 1 30000 € 1 4 2 35000 € 1 0 0 40000 € 10 4 2 50000 € 24 7 2 60000 € 5 2 1 70000 € 4 1 1 80000 € 3 1 0 90000 € 2 0 0 100000 € 34 13 3 120000 € 1 0 1 150000 € 2 6 2 180000 € 1 1 0 200000 € 22 4 3 250000 € 3 0 1 300000 € 2 4 0 400000 € 3 1 1 500000 € 8 3 1 600000 € 0 1 0 1000000 € 0 3 1 1200000 € 1 0 0 1500000 € 0 0 1 2000000 € 1 1 2
The levels as illustrated in the table above are those advanced directly by the respondents. Within such a large range of dispersion it might prove difficult to observe a potential trend. To this aim the various amounts are regrouped in coherent categories (Table 4). The categories are meant to increase with the amounts instead of maintaining uniform classes in order to highlight eventual concentrations instead of simply reducing the scale of the dispersion.
Table 4. Regrouped ranges of total financing for the projects (No. of respondents)
question 2a 2b 2c <20000 € 24 12 4 20000-49000 € 23 14 7 50000-99000 € 38 11 4 100000-199000 € 38 20 6 200000-499000 € 30 9 5 500000-999000 € 8 4 1 >1000000 € 2 4 4
A first observation refers to the polarisation around the category 100000-199000 €. Most answers across all three options (64 respondents, or 33% of total) most options within the first (23%) and the second options (27%) place this range among the most likely level of the project' total expenditure. This category is followed by the range of 50000-99000 € relatively close to the first one and equal at the level of the first project intention, while the other categories disperse almost Gaussian from the above revealed peak. If crossed with the types of projects promoted and the expected amounts for the implementation the main development options consolidate further their position of core interest (Table 5). The highest total amounts as expressed per options or in the consolidated total indicate the investments in modernising agriculture as dominant followed by the rural entrepreneurship. This observation consolidates the earlier findings linked to the main orientations.
Table 5. Cumulated total amounts for the main options for investments (€)
Options / Amounts 2a 2b 2c Non-agricultural activities, services, rural business (€) 4910000 2157000 700000
Modernising agriculture (€) 6536000 2640000 665000 Conditioning and storage €) 1204000 1975000 - TOTAL (€) 12650000 6772000 1365000
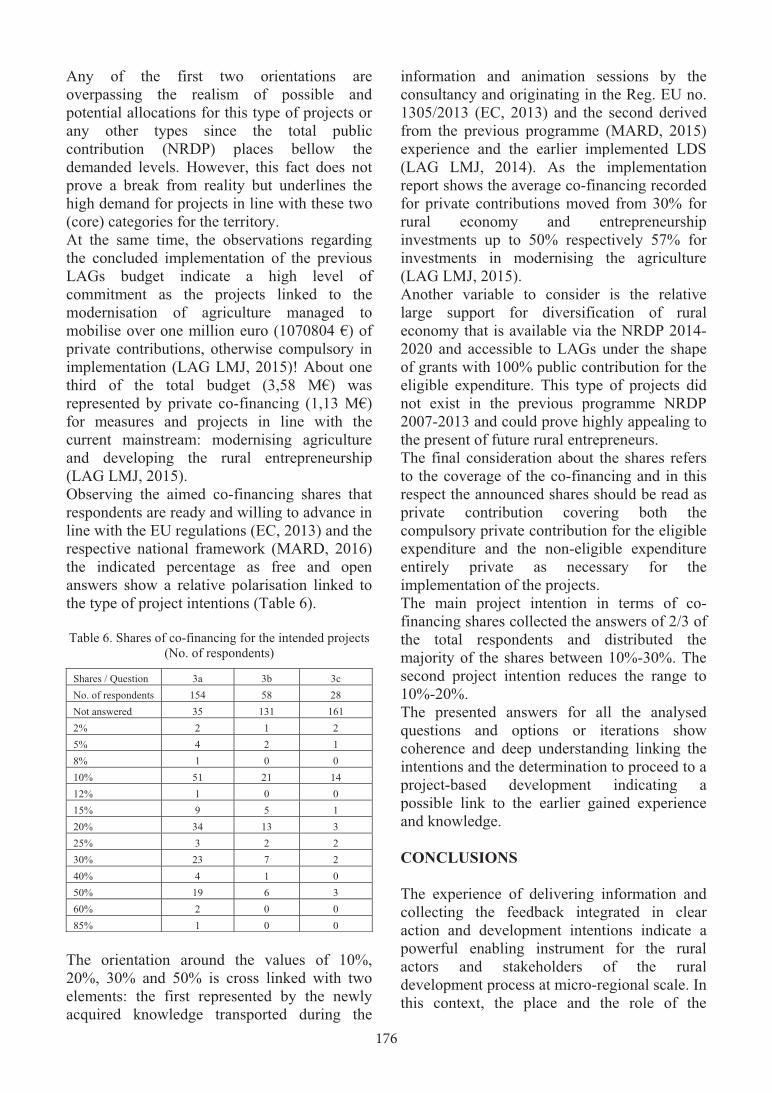
176
Any of the first two orientations are overpassing the realism of possible and potential allocations for this type of projects or any other types since the total public contribution (NRDP) places bellow the demanded levels. However, this fact does not prove a break from reality but underlines the high demand for projects in line with these two (core) categories for the territory. At the same time, the observations regarding the concluded implementation of the previous LAGs budget indicate a high level of commitment as the projects linked to the modernisation of agriculture managed to mobilise over one million euro (1070804 €) of private contributions, otherwise compulsory in implementation (LAG LMJ, 2015)! About one third of the total budget (3,58 M€) was represented by private co-financing (1,13 M€) for measures and projects in line with the current mainstream: modernising agriculture and developing the rural entrepreneurship (LAG LMJ, 2015). Observing the aimed co-financing shares that respondents are ready and willing to advance in line with the EU regulations (EC, 2013) and the respective national framework (MARD, 2016) the indicated percentage as free and open answers show a relative polarisation linked to the type of project intentions (Table 6). Table 6. Shares of co-financing for the intended projects
(No. of respondents)
Shares / Question 3a 3b 3c No. of respondents 154 58 28 Not answered 35 131 161 2% 2 1 2 5% 4 2 1 8% 1 0 0 10% 51 21 14 12% 1 0 0 15% 9 5 1 20% 34 13 3 25% 3 2 2 30% 23 7 2 40% 4 1 0 50% 19 6 3 60% 2 0 0 85% 1 0 0
The orientation around the values of 10%, 20%, 30% and 50% is cross linked with two elements: the first represented by the newly acquired knowledge transported during the
information and animation sessions by the consultancy and originating in the Reg. EU no. 1305/2013 (EC, 2013) and the second derived from the previous programme (MARD, 2015) experience and the earlier implemented LDS (LAG LMJ, 2014). As the implementation report shows the average co-financing recorded for private contributions moved from 30% for rural economy and entrepreneurship investments up to 50% respectively 57% for investments in modernising the agriculture (LAG LMJ, 2015). Another variable to consider is the relative large support for diversification of rural economy that is available via the NRDP 2014-2020 and accessible to LAGs under the shape of grants with 100% public contribution for the eligible expenditure. This type of projects did not exist in the previous programme NRDP 2007-2013 and could prove highly appealing to the present of future rural entrepreneurs. The final consideration about the shares refers to the coverage of the co-financing and in this respect the announced shares should be read as private contribution covering both the compulsory private contribution for the eligible expenditure and the non-eligible expenditure entirely private as necessary for the implementation of the projects. The main project intention in terms of co-financing shares collected the answers of 2/3 of the total respondents and distributed the majority of the shares between 10%-30%. The second project intention reduces the range to 10%-20%. The presented answers for all the analysed questions and options or iterations show coherence and deep understanding linking the intentions and the determination to proceed to a project-based development indicating a possible link to the earlier gained experience and knowledge. CONCLUSIONS The experience of delivering information and collecting the feedback integrated in clear action and development intentions indicate a powerful enabling instrument for the rural actors and stakeholders of the rural development process at micro-regional scale. In this context, the place and the role of the
advisory and consultancy appears critical as knowledge and information vector and partner. The role can and should resume to an objective provider of services and problem solver in the context of a wider and clearer understanding and not to direct or orient the future development. The analysis aiming to research the impact of the advisory and the consultancy over the choices of a project-based development in a rural micro-region indicates a number of clear findings. The capacity to capitalise the previous learning points both from acquired knowledge and experiences is compiled with an elevated capacity of linking the resources and the development vocation of the territory with clear project intentions and with a high realism in designing the immediate and medium-term development priorities. The observations and findings can only prove the impact of the consultancy over the educated choices of projects as result of efficient and repeated interaction and cannot demonstrate the opposite in absence of qualified and competent assistance. ACKNOWLEDGEMENTS The authors are expressing their gratitude to the executive staff of the Local Action Group LMJ for the entire support, logistics, data and
discussions, for their availability and willingness to participate in the elaboration of the present paper during all stages, from preparation to analysis and conclusions. REFERENCES ***EC, 2013, European Regulation no. 1305/2013
regarding the support for rural development granted from the European Fund for Agriculture and Rural Development (EFARD).
***LAG LMJ, 2014, Local Development Strategy Local Action Group LMJ, 2014, http://www.galluncamuresuluidejos.ro/images/gal/Strategie%20Lunca%20Muresului_modificata_MAI%202014.pdf.
***LAG LMJ, 2015, Report on Financial implementation of Local Development Strategy of the Local Action Group LMJ, 2015.
***MARD, 2015, Ministry of Agriculture and Rural Development, National Rural Development Programme 2007-2013, versions 02.2008, 07.2008, 03.2009, 12.2009, 06.2010, 04.2011, 07.2011, 03.2012, 05.2012, 12.2012, 11.2013, 08.2014, 09.2014, 09.2015, Bucharest.
***MARD, 2016, Ministry of Agriculture and Rural Development, National Rural Development Programme 2014-2020, 2016, Bucharest.
***AFRI, 2016, Ministry of Agriculture and Rural Development, Agency for Financing the Rural Investments, Measure M19 LEADER, Sub-measure 19.1 Preparatory Support, Applicant's Guide and Appendixes, 2016, Bucharest.

177
Any of the first two orientations are overpassing the realism of possible and potential allocations for this type of projects or any other types since the total public contribution (NRDP) places bellow the demanded levels. However, this fact does not prove a break from reality but underlines the high demand for projects in line with these two (core) categories for the territory. At the same time, the observations regarding the concluded implementation of the previous LAGs budget indicate a high level of commitment as the projects linked to the modernisation of agriculture managed to mobilise over one million euro (1070804 €) of private contributions, otherwise compulsory in implementation (LAG LMJ, 2015)! About one third of the total budget (3,58 M€) was represented by private co-financing (1,13 M€) for measures and projects in line with the current mainstream: modernising agriculture and developing the rural entrepreneurship (LAG LMJ, 2015). Observing the aimed co-financing shares that respondents are ready and willing to advance in line with the EU regulations (EC, 2013) and the respective national framework (MARD, 2016) the indicated percentage as free and open answers show a relative polarisation linked to the type of project intentions (Table 6). Table 6. Shares of co-financing for the intended projects
(No. of respondents)
Shares / Question 3a 3b 3c No. of respondents 154 58 28 Not answered 35 131 161 2% 2 1 2 5% 4 2 1 8% 1 0 0 10% 51 21 14 12% 1 0 0 15% 9 5 1 20% 34 13 3 25% 3 2 2 30% 23 7 2 40% 4 1 0 50% 19 6 3 60% 2 0 0 85% 1 0 0
The orientation around the values of 10%, 20%, 30% and 50% is cross linked with two elements: the first represented by the newly acquired knowledge transported during the
information and animation sessions by the consultancy and originating in the Reg. EU no. 1305/2013 (EC, 2013) and the second derived from the previous programme (MARD, 2015) experience and the earlier implemented LDS (LAG LMJ, 2014). As the implementation report shows the average co-financing recorded for private contributions moved from 30% for rural economy and entrepreneurship investments up to 50% respectively 57% for investments in modernising the agriculture (LAG LMJ, 2015). Another variable to consider is the relative large support for diversification of rural economy that is available via the NRDP 2014-2020 and accessible to LAGs under the shape of grants with 100% public contribution for the eligible expenditure. This type of projects did not exist in the previous programme NRDP 2007-2013 and could prove highly appealing to the present of future rural entrepreneurs. The final consideration about the shares refers to the coverage of the co-financing and in this respect the announced shares should be read as private contribution covering both the compulsory private contribution for the eligible expenditure and the non-eligible expenditure entirely private as necessary for the implementation of the projects. The main project intention in terms of co-financing shares collected the answers of 2/3 of the total respondents and distributed the majority of the shares between 10%-30%. The second project intention reduces the range to 10%-20%. The presented answers for all the analysed questions and options or iterations show coherence and deep understanding linking the intentions and the determination to proceed to a project-based development indicating a possible link to the earlier gained experience and knowledge. CONCLUSIONS The experience of delivering information and collecting the feedback integrated in clear action and development intentions indicate a powerful enabling instrument for the rural actors and stakeholders of the rural development process at micro-regional scale. In this context, the place and the role of the
advisory and consultancy appears critical as knowledge and information vector and partner. The role can and should resume to an objective provider of services and problem solver in the context of a wider and clearer understanding and not to direct or orient the future development. The analysis aiming to research the impact of the advisory and the consultancy over the choices of a project-based development in a rural micro-region indicates a number of clear findings. The capacity to capitalise the previous learning points both from acquired knowledge and experiences is compiled with an elevated capacity of linking the resources and the development vocation of the territory with clear project intentions and with a high realism in designing the immediate and medium-term development priorities. The observations and findings can only prove the impact of the consultancy over the educated choices of projects as result of efficient and repeated interaction and cannot demonstrate the opposite in absence of qualified and competent assistance. ACKNOWLEDGEMENTS The authors are expressing their gratitude to the executive staff of the Local Action Group LMJ for the entire support, logistics, data and
discussions, for their availability and willingness to participate in the elaboration of the present paper during all stages, from preparation to analysis and conclusions. REFERENCES ***EC, 2013, European Regulation no. 1305/2013
regarding the support for rural development granted from the European Fund for Agriculture and Rural Development (EFARD).
***LAG LMJ, 2014, Local Development Strategy Local Action Group LMJ, 2014, http://www.galluncamuresuluidejos.ro/images/gal/Strategie%20Lunca%20Muresului_modificata_MAI%202014.pdf.
***LAG LMJ, 2015, Report on Financial implementation of Local Development Strategy of the Local Action Group LMJ, 2015.
***MARD, 2015, Ministry of Agriculture and Rural Development, National Rural Development Programme 2007-2013, versions 02.2008, 07.2008, 03.2009, 12.2009, 06.2010, 04.2011, 07.2011, 03.2012, 05.2012, 12.2012, 11.2013, 08.2014, 09.2014, 09.2015, Bucharest.
***MARD, 2016, Ministry of Agriculture and Rural Development, National Rural Development Programme 2014-2020, 2016, Bucharest.
***AFRI, 2016, Ministry of Agriculture and Rural Development, Agency for Financing the Rural Investments, Measure M19 LEADER, Sub-measure 19.1 Preparatory Support, Applicant's Guide and Appendixes, 2016, Bucharest.

178
THE INFLUENCE OF ANTHROPIC ACTIVITY ON SOMES RIVER
WATER QUALITY
Laura ȘMULEAC, Florin IMBREA, Ioana CORODAN, Anișoara IENCIU, Adrian ȘMULEAC, Dan MANEA
Banat’s University of Agricultural Sciences and Veterinary Medicine “King Michael I of Romania”
Timişoara, Faculty of Agriculture, 300645, Aradului Street 119, Timişoara, Romania
Corresponding author email: [email protected]
Abstract Under current conditions, the water resource at planetary level has become increasingly expensive because of human pressure. Therefore, maintaining drinking water quality is increasingly important. In this paper, the authors present the influence of human activities on the River Somes (Romania). It has been studied mainly as water quality indices. Within the Somes-Tisa basin, the authors identified 41 potentially polluting industrial sources in the following fields of activity: mining (decantation ponds, mining dumps) and urban and industrial waste management. Thus, the authors analysed the best pollution parameters such as pH, dissolved oxygen, biochemical oxygen consumption, ammonia, nitrates, nitrites, total nitrogen, chromium, calcium, and magnesium. As a result of effected analyses, it can be observed a charge of nitrites and chlorides, and the presence of pollution phenomenon is showed by the high values of nitrites and biochemical oxygen consumption. Analyses were carried out over three years, 2014-2016. Quality classes increased from 2014 to 2016 because pollution decreased due to the lack of connection of the households to the waste water system in 2013-2014. Research analyses show that the water from the River Somes tends to maintain its quality; however, surface waters tend to be polluted and they are slightly influenced by human activities. Key words: anthropic activities, pH, oxygen regime, nutrients, water quality. INTRODUCTION Development of industrial activity, increasing the intensification of water use in agriculture, increasing the population and the degree of civilization are asking for water requirements, worldwide (Șmuleac et al., 2012; Pișota et al., 2010). Humanity has come to ask, whether we succeed in increasing water resources, both levies for different uses, and for use as an emissary for discharges. At this stage it has reached a finding that water is intimately linked to the terrestrial ecological system and to maintaining this system and the very survival of humanity need conservation and protection of hydrosphere, worldwide (Ienciu et al., 2013, 2015; Marica et al., 2016). Direct discharge of waste waters into rivers could contribute to microbial and chemical pollution and can have negative effects on the quality of water (Ciobotaru, 2015; Sofrenie, 2000). Studies about sources of water pollution (Chiorescu, 2013), especially in Somes Basin (Corodan, 2016; Pompei, 2012) shows that the
water of Somes is not so polluted, but require good measurements to protect it. Corodan et al. (2016) shows that the basin Someș-Tisa gets an negative anthropogenic pollution because of agriculture, industry and human settlements. That study was made using model MONERIS (Modelling Nutrient Emissions in River Systems) for estimating emissions coming from diffuse and local pollution sources. That research conclude that the industrial and agricultural pollution sources contributes to the discharge of pollutants specific to the type of activities performed as follows: fertilizers, nutrients from food industry, chemical industry, organics, animal farms, pulp and paper, and heavy metals by the extractive industry and manufacturing, chemical and hazardous organic micro pollutants. MATERIALS AND METHODS Data analysis was carried out at the research platform of the Satu-Mare Romanian Water Agency in the Somes-Tisa Basin, according to Official Journal of Romania, Part I, No 161/ 2006.
AgroLife Scientific Journal - Volume 6, Number 2, 2017ISSN 2285-5718; ISSN CD-ROM 2285-5726; ISSN ONLINE 2286-0126; ISSN-L 2285-5718
The location of water sampling was established about 20 km south-west from Satu-Mare between the Commune of Lipau and the village of Potau (Figure 1). Water was sampled on the 1st day of each month between 8 and 11 a.m.
Figure 1. The point of water sampling
RESULTS AND DISCUSSIONS We determined general physical and chemical indices such as dissolved oxygen, biochemical oxygen consumption over 5 days (CBO ), temperature and pH. We noted that, the cooler the water, the higher dissolved oxygen concentration. For 2014, temperature in January was 6.5 C, dissolved oxygen reached 13.5 mg/l compared to June, when the highest temperature was 23.2 C, and dissolved oxygen reached only 9 mg/l. Oxygen regime is shown in Figure 2. Figure 2 below shows a decrease of oxygen from 8.1 mg/l in 2014 to 7.1 in 2016. This means that, in 2014 and 2015, water ranked 1st in quality, while in 2016, it ranked 2nd. Dissolved oxygen is the most important feature of water quality: therefore, 1st quality water means self-purge is normal, while 2nd quality water asks for river monitoring. Biochemical consumption of oxygen over 5 days (Figure 3) ranked 2nd in 2014 and 5th in June-September of the same year. In January 2015, water quality ranked 3rd (12.7 mg/l), in June it ranked 1st (1.1 mg/l), and in September it ranked 2nd (4.9 mg/l). In 2016, water quality ranked 1st (3 mg/l). Due to water quality, fish farming activities play a role in establishing and monitoring of possible pollution sources.
Figure 2. Dissolved oxygen in Somes River
Figure 3. Biochemical consumption of oxygen
Saturation of dissolved oxygen was 1st in 2014 and 2015. In 2014, saturation of dissolved oxygen was 108.2% in January, 108.2% in June, and 115.0% in September. In 2015, it reached 97.0% in January, 103.1% in June, and 101.4% in September. In 2016, it reached 0% in January, 87.0% in June and 67.2% in September. Therefore, water quality was in balance with water temperature for the period 2014-2015, while in 2016 water quality ranked 3rd. Nutrients. Aquatic bodies need chemical elements to grow and develop normally such as ammonia (N-NH4
+), nitrites (N-NO2-), nitrates
(N-NO3-), total nitrate (N) and total phosphorus
(P). In 23014, ammonia ranked water 2nd quality, i.e. it was 0.71 mg/dmᶟ in January, 0.80 mg/dmᶟ in June and 0.61 mg/dmᶟ in September. In 2015, ammonia reached 0.77 mg/dmᶾ in January, making water 2nd quality, compared to June, when it reached 0.027 mg/dmᶾ making water 1st quality, just like in September, when it reached 0.02 mg/dmᶾ. In 2016, ammonia levels in January was higher because of the rainfalls (Figure 4). Nitrites (Figure 5) in January 2014 reached 0.065 mg/dmᶟ making water 3rd quality, in June it reached 0.007 gm/dmᶟ, and in September, it reached 0.012 making water 1st quality.

179
THE INFLUENCE OF ANTHROPIC ACTIVITY ON SOMES RIVER
WATER QUALITY
Laura ȘMULEAC, Florin IMBREA, Ioana CORODAN, Anișoara IENCIU, Adrian ȘMULEAC, Dan MANEA
Banat’s University of Agricultural Sciences and Veterinary Medicine “King Michael I of Romania”
Timişoara, Faculty of Agriculture, 300645, Aradului Street 119, Timişoara, Romania
Corresponding author email: [email protected]
Abstract Under current conditions, the water resource at planetary level has become increasingly expensive because of human pressure. Therefore, maintaining drinking water quality is increasingly important. In this paper, the authors present the influence of human activities on the River Somes (Romania). It has been studied mainly as water quality indices. Within the Somes-Tisa basin, the authors identified 41 potentially polluting industrial sources in the following fields of activity: mining (decantation ponds, mining dumps) and urban and industrial waste management. Thus, the authors analysed the best pollution parameters such as pH, dissolved oxygen, biochemical oxygen consumption, ammonia, nitrates, nitrites, total nitrogen, chromium, calcium, and magnesium. As a result of effected analyses, it can be observed a charge of nitrites and chlorides, and the presence of pollution phenomenon is showed by the high values of nitrites and biochemical oxygen consumption. Analyses were carried out over three years, 2014-2016. Quality classes increased from 2014 to 2016 because pollution decreased due to the lack of connection of the households to the waste water system in 2013-2014. Research analyses show that the water from the River Somes tends to maintain its quality; however, surface waters tend to be polluted and they are slightly influenced by human activities. Key words: anthropic activities, pH, oxygen regime, nutrients, water quality. INTRODUCTION Development of industrial activity, increasing the intensification of water use in agriculture, increasing the population and the degree of civilization are asking for water requirements, worldwide (Șmuleac et al., 2012; Pișota et al., 2010). Humanity has come to ask, whether we succeed in increasing water resources, both levies for different uses, and for use as an emissary for discharges. At this stage it has reached a finding that water is intimately linked to the terrestrial ecological system and to maintaining this system and the very survival of humanity need conservation and protection of hydrosphere, worldwide (Ienciu et al., 2013, 2015; Marica et al., 2016). Direct discharge of waste waters into rivers could contribute to microbial and chemical pollution and can have negative effects on the quality of water (Ciobotaru, 2015; Sofrenie, 2000). Studies about sources of water pollution (Chiorescu, 2013), especially in Somes Basin (Corodan, 2016; Pompei, 2012) shows that the
water of Somes is not so polluted, but require good measurements to protect it. Corodan et al. (2016) shows that the basin Someș-Tisa gets an negative anthropogenic pollution because of agriculture, industry and human settlements. That study was made using model MONERIS (Modelling Nutrient Emissions in River Systems) for estimating emissions coming from diffuse and local pollution sources. That research conclude that the industrial and agricultural pollution sources contributes to the discharge of pollutants specific to the type of activities performed as follows: fertilizers, nutrients from food industry, chemical industry, organics, animal farms, pulp and paper, and heavy metals by the extractive industry and manufacturing, chemical and hazardous organic micro pollutants. MATERIALS AND METHODS Data analysis was carried out at the research platform of the Satu-Mare Romanian Water Agency in the Somes-Tisa Basin, according to Official Journal of Romania, Part I, No 161/ 2006.
The location of water sampling was established about 20 km south-west from Satu-Mare between the Commune of Lipau and the village of Potau (Figure 1). Water was sampled on the 1st day of each month between 8 and 11 a.m.
Figure 1. The point of water sampling
RESULTS AND DISCUSSIONS We determined general physical and chemical indices such as dissolved oxygen, biochemical oxygen consumption over 5 days (CBO ), temperature and pH. We noted that, the cooler the water, the higher dissolved oxygen concentration. For 2014, temperature in January was 6.5 C, dissolved oxygen reached 13.5 mg/l compared to June, when the highest temperature was 23.2 C, and dissolved oxygen reached only 9 mg/l. Oxygen regime is shown in Figure 2. Figure 2 below shows a decrease of oxygen from 8.1 mg/l in 2014 to 7.1 in 2016. This means that, in 2014 and 2015, water ranked 1st in quality, while in 2016, it ranked 2nd. Dissolved oxygen is the most important feature of water quality: therefore, 1st quality water means self-purge is normal, while 2nd quality water asks for river monitoring. Biochemical consumption of oxygen over 5 days (Figure 3) ranked 2nd in 2014 and 5th in June-September of the same year. In January 2015, water quality ranked 3rd (12.7 mg/l), in June it ranked 1st (1.1 mg/l), and in September it ranked 2nd (4.9 mg/l). In 2016, water quality ranked 1st (3 mg/l). Due to water quality, fish farming activities play a role in establishing and monitoring of possible pollution sources.
Figure 2. Dissolved oxygen in Somes River
Figure 3. Biochemical consumption of oxygen
Saturation of dissolved oxygen was 1st in 2014 and 2015. In 2014, saturation of dissolved oxygen was 108.2% in January, 108.2% in June, and 115.0% in September. In 2015, it reached 97.0% in January, 103.1% in June, and 101.4% in September. In 2016, it reached 0% in January, 87.0% in June and 67.2% in September. Therefore, water quality was in balance with water temperature for the period 2014-2015, while in 2016 water quality ranked 3rd. Nutrients. Aquatic bodies need chemical elements to grow and develop normally such as ammonia (N-NH4
+), nitrites (N-NO2-), nitrates
(N-NO3-), total nitrate (N) and total phosphorus
(P). In 23014, ammonia ranked water 2nd quality, i.e. it was 0.71 mg/dmᶟ in January, 0.80 mg/dmᶟ in June and 0.61 mg/dmᶟ in September. In 2015, ammonia reached 0.77 mg/dmᶾ in January, making water 2nd quality, compared to June, when it reached 0.027 mg/dmᶾ making water 1st quality, just like in September, when it reached 0.02 mg/dmᶾ. In 2016, ammonia levels in January was higher because of the rainfalls (Figure 4). Nitrites (Figure 5) in January 2014 reached 0.065 mg/dmᶟ making water 3rd quality, in June it reached 0.007 gm/dmᶟ, and in September, it reached 0.012 making water 1st quality.
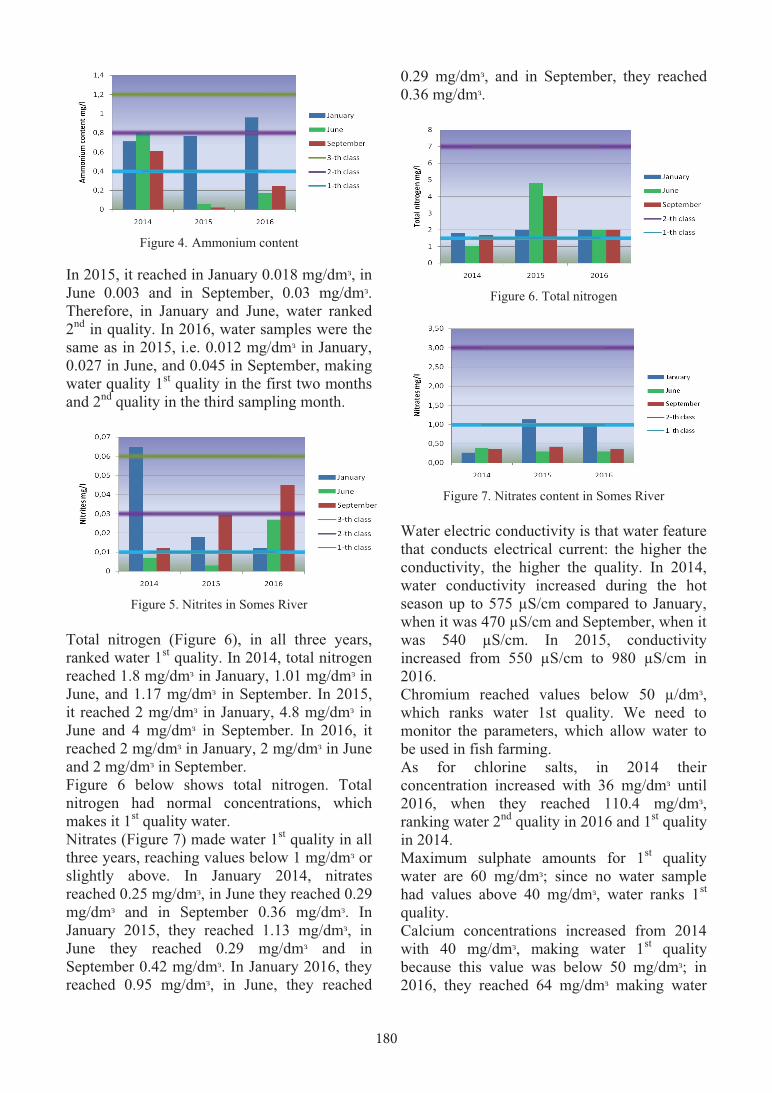
180
Figure 4. Ammonium content
In 2015, it reached in January 0.018 mg/dmᶟ, in June 0.003 and in September, 0.03 mg/dmᶟ. Therefore, in January and June, water ranked 2nd in quality. In 2016, water samples were the same as in 2015, i.e. 0.012 mg/dmᶟ in January, 0.027 in June, and 0.045 in September, making water quality 1st quality in the first two months and 2nd quality in the third sampling month.
Figure 5. Nitrites in Somes River
Total nitrogen (Figure 6), in all three years, ranked water 1st quality. In 2014, total nitrogen reached 1.8 mg/dmᶟ in January, 1.01 mg/dmᶟ in June, and 1.17 mg/dmᶟ in September. In 2015, it reached 2 mg/dmᶟ in January, 4.8 mg/dmᶟ in June and 4 mg/dmᶟ in September. In 2016, it reached 2 mg/dmᶟ in January, 2 mg/dmᶟ in June and 2 mg/dmᶟ in September. Figure 6 below shows total nitrogen. Total nitrogen had normal concentrations, which makes it 1st quality water. Nitrates (Figure 7) made water 1st quality in all three years, reaching values below 1 mg/dmᶟ or slightly above. In January 2014, nitrates reached 0.25 mg/dmᶟ, in June they reached 0.29 mg/dmᶟ and in September 0.36 mg/dmᶟ. In January 2015, they reached 1.13 mg/dmᶟ, in June they reached 0.29 mg/dmᶟ and in September 0.42 mg/dmᶟ. In January 2016, they reached 0.95 mg/dmᶟ, in June, they reached
0.29 mg/dmᶟ, and in September, they reached 0.36 mg/dmᶟ.
Figure 6. Total nitrogen
Figure 7. Nitrates content in Somes River
Water electric conductivity is that water feature that conducts electrical current: the higher the conductivity, the higher the quality. In 2014, water conductivity increased during the hot season up to 575 µS/cm compared to January, when it was 470 µS/cm and September, when it was 540 µS/cm. In 2015, conductivity increased from 550 µS/cm to 980 µS/cm in 2016. Chromium reached values below 50 µ/dmᶟ, which ranks water 1st quality. We need to monitor the parameters, which allow water to be used in fish farming. As for chlorine salts, in 2014 their concentration increased with 36 mg/dmᶟ until 2016, when they reached 110.4 mg/dmᶟ, ranking water 2nd quality in 2016 and 1st quality in 2014. Maximum sulphate amounts for 1st quality water are 60 mg/dmᶟ; since no water sample had values above 40 mg/dmᶟ, water ranks 1st quality. Calcium concentrations increased from 2014 with 40 mg/dmᶟ, making water 1st quality because this value was below 50 mg/dmᶟ; in 2016, they reached 64 mg/dmᶟ making water
2nd quality. We need to monitor this perimeter on a constant basis. As for magnesium, its concentration decreased from 2014 to 2016: in 2014, it was 15 mg/dmᶟ making water 2nd quality, compare to 2016, when it was 6 mg/dmᶟ making water 1st quality. We need to monitor the perimeter. Copper concentration was below 20 μg/dmᶟ in all three years, making water 1st quality. Zinc had maximum concentration for 1st quality water (100 μg/dmᶟ) and it kept constant. Arsenic had concentrations below 10 μg/dmᶟ making water 1st quality.
Figure 8. Specific toxic pollutants in Somes River Barium made water 1st quality because its concentration was below 0.05 μg/dmᶟ. Maximum concentration of selenium in 1st quality water is 1 μg/dmᶟ, and this was the case in our water samples. Cobalt ranks water 1st class because its concentration was below 10 μg/dmᶟ. Lead concentration for 1st quality water is 5 μg/dmᶟ; in January 2014, lead concentration was 1.9 μg/dmᶟ and in June and September, it was below 1 μg/dmᶟ; in 2015 lead concentration were 1.0 μg/dmᶟ in January, 1.5 μg/dmᶟ in June and 1.8 μg/dmᶟ in September. Cadmium ranked water 1st quality because it was below 0.5 μg/dmᶟ in either year. Mercury concentrations were below 0.1 μg/dmᶟ making water 1st quality. The same in nickel concentrations, in which maximum concentration for 1st quality water is 10 μg/dmᶟ, as it was the case of our samples. Therefore, the River Somes is fit for the growth and development of aquatic bodies due to its concentration in chemical elements. However, these parameters need to be permanently monitored.
CONCLUSIONS To determine water quality, we analysed water samples from three different years (2014, 2015 and 2016) from January, June and September. As a conclusion, because of human activities, river water quality is decreasing in dissolved oxygen, biochemical consumption of oxygen over five days, oxygen saturation, nitrite and chlorine salt content, parameters that need constant monitoring. Quality classes increased from 2014 to 2016 because pollution decreased because of the lack of connection of the households to the waste water system in 2013-2014. Nitrates are present in minimum concentrations and rank water quality 1st: therefore, water is fit for fish farming and as drinking water. Therefore, total nitrogen ranks water as 1st quality water, which means that it has substances and chemical elements favourable to body development. As a conclusion, most studied parameters make water 1st quality; the river is self-cleaning and self-maintaining, with balanced concentrations of dissolved oxygen and water temperature. Toxic specific natural pollutants such as total chromium, copper, zinc, arsenic, barium, selenium, cobalt, cadmium, and mercury range are in 1st quality water. However, we need to continuously monitor the parameters. ACKNOWLEDGEMENTS This research work was carried out with the support of GEOMATICS RESEARCH LABORATORY infrastructure, https://erris.gov.ro/Laborator-Cercetaregeomatica from BUASMV "King Michael I of Romania" Timisoara - Faculty of Agriculture. REFERENCES Ciobotaru A., 2015. Influence of human activities on
water quality of rivers and groundwaters from Brăila County. Analele Universităţii din Oradea, Seria Geografie Year XXV, no. 1/2015 (June), ISSN 1221-1273, E-ISSN 2065-3409, p. 05-13.
Chiorescu E., 2013. Simulation of soluble pollutants dispersion in rivers – elements of mathematical modelling. Vol. 2, Current topics, concepts and research priorities in environmental chemistry, vol. 2.

181
Figure 4. Ammonium content
In 2015, it reached in January 0.018 mg/dmᶟ, in June 0.003 and in September, 0.03 mg/dmᶟ. Therefore, in January and June, water ranked 2nd in quality. In 2016, water samples were the same as in 2015, i.e. 0.012 mg/dmᶟ in January, 0.027 in June, and 0.045 in September, making water quality 1st quality in the first two months and 2nd quality in the third sampling month.
Figure 5. Nitrites in Somes River
Total nitrogen (Figure 6), in all three years, ranked water 1st quality. In 2014, total nitrogen reached 1.8 mg/dmᶟ in January, 1.01 mg/dmᶟ in June, and 1.17 mg/dmᶟ in September. In 2015, it reached 2 mg/dmᶟ in January, 4.8 mg/dmᶟ in June and 4 mg/dmᶟ in September. In 2016, it reached 2 mg/dmᶟ in January, 2 mg/dmᶟ in June and 2 mg/dmᶟ in September. Figure 6 below shows total nitrogen. Total nitrogen had normal concentrations, which makes it 1st quality water. Nitrates (Figure 7) made water 1st quality in all three years, reaching values below 1 mg/dmᶟ or slightly above. In January 2014, nitrates reached 0.25 mg/dmᶟ, in June they reached 0.29 mg/dmᶟ and in September 0.36 mg/dmᶟ. In January 2015, they reached 1.13 mg/dmᶟ, in June they reached 0.29 mg/dmᶟ and in September 0.42 mg/dmᶟ. In January 2016, they reached 0.95 mg/dmᶟ, in June, they reached
0.29 mg/dmᶟ, and in September, they reached 0.36 mg/dmᶟ.
Figure 6. Total nitrogen
Figure 7. Nitrates content in Somes River
Water electric conductivity is that water feature that conducts electrical current: the higher the conductivity, the higher the quality. In 2014, water conductivity increased during the hot season up to 575 µS/cm compared to January, when it was 470 µS/cm and September, when it was 540 µS/cm. In 2015, conductivity increased from 550 µS/cm to 980 µS/cm in 2016. Chromium reached values below 50 µ/dmᶟ, which ranks water 1st quality. We need to monitor the parameters, which allow water to be used in fish farming. As for chlorine salts, in 2014 their concentration increased with 36 mg/dmᶟ until 2016, when they reached 110.4 mg/dmᶟ, ranking water 2nd quality in 2016 and 1st quality in 2014. Maximum sulphate amounts for 1st quality water are 60 mg/dmᶟ; since no water sample had values above 40 mg/dmᶟ, water ranks 1st quality. Calcium concentrations increased from 2014 with 40 mg/dmᶟ, making water 1st quality because this value was below 50 mg/dmᶟ; in 2016, they reached 64 mg/dmᶟ making water
2nd quality. We need to monitor this perimeter on a constant basis. As for magnesium, its concentration decreased from 2014 to 2016: in 2014, it was 15 mg/dmᶟ making water 2nd quality, compare to 2016, when it was 6 mg/dmᶟ making water 1st quality. We need to monitor the perimeter. Copper concentration was below 20 μg/dmᶟ in all three years, making water 1st quality. Zinc had maximum concentration for 1st quality water (100 μg/dmᶟ) and it kept constant. Arsenic had concentrations below 10 μg/dmᶟ making water 1st quality.
Figure 8. Specific toxic pollutants in Somes River Barium made water 1st quality because its concentration was below 0.05 μg/dmᶟ. Maximum concentration of selenium in 1st quality water is 1 μg/dmᶟ, and this was the case in our water samples. Cobalt ranks water 1st class because its concentration was below 10 μg/dmᶟ. Lead concentration for 1st quality water is 5 μg/dmᶟ; in January 2014, lead concentration was 1.9 μg/dmᶟ and in June and September, it was below 1 μg/dmᶟ; in 2015 lead concentration were 1.0 μg/dmᶟ in January, 1.5 μg/dmᶟ in June and 1.8 μg/dmᶟ in September. Cadmium ranked water 1st quality because it was below 0.5 μg/dmᶟ in either year. Mercury concentrations were below 0.1 μg/dmᶟ making water 1st quality. The same in nickel concentrations, in which maximum concentration for 1st quality water is 10 μg/dmᶟ, as it was the case of our samples. Therefore, the River Somes is fit for the growth and development of aquatic bodies due to its concentration in chemical elements. However, these parameters need to be permanently monitored.
CONCLUSIONS To determine water quality, we analysed water samples from three different years (2014, 2015 and 2016) from January, June and September. As a conclusion, because of human activities, river water quality is decreasing in dissolved oxygen, biochemical consumption of oxygen over five days, oxygen saturation, nitrite and chlorine salt content, parameters that need constant monitoring. Quality classes increased from 2014 to 2016 because pollution decreased because of the lack of connection of the households to the waste water system in 2013-2014. Nitrates are present in minimum concentrations and rank water quality 1st: therefore, water is fit for fish farming and as drinking water. Therefore, total nitrogen ranks water as 1st quality water, which means that it has substances and chemical elements favourable to body development. As a conclusion, most studied parameters make water 1st quality; the river is self-cleaning and self-maintaining, with balanced concentrations of dissolved oxygen and water temperature. Toxic specific natural pollutants such as total chromium, copper, zinc, arsenic, barium, selenium, cobalt, cadmium, and mercury range are in 1st quality water. However, we need to continuously monitor the parameters. ACKNOWLEDGEMENTS This research work was carried out with the support of GEOMATICS RESEARCH LABORATORY infrastructure, https://erris.gov.ro/Laborator-Cercetaregeomatica from BUASMV "King Michael I of Romania" Timisoara - Faculty of Agriculture. REFERENCES Ciobotaru A., 2015. Influence of human activities on
water quality of rivers and groundwaters from Brăila County. Analele Universităţii din Oradea, Seria Geografie Year XXV, no. 1/2015 (June), ISSN 1221-1273, E-ISSN 2065-3409, p. 05-13.
Chiorescu E., 2013. Simulation of soluble pollutants dispersion in rivers – elements of mathematical modelling. Vol. 2, Current topics, concepts and research priorities in environmental chemistry, vol. 2.

182
ISBN 978-973-703-939-2, Ed. Univ. Alexandru I. Cuza-Iași, Iași, p. 87-108.
Corodan I., Șmuleac L., 2016. Anthropogenic pressure on the Someș-Tisa Basin. Research Journal of Agric. Science, 48 (4), ISSN 2066-1843, p. 51-60.
Ienciu A., Oncia S., Smuleac L., Manea D., Peptan C., Ştefan A, 2015. Monitoring hydro-climatic hazard in the area of Oravita: Assesing drought hazard. Research Journal of Agricultural Science, vol. 47, Timişoara, p. 72-79.
Ienciu A., Oncia S., Smuleac L., Pintilie S., Bertici R., 2013. Quality of The Water of the Bârzava River. Annals of the University of Oradea, Fascicola Environmental Protection, Vol. XVII, p. 25-30.
Marica E., Corcheş M., 2016. Study on water quality of the ampoi River Alba County. Research Journal of Agricultural Science. Vol. 48, Issue 4, p. 100-104.
Pișota I., Zaharia L., Diaconu D., 2010. Hidrologie. Ed. Universitară, p. 62-87.
Pompei C., Göncz A., 2012. Development strategy of the Someş catchment area. Publisher Risoprint Satu Mare.
Șmuleac L., Oncia S., 2012. Resurse de apă și protecția lor. Ed. Agroprint, Timișoara, p. 67-89.
Sofrenie C., 2000. Amenajari hidrotehnice in bazinul Somes-Tisa. Ed. Gloria, Cluj Napoca.
*** Official Journal of Romania, Part I, No. 161/2006.
CHEMICAL DIVERSITY OF POLYPHENOLS FROM BEE POLLEN AND PROPOLIS
Roxana SPULBER1, Teodora COLȚA1, Narcisa BĂBEANU2, Ovidiu POPA2
1Institute for Apicultural Research and Development, 42 Ficusului Blvd., District 1,
011464, Bucharest, Romania 2University of Agronomic Sciences and Veterinary Medicine, Faculty of Biotechnology,
59 Mărăşti Blvd., District 1, 011464, Bucharest, Romania
Corresponding author email: [email protected]
Abstract Bee pollen and propolis represent the bee products with the highest concentration of phenolic substances. These products contains a variety of chemical compounds but phenolic compounds are considered the main bioactive constituents. The chemical composition in both cases varies with botanical sources available to bees and extraction conditions. Despite chemical diversity, most of the samples share a similar phenolic profile. Only a part of phenolic constituents like flavonoid glycosides and pigments have been demonstrated the use as markers to discriminate bee pollen or propolis from different botanical origins.This paper highlights the main factors that contributes to chemical diversity of polyphenols from bee pollen and propolis. Key words: bee pollen, propolis, phenolic compounds. INTRODUCTION Bee pollen and propolis are popular natural products which have gained the reputation as important functional foods. Like other bee products, bee pollen and propolis are considered as pleiomorphic substances with multiple biochemical effects (Munstedt and Bogdanov, 2009) due to more than 300 compounds (Martos et al., 2008) and 250 compounds in propolis, respectively bee pollen composition. The main chemical components of bee pollen are proteins, amino acids, carbohydrates, lipids and fatty acids, phenolic compounds, enzymes, coenzymes, vitamins and bio-elements (Vassev et al., 2015). Propolis contains of variety of chemical compounds, generally being represented by 50% resin and vegetable balsam, 30% wax, 10% essential oil and aromatics, 5% pollen and 5% other substances (Sforcin, 2007; Coneac et al., 2008). Among these chemical compounds, phenolic substances are common chemical components found in high concentration. In general, the average content of bee pollen phenolic
compounds is 1.6% (Vassev et al., 2015) and minimum of total phenolic content is 21% for European propolis (Popova et al., 2007; Bankova, 2008). Based on chemical structure, phenolic compounds can be group into: phenols, phenolic acids, coumarins and isocoumarins, xanthones, naphtoquinones, stilbens, anthraquinones, flavonoids and lignins (Wollgast et al., 2000). Phenolic compounds are considered as secondary metabolites of plants with an extensive number of flavonoids and phenolic acids (Ulusoy, 2014), the bioactive constituents of bee pollen and propolis (Stojko et al., 2015; Bankova et al., 2000). The most important polyphenolic class is represented by flavonoids, with more than 5000 compounds. From chemical point of view, flavonoids are a group of benzo-γ-pyrone derivatives classified as chalcones, flavan-3-ols, flavanones, flavones, flavonols, isoflavones and bioflavonoids (Kim et al., 2004). The botanical sources and geographic origin of bee pollen and propolis are the major determinants of the diversity of phenolic substances (Ulusoy, 2014; Bankova et al.,
183
ISBN 978-973-703-939-2, Ed. Univ. Alexandru I. Cuza-Iași, Iași, p. 87-108.
Corodan I., Șmuleac L., 2016. Anthropogenic pressure on the Someș-Tisa Basin. Research Journal of Agric. Science, 48 (4), ISSN 2066-1843, p. 51-60.
Ienciu A., Oncia S., Smuleac L., Manea D., Peptan C., Ştefan A, 2015. Monitoring hydro-climatic hazard in the area of Oravita: Assesing drought hazard. Research Journal of Agricultural Science, vol. 47, Timişoara, p. 72-79.
Ienciu A., Oncia S., Smuleac L., Pintilie S., Bertici R., 2013. Quality of The Water of the Bârzava River. Annals of the University of Oradea, Fascicola Environmental Protection, Vol. XVII, p. 25-30.
Marica E., Corcheş M., 2016. Study on water quality of the ampoi River Alba County. Research Journal of Agricultural Science. Vol. 48, Issue 4, p. 100-104.
Pișota I., Zaharia L., Diaconu D., 2010. Hidrologie. Ed. Universitară, p. 62-87.
Pompei C., Göncz A., 2012. Development strategy of the Someş catchment area. Publisher Risoprint Satu Mare.
Șmuleac L., Oncia S., 2012. Resurse de apă și protecția lor. Ed. Agroprint, Timișoara, p. 67-89.
Sofrenie C., 2000. Amenajari hidrotehnice in bazinul Somes-Tisa. Ed. Gloria, Cluj Napoca.
*** Official Journal of Romania, Part I, No. 161/2006.
AgroLife Scientific Journal - Volume 6, Number 2, 2017ISSN 2285-5718; ISSN CD-ROM 2285-5726; ISSN ONLINE 2286-0126; ISSN-L 2285-5718
CHEMICAL DIVERSITY OF POLYPHENOLS FROM BEE POLLEN AND PROPOLIS
Roxana SPULBER1, Teodora COLȚA1, Narcisa BĂBEANU2, Ovidiu POPA2
1Institute for Apicultural Research and Development, 42 Ficusului Blvd., District 1,
011464, Bucharest, Romania 2University of Agronomic Sciences and Veterinary Medicine, Faculty of Biotechnology,
59 Mărăşti Blvd., District 1, 011464, Bucharest, Romania
Corresponding author email: [email protected]
Abstract Bee pollen and propolis represent the bee products with the highest concentration of phenolic substances. These products contains a variety of chemical compounds but phenolic compounds are considered the main bioactive constituents. The chemical composition in both cases varies with botanical sources available to bees and extraction conditions. Despite chemical diversity, most of the samples share a similar phenolic profile. Only a part of phenolic constituents like flavonoid glycosides and pigments have been demonstrated the use as markers to discriminate bee pollen or propolis from different botanical origins.This paper highlights the main factors that contributes to chemical diversity of polyphenols from bee pollen and propolis. Key words: bee pollen, propolis, phenolic compounds. INTRODUCTION Bee pollen and propolis are popular natural products which have gained the reputation as important functional foods. Like other bee products, bee pollen and propolis are considered as pleiomorphic substances with multiple biochemical effects (Munstedt and Bogdanov, 2009) due to more than 300 compounds (Martos et al., 2008) and 250 compounds in propolis, respectively bee pollen composition. The main chemical components of bee pollen are proteins, amino acids, carbohydrates, lipids and fatty acids, phenolic compounds, enzymes, coenzymes, vitamins and bio-elements (Vassev et al., 2015). Propolis contains of variety of chemical compounds, generally being represented by 50% resin and vegetable balsam, 30% wax, 10% essential oil and aromatics, 5% pollen and 5% other substances (Sforcin, 2007; Coneac et al., 2008). Among these chemical compounds, phenolic substances are common chemical components found in high concentration. In general, the average content of bee pollen phenolic
compounds is 1.6% (Vassev et al., 2015) and minimum of total phenolic content is 21% for European propolis (Popova et al., 2007; Bankova, 2008). Based on chemical structure, phenolic compounds can be group into: phenols, phenolic acids, coumarins and isocoumarins, xanthones, naphtoquinones, stilbens, anthraquinones, flavonoids and lignins (Wollgast et al., 2000). Phenolic compounds are considered as secondary metabolites of plants with an extensive number of flavonoids and phenolic acids (Ulusoy, 2014), the bioactive constituents of bee pollen and propolis (Stojko et al., 2015; Bankova et al., 2000). The most important polyphenolic class is represented by flavonoids, with more than 5000 compounds. From chemical point of view, flavonoids are a group of benzo-γ-pyrone derivatives classified as chalcones, flavan-3-ols, flavanones, flavones, flavonols, isoflavones and bioflavonoids (Kim et al., 2004). The botanical sources and geographic origin of bee pollen and propolis are the major determinants of the diversity of phenolic substances (Ulusoy, 2014; Bankova et al.,

184
2000). Beside those, there are several other important factors influences phenolic content in propolis, such as, age of bees, conditions of the beehives, strength of the colony and method used to collect the sample (Can et al., 2015). Previous studies found that bee pollen and propolis present a heterogenous phenolic content (Carpes et al., 2009; Miguel and Antunes, 2011). Nowadays, various techniques such as maceration with different solvents, ultrasound-assisted and supercritical fluid extraction are the most used methods for extraction of bioactive constituents from bee pollen and propolis (Miha et al., 2013). Significant amounts of bee pollen polyphenols were obtained by enzymatic extraction with pepsin (Stojko et al., 2010). In case of propolis, have been developed other methods with good yield extraction like: microwave and Soxhlet extraction (Margeretha et al., 2012; Trusheva et al., 2007). Also, the commonly used solvents for phenolic compounds extraction from bee pollen and propolis are methanol, ethanol, water (Damir et al., 2014). Since ancient times, both bee products demonstrated to possess many health benefits: anti-inflammatory, antimicrobial, antioxidant, antitumor, immunemodulatory, hepato-protective and wound healing. All these biological activities of bee pollen and propolis are related with their high polyphenol contents (Gabriele et al., 2015). Chemical diversity of phenolic compounds All hive products are rich sources of phytochemicals, but propolis and bee pollen are considered the main bee products with the highest amounts of phenolic compounds. Various techniques for extraction, separation, identification and quantification of phenolic compounds have been developed over time to capitalize and characterized these biologically active constituents from bee pollen and propolis. Extraction procedures applied for phenolic compounds in both cases do not present significant differences. The only differences arise from bee pollen composition rich in polar compounds (sugars) which requires chemical or enzymatic hydrolysis to remove glucose molecules. (Ferreres et al., 1994; Barberán et al., 2013; Carpes et al.,
2013). Enzymatic hydrolysis of flavonoid glycosides occurs in vivo by hydrolytic enzymes α- and β-glucosidases from bee saliva to free aglycone (Sameer et al., 2014; Yen et al., 2011) Most commonly flavonoids forms occur in bee pollen and propolis are flavonoid glycosides and free aglycones. Bonvehi, 2001, confirmed that the major classes of phenols in honeybee collected pollen are flavonol glycosides. The same class of constituents being determined in propolis (Marcucci, 1995). Some flavonoids from bee pollen, quercetin and kaemferol are derivatives of flavonol glycosides and can be considered as markers for pollen quality (Sameer et al., 2014). Substantial developments in research focused on extraction of bioactive compounds from bee pollen and propolis have proved that polar solvents are more effective in the extraction of bioactive compounds. The research findings of other authors reveal that flavonoid glycosides and free aglycones are richer in ethanolic extracts comparative with aqueous extracts (Yen Tin Kao et al., 2011) but a maximum concentration of bee pollen flavonoids and terpenoids was obtained when using water as solvent followed by ethanol and methanol (Kaur et al., 2013). The results obtained by Chunli S. noted that the extraction yields of propolis are tended to elevate with increasing of the ethanol con-centration (Chunli et al., 2015), specifically, phenolic compounds such as methyl gallate, rutin and myricetin were more abundant in the ethanol extract. Moreover, rutin amount was found to be direct proportionally with ethanol concentration (Yen Tin Kao et al., 2011). The using of various concentrations of ethanol as solvent allowed extraction of the highest amounts of different flavonoids: 80% ethanol extracted especiallly kaempferide, acacetin and isorhamnetin, while 60% ethanol and 70% ethanol extracted isosakuranetin, quercetin and kaempferol, respectively pinocembrin and sakuranetin (Gómez-Caravaca et al., 2006). Less polar flavonoids (isoflavones, flavanones, methylated flavones, flavonols) are extracted with nonpolar solvents, instead flavonoid glycosides and polar aglycones are extracted using alcohols or alcohol-water mixtures, presented in Table 1. The water-solvent
mixtures such ethanol-water and methanol-water in various proportions are suitable solvents for the extraction of polar phenolic acids (cinnamic acids, benzoic etc.) (Mojzer et al., 2016). Propolis extracts obtained by extraction with aqueous ethanol contain higher concentrations of phenolic substances than extracts obtained by extraction with absolute ethanol (R.G. Woisky et al., 1998).
Additional, water propolis extract has also demonstrated a substantially lower capacity to extract phenols, flavones, flavonols, flavanones and dihydroflavonols compared with methanol (Miguel et al., 2014). Despite the methanol ability to extract polar compounds, the use of methanol extracts in pharmaceutical industry can raise problems due to its toxicity and most frequently is replaced with water or ethanol extraction (Delfanian et al., 2015).
Tabel 1. The main phenolic compounds from various geographic origin identified
by used of different extraction solvents
Bee product Botanic origin Geographic origin Identified analytes Extraction
solvent References
Bee pollen
- Egypt Hydroxycinnamic Acid (3,4-Dimethoxycinnamic) Methanol Mohdaly A.A.A. and
colab., 2015
Polyfloral Algeria Hydroxybenzoic acid (Gallic), Hydroxycinnamic acid (Caffeic) Methanol Rebiai A. and colab.,
2014
Castanea sp. Italia Hydroxybenzoic acid (Gallic, 4-hydroxybenzoic, Hydroxycinnamic acids (caffeic, p–coumaric)
Ethanol 95% Gabriele M. and colab., 2015
Almond (Prunus amygdalus) Spain
Flavonols (8-Methoxykaempferol 3-glycoside, kaempferol 3-diglucosides. quercetin)
Methanol Barberán T.F. and colab., 1988
Cistus sp. Spain
Flavonols (Quercetin 3-glycoside, quercetin 3-glucoside, kaempferol, myricetin 3-glycosides, isorhamnetin 3-glycoside, isorhamnetin 3-glucoside).
Methanol Barberán T.F. and colab., 1988
Echium sp. Spain Flavonol (Kaempferol 3-glycoside). Methanol Barberán T.F. and colab., 1988
Chrysanthemum sp. Spain
Flavonols (Kaempferol 3- glycoside, quercetin 3-glycoside, myricetin 3-glycoside, isorhamnetin 3-glycoside, isorhamnetin 3-glucoside) Flavone (apigenin 7-glycoside).
Methanol Barberán T.F. and colab., 1988
Brassica napus/Trifolium repens/ Carum carvi L.
Lithuania
Flavonols (quercetin 3-O-sophoroside, 5,7-dihydroxy-2-(4-hydroxy-3-methoxyphenyl)-4-oxo-4H-chromen-3-yl 6-O-β-d-glucopyranosyl-β-d-glucopyranoside, quercetin dihexoside, isorhamnetin 3-glucoside), dicarboxylic acid (azelaic acid)
Methanol Čeksterytė V. and colab., 2016
Brassica juncea India Flavone (chrysin), Flavonols
(kaempferol, rutin, quercetin).
Mixture: ethyl acetate, diammonium sulfate, meta-phosphoric acid, methanol
Sameer S.K. and colab., 2014
Polyfloral Turkey (Anzer)
Hydroxybenzoic acids (p-OH benzoic, benzoic acid, gallic, protocatechuic acid, syringic, vanillic acids), Hydroxycinnamic acids (trans-cinnamic acid, p-coumaric acid, chlorogenic, ferulic acid, caffeic acid, o-coumaric acid), Flavonols (rutin, quercetin) Flavan-3-ols (epicatechin, catechin)
Methanol Ulusoy E., Kolayli S., 2014
Cecropia Bahia, northeastern Brazil
Flavonols (Isoquercetin, isorhamnetin, quercetin, kaempferol, myricetin) Flavone (Tricetin)
Ethanol Freire K.R.L. and colab., 2012
Eucalyptus Bahia, northeastern Brazil
Flavonols (Isoquercetin, myricetin, kaempferol, isorhamnetin, quercetin) Ethanol
Freire K.R.L. and colab., 2012
Elaeis Bahia, northeastern Brazil
Flavonols (Isoquercetin, quercetin, isorhamnetin) Ethanol
Freire K.R.L. and colab., 2012
Mimosa pudica Bahia, northeastern Brazil
Flavonols (Isoquercetin, isorhamnetin, quercetin, kaempferol, myricetin) Flavone (Tricetin)
Ethanol Freire K.R.L. and colab., 2012

185
2000). Beside those, there are several other important factors influences phenolic content in propolis, such as, age of bees, conditions of the beehives, strength of the colony and method used to collect the sample (Can et al., 2015). Previous studies found that bee pollen and propolis present a heterogenous phenolic content (Carpes et al., 2009; Miguel and Antunes, 2011). Nowadays, various techniques such as maceration with different solvents, ultrasound-assisted and supercritical fluid extraction are the most used methods for extraction of bioactive constituents from bee pollen and propolis (Miha et al., 2013). Significant amounts of bee pollen polyphenols were obtained by enzymatic extraction with pepsin (Stojko et al., 2010). In case of propolis, have been developed other methods with good yield extraction like: microwave and Soxhlet extraction (Margeretha et al., 2012; Trusheva et al., 2007). Also, the commonly used solvents for phenolic compounds extraction from bee pollen and propolis are methanol, ethanol, water (Damir et al., 2014). Since ancient times, both bee products demonstrated to possess many health benefits: anti-inflammatory, antimicrobial, antioxidant, antitumor, immunemodulatory, hepato-protective and wound healing. All these biological activities of bee pollen and propolis are related with their high polyphenol contents (Gabriele et al., 2015). Chemical diversity of phenolic compounds All hive products are rich sources of phytochemicals, but propolis and bee pollen are considered the main bee products with the highest amounts of phenolic compounds. Various techniques for extraction, separation, identification and quantification of phenolic compounds have been developed over time to capitalize and characterized these biologically active constituents from bee pollen and propolis. Extraction procedures applied for phenolic compounds in both cases do not present significant differences. The only differences arise from bee pollen composition rich in polar compounds (sugars) which requires chemical or enzymatic hydrolysis to remove glucose molecules. (Ferreres et al., 1994; Barberán et al., 2013; Carpes et al.,
2013). Enzymatic hydrolysis of flavonoid glycosides occurs in vivo by hydrolytic enzymes α- and β-glucosidases from bee saliva to free aglycone (Sameer et al., 2014; Yen et al., 2011) Most commonly flavonoids forms occur in bee pollen and propolis are flavonoid glycosides and free aglycones. Bonvehi, 2001, confirmed that the major classes of phenols in honeybee collected pollen are flavonol glycosides. The same class of constituents being determined in propolis (Marcucci, 1995). Some flavonoids from bee pollen, quercetin and kaemferol are derivatives of flavonol glycosides and can be considered as markers for pollen quality (Sameer et al., 2014). Substantial developments in research focused on extraction of bioactive compounds from bee pollen and propolis have proved that polar solvents are more effective in the extraction of bioactive compounds. The research findings of other authors reveal that flavonoid glycosides and free aglycones are richer in ethanolic extracts comparative with aqueous extracts (Yen Tin Kao et al., 2011) but a maximum concentration of bee pollen flavonoids and terpenoids was obtained when using water as solvent followed by ethanol and methanol (Kaur et al., 2013). The results obtained by Chunli S. noted that the extraction yields of propolis are tended to elevate with increasing of the ethanol con-centration (Chunli et al., 2015), specifically, phenolic compounds such as methyl gallate, rutin and myricetin were more abundant in the ethanol extract. Moreover, rutin amount was found to be direct proportionally with ethanol concentration (Yen Tin Kao et al., 2011). The using of various concentrations of ethanol as solvent allowed extraction of the highest amounts of different flavonoids: 80% ethanol extracted especiallly kaempferide, acacetin and isorhamnetin, while 60% ethanol and 70% ethanol extracted isosakuranetin, quercetin and kaempferol, respectively pinocembrin and sakuranetin (Gómez-Caravaca et al., 2006). Less polar flavonoids (isoflavones, flavanones, methylated flavones, flavonols) are extracted with nonpolar solvents, instead flavonoid glycosides and polar aglycones are extracted using alcohols or alcohol-water mixtures, presented in Table 1. The water-solvent
mixtures such ethanol-water and methanol-water in various proportions are suitable solvents for the extraction of polar phenolic acids (cinnamic acids, benzoic etc.) (Mojzer et al., 2016). Propolis extracts obtained by extraction with aqueous ethanol contain higher concentrations of phenolic substances than extracts obtained by extraction with absolute ethanol (R.G. Woisky et al., 1998).
Additional, water propolis extract has also demonstrated a substantially lower capacity to extract phenols, flavones, flavonols, flavanones and dihydroflavonols compared with methanol (Miguel et al., 2014). Despite the methanol ability to extract polar compounds, the use of methanol extracts in pharmaceutical industry can raise problems due to its toxicity and most frequently is replaced with water or ethanol extraction (Delfanian et al., 2015).
Tabel 1. The main phenolic compounds from various geographic origin identified
by used of different extraction solvents
Bee product Botanic origin Geographic origin Identified analytes Extraction
solvent References
Bee pollen
- Egypt Hydroxycinnamic Acid (3,4-Dimethoxycinnamic) Methanol Mohdaly A.A.A. and
colab., 2015
Polyfloral Algeria Hydroxybenzoic acid (Gallic), Hydroxycinnamic acid (Caffeic) Methanol Rebiai A. and colab.,
2014
Castanea sp. Italia Hydroxybenzoic acid (Gallic, 4-hydroxybenzoic, Hydroxycinnamic acids (caffeic, p–coumaric)
Ethanol 95% Gabriele M. and colab., 2015
Almond (Prunus amygdalus) Spain
Flavonols (8-Methoxykaempferol 3-glycoside, kaempferol 3-diglucosides. quercetin)
Methanol Barberán T.F. and colab., 1988
Cistus sp. Spain
Flavonols (Quercetin 3-glycoside, quercetin 3-glucoside, kaempferol, myricetin 3-glycosides, isorhamnetin 3-glycoside, isorhamnetin 3-glucoside).
Methanol Barberán T.F. and colab., 1988
Echium sp. Spain Flavonol (Kaempferol 3-glycoside). Methanol Barberán T.F. and colab., 1988
Chrysanthemum sp. Spain
Flavonols (Kaempferol 3- glycoside, quercetin 3-glycoside, myricetin 3-glycoside, isorhamnetin 3-glycoside, isorhamnetin 3-glucoside) Flavone (apigenin 7-glycoside).
Methanol Barberán T.F. and colab., 1988
Brassica napus/Trifolium repens/ Carum carvi L.
Lithuania
Flavonols (quercetin 3-O-sophoroside, 5,7-dihydroxy-2-(4-hydroxy-3-methoxyphenyl)-4-oxo-4H-chromen-3-yl 6-O-β-d-glucopyranosyl-β-d-glucopyranoside, quercetin dihexoside, isorhamnetin 3-glucoside), dicarboxylic acid (azelaic acid)
Methanol Čeksterytė V. and colab., 2016
Brassica juncea India Flavone (chrysin), Flavonols
(kaempferol, rutin, quercetin).
Mixture: ethyl acetate, diammonium sulfate, meta-phosphoric acid, methanol
Sameer S.K. and colab., 2014
Polyfloral Turkey (Anzer)
Hydroxybenzoic acids (p-OH benzoic, benzoic acid, gallic, protocatechuic acid, syringic, vanillic acids), Hydroxycinnamic acids (trans-cinnamic acid, p-coumaric acid, chlorogenic, ferulic acid, caffeic acid, o-coumaric acid), Flavonols (rutin, quercetin) Flavan-3-ols (epicatechin, catechin)
Methanol Ulusoy E., Kolayli S., 2014
Cecropia Bahia, northeastern Brazil
Flavonols (Isoquercetin, isorhamnetin, quercetin, kaempferol, myricetin) Flavone (Tricetin)
Ethanol Freire K.R.L. and colab., 2012
Eucalyptus Bahia, northeastern Brazil
Flavonols (Isoquercetin, myricetin, kaempferol, isorhamnetin, quercetin) Ethanol
Freire K.R.L. and colab., 2012
Elaeis Bahia, northeastern Brazil
Flavonols (Isoquercetin, quercetin, isorhamnetin) Ethanol
Freire K.R.L. and colab., 2012
Mimosa pudica Bahia, northeastern Brazil
Flavonols (Isoquercetin, isorhamnetin, quercetin, kaempferol, myricetin) Flavone (Tricetin)
Ethanol Freire K.R.L. and colab., 2012

186
Bee product Botanic origin Geographic origin Identified analytes Extraction
solvent References
Scoparia Bahia, northeastern Brazil
Flavonol (myricetin) Ethanol Freire K.R.L. and colab., 2012
Camelia sinensis Taiwan Hydroxycinnamic acids (Caffeic acid, chlorogenic acid, p-coumaric acid, ferulic acid).
Cold water Yen T. K. and colab., 2011
Camelia sinensis Taiwan
Flavan-3-ol (Catechin), Hydroxybenzoic acid (Gallic acid), Hydroxycinnamic acids (chlorogenic acid, caffeic acid, p-coumaric acid, ferulic acid).
Hot water Yen T. K. and colab., 2011
Camelia sinensis Taiwan
Flavan-3-ol (Catechin), Hydroxybenzoic acid (Gallic acid), Methyl ester of gallic acid (methyl gallate), Hydroxycinnamic acids (chlorogenic acid, caffeic acid, p-coumaric acid, ferulic acid), Flavonol (myricetin, rutin).
Ethanol 50% Yen T. K. and colab., 2011
Camelia sinensis Taiwan
Flavan-3-ol (Catechin), Hydroxybenzoic acid (Gallic acid), Methyl ester of gallic acid (methyl gallate) Hydroxycinnamic acids (chlorogenic acid, caffeic acid, p-coumaric acid, ferulic acid Flavonols (myricetin, rutin).
Ethanol 95% Yen T. K. and colab., 2011
Phoenix dactylifera L. Tunisia (Tozeur)
Hydroxycinnamic acids (caffeic, coumaric) Hydroxybenzoic acids (gallic, vanilic acid), Flavonols (quercetin, rutin), Flavan-3-ol (catechin, epicatechin)
Ethyl acetate Daoud, A. and colab., 2015
Phoenix dactylifera L. Tunisia (Tozeur)
Hydroxycinnamic acids (caffeic, coumaric) Hydroxybenzoic acids (gallic, vanilic acid), Flavan-3-ol (epicatechin)
Acetone Daoud, A. and colab., 2015
Phoenix dactylifera L. Tunisia (Tozeur)
Hydroxybenzoic acids (gallic, vanilic acid) Hydroxycinnamic acids (caffeic acid coumaric), Flavonols (quercetin, rutin, Flavan-3-ols (catechin, epicatechin)
Ethanol Daoud, A. and colab., 2015
Phoenix dactylifera L. Tunisia (Tozeur)
Hydroxybenzoic acids (gallic, vanilic acid) Hydroxycinnamic acids (caffeic acid coumaric), Flavonols (quercetin, rutin), Flavan-3-ols (catechin, epicatechin)
Water Daoud, A. and colab., 2015
Phoenix dactylifera L. Tunisia (Kerkennah)
Hydroxybenzoic acids (gallic, vanilic acid) Hydroxycinnamic acids (caffeic acid coumaric), Flavonols (quercetin, rutin, Flavan-3-ols (catechin, epicatechin)
Ethyl acetate Daoud, A. and colab., 2015
Phoenix dactylifera L. Tunisia (Kerkennah)
Hydroxybenzoic acid (gallic), Hydroxycinnamic acids (caffeic acid, coumaric), Flavonols (quercetin, rutin), Flavan-3-ols (epicatechin)
Acetone Daoud, A. and colab., 2015
Phoenix dactylifera L. Tunisia (Kerkennah)
Hydroxybenzoic acid (gallic), Hydroxycinnamic acid (caffeic acid), Flavonols (rutin), Flavan-3-ols (epicatechin, catechin)
Ethanol Daoud, A. and colab., 2015
Phoenix dactylifera L. Tunisia (Kerkennah)
Hydroxybenzoic acids (gallic, vanilic acid) Hydroxycinnamic acids (caffeic acid coumaric), Flavonols (quercetin, rutin), Flavan-3-ols (epicatechin)
Water Daoud, A. and colab., 2015
Heterofloral (dominant Brassicaceae)
southern Brazil
Hydroxybenzoic acids (Benzoic acid, methyl ester), Flavonols (myricetin, rutin).
Hot ethanol 70%
Carpes S.T. and colab., 2013
Heterofloral (dominant Myrtaceae eucalyptus)
southern Brazil
Hydroxybenzoic acids (Benzoic acid, methyl ester), Flavonol (rutin).
Hot ethanol 70%
Carpes S.T. and colab., 2013
Crataegus pinnatifida China (Jilin)
Hydroxybenzoic acids (Gallic acid, protocatechuic acid, vanillic acid), Hydroxycinnamic acid (p-Coumaric acid), flavonols (Quercetin, kaempferol, galangin) flavanones (Hesperetin)
Hot water Cheng N. and colab., 2013
Bee product Botanic origin Geographic origin Identified analytes Extraction
solvent References
Zea mays L. Various regions
Flavonols (quercetin-3,7-O-glucoside, quercetin-3,7,3’-O-diglucoside, quercetin-3,3’-O-diglycoside), quercetin-3-O-glucoside-3’-O-diglucoside, isorhamnetin-3-O-glycosides, quercetin-3-O-dyglycoside, quercetin-3-O-glucoside)
Ethanol-water 50%
Campos M.G. and colab., 2015
Poplar propolis
Populus spp. (especcilaly P. nigra)
continental Europe, North America, West Asia, New Zealand
Flavanons (pinocembrin, pinostrobin), flavonols (galangin, pinobanksin, rutin), flavons (chrysin), aromatic acids and their esters (ferulic acid, p-coumaric acid, isoferulic acid, cinnamic acid, caffeic acid)
Ethanol
Bankova and colab., 2000, Bankova and colab., 2008, Fokt and colab., 2010; Mohdaly A.A.A. and colab., 2015
Medite-rranean propolis
Ferula spp. (most often F. communis) Cupressaseae family (ex. Cupressus sempervirens)
Croatia, Sicilia, Greece, Malta, Algeria and Cyprus
Diterpenes, sesquiterpene esters of benzoic acids, aliphatic hydroxyacids, aromatic and fatty acids, triterpenes, anthraquinones
Ethanol Popova and colab., 2011; Miguel and Antunes, 2011 Righi and colab., 2013
Birch propolis
Betula verrucosa Northern Russia, Azerbaijan
Flavones (acacetin, apigenin), flavonols (ermanin, rhamnocitrin, fisetin, quercetin, kaempferol, isorhamnetin, rutin), hydroxybenzoic acids (p-OH Benzoic acid, Protocatechuic, Vanillic acid, Gallic acid), hydroxycinnamic acids (Caffeic acid, Ferulic acid, p-Coumaric acid, chlorogenic acid), Flavan-3-ol (catechin) phenolic glycerides (dicoumaroyl acetyl glycerol, diferuloyl acetyl glycerol, feruloyl coumaroyl acetyl glycerol, caffeoyl coumaroyl acetyl glycerol)
Ethanol
Popravko, 1978, Bankova V and colab., 2002, Can Z. and colab., 2015
Green propolis
Baccharis spp., (predominantly B. dracunculifolia)
Brasil
Phenylpropanoids, prenylated phenylpropanoids (e.g., artepillin C), and sesqui- and diterpenoids, lignans, benzofurans, benzopirans
Chloroform, methanol
Bankova and colab., 2000, Rusak, 2008 Miguel and Antunes, 2011 Righi and colab., 2013
Red propolis
Dalbergia ecastaphyllum Brasil
Chalcones, pterocarpans and other isoflavonoids Ethanol
Fokt and colab., 2010 Miguel and Antunes, 2011 Righi and colab., 2013, Nunes and colab., 2013
Red propolis Clusia spp Brasil polyprenylated benzophenones
Miguel and Antunes, 2011 Righi and colab., 2013
Red propolis
Clusia spp Venezuela, Cuba
Isoflavons, isoflavans, isoprenylated flavonoids and benzophenones
Bankova and colab., 2000, Bankova, 2005 Rusak, 2008, Fokt and colab., 2010, Miguel and Antunes,2011, Cardinault and colab., 2012
“Pacific” propolis
Macaranga tanarius
Okinawa, Taiwan, Indonesia
Prenylflavanones (propolins) Ethanol, chloroform
Bankova and colab. 2000, Bankova and colab., 2008, Trusheva, 2011, Miguel and Antunes,2011
“Canarian” propolis unknown Canary
Islands Furofuran lignans, carbohydrates Ethanol
Bankova and colab., 2000, Bankova and colab., 2008, Miguel and Antunes, 2011, Pujirahaiu and colab., 2014
Stilbene propolis
Ambrosia deltoidea Encelia farinose
Australia and equatorial regions in South America
Prenylated stilbenes Ethyl acetate
Bankova and colab., 2000 Fokt and colab., 2010, Miguel and Antunes,2011 Abu-Mellal and colab.,2012 Righi and colab., 2013

187
Bee product Botanic origin Geographic origin Identified analytes Extraction
solvent References
Scoparia Bahia, northeastern Brazil
Flavonol (myricetin) Ethanol Freire K.R.L. and colab., 2012
Camelia sinensis Taiwan Hydroxycinnamic acids (Caffeic acid, chlorogenic acid, p-coumaric acid, ferulic acid).
Cold water Yen T. K. and colab., 2011
Camelia sinensis Taiwan
Flavan-3-ol (Catechin), Hydroxybenzoic acid (Gallic acid), Hydroxycinnamic acids (chlorogenic acid, caffeic acid, p-coumaric acid, ferulic acid).
Hot water Yen T. K. and colab., 2011
Camelia sinensis Taiwan
Flavan-3-ol (Catechin), Hydroxybenzoic acid (Gallic acid), Methyl ester of gallic acid (methyl gallate), Hydroxycinnamic acids (chlorogenic acid, caffeic acid, p-coumaric acid, ferulic acid), Flavonol (myricetin, rutin).
Ethanol 50% Yen T. K. and colab., 2011
Camelia sinensis Taiwan
Flavan-3-ol (Catechin), Hydroxybenzoic acid (Gallic acid), Methyl ester of gallic acid (methyl gallate) Hydroxycinnamic acids (chlorogenic acid, caffeic acid, p-coumaric acid, ferulic acid Flavonols (myricetin, rutin).
Ethanol 95% Yen T. K. and colab., 2011
Phoenix dactylifera L. Tunisia (Tozeur)
Hydroxycinnamic acids (caffeic, coumaric) Hydroxybenzoic acids (gallic, vanilic acid), Flavonols (quercetin, rutin), Flavan-3-ol (catechin, epicatechin)
Ethyl acetate Daoud, A. and colab., 2015
Phoenix dactylifera L. Tunisia (Tozeur)
Hydroxycinnamic acids (caffeic, coumaric) Hydroxybenzoic acids (gallic, vanilic acid), Flavan-3-ol (epicatechin)
Acetone Daoud, A. and colab., 2015
Phoenix dactylifera L. Tunisia (Tozeur)
Hydroxybenzoic acids (gallic, vanilic acid) Hydroxycinnamic acids (caffeic acid coumaric), Flavonols (quercetin, rutin, Flavan-3-ols (catechin, epicatechin)
Ethanol Daoud, A. and colab., 2015
Phoenix dactylifera L. Tunisia (Tozeur)
Hydroxybenzoic acids (gallic, vanilic acid) Hydroxycinnamic acids (caffeic acid coumaric), Flavonols (quercetin, rutin), Flavan-3-ols (catechin, epicatechin)
Water Daoud, A. and colab., 2015
Phoenix dactylifera L. Tunisia (Kerkennah)
Hydroxybenzoic acids (gallic, vanilic acid) Hydroxycinnamic acids (caffeic acid coumaric), Flavonols (quercetin, rutin, Flavan-3-ols (catechin, epicatechin)
Ethyl acetate Daoud, A. and colab., 2015
Phoenix dactylifera L. Tunisia (Kerkennah)
Hydroxybenzoic acid (gallic), Hydroxycinnamic acids (caffeic acid, coumaric), Flavonols (quercetin, rutin), Flavan-3-ols (epicatechin)
Acetone Daoud, A. and colab., 2015
Phoenix dactylifera L. Tunisia (Kerkennah)
Hydroxybenzoic acid (gallic), Hydroxycinnamic acid (caffeic acid), Flavonols (rutin), Flavan-3-ols (epicatechin, catechin)
Ethanol Daoud, A. and colab., 2015
Phoenix dactylifera L. Tunisia (Kerkennah)
Hydroxybenzoic acids (gallic, vanilic acid) Hydroxycinnamic acids (caffeic acid coumaric), Flavonols (quercetin, rutin), Flavan-3-ols (epicatechin)
Water Daoud, A. and colab., 2015
Heterofloral (dominant Brassicaceae)
southern Brazil
Hydroxybenzoic acids (Benzoic acid, methyl ester), Flavonols (myricetin, rutin).
Hot ethanol 70%
Carpes S.T. and colab., 2013
Heterofloral (dominant Myrtaceae eucalyptus)
southern Brazil
Hydroxybenzoic acids (Benzoic acid, methyl ester), Flavonol (rutin).
Hot ethanol 70%
Carpes S.T. and colab., 2013
Crataegus pinnatifida China (Jilin)
Hydroxybenzoic acids (Gallic acid, protocatechuic acid, vanillic acid), Hydroxycinnamic acid (p-Coumaric acid), flavonols (Quercetin, kaempferol, galangin) flavanones (Hesperetin)
Hot water Cheng N. and colab., 2013
Bee product Botanic origin Geographic origin Identified analytes Extraction
solvent References
Zea mays L. Various regions
Flavonols (quercetin-3,7-O-glucoside, quercetin-3,7,3’-O-diglucoside, quercetin-3,3’-O-diglycoside), quercetin-3-O-glucoside-3’-O-diglucoside, isorhamnetin-3-O-glycosides, quercetin-3-O-dyglycoside, quercetin-3-O-glucoside)
Ethanol-water 50%
Campos M.G. and colab., 2015
Poplar propolis
Populus spp. (especcilaly P. nigra)
continental Europe, North America, West Asia, New Zealand
Flavanons (pinocembrin, pinostrobin), flavonols (galangin, pinobanksin, rutin), flavons (chrysin), aromatic acids and their esters (ferulic acid, p-coumaric acid, isoferulic acid, cinnamic acid, caffeic acid)
Ethanol
Bankova and colab., 2000, Bankova and colab., 2008, Fokt and colab., 2010; Mohdaly A.A.A. and colab., 2015
Medite-rranean propolis
Ferula spp. (most often F. communis) Cupressaseae family (ex. Cupressus sempervirens)
Croatia, Sicilia, Greece, Malta, Algeria and Cyprus
Diterpenes, sesquiterpene esters of benzoic acids, aliphatic hydroxyacids, aromatic and fatty acids, triterpenes, anthraquinones
Ethanol Popova and colab., 2011; Miguel and Antunes, 2011 Righi and colab., 2013
Birch propolis
Betula verrucosa Northern Russia, Azerbaijan
Flavones (acacetin, apigenin), flavonols (ermanin, rhamnocitrin, fisetin, quercetin, kaempferol, isorhamnetin, rutin), hydroxybenzoic acids (p-OH Benzoic acid, Protocatechuic, Vanillic acid, Gallic acid), hydroxycinnamic acids (Caffeic acid, Ferulic acid, p-Coumaric acid, chlorogenic acid), Flavan-3-ol (catechin) phenolic glycerides (dicoumaroyl acetyl glycerol, diferuloyl acetyl glycerol, feruloyl coumaroyl acetyl glycerol, caffeoyl coumaroyl acetyl glycerol)
Ethanol
Popravko, 1978, Bankova V and colab., 2002, Can Z. and colab., 2015
Green propolis
Baccharis spp., (predominantly B. dracunculifolia)
Brasil
Phenylpropanoids, prenylated phenylpropanoids (e.g., artepillin C), and sesqui- and diterpenoids, lignans, benzofurans, benzopirans
Chloroform, methanol
Bankova and colab., 2000, Rusak, 2008 Miguel and Antunes, 2011 Righi and colab., 2013
Red propolis
Dalbergia ecastaphyllum Brasil
Chalcones, pterocarpans and other isoflavonoids Ethanol
Fokt and colab., 2010 Miguel and Antunes, 2011 Righi and colab., 2013, Nunes and colab., 2013
Red propolis Clusia spp Brasil polyprenylated benzophenones
Miguel and Antunes, 2011 Righi and colab., 2013
Red propolis
Clusia spp Venezuela, Cuba
Isoflavons, isoflavans, isoprenylated flavonoids and benzophenones
Bankova and colab., 2000, Bankova, 2005 Rusak, 2008, Fokt and colab., 2010, Miguel and Antunes,2011, Cardinault and colab., 2012
“Pacific” propolis
Macaranga tanarius
Okinawa, Taiwan, Indonesia
Prenylflavanones (propolins) Ethanol, chloroform
Bankova and colab. 2000, Bankova and colab., 2008, Trusheva, 2011, Miguel and Antunes,2011
“Canarian” propolis unknown Canary
Islands Furofuran lignans, carbohydrates Ethanol
Bankova and colab., 2000, Bankova and colab., 2008, Miguel and Antunes, 2011, Pujirahaiu and colab., 2014
Stilbene propolis
Ambrosia deltoidea Encelia farinose
Australia and equatorial regions in South America
Prenylated stilbenes Ethyl acetate
Bankova and colab., 2000 Fokt and colab., 2010, Miguel and Antunes,2011 Abu-Mellal and colab.,2012 Righi and colab., 2013

188
The phenolic compounds present in propolis and bee pollen were extracted and analyzed from complex matrices by various analytical methods. Several analytical methods have been deve-loped for separation and identification of phe-nolic compounds from bee pollen and propolis. Liquid chromatography tandem mass spectroscopy (LC-MS), sometimes coupled with electrospray ionization detection (ESI), or light-scattering detection (LSD) and gas chromatography (GC) coupled with mass spectroscopy (GC-MS) are usually applied for
identification of flavonoids like specific possible markers from a plant source (Oman et al., 2013; Ciulu et al., 2016). The most used HPLC detection system for measuring the phenolic profile of bee pollen or propolis are: UV-VIS detector (Can et al., 2015), PDA (photodiode array) detector (Sameer et al., 2014) and MS (mass spectrometry) detector. The analytical conditions employed should be suitable for the diverse group of phenolics due to different chemical structures and the variate sensitivity of the compounds to pre-treatment (Häkkinen, 1998) describe in Table 2.
Table 2. Different conditions for identification of the common phenolic compounds from bee pollen and propolis
Bee product
/type Geographic origin/type
Phenolic compound Min. Max. Procedure/conditions References
Pollen
North and south Algeria
Gallic acid (mg/g)
0.321 0.406 RP-HPLC with linear gradient elution mode, mobile phase: mixture CH3- COOH 0,1% - ACN, volume of injection: 20 μL, effluent detected at 300 nm.
Rebiai A. and colab., 2014
Crataegus pinnatifida 0.0112
HPLC-DAD with linear gradient elution, C-18 column, mobile phase: methanol- 2% aqueous acetic acid, volume of injection: 10 μL, effluent detected at 360 nm.
Cheng N. and colab., 2013
Camellia sinensis (Taiwan)
0.69 2.55 HPLC-DAD with linear gradient elution, RP column, mobile phase: methanol- trifluoroacetic acid, volume of injection: 10 μL, effluent detected at 280 nm.
Yen T.K. and colab., 2011
Polyfloral 5,9 mg/mL
HPLC using Lichrosorb RP18 Lichrocart and Lichrocart RP 18 pre-column, gradient elution, water-methanol, flow rate 50 μL/min., effluent detected at 280 nm
Mohdaly A.A.A. and colab., 2015
Propolis
Polish
Caffeic acid (mg/g)
3.90
HPLC-DAD, reverse phase Cadenza 5CD-C18 column, mobile phase: formic acid in water-acetonitrile, gradient elution, the injection volume was 20 μL, detection at 290 nm, 325 nm, and 370 nm.
Szliszka E. and colab., 2013
Chilean 12.3
HPLC equipped with a UV-visible detector, RP-18 column, mobile phase: formic acid 5% in water- methanol, isocratic-0 to 10 min-run, followed by a gradient up to 100% B at 70 min, detection at 290 nm, the injection volume was 10μL
Barrientos L. and colab., 2013
Egyptian 0.13 10.16
HPLC on a C-18 reverse phase column, using a UV detector, Elution with water/formic acid and acetonitrile, Gradient elution at 35 min, and then the system became isocratic, detection at 340 and 290 nm
Abd El-Hady F.K. and colab., 2007
Korean 1.0 8.7
HPLC with PDA and MS detection, C18 column, mobile phase: 0.1% formic acid in water-0.1% formic acid in acetonitrile, the injection volume was 10μL
Choi S.J. and colab., 2013
Azerbaijan 0.03 5.32
HPLC-DAD, reverse phase C18 column, mobile phase: 2% acetic acid in water-70:30 acetonitrile/water mixtures, gradient elution, injection volume was 25 mL, detection at 280 and 315 nm.
Can Z. and colab., 2015
Polish
Ferulic acid (mg/g)
22.01
HPLC-DAD, reverse phase Cadenza 5CD-C18 column, mobile phase: formic acid in water-acetonitrile, gradient elution, the injection volume was 20 μL, detection at 290 nm, 325 nm, and 370 nm.
Szliszka E. and colab., 2013
Egyptian 0.30 0.56
HPLC on a C-18 reverse phase column, using a UV detector, Elution with water/formic acid and acetonitrile, Gradient elution at 35 min, and then the system became isocratic, detection at 340 and 290 nm
Abd El-Hady F.K. and colab., 2007
Korean 0.50 1.9
HPLC-PDA and MS detection, C18 column, mobile phase: 0.1% formic acid in water-0.1% formic acid in acetonitrile, the injection volume was 10μL
Choi S.J. and colab., 2013
Azerbaijan 0.005 3.675
HPLC-DAD, reverse phase C18 column, mobile phase: 2% acetic acid in water-70:30 acetonitrile/water mixtures, gradient elution, injection volume was 25 mL, detection at 280 and 315 nm.
Can Z. and colab., 2015
Bee product /type
Geographic origin/type
Phenolic compound Min. Max. Procedure/conditions References
Polish
Galangin (mg/g)
0.47
HPLC-DAD, reverse phase Cadenza 5CD-C18 column, mobile phase: formic acid in water-acetonitrile, gradient elution, the injection volume was 20 μL, detection at 290 nm, 325 nm, and 370 nm.
Szliszka E. and colab., 2013
Egyptian 0.63 5.0
HPLC on a C-18 reverse phase column, using a UV detector, Elution with water/formic acid and acetonitrile, Gradient elution at 35 min, and then the system became isocratic, detection at 340 and 290 nm
Abd El-Hady F.K. and colab., 2007
Korean 4.9 26.3 HPLC-PDA and MS detection, C18 column, mobile phase: 0.1% formic acid in water-0.1% formic acid in acetonitrile, the injection volume was 10μL
Choi S.J. and colab., 2013
Chinese 2.785 LC-DAD system, EclipseXDB-C18 column, mobile phase: mixture of phosphate buffered saline (pH=4.5) in water and methanol, isocratic mode, detection at 260 nm.
Yang l. and colab., 2013
Egyptian
Kaempferol (mg/g)
0.47 2.0
HPLC on a C-18 reverse phase column, using a UV detector, Elution with water/formic acid and acetonitrile, Gradient elution at 35 min, and then the system became isocratic, detection at 340 and 290 nm
Abd El-Hady F.K. and colab., 2007
Korean 0.7 2.5
HPLC-PDA and MS detection, C18 column, mobile phase: 0.1% formic acid in water-0.1% formic acid in acetonitrile, the injection volume was 10μL
Choi S.J. and colab., 2013
Azerbaijan 0.124 2.159
HPLC-DAD, reverse phase C18 column, mobile phase: 2% acetic acid in water-70:30 acetonitrile/water mixtures, gradient elution, injection volume was 25 mL, detection at 280 and 315 nm.
Can Z. and colab., 2015
For example, the use of hydrophobic resin, Amberlite XAD2 for bee pollen sample purification determined a decrease in the content of phenolic compounds (Carpes et al., 2013). The presence of glycosidic flavonoids in bee pollen was reported in many studies (Ferreres et al., 1994; Ulusoy, 2014; Sameer et al., 2014) and the most frequent compound found is identified as quercetin-3-sophoroside by various methods regardless of the pollen type. Capillary electrophoresis coupled with electrospray ionization time-of-flight-mass spectrometry (CE–ESI–TOF–MS) showed the presence of quercetin-3-sophoroside in Ranunculus petiolaris bee pollen extract including acetin-glucoside, 7-O-methylherbacetin-3-sophoroside, galloyl-glucose, apigenin-6,8-di-C-glycoside, quercetin-3-rutinoside, genistein-7-O-β-D-glucoside, luteolin-7-O-glucoside, apigenin-7-O-glucoside and 2′,4′,6′-trihydroxy-3′-formyldihydrochalcone (Arráez-Román et al., 2007). HPLC-PDA combined with UHR-QTOF mass spectrometer used to analyze methanolic extracts of Lithuanian pollen also confirms that quercetin 3-o-sophoroside is a glycosidic flavonoid as well as other compounds like quercetin dihexoside and isorhamnetin 3-glucoside (Čeksterytė et al., 2016). Study carried out by Freire (2012), showed that bee
pollen from Brazil contained mainly isoquercetin, quercetin and isorhamnetin. These flavonoids appeared in more than 90% of the sample and may be not considered a marker to plant species (Freire et al., 2012). The chemical diversity of propolis depends mainly by geographic and plant origin (Bankova et al., 2000). The differences bet-ween propolis of temperate and tropical regions are determined by vegetal source: in temperate zones the main visited plant species are poplar trees, while in tropical zones the dominant propolis source is Baccharis dracunculifolia. In other geographical regions, such as in Australia and equatorial regions in South America, propolis have botanical origin in Ambrosia deltoidea and Encelia farinose, whereas the major sources for propolis from Venezuela are represented by Clusia minor and Clusia major. Based on plant origin it were estabilished the main chemical types of propolis: Poplar propolis from Europe, North America, and the non-tropical regions of Asia, Birch propolis from Russia, Mediterranean propolis from Croatia, Sicilia, Greece, Malta, Algeria and Cyprus (Popova et al., 2011), Green Propolis from Brazilia, Red propolis from Cuba and Venezuela, “Pacific” propolis from Okinawa and Taiwan and “Canarian” propolis from Canarian Islands (Bankova, 2005).

189
The phenolic compounds present in propolis and bee pollen were extracted and analyzed from complex matrices by various analytical methods. Several analytical methods have been deve-loped for separation and identification of phe-nolic compounds from bee pollen and propolis. Liquid chromatography tandem mass spectroscopy (LC-MS), sometimes coupled with electrospray ionization detection (ESI), or light-scattering detection (LSD) and gas chromatography (GC) coupled with mass spectroscopy (GC-MS) are usually applied for
identification of flavonoids like specific possible markers from a plant source (Oman et al., 2013; Ciulu et al., 2016). The most used HPLC detection system for measuring the phenolic profile of bee pollen or propolis are: UV-VIS detector (Can et al., 2015), PDA (photodiode array) detector (Sameer et al., 2014) and MS (mass spectrometry) detector. The analytical conditions employed should be suitable for the diverse group of phenolics due to different chemical structures and the variate sensitivity of the compounds to pre-treatment (Häkkinen, 1998) describe in Table 2.
Table 2. Different conditions for identification of the common phenolic compounds from bee pollen and propolis
Bee product
/type Geographic origin/type
Phenolic compound Min. Max. Procedure/conditions References
Pollen
North and south Algeria
Gallic acid (mg/g)
0.321 0.406 RP-HPLC with linear gradient elution mode, mobile phase: mixture CH3- COOH 0,1% - ACN, volume of injection: 20 μL, effluent detected at 300 nm.
Rebiai A. and colab., 2014
Crataegus pinnatifida 0.0112
HPLC-DAD with linear gradient elution, C-18 column, mobile phase: methanol- 2% aqueous acetic acid, volume of injection: 10 μL, effluent detected at 360 nm.
Cheng N. and colab., 2013
Camellia sinensis (Taiwan)
0.69 2.55 HPLC-DAD with linear gradient elution, RP column, mobile phase: methanol- trifluoroacetic acid, volume of injection: 10 μL, effluent detected at 280 nm.
Yen T.K. and colab., 2011
Polyfloral 5,9 mg/mL
HPLC using Lichrosorb RP18 Lichrocart and Lichrocart RP 18 pre-column, gradient elution, water-methanol, flow rate 50 μL/min., effluent detected at 280 nm
Mohdaly A.A.A. and colab., 2015
Propolis
Polish
Caffeic acid (mg/g)
3.90
HPLC-DAD, reverse phase Cadenza 5CD-C18 column, mobile phase: formic acid in water-acetonitrile, gradient elution, the injection volume was 20 μL, detection at 290 nm, 325 nm, and 370 nm.
Szliszka E. and colab., 2013
Chilean 12.3
HPLC equipped with a UV-visible detector, RP-18 column, mobile phase: formic acid 5% in water- methanol, isocratic-0 to 10 min-run, followed by a gradient up to 100% B at 70 min, detection at 290 nm, the injection volume was 10μL
Barrientos L. and colab., 2013
Egyptian 0.13 10.16
HPLC on a C-18 reverse phase column, using a UV detector, Elution with water/formic acid and acetonitrile, Gradient elution at 35 min, and then the system became isocratic, detection at 340 and 290 nm
Abd El-Hady F.K. and colab., 2007
Korean 1.0 8.7
HPLC with PDA and MS detection, C18 column, mobile phase: 0.1% formic acid in water-0.1% formic acid in acetonitrile, the injection volume was 10μL
Choi S.J. and colab., 2013
Azerbaijan 0.03 5.32
HPLC-DAD, reverse phase C18 column, mobile phase: 2% acetic acid in water-70:30 acetonitrile/water mixtures, gradient elution, injection volume was 25 mL, detection at 280 and 315 nm.
Can Z. and colab., 2015
Polish
Ferulic acid (mg/g)
22.01
HPLC-DAD, reverse phase Cadenza 5CD-C18 column, mobile phase: formic acid in water-acetonitrile, gradient elution, the injection volume was 20 μL, detection at 290 nm, 325 nm, and 370 nm.
Szliszka E. and colab., 2013
Egyptian 0.30 0.56
HPLC on a C-18 reverse phase column, using a UV detector, Elution with water/formic acid and acetonitrile, Gradient elution at 35 min, and then the system became isocratic, detection at 340 and 290 nm
Abd El-Hady F.K. and colab., 2007
Korean 0.50 1.9
HPLC-PDA and MS detection, C18 column, mobile phase: 0.1% formic acid in water-0.1% formic acid in acetonitrile, the injection volume was 10μL
Choi S.J. and colab., 2013
Azerbaijan 0.005 3.675
HPLC-DAD, reverse phase C18 column, mobile phase: 2% acetic acid in water-70:30 acetonitrile/water mixtures, gradient elution, injection volume was 25 mL, detection at 280 and 315 nm.
Can Z. and colab., 2015
Bee product /type
Geographic origin/type
Phenolic compound Min. Max. Procedure/conditions References
Polish
Galangin (mg/g)
0.47
HPLC-DAD, reverse phase Cadenza 5CD-C18 column, mobile phase: formic acid in water-acetonitrile, gradient elution, the injection volume was 20 μL, detection at 290 nm, 325 nm, and 370 nm.
Szliszka E. and colab., 2013
Egyptian 0.63 5.0
HPLC on a C-18 reverse phase column, using a UV detector, Elution with water/formic acid and acetonitrile, Gradient elution at 35 min, and then the system became isocratic, detection at 340 and 290 nm
Abd El-Hady F.K. and colab., 2007
Korean 4.9 26.3 HPLC-PDA and MS detection, C18 column, mobile phase: 0.1% formic acid in water-0.1% formic acid in acetonitrile, the injection volume was 10μL
Choi S.J. and colab., 2013
Chinese 2.785 LC-DAD system, EclipseXDB-C18 column, mobile phase: mixture of phosphate buffered saline (pH=4.5) in water and methanol, isocratic mode, detection at 260 nm.
Yang l. and colab., 2013
Egyptian
Kaempferol (mg/g)
0.47 2.0
HPLC on a C-18 reverse phase column, using a UV detector, Elution with water/formic acid and acetonitrile, Gradient elution at 35 min, and then the system became isocratic, detection at 340 and 290 nm
Abd El-Hady F.K. and colab., 2007
Korean 0.7 2.5
HPLC-PDA and MS detection, C18 column, mobile phase: 0.1% formic acid in water-0.1% formic acid in acetonitrile, the injection volume was 10μL
Choi S.J. and colab., 2013
Azerbaijan 0.124 2.159
HPLC-DAD, reverse phase C18 column, mobile phase: 2% acetic acid in water-70:30 acetonitrile/water mixtures, gradient elution, injection volume was 25 mL, detection at 280 and 315 nm.
Can Z. and colab., 2015
For example, the use of hydrophobic resin, Amberlite XAD2 for bee pollen sample purification determined a decrease in the content of phenolic compounds (Carpes et al., 2013). The presence of glycosidic flavonoids in bee pollen was reported in many studies (Ferreres et al., 1994; Ulusoy, 2014; Sameer et al., 2014) and the most frequent compound found is identified as quercetin-3-sophoroside by various methods regardless of the pollen type. Capillary electrophoresis coupled with electrospray ionization time-of-flight-mass spectrometry (CE–ESI–TOF–MS) showed the presence of quercetin-3-sophoroside in Ranunculus petiolaris bee pollen extract including acetin-glucoside, 7-O-methylherbacetin-3-sophoroside, galloyl-glucose, apigenin-6,8-di-C-glycoside, quercetin-3-rutinoside, genistein-7-O-β-D-glucoside, luteolin-7-O-glucoside, apigenin-7-O-glucoside and 2′,4′,6′-trihydroxy-3′-formyldihydrochalcone (Arráez-Román et al., 2007). HPLC-PDA combined with UHR-QTOF mass spectrometer used to analyze methanolic extracts of Lithuanian pollen also confirms that quercetin 3-o-sophoroside is a glycosidic flavonoid as well as other compounds like quercetin dihexoside and isorhamnetin 3-glucoside (Čeksterytė et al., 2016). Study carried out by Freire (2012), showed that bee
pollen from Brazil contained mainly isoquercetin, quercetin and isorhamnetin. These flavonoids appeared in more than 90% of the sample and may be not considered a marker to plant species (Freire et al., 2012). The chemical diversity of propolis depends mainly by geographic and plant origin (Bankova et al., 2000). The differences bet-ween propolis of temperate and tropical regions are determined by vegetal source: in temperate zones the main visited plant species are poplar trees, while in tropical zones the dominant propolis source is Baccharis dracunculifolia. In other geographical regions, such as in Australia and equatorial regions in South America, propolis have botanical origin in Ambrosia deltoidea and Encelia farinose, whereas the major sources for propolis from Venezuela are represented by Clusia minor and Clusia major. Based on plant origin it were estabilished the main chemical types of propolis: Poplar propolis from Europe, North America, and the non-tropical regions of Asia, Birch propolis from Russia, Mediterranean propolis from Croatia, Sicilia, Greece, Malta, Algeria and Cyprus (Popova et al., 2011), Green Propolis from Brazilia, Red propolis from Cuba and Venezuela, “Pacific” propolis from Okinawa and Taiwan and “Canarian” propolis from Canarian Islands (Bankova, 2005).
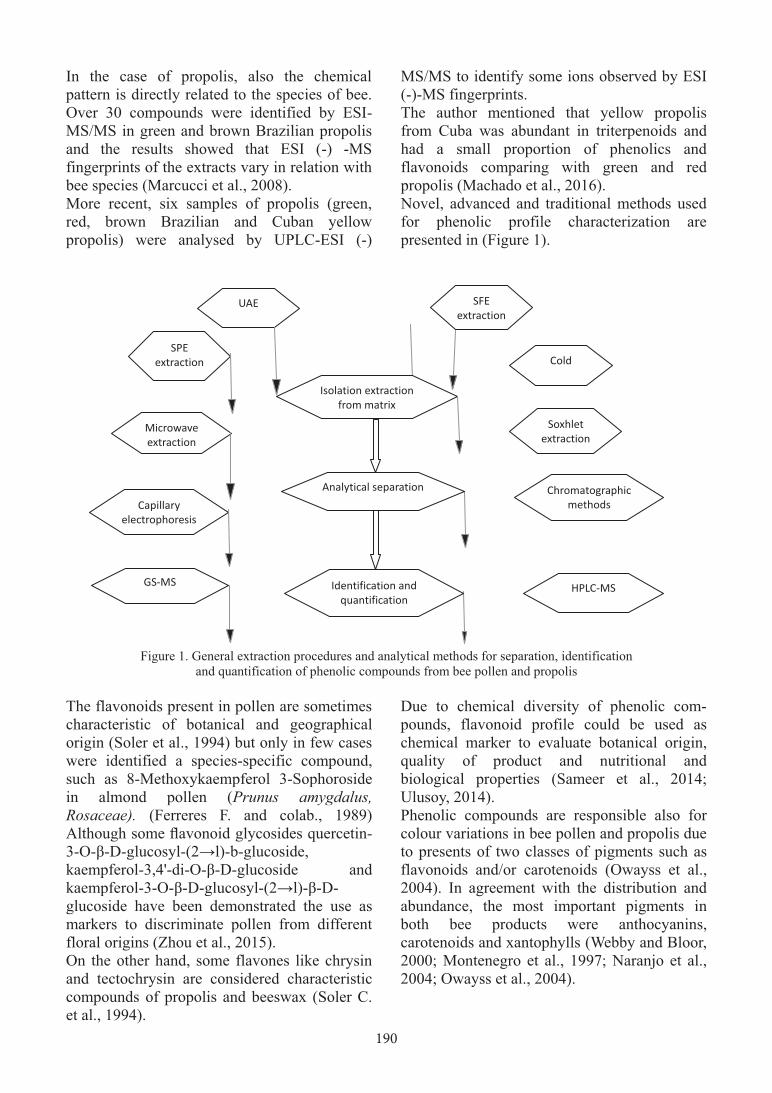
190
In the case of propolis, also the chemical pattern is directly related to the species of bee. Over 30 compounds were identified by ESI-MS/MS in green and brown Brazilian propolis and the results showed that ESI (-) -MS fingerprints of the extracts vary in relation with bee species (Marcucci et al., 2008). More recent, six samples of propolis (green, red, brown Brazilian and Cuban yellow propolis) were analysed by UPLC-ESI (-)
MS/MS to identify some ions observed by ESI (-)-MS fingerprints. The author mentioned that yellow propolis from Cuba was abundant in triterpenoids and had a small proportion of phenolics and flavonoids comparing with green and red propolis (Machado et al., 2016). Novel, advanced and traditional methods used for phenolic profile characterization are presented in (Figure 1).
Figure 1. General extraction procedures and analytical methods for separation, identification and quantification of phenolic compounds from bee pollen and propolis
The flavonoids present in pollen are sometimes characteristic of botanical and geographical origin (Soler et al., 1994) but only in few cases were identified a species-specific compound, such as 8-Methoxykaempferol 3-Sophoroside in almond pollen (Prunus amygdalus, Rosaceae). (Ferreres F. and colab., 1989) Although some flavonoid glycosides quercetin-3-O-β-D-glucosyl-(2→l)-b-glucoside, kaempferol-3,4'-di-O-β-D-glucoside and kaempferol-3-O-β-D-glucosyl-(2→l)-β-D-glucoside have been demonstrated the use as markers to discriminate pollen from different floral origins (Zhou et al., 2015). On the other hand, some flavones like chrysin and tectochrysin are considered characteristic compounds of propolis and beeswax (Soler C. et al., 1994).
Due to chemical diversity of phenolic com-pounds, flavonoid profile could be used as chemical marker to evaluate botanical origin, quality of product and nutritional and biological properties (Sameer et al., 2014; Ulusoy, 2014). Phenolic compounds are responsible also for colour variations in bee pollen and propolis due to presents of two classes of pigments such as flavonoids and/or carotenoids (Owayss et al., 2004). In agreement with the distribution and abundance, the most important pigments in both bee products were anthocyanins, carotenoids and xantophylls (Webby and Bloor, 2000; Montenegro et al., 1997; Naranjo et al., 2004; Owayss et al., 2004).
UAE
Isolation extraction from matrix
Cold
GS-MS
Chromatographic methods
SFE extraction
Microwave extraction
Analytical separation Capillary
electrophoresis
SPE extraction
Soxhlet extraction
Identification and quantification
HPLC-MS
CONCLUSIONS Based on papers presented in current work, it can be concluded that propolis as well as bee pollen contain a high amount of phenolic constituents. Chemical diversity of these bee products is influenced by botanical origin and extraction methods. These factors can also induced variations in phenolic compounds concentrations. High levels of some polyphenols can explain the biological activities of bee pollen and propolis. REFERENCES Abd El-Hady F.K., Hegazi A.G., Wollenweber E.,
2007. Effect of Egyptian Propolis on the susceptibility of LDL to oxidative modification and its antiviral activity with special emphasis on chemical composition. Z. Naturforsch. 62c, p. 645-655.
Abu-Mellal A., Koolaji N., Duke R.K., Tran V.H., Duke C.C., 2012. Prenylated cinnamate and stilbenes from Kangaroo Island propolis and their antioxidant activity. Phytochemistry 77: p. 251-259.
Arráez-Román D., Zurek G., Bäßmann C., Almaraz-Abarca N., Quirantes R., Segura-Carretero A., Fernández-Gutiérrez A., 2007. Identification of phenolic compounds from pollen extracts using capillary electrophoresis-electrospray time-of-flight mass spectrometry. Anal Bioanal Chem., 389, 6, p. 1909-1917.
Bankova V., 2005. Chemical diversity of propolis and the problem of standardization. J. Ethnopharmacol, 7, p. 100-114.
Bankova V., 2008. Propolis standard: update, International Honey Commission Group. “Standards for bee products other than honey”, Tzarevo.
Bankova V., Castro S.L.D., Marcucci M., 2000. Propolis: recent advances in chemistry and plant origin. Apidologie 31: p. 3–15.
Bankova V., Popova M., Bogdanov S., Sabatini A., 2002. Chemical composition of European propolis: expected and unexpected results. Z Naturforsch 57c: p. 530-533.
Barberán T.F., Lorente F.T., Ferres F., Viguera G.C., 1988. Flavonoids as biochemical markers of the plant origin of bee pollen. Journal of the Science of Food and Agriculture, 47, 3, p. 337–340.
Barberán T.F., Truchado P., Ferreres F., 2013. Flavonoids in Stingless-Bee and Honey-Bee Honeys, Pot-Honey. Springer New York, 2013, 33, p. 461-474.
Barrientos L., Herrera C.L., Montenegro G., Ortega X., Veloz J., Alvear M., Cuevas A., Saavedra N., Salazar L.A., 2013. Chemical and botanical characterization of Chilean propolis and biological
activity on cariogenic bacteria Streptococcus mutans and Streptococcus sobrinus. Brazilian Journal of Microbiology 44, 2, p. 577-585.
Bonvehí J.S., Torrentó M.S., Lorente E.C., 2001. Evaluation of polyphenolic and flavonoid compounds in honeybee-collected pollen produced in Spain. J. Agr. Food Chem. 49, p. 1848-1853.
Campos M.G., Abarca A.N., Matos M.G., Gomez N.M., Arruda A.V., Barth M.O., Freitas A.S., Amancio D.C., Muradian A.B.L., 2015. Zea mays L. Pollen: An Approach to Its Quality Control. Journal of Agricultural Science and Technology, B 5, p. 513-522.
Can Z., Yildiz O., Şahin H., Asadov A., Kolayi S., 2015. Phenolic Profile and Antioxidant Potential of Propolis from Azerbaijan, Mellifera, 15, 1, p. 16-28.
Cardinault N., Cayeux M.O., Percie du Sert P., 2012. La propolis: origine, composition et propriétés. Phytothérapie, 10: p. 298-304.
Carpes S.T., Alencar S.M., Cabral I.S.R., Oldoni T.L.C., Mourão G.B., Haminiuk C.W.I, Luz C.F.P., Masson M.L., 2013. Polyphenols and palynological origin of bee pollen of Apis mellifera L. from Brazil, Characterization of polyphenols of bee pollen. CyTA - Journal of Food, 11, 2, p. 150-161.
Carpes S.T., Begnini R., Alencar M.S., Masson M.L., 2007. Study of preparations of bee pollen extracts, antioxidant and antibacterial activity, Ciênc. agrotec., 31, 6, p. 1818-1825.
Carpes T.S., Mourão B.G.S.M., Masson M.L., 2009. Chemical composition and free radical scavenging activity of Apis mellifera bee pollen from Southern Brazil. Braz. J. Food Technol., 12, 3, p. 220-229.
Čeksterytė V., Kurtinaitienė B., Venskutonis P.R., Pukalskas A., Kazernavičiūtė R., Balžekas J. 2016. Evaluation of antioxidant activity and flav,onoid composition in differently preserved bee products. Czech J. Food Sci., 34, p. 133–142.
Cheng N., Wang Y., Gao H., Yuan J., Feng F., Cao W., Zheng J., 2013. Protective effect of extract of Crataegus pinnatifida pollen on DNA damage response to oxidative stress. Food and Chemical Toxicology, 59, p. 709-714.
Choi S.J., Shimomura K., Kumazawa S., Ahn Mok-Ryeon, 2013. Antioxidant properties and phenolic composition of propolis from diverse geographic regions in Korea. Food Sci. Technol. Res., 19 (2), p. 211-222.
Chunli S., Zhengshuang W., Ziyan W., Hongcheng Z., 2015. Effect of Ethanol/Water Solvents on Phenolic Profiles and Antioxidant Properties of Beijing Propolis Extracts. Evid Based Complement Alternat Med. Article ID 595393.
Ciulu M., Spano N., Pilo M., Sanna G., 2016. Recent Advances in the Analysis of Phenolic Compounds in Unifloral Honeys. Molecules, 21, pp. 451.
Coneac G., Gafiţanu E., Hădărugă D.I., Hădărugă N.G., Pînzaru I.A., Bandur G., Ursica L., Păunescu V., Gruia A., 2008. Flavonoid Contents of Propolis from the West Side of Romania and Correlation with the Antioxidant Activity. Chem.
191
In the case of propolis, also the chemical pattern is directly related to the species of bee. Over 30 compounds were identified by ESI-MS/MS in green and brown Brazilian propolis and the results showed that ESI (-) -MS fingerprints of the extracts vary in relation with bee species (Marcucci et al., 2008). More recent, six samples of propolis (green, red, brown Brazilian and Cuban yellow propolis) were analysed by UPLC-ESI (-)
MS/MS to identify some ions observed by ESI (-)-MS fingerprints. The author mentioned that yellow propolis from Cuba was abundant in triterpenoids and had a small proportion of phenolics and flavonoids comparing with green and red propolis (Machado et al., 2016). Novel, advanced and traditional methods used for phenolic profile characterization are presented in (Figure 1).
Figure 1. General extraction procedures and analytical methods for separation, identification and quantification of phenolic compounds from bee pollen and propolis
The flavonoids present in pollen are sometimes characteristic of botanical and geographical origin (Soler et al., 1994) but only in few cases were identified a species-specific compound, such as 8-Methoxykaempferol 3-Sophoroside in almond pollen (Prunus amygdalus, Rosaceae). (Ferreres F. and colab., 1989) Although some flavonoid glycosides quercetin-3-O-β-D-glucosyl-(2→l)-b-glucoside, kaempferol-3,4'-di-O-β-D-glucoside and kaempferol-3-O-β-D-glucosyl-(2→l)-β-D-glucoside have been demonstrated the use as markers to discriminate pollen from different floral origins (Zhou et al., 2015). On the other hand, some flavones like chrysin and tectochrysin are considered characteristic compounds of propolis and beeswax (Soler C. et al., 1994).
Due to chemical diversity of phenolic com-pounds, flavonoid profile could be used as chemical marker to evaluate botanical origin, quality of product and nutritional and biological properties (Sameer et al., 2014; Ulusoy, 2014). Phenolic compounds are responsible also for colour variations in bee pollen and propolis due to presents of two classes of pigments such as flavonoids and/or carotenoids (Owayss et al., 2004). In agreement with the distribution and abundance, the most important pigments in both bee products were anthocyanins, carotenoids and xantophylls (Webby and Bloor, 2000; Montenegro et al., 1997; Naranjo et al., 2004; Owayss et al., 2004).
UAE
Isolation extraction from matrix
Cold
GS-MS
Chromatographic methods
SFE extraction
Microwave extraction
Analytical separation Capillary
electrophoresis
SPE extraction
Soxhlet extraction
Identification and quantification
HPLC-MS
CONCLUSIONS Based on papers presented in current work, it can be concluded that propolis as well as bee pollen contain a high amount of phenolic constituents. Chemical diversity of these bee products is influenced by botanical origin and extraction methods. These factors can also induced variations in phenolic compounds concentrations. High levels of some polyphenols can explain the biological activities of bee pollen and propolis. REFERENCES Abd El-Hady F.K., Hegazi A.G., Wollenweber E.,
2007. Effect of Egyptian Propolis on the susceptibility of LDL to oxidative modification and its antiviral activity with special emphasis on chemical composition. Z. Naturforsch. 62c, p. 645-655.
Abu-Mellal A., Koolaji N., Duke R.K., Tran V.H., Duke C.C., 2012. Prenylated cinnamate and stilbenes from Kangaroo Island propolis and their antioxidant activity. Phytochemistry 77: p. 251-259.
Arráez-Román D., Zurek G., Bäßmann C., Almaraz-Abarca N., Quirantes R., Segura-Carretero A., Fernández-Gutiérrez A., 2007. Identification of phenolic compounds from pollen extracts using capillary electrophoresis-electrospray time-of-flight mass spectrometry. Anal Bioanal Chem., 389, 6, p. 1909-1917.
Bankova V., 2005. Chemical diversity of propolis and the problem of standardization. J. Ethnopharmacol, 7, p. 100-114.
Bankova V., 2008. Propolis standard: update, International Honey Commission Group. “Standards for bee products other than honey”, Tzarevo.
Bankova V., Castro S.L.D., Marcucci M., 2000. Propolis: recent advances in chemistry and plant origin. Apidologie 31: p. 3–15.
Bankova V., Popova M., Bogdanov S., Sabatini A., 2002. Chemical composition of European propolis: expected and unexpected results. Z Naturforsch 57c: p. 530-533.
Barberán T.F., Lorente F.T., Ferres F., Viguera G.C., 1988. Flavonoids as biochemical markers of the plant origin of bee pollen. Journal of the Science of Food and Agriculture, 47, 3, p. 337–340.
Barberán T.F., Truchado P., Ferreres F., 2013. Flavonoids in Stingless-Bee and Honey-Bee Honeys, Pot-Honey. Springer New York, 2013, 33, p. 461-474.
Barrientos L., Herrera C.L., Montenegro G., Ortega X., Veloz J., Alvear M., Cuevas A., Saavedra N., Salazar L.A., 2013. Chemical and botanical characterization of Chilean propolis and biological
activity on cariogenic bacteria Streptococcus mutans and Streptococcus sobrinus. Brazilian Journal of Microbiology 44, 2, p. 577-585.
Bonvehí J.S., Torrentó M.S., Lorente E.C., 2001. Evaluation of polyphenolic and flavonoid compounds in honeybee-collected pollen produced in Spain. J. Agr. Food Chem. 49, p. 1848-1853.
Campos M.G., Abarca A.N., Matos M.G., Gomez N.M., Arruda A.V., Barth M.O., Freitas A.S., Amancio D.C., Muradian A.B.L., 2015. Zea mays L. Pollen: An Approach to Its Quality Control. Journal of Agricultural Science and Technology, B 5, p. 513-522.
Can Z., Yildiz O., Şahin H., Asadov A., Kolayi S., 2015. Phenolic Profile and Antioxidant Potential of Propolis from Azerbaijan, Mellifera, 15, 1, p. 16-28.
Cardinault N., Cayeux M.O., Percie du Sert P., 2012. La propolis: origine, composition et propriétés. Phytothérapie, 10: p. 298-304.
Carpes S.T., Alencar S.M., Cabral I.S.R., Oldoni T.L.C., Mourão G.B., Haminiuk C.W.I, Luz C.F.P., Masson M.L., 2013. Polyphenols and palynological origin of bee pollen of Apis mellifera L. from Brazil, Characterization of polyphenols of bee pollen. CyTA - Journal of Food, 11, 2, p. 150-161.
Carpes S.T., Begnini R., Alencar M.S., Masson M.L., 2007. Study of preparations of bee pollen extracts, antioxidant and antibacterial activity, Ciênc. agrotec., 31, 6, p. 1818-1825.
Carpes T.S., Mourão B.G.S.M., Masson M.L., 2009. Chemical composition and free radical scavenging activity of Apis mellifera bee pollen from Southern Brazil. Braz. J. Food Technol., 12, 3, p. 220-229.
Čeksterytė V., Kurtinaitienė B., Venskutonis P.R., Pukalskas A., Kazernavičiūtė R., Balžekas J. 2016. Evaluation of antioxidant activity and flav,onoid composition in differently preserved bee products. Czech J. Food Sci., 34, p. 133–142.
Cheng N., Wang Y., Gao H., Yuan J., Feng F., Cao W., Zheng J., 2013. Protective effect of extract of Crataegus pinnatifida pollen on DNA damage response to oxidative stress. Food and Chemical Toxicology, 59, p. 709-714.
Choi S.J., Shimomura K., Kumazawa S., Ahn Mok-Ryeon, 2013. Antioxidant properties and phenolic composition of propolis from diverse geographic regions in Korea. Food Sci. Technol. Res., 19 (2), p. 211-222.
Chunli S., Zhengshuang W., Ziyan W., Hongcheng Z., 2015. Effect of Ethanol/Water Solvents on Phenolic Profiles and Antioxidant Properties of Beijing Propolis Extracts. Evid Based Complement Alternat Med. Article ID 595393.
Ciulu M., Spano N., Pilo M., Sanna G., 2016. Recent Advances in the Analysis of Phenolic Compounds in Unifloral Honeys. Molecules, 21, pp. 451.
Coneac G., Gafiţanu E., Hădărugă D.I., Hădărugă N.G., Pînzaru I.A., Bandur G., Ursica L., Păunescu V., Gruia A., 2008. Flavonoid Contents of Propolis from the West Side of Romania and Correlation with the Antioxidant Activity. Chem.

192
Bull. "POLITEHNICA" Univ. (Timisoara), 53, 67, p. 56-60.
Damir Aličić, Drago Šubarić, Midhat Jašić, Hatidža Pašalić, Đurđica Ačkar, 2014. Antioxidant properties of pollen. Hrana u zdravlju i bolesti, znanstveno-stručni časopis za nutricionizam i dijetetiku, 3, 1, 6-12.
Daoud A., Malika D., Bakari S., Hfaiedh, Mnafgui K., Kadri A., Gharsallah N., 2015. Assessment of polyphenol composition, antioxidant and antimicrobial properties of various extracts of Date Palm Pollen (DPP) from two Tunisian cultivars. Arabian Journal of Chemistry. (in press)
Delfanian M., Kenari R.E., Sahari M.A., 2015. Influence of extraction techniques on antioxidant properties and bioactive compounds of loquat fruit (Eriobotrya japonica Lindl.) skin and ulp extracts. Food Science & Nutrition, 3(3): p. 179–187.
Eva Brglez Mojzer, Maša Knez Hrnčič, Mojca Škerget, Željko Knez, Urban Bren, 2016. Polyphenols: Extraction Methods, Antioxidative Action, Bioavailability and Anticarcinogenic Effects. Molecules, 21, pp. 901.
Ferreres F., Barberan T.A.F., Lorente F.T., Nieto J.L., Rumbero A., Olias J.M., 1989. 8-Methoxykaempferol 3-Sophoroside, a yellow pigment from almond pollen. Phytochemistry, 28,7, p. 1901-1903.
Ferreres F., Tomás-Barberán F.A., Soler C., GarcíaViguera C., Ortiz A., Tomás-Lorente F., 1994. A simple extractive technique for honey flavonoid HPLC analysis. Apidologie 25, p. 21-30.
Fokt H., Pereira A., Ferreira A.M., Cunha A. and Aguiar C., 2010. How do bees prevent hive infections? The antimicrobial properties of propolis. Current Research, Technology and Education Topics in Applied Microbiology and Microbial Biotech., 1, p. 481-493.
Freire K.R.L., Lins A.C.S., Dorea M., Santos F.A.R., Camara C.A., Silva T.M.S., 2012. Palynological Origin, Phenolic Content, and Antioxidant Properties of Honeybee-Collected Pollen from Bahia, Brazil. Molecules, 17, p. 1652-1664.
Gabriele M., Parri E., Felicioli A., Sagona S., Pozzo L., Biondi C., Domenici V., Pucci L., 2015. Phytochemical composition and antioxidant activity of Tuscan bee pollen of different botanic origins. Italian Journal Food Sciences, 27, p. 248-259.
Gabriele M., Parri E., Felicioli A., Sagona S., Pozzo L., Biondi C., Domenici V., Pucci L., 2015. Phytochemical composition and antioxidant activity of Tuscan bee pollen of different botanic origins. Ital. J. Food Sci., 27, p. 248-259.
Gómez-Caravaca A.M., Gómez-Romero M., Arráez-Roman D., Segura-Carretero A., Fernández-Gutiérrez A., 2006. Advances in the analysis of phenolic compounds in products derived from bees. J. of Pharm. and Biomedical Analysis, 41: p. 1220-1234.
Häkkinen S.H, Kärenlampi S.O., Heinonen I.M, Mykkänen H.M, Törrönen A.R., 1998. HPLC method for screening of flavonoids and phenolic acids in berries. J. Sci. Food Agric.; 77, p. 543–551.
Kaur R., Kumar N.R., Harjai K., 2013. Phytochemical analysis of different extracts of bee pollen. International Journal of Pharmaceutical and Biological Research, 4, 3, p. 65-68.
Kim H.P., Son K.H., Chang H.W., Kang S.S., 2004, Anti-inflammatory Plant Flavonoids and Cellular Action Mechanisms, J. Pharmacol Sci., 96, p. 229-245.
Machado S.C., Mokochinski J.B., Onofre de Lira T., Oliveira F.C.E., Cardoso M.V., Ferreira R.G., Sawaya A.C.F.H., Ferreira A.G., Pessoa C., Rubio O.C., Monteiro M.C., Campos M.S., Torres Y.R., 2016. Comparative Study of Chemical Composition and Biological Activity of Yellow, Green, Brown, and Red Brazilian Propolis. Evidence-Based Complementary and Alternative Medicine, 6057650.
Marcucci M.C., 1995. Propolis: chemical composition, biological properties and therapeutic activity. Apidologie, 26: p. 83–99.
Marcucci M.C., Sawaya A.C.H.F., Custodio A.R., Paulino N., Eberlin M.N., 2008. HPLC and ESI-MS typification: New approaches for natural therapy with Brazilian propolis, Scientific Evidence of the Use of Propolis in Ethnomedicine, ISBN: 978-81-7895-357-1, Transworld Research Network, p. 33-54.
Mărgăoan R., Mărghitaş L.Al., Dezmirean D.S., Bobiş O., Tomoş L., Mihai C., Bonta V., 2013. Honeybee-collected Pollen from Transylvania: Palynological Origin, Phenolic Content and Antioxidant Activity. Bulletin UASVM Animal Science and Biotechnologies, 70, (2), p. 311-315.
Margeretha I., Suniarti D.F., Herda E., Mas’ud Z.A., 2012. Optimization and comparative study of different extraction methods of biologically active components of Indonesian propolis Trigona spp. Journal of Natural Products, 5, p. 233-242.
Martos V.M., Navajaz V.Y., Lopez F.J., Alvarez P.J.A., 2008. Functional Properties of Honey, Propolis and Royal Jelly. Journal of Food Science, 73, 9, p. 117-124.
Miguel M.G., Antunes M.D., 2011. Is propolis safe as an alternative medicine? Journal of Farmacy BioAllied Sciences, 3, 4, p. 479-495.
Miguel M.G., Nunes S., Dandlen S.A., Cavaco A.M., Antunes M.D., 2014. Phenols, flavonoids and antioxidant activity of aqueous and methanolic extracts of propolis (Apis mellifera L.) from Algarve, South Portugal. Food Sci. and Techn., 34, 1, p. 16-23.
Miha O., Škerget M., Želijko K., 2013. Application of supercritical fluid extraction for the separation of nutraceuticals and other phitochemicals from plant material. Macedonian Journal of Chemistry and Chemical Engineering, 32, 2, p. 183–226.
Mohdaly A.A.A., Mahmoud A.A., Roby M.H.H., Smetanska I., Ramadan M.F., 2015. Phenolic extract from propolis and bee pollen: composition, antioxidant and antibacterial activities. Journal of Food Biochemistry, 39, 5, p. 538-547.
Montenegro G., Vila G., Rougier D., Timmermann B., 1997. Pollen loads: source of carotenoids
originating from the mediterranean plant communities of the central zone of Chile. Revista Chilena de Historia Natural, 70: p. 91-99.
Münstedt K., Bogdanov S., 2009. Bee products and their potetial use in modern medicine. Journal of ApiProduct and ApiMedical Science, 1 (3): p. 57-63.
Naranjo P.R.D., Sánchez S.J., Paramás G.A.M., Gonzalo R.J.C., 2004. Liquid chromatographic–mass spectrometric analysis of anthocyanin composition of dark blue bee pollen from Echium plantagineum. Journal of Chromatography A, 1054, p. 205–210.
Nunes L.C.C., Galindo A.B., Lustosa S.R., Brasileiro M.T., do Egito A.A., Freitas R.M., Randau K.P., Rolim Neto P.J., 2013. Influence of seasonal variation on antioxidant and total phenol activity of red propolis extracts. Advanced Studies in Biology, 5(3), p. 119-133.
Oman M., Škerget M., Knez Ž., 2013. Application of Supercritical Fluid Extraction for the Separation of Nutraceutical and Other Phytochemicals from Plant Material. Macedonian Journal of Chemistry and Chemical Engineering, 32, 2, p. 183-226.
Owayss A.A., Rady M.M., Gadallah F., 2004. Pigmentation of some honeybee, Apis mellifera L., products. Fayoum J. Agric. Res. & Dev., 18, 2, p. 121- 132.
Popova M., Trusheva B., Antonova D., Cutajar S., Mifsud D., Farrugia C., Tsvetkova I., Najdenski H., Bankova V., 2011. The specific chemical profile of Mediterranean propolis from Malta. Food Chemistry, 126: p. 1431–1435.
Popova M.P., Bankova V., Bogdanov S., Tsvetkova I., Naydenski C., Marcazzan G.L., Sabatini A.G., 2007. Chemical characteristics of poplar type propolis of different geographic origin. Apidologie 38, p. 306-311.
Popravko S.A., 1978. Chemical composition of propolis, its origin and standardization, in: A Remarkable Hive Product: PROPOLIS. Apimondia Publ. House, Bucharest, p. 15–18.
Pujirahayu N., Ritonga H., Uslinawaty Z., 2014. Properties and flavonoids content in propolis of some extraction method of raw propolis, International J. of Pharmacy and Pharmaceutical Sci., 6(6), p. 338-340.
Rebiai A., Lanez T., Belfar M.L., 2014. Determination of caffeic acid and gallic acid in Algerian bee pollen by an HPLC method. PhytoChem & BioSub Journal, 8, 3, p. 190-197.
Righi A.A., Negri G., Salatino A., 2013. Comparative chemistry of propolis from eight brazilian localities. Evidence-Based Complementary and Alternative Medicine, p. 1-14.
Rusak G., 2008. Bioactive constituents of propolis, In Scientific Evidence of the use of propolis in ethnomedicine. Transworld Research Network, Kerala, India, p. 15-31.
Rzepecka-Stojko A., Maciejewska-Paszek I., Stec M., Kurzeja E., Kęska A., Pawłowska-Góral K., 2010. The influence of extraction method on obtaining
polyphenolic compounds from bee pollen. Farm. Prz. Naukowy, 1, p. 38–41.
Sameer S.K., Atul S.R., Sathiyanarayanan L., Lakshmi R., Anant R.P., Kakasaheb R.M., 2014. Investigation of the nutraceutical potential of monofloral Indian mustard bee pollen. Journal of Integrative Medicine, 4, p. 379-389.
Sforcin J.M., 2007. Propolis and immune system review. Journal Ethnopharmacol., 113, 1, p. 1-14.
Soler C., Gil M.I., Viguera G., Barberán T.F., 1995. Flavonoid patterns of French honeys with different floral origin. Apidologie, 26, p. 53-60.
Stojko A.R., Stojko J., Górecka A.K., Górecki M., Dzik A.K., Kubina R., Moździerz A., Buszman E., 2015. Polyphenols from Bee Pollen: Structure, Absorption, Metabolism and Biological Activity. Molecules, 20, p. 21732–21749.
Stojko A.R., Stojko J., Gόreka A.K., Gόrecki M., Dzik K.A., Kubina R., Mozdzierz A., Buszman E., 2015. Polyphenols from Bee Pollen: Structure, Absorption. Metabolism and Biological Activity, Molecules, 20, p. 21732–21749.
Szliszka E., Sokól-Letowska A., Kucharska A.Z., Jaworska D., Czuba Z.P., Król W., 2013. Ethanolic Extract of Polish Propolis: Chemical composition and TRAIL-R2 death receptor targeting apoptotic activity against prostate cancer cells. Evidence-Based Complementary and Alternative Medicine, pp. 12.
Trusheva B., Popova M., Koendhori E.B., Tsvetkova I., Naydenski C., Bankova V., 2011. Indonesian propolis: chemical composition, biological activity and botanical origin. Natural Product Research: Formerly Natural Product Letters, 25: p. 606–13.
Trusheva B., Trunkova D., Bankova V., 2007. Different extraction methods of biologically active components from propolis: preliminary study. Chemistry Central Journal, 7, p. 1-13.
Ulusoy E., Kolayli S., 2014. Phenolic composition and antioxidant properties of Anzer bee pollen. Journal of Food Biochemistry, 38, p. 73–82.
Vassev K.K., Olczyk P., Kazmierczak J., Mencner L., Olczyk K., 2015. Bee Pollen: Chemical Composition and Therapeutic Application. Hindawi Publishing Corporation, Evidence-Based Complementary and Alternative Medicine, p. 297-425.
Webby R., Bloor S., 2000. Pigments in the Blue Pollen and Bee Pollen of Fuchsia excorticate. Z. Naturforschung, 55c, p. 503-505.
Woisky R.G., Salatino A., 1998. Analysis of propolis: some parameters and procedures for chemical quality control. Journal of Apicultural Research, 37(2): p. 99- 105.
Woisky R.G., Salatino A., 1998. Analysis of propolis: some parameters and procedures for chemical quality control. Journal of Apicultural Research, 37(2): p. 99- 105.
Wollgast J., Anklam E., 2000. Review on polyphenols in Theobroma cacao: changes in composition during the manufacture of chocolate and methodology for identification and quantification. Food Res. Int. 33, p. 423–447

193
Bull. "POLITEHNICA" Univ. (Timisoara), 53, 67, p. 56-60.
Damir Aličić, Drago Šubarić, Midhat Jašić, Hatidža Pašalić, Đurđica Ačkar, 2014. Antioxidant properties of pollen. Hrana u zdravlju i bolesti, znanstveno-stručni časopis za nutricionizam i dijetetiku, 3, 1, 6-12.
Daoud A., Malika D., Bakari S., Hfaiedh, Mnafgui K., Kadri A., Gharsallah N., 2015. Assessment of polyphenol composition, antioxidant and antimicrobial properties of various extracts of Date Palm Pollen (DPP) from two Tunisian cultivars. Arabian Journal of Chemistry. (in press)
Delfanian M., Kenari R.E., Sahari M.A., 2015. Influence of extraction techniques on antioxidant properties and bioactive compounds of loquat fruit (Eriobotrya japonica Lindl.) skin and ulp extracts. Food Science & Nutrition, 3(3): p. 179–187.
Eva Brglez Mojzer, Maša Knez Hrnčič, Mojca Škerget, Željko Knez, Urban Bren, 2016. Polyphenols: Extraction Methods, Antioxidative Action, Bioavailability and Anticarcinogenic Effects. Molecules, 21, pp. 901.
Ferreres F., Barberan T.A.F., Lorente F.T., Nieto J.L., Rumbero A., Olias J.M., 1989. 8-Methoxykaempferol 3-Sophoroside, a yellow pigment from almond pollen. Phytochemistry, 28,7, p. 1901-1903.
Ferreres F., Tomás-Barberán F.A., Soler C., GarcíaViguera C., Ortiz A., Tomás-Lorente F., 1994. A simple extractive technique for honey flavonoid HPLC analysis. Apidologie 25, p. 21-30.
Fokt H., Pereira A., Ferreira A.M., Cunha A. and Aguiar C., 2010. How do bees prevent hive infections? The antimicrobial properties of propolis. Current Research, Technology and Education Topics in Applied Microbiology and Microbial Biotech., 1, p. 481-493.
Freire K.R.L., Lins A.C.S., Dorea M., Santos F.A.R., Camara C.A., Silva T.M.S., 2012. Palynological Origin, Phenolic Content, and Antioxidant Properties of Honeybee-Collected Pollen from Bahia, Brazil. Molecules, 17, p. 1652-1664.
Gabriele M., Parri E., Felicioli A., Sagona S., Pozzo L., Biondi C., Domenici V., Pucci L., 2015. Phytochemical composition and antioxidant activity of Tuscan bee pollen of different botanic origins. Italian Journal Food Sciences, 27, p. 248-259.
Gabriele M., Parri E., Felicioli A., Sagona S., Pozzo L., Biondi C., Domenici V., Pucci L., 2015. Phytochemical composition and antioxidant activity of Tuscan bee pollen of different botanic origins. Ital. J. Food Sci., 27, p. 248-259.
Gómez-Caravaca A.M., Gómez-Romero M., Arráez-Roman D., Segura-Carretero A., Fernández-Gutiérrez A., 2006. Advances in the analysis of phenolic compounds in products derived from bees. J. of Pharm. and Biomedical Analysis, 41: p. 1220-1234.
Häkkinen S.H, Kärenlampi S.O., Heinonen I.M, Mykkänen H.M, Törrönen A.R., 1998. HPLC method for screening of flavonoids and phenolic acids in berries. J. Sci. Food Agric.; 77, p. 543–551.
Kaur R., Kumar N.R., Harjai K., 2013. Phytochemical analysis of different extracts of bee pollen. International Journal of Pharmaceutical and Biological Research, 4, 3, p. 65-68.
Kim H.P., Son K.H., Chang H.W., Kang S.S., 2004, Anti-inflammatory Plant Flavonoids and Cellular Action Mechanisms, J. Pharmacol Sci., 96, p. 229-245.
Machado S.C., Mokochinski J.B., Onofre de Lira T., Oliveira F.C.E., Cardoso M.V., Ferreira R.G., Sawaya A.C.F.H., Ferreira A.G., Pessoa C., Rubio O.C., Monteiro M.C., Campos M.S., Torres Y.R., 2016. Comparative Study of Chemical Composition and Biological Activity of Yellow, Green, Brown, and Red Brazilian Propolis. Evidence-Based Complementary and Alternative Medicine, 6057650.
Marcucci M.C., 1995. Propolis: chemical composition, biological properties and therapeutic activity. Apidologie, 26: p. 83–99.
Marcucci M.C., Sawaya A.C.H.F., Custodio A.R., Paulino N., Eberlin M.N., 2008. HPLC and ESI-MS typification: New approaches for natural therapy with Brazilian propolis, Scientific Evidence of the Use of Propolis in Ethnomedicine, ISBN: 978-81-7895-357-1, Transworld Research Network, p. 33-54.
Mărgăoan R., Mărghitaş L.Al., Dezmirean D.S., Bobiş O., Tomoş L., Mihai C., Bonta V., 2013. Honeybee-collected Pollen from Transylvania: Palynological Origin, Phenolic Content and Antioxidant Activity. Bulletin UASVM Animal Science and Biotechnologies, 70, (2), p. 311-315.
Margeretha I., Suniarti D.F., Herda E., Mas’ud Z.A., 2012. Optimization and comparative study of different extraction methods of biologically active components of Indonesian propolis Trigona spp. Journal of Natural Products, 5, p. 233-242.
Martos V.M., Navajaz V.Y., Lopez F.J., Alvarez P.J.A., 2008. Functional Properties of Honey, Propolis and Royal Jelly. Journal of Food Science, 73, 9, p. 117-124.
Miguel M.G., Antunes M.D., 2011. Is propolis safe as an alternative medicine? Journal of Farmacy BioAllied Sciences, 3, 4, p. 479-495.
Miguel M.G., Nunes S., Dandlen S.A., Cavaco A.M., Antunes M.D., 2014. Phenols, flavonoids and antioxidant activity of aqueous and methanolic extracts of propolis (Apis mellifera L.) from Algarve, South Portugal. Food Sci. and Techn., 34, 1, p. 16-23.
Miha O., Škerget M., Želijko K., 2013. Application of supercritical fluid extraction for the separation of nutraceuticals and other phitochemicals from plant material. Macedonian Journal of Chemistry and Chemical Engineering, 32, 2, p. 183–226.
Mohdaly A.A.A., Mahmoud A.A., Roby M.H.H., Smetanska I., Ramadan M.F., 2015. Phenolic extract from propolis and bee pollen: composition, antioxidant and antibacterial activities. Journal of Food Biochemistry, 39, 5, p. 538-547.
Montenegro G., Vila G., Rougier D., Timmermann B., 1997. Pollen loads: source of carotenoids
originating from the mediterranean plant communities of the central zone of Chile. Revista Chilena de Historia Natural, 70: p. 91-99.
Münstedt K., Bogdanov S., 2009. Bee products and their potetial use in modern medicine. Journal of ApiProduct and ApiMedical Science, 1 (3): p. 57-63.
Naranjo P.R.D., Sánchez S.J., Paramás G.A.M., Gonzalo R.J.C., 2004. Liquid chromatographic–mass spectrometric analysis of anthocyanin composition of dark blue bee pollen from Echium plantagineum. Journal of Chromatography A, 1054, p. 205–210.
Nunes L.C.C., Galindo A.B., Lustosa S.R., Brasileiro M.T., do Egito A.A., Freitas R.M., Randau K.P., Rolim Neto P.J., 2013. Influence of seasonal variation on antioxidant and total phenol activity of red propolis extracts. Advanced Studies in Biology, 5(3), p. 119-133.
Oman M., Škerget M., Knez Ž., 2013. Application of Supercritical Fluid Extraction for the Separation of Nutraceutical and Other Phytochemicals from Plant Material. Macedonian Journal of Chemistry and Chemical Engineering, 32, 2, p. 183-226.
Owayss A.A., Rady M.M., Gadallah F., 2004. Pigmentation of some honeybee, Apis mellifera L., products. Fayoum J. Agric. Res. & Dev., 18, 2, p. 121- 132.
Popova M., Trusheva B., Antonova D., Cutajar S., Mifsud D., Farrugia C., Tsvetkova I., Najdenski H., Bankova V., 2011. The specific chemical profile of Mediterranean propolis from Malta. Food Chemistry, 126: p. 1431–1435.
Popova M.P., Bankova V., Bogdanov S., Tsvetkova I., Naydenski C., Marcazzan G.L., Sabatini A.G., 2007. Chemical characteristics of poplar type propolis of different geographic origin. Apidologie 38, p. 306-311.
Popravko S.A., 1978. Chemical composition of propolis, its origin and standardization, in: A Remarkable Hive Product: PROPOLIS. Apimondia Publ. House, Bucharest, p. 15–18.
Pujirahayu N., Ritonga H., Uslinawaty Z., 2014. Properties and flavonoids content in propolis of some extraction method of raw propolis, International J. of Pharmacy and Pharmaceutical Sci., 6(6), p. 338-340.
Rebiai A., Lanez T., Belfar M.L., 2014. Determination of caffeic acid and gallic acid in Algerian bee pollen by an HPLC method. PhytoChem & BioSub Journal, 8, 3, p. 190-197.
Righi A.A., Negri G., Salatino A., 2013. Comparative chemistry of propolis from eight brazilian localities. Evidence-Based Complementary and Alternative Medicine, p. 1-14.
Rusak G., 2008. Bioactive constituents of propolis, In Scientific Evidence of the use of propolis in ethnomedicine. Transworld Research Network, Kerala, India, p. 15-31.
Rzepecka-Stojko A., Maciejewska-Paszek I., Stec M., Kurzeja E., Kęska A., Pawłowska-Góral K., 2010. The influence of extraction method on obtaining
polyphenolic compounds from bee pollen. Farm. Prz. Naukowy, 1, p. 38–41.
Sameer S.K., Atul S.R., Sathiyanarayanan L., Lakshmi R., Anant R.P., Kakasaheb R.M., 2014. Investigation of the nutraceutical potential of monofloral Indian mustard bee pollen. Journal of Integrative Medicine, 4, p. 379-389.
Sforcin J.M., 2007. Propolis and immune system review. Journal Ethnopharmacol., 113, 1, p. 1-14.
Soler C., Gil M.I., Viguera G., Barberán T.F., 1995. Flavonoid patterns of French honeys with different floral origin. Apidologie, 26, p. 53-60.
Stojko A.R., Stojko J., Górecka A.K., Górecki M., Dzik A.K., Kubina R., Moździerz A., Buszman E., 2015. Polyphenols from Bee Pollen: Structure, Absorption, Metabolism and Biological Activity. Molecules, 20, p. 21732–21749.
Stojko A.R., Stojko J., Gόreka A.K., Gόrecki M., Dzik K.A., Kubina R., Mozdzierz A., Buszman E., 2015. Polyphenols from Bee Pollen: Structure, Absorption. Metabolism and Biological Activity, Molecules, 20, p. 21732–21749.
Szliszka E., Sokól-Letowska A., Kucharska A.Z., Jaworska D., Czuba Z.P., Król W., 2013. Ethanolic Extract of Polish Propolis: Chemical composition and TRAIL-R2 death receptor targeting apoptotic activity against prostate cancer cells. Evidence-Based Complementary and Alternative Medicine, pp. 12.
Trusheva B., Popova M., Koendhori E.B., Tsvetkova I., Naydenski C., Bankova V., 2011. Indonesian propolis: chemical composition, biological activity and botanical origin. Natural Product Research: Formerly Natural Product Letters, 25: p. 606–13.
Trusheva B., Trunkova D., Bankova V., 2007. Different extraction methods of biologically active components from propolis: preliminary study. Chemistry Central Journal, 7, p. 1-13.
Ulusoy E., Kolayli S., 2014. Phenolic composition and antioxidant properties of Anzer bee pollen. Journal of Food Biochemistry, 38, p. 73–82.
Vassev K.K., Olczyk P., Kazmierczak J., Mencner L., Olczyk K., 2015. Bee Pollen: Chemical Composition and Therapeutic Application. Hindawi Publishing Corporation, Evidence-Based Complementary and Alternative Medicine, p. 297-425.
Webby R., Bloor S., 2000. Pigments in the Blue Pollen and Bee Pollen of Fuchsia excorticate. Z. Naturforschung, 55c, p. 503-505.
Woisky R.G., Salatino A., 1998. Analysis of propolis: some parameters and procedures for chemical quality control. Journal of Apicultural Research, 37(2): p. 99- 105.
Woisky R.G., Salatino A., 1998. Analysis of propolis: some parameters and procedures for chemical quality control. Journal of Apicultural Research, 37(2): p. 99- 105.
Wollgast J., Anklam E., 2000. Review on polyphenols in Theobroma cacao: changes in composition during the manufacture of chocolate and methodology for identification and quantification. Food Res. Int. 33, p. 423–447

194
Yang L., Yan Q.H., Ma J.Y., Wang Q., Zhang J.W., G.X. Xi, 2013. High Performance Liquid Chromatographic determination of phenolic compounds in propolis. Tropical J. of Pharm. Research, 12 (5): p. 771-776.
Yen T.K., Min J.L., Chinshun C., 2011. Preliminary Analyses of Phenolic Compounds and Antioxidant
Activities in Tea Pollen Extracts. Journal of Food and Drug Analysis, 19, 4, p. 470-477.
Zhou J., Qi Y., Ritho J., Zhang Y., Zheng X., Wu L., Li Y., Sun L., 2015. Flavonoid glycosides as floral origin markers to discriminate of unifloral bee pollen by LC-MS/MS. Food Control, 57, p. 54-61.
RESIDUAL EFFECTS OF FERTILIZATION WITH SEWAGE SLUDGE
COMPOST ON CROPLAND
Veronica TĂNASE, Nicoleta VRÎNCEANU, Mihaela PREDA, Dumitru Marian MOTELICA
National Research and Development Institute for Soil Science, Agrochemistry and Environment, 61 Blvd. Mărăşti, 011464, Bucharest, Romania,
Phone: +40 - 021.318.43.49, Fax: +40 - 021.318.43.48, Emails: [email protected], [email protected], [email protected],
Corresponding author email: [email protected] Abstract
Composting municipal sludge is an ecological and economic efficient technology to exploit such residual organic products in order to increase agricultural yields and soil fertility. This study aimed to determine the improve of some chemical characteristics of soil after fertilization with composted sewage sludge associated or not with mineral fertilization after two years of application and the yields recorded after the first two years of treatment. The experimental field was organized using subdivided parcels method, studying two gradients: organic and mineral fertilization. Before application on land as organic fertilizer, chemical characteristics of compost were analyzed in laboratory. Also it was made a characterization of soil from experimental field before and after compost fertilization. In the first year of experimentation the highest soybean yield were recorded in variants with maximum dose of mineral fertilizer. The highest maize yield was obtained in the most intensive fertilization treatment of our experiment which consist of doses of compost equivalent to a nitrogen rate of 400 kg/ ha and mineral fertilization (N100P100). In the second year of experimentation we recorded significant increase yields at oat crops in variants with fertilization in maximum doses. Related to soybean crops, in this second year, the values of yields were increased only in organic or mineral fertilization, but not in association of them. Fertilizing with sewage sludge does not replace the chemical fertilization, but is used in association with it in order to satisfy the necessity of crops for the nutrients. Key words: fertilization, sewage sludge, yields. INTRODUCTION As a result of growing population correlated with developing industry, there are some aspects which lately are taken into consideration. One of them is related to the increasing necessity of food supply and the other is the disposal of sewage sludge in order to minimize the environmental impacts. (Praspaliauskas and Pedišius, 2017). According to the report by Mininni et al. (2015), the current production of sewage sludge in the 15 member states is estimated in about 25 kg/(P.E. x year) i.e. 68 g/(P.E. x d). In many countries from Europe (Belgium, Netherlands, Switzerland) the incineration of sewage sludge is a predominant practice for sludge disposal and the agricultural use of ash is rarely practiced (Mininni et al., 2015). The use of sludge in agriculture is an old, preferred alternative when it comes to disposal
of these urban organic residues in some countries like France, Spain and UK (Leonard et al., 2007). In our country, just like in Greece and Malta, landfilling is still considered a solution for sludge disposal, the soil is considered in this case as a final purification step, being not only capable to offer a treatment for sludge but also to recycle nutrients for different crops (Mininni et al., 2015). Composting is a way of processing municipal sludge in order to obtain a material sanitized and stabilized with value as bio-fertilizer for soil. Sludge and compost made from it, have a significant content of nitrogen, phosphorus and organic matter and can be an important source of nutrients for different types of crops. In this context, the paper aimed to present the effect of different rates of sewage sludge compost associated or not with mineral fertilization on soil fertility and crop yields after two years of experimentation.
195
Yang L., Yan Q.H., Ma J.Y., Wang Q., Zhang J.W., G.X. Xi, 2013. High Performance Liquid Chromatographic determination of phenolic compounds in propolis. Tropical J. of Pharm. Research, 12 (5): p. 771-776.
Yen T.K., Min J.L., Chinshun C., 2011. Preliminary Analyses of Phenolic Compounds and Antioxidant
Activities in Tea Pollen Extracts. Journal of Food and Drug Analysis, 19, 4, p. 470-477.
Zhou J., Qi Y., Ritho J., Zhang Y., Zheng X., Wu L., Li Y., Sun L., 2015. Flavonoid glycosides as floral origin markers to discriminate of unifloral bee pollen by LC-MS/MS. Food Control, 57, p. 54-61.
AgroLife Scientific Journal - Volume 6, Number 2, 2017ISSN 2285-5718; ISSN CD-ROM 2285-5726; ISSN ONLINE 2286-0126; ISSN-L 2285-5718
RESIDUAL EFFECTS OF FERTILIZATION WITH SEWAGE SLUDGE
COMPOST ON CROPLAND
Veronica TĂNASE, Nicoleta VRÎNCEANU, Mihaela PREDA, Dumitru Marian MOTELICA
National Research and Development Institute for Soil Science, Agrochemistry and Environment, 61 Blvd. Mărăşti, 011464, Bucharest, Romania,
Phone: +40 - 021.318.43.49, Fax: +40 - 021.318.43.48, Emails: [email protected], [email protected], [email protected],
Corresponding author email: [email protected] Abstract
Composting municipal sludge is an ecological and economic efficient technology to exploit such residual organic products in order to increase agricultural yields and soil fertility. This study aimed to determine the improve of some chemical characteristics of soil after fertilization with composted sewage sludge associated or not with mineral fertilization after two years of application and the yields recorded after the first two years of treatment. The experimental field was organized using subdivided parcels method, studying two gradients: organic and mineral fertilization. Before application on land as organic fertilizer, chemical characteristics of compost were analyzed in laboratory. Also it was made a characterization of soil from experimental field before and after compost fertilization. In the first year of experimentation the highest soybean yield were recorded in variants with maximum dose of mineral fertilizer. The highest maize yield was obtained in the most intensive fertilization treatment of our experiment which consist of doses of compost equivalent to a nitrogen rate of 400 kg/ ha and mineral fertilization (N100P100). In the second year of experimentation we recorded significant increase yields at oat crops in variants with fertilization in maximum doses. Related to soybean crops, in this second year, the values of yields were increased only in organic or mineral fertilization, but not in association of them. Fertilizing with sewage sludge does not replace the chemical fertilization, but is used in association with it in order to satisfy the necessity of crops for the nutrients. Key words: fertilization, sewage sludge, yields. INTRODUCTION As a result of growing population correlated with developing industry, there are some aspects which lately are taken into consideration. One of them is related to the increasing necessity of food supply and the other is the disposal of sewage sludge in order to minimize the environmental impacts. (Praspaliauskas and Pedišius, 2017). According to the report by Mininni et al. (2015), the current production of sewage sludge in the 15 member states is estimated in about 25 kg/(P.E. x year) i.e. 68 g/(P.E. x d). In many countries from Europe (Belgium, Netherlands, Switzerland) the incineration of sewage sludge is a predominant practice for sludge disposal and the agricultural use of ash is rarely practiced (Mininni et al., 2015). The use of sludge in agriculture is an old, preferred alternative when it comes to disposal
of these urban organic residues in some countries like France, Spain and UK (Leonard et al., 2007). In our country, just like in Greece and Malta, landfilling is still considered a solution for sludge disposal, the soil is considered in this case as a final purification step, being not only capable to offer a treatment for sludge but also to recycle nutrients for different crops (Mininni et al., 2015). Composting is a way of processing municipal sludge in order to obtain a material sanitized and stabilized with value as bio-fertilizer for soil. Sludge and compost made from it, have a significant content of nitrogen, phosphorus and organic matter and can be an important source of nutrients for different types of crops. In this context, the paper aimed to present the effect of different rates of sewage sludge compost associated or not with mineral fertilization on soil fertility and crop yields after two years of experimentation.
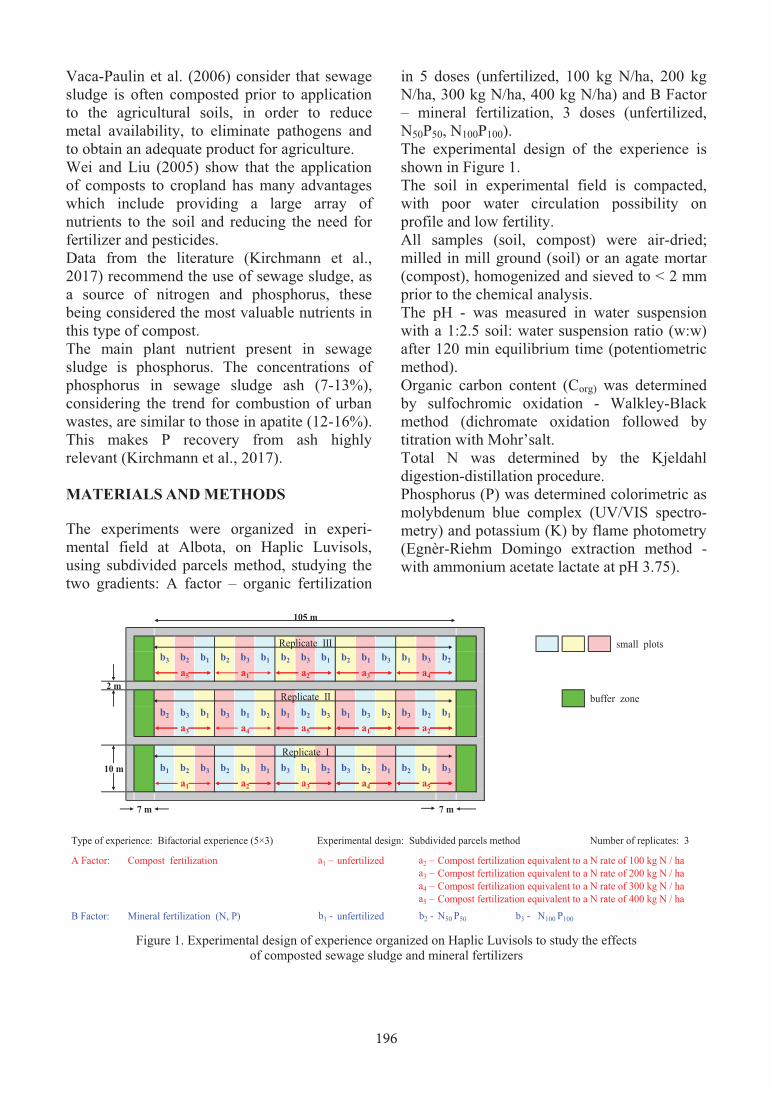
196
Vaca-Paulin et al. (2006) consider that sewage sludge is often composted prior to application to the agricultural soils, in order to reduce metal availability, to eliminate pathogens and to obtain an adequate product for agriculture. Wei and Liu (2005) show that the application of composts to cropland has many advantages which include providing a large array of nutrients to the soil and reducing the need for fertilizer and pesticides. Data from the literature (Kirchmann et al., 2017) recommend the use of sewage sludge, as a source of nitrogen and phosphorus, these being considered the most valuable nutrients in this type of compost. The main plant nutrient present in sewage sludge is phosphorus. The concentrations of phosphorus in sewage sludge ash (7-13%), considering the trend for combustion of urban wastes, are similar to those in apatite (12-16%). This makes P recovery from ash highly relevant (Kirchmann et al., 2017). MATERIALS AND METHODS The experiments were organized in experi-mental field at Albota, on Haplic Luvisols, using subdivided parcels method, studying the two gradients: A factor – organic fertilization
in 5 doses (unfertilized, 100 kg N/ha, 200 kg N/ha, 300 kg N/ha, 400 kg N/ha) and B Factor – mineral fertilization, 3 doses (unfertilized, N50P50, N100P100). The experimental design of the experience is shown in Figure 1. The soil in experimental field is compacted, with poor water circulation possibility on profile and low fertility. All samples (soil, compost) were air-dried; milled in mill ground (soil) or an agate mortar (compost), homogenized and sieved to < 2 mm prior to the chemical analysis. The pH - was measured in water suspension with a 1:2.5 soil: water suspension ratio (w:w) after 120 min equilibrium time (potentiometric method). Organic carbon content (Corg) was determined by sulfochromic oxidation - Walkley-Black method (dichromate oxidation followed by titration with Mohr’salt. Total N was determined by the Kjeldahl digestion-distillation procedure. Phosphorus (P) was determined colorimetric as molybdenum blue complex (UV/VIS spectro-metry) and potassium (K) by flame photometry (Egnèr-Riehm Domingo extraction method - with ammonium acetate lactate at pH 3.75).
Replicate III small plotsb3 b2 b1 b2 b3 b1 b2 b3 b1 b2 b1 b3 b1 b3 b2
a5 a1 a2 a3 a42 m
Replicate II buffer zoneb2 b3 b1 b3 b1 b2 b1 b2 b3 b1 b3 b2 b3 b2 b1
a3 a4 a5 a1 a2
Replicate I10 m b1 b2 b3 b2 b3 b1 b3 b1 b2 b3 b2 b1 b2 b1 b3
a1 a2 a3 a4 a5
7 m 7 m
Type of experience: Bifactorial experience (5×3) Experimental design: Subdivided parcels method Number of replicates: 3
A Factor: Compost fertilization a1 – unfertilized a2 – Compost fertilization equivalent to a N rate of 100 kg N / haa3 – Compost fertilization equivalent to a N rate of 200 kg N / haa4 – Compost fertilization equivalent to a N rate of 300 kg N / haa5 – Compost fertilization equivalent to a N rate of 400 kg N / ha
B Factor: Mineral fertilization (N, P) b1 - unfertilized b2 - N50 P50 b3 - N100 P100
105 m
Figure 1. Experimental design of experience organized on Haplic Luvisols to study the effects of composted sewage sludge and mineral fertilizers
Soil test data for the experimental site prior to fertilization are presented in (Table 1).
Table 1. Chemical characteristics of the soil in the experimental field (dry weight)
Depth (cm) pH Corg
(%) Nt (%)
P (mg/kg)
K (mg/kg)
0-27 4.67 1.57 0.10 48 57 37-36 5.59 0.76 0.07 5 67 36-44 5.37 0.49 - 4 73
For composting, sewage sludge was mixed with wheat straw or chopped stalks of peas or soybean (size of 2-5 cm) for better aeration of composting heap (of approximately 6x3x2 m3 volume). Compost was obtained through a process of thermophilic digestion and microbial synthesis of organic substances from waste products. It was added selected microbial cultures to rise rapidly the temperatures over 60°C in order to kill pathogens from their vegetative stage. Total heavy metals content in compost samples were measured by flame atomic absorption spectrometry (AAS) after extraction by the aqua regia - microwave digestion method. Microwave digestion was performed using 10 mL of aqua regia (7.5 mL HCl and 2.5 mL HNO3) at 140°C for 30 min. The general properties of compost are shown in Table 2.
Table 2. Properties of compost*(dry weight)
Min Max Mean
pH 7.05 7.08 7.07
Corg (%) 16.77 19.55 18.38
Nt (%) 2.07 2.4 2.24
P (%) 1.25 1.34 1.29
K (%) 0.25 0.35 0.30
Cu (mg/kg) 129 131 130
Zn (mg/kg) 1355 1381 1367
Pb (mg/kg) 76 87 80
Ni (mg/kg) 24 31 27
Mn (mg/kg) 339 350 345 Cd (mg/kg) 3.9 4.4 4.2
*the number of test samples for compost was 10
For mineral fertilization it was used urea as a source of nitrogen (46% N) and concentrated
triple superphosphate as a source of phosphorus (45% P2O5). Test crops were soybean (Atlas variety), maize (Turda 200 hybrid) and oat (Someşean variety). Processing of experimental data was performed using analysis of variance and Tukey test. RESULTS AND DISCUSSIONS Data from Table 2 show that considering the heavy metals content in compost or their availability for crops, none of the metals analyzed had values above the permissible limits, according to Order 344/ 2004 (for the approval of the Technical Norms on environmental protection and especially of soils, when using sewage sludge in agriculture). It can be appreciated that there are no restrictions in using this sewage sludge compost on cropland, its elemental composition recommend its application on soils with low content of microelements. On the other hand, the high pH values of compost, usually lower the bioavailability of heavy metals and, consequently, their uptake by plant roots (Gattullo et al., 2017). In our case, the fertilization with compost led to decreasing soil acidification because the treatment of sludge was made with lime (Table 3). The same situation was noticed in Pennsylvania, where the use of biosolids it has been a practice since mid -1970s. The study was carried out on 20 farms and it was noticed that the pH increased by an average 0.2 pH on soils that received biosolids. The reasons of this increasing was attributed to the treatment plant of sewage sludge and to regulations which require soil pH to be at least 6.0 when biosolids are applied (http//extension.psu.edu/effects-of biosolids-on soil-and-crop-quality). Sewage sludge composted can be a good source of nutrient for plant depends on their origin, the characteristics of the compost and the environmental regulations of the area where these will be applied. Kominko et al. (2017) noticed that many researchers reported positive effects of using sewage sludge in agriculture by improving the physicochemical properties of soil. This observation is consistent with Singh and Agrawal (2011) and Mi et al. (2016), quoted by
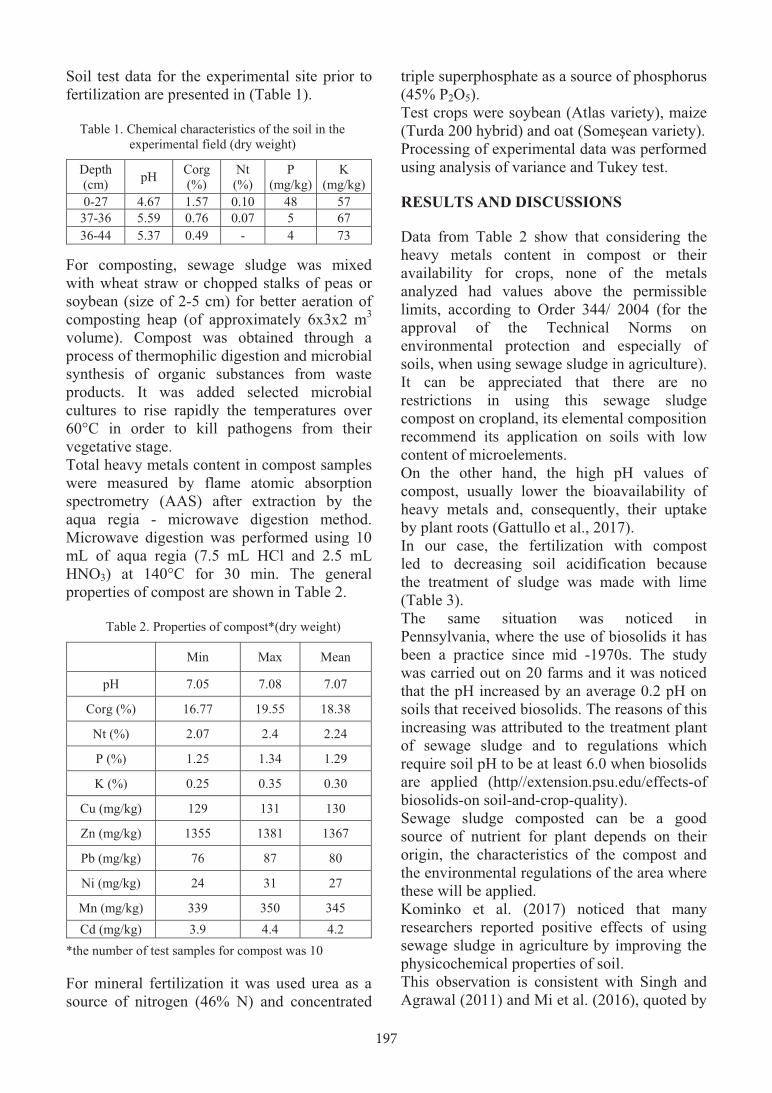
197
Vaca-Paulin et al. (2006) consider that sewage sludge is often composted prior to application to the agricultural soils, in order to reduce metal availability, to eliminate pathogens and to obtain an adequate product for agriculture. Wei and Liu (2005) show that the application of composts to cropland has many advantages which include providing a large array of nutrients to the soil and reducing the need for fertilizer and pesticides. Data from the literature (Kirchmann et al., 2017) recommend the use of sewage sludge, as a source of nitrogen and phosphorus, these being considered the most valuable nutrients in this type of compost. The main plant nutrient present in sewage sludge is phosphorus. The concentrations of phosphorus in sewage sludge ash (7-13%), considering the trend for combustion of urban wastes, are similar to those in apatite (12-16%). This makes P recovery from ash highly relevant (Kirchmann et al., 2017). MATERIALS AND METHODS The experiments were organized in experi-mental field at Albota, on Haplic Luvisols, using subdivided parcels method, studying the two gradients: A factor – organic fertilization
in 5 doses (unfertilized, 100 kg N/ha, 200 kg N/ha, 300 kg N/ha, 400 kg N/ha) and B Factor – mineral fertilization, 3 doses (unfertilized, N50P50, N100P100). The experimental design of the experience is shown in Figure 1. The soil in experimental field is compacted, with poor water circulation possibility on profile and low fertility. All samples (soil, compost) were air-dried; milled in mill ground (soil) or an agate mortar (compost), homogenized and sieved to < 2 mm prior to the chemical analysis. The pH - was measured in water suspension with a 1:2.5 soil: water suspension ratio (w:w) after 120 min equilibrium time (potentiometric method). Organic carbon content (Corg) was determined by sulfochromic oxidation - Walkley-Black method (dichromate oxidation followed by titration with Mohr’salt. Total N was determined by the Kjeldahl digestion-distillation procedure. Phosphorus (P) was determined colorimetric as molybdenum blue complex (UV/VIS spectro-metry) and potassium (K) by flame photometry (Egnèr-Riehm Domingo extraction method - with ammonium acetate lactate at pH 3.75).
Replicate III small plotsb3 b2 b1 b2 b3 b1 b2 b3 b1 b2 b1 b3 b1 b3 b2
a5 a1 a2 a3 a42 m
Replicate II buffer zoneb2 b3 b1 b3 b1 b2 b1 b2 b3 b1 b3 b2 b3 b2 b1
a3 a4 a5 a1 a2
Replicate I10 m b1 b2 b3 b2 b3 b1 b3 b1 b2 b3 b2 b1 b2 b1 b3
a1 a2 a3 a4 a5
7 m 7 m
Type of experience: Bifactorial experience (5×3) Experimental design: Subdivided parcels method Number of replicates: 3
A Factor: Compost fertilization a1 – unfertilized a2 – Compost fertilization equivalent to a N rate of 100 kg N / haa3 – Compost fertilization equivalent to a N rate of 200 kg N / haa4 – Compost fertilization equivalent to a N rate of 300 kg N / haa5 – Compost fertilization equivalent to a N rate of 400 kg N / ha
B Factor: Mineral fertilization (N, P) b1 - unfertilized b2 - N50 P50 b3 - N100 P100
105 m
Figure 1. Experimental design of experience organized on Haplic Luvisols to study the effects of composted sewage sludge and mineral fertilizers
Soil test data for the experimental site prior to fertilization are presented in (Table 1).
Table 1. Chemical characteristics of the soil in the experimental field (dry weight)
Depth (cm) pH Corg
(%) Nt (%)
P (mg/kg)
K (mg/kg)
0-27 4.67 1.57 0.10 48 57 37-36 5.59 0.76 0.07 5 67 36-44 5.37 0.49 - 4 73
For composting, sewage sludge was mixed with wheat straw or chopped stalks of peas or soybean (size of 2-5 cm) for better aeration of composting heap (of approximately 6x3x2 m3 volume). Compost was obtained through a process of thermophilic digestion and microbial synthesis of organic substances from waste products. It was added selected microbial cultures to rise rapidly the temperatures over 60°C in order to kill pathogens from their vegetative stage. Total heavy metals content in compost samples were measured by flame atomic absorption spectrometry (AAS) after extraction by the aqua regia - microwave digestion method. Microwave digestion was performed using 10 mL of aqua regia (7.5 mL HCl and 2.5 mL HNO3) at 140°C for 30 min. The general properties of compost are shown in Table 2.
Table 2. Properties of compost*(dry weight)
Min Max Mean
pH 7.05 7.08 7.07
Corg (%) 16.77 19.55 18.38
Nt (%) 2.07 2.4 2.24
P (%) 1.25 1.34 1.29
K (%) 0.25 0.35 0.30
Cu (mg/kg) 129 131 130
Zn (mg/kg) 1355 1381 1367
Pb (mg/kg) 76 87 80
Ni (mg/kg) 24 31 27
Mn (mg/kg) 339 350 345 Cd (mg/kg) 3.9 4.4 4.2
*the number of test samples for compost was 10
For mineral fertilization it was used urea as a source of nitrogen (46% N) and concentrated
triple superphosphate as a source of phosphorus (45% P2O5). Test crops were soybean (Atlas variety), maize (Turda 200 hybrid) and oat (Someşean variety). Processing of experimental data was performed using analysis of variance and Tukey test. RESULTS AND DISCUSSIONS Data from Table 2 show that considering the heavy metals content in compost or their availability for crops, none of the metals analyzed had values above the permissible limits, according to Order 344/ 2004 (for the approval of the Technical Norms on environmental protection and especially of soils, when using sewage sludge in agriculture). It can be appreciated that there are no restrictions in using this sewage sludge compost on cropland, its elemental composition recommend its application on soils with low content of microelements. On the other hand, the high pH values of compost, usually lower the bioavailability of heavy metals and, consequently, their uptake by plant roots (Gattullo et al., 2017). In our case, the fertilization with compost led to decreasing soil acidification because the treatment of sludge was made with lime (Table 3). The same situation was noticed in Pennsylvania, where the use of biosolids it has been a practice since mid -1970s. The study was carried out on 20 farms and it was noticed that the pH increased by an average 0.2 pH on soils that received biosolids. The reasons of this increasing was attributed to the treatment plant of sewage sludge and to regulations which require soil pH to be at least 6.0 when biosolids are applied (http//extension.psu.edu/effects-of biosolids-on soil-and-crop-quality). Sewage sludge composted can be a good source of nutrient for plant depends on their origin, the characteristics of the compost and the environmental regulations of the area where these will be applied. Kominko et al. (2017) noticed that many researchers reported positive effects of using sewage sludge in agriculture by improving the physicochemical properties of soil. This observation is consistent with Singh and Agrawal (2011) and Mi et al. (2016), quoted by

198
Khaliq (2017) that the organic fertilization led to increasing values of organic carbon in soil compared with mineral fertilization with NPK. Consequently, carbon content in the soil would be expected to increase as a result of organic fertilization but, in our experiment, the content of organic carbon in soil has not changed
statistic significantly after treatments applied, because of clay soil texture and short time of experimentation (Table 4). Kominko et al. (2017) also reported that meteorological factors and the type of soil have a significant influence of nitrogen uptake.
Table 3. Effects of organic, mineral and mixed fertilization on pH values in soil
Mineral fertilization Compost fertilization Mean value
Unfertilized Compost fertilization equivalent to a N rate of: mineral
with compost 100 kg/ha 200 kg/ha 300 kg/ha 400 kg/ha fertilization
Unfertilized 5.01 5.14 5.14 5.51 6.09 5.38 A(1)
N50 P50 4.74 5.07 5.07 6.07 6.06 5.40 A
N100 P100 4.69 4.91 4.92 6.26 6.48 5.45 A
Mean value compost fertilization 4.81 W(2) 5.04 W 5.04 W 5.95 X 6.21 X
(1) or (2) - Values followed by the same letter (A, B, C or W, X, Y) are not significantly different at the p=0.05
Table 4. Effects of organic, mineral and mixed fertilization on organic carbon content in soil
Mineral fertilization Compost fertilization Mean value
Unfertilized Compost fertilization equivalent to a N rate of: mineral
with compost 100 kg/ha 200 kg/ha 300 kg/ha 400 kg/ha fertilization
------------------------------------------------ % ----------------------------------------------
Unfertilized 1.57 1.67 1.56 1.79 1.59 1.64 A(1)
N50 P50 1.63 1.62 1.67 1.51 1.61 1.61 A
N100 P100 1.54 1.61 1.63 1.62 1.58 1.60 A
Mean value compost fertilization 1.58 W(2) 1.63 W 1.62 W 1.64 W 1.59 W
(1) or (2) - Values followed by the same letter (A, B, C or W, X, Y) are not significantly different at the p=0.05
The same (with organic carbon content in soil samples after fertilization) was the behavior of total nitrogen soil content, which has not changed statistic significantly, also (Table 5). Kahliq et al. (2017) showed that the statistical analyses of TN% (total nitrogen) in soil sample among all treatments (Kala compost- commercial name of the organic fertilizer produced from municipal sewage treated wastewater and mineral fertilizers with three elements - NPK) was not significant.
Vieira R. et al. (2014) emphasized that the dynamics of nitrogen applied with the sludge is complex and demands studies in the sense of evaluating the amount of sludge to be applied to the soil and the frequency of application. Beside nitrogen, utilization of sewage sludge in agriculture has a major interest due to phosphorus and potassium supply. Zaman et al. (2002) quoted by Mtshali et al. (2014) consider that treated sewage sludge can enrich soil with macronutrients such as
phosphorus and potassium. Nyamangara and Mzezewa (2001) quoted by Mtshali J. (2014) reported that phosphorus increase was
observed from control plot where phosphorus content in soil was about 2-4 mg/kg to 29-114 mg/kg of phosphorus in sludge amended soil.
Table 5. Effects of organic, mineral and mixed fertilization, on total nitrogen content in soil
Mineral fertilization Compost fertilization Mean value
Unfertilized Compost fertilization equivalent to a N rate of: mineral
with compost 100 kg/ha 200 kg/ha 300 kg/ha 400 kg/ha fertilization
------------------------------------------------ % ---------------------------------------------------
Unfertilized 0.146 0.160 0.151 0.164 0.161 0.156 A(1)
N50 P50 0.153 0.156 0.170 0.143 0.157 0.156 A
N100 P100 0.147 0.151 0.158 0.153 0.161 0.154 A
Mean value compost fertilization 0.149 W(2) 0.156 W 0.160 W 0.153 W 0.160 W
(1) or (2) - Values followed by the same letter (A, B, C or W, X, Y) are not significantly different at the p=0.05 level
In our experiment the organic fertilization with the highest dose of compost equivalent to 400 kg N/ha led to statistically significant increases of mobile phosphorus content in soil. Also, we recorded increases of mobile phosphorus content in soil at doses of compost equivalent to 100, 200 and 300 kg N/ha, but these are not statistically significant (Table 6). Similar results was obtained from experimental field in Pennsylvania and the reason could be the fact
that biosolids phosphorus is held strongly in soil and it is necessary repeatedly applications of biosolids over several years for increasing soil test levels (http//extension.psu.edu/effects-of biosolids-on soil-and-crop-quality). He et al. (2001), quoted by Diacono and Montemurro (2009), reported that the biosolids-municipal solid waste co-compost applied, once at 4 years, has also been found to effectively supply P to soil at 0-15 cm depth.
Table 6. Effects of organic, mineral and mixed fertilization on mobile phosphorus content in soil
Mineral fertilization Compost fertilization Mean value
Unfertilized Compost fertilization equivalent to a N rate of: mineral
with compost 100 kg/ha 200 kg/ha 300 kg/ha 400 kg/ha fertilization
---------------------------------------------- mg / kg -----------------------------------------------
Unfertilized 33 37 41 42 48 40 A(1)
N50 P50 43 42 43 45 50 45 A
N100 P100 35 38 39 50 49 42 A
Mean value compost fertilization 37 W(2) 39 WX 41 WX 46 WX 49 X
(1) or (2) - Values followed by the same letter (A, B, C or W, X, Y) are not significantly different at the p=0.05 level
Concerning potassium, as a water-soluble nutrient, the concentrations in sewage sludge are lower than in other organic amendments
(such as manures) (Kirchmann et al., 2017). On the other hand, in our experiment (Table 7), the lack of potassium from mineral fertilizer recipe

199
Khaliq (2017) that the organic fertilization led to increasing values of organic carbon in soil compared with mineral fertilization with NPK. Consequently, carbon content in the soil would be expected to increase as a result of organic fertilization but, in our experiment, the content of organic carbon in soil has not changed
statistic significantly after treatments applied, because of clay soil texture and short time of experimentation (Table 4). Kominko et al. (2017) also reported that meteorological factors and the type of soil have a significant influence of nitrogen uptake.
Table 3. Effects of organic, mineral and mixed fertilization on pH values in soil
Mineral fertilization Compost fertilization Mean value
Unfertilized Compost fertilization equivalent to a N rate of: mineral
with compost 100 kg/ha 200 kg/ha 300 kg/ha 400 kg/ha fertilization
Unfertilized 5.01 5.14 5.14 5.51 6.09 5.38 A(1)
N50 P50 4.74 5.07 5.07 6.07 6.06 5.40 A
N100 P100 4.69 4.91 4.92 6.26 6.48 5.45 A
Mean value compost fertilization 4.81 W(2) 5.04 W 5.04 W 5.95 X 6.21 X
(1) or (2) - Values followed by the same letter (A, B, C or W, X, Y) are not significantly different at the p=0.05
Table 4. Effects of organic, mineral and mixed fertilization on organic carbon content in soil
Mineral fertilization Compost fertilization Mean value
Unfertilized Compost fertilization equivalent to a N rate of: mineral
with compost 100 kg/ha 200 kg/ha 300 kg/ha 400 kg/ha fertilization
------------------------------------------------ % ----------------------------------------------
Unfertilized 1.57 1.67 1.56 1.79 1.59 1.64 A(1)
N50 P50 1.63 1.62 1.67 1.51 1.61 1.61 A
N100 P100 1.54 1.61 1.63 1.62 1.58 1.60 A
Mean value compost fertilization 1.58 W(2) 1.63 W 1.62 W 1.64 W 1.59 W
(1) or (2) - Values followed by the same letter (A, B, C or W, X, Y) are not significantly different at the p=0.05
The same (with organic carbon content in soil samples after fertilization) was the behavior of total nitrogen soil content, which has not changed statistic significantly, also (Table 5). Kahliq et al. (2017) showed that the statistical analyses of TN% (total nitrogen) in soil sample among all treatments (Kala compost- commercial name of the organic fertilizer produced from municipal sewage treated wastewater and mineral fertilizers with three elements - NPK) was not significant.
Vieira R. et al. (2014) emphasized that the dynamics of nitrogen applied with the sludge is complex and demands studies in the sense of evaluating the amount of sludge to be applied to the soil and the frequency of application. Beside nitrogen, utilization of sewage sludge in agriculture has a major interest due to phosphorus and potassium supply. Zaman et al. (2002) quoted by Mtshali et al. (2014) consider that treated sewage sludge can enrich soil with macronutrients such as
phosphorus and potassium. Nyamangara and Mzezewa (2001) quoted by Mtshali J. (2014) reported that phosphorus increase was
observed from control plot where phosphorus content in soil was about 2-4 mg/kg to 29-114 mg/kg of phosphorus in sludge amended soil.
Table 5. Effects of organic, mineral and mixed fertilization, on total nitrogen content in soil
Mineral fertilization Compost fertilization Mean value
Unfertilized Compost fertilization equivalent to a N rate of: mineral
with compost 100 kg/ha 200 kg/ha 300 kg/ha 400 kg/ha fertilization
------------------------------------------------ % ---------------------------------------------------
Unfertilized 0.146 0.160 0.151 0.164 0.161 0.156 A(1)
N50 P50 0.153 0.156 0.170 0.143 0.157 0.156 A
N100 P100 0.147 0.151 0.158 0.153 0.161 0.154 A
Mean value compost fertilization 0.149 W(2) 0.156 W 0.160 W 0.153 W 0.160 W
(1) or (2) - Values followed by the same letter (A, B, C or W, X, Y) are not significantly different at the p=0.05 level
In our experiment the organic fertilization with the highest dose of compost equivalent to 400 kg N/ha led to statistically significant increases of mobile phosphorus content in soil. Also, we recorded increases of mobile phosphorus content in soil at doses of compost equivalent to 100, 200 and 300 kg N/ha, but these are not statistically significant (Table 6). Similar results was obtained from experimental field in Pennsylvania and the reason could be the fact
that biosolids phosphorus is held strongly in soil and it is necessary repeatedly applications of biosolids over several years for increasing soil test levels (http//extension.psu.edu/effects-of biosolids-on soil-and-crop-quality). He et al. (2001), quoted by Diacono and Montemurro (2009), reported that the biosolids-municipal solid waste co-compost applied, once at 4 years, has also been found to effectively supply P to soil at 0-15 cm depth.
Table 6. Effects of organic, mineral and mixed fertilization on mobile phosphorus content in soil
Mineral fertilization Compost fertilization Mean value
Unfertilized Compost fertilization equivalent to a N rate of: mineral
with compost 100 kg/ha 200 kg/ha 300 kg/ha 400 kg/ha fertilization
---------------------------------------------- mg / kg -----------------------------------------------
Unfertilized 33 37 41 42 48 40 A(1)
N50 P50 43 42 43 45 50 45 A
N100 P100 35 38 39 50 49 42 A
Mean value compost fertilization 37 W(2) 39 WX 41 WX 46 WX 49 X
(1) or (2) - Values followed by the same letter (A, B, C or W, X, Y) are not significantly different at the p=0.05 level
Concerning potassium, as a water-soluble nutrient, the concentrations in sewage sludge are lower than in other organic amendments
(such as manures) (Kirchmann et al., 2017). On the other hand, in our experiment (Table 7), the lack of potassium from mineral fertilizer recipe

200
explains the absence of significantly changes of the mobile potassium content in the soil. Consequently, compared with the check (unfertilized variant), the content of mobile potassium in soil did not change significantly after compost application or mineral fertilization. The average values of potassium content in soil ranged between 85 mg/kg - 94 mg/kg. Generally, the data from literature demon-strated that organic amendments long-term applications enhanced soil available potassium, extractable phosphorus and organic carbon content (Diacono and Montemurro, 2009). The use of biosolids on Pennsylvania cropland, in a three year research project, showed even lower soil test potassium level in biosolid fields than they were in control fields. It was considered that the amount of potassium added by biosolid it was not sufficient to fulfill the crop necessity. Alternative source of potassium should be considered (chemical fertilizer or manure) to maintain optimum potassium soil
test levels (http//extension.psu.edu/effects-of biosolids-on soil-and-crop-quality). The use of quality compost is a sure way of restoring organic matter to the soil, mitigation of acute tendency of decreasing soil nutrient reserves and a way to increase the crops quality. Evaluating the quality compost is done not only by laboratory tests, but also in experimental field. Because the sewage sludge compost used in our experimental field contain low levels of nutrients compared with mineral fertilizer and it is known that the low mineralization rates did not satisfy the requirements of a crop, we studied the combined effects of applying compost and mineral fertilizers (N-P). On the other hand, by applying compost it is expected to increase recovery ratios of nutrients from mineral fertilizers. We tried to obtain economic efficiency of using compost by careful choice of crop rotation and monitoring of the environment.
Table 7. Effects of organic, mineral and mixed fertilization on mobile potassium content in soil
Mineral fertilization Compost fertilization Mean value
Unfertilized Compost fertilization equivalent to a N rate of: mineral
with compost 100 kg/ha 200 kg/ha 300 kg/ha 400 kg/ha fertilization
------------------------------------------------- mg / kg -----------------------------------------------
Unfertilized 85 79 85 a 94 a 88 a 86 A(1)
N50 P50 88 85 85 a 85 a 88 a 86 A
N100 P100 85 85 91 a 85 a 88 a 87 A
Mean value compost fertilization 86 W(2) 83 W 87 W 88 W 88 W
(1) or (2) - Values followed by the same letter (A, B, C or W, X, Y) are not significantly different at the p=0.05 level The data from the first year of experimentation show that the soybean yield increased statistically significant with the increases of mineral fertilizer doses from 789 kg/ha to 1043 kg/ha (Table 8). The increase of compost dose led to a slightly decrease of soybean yield, probably because of heavy metals content from sewage sludge, who reduced the nitrogen-fixing microorganisms activity. As soybean plant has a high demand of nitrogen, the decline of the nitrogen content in the soil due to
the lack of symbiotic microorganisms has resulted in a diminished yield of soybean crop. Noggle and Fritz (1976), quoted by Kabir et al. (2011) appreciate that optimum dose of essential nutrient elements ensure the highest yield of a crop. In this sense, by supplying nutrient from sewage sludge, Lavado (2006), quoted by Kabir et al. (2011), found increased yield of sunflower.
Table 8. Effects of organic, mineral and mixed fertilization on soybean yield
Mineral fertilization Compost fertilization Mean value
Unfertilized Compost fertilization equivalent to a N rate of: mineral
with compost 100 kg/ha 200 kg/ha 300 kg/ha 400 kg/ha fertilization
---------------------------------------------- kg / ha -----------------------------------------------
Unfertilized 609 906 831 750 847 789 A(2)
N50 P50 872 958 926 857 871 897 B
N100 P100 1378 976 1028 932 903 1043 C
Mean value compost fertilization 953 W 947 W 928 W 846 X 874 X
(1) or (2) - Values followed by the same letter (A, B, C or W, X, Y) are not significantly different at the p=0.05 level In Pennsylvania project where biosolids were used as a nitrogen fertilizer, there were no differences in crop yields between biosolids and control fields (control fields used conventional chemicals fertilizers and manures) (http//extension.psu.edu/effects-of biosolids-on soil-and-crop-quality). Considering maize crop, in our experiment, the association between organic and mineral fertilization (N-P) was beneficial for maize yield, possibly due to high maize tolerance for
heavy metals (maize is considered a plant that can be cultivated on land fertilized with high doses of sewage sludge). The results suggested that the compost application associated or not with mineral fertilization generated positive yield responses (Table 9). Wei and Liu (2005) observed that compared with the check, the compost application increased significantly the weight of barley spikes and grains and the mean weight and yield of Chinese cabbage.
Table 9. Effects of organic, mineral and mixed fertilization on maize yield
Mineral fertilization Compost fertilization Mean value
Unfertilized Compost fertilization equivalent to a N rate of: mineral
with compost 100 kg/ha 200 kg/ha 300 kg/ha 400 kg/ha fertilization
---------------------------------------------- kg / ha -----------------------------------------------
Unfertilized 6449 8207 8609 8621 9753 8328 A(2)
N50 P50 7554 8750 8636 9354 9939 8847 B
N100 P100 8432 9335 9404 9542 10090 9361 C
Mean value compost fertilization 7478 W 8764 X 8883 X 9172 Y 9927 Z
(1) or (2) - Values followed by the same letter (A, B, C or W, X, Y) are not significantly different at the p=0.05 level
The maize yield in our experiment increased statistically significant with the dose of mineral fertilizer from 8328 kg/ha in unfertilized plot to 9361 kg/ha after mineral fertilization in high dose (N100P100). Compost fertilization equivalent to increasing rate of nitrogen led
also to statistically significant increases of maize crop, from 6449 kg/ha in unfertilized plot, to 9753 kg/ha in plots fertilized with composted sewage sludge equivalent to a N rate of 400 kg/ha.

201
explains the absence of significantly changes of the mobile potassium content in the soil. Consequently, compared with the check (unfertilized variant), the content of mobile potassium in soil did not change significantly after compost application or mineral fertilization. The average values of potassium content in soil ranged between 85 mg/kg - 94 mg/kg. Generally, the data from literature demon-strated that organic amendments long-term applications enhanced soil available potassium, extractable phosphorus and organic carbon content (Diacono and Montemurro, 2009). The use of biosolids on Pennsylvania cropland, in a three year research project, showed even lower soil test potassium level in biosolid fields than they were in control fields. It was considered that the amount of potassium added by biosolid it was not sufficient to fulfill the crop necessity. Alternative source of potassium should be considered (chemical fertilizer or manure) to maintain optimum potassium soil
test levels (http//extension.psu.edu/effects-of biosolids-on soil-and-crop-quality). The use of quality compost is a sure way of restoring organic matter to the soil, mitigation of acute tendency of decreasing soil nutrient reserves and a way to increase the crops quality. Evaluating the quality compost is done not only by laboratory tests, but also in experimental field. Because the sewage sludge compost used in our experimental field contain low levels of nutrients compared with mineral fertilizer and it is known that the low mineralization rates did not satisfy the requirements of a crop, we studied the combined effects of applying compost and mineral fertilizers (N-P). On the other hand, by applying compost it is expected to increase recovery ratios of nutrients from mineral fertilizers. We tried to obtain economic efficiency of using compost by careful choice of crop rotation and monitoring of the environment.
Table 7. Effects of organic, mineral and mixed fertilization on mobile potassium content in soil
Mineral fertilization Compost fertilization Mean value
Unfertilized Compost fertilization equivalent to a N rate of: mineral
with compost 100 kg/ha 200 kg/ha 300 kg/ha 400 kg/ha fertilization
------------------------------------------------- mg / kg -----------------------------------------------
Unfertilized 85 79 85 a 94 a 88 a 86 A(1)
N50 P50 88 85 85 a 85 a 88 a 86 A
N100 P100 85 85 91 a 85 a 88 a 87 A
Mean value compost fertilization 86 W(2) 83 W 87 W 88 W 88 W
(1) or (2) - Values followed by the same letter (A, B, C or W, X, Y) are not significantly different at the p=0.05 level The data from the first year of experimentation show that the soybean yield increased statistically significant with the increases of mineral fertilizer doses from 789 kg/ha to 1043 kg/ha (Table 8). The increase of compost dose led to a slightly decrease of soybean yield, probably because of heavy metals content from sewage sludge, who reduced the nitrogen-fixing microorganisms activity. As soybean plant has a high demand of nitrogen, the decline of the nitrogen content in the soil due to
the lack of symbiotic microorganisms has resulted in a diminished yield of soybean crop. Noggle and Fritz (1976), quoted by Kabir et al. (2011) appreciate that optimum dose of essential nutrient elements ensure the highest yield of a crop. In this sense, by supplying nutrient from sewage sludge, Lavado (2006), quoted by Kabir et al. (2011), found increased yield of sunflower.
Table 8. Effects of organic, mineral and mixed fertilization on soybean yield
Mineral fertilization Compost fertilization Mean value
Unfertilized Compost fertilization equivalent to a N rate of: mineral
with compost 100 kg/ha 200 kg/ha 300 kg/ha 400 kg/ha fertilization
---------------------------------------------- kg / ha -----------------------------------------------
Unfertilized 609 906 831 750 847 789 A(2)
N50 P50 872 958 926 857 871 897 B
N100 P100 1378 976 1028 932 903 1043 C
Mean value compost fertilization 953 W 947 W 928 W 846 X 874 X
(1) or (2) - Values followed by the same letter (A, B, C or W, X, Y) are not significantly different at the p=0.05 level In Pennsylvania project where biosolids were used as a nitrogen fertilizer, there were no differences in crop yields between biosolids and control fields (control fields used conventional chemicals fertilizers and manures) (http//extension.psu.edu/effects-of biosolids-on soil-and-crop-quality). Considering maize crop, in our experiment, the association between organic and mineral fertilization (N-P) was beneficial for maize yield, possibly due to high maize tolerance for
heavy metals (maize is considered a plant that can be cultivated on land fertilized with high doses of sewage sludge). The results suggested that the compost application associated or not with mineral fertilization generated positive yield responses (Table 9). Wei and Liu (2005) observed that compared with the check, the compost application increased significantly the weight of barley spikes and grains and the mean weight and yield of Chinese cabbage.
Table 9. Effects of organic, mineral and mixed fertilization on maize yield
Mineral fertilization Compost fertilization Mean value
Unfertilized Compost fertilization equivalent to a N rate of: mineral
with compost 100 kg/ha 200 kg/ha 300 kg/ha 400 kg/ha fertilization
---------------------------------------------- kg / ha -----------------------------------------------
Unfertilized 6449 8207 8609 8621 9753 8328 A(2)
N50 P50 7554 8750 8636 9354 9939 8847 B
N100 P100 8432 9335 9404 9542 10090 9361 C
Mean value compost fertilization 7478 W 8764 X 8883 X 9172 Y 9927 Z
(1) or (2) - Values followed by the same letter (A, B, C or W, X, Y) are not significantly different at the p=0.05 level
The maize yield in our experiment increased statistically significant with the dose of mineral fertilizer from 8328 kg/ha in unfertilized plot to 9361 kg/ha after mineral fertilization in high dose (N100P100). Compost fertilization equivalent to increasing rate of nitrogen led
also to statistically significant increases of maize crop, from 6449 kg/ha in unfertilized plot, to 9753 kg/ha in plots fertilized with composted sewage sludge equivalent to a N rate of 400 kg/ha.
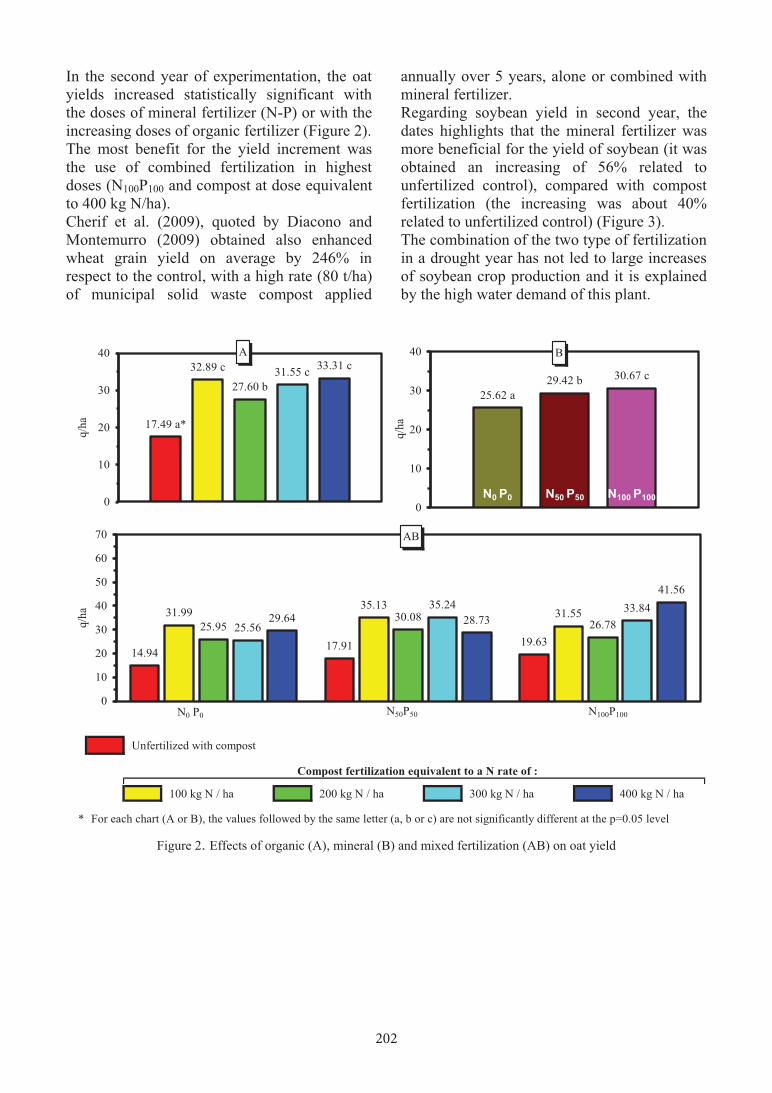
202
In the second year of experimentation, the oat yields increased statistically significant with the doses of mineral fertilizer (N-P) or with the increasing doses of organic fertilizer (Figure 2). The most benefit for the yield increment was the use of combined fertilization in highest doses (N100P100 and compost at dose equivalent to 400 kg N/ha). Cherif et al. (2009), quoted by Diacono and Montemurro (2009) obtained also enhanced wheat grain yield on average by 246% in respect to the control, with a high rate (80 t/ha) of municipal solid waste compost applied
annually over 5 years, alone or combined with mineral fertilizer. Regarding soybean yield in second year, the dates highlights that the mineral fertilizer was more beneficial for the yield of soybean (it was obtained an increasing of 56% related to unfertilized control), compared with compost fertilization (the increasing was about 40% related to unfertilized control) (Figure 3). The combination of the two type of fertilization in a drought year has not led to large increases of soybean crop production and it is explained by the high water demand of this plant.
Unfertilized with compost
Compost fertilization equivalent to a N rate of :
100 kg N / ha 200 kg N / ha 300 kg N / ha 400 kg N / ha
* For each chart (A or B), the values followed by the same letter (a, b or c) are not significantly different at the p=0.05 level
A
17.49 a*
32.89 c
27.60 b31.55 c 33.31 c
0
10
20
30
40
q/ha
B
25.62 a29.42 b 30.67 c
0
10
20
30
40
q/ha
N0 P0 N50 P50 N100 P100
AB
14.94 17.91 19.63
31.99 35.1331.55
25.9530.08
26.7825.56
35.24 33.8429.64 28.73
41.56
0
10
20
30
40
50
60
70
q/ha
N0 P0 N100P100 N50P50
Figure 2. Effects of organic (A), mineral (B) and mixed fertilization (AB) on oat yield
Unfertilized with compost Compost fertilization equivalent to a N rate of :
100 kg N / ha 200 kg N / ha 300 kg N / ha 400 kg N / ha
* For each chart (A or B), the values followed by the same letter (a, b or c) are not significantly different at the p=0.05 level
A
4.29a*5.38 b 5.55 bc 5.75 cd 6.04 d
0
10
q/ha
B
4.28 a5.24 b
6.69 c
0
10
q/ha
N0 P0 N50 P50 N100 P100
AB
2.44
4.386.05
3.16
5.47
7.52
4.79 5.116.76
5.56 5.246.44
5.44 6.02
6.67
0
10
q/ha
N0 P0 N100 P100 N50 P50
Figure 3. Effects of organic (A), mineral (B) and mixed fertilization (AB) on soybean yield CONCLUSIONS Following municipal sludge composting process are obtained materials that can be used beneficially as bio-fertilizers and conditioning of soil. Application of compost on cropland will take into account the characteristics of compost and soil, the plant needs and the environmental regulations from area. The fertilization with sewage sludge compost does not replace chemical fertilizer but is applied along with it to fulfill necessary nutrients for plants. The experimental results in this paper showed that compost fertilization associated with mineral fertilization led to better yields responses for oat, maize and soybean comparing with only one type of fertilization. Mineral fertilization of soils is a short-term solution in terms of increasing yield but the alternative of applying composted sewage sludge could lead to a nutrient slow-release effect. On the other hand a reliable agronomic value of organic amendments can be determined over years of application on soils considering the climate, soil type and compost characteristics. Long time research on sewage sludge compost as amendment on cropland is particularly relevant, because the composition of compost can influence the soil fertility and the
potentially accumulation of heavy metals in soil, but these changes evolve slowly. To predict the effects of applying different organic amendments is useful to continue the research in order to establish the most appro-priate technologies for sewage sludge com-posting, as it is known that composting process reduce the heavy metal availability. Another aspect for which continued long-term research could be important is the recom-mendation of optimal doses mixed with mineral fertilizers to obtain high crop yields. AKNOWLEDGEMNTS The research was supported by the Research Program Agral, Contract 82. REFERENCES Diacono M., Montemurro F., 2009. Long-term effects of
organic amendments on soil fertility. A review. Agron. Sustain. Dev. 30 (2010), p. 401-422.
Gattullo C., Mininni C., Parente A., Montesano F., Allegretta I., Terzano R., 2017. Effects of municipal solid waste- and sewage sludge-compost-based growing media on the yield and heavy metal content of four lettuce cultivars. Environ Sci Pollut Res 24: p. 25406-25415.
Kabir M., Kamal A., Jahan S., Faizullah A., Ullah S., 2011. Yield of rice and its mineral contents as
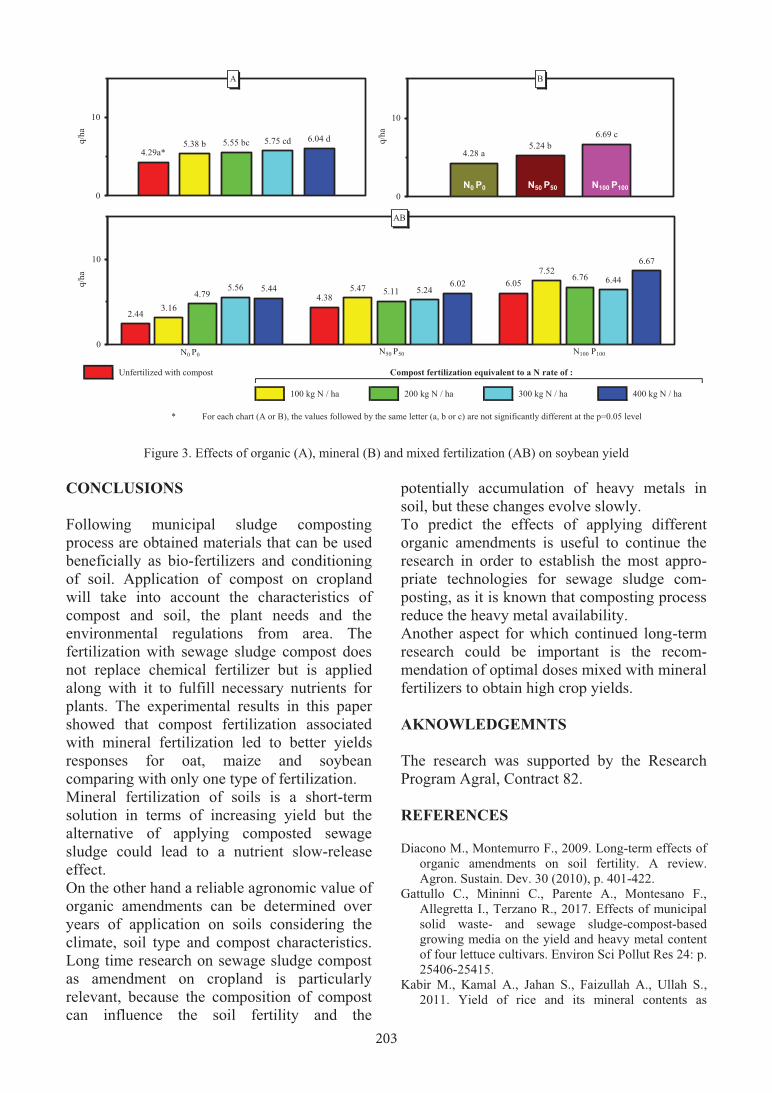
203
In the second year of experimentation, the oat yields increased statistically significant with the doses of mineral fertilizer (N-P) or with the increasing doses of organic fertilizer (Figure 2). The most benefit for the yield increment was the use of combined fertilization in highest doses (N100P100 and compost at dose equivalent to 400 kg N/ha). Cherif et al. (2009), quoted by Diacono and Montemurro (2009) obtained also enhanced wheat grain yield on average by 246% in respect to the control, with a high rate (80 t/ha) of municipal solid waste compost applied
annually over 5 years, alone or combined with mineral fertilizer. Regarding soybean yield in second year, the dates highlights that the mineral fertilizer was more beneficial for the yield of soybean (it was obtained an increasing of 56% related to unfertilized control), compared with compost fertilization (the increasing was about 40% related to unfertilized control) (Figure 3). The combination of the two type of fertilization in a drought year has not led to large increases of soybean crop production and it is explained by the high water demand of this plant.
Unfertilized with compost
Compost fertilization equivalent to a N rate of :
100 kg N / ha 200 kg N / ha 300 kg N / ha 400 kg N / ha
* For each chart (A or B), the values followed by the same letter (a, b or c) are not significantly different at the p=0.05 level
A
17.49 a*
32.89 c
27.60 b31.55 c 33.31 c
0
10
20
30
40
q/ha
B
25.62 a29.42 b 30.67 c
0
10
20
30
40
q/ha
N0 P0 N50 P50 N100 P100
AB
14.94 17.91 19.63
31.99 35.1331.55
25.9530.08
26.7825.56
35.24 33.8429.64 28.73
41.56
0
10
20
30
40
50
60
70
q/ha
N0 P0 N100P100 N50P50
Figure 2. Effects of organic (A), mineral (B) and mixed fertilization (AB) on oat yield
Unfertilized with compost Compost fertilization equivalent to a N rate of :
100 kg N / ha 200 kg N / ha 300 kg N / ha 400 kg N / ha
* For each chart (A or B), the values followed by the same letter (a, b or c) are not significantly different at the p=0.05 level
A
4.29a*5.38 b 5.55 bc 5.75 cd 6.04 d
0
10
q/ha
B
4.28 a5.24 b
6.69 c
0
10
q/ha
N0 P0 N50 P50 N100 P100
AB
2.44
4.386.05
3.16
5.47
7.52
4.79 5.116.76
5.56 5.246.44
5.44 6.02
6.67
0
10
q/ha
N0 P0 N100 P100 N50 P50
Figure 3. Effects of organic (A), mineral (B) and mixed fertilization (AB) on soybean yield CONCLUSIONS Following municipal sludge composting process are obtained materials that can be used beneficially as bio-fertilizers and conditioning of soil. Application of compost on cropland will take into account the characteristics of compost and soil, the plant needs and the environmental regulations from area. The fertilization with sewage sludge compost does not replace chemical fertilizer but is applied along with it to fulfill necessary nutrients for plants. The experimental results in this paper showed that compost fertilization associated with mineral fertilization led to better yields responses for oat, maize and soybean comparing with only one type of fertilization. Mineral fertilization of soils is a short-term solution in terms of increasing yield but the alternative of applying composted sewage sludge could lead to a nutrient slow-release effect. On the other hand a reliable agronomic value of organic amendments can be determined over years of application on soils considering the climate, soil type and compost characteristics. Long time research on sewage sludge compost as amendment on cropland is particularly relevant, because the composition of compost can influence the soil fertility and the
potentially accumulation of heavy metals in soil, but these changes evolve slowly. To predict the effects of applying different organic amendments is useful to continue the research in order to establish the most appro-priate technologies for sewage sludge com-posting, as it is known that composting process reduce the heavy metal availability. Another aspect for which continued long-term research could be important is the recom-mendation of optimal doses mixed with mineral fertilizers to obtain high crop yields. AKNOWLEDGEMNTS The research was supported by the Research Program Agral, Contract 82. REFERENCES Diacono M., Montemurro F., 2009. Long-term effects of
organic amendments on soil fertility. A review. Agron. Sustain. Dev. 30 (2010), p. 401-422.
Gattullo C., Mininni C., Parente A., Montesano F., Allegretta I., Terzano R., 2017. Effects of municipal solid waste- and sewage sludge-compost-based growing media on the yield and heavy metal content of four lettuce cultivars. Environ Sci Pollut Res 24: p. 25406-25415.
Kabir M., Kamal A., Jahan S., Faizullah A., Ullah S., 2011. Yield of rice and its mineral contents as

204
influenced by sewage sludge and nitrogen. Bangladesh J. Sci. Res. 24(2): p. 161-168.
Khaliq A., Al-Busaidi A., Ahmed M., Al-Wardy M., Agrama H., Choudri B.S., 2017. The effect of municipal sewage sludge on the quality of soil and crops. Int. J. Recycl Org. Waste Agricult., Vol. 6 (4): p. 289-299.
Kirchmann H., Börjesson G., Kätterer T., Cohen Y., 2017. From agricultural use of sewage sludge to nutrient extraction: a soil science outlook. Ambio, 46, p. 143-154.
Kominko H., Gorazda K., Wzorek Z., 2017. The Possibility of organo-Mineral Fertilizer Production from Sewage Sludge. Waste Biomass Valor, Vol. 8(5): p. 1781-1791.
Leonard I., Dumitru M., Vrînceanu N., Motelică D.M., Tănase V., 2007. Metodologie de utilizare a nămolului orăşenesc în agricultură. Solness Publishing House, Timişoara.
Mininni G., Blanch A.R., Lucena F., Berselli S., 2015. EU policy on sewage sludge utilization and perspectives on new approaches of sludge management. Environ. Sci. Pollut. Res., 22, p. 7361-7374.
Mtshali J., Tirunch A., Fadiran A., 2014. Characteriza-tion of sewage sludge generated from wastewater
treatment plants in Swaziland in relation to agricultural uses. Resources and Environment, 4(4): p. 190-199.
Praspaliauskas M., Pedišius N., 2017. A review of sludge characteristics in Lithuania’s wastewater treatment plants and perspectives of its usage in thermal processes. Renewable and Sustainable Energy Reviews 67, p. 899-907
Vaca-Paulín R., Esteller-Alberich M.V., Lugo-de la Fuente J., Zavaleta-Mancera H.A., 2006. Effect of sewage sludge or compost on the sorption and distribution of copper and cadmium in soil. Waste Management 26, p. 71-81.
Vieira R., Moriconi W., Pazianotto R., 2014. Residual and cumulative effects of soil application of sewage sludge on corn productivity. Environ. Sci. Pollut. Res., 21: p. 6472-6481.
Wei Y., Liu Y., 2005. Effects of sewage sludge compost application on crops and cropland in a 3-year field study. Chemosphere 59, p. 1257-1265.
***Order 344/2004. Technical Norms on environmental protection and especially of soils, when using sewage sludge in agriculture.
***http://extension.psu.edu/effects-of-biosolids-on-soil-and-crop-quality, 2017.
ANTIOXIDANT ACTIVITIES AND CHEMICAL COMPOSITON OF DIFFERENT EXTRACTS OF MOSSES GATHERED FROM TURKEY
Ozlem TONGUC YAYINTAS1, Ozlem SOGUT2, Sibel KONYALIOGLU3,
Selehattin YILMAZ4, Burcu TEPELİ4
1Canakkale Onsekiz Mart University, Canakkale Applied Sciences, Department of Fisheries, Terzioglu Campus, 17100 Canakkale, Turkey, Email: [email protected]
2Ege University, Faculty of Pharmacy, Department of Analytical Chemistry, Izmir, Turkey, Email: [email protected]
3Ege University, Faculty of Pharmacy Department of Biochemistry Izmir, Turkey, Email: [email protected]
4Canakkale Onsekiz Mart University, Faculty of Science & Arts, Chemistry Department, Terzioglu Campus, 17100, Canakkale, Turkey, Email: [email protected]
Corresponding author email: [email protected]
Abstract Recent pharmacological investigations of bryophytes have proven that the active principles present in these plants are quite unique and having potential chemical application and antioxidant capacity. The mosses of Oxytegius tenuirostris, Eurhynchium striatum W. P. Schimper and Rhynchostegium murale (Hedw.) Schimp. were collected from different locations of Turkey, and dried and exracted with different solvents. Volatiles were isolated from the samples by solid phase microextraction. Gas Chromatography-Mass Spectrometry (GC-MS) was used to identify volatile compounds. Antioxidant activities of moss were tested by free radical scavenging activity (DPPH• assay), Trolox equivalent (TEAC) and Cupric Reducing Antioxidant Capacity (CUPRAC) methods. Antioxidant activities were found for mossesas 24.67-67.12 mg/g from chloroform extract, 18.83-35.83 mg/g from ethanol extract, 7.78-46.09 mg/g from methanol extract and 12.56-34.13 mg/g from water extract by DPPH• assay method. Antioxidan activities were found as 562.07-2060.52 mg/g from chloroform extract, 597.44-1765.77 mg/g from ethanol extract, 2506.23-7454.92 mg/g from methanol extract and 676.41-5631.23 mg/g from water extract by Trolox method. Antioxidant activities were found as 9.78-64.60 mg/g from chloroform extract, 5.62-28.37 mg/g from ethanol extract, 4.23-30.54 mg/g from methanol extract and 4.92-27.77 mg/g from water extract by Cuprac method. On the basis of the results it is suggested that the extract of mosses species determined here could be of use as an easily accessible source of natural antioxidant for the treatment. Key words: Oxytegus tenuirostris, Eurhynchium striatum, Rhynchostegium murale, mosses, antioxidant activity, DPPH; TEAC, CUPRAC methods. INTRODUCTION Plant phenolics are commonly found in both edible and non-edible plants, and have been reported to have multiple biological effects, including antioxidant activity. The importance of the antioxidant constituents of plant mate-rials in the maintenance of health and protec-tion from coronary heart disease and cancer is also raising interest among scientists, food manufacturers, and consumers as the trend of the future is moving toward functional food with specific health effects (Löliger, 1991). Most phytochemicals in natural agricultural sources have been generally recognized as
bioactive or health-promoting compounds, which play an important role in preventing cardiovascular diseases, cancers, obesity and diabetes, lowering blood cholesterol level, and reducing inflammatory action (Halliwell, 1996). Bryophytes belong to phylum bryophyte and include three classes Hepaticopsida (liverworts), Bryopsida (mosses), and Antho-cerotea (hornworts). They are small, terrestrial photosynthetic, spore-bearing plants that require a humid environment and can be found all over the world. There are about 20,000 species of bryophytes worldwide, which is about five percent of the total of 400,000 plant species on the earth (Zinsmeister, 1991).

205
influenced by sewage sludge and nitrogen. Bangladesh J. Sci. Res. 24(2): p. 161-168.
Khaliq A., Al-Busaidi A., Ahmed M., Al-Wardy M., Agrama H., Choudri B.S., 2017. The effect of municipal sewage sludge on the quality of soil and crops. Int. J. Recycl Org. Waste Agricult., Vol. 6 (4): p. 289-299.
Kirchmann H., Börjesson G., Kätterer T., Cohen Y., 2017. From agricultural use of sewage sludge to nutrient extraction: a soil science outlook. Ambio, 46, p. 143-154.
Kominko H., Gorazda K., Wzorek Z., 2017. The Possibility of organo-Mineral Fertilizer Production from Sewage Sludge. Waste Biomass Valor, Vol. 8(5): p. 1781-1791.
Leonard I., Dumitru M., Vrînceanu N., Motelică D.M., Tănase V., 2007. Metodologie de utilizare a nămolului orăşenesc în agricultură. Solness Publishing House, Timişoara.
Mininni G., Blanch A.R., Lucena F., Berselli S., 2015. EU policy on sewage sludge utilization and perspectives on new approaches of sludge management. Environ. Sci. Pollut. Res., 22, p. 7361-7374.
Mtshali J., Tirunch A., Fadiran A., 2014. Characteriza-tion of sewage sludge generated from wastewater
treatment plants in Swaziland in relation to agricultural uses. Resources and Environment, 4(4): p. 190-199.
Praspaliauskas M., Pedišius N., 2017. A review of sludge characteristics in Lithuania’s wastewater treatment plants and perspectives of its usage in thermal processes. Renewable and Sustainable Energy Reviews 67, p. 899-907
Vaca-Paulín R., Esteller-Alberich M.V., Lugo-de la Fuente J., Zavaleta-Mancera H.A., 2006. Effect of sewage sludge or compost on the sorption and distribution of copper and cadmium in soil. Waste Management 26, p. 71-81.
Vieira R., Moriconi W., Pazianotto R., 2014. Residual and cumulative effects of soil application of sewage sludge on corn productivity. Environ. Sci. Pollut. Res., 21: p. 6472-6481.
Wei Y., Liu Y., 2005. Effects of sewage sludge compost application on crops and cropland in a 3-year field study. Chemosphere 59, p. 1257-1265.
***Order 344/2004. Technical Norms on environmental protection and especially of soils, when using sewage sludge in agriculture.
***http://extension.psu.edu/effects-of-biosolids-on-soil-and-crop-quality, 2017.
AgroLife Scientific Journal - Volume 6, Number 2, 2017ISSN 2285-5718; ISSN CD-ROM 2285-5726; ISSN ONLINE 2286-0126; ISSN-L 2285-5718
ANTIOXIDANT ACTIVITIES AND CHEMICAL COMPOSITON OF DIFFERENT EXTRACTS OF MOSSES GATHERED FROM TURKEY
Ozlem TONGUC YAYINTAS1, Ozlem SOGUT2, Sibel KONYALIOGLU3,
Selehattin YILMAZ4, Burcu TEPELİ4
1Canakkale Onsekiz Mart University, Canakkale Applied Sciences, Department of Fisheries, Terzioglu Campus, 17100 Canakkale, Turkey, Email: [email protected]
2Ege University, Faculty of Pharmacy, Department of Analytical Chemistry, Izmir, Turkey, Email: [email protected]
3Ege University, Faculty of Pharmacy Department of Biochemistry Izmir, Turkey, Email: [email protected]
4Canakkale Onsekiz Mart University, Faculty of Science & Arts, Chemistry Department, Terzioglu Campus, 17100, Canakkale, Turkey, Email: [email protected]
Corresponding author email: [email protected]
Abstract Recent pharmacological investigations of bryophytes have proven that the active principles present in these plants are quite unique and having potential chemical application and antioxidant capacity. The mosses of Oxytegius tenuirostris, Eurhynchium striatum W. P. Schimper and Rhynchostegium murale (Hedw.) Schimp. were collected from different locations of Turkey, and dried and exracted with different solvents. Volatiles were isolated from the samples by solid phase microextraction. Gas Chromatography-Mass Spectrometry (GC-MS) was used to identify volatile compounds. Antioxidant activities of moss were tested by free radical scavenging activity (DPPH• assay), Trolox equivalent (TEAC) and Cupric Reducing Antioxidant Capacity (CUPRAC) methods. Antioxidant activities were found for mossesas 24.67-67.12 mg/g from chloroform extract, 18.83-35.83 mg/g from ethanol extract, 7.78-46.09 mg/g from methanol extract and 12.56-34.13 mg/g from water extract by DPPH• assay method. Antioxidan activities were found as 562.07-2060.52 mg/g from chloroform extract, 597.44-1765.77 mg/g from ethanol extract, 2506.23-7454.92 mg/g from methanol extract and 676.41-5631.23 mg/g from water extract by Trolox method. Antioxidant activities were found as 9.78-64.60 mg/g from chloroform extract, 5.62-28.37 mg/g from ethanol extract, 4.23-30.54 mg/g from methanol extract and 4.92-27.77 mg/g from water extract by Cuprac method. On the basis of the results it is suggested that the extract of mosses species determined here could be of use as an easily accessible source of natural antioxidant for the treatment. Key words: Oxytegus tenuirostris, Eurhynchium striatum, Rhynchostegium murale, mosses, antioxidant activity, DPPH; TEAC, CUPRAC methods. INTRODUCTION Plant phenolics are commonly found in both edible and non-edible plants, and have been reported to have multiple biological effects, including antioxidant activity. The importance of the antioxidant constituents of plant mate-rials in the maintenance of health and protec-tion from coronary heart disease and cancer is also raising interest among scientists, food manufacturers, and consumers as the trend of the future is moving toward functional food with specific health effects (Löliger, 1991). Most phytochemicals in natural agricultural sources have been generally recognized as
bioactive or health-promoting compounds, which play an important role in preventing cardiovascular diseases, cancers, obesity and diabetes, lowering blood cholesterol level, and reducing inflammatory action (Halliwell, 1996). Bryophytes belong to phylum bryophyte and include three classes Hepaticopsida (liverworts), Bryopsida (mosses), and Antho-cerotea (hornworts). They are small, terrestrial photosynthetic, spore-bearing plants that require a humid environment and can be found all over the world. There are about 20,000 species of bryophytes worldwide, which is about five percent of the total of 400,000 plant species on the earth (Zinsmeister, 1991).
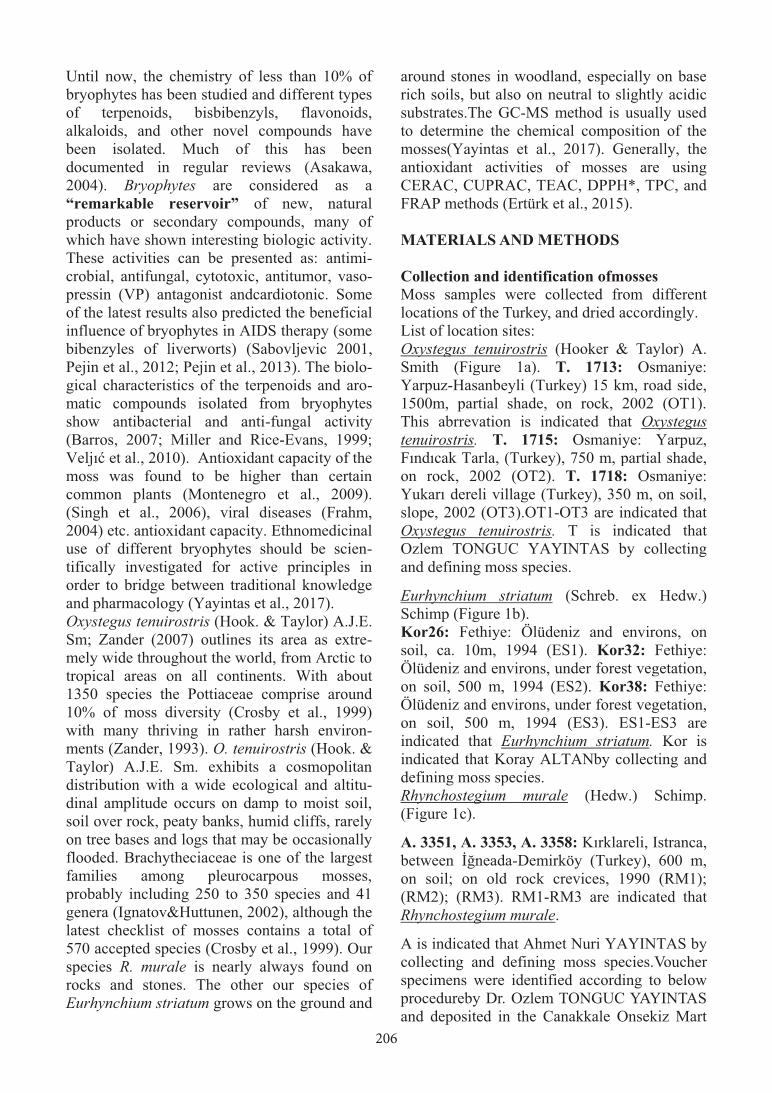
206
Until now, the chemistry of less than 10% of bryophytes has been studied and different types of terpenoids, bisbibenzyls, flavonoids, alkaloids, and other novel compounds have been isolated. Much of this has been documented in regular reviews (Asakawa, 2004). Bryophytes are considered as a “remarkable reservoir” of new, natural products or secondary compounds, many of which have shown interesting biologic activity. These activities can be presented as: antimi-crobial, antifungal, cytotoxic, antitumor, vaso-pressin (VP) antagonist andcardiotonic. Some of the latest results also predicted the beneficial influence of bryophytes in AIDS therapy (some bibenzyles of liverworts) (Sabovljevic 2001, Pejin et al., 2012; Pejin et al., 2013). The biolo-gical characteristics of the terpenoids and aro-matic compounds isolated from bryophytes show antibacterial and anti-fungal activity (Barros, 2007; Miller and Rice-Evans, 1999; Veljıć et al., 2010). Antioxidant capacity of the moss was found to be higher than certain common plants (Montenegro et al., 2009). (Singh et al., 2006), viral diseases (Frahm, 2004) etc. antioxidant capacity. Ethnomedicinal use of different bryophytes should be scien-tifically investigated for active principles in order to bridge between traditional knowledge and pharmacology (Yayintas et al., 2017). Oxystegus tenuirostris (Hook. & Taylor) A.J.E. Sm; Zander (2007) outlines its area as extre-mely wide throughout the world, from Arctic to tropical areas on all continents. With about 1350 species the Pottiaceae comprise around 10% of moss diversity (Crosby et al., 1999) with many thriving in rather harsh environ-ments (Zander, 1993). O. tenuirostris (Hook. & Taylor) A.J.E. Sm. exhibits a cosmopolitan distribution with a wide ecological and altitu-dinal amplitude occurs on damp to moist soil, soil over rock, peaty banks, humid cliffs, rarely on tree bases and logs that may be occasionally flooded. Brachytheciaceae is one of the largest families among pleurocarpous mosses, probably including 250 to 350 species and 41 genera (Ignatov&Huttunen, 2002), although the latest checklist of mosses contains a total of 570 accepted species (Crosby et al., 1999). Our species R. murale is nearly always found on rocks and stones. The other our species of Eurhynchium striatum grows on the ground and
around stones in woodland, especially on base rich soils, but also on neutral to slightly acidic substrates.The GC-MS method is usually used to determine the chemical composition of the mosses(Yayintas et al., 2017). Generally, the antioxidant activities of mosses are using CERAC, CUPRAC, TEAC, DPPH*, TPC, and FRAP methods (Ertürk et al., 2015). MATERIALS AND METHODS Collection and identification ofmosses Moss samples were collected from different locations of the Turkey, and dried accordingly. List of location sites: Oxystegus tenuirostris (Hooker & Taylor) A. Smith (Figure 1a). T. 1713: Osmaniye: Yarpuz-Hasanbeyli (Turkey) 15 km, road side, 1500m, partial shade, on rock, 2002 (OT1). This abrrevation is indicated that Oxystegus tenuirostris. T. 1715: Osmaniye: Yarpuz, Fındıcak Tarla, (Turkey), 750 m, partial shade, on rock, 2002 (OT2). T. 1718: Osmaniye: Yukarı dereli village (Turkey), 350 m, on soil, slope, 2002 (OT3).OT1-OT3 are indicated that Oxystegus tenuirostris. T is indicated that Ozlem TONGUC YAYINTAS by collecting and defining moss species.
Eurhynchium striatum (Schreb. ex Hedw.) Schimp (Figure 1b). Kor26: Fethiye: Ölüdeniz and environs, on soil, ca. 10m, 1994 (ES1). Kor32: Fethiye: Ölüdeniz and environs, under forest vegetation, on soil, 500 m, 1994 (ES2). Kor38: Fethiye: Ölüdeniz and environs, under forest vegetation, on soil, 500 m, 1994 (ES3). ES1-ES3 are indicated that Eurhynchium striatum. Kor is indicated that Koray ALTANby collecting and defining moss species. Rhynchostegium murale (Hedw.) Schimp. (Figure 1c).
A. 3351, A. 3353, A. 3358: Kırklareli, Istranca, between İğneada-Demirköy (Turkey), 600 m, on soil; on old rock crevices, 1990 (RM1); (RM2); (RM3). RM1-RM3 are indicated that Rhynchostegium murale.
A is indicated that Ahmet Nuri YAYINTAS by collecting and defining moss species.Voucher spec�mens were �dent�f�ed accord�ng to below procedureby Dr. Ozlem TONGUC YAYINTAS and depos�ted �n the Canakkale Onsek�z Mart
Un�vers�ty, Appl�ed Sc�enceof College, Fisheries Technology,Turkey. The status of these taxa wasevaluated by reviewing the related literature for Turkey (Uyar and Çetin 2004, Kürschner and Erdağ 2005; Kürschner
and Frey 2011).We �nvest�gated the follow�ng spec�es: Oxystegus tenu�rostr�s (Hooker & Taylor) A. Sm�th, Eurhynch�um str�atum (Schreb. ex Hedw.) Sch�mp, Rhynchosteg�um murale (Hedw.) Sch�mp (F�gures 1 a, b, c).
(a) (b) (c) Figure 1. Moss species of (a) Oxystegus tenuirostris (Hooker & Taylor) A. Smith,
(b) Eurhynchium striatum (Schreb. ex Hedw.) Schimp, (c) Rhynchostegium murale (Hedw.) Schimp.in Turkey
Extraction of Moss Specimens Milled moss specimens were weighed, extrac-tion is carried out with chloroform, ethanol, me-thanol and water successively. 5 ml of chloro-form was added to each sample and mixed with a vortex. It was waited for 30 min in ultrasonic bath and then mixed with vortex. Then, filtered and dried drogs. The same procedure was performed using ethanol, methanol and water Gas chromatography-mass spectrometry (GC/MS) Volatile compounds from moss samples were isolated by solid-phase microextraction (SPME) technique (Pawliszyn, 2012) and iden-tified by Gas chromatography mass spectro-metry. Volatiles were tentatively identified by GC–MS. A nonpolar HP5 column (30 m × 0.25 mm i.d. × 0.25-µm film thickness; J&W Scientific) was used for separation of volatiles. The GC–MS system consisted of an HP 6890 GC and 7895C mass-selective detector (MSD; Agilent Technologies, Wilmington, DE, USA). Experimental Conditions for Methods Free radical scavenging activity (DPPH� assay) Antioxidant activities of these mosses were tested by free radical scavenging activity (DPPH� assay) of chloroform, ethanol, methanol and water extracts according to the procedures described by Srinivasan et al. Moss extract of 0.1 ml were mixed with 1.5 ml of DPPH� reagent and allowed to stand at room
temperature for 30 minutes in the dark. The absorbance was taken at 517 nm. RSD is cal-culated by measuring the average and the third the preparation of each sample. Results are calculated as % reduction (Amarowicz, 2004) (Table 2). Trolox was used as a standard. Trolox equivalent antioxidant capacity (TEAC) assay Antioxidant activity was measured using the 2,2’-azino-bis(3-ethylbenzothiazoline-6-sulfonic acid) (ABTS) method as described before (Re et al., 1999). It is based on the Trolox equivalence of the samples. Mixed with 2.45 mM potassium persulfate was 7 mM ABTS, in order to produce an ABTS+ radical. Th is radical was left in a dark room at 30 °C for 2 days to reach stable absorbance at 734 nm. Extracts were diluted in ethanol to a final concentration of 0.1 mg/mL. Ethanol was used as the blank. The ABTS+ solution was diluted with 5 mM phosphate buffer until it had an absorbance of 0.70 ± 0.02 at 734 nm. Next, 1 mL of this stock solution was taken and mixed with 10 μL of a sample solution and measured at 734 nm for 1-6 min after the initial mixing. All measurements were carried out in triplicate. The inhibition percentages were calculated as follows: Inhibition % = (AABTS + – A6.min) × 100/AABTS
+, where AABTS.+ is the absorbance of ABTS+ at 734 nm (0.700 ± 0.02) and A6.min is the 6-min absorbance aft er the addition of the sample to the ABTS+. The absorbances of the samples were compared to that of the stan-
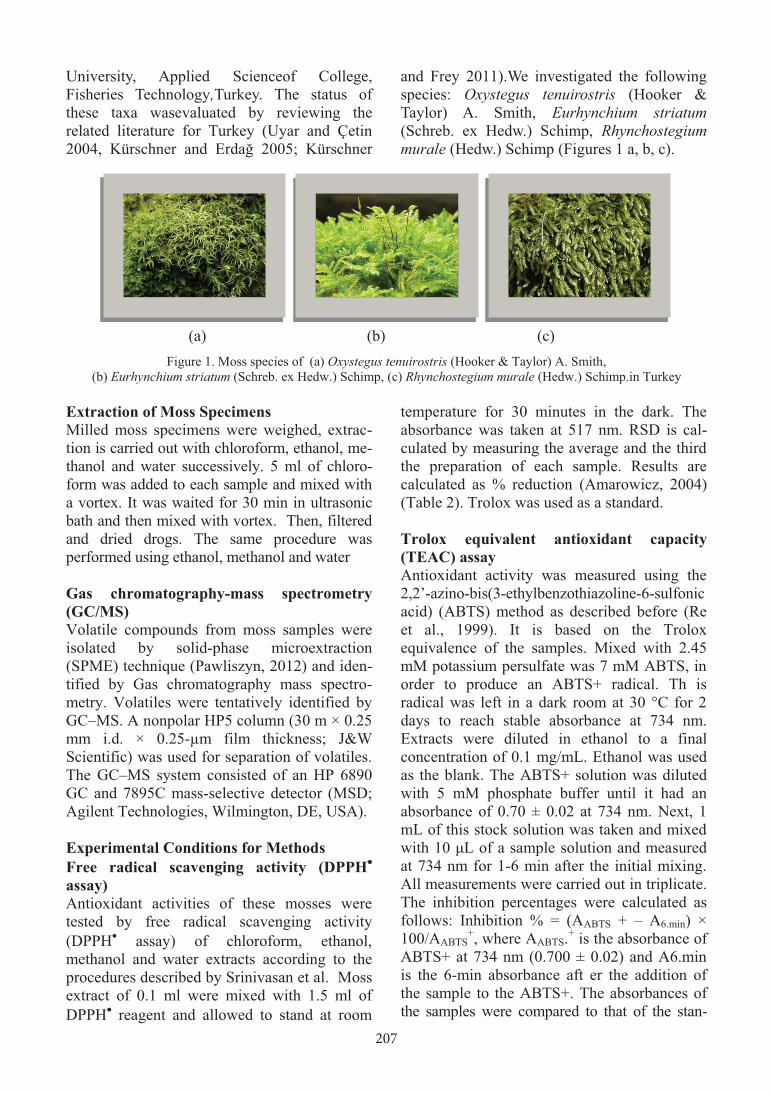
207
Until now, the chemistry of less than 10% of bryophytes has been studied and different types of terpenoids, bisbibenzyls, flavonoids, alkaloids, and other novel compounds have been isolated. Much of this has been documented in regular reviews (Asakawa, 2004). Bryophytes are considered as a “remarkable reservoir” of new, natural products or secondary compounds, many of which have shown interesting biologic activity. These activities can be presented as: antimi-crobial, antifungal, cytotoxic, antitumor, vaso-pressin (VP) antagonist andcardiotonic. Some of the latest results also predicted the beneficial influence of bryophytes in AIDS therapy (some bibenzyles of liverworts) (Sabovljevic 2001, Pejin et al., 2012; Pejin et al., 2013). The biolo-gical characteristics of the terpenoids and aro-matic compounds isolated from bryophytes show antibacterial and anti-fungal activity (Barros, 2007; Miller and Rice-Evans, 1999; Veljıć et al., 2010). Antioxidant capacity of the moss was found to be higher than certain common plants (Montenegro et al., 2009). (Singh et al., 2006), viral diseases (Frahm, 2004) etc. antioxidant capacity. Ethnomedicinal use of different bryophytes should be scien-tifically investigated for active principles in order to bridge between traditional knowledge and pharmacology (Yayintas et al., 2017). Oxystegus tenuirostris (Hook. & Taylor) A.J.E. Sm; Zander (2007) outlines its area as extre-mely wide throughout the world, from Arctic to tropical areas on all continents. With about 1350 species the Pottiaceae comprise around 10% of moss diversity (Crosby et al., 1999) with many thriving in rather harsh environ-ments (Zander, 1993). O. tenuirostris (Hook. & Taylor) A.J.E. Sm. exhibits a cosmopolitan distribution with a wide ecological and altitu-dinal amplitude occurs on damp to moist soil, soil over rock, peaty banks, humid cliffs, rarely on tree bases and logs that may be occasionally flooded. Brachytheciaceae is one of the largest families among pleurocarpous mosses, probably including 250 to 350 species and 41 genera (Ignatov&Huttunen, 2002), although the latest checklist of mosses contains a total of 570 accepted species (Crosby et al., 1999). Our species R. murale is nearly always found on rocks and stones. The other our species of Eurhynchium striatum grows on the ground and
around stones in woodland, especially on base rich soils, but also on neutral to slightly acidic substrates.The GC-MS method is usually used to determine the chemical composition of the mosses(Yayintas et al., 2017). Generally, the antioxidant activities of mosses are using CERAC, CUPRAC, TEAC, DPPH*, TPC, and FRAP methods (Ertürk et al., 2015). MATERIALS AND METHODS Collection and identification ofmosses Moss samples were collected from different locations of the Turkey, and dried accordingly. List of location sites: Oxystegus tenuirostris (Hooker & Taylor) A. Smith (Figure 1a). T. 1713: Osmaniye: Yarpuz-Hasanbeyli (Turkey) 15 km, road side, 1500m, partial shade, on rock, 2002 (OT1). This abrrevation is indicated that Oxystegus tenuirostris. T. 1715: Osmaniye: Yarpuz, Fındıcak Tarla, (Turkey), 750 m, partial shade, on rock, 2002 (OT2). T. 1718: Osmaniye: Yukarı dereli village (Turkey), 350 m, on soil, slope, 2002 (OT3).OT1-OT3 are indicated that Oxystegus tenuirostris. T is indicated that Ozlem TONGUC YAYINTAS by collecting and defining moss species.
Eurhynchium striatum (Schreb. ex Hedw.) Schimp (Figure 1b). Kor26: Fethiye: Ölüdeniz and environs, on soil, ca. 10m, 1994 (ES1). Kor32: Fethiye: Ölüdeniz and environs, under forest vegetation, on soil, 500 m, 1994 (ES2). Kor38: Fethiye: Ölüdeniz and environs, under forest vegetation, on soil, 500 m, 1994 (ES3). ES1-ES3 are indicated that Eurhynchium striatum. Kor is indicated that Koray ALTANby collecting and defining moss species. Rhynchostegium murale (Hedw.) Schimp. (Figure 1c).
A. 3351, A. 3353, A. 3358: Kırklareli, Istranca, between İğneada-Demirköy (Turkey), 600 m, on soil; on old rock crevices, 1990 (RM1); (RM2); (RM3). RM1-RM3 are indicated that Rhynchostegium murale.
A is indicated that Ahmet Nuri YAYINTAS by collecting and defining moss species.Voucher spec�mens were �dent�f�ed accord�ng to below procedureby Dr. Ozlem TONGUC YAYINTAS and depos�ted �n the Canakkale Onsek�z Mart
Un�vers�ty, Appl�ed Sc�enceof College, Fisheries Technology,Turkey. The status of these taxa wasevaluated by reviewing the related literature for Turkey (Uyar and Çetin 2004, Kürschner and Erdağ 2005; Kürschner
and Frey 2011).We �nvest�gated the follow�ng spec�es: Oxystegus tenu�rostr�s (Hooker & Taylor) A. Sm�th, Eurhynch�um str�atum (Schreb. ex Hedw.) Sch�mp, Rhynchosteg�um murale (Hedw.) Sch�mp (F�gures 1 a, b, c).
(a) (b) (c) Figure 1. Moss species of (a) Oxystegus tenuirostris (Hooker & Taylor) A. Smith,
(b) Eurhynchium striatum (Schreb. ex Hedw.) Schimp, (c) Rhynchostegium murale (Hedw.) Schimp.in Turkey
Extraction of Moss Specimens Milled moss specimens were weighed, extrac-tion is carried out with chloroform, ethanol, me-thanol and water successively. 5 ml of chloro-form was added to each sample and mixed with a vortex. It was waited for 30 min in ultrasonic bath and then mixed with vortex. Then, filtered and dried drogs. The same procedure was performed using ethanol, methanol and water Gas chromatography-mass spectrometry (GC/MS) Volatile compounds from moss samples were isolated by solid-phase microextraction (SPME) technique (Pawliszyn, 2012) and iden-tified by Gas chromatography mass spectro-metry. Volatiles were tentatively identified by GC–MS. A nonpolar HP5 column (30 m × 0.25 mm i.d. × 0.25-µm film thickness; J&W Scientific) was used for separation of volatiles. The GC–MS system consisted of an HP 6890 GC and 7895C mass-selective detector (MSD; Agilent Technologies, Wilmington, DE, USA). Experimental Conditions for Methods Free radical scavenging activity (DPPH� assay) Antioxidant activities of these mosses were tested by free radical scavenging activity (DPPH� assay) of chloroform, ethanol, methanol and water extracts according to the procedures described by Srinivasan et al. Moss extract of 0.1 ml were mixed with 1.5 ml of DPPH� reagent and allowed to stand at room
temperature for 30 minutes in the dark. The absorbance was taken at 517 nm. RSD is cal-culated by measuring the average and the third the preparation of each sample. Results are calculated as % reduction (Amarowicz, 2004) (Table 2). Trolox was used as a standard. Trolox equivalent antioxidant capacity (TEAC) assay Antioxidant activity was measured using the 2,2’-azino-bis(3-ethylbenzothiazoline-6-sulfonic acid) (ABTS) method as described before (Re et al., 1999). It is based on the Trolox equivalence of the samples. Mixed with 2.45 mM potassium persulfate was 7 mM ABTS, in order to produce an ABTS+ radical. Th is radical was left in a dark room at 30 °C for 2 days to reach stable absorbance at 734 nm. Extracts were diluted in ethanol to a final concentration of 0.1 mg/mL. Ethanol was used as the blank. The ABTS+ solution was diluted with 5 mM phosphate buffer until it had an absorbance of 0.70 ± 0.02 at 734 nm. Next, 1 mL of this stock solution was taken and mixed with 10 μL of a sample solution and measured at 734 nm for 1-6 min after the initial mixing. All measurements were carried out in triplicate. The inhibition percentages were calculated as follows: Inhibition % = (AABTS + – A6.min) × 100/AABTS
+, where AABTS.+ is the absorbance of ABTS+ at 734 nm (0.700 ± 0.02) and A6.min is the 6-min absorbance aft er the addition of the sample to the ABTS+. The absorbances of the samples were compared to that of the stan-
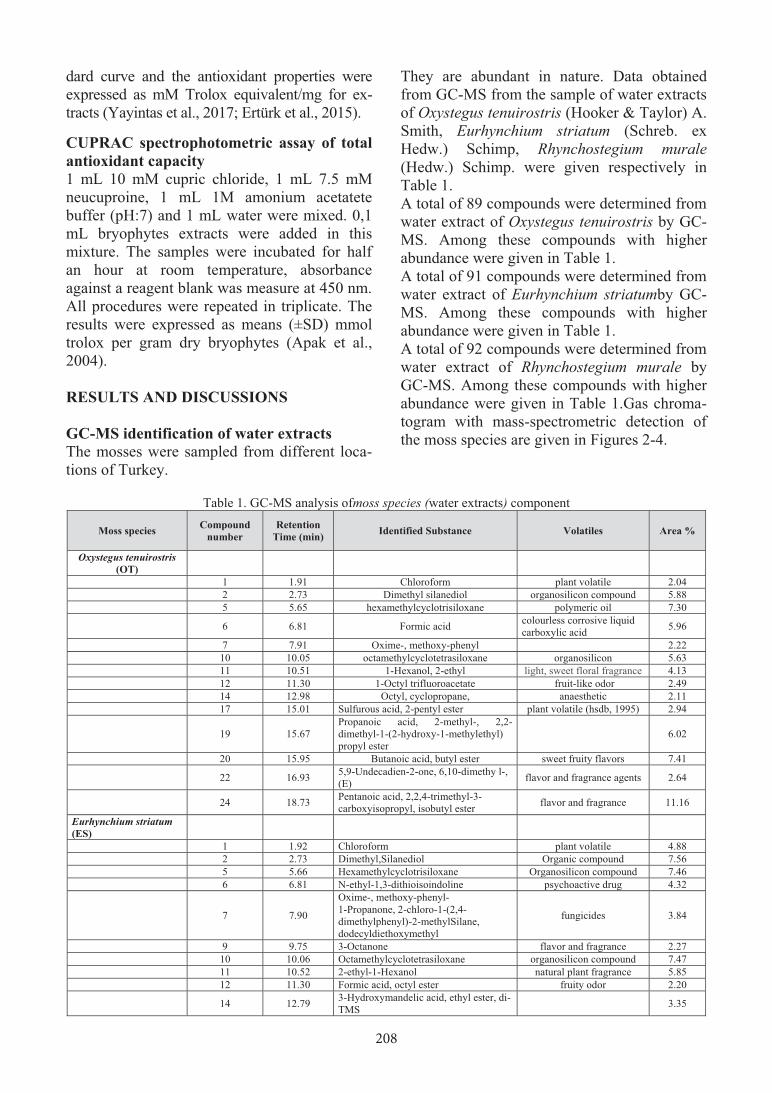
208
dard curve and the antioxidant properties were expressed as mM Trolox equivalent/mg for ex-tracts (Yayintas et al., 2017; Ertürk et al., 2015). CUPRAC spectrophotometric assay of total antioxidant capacity 1 mL 10 mM cupric chloride, 1 mL 7.5 mM neucuproine, 1 mL 1M amonium acetatete buffer (pH:7) and 1 mL water were mixed. 0,1 mL bryophytes extracts were added in this mixture. The samples were incubated for half an hour at room temperature, absorbance against a reagent blank was measure at 450 nm. All procedures were repeated in triplicate. The results were expressed as means (±SD) mmol trolox per gram dry bryophytes (Apak et al., 2004). RESULTS AND DISCUSSIONS GC-MS identification of water extracts The mosses were sampled from different loca-tions of Turkey.
They are abundant in nature. Data obtained from GC-MS from the sample of water extracts of Oxystegus tenuirostris (Hooker & Taylor) A. Smith, Eurhynchium striatum (Schreb. ex Hedw.) Schimp, Rhynchostegium murale (Hedw.) Schimp. were given respectively in Table 1. A total of 89 compounds were determined from water extract of Oxystegus tenuirostris by GC-MS. Among these compounds with higher abundance were given in Table 1. A total of 91 compounds were determined from water extract of Eurhynchium striatumby GC-MS. Among these compounds with higher abundance were given in Table 1. A total of 92 compounds were determined from water extract of Rhynchostegium murale by GC-MS. Among these compounds with higher abundance were given in Table 1.Gas chroma-togram with mass-spectrometric detection of the moss species are given in Figures 2-4.
Table 1. GC-MS analysis ofmoss species (water extracts) component
Moss species Compound number
Retention Time (min) Identified Substance Volatiles Area %
Oxystegus tenuirostris (OT)
1 1.91 Chloroform plant volatile 2.04 2 2.73 Dimethyl silanediol organosilicon compound 5.88 5 5.65 hexamethylcyclotrisiloxane polymeric oil 7.30
6 6.81 Formic acid colourless corrosive liquid carboxylic acid 5.96
7 7.91 Oxime-, methoxy-phenyl 2.22 10 10.05 octamethylcyclotetrasiloxane organosilicon 5.63 11 10.51 1-Hexanol, 2-ethyl light, sweet floral fragrance 4.13 12 11.30 1-Octyl trifluoroacetate fruit-like odor 2.49 14 12.98 Octyl, cyclopropane, anaesthetic 2.11 17 15.01 Sulfurous acid, 2-pentyl ester plant volatile (hsdb, 1995) 2.94
19 15.67 Propanoic acid, 2-methyl-, 2,2-dimethyl-1-(2-hydroxy-1-methylethyl) propyl ester
6.02
20 15.95 Butanoic acid, butyl ester sweet fruity flavors 7.41
22 16.93 5,9-Undecadien-2-one, 6,10-dimethy l-, (E) flavor and fragrance agents 2.64
24 18.73 Pentanoic acid, 2,2,4-trimethyl-3- carboxyisopropyl, isobutyl ester flavor and fragrance 11.16
Eurhynchium striatum (ES)
1 1.92 Chloroform plant volatile 4.88 2 2.73 Dimethyl,Silanediol Organic compound 7.56 5 5.66 Hexamethylcyclotrisiloxane Organosilicon compound 7.46 6 6.81 N-ethyl-1,3-dithioisoindoline psychoactive drug 4.32
7 7.90
Oxime-, methoxy-phenyl- 1-Propanone, 2-chloro-1-(2,4-dimethylphenyl)-2-methylSilane, dodecyldiethoxymethyl
fungicides 3.84
9 9.75 3-Octanone flavor and fragrance 2.27 10 10.06 Octamethylcyclotetrasiloxane organosilicon compound 7.47 11 10.52 2-ethyl-1-Hexanol natural plant fragrance 5.85 12 11.30 Formic acid, octyl ester fruity odor 2.20
14 12.79 3-Hydroxymandelic acid, ethyl ester, di-TMS 3.35
Moss species Compound number
Retention Time (min) Identified Substance Volatiles Area %
18 15.31 (3-Methoxy-phenyl)-(6-methyl-4-phenyl-quinazolin-2-yl)-amine stimulant drug 2.07
Rhynchostegium murale (RM)
1 1.93 Chloroform plant volatile 5.38 2 2.53 Dimethyl Silanediol Organic compound 7.53 3 4.59 Hexanal fruity flavors 6.35 4 5.56 Hexamethylcyclotrisiloxane polymeric oil 10.69 5 6.84 N-ethyl-1,3-dithioisoindoline psychoactive drug 2.22 7 7.87 Oxime- methoxy-phenyl fungicides 2.22 10 10.04 Octamethyl, cyclotetrasiloxane organosilicon compound 6.83
11 10.52 2-tert-Butyl-3,4,5,6- tetrahydropyridine heterocyclic compounds 4.88
24 18.11 2-phenyl-5-propylresorcin antiseptic and disinfectant 2.78
Figure 2. Gas chromatogram with mass-spectrometric detection of Oxystegus tenuirostris; numbers refer to the
compounds listed in Table 1
Figure 3. Gas chromatogram with mass-spectrometric detection of Eurhynchium striatum; numbers refer to the
compounds listed in Table 1
Figure 4. Gas chromatogram with mass-spectrometric detection of Rhynchostegium murale;
numbers refer to the compounds listed in Table 1

209
dard curve and the antioxidant properties were expressed as mM Trolox equivalent/mg for ex-tracts (Yayintas et al., 2017; Ertürk et al., 2015). CUPRAC spectrophotometric assay of total antioxidant capacity 1 mL 10 mM cupric chloride, 1 mL 7.5 mM neucuproine, 1 mL 1M amonium acetatete buffer (pH:7) and 1 mL water were mixed. 0,1 mL bryophytes extracts were added in this mixture. The samples were incubated for half an hour at room temperature, absorbance against a reagent blank was measure at 450 nm. All procedures were repeated in triplicate. The results were expressed as means (±SD) mmol trolox per gram dry bryophytes (Apak et al., 2004). RESULTS AND DISCUSSIONS GC-MS identification of water extracts The mosses were sampled from different loca-tions of Turkey.
They are abundant in nature. Data obtained from GC-MS from the sample of water extracts of Oxystegus tenuirostris (Hooker & Taylor) A. Smith, Eurhynchium striatum (Schreb. ex Hedw.) Schimp, Rhynchostegium murale (Hedw.) Schimp. were given respectively in Table 1. A total of 89 compounds were determined from water extract of Oxystegus tenuirostris by GC-MS. Among these compounds with higher abundance were given in Table 1. A total of 91 compounds were determined from water extract of Eurhynchium striatumby GC-MS. Among these compounds with higher abundance were given in Table 1. A total of 92 compounds were determined from water extract of Rhynchostegium murale by GC-MS. Among these compounds with higher abundance were given in Table 1.Gas chroma-togram with mass-spectrometric detection of the moss species are given in Figures 2-4.
Table 1. GC-MS analysis ofmoss species (water extracts) component
Moss species Compound number
Retention Time (min) Identified Substance Volatiles Area %
Oxystegus tenuirostris (OT)
1 1.91 Chloroform plant volatile 2.04 2 2.73 Dimethyl silanediol organosilicon compound 5.88 5 5.65 hexamethylcyclotrisiloxane polymeric oil 7.30
6 6.81 Formic acid colourless corrosive liquid carboxylic acid 5.96
7 7.91 Oxime-, methoxy-phenyl 2.22 10 10.05 octamethylcyclotetrasiloxane organosilicon 5.63 11 10.51 1-Hexanol, 2-ethyl light, sweet floral fragrance 4.13 12 11.30 1-Octyl trifluoroacetate fruit-like odor 2.49 14 12.98 Octyl, cyclopropane, anaesthetic 2.11 17 15.01 Sulfurous acid, 2-pentyl ester plant volatile (hsdb, 1995) 2.94
19 15.67 Propanoic acid, 2-methyl-, 2,2-dimethyl-1-(2-hydroxy-1-methylethyl) propyl ester
6.02
20 15.95 Butanoic acid, butyl ester sweet fruity flavors 7.41
22 16.93 5,9-Undecadien-2-one, 6,10-dimethy l-, (E) flavor and fragrance agents 2.64
24 18.73 Pentanoic acid, 2,2,4-trimethyl-3- carboxyisopropyl, isobutyl ester flavor and fragrance 11.16
Eurhynchium striatum (ES)
1 1.92 Chloroform plant volatile 4.88 2 2.73 Dimethyl,Silanediol Organic compound 7.56 5 5.66 Hexamethylcyclotrisiloxane Organosilicon compound 7.46 6 6.81 N-ethyl-1,3-dithioisoindoline psychoactive drug 4.32
7 7.90
Oxime-, methoxy-phenyl- 1-Propanone, 2-chloro-1-(2,4-dimethylphenyl)-2-methylSilane, dodecyldiethoxymethyl
fungicides 3.84
9 9.75 3-Octanone flavor and fragrance 2.27 10 10.06 Octamethylcyclotetrasiloxane organosilicon compound 7.47 11 10.52 2-ethyl-1-Hexanol natural plant fragrance 5.85 12 11.30 Formic acid, octyl ester fruity odor 2.20
14 12.79 3-Hydroxymandelic acid, ethyl ester, di-TMS 3.35
Moss species Compound number
Retention Time (min) Identified Substance Volatiles Area %
18 15.31 (3-Methoxy-phenyl)-(6-methyl-4-phenyl-quinazolin-2-yl)-amine stimulant drug 2.07
Rhynchostegium murale (RM)
1 1.93 Chloroform plant volatile 5.38 2 2.53 Dimethyl Silanediol Organic compound 7.53 3 4.59 Hexanal fruity flavors 6.35 4 5.56 Hexamethylcyclotrisiloxane polymeric oil 10.69 5 6.84 N-ethyl-1,3-dithioisoindoline psychoactive drug 2.22 7 7.87 Oxime- methoxy-phenyl fungicides 2.22 10 10.04 Octamethyl, cyclotetrasiloxane organosilicon compound 6.83
11 10.52 2-tert-Butyl-3,4,5,6- tetrahydropyridine heterocyclic compounds 4.88
24 18.11 2-phenyl-5-propylresorcin antiseptic and disinfectant 2.78
Figure 2. Gas chromatogram with mass-spectrometric detection of Oxystegus tenuirostris; numbers refer to the
compounds listed in Table 1
Figure 3. Gas chromatogram with mass-spectrometric detection of Eurhynchium striatum; numbers refer to the
compounds listed in Table 1
Figure 4. Gas chromatogram with mass-spectrometric detection of Rhynchostegium murale;
numbers refer to the compounds listed in Table 1

210
Free radical scavenging activity (DPPH� assay) of these mosses was given in Table 2.
Table 2. Free radical scavenging activity (DDPH asssay) of different solvent extracts of mosses (mg/g)
Sample and (location)* Chloroform Ethanol Methanol Water
Mean RSD Mean RSD Mean RSD Mean RSD
OT1 29.03 4.69 35.83 5.21 15.48 3.71 24.98 4.64
OT2 25.45 4.25 18.83 0.69 16.81 1.26 27.64 1.69
OT3 24.85 2.34 21.17 10.58 7.78 2.55 34.13 2.88
Average 26.44 3.79 25.27 5.49 13.35 2.50 28.91 3.07
ES1 33.94 5.21 23.92 4.86 24.23 0.54 26.04 1.61
ES2 31.83 3.82 26.06 2.74 25.50 14.83 25.28 6.72
ES3 24.67 3.13 25.83 4.14 23.20 8.58 22.54 4.04
Average 30.14 4.05 25.27 3.91 24.31 7.98 24.62 4.12
RM1 67.12 2.20 22.74 2.25 20.91 8.60 12.56 13.53
RM2 28.32 1.59 22.59 7.92 19.45 7.10 21.92 2.94
RM3 25.11 1.38 22.65 1.82 20.01 4.88 25.67 9.24
Average 40.18 3.44 22.66 3,99 20.12 6.86 20.05 8.57
In general, when Table 2 is evaluated the chloroform extract of RM1 has been shown higher value than the other RM species. This value should be taken the evaluation of the results by the Q test (90 confident level). There is no difference between the moss species and the extraction solvents according to the free radical scavenging method (DDPH) (p>0.05). TEAC spectrophotometric assay of total
antioxidant capacity of mosses is given in Table 3. In Table 3, the results of antioxidant capacity of the mosses determined by TEAC method is given.As it can be seen in Table 3 the methanol extracts of all kinds of mosses showed higher antioxidant capacity by TEAC method. Different results were teken from thesame group of mosses in the same solvent.
Table 3. Antioxidant activities of these mosses were tested by TEAC spectrophotometric method of chloroform,
ethanol, methanol and water extracts (mg/g)
When the result were compared statistically, the different values couldn't be eliminated (the Q test 90 confident level) and there were no difference between the extraction solvents,
p>0.05). The third method was CUPRAC for the determination of antioxidant capacity of the mosses. The results were given in Table 4.
Sample and (location)* Chloroform Ethanol Methanol Water
Mean RSD Mean RSD Mean RSD Mean RSD
OT1 840.66 1.43 597.44 3.17 6586.52 2.13 1373.09 3.72
OT2 687.57 4.46 1280.14 1.36 7454.92 3.18 1459.30 2.23
OT3 994.40 3.22 957.28 1.45 5046.73 5.43 1073.76 1.75
Average 840.87 3.03 944.95 1.99 6362.72 3.58 1302.05 2.56
ES1 688.52 2.91 1264.49 1.03 6490.16 3.71 1854.40 1.62
ES2 1822.30 4.25 1561.95 2.62 2506.23 1.63 4642.42 1.20
ES3 2060.52 0.88 1608.21 5.47 3498.50 0.26 5631.23 3.23
Average 1523.78 2.68 1478.21 3.04 4164.96 1.86 4042.68 2.01
RM1 958.07 0.85 1088.29 3.00 6891.34 1.04 819.91 4.13
RM2 562.07 0.99 1765.77 4.24 6710.46 2.19 676.41 0.46
RM3 1021.64 0.70 1315.97 5.58 4624.78 2.34 721.76 2.36
Average 847.26 0.84 1390.01 4.27 6075.52 1.85 739.36 2.31
Table 4. Antioxidant activities of these mosses were tested by CUPRAC spectrophotometric method of chloroform, ethanol, methanol and water extracts (mg/g)
Sample and (location)*
Chloroform Ethanol Methanol Water
Mean RSD Mean RSD Mean RSD Mean RSD
OT1 12.08 1.90 7.74 4.38 4.23 2.00 6.03 4.26
OT2 11.23 3.50 10.42 8.34 9.64 7.49 4.92 2.50
OT3 13.57 4.13 12.57 9.76 4.27 3.88 7.10 5.69
Average 12.29 3.17 10.24 7.49 6.04 4.45 6.01 4.15
ES1 9.78 5.32 5.88 16.31 5.21 5.73 6.36 5.35
ES2 47.93 0.53 20.64 3.52 29.71 5.73 20.74 1.28
ES3 64.60 2.28 28.37 1.99 30.54 6.83 27.77 2.19
Average 40.77 2.71 18.29 7.27 21.82 6.09 18.29 2.94
RM1 11.66 3.62 5.62 5.62 5.16 5.54 6.53 6.97
RM2 22.78 4.08 6.11 6.94 8.15 6.97 5.77 5.83
RM3 18.95 4.43 5.84 6.53 8.52 5.18 10.84 3.12
Average 17.79 4.04 5.85 6.36 7.27 5.89 7.71 5.30
In CUPRAC method, chloroform is the best solvent for the extraction. Chloroform extracts of all the species of mosses had higher antioxiant capactity than the other solvent extracts. Q test were done for the evaluate the values.When we look at the Table 4, the extraction values of E. striatum collected with Kor26 code in chloroform, ethanol, methanol and water were found to be quite low compared to other samples (Kor32 and Kor38). The reason for this may be attributed to the fact that the cormorant species of Kor 26 has been collected from a semi-shaded area, over rock and near the roadside.As shown in Table 3, the amounts of antioxidants in the same species of Oxytegus tenuirostris vary. The difference between the antioxidant values of the O. tenuirostris species can be attributed to the collection of the same species from different heights. The same situation is seen in Eurhynchium striatum and Rhynchostegium murale species.As seen from Tables 2-4, climate is the most important ecological factor that determines the bryophyte types and the basic characters and the distribution areas of the bryophytes associa-tions. The common effects of the climate factors such as heat, humidity, rain, and light have important role in formation of the bryophyte vegetation of a place. Depending on these factors, antioxidant amounts in our species vary both within themselves and
between species. Bryophytes possess strong antioxidative enzymatic machinery which helps them to cope up with extreme climates and stresses (Glime, 2007). Mosses holds good antioxidant capacity and has high phenolic content however; significant difference was also observed in the solvent system used along with the difference in the antioxidant capacity in the plant sample collected from different locations. The maximum antioxidant capacity was observed by DPPH forthe chloroform extract of Rhynchostegium murale collected from Kırklareli, Istranca (Turkey) than other area, extracts and moss speciemens. The maximum antioxidant capacity was observed by TEAC for the methanol extract of Oxytegus tenuirostris collected from Osmaniye (Turkey) than other area, extracts and moss speciemens. The maximum antioxidant capacity was observed by CUPRAC for the chlorofom extract of Eurhynchium striatum collected from Fethiye (Turkey) than other area, extracts and moss speciemens. Erturk and his colleagues (2015) was found the phenolic content of Hypnum lutescens was considerably higher than H. sericeum. Among the moss samples, H. sericeum and E. sriatulum showed nearly the same CUPRAC, FRAP activity, and resulted highest antioxidant activity, 142.91±0.23 µmol Trolox/100 g sample and 118.12±0.42 µmol Trolox/100 g sample respectively.
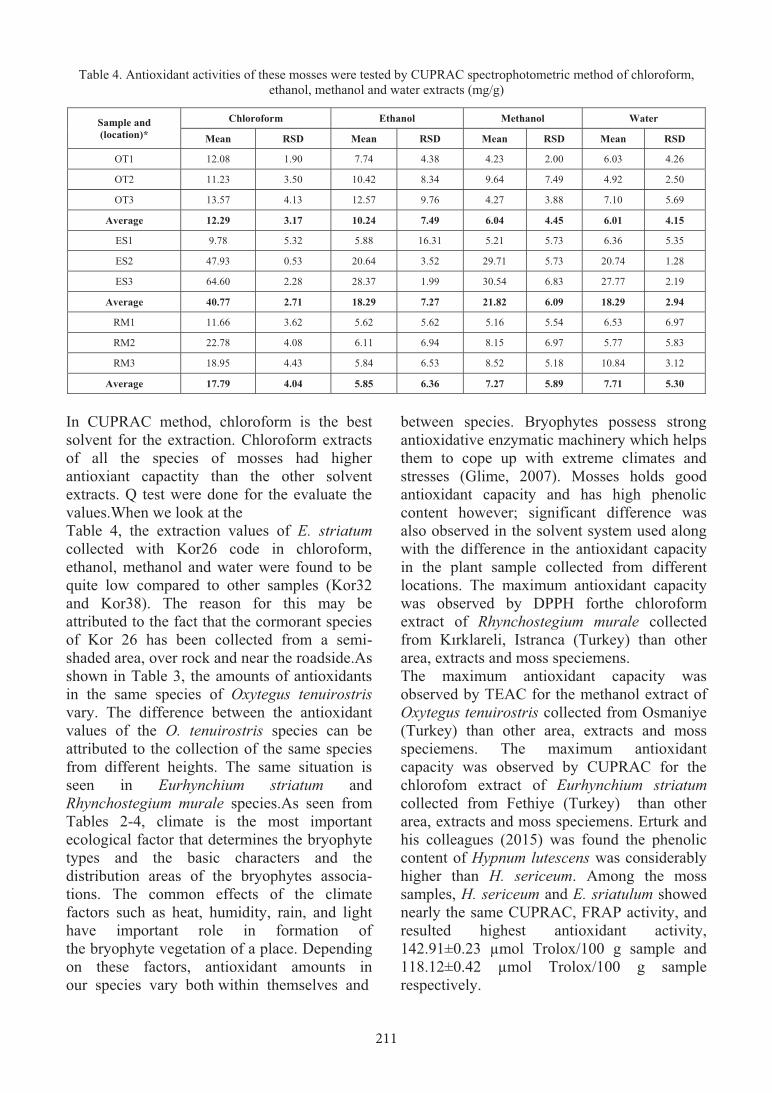
211
Free radical scavenging activity (DPPH� assay) of these mosses was given in Table 2.
Table 2. Free radical scavenging activity (DDPH asssay) of different solvent extracts of mosses (mg/g)
Sample and (location)* Chloroform Ethanol Methanol Water
Mean RSD Mean RSD Mean RSD Mean RSD
OT1 29.03 4.69 35.83 5.21 15.48 3.71 24.98 4.64
OT2 25.45 4.25 18.83 0.69 16.81 1.26 27.64 1.69
OT3 24.85 2.34 21.17 10.58 7.78 2.55 34.13 2.88
Average 26.44 3.79 25.27 5.49 13.35 2.50 28.91 3.07
ES1 33.94 5.21 23.92 4.86 24.23 0.54 26.04 1.61
ES2 31.83 3.82 26.06 2.74 25.50 14.83 25.28 6.72
ES3 24.67 3.13 25.83 4.14 23.20 8.58 22.54 4.04
Average 30.14 4.05 25.27 3.91 24.31 7.98 24.62 4.12
RM1 67.12 2.20 22.74 2.25 20.91 8.60 12.56 13.53
RM2 28.32 1.59 22.59 7.92 19.45 7.10 21.92 2.94
RM3 25.11 1.38 22.65 1.82 20.01 4.88 25.67 9.24
Average 40.18 3.44 22.66 3,99 20.12 6.86 20.05 8.57
In general, when Table 2 is evaluated the chloroform extract of RM1 has been shown higher value than the other RM species. This value should be taken the evaluation of the results by the Q test (90 confident level). There is no difference between the moss species and the extraction solvents according to the free radical scavenging method (DDPH) (p>0.05). TEAC spectrophotometric assay of total
antioxidant capacity of mosses is given in Table 3. In Table 3, the results of antioxidant capacity of the mosses determined by TEAC method is given.As it can be seen in Table 3 the methanol extracts of all kinds of mosses showed higher antioxidant capacity by TEAC method. Different results were teken from thesame group of mosses in the same solvent.
Table 3. Antioxidant activities of these mosses were tested by TEAC spectrophotometric method of chloroform,
ethanol, methanol and water extracts (mg/g)
When the result were compared statistically, the different values couldn't be eliminated (the Q test 90 confident level) and there were no difference between the extraction solvents,
p>0.05). The third method was CUPRAC for the determination of antioxidant capacity of the mosses. The results were given in Table 4.
Sample and (location)* Chloroform Ethanol Methanol Water
Mean RSD Mean RSD Mean RSD Mean RSD
OT1 840.66 1.43 597.44 3.17 6586.52 2.13 1373.09 3.72
OT2 687.57 4.46 1280.14 1.36 7454.92 3.18 1459.30 2.23
OT3 994.40 3.22 957.28 1.45 5046.73 5.43 1073.76 1.75
Average 840.87 3.03 944.95 1.99 6362.72 3.58 1302.05 2.56
ES1 688.52 2.91 1264.49 1.03 6490.16 3.71 1854.40 1.62
ES2 1822.30 4.25 1561.95 2.62 2506.23 1.63 4642.42 1.20
ES3 2060.52 0.88 1608.21 5.47 3498.50 0.26 5631.23 3.23
Average 1523.78 2.68 1478.21 3.04 4164.96 1.86 4042.68 2.01
RM1 958.07 0.85 1088.29 3.00 6891.34 1.04 819.91 4.13
RM2 562.07 0.99 1765.77 4.24 6710.46 2.19 676.41 0.46
RM3 1021.64 0.70 1315.97 5.58 4624.78 2.34 721.76 2.36
Average 847.26 0.84 1390.01 4.27 6075.52 1.85 739.36 2.31
Table 4. Antioxidant activities of these mosses were tested by CUPRAC spectrophotometric method of chloroform, ethanol, methanol and water extracts (mg/g)
Sample and (location)*
Chloroform Ethanol Methanol Water
Mean RSD Mean RSD Mean RSD Mean RSD
OT1 12.08 1.90 7.74 4.38 4.23 2.00 6.03 4.26
OT2 11.23 3.50 10.42 8.34 9.64 7.49 4.92 2.50
OT3 13.57 4.13 12.57 9.76 4.27 3.88 7.10 5.69
Average 12.29 3.17 10.24 7.49 6.04 4.45 6.01 4.15
ES1 9.78 5.32 5.88 16.31 5.21 5.73 6.36 5.35
ES2 47.93 0.53 20.64 3.52 29.71 5.73 20.74 1.28
ES3 64.60 2.28 28.37 1.99 30.54 6.83 27.77 2.19
Average 40.77 2.71 18.29 7.27 21.82 6.09 18.29 2.94
RM1 11.66 3.62 5.62 5.62 5.16 5.54 6.53 6.97
RM2 22.78 4.08 6.11 6.94 8.15 6.97 5.77 5.83
RM3 18.95 4.43 5.84 6.53 8.52 5.18 10.84 3.12
Average 17.79 4.04 5.85 6.36 7.27 5.89 7.71 5.30
In CUPRAC method, chloroform is the best solvent for the extraction. Chloroform extracts of all the species of mosses had higher antioxiant capactity than the other solvent extracts. Q test were done for the evaluate the values.When we look at the Table 4, the extraction values of E. striatum collected with Kor26 code in chloroform, ethanol, methanol and water were found to be quite low compared to other samples (Kor32 and Kor38). The reason for this may be attributed to the fact that the cormorant species of Kor 26 has been collected from a semi-shaded area, over rock and near the roadside.As shown in Table 3, the amounts of antioxidants in the same species of Oxytegus tenuirostris vary. The difference between the antioxidant values of the O. tenuirostris species can be attributed to the collection of the same species from different heights. The same situation is seen in Eurhynchium striatum and Rhynchostegium murale species.As seen from Tables 2-4, climate is the most important ecological factor that determines the bryophyte types and the basic characters and the distribution areas of the bryophytes associa-tions. The common effects of the climate factors such as heat, humidity, rain, and light have important role in formation of the bryophyte vegetation of a place. Depending on these factors, antioxidant amounts in our species vary both within themselves and
between species. Bryophytes possess strong antioxidative enzymatic machinery which helps them to cope up with extreme climates and stresses (Glime, 2007). Mosses holds good antioxidant capacity and has high phenolic content however; significant difference was also observed in the solvent system used along with the difference in the antioxidant capacity in the plant sample collected from different locations. The maximum antioxidant capacity was observed by DPPH forthe chloroform extract of Rhynchostegium murale collected from Kırklareli, Istranca (Turkey) than other area, extracts and moss speciemens. The maximum antioxidant capacity was observed by TEAC for the methanol extract of Oxytegus tenuirostris collected from Osmaniye (Turkey) than other area, extracts and moss speciemens. The maximum antioxidant capacity was observed by CUPRAC for the chlorofom extract of Eurhynchium striatum collected from Fethiye (Turkey) than other area, extracts and moss speciemens. Erturk and his colleagues (2015) was found the phenolic content of Hypnum lutescens was considerably higher than H. sericeum. Among the moss samples, H. sericeum and E. sriatulum showed nearly the same CUPRAC, FRAP activity, and resulted highest antioxidant activity, 142.91±0.23 µmol Trolox/100 g sample and 118.12±0.42 µmol Trolox/100 g sample respectively.

212
CONCLUSIONS This study presents the results of moss extracts of Oxytegus tenuirostris, Eurhynchium striatum W. P. Schimper and Rhynchostegium murale (Hedw.) Schimp were collected from different locations of Turkey by chemical composition antioxidant activities. To the best of our knowledge, these properties of mosses extracts have not been previously reported; thus, the results reported here are preliminary reports on the properties 3 different extracts of the mentioned mosses. Most of the extracts presented significant antioxidant activity in DPPH*, TEAC and CUPRAC tests. Significant changes were observed in the antioxidant quantities of the applied methods, the solvents used and the species studied according to the area of collection of the moss samples. Climate is the most important ecological factor that determines the bryophyte types and the basic characters and the distribution areas of the bryophytes associations. The common effects of the climate factors such as heat, humidity, rain, and light have important role in formation of the bryophyte vegetation of a place. Depending on these factors, antioxidant amounts in our species vary both within themselves and between species. Naturally occurring antioxidant compounds are detected and can be obtained purely by working on the mosses. These compounds can be used in the pharmaceutical, cosmetic and food industries. Thus, we can obtain new and more effective compounds that enhance cellular defense. Many future studies with mosses may be promising in the formation, progression and treatment of many diseases. Oxidative stress, which is the aging effect, can be suppressed and the aging process can be slowed down and a longer and healthier life can be possible. On the basis of the results, it is suggested that the extract of three moss species determined here could be of use as an easily accessible source of natural antioxidant for the treatment. REFERENCES Amarowicz R., Pegg R.B., Rahimi-Maghaddam P., 2004.
Food Chemistry. 84,p. 551-562. Apak R., Güçlü K., Özyürek M., Karademir S.E., 2004.
A novel total antioxidant capacity index for dietary polyphenols, vitamins C and E, using their cupric ion
reducing capability in the presence of neocuproine: CUPRAC method. J Agric Food Chem. 52, p. 7970–7981.
Asakawa Y., 2004. Chemosystematics of the Hepaticae. Phytochemistry, 65, p. 623-669.
Barros L., Baptista P., Ferreira I.C.F.R., 2007. Effect of Lactarius piperatus fruiting body maturity stage on antioxidant activity measured by several biochemical assays. Food Chem Toxicol. 45, p. 1731-1737.
Crosby M.R., Magill R.E., Allen B., He S., 1999. Checklist of mosses. Missouri Botanical Gardens, St. Louis.
Ertürk Ö., Sahın H., Ertürk E.Y., Hotaman H.E., Koz B., Özdemr Ö., 2015. The antimicrobial and antioxidant activities of extracts obtained from some moss species in Turkey. Herba Pol., 61 (4), p. 52-65.
Frahm J.P., 2004. Recent developments of commercial products from bryophytes. Bryologist 107, p. 277-283.
Glime J.M., 2007. Economic and Ethnic uses of Bryophytes. In: Flora of North America: North of Mexico, Flora of North America Editorial Committee, Oxford University Press, New York, Vol. 27, Part 1,p. 14- 41.
Goffinet B., Buck W.R., 2004. Systematics of The Bryophyta (mosses): From Molecules to A Revised, Classification. In: Goffinet B, Hollowell VC & Magill RE (ed.) Molecular Systematics of Bryophytes. p. 205–239. St. Louis: Missouri Botanical Garden Press.
Halliwell B., 1996. Antioxidants in Human Health and Disease. Annual Review of Nutrition, Vol.16: p. 33-50
Hill H., Welsh T., 2006. Using peas in tilapia feed formulations. Aqua Culture Asia Pacific, 2 (3): p. 36-38
Ignatov M.S., Huttunen S., 2002. Brachytheciaceae (Bryophyta) - family of sibling genera. Arctoa 11, p. 245-296.
Kürschner H., Erdağ A., 2005. Bryophytes of Turkey: an annotated reference list of the species with synonyms from the recent literature and an annotated list of Turkish bryological literature. Turkish Journal of Botany 29: p. 95-154.
Kürschner H., Frey W., 2011. Liverworts, Mosses and Hornworts of Southwest Asia (Marchantiophyta, Bryophyta, Anthocerotophyta). Nova Hedwigia. Beiheft 139, p. 1-240.
Loliger J., 1991. Use of antioxidants in food, In: Aruoma OI and Halliwell B, Free Radials and Food Additives. Taylor and Francis, London, p. 121-150.
Miller N.J., Rice-Evans C.A., 1999. Factors influencing the antioxidant activity determined by the abts (center dot+) radical cation assay. Free Radic Res. 26: p. 195-199.
Özdamar K., 2013. Paket Programlar ile İstatistiksel Veri analizi, Cilt I, Nisan kitapevi, Ankara.
Pejin B., Sabovljević A., Soković M., Glamočlija J., Ćirić A., Vujičić M., Sabovljević M., 2012. Antimicrobial activity of Rhodobryum ontariense. Hem Ind (Chemical Industry). 66: p. 381-384.
Pejin B., Bogdanovic-Pristov J., Pejin I., Sabovljevic M., 2013. Potential antioxidant activity of the moss Bryum moravicum. Nat Prod Res., 27:p. 900-902.
Re R., Pellegrini N., Proteggente A.,1999. Antioxidant activity applying an improved ABTS radical cation decolorization assay. Free Radic Biol Med., 26: p. 1231-1237.
Sabovljevic M., Bijelovic A., Grubisic D., 2001. Bryophytes as a potential source of medicinal compounds. Med Raw., 21: p. 17-29.
Singh M., Govindarajan R., Nath V., Rawat A.K.S., Mehrotra S., 2006. Antimicrobial, wound healing and antioxidant activity of Plagiochasma appendiculatum Lehm. et Lind. Journal of Ethnopharmacology, 107(1): p. 67-72.
Uyar G., Çetin B., 2004. A New Check-List of the Mosses of Turkey. Journal of Bryology, 26, p. 203-220.
Veljıć M., Ćırıć A., Sokovıć M., Janaćkovıć P., Marin P.D., 2010. Extract, antibacterial and antifungal
activity of the liverwort (Ptilidium pulcherrimum) methanol extract. Arch Biol Sci, 62: p. 381-395, Belgrade.
Yayintas Tonguc O., Alpaslan D., Karagul Yuceer Y., Yilmaz S., Sahiner N., 2017. Chemical composition, antimicrobial, antioxidant and anthocyanin activities of mosses Cinclidotus fontinaloides (Hedw.) P. Beauv. and Palustriella commutata (Hedw.) Ochyra) gathered from Turkey, Natural Product Research, DOI: 0.1080/14786419.2016.1277355.
Zander R.H., 1993. Genera of the Pottiaceae: mosses of harsh environments. Bulletin of the Buffalo Society of Natural Sciences, 32: p. 1-378.
Zander R.H., 2007. The Pottiaceae s. str. as an evolutionary Lazarus taxon. Journal of the Hattori Botanical Laboratory, 100: p. 581-602.
Zinsmeister H.D., Becker H., Eicher T., 1991. Bryophytes, a Source of Biologically Active, Naturally Occurring Material?. Angew. Chem. Int. Ed. Engl., 30: p. 130–147.
213
CONCLUSIONS This study presents the results of moss extracts of Oxytegus tenuirostris, Eurhynchium striatum W. P. Schimper and Rhynchostegium murale (Hedw.) Schimp were collected from different locations of Turkey by chemical composition antioxidant activities. To the best of our knowledge, these properties of mosses extracts have not been previously reported; thus, the results reported here are preliminary reports on the properties 3 different extracts of the mentioned mosses. Most of the extracts presented significant antioxidant activity in DPPH*, TEAC and CUPRAC tests. Significant changes were observed in the antioxidant quantities of the applied methods, the solvents used and the species studied according to the area of collection of the moss samples. Climate is the most important ecological factor that determines the bryophyte types and the basic characters and the distribution areas of the bryophytes associations. The common effects of the climate factors such as heat, humidity, rain, and light have important role in formation of the bryophyte vegetation of a place. Depending on these factors, antioxidant amounts in our species vary both within themselves and between species. Naturally occurring antioxidant compounds are detected and can be obtained purely by working on the mosses. These compounds can be used in the pharmaceutical, cosmetic and food industries. Thus, we can obtain new and more effective compounds that enhance cellular defense. Many future studies with mosses may be promising in the formation, progression and treatment of many diseases. Oxidative stress, which is the aging effect, can be suppressed and the aging process can be slowed down and a longer and healthier life can be possible. On the basis of the results, it is suggested that the extract of three moss species determined here could be of use as an easily accessible source of natural antioxidant for the treatment. REFERENCES Amarowicz R., Pegg R.B., Rahimi-Maghaddam P., 2004.
Food Chemistry. 84,p. 551-562. Apak R., Güçlü K., Özyürek M., Karademir S.E., 2004.
A novel total antioxidant capacity index for dietary polyphenols, vitamins C and E, using their cupric ion
reducing capability in the presence of neocuproine: CUPRAC method. J Agric Food Chem. 52, p. 7970–7981.
Asakawa Y., 2004. Chemosystematics of the Hepaticae. Phytochemistry, 65, p. 623-669.
Barros L., Baptista P., Ferreira I.C.F.R., 2007. Effect of Lactarius piperatus fruiting body maturity stage on antioxidant activity measured by several biochemical assays. Food Chem Toxicol. 45, p. 1731-1737.
Crosby M.R., Magill R.E., Allen B., He S., 1999. Checklist of mosses. Missouri Botanical Gardens, St. Louis.
Ertürk Ö., Sahın H., Ertürk E.Y., Hotaman H.E., Koz B., Özdemr Ö., 2015. The antimicrobial and antioxidant activities of extracts obtained from some moss species in Turkey. Herba Pol., 61 (4), p. 52-65.
Frahm J.P., 2004. Recent developments of commercial products from bryophytes. Bryologist 107, p. 277-283.
Glime J.M., 2007. Economic and Ethnic uses of Bryophytes. In: Flora of North America: North of Mexico, Flora of North America Editorial Committee, Oxford University Press, New York, Vol. 27, Part 1,p. 14- 41.
Goffinet B., Buck W.R., 2004. Systematics of The Bryophyta (mosses): From Molecules to A Revised, Classification. In: Goffinet B, Hollowell VC & Magill RE (ed.) Molecular Systematics of Bryophytes. p. 205–239. St. Louis: Missouri Botanical Garden Press.
Halliwell B., 1996. Antioxidants in Human Health and Disease. Annual Review of Nutrition, Vol.16: p. 33-50
Hill H., Welsh T., 2006. Using peas in tilapia feed formulations. Aqua Culture Asia Pacific, 2 (3): p. 36-38
Ignatov M.S., Huttunen S., 2002. Brachytheciaceae (Bryophyta) - family of sibling genera. Arctoa 11, p. 245-296.
Kürschner H., Erdağ A., 2005. Bryophytes of Turkey: an annotated reference list of the species with synonyms from the recent literature and an annotated list of Turkish bryological literature. Turkish Journal of Botany 29: p. 95-154.
Kürschner H., Frey W., 2011. Liverworts, Mosses and Hornworts of Southwest Asia (Marchantiophyta, Bryophyta, Anthocerotophyta). Nova Hedwigia. Beiheft 139, p. 1-240.
Loliger J., 1991. Use of antioxidants in food, In: Aruoma OI and Halliwell B, Free Radials and Food Additives. Taylor and Francis, London, p. 121-150.
Miller N.J., Rice-Evans C.A., 1999. Factors influencing the antioxidant activity determined by the abts (center dot+) radical cation assay. Free Radic Res. 26: p. 195-199.
Özdamar K., 2013. Paket Programlar ile İstatistiksel Veri analizi, Cilt I, Nisan kitapevi, Ankara.
Pejin B., Sabovljević A., Soković M., Glamočlija J., Ćirić A., Vujičić M., Sabovljević M., 2012. Antimicrobial activity of Rhodobryum ontariense. Hem Ind (Chemical Industry). 66: p. 381-384.
Pejin B., Bogdanovic-Pristov J., Pejin I., Sabovljevic M., 2013. Potential antioxidant activity of the moss Bryum moravicum. Nat Prod Res., 27:p. 900-902.
Re R., Pellegrini N., Proteggente A.,1999. Antioxidant activity applying an improved ABTS radical cation decolorization assay. Free Radic Biol Med., 26: p. 1231-1237.
Sabovljevic M., Bijelovic A., Grubisic D., 2001. Bryophytes as a potential source of medicinal compounds. Med Raw., 21: p. 17-29.
Singh M., Govindarajan R., Nath V., Rawat A.K.S., Mehrotra S., 2006. Antimicrobial, wound healing and antioxidant activity of Plagiochasma appendiculatum Lehm. et Lind. Journal of Ethnopharmacology, 107(1): p. 67-72.
Uyar G., Çetin B., 2004. A New Check-List of the Mosses of Turkey. Journal of Bryology, 26, p. 203-220.
Veljıć M., Ćırıć A., Sokovıć M., Janaćkovıć P., Marin P.D., 2010. Extract, antibacterial and antifungal
activity of the liverwort (Ptilidium pulcherrimum) methanol extract. Arch Biol Sci, 62: p. 381-395, Belgrade.
Yayintas Tonguc O., Alpaslan D., Karagul Yuceer Y., Yilmaz S., Sahiner N., 2017. Chemical composition, antimicrobial, antioxidant and anthocyanin activities of mosses Cinclidotus fontinaloides (Hedw.) P. Beauv. and Palustriella commutata (Hedw.) Ochyra) gathered from Turkey, Natural Product Research, DOI: 0.1080/14786419.2016.1277355.
Zander R.H., 1993. Genera of the Pottiaceae: mosses of harsh environments. Bulletin of the Buffalo Society of Natural Sciences, 32: p. 1-378.
Zander R.H., 2007. The Pottiaceae s. str. as an evolutionary Lazarus taxon. Journal of the Hattori Botanical Laboratory, 100: p. 581-602.
Zinsmeister H.D., Becker H., Eicher T., 1991. Bryophytes, a Source of Biologically Active, Naturally Occurring Material?. Angew. Chem. Int. Ed. Engl., 30: p. 130–147.

214
AgroLife Scientific Journal - Volume 6, Number 2, 2017ISSN 2285-5718; ISSN CD-ROM 2285-5726; ISSN ONLINE 2286-0126; ISSN-L 2285-5718
IMPACT OF KAOLIN PARTICLE FILM ON LIGHT EXTINCTION
COEFFICIENT AND RADIATION USE EFFICIENCY OF PISTACHIO (Pistachia vera)
Safieh VATANDOOST1, Gholamhossein DAVARYNEJAD2, Ali TEHRANIFAR2
1University of Torbat Heydarieh,Torbat Heydarieh, Iran
2Ferdowsi University of Mashhad, Mashhad, Iran
Corresponding author email: [email protected]
Abstract Kaolin application became a common treatment in orchards against different pests like psyllid. After kaolin application a thick powdery layer covers both sides of each leaf. It is a major concern that how much this layer affect light absorbance of leaves and net plant production, although light interception can be altered by changing spacing, tree height, tree shape and/or row orientation. In order to investigate the effect of kaolin spray on light extinction coefficient and radiation use efficiency of pistachio, an experiment conducted on a commercial orchard in khorasan razavi province. Three concentrations (0%, 3% and 6%) of processed Kaolin particle film sprayed on four varieties (Ohadi, Sepid, Kalehghoochi and Akbari) of pistachio as a liquid suspension, which evaporates, leaving white colour powdery film on the surfaces of leaves, stems and fruits. Treatments arranged in a randomized block design with 3 replications. Imaging softwares used to extract canopy structure and light transmission factor. In this case that we could not measure total plant production, only dried fruit production of each tree was used to estimate RUE (Radiation Use Efficiency). The results showed that kaolin film decreased single-leaf light absorbance and increased total light absorbance of pistachio tree. K, the Light extinction coefficient was not significantly different in different concentration of kaolin treatments. Key words: Dry matter accumulation, Light intercept, Net production, RUE. INTRODUCTION Mineral-based particle films have long been considered as useful crop protectants. From the 1920s through the 1960s many growers and researchers attempted to apply mineral-based particle films to a variety of agricultural production problems (Glenn et al., 1999). Kaolin (kaolinite) a white aluminosilicate clay, with fine and porous, non-abrasive particles disperses easily in water. This inert mineral is used in the paper, paint and plastic industries, depending on the processing and characteristics of the particles (size, dimensions and brightness). It is also a component of drugs, toothpaste, cosmetics and alimentary products (Glenn and Puterka, 2005). Particle film technology (i.e. spraying canopies with a suspension of particles of various kinds of clay, leaving a film on the leaves) has long been used to limit the impact of water and heat stress on crops (Rosati et al., 2006). Different studies on crops showed that using mineral particle films may have beneficial
effects on tomato (Srinivasa Rao, 1985), peanut (Soundara Rajan et al., 1981), apple (Glenn et al., 2001) almond and walnuts (Rosati et al., 2007). Studied focused on kaolin particle films application, report that it may decrease single leaf photosynthesis which is related to the reduction in light reaching the photosynthetic apparatus, due to a 20-40% increase in reflection and decreased absorption (Grange et al., 2004; Wünsche et al., 2004; Rosati et al., 2006; Rosati et al., 2007). In contrast to these findings, Glenn et al. (2003) reported that total canopy photosynthesis increased. Wunsche et al. (2004) suggested that this is due to improved light distribution within the canopy. Rosati et al. (2007) tested the relationship between individual-leaf and canopy photosynthesis in almond and walnut by means of modeling and they report an increase in total photosynthesis. In this study we object to measure effect of kaolin application on photosynthesis active
radiation (PAR) absorption by the canopy and its possible effects on radiation use efficiency. Radiation attenuates exponentially within a canopy and is given by (1) Where I and I0, are the total PPFDs (Photosynthetic Photon Flux Density) at points below and above the canopy, respectively (Monsi and Saeki, 1953), k is the direct beam extinction coefficient and LAI is the cumulative leaf area index from the top of the canopy. (2) If k = 1 and LAI = 1, all leaves distributed randomly in the horizontal plane will intercept 63% of the incident PPFD. Taking the natural log of both sides in the above equation, (3) Ln (I/I0) = K.LAI When Ln (I/I0) was plotted against LAI, the slope of the straight line, k, is a function of the orientation of leaves forming the canopy (Acock, 1991). Plants such as grasses, which have narrow erect leaves, have a smaller k value than plants such as eggplant which have broad horizontal leaves, suggesting that PPFD penetrates further into a grass canopy than into a eggplant canopy. A k value of 0.68 for the upper leaf layer and stem in eggplant canopy was reported; it decreased to 0.63 with depth in the canopy. Suggesting the leaf area was less efficient at intercepting PPFD towards the base of the canopy. The lowest third leaf layer absorbed less than 10% PPFD incident downward on a horizontal plane above the canopy. Daily accumulated light interception and the daily dry matter production can be used to calculate light use efficiency. (4) Dry Matter Increase = LUE×LI Which DM = daily dry matter production (g/m2), LUE= Light use efficiency constant (g/MJ), LI = Light energy intercepted by the crop (MJ/m2). When we measure LI using PAR-meter tools and dry matter accumulation in plant, we can plot produced dry matter
against LI and the slope of the line will be the radiation use efficiency (Rosati et al., 2007). Two major determinants of high productivity in trees are their ability to produce high levels of assimilates in the photosynthetic process and to efficiently partition a high proportion of those assimilates into economically important organs. Here we try to the allocation of plant produced assimilates in fruits, so beside the whole canopy weight, only fruit weight used in the LUE calculation formula. Because the pistachio crop is consumed dried, accumulated dry weight of fruits at the end of season, used for calculation of RUE (Radiation use efficiency) in equations. MATERIALS AND METHODS Plant material: In this study, 4 local pistachio cultivars ohadi, sepid, kalehghoochi and akbari selected. Uniform and same aged trees of each cultivar being sprayed (using agricultural sprayer) with a 6% suspension of processed Kaolin particle film. Kaolin suspension spray repeated during growing season for 2 to 3 times to keep powder film thickness on plant organs steady. Canopy light absorption: The PAR transmitted by and reflected from the canopy was measured using a solar active radiation and power meter for each cultivar and in both kaolin treatments and controls. For the reflected PAR, the light bar was held with the sensors orientated downwards about 2 m above the highest part of the canopy; for the transmitted PAR, the light bar was held at ground level, with the sensor orientated upwards. Leaf area index calculation: LAI was calculated using hemispheric photographs taken by fish-eye lens equipped camera (Jonckheere et al., 2005). We used the scientific image processing software, Gap Light Analyzer (GLA) Version 2.0 developed by Frazer et al. (1999, 2000), to process and analyze the digital hemispheric canopy images. The software extracts canopy structure data (gap fraction, canopy openness, effective LAI) and gap light transmission indices based on a user-specified day of interest. The simplified radiation model within GLA assumes that when the sun position is obstructed by the canopy, the direct radiation is zero, and when

215
IMPACT OF KAOLIN PARTICLE FILM ON LIGHT EXTINCTION
COEFFICIENT AND RADIATION USE EFFICIENCY OF PISTACHIO (Pistachia vera)
Safieh VATANDOOST1, Gholamhossein DAVARYNEJAD2, Ali TEHRANIFAR2
1University of Torbat Heydarieh,Torbat Heydarieh, Iran
2Ferdowsi University of Mashhad, Mashhad, Iran
Corresponding author email: [email protected]
Abstract Kaolin application became a common treatment in orchards against different pests like psyllid. After kaolin application a thick powdery layer covers both sides of each leaf. It is a major concern that how much this layer affect light absorbance of leaves and net plant production, although light interception can be altered by changing spacing, tree height, tree shape and/or row orientation. In order to investigate the effect of kaolin spray on light extinction coefficient and radiation use efficiency of pistachio, an experiment conducted on a commercial orchard in khorasan razavi province. Three concentrations (0%, 3% and 6%) of processed Kaolin particle film sprayed on four varieties (Ohadi, Sepid, Kalehghoochi and Akbari) of pistachio as a liquid suspension, which evaporates, leaving white colour powdery film on the surfaces of leaves, stems and fruits. Treatments arranged in a randomized block design with 3 replications. Imaging softwares used to extract canopy structure and light transmission factor. In this case that we could not measure total plant production, only dried fruit production of each tree was used to estimate RUE (Radiation Use Efficiency). The results showed that kaolin film decreased single-leaf light absorbance and increased total light absorbance of pistachio tree. K, the Light extinction coefficient was not significantly different in different concentration of kaolin treatments. Key words: Dry matter accumulation, Light intercept, Net production, RUE. INTRODUCTION Mineral-based particle films have long been considered as useful crop protectants. From the 1920s through the 1960s many growers and researchers attempted to apply mineral-based particle films to a variety of agricultural production problems (Glenn et al., 1999). Kaolin (kaolinite) a white aluminosilicate clay, with fine and porous, non-abrasive particles disperses easily in water. This inert mineral is used in the paper, paint and plastic industries, depending on the processing and characteristics of the particles (size, dimensions and brightness). It is also a component of drugs, toothpaste, cosmetics and alimentary products (Glenn and Puterka, 2005). Particle film technology (i.e. spraying canopies with a suspension of particles of various kinds of clay, leaving a film on the leaves) has long been used to limit the impact of water and heat stress on crops (Rosati et al., 2006). Different studies on crops showed that using mineral particle films may have beneficial
effects on tomato (Srinivasa Rao, 1985), peanut (Soundara Rajan et al., 1981), apple (Glenn et al., 2001) almond and walnuts (Rosati et al., 2007). Studied focused on kaolin particle films application, report that it may decrease single leaf photosynthesis which is related to the reduction in light reaching the photosynthetic apparatus, due to a 20-40% increase in reflection and decreased absorption (Grange et al., 2004; Wünsche et al., 2004; Rosati et al., 2006; Rosati et al., 2007). In contrast to these findings, Glenn et al. (2003) reported that total canopy photosynthesis increased. Wunsche et al. (2004) suggested that this is due to improved light distribution within the canopy. Rosati et al. (2007) tested the relationship between individual-leaf and canopy photosynthesis in almond and walnut by means of modeling and they report an increase in total photosynthesis. In this study we object to measure effect of kaolin application on photosynthesis active
radiation (PAR) absorption by the canopy and its possible effects on radiation use efficiency. Radiation attenuates exponentially within a canopy and is given by (1) Where I and I0, are the total PPFDs (Photosynthetic Photon Flux Density) at points below and above the canopy, respectively (Monsi and Saeki, 1953), k is the direct beam extinction coefficient and LAI is the cumulative leaf area index from the top of the canopy. (2) If k = 1 and LAI = 1, all leaves distributed randomly in the horizontal plane will intercept 63% of the incident PPFD. Taking the natural log of both sides in the above equation, (3) Ln (I/I0) = K.LAI When Ln (I/I0) was plotted against LAI, the slope of the straight line, k, is a function of the orientation of leaves forming the canopy (Acock, 1991). Plants such as grasses, which have narrow erect leaves, have a smaller k value than plants such as eggplant which have broad horizontal leaves, suggesting that PPFD penetrates further into a grass canopy than into a eggplant canopy. A k value of 0.68 for the upper leaf layer and stem in eggplant canopy was reported; it decreased to 0.63 with depth in the canopy. Suggesting the leaf area was less efficient at intercepting PPFD towards the base of the canopy. The lowest third leaf layer absorbed less than 10% PPFD incident downward on a horizontal plane above the canopy. Daily accumulated light interception and the daily dry matter production can be used to calculate light use efficiency. (4) Dry Matter Increase = LUE×LI Which DM = daily dry matter production (g/m2), LUE= Light use efficiency constant (g/MJ), LI = Light energy intercepted by the crop (MJ/m2). When we measure LI using PAR-meter tools and dry matter accumulation in plant, we can plot produced dry matter
against LI and the slope of the line will be the radiation use efficiency (Rosati et al., 2007). Two major determinants of high productivity in trees are their ability to produce high levels of assimilates in the photosynthetic process and to efficiently partition a high proportion of those assimilates into economically important organs. Here we try to the allocation of plant produced assimilates in fruits, so beside the whole canopy weight, only fruit weight used in the LUE calculation formula. Because the pistachio crop is consumed dried, accumulated dry weight of fruits at the end of season, used for calculation of RUE (Radiation use efficiency) in equations. MATERIALS AND METHODS Plant material: In this study, 4 local pistachio cultivars ohadi, sepid, kalehghoochi and akbari selected. Uniform and same aged trees of each cultivar being sprayed (using agricultural sprayer) with a 6% suspension of processed Kaolin particle film. Kaolin suspension spray repeated during growing season for 2 to 3 times to keep powder film thickness on plant organs steady. Canopy light absorption: The PAR transmitted by and reflected from the canopy was measured using a solar active radiation and power meter for each cultivar and in both kaolin treatments and controls. For the reflected PAR, the light bar was held with the sensors orientated downwards about 2 m above the highest part of the canopy; for the transmitted PAR, the light bar was held at ground level, with the sensor orientated upwards. Leaf area index calculation: LAI was calculated using hemispheric photographs taken by fish-eye lens equipped camera (Jonckheere et al., 2005). We used the scientific image processing software, Gap Light Analyzer (GLA) Version 2.0 developed by Frazer et al. (1999, 2000), to process and analyze the digital hemispheric canopy images. The software extracts canopy structure data (gap fraction, canopy openness, effective LAI) and gap light transmission indices based on a user-specified day of interest. The simplified radiation model within GLA assumes that when the sun position is obstructed by the canopy, the direct radiation is zero, and when

216
unobstructed, direct radiation is equal to the above-canopy value (Frazer et al., 1999; Hardy et al., 2004). Light Absorbance Coefficient: K the coefficient of light absorbance (Light absorbance factor), RUE of all pistachio cultivars in different kaolin treatments calculated using equation one. Radiation use efficiency: RUE of each treated tree calculated using equation four based on dry fruit weight production. Data Analysis: Experimental procedure was a complete block design with three blocks and one tree of each pistachio cultivar for each kaolin treatment. Totally 27 pistachio trees being treated during experiment. RESULTS AND DISCUSSIONS Leaf area data, calculated using Gap light analyzer showed in Table 1. Only differences in Akbari cultivar were significant between kaolin and control and in other studied cultivars there were no significant differences between kaolin treatments. Table 1. Effect of kaolin treatment on LAI, K and LUE
in different pistachio cultivars
Kaolin Treatment Cultivar LAI K LUE
Control
Akbari 1.598a 0.609b 0.355ab Ohadi 1.138c 0.876a 0.267b Sefid 1.423b 0.669b 0.400a
Kalehghoochi 1.493b 0.629b 0.248b
6 %
Akbari 1.448b 0.725b 0.396a Ohadi 1.076c 0.914a 0.378a Sefid 1.361b 0.731b 0.433a
Kalehghoochi 1.411b 0.744b 0.468a Data with different letters in each column have significant differences (P≤5%)
For K, the light extinction coefficient, all kaolin treated trees have higher levels but they were not significantly differ from control. Ohadi in both treatments had the highest K (Table 1). Generally, LUE was higher in kaolin treated pistachios, although differences between kaolin treatment in Akbari and sepid were not significant. Light use efficiency of pistachio cultivars showed significant differences for Kaleghoochi and Ohadi between kaolin and control (Table 1, Figure 1). In fact, top-canopy leaves often operate near light saturation and
their LUE is improved at lower light, while inner-canopy leaves operate more often at low light and their LUE is improved at higher light (Hirose and Bazzaz, 1998). Skewing the light distribution towards inner-canopy leaves, as kaolin application did (Figure 2), would therefore result in improved canopy LUE, as previously found in Almont and Walnut (Rosati et al., 2007) or Prunus under water stress (Lampinen et al., 2004).
Figure 1. Light use efficiency of different pistachio cultivars (total fruit production basis)
Figure 2. Total and diffuse irradiance in control and
kaolin treated pistachio tree during a day. Y axis is solar energy (MJ.m-2.day-1)
The most important parameter affected by kaolin in studied pistachio cultivars, was diffuse irradiance. For a given daily incident PAR above the canopy, kaolin application increased the daily PAR incident on individual inner-canopy leaves, as measured by the light meters. Kaolin treatment increased light reflection of leaves. So, light transmission of total and diffuse irradiance was lower in kaolin treated trees. This help tree to intercept more solar energy, however, their leaves covered by kaolin and single- leaf solar energy interception may lower in compare to control. This implies that a great part of the additional PAR reflection at the leaf level is re-intercepted and eventually absorbed within the canopy (Figure 2). These results support the hypothesis that kaolin application affects canopy light distribution (Wünsche et al., 2004). Rosati et al. (2007), reported a 200% increase in inner-canopy leaves PAR incidence in almond and walnut after kaolin application. In a normal tree, most of the photosynthesis was occurred in outer-canopy leaves, since PAR decreases exponentially with canopy depth. However, most of the leaves in the tree are actually inner-canopy leaves, which thus with an increase in PAR incident with kaolin application, they should began to have higher amount of photosynthesis. Therefore, total dry matter production of tree should increase. This explains the contradiction in the literature of increased yield with kaolin application (Stanhill et al., 1976; Moreshet et al., 1979;
Soundara Rajan et al., 1981; Srinivasa Rao, 1985; Glenn et al., 2001), despite an apparent reduction in leaf photosynthesis (Moreshet et al., 1979; Glenn et al., 2003; Grange et al., 2004; Wünsche et al., 2004; Rosati et al., 2006). CONCLUSIONS Results of this study showed that greater PPFD interception was occurred in kaolin treated pistachio trees, however, K, the light extinction factor was not significantly changed by kaolin treatment. By this increase in PPFD interception, we expect an increase in LUE and yield. There was significant increase in some of pistachio cultivars. Since we only use fruit weight for LUE calculation, it might be an increase in other tree parts dry weight as a result of higher solar energy interception which was not calculated. REFERENCES Acock B., Acock M.C., 1991. Potential for using long-
term field research data to develop and validate crop simulators. Agronomy Journal, 83(1), p. 56-61.
Frazer G.W., Canham C.D., Lertzman K.P., 1999. Gap Light Analyzer (GLA), Version 2.0: Imaging Software to Extract Canopy Structure and Gap Light Transmission Indices from True-color Fisheye Photographs, Users Manual and Program Documentation. Copyright 1999: Simon Fraser University/Institute of Ecosystem Studies, Burnaby, BC/ Millbrook/NY.
Frazer G.W., Canham C.D., Lertzman K.P., 2000. Gap Light Analyzer (GLA), Version 2.0. Technological Tools. Bulletin of the Ecological Society of America, p. 191-197.
Glenn D.M., Puterka G.J., Drake S.R., Unruh T.R., Knight A.L., Baherle P., Prado E., Baugher T.A., 2001. Particle film application influences apple leaf physiology, fruit yield, and fruit quality. Journal of American Society for Hortic. Sci. 126, p. 175-181.
Glenn D.M., Erez A., Puterka G.J., Gundrum P., 2003. Particle films affect carbon assimilation and yield in ‘Empire’ apple. Journal of American Society for Horticultural Science, 128, p. 356-362.
Grange M., Wand S.J.E., Theron K.L., 2004. Effect of kaolin applications on apple fruit quality and gas exchange of apple leaves. Acta Hortic., 636, p. 545-550.
Hardy J.P., Melloh R., Koenig G., Marks D., Winstral A., Pomeroy J.W., Link T., 2004. Solar radiation transmission through conifer canopies. Agricultural and forest meteorology, 126(3), p. 257-270.
Hirose T., Bazzaz F.A., 1998. Trade-off between light-

217
unobstructed, direct radiation is equal to the above-canopy value (Frazer et al., 1999; Hardy et al., 2004). Light Absorbance Coefficient: K the coefficient of light absorbance (Light absorbance factor), RUE of all pistachio cultivars in different kaolin treatments calculated using equation one. Radiation use efficiency: RUE of each treated tree calculated using equation four based on dry fruit weight production. Data Analysis: Experimental procedure was a complete block design with three blocks and one tree of each pistachio cultivar for each kaolin treatment. Totally 27 pistachio trees being treated during experiment. RESULTS AND DISCUSSIONS Leaf area data, calculated using Gap light analyzer showed in Table 1. Only differences in Akbari cultivar were significant between kaolin and control and in other studied cultivars there were no significant differences between kaolin treatments. Table 1. Effect of kaolin treatment on LAI, K and LUE
in different pistachio cultivars
Kaolin Treatment Cultivar LAI K LUE
Control
Akbari 1.598a 0.609b 0.355ab Ohadi 1.138c 0.876a 0.267b Sefid 1.423b 0.669b 0.400a
Kalehghoochi 1.493b 0.629b 0.248b
6 %
Akbari 1.448b 0.725b 0.396a Ohadi 1.076c 0.914a 0.378a Sefid 1.361b 0.731b 0.433a
Kalehghoochi 1.411b 0.744b 0.468a Data with different letters in each column have significant differences (P≤5%)
For K, the light extinction coefficient, all kaolin treated trees have higher levels but they were not significantly differ from control. Ohadi in both treatments had the highest K (Table 1). Generally, LUE was higher in kaolin treated pistachios, although differences between kaolin treatment in Akbari and sepid were not significant. Light use efficiency of pistachio cultivars showed significant differences for Kaleghoochi and Ohadi between kaolin and control (Table 1, Figure 1). In fact, top-canopy leaves often operate near light saturation and
their LUE is improved at lower light, while inner-canopy leaves operate more often at low light and their LUE is improved at higher light (Hirose and Bazzaz, 1998). Skewing the light distribution towards inner-canopy leaves, as kaolin application did (Figure 2), would therefore result in improved canopy LUE, as previously found in Almont and Walnut (Rosati et al., 2007) or Prunus under water stress (Lampinen et al., 2004).
Figure 1. Light use efficiency of different pistachio cultivars (total fruit production basis)
Figure 2. Total and diffuse irradiance in control and
kaolin treated pistachio tree during a day. Y axis is solar energy (MJ.m-2.day-1)
The most important parameter affected by kaolin in studied pistachio cultivars, was diffuse irradiance. For a given daily incident PAR above the canopy, kaolin application increased the daily PAR incident on individual inner-canopy leaves, as measured by the light meters. Kaolin treatment increased light reflection of leaves. So, light transmission of total and diffuse irradiance was lower in kaolin treated trees. This help tree to intercept more solar energy, however, their leaves covered by kaolin and single- leaf solar energy interception may lower in compare to control. This implies that a great part of the additional PAR reflection at the leaf level is re-intercepted and eventually absorbed within the canopy (Figure 2). These results support the hypothesis that kaolin application affects canopy light distribution (Wünsche et al., 2004). Rosati et al. (2007), reported a 200% increase in inner-canopy leaves PAR incidence in almond and walnut after kaolin application. In a normal tree, most of the photosynthesis was occurred in outer-canopy leaves, since PAR decreases exponentially with canopy depth. However, most of the leaves in the tree are actually inner-canopy leaves, which thus with an increase in PAR incident with kaolin application, they should began to have higher amount of photosynthesis. Therefore, total dry matter production of tree should increase. This explains the contradiction in the literature of increased yield with kaolin application (Stanhill et al., 1976; Moreshet et al., 1979;
Soundara Rajan et al., 1981; Srinivasa Rao, 1985; Glenn et al., 2001), despite an apparent reduction in leaf photosynthesis (Moreshet et al., 1979; Glenn et al., 2003; Grange et al., 2004; Wünsche et al., 2004; Rosati et al., 2006). CONCLUSIONS Results of this study showed that greater PPFD interception was occurred in kaolin treated pistachio trees, however, K, the light extinction factor was not significantly changed by kaolin treatment. By this increase in PPFD interception, we expect an increase in LUE and yield. There was significant increase in some of pistachio cultivars. Since we only use fruit weight for LUE calculation, it might be an increase in other tree parts dry weight as a result of higher solar energy interception which was not calculated. REFERENCES Acock B., Acock M.C., 1991. Potential for using long-
term field research data to develop and validate crop simulators. Agronomy Journal, 83(1), p. 56-61.
Frazer G.W., Canham C.D., Lertzman K.P., 1999. Gap Light Analyzer (GLA), Version 2.0: Imaging Software to Extract Canopy Structure and Gap Light Transmission Indices from True-color Fisheye Photographs, Users Manual and Program Documentation. Copyright 1999: Simon Fraser University/Institute of Ecosystem Studies, Burnaby, BC/ Millbrook/NY.
Frazer G.W., Canham C.D., Lertzman K.P., 2000. Gap Light Analyzer (GLA), Version 2.0. Technological Tools. Bulletin of the Ecological Society of America, p. 191-197.
Glenn D.M., Puterka G.J., Drake S.R., Unruh T.R., Knight A.L., Baherle P., Prado E., Baugher T.A., 2001. Particle film application influences apple leaf physiology, fruit yield, and fruit quality. Journal of American Society for Hortic. Sci. 126, p. 175-181.
Glenn D.M., Erez A., Puterka G.J., Gundrum P., 2003. Particle films affect carbon assimilation and yield in ‘Empire’ apple. Journal of American Society for Horticultural Science, 128, p. 356-362.
Grange M., Wand S.J.E., Theron K.L., 2004. Effect of kaolin applications on apple fruit quality and gas exchange of apple leaves. Acta Hortic., 636, p. 545-550.
Hardy J.P., Melloh R., Koenig G., Marks D., Winstral A., Pomeroy J.W., Link T., 2004. Solar radiation transmission through conifer canopies. Agricultural and forest meteorology, 126(3), p. 257-270.
Hirose T., Bazzaz F.A., 1998. Trade-off between light-

218
and nitrogen-use efficiency in canopy photosynthesis. Annals of Botany, 82, p. 195-202.
Jonckheere I., Muys B., Coppin P., 2005. Allometry and evaluation of in situ optical LAI determination in Scots pine: a case study in Belgium. Tree physiology, 25(6), p. 723-732.
Lampinen B.D., Shakel K.A., Southwick S.M., Olson, W.H., DeJong T.M., 2004. Leaf and canopy level photosynthetic response of French prune (Prunus domestica L. ‘French‘) to stem water potential based deficit irrigation. Journal of Horticultural Science and Biotechnology, 79, p. 638-644.
Monsi M., Saeki T., 1953. The light factor in plant communities and its significance for dry matter production. Japanese Journal of Botany, 14, p. 22-52.
Moreshet S., Cohen Y., Fuchs M.E., 1979. Effect of increasing foliage reflectance on yield, growth, and physiological behavior of a dryland cotton crop. Crop Science, 19, p. 863-868.
Rosati A., Metcalf S.G., Buchner R.P., Fulton A.E., Lampinen B.D., 2006. Physiological effects of kaolin applications in well-irrigated and water-stressed walnut and almond trees. Annals of Botany, 98, p. 267-275.
Rosati A., Metcalf S.G., Buchner R.P., Fulton A.E., Lampinen B.D., 2007. Effects of kaolin application
on light absorption and distribution, radiation use efficiency and photosynthesis of almond and walnut canopies. Annals of botany, 99(2), p. 255-263.
Sinclair T.R., Shirawa T., Hammer G.L., 1992. Variation in crop radiation-use efficiency with increased diffused radiation. Crop Science, 32, p. 1281-1284.
Soundara Rajan, M.S., Ramkumar Reddy K., Sudhakar Rao R., Sankara Reddi G.H., 1981. Effect of antitranspirants and reflectants on pod yield of rainfed groundnut. Agric. Sci. Digest, 1, p. 205-206.
Spitters C.J.T., 1986. Separating the diffuse and direct component of global radiation and its implication for modeling canopy photosynthesis. Part II. Calculation of canopy photosynthesis. Agricultural and Forest Meteorology, 38, p. 231-242.
Srinivasa Rao N.K., 1985. The effects of antitranspirants on leaf water status, stomatal resistance and yield of tomato. Journal of Hortic. Science, 60, p. 89-92.
Stanhill G., Moreshet S., Fuchs M., 1976. Effect of increasing foliage and soil reflectivity on the yield and water use efficiency of grain sorghum. Agronomy Journal, 68, p. 329-332.
Wunsche J.N., Lombardini L., Greer D.H., 2004. Surround particle film applications - effects on whole canopy physiology of apple. Acta Horticulturae, 636, p. 565-571.
SOIL FRIABILITY ASSESSMENT OF SOME AGRICULTURAL SOILS
IN ROMANIA
Olga VIZITIU, Irina CALCIU, Cătălin SIMOTA
National Research and Development Institute for Soil Science, Agrochemistry and Environment – ICPA Bucharest, 61 Mărăști Blvd, District 1, 011464, Bucharest, Romania,
Phone +4021.318.43.49, Fax +4021.318.43.48, Email: [email protected], [email protected], [email protected]
Corresponding author email: [email protected]
Abstract Tensile strength is a dynamic property and is sensitive to soil structure because it is related to the presence of air-filled pores, the occurrence of micro-cracks and the strength of inter-granular bonds within and between micro-cracks. Moreover, the tensile strength of soil is much affected by the soil water content and processes which change pore characteristics and/or the cementation between structural units. A friability index has been proposed that is based on measurements of tensile strength of different sized aggregates. The main objectives of the present paper were to measure the mechanical properties (tensile strength and friability) of soil aggregates collected from three agricultural soils, and to explore the relationships between mechanical and basic physical properties of the investigated soils. Soils used in these investigations can be described as “friable” according to the classification used for friability index, F1, values. Soil aggregates of the sandy soil from Grădiștea had the smallest values of tensile strength. The highest values of tensile strength were recorded in case of clayey soil, whereas the loamy soil had values between the sandy and clayey soils. Increasing organic matter content decreased the values of tensile strength for soil aggregates from all soils. High values of clay content in case of loamy and clayey soils increased the values of tensile strength. Increasing amount of clay in sandy soil has been shown to increase the tensile strength of this soil. This may be due to clay particles acting as cementing materials between large particles. Higher amounts of clay in sandy soils provide more opportunities for interparticle contact. Small size classes of aggregates presented higher values of tensile strength as compared with larger size classes of aggregates when the volume dependence method was used. In case of sandy and clayey soils were found underestimates and respectively overestimates of F2 values. As for the loamy soil, the volume dependence method (F2) gave similar values when compared to the coefficient of variation method (F1). The coefficient of variation method is recommended as standard method for measuring soil friability. Key words: friability index, tensile strength, soil aggregates, aggregate size. INTRODUCTION The term “tensile strength”, Y, was defined by Dexter and Watts (2001) as the stress (force per unit area) required to breakdown the soil aggregates. Tensile strength is an indicator which describes the minimum force required during seedbed preparation when large clods are fragmented without disturbing soil microstructure (Munkholm and Kay, 2002). Tensile strength is a dynamic property (Kay and Dexter, 1992) and is sensitive to soil structure (Watts and Dexter, 1998) because it is related to the presence of air-filled pores, the occurrence of micro-cracks and the strength of inter-granular bonds within and between micro-cracks.
Moreover, the tensile strength of soil is much affected by the soil water content and processes which change pore characteristics and/or the cementation between structural units (Kay and Dexter, 1992). A friability index has been proposed that is based on measurements of tensile strength of different sized aggregates (Utomo and Dexter, 1981b). Friability, F, is defined as ‘the tendency of large clods or aggregates to breakdown and crumble under an applied stress into a certain size range of smaller fragments (aggregates)’ (Utomo and Dexter, 1981b). This property is one of the objectives of tillage because a friable soil is much easier to till and large clods are relatively weak whereas the smaller aggregates are relatively strong and resistant to further breakdown (Dexter, 1997).

219
and nitrogen-use efficiency in canopy photosynthesis. Annals of Botany, 82, p. 195-202.
Jonckheere I., Muys B., Coppin P., 2005. Allometry and evaluation of in situ optical LAI determination in Scots pine: a case study in Belgium. Tree physiology, 25(6), p. 723-732.
Lampinen B.D., Shakel K.A., Southwick S.M., Olson, W.H., DeJong T.M., 2004. Leaf and canopy level photosynthetic response of French prune (Prunus domestica L. ‘French‘) to stem water potential based deficit irrigation. Journal of Horticultural Science and Biotechnology, 79, p. 638-644.
Monsi M., Saeki T., 1953. The light factor in plant communities and its significance for dry matter production. Japanese Journal of Botany, 14, p. 22-52.
Moreshet S., Cohen Y., Fuchs M.E., 1979. Effect of increasing foliage reflectance on yield, growth, and physiological behavior of a dryland cotton crop. Crop Science, 19, p. 863-868.
Rosati A., Metcalf S.G., Buchner R.P., Fulton A.E., Lampinen B.D., 2006. Physiological effects of kaolin applications in well-irrigated and water-stressed walnut and almond trees. Annals of Botany, 98, p. 267-275.
Rosati A., Metcalf S.G., Buchner R.P., Fulton A.E., Lampinen B.D., 2007. Effects of kaolin application
on light absorption and distribution, radiation use efficiency and photosynthesis of almond and walnut canopies. Annals of botany, 99(2), p. 255-263.
Sinclair T.R., Shirawa T., Hammer G.L., 1992. Variation in crop radiation-use efficiency with increased diffused radiation. Crop Science, 32, p. 1281-1284.
Soundara Rajan, M.S., Ramkumar Reddy K., Sudhakar Rao R., Sankara Reddi G.H., 1981. Effect of antitranspirants and reflectants on pod yield of rainfed groundnut. Agric. Sci. Digest, 1, p. 205-206.
Spitters C.J.T., 1986. Separating the diffuse and direct component of global radiation and its implication for modeling canopy photosynthesis. Part II. Calculation of canopy photosynthesis. Agricultural and Forest Meteorology, 38, p. 231-242.
Srinivasa Rao N.K., 1985. The effects of antitranspirants on leaf water status, stomatal resistance and yield of tomato. Journal of Hortic. Science, 60, p. 89-92.
Stanhill G., Moreshet S., Fuchs M., 1976. Effect of increasing foliage and soil reflectivity on the yield and water use efficiency of grain sorghum. Agronomy Journal, 68, p. 329-332.
Wunsche J.N., Lombardini L., Greer D.H., 2004. Surround particle film applications - effects on whole canopy physiology of apple. Acta Horticulturae, 636, p. 565-571.
AgroLife Scientific Journal - Volume 6, Number 2, 2017ISSN 2285-5718; ISSN CD-ROM 2285-5726; ISSN ONLINE 2286-0126; ISSN-L 2285-5718
SOIL FRIABILITY ASSESSMENT OF SOME AGRICULTURAL SOILS
IN ROMANIA
Olga VIZITIU, Irina CALCIU, Cătălin SIMOTA
National Research and Development Institute for Soil Science, Agrochemistry and Environment – ICPA Bucharest, 61 Mărăști Blvd, District 1, 011464, Bucharest, Romania,
Phone +4021.318.43.49, Fax +4021.318.43.48, Email: [email protected], [email protected], [email protected]
Corresponding author email: [email protected]
Abstract Tensile strength is a dynamic property and is sensitive to soil structure because it is related to the presence of air-filled pores, the occurrence of micro-cracks and the strength of inter-granular bonds within and between micro-cracks. Moreover, the tensile strength of soil is much affected by the soil water content and processes which change pore characteristics and/or the cementation between structural units. A friability index has been proposed that is based on measurements of tensile strength of different sized aggregates. The main objectives of the present paper were to measure the mechanical properties (tensile strength and friability) of soil aggregates collected from three agricultural soils, and to explore the relationships between mechanical and basic physical properties of the investigated soils. Soils used in these investigations can be described as “friable” according to the classification used for friability index, F1, values. Soil aggregates of the sandy soil from Grădiștea had the smallest values of tensile strength. The highest values of tensile strength were recorded in case of clayey soil, whereas the loamy soil had values between the sandy and clayey soils. Increasing organic matter content decreased the values of tensile strength for soil aggregates from all soils. High values of clay content in case of loamy and clayey soils increased the values of tensile strength. Increasing amount of clay in sandy soil has been shown to increase the tensile strength of this soil. This may be due to clay particles acting as cementing materials between large particles. Higher amounts of clay in sandy soils provide more opportunities for interparticle contact. Small size classes of aggregates presented higher values of tensile strength as compared with larger size classes of aggregates when the volume dependence method was used. In case of sandy and clayey soils were found underestimates and respectively overestimates of F2 values. As for the loamy soil, the volume dependence method (F2) gave similar values when compared to the coefficient of variation method (F1). The coefficient of variation method is recommended as standard method for measuring soil friability. Key words: friability index, tensile strength, soil aggregates, aggregate size. INTRODUCTION The term “tensile strength”, Y, was defined by Dexter and Watts (2001) as the stress (force per unit area) required to breakdown the soil aggregates. Tensile strength is an indicator which describes the minimum force required during seedbed preparation when large clods are fragmented without disturbing soil microstructure (Munkholm and Kay, 2002). Tensile strength is a dynamic property (Kay and Dexter, 1992) and is sensitive to soil structure (Watts and Dexter, 1998) because it is related to the presence of air-filled pores, the occurrence of micro-cracks and the strength of inter-granular bonds within and between micro-cracks.
Moreover, the tensile strength of soil is much affected by the soil water content and processes which change pore characteristics and/or the cementation between structural units (Kay and Dexter, 1992). A friability index has been proposed that is based on measurements of tensile strength of different sized aggregates (Utomo and Dexter, 1981b). Friability, F, is defined as ‘the tendency of large clods or aggregates to breakdown and crumble under an applied stress into a certain size range of smaller fragments (aggregates)’ (Utomo and Dexter, 1981b). This property is one of the objectives of tillage because a friable soil is much easier to till and large clods are relatively weak whereas the smaller aggregates are relatively strong and resistant to further breakdown (Dexter, 1997).

220
Theory Determination of aggregate tensile strength, Y, has been widely applied to characterize the ease of aggregate fracture in tillage (Munkholm and Kay, 2002). As it is difficult to measure Y directly in a direct tension test (Dexter and Watts, 2001), most authors have used indirect tension tests to determine Y. For a spherical aggregate, Y can be determined from the equation (Dexter and Kroesbergen, 1985):
2DPqY � (1)
where: q is the proportionality constant, P is the applied compressive force at breakdown (N), and D is the effective diameter (m). The coefficient, q, depends on the relationship between the compressive and tensile stress in the centre of the aggregate and has been used ranging from 0.576 (Braunack et al., 1979) to 1.860 (Dexter, 1988b). Utomo and Dexter (1981b) proposed the scale factor between aggregate size and the aggregate tensile strength as an index of friability, k: BVkY ee ���� loglog (2) where: V (m3) is the aggregate volume, and B (kPa) is the predicted log strength of 1m3 of soil. The intercept B can be written as: � �� �kVYB k
e ��� 1log 00 (3) where: Y0 and V0 are the strength and volume respectively of the basic soil elements, which comprise the bulk aggregates, and Γ is the tabulated Gamma function. Three methods for quantifying friability were described by Watts and Dexter (1998) and Dexter and Watts (2001), and are based on the statistical theory of brittle fracture. Briefly, this theory can be described by the “weakest link” concept: the strength of the total solid is determined by the local strength of the weakest volume element, in the same way as the strength of a chain is determined by its weakest link (Dexter and Watts, 2001). The methods for quantifying friability are as follows: 1. The first method is based upon the coefficient of variation of the tensile strength and is derived from Dexter and Watts (2001, Eq. 14). Only one size class of soil aggregates is needed for calculation of friability index using this method. The index F1, is given by:
2xY
σYσF YY
1 �� (4)
where: Yσ is the standard deviation of measured values of tensile strength, Y is the mean of the tensile strength measurements and x is the number of replicates. The second term is the standard error of the coefficient of variation or friability. 2. The volume dependence method is based on Dexter and Watts (2001, Eq. 18), and leads to:
β1F2 � (5)
where: β is obtained from the slope of a plot of
EVlogβ1Ylog eVe ��� (6)
where: YV is the tensile strength of volume V, and E is the intercept, the value of which is given in Dexter and Watts (2001, Eq. 18). Because the aggregate strength is size dependent, for this method at least 3 – 4 size classes of aggregates are needed for calculation of F2. Chan et al. (1999) found that for an Australian clayey soil: 21 2FF � (7) Dexter and Watts (2001) recommended the first method as the standard method for measuring soil friability because it is easy to calculate and because it requires fewer measurements than the second method. The main objectives of the present paper were to measure the mechanical properties (tensile strength and friability) of soil aggregates collected from three agricultural soils, and to explore the relationships between mechanical and basic physical properties of the investigated soils. MATERIALS AND METHODS Sample collection and preparation For soil tensile strength measurements samples were collected from the field. Two sampling points were located in Giurgiu county (Grădiștea, Brăniștari) and one point in Teleorman county (Drăgănești-Vlașca) so that three different textured soils were covered, namely: sandy soil, loamy soil and clayey soil. At the time of sampling the plots had been cropped with winter wheat and alfalfa. The soils were characterized using standard methods and the results are given in Table 1.
Soil aggregates from the plough layer were collected from two depth intervals (5-10 cm and 15-20 cm), and soil aggregates from the subsoil were collected from the 35-40 cm depth interval.
Table 1. Physical characterization of the soil profiles
Location Depth Clay
content Organic matter
Bulk density Texture
class (cm) (%) (%) (Mg m-3)
Grădiștea
5-10 11.7 1.55 1.46 sandy loam 15-20 11.2 1.22 1.46
35-40 8.3 0.49 1.39
Brăniștari
5-10 28.5 2.71 1.48 clayey loam 15-20 30.1 2.37 1.46
35-40 31.2 1.88 1.45
Drăgănești - Vlașca
5-10 36.5 6.39 1.20
clay 15-20 39.0 5.10 1.40
35-40 44.4 3.53 1.41 To obtain aggregates of the desired size range, a set of two sieves was used. The soil mass was carefully passed through these sieves and the remained aggregates on each sieve were placed in airtight containers in order to avoid any further mechanical disturbance of the aggregates. After completing this operation three size classes of aggregates were obtained: aggregates of diameter larger than 2 cm, between 1-2 cm, and smaller than 1 cm. In the laboratory, the soil aggregates were allowed to air dry at room temperature. After air-drying the aggregates, an additional sieving of the aggregates smaller than 1 cm in diameter was performed so that two more size classes of aggregates were obtained, namely: aggregates of diameter between 0.5-1 cm, and between 0.25-0.5 cm. These two size classes of aggregates together with aggregates of diameter larger than 2 cm and between 1 and 2 cm, were then used for determination of the friability index (F2) using the second method. In total, four classes of aggregate sizes were obtained and subsequently subjected to the crushing tests. Indirect tension tests for measurement of soil tensile strength For the size classes of aggregates larger than 1 cm a loading frame was used. The loading frame consists of two parallel plates between which the aggregates are crushed by raising the
lower plate with the help of a handle. The force acting across the soil sample is measured by a load ring. The force which is applied to the aggregates is measured by a load-ring of 0-1 kN range placed between the upper plate and the cross beam of the loading frame. In this work, 40 replicate aggregates were measured for each size class, depth and soil texture. For the size classes of aggregates smaller than 1 cm a digital balance was inserted into the loading frame and acted as a load sensor. The force P (N) applied to the aggregate is the product of the balance output in kg, and g = 9.807 m s-1, which is the acceleration of gravity (Dexter and Watts, 2001). Before crushing the aggregates, the size of each aggregate was measured by using callipers and then calculated as described below. To provide a standard sample orientation, the aggregates were then placed with the flattest side downwards on the lower plate as suggested by Dexter and Watts (2001) so that the aggregates would be crushed across their shortest axis. When the load was applied to the aggregate, the force measured increased up to the point of breakdown and a vertical crack appeared into the aggregate when a rapid drop in force was recorded. The peak force, P (N), at breakdown was recorded and then used in calculating the aggregate tensile strength (Y) using Eq. (1) with q = 0.576 and D was calculated from Eq. (8) from below. Measurement of aggregate size Aggregate diameter (D) had to be estimated before the aggregates were crushed. For the size classes of aggregates larger than 1 cm, the diameter was estimated from “Method 2” described by Dexter and Watts (2001):
3
zyx DDDD
��� (8)
where: Dx, Dy and Dz represent the longest, intermediate and smallest diameters respectively of each aggregate. Also the mass (M) of individual aggregates and the mean mass ( M ) of the aggregates in the population were recorded. To determine the friability index F1, a single size class of aggregates was used, which was
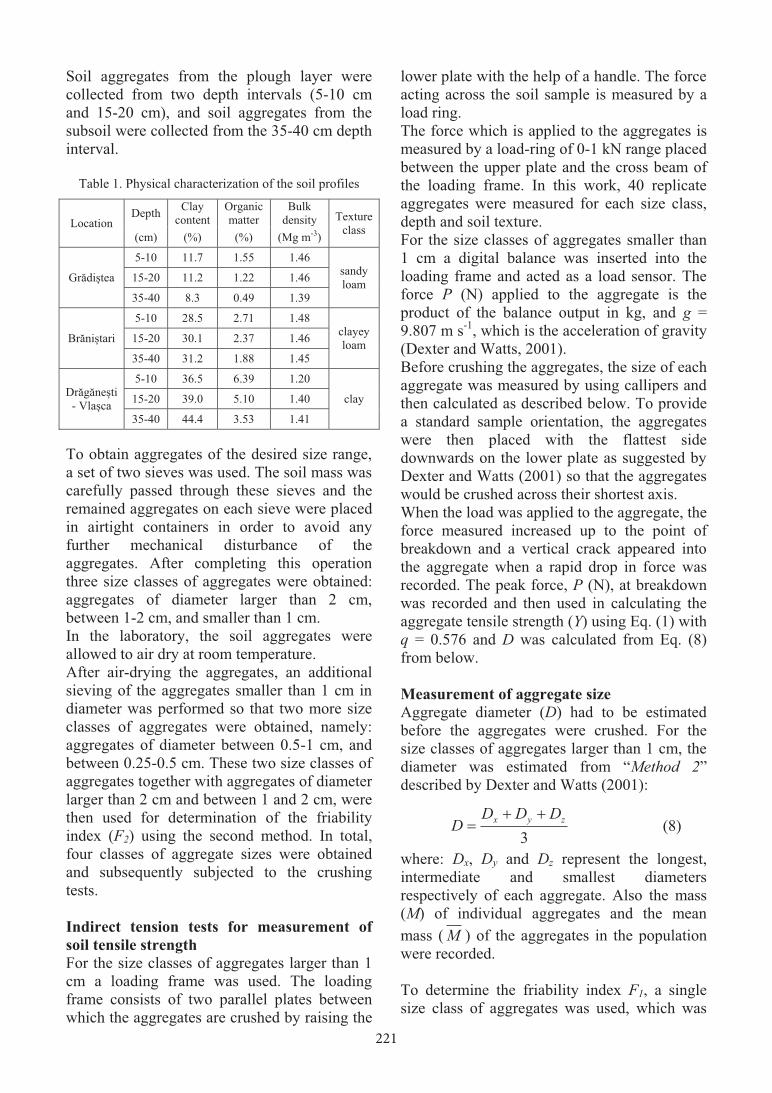
221
Theory Determination of aggregate tensile strength, Y, has been widely applied to characterize the ease of aggregate fracture in tillage (Munkholm and Kay, 2002). As it is difficult to measure Y directly in a direct tension test (Dexter and Watts, 2001), most authors have used indirect tension tests to determine Y. For a spherical aggregate, Y can be determined from the equation (Dexter and Kroesbergen, 1985):
2DPqY � (1)
where: q is the proportionality constant, P is the applied compressive force at breakdown (N), and D is the effective diameter (m). The coefficient, q, depends on the relationship between the compressive and tensile stress in the centre of the aggregate and has been used ranging from 0.576 (Braunack et al., 1979) to 1.860 (Dexter, 1988b). Utomo and Dexter (1981b) proposed the scale factor between aggregate size and the aggregate tensile strength as an index of friability, k: BVkY ee ���� loglog (2) where: V (m3) is the aggregate volume, and B (kPa) is the predicted log strength of 1m3 of soil. The intercept B can be written as: � �� �kVYB k
e ��� 1log 00 (3) where: Y0 and V0 are the strength and volume respectively of the basic soil elements, which comprise the bulk aggregates, and Γ is the tabulated Gamma function. Three methods for quantifying friability were described by Watts and Dexter (1998) and Dexter and Watts (2001), and are based on the statistical theory of brittle fracture. Briefly, this theory can be described by the “weakest link” concept: the strength of the total solid is determined by the local strength of the weakest volume element, in the same way as the strength of a chain is determined by its weakest link (Dexter and Watts, 2001). The methods for quantifying friability are as follows: 1. The first method is based upon the coefficient of variation of the tensile strength and is derived from Dexter and Watts (2001, Eq. 14). Only one size class of soil aggregates is needed for calculation of friability index using this method. The index F1, is given by:
2xY
σYσF YY
1 �� (4)
where: Yσ is the standard deviation of measured values of tensile strength, Y is the mean of the tensile strength measurements and x is the number of replicates. The second term is the standard error of the coefficient of variation or friability. 2. The volume dependence method is based on Dexter and Watts (2001, Eq. 18), and leads to:
β1F2 � (5)
where: β is obtained from the slope of a plot of
EVlogβ1Ylog eVe ��� (6)
where: YV is the tensile strength of volume V, and E is the intercept, the value of which is given in Dexter and Watts (2001, Eq. 18). Because the aggregate strength is size dependent, for this method at least 3 – 4 size classes of aggregates are needed for calculation of F2. Chan et al. (1999) found that for an Australian clayey soil: 21 2FF � (7) Dexter and Watts (2001) recommended the first method as the standard method for measuring soil friability because it is easy to calculate and because it requires fewer measurements than the second method. The main objectives of the present paper were to measure the mechanical properties (tensile strength and friability) of soil aggregates collected from three agricultural soils, and to explore the relationships between mechanical and basic physical properties of the investigated soils. MATERIALS AND METHODS Sample collection and preparation For soil tensile strength measurements samples were collected from the field. Two sampling points were located in Giurgiu county (Grădiștea, Brăniștari) and one point in Teleorman county (Drăgănești-Vlașca) so that three different textured soils were covered, namely: sandy soil, loamy soil and clayey soil. At the time of sampling the plots had been cropped with winter wheat and alfalfa. The soils were characterized using standard methods and the results are given in Table 1.
Soil aggregates from the plough layer were collected from two depth intervals (5-10 cm and 15-20 cm), and soil aggregates from the subsoil were collected from the 35-40 cm depth interval.
Table 1. Physical characterization of the soil profiles
Location Depth Clay
content Organic matter
Bulk density Texture
class (cm) (%) (%) (Mg m-3)
Grădiștea
5-10 11.7 1.55 1.46 sandy loam 15-20 11.2 1.22 1.46
35-40 8.3 0.49 1.39
Brăniștari
5-10 28.5 2.71 1.48 clayey loam 15-20 30.1 2.37 1.46
35-40 31.2 1.88 1.45
Drăgănești - Vlașca
5-10 36.5 6.39 1.20
clay 15-20 39.0 5.10 1.40
35-40 44.4 3.53 1.41 To obtain aggregates of the desired size range, a set of two sieves was used. The soil mass was carefully passed through these sieves and the remained aggregates on each sieve were placed in airtight containers in order to avoid any further mechanical disturbance of the aggregates. After completing this operation three size classes of aggregates were obtained: aggregates of diameter larger than 2 cm, between 1-2 cm, and smaller than 1 cm. In the laboratory, the soil aggregates were allowed to air dry at room temperature. After air-drying the aggregates, an additional sieving of the aggregates smaller than 1 cm in diameter was performed so that two more size classes of aggregates were obtained, namely: aggregates of diameter between 0.5-1 cm, and between 0.25-0.5 cm. These two size classes of aggregates together with aggregates of diameter larger than 2 cm and between 1 and 2 cm, were then used for determination of the friability index (F2) using the second method. In total, four classes of aggregate sizes were obtained and subsequently subjected to the crushing tests. Indirect tension tests for measurement of soil tensile strength For the size classes of aggregates larger than 1 cm a loading frame was used. The loading frame consists of two parallel plates between which the aggregates are crushed by raising the
lower plate with the help of a handle. The force acting across the soil sample is measured by a load ring. The force which is applied to the aggregates is measured by a load-ring of 0-1 kN range placed between the upper plate and the cross beam of the loading frame. In this work, 40 replicate aggregates were measured for each size class, depth and soil texture. For the size classes of aggregates smaller than 1 cm a digital balance was inserted into the loading frame and acted as a load sensor. The force P (N) applied to the aggregate is the product of the balance output in kg, and g = 9.807 m s-1, which is the acceleration of gravity (Dexter and Watts, 2001). Before crushing the aggregates, the size of each aggregate was measured by using callipers and then calculated as described below. To provide a standard sample orientation, the aggregates were then placed with the flattest side downwards on the lower plate as suggested by Dexter and Watts (2001) so that the aggregates would be crushed across their shortest axis. When the load was applied to the aggregate, the force measured increased up to the point of breakdown and a vertical crack appeared into the aggregate when a rapid drop in force was recorded. The peak force, P (N), at breakdown was recorded and then used in calculating the aggregate tensile strength (Y) using Eq. (1) with q = 0.576 and D was calculated from Eq. (8) from below. Measurement of aggregate size Aggregate diameter (D) had to be estimated before the aggregates were crushed. For the size classes of aggregates larger than 1 cm, the diameter was estimated from “Method 2” described by Dexter and Watts (2001):
3
zyx DDDD
��� (8)
where: Dx, Dy and Dz represent the longest, intermediate and smallest diameters respectively of each aggregate. Also the mass (M) of individual aggregates and the mean mass ( M ) of the aggregates in the population were recorded. To determine the friability index F1, a single size class of aggregates was used, which was
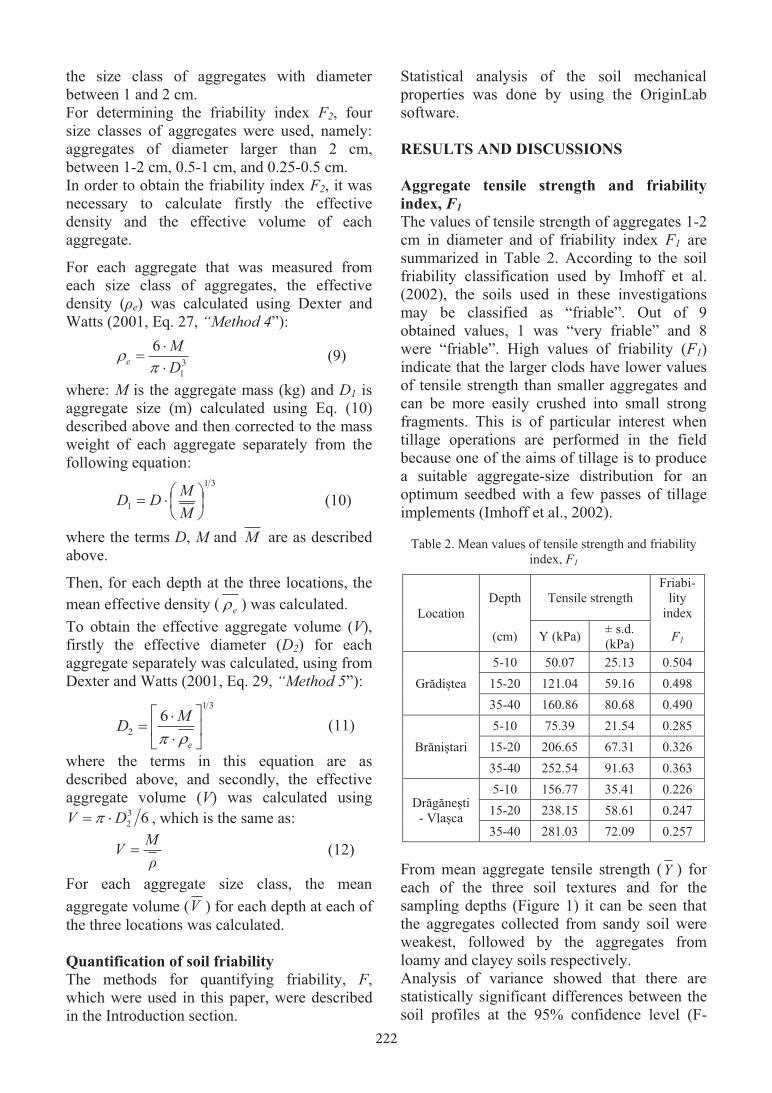
222
the size class of aggregates with diameter between 1 and 2 cm. For determining the friability index F2, four size classes of aggregates were used, namely: aggregates of diameter larger than 2 cm, between 1-2 cm, 0.5-1 cm, and 0.25-0.5 cm. In order to obtain the friability index F2, it was necessary to calculate firstly the effective density and the effective volume of each aggregate.
For each aggregate that was measured from each size class of aggregates, the effective density (ρe) was calculated using Dexter and Watts (2001, Eq. 27, “Method 4”):
31
6DM
e ��
��
� (9)
where: M is the aggregate mass (kg) and D1 is aggregate size (m) calculated using Eq. (10) described above and then corrected to the mass weight of each aggregate separately from the following equation:
31
1 ���
�����
MMDD (10)
where the terms D, M and M are as described above.
Then, for each depth at the three locations, the mean effective density ( e� ) was calculated. To obtain the effective aggregate volume (V), firstly the effective diameter (D2) for each aggregate separately was calculated, using from Dexter and Watts (2001, Eq. 29, “Method 5”):
31
26
��
���
�
��
�e
MD��
(11)
where the terms in this equation are as described above, and secondly, the effective aggregate volume (V) was calculated using
632DV �� � , which is the same as:
ρ
MV � (12)
For each aggregate size class, the mean aggregate volume (V ) for each depth at each of the three locations was calculated. Quantification of soil friability The methods for quantifying friability, F, which were used in this paper, were described in the Introduction section.
Statistical analysis of the soil mechanical properties was done by using the OriginLab software. RESULTS AND DISCUSSIONS Aggregate tensile strength and friability index, F1 The values of tensile strength of aggregates 1-2 cm in diameter and of friability index F1 are summarized in Table 2. According to the soil friability classification used by Imhoff et al. (2002), the soils used in these investigations may be classified as “friable”. Out of 9 obtained values, 1 was “very friable” and 8 were “friable”. High values of friability (F1) indicate that the larger clods have lower values of tensile strength than smaller aggregates and can be more easily crushed into small strong fragments. This is of particular interest when tillage operations are performed in the field because one of the aims of tillage is to produce a suitable aggregate-size distribution for an optimum seedbed with a few passes of tillage implements (Imhoff et al., 2002).
Table 2. Mean values of tensile strength and friability index, F1
Location Depth Tensile strength
Friabi-lity
index
(cm) Y (kPa) ± s.d. (kPa) F1
Grădiștea 5-10 50.07 25.13 0.504
15-20 121.04 59.16 0.498 35-40 160.86 80.68 0.490
Brăniștari 5-10 75.39 21.54 0.285
15-20 206.65 67.31 0.326 35-40 252.54 91.63 0.363
Drăgănești - Vlașca
5-10 156.77 35.41 0.226 15-20 238.15 58.61 0.247 35-40 281.03 72.09 0.257
From mean aggregate tensile strength (Y ) for each of the three soil textures and for the sampling depths (Figure 1) it can be seen that the aggregates collected from sandy soil were weakest, followed by the aggregates from loamy and clayey soils respectively. Analysis of variance showed that there are statistically significant differences between the soil profiles at the 95% confidence level (F-
Ratio = 96.86; P-Value = 1.79745E-13) when the depth was taken as factor of influence.
Figure 1. Variation of the tensile strength with depth
A similar trend of the soil tensile strength values was obtained by Vizitiu et al. (2010) for Polish soils. Also the average values of the tensile strength were higher in the deeper layers of the soil profiles when compared to the topsoil layers. The influence of organic matter and clay content on the tensile strength values was assessed through simple analysis using linear regressions. In Figures 2 and 3 are shown the variation in tensile strength as a function of organic matter and clay content. The regression lines which are drawn in Figure 2 can be described by the following equations: - for sandy soil: Y = 213.58 – 94.81 OM r2 = 0.70 (±27.74) (±23.54) p = 0.005 - for loamy soil: Y = 605.18 – 184.05 OM r2 = 0.78 (±86.76) (±36.95) p = 0.002 - for clayey soil: Y = 427.89 – 40.47 OM r2 = 0.83 (±35.42) (±6.88) p = 0.0006 The three investigated soils showed a statistically significant decrease of the tensile strength as a function of organic matter content, the most obvious decrease being recorded for clayey soil. Some researchers found a positive correlation between tensile strength and organic matter (Bartoli et al., 1992; Imhoff et al., 2002), whereas others found no correlation (Watts and Dexter, 1998) or negative correlation (Guérif, 1990; Watts and Dexter, 1997).
Figure 2. Effect of organic matter on tensile strength
The tensile strength of air-dry soil aggregates is shown in Figure 3 to be highly correlated with the clay content (Guérif, 1990) in the case of loamy and clayey soils and less correlated for the sandy soil. The regression lines are given by the following equations: - for sandy soil: Y = 297.16 – 17.95 C r2 = 0.32 (±103.47) (±9.84) p = 0.111 - for loamy soil: Y = -1125.60 + 43.51 C r2 = 0.64 (±369.63) (±12.32) p = 0.0096 - for clayey soil: Y = -320.87 + 13.67 C r2 = 0.75 (±120.87) (±3.01) p = 0.0027
Figure 3. Effect of clay content on tensile strength
Increasing amount of clay in sandy soil has determined an increase of the soil tensile strength values (Figure 3). This may be due to clay particles acting as cementing materials between large particles, high amounts of clay providing more opportunities for interparticle contact and also adsorb more water, causing higher tensions in soil water at a specific water content (Kemper et al., 1987). Dispersion of cementing materials (e.g. clay) can cause migration of those to lower energy positions, and the greatest effect on tensile strength is recorded when the bonding occurs at contact

223
the size class of aggregates with diameter between 1 and 2 cm. For determining the friability index F2, four size classes of aggregates were used, namely: aggregates of diameter larger than 2 cm, between 1-2 cm, 0.5-1 cm, and 0.25-0.5 cm. In order to obtain the friability index F2, it was necessary to calculate firstly the effective density and the effective volume of each aggregate.
For each aggregate that was measured from each size class of aggregates, the effective density (ρe) was calculated using Dexter and Watts (2001, Eq. 27, “Method 4”):
31
6DM
e ��
��
� (9)
where: M is the aggregate mass (kg) and D1 is aggregate size (m) calculated using Eq. (10) described above and then corrected to the mass weight of each aggregate separately from the following equation:
31
1 ���
�����
MMDD (10)
where the terms D, M and M are as described above.
Then, for each depth at the three locations, the mean effective density ( e� ) was calculated. To obtain the effective aggregate volume (V), firstly the effective diameter (D2) for each aggregate separately was calculated, using from Dexter and Watts (2001, Eq. 29, “Method 5”):
31
26
��
���
�
��
�e
MD��
(11)
where the terms in this equation are as described above, and secondly, the effective aggregate volume (V) was calculated using
632DV �� � , which is the same as:
ρ
MV � (12)
For each aggregate size class, the mean aggregate volume (V ) for each depth at each of the three locations was calculated. Quantification of soil friability The methods for quantifying friability, F, which were used in this paper, were described in the Introduction section.
Statistical analysis of the soil mechanical properties was done by using the OriginLab software. RESULTS AND DISCUSSIONS Aggregate tensile strength and friability index, F1 The values of tensile strength of aggregates 1-2 cm in diameter and of friability index F1 are summarized in Table 2. According to the soil friability classification used by Imhoff et al. (2002), the soils used in these investigations may be classified as “friable”. Out of 9 obtained values, 1 was “very friable” and 8 were “friable”. High values of friability (F1) indicate that the larger clods have lower values of tensile strength than smaller aggregates and can be more easily crushed into small strong fragments. This is of particular interest when tillage operations are performed in the field because one of the aims of tillage is to produce a suitable aggregate-size distribution for an optimum seedbed with a few passes of tillage implements (Imhoff et al., 2002).
Table 2. Mean values of tensile strength and friability index, F1
Location Depth Tensile strength
Friabi-lity
index
(cm) Y (kPa) ± s.d. (kPa) F1
Grădiștea 5-10 50.07 25.13 0.504
15-20 121.04 59.16 0.498 35-40 160.86 80.68 0.490
Brăniștari 5-10 75.39 21.54 0.285
15-20 206.65 67.31 0.326 35-40 252.54 91.63 0.363
Drăgănești - Vlașca
5-10 156.77 35.41 0.226 15-20 238.15 58.61 0.247 35-40 281.03 72.09 0.257
From mean aggregate tensile strength (Y ) for each of the three soil textures and for the sampling depths (Figure 1) it can be seen that the aggregates collected from sandy soil were weakest, followed by the aggregates from loamy and clayey soils respectively. Analysis of variance showed that there are statistically significant differences between the soil profiles at the 95% confidence level (F-
Ratio = 96.86; P-Value = 1.79745E-13) when the depth was taken as factor of influence.
Figure 1. Variation of the tensile strength with depth
A similar trend of the soil tensile strength values was obtained by Vizitiu et al. (2010) for Polish soils. Also the average values of the tensile strength were higher in the deeper layers of the soil profiles when compared to the topsoil layers. The influence of organic matter and clay content on the tensile strength values was assessed through simple analysis using linear regressions. In Figures 2 and 3 are shown the variation in tensile strength as a function of organic matter and clay content. The regression lines which are drawn in Figure 2 can be described by the following equations: - for sandy soil: Y = 213.58 – 94.81 OM r2 = 0.70 (±27.74) (±23.54) p = 0.005 - for loamy soil: Y = 605.18 – 184.05 OM r2 = 0.78 (±86.76) (±36.95) p = 0.002 - for clayey soil: Y = 427.89 – 40.47 OM r2 = 0.83 (±35.42) (±6.88) p = 0.0006 The three investigated soils showed a statistically significant decrease of the tensile strength as a function of organic matter content, the most obvious decrease being recorded for clayey soil. Some researchers found a positive correlation between tensile strength and organic matter (Bartoli et al., 1992; Imhoff et al., 2002), whereas others found no correlation (Watts and Dexter, 1998) or negative correlation (Guérif, 1990; Watts and Dexter, 1997).
Figure 2. Effect of organic matter on tensile strength
The tensile strength of air-dry soil aggregates is shown in Figure 3 to be highly correlated with the clay content (Guérif, 1990) in the case of loamy and clayey soils and less correlated for the sandy soil. The regression lines are given by the following equations: - for sandy soil: Y = 297.16 – 17.95 C r2 = 0.32 (±103.47) (±9.84) p = 0.111 - for loamy soil: Y = -1125.60 + 43.51 C r2 = 0.64 (±369.63) (±12.32) p = 0.0096 - for clayey soil: Y = -320.87 + 13.67 C r2 = 0.75 (±120.87) (±3.01) p = 0.0027
Figure 3. Effect of clay content on tensile strength
Increasing amount of clay in sandy soil has determined an increase of the soil tensile strength values (Figure 3). This may be due to clay particles acting as cementing materials between large particles, high amounts of clay providing more opportunities for interparticle contact and also adsorb more water, causing higher tensions in soil water at a specific water content (Kemper et al., 1987). Dispersion of cementing materials (e.g. clay) can cause migration of those to lower energy positions, and the greatest effect on tensile strength is recorded when the bonding occurs at contact

224
points within or at the ends of microcracks (Kay and Dexter, 1992). Friability index, F2 In Table 3 are presented the values of friability index, F2, and Figure 4 a, b and c show some examples of the volume dependence of the tensile strength. As expected from the work of Dexter and Watts (2001), the values of friability index, F2, obtained using Eqs. (5) and (6) from the volume dependence method described in the introduction section, are smaller than the values of friability index, F1, obtained using Eq. (4) from the coefficient of variation method.
Table 3. Values of friability index, F2
Location Depth Friability index Ratio between (cm) F2 F1/F2
Grădiștea 5-10 0.314 1.60
15-20 0.217 2.29 35-40 0.202 2.43
Brăniștari 5-10 0.370 0.77
15-20 0.289 1.13 35-40 0.291 1.25
Drăgănești - Vlașca
5-10 0.335 0.68 15-20 0.286 0.86 35-40 0.381 0.68
Measurement of the tensile strength of soil aggregates as functions of volume is based on the assumption that small aggregates are fragments of larger aggregates (Watts and Dexter, 1998). It is desirable that the material of the smaller aggregates, which initially comprised the larger clods, has a relatively greater strength than that of the larger clods, otherwise, the soil mass could break down into individual mineral particles or dust (Utomo and Dexter, 1981). Statistical analysis of the friability (F2) results showed that F2 was not correlated with organic matter content and clay content. One possible explanation could be that soil aggregates of different size may have been formed by different mechanisms (Dexter, 1988b), may be of different ages, and may have weathered differently (Watts and Dexter, 1998), and these can affect the subsequent strength behavior of the aggregates.
a) sandy soil
b) loamy soil
c) clayey soil
Figure 4. Plots of aggregate tensile strength as a function of volume for the topsoil layer of:
a) sandy soil; b) loamy soil; c) clayey soil Amongst the main factors which can affect friability index, F2, is the water content. Utomo and Dexter (1981) found maximum friability at around the soil plastic limit when assessed the friability using the volume dependence method. Similar results were reported by Shanmuganathan and Oades (1982), Munkholm and Kay (2002) and Munkholm et al. (2002). In these investigations, we looked also for a correlation between F1 and F2, and the results are shown in Figure 5. The regression line in Figure 5 show a small linear correlation
between F1 and F2, and the equation of regression is as follows:
F1 = 0.67 - 1.115 F2 r2 = 0.45 (±0.076) (±0.251) p = 0.0002 When the results for each soil profile were compared separately, these have shown different trends. Whereas for the sandy and clayey soils were found underestimates and respectively overestimates of F2 values, for the other loamy soil the volume dependence method (F2) gave similar values when compared to the coefficient of variation method (F1). The ratio F1/F2 is as follows: 2.11 for the sandy soil, 1.05 for the loamy soil and respectively 0.74 for the clayey soil.
Figure 5. Plot of friability indices (F1 and F3) as
measured by two different methods. Dexter and Watts (2001) suggested that at least two factors contribute to the finding that F1 is always larger than F2. The first factor which they mention is that some variability of the force, P, for sample breakdown, is due to differences in the shape of individual soil aggregates. The second factor mentioned by Dexter and Watts (2001) is that, for natural aggregates, some of the flaws or micro-cracks are not very small when compared with the sample size, and this negates one of the main assumptions of the weakest link theory of soil strength. Therefore, it was recommended (Watts and Dexter, 1998; Dexter and Watts, 2001) that the coefficient of variation method can be used as a standard method for describing soil friability (F1) because it is easy to calculate, because it can be related to the principal parameter, 1/α, of brittle fracture theory, and because it requires fewer measurements than the second method (F2).
CONCLUSIONS Soils used in these investigations can be described as “friable” according to the classification used for F1 values. Soil aggregates of the sandy soil from Grădiștea had the smallest values of tensile strength. The highest values of tensile strength were recorded in case of clayey soil, whereas the loamy soil had values between the sandy and clayey soils. Increasing organic matter content decreased the values of tensile strength for soil aggregates from all soils. High values of clay content in case of loamy and clayey soils increased the values of tensile strength. Increasing amount of clay in sandy soil has been shown to increase the tensile strength of this soil. This may be due to clay particles acting as cementing materials between large particles. Higher amounts of clay in sandy soils provide more opportunities for interparticle contact. Small size classes of aggregates presented higher values of tensile strength as compared with larger size classes of aggregates when the volume dependence method was used. In case of sandy and clayey soils were found underestimates and respectively overestimates of F2 values. As for the loamy soil, the volume dependence method (F2) gave similar values when compared to the coefficient of variation method (F1). The coefficient of variation method (F1) is recommended as standard method for measuring soil friability. ACKNOWLEDGEMENTS This research was carried out with the financial support of Romanian Ministry of Research and Innovation by the Core Program, Project No. PN 16 07 01 08. REFERENCES Bartoli F., Burtin G. and Guérif J., 1992. Influence of
organic matter on aggregation in Oxisols rich in gibbsite or in goethite. II. Clay dispersion, aggregate strength and water stability. Geoderma 54, p. 259-274.
Braunack M.V., Hewitt J.S. and Dexter A.R., 1979. Brittle fracture of soil aggregates and the compaction of aggregate beds. J. Soil Sci. 30, p. 653-667.

225
points within or at the ends of microcracks (Kay and Dexter, 1992). Friability index, F2 In Table 3 are presented the values of friability index, F2, and Figure 4 a, b and c show some examples of the volume dependence of the tensile strength. As expected from the work of Dexter and Watts (2001), the values of friability index, F2, obtained using Eqs. (5) and (6) from the volume dependence method described in the introduction section, are smaller than the values of friability index, F1, obtained using Eq. (4) from the coefficient of variation method.
Table 3. Values of friability index, F2
Location Depth Friability index Ratio between (cm) F2 F1/F2
Grădiștea 5-10 0.314 1.60
15-20 0.217 2.29 35-40 0.202 2.43
Brăniștari 5-10 0.370 0.77
15-20 0.289 1.13 35-40 0.291 1.25
Drăgănești - Vlașca
5-10 0.335 0.68 15-20 0.286 0.86 35-40 0.381 0.68
Measurement of the tensile strength of soil aggregates as functions of volume is based on the assumption that small aggregates are fragments of larger aggregates (Watts and Dexter, 1998). It is desirable that the material of the smaller aggregates, which initially comprised the larger clods, has a relatively greater strength than that of the larger clods, otherwise, the soil mass could break down into individual mineral particles or dust (Utomo and Dexter, 1981). Statistical analysis of the friability (F2) results showed that F2 was not correlated with organic matter content and clay content. One possible explanation could be that soil aggregates of different size may have been formed by different mechanisms (Dexter, 1988b), may be of different ages, and may have weathered differently (Watts and Dexter, 1998), and these can affect the subsequent strength behavior of the aggregates.
a) sandy soil
b) loamy soil
c) clayey soil
Figure 4. Plots of aggregate tensile strength as a function of volume for the topsoil layer of:
a) sandy soil; b) loamy soil; c) clayey soil Amongst the main factors which can affect friability index, F2, is the water content. Utomo and Dexter (1981) found maximum friability at around the soil plastic limit when assessed the friability using the volume dependence method. Similar results were reported by Shanmuganathan and Oades (1982), Munkholm and Kay (2002) and Munkholm et al. (2002). In these investigations, we looked also for a correlation between F1 and F2, and the results are shown in Figure 5. The regression line in Figure 5 show a small linear correlation
between F1 and F2, and the equation of regression is as follows:
F1 = 0.67 - 1.115 F2 r2 = 0.45 (±0.076) (±0.251) p = 0.0002 When the results for each soil profile were compared separately, these have shown different trends. Whereas for the sandy and clayey soils were found underestimates and respectively overestimates of F2 values, for the other loamy soil the volume dependence method (F2) gave similar values when compared to the coefficient of variation method (F1). The ratio F1/F2 is as follows: 2.11 for the sandy soil, 1.05 for the loamy soil and respectively 0.74 for the clayey soil.
Figure 5. Plot of friability indices (F1 and F3) as
measured by two different methods. Dexter and Watts (2001) suggested that at least two factors contribute to the finding that F1 is always larger than F2. The first factor which they mention is that some variability of the force, P, for sample breakdown, is due to differences in the shape of individual soil aggregates. The second factor mentioned by Dexter and Watts (2001) is that, for natural aggregates, some of the flaws or micro-cracks are not very small when compared with the sample size, and this negates one of the main assumptions of the weakest link theory of soil strength. Therefore, it was recommended (Watts and Dexter, 1998; Dexter and Watts, 2001) that the coefficient of variation method can be used as a standard method for describing soil friability (F1) because it is easy to calculate, because it can be related to the principal parameter, 1/α, of brittle fracture theory, and because it requires fewer measurements than the second method (F2).
CONCLUSIONS Soils used in these investigations can be described as “friable” according to the classification used for F1 values. Soil aggregates of the sandy soil from Grădiștea had the smallest values of tensile strength. The highest values of tensile strength were recorded in case of clayey soil, whereas the loamy soil had values between the sandy and clayey soils. Increasing organic matter content decreased the values of tensile strength for soil aggregates from all soils. High values of clay content in case of loamy and clayey soils increased the values of tensile strength. Increasing amount of clay in sandy soil has been shown to increase the tensile strength of this soil. This may be due to clay particles acting as cementing materials between large particles. Higher amounts of clay in sandy soils provide more opportunities for interparticle contact. Small size classes of aggregates presented higher values of tensile strength as compared with larger size classes of aggregates when the volume dependence method was used. In case of sandy and clayey soils were found underestimates and respectively overestimates of F2 values. As for the loamy soil, the volume dependence method (F2) gave similar values when compared to the coefficient of variation method (F1). The coefficient of variation method (F1) is recommended as standard method for measuring soil friability. ACKNOWLEDGEMENTS This research was carried out with the financial support of Romanian Ministry of Research and Innovation by the Core Program, Project No. PN 16 07 01 08. REFERENCES Bartoli F., Burtin G. and Guérif J., 1992. Influence of
organic matter on aggregation in Oxisols rich in gibbsite or in goethite. II. Clay dispersion, aggregate strength and water stability. Geoderma 54, p. 259-274.
Braunack M.V., Hewitt J.S. and Dexter A.R., 1979. Brittle fracture of soil aggregates and the compaction of aggregate beds. J. Soil Sci. 30, p. 653-667.
226
Chan K.Y., Dexter A.R. and McKenzie D.C., 1999.
Categories of soil structure based on mechanical behaviour and their evaluation using additions of lime and gypsum on a sodic soil. Aust. J. Soil Res. 37, p. 903-911.
Dexter A.R., 1975. Uniaxial compression of ideal brittle tilths. J. Terramechanics 12, p. 3-14.
Dexter A.R., 1985. Shapes of aggregates from tilled layers of some Dutch and Australian soils. Geoderma 35: p. 91-107.
Dexter A.R., 1988a. Strength of soil aggregates and of aggregate beds. Catena Supplement 11, p. 35-52.
Dexter A.R., 1988b. Advances in characterization of soil structure. Soil Till. Res. 11, p. 199-238.
Dexter A.R., 1997. Physical properties of tilled soils. Soil Till. Res. 43, p. 41-63.
Dexter A.R. and Kroesbergen B., 1985. Methodology for determination of tensile strength of soil aggregates. J. Agric. Eng. Res. 31, p. 139-147.
Dexter A.R. and Chan K.Y., 1991. Soil mechanical properties as influenced by exchangeable cations. J. Soil Sci. 42, p. 219-226.
Dexter A. R. and Watts C.W., 2001. Tensile Strength and Friability. In: Smith, K. A. and Mullins, C. E. (Eds.), Soil and Environmental Analysis. Physical Methods. 2nd edition. Marcel Dekker Inc., New York, p. 401-430.
Guérif J., 1990. Factors Influencing Compaction-Induced Increases in Soil Strength. Soil Till. Res. 16, p. 167-178.
Imhoff S., da Silva A.P. and Dexter A.R., 2002. Factors Contributing to the Tensile Strength and Friability of Oxisols. Soil Sci. Soc. Am. J. 66, p. 1656-1661.
Kay B.D. and Dexter A.R., 1992. The influence of Dispersible Clay and Wetting/Drying Cycles on the Tensile Strength of a Red-Brown Earth. Aust. J. Soil Res. 30, p. 297-310.
Kemper W.D., Rosenau R.C. and Dexter A.R., 1987. Cohesion development in disrupted soils as affected by clay and organic matter content and temperature. Soil Sci. Soc. Am. J. 51, p. 860-867.
Munkholm L.J. and Kay B.D., 2002. Effect of Water Regime on Aggregate-tensile Strength, Rupture Energy, and Friability. Soil Sci. Soc. Am. J. 66, p. 702-709.
Munkholm L.J., Schjønning P., Debosz K., Jensen H.E. and Christensen B.T., 2002. Aggregate strength and mechanical behaviour of a sandy loam soil under long-term fertilization treatments. Eur. J. Soil Sci. 53, p. 129-137.
Shanmuganathan R.T. and Oades J.M., 1982. Effect of Dispersible Clay on the Physical Properties of the B Horizon of a Red-brown Earth. Aust. J. Soil Res. 20, p. 315-324.
Utomo W.H. and Dexter A.R., 1981. Soil friability. J. Soil Sci. 32, p. 203-213.
Vizitiu O.P., Cżyż E.A. and Dexter A.R., 2010. Soil physical quality - theory and applications for arable soils. 166 pp. Ed. SITECH, Craiova, ISBN 978-606-11-0844-2.
Watts C.W. and Dexter A.R., 1997. The influence of organic matter in reducing the destabilization of soil by simulated tillage. Soil Till. Res. 42, p. 253-275.
Watts C.W. and Dexter A.R., 1998. Soil friability: theory, measurement and the effects of management and organic carbon content. European J. Soil Sci. 49, p. 73-84.
Watts C.W., Dexter A.R. and Longstaff D.J., 1996. An assessment of the vulnerability of soil structure to destabilisation during tillage. Part II. Field trials. Soil Till. Res. 37, p. 175-190.
INFLUENCE OF BENTONITE, DOLOMITE, NATURAL ZEOLITE
AND MANURE ON HEAVY METAL IMMOBILIZATION IN A CONTAMINATED SOIL
Nicoleta Olimpia VRÎNCEANU, Dumitru Marian MOTELICĂ, Ilie CALCIU, Veronica TĂNASE, Mihaela PREDA, Georgiana PLOPEANU, Iuliana IVANA
National Research and Development Institute for Soil Science, Agrochemistry and Environment
Bucharest, 61 Mărăşti Blvd., District 1, 011464, Bucharest, Romania, Phone: +4021.318.44.58, Fax:+4021.318.25.67,
Emails: [email protected], [email protected], [email protected], [email protected], [email protected], [email protected], [email protected]
Corresponding author email: [email protected]
Abstract
Using organic or inorganic amendments to immobilize the heavy metals in soils is a cost-effective remediation technique for contaminated soils. The aim of study was to assess the efficiency of 4 amendments to immobilize cadmium (Cd), copper (Cu), lead (Pb) and zinc (Zn) in soil and reduce their phyto availabilty. An experimental field was set-up in Copșa Mica area and four amendments were applied: Na-bentonite, dolomite, natural zeolite and manure. Following the application of the amendments, a mix of perennial grasses and straw cereals, belonging to the family of Gramineae, were sown. The efficiency of in situ immobilization of heavy metals was assessed using DTPA extraction of metals and plant uptake. All treatments produced significant increases of pH values in soil. The mean soil pH of the control plots was 5.18. Comparing the effects of treatments on soil reaction, the best results were observed after applications of bentonite or dolomite. The highest mean value of pH was measured in plots treated with Na-bentonite (pH 7.16). The bioavailability of metals is related to soil pH. Therefore the effects of treatments on pH are reflected on metals bioavailability assessed by DTPA-extractable metal fractions. All amendments caused a reduction of heavy metal (Cu, Cd, Pb or Zn) mobility compared to the control but the magnitude of effects depends on metal and amendment. For copper and zinc, addition of Na-bentonite reduces statistically significant the mobile forms in soil from 13.6 mg·kg-1 Cu (control) to 9.4 mg·kg-1 Cu and from 327 mg·kg-1 Zn (control) to 143 mg·kg-1 Zn. By using the natural zeolite the values of heavy metal contents in mobile forms in soil decreased significantly comparing with control. The results demonstrate the high potential of studied amendments for immobilization of heavy metals in contaminated agricultural soils. Key words: amendments, bioavailability, contaminated soils, heavy metals, immobilization.
INTRODUCTION Some of traditional clean-up methods are very expensive and, at the same time, often not environmentally friendly. According with conclusion of technical report from GWRTAC (1997)general approaches to remediation of metal-contaminated soils include: isolation, immobilization, toxicity reduction, physical separation and extraction. These approaches can be used for many types of contaminants but the specific technology selected for treatment of a metals-contaminated site will depend on the form of the contamination and other site-specific characteristics (Sitarz-Palczak and Kalembkiewicz, 2012; Mench et al., 2003; Houben et al., 2012). Due to the increase in
public awareness regarding the consequences of contaminated lands, the research and academic community focused on the development of cost effective and socially acceptable soil remediation techniques. Immobilization of heavy metals is a promising in-situ alternative to the traditional remediation methods for the reduction of the environmental health risks poses by heavy metals contaminated sites. The principle involved in the immobilization methods is to remove the metal from soil solution either through adsorption, complexation and precipitation reactions and convert into the metal unavailable for human and plant uptake and leaching to groundwater (Adriano et al., 2004; Boisson at al., 1999).

227
Chan K.Y., Dexter A.R. and McKenzie D.C., 1999.
Categories of soil structure based on mechanical behaviour and their evaluation using additions of lime and gypsum on a sodic soil. Aust. J. Soil Res. 37, p. 903-911.
Dexter A.R., 1975. Uniaxial compression of ideal brittle tilths. J. Terramechanics 12, p. 3-14.
Dexter A.R., 1985. Shapes of aggregates from tilled layers of some Dutch and Australian soils. Geoderma 35: p. 91-107.
Dexter A.R., 1988a. Strength of soil aggregates and of aggregate beds. Catena Supplement 11, p. 35-52.
Dexter A.R., 1988b. Advances in characterization of soil structure. Soil Till. Res. 11, p. 199-238.
Dexter A.R., 1997. Physical properties of tilled soils. Soil Till. Res. 43, p. 41-63.
Dexter A.R. and Kroesbergen B., 1985. Methodology for determination of tensile strength of soil aggregates. J. Agric. Eng. Res. 31, p. 139-147.
Dexter A.R. and Chan K.Y., 1991. Soil mechanical properties as influenced by exchangeable cations. J. Soil Sci. 42, p. 219-226.
Dexter A. R. and Watts C.W., 2001. Tensile Strength and Friability. In: Smith, K. A. and Mullins, C. E. (Eds.), Soil and Environmental Analysis. Physical Methods. 2nd edition. Marcel Dekker Inc., New York, p. 401-430.
Guérif J., 1990. Factors Influencing Compaction-Induced Increases in Soil Strength. Soil Till. Res. 16, p. 167-178.
Imhoff S., da Silva A.P. and Dexter A.R., 2002. Factors Contributing to the Tensile Strength and Friability of Oxisols. Soil Sci. Soc. Am. J. 66, p. 1656-1661.
Kay B.D. and Dexter A.R., 1992. The influence of Dispersible Clay and Wetting/Drying Cycles on the Tensile Strength of a Red-Brown Earth. Aust. J. Soil Res. 30, p. 297-310.
Kemper W.D., Rosenau R.C. and Dexter A.R., 1987. Cohesion development in disrupted soils as affected by clay and organic matter content and temperature. Soil Sci. Soc. Am. J. 51, p. 860-867.
Munkholm L.J. and Kay B.D., 2002. Effect of Water Regime on Aggregate-tensile Strength, Rupture Energy, and Friability. Soil Sci. Soc. Am. J. 66, p. 702-709.
Munkholm L.J., Schjønning P., Debosz K., Jensen H.E. and Christensen B.T., 2002. Aggregate strength and mechanical behaviour of a sandy loam soil under long-term fertilization treatments. Eur. J. Soil Sci. 53, p. 129-137.
Shanmuganathan R.T. and Oades J.M., 1982. Effect of Dispersible Clay on the Physical Properties of the B Horizon of a Red-brown Earth. Aust. J. Soil Res. 20, p. 315-324.
Utomo W.H. and Dexter A.R., 1981. Soil friability. J. Soil Sci. 32, p. 203-213.
Vizitiu O.P., Cżyż E.A. and Dexter A.R., 2010. Soil physical quality - theory and applications for arable soils. 166 pp. Ed. SITECH, Craiova, ISBN 978-606-11-0844-2.
Watts C.W. and Dexter A.R., 1997. The influence of organic matter in reducing the destabilization of soil by simulated tillage. Soil Till. Res. 42, p. 253-275.
Watts C.W. and Dexter A.R., 1998. Soil friability: theory, measurement and the effects of management and organic carbon content. European J. Soil Sci. 49, p. 73-84.
Watts C.W., Dexter A.R. and Longstaff D.J., 1996. An assessment of the vulnerability of soil structure to destabilisation during tillage. Part II. Field trials. Soil Till. Res. 37, p. 175-190.
AgroLife Scientific Journal - Volume 6, Number 2, 2017ISSN 2285-5718; ISSN CD-ROM 2285-5726; ISSN ONLINE 2286-0126; ISSN-L 2285-5718
INFLUENCE OF BENTONITE, DOLOMITE, NATURAL ZEOLITE
AND MANURE ON HEAVY METAL IMMOBILIZATION IN A CONTAMINATED SOIL
Nicoleta Olimpia VRÎNCEANU, Dumitru Marian MOTELICĂ, Ilie CALCIU, Veronica TĂNASE, Mihaela PREDA, Georgiana PLOPEANU, Iuliana IVANA
National Research and Development Institute for Soil Science, Agrochemistry and Environment
Bucharest, 61 Mărăşti Blvd., District 1, 011464, Bucharest, Romania, Phone: +4021.318.44.58, Fax:+4021.318.25.67,
Emails: [email protected], [email protected], [email protected], [email protected], [email protected], [email protected], [email protected]
Corresponding author email: [email protected]
Abstract
Using organic or inorganic amendments to immobilize the heavy metals in soils is a cost-effective remediation technique for contaminated soils. The aim of study was to assess the efficiency of 4 amendments to immobilize cadmium (Cd), copper (Cu), lead (Pb) and zinc (Zn) in soil and reduce their phyto availabilty. An experimental field was set-up in Copșa Mica area and four amendments were applied: Na-bentonite, dolomite, natural zeolite and manure. Following the application of the amendments, a mix of perennial grasses and straw cereals, belonging to the family of Gramineae, were sown. The efficiency of in situ immobilization of heavy metals was assessed using DTPA extraction of metals and plant uptake. All treatments produced significant increases of pH values in soil. The mean soil pH of the control plots was 5.18. Comparing the effects of treatments on soil reaction, the best results were observed after applications of bentonite or dolomite. The highest mean value of pH was measured in plots treated with Na-bentonite (pH 7.16). The bioavailability of metals is related to soil pH. Therefore the effects of treatments on pH are reflected on metals bioavailability assessed by DTPA-extractable metal fractions. All amendments caused a reduction of heavy metal (Cu, Cd, Pb or Zn) mobility compared to the control but the magnitude of effects depends on metal and amendment. For copper and zinc, addition of Na-bentonite reduces statistically significant the mobile forms in soil from 13.6 mg·kg-1 Cu (control) to 9.4 mg·kg-1 Cu and from 327 mg·kg-1 Zn (control) to 143 mg·kg-1 Zn. By using the natural zeolite the values of heavy metal contents in mobile forms in soil decreased significantly comparing with control. The results demonstrate the high potential of studied amendments for immobilization of heavy metals in contaminated agricultural soils. Key words: amendments, bioavailability, contaminated soils, heavy metals, immobilization.
INTRODUCTION Some of traditional clean-up methods are very expensive and, at the same time, often not environmentally friendly. According with conclusion of technical report from GWRTAC (1997)general approaches to remediation of metal-contaminated soils include: isolation, immobilization, toxicity reduction, physical separation and extraction. These approaches can be used for many types of contaminants but the specific technology selected for treatment of a metals-contaminated site will depend on the form of the contamination and other site-specific characteristics (Sitarz-Palczak and Kalembkiewicz, 2012; Mench et al., 2003; Houben et al., 2012). Due to the increase in
public awareness regarding the consequences of contaminated lands, the research and academic community focused on the development of cost effective and socially acceptable soil remediation techniques. Immobilization of heavy metals is a promising in-situ alternative to the traditional remediation methods for the reduction of the environmental health risks poses by heavy metals contaminated sites. The principle involved in the immobilization methods is to remove the metal from soil solution either through adsorption, complexation and precipitation reactions and convert into the metal unavailable for human and plant uptake and leaching to groundwater (Adriano et al., 2004; Boisson at al., 1999).

228
The main goal of the amendment’s incorporation into contaminated soils is to reduce the bioavailability and toxicity of metals, based on increasing the soil pH (and thus decreasing the metal mobility) and/or enhance metal sorption by increasing the number of specific sorption sites. Immobilization of metals is an enticing option to reclaim the contaminated soils due to its simplicity and effectiveness, in situ applicability and low cost (Houben et al., 2012; Shaheen et al., 2015). Thus, significant efforts have been made to assess different potentially effective amendments to remediate the heavy metals contaminated soils (eg. Lee et al., 2011; Basta and McGowen, 2004; Lombi et al., 2004; Gonzales-Nunez et al., 2015) and a large number of soil amendments have been investigated including natural zeolites (Ulmanu et al., 2006; Vrînceanu et al., 2008), bentonite (Vrînceanu et al., 2008), dolomite (Trakal et al., 2011), lime (Vrînceanu et al., 2010) and organic amendments (Friesl et al., 2006; Hamidpour et al., 2016). These materials have proven to be efficient for metal immobilization in soils and, at the same time, they are not expensive and widely available (Bolan et al., 2014). Many soil extraction tests have been developed to assess the bioavailability of metals in soil. The extractions such as the DTPA-TEA method have been found to be more reliable in predicting the plant availability of metals (Bolan et al., 2014). The main objective of the present study was to test the effectiveness of different amendments to reduce the entry of metals into the food chain in order to limit the negative impact of metals contamination of soil. The immobilization treatments will convert the heavy metals into a less mobile form in the soil. Effectiveness of treatment is assessed using the changes of heavy metals bioavailability and metal accumulation in plant grown on treated soils. MATERIALS AND METHODS In 2015, an experimental field was set-up in Copsa Mica area- Case study for RECARE project. The objective was to study the effects
of amendments used for in-situ remediation of heavy metal contaminated soils. The experiment was carried out in a Randomized Complete Blocks Design (RCBD) with 20 experimental plots organized in 4 blocks. Four amendments were applied: Na-bentonite, dolomite, manure and natural zeolite. Also the experimental field has included 4 control plots (without treatment). The following rates were applied: 90 t/ha of Na-bentonite, 50 t/ha of dolomite, 90 t/ha natural zeolite and 45 t/ha of manure dry matter (Figure 1). The Na-bentonite was purchased from SC Bega Minerale Industriale SA, Gurasada. (grain size 0.16 mm, pH 9.79). The dolomite is a double carbonate of calcium and magnesium (commercial name DEL-CA-MAG) and was provided by SC ExploatareaMinieraHarghita SA from Delnita, Harghita County, Romania. The chemical characteristics indicated a highly alkaline reaction (pH 10.24) and high contents of CaO (max 32.2%) and MgO (max 20.3%). The natural zeolite was purchased from SC Zeolites Production SA, Rupea Brasov (pH 9.25, CEC 217 meq/100 g). The studied zeolite was composed mainly of clinoptilolite (90%). The manure was provided by o small dairy farm from case study area (pH 8.97). One composite soil sample (9 subsamples) was collected from each plot in September 2016. The soil samples were collected from 0-20 cm layer. From each plot were collected plant samples consisting of a mixture of all plants from plot area. The soil samples were air-dried, crushed, and passed through a 2 mm sieve prior to the chemical analysis. Soil pH was measured using potentiometric method (1:2.5 w/v, soil: water). DTPA-extractable heavy metals were extracted from soil (10 g) with 20 ml of extracting solution (0.05 M DTPA, 0.01 M CaCl2 and 0.1 M tetraethylammonium adjusted to pH 7.3), according to SR ISO 14870:2002. DTPA-extracted samples were analyzed for their heavy metal content by means of flame AA Spectrometer GBC Avanta 932AA. The plant samples were washed with tap-water first and then with deionized water in order to remove the soil particles. Afterwards the washed samples were dried (60°C, 72 h), grounded and then were digested with nitric acid in a microwave digestion system. The
metal content was measured using a flame atomic absorption spectrometry. The inorganic additives (Na-bentonite, dolomite and natural zeolite) and manure were analysed in order to determine the metal content (Cd, Cu, Pb and Zn) using atomic absorption spectrometry (flame or graphite furnace). All the chemical determinations analyses were performed in triplicate, and the data reported in
the tables and figures referred to the mean values of these three replicates. Statistical analyses to compare the average results of the different treatments were performed using one-way analysis of variance (ANOVA). Paired comparisons between the treatments and control were carried out using Tukey’s honestly significant difference (HSD) test.
Figure 1. Experimental design amendment addition used for immobilization of heavy metal in contaminated soil
RESULTS AND DISCUSSIONS The mean soil pH value of the control plots was 5.18. Compared to the control, all
treatments induced a significant increase of pH value (p˂0.05). The strong alkaline reaction of Na-bentonite applied induced a significant increase of soil pH. The highest mean value of
800 m
2m 1m
Bloc
k 4
1m
Bloc
k 3
Bloc
k 2
2m
Bloc
k 1
Non amended (control)
Na-bentonite (90 t/ha) Dolomite (50 t/ha)
Natural zeolite (90 t/ha) Manure (45 t D.M./ha)
sampling point soil subsamples colecting for compositing into one sample for analysis
16 m
13 m
1 m

229
The main goal of the amendment’s incorporation into contaminated soils is to reduce the bioavailability and toxicity of metals, based on increasing the soil pH (and thus decreasing the metal mobility) and/or enhance metal sorption by increasing the number of specific sorption sites. Immobilization of metals is an enticing option to reclaim the contaminated soils due to its simplicity and effectiveness, in situ applicability and low cost (Houben et al., 2012; Shaheen et al., 2015). Thus, significant efforts have been made to assess different potentially effective amendments to remediate the heavy metals contaminated soils (eg. Lee et al., 2011; Basta and McGowen, 2004; Lombi et al., 2004; Gonzales-Nunez et al., 2015) and a large number of soil amendments have been investigated including natural zeolites (Ulmanu et al., 2006; Vrînceanu et al., 2008), bentonite (Vrînceanu et al., 2008), dolomite (Trakal et al., 2011), lime (Vrînceanu et al., 2010) and organic amendments (Friesl et al., 2006; Hamidpour et al., 2016). These materials have proven to be efficient for metal immobilization in soils and, at the same time, they are not expensive and widely available (Bolan et al., 2014). Many soil extraction tests have been developed to assess the bioavailability of metals in soil. The extractions such as the DTPA-TEA method have been found to be more reliable in predicting the plant availability of metals (Bolan et al., 2014). The main objective of the present study was to test the effectiveness of different amendments to reduce the entry of metals into the food chain in order to limit the negative impact of metals contamination of soil. The immobilization treatments will convert the heavy metals into a less mobile form in the soil. Effectiveness of treatment is assessed using the changes of heavy metals bioavailability and metal accumulation in plant grown on treated soils. MATERIALS AND METHODS In 2015, an experimental field was set-up in Copsa Mica area- Case study for RECARE project. The objective was to study the effects
of amendments used for in-situ remediation of heavy metal contaminated soils. The experiment was carried out in a Randomized Complete Blocks Design (RCBD) with 20 experimental plots organized in 4 blocks. Four amendments were applied: Na-bentonite, dolomite, manure and natural zeolite. Also the experimental field has included 4 control plots (without treatment). The following rates were applied: 90 t/ha of Na-bentonite, 50 t/ha of dolomite, 90 t/ha natural zeolite and 45 t/ha of manure dry matter (Figure 1). The Na-bentonite was purchased from SC Bega Minerale Industriale SA, Gurasada. (grain size 0.16 mm, pH 9.79). The dolomite is a double carbonate of calcium and magnesium (commercial name DEL-CA-MAG) and was provided by SC ExploatareaMinieraHarghita SA from Delnita, Harghita County, Romania. The chemical characteristics indicated a highly alkaline reaction (pH 10.24) and high contents of CaO (max 32.2%) and MgO (max 20.3%). The natural zeolite was purchased from SC Zeolites Production SA, Rupea Brasov (pH 9.25, CEC 217 meq/100 g). The studied zeolite was composed mainly of clinoptilolite (90%). The manure was provided by o small dairy farm from case study area (pH 8.97). One composite soil sample (9 subsamples) was collected from each plot in September 2016. The soil samples were collected from 0-20 cm layer. From each plot were collected plant samples consisting of a mixture of all plants from plot area. The soil samples were air-dried, crushed, and passed through a 2 mm sieve prior to the chemical analysis. Soil pH was measured using potentiometric method (1:2.5 w/v, soil: water). DTPA-extractable heavy metals were extracted from soil (10 g) with 20 ml of extracting solution (0.05 M DTPA, 0.01 M CaCl2 and 0.1 M tetraethylammonium adjusted to pH 7.3), according to SR ISO 14870:2002. DTPA-extracted samples were analyzed for their heavy metal content by means of flame AA Spectrometer GBC Avanta 932AA. The plant samples were washed with tap-water first and then with deionized water in order to remove the soil particles. Afterwards the washed samples were dried (60°C, 72 h), grounded and then were digested with nitric acid in a microwave digestion system. The
metal content was measured using a flame atomic absorption spectrometry. The inorganic additives (Na-bentonite, dolomite and natural zeolite) and manure were analysed in order to determine the metal content (Cd, Cu, Pb and Zn) using atomic absorption spectrometry (flame or graphite furnace). All the chemical determinations analyses were performed in triplicate, and the data reported in
the tables and figures referred to the mean values of these three replicates. Statistical analyses to compare the average results of the different treatments were performed using one-way analysis of variance (ANOVA). Paired comparisons between the treatments and control were carried out using Tukey’s honestly significant difference (HSD) test.
Figure 1. Experimental design amendment addition used for immobilization of heavy metal in contaminated soil
RESULTS AND DISCUSSIONS The mean soil pH value of the control plots was 5.18. Compared to the control, all
treatments induced a significant increase of pH value (p˂0.05). The strong alkaline reaction of Na-bentonite applied induced a significant increase of soil pH. The highest mean value of
800 m
2m 1m
Bloc
k 4
1m
Bloc
k 3
Bloc
k 2
2m
Bloc
k 1
Non amended (control)
Na-bentonite (90 t/ha) Dolomite (50 t/ha)
Natural zeolite (90 t/ha) Manure (45 t D.M./ha)
sampling point soil subsamples colecting for compositing into one sample for analysis
16 m
13 m
1 m

230
pH was measured in plots treated with Na-bentonite (pH 7.16). Also a significant increasing of pH values was noticed for soil treated with dolomite (pH 6.90) comparing with control (pH 5.18) and soil treated with manure (pH 5.92) and natural zeolite (pH 6.02). Compared to control, the addition of manure and natural zeolite increased statistically significant the pH value of soil but without significant differences between these treatments (Figure 2). It is known that the pH is one of the key parameters governing the behaviour of metals in soils. Increasing the pH induces metal immobilization through different processes like selective sorption or the precipitation of metals as oxides, hydroxides, carbonates and phosphates (Naidu et al., 1994; Gomes et al., 2001; Shaheen et al., 2015). The bioavailability of metals is related to soil pH. Therefore the effects of treatments on pH are reflected on metals bioavailability assessed by DTPA-extractable metal fractions. Precipitation and increased sorption are the main mechanisms identified as responsible by retention of metals in soils treated with alkaline materials (Lee et al., 2009; Houben et al., 2012). In our experiments addition of Na-bentonite and dolomite increased significantly the soil pH this explain why it lowered the concentrations of Cd, Zn, Cu and Pb in mobile forms in soil. The addition of 90 t/ha Na-bentonite reduce statistically significant the mobile forms in soil from 13.6 mg∙kg-1 Cu (control) to 9.4 mg∙kg-1 Cu and from, 327 mg∙kg-1 (control) to and 143 mg∙kg-1 Zn. Contents of Cd and Pb as mobile forms in soils decreased statistically significant (p˂0.05) after addition of 50 t/ha dolomite from 10.5 mg∙kg-1 Cd (control) to 8.5 mg∙kg-1 Cd and from 163 mg∙kg-1 Pb (control) to134 mg∙kg-1Pb (treated soil). By using the natural zeolites (90 t/ha) the values of heavy metal contents in mobile forms from soil decreased significantly comparing with control, without significant effects on metal concentration in plants grown on treated soils. Comparing with application of Na-bentonite or dolomite the addition of
natural zeolites was less effective in reducing the metal bioavailability. Lepp (1998) quoted by Hamidpour et al. (2016) demonstrated that the addition of zeolites in contaminated soils reduced the water-extractable metal ion concentrations and improved the plant growth. Addition of manure, collected from a local farm, had no influence on bioavailability of studied metals. The reason of this could be the high contents of heavy metals in this amendment (1.59 mg∙kg-1 Cd, 128 mg∙kg-1 Cu, 156 mg∙kg-1Pb, 920 mg∙kg-1 Zn). Another reason could be the chemical extractant used to assess the bioavailability, because 0.05 M DTPA in buffered solution of CaCl2 and TEA (pH 7.3) is more effective in removing soluble metal-organic complexes. However, some studies have strongly correlated DTPA-extractable metals to plant-available metals (Hamidpour et al., 2016). Compared to control the values of metals (Cd, Cu, Zn and Pb) contents in mobile forms decreased after treatment with 45t/ha manure but without statistically significance. The highest reducing was noticed for Zn. After application of manure the mean value of Zn content in mobile forms decreased from 327 mg∙kg-1 Zn (control) to 290 mg∙kg-1 Zn (Figure 2). The average contents of Cd, Cu, Pb and Zn in plants grown in the untreated soil (control) were: 10.7 mg∙kg-1 DW Cd, 13.8 mg∙kg-1 DW Cu, 11.6 mg∙kg-1 DW Pb, 392 mg∙kg-1 DW Zn. Compared to the control, the contents of Cd and Cu decreased statistically significant (p˂0.05) to 8.4 mg∙kg-1 DW Cd and 7.2 mg∙kg-1 DW Cu in plants grown in soil treated with Na-bentonite (90 t/ha). There are no statistical significant effects on lead and zinc accumulation in biomass (Figure 2). The highest decrease of zinc content in plant was noticed after Na-bentonite application. The mean value of zinc content in plants grown in soil treated with 90 t/ha Na-bentonite was 67.3% of mean value of zinc content in control plant.
Figure 2. Effects of immobilization amendments on pH values, DTPA-extractable metal content
and metal content in plant biomass
pH
5.18 a
* 5.92 b
6.02 b
6.90 c 7.1
6 c
3
5
7
9
Cd in soil (mg/kg)
10.5
a
9.8 ab
9.1 bc
8.7 bc
8.5 c
0
5
10
15
Cd in plant (mg/kg)12
.1 a
10.8
ab
10.7
ab
8.5 b
8.4 b
0
5
10
15
Cu in soil (mg/kg)
13.6
a
12.2
ab
10.5
bc
9.6 bc
9.4 c
0
6
12
18
Cu in plant (mg/kg)
13.8
a
11.2
b
8.1 c
7.3 c
7.2 c
0
6
12
18
Pb in soil (mg/kg)
163 a
160 a
143 b
136 b
134 b
0
50
100
150
200
250
Pb in plant (mg/kg)
11.6
a
10.6
a10
.3 a
9.3 a
9.3 a
0
5
10
15
20
25
Zn in soil (mg/kg)
327 a
290 a
234 b
156 c
143 c
0
100
200
300
400
Zn in plant (mg/kg)
392 a
376 a
329 a
309 a
264 a
0
125
250
375
500
Non amended ( control ) Manure ( 45 t D.M. / ha )
Natural zeolite ( 90 t/ha ) Dolomite ( 50 t/ha ) Na-bentonite ( 90 t/ha )
* Values followed by the same letter (a, b, c) are not significantly different at the 5% level according to the Tukey's honestly significant differences (HSD) test.

231
pH was measured in plots treated with Na-bentonite (pH 7.16). Also a significant increasing of pH values was noticed for soil treated with dolomite (pH 6.90) comparing with control (pH 5.18) and soil treated with manure (pH 5.92) and natural zeolite (pH 6.02). Compared to control, the addition of manure and natural zeolite increased statistically significant the pH value of soil but without significant differences between these treatments (Figure 2). It is known that the pH is one of the key parameters governing the behaviour of metals in soils. Increasing the pH induces metal immobilization through different processes like selective sorption or the precipitation of metals as oxides, hydroxides, carbonates and phosphates (Naidu et al., 1994; Gomes et al., 2001; Shaheen et al., 2015). The bioavailability of metals is related to soil pH. Therefore the effects of treatments on pH are reflected on metals bioavailability assessed by DTPA-extractable metal fractions. Precipitation and increased sorption are the main mechanisms identified as responsible by retention of metals in soils treated with alkaline materials (Lee et al., 2009; Houben et al., 2012). In our experiments addition of Na-bentonite and dolomite increased significantly the soil pH this explain why it lowered the concentrations of Cd, Zn, Cu and Pb in mobile forms in soil. The addition of 90 t/ha Na-bentonite reduce statistically significant the mobile forms in soil from 13.6 mg∙kg-1 Cu (control) to 9.4 mg∙kg-1 Cu and from, 327 mg∙kg-1 (control) to and 143 mg∙kg-1 Zn. Contents of Cd and Pb as mobile forms in soils decreased statistically significant (p˂0.05) after addition of 50 t/ha dolomite from 10.5 mg∙kg-1 Cd (control) to 8.5 mg∙kg-1 Cd and from 163 mg∙kg-1 Pb (control) to134 mg∙kg-1Pb (treated soil). By using the natural zeolites (90 t/ha) the values of heavy metal contents in mobile forms from soil decreased significantly comparing with control, without significant effects on metal concentration in plants grown on treated soils. Comparing with application of Na-bentonite or dolomite the addition of
natural zeolites was less effective in reducing the metal bioavailability. Lepp (1998) quoted by Hamidpour et al. (2016) demonstrated that the addition of zeolites in contaminated soils reduced the water-extractable metal ion concentrations and improved the plant growth. Addition of manure, collected from a local farm, had no influence on bioavailability of studied metals. The reason of this could be the high contents of heavy metals in this amendment (1.59 mg∙kg-1 Cd, 128 mg∙kg-1 Cu, 156 mg∙kg-1Pb, 920 mg∙kg-1 Zn). Another reason could be the chemical extractant used to assess the bioavailability, because 0.05 M DTPA in buffered solution of CaCl2 and TEA (pH 7.3) is more effective in removing soluble metal-organic complexes. However, some studies have strongly correlated DTPA-extractable metals to plant-available metals (Hamidpour et al., 2016). Compared to control the values of metals (Cd, Cu, Zn and Pb) contents in mobile forms decreased after treatment with 45t/ha manure but without statistically significance. The highest reducing was noticed for Zn. After application of manure the mean value of Zn content in mobile forms decreased from 327 mg∙kg-1 Zn (control) to 290 mg∙kg-1 Zn (Figure 2). The average contents of Cd, Cu, Pb and Zn in plants grown in the untreated soil (control) were: 10.7 mg∙kg-1 DW Cd, 13.8 mg∙kg-1 DW Cu, 11.6 mg∙kg-1 DW Pb, 392 mg∙kg-1 DW Zn. Compared to the control, the contents of Cd and Cu decreased statistically significant (p˂0.05) to 8.4 mg∙kg-1 DW Cd and 7.2 mg∙kg-1 DW Cu in plants grown in soil treated with Na-bentonite (90 t/ha). There are no statistical significant effects on lead and zinc accumulation in biomass (Figure 2). The highest decrease of zinc content in plant was noticed after Na-bentonite application. The mean value of zinc content in plants grown in soil treated with 90 t/ha Na-bentonite was 67.3% of mean value of zinc content in control plant.
Figure 2. Effects of immobilization amendments on pH values, DTPA-extractable metal content
and metal content in plant biomass
pH
5.18 a
* 5.92 b
6.02 b
6.90 c 7.1
6 c
3
5
7
9
Cd in soil (mg/kg)
10.5
a
9.8 ab
9.1 bc
8.7 bc
8.5 c
0
5
10
15
Cd in plant (mg/kg)12
.1 a
10.8
ab
10.7
ab
8.5 b
8.4 b
0
5
10
15
Cu in soil (mg/kg)
13.6
a
12.2
ab
10.5
bc
9.6 bc
9.4 c
0
6
12
18
Cu in plant (mg/kg)
13.8
a
11.2
b
8.1 c
7.3 c
7.2 c
0
6
12
18
Pb in soil (mg/kg)
163 a
160 a
143 b
136 b
134 b
0
50
100
150
200
250
Pb in plant (mg/kg)
11.6
a
10.6
a10
.3 a
9.3 a
9.3 a
0
5
10
15
20
25
Zn in soil (mg/kg)
327 a
290 a
234 b
156 c
143 c
0
100
200
300
400
Zn in plant (mg/kg)
392 a
376 a
329 a
309 a
264 a
0
125
250
375
500
Non amended ( control ) Manure ( 45 t D.M. / ha )
Natural zeolite ( 90 t/ha ) Dolomite ( 50 t/ha ) Na-bentonite ( 90 t/ha )
* Values followed by the same letter (a, b, c) are not significantly different at the 5% level according to the Tukey's honestly significant differences (HSD) test.

232
The same trend was noticed by Houben et al. (2012) for the plant of white lupin grown in the contaminated soil treated with bentonite. The lowest content of lead (9.3 mg∙kg-1 DW) was noticed in plant grown in soil treated with dolomite (50 t/ha). This mean value of lead content is 80.1% of mean value of lead content in control plants (Figure 2). The reason of this could be the high contents of metals in this amendment (1.59 mg∙kg-1 Cd, 128 mg∙kg-1 Cu, 156 mg∙kg-1Pb, 920 mg∙kg-1 Zn). Another reason could be the chemical extractant used to assess the bioavailability, because 0.05 M DTPA in buffered solution of CaCl2 and TEA (pH 7.3) is more effective in removing soluble metal-organic complexes. However, some studies have strongly correlated DTPA-extractable metals to plant-available metals (Hamidpour et al., 2016).
There are slightly correlations between Zn concentration in grass plant and DTPA-extractable Zn content in the manure amended soils but Cu and Pb concentrations of grass were not correlated with DTPA-extractable content of the metals in soil. This behaviour indicates that the effectiveness of DTPA extraction, as a measure of metal bioavailability, depends on the nature of the metal. Unlike single extraction, sequential extraction offers information about mobile and residual fraction of metal in soil allowing a better correlation with data related to transfer metals in the plant. The Table 1 summarized the effects of amend-ment’s application on soil and indicates that the two metals transfer pathways considered are differently affected.
Table 1. Overview of significant effects of treatments on metal bioavailability in soil and metal accumulation in biomass grown on treated soils
Additions of some amendments like manure or natural zeolite, tested for immobilization of heavy metals improved the soil fertility. Natural zeolites are recognized as a source of available potassium. The input of organic
matter and nutrients like P and K would promote plant growth. Reducing the metal toxicity and improving the soil fertility lead to development of a consistent vegetation cover (Figure 3).
TreatmentCd Cu Pb Zn Cd Cu Pb Zn
Na-bentonite (90 t/ha) + + + + + + + + + + = + + + = =
Dolomite (50 t/ha) + + + + + + + + + + = + + + = =
Natural zeolite (90 t/ha) + + + + + + = + = =
Manure (45 t D.M./ha) = = = = = + + + = =
= Non-significant effect ( p > 0.05 )
+ Significant effect ( 0.01 < p � 0.05 )
+ + Very significant effect ( 0.001 < p � 0.01 )
+ + + Extremely significant effect ( p � 0.001 )
Heavy metals bioavailability Heavy metals accumulation in plant
Figure 3. Images from the experimental field (september, 2016): (a) the experimental site just after the
first sampling of soil and plants; ground cover vegetation in a control (non-amended) plot (b) and some experimental plots amended with dolomite (c), natural zeolite (d); bentonite (e) and manure (f)
CONCLUSIONS Our study aimed at simultaneously investi-gating the effects of four amendments on bioavailability and accumulation in plants of Cu, Cd, Pb and Zn. The studied metals do not react similarly to the same amendments and this conclusion highlights the difficulty in selection of suitable amendments for every metal in contaminated soil. Inorganic amendments are effective in decreasing the metal bioavailability (assessed by single extraction with 0.05 M DTPA) due to increasing the number of binding sites for heavy metals (bentonite and natural zeolite)
and due to pH effects (dolomite). Organic amendments like farm manure decreased the metal bioavailability in soil due to its high content of organic matter, able to bind the metals as metal-organic complexes. Although soil amendments significantly reduce the bioavailability of metals this reduction is not enough to produce food or fodder. The repeated application may be necessary and the effectiveness is highly dependent on soil conditions and has to be monitored. Also, the further investigations on the long-run are important to examine the positive but potential transitory effects of these amendments.
a b
c d
e f
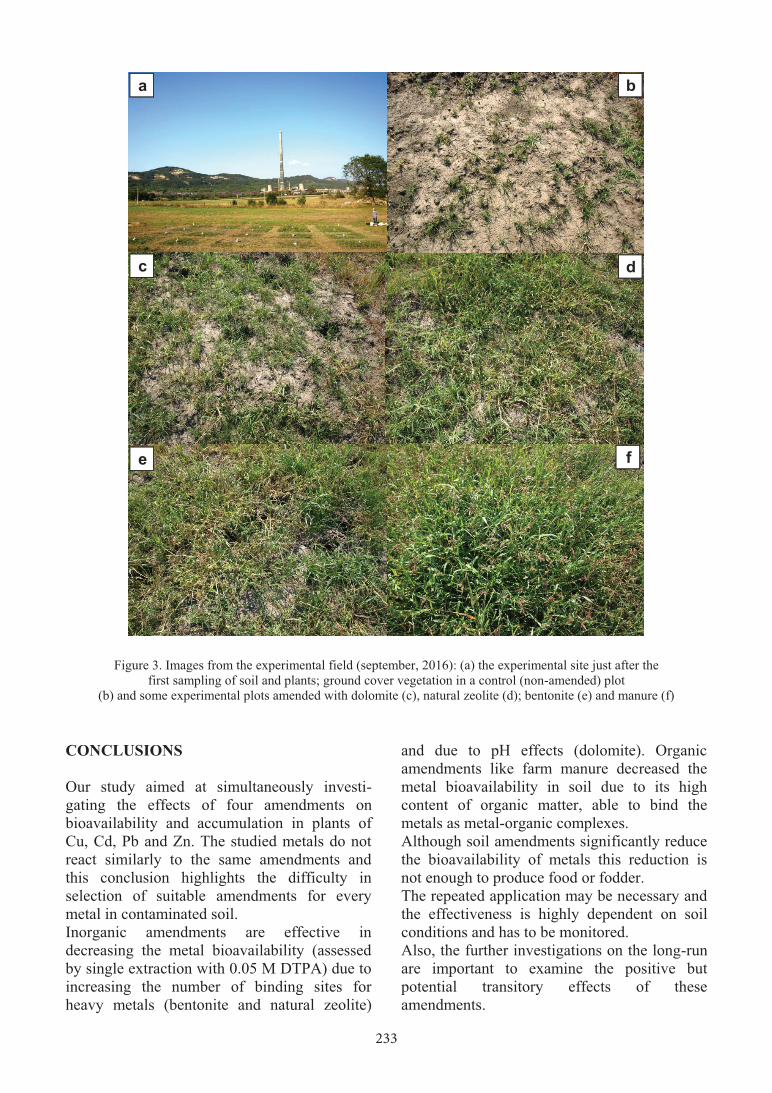
233
The same trend was noticed by Houben et al. (2012) for the plant of white lupin grown in the contaminated soil treated with bentonite. The lowest content of lead (9.3 mg∙kg-1 DW) was noticed in plant grown in soil treated with dolomite (50 t/ha). This mean value of lead content is 80.1% of mean value of lead content in control plants (Figure 2). The reason of this could be the high contents of metals in this amendment (1.59 mg∙kg-1 Cd, 128 mg∙kg-1 Cu, 156 mg∙kg-1Pb, 920 mg∙kg-1 Zn). Another reason could be the chemical extractant used to assess the bioavailability, because 0.05 M DTPA in buffered solution of CaCl2 and TEA (pH 7.3) is more effective in removing soluble metal-organic complexes. However, some studies have strongly correlated DTPA-extractable metals to plant-available metals (Hamidpour et al., 2016).
There are slightly correlations between Zn concentration in grass plant and DTPA-extractable Zn content in the manure amended soils but Cu and Pb concentrations of grass were not correlated with DTPA-extractable content of the metals in soil. This behaviour indicates that the effectiveness of DTPA extraction, as a measure of metal bioavailability, depends on the nature of the metal. Unlike single extraction, sequential extraction offers information about mobile and residual fraction of metal in soil allowing a better correlation with data related to transfer metals in the plant. The Table 1 summarized the effects of amend-ment’s application on soil and indicates that the two metals transfer pathways considered are differently affected.
Table 1. Overview of significant effects of treatments on metal bioavailability in soil and metal accumulation in biomass grown on treated soils
Additions of some amendments like manure or natural zeolite, tested for immobilization of heavy metals improved the soil fertility. Natural zeolites are recognized as a source of available potassium. The input of organic
matter and nutrients like P and K would promote plant growth. Reducing the metal toxicity and improving the soil fertility lead to development of a consistent vegetation cover (Figure 3).
TreatmentCd Cu Pb Zn Cd Cu Pb Zn
Na-bentonite (90 t/ha) + + + + + + + + + + = + + + = =
Dolomite (50 t/ha) + + + + + + + + + + = + + + = =
Natural zeolite (90 t/ha) + + + + + + = + = =
Manure (45 t D.M./ha) = = = = = + + + = =
= Non-significant effect ( p > 0.05 )
+ Significant effect ( 0.01 < p � 0.05 )
+ + Very significant effect ( 0.001 < p � 0.01 )
+ + + Extremely significant effect ( p � 0.001 )
Heavy metals bioavailability Heavy metals accumulation in plant
Figure 3. Images from the experimental field (september, 2016): (a) the experimental site just after the
first sampling of soil and plants; ground cover vegetation in a control (non-amended) plot (b) and some experimental plots amended with dolomite (c), natural zeolite (d); bentonite (e) and manure (f)
CONCLUSIONS Our study aimed at simultaneously investi-gating the effects of four amendments on bioavailability and accumulation in plants of Cu, Cd, Pb and Zn. The studied metals do not react similarly to the same amendments and this conclusion highlights the difficulty in selection of suitable amendments for every metal in contaminated soil. Inorganic amendments are effective in decreasing the metal bioavailability (assessed by single extraction with 0.05 M DTPA) due to increasing the number of binding sites for heavy metals (bentonite and natural zeolite)
and due to pH effects (dolomite). Organic amendments like farm manure decreased the metal bioavailability in soil due to its high content of organic matter, able to bind the metals as metal-organic complexes. Although soil amendments significantly reduce the bioavailability of metals this reduction is not enough to produce food or fodder. The repeated application may be necessary and the effectiveness is highly dependent on soil conditions and has to be monitored. Also, the further investigations on the long-run are important to examine the positive but potential transitory effects of these amendments.
a b
c d
e f

234
ACKNOWLEDGEMENTS The research leading to these results has received funding from the European Union Seventh Framework Programme (FP7/2007-2013) under Grant Agreement No 603498 (RECARE project). The authors wish to thank Jan Jacob Keizerof University of Aveiro, Portugal for his useful comments. Thanks also go to Mircea Rotar, agronomist from Axente Sever, the owner of the land where was organised the experimental field. REFERENCES Adriano D.C., Wenzel W.W., Vangrosveld J., Bolan
N.S., 2004. Role of assisted natural remediation in environmental cleanup. Geoderma, 122, p. 121-142.
Basta N.T., McGowen S.L., 2004. Evaluation of chemical immobilization treatments for reducing heavy metal transport in a smelter - contaminated soil. Environmental Pollution 127, p. 73-82.
Boisson J., Ruttens A., Mench M., Vangrosveld J., 1999. Evaluation of hydroxyapatite as a metal immobilizing soil additive for the remediation of polluted soils. Part 1. Influence of hydroxyapatite on metal exchangeability in soil, plant growth and plant metal accumulation. Enviro. Pollution, 104, p. 225-233.
Bolan N., KunhikrishnanA., ThangarajanR., KumpieneJ., ParkJ., MakinoT., Kirkham M.B., Scheckel K., 2014. Remediation of heavy metal(loid)s contaminated soils - To mobilize or to immobilize? Journal of Hazardous Materials, 266, p. 141-166.
Friesl W., Friedl J., Platzer K., HorakO., Gerzabek M.H., 2006. Remediation of contaminated agricultural soils near a former Pb/Zn smelter in Austria: Batch, pot and field experiments. Environmental Pollution 144, p. 40-50.
Hamidpour M., Khadivi E., Afyuni M., 2016. Residual effects of biosolids and farm manure on speciation and plant uptake of heavy metals in a calcareous soil. Environ Earth Sci. 75, 1037, p. 1-9.
Houben D., Pircar J., Sonnet P., 2012. Heavy metal immobilization by cost-effective amendments in a contaminated soil: Effects on metal leaching and phyto availability. Journal of Geochemical Exploration, 123, p.87-94.
Gomes P.C., Fontes M.P., da Silva A.G., de Mendoca E., Netto R.A., 2001. Selectivity sequence and competitive adsorption of heavy metals by Brazilian soils, Soil. Sci. Soc. Am. J., 65, p. 1115-1121.
Gonzalez-Nunez R., Alba M.D., Vidal M., Rigol A., 2015. Viability of adding gypsum and calcite for remediation of metal-contaminated soil: laboratory and pilot plant scales. International Journal of Environ. Science and Techn., 12 (8), 12, p. 2697-2710.
Lee S.H., Lee J.S., Choi Y.J., KimJ.G., 2009. In situ stabilization of cadmium, lead and zinc-contaminated soil using various amendments, Chemosphere, 77, p. 1069-1075.
Lee S.H., Park H., Koo N., Hyun S., Hwang A., 2011. Evaluation of the effectiveness of various amendments on trace metals stabilization by chemical and biological methods. Journal of Hazardous Materials, 188, p. 44-51.
Lombi E., Hamon R.E., Wieshammer G., McLaughlin J., McGrath S.P., 2004. Assessment of the use of industrial by-products to remediate a copper- and arsenic- contaminated soil. Journal of Environmental Quality 33, p. 902-910.
Mench M., Bussiere S., Biosson J., Castaing E., Vangronsveld J., Ruttens A., Dekoe T., Bleeker P., Assuncao A., Manceau A., 2003. Progress in remediation and revegetation of barren Jales gold mine spoil after in situ treatments. Plant Soil, 249, p. 187-202.
Naidu R., Bolan N.S., Kookana R.S., Tiller K.G., 1994. Ionic-strength and pH effects on sorption of cadmium and the surface charge of soils. European Journal of Soil Science,45, p. 419-429.
Shaheen S.M., Rinklebe J., Selim M.H., 2015. Impact of various amendments on immobilization and phytoavailability of nickel and zinc in contaminated floodplain soil. Int. J. Environ. Sci. Technol., 12, p. 2765-2776.
Sitarz-Palczak E., Kalembkiewicz J., 2012. Study of remediation of soil contaminated with heavy metals by coal fly ash. J. Environ. Protection, 3, p. 1373-1383.
Trakal L., Neuberg M., Tlustos P.,Szakova J., Tejnecky V., Drabek O., 2011. Dolomite limestone application as a chemical immobilization of metal-contaminated soil. Plant Soil Environ., 57 (4),p. 173-179.
Ulmanu M., Anger I., Gament E., Olanescu G., Predescu C., Sohaciu, M., 2011. Effects of a Romanian zeolit on heavy metals transfer from polluted soil to corn, mustard and oat. U.P.B. Sci. Bull, Series B, 68 (3),p. 67-78.
Vrînceanu N., Dumitru M., Motelică D.M., Tănase V., Calciu I., 2008. Efectele utilizării unor aditivi anorganici asupra transferului cadmiului, plumbului şi zincului în plantele de porumb cultivate pe un sol poluat din zona Copşa Mică. Ştiinţa Solului XLII (1), p. 69-82.
Vrînceanu N.O., Dumitru M., Motelica D.M., Gamenț E., 2010. Comportarea unor metale in sistemul sol-planta. Ed. Solness, Timisoara.
***GWRTAC, “Remediation of metals-contaminated soils and groundwater,” Tech. Rep. TE-97-01, GWRTAC, Pittsburgh, Pa, USA, 1997.
EPIDEMIOLOGICAL PROFILE OF RABIESIN PRAHOVA COUNTY,
ROMANIA 2010-2015
Vlad VUTA1, 2, Gheorghe BARBOI3, Florica BARBUCEANU1, 2, Constantin LUPESCU1, 3, Gabriel PREDOI2, Viorel SURLARU4, Constantin VLAGIOIU2
1Institute for Diagnosis and Animal Health, Bucharest, Romania 2University of Agronomic Sciences and Veterinary Medicine - Faculty of Veterinary Medicine,
Bucharest, Romania 3Spiru Haret University, Faculty of Veterinary Medicine, Bucharest, Romania
4Prahova County Sanitary Veterinary Laboratory, Romania
Corresponding author email: [email protected]
Abstract Rabies is a fatal zoonotic viral disease produced by a Lyssavirus and is causing more than 70,000 human deaths each year. Due to the fatality of the disease and in the absence of the specific treatment, vaccination and immunization are the most important methods to fight against rabies. The aim of this study was to evaluate the epidemiological situation of rabies in Prahova County during 2010-2015. During this period in Prahova county from total number of population 0.25%, (n=6513) out of women, respectively 0.28% (n=6739) out of man were immunized against Rabies. 0.32% (n=8324) out of urban population and 0.20% (n=4928) of rural population were immunized against Rabies. In 2010-2015, 63 animals, 51 wild (81%) and 12 domestic (19%) were find positive to Fluorescent Antibody Test (FAT) for Rabies (5 dogs, 6 cats, 1 bear, 1 cattle and 50 fox). Taking into account the number of positive cases in animals as well as the risk of diseases in human population it is strongly recommended to use procedures in place of vaccination for persons who have come into contact with the animal potentially infected with rabies virus. Key words: rabies, epidemiology, Prahova, 2010-2015. INTRODUCTION Rabies is a Central Nervous System zoonotic disease, with the causative agent Rabies virus, distributed worldwide and generally is found in terrestrial mammals and causes between 37.000 and 87.000 human deaths annually (Virus taxonomy 9th report, 2012; WHO Expert Consultation on Rabies second report, 2013; Schell, 2010; Vuta et al., 2016). In Europe canine rabies has been eradicated from by control measures such as dog movement restriction and mass vaccination and now the major reservoir of rabies was replaced by red fox (Vulpes vulpes) (Cliquet, 2015;Vuta, 2016). A co-financed by the EU and the Romanian state budget oral vaccination trial of foxes has been conducted in 16 counties from the western part of Romania in spring and autumn 2011 (Vuta, 2016). The purpose of our study was to assess the epidemiological profile of Rabies in Prahova County during 2010-2015, due to the following reasons: rabies is a fatal zoonotic disease and the risk is still present.
MATERIALS AND METHODS Data collection The analysis of the epidemiological situation of Rabies in Prahova County was based on information from National Reference Labora-tory for rabies and Prahova County Sanitary Veterinary Laboratory. The data of patients were collected from data base of Vaccination Center against Rabies of the County Infectious Diseases Emergency Hospital in Ploiesti, Prahova County. The next parameters were collected: age, gender, aggressor animal, date of contact and date of starting prophylaxis. During 2010-2015 in Prahova County, there was no reported any case of human rabies. Statistical analysis and spatial distribution Statistical analyses were performed using Graph Pad Prism version 6.01 software. For spatial distribution, we have used QGIS 2.18 software.

235
ACKNOWLEDGEMENTS The research leading to these results has received funding from the European Union Seventh Framework Programme (FP7/2007-2013) under Grant Agreement No 603498 (RECARE project). The authors wish to thank Jan Jacob Keizerof University of Aveiro, Portugal for his useful comments. Thanks also go to Mircea Rotar, agronomist from Axente Sever, the owner of the land where was organised the experimental field. REFERENCES Adriano D.C., Wenzel W.W., Vangrosveld J., Bolan
N.S., 2004. Role of assisted natural remediation in environmental cleanup. Geoderma, 122, p. 121-142.
Basta N.T., McGowen S.L., 2004. Evaluation of chemical immobilization treatments for reducing heavy metal transport in a smelter - contaminated soil. Environmental Pollution 127, p. 73-82.
Boisson J., Ruttens A., Mench M., Vangrosveld J., 1999. Evaluation of hydroxyapatite as a metal immobilizing soil additive for the remediation of polluted soils. Part 1. Influence of hydroxyapatite on metal exchangeability in soil, plant growth and plant metal accumulation. Enviro. Pollution, 104, p. 225-233.
Bolan N., KunhikrishnanA., ThangarajanR., KumpieneJ., ParkJ., MakinoT., Kirkham M.B., Scheckel K., 2014. Remediation of heavy metal(loid)s contaminated soils - To mobilize or to immobilize? Journal of Hazardous Materials, 266, p. 141-166.
Friesl W., Friedl J., Platzer K., HorakO., Gerzabek M.H., 2006. Remediation of contaminated agricultural soils near a former Pb/Zn smelter in Austria: Batch, pot and field experiments. Environmental Pollution 144, p. 40-50.
Hamidpour M., Khadivi E., Afyuni M., 2016. Residual effects of biosolids and farm manure on speciation and plant uptake of heavy metals in a calcareous soil. Environ Earth Sci. 75, 1037, p. 1-9.
Houben D., Pircar J., Sonnet P., 2012. Heavy metal immobilization by cost-effective amendments in a contaminated soil: Effects on metal leaching and phyto availability. Journal of Geochemical Exploration, 123, p.87-94.
Gomes P.C., Fontes M.P., da Silva A.G., de Mendoca E., Netto R.A., 2001. Selectivity sequence and competitive adsorption of heavy metals by Brazilian soils, Soil. Sci. Soc. Am. J., 65, p. 1115-1121.
Gonzalez-Nunez R., Alba M.D., Vidal M., Rigol A., 2015. Viability of adding gypsum and calcite for remediation of metal-contaminated soil: laboratory and pilot plant scales. International Journal of Environ. Science and Techn., 12 (8), 12, p. 2697-2710.
Lee S.H., Lee J.S., Choi Y.J., KimJ.G., 2009. In situ stabilization of cadmium, lead and zinc-contaminated soil using various amendments, Chemosphere, 77, p. 1069-1075.
Lee S.H., Park H., Koo N., Hyun S., Hwang A., 2011. Evaluation of the effectiveness of various amendments on trace metals stabilization by chemical and biological methods. Journal of Hazardous Materials, 188, p. 44-51.
Lombi E., Hamon R.E., Wieshammer G., McLaughlin J., McGrath S.P., 2004. Assessment of the use of industrial by-products to remediate a copper- and arsenic- contaminated soil. Journal of Environmental Quality 33, p. 902-910.
Mench M., Bussiere S., Biosson J., Castaing E., Vangronsveld J., Ruttens A., Dekoe T., Bleeker P., Assuncao A., Manceau A., 2003. Progress in remediation and revegetation of barren Jales gold mine spoil after in situ treatments. Plant Soil, 249, p. 187-202.
Naidu R., Bolan N.S., Kookana R.S., Tiller K.G., 1994. Ionic-strength and pH effects on sorption of cadmium and the surface charge of soils. European Journal of Soil Science,45, p. 419-429.
Shaheen S.M., Rinklebe J., Selim M.H., 2015. Impact of various amendments on immobilization and phytoavailability of nickel and zinc in contaminated floodplain soil. Int. J. Environ. Sci. Technol., 12, p. 2765-2776.
Sitarz-Palczak E., Kalembkiewicz J., 2012. Study of remediation of soil contaminated with heavy metals by coal fly ash. J. Environ. Protection, 3, p. 1373-1383.
Trakal L., Neuberg M., Tlustos P.,Szakova J., Tejnecky V., Drabek O., 2011. Dolomite limestone application as a chemical immobilization of metal-contaminated soil. Plant Soil Environ., 57 (4),p. 173-179.
Ulmanu M., Anger I., Gament E., Olanescu G., Predescu C., Sohaciu, M., 2011. Effects of a Romanian zeolit on heavy metals transfer from polluted soil to corn, mustard and oat. U.P.B. Sci. Bull, Series B, 68 (3),p. 67-78.
Vrînceanu N., Dumitru M., Motelică D.M., Tănase V., Calciu I., 2008. Efectele utilizării unor aditivi anorganici asupra transferului cadmiului, plumbului şi zincului în plantele de porumb cultivate pe un sol poluat din zona Copşa Mică. Ştiinţa Solului XLII (1), p. 69-82.
Vrînceanu N.O., Dumitru M., Motelica D.M., Gamenț E., 2010. Comportarea unor metale in sistemul sol-planta. Ed. Solness, Timisoara.
***GWRTAC, “Remediation of metals-contaminated soils and groundwater,” Tech. Rep. TE-97-01, GWRTAC, Pittsburgh, Pa, USA, 1997.
AgroLife Scientific Journal - Volume 6, Number 2, 2017ISSN 2285-5718; ISSN CD-ROM 2285-5726; ISSN ONLINE 2286-0126; ISSN-L 2285-5718
EPIDEMIOLOGICAL PROFILE OF RABIESIN PRAHOVA COUNTY,
ROMANIA 2010-2015
Vlad VUTA1, 2, Gheorghe BARBOI3, Florica BARBUCEANU1, 2, Constantin LUPESCU1, 3, Gabriel PREDOI2, Viorel SURLARU4, Constantin VLAGIOIU2
1Institute for Diagnosis and Animal Health, Bucharest, Romania 2University of Agronomic Sciences and Veterinary Medicine - Faculty of Veterinary Medicine,
Bucharest, Romania 3Spiru Haret University, Faculty of Veterinary Medicine, Bucharest, Romania
4Prahova County Sanitary Veterinary Laboratory, Romania
Corresponding author email: [email protected]
Abstract Rabies is a fatal zoonotic viral disease produced by a Lyssavirus and is causing more than 70,000 human deaths each year. Due to the fatality of the disease and in the absence of the specific treatment, vaccination and immunization are the most important methods to fight against rabies. The aim of this study was to evaluate the epidemiological situation of rabies in Prahova County during 2010-2015. During this period in Prahova county from total number of population 0.25%, (n=6513) out of women, respectively 0.28% (n=6739) out of man were immunized against Rabies. 0.32% (n=8324) out of urban population and 0.20% (n=4928) of rural population were immunized against Rabies. In 2010-2015, 63 animals, 51 wild (81%) and 12 domestic (19%) were find positive to Fluorescent Antibody Test (FAT) for Rabies (5 dogs, 6 cats, 1 bear, 1 cattle and 50 fox). Taking into account the number of positive cases in animals as well as the risk of diseases in human population it is strongly recommended to use procedures in place of vaccination for persons who have come into contact with the animal potentially infected with rabies virus. Key words: rabies, epidemiology, Prahova, 2010-2015. INTRODUCTION Rabies is a Central Nervous System zoonotic disease, with the causative agent Rabies virus, distributed worldwide and generally is found in terrestrial mammals and causes between 37.000 and 87.000 human deaths annually (Virus taxonomy 9th report, 2012; WHO Expert Consultation on Rabies second report, 2013; Schell, 2010; Vuta et al., 2016). In Europe canine rabies has been eradicated from by control measures such as dog movement restriction and mass vaccination and now the major reservoir of rabies was replaced by red fox (Vulpes vulpes) (Cliquet, 2015;Vuta, 2016). A co-financed by the EU and the Romanian state budget oral vaccination trial of foxes has been conducted in 16 counties from the western part of Romania in spring and autumn 2011 (Vuta, 2016). The purpose of our study was to assess the epidemiological profile of Rabies in Prahova County during 2010-2015, due to the following reasons: rabies is a fatal zoonotic disease and the risk is still present.
MATERIALS AND METHODS Data collection The analysis of the epidemiological situation of Rabies in Prahova County was based on information from National Reference Labora-tory for rabies and Prahova County Sanitary Veterinary Laboratory. The data of patients were collected from data base of Vaccination Center against Rabies of the County Infectious Diseases Emergency Hospital in Ploiesti, Prahova County. The next parameters were collected: age, gender, aggressor animal, date of contact and date of starting prophylaxis. During 2010-2015 in Prahova County, there was no reported any case of human rabies. Statistical analysis and spatial distribution Statistical analyses were performed using Graph Pad Prism version 6.01 software. For spatial distribution, we have used QGIS 2.18 software.

236
RESULTS AND DISCUSSIONS Rabies cases in animals During the analyzed period (2010-2015), the natural reservoir of rabies virus in Prahova County was identified in wild animals 81% (n=51) in comparison with domestic animals, 19% (n=12). The spatial distribution of diag-nosed species and number of animals per year are shown in Figures 1 and 2. The number of positive cases is decreasing, in 2015 only 2 positive foxes were find, due to the oral rabies vaccination program of foxes implemented in Romania since 2011. The pets and the farm animals have been in-volved in most of the cases of aggression, 99% (n=13124), in comparison with wild animals, 1% (n=126). The distribution per year and per species is shown in Figure 3, as well as, Figure 4 for dog and cat distribution along 2010-2015. Registration of people exposed to suspected animals The total population of Prahova County, according to General population and housing census was 4944296 persons, 51.5% female (n=2547421) and 48.5% (n=2396875) male. The total population living in urban and rural areas was 2538548 (51.3%), respectively 2405748 (48.7%) (National Institute of Statistics). None of the patients got rabies pre-exposure prophylaxis. The prescribed schedule of immune prophylaxis was performed accor-ding to WHO recommendations and protocols (WHO Expert Consultation on Rabies second report, 2013).
Figure 1. Spatial distribution of rabies cases in animals during 2010-2015, PrahovaCounty. A-2010; B-2011;
C-2012; D-2013; E-2014; F-2015
Figure 2. Numbers and species of rabies positive animals per year
Out of 2547421 women, 6513 were immunized (0.25%), as well as out of 2396875 total number of men, 6738 (0.28%) got immune prophylaxis (Figure 5).
Figure 3. The numbers and species of animals involved in human aggression during 2010-2015.
A-2010; B-2011; C-2012; D-2013; E-2014; F-2015
Figure 4. The number of dogs (A) and cats
(B) involved in human aggression 2010-2015
There is no relevant difference between number of immunized people divided by gender (Figure 6-A). Regarding urban and rural area, out of 2538548 people living in cities, 8324 were immunized (0.32%) and 4928 (0.2%) persons from 2405748 total number of people from villages were immunized too (Figure 7). The temporal distribution of immunized people from urban and rural areas is shown on figure 6-B and indicate a big difference between these two categories.
Figure 5. A-number of immunized women reported to total number of women. B-number of men reported to
the total number of men
Figure 6. A-immunized women versus immunized men.
B-immunized people from urban areas versus immunized people from rural areas
Figure 7. A-number of immunized people from urban
areas reported to the total number of people from these regions. B-number of immunized people from rural
areas reported to the total number of population from these regions
CONCLUSIONS The main reservoir of rabies virus in Prahova County, as it is in Romania and even Europe, is fox. The number of positive cases dramatically decreases in 2015. The highest number of assaults on human population is made by dogs. The rabies post-exposure treatment for person exposed to potentially rabid animals is strongly recommended, according to the presence of rabies virus in the studied area. The program of oral vaccination of foxes has to continue, based on the decreasing number of positive rabies cases in 2015. There is an obvious need to educate the people from rural areas about the fatal risk of rabies by different ways such as: rural physicians, schools, local administration. ACKNOWLEDGEMENTS We thank to Dr. Claudia Vuta who kindly provide us the registers of Vaccination Center against Rabies of the County Infectious Diseases Emergency Hospital in Ploiesti, Prahova County.

237
RESULTS AND DISCUSSIONS Rabies cases in animals During the analyzed period (2010-2015), the natural reservoir of rabies virus in Prahova County was identified in wild animals 81% (n=51) in comparison with domestic animals, 19% (n=12). The spatial distribution of diag-nosed species and number of animals per year are shown in Figures 1 and 2. The number of positive cases is decreasing, in 2015 only 2 positive foxes were find, due to the oral rabies vaccination program of foxes implemented in Romania since 2011. The pets and the farm animals have been in-volved in most of the cases of aggression, 99% (n=13124), in comparison with wild animals, 1% (n=126). The distribution per year and per species is shown in Figure 3, as well as, Figure 4 for dog and cat distribution along 2010-2015. Registration of people exposed to suspected animals The total population of Prahova County, according to General population and housing census was 4944296 persons, 51.5% female (n=2547421) and 48.5% (n=2396875) male. The total population living in urban and rural areas was 2538548 (51.3%), respectively 2405748 (48.7%) (National Institute of Statistics). None of the patients got rabies pre-exposure prophylaxis. The prescribed schedule of immune prophylaxis was performed accor-ding to WHO recommendations and protocols (WHO Expert Consultation on Rabies second report, 2013).
Figure 1. Spatial distribution of rabies cases in animals during 2010-2015, PrahovaCounty. A-2010; B-2011;
C-2012; D-2013; E-2014; F-2015
Figure 2. Numbers and species of rabies positive animals per year
Out of 2547421 women, 6513 were immunized (0.25%), as well as out of 2396875 total number of men, 6738 (0.28%) got immune prophylaxis (Figure 5).
Figure 3. The numbers and species of animals involved in human aggression during 2010-2015.
A-2010; B-2011; C-2012; D-2013; E-2014; F-2015
Figure 4. The number of dogs (A) and cats
(B) involved in human aggression 2010-2015
There is no relevant difference between number of immunized people divided by gender (Figure 6-A). Regarding urban and rural area, out of 2538548 people living in cities, 8324 were immunized (0.32%) and 4928 (0.2%) persons from 2405748 total number of people from villages were immunized too (Figure 7). The temporal distribution of immunized people from urban and rural areas is shown on figure 6-B and indicate a big difference between these two categories.
Figure 5. A-number of immunized women reported to total number of women. B-number of men reported to
the total number of men
Figure 6. A-immunized women versus immunized men.
B-immunized people from urban areas versus immunized people from rural areas
Figure 7. A-number of immunized people from urban
areas reported to the total number of people from these regions. B-number of immunized people from rural
areas reported to the total number of population from these regions
CONCLUSIONS The main reservoir of rabies virus in Prahova County, as it is in Romania and even Europe, is fox. The number of positive cases dramatically decreases in 2015. The highest number of assaults on human population is made by dogs. The rabies post-exposure treatment for person exposed to potentially rabid animals is strongly recommended, according to the presence of rabies virus in the studied area. The program of oral vaccination of foxes has to continue, based on the decreasing number of positive rabies cases in 2015. There is an obvious need to educate the people from rural areas about the fatal risk of rabies by different ways such as: rural physicians, schools, local administration. ACKNOWLEDGEMENTS We thank to Dr. Claudia Vuta who kindly provide us the registers of Vaccination Center against Rabies of the County Infectious Diseases Emergency Hospital in Ploiesti, Prahova County.

238
REFERENCES Cliquet F., Picard-Meyer E., Mojzis M., Dirbakova Z.,
Muizniece Z., Jaceviciene I., Mutinelli F., Matulova M., Frolichova J., Rychlik I., Celer V., 2015. In-Depth Characterization of Live Vaccines Used in Europe for Oral Rabies Vaccination of Wild life. PLOS One, 10(10), p. 1-8.
Schnell M.J., McGettigan J.P., Wirblich C., Papaneri A., 2010. The cell biology of rabies virus: Using stealth to reach the brain. Nat Rev Microbiol; 8: p. 51-61.
Vuta V., Picard-Meyer E., Robardet E., Barboi G., Motiu R., Barbuceanu F., Vlagioiu C., Cliquet F., 2016. Vaccine-induced rabies case in a cow (Bos taurus):
molecular characterisation of vaccine strain in brain tissue. Vaccine, 34(2016), p. 5021-5025.
http://dx.doi.org/10.1016/j.vaccine.2016.08.013 Vuta V., Barboi Gh., Boncea D., Barbuceanu F.,
Vlagioiu C., 2016. Evaluation of the Oral Rabies Vaccination Program Of Red Foxes (Vulpes vulpes) population In Romania In 2014. Scientific Papers. Series D. Animal Science. Vol. LIX, 2016, ISSN 2285-5750.
***WHO, 2013. Expert Consultation on Rabies, second report.
***Virus Taxonomy 9th report, 2012. ***National Institute of Statistics, Romania, 2016.
General Population and Housing Census. Available: http://www.recensamant.ro/.