Agriculture in Uganda: Performance and policy implementation
27
Agriculture in Uganda: Performance and policy implementation Dr. Patience B. Rwamigisa Economic Growth Forum III 22 nd August 2019
-
Upload
khangminh22 -
Category
Documents
-
view
0 -
download
0
Transcript of Agriculture in Uganda: Performance and policy implementation
Agriculture in Uganda:
Performance and policy
implementation
Dr. Patience B. Rwamigisa
Economic Growth Forum III
22nd August 2019
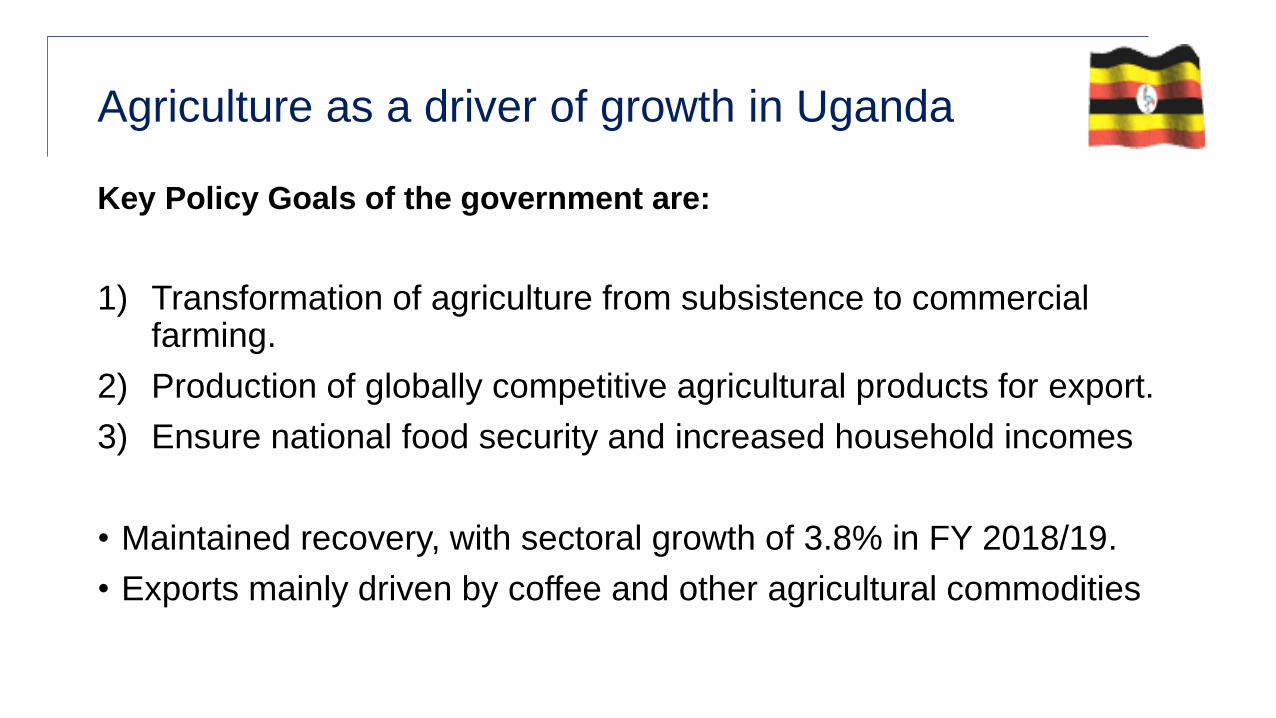
Agriculture as a driver of growth in Uganda
Key Policy Goals of the government are:
1) Transformation of agriculture from subsistence to commercial farming.
2) Production of globally competitive agricultural products for export.
3) Ensure national food security and increased household incomes
• Maintained recovery, with sectoral growth of 3.8% in FY 2018/19.
• Exports mainly driven by coffee and other agricultural commodities
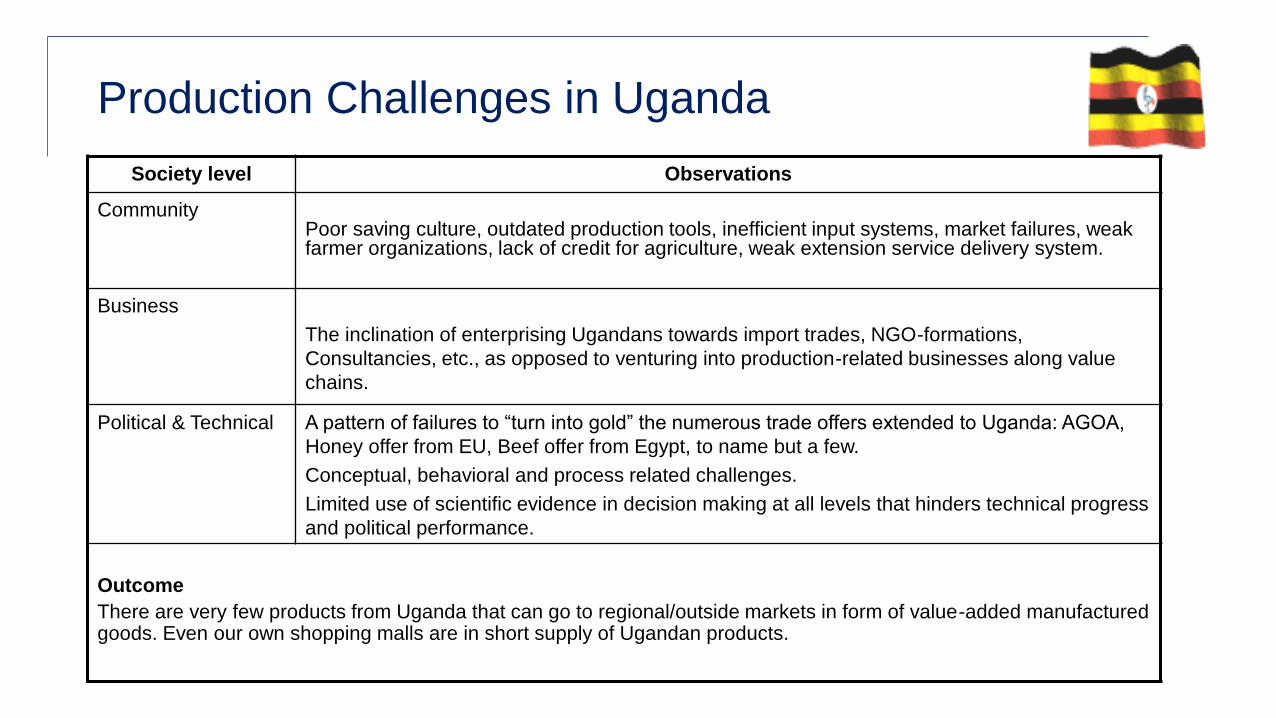
Production Challenges in Uganda
Society level Observations
CommunityPoor saving culture, outdated production tools, inefficient input systems, market failures, weak farmer organizations, lack of credit for agriculture, weak extension service delivery system.
Business
The inclination of enterprising Ugandans towards import trades, NGO-formations,
Consultancies, etc., as opposed to venturing into production-related businesses along value
chains.
Political & Technical A pattern of failures to “turn into gold” the numerous trade offers extended to Uganda: AGOA,
Honey offer from EU, Beef offer from Egypt, to name but a few.
Conceptual, behavioral and process related challenges.
Limited use of scientific evidence in decision making at all levels that hinders technical progress
and political performance.
Outcome
There are very few products from Uganda that can go to regional/outside markets in form of value-added manufactured goods. Even our own shopping malls are in short supply of Ugandan products.
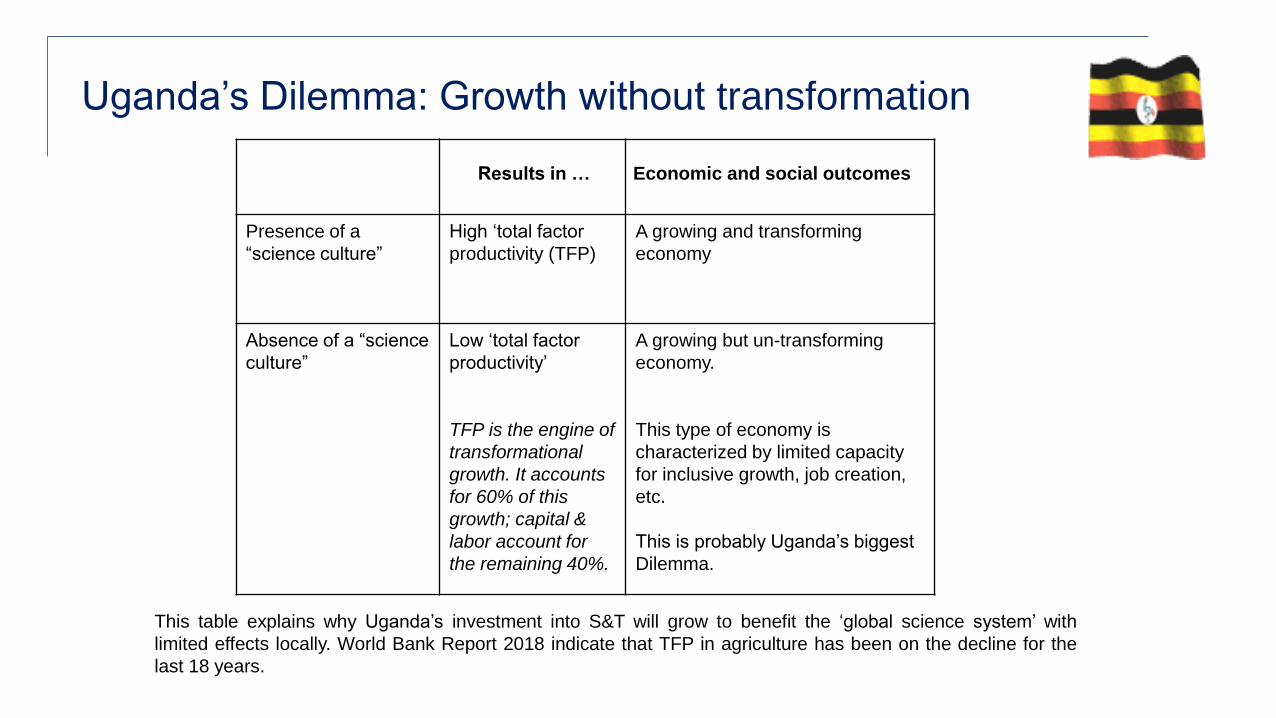
Uganda’s Dilemma: Growth without transformation
Results in … Economic and social outcomes
Presence of a
“science culture”
High ‘total factor
productivity (TFP)
A growing and transforming
economy
Absence of a “science
culture”
Low ‘total factor
productivity’
TFP is the engine of
transformational
growth. It accounts
for 60% of this
growth; capital &
labor account for
the remaining 40%.
A growing but un-transforming
economy.
This type of economy is
characterized by limited capacity
for inclusive growth, job creation,
etc.
This is probably Uganda’s biggest
Dilemma.
This table explains why Uganda’s investment into S&T will grow to benefit the ‘global science system’ with
limited effects locally. World Bank Report 2018 indicate that TFP in agriculture has been on the decline for the
last 18 years.
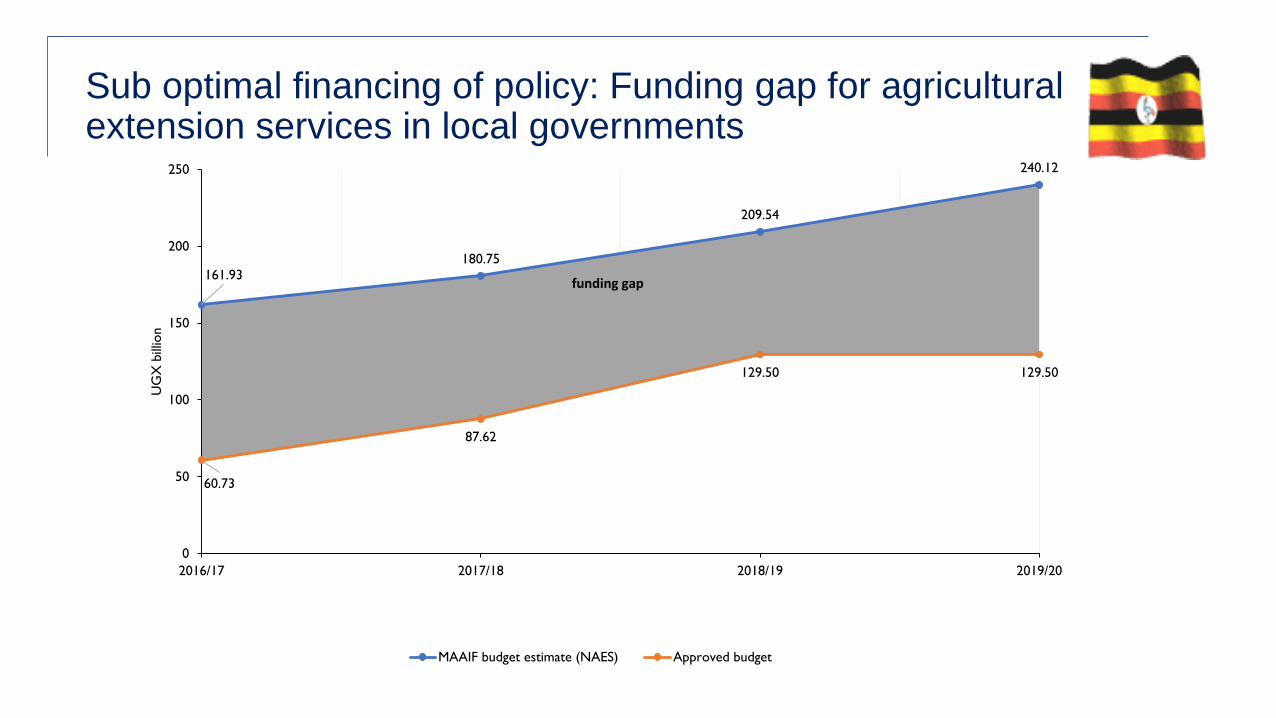
Sub optimal financing of policy: Funding gap for agricultural extension services in local governments
161.93180.75
209.54
240.12
60.73
87.62
129.50 129.50
0
50
100
150
200
250
2016/17 2017/18 2018/19 2019/20
UG
X b
illio
n
MAAIF budget estimate (NAES) Approved budget
funding gap
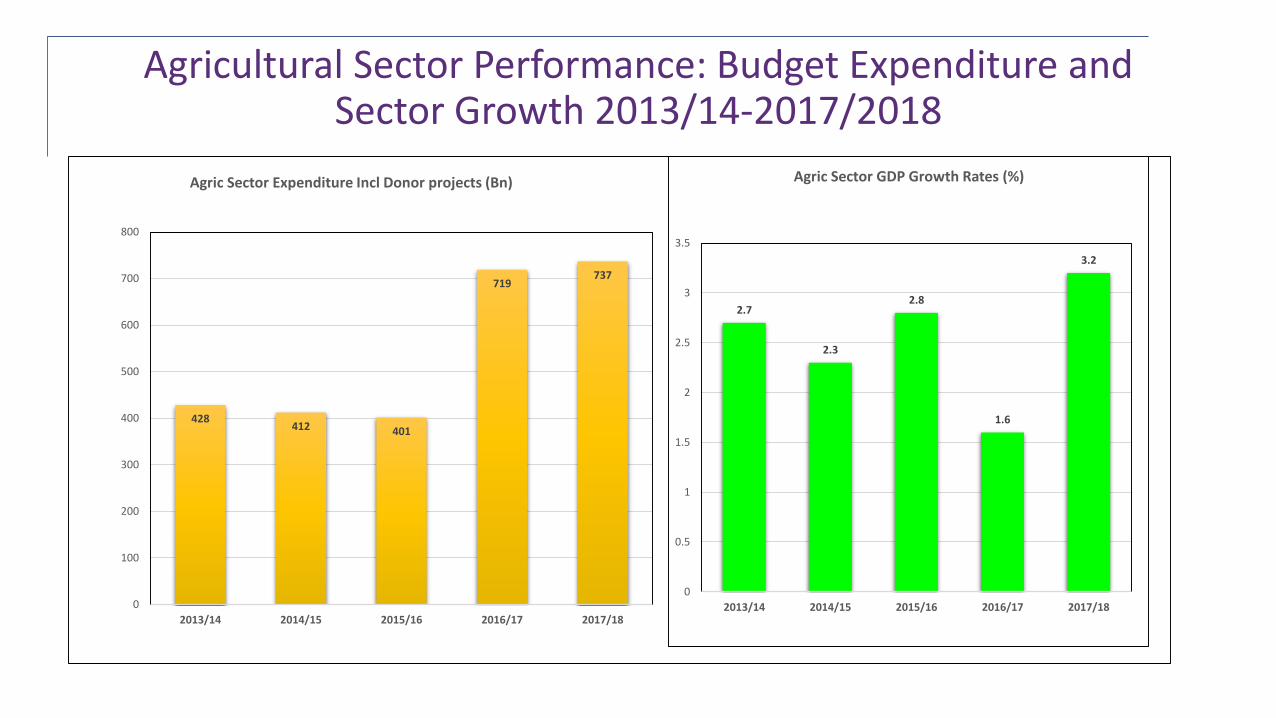
Agricultural Sector Performance: Budget Expenditure and Sector Growth 2013/14-2017/2018
428412 401
719737
0
100
200
300
400
500
600
700
800
2013/14 2014/15 2015/16 2016/17 2017/18
Agric Sector Expenditure Incl Donor projects (Bn)
2.7
2.3
2.8
1.6
3.2
0
0.5
1
1.5
2
2.5
3
3.5
2013/14 2014/15 2015/16 2016/17 2017/18
Agric Sector GDP Growth Rates (%)
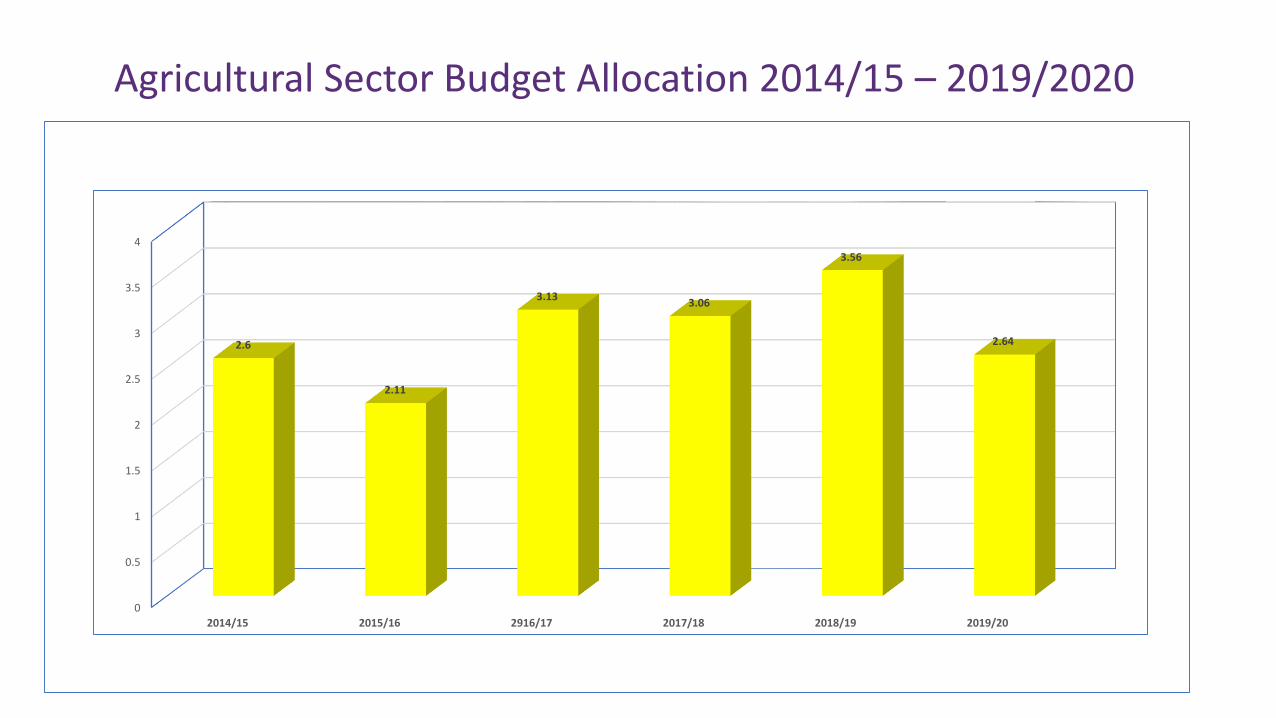
Agricultural Sector Budget Allocation 2014/15 – 2019/2020
0
0.5
1
1.5
2
2.5
3
3.5
4
2014/15 2015/16 2916/17 2017/18 2018/19 2019/20
2.6
2.11
3.133.06
3.56
2.64
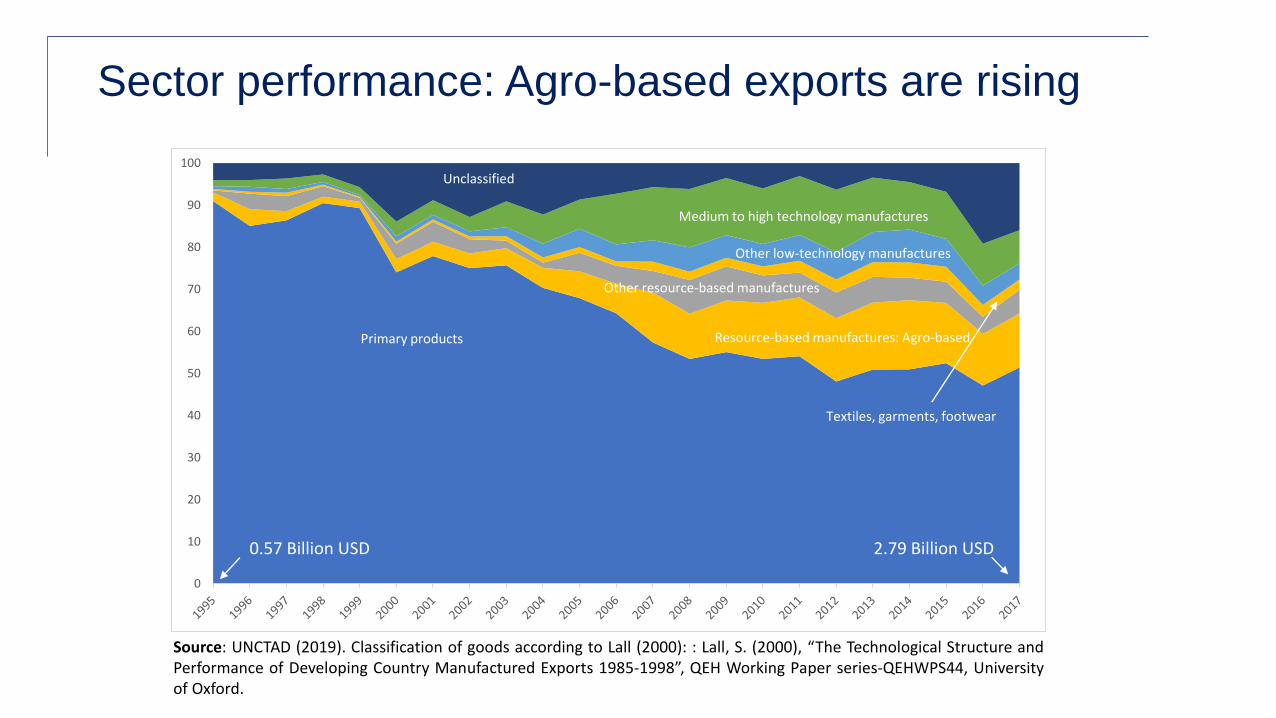
Sector performance: Agro-based exports are rising
0
10
20
30
40
50
60
70
80
90
100
Primary products
Medium to high technology manufactures
Resource-based manufactures: Agro-based
Other resource-based manufactures
Other low-technology manufactures
Unclassified
Textiles, garments, footwear
Source: UNCTAD (2019). Classification of goods according to Lall (2000): : Lall, S. (2000), “The Technological Structure andPerformance of Developing Country Manufactured Exports 1985-1998”, QEH Working Paper series-QEHWPS44, Universityof Oxford.
0.57 Billion USD 2.79 Billion USD
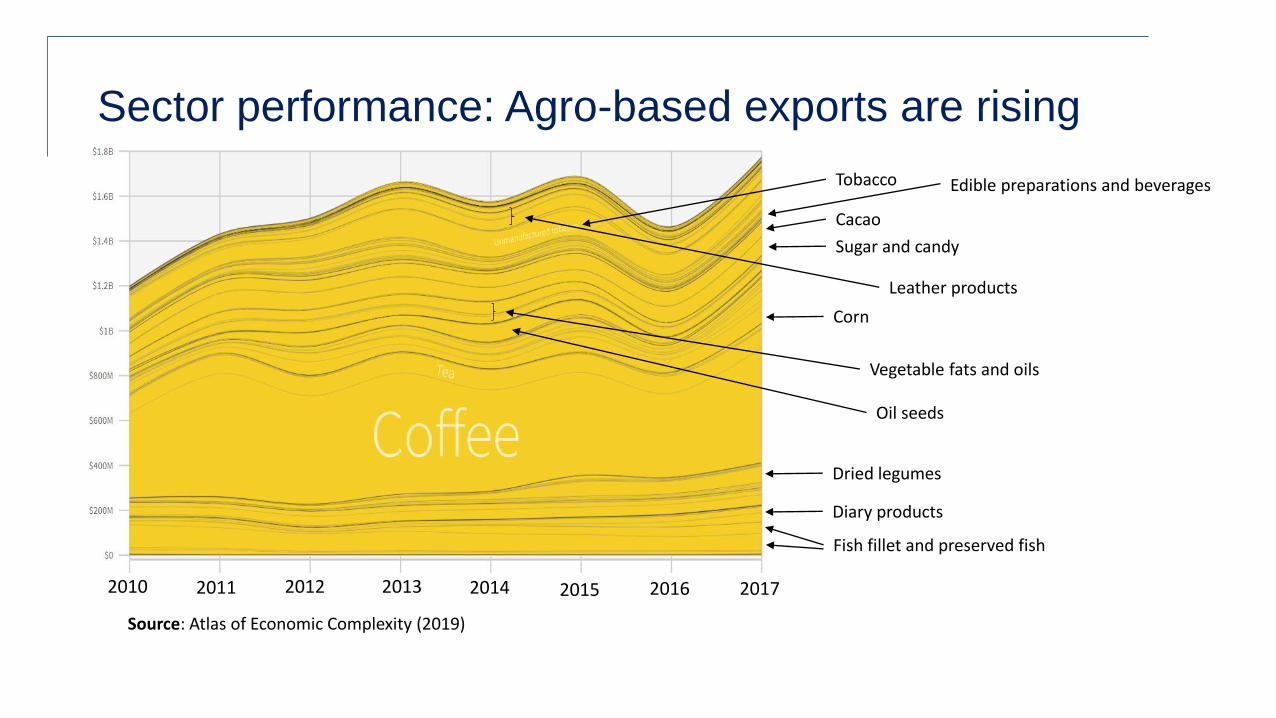
Sector performance: Agro-based exports are rising
0.57 Billion USD 2.79 Billion USD
Dried legumes
Diary products
Fish fillet and preserved fish
Corn
Sugar and candy
Cacao
Tobacco
Vegetable fats and oils
Oil seeds
Leather products
Edible preparations and beverages
2010 2011 2012 2013 2014 2015 2016 2017
Source: Atlas of Economic Complexity (2019)
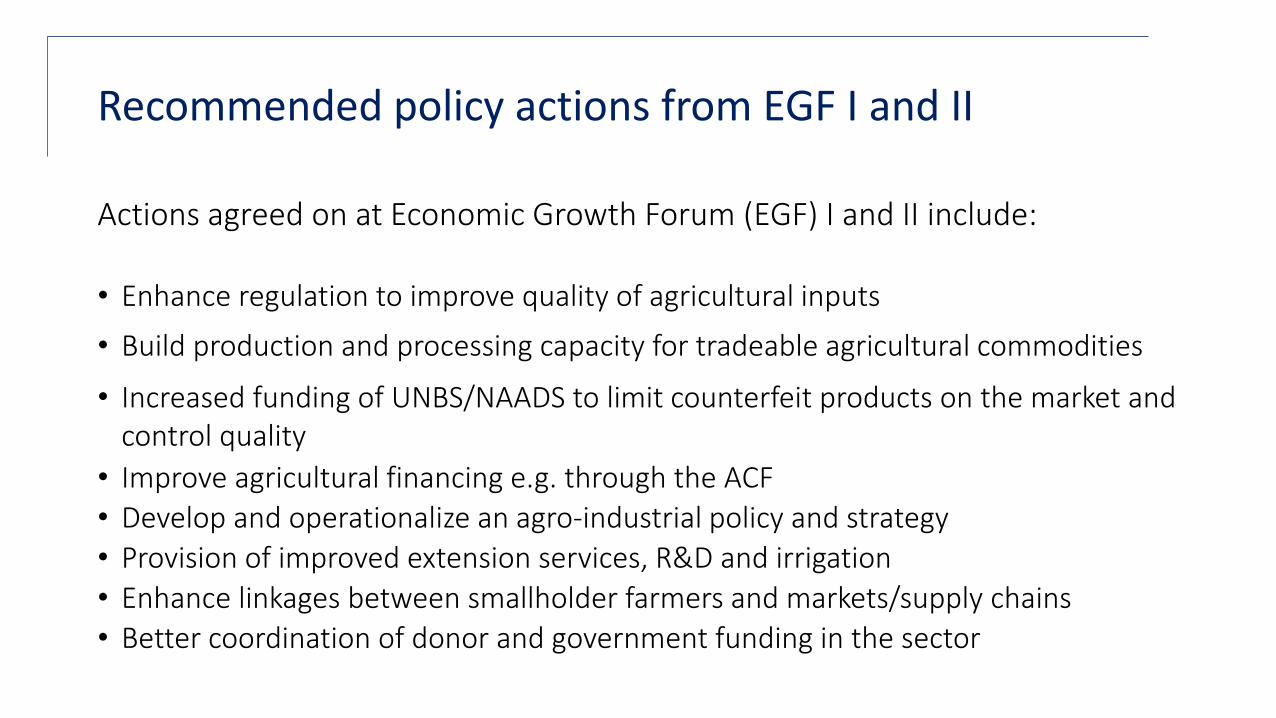
Recommended policy actions from EGF I and II
Actions agreed on at Economic Growth Forum (EGF) I and II include:
• Enhance regulation to improve quality of agricultural inputs
• Build production and processing capacity for tradeable agricultural commodities
• Increased funding of UNBS/NAADS to limit counterfeit products on the market and control quality
• Improve agricultural financing e.g. through the ACF
• Develop and operationalize an agro-industrial policy and strategy
• Provision of improved extension services, R&D and irrigation
• Enhance linkages between smallholder farmers and markets/supply chains
• Better coordination of donor and government funding in the sector
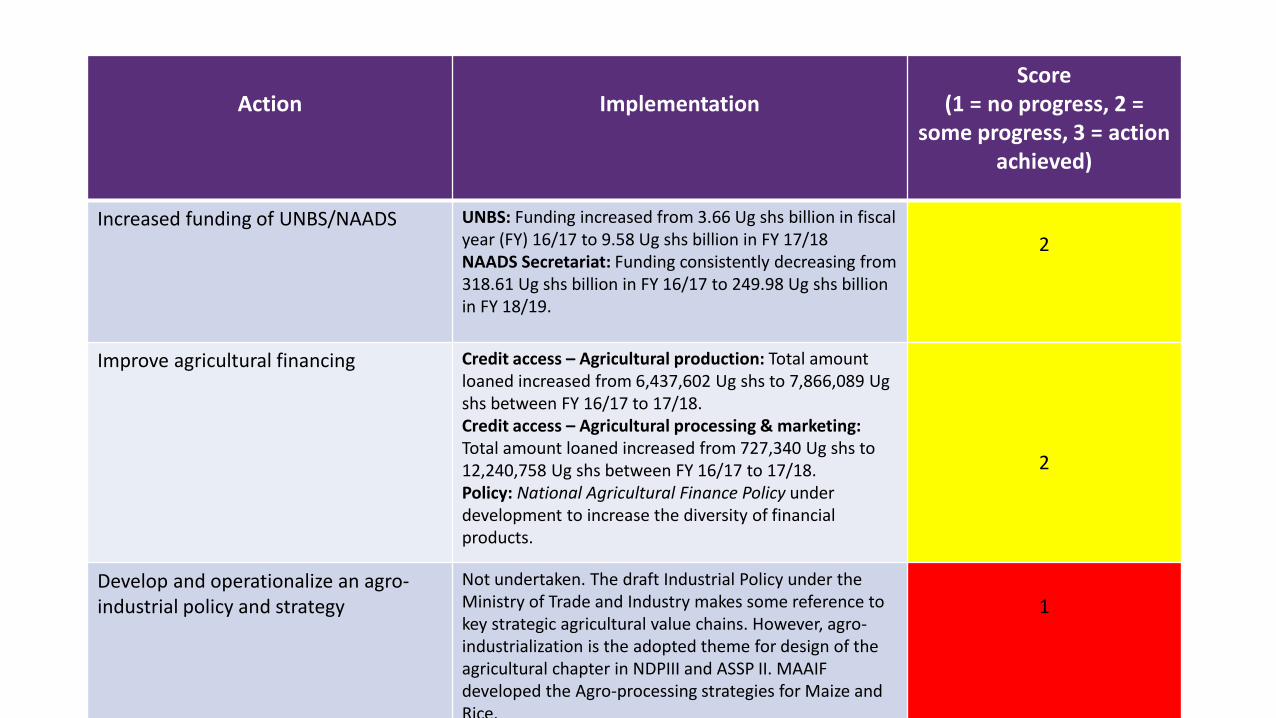
Action Implementation Score
(1 = no progress, 2 = some progress, 3 = action
achieved)
Increased funding of UNBS/NAADS UNBS: Funding increased from 3.66 Ug shs billion in fiscal year (FY) 16/17 to 9.58 Ug shs billion in FY 17/18NAADS Secretariat: Funding consistently decreasing from 318.61 Ug shs billion in FY 16/17 to 249.98 Ug shs billion in FY 18/19.
2
Improve agricultural financing Credit access – Agricultural production: Total amount loaned increased from 6,437,602 Ug shs to 7,866,089 Ug shs between FY 16/17 to 17/18.Credit access – Agricultural processing & marketing: Total amount loaned increased from 727,340 Ug shs to 12,240,758 Ug shs between FY 16/17 to 17/18.Policy: National Agricultural Finance Policy under development to increase the diversity of financial products.
2
Develop and operationalize an agro-industrial policy and strategy
Not undertaken. The draft Industrial Policy under the Ministry of Trade and Industry makes some reference to key strategic agricultural value chains. However, agro-industrialization is the adopted theme for design of the agricultural chapter in NDPIII and ASSP II. MAAIF developed the Agro-processing strategies for Maize and Rice.
1
Action Implementation Score
(1 = no progress, 2 = some progress, 3 = action
achieved)
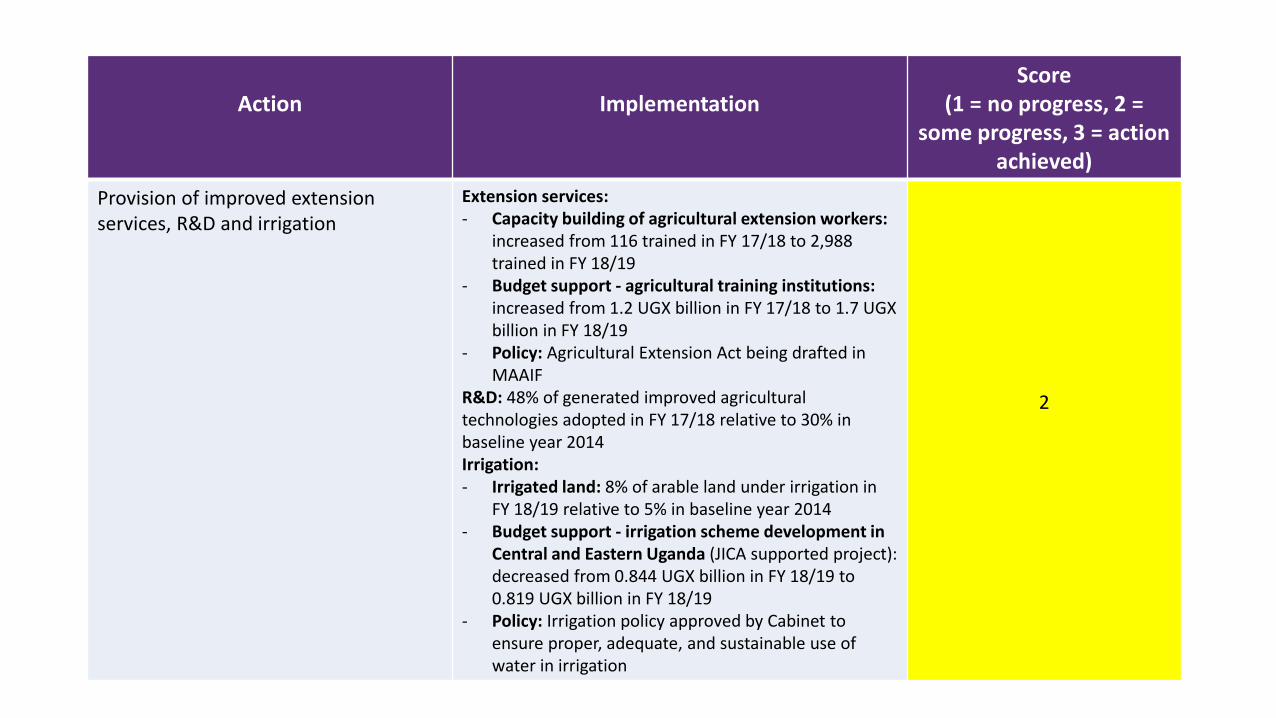
Provision of improved extension services, R&D and irrigation
Extension services: - Capacity building of agricultural extension workers:
increased from 116 trained in FY 17/18 to 2,988 trained in FY 18/19
- Budget support - agricultural training institutions: increased from 1.2 UGX billion in FY 17/18 to 1.7 UGXbillion in FY 18/19
- Policy: Agricultural Extension Act being drafted in MAAIF
R&D: 48% of generated improved agricultural technologies adopted in FY 17/18 relative to 30% in baseline year 2014 Irrigation: - Irrigated land: 8% of arable land under irrigation in
FY 18/19 relative to 5% in baseline year 2014- Budget support - irrigation scheme development in
Central and Eastern Uganda (JICA supported project): decreased from 0.844 UGX billion in FY 18/19 to 0.819 UGX billion in FY 18/19
- Policy: Irrigation policy approved by Cabinet to ensure proper, adequate, and sustainable use of water in irrigation
2
Sources
• Annual budget monitoring report Financial Year 2016/17
• Annual budget monitoring report Financial Year 2017/18
• Semi-annual budget monitoring report 2018/19
• Bank of Uganda Credit to the Private Sector
• Ministry of Finance, Planning and Economic Development
• National Budget Framework Paper FY 2019/20
• Ministerial Policy Statement: Ministry of Agriculture, Animals, & Fisheries (18/19)
8/27/2019 1
AGRO-INDUSTRIALIZATION IN UGANDA
CURRENT STATUS, FUTURE PROSPECTS AND
POSSIBLE SOLUTIONS TO PRESSING CHALLENGES
MARTIN FOWLER
SENIOR AGRICULTURAL ADVISER
USAID
KAMPALA

8/27/2019 2
PRESENTATION OUTLINE
– Agro-industrialization focus: its genesis
– The place of agriculture & agro-industries in the economy, manufacturing, dietary
transition, exports
– Agro-industrialization strategy: a review of some of its features
– Policy recommendations
8/27/2019 3
AGRO-INDUSTRIALIZATION FOCUS: ITS GENESIS
• EPRC 2018 study
• NDP III
• 2019 Budget speech
• ASSP 2020/21-2024/25
8/27/2019 4
THE PLACE OF AGRICULTURE AND AGRO-INDUSTRIES
IN UGANDA’S ECONOMY
• 24% GDP, down from 50% in 1995 (cf. 8% Manufacturing)
• > 50% export earnings
• Employs 70% of working population (78% of total population are “rural”)
• Agro-processing accounts for approx. 60% manufacturing output
– Food processing: 40% (half of this provided by sugar, coffee and tea processing)
– Drinks: 17%
– Textiles…
• 2013-2017: 6% annual rate of growth in manufacturing (esp. ag-related: cotton ginning, textiles, drinks, meat, fish & dairy)

8/27/2019 5
THE PLACE OF AGRICULTURE AND AGRO-INDUSTRIES
IN UGANDA’S ECONOMY (cont.)
0 5 10 15 20 25 30 35 40 45
Food Processing
Drinks and Tobacco
Chemical, paint
Metal
Bricks & cement
Miscellaneous
Textiles, clothing and footwear
Saw milling, paper and printing
Source: UBoS (various)
Share of manufacturing output by sub-sector (in %)
8/27/2019 6
FOOD AND THE DIETARY TRANSITION
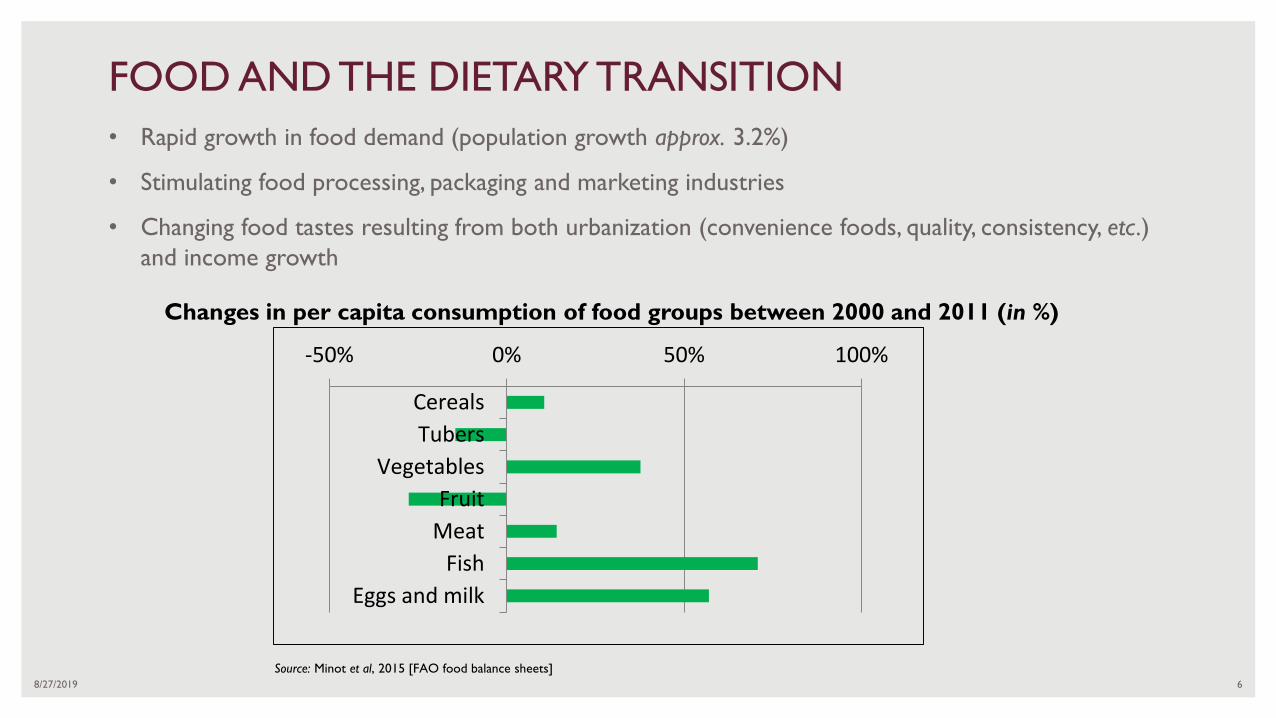
• Rapid growth in food demand (population growth approx. 3.2%)
• Stimulating food processing, packaging and marketing industries
• Changing food tastes resulting from both urbanization (convenience foods, quality, consistency, etc.)
and income growth
-50% 0% 50% 100%
Cereals
Tubers
Vegetables
Fruit
Meat
Fish
Eggs and milk
Changes in per capita consumption of food groups between 2000 and 2011 (in %)
Source: Minot et al, 2015 [FAO food balance sheets]
8/27/2019 7
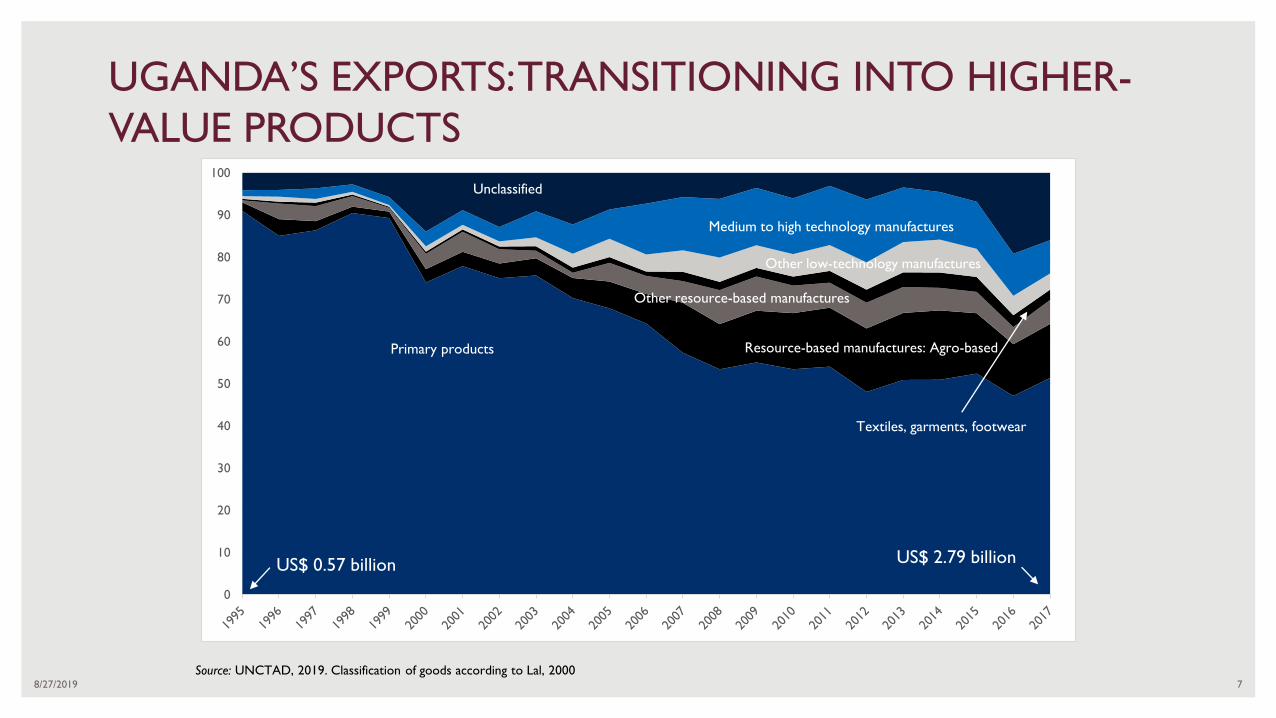
UGANDA’S EXPORTS: TRANSITIONING INTO HIGHER-
VALUE PRODUCTS
0
10
20
30
40
50
60
70
80
90
100
Primary products
Medium to high technology manufactures
Resource-based manufactures: Agro-based
Other resource-based manufactures
Other low-technology manufactures
Unclassified
Textiles, garments, footwear
Source: UNCTAD, 2019. Classification of goods according to Lal, 2000
US$ 0.57 billion US$ 2.79 billion
8/27/2019 8
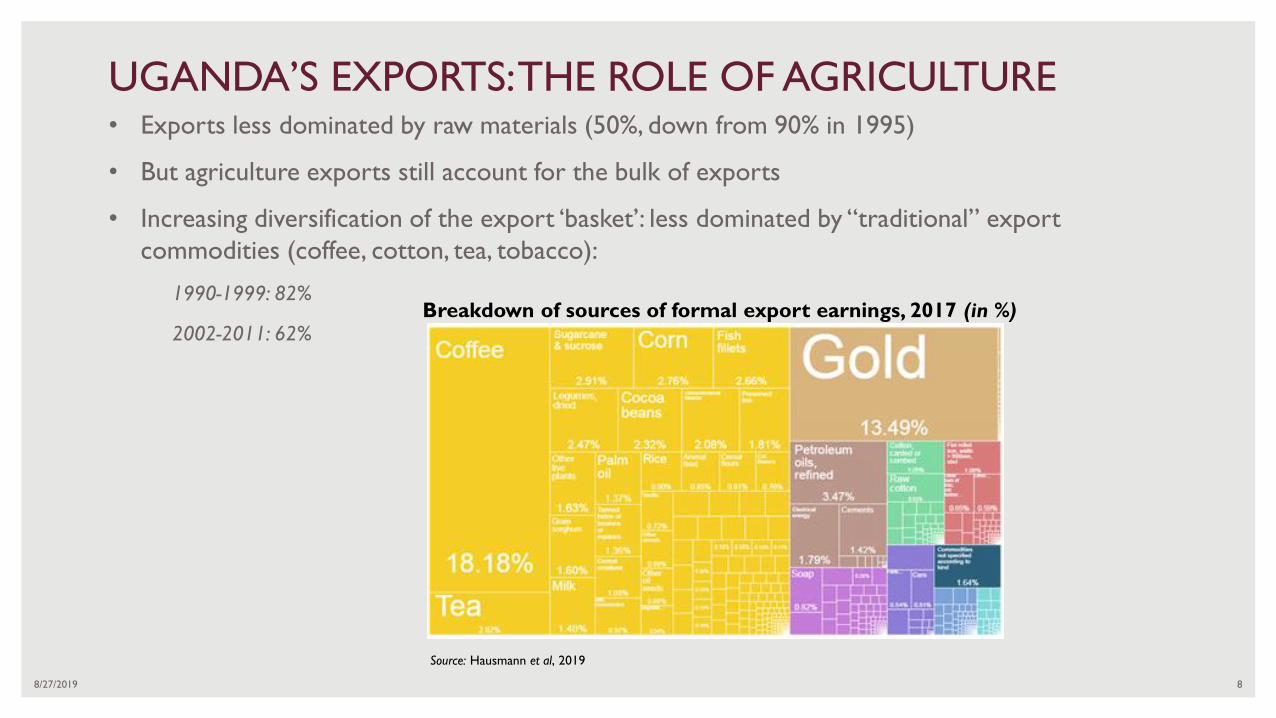
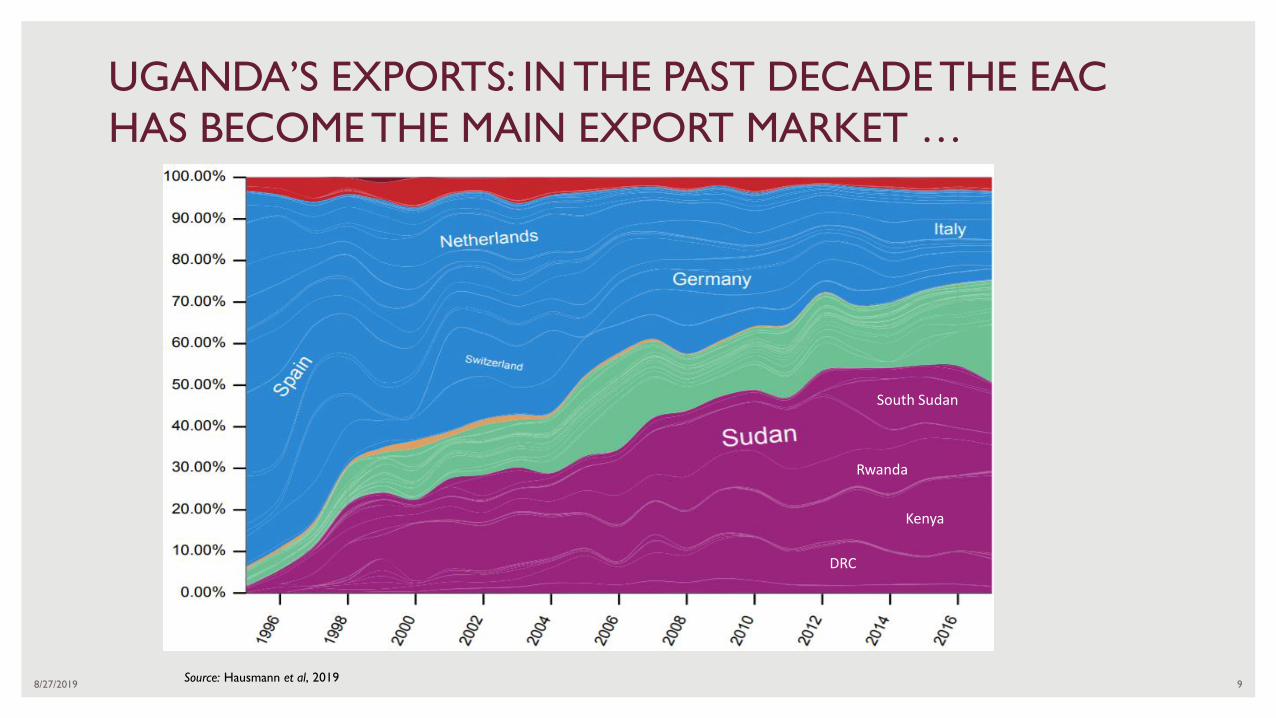
UGANDA’S EXPORTS: THE ROLE OF AGRICULTURE• Exports less dominated by raw materials (50%, down from 90% in 1995)
• But agriculture exports still account for the bulk of exports
• Increasing diversification of the export ‘basket’: less dominated by “traditional” export
commodities (coffee, cotton, tea, tobacco):
1990-1999: 82%
2002-2011: 62%Breakdown of sources of formal export earnings, 2017 (in %)
Source: Hausmann et al, 2019
8/27/2019 9
UGANDA’S EXPORTS: IN THE PAST DECADE THE EAC
HAS BECOME THE MAIN EXPORT MARKET …
Source: Hausmann et al, 2019
South Sudan
Rwanda
Kenya
DRC
8/27/2019 10
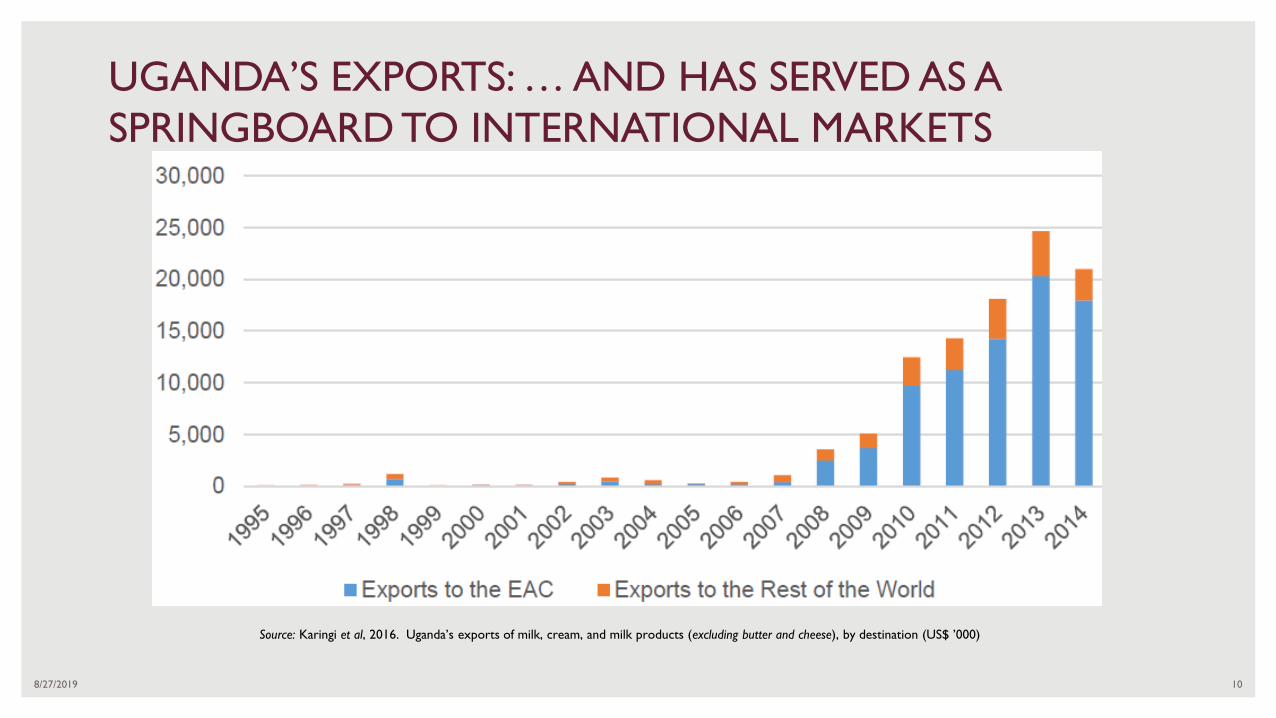
UGANDA’S EXPORTS: … AND HAS SERVED AS A
SPRINGBOARD TO INTERNATIONAL MARKETS
Source: Karingi et al, 2016. Uganda’s exports of milk, cream, and milk products (excluding butter and cheese), by destination (US$ ’000)
8/27/2019 11
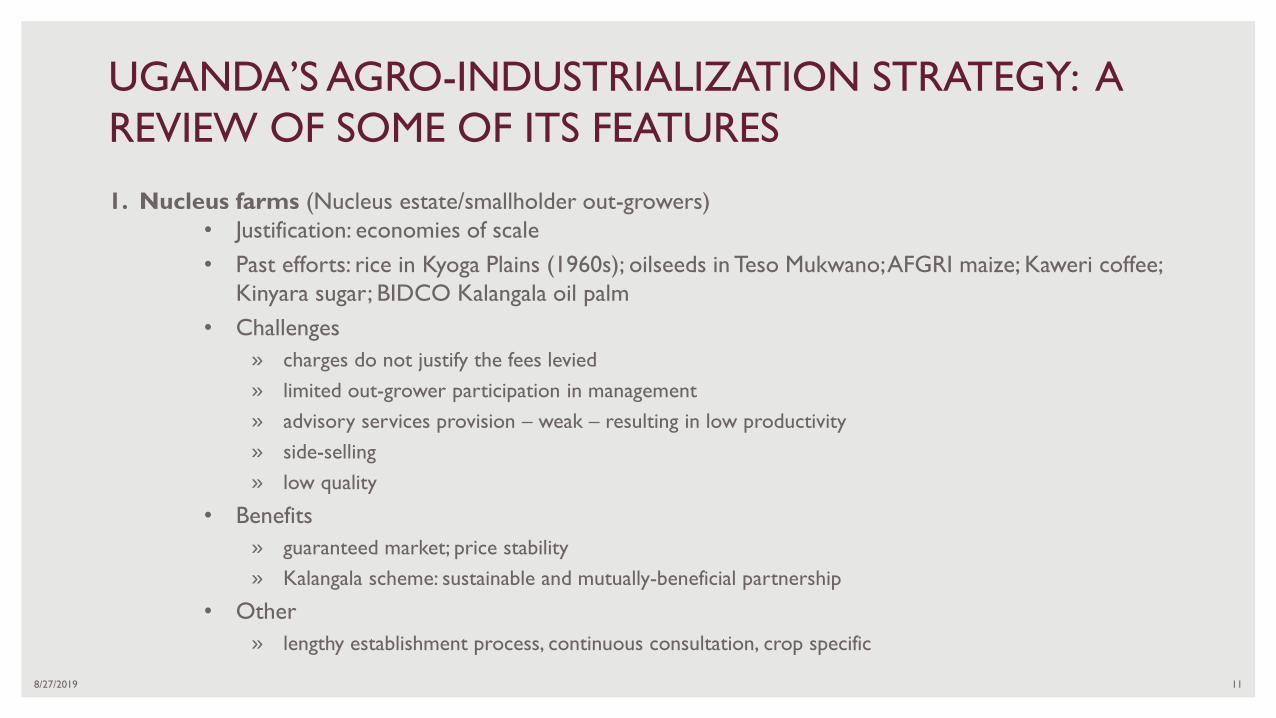
UGANDA’S AGRO-INDUSTRIALIZATION STRATEGY: A
REVIEW OF SOME OF ITS FEATURES
1. Nucleus farms (Nucleus estate/smallholder out-growers)
• Justification: economies of scale
• Past efforts: rice in Kyoga Plains (1960s); oilseeds in Teso Mukwano; AFGRI maize; Kaweri coffee;
Kinyara sugar; BIDCO Kalangala oil palm
• Challenges
» charges do not justify the fees levied
» limited out-grower participation in management
» advisory services provision – weak – resulting in low productivity
» side-selling
» low quality
• Benefits
» guaranteed market; price stability
» Kalangala scheme: sustainable and mutually-beneficial partnership
• Other
» lengthy establishment process, continuous consultation, crop specific
8/27/2019 12
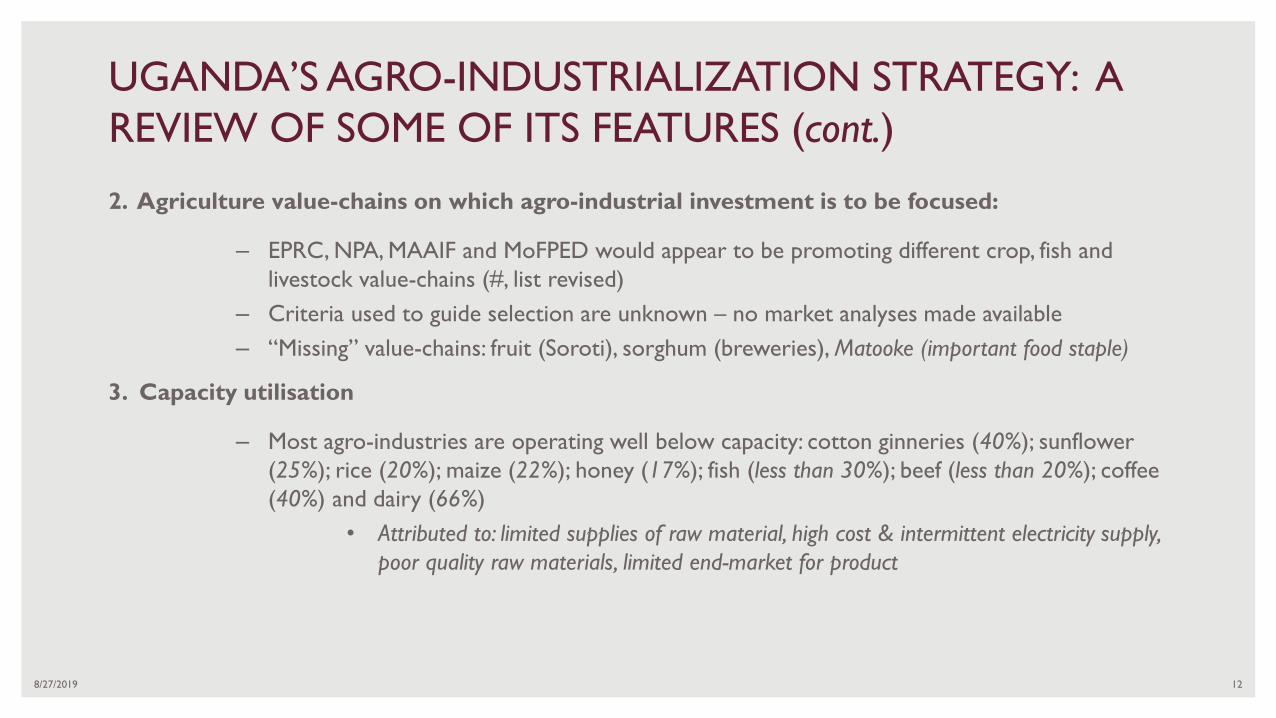
UGANDA’S AGRO-INDUSTRIALIZATION STRATEGY: A
REVIEW OF SOME OF ITS FEATURES (cont.)
2. Agriculture value-chains on which agro-industrial investment is to be focused:
– EPRC, NPA, MAAIF and MoFPED would appear to be promoting different crop, fish and
livestock value-chains (#, list revised)
– Criteria used to guide selection are unknown – no market analyses made available
– “Missing” value-chains: fruit (Soroti), sorghum (breweries), Matooke (important food staple)
3. Capacity utilisation
– Most agro-industries are operating well below capacity: cotton ginneries (40%); sunflower
(25%); rice (20%); maize (22%); honey (17%); fish (less than 30%); beef (less than 20%); coffee
(40%) and dairy (66%)
• Attributed to: limited supplies of raw material, high cost & intermittent electricity supply,
poor quality raw materials, limited end-market for product
8/27/2019 13
UGANDA’S AGRO-INDUSTRIALIZATION STRATEGY: A
REVIEW OF SOME OF ITS FEATURES (cont.)
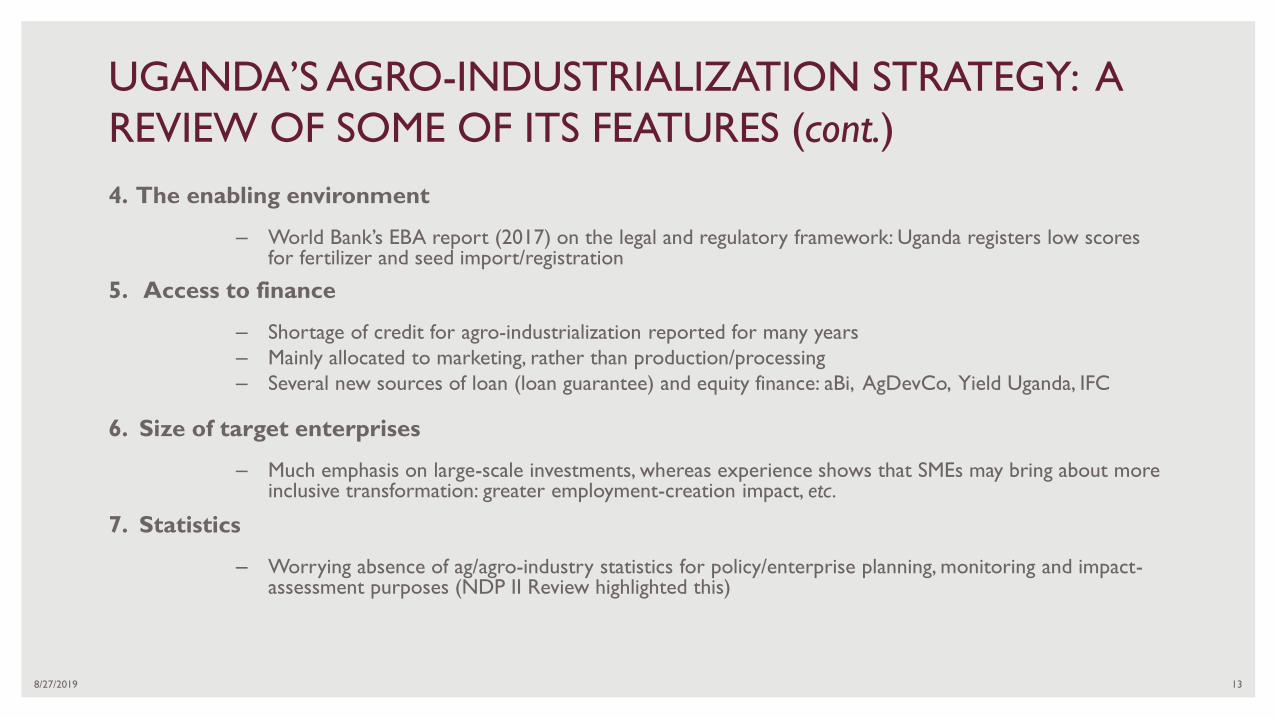
4. The enabling environment
– World Bank’s EBA report (2017) on the legal and regulatory framework: Uganda registers low scores for fertilizer and seed import/registration
5. Access to finance
– Shortage of credit for agro-industrialization reported for many years
– Mainly allocated to marketing, rather than production/processing
– Several new sources of loan (loan guarantee) and equity finance: aBi, AgDevCo, Yield Uganda, IFC
6. Size of target enterprises
– Much emphasis on large-scale investments, whereas experience shows that SMEs may bring about more inclusive transformation: greater employment-creation impact, etc.
7. Statistics
– Worrying absence of ag/agro-industry statistics for policy/enterprise planning, monitoring and impact-assessment purposes (NDP II Review highlighted this)
8/27/2019 14
POLICY RECOMMENDATIONS
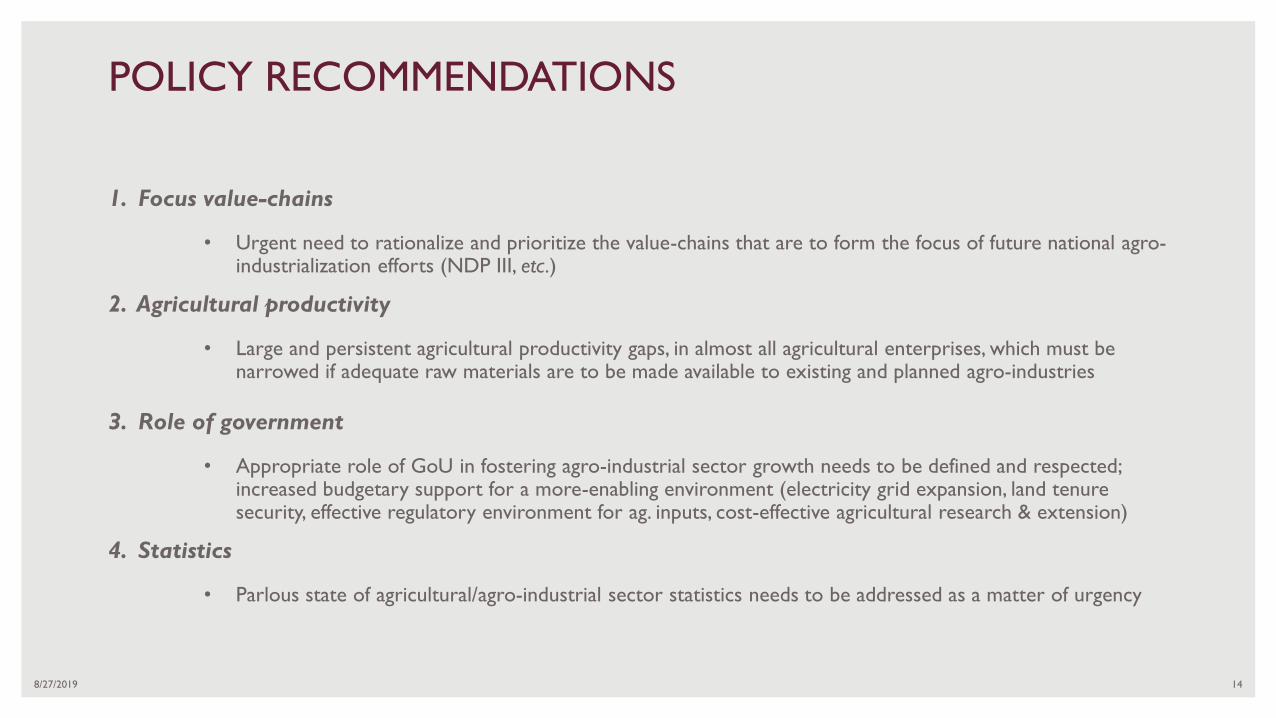
1. Focus value-chains
• Urgent need to rationalize and prioritize the value-chains that are to form the focus of future national agro-industrialization efforts (NDP III, etc.)
2. Agricultural productivity
• Large and persistent agricultural productivity gaps, in almost all agricultural enterprises, which must be narrowed if adequate raw materials are to be made available to existing and planned agro-industries
3. Role of government
• Appropriate role of GoU in fostering agro-industrial sector growth needs to be defined and respected; increased budgetary support for a more-enabling environment (electricity grid expansion, land tenure security, effective regulatory environment for ag. inputs, cost-effective agricultural research & extension)
4. Statistics
• Parlous state of agricultural/agro-industrial sector statistics needs to be addressed as a matter of urgency