Fingerprint Classification by Directional Image Partitioning
Upload
independentCategory
view
0download
0
Ecological Applications, 21(5), 2011, pp. 1772–1781� 2011 by the Ecological Society of America
Agricultural intensification and biodiversity partitioning in Europeanlandscapes comparing plants, carabids, and birds
ANDREAS FLOHRE,1,10 CHRISTINA FISCHER,1 TSIPE AAVIK,2 JAN BENGTSSON,3 FRANK BERENDSE,4 RICCARDO BOMMARCO,3
PIOTR CERYNGIER,5 LARS W. CLEMENT,6 CHRISTOPHER DENNIS,7 SONKE EGGERS,3 MARK EMMERSON,7 FLAVIA GEIGER,4
IRENE GUERRERO,8 VIOLETTA HAWRO,5 PABLO INCHAUSTI,9 JAAN LIIRA,2 MANUEL B. MORALES,8 JUAN J. ONATE,8
TOMAS PART,3 WOLFGANG W. WEISSER,6 CAMILLA WINQVIST,3 CARSTEN THIES,1 AND TEJA TSCHARNTKE1
1Agroecology, Department of Crop Science, Georg-August-University, Waldweg 26, 37073 Gottingen, Germany2Institute of Ecology and Earth Sciences, University of Tartu, Lai 40, Tartu EE51005, Estonia
3Department of Ecology, Swedish University of Agricultural Sciences, P.O. Box 7044, 75007 Uppsala, Sweden4Nature Conservation and Plant Ecology Group, P.O. Box 47, Wageningen University, 6700 AA Wageningen, The Netherlands
5Centre for Ecological Research, Polish Academy of Sciences, CBE PAN, Dziekanow Lesny, Konopnickiej 1,05-092 Lomianki, Poland
6Institute of Ecology, Friedrich-Schiller-University Jena, Dornburger Straße 159, 07743 Jena, Germany7Department of Zoology, Ecology and Plant Sciences, University College Cork, Distillery Fields, Cork, Ireland8Department of Ecology, c/Darwin, 2, Universidad Autonoma de Madrid, Ciudad Universitaria de Cantoblanco,
28049 Madrid, Spain9Centre for Biological Studies of Chize CNRS, 79360 Villiers-en-Bois, France
Abstract. Effects of agricultural intensification (AI) on biodiversity are often assessed onthe plot scale, although processes determining diversity also operate on larger spatial scales.Here, we analyzed the diversity of vascular plants, carabid beetles, and birds in agriculturallandscapes in cereal crop fields at the field (n¼1350), farm (n¼270), and European-region (n¼9) scale. We partitioned diversity into its additive components a, b, and c, and assessed therelative contribution of b diversity to total species richness at each spatial scale. AI wasdetermined using pesticide and fertilizer inputs, as well as tillage operations and categorizedinto low, medium, and high levels. As AI was not significantly related to landscape complexity,we could disentangle potential AI effects on local vs. landscape community homogenization.AI negatively affected the species richness of plants and birds, but not carabid beetles, at allspatial scales. Hence, local AI was closely correlated to b diversity on larger scales up to thefarm and region level, and thereby was an indicator of farm- and region-wide biodiversitylosses. At the scale of farms (12.83–20.52%) and regions (68.34–80.18%), b diversity accountedfor the major part of the total species richness for all three taxa, indicating great dissimilarityin environmental conditions on larger spatial scales. For plants, relative importance of adiversity decreased with AI, while relative importance of b diversity on the farm scaleincreased with AI for carabids and birds. Hence, and in contrast to our expectations, AI doesnot necessarily homogenize local communities, presumably due to the heterogeneity offarming practices. In conclusion, a more detailed understanding of AI effects on diversitypatterns of various taxa and at multiple spatial scales would contribute to more efficient agri-environmental schemes in agroecosystems.
Key words: agricultural intensification; alpha diversity; beta diversity; biodiversity patterns; cereal cropfields; community homogenization; landscape ecology; Western Europe.
INTRODUCTION
Global croplands, plantations, and pastures have
expanded significantly in the last decades (Foley et al.
2005). This has led to dramatic changes in the spatial
structure of agricultural landscapes in Western Europe.
Formerly, structurally diverse landscapes have often
been converted to simple landscapes mainly consisting
of intensively managed agricultural units (Robinson and
Sutherland 2002, Benton et al. 2003). Such agricultural
intensification (AI) is featured by higher pesticide and
fertilizer inputs, tillage operations, and livestock densi-
ties, as well as an increasing simplification of agricultural
landscapes, and was accompanied by a profound loss of
biodiversity (Matson et al. 1997, Stoate et al. 2001,
Bengtsson et al. 2005, Foley et al. 2005, Tscharntke et al.
2005, Billeter et al. 2008). While effects of agricultural
intensification have been a major topic in ecological
research in the last decade, they have mainly been
studied at the plot spatial scale (spatial scales are
henceforth addressed simply as scale), although process-
es determining diversity operate at different spatial
scales (Crawley and Harral 2001, Collins et al. 2002,
Weiher and Howe 2003, Aavik and Liira 2010), and
Manuscript received 29 March 2010; revised 15 October2010; accepted 22 October 2010. Corresponding Editor: V. C.Radeloff.
10 E-mail: [email protected]
1772

assessing diversity merely at one scale can be misleading
(Tylianakis et al. 2006). For example, AI could lead to a
homogenization of communities on, e.g., the field scale,
which could have profound effects on the species
turnover (i.e., the dissimilarity in species composition
between plots) between fields and hence to species
richness on larger scales (Cadotte 2006). However, one
has to keep in mind that AI also acts on different spatial
scales, e.g., intensification on a landscape level vs.
intensification on the field (Tscharntke et al. 2005).
Therefore, when addressing agricultural intensification
at the field scale, one has to also acknowledge the
landscape context.
A useful tool to evaluate diversity at different spatial
scales is the additive partitioning approach (Lande 1996,
Veech et al. 2002, Crist et al. 2003, Legendre et al. 2005,
Clough et al. 2007): The total diversity of a sampling
unit (c) can be separated into different components: adiversity, which is the average diversity on a plot scale,
and b diversity, which is the between-plot diversity.
Thus, b diversity is a measure of variation in species
composition between plots. Beta diversity between plots
and regions has been shown to account for up to 80% of
the total species richness of arthropods (Tylianakis et al.
2006, Clough et al. 2007) or plants (Wagner et al. 2000,
Gabriel et al. 2006). A more thorough understanding of
the spatial organization of farmland diversity could give
important insights into associated ecosystem processes
and human-related drivers of species loss at different
scales.
From an applied point of view, a more thorough
understandingmay be useful for selecting the appropriate
scale for conservation efforts (e.g., agri-environmental
schemes; Gering et al. 2003, Chandy et al. 2006) or for the
identification of flexible conservation strategies (Gabriel
et al. 2006, Diekotter et al. 2008) for different taxa.
Here, we applied additive partitioning of diversity to a
data set from a biodiversity survey conducted in cereal
crop fields across nine regions in Europe. We analyzed
the effects of AI and landscape context on species
richness of plants, carabid beetles, and breeding birds in
agricultural landscapes and hypothesized: (1) AI has a
negative effect on species richness of all taxa, with bdiversity making the major contribution to total
diversity; (2) the three species groups respond differen-
tially to AI on different spatial scales; (3) AI homoge-
nizes communities across fields, and this homog-
enization negatively affects species turnover between
fields and regions; and (4) local AI is not only related to
local biodiversity losses, but also to losses at larger
spatial scales.
METHODS
Study area and design
The study was conducted in nine European regions
(Estonia, France, East and West Germany separately,
Ireland, Netherlands, Poland, Spain, and Sweden; Fig.
1) covering a north–south gradient from Sweden and
Estonia to Spain, and a west–east gradient from Ireland
to Poland in the context of the collaborative
AGRIPOPES project (further details available online).11
In each region we selected 30 farms differing in the level
of agricultural intensification (AI). Farms were situated
in a 50 3 50 km region to standardize spatial scales and
account for larger edaphic or topographic gradients.
FIG. 1. Locations of the study regions, indicated by black dots in Sweden, Estonia, Ireland, The Netherlands, Germany(Gottingen), Germany (Jena), Poland, France, and Spain (from Geiger et al. 2010).
11 hhttp://www.agripopes.neti
July 2011 1773BIODIVERSITY PARTITIONING

Each farm comprised (ideally) five cereal crop fields (see
Geiger et al. 2010) for sampling of vascular plants and
carabids and a 500 3 500 m square for sampling of
breeding birds centered on the largest field of each farm.
When one farm could not provide five fields, five
sampling points with maximum distance to each other
were chosen. Each sampling point consisted of three
vegetation plots in a row, with a distance of 5 m between
each one, and one pitfall trap (Schmidt et al. 2006)
placed in the middle of each of the outer vegetation
plots. Plots were situated parallel to the field boundary
with 10 m distance between field margin and sampling
point.
Sampling of organisms
At the flowering stage of winter wheat (mid June) the
number of vascular-plant species was counted in the
vegetation plots (each 2 3 2 m2, three plots per field).
The number of carabid species was counted using two
pitfall traps per plot (diameter 9.5 cm, depth 15.4 cm),
opened for two one-week periods (one week after spike
appearance and at the milk-ripening stage of winter
wheat, respectively). Roofs made of cardboard fixed
with needles prevented flooding by rain. The trapping
fluid was 50% ethylene glycol. Carabids were stored in
70% ethanol and identified up to species level. We
identified and counted all the species caught in one trap
randomly selected from each pair of traps.
We used a simplified version of the British Trust for
Ornithology’s (BTO) Common Bird Census (Bibby et al.
1992) for bird species recording. All bird species were
mapped in a 500 3 500 m2 survey plot on each farm
centered on one focal field. Mapping included three
early morning visits between April and June. Windy,
cloudy, or rainy weather was avoided. Birds that merely
flew over the area without showing any behavior that
indicated breeding or foraging/hunting activity were
excluded. Breeding-bird territories were determined
using the three survey rounds (for details see Appendix
A). In some cases, not only the focal field, but also parts
of the surrounding landscape were sampled. Our bird
surveys thus were not restricted to arable bird species
and include species from seminatural habitats next to
the focal fields within the 5003 500 m square, to ensure
that possible indirect effects of AI on the landscape
structure are included in the analysis.
We are aware that the low sampling effort potentially
underestimates local diversity and thus might overesti-
mate b diversities. However, we were mainly interested
in the correlations between a, b, and c diversity and
agricultural intensification. Here, a standardized sam-
pling protocol is most important and a potential
underestimation of local diversity would enter the
statistical analysis merely as a systematical error.
Agricultural intensification index
Agricultural intensification (AI) was measured using a
standardized questionnaire on pesticide and fertilizer
(mineral and organic) applications, tillage operations,
and mechanical weed control, filled in by the farmers
after harvest.
All of these indicators are known to have the potential
to severely influence communities. The effects of
fertilization on species richness and community compo-
sition of plants are well studied (Pysek and Leps 1991,
Gough et al. 2000, Reich 2009). Likewise, the effects of
pesticides on plant, carabid, and bird communities are
well studied (Newton 2004, Geiger et al. 2010). Plowing
is assumed to affect plant (Dorado and Lopez-Fando
2006, Gruber and Claupein 2009), carabid (Thorbek and
Bilde 2004), and bird (Newton 2004) communities.
Although mechanical weed control is more frequently
used in organic farming, the effects of mechanical weed
control on plant and arthropod communities can be
severe (van Elsen 2000, Hatcher and Melander 2003,
Thorbek and Bilde 2004) and were therefore included
into the AI index. Based on this information, we
calculated an AI index for each farm. Three agricultural
practices, namely, pesticide input (number of applica-
tions; insecticides, herbicides, fungicides, and other
pesticides), fertilizer input (kg N per year per hectare
applied, both organic and inorganic), and the number of
tillage operations and mechanical weeding were normal-
ized, averaged, and added following Herzog et al.
(2006):
AI ¼
Xn
i¼1
ðyi � yiminÞ=ðyimax � yiminÞ
n3 100
where AI is the agricultural intensification index, yi is the
observed value (number of pesticide applications,
amount of fertilizer applied, or number of tillage
operations), ymin is the minimum observed value in all
regions, ymax is the maximum observed value in all
regions, n is the number of individual indicators, and i is
the identifier for the three indicators.
Based on this AI index, each farm within a local 503
50 km region was assigned to one level of agricultural
intensification (low, medium, and high). The continuous
variable AI was split into three discrete levels to allow
for the calculation of b diversities within each level on
the region scale. Within each region, farms were
classified into three groups into 10 farms of each AI
level to avoid spatial autocorrelation of the AI levels
over the whole study area (i.e., all regions; for mean AI
index values per level, see Table 1). Otherwise, farms of
one AI level might have been clumped in one or a few
regions, and hence, it would not have been possible to
separate AI level and region effects. To test for the
effects of overlapping AI index values between AI levels
and regions, we additionally analyzed a reduced data set
with data only from regions with similar AI index values
for the low, medium, and high AI treatments, i.e.,
France, Ireland, and Sweden were excluded, which
ANDREAS FLOHRE ET AL.1774 Ecological ApplicationsVol. 21, No. 5

yielded comparable results (Appendix B). Hence, we
used the whole data set in the present analysis.
Landscape structure
Landscape structure in a 1000 m radius around the
sampling points was measured on the basis of official
topographical maps (1:5000; DGK 5, Deutsche
Grundkarte, Landesvermessung und Geobasisinforma-
tion Lower Saxony, Hannover, Germany) using ArcGIS
9.2 (ESRI 2006). The percentage of agricultural fields,
which is closely related to habitat type diversity and
mean field size, was used as an indicator for landscape
complexity (Thies and Tscharntke 1999, Thies et al.
2003, Roschewitz et al. 2005). Because percentage arable
land was highly correlated with mean field size, only the
percentage of arable land was used in the analysis.
Landscape structure on higher spatial scales was
calculated using the mean values from the corresponding
lower spatial scale. For birds, only the mean field size
and the percentage of arable land within the 5003500 m
quadrats were measured.
Additive partitioning of species diversity
The total observed non-rarefied species richness, cobs,for each AI level and community can be partitioned as
cobs ¼ aþ bfield þ bfarm þ bregion
where a is the mean a diversity per field, bfield is the
between-field b diversity, bfarm is the mean between-farm
b diversity, and bregion is the mean between-region bdiversity. Because birds were sampled on the farm level,
bird data could only be partitioned into cobs ¼ afarm þbfarm þ bregion.
These values can be obtained as follows:
a ¼ 1
n
X
ijk
aijk
bfield ¼1
n
X
ijk
ðcjk � aijkÞ
bfarm ¼1
N
X
jk
ðck � cjkÞ
bregion ¼1
M
X
k
ðcobs � ckÞ
where n is the total number of fields (450), N is the totalnumber of farms within regions (90), M is the total
number of regions (9), i is the identifier for field withinfarm, j is the identifier for farm within region (90), and k
is the identifier for each region (9) for each AI level.We also calculated the relative a and b diversities, i.e.,
the percentage of contribution of a and b diversities tocobs.
Statistical models
Linear mixed-effects models were used to test theeffects of agricultural intensification and landscape
structure on the a, b, and c diversity of carabids,plants, and birds species richness. AI was included as a
factor with three levels (low, medium, and high) and thepercentage of arable land was included as a continuous
variable. Alpha and beta diversities were tested sepa-rately at field, farm, and regional scales, respectively,
i.e., one model for the effect of AI and landscapestructure on the a diversity on the field scale, one model
for the effect of AI and landscape structure on the bdiversity on the field scale, one model for the effect ofAI and landscape structure on the b diversity on the
farm scale, and so on. In total, we analyzed 450observations per AI level at the field scale, 90
calculations of b diversities per AI level at the farmscale, and 9 calculations of b diversities per AI level at
the regional scale. There were 1350 total replications (n)for the models at the field level, 270 at the farm level,
and 27 on the region level. Because these observationswere not independent from each other, fields were
nested within farms, and farms were nested withinregions and included as random factors into the models.
We analyzed the effects of AI on the relative contribu-tion using linear mixed-effect models with the same
nesting structure. Model assumptions were checked
TABLE 1. Mean (6SE) agricultural intensification (AI) index values for low, medium, and high AIlevels in each region and for all regions combined.
Region
Mean AI index
Low AI Medium AI High AI
Estonia 5.53 6 0.51 15.03 6 1.46 24.43 6 1.12France 13.54 6 0.73 16.21 6 0.18 18.04 6 0.33Germany Gottingen 3.07 6 0.73 16.63 6 2.56 32.11 6 2.28Germany Jena 13.63 6 1.72 27.81 6 0.78 36.42 6 1.96Ireland 29.74 6 1.21 31.76 6 1.10 33.06 6 0.97Netherlands 13.47 6 1.65 22.39 6 0.70 35.30 6 3.04Poland 14.98 6 1.22 21.15 6 0.71 30.71 6 1.95Spain 14.70 6 1.07 20.87 6 0.56 27.11 6 1.27Sweden 5.18 6 0.80 13.20 6 0.49 19.95 6 1.57
Overall mean 12.65 6 0.84 20.56 6 0.65 28.57 6 0.70
July 2011 1775BIODIVERSITY PARTITIONING
using diagnosis plots and dependent variables were
either log- or square-root-transformed and/or variance
functions (varIdent) were used (Pinheiro and Bates
2000) to account for non-normal distribution and
heteroscedasticity when necessary. The significance of
AI in each model was determined by using conditional F
tests, where the null model was tested against a model
with AI.
We applied paired t tests on the whole data set of each
taxon, i.e., across all AI levels, to test for taxon-specific
differences in the percentage contribution to total
species richness. On each scale, one t test per taxon
combination was done. Post hoc Tukey hsd tests were
applied to separate means. All analyses were performed
using R 2.8.1 (R Development Core Team 2009) and the
packages nlme (Pinheiro et al. 2009) and multcomp
(Hothorn et al. 2008).
RESULTS
Effects of AI level on a, b, and c diversity of plants,
carabids, and birds
In total, we recorded 423 vascular plant species, 219
carabid beetle species, and 121 bird species.
Comparisons of the a and b diversities between low,
medium, and high agricultural intensification (AI)
revealed that the effects of AI on species richness were
taxon specific. High AI significantly decreased a and bdiversities of plants at all scales, while b diversities of
carabids were only decreased at the region scale, and
bird b diversities were decreased at the farm and region
scale (Table 2 and Fig. 2). The percentage of arable land
was negatively related to plant and bird a diversity and
bird bfarm diversity. Carabid bfarm diversity showed a
significant interaction between AI and percentage of
arable land. Only at the medium AI level was the
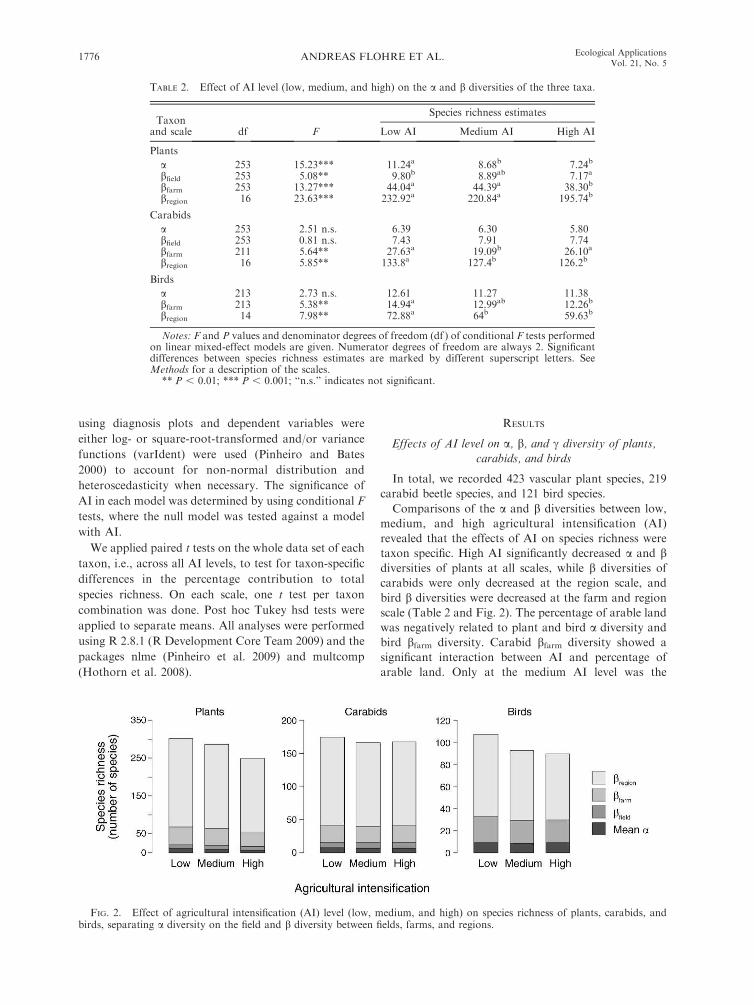
TABLE 2. Effect of AI level (low, medium, and high) on the a and b diversities of the three taxa.
Taxonand scale df F
Species richness estimates
Low AI Medium AI High AI
Plants
a 253 15.23*** 11.24a 8.68b 7.24b
bfield 253 5.08** 9.80b 8.89ab 7.17a
bfarm 253 13.27*** 44.04a 44.39a 38.30b
bregion 16 23.63*** 232.92a 220.84a 195.74b
Carabids
a 253 2.51 n.s. 6.39 6.30 5.80bfield 253 0.81 n.s. 7.43 7.91 7.74bfarm 211 5.64** 27.63a 19.09b 26.10a
bregion 16 5.85** 133.8a 127.4b 126.2b
Birds
a 213 2.73 n.s. 12.61 11.27 11.38bfarm 213 5.38** 14.94a 12.99ab 12.26b
bregion 14 7.98** 72.88a 64b 59.63b
Notes: F and P values and denominator degrees of freedom (df ) of conditional F tests performedon linear mixed-effect models are given. Numerator degrees of freedom are always 2. Significantdifferences between species richness estimates are marked by different superscript letters. SeeMethods for a description of the scales.
** P , 0.01; *** P , 0.001; ‘‘n.s.’’ indicates not significant.
FIG. 2. Effect of agricultural intensification (AI) level (low, medium, and high) on species richness of plants, carabids, andbirds, separating a diversity on the field and b diversity between fields, farms, and regions.
ANDREAS FLOHRE ET AL.1776 Ecological ApplicationsVol. 21, No. 5

percentage of arable land positively correlated to bfarmdiversity, while the low and high AI levels showed no
relationship (Table 3).
Effects of AI level on relative contribution of a, b,and c diversity to total species richness of plants,
carabids, and birds
Shifts in relative contribution of a and b diversity to
the total species richness within AI levels, estimated as
percentage of total diversity, were taxon specific (Table
4). Plants had a significantly larger relative contribution
of a diversity at the low AI level, while carabids had
higher relative bfield diversity at the high and medium,
compared to the low, AI level. Birds showed higher
relative a diversity at medium and low, compared to
high, AI level. The percentage of arable land was
negatively related to relative plant and bird a diversity
(Table 5).
Effects of taxon on relative contribution of a and bdiversity to total species richness
A comparison of the mean relative contribution to
total diversity regardless of AI level on each scale
between plants, carabids, and birds (Table 6) showed
that the taxa in this study had significantly different
relative contributions to total diversity, probably
depending on their mobility. On the field scale, carabids
showed higher a and b diversity than plants. On the
landscape scale, no differences between plants and
carabids were apparent, while birds had higher bdiversity than carabids and plants. On the region scale,
plants and carabids also did not differ, but both were
higher than bird diversity. The importance of a and bdiversities for the species richness within each region is
shown in Appendix C.
DISCUSSION
The analysis of diversity patterns of plants, carabid
beetles, and birds in agricultural landscapes across
Europe showed that b diversity between farms and
regions contributed most to total diversity. Agricultural
intensification (AI) was negatively correlated with species
richness of plants and birds, whereas carabid beetles
showed no such relationships, thus supporting our
hypotheses that AI has a negative effect on species
richness depending on taxon. AI, although based on local
TABLE 3. Correlation between percentage of arable land in a 1000 m radius around the plots and a and b diversities of the threetaxa and their interactions.
Taxon Scale Variable df F Description
Plants a percentage of arable land 1035 6.73** negativeCarabids bfarm interaction percentage arable land 211 3.35* medium: positiveBirds a percentage arable land 213 9.95** negativeBirds bfarm percentage arable land 213 13.93*** positive
Notes: F and P values and denominator degrees of freedom (df ) of conditional F tests performed on linear mixed-effect modelsare given. Numerator degrees of freedom are always 1. The description column gives details about the direction of the main effectsand interactions. ‘‘Interaction’’ is the interaction between percentage of arable land and AI. Only significant results are shown.
* P , 0.05; ** P , 0.01; *** P , 0.001.
TABLE 4. Effect of AI level on the relative contribution (percentage of total) of a and b diversitiesto the c diversity of each taxa within each AI level.
Taxonand scale df F
Percentage of total species richness estimates
Low AI Medium AI High AI
Plants
a 253 6.99** 3.82a 3.09b 2.92b
bfield 253 0.82 n.s. 3.45 3.29 3.08bfarm 214 0.02 n.s. 12.73 12.77 12.78bregion 16 0.15 n.s. 77.63 77.66 78.58
Carabids
a 253 1.64 n.s. 3.69 3.79 3.45bfield 253 2.39 n.s. 4.29 4.75 4.65bfarm 211 6.37** 16.11a 12.18b 16.46a
bregion 16 0.48 n.s. 76.95 76.31 75.58
Birds
a 213 0.56 n.s. 12.78 12.64 13.24bfarm 219 8.57*** 21.17a 21.77a 23.79b
bregion 14 0.00 n.s. 68.75 68.82 68.53
Notes: F and P values and denominator degrees of freedom (df ) of conditional F tests performedon linear mixed-effect models are given. Numerator degrees of freedom are always 2. Significantdifferences between the percentage of total species richness estimates are marked by differentsuperscript letters.
** P , 0.01; *** P , 0.001; ‘‘n.s.’’ indicates not significant.
July 2011 1777BIODIVERSITY PARTITIONING

practices, was closely related to the b diversity on largerscales up to the region scale, with the detrimental effectsof AI still recognizable on higher scales. Hence, AI at
local scales appeared to be an indicator of farm- andregion-wide loss of diversity.
Effects of AI on species richness across different taxa
The great role of b diversity contribution to overall
biodiversity at the regional scale has been shown byseveral studies (Wagner et al. 2000, Roschewitz et al.
2005, Gabriel et al. 2006, Clough et al. 2007, Hendrickxet al. 2007) and stress the huge importance ofenvironmental heterogeneity at larger scales.
In this study, plant species richness was significantlyreduced under intensive management. This detrimental
effect of high input farming was consistent over allscales, indicating species poorer plant communitiesunder high AI. This is supported by the literature,
showing positive effects of low-input farming, i.e.,reduced pesticide and/or reduced fertilizer input, on
plant species richness (e.g., Stoate et al. 2001, Bengtssonet al. 2005, Gabriel et al. 2006, Liira et al. 2008, Kleijn et
al. 2009). In addition, we could confirm that plantspecies richness was reduced with increasing landscapesimplification (as shown by the percentage of arable
land; Tscharntke et al. 2005, Gabriel et al. 2006).In contrast, AI had no effect on the species richness of
carabids on the field and farm scale, although detrimen-tal effects of soil management, for example, plowing,
mechanical weed control, or grass cutting on arthropodsare well known (Holland and Reynolds 2003, Thorbekand Bilde 2004). However, pesticide use in crop edges
usually does not seem to affect carabid species richnessnegatively (Frampton and Dorne 2007), although
pesticides may change carabid abundance and commu-nity composition directly and indirectly (Shah et al.2003, Navntoft et al. 2006, Geiger et al. 2010). Our
results agree with studies showing no effect of AI on thespecies richness of carabids in cereal fields at the regional
and local scale (Clough et al. 2007, Batary et al. 2008,but see Geiger et al. 2010). Only at the region scale did apositive effect of lower AI on b-diversity exist, indicatingmore dissimilar and diverse carabid communitiesbetween regions under low AI management (also see
Schweiger et al. 2005, Hendrickx et al. 2009). However,we found a significant interaction between AI and
percentage of arable land. Here, an increasing amountof arable land slightly increased dissimilarity of com-munities only on the medium AI level.
Bird species richness was enhanced under low AI. Thiscould be due to improved food and nesting resource
availability in low-intensity management fields(Stephens et al. 2003) and more diverse and complexfield margins (e.g., hedgerows, woodland), stressing the
importance of physical heterogeneity on the field as animportant determinant of bird diversity (Wilson et al.
2005). Granivorous birds especially could be affectedthrough the loss of food and nesting resources through
weed control at higher AI (Newton 2004). We alsofound a negative correlation between the percentage ofarable land and bird a diversity and bfarm diversity,
highlighting the importance of seminatural habitats forthe bird community in arable landscapes independently
from local AI on the field.
AI effects across different spatial scales
If local AI determines the local diversity of a specificset of species out of the species pool, AI would enhance
TABLE 5. Correlation between percentage of arable land in a 1000 m radius around the plots andrelative contribution (percentage of total) of a and b diversities to the c diversity of each taxawithin each AI level.
Taxon Scale Variable df F Description
Plants a percentage of arable land 1035 6.98** negativeBirds a percentage of arable land 213 12.74*** negative
Notes: F and P values and denominator degrees of freedom (df ) of conditional F tests performedon linear mixed-effect models are given. Numerator degrees of freedom are always 1. Thedescription column gives details about the direction of the main effects and interactions.‘‘Interaction’’ is the interaction between the percentage of arable land and AI. Only significantresults are shown.
** P , 0.01; *** P , 0.001.
TABLE 6. Results of paired t tests comparing the relative contribution of each scale to taxon-specific total species richness between the different taxa (plants, P; carabids, C; birds, B).
Scale Compared taxa t df Direction of effect
a plants–carabids �14.07*** 1315 P , Cbfield plants–carabids �10.95*** 1315 P , Cbfarm plants–carabids 1.24 n.s. 263 P ¼ Cbfarm plants–birds �12.13*** 228 B . Pbfarm carabids–birds �11.22*** 228 B . Cbregion plants–carabids 0.97 n.s. 26 P ¼ Cbregion plants–birds 3.68*** 23 B . Pbregion carabids–birds 3.10*** 23 B , C
*** P , 0.001; n.s. is not significant.
ANDREAS FLOHRE ET AL.1778 Ecological ApplicationsVol. 21, No. 5

the relative importance (i.e., percentage contribution of
a diversity to c diversity) of a diversity, homogenizing
community composition between sites due to increas-
ingly similar environmental conditions (Tylianakis et al.
2005, Quintero et al. 2010). In our study, AI on the field
was not related to large-scale land-use changes, as AI
was not significantly correlated with the percentage of
arable land (with the exception of carabid bfarm
diversity). Hence, local effects of AI could be disentan-
gled from effects such as landscape homogenization. In
contrast to the expected enhancement of the relative
importance of a diversity, local AI decreased the relative
a diversity of plants and increased the relative impor-
tance of bfarm diversity of birds and carabids under high
AI, indicating an increased species turnover. Hence, AI
does not necessarily homogenize local communities
presumably due to heterogeneity of farming practices
in intensified agriculture.
In addition, we could show that the percentage of
arable land independent from AI was negatively
correlated with the relative a diversity of plants and
birds. Therefore, increasing landscape simplification was
connected to more and more dissimilar communities,
although this relationship was relatively weak as shown
by the nonsignificant results concerning b diversities.
Differences in spatial diversity patterns between plants,
carabids, and birds
Species group identity had a significant effect on the
spatial diversity patterns, indicated by a different
partitioning of diversity components (relative a, bfield,
bfarm, and bregion). One could expect birds to have, on
average, a higher mobility and possibly higher dispersal
ability than carabids. Both taxa are surely more mobile
than plants as sessile organisms. The more mobile taxa
had, on average, less similar communities on the field and
farm level than plants (Table 4), i.e., afield and bfield
represented a greater proportion of c diversity for
carabids, and afarm, bfarm, and bregion represented a
greater proportion of c diversity for birds in comparison
to plants. One possible explanation are spillover effects
from the adjacent non-crop habitats for more mobile
taxa, which could lead to variance in the local species
composition (Hendrickx et al. 2009), as supported by
several studies stressing the importance of the surround-
ing landscape and field margins for the within field
carabid community (Denys and Tscharntke 2002,
Purtauf et al. 2005, Schweiger et al. 2005, Hendrickx et
al. 2007, Batary et al. 2008, Smith et al. 2008). Likewise,
the importance of species-rich field margins and semi-
natural habitats for within-field species richness has
already been shown for many other arthropod taxa
depending on body size (ability for mobility; Schmidt and
Tscharntke 2005, Schmidt et al. 2005, Schweiger et al.
2005, Holland et al. 2009) and farmland birds (Vickery et
al. 2002, Billeter et al. 2008). For plants, however, the
picture could be a little different. The within-field
environmental conditions between farms are likely more
similar than the environmental conditions in the sur-
rounding landscapes around these fields. For plants, as
less mobile taxa, this could act as a homogenizing force,
filtering out species with specific traits and life histories
(Liira et al. 2008). Plant species richness might be more
strongly affected by local management than by landscape
and field margin composition and structure (Gabriel et
al. 2006, Aavik et al. 2008, Marshall 2009), although
landscape has a relevant effect, especially at high
landscape complexity (Roschewitz et al. 2005, Gabriel
et al. 2006, Aavik and Liira 2010). This is in line with
results of a meta-analysis from Attwood et al. (2008),
which show that the loss of species richness of arthropods
from native to agricultural systems is greater than that
through AI within agricultural systems.
Birds had a higher relative b diversity on the farm
scale than plants and carabids, indicating relatively more
dissimilar communities. Because bird species richness
was measured in a 500 3 500 m square, sometimes not
only the focal field, but parts of the surrounding
landscape were sampled, too. However, AI and percent-
age of arable land in the 500 3 500 m square were not
correlated in our study, hence, disentangling AI and
landscape effects.
At the region scale, birds had a significantly lower
relative b diversity than plants and carabids, indicating a
possible homogenizing effect of dispersal ability on
species richness (Mouquet and Loreau 2003, Cadotte
2006). With increasing dispersal ability, species turnover
between plots should decrease, caused by community
homogenization between plots through dispersal over
long distances.
Conclusions and management implications
Our study shows that b diversity accounted for the
major part of the total diversity, an effect consistent over
all nine European regions included in this study.
Landscape simplification was negatively correlated to the
a diversity of plants and birds and bfarm diversity of birds.
AI was correlated to decreased species richness of plants
and birds on all scales, i.e., local AI did not only negatively
affect the local diversity on the field, but was also related to
reduced species turnover between fields, farms, and
regions. In contrast, carabid beetle species richness was
not correlated to AI, possibly due to a relatively high
tolerance to pesticides and a high impact of immigration
from surrounding field margins and seminatural habitats.
AI did not cause the hypothesized higher relative
contribution of a than b diversity to total diversity,
which would have indicated a homogenizing effect of
AI. Relative contributions of b diversity to total
diversity across all scales were taxon specific, highlight-
ing the need to consider traits such as species mobility
when planning agri-environmental schemes. This means,
from an applied point of view, agri-environmental
schemes need to (1) expand the view from the local
field and farm to the landscape and region level to
appropriately predict the effectiveness of agri-environ-
July 2011 1779BIODIVERSITY PARTITIONING

mental schemes, shown by the huge contribution of bdiversity of large scales; and to (2) consider taxon
specific responses to conservation efforts.
ACKNOWLEDGMENTS
We thank the people who did the bird surveys and ChristophScherber for statistical advice. We also thank the EuropeanScience Foundation and the connected eight national sciencefoundations for funding the presented study through theEurodiversity AGRIPOPES (agricultural policy-induced land-scape changes: effects on biodiversity and ecosystem services)program and the biology program BIOPLEX of the GermanFederal Ministry of Education and Science (BMBF).
LITERATURE CITED
Aavik, T., I. Augenstein, D. Bailey, F. Herzog, M. Zobel, and J.Liira. 2008. What is the role of local landscape structure inthe vegetation composition of field boundaries? AppliedVegetation Science 11:375–386.
Aavik, T., and J. Liira. 2010. Quantifying the effect of organicfarming, field boundary type and landscape structure on thevegetation of field boundaries. Agriculture, Ecosystems andEnvironment 135:178–186.
Attwood, S. J., M. Maron, A. P. N. House, and C. Zammit.2008. Do arthropod assemblages display globally consistentresponses to intensified agricultural land use and manage-ment? Global Ecology and Biogeography 17:585–599.
Batary, P., A. Kovacs, and A. Baldi. 2008. Management effectson carabid beetles and spiders in Central Hungariangrasslands and cereal fields. Community Ecology 9:247–254.
Bengtsson, J., J. Ahnstrom, and A. C. Weibull. 2005. Theeffects of organic agriculture on biodiversity and abundance:a meta-analysis. Journal of Applied Ecology 42:261–269.
Benton, T. G., J. A. Vickery, and J. D. Wilson. 2003. Farmlandbiodiversity: is habitat heterogeneity the key? Trends inEcology and Evolution 18:182–188.
Bibby, J. C., D. N. Burgress, and A. D. Hill. 1992. Bird censustechniques. Academic Press, London, UK.
Billeter, R., et al. 2008. Indicators for biodiversity inagricultural landscapes: a pan-European study. Journal ofApplied Ecology 45:141–150.
Cadotte, M. W. 2006. Dispersal and species diversity: a meta-analysis. American Naturalist 167:913–924.
Chandy, S., D. J. Gibson, and P. A. Robertson. 2006. Additivepartitioning of diversity across hierarchical spatial scales in aforested landscape. Journal of Applied Ecology 43:792–801.
Clough, Y., A. Holzschuh, D. Gabriel, T. Purtauf, D. Kleijn, A.Kruess, I. Steffan-Dewenter, and T. Tscharntke. 2007. Alphaand beta diversity of arthropods and plants in organicallyand conventionally managed wheat fields. Journal of AppliedEcology 44:804–812.
Collins, S. L., S. M. Glenn, and J. M. Briggs. 2002. Effect oflocal and regional processes on plant species richness intallgrass prairie. Oikos 99:571–579.
Crawley, M. J., and J. E. Harral. 2001. Scale dependence inplant biodiversity. Science 291:864–868.
Crist, T., J. Veech, J. Gering, and K. Summerville. 2003.Partitioning species diversity across landscapes and regions: ahierarchical analysis of alpha, beta, and gamma diversity.American Naturalist 162:734–743.
Denys, C., and T. Tscharntke. 2002. Plant-insect communitiesand predator-prey ratios in field margin strips, adjacent cropfields, and fallows. Oecologia 130:315–324.
Diekotter, T., R. Billeter, and T. O. Crist. 2008. Effects oflandscape connectivity on the spatial distribution of insectdiversity in agricultural mosaic landscapes. Basic andApplied Ecology 9:298–307.
Dorado, J., and C. Lopez-Fando. 2006. The effect of tillagesystem and use of a paraplow on weed flora in a semiarid soilfrom central Spain. Weed Research 46:424–431.
ESRI. 2006. ArcGIS. Version 9.2. ESRI, Redlands, California,USA.
Foley, J. A., et al. 2005. Global consequences of land use.Science 309:570–574.
Frampton, G. K., and J. Dorne. 2007. The effects on terrestrialinvertebrates of reducing pesticide inputs in arable crop edges:a meta-analysis. Journal of Applied Ecology 44:362–373.
Gabriel, D., I. Roschewitz, T. Tscharntke, and C. Thies. 2006.Beta diversity at different spatial scales: plant communities inorganic and conventional agriculture. Ecological Applica-tions 16:2011–2021.
Geiger, F., et al. 2010. Persistent negative effects of pesticideson biodiversity and biological control potential on Europeanfarmland. Basic and Applied Ecology 11:97–105.
Gering, J. C., T. O. Crist, and J. A. Veech. 2003. Additivepartitioning of species diversity across multiple spatial scales:implications for regional conservation of biodiversity.Conservation Biology 17:488–499.
Gough, L., C. W. Osenberg, K. L. Gross, and S. L. Collins.2000. Fertilization effects on species density and primaryproductivity in herbaceous plant communities. Oikos89:428–439.
Gruber, S., and W. Claupein. 2009. Effect of tillage intensity onweed infestation in organic farming. Soil and TillageResearch 105:104–111.
Hatcher, P. E., and B. Melander. 2003. Combining physical,cultural and biological methods: prospects for integratednon-chemical weed management strategies. Weed Research43:303–322.
Hendrickx, F., J. P. Maelfait, K. Desender, S. Aviron, D.Bailey, T. Diekotter, L. Lens, J. Liira, O. Schweiger, M.Speelmans, V. Vandomme, and R. Bugter. 2009. Pervasiveeffects of dispersal limitation on within- and among-community species richness in agricultural landscapes.Global Ecology and Biogeography 18:607–616.
Hendrickx, F., et al. 2007. How landscape structure, land-useintensity and habitat diversity affect components of totalarthropod diversity in agricultural landscapes. Journal ofApplied Ecology 44:340–351.
Herzog, F., et al. 2006. Assessing the intensity of temperateEuropean agriculture at the landscape scale. EuropeanJournal of Agronomy 24:165–181.
Holland, J. M., T. Birkett, and S. Southway. 2009. Contrastingthe farm-scale spatio-temporal dynamics of boundary andfield overwintering predatory beetles in arable crops.Biocontrol 54:19–33.
Holland, J. M., and C. J. M. Reynolds. 2003. The impact of soilcultivation on arthropod (Coleoptera and Araneae) emer-gence on arable land. Pedobiologia 47:181–191.
Hothorn, T., F. Bretz, and P. Westfall. 2008. Simultaneousinference in general parametric models. Biometrical Journal50:346–363.
Kleijn, D., et al. 2009. On the relationship between farmlandbiodiversity and land-use intensity in Europe. Proceedings ofthe Royal Society of London B 276:903–909.
Lande, R. 1996. Statistics and partitioning of species diversity,and similarity among multiple communities. Oikos 76:5–13.
Legendre, P., D. Borcard, and P. R. Peres-Neto. 2005.Analyzing beta diversity: partitioning the spatial variationof community composition data. Ecological Monographs75:435–450.
Liira, J., et al. 2008. Plant functional group composition andlarge-scale species richness in the agricultural landscapes ofEurope. Journal of Vegetation Science 19:3–14.
Marshall, E. J. P. 2009. The impact of landscape structure andsown grass margin strips on weed assemblages in arable cropsand their boundaries. Weed Research 49:107–115.
Matson, P. A., W. J. Parton, A. G. Power, and M. J. Swift.1997. Agricultural intensification and ecosystem properties.Science 277:504–509.
ANDREAS FLOHRE ET AL.1780 Ecological ApplicationsVol. 21, No. 5

Mouquet, N., and M. Loreau. 2003. Community patterns insource-sink metacommunities. American Naturalist 162:544–557.
Navntoft, S., P. Esbjerg, and W. Riedel. 2006. Effects ofreduced pesticide dosages on carabids (Coleoptera: Carabi-dae) in winter wheat. Agricultural and Forest Entomolgy8:57–62.
Newton, I. 2004. The recent declines of farmland birdpopulations in Britain: an appraisal of causal factors andconservation actions. Ibis 146:579–600.
Pinheiro, J. C., and D. M. Bates. 2000. Mixed-effects models inS and S-PLUS. First edition. Springer, New York, USA.
Pinheiro, J. C., D. M. Bates, S. DebRoy, and D. Sarkar, andthe R Core Team. 2009. nlme: linear and nonlinear mixedeffects models. R package version 3.1-93. R Foundation forStatistical Computing, Vienna, Austria.
Purtauf, T., I. Roschewitz, J. Dauber, C. Thies, T. Tscharntke,and V. Wolters. 2005. Landscape context of organic andconventional farms: influences on carabid beetle diversity.Agriculture Ecosystems and Environment 108:165–174.
Pysek, P., and J. Leps. 1991. Response of a weed community tonitrogen-fertilization: a multivariate-analysis. Journal ofVegetation Science 2:237–244.
Quintero, C., C. L. Morales, and M. A. Aizen. 2010. Effects ofanthropogenic habitat disturbance on local pollinator diver-sity and species turnover across a precipitation gradient.Biodiversity and Conservation 19:257–274.
R Development Core Team. 2009. R: a language andenvironment for statistical computing. R Foundation forStatistical Computing, Vienna, Austria.
Reich, P. B. 2009. Elevated CO2 reduces losses of plant diversitycaused by nitrogen deposition. Science 326:1399–1402.
Robinson, R. A., and W. J. Sutherland. 2002. Post-war changesin arable farming and biodiversity in Great Britain. Journalof Applied Ecology 39:157–176.
Roschewitz, I., D. Gabriel, T. Tscharntke, and C. Thies. 2005.The effects of landscape complexity on arable weed speciesdiversity in organic and conventional farming. Journal ofApplied Ecology 42:873–882.
Schmidt, M., Y. Clough, W. Schulz, A. Westphalen, and T.Tscharntke. 2006. Capture efficiency and preservationattributes of different fluids in pitfall traps. Journal ofArachnology 34:159–162.
Schmidt, M. H., I. Roschewitz, C. Thies, and T. Tscharntke.2005. Differential effects of landscape and management ondiversity and density of ground-dwelling farmland spiders.Journal of Applied Ecology 42:281–287.
Schmidt, M. H., and T. Tscharntke. 2005. The role of perennialhabitats for Central European farmland spiders. AgricultureEcosystems and Environment 105:235–242.
Schweiger, O., et al. 2005. Quantifying the impact ofenvironmental factors on arthropod communities in agricul-tural landscapes across organizational levels and spatialscales. Journal of Applied Ecology 42:1129–1139.
Shah, P. A., D. R. Brooks, J. E. Ashby, J. N. Perry, and I. P.Woiwod. 2003. Diversity and abundance of the coleopteran
fauna from organic and conventional management systems insouthern England. Agricultural and Forest Entomolgy 5:51–60.
Smith, J., S. G. Potts, B. A. Woodcock, and P. Eggleton. 2008.Can arable field margins be managed to enhance theirbiodiversity, conservation and functional value for soilmacrofauna? Journal of Applied Ecology 45:269–278.
Stephens, P. A., R. P. Freckleton, A. R. Watkinson, and W. J.Sutherland. 2003. Predicting the response of farmland birdpopulations to changing food supplies. Journal of AppliedEcology 40:970–983.
Stoate, C., N. D. Boatman, R. J. Borralho, C. R. Carvalho,G. R. de Snoo, and P. Eden. 2001. Ecological impacts ofarable intensification in Europe. Journal of EnvironmentalManagement 63:337–365.
Thies, C., I. Steffan-Dewenter, and T. Tscharntke. 2003. Effectsof landscape context on herbivory and parasitism at differentspatial scales. Oikos 101:18–25.
Thies, C., and T. Tscharntke. 1999. Landscape structure andbiological control in agroecosystems. Science 285:893–895.
Thorbek, P., and T. Bilde. 2004. Reduced numbers of generalistarthropod predators after crop management. Journal ofApplied Ecology 41:526–538.
Tscharntke, T., A. M. Klein, A. Kruess, I. Steffan-Dewenter,and C. Thies. 2005. Landscape perspectives on agriculturalintensification and biodiversity—ecosystem service manage-ment. Ecology Letters 8:857–874.
Tylianakis, J. M., A. M. Klein, T. Lozada, and T. Tscharntke.2006. Spatial scale of observation affects alpha, beta andgamma diversity of cavity-nesting bees and wasps across atropical land-use gradient. Journal of Biogeography 33:1295–1304.
Tylianakis, J. M., A. M. Klein, and T. Tscharntke. 2005.Spatiotemporal variation in the diversity of hymenopteraacross a tropical habitat gradient. Ecology 86:3296–3302.
van Elsen, T. 2000. Species diversity as a task for organicagriculture in Europe. Agriculture Ecosystems and Environ-ment 77:101–109.
Veech, J., K. Summerville, T. Crist, and J. Gering. 2002. Theadditive partitioning of species diversity: recent revival of anold idea. Oikos 99:3–9.
Vickery, J., N. Carter, and R. J. Fuller. 2002. The potentialvalue of managed cereal field margins as foraging habitats forfarmland birds in the UK. Agriculture Ecosystems andEnvironment 89:41–52.
Wagner, H. H., O. Wildi, and K. C. Ewald. 2000. Additivepartitioning of plant species diversity in an agriculturalmosaic landscape. Landscape Ecology 15:219–227.
Weiher, E., and A. Howe. 2003. Scale-dependence of environ-mental effects on species richness in oak savannas. Journal ofVegetation Science 14:917–920.
Wilson, J. D., M. J. Whittingham, and R. B. Bradbury. 2005.The management of crop structure: a general approach toreversing the impacts of agricultural intensification on birds?Ibis 147:453–463.
APPENDIX A
Details on the breeding-bird sampling protocol (Ecological Archives A021-080-A1).
APPENDIX B
Results of the analysis with a reduced data set (Ecological Archives A021-080-A2).
APPENDIX C
The a and b diversities within each region disregarding agricultural intensification (Ecological Archives A021-080-A3).
July 2011 1781BIODIVERSITY PARTITIONING
Copyright © 2022 FDOKUMEN