Aging, Disablement, and Dying: Using Time-as-Process and Time-as-Resources Metrics to Chart...
14
Aging, Disablement, and Dying: Using Time-as-Process and Time-as-Resources Metrics to Chart Late-Life Change Nilam Ram 1,2 , Denis Gerstorf 1 , Elizabeth Fauth 3 , Steven Zarit 1,4 , and Bo Malmberg 4 1 The Pennsylvania State University 2 Max Planck Institute for Human Development 3 Utah State University 4 Jönköping University, Sweden Abstract Time is a vehicle that can be used to represent aging-related processes and to index the amount of aging-related resources or burdens individuals have accumulated. Using data on cognitive (memory) performance from two Swedish studies of the elderly (OCTO and OCTO-TWIN), we illustrate how time-as-process and time-as-resources/burdens time metrics can be articulated and incorporated within a growth curve modeling framework. Our results highlight the possibilities for representing the contributions of primary, secondary, and tertiary aspects of aging to late-life changes in cognitive and other domains of functioning. Keywords longitudinal; development; aging; disability; mortality; growth modeling One of the primary objectives of lifespan developmental research is to describe intraindividual changes across time (Baltes & Nesselroade, 1979; Wohlwill, 1973). Time is often indexed as chronological age. But, what is time? K. Warner Schaie (1965), among others, recognized early on that development was driven by a multitude of processes and constructs (e.g., age, period, cohort) and illustrated through his general developmental model that time can be characterized in different ways and indexed in relation to different starting or ending points. Conceptually, the metric on which time is indexed can be considered a vehicle (variable) representing and condensing a particular set of processes (Wohlwill, 1973). Thus, depending on the sets of processes or constructs one is interested in, different time metrics may be of use. For instance, Sliwinski, Hofer, Hall, Buschke, and Lipton (2003) illustrated how different developmental processes might be invoked via time since birth (age), time since dementia diagnosis, time to dropout, or time to death. Describing how differences and changes are organized in relation to these and other types of time may reveal additional insights into when and how aging proceeds (Li & Schmiedek, 2002). Following and expanding Sliwinski et al.’s lead, we illustrate two ways in which age-related, pathology- Correspondence concerning this article should be addressed to Nilam Ram, Department of Human Development and Family Studies, 110 South Henderson Building, Pennsylvania State University, University Park, PA 16802-6505. [email protected]. Nilam Ram and Denis Gerstorf, Department of Human Development and Family Studies, The Pennsylvania State University; Elizabeth Fauth, Department of Family, Consumer, and Human Development, Utah State University; Steven Zarit, Department of Human Development and Family Studies, The Pennsylvania State University; and, Bo Malmberg, Institute for Gerontology in the College of Health Sciences at Jönköping University, Sweden. NIH Public Access Author Manuscript Res Hum Dev. Author manuscript; available in PMC 2012 October 28. Published in final edited form as: Res Hum Dev. 2010 ; 7(1): 27–44. doi:10.1080/15427600903578151. NIH-PA Author Manuscript NIH-PA Author Manuscript NIH-PA Author Manuscript
Transcript of Aging, Disablement, and Dying: Using Time-as-Process and Time-as-Resources Metrics to Chart...

Aging, Disablement, and Dying: Using Time-as-Process andTime-as-Resources Metrics to Chart Late-Life Change
Nilam Ram1,2, Denis Gerstorf1, Elizabeth Fauth3, Steven Zarit1,4, and Bo Malmberg4
1The Pennsylvania State University2Max Planck Institute for Human Development3Utah State University4Jönköping University, Sweden
AbstractTime is a vehicle that can be used to represent aging-related processes and to index the amount ofaging-related resources or burdens individuals have accumulated. Using data on cognitive(memory) performance from two Swedish studies of the elderly (OCTO and OCTO-TWIN), weillustrate how time-as-process and time-as-resources/burdens time metrics can be articulated andincorporated within a growth curve modeling framework. Our results highlight the possibilities forrepresenting the contributions of primary, secondary, and tertiary aspects of aging to late-lifechanges in cognitive and other domains of functioning.
Keywordslongitudinal; development; aging; disability; mortality; growth modeling
One of the primary objectives of lifespan developmental research is to describeintraindividual changes across time (Baltes & Nesselroade, 1979; Wohlwill, 1973). Time isoften indexed as chronological age. But, what is time? K. Warner Schaie (1965), amongothers, recognized early on that development was driven by a multitude of processes andconstructs (e.g., age, period, cohort) and illustrated through his general developmentalmodel that time can be characterized in different ways and indexed in relation to differentstarting or ending points.
Conceptually, the metric on which time is indexed can be considered a vehicle (variable)representing and condensing a particular set of processes (Wohlwill, 1973). Thus, dependingon the sets of processes or constructs one is interested in, different time metrics may be ofuse. For instance, Sliwinski, Hofer, Hall, Buschke, and Lipton (2003) illustrated howdifferent developmental processes might be invoked via time since birth (age), time sincedementia diagnosis, time to dropout, or time to death. Describing how differences andchanges are organized in relation to these and other types of time may reveal additionalinsights into when and how aging proceeds (Li & Schmiedek, 2002). Following andexpanding Sliwinski et al.’s lead, we illustrate two ways in which age-related, pathology-
Correspondence concerning this article should be addressed to Nilam Ram, Department of Human Development and Family Studies,110 South Henderson Building, Pennsylvania State University, University Park, PA 16802-6505. [email protected] Ram and Denis Gerstorf, Department of Human Development and Family Studies, The Pennsylvania State University;Elizabeth Fauth, Department of Family, Consumer, and Human Development, Utah State University; Steven Zarit, Department ofHuman Development and Family Studies, The Pennsylvania State University; and, Bo Malmberg, Institute for Gerontology in theCollege of Health Sciences at Jönköping University, Sweden.
NIH Public AccessAuthor ManuscriptRes Hum Dev. Author manuscript; available in PMC 2012 October 28.
Published in final edited form as:Res Hum Dev. 2010 ; 7(1): 27–44. doi:10.1080/15427600903578151.
NIH
-PA Author Manuscript
NIH
-PA Author Manuscript
NIH
-PA Author Manuscript

related, and mortality-related aspects of aging can be articulated and invoked within thecontext of contemporary growth curve methodology. As will be elaborated, time can beincorporated in the growth curve model at both within-person and between-person levels ofanalysis – as proxy for process and as proxy for personal resources/burdens, respectively.Together, the process and resources/burdens time metrics are used to articulate and testhypotheses regarding how late-life development is driven by multiple time-relatedprocesses.
Aging, Time, and Growth ModelingThe lifespan and gerontological literatures propose that trajectories of behavioral change atthe end of life reflect a combination of age-related, pathology-related, and mortality-relatedprocesses. For example, Birren and Cunningham (1985; see also Busse, 1969) highlightedconceptual distinctions between primary, secondary, and tertiary aspects of aging. Primaryor normal aging refers to the typical changes that most people experience with increasingage – processes thought to accrue with age and are causally linked to age-related biologicaland physical deterioration. Secondary or pathological aging encompasses changes thataccrue with or are causally linked to disease and disability. Tertiary or mortality-relatedaging refers to accelerated functional deteriorations that manifest shortly (months, maybeyears) before death. By definition, these tertiary changes are not so much correlated withage, but with impending death.
In recent years, longitudinal studies of growth and change have been making good use ofgrowth curve modeling methods (see Hertzog & Nesselroade, 2003; McArdle &Nesselroade, 2003; Schaie & Hofer, 2001). Repeated assessments from multiple persons areused as the raw data for analytic procedures that model interindividual differences inintraindividual change. Without going into detail here (see methods section), a simple lineargrowth model can be written in two parts/levels – a within-person model and a between-person model. At the within-person level, the model indicates how individuals’ performanceor ability changes as Timeti, a time-varying predictor measured at occasion t for person i,proceeds from one measurement occasion to the next (i.e., Yti =β0i + β1iTimeti + eti). Thelongitudinal, within-person model invokes time as an on-going process, the specificprogression of which is captured by individual-specific intercepts and slopes, β0i and β1i.The slope coefficient, β1i, specifically, indicates the amount of change in the outcome, Yti,expected for one unit increase of Time. Conceptually, the slope coefficient is an attribute ofthe person, indicating the contribution of underlying processes to that person’s scores. Oneway to think of this is that each person receives a yearly injection of process – a substancethat “causes” the observed changes. At the between-person level, the size of the injectionmay differ across individuals. For example, one individual’s yearly injection may contain alot of age-related process, another’s only a little. Conceptually, the cross-sectional, between-person level of the model describes how and, with the inclusion of additional predictors(e.g., SES), potentially why the process progresses in a different manner for individuals withdifferent characteristics or levels of resources (e.g., β1i =γ10 + γ11Resourcesi + u1i) – whysome individuals get larger injections than others. For example, individuals with moreresources may receive relatively small injections of age-related decline. In contrast,individuals with few resources might be prone to relatively large injections of age-relateddecline.
Making use of the two-level structure, time can be introduced into the growth modelingframework in two ways – in a longitudinal manner (the within-person level), and in a cross-sectional manner (the between-person level).
Ram et al. Page 2
Res Hum Dev. Author manuscript; available in PMC 2012 October 28.
NIH
-PA Author Manuscript
NIH
-PA Author Manuscript
NIH
-PA Author Manuscript

Within-person: Time as ProcessAt the within-person level, time serves as a proxy for process, and based on the “type” oftime index used, primary, secondary, tertiary processes may be represented.
Primary aging processesMost aging research seeks to describe and understand systematic changes that occur as aresult of primary or normative aging processes (see Alwin, Hofer, & McCammon, 2006;Hertzog & Nesselroade, 2003; Schroots & Birren, 1990). Longitudinal observationsobtained over multiple individuals’ life-spans are indexed along a time-from-birth, orchronological age, time axis. Individuals’ behavior (e.g., memory performance) is tracked asthey move from left to right along the time axis with chronological age acting as a time-varying indicator of progressive age-related processes.
Secondary aging processesBiological perspectives draw a distinction between endogenous (primary) and exogenous(secondary) aspects of aging (cf. Austad, 2001) and suggest that typical age-related changes,which are intrinsic to growing older and are irreversible, be separated from disease-relatedchanges that are, in principle, reversible or preventable. In similar fashion, prominentbiopsychosocial theories, such as the Disablement Process model (Verbrugge & Jette, 1994),implicate disablement as a major force underlying developmental change. Longitudinalobservations obtained over the life span can, for individuals who at some point becomedisabled, be indexed along a time-to/from-disability time axis that serves as a time-varyingproxy for the progression of secondary or disease/disability-related processes.
Tertiary aging processesNotions of terminal decline (Kleemeier, 1962) suggest that mortality-related processes mayrise to the forefront and drive the changes occurring during the last years of life (foroverviews, see Bäckman & MacDonald, 2006; Berg, 1996). Longitudinal observations are,in this case, indexed along a time-to-death time axis that serves as a time-varying proxy fortertiary aging processes.
Between-person: Time as a Resource/BurdenAt the cross-sectional, between-person level time can be considered as proxy for individualresources or burdens (cf. Heirich, 1964). The general idea is that time is a fixed-sumresource that has been accumulated and/or spent. As with other types of resources (e.g.,income), individuals differ in the amount of time-related resources they have available.Working now at the between-person level, time is considered as a fixed, trait-like, time-invariant, individual characteristic. For example, consider how individuals might becompared on accumulated age, or time-lived. Older individuals have more ‘time-lived’ thanyounger individuals. They have attained a greater amount of age-related resources (e.g. lifeexperiences), or age-related burdens (e.g. wear and tear on their joints). In a typicalexamination of cross-sectional age differences, time is invoked as an interindividualdifferences variable and regressed on between-person differences in a construct of interest,e.g., Yi = γ0 + γ1(agei) + ui. More generally, results from such models can be used to inferhow between-person differences in time, as a fixed-sum resource (or burden), are related tothe outcome measure (Heirich, 1964).
Multiple aspects of time-related resources/burdens can be obtained when considering thesequence of events an individual may encounter across his or her life span. In the context ofthe current example, events of interest include birth, disability onset, and death. Knowledge
Ram et al. Page 3
Res Hum Dev. Author manuscript; available in PMC 2012 October 28.
NIH
-PA Author Manuscript
NIH
-PA Author Manuscript
NIH
-PA Author Manuscript
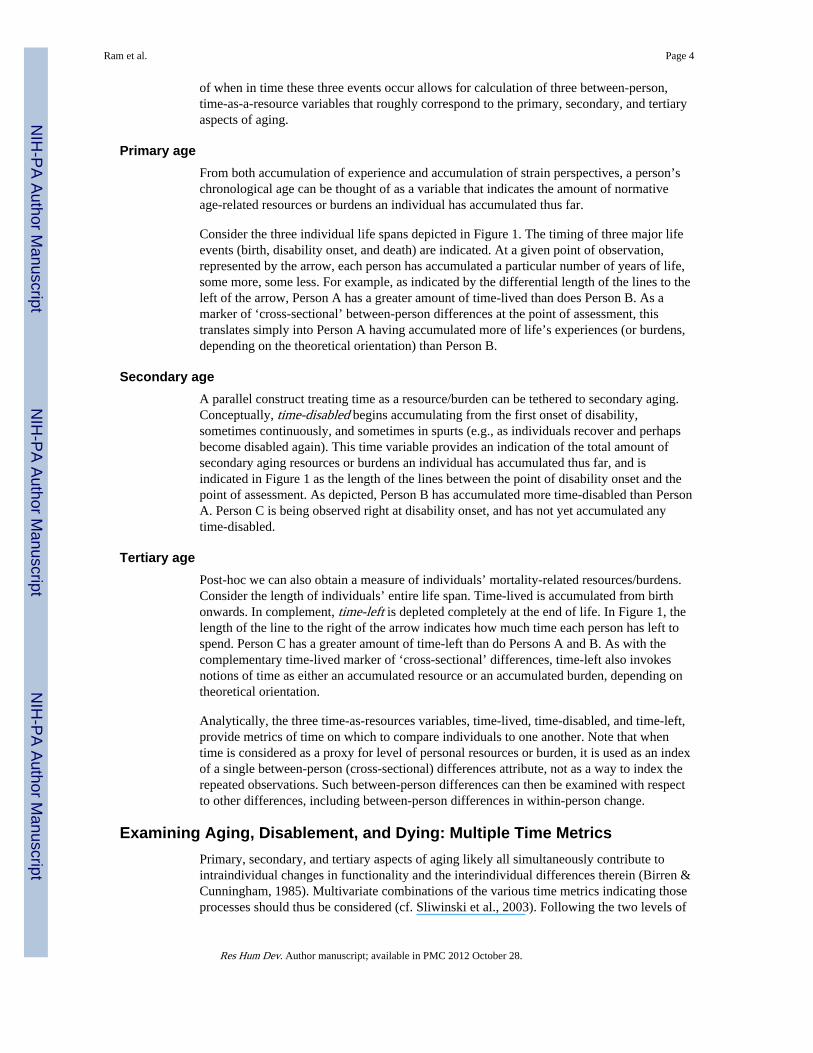
of when in time these three events occur allows for calculation of three between-person,time-as-a-resource variables that roughly correspond to the primary, secondary, and tertiaryaspects of aging.
Primary ageFrom both accumulation of experience and accumulation of strain perspectives, a person’schronological age can be thought of as a variable that indicates the amount of normativeage-related resources or burdens an individual has accumulated thus far.
Consider the three individual life spans depicted in Figure 1. The timing of three major lifeevents (birth, disability onset, and death) are indicated. At a given point of observation,represented by the arrow, each person has accumulated a particular number of years of life,some more, some less. For example, as indicated by the differential length of the lines to theleft of the arrow, Person A has a greater amount of time-lived than does Person B. As amarker of ‘cross-sectional’ between-person differences at the point of assessment, thistranslates simply into Person A having accumulated more of life’s experiences (or burdens,depending on the theoretical orientation) than Person B.
Secondary ageA parallel construct treating time as a resource/burden can be tethered to secondary aging.Conceptually, time-disabled begins accumulating from the first onset of disability,sometimes continuously, and sometimes in spurts (e.g., as individuals recover and perhapsbecome disabled again). This time variable provides an indication of the total amount ofsecondary aging resources or burdens an individual has accumulated thus far, and isindicated in Figure 1 as the length of the lines between the point of disability onset and thepoint of assessment. As depicted, Person B has accumulated more time-disabled than PersonA. Person C is being observed right at disability onset, and has not yet accumulated anytime-disabled.
Tertiary agePost-hoc we can also obtain a measure of individuals’ mortality-related resources/burdens.Consider the length of individuals’ entire life span. Time-lived is accumulated from birthonwards. In complement, time-left is depleted completely at the end of life. In Figure 1, thelength of the line to the right of the arrow indicates how much time each person has left tospend. Person C has a greater amount of time-left than do Persons A and B. As with thecomplementary time-lived marker of ‘cross-sectional’ differences, time-left also invokesnotions of time as either an accumulated resource or an accumulated burden, depending ontheoretical orientation.
Analytically, the three time-as-resources variables, time-lived, time-disabled, and time-left,provide metrics of time on which to compare individuals to one another. Note that whentime is considered as a proxy for level of personal resources or burden, it is used as an indexof a single between-person (cross-sectional) differences attribute, not as a way to index therepeated observations. Such between-person differences can then be examined with respectto other differences, including between-person differences in within-person change.
Examining Aging, Disablement, and Dying: Multiple Time MetricsPrimary, secondary, and tertiary aspects of aging likely all simultaneously contribute tointraindividual changes in functionality and the interindividual differences therein (Birren &Cunningham, 1985). Multivariate combinations of the various time metrics indicating thoseprocesses should thus be considered (cf. Sliwinski et al., 2003). Following the two levels of
Ram et al. Page 4
Res Hum Dev. Author manuscript; available in PMC 2012 October 28.
NIH
-PA Author Manuscript
NIH
-PA Author Manuscript
NIH
-PA Author Manuscript

the growth curve model, one can first determine which of the time-as-process metrics, andthe different sets of processes they represent, provides the most efficient description ofobserved within-person changes in the outcome of interest. Second, the time-as-resources/burdens measures can be incorporated as predictors of between-person differences inchange. Methodologically, this allows for integrating process (within-person) and resource(between-person) time metrics within a single growth curve model. Conceptually, itprovides a description of how primary, secondary, and tertiary aging together contribute tolate-life changes.
MethodsTo examine how late-life changes might be organized with respect to aging, disablement,and dying (and the various time metrics used to represent those processes and burdens), wemake use of data on cognitive (memory) performance obtained in two Swedishmultidisciplinary population-based studies of aging: 123 randomly-selected twins fromelderly twin pairs in the OCTO-TWIN study (Origins of Variance in the Old-old:Octogenarian Twins; McClearn et al., 1997) and 242 elderly individuals from the OCTOstudy (Aging and Development in the Oldest Old: Octogenarians; Johansson & Zarit, 1995).Detailed overviews of data collection procedures and specific measures used here can befound in the above references. In short, the studies span five waves of longitudinal datacollected at approximately two-year intervals from participants aged 79 to 98 years. Wemake use of data collected from a total of 365 participants who (a) were disabled at one ormore occasions, and (b) have since died. Select details relevant to the example are presentedbelow.
Outcome Measure: Memory RecallFor the current illustration, we use a memory recall test where participants were asked tomemorize a 10-item word list and recall those same items 30 minutes later. At their firstassessment, the 365 individuals’ scores ranged from 0 to 10 (M = 4.26, SD = 3.23).
Within-person: Time as ProcessAge—Chronological age is recorded at each observation point as the number of years sincean individual’s birth. At the time of the first observation, participants (N = 365) werebetween 79 and 91 years (M = 86.07 years, SD = 2.82) of age.
Time-to/from-Disability—Disability was assessed using standard measures of basicpersonal activities of daily living (PADL; Katz et al., 1963). Individuals indicated on a 4-point scale ranging from 0 = “completely independent” to 3 = “unable to do the activity atall” their ability to bathe, dress, toilet, and feed oneself (for reliabilities, see Zarit et al.,1993, 1995). We define the onset of disability as the date of the first interview at which itwas reported that an individual could not perform one or more PADL tasks independently(i.e, any response > 0; see Guralnik et al., 2002; Seeman et al., 1996). Number of years toand from this point of onset serves as a time-to/from-disability time metric. While birth dateand death date are specific and known anchors of the other two time metrics, assessing theonset of disability is less precise. Individuals may have become disabled at any time duringthe interval between assessments (or prior to entry to the study).
Time-to-death—Mortality status and date of death for deceased participants were obtainedfrom public death records. On average, individuals’ deaths occurred 4.78 years (SD = 3.63;range: 0–15 years) after their initial assessment and 1.42 years (SD = 1.99; range: 0–10years) after the last assessment in which they took part.
Ram et al. Page 5
Res Hum Dev. Author manuscript; available in PMC 2012 October 28.
NIH
-PA Author Manuscript
NIH
-PA Author Manuscript
NIH
-PA Author Manuscript
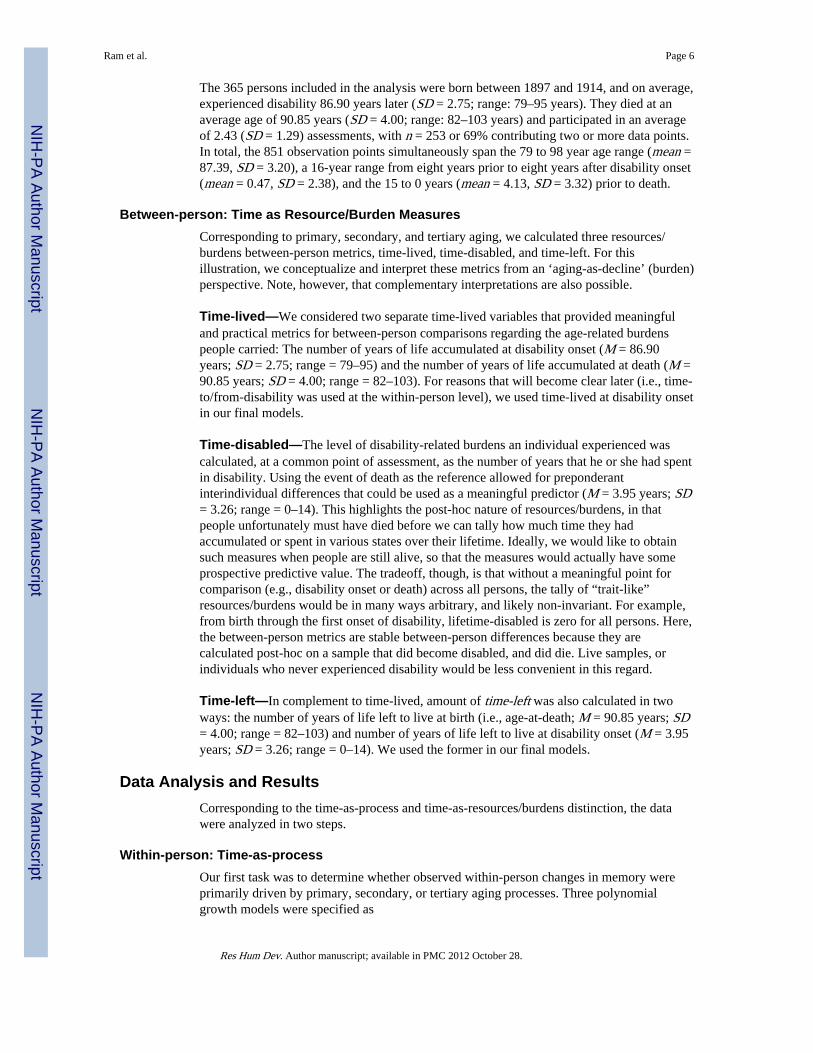
The 365 persons included in the analysis were born between 1897 and 1914, and on average,experienced disability 86.90 years later (SD = 2.75; range: 79–95 years). They died at anaverage age of 90.85 years (SD = 4.00; range: 82–103 years) and participated in an averageof 2.43 (SD = 1.29) assessments, with n = 253 or 69% contributing two or more data points.In total, the 851 observation points simultaneously span the 79 to 98 year age range (mean =87.39, SD = 3.20), a 16-year range from eight years prior to eight years after disability onset(mean = 0.47, SD = 2.38), and the 15 to 0 years (mean = 4.13, SD = 3.32) prior to death.
Between-person: Time as Resource/Burden MeasuresCorresponding to primary, secondary, and tertiary aging, we calculated three resources/burdens between-person metrics, time-lived, time-disabled, and time-left. For thisillustration, we conceptualize and interpret these metrics from an ‘aging-as-decline’ (burden)perspective. Note, however, that complementary interpretations are also possible.
Time-lived—We considered two separate time-lived variables that provided meaningfuland practical metrics for between-person comparisons regarding the age-related burdenspeople carried: The number of years of life accumulated at disability onset (M = 86.90years; SD = 2.75; range = 79–95) and the number of years of life accumulated at death (M =90.85 years; SD = 4.00; range = 82–103). For reasons that will become clear later (i.e., time-to/from-disability was used at the within-person level), we used time-lived at disability onsetin our final models.
Time-disabled—The level of disability-related burdens an individual experienced wascalculated, at a common point of assessment, as the number of years that he or she had spentin disability. Using the event of death as the reference allowed for preponderantinterindividual differences that could be used as a meaningful predictor (M = 3.95 years; SD= 3.26; range = 0–14). This highlights the post-hoc nature of resources/burdens, in thatpeople unfortunately must have died before we can tally how much time they hadaccumulated or spent in various states over their lifetime. Ideally, we would like to obtainsuch measures when people are still alive, so that the measures would actually have someprospective predictive value. The tradeoff, though, is that without a meaningful point forcomparison (e.g., disability onset or death) across all persons, the tally of “trait-like”resources/burdens would be in many ways arbitrary, and likely non-invariant. For example,from birth through the first onset of disability, lifetime-disabled is zero for all persons. Here,the between-person metrics are stable between-person differences because they arecalculated post-hoc on a sample that did become disabled, and did die. Live samples, orindividuals who never experienced disability would be less convenient in this regard.
Time-left—In complement to time-lived, amount of time-left was also calculated in twoways: the number of years of life left to live at birth (i.e., age-at-death; M = 90.85 years; SD= 4.00; range = 82–103) and number of years of life left to live at disability onset (M = 3.95years; SD = 3.26; range = 0–14). We used the former in our final models.
Data Analysis and ResultsCorresponding to the time-as-process and time-as-resources/burdens distinction, the datawere analyzed in two steps.
Within-person: Time-as-processOur first task was to determine whether observed within-person changes in memory wereprimarily driven by primary, secondary, or tertiary aging processes. Three polynomialgrowth models were specified as
Ram et al. Page 6
Res Hum Dev. Author manuscript; available in PMC 2012 October 28.
NIH
-PA Author Manuscript
NIH
-PA Author Manuscript
NIH
-PA Author Manuscript
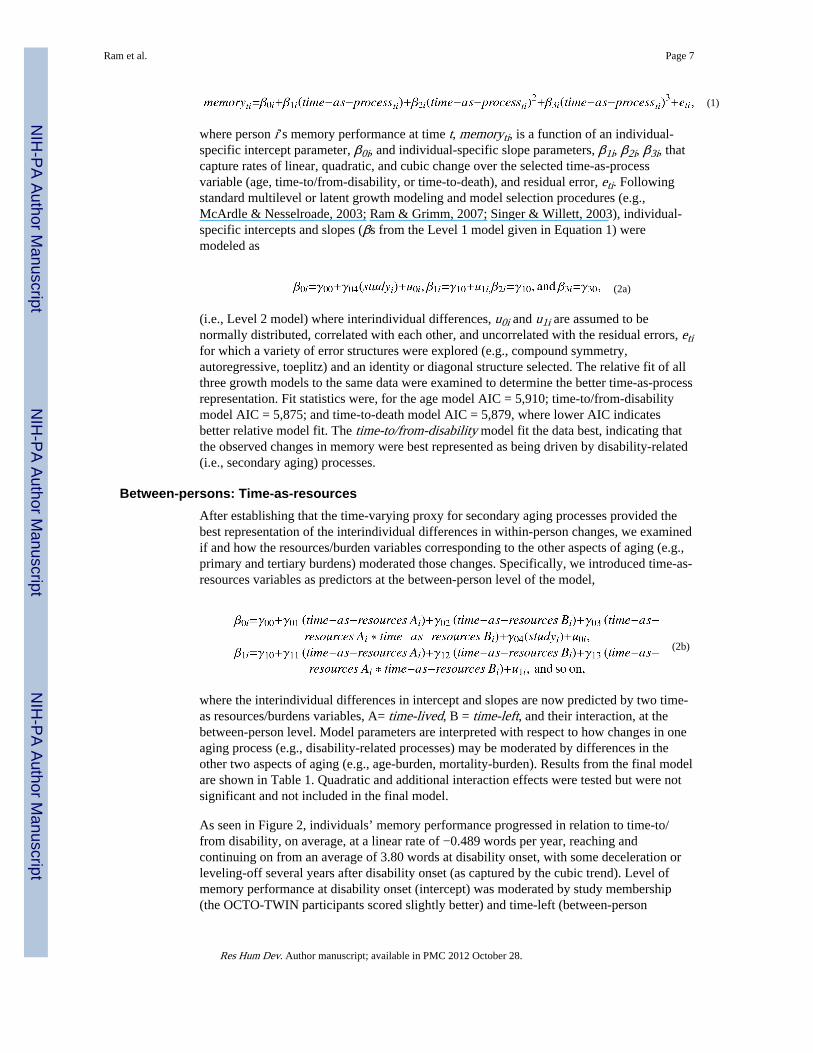
(1)
where person i’s memory performance at time t, memoryti, is a function of an individual-specific intercept parameter, β0i, and individual-specific slope parameters, β1i, β2i, β3i, thatcapture rates of linear, quadratic, and cubic change over the selected time-as-processvariable (age, time-to/from-disability, or time-to-death), and residual error, eti. Followingstandard multilevel or latent growth modeling and model selection procedures (e.g.,McArdle & Nesselroade, 2003; Ram & Grimm, 2007; Singer & Willett, 2003), individual-specific intercepts and slopes (βs from the Level 1 model given in Equation 1) weremodeled as
(2a)
(i.e., Level 2 model) where interindividual differences, u0i and u1i are assumed to benormally distributed, correlated with each other, and uncorrelated with the residual errors, etifor which a variety of error structures were explored (e.g., compound symmetry,autoregressive, toeplitz) and an identity or diagonal structure selected. The relative fit of allthree growth models to the same data were examined to determine the better time-as-processrepresentation. Fit statistics were, for the age model AIC = 5,910; time-to/from-disabilitymodel AIC = 5,875; and time-to-death model AIC = 5,879, where lower AIC indicatesbetter relative model fit. The time-to/from-disability model fit the data best, indicating thatthe observed changes in memory were best represented as being driven by disability-related(i.e., secondary aging) processes.
Between-persons: Time-as-resourcesAfter establishing that the time-varying proxy for secondary aging processes provided thebest representation of the interindividual differences in within-person changes, we examinedif and how the resources/burden variables corresponding to the other aspects of aging (e.g.,primary and tertiary burdens) moderated those changes. Specifically, we introduced time-as-resources variables as predictors at the between-person level of the model,
(2b)
where the interindividual differences in intercept and slopes are now predicted by two time-as resources/burdens variables, A= time-lived, B = time-left, and their interaction, at thebetween-person level. Model parameters are interpreted with respect to how changes in oneaging process (e.g., disability-related processes) may be moderated by differences in theother two aspects of aging (e.g., age-burden, mortality-burden). Results from the final modelare shown in Table 1. Quadratic and additional interaction effects were tested but were notsignificant and not included in the final model.
As seen in Figure 2, individuals’ memory performance progressed in relation to time-to/from disability, on average, at a linear rate of −0.489 words per year, reaching andcontinuing on from an average of 3.80 words at disability onset, with some deceleration orleveling-off several years after disability onset (as captured by the cubic trend). Level ofmemory performance at disability onset (intercept) was moderated by study membership(the OCTO-TWIN participants scored slightly better) and time-left (between-person
Ram et al. Page 7
Res Hum Dev. Author manuscript; available in PMC 2012 October 28.
NIH
-PA Author Manuscript
NIH
-PA Author Manuscript
NIH
-PA Author Manuscript
measure of tertiary age). In particular, greater time-left (i.e., greater resources) at disabilityonset was associated with higher levels of memory performance, γ02 = +0.178. In addition,interindividual differences in disability-related change were moderated by level of tertiaryaging resources, in that greater amount of time-left was significantly associated with less-steep linear declines in memory performance, γ12 = +0.031. No other interactions weresignificantly different than zero. The general interpretation is that, in this sample, secondaryand tertiary aging both play a role in how between-person differences in within-personchanges in memory performance manifest in late-life, whereas the role of primary aging israther minor.
DiscussionOne of the key objectives developmental researchers face is to describe development interms of intraindividual changes across time (Baltes & Nesselroade, 1979; Wohlwill, 1973).Chronological age, as an easily measured proxy for a set of unobserved age-relatedprocesses, has been and is used as the chief variable on which to index these changes.Employing age as a continuous predictor, growth models and similar techniques are oftenused to describe how individuals’ behavior changes over time. Considering multiple proxiesfor unobserved aging processes, we found that chronological age may not always be the bestindex on which to track developmental change. Instead, the changes in memory observed inour sample were described by a model where the progression of secondary aging processeswas moderated by tertiary age burdens. While many people assume late-life changes aredriven by aging processes, these results provide further empirical evidence implicatingdisablement (e.g., Comijs et al., 2005; Lucas, 2007) and mortality (Backman & MacDonald,2006; Diehr, et al., 2002; Gerstorf, Ram, et al. 2008; Johansson et al., 2004; Sliwinski et al.,2006; Thorvaldsson, et al., 2006; Wilson et al., 2003) as major forces underlying cognitivedevelopment in late life.
Beyond the substantive implications of our findings, the motivation for this article was toexplore how multiple aspects of aging, or more generally, time can be incorporated withinthe growth curve modeling framework. Parsing the model into its component parts, weillustrated how three time variables could be incorporated simultaneously. Brought in at thewithin-person, longitudinal level, time-varying indices such as age, time-to/from-disability,and time-to-death serve to organize repeated measurements and can be used to extractsystematic patterns of change that proceed in conjunction with the passage of time –intraindividual change. The time-varying variables serve as easy-to-measure latentindicators of the conglomerate of causes of change – as proxy for process. Brought in at thebetween-person, cross-sectional level, time-lived, time-disabled, and time-left can all beused, at a meaningful point of observation, to index interindividual differences in theaccumulation of experience. The variables are treated as inherent characteristics of theperson and their life span – as proxy for time-related resources or burdens that wereaccumulated or spent (Heirich, 1964).
The time variables, both process and resource/burden versions, invoked in this illustrationall make use of calendar time. That is, all are indexed and scaled in years (e.g., years frombirth, years in disability, etc.). However, this is only one of many units that may be used toquantify time (see also Schaie, 1986). Other possibilities include social time, psychologicaltime, subjective time, biological time, and so on (Baars & Visser, 2007; Birren &Cunningham, 1985; Sorokin & Merton, 1937; Settersten & Mayer, 1997; Wohlwill, 1973).For example, rather than using the number of years lived as a proxy for accumulatedexperience, neurobiological or cultural-social ‘clocks’ could be used to measure change and/or time-related resources (cf. Featherman & Petersen, 1986; Li & Schmiedek, 2002; e.g.,burden of disability on a biological or functional metric rather than calendar metric). Given
Ram et al. Page 8
Res Hum Dev. Author manuscript; available in PMC 2012 October 28.
NIH
-PA Author Manuscript
NIH
-PA Author Manuscript
NIH
-PA Author Manuscript

the generality of the growth curve modeling framework, in that statistical models acceptwithout prejudice variables of many shapes and sizes, all such possibilities can and shouldbe explored.
Even before some of us were born, Schaie (1965) proposed a theoretical framework fordisentangling multiple aspects of time, age (A), cohort (C), and period (T) – the generaldevelopmental model. Sequential study designs provided some hope for unconfounding age,cohort, and time-of-measurement (period) variance. Insights obtained in the subsequentyears have provided further understanding of when and how these components ofdevelopmental change can be estimated. For example, Schaie (1986) discussed the role ofcohort as a selection or between-person variable – individuals’ membership or non-membership in a cohort does not change over time. As such cohort can be used as apredictor of between-person differences in age-related change. Although still requiring afully elaborated connection to A, C, T concepts, we attempt to draw a parallel to the currenteffort to distinguish primary, secondary, and tertiary aspects of aging. Following a few yearsafter Schaie’s discussion, we distinguish how process and resources aspects of time can beinvoked as within-person or between-person variables within the growth curve model.Although the specific variables and modeling framework are different, the general form ofthe possibilities and constraints is the same. Process and resources/burdens-based proxies forprimary, secondary and tertiary aging are not replacements for A, C, and T. They simplyprovide a different, substantively based decomposition of the within- and between-personvariance present in longitudinal panel data – a decomposition that is subject to many of thesame convergence assumptions, internal validity threats (e.g., practice effects and theirinteractions with time-left), multicollinearity problems, and resulting difficulties inaccurately separating the independent effects of each type of time (Hertzog & Nesselroade,2003). As do A, C, and T, the process- and resources/burdens-based time variables discussedhere provide a general framework that can inform longitudinal study designs, particularlywith respect to how event-based (birth, disability, death, etc.) sampling can be used toexplicate and disentangle multiple aspects of ageing. As we explore further how time,statistical models, and study designs can be integrated efficiently and effectively, we lookforward to obtaining a fuller description of the many factors that contribute todevelopmental change. Many thanks to KWS for laying the footprints for us to follow.
AcknowledgmentsThe authors gratefully acknowledge grant funds provided by the Center for Population Health and Aging at PennState University (NIH/NIA Grant R03 AG028471-01) to combine the datasets, The European Union projectcontract no. QLK6-CT-2001-02283 and the Research Board in the County Council of Jönköping, and the ResearchCouncil in the Southeast of Sweden for their funding of the OCTO study, NIA grant AG-08861 for the funding ofthe OCTO-Twin study.
The authors would also like to extend their gratitude to Stig Berg, who was an instrumental leader in the collectionof the Swedish datasets, and who’s research career contributed significantly to the current study. Special thanks alsoto Gerald McClearn from Penn State University, Boo Johansson from the University of Göteborg, and the researchteams at the Institute for Gerontology in the College of Health Sciences at Jönköping University in Sweden, theCenter for Developmental and Health Genetics at the Pennsylvania State University, and the Division of GeneticEpidemiology at the Karolinska Institute in Stockholm, Sweden for their design and collection of the original data.
ReferencesAlwin, DF.; Hofer, SM.; McCammon, RJ. Modeling the effects of time: Integrating demographic and
developmental perspectives. In: Binstock, RH.; George, LK., editors. Handbook of aging and thesocial sciences. 6. New York, NY: Elsevier; 2006. p. 20-38.
Austad, SN. Concepts and theories of aging. In: Masoro, EJ.; Austad, SN., editors. Handbook of thebiology of aging. 5. New York: Academic Press; 2001. p. 3-22.
Ram et al. Page 9
Res Hum Dev. Author manuscript; available in PMC 2012 October 28.
NIH
-PA Author Manuscript
NIH
-PA Author Manuscript
NIH
-PA Author Manuscript
Baars, J.; Visser, H., editors. Aging and time: Multidisciplinary perspectives. Amityville, NY:Baywood Publishing; 2007.
Bäckman L, MacDonald SWS. Death and cognition: Synthesis and outlook. European Psychologist.2006; 11:224–235.
Baltes, PB.; Nesselroade, JR. History and rationale of longitudinal research. In: Nesselroade, JR.;Baltes, PB., editors. Longitudinal research in the study of behavior and development. New York,NY: Academic Press; 1979. p. 1-39.
Berg, S. Aging, behavior, and terminal decline. In: Birren, JE.; Schaie, KW., editors. Handbook of thepsychology of aging. 4. San Diego, CA: Academic Press; 1996. p. 323-337.
Birren, JE.; Cunningham, WR. Research on the psychology of aging: Principles, concepts and theory.In: Birren, JE.; Schaie, KW., editors. Handbook of the psychology of aging. 2. New York, NY: VanNostrand Reinhold; 1985. p. 3-34.
Busse, EW. Theories of aging. In: Busse, EW.; Pfeiffer, E., editors. Behavior and adaptation in latelife. Boston, MA: Little & Brown; 1969.
Comijs HC, Dik MG, Aartsen MJ. The impact of change in cognitive functioning and cognitivedecline on disability, well-being, and the use of healthcare services in older persons: Results of theLongitudinal Aging Study Amsterdam. Dementia and Geriatric Cognitive Disorders. 2005; 19:316–323. [PubMed: 15785032]
Diehr P, Williamson J, Burke GL, Psaty BM. The aging and dying processes and the health of olderadults. Journal of Clinical Epidemiology. 2002; 55:269–278. [PubMed: 11864798]
Featherman DL, Petersen T. Markers of aging: Modeling the clocks that time us. Research on Aging.1986; 8:339–365. [PubMed: 3332403]
Gerstorf D, Ram N, Estabrook R, Schupp J, Wagner GG, Lindenberger U. Life satisfaction showsterminal decline in old age: Longitudinal evidence from the German Socio-Economic Panel Study(SOEP). Developmental Psychology. 2008a; 44:1148–1159. [PubMed: 18605841]
Guralnik JM, Alecxih L, Branch LG, Wiener JM. Medical and long-term care cost when older personsbecome more dependent. American Journal of Public Health. 2002; 92:1244–1245. [PubMed:12144976]
Heirich M. The use of time in the study of social change. American Sociological Review. 1964;29:386–397.
Hertzog C, Nesselroade JR. Assessing psychological change in adulthood: An overview ofmethodological issues. Psychology and Aging. 2003; 18:639–657. [PubMed: 14692854]
Johansson B, Hofer SM, Allaire JC, Maldonado-Molina M, Piccinin AM, Berg S, et al. Change inmemory and cognitive functioning in the oldest-old: The effects of proximity to death ingenetically related individuals over a six-year period. Psychology and Aging. 2004; 19:145–156.[PubMed: 15065938]
Johansson B, Zarit SH. Prevalence and incidence of dementia in the oldest-old: A longitudinal study ofa population-based sample of 84–90-year-olds in Sweden. International Journal of GeriatricPsychiatry. 1995; 10:359–366.
Katz S, Ford AB, Moskowitz RW, Jackson BA, Jaffe MW. Studies of illness and the aged. The indexof ADL: A standardized measure of biological and psychosocial function. Journal of the AmericanMedical Association. 1963; 185:914–923. [PubMed: 14044222]
Kleemeier RW. Intellectual change in the senium. Proceedings of the Social Statistics Section of theAmerican Statistical Association. 1962; 1:290–295.
Li S, Schmiedek F. Age is not necessarily aging: Another step towards understanding the ‘clocks’ thattime aging. Gerontology. 2002; 48:5–12. [PubMed: 11844923]
Lucas RE. Long-term disability is associated with lasting changes in subjective well-being: Evidencefrom two nationally representative Longitudinal Studies. Journal of Personality and SocialPsychology. 2007; 92:717–730. [PubMed: 17469954]
McArdle, JJ.; Nesselroade, JR. Growth curve analysis in contemporary psychological research. In:Schinka, JA.; Velicer, WF., editors. Handbook of psychology: Research methods in psychology.Vol. 2. Hoboken, NJ: Wiley; 2003. p. 447-480.
Ram et al. Page 10
Res Hum Dev. Author manuscript; available in PMC 2012 October 28.
NIH
-PA Author Manuscript
NIH
-PA Author Manuscript
NIH
-PA Author Manuscript

McClearn G, Johansson B, Berg S, Ahern F, Nesselroade J, Pedersen N, Petrill S, Plomin R.Substantial genetic influence on cognitive abilities in twins 80+ years old. Science. 1997;276:1560–1563. [PubMed: 9171059]
Ram N, Grimm KJ. Using simple and complex growth models to articulate developmental change:Matching theory to method. International Journal of Behavioral Development. 2007; 31:303–316.
Schaie KW. A general model for the study of developmental problems. Psychological Bulletin. 1965;64:91–107.
Schaie KW. Beyond calendar definitions of age, time and cohort: The general developmental modelrevisited. Developmental Review. 1986; 6:252–277.
Schaie, KW.; Hofer, SM. Longitudinal studies in aging research. In: Birren, JE.; Schaie, KW., editors.Handbook of the psychology of aging. 5. San Diego, CA: Academic Press; 2001. p. 53-77.
Schroots, JJF.; Birren, JE. Concepts of time and aging in science. In: Birren, JE.; Schaie, KW., editors.Handbook of the psychology of aging. 3. San Diego, CA: Academic Press; 1990. p. 45-64.
Seeman TE, Bruce ML, McAvay GJ. Social network characteristics and onset of ADL disability:MacArthur studies of successful aging. Journals of Gerontology: Series B: Psychological Sciencesand Social Sciences. 1996; 51B(4):S191–S200.
Settersten RA, Mayer KU. The measurement of age, age structuring, and the life course. AnnualReview of Sociology. 1997; 23:233–261.
Singer, JD.; Willett, JB. Applied longitudinal data analysis: Modeling change and event occurrence.New York, NY: Oxford University Press; 2003.
Sliwinski MJ, Hofer SM, Hall C, Buschke H, Lipton RB. Modeling memory decline in older adults:The importance of preclinical dementia, attrition, and chronological age. Psychology and Aging.2003; 18:658–671. [PubMed: 14692855]
Sliwinski MJ, Stawski RS, Hall RB, Katz M, Verghese J, Lipton RB. On the importance ofdistinguishing pre-terminal and terminal cognitive decline. European Psychologist. 2006; 11:172–181.
Sorokin PA, Merton RK. Social time: A methodological and functional analysis. American Journal ofSociology. 1937; 5:615–629.
Thorvaldsson V, Hofer SM, Johansson B. Ageing and late life terminal decline: A comparison ofalternative modeling approaches. European Psychologist. 2006; 11:196–203.
Verbrugge LM, Jette AM. The disablement process. Social Science and Medicine. 1994; 38:1–14.[PubMed: 8146699]
Wilson RS, Beckett LA, Bienias JL, Evans DA, Bennett DA. Terminal decline in cognitive function.Neurology. 2003; 60:1782–1787. [PubMed: 12796531]
Wohlwill, JF. The study of behavioral development. Oxford, UK: Academic Press; 1973.
Zarit SH, Johansson B, Berg S. Functional impairment and co-disability in the oldest old: Amultidimensional approach. Journal of Aging and Health. 1993; 5:291–305.
Zarit SH, Johansson B, Malmberg B. Changes in functional competency in the oldest-old: Alongitudinal study. Journal of Aging and Health. 1995; 7:3–23. [PubMed: 10172778]
Ram et al. Page 11
Res Hum Dev. Author manuscript; available in PMC 2012 October 28.
NIH
-PA Author Manuscript
NIH
-PA Author Manuscript
NIH
-PA Author Manuscript

Figure 1.Three persons’ life spans with between-person similarities and differences in the timing ofthree major life events (birth, disability onset, and death). At a given point of observation,indicated by the arrow, each person has accumulated a particular number of years of life(time-lived), years of life lived with disability (time-disabled), and has a particular numberof years of life before death (time-left).
Ram et al. Page 12
Res Hum Dev. Author manuscript; available in PMC 2012 October 28.
NIH
-PA Author Manuscript
NIH
-PA Author Manuscript
NIH
-PA Author Manuscript

Figure 2.Time-left (tertiary age) moderates the amount of decline in memory recall performance overtime-to/from-disability (secondary aging). Participants who were closer to death at the onsetof disability (i.e., those with fewer resources; −1 SD time-left) showed steeper disability-related memory decline than participants who were further away from death at the onset ofdisability (i.e., those with greater resources; +1 SD time-left).
Ram et al. Page 13
Res Hum Dev. Author manuscript; available in PMC 2012 October 28.
NIH
-PA Author Manuscript
NIH
-PA Author Manuscript
NIH
-PA Author Manuscript

NIH
-PA Author Manuscript
NIH
-PA Author Manuscript
NIH
-PA Author Manuscript
Ram et al. Page 14
Table 1
Polynomial Growth Models for Memory over Time-to/From-Disability.
Parameter
Memory Recall
Estimate SE
Fixed effects
Intercepta, γ00 3.801 * (0.190)
Time-to/from-disability, γ10 − 0.489 * (0.051)
Time-to/from-disability3, γ20 − 0.004 * (0.001)
Study membershipb 0.898 * (0.317)
Time-lived, γ01 − 0.032 (0.057)
Time-left, γ02 0.178 * (0.046)
Time-lived x time-left, γ03 − 0.006 (0.017)
Time-lived x time-to/from-disability, γ11 − 0.024 (0.013)
Time-left x time-to/from-disability, γ12 0.031 * (0.012)
Time-lived x time-left x time-to/from-disability, γ13 0.002 (0.004)
Random effects
Intercept, σ2u0 6.128 * (0.588)
Time-to/from-disability, σ2u0 0.049 * (0.027)
Cov. Intercept with time-to/from-disability, σu0u1 0.288 * (0.100)
Residual, σ2e1 3.341 * (0.408)
Residual, σ2e2 1.728 * (0.294)
Residual, σ2e3 1.660 * (0.328)
Residual, σ2e4 3.077 * (0.740)
Residual, σ2e5 2.749 * (1.400)
−2LL 3,878
AIC 3,914
Note. Unstandardized estimates and standard errors are presented.
a= Intercept is centered at point of disability onset, t = 0;
b= OCTO = 0, OCTO-TWIN = 1; Time-lived = age at disability onset; Time-left = years between disability onset and death. N = 365 who provided
851 observations. AIC = Akaike Information Criterion; −2LL = −2 Log Likelihood, relative model fit statistics. Cov. = Covariance.
*= p < .05.
Res Hum Dev. Author manuscript; available in PMC 2012 October 28.