Agent-Based Electricity Balancing with Distributed Energy Resources, A Multiperspective Case Study
10
Agent-based Electricity Balancing with Distributed Energy Resources, A Multiperspective Case Study [Submitted (June 15, 2007) to HICSS 2008 - Track on Electric Power Systems Restructuring] Koen Kok §‡ , Zs´ ofia Derzsi § , Jaap Gordijn § , Maarten Hommelberg ‡ , Cor Warmer ‡ , Ren´ e Kamphuis ‡ , Hans Akkermans § , § Free University, Faculty of Exact Sciences - Business Informatics De Boelelaan 1083a, 1081 HV Amsterdam, The Netherlands Email: {koenkok, gordijn, derszi, hansa}@few.vu.nl ‡ Energy research Centre of the Netherlands (ECN) - Intelligent Energy Networks P.O. Box 1, 1755 ZG Petten, The Netherlands. Email: {j.kok, hommelberg, warmer, kamphuis}@ecn.nl Abstract— Distributed generation (DG) of electricity is pro- viding an increasing part of the worldwide electricity supply. At the same time, there is a big potential of demand response resources. When — in a geographical area or in the contract portfolio of an energy trader — the number of these Distributed Energy Resources (DER) increases, clustered control of DER by common ICT (information and communication technology) systems can add value. Due to the fine-grained and distributed nature of DER, the design of such a system needs to meet heavy requirements, e.g. regarding scalability and openness. Further, these systems need to balance multiple stakes in a multi- actor environment. Multiagent systems, especially those based on electronic markets have been identified as key technologies in this respect. This paper presents a multiperspective case study of the design, implementation and performance of such a system for the business case of imbalance reduction in commercial clusters of DER. The benefits of this approach are shown by field experimental results of a real-life DER cluster with an imbalance characteristic dominated by wind electricity production. The approach resulted in substantial imbalance reductions. Further, a thorough analysis of the networked business constellation is given, together with an indication how business modelling techniques can be used to asses the financial feasibility of the business idea. I. I NTRODUCTION Distributed generation (DG) of electricity is providing an increasing part of the worldwide electricity supply. DG con- sists of different sources of electric power connected to the distribution network or to a customer site. This approach is distinct from the traditional central-plant model for electricity generation and delivery. Examples of DG are photovoltaic solar systems, small and medium-scale wind turbine farms, and the combined generation of heat and power (CHP). When the share of DG increases in a geographical area or in the contract portfolio of an energy trader, clustered control of DG by common ICT (information and communication technology) systems can add value [1]. The value drivers originate either in the energy markets —as clustered control of DG increases market power— or in network operations —as active network management increases infrastructure efficiency. Clustering of DG in itself has positive effects, as it partially smoothes the individual stochastic behaviour of most types of DG. Actively utilizing the flexibility in the electricity production of the cluster allows for profile shaping of the aggregated power output. In the latter case the aggregation can be operated as a virtual power plant (VPP), i.e. a system that is operated similar to a ‘normal’ electrical power plant, but consists of a high number of small and medium-sized units interconnected by an ICT-system. Another development is the increasing utilization of demand response resources (DRR): those electricity consuming instal- lations that can alter their operations in (near) real time in respond to signals from the energy markets or electricity net- work operators. From the viewpoint of controllability, DG and DRR are equivalent: increasing production has the same effect on the supply and demand balance as decreasing consumption, and vice versa. Hence, the treatment of demand response as a resource. Accordingly, DRR-units can be incorporated in virtual power plants as well. Because of the common nature of DG and DRR we use the overarching term Distributed Energy Resources (DER) in the remainder of this text. Due to the fine-grained and distributed nature of DER, the design and implementation of a common ICT system for coordination is not trivial. Specific information system requirements include [2], [3]: • The information system architecture must be well scal- able. The number of components actively involved in the coordination can grow huge quite easily and they may well be spread over a vast area. Centralized control of such a complex system may reach the limits of scalability and communication overhead rapidly. • The information system architecture must be open: indi- vidual DER units can connect and disconnect at will and future types of DER —with own and specific operational characteristics— need to be able to connect without
Transcript of Agent-Based Electricity Balancing with Distributed Energy Resources, A Multiperspective Case Study
Agent-based Electricity Balancing withDistributed Energy Resources,A Multiperspective Case Study
[Submitted (June 15, 2007) to HICSS 2008 - Track on Electric Power Systems Restructuring]
Koen Kok§‡, Zsofia Derzsi§, Jaap Gordijn§,Maarten Hommelberg‡, Cor Warmer‡, Rene Kamphuis‡, Hans Akkermans§,
§Free University, Faculty of Exact Sciences - Business InformaticsDe Boelelaan 1083a, 1081 HV Amsterdam, The Netherlands
Email: {koenkok, gordijn, derszi, hansa}@few.vu.nl‡Energy research Centre of the Netherlands (ECN) - Intelligent Energy Networks
P.O. Box 1, 1755 ZG Petten, The Netherlands.Email: {j.kok, hommelberg, warmer, kamphuis}@ecn.nl
Abstract— Distributed generation (DG) of electricity is pro-viding an increasing part of the worldwide electricity supply.At the same time, there is a big potential of demand responseresources. When — in a geographical area or in the contractportfolio of an energy trader — the number of these DistributedEnergy Resources (DER) increases, clustered control of DERby common ICT (information and communication technology)systems can add value. Due to the fine-grained and distributednature of DER, the design of such a system needs to meetheavy requirements, e.g. regarding scalability and openness.Further, these systems need to balance multiple stakes in a multi-actor environment. Multiagent systems, especially those based onelectronic markets have been identified as key technologies in thisrespect. This paper presents a multiperspective case study ofthe design, implementation and performance of such a systemfor the business case of imbalance reduction in commercialclusters of DER. The benefits of this approach are shown by fieldexperimental results of a real-life DER cluster with an imbalancecharacteristic dominated by wind electricity production. Theapproach resulted in substantial imbalance reductions. Further, athorough analysis of the networked business constellation is given,together with an indication how business modelling techniquescan be used to asses the financial feasibility of the business idea.
I. I NTRODUCTION
Distributed generation (DG) of electricity is providing anincreasing part of the worldwide electricity supply. DG con-sists of different sources of electric power connected to thedistribution network or to a customer site. This approach isdistinct from the traditional central-plant model for electricitygeneration and delivery. Examples of DG are photovoltaicsolar systems, small and medium-scale wind turbine farms,and the combined generation of heat and power (CHP). Whenthe share of DG increases in a geographical area or in thecontract portfolio of an energy trader, clustered control of DGby common ICT (information and communication technology)systems can add value [1]. The value drivers originate eitherin the energy markets —as clustered control of DG increasesmarket power— or in network operations —as active network
management increases infrastructure efficiency. Clustering ofDG in itself has positive effects, as it partially smoothes theindividual stochastic behaviour of most types of DG. Activelyutilizing the flexibility in the electricity production of thecluster allows for profile shaping of the aggregated poweroutput. In the latter case the aggregation can be operated asa virtual power plant (VPP), i.e. a system that is operatedsimilar to a ‘normal’ electrical power plant, but consists of ahigh number of small and medium-sized units interconnectedby an ICT-system.
Another development is the increasing utilization ofdemandresponse resources(DRR): those electricity consuming instal-lations that can alter their operations in (near) real time inrespond to signals from the energy markets or electricity net-work operators. From the viewpoint of controllability, DG andDRR are equivalent: increasing production has the same effecton the supply and demand balance as decreasing consumption,and vice versa. Hence, the treatment of demand response asa resource. Accordingly, DRR-units can be incorporated invirtual power plants as well. Because of the common nature ofDG and DRR we use the overarching termDistributed EnergyResources(DER) in the remainder of this text.
Due to the fine-grained and distributed nature of DER,the design and implementation of a common ICT systemfor coordination is not trivial. Specific information systemrequirements include [2], [3]:• The information system architecture must be well scal-
able. The number of components actively involved in thecoordination can grow huge quite easily and they maywell be spread over a vast area. Centralized control ofsuch a complex system may reach the limits of scalabilityand communication overhead rapidly.
• The information system architecture must be open: indi-vidual DER units can connect and disconnect at will andfuture types of DER —with own and specific operationalcharacteristics— need to be able to connect without
changing the implementation of the system as a whole.Therefore, communication between system parts must beuniform and stripped from all information specific to thelocal situation.
• The information system must facilitate a multi-actorinteraction and balance the stakes on the global level(i.e. the aggregated behaviour: reaction to energy marketsituation and/or network operator needs) and on the locallevel (i.e. DER operational goals).
• In most cases, different system parts are owned or op-erated by different legal persons, so the coordinationmechanism must be suitable to work over boundaries ofownership. Accordingly, the power to take decisions onlocal issues must stay with each individual local actor.
Different authors identified Multiagent Systems (MAS) asa suitable design paradigm for Distributed Energy Manage-ment: [4], [5], [6], [7], [2], of which the latter three propose theuse ofelectronic equilibrium marketsas the core coordinationmechanism.
Electronic markets provide a framework for distributeddecision making among different actors in computational mul-tiagent systems based on microeconomics. Microeconomics isa branch of economics that studies how economic agents (i.e.individuals, households, and firms) make decisions to allocatelimited resources, typically in markets where goods or servicesare being bought and sold. One of the goals of microeconomicsis to analyze market mechanisms that establish relative pricesamongst goods and services and allocation of limited resourcesamongst many alternative uses [8]. Whereas economists usemicroeconomic theory to model phenomena observed in thereal world, computer scientists use the theory to let distributedsoftware systems behave in a desired way. Market-basedcomputing is becoming a central paradigm in the design ofdistributed systems that need to act in complex environments.Market mechanisms provide a way to incentivize parties (inthis case software agents), that you don’t necessary control,to behave in a certain way [9], [10]. A microeconomic theorycommonly used in MAS is that of general equilibrium. Ingeneral equilibrium markets, or exchange markets, all agentsrespond to the same price, that is determined by searching forthe price that balances all demand and supply in the system.From a computational point of view, electronic equilibriummarkets are distributed search algorithms aimed at finding thebest trade-offs in a multidimensional search space defined bythe preferences of all agents participating in the market [11],[12]. The market outcome isParetooptimal, a social optimaloutcome for which no other outcome exists that makes oneagent better-off while making other agents worse-off.
In Market-based Control, agents in a MAS are competingfor resources on a equilibrium market whilst performing alocal control task (e.g. classical feedback control of a physicalprocess) that needs the resource as an input. For this type ofMAS, it has been shown by formal proof that the market-based solution is identical to that of a centralized omniscientoptimizer [13]. From the viewpoint of scalability and opennessof the information architecture, this is an important feature. In
the centralized optimization all relevant information (i.e. localstate histories, local control characteristics and objectives)need to be known at the central level in order to optimizeover all local and global control goals. While in the market-based optimization the same optimal solution is found bycommunicating uniform market information (i.e. market bidsstating volume-price relations), running an electronic equilib-rium market and communicating the resulting market priceback to the local control agents.
This paper presents a multi-perspective case study ofmarket-based control for coordination of clusters of DER. Therationale behind the business idea roots in energy wholesalemarkets that use the mechanism ofBalancing Responsibilityto charge for used reserve capacity for frequency regulation.The business idea relies heavily on ICT and implements anet-worked business constellation. We study the case from a tech-nological perspective as well as from a business perspective.We show how market-based control can be used for imbalancereduction in clusters of DER via aDistributed BalancingService(DBS). We show how the DBS is implemented in afield experiment. The experimental results give an indication ofthe benefits of DBS in terms of reduced imbalance in a real-lifeDER cluster whose imbalance characteristic is dominated bywind electricity production. Further, we analyze the networkedbusiness constellation and indicate how business modellingtechniques can be used to asses the financial feasibility of thebusiness idea.
In section II the principles behind market-based control arediscussed in somewhat greater depth and thePowerMatcher,an implemented market-based control system dedicated fordistributed energy management, is introduced briefly. Afterthat, (section III) the business idea explored in the case studyis presented together with the value driver behind the idea.Section IV focusses on the technology by describing the fieldtest implementation of DBS. Further, that section describes themain results and insights from the field experiment. After that,in section V, we give the business perspective of the system,presenting a business model that describes the extensive valuenetwork enabled by the DBS information system. Finally, insection VI we present the lessons learned and conclusions.
II. M ARKET-BASED CONTROL IN ELECTRICITY
A. Market-based Control
The type of market-based control used in this document isprice-based, where a price is used as the control signal (asopposed toutility based, where price is implicit). Whether —in a specific application — the price has a monetary value oris virtual and solely used as a control signal depends on theparticular implementation and on the business case behind theapplication.
In a typical application of market-based coordination, thereare several entities producing and/or consuming a certaincommodity or good1. Each of these entities is represented by
1Or a series of commodities. Here we treat the single-commodity case forsimplicity
0 20 40 60 80 100 120 140 160 180 200−100
−50
0
50
100
Age
nt D
eman
d(A) Demand Functions Individual Agents
d1(p)
d2(p)
d3(p)
d4(p)
0 20 40 60 80 100 120 140 160 180 200−200
−100
0
100
200(B) Aggregate Demand and Equilibrium Price
Tot
al D
eman
d
Commodity Price
p* = 92.7
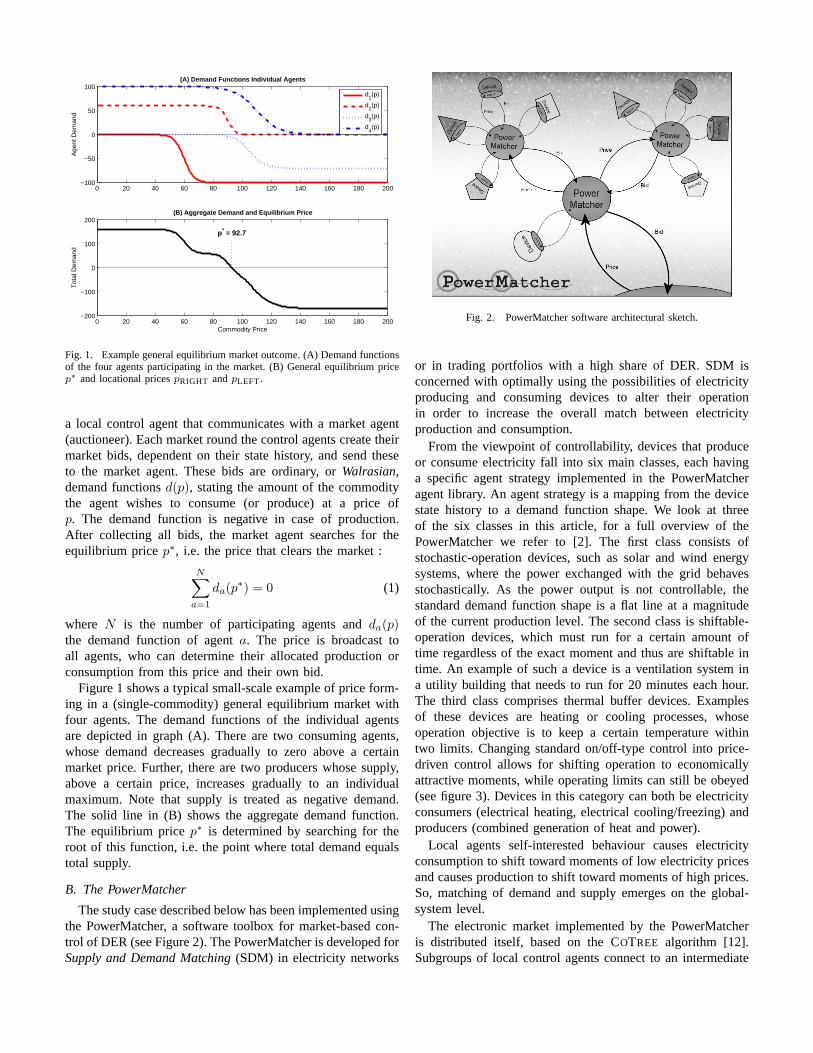
Fig. 1. Example general equilibrium market outcome. (A) Demand functionsof the four agents participating in the market. (B) General equilibrium pricep∗ and locational pricespRIGHT andpLEFT.
a local control agent that communicates with a market agent(auctioneer). Each market round the control agents create theirmarket bids, dependent on their state history, and send theseto the market agent. These bids are ordinary, orWalrasian,demand functionsd(p), stating the amount of the commoditythe agent wishes to consume (or produce) at a price ofp. The demand function is negative in case of production.After collecting all bids, the market agent searches for theequilibrium pricep∗, i.e. the price that clears the market :
N∑a=1
da(p∗) = 0 (1)
where N is the number of participating agents andda(p)the demand function of agenta. The price is broadcast toall agents, who can determine their allocated production orconsumption from this price and their own bid.
Figure 1 shows a typical small-scale example of price form-ing in a (single-commodity) general equilibrium market withfour agents. The demand functions of the individual agentsare depicted in graph (A). There are two consuming agents,whose demand decreases gradually to zero above a certainmarket price. Further, there are two producers whose supply,above a certain price, increases gradually to an individualmaximum. Note that supply is treated as negative demand.The solid line in (B) shows the aggregate demand function.The equilibrium pricep∗ is determined by searching for theroot of this function, i.e. the point where total demand equalstotal supply.
B. The PowerMatcher
The study case described below has been implemented usingthe PowerMatcher, a software toolbox for market-based con-trol of DER (see Figure 2). The PowerMatcher is developed forSupply and Demand Matching(SDM) in electricity networks
Fig. 2. PowerMatcher software architectural sketch.
or in trading portfolios with a high share of DER. SDM isconcerned with optimally using the possibilities of electricityproducing and consuming devices to alter their operationin order to increase the overall match between electricityproduction and consumption.
From the viewpoint of controllability, devices that produceor consume electricity fall into six main classes, each havinga specific agent strategy implemented in the PowerMatcheragent library. An agent strategy is a mapping from the devicestate history to a demand function shape. We look at threeof the six classes in this article, for a full overview of thePowerMatcher we refer to [2]. The first class consists ofstochastic-operation devices, such as solar and wind energysystems, where the power exchanged with the grid behavesstochastically. As the power output is not controllable, thestandard demand function shape is a flat line at a magnitudeof the current production level. The second class is shiftable-operation devices, which must run for a certain amount oftime regardless of the exact moment and thus are shiftable intime. An example of such a device is a ventilation system ina utility building that needs to run for 20 minutes each hour.The third class comprises thermal buffer devices. Examplesof these devices are heating or cooling processes, whoseoperation objective is to keep a certain temperature withintwo limits. Changing standard on/off-type control into price-driven control allows for shifting operation to economicallyattractive moments, while operating limits can still be obeyed(see figure 3). Devices in this category can both be electricityconsumers (electrical heating, electrical cooling/freezing) andproducers (combined generation of heat and power).
Local agents self-interested behaviour causes electricityconsumption to shift toward moments of low electricity pricesand causes production to shift toward moments of high prices.So, matching of demand and supply emerges on the global-system level.
The electronic market implemented by the PowerMatcheris distributed itself, based on theCOTREE algorithm [12].Subgroups of local control agents connect to an intermediate

Fig. 3. Operation shifting in a cooling process whilst obeying process statelimits.
PowerMatcher agent that aggregates the bids (performing partof the demand-functions summation of market equation (1))and passes the result on. In this way, each non-leaf nodeaggregates the information passed by its entire sub-tree. Whenthe (binary) tree-structure overlaying the agent network iswell-balanced in its height, this results in a system that ishighly scalable with respect to the number of agents.
III. B USINESSVALUE DRIVER AND BUSINESSIDEA
A. Balancing Responsibility
As a result of deregulation of electricity markets, functionsof network management and electricity supply have beenunbundled and placed under separate legal entities in a numberof world regions. The parties active on the electricity wholesalemarket are free to buy from or sell to players of their choice.System operators carry out tasks of infrastructure operations.Here, we focus on the maintainer and operator of the high-voltage transmission network, referred to asTransmissionSystem Operator(TSO). One of its tasks is maintaining theinstantaneous demand and supply balance in the network. Inseveral regions (e.g. European countries, South Africa,...), asystem of balancing responsibility gives wholesale tradingparties incentives to maintain their own portfolio balance.Moreover, this system provides means to charge the costsmade by the TSO when maintaining the real-time system bal-ance to the parties responsible of the unbalance. This systemof balancing responsibility consists of three instruments:
• Balancing responsibility: the obligation of wholesalersto plan their production and consumption and to makethis plan available to the TSO. Parties having this respon-sibility are referred to asbalancing responsible parties(BRPs).
• Reserves for frequency response:the TSO contractsgeneration capacity for primary, secondary and emer-gency frequency-response reserve. Production sites of acertain capacity are obliged to make available a prede-fined portion of their capacity to the TSO, while othersare free to offer reserve capacity. This offer is done inthe form of a bid. In case of (smaller or bigger) system-wide imbalance, the TSO calls off the reserves available
in the order of their bid prices, in order to restore theinstantaneous system balance.
• Settlement of imbalance costs with the balancingresponsible parties:in a later stage, the TSO charges theactual costs for the used reserve and emergency capacityto those BRPs that had deviations from their energyprograms. These charges are referred to as imbalancecosts.
Among different countries or states where balancing re-sponsibility is being used, the implementation details andterminology may vary. A common key aspect is anotificationdone by the BRPs to the TSO stating their future productionor consumption. These notifications consist of one or moresettlement periods(each typically 15 or 30 minutes long) overwhich the BPR indicates his expected average power to beexchanged with the network. The notification has to reflectthe party’s position on the power markets, i.e. the net resultof all its trades on the different markets for each settlementperiod. The notification to the TSO can be done until thegateclosure time. After this time the BRP is not allowed to tradeany power with other market parties. Hence, the TSO gateclosure typically coincides with the closure of the day-aheador intra-day power exchange markets.
In real time, deviations between the planned electricityproduction and consumption at system-wide level becomevisible to the TSO through deviations in the voltage frequency(50 or 60 Hz). If the load increases and the generation stays,the frequency will decrease, whereas if the load decreases, thefrequency will increase fast. In real time, the TSO monitorsthe frequency, and maintains the real-time system balanceby adjusting generation up and down using the contracted“reserves” for frequency response. In this way, the TSOcompensates for those activities of BRPs that deviate fromtheir notification. Afterwards, the TSO compares the real,measured, energy profile of the full portfolio of each BRP,with its notification. For every settlement period, the costs forreserve and emergency capacity made by the TSO are spreadover all BRPs that caused imbalance in that particular period.
In the Netherlands, where the field test described below islocated, each settlement period is 15 minutes in length and thenotification consists of 96 of these periods, spanning a full day.The gate-closure time is at noon the day before, shortly afterthe day-ahead electricity wholesale market closes.
B. Portfolio Imbalance: Wind Energy
As may be clear, the system of balancing responsibilityimposes imbalance risks to market parties. Among BRPs, thisrisk will vary with the predictability of the total portfolio ofthe BRP. BRPs with low portfolio predictability are faced withhigher imbalance risks.
Typically, wind power is one type of DER that suffersfrom low predictability. This gives higher imbalance costsresulting in a lower market value for electricity producedby wind turbines. In general, any market disadvantage dueto high imbalance costs can be reduced by increasing ei-ther the predictability or the controllability. Using specialized
07−Mar−2006 08−Mar−2006 09−Mar−2006 10−Mar−2006 11−Mar−2006 12−Mar−20060
500
1000
1500
2000
2500
3000Typical Forecast and Realisation 2.5MW Windturbine
Date
Pow
er [k
W]
07−Mar−2006 08−Mar−2006 09−Mar−2006 10−Mar−2006 11−Mar−2006 12−Mar−2006−2000
−1000
0
1000
2000Imbalance
Date
Pow
er [k
W]
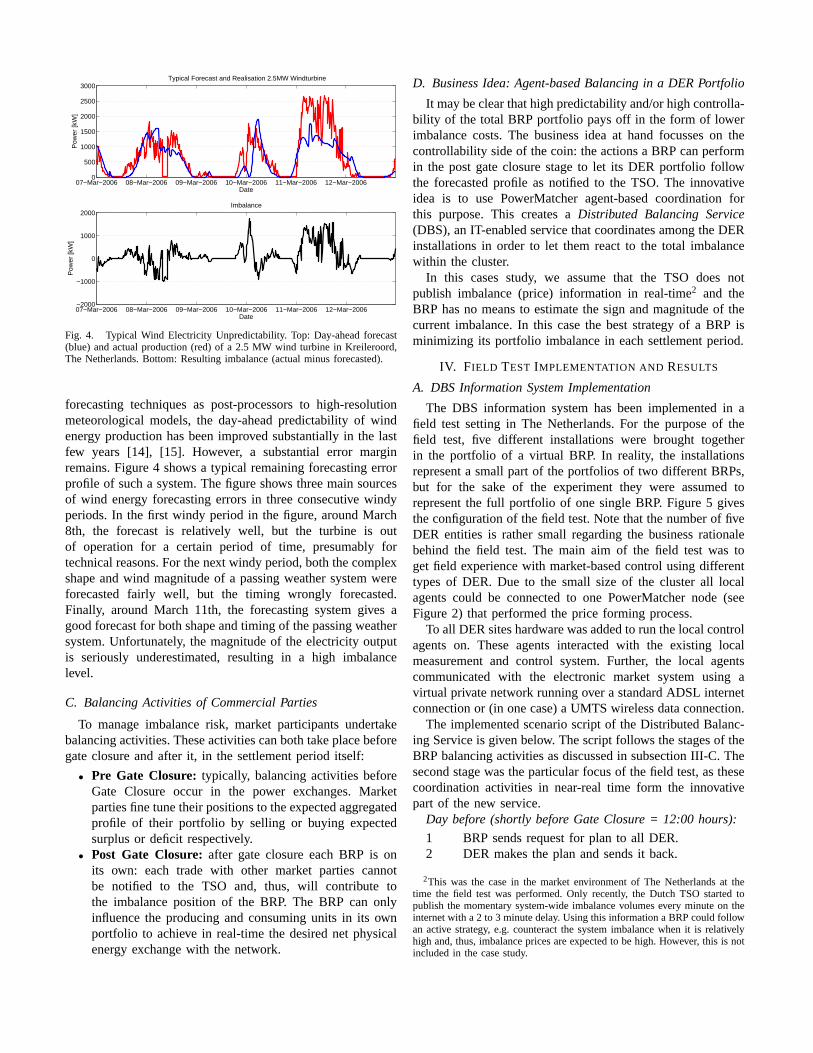
Fig. 4. Typical Wind Electricity Unpredictability. Top: Day-ahead forecast(blue) and actual production (red) of a 2.5 MW wind turbine in Kreileroord,The Netherlands. Bottom: Resulting imbalance (actual minus forecasted).
forecasting techniques as post-processors to high-resolutionmeteorological models, the day-ahead predictability of windenergy production has been improved substantially in the lastfew years [14], [15]. However, a substantial error marginremains. Figure 4 shows a typical remaining forecasting errorprofile of such a system. The figure shows three main sourcesof wind energy forecasting errors in three consecutive windyperiods. In the first windy period in the figure, around March8th, the forecast is relatively well, but the turbine is outof operation for a certain period of time, presumably fortechnical reasons. For the next windy period, both the complexshape and wind magnitude of a passing weather system wereforecasted fairly well, but the timing wrongly forecasted.Finally, around March 11th, the forecasting system gives agood forecast for both shape and timing of the passing weathersystem. Unfortunately, the magnitude of the electricity outputis seriously underestimated, resulting in a high imbalancelevel.
C. Balancing Activities of Commercial Parties
To manage imbalance risk, market participants undertakebalancing activities. These activities can both take place beforegate closure and after it, in the settlement period itself:
• Pre Gate Closure: typically, balancing activities beforeGate Closure occur in the power exchanges. Marketparties fine tune their positions to the expected aggregatedprofile of their portfolio by selling or buying expectedsurplus or deficit respectively.
• Post Gate Closure:after gate closure each BRP is onits own: each trade with other market parties cannotbe notified to the TSO and, thus, will contribute tothe imbalance position of the BRP. The BRP can onlyinfluence the producing and consuming units in its ownportfolio to achieve in real-time the desired net physicalenergy exchange with the network.
D. Business Idea: Agent-based Balancing in a DER Portfolio
It may be clear that high predictability and/or high controlla-bility of the total BRP portfolio pays off in the form of lowerimbalance costs. The business idea at hand focusses on thecontrollability side of the coin: the actions a BRP can performin the post gate closure stage to let its DER portfolio followthe forecasted profile as notified to the TSO. The innovativeidea is to use PowerMatcher agent-based coordination forthis purpose. This creates aDistributed Balancing Service(DBS), an IT-enabled service that coordinates among the DERinstallations in order to let them react to the total imbalancewithin the cluster.
In this cases study, we assume that the TSO does notpublish imbalance (price) information in real-time2 and theBRP has no means to estimate the sign and magnitude of thecurrent imbalance. In this case the best strategy of a BRP isminimizing its portfolio imbalance in each settlement period.
IV. F IELD TEST IMPLEMENTATION AND RESULTS
A. DBS Information System Implementation
The DBS information system has been implemented in afield test setting in The Netherlands. For the purpose of thefield test, five different installations were brought togetherin the portfolio of a virtual BRP. In reality, the installationsrepresent a small part of the portfolios of two different BRPs,but for the sake of the experiment they were assumed torepresent the full portfolio of one single BRP. Figure 5 givesthe configuration of the field test. Note that the number of fiveDER entities is rather small regarding the business rationalebehind the field test. The main aim of the field test was toget field experience with market-based control using differenttypes of DER. Due to the small size of the cluster all localagents could be connected to one PowerMatcher node (seeFigure 2) that performed the price forming process.
To all DER sites hardware was added to run the local controlagents on. These agents interacted with the existing localmeasurement and control system. Further, the local agentscommunicated with the electronic market system using avirtual private network running over a standard ADSL internetconnection or (in one case) a UMTS wireless data connection.
The implemented scenario script of the Distributed Balanc-ing Service is given below. The script follows the stages of theBRP balancing activities as discussed in subsection III-C. Thesecond stage was the particular focus of the field test, as thesecoordination activities in near-real time form the innovativepart of the new service.
Day before (shortly before Gate Closure = 12:00 hours):
1 BRP sends request for plan to all DER.2 DER makes the plan and sends it back.
2This was the case in the market environment of The Netherlands at thetime the field test was performed. Only recently, the Dutch TSO started topublish the momentary system-wide imbalance volumes every minute on theinternet with a 2 to 3 minute delay. Using this information a BRP could followan active strategy, e.g. counteract the system imbalance when it is relativelyhigh and, thus, imbalance prices are expected to be high. However, this is notincluded in the case study.
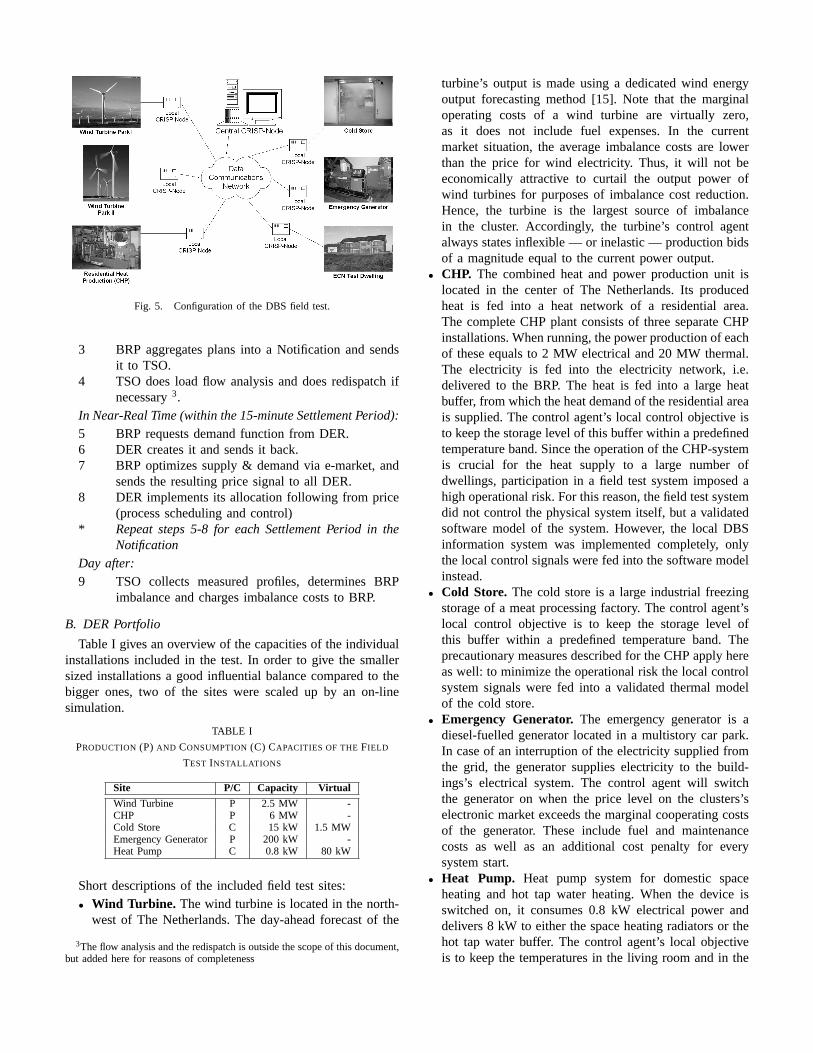
Fig. 5. Configuration of the DBS field test.
3 BRP aggregates plans into a Notification and sendsit to TSO.
4 TSO does load flow analysis and does redispatch ifnecessary3.
In Near-Real Time (within the 15-minute Settlement Period):
5 BRP requests demand function from DER.6 DER creates it and sends it back.7 BRP optimizes supply & demand via e-market, and
sends the resulting price signal to all DER.8 DER implements its allocation following from price
(process scheduling and control)* Repeat steps 5-8 for each Settlement Period in the
Notification
Day after:
9 TSO collects measured profiles, determines BRPimbalance and charges imbalance costs to BRP.
B. DER Portfolio
Table I gives an overview of the capacities of the individualinstallations included in the test. In order to give the smallersized installations a good influential balance compared to thebigger ones, two of the sites were scaled up by an on-linesimulation.
TABLE I
PRODUCTION (P) AND CONSUMPTION (C) CAPACITIES OF THEFIELD
TEST INSTALLATIONS
Site P/C Capacity Virtual
Wind Turbine P 2.5 MW -CHP P 6 MW -Cold Store C 15 kW 1.5 MWEmergency Generator P 200 kW -Heat Pump C 0.8 kW 80 kW
Short descriptions of the included field test sites:• Wind Turbine. The wind turbine is located in the north-
west of The Netherlands. The day-ahead forecast of the
3The flow analysis and the redispatch is outside the scope of this document,but added here for reasons of completeness
turbine’s output is made using a dedicated wind energyoutput forecasting method [15]. Note that the marginaloperating costs of a wind turbine are virtually zero,as it does not include fuel expenses. In the currentmarket situation, the average imbalance costs are lowerthan the price for wind electricity. Thus, it will not beeconomically attractive to curtail the output power ofwind turbines for purposes of imbalance cost reduction.Hence, the turbine is the largest source of imbalancein the cluster. Accordingly, the turbine’s control agentalways states inflexible — or inelastic — production bidsof a magnitude equal to the current power output.
• CHP. The combined heat and power production unit islocated in the center of The Netherlands. Its producedheat is fed into a heat network of a residential area.The complete CHP plant consists of three separate CHPinstallations. When running, the power production of eachof these equals to 2 MW electrical and 20 MW thermal.The electricity is fed into the electricity network, i.e.delivered to the BRP. The heat is fed into a large heatbuffer, from which the heat demand of the residential areais supplied. The control agent’s local control objective isto keep the storage level of this buffer within a predefinedtemperature band. Since the operation of the CHP-systemis crucial for the heat supply to a large number ofdwellings, participation in a field test system imposed ahigh operational risk. For this reason, the field test systemdid not control the physical system itself, but a validatedsoftware model of the system. However, the local DBSinformation system was implemented completely, onlythe local control signals were fed into the software modelinstead.
• Cold Store. The cold store is a large industrial freezingstorage of a meat processing factory. The control agent’slocal control objective is to keep the storage level ofthis buffer within a predefined temperature band. Theprecautionary measures described for the CHP apply hereas well: to minimize the operational risk the local controlsystem signals were fed into a validated thermal modelof the cold store.
• Emergency Generator. The emergency generator is adiesel-fuelled generator located in a multistory car park.In case of an interruption of the electricity supplied fromthe grid, the generator supplies electricity to the build-ings’s electrical system. The control agent will switchthe generator on when the price level on the clusters’selectronic market exceeds the marginal cooperating costsof the generator. These include fuel and maintenancecosts as well as an additional cost penalty for everysystem start.
• Heat Pump. Heat pump system for domestic spaceheating and hot tap water heating. When the device isswitched on, it consumes 0.8 kW electrical power anddelivers 8 kW to either the space heating radiators or thehot tap water buffer. The control agent’s local objectiveis to keep the temperatures in the living room and in the
03−Mar−2006 05−Mar−2006 07−Mar−2006 09−Mar−2006 11−Mar−2006 13−Mar−2006−2500
−2000
−1500
−1000
−500
0
500
1000
1500
2000
2500
Wind Imbalance (red) and Total Cluster Imbalance (blue)
Date
Pow
er [k
W]
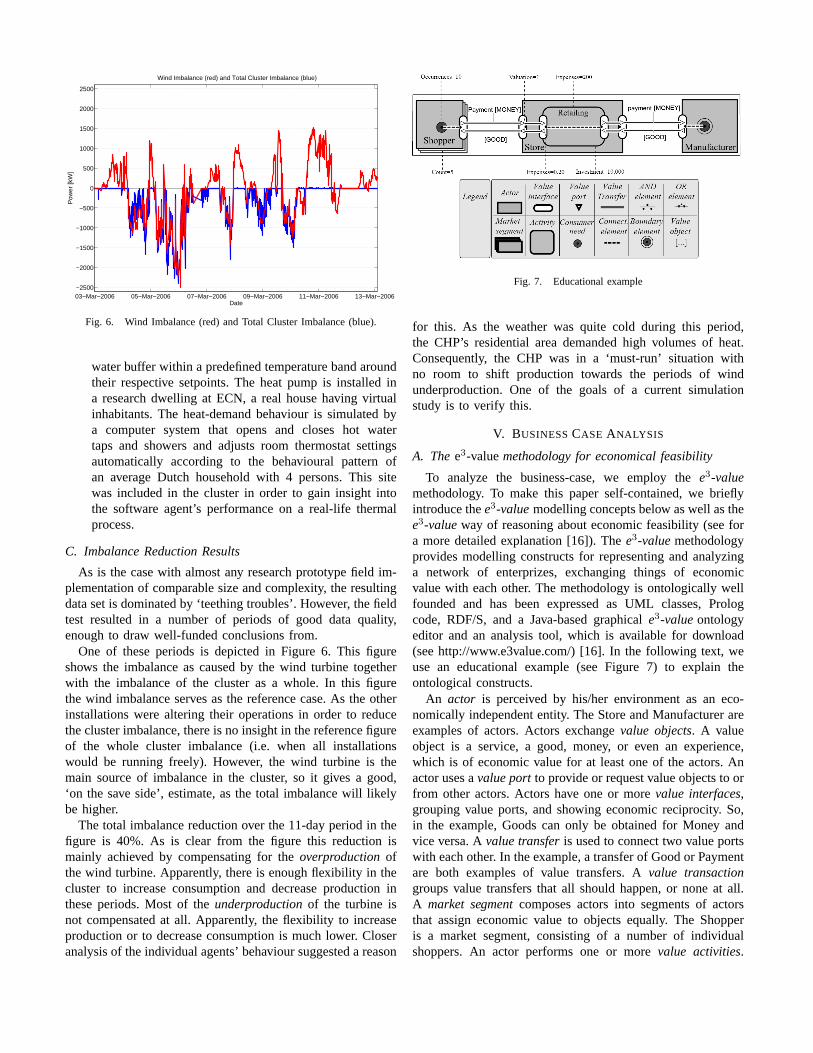
Fig. 6. Wind Imbalance (red) and Total Cluster Imbalance (blue).
water buffer within a predefined temperature band aroundtheir respective setpoints. The heat pump is installed ina research dwelling at ECN, a real house having virtualinhabitants. The heat-demand behaviour is simulated bya computer system that opens and closes hot watertaps and showers and adjusts room thermostat settingsautomatically according to the behavioural pattern ofan average Dutch household with 4 persons. This sitewas included in the cluster in order to gain insight intothe software agent’s performance on a real-life thermalprocess.
C. Imbalance Reduction Results
As is the case with almost any research prototype field im-plementation of comparable size and complexity, the resultingdata set is dominated by ‘teething troubles’. However, the fieldtest resulted in a number of periods of good data quality,enough to draw well-funded conclusions from.
One of these periods is depicted in Figure 6. This figureshows the imbalance as caused by the wind turbine togetherwith the imbalance of the cluster as a whole. In this figurethe wind imbalance serves as the reference case. As the otherinstallations were altering their operations in order to reducethe cluster imbalance, there is no insight in the reference figureof the whole cluster imbalance (i.e. when all installationswould be running freely). However, the wind turbine is themain source of imbalance in the cluster, so it gives a good,‘on the save side’, estimate, as the total imbalance will likelybe higher.
The total imbalance reduction over the 11-day period in thefigure is 40%. As is clear from the figure this reduction ismainly achieved by compensating for theoverproductionofthe wind turbine. Apparently, there is enough flexibility in thecluster to increase consumption and decrease production inthese periods. Most of theunderproductionof the turbine isnot compensated at all. Apparently, the flexibility to increaseproduction or to decrease consumption is much lower. Closeranalysis of the individual agents’ behaviour suggested a reason
Fig. 7. Educational example
for this. As the weather was quite cold during this period,the CHP’s residential area demanded high volumes of heat.Consequently, the CHP was in a ‘must-run’ situation withno room to shift production towards the periods of windunderproduction. One of the goals of a current simulationstudy is to verify this.
V. BUSINESSCASE ANALYSIS
A. Thee3-valuemethodology for economical feasibility
To analyze the business-case, we employ thee3-valuemethodology. To make this paper self-contained, we brieflyintroduce thee3-valuemodelling concepts below as well as thee3-valueway of reasoning about economic feasibility (see fora more detailed explanation [16]). Thee3-valuemethodologyprovides modelling constructs for representing and analyzinga network of enterprizes, exchanging things of economicvalue with each other. The methodology is ontologically wellfounded and has been expressed as UML classes, Prologcode, RDF/S, and a Java-based graphicale3-valueontologyeditor and an analysis tool, which is available for download(see http://www.e3value.com/) [16]. In the following text, weuse an educational example (see Figure 7) to explain theontological constructs.
An actor is perceived by his/her environment as an eco-nomically independent entity. The Store and Manufacturer areexamples of actors. Actors exchangevalue objects. A valueobject is a service, a good, money, or even an experience,which is of economic value for at least one of the actors. Anactor uses avalue portto provide or request value objects to orfrom other actors. Actors have one or morevalue interfaces,grouping value ports, and showing economic reciprocity. So,in the example, Goods can only be obtained for Money andvice versa. Avalue transferis used to connect two value portswith each other. In the example, a transfer of Good or Paymentare both examples of value transfers. Avalue transactiongroups value transfers that all should happen, or none at all.A market segmentcomposes actors into segments of actorsthat assign economic value to objects equally. The Shopperis a market segment, consisting of a number of individualshoppers. An actor performs one or morevalue activities.
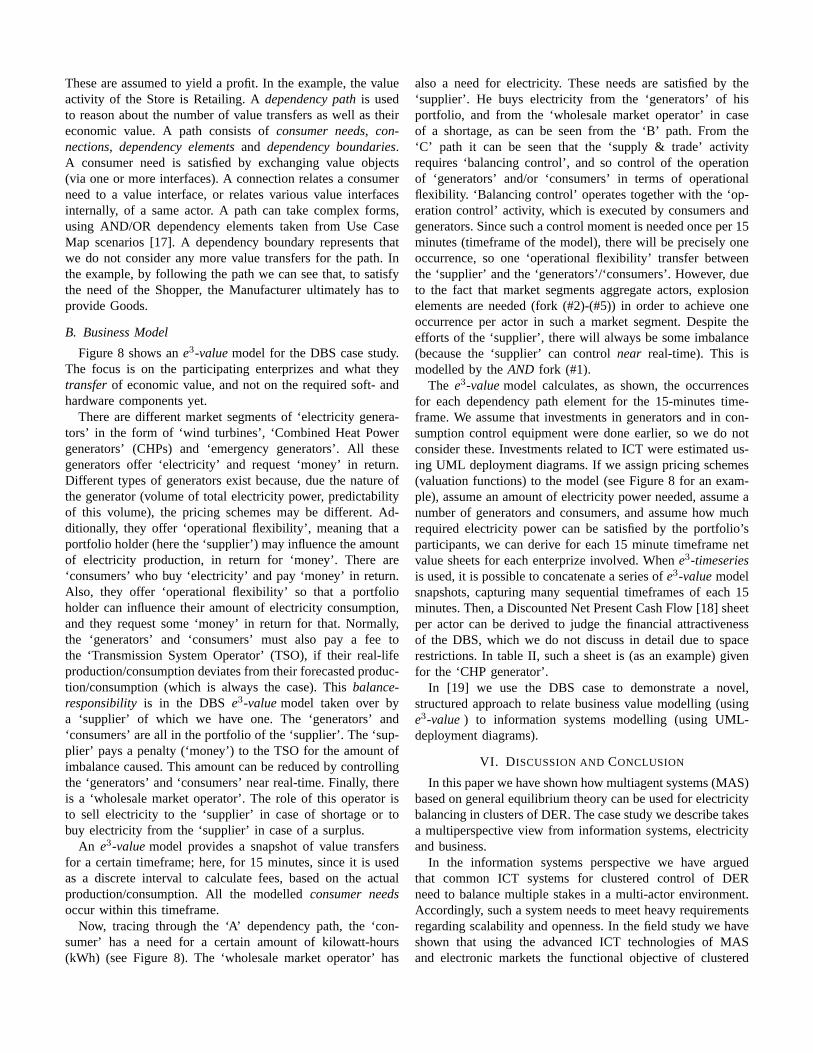
These are assumed to yield a profit. In the example, the valueactivity of the Store is Retailing. Adependency pathis usedto reason about the number of value transfers as well as theireconomic value. A path consists ofconsumer needs, con-nections, dependency elementsand dependency boundaries.A consumer need is satisfied by exchanging value objects(via one or more interfaces). A connection relates a consumerneed to a value interface, or relates various value interfacesinternally, of a same actor. A path can take complex forms,using AND/OR dependency elements taken from Use CaseMap scenarios [17]. A dependency boundary represents thatwe do not consider any more value transfers for the path. Inthe example, by following the path we can see that, to satisfythe need of the Shopper, the Manufacturer ultimately has toprovide Goods.
B. Business Model
Figure 8 shows ane3-valuemodel for the DBS case study.The focus is on the participating enterprizes and what theytransferof economic value, and not on the required soft- andhardware components yet.
There are different market segments of ‘electricity genera-tors’ in the form of ‘wind turbines’, ‘Combined Heat Powergenerators’ (CHPs) and ‘emergency generators’. All thesegenerators offer ‘electricity’ and request ‘money’ in return.Different types of generators exist because, due the nature ofthe generator (volume of total electricity power, predictabilityof this volume), the pricing schemes may be different. Ad-ditionally, they offer ‘operational flexibility’, meaning that aportfolio holder (here the ‘supplier’) may influence the amountof electricity production, in return for ‘money’. There are‘consumers’ who buy ‘electricity’ and pay ‘money’ in return.Also, they offer ‘operational flexibility’ so that a portfolioholder can influence their amount of electricity consumption,and they request some ‘money’ in return for that. Normally,the ‘generators’ and ‘consumers’ must also pay a fee tothe ‘Transmission System Operator’ (TSO), if their real-lifeproduction/consumption deviates from their forecasted produc-tion/consumption (which is always the case). Thisbalance-responsibility is in the DBS e3-valuemodel taken over bya ‘supplier’ of which we have one. The ‘generators’ and‘consumers’ are all in the portfolio of the ‘supplier’. The ‘sup-plier’ pays a penalty (‘money’) to the TSO for the amount ofimbalance caused. This amount can be reduced by controllingthe ‘generators’ and ‘consumers’ near real-time. Finally, thereis a ‘wholesale market operator’. The role of this operator isto sell electricity to the ‘supplier’ in case of shortage or tobuy electricity from the ‘supplier’ in case of a surplus.
An e3-valuemodel provides a snapshot of value transfersfor a certain timeframe; here, for 15 minutes, since it is usedas a discrete interval to calculate fees, based on the actualproduction/consumption. All the modelledconsumer needsoccur within this timeframe.
Now, tracing through the ‘A’ dependency path, the ‘con-sumer’ has a need for a certain amount of kilowatt-hours(kWh) (see Figure 8). The ‘wholesale market operator’ has
also a need for electricity. These needs are satisfied by the‘supplier’. He buys electricity from the ‘generators’ of hisportfolio, and from the ‘wholesale market operator’ in caseof a shortage, as can be seen from the ‘B’ path. From the‘C’ path it can be seen that the ‘supply & trade’ activityrequires ‘balancing control’, and so control of the operationof ‘generators’ and/or ‘consumers’ in terms of operationalflexibility. ‘Balancing control’ operates together with the ‘op-eration control’ activity, which is executed by consumers andgenerators. Since such a control moment is needed once per 15minutes (timeframe of the model), there will be precisely oneoccurrence, so one ‘operational flexibility’ transfer betweenthe ‘supplier’ and the ‘generators’/‘consumers’. However, dueto the fact that market segments aggregate actors, explosionelements are needed (fork (#2)-(#5)) in order to achieve oneoccurrence per actor in such a market segment. Despite theefforts of the ‘supplier’, there will always be some imbalance(because the ‘supplier’ can controlnear real-time). This ismodelled by theAND fork (#1).
The e3-valuemodel calculates, as shown, the occurrencesfor each dependency path element for the 15-minutes time-frame. We assume that investments in generators and in con-sumption control equipment were done earlier, so we do notconsider these. Investments related to ICT were estimated us-ing UML deployment diagrams. If we assign pricing schemes(valuation functions) to the model (see Figure 8 for an exam-ple), assume an amount of electricity power needed, assume anumber of generators and consumers, and assume how muchrequired electricity power can be satisfied by the portfolio’sparticipants, we can derive for each 15 minute timeframe netvalue sheets for each enterprize involved. Whene3-timeseriesis used, it is possible to concatenate a series ofe3-valuemodelsnapshots, capturing many sequential timeframes of each 15minutes. Then, a Discounted Net Present Cash Flow [18] sheetper actor can be derived to judge the financial attractivenessof the DBS, which we do not discuss in detail due to spacerestrictions. In table II, such a sheet is (as an example) givenfor the ‘CHP generator’.
In [19] we use the DBS case to demonstrate a novel,structured approach to relate business value modelling (usinge3-value) to information systems modelling (using UML-deployment diagrams).
VI. D ISCUSSION ANDCONCLUSION
In this paper we have shown how multiagent systems (MAS)based on general equilibrium theory can be used for electricitybalancing in clusters of DER. The case study we describe takesa multiperspective view from information systems, electricityand business.
In the information systems perspective we have arguedthat common ICT systems for clustered control of DERneed to balance multiple stakes in a multi-actor environment.Accordingly, such a system needs to meet heavy requirementsregarding scalability and openness. In the field study we haveshown that using the advanced ICT technologies of MASand electronic markets the functional objective of clustered
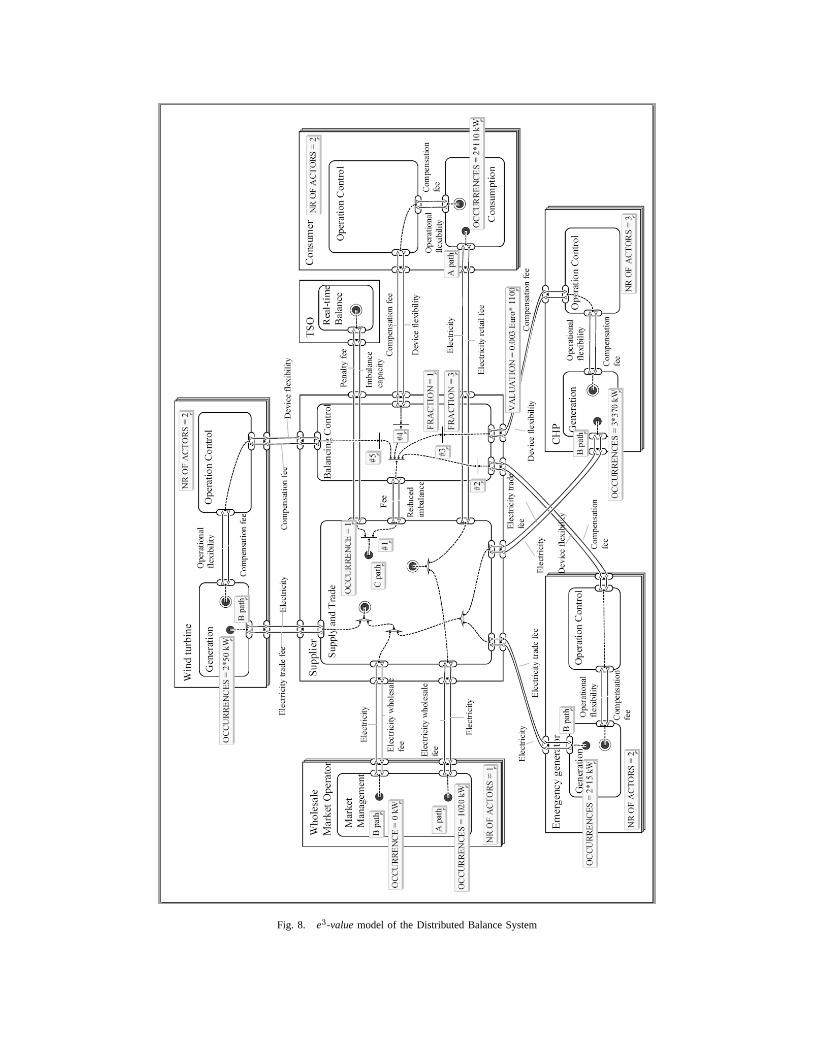
Fig. 8. e3-value model of the Distributed Balance System

TABLE II
NET VALUE FLOW SHEET FOR’OPERATION CONTROL’ ACTIVITY OF ONE
CHP
operation of DER can be realized. This system uses a simpleand uniform data interchange between actors based on marketinformation. Its information system architecture is tree shaped,where each non-leaf node aggregates the information passedby its entire sub-tree. These two features ensure an open andwell-scalable system.
As seen from the electricity perspective, the benefits shownin the field experiment are substantial. In the real-life DERportfolio with a wind power dominated imbalance character-istic, the imbalance reduction reached to 40%. This makes theapproach a good addition to the current options for dealingwith wind power unpredictability, like wind/diesel combina-tions and balancing by conventional power plants. Topics thatneed further research include the factors that influence theflexibility level of the aggregate and the system behaviourwhen the number of attached DER is increased substantially.
In the business perspective, we have shown that this ICT-enabled business case consists of a complex networked valueconstellation. Modelling techniques to discover all necessaryvalue transfers between different actors are indispensable toreason about the financial feasibility of the business idea.
ACKNOWLEDGMENTS
The authors wish to thank all people at ECN who helped inrealizing the distributed balancing field test within the CRISPproject.
This work has been partly sponsored by the EU-fundedprojects CRISP (NNE5-2001-00906) and FENIX (518272),the JACQUARD/NWO funded project VITAL (838.003.407),and the VUA funded project VUBIS.
REFERENCES
[1] International Energy Agency,Distributed Generation in LiberalisedElectricity Markets. Paris: International Energy Agency, 2002.
[2] K. Kok, C. Warmer, and R. Kamphuis, “PowerMatcher: multiagentcontrol in the electricity infrastructure,” inAAMAS ’05: Proceedings ofthe 4th int. joint conf. on Autonomous Agents and Multiagent Systems,vol. industry track. New York, NY, USA: ACM Press, 2005, pp. 75–82.
[3] ——, “The PowerMatcher: Multiagent control of electricity demand andsupply,” IEEE Intelligent Systems, vol. 21, no. 2, pp. 89–90, March/April2006, part of an overview of the 4 best industrial contributions toAAMAS05.
[4] R. Gustavsson, “Agents with power,”Communications of the ACM,vol. 42, no. 3, pp. 41–47, 1999.
[5] D. Cohen, “Using real–time web technology to manage DE networks,”in Proceedings of Distributed Power 2001. Intertech, 2001.
[6] F. Ygge and H. Akkermans, “Power load management as acomputational market,” inProceedings of the 1st Int. Conf. onMulti-Agent Systems, V. Lesser, Ed. MIT Press, 1996. [Online].Available: citeseer.ist.psu.edu/ygge96power.html
[7] P. Carlsson, “Algorithms for electronic power markets,” Ph.D. disserta-tion, Uppsala University, 2004.
[8] A. Mas-Colell, M. Whinston, and J. R. Green,Microeconomic Theory.Oxford University Press, 1995.
[9] R. K. Dash, D. C. Parkes, and N. R. Jennings, “Computational mecha-nism design: A call to arms,”IEEE Intelligent Systems, vol. 18, no. 6,pp. 40–47, November/December 2003.
[10] T. W. Sandholm, “Distributed rational decision making,” inMultiagentSystems: A Modern Approach to Distributed Artificial Intelligence,G. Weiss, Ed. Cambridge, MA, USA: The MIT Press, 1999, pp. 201–258. [Online]. Available: citeseer.ist.psu.edu/sandholm99distributed.html
[11] M. P. Wellman, “A market-oriented programming environment and itsapplication to distributed multicommodity flow problems,”Journal ofArtificial Intelligence Research, vol. 1, pp. 1–23, 1993.
[12] F. Ygge and H. Akkermans, “Resource-oriented multicommodity marketalgorithms,”Autonomous Agents and Multi-Agent Systems, vol. 3, no. 1,pp. 53–71, 2000, special Issue Best Papers of ICMAS–98.
[13] H. Akkermans, J. Schreinemakers, and K. Kok, “Microeconomic dis-tributed control: Theory and application of multi-agent electronic mar-kets,” in Proceedings of CRIS 2004 - 2nd International Conference onCritical Infrastructures, 2004.
[14] B. Ernst, “Wind power forecast for the german and danish networks,”in Wind Power in Power Systems, T. Ackermann, Ed. John Wiley andSons Ltd, Januari 2005.
[15] A. Brand and J. Kok, “Forecasting wind power by a quarter of thehour,” in Proceedings of the 2003 European Wind Energy Conference.Brussels, Belgium: EWEA, 2003.
[16] J. M. A. J. Gordijn, “Value based requirements engineering: Explor-ing innovative e-commerce ideas,”Requirements Engineering Journal,vol. 8, no. 2, pp. 114–134, 2003.
[17] R. J. A. Buhr, “Use case maps as architectural entities for complexsystems,”IEEE Transactions on Software Engineering, vol. 24, no. 12,pp. 1131–1155, 1998.
[18] R. Brealey, S. Myers, and F. Allen,Corporate Finance. McGraw HillHigher Education, 2005.
[19] Z. Derzsi, J. Gordijn, K. Kok, H. Akkermans, and Y.-H. Tan, “Assessingfeasibility of IT-enabled networked value constellations: A case studyin the electricity sector,” inProceedings of CAISE 2007, 2007.