AGENDA - Dallas Police and Fire Pension
343
1 of 5 AGENDA Date: April 8, 2016 The regular meeting of the Dallas Police and Fire Pension System Board of Trustees will be held at 8:30 a.m. on Thursday, April 14, 2016, in the Second Floor Board Room at 4100 Harry Hines Boulevard, Dallas, Texas. Items of the following agenda will be presented to the Board: A. MOMENT OF SILENCE B. CONSENT AGENDA 1. Approval of Minutes a. Regular meeting of March 10, 2016 b. Special meeting of March 24, 2016 2. Approval of Refunds of Contributions for the Month of March 2016
-
Upload
khangminh22 -
Category
Documents
-
view
2 -
download
0
Transcript of AGENDA - Dallas Police and Fire Pension

1 of 5
AGENDA
Date: April 8, 2016
The regular meeting of the Dallas Police and Fire Pension System Board of Trustees will be held
at 8:30 a.m. on Thursday, April 14, 2016, in the Second Floor Board Room at 4100 Harry
Hines Boulevard, Dallas, Texas. Items of the following agenda will be presented to the Board:
A. MOMENT OF SILENCE
B. CONSENT AGENDA
1. Approval of Minutes
a. Regular meeting of March 10, 2016
b. Special meeting of March 24, 2016
2. Approval of Refunds of Contributions for the Month of March 2016

2 of 5
3. Approval of Activity in the Deferred Retirement Option Plan (DROP) for April
2016
4. Approval of Survivor Benefits
5. Approval of Service Retirements
6. Approval of Alternate Payee Benefits
7. Approval of Payment of Military Leave Contributions
8. Approval of Payment of DROP Revocation Contributions
C. DISCUSSION AND POSSIBLE ACTION REGARDING ITEMS FOR INDIVIDUAL
CONSIDERATION
1. Performance review of the Executive Director
Portions of the discussion under this topic may be closed to the public under the terms
of Section 551.074 of the Texas Government Code
2. Actuarial experience study
3. Investment Policy Statement

3 of 5
4. Fixed Income structure study
5. Income Research & Management
6. Industry Ventures
7. North Texas Opportunity Fund extension
8. Investment reports
9. 2015 audit plan
10. Annual 2015 budget review
11. Employee recognition – First Quarter 2016
Employee of the Quarter award
12. Disability recall process
Portions of the discussion under this topic may be closed to the public under the terms
of Section 551.078 of the Texas Government Code.

4 of 5
13. Disability recall
Portions of the discussion under this topic may be closed to the public under the terms
of Section 551.078 of the Texas Government Code.
14. Legal issues
Portions of the discussion under this topic may be closed to the public under the terms
of Section 551.071 of the Texas Government Code.
a. Police Officer and Firefighter pay lawsuits
b. Potential claims involving fiduciaries and advisors
15. Ad hoc committee reports
16. Business continuity update
17. Board Members’ reports on due diligence meetings, seminars and/or conferences
attended
a. IFEBP: Investments Institute
b. Society of Pension Professionals
c. House Pension Public Hearing
d. TEXPERS Basic Trustee Training Course
e. TEXPERS Annual Conference
f. Merit Energy Annual Meeting

5 of 5
D. BRIEFING ITEMS
1. Reports and concerns of active members and pensioners of the Dallas Police and
Fire Pension System
2. Executive Director’s report
a. Associations’ newsletters
NCPERS Monitor (March 2016)
NCPERS Monitor (April 2016)
NCPERS PERSist (Spring 2016)
TEXPERS Outlook (April 2016)
b. Future Education and Business Related Travel
c. Future Investment Related Travel
The term “possible action” in the wording of any Agenda item contained herein serves as notice that the Board may, as permitted by the Texas Government Code, Section 551, in its discretion,
dispose of any item by any action in the following non-exclusive list: approval, disapproval, deferral, table, take no action, and receive and file. At the discretion of the Board, items on this
agenda may be considered at times other than in the order indicated in this agenda.
At any point during the consideration of the above items, the Board may go into Closed Executive Session as per Texas Government Code, Section 551.071 for consultation with attorneys,
Section 551.072 for real estate matters, Section 551.074 for personnel matters, and Section 551.078 for review of medical records.

Regular Board Meeting – Thursday, April 14, 2016
ITEM #A
MOMENT OF SILENCE
In memory of our Members and Pensioners who recently passed away
(March 2, 2016 – April 6, 2016)
FIRE ACTIVE/ RETIRED
DATE OF DEATH
POLICE ACTIVE/ RETIRED
DATE OF DEATH
J. B. Allen Marco A. Davila James T. Stewart
Retired Active Retired
Mar. 15, 2016 Mar. 23, 2016 Mar. 26, 2016
Max H. Abney Ronnie C. Hawthorne
Retired Retired
Mar. 16, 2016 Mar. 7, 2016

1 of 9
Dallas Police and Fire Pension System
Thursday, March 10, 2016
8:30 a.m.
4100 Harry Hines Blvd., Suite 100
Second Floor Board Room
Dallas, TX
Regular meeting, Samuel L. Friar, Chairman, presiding:
ROLL CALL
Board Members
Present at 8:30 Samuel L. Friar, Lee M. Kleinman, Joseph P. Schutz, Brian Hass,
Kenneth S. Haben, Tho T. Ho, Gerald D. Brown, Clint Conway, John M.
Mays
Present at 8:37 Philip T. Kingston
Present at 9:18 Scott Griggs
Absent: Erik Wilson
Staff Kelly Gottschalk, Joshua Mond, James Perry, Summer Loveland, John
Holt, Corina Terrazas, Carlos Ortiz, Pat McGennis, Ryan Wagner,
Milissa Romero, Christina Wu, Greg Irlbeck, Linda Rickley, Kevin
Killingsworth
Others Eric Calhoun (by telephone), Michael A. Shaunessy (by telephone),
Bohdy Hedgcock, Doug Bowen, Dennis Bush, Phil Nelson, Rhett
Humphreys, Jeff Roberts, Christopher Abbate, Jamie Brodsky, Patrick
Connell, A. D. Donald, Jimmy Davis, Lloyd D. Brown, Dan Wojcik,
Juan Urreta, Ken Sprecher, Jerry M. Rhodes, Nancy Kirkpatrick, Larry
Lewis, Michael Flusche, Jim Aulbaugh, Tommy R. Buggs, Steve
Thompson
* * * * * * * *
The meeting was called to order at 8:30 a.m.
* * * * * * * *
A. MOMENT OF SILENCE
The Board observed a moment of silence in memory of retired police officers, Virgil F.
Kulwicki, Darryl W. Smyers and Dan G. Whittington, and retired firefighters, William T. Babb
and John W. Bass.

Regular Board Meeting
Thursday, March 10, 2016
2 of 9
* * * * * * * *
B. CONSENT AGENDA
1. Approval of Minutes
a. Actuarial Funding Committee meeting of February 19, 2015
b. Administrative and Audit Advisory Committee meeting of September 24,
2015
c. Investment Advisory Committee meeting of September 24, 2015
d. Regular meeting of February 11, 2016
e. Special meeting of February 22, 2016
2. Approval of Refunds of Contributions for the Month of February 2016
3. Approval of Activity in the Deferred Retirement Option Plan (DROP) for
March 2016
4. Approval of Estate Settlements
5. Approval of Survivor Benefits
6. Approval of Service Retirements
7. Spouse Wed After Retirement (SWAR)
The minutes of the following meetings were removed from consideration: Actuarial Funding
Committee meeting of February 19, 2015, Administrative and Audit Advisory Committee
meeting of September 24, 2015, and Investment Advisory Committee meeting of September
24, 2015.
After discussion, Mr. Brown made a motion to approve the items on the Consent Agenda as
amended, subject to the final review of the staff. Mr. Mays seconded the motion, which was
unanimously approved by the Board.
* * * * * * * *

Regular Board Meeting
Thursday, March 10, 2016
3 of 9
C. DISCUSSION AND POSSIBLE ACTION REGARDING ITEMS FOR
INDIVIDUAL CONSIDERATION
1. Clarion Partners
a. Change of ownership
b. Strategic review
The Board went into a closed executive session – real estate at 9:36 a.m.
The meeting was reopened at 10:04 a.m.
After discussion, Mr. Brown made a motion to consent to the change of ownership
of Clarion Partners. Mr. Ho seconded the motion, which was unanimously approved
by the Board.
Mr. Haben made a motion to authorize Clarion to engage a sales broker to market
the 4100 Harry Hines land parcel. Mr. Brown seconded the motion, which was
unanimously approved by the Board.
* * * * * * * *
2. Hearthstone: Dry Creek update
At the January 8, 2015 meeting, the Board approved engaging Hearthstone to take
over investment management of DPFP’s investment in the Spring Valley,
Sandstone, Nampa and Dry Creek properties. At the August 27, 2015 meeting, the
Board approved several recommendations from Hearthstone, which included listing
the Dry Creek property for sale. Dennis Bush, Vice President – Investment
Management, of Hearthstone, discussed the marketing process to date and provided
a recommended course of action.
The Board went into a closed executive session – real estate at 10:07 a.m.
The meeting was reopened at 10:20 a.m.
After discussion, Mr. Ho made a motion to authorize Hearthstone to consummate
the sale of the Dry Creek property, subject to the final approval of terms by the
Executive Director. Mr. Brown seconded the motion, which was unanimously
approved by the Board.
* * * * * * * *
The meeting was recessed at 10:21 a.m.

Regular Board Meeting
Thursday, March 10, 2016
4 of 9
The meeting was reconvened at 10:31 a.m.
* * * * * * * *
3. Legal issues
a. Police Officer and Firefighter pay lawsuits
b. Potential claims involving fiduciaries and advisors
The Board went into a closed executive session – legal at 8:33 a.m.
The meeting was reopened at 9:27 a.m.
Mr. Conway made a motion to authorize the Executive Director, with the advice of
counsel, to cause to be filed in all pay lawsuits, an amended petition including an
ultra vires action, and to pursue such claims with such filings and actions as advised
by counsel. Mr. Haben seconded the motion, which passed by the following vote:
For: Friar, Schutz, Hass, Haben, Ho, Brown, Conway, Mays
Against: Griggs, Kingston
Abstain: Kleinman
* * * * * * * *
4. Asset allocation
Staff and Phil Nelson, Director of Asset Allocation and Rhett Humphreys, Partner,
of NEPC, presented their recommended asset allocation to the Board.
Staff and NEPC introduced the foundation for this asset allocation to the Board in
November of 2015. In January of this year, senior investment staff and the
Executive Director conducted a full day review and examination of the proposed
asset allocation with NEPC’s Director of Asset Allocation as well as with NEPC
research professionals in each of the asset classes included in the recommendation.
Outside experts from GMO and JPMorgan were also consulted with regard to their
analyses of expectations for future market returns for various asset classes. Their
respective analyses were presented to the Board in educational sessions during the
January and February Board meetings this year.
The presentation reviewed return assumptions and volatility expectations for the
proposed asset allocation. This recommendation precedes the recommendation for
changes to the Investment Policy to enable Staff to progress with due diligence in
the near term and propose needed asset allocation adjustments while the Investment
Policy is under review.

Regular Board Meeting
Thursday, March 10, 2016
5 of 9
4. Asset allocation (continued)
After discussion, Mr. Schutz made a motion to approve the new asset allocation and
ranges to be included in the forthcoming investment policy as recommended by Staff
and the consultant. Mr. Kingston seconded the motion, which was unanimously
approved by the Board.
* * * * * * * *
Mr. Brown left the meeting at 10:59 a.m.
Mr. Griggs left the meeting at 11:31 a.m.
* * * * * * * *
The meeting was recessed at 12:20 p.m.
The meeting was reconvened at 12:43 p.m. and Messrs. Kingston and Kleinman were not
present.
* * * * * * * *
5. Investments governance
a. Investment Advisory Committee
b. Roles and responsibilities of Board, staff, and consultants
c. Policy review process
The Board and staff discussed investments governance. The Board provided
direction regarding the Investment Advisory Committee.
* * * * * * * *
6. Private Asset pacing
Jeff Roberts, Senior Research Consultant – Private Markets, NEPC, reviewed the
current investment programs in both Private Equity and Private Credit and provided
recommendations to assist DPFP in achieving its investment goal of reaching
recommended target allocations in these asset classes. The review and
recommendations addressed allocation, projected cash flows, and commitment
pacing.

Regular Board Meeting
Thursday, March 10, 2016
6 of 9
6. Private Asset pacing (continued)
After discussion, Mr. Haben made a motion to approve the Private Equity and
Private Credit pacing plans as recommended by NEPC. Mr. Mays seconded the
motion, which was unanimously approved by the Board.
* * * * * * * *
The meeting was recessed at 3:02 p.m.
The meeting was reconvened at 3:10 p.m.
* * * * * * * *
7. Riverstone Credit Partners, LP
Riverstone Credit Partners, LP, a private equity firm specializing in the energy and
power industry, discussed their energy-focused private credit strategy with the
Board. Riverstone was represented by Christopher Abbate, Managing Director, Co-
Head of Riverstone Credit, Jamie Brodsky, Managing Director, Co-Head of
Riverstone Credit, and Patrick Connell, Principal, Limited Partner Relations Team.
Staff and NEPC recommended approving an allocation of $10 million to the
Riverstone Credit Partner L.P. fund within DPFP’s private credit allocation.
After discussion, Mr. Haben made a motion to approve a $10 million commitment
to the Riverstone Credit Partners, LP fund and authorize the Executive Director to
perform due diligence, execute documentation, and perform all necessary acts and
exercise all appropriate discretion to facilitate this investment. Mr. Schutz seconded
the motion, which was unanimously approved by the Board.
* * * * * * * *
The meeting was recessed at 2:21 p.m.
The meeting was reconvened at 2:34 p.m.
* * * * * * * *

Regular Board Meeting
Thursday, March 10, 2016
7 of 9
8. NEPC: Fourth Quarter 2015 Investment Performance Analysis and Third
Quarter 2015 Private Markets Review
Messrs. Humphreys and Roberts, of NEPC, presented the above reports.
No motion was made.
* * * * * * * *
9. Investment and financial reports
Mr. Perry reviewed the preliminary investment performance and rebalancing reports
for the period ending February 29, 2016 with the Board.
No motion was made.
* * * * * * * *
10. Member health insurance
Ms. McGennis, Benefits Manager, updated the Board regarding efforts to reduce the
amount of time staff spends dealing with issues involving Members’ health
insurance.
No motion was made.
* * * * * * * *
The meeting was recessed at 4:19 p.m.
The meeting was reconvened at 4:25 p.m.
* * * * * * * *
11. Continuing Education and Investment Research Expense Policy and Procedure
Ms. Loveland presented several proposed changes to the policy and procedure
covering education and travel related expenses, one of which was the repositioning
of policies and procedures related to investment research expenses to the Investment
Policy. In addition, to encompass all travel related expenses, including those related
to non-education related pension business, Staff proposed a change to the title of the
policy to Education and Travel Policy and Procedure.

Regular Board Meeting
Thursday, March 10, 2016
8 of 9
11. Continuing Education and Investment Research Expense Policy and Procedure
(continued)
As the policy as amended removes procedures related to investment due diligence
travel and the revised Investment Policy will not be presented to the Board until later
in 2016, in the interim period, Staff proposed a requirement for all Trustee due
diligence related travel to be pre-approved by the Board.
In conjunction with the proposed changes to the Education and Travel Policy and
Procedure, Staff proposed a reduction to the 2016 budget as follows, for a total
reduction of $59,320:
Current Proposed
Travel-Board $233,400 $208,400
Conference registration-Board $ 46,120 $ 21,600
Travel-Staff $139,700 $131,700
Conference registration-Staff $ 54,120 $ 52,320
After discussion, Mr. Mays made a motion to approve the Education and Travel
Policy and Procedure as amended and approve proposed reductions in the travel and
conference registration budget line items for Board and Staff for 2016. Mr. Haben
seconded the motion, which was unanimously approved by the Board. Messrs.
Griggs, Kingston, and Wilson were absent when the vote was taken.
* * * * * * * *
12. Ad hoc committee reports
No updates on the ad hoc committees were given.
* * * * * * * *
D. BRIEFING ITEMS
1. Reports and concerns of active members and pensioners of the Dallas Police
and Fire Pension System
No members or pensioners requested to speak to the Board during the open forum.
* * * * * * * *

Regular Board Meeting
Thursday, March 10, 2016
9 of 9
2. Executive Director’s report
a. Associations’ newsletters
NCPERS Monitor (February 2016)
NCPERS PERSist (Winter 2016)
TEXPERS Outlook (March 2016)
TEXPERS Pension Observer (Winter 2016)
b. Future continuing education and investment research programs and
conferences
The Executive Director’s report was presented. No motion was made.
* * * * * * * *
Ms. Gottschalk stated that there was no further business to come before the Board. On a motion
by Mr. Hass and a second by Mr. Ho, the meeting was adjourned at 4:54 p.m.
_______________________ Samuel L. Friar
Chairman
ATTEST:
_____________________ Kelly Gottschalk
Secretary

1 of 4
Dallas Police and Fire Pension System
Thursday, March 24, 2016
8:30 a.m.
4100 Harry Hines Blvd., Suite 100
Second Floor Board Room
Dallas, TX
Special meeting, Samuel L. Friar, Chairman, presiding:
ROLL CALL
Board Members
Present at 8:30: Samuel L. Friar, Lee M. Kleinman, Joseph P. Schutz, Brian Hass,
Kenneth S. Haben, Erik Wilson, Gerald D. Brown, Clint Conway,
John M. Mays
Present at 9:00: Philip T. Kingston
Present at 9:15: Tho T. Ho (after City business)
Present at 9:59: Scott Griggs
Absent: None
Staff Kelly Gottschalk, Joshua Mond, James Perry, John Holt, Corina
Terrazas, Carlos Ortiz, Damion Hervey, Ryan Wagner, Milissa
Romero, Christina Wu, Greg Irlbeck, Linda Rickley
Others Andrea Kim, Greg Taylor, Darrell Jordan, Ron Pinkston, Mike
Hamilton, Rick Salinas, Tristan Hallman
* * * * * * * *
The meeting was called to order at 8:30 a.m.
DISCUSSION AND POSSIBLE ACTION REGARDING ITEM FOR
INDIVIDUAL CONSIDERATION
1. Legal issues
a. Police Officer and Firefighter pay lawsuits
b. Potential claims involving fiduciaries and advisors
The Board went into a closed executive session – legal at 8:30 a.m.
The meeting was reopened at 10:35 a.m.
No motion was made.

Special Meeting
Thursday, March 24, 2016
2 of 4
* * * * * * * *
The meeting was recessed at 10:35 a.m.
The meeting was reconvened at 10:48 a.m.
* * * * * * * *
2. Real estate investment consultant
At the February 11, 2016 Board meeting, The Townsend Group was terminated as
the real asset investment consultant. Staff is recommending that DPFP expand the
scope of the general investment consultant, NEPC, to include the real estate and
natural resource assets that were previously covered by Townsend. NEPC’s real
asset services would include performance reporting, investment monitoring and
investment recommendations.
After discussion, Mr. Haben made a motion to authorize the Executive Director to
enter into an agreement with NEPC for investment consulting services for the entire
DPFP portfolio. Mr. Mays seconded the motion, but no vote was taken, due to an
amendment to the motion that was proposed by Mr. Schutz.
Mr. Schutz amended the motion to authorize the Executive Director to enter into
an agreement with NEPC for investment consulting services for the entire DPFP
portfolio, with the fees for the entire engagement not to exceed the current base fee
structure, plus $200,000 for all other services, including real estate and private
equity consulting. Mr. Mays seconded the motion, which passed by the following
vote:
For: Mays, Friar, Kleinman, Hass, Haben, Wilson, Ho, Brown, Conway
Against: Schutz, Griggs, Kingston
* * * * * * * *
3. Potential action relating to NTE 3a and 3b
In August 2012, the Board approved a $50 million infrastructure investment
commitment to facilitate a 10% equity stake in the North Tarrant Express 3a-3b (I-
35W) project. This managed lanes public-private partnership extends north just
over 10 miles along I-35W from downtown Fort Worth at I-30 to IH-820 (Segment
3a), and IH-820 to US 81/287 (Segment 3b). Construction commenced in 2013 and
DPFP has funded approximately $21 million of the commitment.

Special Meeting
Thursday, March 24, 2016
3 of 4
3. Potential action relating to NTE 3a and 3b (continued)
Texas Department of Transportation (TxDOT) has now requested the developer
also construct another segment (3c) extending from US 81/287 another 7.1 miles
to Eagle Parkway, north of Alliance Airport. The proposal would be a change order
to add this segment as part of the original 3a-3b project, requiring additional equity
contributions. Staff reviewed the options as it relates to the addition of this segment
to the project.
The Board went into a closed executive session – real estate at 12:30 p.m.
The meeting was reopened at 12:50 p.m.
After discussion, Mr. Haben made a motion to authorize the Executive Director to
sell DPFP’s interest in the NTE 3A/3B project, execute documentation, and
perform all necessary acts and exercise all appropriate discretion to complete the
sale. Mr. Hass seconded the motion, which was unanimously approved by the
Board.
* * * * * * * *
4. Consideration of recent public statements by Trustees
The Board went into a closed executive session – real estate at 10:48 a.m.
The meeting was reopened at 11:13 a.m.
The Board went into a closed executive session – real estate at 11:29 a.m.
The meeting was reopened at 11:52 a.m.
No motion was made.
* * * * * * * *
The meeting was recessed at 12:00 p.m.
The meeting was reconvened at 12:13 p.m.
* * * * * * * *

Special Meeting
Thursday, March 24, 2016
4 of 4
Ms. Gottschalk stated that there was no further business to come before the Board. On a
motion by Mr. Haben and a second by Mr. Hass, the meeting was adjourned at 12:50 p.m.
__________________________
Samuel L. Friar
Chairman
ATTEST:
______________________
Kelly Gottschalk
Secretary

DISCUSSION SHEET
Regular Board Meeting – Thursday, April 14, 2016
ITEM #C1
Topic: Performance review of the Executive Director Portions of the discussion under this topic may be closed to the public under the terms of Section 551.074 of the Texas Government Code
Discussion: The Board will meet with the Executive Director to review performance over the past year and provide recommendations concerning yearly objectives, goals, and performance.

DISCUSSION SHEET
Regular Board Meeting – Thursday, April 14, 2016
ITEM #C2
Topic: Actuarial experience study
Discussion: Segal has completed an actuarial experience study for DPFP as of January 1, 2016. The primary purpose of an experience study is to compare the reasonableness of the demographic and economic assumptions used in preparing the Actuarial Valuation to the actual historical experience as well as expectations for the future. Segal will present the results of their study and may recommend the Board consider modifying certain assumptions.
Staff Recommendation: Available at the meeting.

DISCUSSION SHEET
Regular Board Meeting – Thursday, April 14, 2016
ITEM #C3
Topic: Investment Policy Statement
Discussion: At the March 10, 2016 Board meeting, staff updated the Board on the process for and status of drafting a new Investment Policy Statement. Staff and the Governance Committee will present the draft Investment Policy Statement, which has been reviewed by Champion Capital Research and NEPC. The Investment Policy Statement describes, in detail, the roles and responsibilities of the Board, Investment Advisory Committee, Executive Director, staff, consultants, investment managers and the custodian. The new Investment Policy Statement is intended to be a comprehensive document, and therefore would replace the current investment related policies: Brokerage Policy & Procedure, Derivatives Investment Guidelines for External Money Managers, Investment Implementation Policy, Investment Policy, Investment Structure Policy, Manager Selection & Monitoring Policy Excluding Real Estate, New Investment Registration Process, Potential Investment Review Process, Real Estate Investment Procedures & Guidelines, Strategic Investment Policy, Supplemental Investment Policy.
Staff Recommendation: Terminate the investment policies listed above and adopt the draft Investment Policy
Statement, as a comprehensive replacement for all previous investment policies.

510 Bering, Suite 300
Houston, Texas 77057
713-974-8883
www.championcr.com
April 11, 2016
Ms. Kelly Gottschalk
Executive Director
Dallas Police & Fire Pension System
4100 Harry Hines Boulevard, Suite 100
Dallas, Texas 75219
Dear Ms. Gottschalk,
It was my sincere pleasure to assist you and the Dallas Police and Fire Pension System with the
development of this Investment Policy Statement (IPS). These policies are intended to guide the Board,
Staff, Consultants and all vendors in the management of the DPFP System’s portfolio of assets. This
IPS is a result of the cooperation among DPFP Staff, Consultants and Board members.
It is my opinion that this version of the IPS is a substantial improvement over previous policies.
Importantly, this IPS specifically identifies the fiduciary status of Investment Managers and
Consultants. If this IPS is approved and implemented, investment firms that provide comprehensive
and discretionary investment management services to the Board will now be held to a fiduciary
standard of excellence and loyalty. It will be important to share a copy of the approved IPS with each
entity expected to perform on behalf of the DPFP System, as this IPS addresses specific roles and
responsibilities for those responsible for asset management decisions. Importantly, this IPS addresses
specific monitoring criteria for Investment Managers so that Board level decisions can be made more
effectively using quantifiable and measurable criteria and analyses.
The IPS is a working document. During the course of the year, the Board, Staff, Consultants,
Investment Managers and all vendors will be allowed to satisfy the responsibilities outlined for each.
To the extent specific policies are followed, they will be included in the annually updated IPS. To the
extent specific policies may not be followed, an annual review can assess changes to ensure closer
adherence to best practice portfolio management.
Finally, these policies are intentionally silent on ethics. It is recommended that a separate ethics policy
be developed to complement this IPS. Additionally, Champion Capital Research makes no
recommendation regarding the asset allocation decisions approved by the Board and referenced in
Appendix A of these polices.
Thank you again for the opportunity to assist DPFP System with the design of this IPS.
Sincerely,
Mary Kathryn Campion, Ph.D., CFA, AIFA
President, Champion Capital Research
Adjunct Faculty, Center for Fiduciary Studies

INVESTMENT POLICY
STATEMENT
Adopted ______________

Page 1 of 19
INVESTMENT POLICY STATEMENT
Adopted __________
TABLE OF CONTENTS
SECTION 1 Introduction and Purpose
SECTION 2 Design, Goals, and Objectives
SECTION 3 Standards of Conduct and Fiduciary Responsibility
SECTION 4 Core Beliefs and Long Range Acknowledgments
SECTION 5 Roles and Responsibilities
SECTION 6 Authorized Asset Classes and Investment Guidelines
SECTION 7 Investment Due Diligence and Monitoring
SECTION 8 Risk Management
SECTION 9 APPENDICES

Page 2 of 19
INVESTMENT POLICY STATEMENT
Adopted __________
Section 1 Introduction and Purpose
This policy statement shall guide investment of the assets of the Dallas Police and Fire Pension
System (DPFP). This investment policy statement (IPS) is issued for the guidance of the Dallas
Police and Fire Pension System Board of Trustees (Board), Investment Advisory Committee
(IAC), Executive Director, Staff, Consultant(s), Custodian, and Investment Managers. This IPS
is intended to set forth an appropriate set of goals and objectives for DPFP. It will define guidelines
to assist fiduciaries and Staff in the supervision of the investments of DPFP. The investment
program processes and procedures are defined in the various sections of the IPS by:
A. Stating in a written document DPFP’s expectations, objectives and guidelines for the
investment of assets;
B. Setting forth an investment structure for managing the portfolio. This structure includes
assigning various asset classes, investment management styles, asset allocation and
acceptable ranges that, in total, are expected to produce an appropriate level of overall
diversification and total investment return over the investment time horizon;
C. Encouraging effective communications between the Board, IAC, Staff, Consultant(s),
Investment Managers and Custodian(s);
D. Set forth policy that will consider various factors, including inflation, consumption, taxes,
liquidity and administrative expenses, that will affect the portfolio’s short and long term total
expected returns and risk;
E. Establishing formal criteria to select, evaluate, monitor, compare, and attribute the
performance of Investment Managers on a regular basis; and
F. Complying with all applicable fiduciary and due diligence requirements experienced
investment professionals would utilize, and with all applicable laws, rules and regulations
from various local, state, federal, and international political entities that can impact DPFP.

Page 3 of 19
Section 2 Design, Goals, and Objectives
Staff and the Consultant(s) are expected to deliver excess return beyond the Policy Benchmark1
through manager selection and asset allocation adjustments. By achieving allocation and
performance objectives consistently, the long term investment goals of DPFP are expected to be
achieved.
Goals
a. Ensure funds are available to meet current and future obligations of the plan when due
while earning a long-term, net of fees investment return greater than the actuarial return
assumption.
b. To consistently rank in the top half of the public fund universe over the rolling three-
year period, net of fees.
Objectives
1. To maintain a diversified asset allocation;
2. To provide for an appropriate risk adjusted rate of return;
3. To allow for both passive and active investment management;
4. To monitor quarterly manager performance;
5. To monitor monthly asset allocation changes;
6. To outperform the Policy Benchmark over rolling three year periods;
7. To control and monitor the costs of administering and managing the investments;
8. Establish guidelines and procedures for selecting, monitoring and replacing investment
vehicles; and
9. Re-evaluate annually the policies defined in this IPS.
1 The Policy Benchmark represents the return of the investable and non-investable indices as defined in Appendix A,
at the target allocation for each asset class.

Page 4 of 19
Section 3 Standards of Conduct and Fiduciary Responsibility
The following are standards of conduct for the Board, Investment Advisory Committee, Staff,
Investment Managers, Consultant(s) and all investment related other service providers of DPFP:2
1. Place the interest of DPFP above personal interests;
2. Act with integrity, competence, diligence, respect, and in an ethical manner;
3. Use reasonable care, diligence, and exercise independent professional judgment when
conducting analysis, making recommendations, and taking actions;
4. Promote the integrity of and uphold the rules governing DPFP;
5. Comply with all applicable laws, rules, and regulations of any government agency,
regulatory organization, licensing agency, or professional association governing their
professional activities;
6. Not assist or knowingly participate in any violation of governing laws, rules, or
regulations;
7. Not accept gifts, benefits, or compensation that could be expected to compromise
independence and objectivity;
8. Must not knowingly make any statement that misrepresents facts relating to investment
analysis, recommendations, actions, or other professional activities;
9. Not engage in conduct involving dishonesty, fraud, deceit; and
10. Make full disclosure (annually) of all matters that could reasonably be expected to
impair independence and objectivity with their respective duties to DPFP.
2 These are informed by the CFA Institute and the Center for Fiduciary Studies.

Page 5 of 19
Section 4 Core Beliefs and Long Range Acknowledgements
This section outlines the core beliefs and long range acknowledgements for the overall governance
of DPFP. These beliefs and acknowledgements will serve as guiding principles in the decision
making and implementation of DPFP’s investment mandate.
A. A well-defined governance structure with clearly delineated responsibilities is critical in
achieving consistent, long term performance objectives.
B. The strategic asset allocation determines the risk reward profile of the portfolio and thus
drives overall portfolio volatility.
C. The opportunity for active manager outperformance (alpha) is not uniformly distributed
across asset classes or Investment Managers’ strategies.
D. Leverage may improve a risk / return profile when structured appropriately.
E. Portfolio cash flow and income will be used to rebalance the asset allocation.

Page 6 of 19
Section 5 Roles and Responsibilities
Board
The Board is made up of twelve (12) Trustees. The Board has a fiduciary role as the
representative of DPFP. The Board recognizes its fiduciary duty and acknowledges its
responsibility to ensure that the management of plan and DPFP’s fund is in compliance with state
and federal laws. Additionally, the Board:
1. Establishes investment objectives consistent with the needs of DPFP and prepares the IPS of
DPFP;
2. Prudently diversifies, selects, and maintains a general investment strategy consistent with
allocation ranges and investment guidelines including an agreed upon risk/return profile;
3. Approves strategic asset allocation targets and ranges;
4. Prudently hi res , monitors, & terminates Consultant(s), Investment Managers and other
vendors;
5. Reviews investment related expenses;
6. Approves Board travel related to investment monitoring, and in exceptional cases due
diligence;
7. Approves any expansion or renewals of the DPFP leverage facility and reviews existing
facility;
8. Adopts the IPS and annually reviews in the last quarter of each calendar year and revises as
needed; and
9. Avoids prohibited transactions and conflicts of interest.
Investment Advisory Committee
IAC Composition, Selection and Criteria:
1. The IAC serves at the discretion of the Board of Trustees;
2. The IAC is composed of nine (9) members and represented by three constituent groups:
Dallas Police Department, Dallas Fire Department, and Dallas City Council.
3. Each constituent group will nominate at least two and up to three outside investment
professionals to represent their group on the IAC;
4. One of the three representatives from each group may be filled by an existing Board
member;

Page 7 of 19
Section 5 Roles and Responsibilities (continued)
IAC Composition, Selection and Criteria (continued):
5. The Board will vote on and approve all IAC nominations;
6. To be eligible to serve on the IAC, an individual must live or work in the city of Dallas;
7. An IAC meeting requires a quorum of at least five members, of which, at least two
members must be outside investment professionals;
8. An IAC member will serve staggered terms of three years. It is contemplated that the outside
investment members of the IAC will sign an agreement and be compensated as determined
to be reasonable by the Board. Compensation and expenses are reimbursable under the
Education and Travel Policies and Procedure. The IAC selects a chair and vice chair from its
members, for a two-year term, to serve as liaison to the Board and to preside over IAC
meetings;
9. Each member of the IAC will respond annually to a disclosure questionnaire, which the
Board will review for any independence issues or potential conflicts of interest;
10. If the Executive Director learns that potential ground for removal of an IAC member exists,
the Executive Director shall notify the Chair of the Board of the potential grounds for
removal;
11. The Board of Trustees may elect to dismiss a member of IAC for any reason; and
12. The IAC will meet at least quarterly at duly noticed public meetings.
IAC Roles and Responsibilities:
1. The IAC will review all investment related items including, but not limited to, annual asset
allocation updates and the hiring or termination of Investment Managers, Consultant(s), and
Custodian;
2. The IAC will vote on each investment related action item;
3. The IAC chair or vice chair will update the Board with an abbreviated version of the facts
and the IAC recommendation, or lack thereof, to the Board, which will accompany the Staff
and Consultant recommendations;
4. The IAC shall review Staff and Consultant recommendations on asset allocation targets and
ranges at least annually, and provide an IAC recommendation to the Board; and
5. Acts as fiduciaries to DPFP.

Page 8 of 19
Section 5 Roles and Responsibilities (continued)
Staff
Executive Director
1. The Executive Director is authorized to administer the operations and investment activities
of DPFP under policy guidance from the Board;
2. Manages the day to day operations of DPFP;
3. Reports to Board when strategic asset allocation breaches target allocation bands;
4. Oversees and reports to Board on investment and due diligence processes and procedures;
5. Approves/declines all Staff travel related to all manager pre-hire & on-site due diligence;
6. Approval of Investment Staff recommendations for presentation to the IAC and Board; and
7. Is not a fiduciary to DPFP.
Investment Staff
The Staff is responsible for manager due diligence and recommendations, portfolio
implementation consistent with the Board approved asset allocation, and will assess the activities
of the Consultant(s). The Staff helps the Board to oversee Investment Managers, Consultant(s),
Custodian(s), and vendors. Additionally, the Staff:
1. Reports to Executive Director when portfolio asset classes exceed allowable strategic
boundaries;
2. Notifies Consultant(s) in writing of rebalancing needs and recommended implementation, so
as to employ periodic cash flows to asset classes within target allocation ranges;
3. Instructs Investment Managers to implement Consultant approved re-balance instructions;
4. Submits to Executive Director for review, on annual basis, recommended asset allocation
targets and ranges & oversees implementation of the approved asset allocation;
5. Monitors and reports portfolio asset class balances;
6. Assists in the preparation and annual review of IPS;
7. Reviews Consultant(s)’s Investment Manager due diligence and recommendations;
8. Prepares Staff Investment Manager recommendations, submits Staff and Consultant(s)
recommendations to Executive Director for review;

Page 9 of 19
Section 5 Roles and Responsibilities (continued)
Staff (continued)
Investment Staff (continued)
9. After Board approval of investment, Staff approves Investment Manager Strategy guidelines
which will be outlined in the Investment Manager agreements, as applicable;
10. Monitors all investments, Investment Managers and vendors;
11. Monitors adherence to quantitative due diligence criteria;
12. Accounts for and reviews annually all external management fees and investment expenses;
13. Reviews, every two years, the eligibility status of members of the IAC;
14. Ensures all fiduciaries to DPFP are aware of their fiduciary obligations annually;3 and
15. Is not a fiduciary to DPFP.
Consultant(s)
The Consultant(s) should monitor qualitative and quantitative criteria related to Investment
Managers and aggregate portfolio activity and performance. The Consultant(s), through its
continuous and comprehensive responsibilities to DPFP should acknowledge in its contract, its
fiduciary responsibility to DPFP. Additionally, the Consultant(s):
1. Recommends annually to IAC and Board strategic asset allocation targets, ranges, and
benchmarks for asset classes;
2. Documents asset allocation recommendations with asset class performance expectations
including standard deviation, expected return and correlations for each asset class used by
DPFP;
3. Establishes and follows due diligence procedures for Investment Manager candidate
searches;
4. Conducts screens and searches for Investment Manager candidates;
5. Assists in the selection process and monitoring of Investment Managers;4
6. Reviews and recommends Investment Managers and peer groups to IAC and Board;
3 Verification of this may be through contract, agreement, or annual fiduciary acknowledgement letter. 4 The specific screening criteria for investment managers can be found in Appendix B.

Page 10 of 19
Section 5 Roles and Responsibilities (continued)
Consultant(s) (continued)
7. Documents and delivers to Staff written recommendations on Investment Manager new
hire, hold and termination reviews;
8. Any new hire recommendation from the Consultant should include a recommended
benchmark and an assessment of appropriate asset class and sub-allocation;
9. Approves and verifies in writing each of Staff’s rebalancing recommendations and
implementation;5
10. Reviews whether rebalancing was done consistent with best practices;
11. Monitors the diversification, quality, duration, and risk of holdings as applicable;
12. Assists Staff in negotiation of terms of vendor contracts;
13. Prepares quarterly investment reports, which include the information outlined in Appendix
C; and
14. Acts as a fiduciary to DPFP.
Investment Managers
Public Investment Managers
1. Acknowledge in writing acceptance of the objectives, guidelines, and standards of
performance;
2. Invest the assets of DPFP in accordance with its objectives, guidelines and standards;
3. Exercise full discretionary authority as to all buy, hold and sell decisions for each security
under management, subject to the guidelines as defined in this Statement;
4. If managing a separate account, send trade confirmations to the Custodian;
5. For separately managed accounts, deliver monthly report to Consultant(s)/Staff describing
portfolio asset class weights, investment performance, security positions, and transactions;
6. For commingled assets, this statement should show unit position and unit value;
7. Adhere to best execution and valuation policies;
5 Evidence of approval may be in electronic format.

Page 11 of 19
Section 5 Roles and Responsibilities (continued)
Investment Managers (continued)
Public Investment Managers (continued)
8. Prices and fair market valuations will be obtained from a third party reporting service
provider;
9. Communicate to Executive Director any material changes at firm;
10. Inform DPFP, as soon as practical, in writing of any breach of investment guidelines, ethic
violations or violations of self-dealing;
11. Communicate significant changes in the ownership, organizational structure, financial
condition, or personnel staffing; and
12. Acts as a fiduciary to DPFP.
Private Investment Managers
1. Acknowledge in writing acceptance of the objectives, strategy guidelines, and standards of
performance as evidenced in investment manager, operating or partnership agreement;
2. Will ensure that financials statements undergo annual audits and that investments are
reported at fair market value, as outlined in the Investment Management, Partnership or
Operating Agreement(s);
3. Communicate to Executive Director any material changes in the ownership or management
of the firm, and or the stability of the organization;
4. Inform DPFP, as soon as practical, in writing of any breach of investment guidelines, ethic
violations or violations of self-dealing; and
5. Acts as fiduciary to DPFP, unless specified and acknowledged by Board at time of hire.
Custodian
1. Safekeep and hold all of DPFP’s assets in the appropriate domestic accounts and provide highly
secure storage of physical stock certificates and bonds such that there is no risk of loss due to
theft, fire, or accident;6
2. Maintain separate accounts by legal registration;
6 Electronic transfer records at the Depository Trust Company (“DTC’’) are preferred.

Page 12 of 19
Section 5 Roles and Responsibilities (continued)
Custodian (continued)
3. Arrange for timely execution and settlement of Investment Manager securities transactions
made for DPFP;
4. Provide for receipt and prompt crediting of all dividend, interest and principal payments
received as a result of DPFP portfolio holdings or securities lending activities;
5. Monitor income receipts to ensure that income is received when due and institute
investigative process to track and correct late or insufficient payments, including
reimbursement for any interest lost due to tardiness or shortfall;
6. At the direction of the Staff, expeditiously transfer funds into and out of specified accounts.
Section 6 Authorized Asset Classes & Investments Guidelines
Asset Class Guidelines
1. Asset allocation is the primary driver of the volatility of portfolio return. To achieve the
goals and objectives of DPFP, the fund’s assets will be invested in the categories listed in
Appendix A. The assets shall be diversified, in order to minimize the concentration risk,
both by asset class and within an asset class.
2. The strategic asset allocation shall be monitored on an ongoing basis and rebalanced when
the lower and upper bounds on the ranges are breached, understanding the timing of the
rebalancing may be delayed depending the liquidity of the asset class and costs of
rebalancing, and otherwise at the discretion of Staff with concurrence of the Consultant.
3. Securities lending is permissible for separately managed accounts and commingled vehicles.
Authorized Investments
1. Equities: Equity represents residual ownership of public and private companies after
obligations to debt holders have been satisfied.
2. Fixed Income: Fixed-income instruments are securities or debt obligations issued by
governments, government-related entities, structured debt facilities and public and private
companies that contain contractual obligations from the issuer to make interest and/or
principal repayments to investors over the duration of the negotiated term agreement.
3. Real Assets (Liquid and Illiquid): Liquid real assets are investments in tradable
tangible/physical assets or related claims that may display a positive correlation to the rate
of inflation. Illiquid real assets (natural resources and infrastructure) represent ownership
claim to an actual, finite asset or property.
Page 13 of 19
Section 6 Authorized Asset Classes & Investments Guidelines (continued)
Authorized Investments (continued)
4. Global Asset Allocation: An investment strategy that actively invests in a variety of liquid
assets including cash, equity, fixed income, credit, derivatives (interest rate, currency, index)
and commodities.
5. Private Equity: A non-financial asset that is relatively illiquid and non-transparent. Private
equity funds make investments directly into private companies.
6. Private Debt: Private debt funds typically provide capital to private sector borrowers.
7. Real Estate: Real estate represents investment in a range of properties which provide income
and/or appreciation potential. Investments in real estate can be structured as public or private
debt and/or equity, and can be in the U.S. or foreign countries.
8. Other Authorized Investments: Trade finance and reinsurance based strategies;
Section 7 Investment Due Diligence & Monitoring
Investment Due Diligence
Staff and Consultant(s) are responsible for recommending external Investment Managers to the
IAC and Board for review for potential hiring. The following will be implemented:
1. Investment Manager candidate due diligence will be conducted by Staff &
Consultant(s).
2. Due diligence criteria are defined in Appendix B.
3. Selected candidate(s) will be presented to the IAC.
4. IAC will communicate their recommendation, or lack thereof, on the candidate(s) for
consideration and final approval by the Board.
Investment Monitoring
A. Staff and Consultant(s) are responsible for monitoring external public & private Investment
Managers. Public and private Investment Managers will be monitored relative to peers and
benchmarks monthly and quarterly, respectively. Additionally, each current manager is
expected to satisfy the due diligence criteria outlined in Appendix B. If the following criteria
are not met, an Investment Manager is to be considered an underperformer:
1. Investment Managers’ 3 year rolling returns in excess of peer group average;

Page 14 of 19
Section 7 Investment Due Diligence & Monitoring (continued)
Investment Monitoring (continued)
2. Investment Managers’ 3 year rolling risk-adjusted returns in excess of peer group
average;
3. Investment Managers’ qualitative requirements must be satisfied at all time periods, as
determined by Staff or Consultant;
B. Based on the criteria outlined above, the Consultant will highlight underperforming
Investment Managers in their quarterly report to Board. If an Investment Manager is
considered an underperformer, Staff and Consultant will provide recommendations to IAC
and Board regarding whether to “hold” or “sell”.
Section 8 Risk Management
The Staff will work within these policies in order to mitigate the risk of capital loss. By
implementing these policies the Board has addressed:
1. Custodial Risk for both public and private holdings;7
2. Interest Rate Risk through fixed income duration and credit monitoring;8
3. Concentration and Credit Risk through asset allocation targets and ranges,
rebalancing, and the monitoring of investment guidelines.
Through these policies, Staff has necessary monitoring criteria established for Custodian,
Consultant(s) and Investment Managers, such that DPFP has in place policies that will mitigate
interest rate, custody, concentration and credit risks.
7 Please review Custodian responsibilities in Section 5. 8 Please review Annual Review of IPS and Investment Manager strategy guidelines reviewed and approved by Staff.

Page 15 of 19
APPROVED on ____________the Board of Trustees of the Dallas Police and Fire Pension
System.
Samuel L. Friar
Chairman
Attested:
Kelly Gottschalk
Executive Director

Page 16 of 19
APPENDICES

Page 17 of 19
Appendix A
STRATEGIC ASSET ALLOCATION TARGETS & RANGES
Asset Class Policy Benchmark Target Range
Cash 90-day T Bills 2.0% 0% – 5%
Plan Level Leverage (LIBOR + 300) 0% 0% - 15%
Equity 30.0% 20% – 40%
Global Equity MSCI AC World (gross) 20.0% 10% – 23%
EM Equity MSCI EM Equity (gross) 5.0% 0% – 8%
Private Equity R3000 +3% (Rolling 3 Mo.) 5.0% 4% – 15%
Fixed Income 33.0% 15% – 38%
Short-Term Core Bonds Barclays UST 1-3 Year 2.0% 0% – 5%
Global Bonds Barclays Global Aggregate 3.0% 0% – 6%
High Yield Barclays Global HY 5.0% 2% – 8%
Bank Loans S&P Leveraged Loan Index 6.0% 3% – 9%
Structured Credit &
Absolute Return HFRI RV: FI (50/50-ABS/Corp) 6.0% 0% – 9%
EMD (50/50) 50% JPM EMBI/50% JPM GBI-
EM 6.0% 0% – 9%
Private Debt Barclays Global HY + 2% (Rolling
3 Mo.) 5.0% 2% – 7%
Real Assets 25.0% 20% – 45%
Natural Resources S&P Global Nat Res (Rolling 3
Mo.) 5.0% 3% – 10%
Infrastructure S&P Global Infra (Rolling 3 Mo.) 5.0% 3% – 10%
Real Estate NCREIF 12.0% 10% – 25%
Liquid Real Assets CPI + 5.00% 3.0% 0% – 6%
Asset Allocation 10.0% 5% – 15%
Risk Parity 60% MSCI ACWI/40% Barclays
Global Aggregate 5.0% 2% – 8%
GTAA 60% MSCI ACWI/40% Barclays
Global Aggregate 3.0% 0% – 6%
Absolute Return HFRX Abs Ret Index 2.0% 0% – 5%
TOTAL 100.0%

Page 18 of 19
Appendix B
The public market Investment Manager screening criteria include:
1. Lead portfolio manager tenure/experience at least 5 years.
2. Firm level assets under management: 75 million or more under management.
3. Investment style should consistently match what is approved and outlined in the Investment
Manager’s guidelines, and will be compared and analyzed against peers/sub-asset class
category.
4. Sharpe ratio generally would exceed .3, which may not be possible following a prolonged
bear market in that respective market, and must exceed 50% of its peer group over a three
year rolling period.
5. Three year rolling total return, on a net of fee basis, must exceed 50% of its peer group.
6. On site due diligence meeting is recommended.
7. Fiduciary acceptance and acknowledgement.
The private Investment Manager screening will focus on the key areas of:
1. Alignment of Interests: management fees and expenses, carry/waterfall, term of fund,
General Partner commitment.
2. Governance: team, investment strategy, fiduciary duty, Limited Partner Advisory Committee
responsibilities and makeup, changes of the fund.
3. Transparency: risk management, financial information, disclosure related to the GP,
management and other fees.
4. Track Record: the firm or lead portfolio manager should have a track record of at least 5
years.
5. Performance: a majority of previous funds should rank in the top 50% of their vintage year
and strategy fund universe.
The hedge-fund Investment Manager screening criteria include:
1. Lead portfolio manager tenure/experience at least 5 years.
2. Utilization of independent third-party administrator.
3. Sharpe ratio should exceed .5 and must exceed 50% of its peer group over a three year rolling
period.
4. Three year rolling total return must exceed 50% of its peer group.
5. A well-defined and documented risk management process.
6. Leverage terms should be appropriate to strategy.
7. Liquidity of assets should match liquidity of fund.
8. Redemption terms consistent with peers.
9. Expected return compensates for illiquidity.
If any of the above due diligence criteria are not met, the Staff and Consultant will disclose this
in their recommendations to the IAC and Board, along with an explanation of why the
investment is still appropriate.

Page 19 of 19
Appendix C
Investment Consultant Reporting Requirements
The investment consultant is required to provide the Board with quarterly investment information
for portfolio monitoring purposes. Generally these are as follows:
Quarterly (due in advance of the meeting)
1. A review of the current investment market environment.
2. DPFP’s actual asset allocation relative to its target asset allocation as defined in Appendix
A.
3. DPFP’s return relative to its Policy Benchmark return and other public pension funds.
4. DPFP’s risk adjusted returns relative to the policy and other public pension funds.
5. Asset class performance relative to the benchmarks as defined in Appendix A.
6. Individual Investment Manager returns relative to their stated benchmark.
7. Report will specifically acknowledge any underperforming Investment Managers based on
the criteria outlined in Section 7 of the IPS.
8. Any reportable events affecting any of DPFP’s Investment Managers.
9. Private Markets reports which covers Private Debt, Private Equity, Infrastructure, Real
Assets and Real Estate.

DISCUSSION SHEET
Regular Board Meeting – Thursday, April 14, 2016
ITEM #C4
Topic: Fixed Income structure study
Attendees: Rhett Humphreys, Partner Keith Stronkowsky, Senior Consultant
Discussion: The liquid Fixed Income portfolio’s target allocation increased from 15% to 28% when the asset allocation was approved at the March 10, 2016 Board meeting. NEPC and Staff will present the structure study which will explain the build out of the liquid portion of the Fixed Income portfolio discussing each of the sub-asset classes in detail, such as which managers to retain/eliminate, reasonable number of managers in each sub-asset class and the expected timeline to complete the build out.
Staff Recommendation: In accordance with the Fixed Income structure study, Staff recommends terminating the
position in Mondrian to fund a short duration core bond manager.

Dallas Police & Fire Pension System Fixed Income Structure Study April 14, 2016
Rhett Humphreys, CFA Partner Keith Stronkowsky, CFA Senior Consultant

• DPFP recently adopted a new long-term strategic Asset Allocation at the March 10th, 2016 meeting
• Within the liquid Fixed Income portfolio the new Asset Allocation includes:
– Changes to existing asset classes and their target weights – Introduction of targets for new asset classes
• Objectives include increased diversification, yield, and plan liquidity
Overview
Asset Class
New
Target
Current Weight*
~Current $*
~Target $*
Core Bonds 2.0% 0.0% $0 $54m
Global Bonds 3.0% 4.8% $128m $81m
High Yield 5.0% 5.5% $149m $134m
Bank Loans 6.0% 1.8% $49m $161m
EMD (50/50) 6.0% 2.0% $55m $161m
Absolute Return & Structured Credit
6.0% 0.0% $0 $161m
Total Fixed Income 28.0% 14.1% $382m $752m
*Estimated values as of 2/29/16 provided by DPFP staff. Current weight and target $ based on NAV of DPFP. Target $ will depend on market movements and timing of implementation. Ranges established around new target weights (e.g., range for Core Bonds is 0% - 5%.
1

• Description – Managers primarily invest in investment grade securities such as Treasuries, Agency
debentures, corporate bonds, Agency mortgage-backed securities and commercial mortgage-backed securities
– May invest in out-of-benchmark securities to enhance return, but generally investments are risk controlled
• Why include in a portfolio
– Stabilize portfolio returns – Low(er) correlations to equities – Liquidity
• Current State
– Target of 2%, or ~$54m of Plan assets – No assets currently invested
• Implementation
– Recommend hiring one manager – IR&M – Harvest assets from the overweight to Global Bonds (Mondrian) to fund this mandate
• NEPC’s assumed return: 1.75% • NEPC’s assumed risk: 2.50%
DPFP: Short Duration Core Bonds
*Based on NEPC ‘s 2016 Capital Market outlook and assumptions. Risk and return assumptions are 5-7 year annualized forecasts.
2

• Description – Managers invest in U.S., and non- U.S. sovereign debt, currencies, investment grade
corporate bonds, etc. – In addition to interest rate and credit risk, the global nature of the portfolios also
introduce country and currency risk
• Why include in a portfolio – Stabilize portfolio returns – Low(er) correlations to equities – Broad diversification across markets and sectors
• Current State
– Target of 3%, or ~$81m of Plan assets – Current weight of 4.4% and ~$128m
• Implementation
– Currently overweight relative to target allocation – Harvest assets from Mondrian to fund Core Bond (short duration) allocation – Retain Brandywine
• NEPC’s assumed return: 1.00% • NEPC’s assumed risk: 8.50%
DPFP: Global Bonds
*Based on NEPC ‘s 2016 Capital Market outlook and assumptions. Risk and return assumptions are 5-7 year annualized forecasts.
3

• Description – Managers invest in corporate bonds with below investment grade credit ratings – Relative to investment grade bonds, high yield issues have higher yields, higher
default risk, lower financial stability and/or more leverage – Portfolios are diversified to limit default risk of a single issuer
• Why include in a portfolio – Attractive coupon yields – Good risk-adjusted returns
• Current State
– Target of 5%, or ~$134m of Plan assets – Current weight of 5.1% and ~$150m
• Implementation
– Currently within range of target allocation – Maintain current exposures while NEPC and Staff research for potential additions and
changes to the space
• NEPC’s assumed return: 5.25% • NEPC’s assumed risk: 13.00%
DPFP: High Yield
*Based on NEPC ‘s 2016 Capital Market outlook and assumptions. Risk and return assumptions are 5-7 year annualized forecasts.
4

• Description – Managers invest in secured commercial loans made by a group of banks to companies
that are then sold (“syndicated”) to other banks and institutional investors – Loans are primarily to non-investment grade companies, carry floating rate coupons
(Libor + spread) that reset every 30-90 days, secured (collateral), and senior in the capital structure
• Why include in a portfolio – Low(er) correlation to other asset classes – Reduced interest rate risk – Attractive yields relative to other areas of the bond market – Relative to High Yield bonds, Bank Loans historically have had lower price volatility and
default risk, and higher recovery rates
• Current State – Target of 6%, or ~$161m of Plan assets – Current weight of 1.7% and ~$49m
• Implementation – Currently underweight relative to target allocation – Maintain exposure to Loomis Sayles Floating Rate & Fixed Income Fund – Look for 1-2 additional Bank Loan managers to complement Loomis Sayles Floating
Rate & Fixed Income Fund – Utilize funds from Illiquid assets (e.g., Private Equity, Real Estate) as a funding source
as they become available • NEPC’s assumed return: 5.50% • NEPC’s assumed risk: 9.00%
DPFP: Bank Loans
*Based on NEPC ‘s 2016 Capital Market outlook and assumptions. Risk and return assumptions are 5-7 year annualized forecasts.
5

• Description – Managers invest in bonds of emerging countries and corporate bonds of companies
domiciled in emerging countries – Securities can be external (typically issued in USD or Euros) or local (issued in currency
of issuing country or corporation) – In addition to interest rate and credit risk, the global nature of the portfolios also
introduce country and currency risk
• Why include in a portfolio – Attractive yields relative to developed markets – Potential to add incremental return – Diversification
• Current State
– Target of 6%, or ~$161m of Plan assets – Current weight of 1.9% and ~$55m
• Implementation
– Currently underweight relative to target allocation – In the near term maintain Ashmore exposures across both external and local currencies – Look to hire 1-2 additional managers – Utilize funds from Illiquid assets (e.g., Private Equity, Real Estate) as a funding source as
they become available
• NEPC’s assumed return: 4.75% (external), 6.50% (local) • NEPC’s assumed risk: 13.00% (external), 15.00% (local)
DPFP: Emerging Market Debt (external and local currency)
*Based on NEPC ‘s 2016 Capital Market outlook and assumptions. Risk and return assumptions are 5-7 year annualized forecasts.
6

• Description – Managers invest in securities across multiple sectors of the credit markets (e.g.,
investment grade credit, high yield, bank loans) as well as in structured (e.g., asset backed securities) and inflation linked securities
– Investment vehicles and structures are less liquid than traditional vehicles
• Why include in a portfolio – Potential for increased yield and cash flows – Can serve to reduce risk and/or increase return, or both – Diversification
• Current State – Target of 6%, or ~$161m of Plan assets – No assets currently invested
• Implementation
– Look to hire 3-5 managers to fill out this asset class – Utilize funds from Illiquid assets (e.g., Private Equity, Real Estate) as a funding source
as they become available
• NEPC’s assumed return: 5.25% • NEPC’s assumed risk: 8.00%
DPFP: Absolute Return & Structured Credit
*Based on NEPC ‘s 2016 Capital Market outlook and assumptions. Risk and return assumptions are 5-7 year annualized forecasts.
7

• Implementation of the new liquid Fixed Income target allocations will take time (0-2 plus years) given the current structure of the Plan’s investments
• Observations & recommendations in this study represent the initial steps and action items with regards to the new targeted allocation of the Fixed Income portfolio
– Hiring of IR&M to fill the void in the Core Bond space – Rebalancing of the Global Bond allocation – High Yield, Bank Loans, EMD, Absolute Return & Structured Credit research and due
diligence in process
• NEPC and Staff will bring forth additional action items & recommendations as due diligence is complete, and assets become available from the illiquid portion of the portfolio
DPFP: Summary
8

INVESTMENT RECOMMENDATION
Date: April 14, 2016 To: DPFP Board From: DPFP Investments Staff Subject: Fixed Income structure study
Recommendation
In accordance with the Fixed Income structure study, Staff recommends terminating the position in
Mondrian to fund a short duration core bond manager.
Executive Summary
At the March 10, 2016 Board meeting the Board approved an increase to the liquid fixed income target allocation from 15% to 28%. This change is expected to increase liquidity, produce moderate consistent returns and provide diversification. The structure study will explain the build out of the sub-asset classes within the Fixed Income broader asset class such as which managers to retain/eliminate, reasonable number of managers in each sub-asset class and the expected timeline to complete the build out. As of 02/29/16 the fixed income holdings relative to target allocations are as follows:

Short Duration Core Bonds
Core Bonds are generally well diversified across the US Investment grade bond market which includes US Treasuries and government related debt, investment grade corporate debt, agency backed mortgage securities and other asset backed securities. This sub-asset class will serve as the anchor of the fixed income portfolio supplemented by other fixed income sub-asset classes to diversify and drive returns.
Exposure in short duration core bonds provides important downside protection with today’s uncertainties in the market such as the timing of the Federal Reserve’s rate hikes, weak oil and commodity prices, and the trajectory of China’s growth and policy. Short duration core bonds are less sensitive to interest rate changes than securities with longer durations. This short duration core bond allocation will provide liquidity and safety but will not be a return driver for the portfolio in the current market environment. The asset class is however expected to deliver slightly higher returns than a money market investment. DPFP currently does not have any capital currently dedicated to US core bonds and the target allocation is 2%. There is an immediate need to fill this space as staff restructures the portfolio and transitions to new managers. This sub-asset class would be used as an alternative to holding cash when assets are liquidated, while decisions are to be made where to redeploy funds and for rebalancing. Income Research + Management (IR+M) will present at the April 14, 2016 Board meeting and would be placed in this sub-asset class if hired and would complete the build out of the short duration core bond sub-allocation. See separate memo for staff’s recommendation on IR+M.
Global Bonds
Global bonds are bonds issued from any country and denominated in any currency. This sub-asset class will invest primarily in investment grade bonds from developed markets including the US, but can also invest in emerging market corporate and sovereign bonds.
DPFP’s current investment managers, Brandywine and Mondrian would be placed in this sub-asset class. However, the target allocation to global bonds is 3% and the current allocation is overweight by 1.77%. DPFP investment staff anticipates maintaining the position in Brandywine and liquidating the position in Mondrian to reduce the current allocation to target. In comparison, Brandywine has a broader more flexible strategy than Mondrian which allows Brandywine to take on incremental risk and produce better risk adjusted returns over the long term. For example, Brandywine’s more opportunistic mandate can fully utilize their risk budget by investing in longer duration securities which can generate higher yield as demonstrated in Brandywine’s longer performance. Brandywine’s duration range is 1-10 years vs. Mondrian’s +/-1.5 years of the Barclay’s Global Aggregate Index and Brandywine’s average yield 3.9% compared to 2.3% for Mondrian as of December 31, 2015. Staff recommends redeeming the assets in Mondrian and redeploying the capital to fill the short duration core bond allocation, while reducing the global bond allocation to the 3% target.
High Yield
High yield bonds are typically fixed rate, subordinated debt of companies with below investment grade credit ratings, (below BBB/Baa). The risk of default is greater in securities with lower credit ratings, so these types of bonds pay higher coupons to investors to compensate them for the risk. As subordinated debt instruments, these bonds often also have lower recoveries when they default than other debt securities that are senior to them in the capital structure.

Current positions in Loomis Sayles Global Opportunistic and WR Huff High Yield total 5.53% of DPFP’s portfolio and the target allocation to high yield is 5%. DPFP investment staff recommends maintaining the position in Loomis Sayles Global Opportunistic and will look to transition the WR Huff high yield assets to a new manager mid-2016 (est), due to consistent underperformance. Staff does not want to reduce DPFP’s exposure to the high yield space at this time, as the assets are attractively priced and offer a significant cash yield. Adding 1-2 managers in addition to Loomis Sayles in the high yield sub-allocation is ideal and staff expects this build out to be complete between mid to late 2016. High yield and bank loan spreads are at their widest since 2012 creating attractive entry points.
Bank Loans
Bank loans, also known as leveraged loans are senior secured, floating rate debt of below investment grade companies. These loans are often syndicated or issued by a group of lenders such as banks and institutional investors. They are used for buyout type transactions, recapitalizations or to refinance existing debt. These types of loans will have a higher interest rate than other types of higher rated floating rate debt to compensate for the credit risk of the loan. Bank loans may also have covenants to help protect the lender against default risk and typically see significantly higher recoveries in the event of default than high yield bonds.
DPFP’s investment in Loomis Sayles Senior Floating Rate & Fixed Income fund represents 1.82% of the portfolio and the target allocation is 6%. Staff will propose hiring 1-2 additional bank loan managers to fulfill this allocation over the course of 2016 and early 2017 (est.) as capital becomes available. Staff has begun meeting with various bank loan managers to build out this allocation. One potential strategy might be a high quality loan portfolio with a turn of leverage which could serve as a complement to the more opportunistic Loomis Senior Floating Rate & Fixed Income fund which includes high yield in the portfolio. Bank loan valuations are fairly attractive now and their seniority in the capital structure is beneficial. Investing in bank loans can increase return while taking on less risk compared to some other fixed income assets. Floating rate loans will also be positively impacted by Fed rate hikes and will reduce duration risk in the fixed income portfolio.
Emerging Market Debt
Emerging market debt includes sovereign, municipal, corporate and structured debt of emerging market economies. It is divided into emerging market local currency and external debt which is denominated in a developed country’s currency.
DPFP’s current exposure to emerging market debt is through two Ashmore funds; Emerging Market Debt Fund and Emerging Market Local Currency Fund. Our current allocation is 2.04% with a 6% target. For now, staff recommends retaining these positions and will explore other opportunities in the 4th quarter of 2016 and over the course of 2017 (est.) to reach the target allocation. We anticipate 2-3 managers in this space. While emerging market debt can provide excess returns, it is appropriate to remain cautious due to uncertainty in the global economy. Emerging market currency valuations are the cheapest they have been in the last 10 years and real interest rates remain attractive in emerging markets relative to developed markets.
Absolute Return & Structured Credit
Absolute return strategies, commonly referred to as hedge funds, seek to generate positive returns versus a relative return approach which seeks to beat a specific benchmark. Absolute return managers may utilize multiple traditional and non-traditional investment techniques to meet their objectives of low correlation and more constant absolute returns. They may invest in untraditional

assets and will likely utilize futures, options and other derivatives in their portfolio. Typical strategies may include arbitrage, leverage and shorting for alpha or hedging purposes.
Structure credit strategies my include any of the above techniques, but focus on investments in debt securities of a pool of securities (bonds, loans, etc) packaged into a structure designed to provide leverage for a type of lending activity. These securities and structures are categorized by the type of underlying debt instruments that they hold and include asset backed securities (ABS), mortgage backed securities (MBS) and collateralized loan obligations (CLO) as well as other types of structures.
Currently, DPFP has zero exposure to absolute return and structured credit and the target allocation is 6%. Although, absolute return strategies and structured credit are less liquid, they will be return drivers for the portfolio and help reduce overall portfolio risk due to their low correlations and more stable return profiles. Staff anticipates having 2-3 managers in this space and is likely to recommend a manager for absolute return at the May or June Board meeting. Staff plans to complete this sub-asset class build out by early 2017. Staff has begun meetings with managers and will continue its search and review of the space throughout the remainder of the year.

DISCUSSION SHEET
Regular Board Meeting – Thursday, April 14, 2016
ITEM #C5
Topic: Income Research & Management
Attendees: Ed Ingalls, Senior Portfolio Manager, Principal Matt Drasser, Senior Vice President
Discussion: As part of the Fixed Income structure study, the first step was to build out the short duration core bonds sub-allocation. NEPC and Staff conducted a search for a high quality short duration core bond manager and selected Income Research + Management (IR+M) to present their 1-3 Year Strategy to the Board. NEPC and Staff have provided memos outlining the process and support for this selection.
IR+M is a US fixed income manager that employs a credit-intensive value-oriented approach. IR+M was founded in 1987 by brothers John and Jack Sommers and is exclusively a fixed income boutique firm that is 85% employee owned and 15% family owned. Current assets under management are $54.9 billion with $2.1 billion in the 1-3 Year Strategy.
Staff Recommendation: Staff recommends approving an initial investment of $50,000,000 to the Income Research +
Management (IR+M) 1-3 year strategy within DPFP’s short duration core fixed income sub-asset allocation.
100 Federal Street, 30th Floor, Boston, MA 02110 (617) 330-9333 www.incomeresearch.com
DALLAS POLICE & FIREPENSION SYSTEMApril 14, 2016
Presented by: Matt DrasserEd Ingalls, CFA
1

2
IR+M FIXED INCOME CAPABILITIES
IR+M OVERVIEW

3
FIRM FACTS • 28+ year history, privately owned
• 43 employee shareholders
• $56.5 billion in assets under management
• Exclusively US dollar-denominated fixed income
• Consistent management team since inception
• 10+ year average tenure for portfolio management team
As of 2/29/16
IR+M OVERVIEW KEY FACTS
ASSETS BY CLIENT TYPE
KEY DIFFERENTIATORS
+ INDEPENDENT FIRM
+ COLLABORATIVE CULTURE
+ VALUE-ORIENTED APPROACH
+ CLIENT FOCUS
29% Corporate
21% Not-for-Profit
13% Insurance
10% Sub-Advisory
10% Government
9% Taft Hartley/Union/Other
8% Private

4
GOVERNMENT: 36City of Anniston, AL Police & Fire Retirement SystemBristol County, MA Retirement SystemCambridge, MA Retirement SystemCity of Detroit, MI Police & Fire Retirement SystemGovernment of Guam Retirement FundIllinois Student Assistance CommissionCity of Knoxville, TN Pension BoardMetropolitan St. Louis Sewer DistrictNew Castle County Employees’ Pension ProgramNew Hampshire Retirement SystemCity of Orlando, FLPlymouth County, MA Retirement AssociationCity of Springfield, MO Police & Fire Retirement SystemCommonwealth of VirginiaCity of Warwick, RIWashington Suburban Sanitary Commission
FAITH-BASED: 26American Bible SocietyArchdiocese of CincinnatiCampus Crusade for Christ Inc.Catholic Relief Services Church of the Brethren Benefit TrustDiocese of BuffaloDiocese of Rockville CentreThe First Church of Christ, ScientistKnights of ColumbusNorthern California Conference of Seventh-Day Adventists The Salvation Army, IllinoisSisters of the Precious Blood
This is a partial list of IR+M’s clients as of 2/29/16. The list excludes confidential clients, private clients, and investors in private placements. It is not known whether the clients listed here approve or disapprove of IR+M or of the investment advisory services provided.
CORPORATE: 67AMETEK, Inc.Belk, Inc.Blue Hills BankCisco SystemsCummins Inc.HARSCOJones DayKaman CorporationLyondellBasell Industries, Inc.MBTA Retirement FundMerck & Co., Inc.Neiman Marcus Group, Inc.Northrop Grumman, Inc.Pitcairn Financial GroupSBC Holdings, Inc.Textron, Inc.
INSURANCE: 40American Bankers Mutual InsuranceAmerican Physicians Assurance CorporationAnthem Insurance Companies, IncAnthem Health Plans of Kentucky, IncAttorneys' Liability Assurance SocietyAvMed Health PlansBETA Healthcare GroupBlue Cross Blue Shield of KansasBlue Cross Blue Shield of MassachusettsBlue Cross Blue Shield of TennesseeCapital Insurance GroupCareMore Health PlanCCC Investment TrustCidel Bank & Trust Inc.Cidel Fund Management Inc.Commonwealth Professional Assurance Co.Excellus Health Plan, Inc.Fallon Community Health PlanMAG Mutual Insurance Co.MedAmerica Insurance CompanyMedAmerica Insurance Company of FloridaMedAmerica Insurance Company of New YorkMIG Assurance (Cayman) Ltd.Mountain States HealthcareMVP Health Plan, Inc.Neighborhood Health Plan of Rhode IslandNew Life Insurance CompanyTufts Associated Health PlansVolunteer State Health Plan, Inc.
SUB-ADVISORY: 9CommonfundEACM Advisors LLCSEI Investments Management CorporationSummit Strategic Solutions, LLC
UNION AND TAFT HARTLEY: 22Laborers’ International Union of North AmericaNew England Health Care Employees’ Pension FundPipefitters Benefit FundTeamsters Joint Council Pension FundSheet Metal Workers Pension FundSocial Service Employees Union Annuity FundUnion Individual Account Retirement FundUnited Food and Commercial WorkersUnited Scenic Artists
HEALTHCARE: 38Adventist Health SystemAllina Health SystemBoston Medical Center CorporationCarolinas HealthCare Foundation, Inc.CT Children’s Medical CenterDeKalb Regional Health System, Inc.Henry Ford Health SystemHoag Memorial Hospital PresbyterianMaine Medical CenterMassachusetts Medical SocietyMemorial Sloan-Kettering Cancer CenterMetroWest Community Health Care FoundationMoses Cone Health SystemNewYork-Presbyterian HospitalRegenstrief Foundation, Inc.Rochester General HospitalSouthcoast Hospital GroupSturdy Memorial HospitalTrinitas Regional Medical CenterTufts Medical CenterUMass Memorial Health Care
EDUCATION: 43Arizona State UniversityClaremont McKenna CollegeColby CollegeIthaca CollegeKingswood Oxford SchoolNorwich UniversityThe Rockefeller UniversitySt. Lawrence UniversitySyracuse UniversityTemple UniversityTexas Tech UniversityTrinity UniversityUniversity of Illinois FoundationUniversity of Maine SystemUniversity of MassachusettsUniversity of San DiegoWest Virginia University Foundation
ENDOWMENT, FOUNDATION, & OTHER: 51American Insurance AssociationThe Boston FoundationBill and Melinda Gates FoundationCentral New York Community FoundationThe Charles Hayden FoundationThe Community Foundation for Greater New Haven, Inc.Fund for New JerseyHartford Foundation for Public GivingIEEE, Inc. The McConnell FoundationMSPCAThe Oregon Community FoundationQueen Lili`uokalani TrustThe Rhode Island Community FoundationThe Samuel Roberts Noble FoundationThe Trustees of ReservationsYawkey Foundation
IR+M OVERVIEW DIVERSITY OF CLIENTS

5
IR+M OVERVIEW INVESTMENT PROFESSIONALS
Matt DrasserAssistant Vice President
Jack Sommers, CFAManaging PrincipalSenior Portfolio Manager31 years experience
PORTFOLIO MANAGEMENT / DIRECTORS
John SommersManaging PrincipalSenior Portfolio Manager51 years experience
Scott Pike, CFAPortfolio Manager19 years experience
Bill O’Neill, CFASenior Portfolio Manager, Principal16 years experience
Mike Sheldon, CFASenior Portfolio Manager, Principal25 years experience
Sarah KilpatrickSenior Portfolio Manager, Principal14 years experience
Jake Remley, CFASenior Portfolio Manager, Principal15 years experience
Matt Walker, CFAPortfolio Manager13 years experience
Bill O’Malley, CFAManaging PrincipalSenior Portfolio Manager28 years experience
MANAGING PRINCIPALS
Ed Ingalls, CFASenior Portfolio Manager, Principal37 years experience
CLIENT TEAM
Eric Mueller, CFASenior Vice President
Rob Lund, CFASenior Vice President
Nils Hegstad, CFAVice President
Brooke Anderson, CFASenior Vice President
Jamie Gordon, CFASenior Vice President
Angela Meringoff, CFASenior Vice President
Molly ManningDirector of Client Service
ANALYSTS (23)
Portfolio Risk: 6Securitized/Government: 4Analysts working on:
Paul Clifford, CFASenior Portfolio Manager, Principal30 years experience
Kara Maloy, CFADirector of Credit Research10 years experience
Credit: 13
Jim Gubitosi, CFASenior Portfolio Manager, Principal12 years experience
Matt DrasserSenior Vice President
Tim Boomer, FSASenior Vice President
As of 2/29/16
Allysen Mattison, CFADirector of Investment Risk11 years experience
Allison WalshVice President
Katy GalfordAssistant Vice President

6
IR+M FIXED INCOME CAPABILITIES
INVESTMENT STRATEGY + PROCESS

7
+ Relative-value oriented, duration-neutral approach
+ Emphasize bottom-up security selection to drive sector rotation
• Benchmark aware, not beholden
• Take what the market gives you
+ Introduce incremental risk to portfolios when compensation is attractive
+ Believe careful security selection and risk management provide superior results over the long term
VALUE-ORIENTED APPROACH
INVESTMENT PHILOSOPHY
IR+M INVESTMENT PHILOSOPHY

8
IR+M INVESTMENT PROCESS BOTTOM-UP APPROACH
FIXED INCOME UNIVERSE INVESTMENT PROCESS FILTERS IMPLEMENTATION
Portfolio
Bonds we don’t
like
Best ideas
Credit
Securitized
Government
Municipal

9
IR+M INVESTMENT PROCESS UNIQUE OPPORTUNITIES
Yiel
d (%
)• Market complexities create overlooked bond structures/issues with attractive return profiles and
favorable characteristics
• Unique structures and off-the-run points on the yield curve have potential for yield, OAS, and convexity advantages
¹Issuer offers 40+ index-eligible bonds and 300+ out-of-index bonds. Spread example is for illustrative purposes only. This is not a recommendation to purchase or sell any specific security. Actual results may differ.
VALUE-ORIENTED APPROACH
Duration (Yrs)
Large Financial Company Yield Curve1
Off-the-Run Bullet Floating Rate NoteLease-Backed Bond Subordinated Bank DebtCentury Bond On-the-Run Curve

10
¹Sample IR+M Securitized Portfolio as of 2/29/16. Includes Small Business Administration Bonds (SBAs).²Sample IR+M Agency MBS Portfolio as of 2/29/16. Data after 1/21/15 includes an adjustment factor to account for Barclays MBS prepayment model change.There are limitations in sample results, including the fact that such results neither represent trading nor reflect the impact thateconomic market factors might have had on the management of the account if the adviser had been managing an actual clients money. Actual results may differ. A similar analysis can be provided of any portfolio we manage.Sources: Bloomberg and Barclays
Years MBS Durations: IR+M Sample² vs. Barclays Aggregate MBS Index
VALUE-ORIENTED APPROACH2/29/16Characteristics
IR+MSecuritizedPortfolio¹
BarclaysSecuritized
IndexOAS (bp) 95 29Effective Duration (yrs) 2.61 3.17Convexity (0.41) (2.01)
12/31/15OAS (bp) 99 31Effective Duration (yrs) 2.79 4.47Convexity (0.49) (1.41)
Agency Hybrid ARMS• Primarily floating-rate securities• Capture large portion of OAS• $40bn universe provides opportunity for security selection
Agency Fixed-Rate MBS• Specified pass-through pools, CMOs• Provide better cash flow characteristics vs. generic TBA pools• Strong liquidity profile
Agency Multi-Family MBS• Agency guaranteed multi-family program• Loan level and structural features help provide cash flow stability• $303bn universe
CMBS• Preference for Super Senior securities• Primarily seasoned holdings with attractive cash flow
characteristics• Well diversified collateral pools
ABS• Senior cards, autos, and equipment deals • Liquid• Front-end yield pick-up
SBA• 504 Loan Program• Full faith and credit of the US Treasury• Embedded prepayment protection
2
3
4
5
6
7
12/12 6/13 12/13 6/14 12/14 6/15 12/15
IR+M Agency MBS PortfolioBarclays Aggregate MBS
IR+M INVESTMENT PROCESS SECURITIZED OPPORTUNITIES
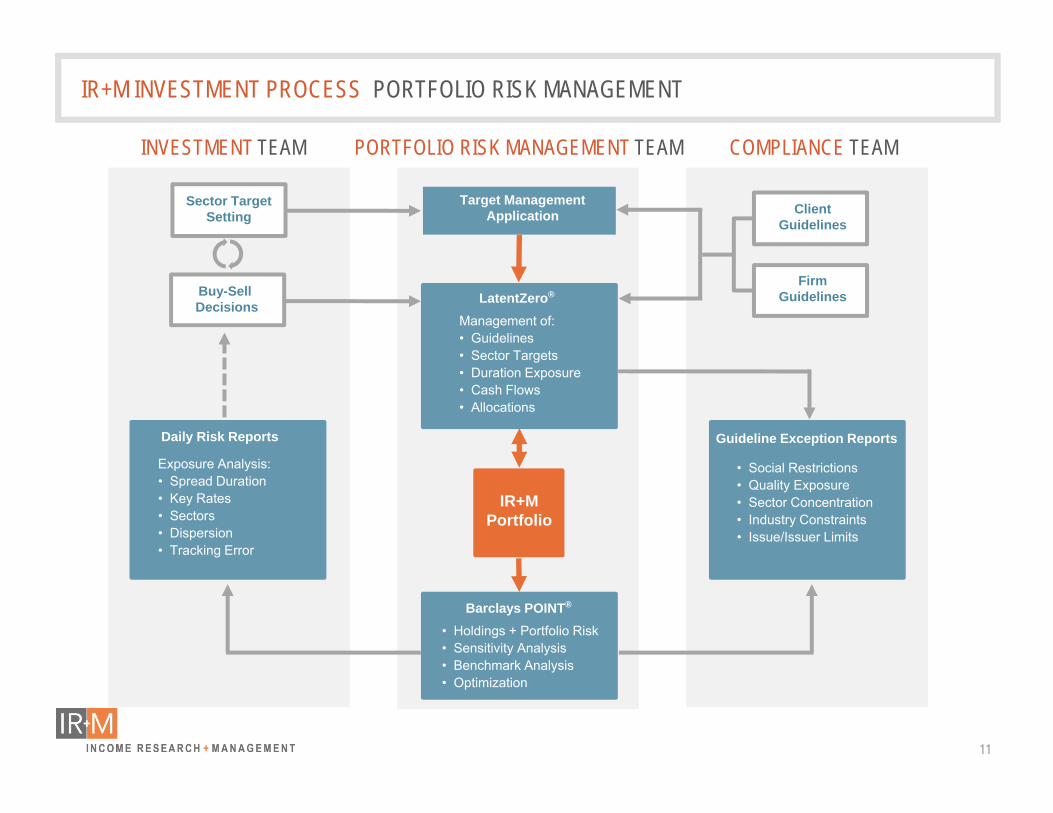
11
IR+M INVESTMENT PROCESS PORTFOLIO RISK MANAGEMENT
INVESTMENT TEAM PORTFOLIO RISK MANAGEMENT TEAM COMPLIANCE TEAM
Sector TargetSetting
Buy-Sell Decisions
Daily Risk Reports
Exposure Analysis:• Spread Duration• Key Rates• Sectors• Dispersion• Tracking Error
Management of:• Guidelines• Sector Targets• Duration Exposure• Cash Flows• Allocations
Target ManagementApplication
• Holdings + Portfolio Risk• Sensitivity Analysis• Benchmark Analysis• Optimization
FirmGuidelines
• Social Restrictions• Quality Exposure• Sector Concentration• Industry Constraints• Issue/Issuer Limits
LatentZero®
IR+M Portfolio
Barclays POINT®
Guideline Exception Reports
ClientGuidelines

12
IR+M FIXED INCOME CAPABILITIES
STRATEGY OVERVIEWIR+M 1-3 YEAR
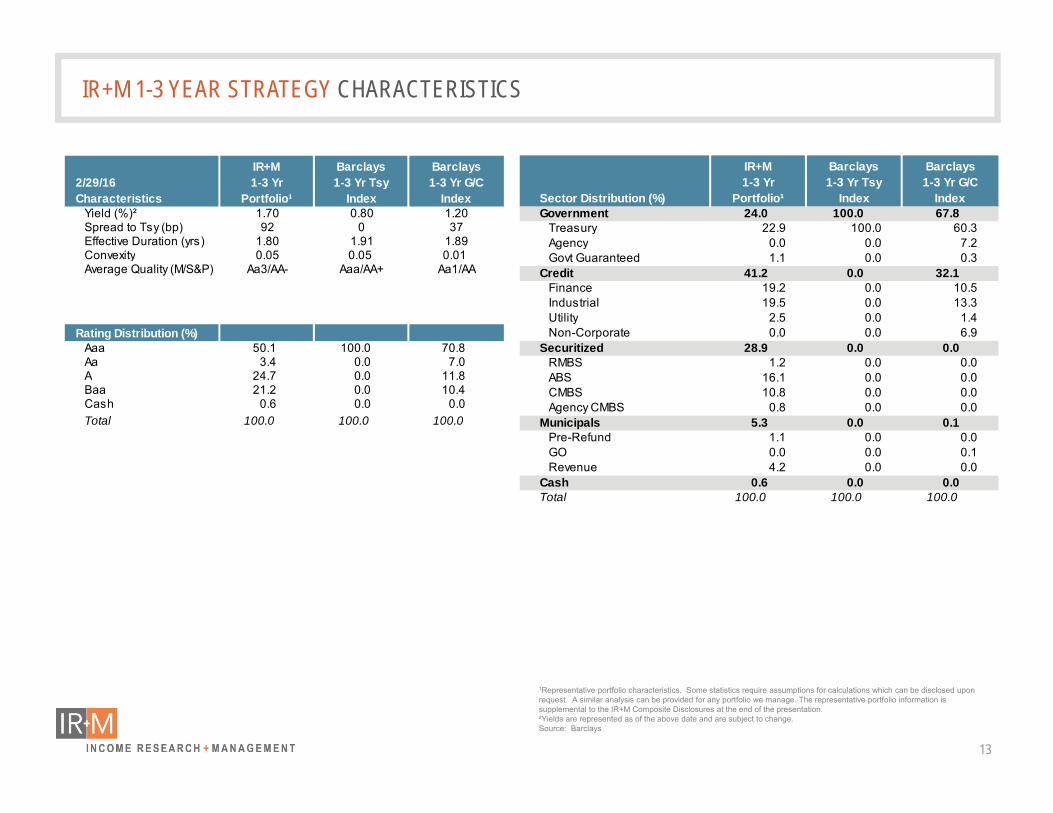
13
IR+M 1-3 YEAR STRATEGY CHARACTERISTICS
2/29/16Characteristics
IR+M1-3 Yr
Portfolio¹
Barclays1-3 Yr Tsy
Index
Barclays1-3 Yr G/C
IndexYield (%)² 1.70 0.80 1.20Spread to Tsy (bp) 92 0 37Effective Duration (yrs) 1.80 1.91 1.89Convexity 0.05 0.05 0.01Average Quality (M/S&P) Aa3/AA- Aaa/AA+ Aa1/AA
Rating Distribution (%)Aaa 50.1 100.0 70.8Aa 3.4 0.0 7.0A 24.7 0.0 11.8Baa 21.2 0.0 10.4Cash 0.6 0.0 0.0Total 100.0 100.0 100.0
Sector Distribution (%)
IR+M1-3 Yr
Portfolio¹
Barclays1-3 Yr Tsy
Index
Barclays1-3 Yr G/C
IndexGovernment 24.0 100.0 67.8
Treasury 22.9 100.0 60.3Agency 0.0 0.0 7.2Govt Guaranteed 1.1 0.0 0.3
Credit 41.2 0.0 32.1Finance 19.2 0.0 10.5Industrial 19.5 0.0 13.3Utility 2.5 0.0 1.4Non-Corporate 0.0 0.0 6.9
Securitized 28.9 0.0 0.0RMBS 1.2 0.0 0.0ABS 16.1 0.0 0.0CMBS 10.8 0.0 0.0Agency CMBS 0.8 0.0 0.0
Municipals 5.3 0.0 0.1Pre-Refund 1.1 0.0 0.0GO 0.0 0.0 0.1Revenue 4.2 0.0 0.0
Cash 0.6 0.0 0.0Total 100.0 100.0 100.0
¹Representative portfolio characteristics. Some statistics require assumptions for calculations which can be disclosed upon request. A similar analysis can be provided for any portfolio we manage. The representative portfolio information is supplemental to the IR+M Composite Disclosures at the end of the presentation.²Yields are represented as of the above date and are subject to change.Source: Barclays

14
0.73
1.30 1.20
1.88
3.25
3.65
5.65
0.680.99 0.90
1.58
2.95
3.35
5.34
0.720.99
0.73 0.841.12
2.47
4.69
0
1
2
3
4
5
6
7
YTD 2016 1 Year 3 Year 5 Year 7 Year 10 Year Since Inception⁴
IR+M 1-3 Yr Composite (Gross of Fees)² IR+M 1-3 Yr Composite (Net of Fees)³ Index¹
IR+M 1-3 Year Composite vs. Index¹Investment Results²
(2/29/16)
IR+M 1-3 YEAR STRATEGY PERFORMANCE
¹Index is Barclays 1-3 Year Treasury Index. Prior to 1/1/13, Index was BofA Merrill Lynch 1-3 Year Treasury Index.²The investment results shown do not reflect the deduction of investment advisory fees. The investment advisory fees charged by Income Research & Management are described in Part 2A of IR+M's Form ADV, which isavailable upon request. Actual returns will be reduced by advisory fees and any other expenses (custodial, etc.) that may be incurred in the management of an investment account. Investment management fees do havean effect on the investment results achieved by a client. For instance, on a $50 million short portfolio, an example IR+M fee might be 0.28%. A gross hypothetical return of 10.00% in a given year would be reduced to 9.72%if the client's annual investment management fee were 0.28%. Over a 5-year period of annual 10% returns, a gross return of 61.05% would be reduced to 59.01% after the deduction of investment management fees. Otherstrategies may have different standard fees. Total returns including realized and unrealized gains plus interest and dividends are used to calculate investment performance. Cash is included in performance calculation. Allreturns are expressed in US$ terms. Trade date accounting and valuation are used. Past performance is not indicative of future results. Please see additional disclosures for important composite performance information.Periods over one year are annualized.³IR+M's net of fee calculation is not an actual composite net of fee return and is for illustrative purposes only. Actual fees may differ. IR+M’s net of fee calculation is based off of the highest breakpoint of our standard fee forthis product.⁴Inception: 12/31/88 – 2/29/16. Annualized. A similar analysis can be provided for any time period since inception.
Return (%)

15
• Since inception, during periods of rising and falling rates as well as spread movement in both directions, there have been no negative quarterly trailing 1-year returns1
Quarterly Trailing 1-Year Returns for the IR+M 1-3 Year Composite2
(12/31/15)%
0
2
4
6
8
10
12
14
16
4Q89 2Q91 4Q92 2Q94 4Q95 2Q97 4Q98 2Q00 4Q01 2Q03 4Q04 2Q06 4Q07 2Q09 4Q10 2Q12 4Q13 2Q15
¹Inception Date: 12/31/88²The investment results shown do not reflect the deduction of investment advisory fees. The investment advisory fees charged by Income Research & Management are described in Part 2A of IR+M's Form ADV, which isavailable upon request. Actual returns will be reduced by advisory fees and any other expenses (custodial, etc.) that may be incurred in the management of an investment account. Investment management fees do havean effect on the investment results achieved by a client. For instance, on a $50 million short portfolio, an example IR+M fee might be 0.28%. A gross hypothetical return of 10.00% in a given year would be reduced to9.72% if the client's annual investment management fee were 0.28%. Over a 5-year period of annual 10% returns, a gross return of 61.05% would be reduced to 59.01% after the deduction of investment management fees.Other strategies may have different standard fees. Total returns including realized and unrealized gains plus interest and dividends are used to calculate investment performance. Cash is included in performancecalculation. All returns are expressed in US$ terms. Trade date accounting and valuation are used. Past performance is not indicative of future results. Please see additional disclosures for important compositeperformance information.
IR+M 1-3 YEAR STRATEGY QUARTERLY RETURNS

16
+ Unique investment strategy that leverages our size advantage
+ History of being consistent in our organization, team and process
+ Availability of senior team to partner with clients
IR+M OVERVIEW SUMMARY

17
APPENDIX
IR+M FIXED INCOME CAPABILITIES

18
IR+M INTERMEDIATE GOVERNMENT CREDIT STRATEGY CHARACTERISTICS
2/29/16Characteristics
IR+M Intermediate G/C Portfolio¹
Barclays Intermediate G/C Index
Yield (%)² 2.52 1.76Spread to Tsy (bp) 132 59Effective Duration (yrs) 3.87 4.02Convexity 0.24 0.21Average Quality (M/S&P) Aa3/AA- Aa2/AA-
Rating Distribution (%)Aaa 45.4 64.7Aa 6.2 5.7A 22.0 13.7Baa 25.8 15.9Less than Baa 0.3 0.0Cash 0.3 0.0Total 100.0 100.0
¹Representative portfolio characteristics. Some statistics require assumptions for calculations which can be disclosed upon request. A similar analysis can be provided for any portfolio we manage. The representative portfolio information is supplemental to the IR+M Composite Disclosures at the end of the presentation.²Yields are represented as of the above date and are subject to change.Source: Barclays
Sector Distribution (%) IR+M Intermediate
G/C Portfolio¹Barclays Intermediate
G/C IndexGovernment 27.8 61.7
Treasury 20.6 57.2Agency 0.0 4.1Govt Guaranteed 7.2 0.4
Credit 48.0 38.1Finance 16.2 11.3Industrial 27.8 18.2Utility 1.9 1.7Non-Corporate 2.1 6.9
Securitized 20.3 0.0RMBS 1.1 0.0ABS 8.7 0.0CMBS 10.5 0.0
Municipals 3.6 0.2GO 0.0 0.1Revenue 3.6 0.1
Cash 0.3 0.0Total 100.0 100.0

19
1.451.66
1.91
3.47
5.44
4.95
6.51
1.72 1.831.63
2.85
3.824.22
5.89
0
2
4
6
8
YTD 2016 1 Year 3 Year 5 Year 7 Year 10 Year Since Inception²
IR+M Intermediate G/C Composite Barclays Intermediate G/C Index
Return (%)
IR+M Intermediate Government Credit Composite vs. Barclays Intermediate Government/Credit IndexInvestment Results¹
(2/29/16)
IR+M INTERMEDIATE GOVERNMENT CREDIT STRATEGY PERFORMANCE
¹The investment results shown do not reflect the deduction of investment advisory fees. The investment advisory fees charged by Income Research & Management are described in Part 2A of IR+M's Form ADV, which isavailable upon request. Actual returns will be reduced by advisory fees and any other expenses (custodial, etc.) that may be incurred in the management of an investment account. Investment management fees do havean effect on the investment results achieved by a client. For instance, on a $100 million portfolio, an example IR+M fee might be 0.28%. A gross hypothetical return of 10.00% in a given year would be reduced to 9.72% ifthe client's annual investment management fee were 0.28%. Over a 5-year period of annual 10% returns, a gross return of 61.05% would be reduced to 59.01% after the deduction of investment management fees. Otherstrategies may have different standard fees. Total returns including realized and unrealized gains plus interest and dividends are used to calculate investment performance. Cash is included in performance calculation. Allreturns are expressed in US$ terms. Trade date accounting and valuation are used. Past performance is not indicative of future results. Please see additional disclosures for important composite performance information.Periods over one year are annualized.²Inception: 9/30/89 – 2/29/16. Annualized. A similar analysis can be provided for any time period since inception.
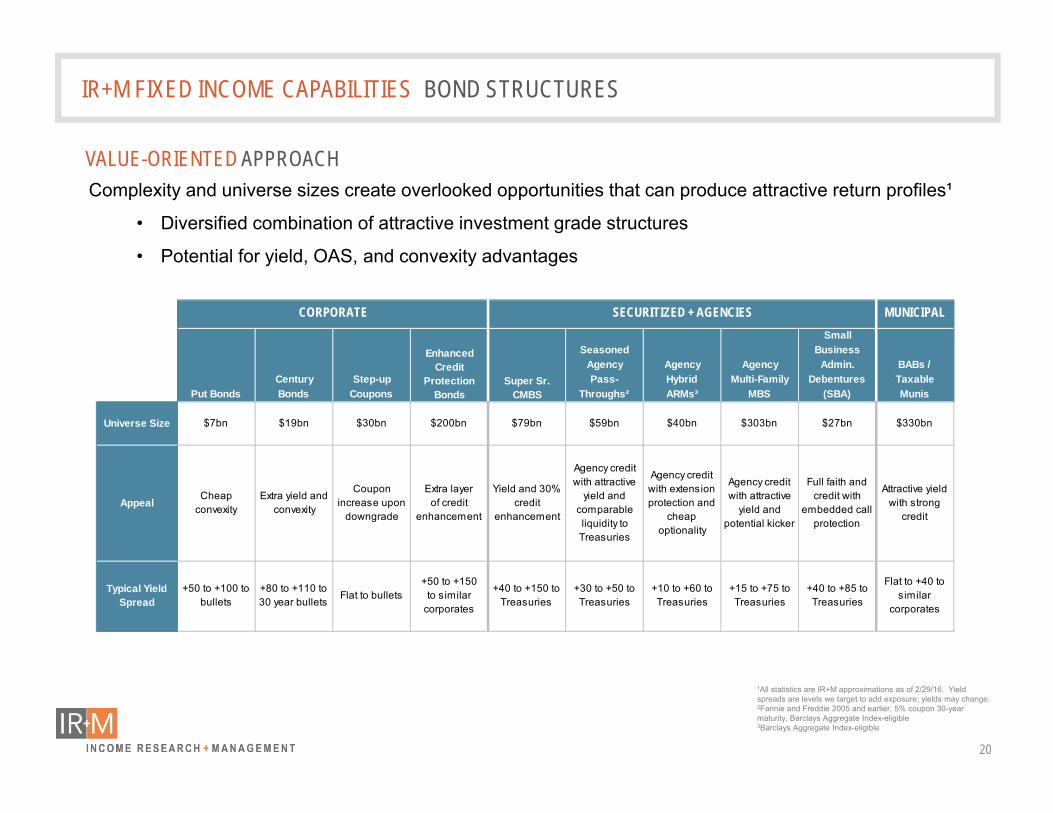
20
VALUE-ORIENTED APPROACHComplexity and universe sizes create overlooked opportunities that can produce attractive return profiles¹
• Diversified combination of attractive investment grade structures
• Potential for yield, OAS, and convexity advantages
MUNICIPALSmall
Seasoned BusinessAgency Agency Agency Admin. BABs /
Century Step-up Pass- Hybrid Multi-Family Debentures Taxable Put Bonds Bonds Coupons Throughs² ARMs³ MBS (SBA) Munis
Universe Size $7bn $19bn $30bn $200bn $79bn $59bn $40bn $303bn $27bn $330bn
AppealCheap
convexityExtra yield and
convexity
Coupon increase upon
downgrade
Extra layer of credit
enhancement
Yield and 30% credit
enhancement
Agency credit with attractive
yield and comparable liquidity to Treasuries
Agency credit with extension protection and
cheap optionality
Agency credit with attractive
yield and potential kicker
Full faith and credit with
embedded call protection
Attractive yield with strong
credit
Typical Yield Spread
+50 to +100 to bullets
+80 to +110 to 30 year bullets Flat to bullets
+50 to +150to similar
corporates
+40 to +150 to Treasuries
+30 to +50 to Treasuries
+10 to +60 to Treasuries
+15 to +75 to Treasuries
+40 to +85 to Treasuries
Flat to +40 to similar
corporates
Super Sr.CMBS
Enhanced Credit
Protection Bonds
CORPORATE SECURITIZED + AGENCIES
IR+M FIXED INCOME CAPABILITIES BOND STRUCTURES
¹All statistics are IR+M approximations as of 2/29/16. Yield spreads are levels we target to add exposure; yields may change.2Fannie and Freddie 2005 and earlier, 5% coupon 30-year maturity, Barclays Aggregate Index-eligible3Barclays Aggregate Index-eligible

21
Portfolio RiskNate Hollingsworth, CFASVP, Senior Portfolio Risk Analyst10 years experience
Annemarie BorteyPortfolio Risk Associate5 years experience
Research Rachel CampbellSenior Research Analyst10 years experience
Ralph SaturnéResearch Analyst9 years experience
Research Wesly Pate, CFASVP, Senior Research Analyst10 years experience
Michael Bronson Research Associate3 years experience
Research Kara Maloy, CFADirector of Credit Research10 years experience
Rob Nuccio, CFASenior Research Analyst8 years experience
Isha Chanana, CFAResearch Analyst10 years experience
Portfolio RiskJim LoftusSenior Portfolio Risk Analyst8 years experience
Mark RiordanPortfolio Risk Associate7 years experience
Portfolio RiskTucker LannonSenior Investment Risk Analyst11 years experience
Jeremy Holtz, CFASenior Portfolio Risk Analyst10 years experience
Trading Lucas MurraySVP, Senior Trader12 years experience
Preston Raymond, CFASenior Trader11 years experience
Samantha QuinnTrader4 years experience
TradingAndy TenczarSenior Trader18 years experience
Mark PaulsonSenior Trader10 years experience
Trading Justin Quattrini, CFASVP, Senior Trader13 years experience
SECURITIZED/GOVERNMENT
CREDIT (MUNICIPAL)
CREDIT (CORPORATE)
Kristoff Nelson, CFASVP, Senior Research Analyst8 years experience
Luke Ferriter, CFASenior Research Analyst12 years experience
Ginny Wood, CFAResearch Analyst6 years experience
As of 2/29/16
Rachel ChongResearch Associate5 years experience
John Costello Senior Research Analyst4 years experience
IR+M OVERVIEW ANALYST TEAM

22
IR+M COMPOSITE DISCLOSURES – 12/31/15
YearReturns (%) Number of
PortfoliosDispersion Assets (USD, mm)
Gross Net Benchmark (%) Composite Firm1989 11.01 10.68 10.87 ≤ 5 N/A 16 2461990 8.98 8.66 9.72 ≤ 5 N/A 18 2861991 13.72 13.39 11.67 ≤ 5 N/A 26 4181992 7.09 6.77 6.30 ≤ 5 N/A 40 5381993 7.77 7.45 5.41 ≤ 5 N/A 49 8031994 1.88 1.57 0.57 ≤ 5 N/A 49 9571995 11.44 11.12 11.00 ≤ 5 N/A 87 1,7001996 5.67 5.36 4.98 ≤ 5 N/A 68 1,9641997 6.73 6.41 6.66 ≤ 5 N/A 24 2,4201998 6.44 6.12 7.00 ≤ 5 N/A 21 3,0411999 4.24 3.93 3.06 ≤ 5 N/A 22 3,3742000 8.01 7.69 8.00 ≤ 5 N/A 215 3,6202001 9.22 8.90 8.30 ≤ 5 N/A 203 3,7052002 5.73 5.41 5.76 ≤ 5 N/A 291 3,847
1 to 3 Year CompositeJanuary 1, 1989 through December 31, 2015
YearReturns (%) Number of
PortfoliosDispersion Assets (USD, mm)
Gross Net Benchmark (%) Composite Firm2003 4.31 4.00 1.90 ≤ 5 N/A 453 5,1082004 2.59 2.28 0.91 ≤ 5 N/A 558 6,6362005 2.74 2.43 1.67 9 0.15 524 7,4802006 4.91 4.60 3.96 10 0.07 460 9,2382007 6.26 5.94 7.32 13 0.10 557 11,5072008 1.50 1.19 6.61 14 0.89 333 13,7182009 10.96 10.62 0.79 20 1.00 661 21,2522010 3.89 3.58 2.35 26 0.16 1,087 26,2952011 2.66 2.36 1.55 30 0.13 1,003 30,6762012 3.37 3.06 0.43 37 0.14 1,309 35,4662013 0.96 0.66 0.36 33 0.33 1,406 37,2242014 1.18 0.89 0.63 32 0.05 1,760 48,4142015 1.03 0.73 0.56 31 0.05 1,905 54,887
Year MV of bundled fee portfolio % of Composite Assets2011 69,631,775 7%2012 127,488,895 10%2013 229,808,734 16%2014 433,317,616 25%2015 471,593,591 33%
The three-year annualized ex-post standard deviation of the composite and benchmark as of year end is as follows:
Year Composite 3-Yr St Dev (%) Benchmark 3-Yr St Dev (%)2011 1.85 1.022012 0.99 0.732013 0.86 0.512014 0.76 0.442015 0.66 0.57
In 2011, one portfolio with a bundled fee entered the composite. The fee paid by the client also includes custody and administration charges. The following table shows the total percentage of composite assets composed of the bundled-fee portfolio:
IR+M's net of fee calculation is not an actual composite net of fee return and is for illustrative purposes only. Actual fees may differ.

23
IR+M COMPOSITE DISCLOSURES – 12/31/15 (continued)
Income Research & Management (“IR+M”) is an independent investment management firm with approximately $54.9 billion in assets under management. IR+M has no subsidiaries or divisions, all business is done at IR+M and all assets are managed by IR+M. A complete list of composite descriptions is available upon request. IR+M claims compliance with the Global Investment Performance Standards (GIPS®) and has prepared and presented this report in compliance with the GIPS standards. IR+M has been independently verified for the period January 1, 2000 through December 31, 2014 by ACA Performance Services. Verification assesses whether (1) the firm has complied with all the composite construction requirements of the GIPS standards on a firm-wide basis and (2) the firm’s processes and procedures are designed to calculate and present performance in compliance with the GIPS standards. Benchmark returns are not covered by the report of independent verifiers. The 1-3 Year Composite has been examined for the period January 1, 2000 through December 31, 2014. The verification and performance examination reports are available upon request. Valuations are computed, performance is reported, and fees are based on U.S. dollars. Gross-of-fee performance returns are presented before management and custodial fees but after all trading expenses. Net-of-fees performance returns are calculated by deducting the highest fee rate from the current associated fee schedule; the fees are deducted quarterly, using one-fourth of the annual fee rate. Fees disclosed are the standard management fee for that strategy. Actual management fees may be different than those illustrated in this disclosure. Additional information regarding valuing portfolios, calculating performance and preparing compliant presentations are available upon request.Dispersion is calculated using the equal-weighted standard deviation of all portfolios that were included in the composite for the entire year. Dispersion is not calculated for years with five or fewer portfolios in the composite for the entire year. This composite utilizes a Significant Cash Flow Policy, which is described as follows. Prior to 1/1/10, if cash flows exceeded 5%, IR+M removed the portfolio from the composite, effective as of the last full month of management prior to the cash flow, if the impact to the performance of the composite was greater than the absolute value of 0.02%. For periods beginning 1/1/10 or later, IR+M will remove a portfolio from a composite if an external contribution or withdrawal (flow) is significant. The portfolio will be removed as of the last full month of management prior to the flow. IR+M defines a flow (either cash or securities) as significant by mandate according to the following criteria: Government mandates: No level – all portfolios left in regardless of size of flow; Corporate/Broad market/TIPS: 25% of beginning portfolio value; Convertibles/Municipals: 10% of beginning portfolio value. Portfolios will re-enter the composite according to the Entering Composites criteria detailed in the IR+M GIPS Policy Manual. Additional information regarding the treatment of significant cash flows is available on request. Derivatives, if used in those accounts whose guidelines permit their use, are primarily engaged as hedging instruments. Interest Rate Swaps and Treasury-bond futures may be used to manage a portfolio’s duration, and Credit Default Swaps may be used in strategies to isolate a particular issuer’s credit risk. The 1 to 3 Year Composite is comprised of separately managed institutional portfolios mainly invested in a diversified range of domestic, investment grade, fixed income securities. The objective of the mandate is to outperform the benchmark on a total return basis while staying within the boundaries of individual client guidelines. The securities’ typical maturity range is between 1-3 years. The benchmark is the Barclays 1-3 Year Treasury Index. Prior to 1/1/13 the benchmark was the BofA Merrill Lynch 1-3 Year Treasury Index. The index was changed due to better representation of how the composite is managed. The standard management fee schedule is 0.30% on the initial $10mm, 0.25% on the next $90mm and 0.20% on amounts over $100mm. The composite was created on 12/31/88.
1 to 3 Year Composite Continued

24
IR+M COMPOSITE DISCLOSURES – 12/31/15 (continued)
Intermediate Government Credit CompositeOctober 1, 1989 through December 31, 2015
YearReturns (%) Number of
PortfoliosDispersion Assets (USD, mm)
Gross Net Benchmark (%) Composite Firm1989¹ 3.14 3.05 3.37 ≤ 5 N/A 31 2461990 8.42 8.05 9.17 ≤ 5 N/A 34 2861991 16.00 15.61 14.63 ≤ 5 N/A 40 4181992 7.90 7.53 7.17 ≤ 5 N/A 57 5381993 10.87 10.49 8.79 ≤ 5 N/A 94 8031994 (0.62) (0.96) (1.93) ≤ 5 N/A 144 9571995 15.87 15.48 15.33 12 0.28 220 1,7001996 4.84 4.48 4.05 13 0.16 259 1,9641997 8.11 7.73 7.87 14 0.14 382 2,4201998 7.51 7.14 8.44 15 0.13 458 3,0411999 2.01 1.66 0.39 15 0.15 473 3,3742000 8.44 8.07 10.12 13 0.40 431 3,6202001 10.54 10.16 8.96 12 0.28 464 3,7052002 8.05 7.68 9.86 9 0.40 406 3,847
YearReturns (%) Number of
PortfoliosDispersion Assets (USD, mm)
Gross Net Benchmark (%) Composite Firm2003 5.81 5.45 4.31 9 0.34 390 5,1082004 3.96 3.60 3.04 8 0.23 647 6,6362005 2.69 2.34 1.58 11 0.16 776 7,4802006 4.69 4.33 4.08 11 0.14 963 9,2382007 7.03 6.66 7.39 16 0.23 1,219 11,5072008 0.64 0.29 5.08 23 1.37 1,299 13,7182009 13.36 12.97 5.24 29 1.15 1,564 21,2522010 6.64 6.27 5.89 34 0.20 1,722 26,2952011 5.87 5.50 5.80 37 0.18 2,023 30,6762012 6.16 5.79 3.89 42 0.36 2,509 35,4662013 (0.57) (0.91) (0.86) 46 0.16 2,832 37,2242014 3.87 3.51 3.13 50 0.12 3,427 48,4142015 1.30 0.95 1.07 41 0.10 3,643 54,887
¹1989 performance represents a partial year covering 10/1 through 12/31.
Year MV of bundled fee portfolio % of Composite Assets2010 33,152,702 2%2011 77,692,118 4%2012 81,031,185 3%
In 2010, one portfolio with a bundled fee entered the composite. The fee paid by the client also includes custody and administration charges. The following table shows the total percentage of composite assets composed of the bundled fee portfolio:
The three-year annualized ex-post standard deviation of the composite and benchmark as of year end is as follows:
Year Composite 3-Yr St Dev (%) Benchmark 3-Yr St Dev (%)2011 3.26 2.552012 2.10 2.162013 2.16 2.11
Year MV of bundled fee portfolio % of Composite Assets2013 160,960,083 6%2014 307,888,011 9%2015 598,360,035 20%
Year Composite 3-Yr St Dev (%) Benchmark 3-Yr St Dev (%)2014 2.02 1.942015 2.07 2.10
IR+M's net of fee calculation is not an actual composite net of fee return and is for illustrative purposes only. Actual fees may differ.

25
IR+M COMPOSITE DISCLOSURES – 12/31/15 (continued)
Income Research & Management (“IR+M”) is an independent investment management firm with approximately $54.9 billion in assets under management. IR+M has no subsidiaries or divisions, all business is done at IR+M and all assets are managed by IR+M. A complete list of composite descriptions is available upon request. IR+M claims compliance with the Global Investment Performance Standards (GIPS®) and has prepared and presented this report in compliance with the GIPS standards. IR+M has been independently verified for the period January 1, 2000 through December 31, 2014 by ACA Performance Services. Verification assesses whether (1) the firm has complied with all the composite construction requirements of the GIPS standards on a firm-wide basis and (2) the firm’s processes and procedures are designed to calculate and present performance in compliance with the GIPS standards. Benchmark returns are not covered by the report of independent verifiers. The Intermediate Government Credit Composite has been examined for the period January 1, 2000 through December 31, 2014. The verification and performance examination reports are available upon request.Valuations are computed, performance is reported, and fees are based on U.S. dollars. Gross-of-fee performance returns are presented before management and custodial fees but after all trading expenses. Net-of-fees performance returns are calculated by deducting the highest fee rate from the current associated fee schedule; the fees are deducted quarterly, using one-fourth of the annual fee rate. Fees disclosed are the standard management fee for that strategy. Actual management fees may be different than those illustrated in this disclosure. Additional information regarding valuing portfolios, calculating performance and preparing compliant presentations are available upon request.Dispersion is calculated using the equal-weighted standard deviation of all portfolios that were included in the composite for the entire year. Dispersion is not calculated for years with five or fewer portfolios in the composite for the entire year.This composite utilizes a Significant Cash Flow Policy, which is described as follows. Prior to 1/1/10, if cash flows exceeded 5%, IR+M removed the portfolio from the composite, effective as of the last full month of management prior to the cash flow, if the impact to the performance of the composite was greater than the absolute value of 0.02%. For periods beginning 1/1/10 or later, IR+M will remove a portfolio from a composite if an external contribution or withdrawal (flow) is significant. The portfolio will be removed as of the last full month of management prior to the flow. IR+M defines a flow (either cash or securities) as significant by mandate according to the following criteria: Government mandates: No level – all portfolios left in regardless of size of flow; Corporate/Broad market/TIPS: 25% of beginning portfolio value; Convertibles/Municipals: 10% of beginning portfolio value. Portfolios will re-enter the composite according to the Entering Composites criteria detailed in the IR+M GIPS Policy Manual. Additional information regarding the treatment of significant cash flows is available on request.Derivatives, if used in those accounts whose guidelines permit their use, are primarily engaged as hedging instruments. Interest Rate Swaps and Treasury-bond futures may be used to manage a portfolio’s duration, and Credit Default Swaps may be used in strategies to isolate a particular issuer’s credit risk. The Intermediate Government Credit Composite is comprised of separately managed institutional portfolios mainly invested in a diversified range of domestic, investment grade, fixed income securities, with a higher allocation to Governments and Credits than our Aggregate composites. The objective of the mandate is to outperform the benchmark on a total return basis while staying within the boundaries of individual client guidelines. The securities’ typical maturity range is between 3-7 years. The benchmark is the Barclays Intermediate Government/Credit Index. The standard management fee schedule is 0.35% on the initial $25mm, 0.30% on the next $25mm, 0.25% on the next $25mm, and 0.20% on amounts over $75mm. The composite was created on 9/30/89.
Intermediate Government Credit Composite Continued

26
IR+M DISCLOSURE STATEMENT
Disclosure Statement:The views contained in this report are those of Income Research & Management (“IR+M”) and are based on information obtained by IR+M from sources that are believed to be reliable. This report is for informational purposes only and is not intended to provide specific advice, recommendations for, or projected returns for any particular IR+M product.
Securities listed in this presentation are for illustrative purposes only and should not be considered as a recommendation to purchase or sell any of the securities listed. It should not be assumed that recommendations made in the future will be profitable or will equal the performance of the securities listed. Forward looking analyses are based on assumptions and may change anytime. Some statistics require assumptions for calculations which can be disclosed upon request.
Past performance is no guarantee of future results and current and future portfolio holdings are subject to risk. Investing in the bond market is subject to certain risks, including market, interest rate, issuer, credit, and inflation risk. It should not be assumed that the yields presented exist today or will in the future.
Ratings information from Standard & Poor's ("S&P") may not be reproduced. S&P credit ratings are statements of opinion and are not statements of fact or recommendations to purchase, hold, or sell securities, nor do they address the suitability of securities for investment purposes, and should not be relied on as investment advice. S&P does not guarantee the accuracy, completeness, timeliness or availability of any information, including ratings, and is not responsible for errors or omissions (negligent or otherwise). S&P gives no express or implied warranties, including but not limited to any warranties of merchantability or fitness for a particular purpose or use. S&P shall not be liable for any direct, indirect, incidental, exemplary, compensatory, punitive, special or consequential damages, costs, expenses, legal fees, or losses (including lost income or profits and opportunity costs) in connection with any use of ratings.
No part of this material may be reproduced in any form, or referred to in any other publication, without express written permission from IR+M.

255 State Street | Boston, MA 02109 | TEL: 617.374.1300 | www.nepc.com BOSTON | ATLANTA | CHARLOTTE | CHICAGO | DETROIT | LAS VEGAS | SAN FRANCISCO
To: Trustees & Staff
Dallas Police & Fire Pension System (DPFP) From: Rhett Humphreys, CFA, Partner Keith Stronkowsky, CFA, Sr. Consultant
Date: April 14, 2016 Subject: Short Duration Core Bond Allocation
BACKGROUND: On March 10th, 2016, DPFP approved a new long-term strategic Asset Allocation plan which calls for a 2% target allocation to Short Duration Core Bonds within the liquid portion of the Fixed Income portfolio. An allocation to Short Duration Core Bonds will help to stabilize portfolio returns and provide additional liquidity to the Plan. Investments in the space will primarily be investment grade securities (treasuries, agency mortgate-backed securities, etc.) but out-of benchmark securities may be added to enhance return. Over the past month(s) NEPC and Staff have been conducting research and due diligence on potential managers to fill this mandate, including:
• The review of NEPC’s Short Duration Fixed Income Focused Placement List (FPL) of preferred strategies (strategies that we expect will provide superior investment performance over time) as well as additional manager(s) that fall outside of the FPL
• Onsite, in person, or additional due diligence meetings with potential candidates RECOMMENDATION: After completion of the research and due diligence process, NEPC recommends that DPFP hire Income Research & Management (IR&M) to fill the 2% target allocation to Short Duration Core Bonds. Disclosures: NEPC relationships with managers profiled in the Short Duration Fixed Income Focused Placement List (FPL) search book (separate handout from this memo)
- NEPC provides investment consulting advice to the AMG 401(k) Plan. Chicago Equity Partners is an investment manager in this plan.
- Mr. Michael Manning’s wife is the Director of Client Service at Income Research & Management. Mr. Timothy O’Connell’s brother is in client relations at Income Research & Management.
- T. Rowe Price Retirement Plan Services provides 401(k) record-keeping services to NEPC for a fee.

Dallas Police & Fire Pension System
Short Duration Fixed Income Manager Search
March 2016
Rhett Humphreys, CFA Partner
Keith Stronkowsky, CFA Senior Consultant

Table Of Contents
Tab
Introduction and Disclosures 1
Firm and Product Summary 2
Performance 3
Profiles 4
Appendix 5

Introduction and Disclosures

Introduction to Asset Class
Short Duration Fixed Income managers primarily invest in investment grade debt securities such as Treasuries, Agency debentures, corporate bonds, Agency mortgage-backed securities, asset-backed securities and commercial mortgage-backed securities. Managers may seek to enhance returns through duration management and yield curve positioning. Managers may also invest in out-of-benchmark securities, but generally investments are risk-controlled. Alpha is constrained in the fixed income space. Expected alpha from Short Duration Fixed Income strategies is in the area of 0.0% to 0.5%, net of fees. The expected benchmarks for this mandate would include the Barclays Capital 1-3 Year Government/Credit Index, Barclays Capital 1-3 Year Government Index, or the Barclays Capital 1-3 Year Credit Index.

NEPC’s investment manager research process identifies a Focused Placement List of preferred strategies representing the strategies that we expect will provide superior investment performance over time. Our four step process used for identifying our Focused Placement List includes:
1. Universe Screening – Minimum inclusion criteria and screening are used to focus our analysis;
2. Quantitative Scoring – Proprietary quantitative analysis measuring the consistency and quality
of alpha-only, net of fees returns;
3. Qualitative Research – Rigorous qualitative analysis of a strategy’s key characteristics, focusing on identification of a clear and differentiating investment thesis to develop forward-looking conviction in future performance; and
4. Peer Review – Confirmation through careful peer review of each strategy by senior investment professionals to challenge each investment thesis and raise critical business issues.
We believe that this exhaustive process leads to identification of strategies with a reasonable probability of delivering consistent, high quality investment results.
Research Process

Research Process
1. Universe Screening – The construction of the Focused Placement List begins with initial universe screening to
identify candidates that meet acceptable criteria for further analysis.
Same screening criteria on Morningstar Universe to ensure broadest coverage – over 132,000 funds
Funds passing same criteria that are not populated in eVestment database - 0
73 unique strategies qualifying for further analytics
Minimum 3-yr Track Record – 73
AUM > $150 Million – 80
Short Duration Fixed Income Strategies – 106
Fixed Income – 2,742
eVestment Universe ~ 12,000

Research Process
2. Quantitative Scoring – Strategies are scored using our proprietary Performance Analytics Statistical Software (PASS)
on metrics that we believe identify investment processes expected to consistently outperform the benchmark over the long term. All analysis is based on excess manager returns, net of all fees. For Short Duration Fixed Income, strategies are scored 0-100. Scoring is weighted 80% quantitative and 20% qualitative, including the following factors:
• % of Rolling 3 Year Returns > 0% • % of Rolling 3 Year Returns > 0.50% • Rolling 3 Year Information Ratio • Contrarian Indicator • Long Term Alpha Confidence (Statistical Significance) • Length of Track Record • Qualitative NEPC Opinion – Firm & Team Stability, Quality of Investment Thesis
0
5
10
15
20
25
30
35
>8060-8040-60<40
Distribution of Scores
Total
FPL

3. Qualitative Research
- Deep, qualitative research is conducted on a focused set of strategies identified through scoring and supplemented by our research teams’ knowledge of strategies that appear compelling for further research.
- Our research efforts are focused on developing a deep understanding of each strategy’s people,
philosophy, & process, synthesizing those aspects into our interpretation of each strategy’s investment thesis – the identification of a particular set of market inefficiencies and the conviction in a portfolio management team’s ability to exploit those inefficiencies over the long-term, thereby, adding value over the benchmark.
- By focusing on investment thesis, our research remains forward-looking, supporting this
investment view with critical knowledge of each organization, investment team, research support, investment process, performance expectations, and fees/available investment vehicles to identify strategies that we believe will provide quality excess returns above the relevant benchmark.
4. Peer Review
- The research process culminates in exhaustive peer review. The Fixed Income Advisory Group provides feedback and insight to the research team prior to vetting preferred strategies in front of senior research and consulting professionals on NEPC’s Due Diligence Committee. The research team presents each Focused Placement List candidate to the Due Diligence Committee. The committee challenges both the soundness of the investment thesis (NEPC’s articulation of why the strategy is expected to outperform over the long-term) and all relevant factors that might effect the long-term stability of the strategy, including business factors at the firm level. Candidates approved by the Due Diligence Committee are placed on the Focused Placement List and included in searches conducted for that asset class.
Research Process
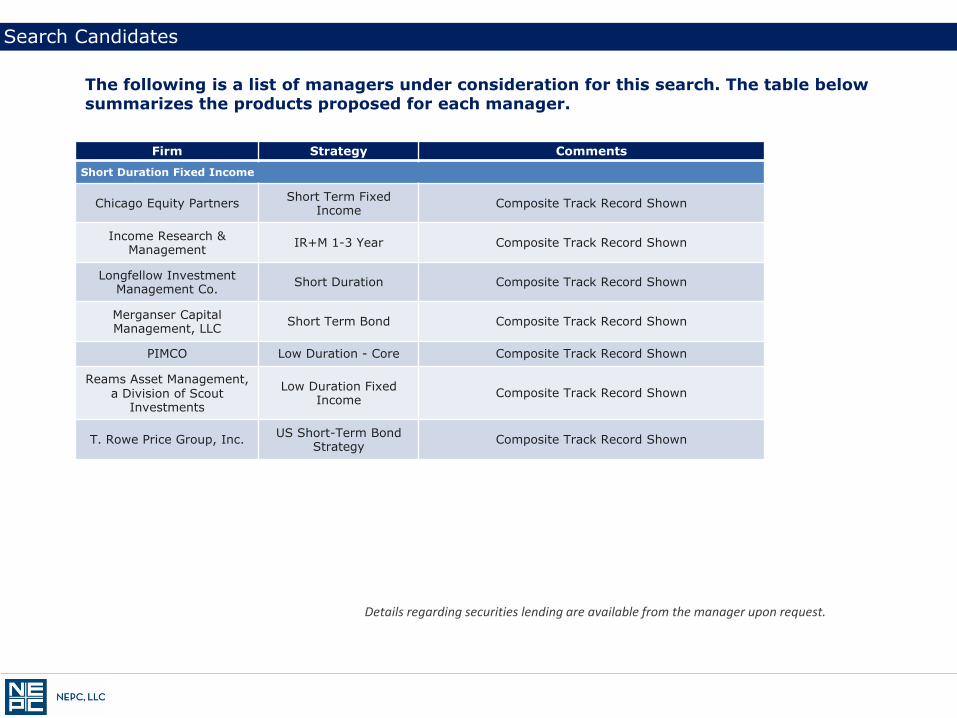
Details regarding securities lending are available from the manager upon request.
The following is a list of managers under consideration for this search. The table below summarizes the products proposed for each manager.
Search Candidates
Firm Strategy Comments
Short Duration Fixed Income
Chicago Equity Partners Short Term Fixed Income Composite Track Record Shown
Income Research & Management IR+M 1-3 Year Composite Track Record Shown
Longfellow Investment Management Co. Short Duration Composite Track Record Shown
Merganser Capital Management, LLC Short Term Bond Composite Track Record Shown
PIMCO Low Duration - Core Composite Track Record Shown
Reams Asset Management, a Division of Scout
Investments
Low Duration Fixed Income Composite Track Record Shown
T. Rowe Price Group, Inc. US Short-Term Bond Strategy Composite Track Record Shown

Disclosures
Data Disclosure: - The results profiled herein reflect the deduction of management fees and other expenses, except where
specifically noted. - Investment fees can have a significant effect on total returns.
NEPC Relationships:
- NEPC provides investment consulting advice to the AMG 401(k) Plan. Chicago Equity Partners is an investment manager in this plan.
- Mr. Michael Manning's wife is the Director of Client Service at Income Research & Management. Mr. Timothy O’Connell’s brother is in client relations at Income Research & Management.
- T. Rowe Price Retirement Plan Services provides 401(k) record-keeping services to NEPC for a fee.
Footnotes:
- Due Diligence Status: - NEPC has given PIMCO a Watch level due diligence rating due to recent organizational changes at senior
management levels of the organization. Note: A Watch rating is given to investment managers when issues have surfaced to be concerned over; manager can participate in future searches, but current and prospective clients must be made aware of the issues.
- Income Research & Management is 15% family-owned.
- Characteristic: - PIMCO does not provide the Yield To Worst characteristic.
- Proposed Vehicle:
- T. Rowe is willing to create a daily-priced commingled trust fund for this client at or below the I-Class expense ratio.
- Firm Ownership:
- “PIMCO is a limited liability company that is a majority owned subsidiary of Allianz Asset Management (“AAM”), which is a subsidiary of Allianz SE (“Allianz”). The allocations to the 'Equity Ownership' section have not been populated because PIMCO does not report this information.”

Firm and Product Summary

Description
The following pages address portfolio-specific characteristics. • Firm and Product Summaries:
- On these pages, several portfolio characteristics are listed. The data here should match what you may already know about the manager: do they have the staff to research this many ideas? How large is their trading staff if portfolio turnover is significant? How do they define their universe?

Firm and Product Summary
Firm/Product Firm/Team Comments Investment Style/Strategy Performance Expectations Portfolio Positioning Other Comments
Short Duration Fixed Income
Chicago Equity - Short Fixed
Income
Team was formed by three professionals from Loomis Sayles'
former Chicago based FI team
Strategy is averse to security specific risk, but may be
aggressive in sector positions. Overall very high quality,
conservative strategy
Should outperform during periods of volatility and
high systemic risk Short-term liquidity A sizeable Taft-
Hartley client base
Income Research -
IR+M 1-3 Year
IR&M is a boutique firm specializing only in
investment grade fixed income
Portfolios will focus on income maximization and positive
convexity characteristics with a focus on securitized and
corporate bond subsectors
Expect good performance in most market
environments, with potential to lag slightly
during credit bear markets
Short-term liquidity
Longfellow - Short Duration
Firm is 100% employee owned with ownership
split amongst eight Principals
Asset-Backed Securities are key to this strategy. Particularly
more esoteric sectors such as Tax Liens and equipment
receivables
Expect the strategy to lag during periods of spread
widening Short-term liquidity
Merganser - Short Term
Bond
In 2013, Merganser was purchased by
Providence Equity Partners
Merganser’s strategy is focused on asset-backed segments of the bond market, including
esoteric sectors such as equipment leases, and
receivables
Strategy will likely lag during periods of spread
widening Short-term liquidity
PIMCO - Low Duration - Core
PIMCO has an impressive team of professionals, and a
sophisticated approach to risk controls
PIMCO's approach is mostly top-down oriented, with capital
efficiency achieved through the use of derivatives
Expected return to be generated through PIMCO's
interest rate strategies, curve strategies and less
from corporate bonds
Short-term liquidity
A good compliment for a credit-oriented
manager
Reams - Low Duration
Firm was acquired by Scout Investment
Advisors in 2010 and was previously
employee owned
Strategy focuses on overweighting spread sectors
through most market cycles, but also has flexibility in setting
duration and yield curve positions
CMBS has contributed to the recent high tracking error of the strategy, but
also to the impressive returns
Short-term liquidity
Probably the most aggressive
manager on the list in terms of spread sector investments

Firm and Product Summary
Firm/Product Firm/Team Comments Investment Style/Strategy Performance Expectations Portfolio Positioning Other Comments
Short Duration Fixed Income
T. Rowe - Short Term Bond
T. Rowe Price is a publicly listed
corporation, with 15% of firm equity held by
employees
T. Rowe Price’s strategy typically overweights corporate credit,
earning a higher yield than the index over time
Due to credit bias, strategy will likely lag during spread
widening Short-term liquidity

NEPC Investment Thesis
Firm/Product NEPC Investment Thesis
Short Duration Fixed Income
Chicago Equity - Short Fixed Income
Chicago Equity Partners structures portfolios to profit from high probability events such as fundamentals improving/worsening in corporate bonds, extreme shifts in the yield curve, and by generally avoiding lower-yielding segments of the market such as Treasuries. Portfolios will not take a lot of security-specific risk, but rather will try to identify securities that will perform predictably given the macro-economic views that drive sector returns.
Income Research - IR+M 1-3 Year
IR+M is a bottom-up value manager with a skill set in the credit and securitized bond sectors of the market. IR+M exploits overlooked opportunities in complex and often overlooked sub-sectors, leading to portfolios that benefit from an income bias and positive convexity relative to the index. Their expected alpha is sourced in their understanding and ability to identify mispricings in bond markets as well as their expertise in the analysis of esoteric securities, such as put bonds, pre-payable CMBS bonds, hybrid ARMS, municipals, century bonds and convertible bonds.
Longfellow - Short Duration
LIM views the fixed income markets as highly segmented in terms of the types of buyers and objectives of participants. Individual securities ideas, trading ideas, and relative value ideas are often generated from the team trading with restricted buyers, insurance, regulated, or other participants that may not be economically, but rather rule driven in their transactions. LIM’s relatively small size and focus on esoteric ABS sectors of the market also provides a source of excess return and over time has contributed to alpha.
Merganser - Short Term Bond
Merganser adds value to client portfolios by investing in under-researched, or under-covered segments of the bond market, particularly in ABS sectors. The firm’s small size is an advantage in purchasing smaller-issue securities and an advantage in pricing. The strategy will overweight spread sectors of the bond market, capturing the higher yield provided.
PIMCO - Low Duration - Core
PIMCO gathers and analyzes information on economic and market trends, develops a long-term secular view and applies this to their portfolios. Input from internal talent as well as prominent figures in academia and the government factor into their investment process. The source of their expected alpha is their well-informed long-term secular outlook, the periodic refinements of short-term views, their ability to capture the benefits associated with the size and depth of their organization, and their global reach and influence within the fixed income markets.
Reams - Low Duration
We expect Reams to add value to client portfolios through their disciplined rotation into and out of spread sectors of the marketplace, the conviction level in which they implement active positions, and by avoiding unproven securities and structures. A key part of their investment process that guides sector allocation is the analysis of price volatility in fixed income securities, the macro-economic environment and long term valuations. The utilization of scenario analysis, stressing securities for different interest rate and credit environments, is also a key part of their investment process that has distinguished the approach from competitors.

NEPC Investment Thesis
Firm/Product NEPC Investment Thesis
Short Duration Fixed Income
T. Rowe - Short Term Bond
We expect T. Rowe Price to outperform the index through security selection and expertise in the corporate bond segment of the market. T. Rowe Price’s corporate credit team has historically contributed positively to excess return. The strategy will overweight corporate bonds, and even overweight BBB rated issues through most cycles, capturing the higher yield available in such securities.

Characteristics as of December 31, 2015
Firm Comparison Summary
Firm Name Location Year Firm Founded
Total Assets Under Mgmt ($MM)
% Employee
Owned
% Parent Owned
Parent Company Name
% Publicly
Held
% Other Ownership
Short Duration Fixed Income
Chicago Equity Partners Chicago, Illinois 1989 9,777 41 59 Affiliated Managers Group 0 0
Income Research & Management
Boston, Massachusetts 1987 54,890 85 0 NA 0 15
Longfellow Investment Management Co.
Boston, Massachusetts 1986 7,747 100 0 NA 0 0
Merganser Capital Management, LLC
Boston, Massachusetts 1984 9,672 0 100 Providence Equity
Partners, LLC. 0 0
PIMCO Newport Beach, California 1971 1,435,042 0 0 NA 0 0
Reams Asset Management, a Division of Scout
Investments Columbus, Indiana 1981 27,185 0 100 UMB Financial
Corporation 0 0
T. Rowe Price Group, Inc. Baltimore, Maryland 1937 763,100 16 0 NA 84 0

Characteristics as of December 31, 2015
Firm Comparison Summary
Firm Name Registered Investment
Advisor
GIPS Compliant
Past or Pending Litigation
Firm uses Placement
Agent
Short Duration Fixed Income
Chicago Equity Partners Yes Yes No No
Income Research & Management Yes Yes Yes No
Longfellow Investment Management Co. Yes Yes No No
Merganser Capital Management, LLC Yes Yes No No
PIMCO Yes Yes Yes No
Reams Asset Management, a Division of Scout
Investments Yes Yes No No
T. Rowe Price Group, Inc. Yes Yes Yes No

Characteristics as of December 31, 2015
Product Comparison
Firm/Product Inception Date
AUM ($MM)
# of Portfolio Managers
# of Research Analysts
# of Traders
Short Duration Fixed Income
Chicago Equity - Short Fixed Income 1997 553 4 10 1
Income Research - IR+M 1-3 Year 1988 2,122 14 19 6
Longfellow - Short Duration 1986 1,622 6 8 1
Merganser - Short Term Bond 1987 5,652 4 6 1
PIMCO - Low Duration - Core 1989 14,617 251 125 0
Reams - Low Duration 2002 3,992 5 6 0
T. Rowe - Short Term Bond 1990 10,323 2 81 37

Characteristics as of December 31, 2015
Product Comparison
Firm/Product Vehicle Proposed Liquidity In Liquidity Out Reported Fee for $50.00 mm
Reported Fee in (bps)
Short Duration Fixed Income
Chicago Equity - Short Fixed Income Separate Account Daily Daily 87,500.00 18
Income Research - IR+M 1-3 Year Separate Account Daily Daily 125,000.00 25
Longfellow - Short Duration Separate Account Daily Daily 125,000.00 25
Merganser - Short Term Bond
Separate Account Commingled Fund
Daily Daily
Daily Daily
100,000.00 100,000.00
20 20
PIMCO - Low Duration - Core Mutual Fund Daily Daily 250,000.00 50
Reams - Low Duration Separate Account Mutual Fund
Daily Daily
Daily Daily
100,000.00 200,000.00
20 40
T. Rowe - Short Term Bond *Commingled Fund Mutual Fund
Daily Daily
Daily Daily
205,000.00 260,000.00
41 52
*Unfunded: See Disclosures

Characteristics as of December 31, 2015
Product Comparison
Firm/Product PRI Signatory (Y/N)
Strategy is Managed with
ESG Considerations (Y/N)
Short Duration Fixed Income
Chicago Equity - Short Fixed Income No NA
Income Research - IR+M 1-3 Year Yes No
Longfellow - Short Duration Yes Yes
Merganser - Short Term Bond No Yes
PIMCO - Low Duration - Core Yes No
Reams - Low Duration No No
T. Rowe - Short Term Bond Yes No

Characteristics as of December 31, 2015
Product Comparison
Firm/Product Internal ESG
Research Utilized (Y/N)
Third Party ESG Research Utilized
(Y/N) Manager Explanation of Research Methodologies Used
Short Duration Fixed Income
Chicago Equity - Short Fixed Income No No NA
Income Research - IR+M 1-3 Year No No NA
Longfellow - Short Duration Yes Yes LIM uses a combination of internal research as well as external information available through sustainability reports and Bloomberg.
Merganser - Short Term Bond Yes Yes Merganser evaluates corporates through Credit Research.
PIMCO - Low Duration - Core Yes Yes
PIMCO relies on clients’ lists of prohibited issuers, and on research that identifies additional investments that might not be suitable. Issuers of restricted securities are coded into our in-house compliance system, and portfolio managers, account managers and our compliance team closely monitor accounts to ensure compliance.
Reams - Low Duration No Yes Screening lists provided by clients and/or the Bloomberg Compliance Module
T. Rowe - Short Term Bond No No NA

Characteristics as of December 31, 2015
Fixed Income Comparison
Firm/Product Duration Emphasis
Weighted Average Coupon
(%)
Yield to Maturity
(%)
Average Maturity (Years)
Duration (Years)
Average Quality
Minimum Quality
Short Duration Fixed Income
Chicago Equity - Short Fixed Income Short 1.0 1.1 1.86 1.84 AAA BBB
Income Research - IR+M 1-3 Year Short 2.6 1.9 1.88 1.81 AA BBB
Longfellow - Short Duration Short 2.9 1.8 1.72 1.57 AA BBB
Merganser - Short Term Bond Short 2.5 1.9 1.95 1.65 AA BBB
PIMCO - Low Duration - Core Short 2.2 2.7 2.12 NA AA B
Reams - Low Duration Short 2.1 1.9 1.98 1.80 AA B
T. Rowe - Short Term Bond Short 2.4 2.2 2.33 NA AA BBB

Characteristics as of December 31, 2015
Fixed Income Comparison
Firm/Product # of Issues Current
Cash (%)
Annual Turnover
(%)
Yield to Worst (%)
Short Duration Fixed Income
Chicago Equity - Short Fixed Income 40 0.8 71.7 1.1
Income Research - IR+M 1-3 Year 121 0.4 68.5 1.9
Longfellow - Short Duration 140 3.5 31.0 1.8
Merganser - Short Term Bond 213 0.9 40.7 1.9
PIMCO - Low Duration - Core 100 15.0 45.0 NA
Reams - Low Duration 155 1.8 29.4 1.9
T. Rowe - Short Term Bond 757 1.9 40.7 2.2

Characteristics as of December 31, 2015
Current Quality Allocations
Benchmark
Barclays US 1-3 Yr Govt/Credit 71.5 6.9 11.4 10.2 0.0 0.0 0.0 0.0
Firm/Product AAA/Aaa (%)
AA/Aa (%)
A (%)
BBB/Baa (%)
BB/Ba (%)
B (%)
CCC/Caa and Below
(%)
Other (%)
Short Duration Fixed Income
Chicago Equity - Short Fixed Income 91.0 1.9 6.6 0.5 0.0 0.0 0.0 0.0
Income Research - IR+M 1-3 Year 51.3 4.5 22.4 21.9 0.0 0.0 0.0 0.0
Longfellow - Short Duration 59.9 10.9 18.7 10.4 0.1 0.0 0.0 0.0
Merganser - Short Term Bond 58.3 9.6 18.2 13.8 0.0 0.0 0.0 0.0
PIMCO - Low Duration - Core 37.0 19.0 42.0 1.0 1.0 0.0 0.0 0.0
Reams - Low Duration 56.3 2.3 19.6 19.0 2.4 0.2 0.0 0.0
T. Rowe - Short Term Bond 48.8 5.8 15.0 27.5 2.7 0.0 0.0 0.0

Characteristics as of December 31, 2015
Current Duration
Benchmark
Barclays US 1-3 Yr Govt/Credit 0.5 99.5 0.0 0.0 0.0 0.0 0.0
Firm/Product Duration
<1 Yr (%)
Duration 1-3 Yrs
(%)
Duration 3-5 Yrs
(%)
Duration 5-7 Yrs
(%)
Duration 7-10 Yrs
(%)
Duration 10-20 Yrs
(%)
Duration >20 Yrs
(%)
Short Duration Fixed Income
Chicago Equity - Short Fixed Income 4.7 95.3 0.0 0.0 0.0 0.0 0.0
Income Research - IR+M 1-3 Year 21.5 75.9 2.7 0.0 0.0 0.0 0.0
Longfellow - Short Duration 30.3 65.1 4.6 0.0 0.0 0.0 0.0
Merganser - Short Term Bond 27.4 63.7 8.9 0.0 0.0 0.0 0.0
PIMCO - Low Duration - Core -11.0 89.0 35.0 2.0 -19.0 4.0 0.0
Reams - Low Duration 22.7 65.0 11.9 0.4 0.0 0.0 0.0
T. Rowe - Short Term Bond 25.1 58.4 15.0 1.5 0.0 0.0 0.0

Characteristics as of December 31, 2015
Fixed Income Sector Allocations
Benchmark
Barclays US 1-3 Yr Govt/Credit 75.6 24.4 0.0 0.0 0.0 0.0 0.0 0.0
Firm
/P
rod
uct
US
Gov
ts/
Ag
enci
es
(%)
US
In
v. G
rad
e C
orp
s (%
)
US
Hig
h Y
ield
(%
)
Mu
nic
ipal
s (%
)
Con
vert
ible
s (%
)
US
Ag
ency
Sec
uri
tize
d
(%)
US
Non
-Ag
ency
S
ecu
riti
zed
(%
)
Oth
er S
ec
(%)
Short Duration Fixed Income
Chicago Equity - Short Fixed Income 89.7 9.6 0.0 0.0 0.0 0.0 0.0 0.7
Income Research - IR+M 1-3 Year 36.8 44.8 0.0 4.8 0.0 0.0 13.5 0.0
Longfellow - Short Duration 29.3 30.0 0.0 4.5 0.0 3.9 27.8 4.6
Merganser - Short Term Bond 13.2 34.9 0.0 0.0 0.0 6.9 45.0 0.0
PIMCO - Low Duration - Core 5.5 45.8 0.0 2.1 0.0 22.1 9.6 15.0
Reams - Low Duration 17.0 42.3 2.0 0.0 0.0 25.6 13.1 0.0

Characteristics as of December 31, 2015
Fixed Income Sector Allocations
Benchmark
Barclays US 1-3 Yr Govt/Credit 75.6 24.4 0.0 0.0 0.0 0.0 0.0 0.0
Firm
/P
rod
uct
US
Gov
ts/
Ag
enci
es
(%)
US
In
v. G
rad
e C
orp
s (%
)
US
Hig
h Y
ield
(%
)
Mu
nic
ipal
s (%
)
Con
vert
ible
s (%
)
US
Ag
ency
Sec
uri
tize
d
(%)
US
Non
-Ag
ency
S
ecu
riti
zed
(%
)
Oth
er S
ec
(%)
Short Duration Fixed Income
T. Rowe - Short Term Bond 9.7 43.4 2.7 0.4 0.0 11.2 31.7 0.9

Performance

The following performance charts show the historical record for the strategies under consideration. To manage client portfolios, each manager has a range of offerings (separate accounts, commingled funds or mutual funds) that allow all types of clients access to the strategy at reasonable prices.
Trailing Period Returns and Calendar Year Returns: These pages highlight a manager’s performance for quarter, year to date, 1, 3, 5, 7 & 10 year periods as well as calendar year returns.
Performance Summary: These pages highlight a manager's excess performance over various periods. All managers are also shown from the inception of the shortest record referred to as LCD or Least Common Denominator.
Return Histogram: These charts display the frequency of a manager’s monthly excess performance data.
Rolling One Year and Three Year Excess Returns: These charts demonstrate the manager’s demonstrated relative performance versus the benchmark over time. Using each manager’s one year return and subtracting the one year benchmark return shows how each manager has performed relative to the relevant benchmark. The same method is used for the three year charts.
Rolling One Year and Three Year Excess Return Versus Benchmark: These charts demonstrate the manager’s demonstrated relative performance behavior over up and down equity markets. The charts are displayed in order of benchmark performance along the X-Axis rather than chronological order. By looking at the Y-Coordinate you can determine whether or not the manager added or detracted value versus the benchmark over that one year period. Each dot represents the one year excess return versus the relevant benchmark. The same method is used for the three year charts.
Risk/Return Performance Charts: These charts show the risk and return of the candidates and indicies for 3, 5, 7 & 10 year periods.
Introduction to Performance Analysis

Performance as of December 31, 2015
Trailing Period Returns - (Net of Fees)
Past performance is no guarantee of future results
Actual Index Return
1 Barclays US 1-3 Yr Govt/Credit -0.4% 0.7% 0.7% 0.7% 1.0% 1.6% 2.7%
2 Barclays US Aggregate -0.6% 0.6% 0.6% 1.4% 3.2% 4.1% 4.5%
Benchmark Qtr YTD 1 Year 3 Year 5 Year 7 Year 10 Year
Short Duration Fixed Income
Chicago Equity - Short Fixed Income 1 -0.5% 0.4% 0.4% 0.3% 0.7% 1.6% 2.9%
Income Research - IR+M 1-3 Year 1 -0.3% 0.8% 0.8% 0.8% 1.6% 3.1% 3.4%
Longfellow - Short Duration 1 -0.2% 0.8% 0.8% 0.8% 1.3% 2.3% 3.1%
Merganser - Short Term Bond 1 -0.3% 0.8% 0.8% 0.8% 1.4% 2.7% 3.2%
PIMCO - Low Duration - Core 1 0.3% 0.4% 0.4% 0.4% 1.7% 3.1% 3.3%
Reams - Low Duration 1 -0.4% 0.7% 0.7% 1.0% 2.1% 4.1% 4.2%
T. Rowe - Short Term Bond 1 -0.3% 0.7% 0.7% 0.8% 1.5% 2.8% 3.2%

Performance as of December 31, 2015
Calendar Year Returns - (Net of Fees)
Past performance is no guarantee of future results
Actual Index Return
1 Barclays US 1-3 Yr Govt/Credit 0.7% 0.8% 0.6% 1.3% 1.6% 2.8% 3.8% 5.0% 6.8% 4.3%
2 Barclays US Aggregate 0.6% 6.0% -2.0% 4.2% 7.8% 6.5% 5.9% 5.2% 7.0% 4.3%
Benchmark 2015 2014 2013 2012 2011 2010 2009 2008 2007 2006
Short Duration Fixed Income
Chicago Equity - Short Fixed Income 1 0.4% 0.4% 0.0% 0.8% 1.9% 2.9% 4.6% 6.6% 7.0% 4.4%
Income Research - IR+M 1-3 Year 1 0.8% 0.9% 0.7% 3.1% 2.4% 3.6% 10.6% 1.3% 6.0% 4.7%
Longfellow - Short Duration 1 0.8% 1.0% 0.6% 2.0% 2.1% 3.4% 6.5% 3.5% 6.8% 4.9%
Merganser - Short Term Bond 1 0.8% 1.0% 0.6% 2.6% 2.1% 3.9% 8.4% 2.5% 5.6% 4.6%
PIMCO - Low Duration - Core 1 0.4% 0.7% 0.1% 4.3% 3.2% 3.7% 9.6% 0.1% 7.5% 3.6%
Reams - Low Duration 1 0.7% 1.2% 1.2% 5.0% 2.5% 5.0% 13.9% 1.4% 7.0% 4.7%
T. Rowe - Short Term Bond 1 0.7% 1.0% 0.6% 3.2% 1.8% 3.5% 9.3% 1.6% 5.8% 4.7%

Manager Excess Return: > 3%, between 0% and 3%, between -0% and -3%, < -3%
Performance as of December 31, 2015
Calendar Year Excess Returns - (Net of Fees)
Past performance is no guarantee of future results
Actual Index Return
1 Barclays US 1-3 Yr Govt/Credit 0.7% 0.8% 0.6% 1.3% 1.6% 2.8% 3.8% 5.0% 6.8% 4.3%
2 Barclays US Aggregate 0.6% 6.0% -2.0% 4.2% 7.8% 6.5% 5.9% 5.2% 7.0% 4.3%
Benchmark 2015 2014 2013 2012 2011 2010 2009 2008 2007 2006
Short Duration Fixed Income
Chicago Equity - Short Fixed Income 1 -0.2% -0.3% -0.7% -0.5% 0.3% 0.1% 0.8% 1.7% 0.1% 0.2%
Income Research - IR+M 1-3 Year 1 0.1% 0.2% 0.1% 1.8% 0.8% 0.8% 6.8% -3.7% -0.8% 0.4%
Longfellow - Short Duration 1 0.1% 0.2% -0.1% 0.8% 0.5% 0.6% 2.7% -1.5% 0.0% 0.7%
Merganser - Short Term Bond 1 0.2% 0.2% -0.1% 1.3% 0.6% 1.1% 4.6% -2.5% -1.2% 0.4%
PIMCO - Low Duration - Core 1 -0.2% 0.0% -0.6% 3.0% 1.6% 0.9% 5.8% -4.9% 0.6% -0.6%
Reams - Low Duration 1 0.1% 0.4% 0.5% 3.7% 0.9% 2.2% 10.0% -3.5% 0.2% 0.4%
T. Rowe - Short Term Bond 1 0.1% 0.2% 0.0% 1.9% 0.2% 0.7% 5.5% -3.4% -1.0% 0.4%
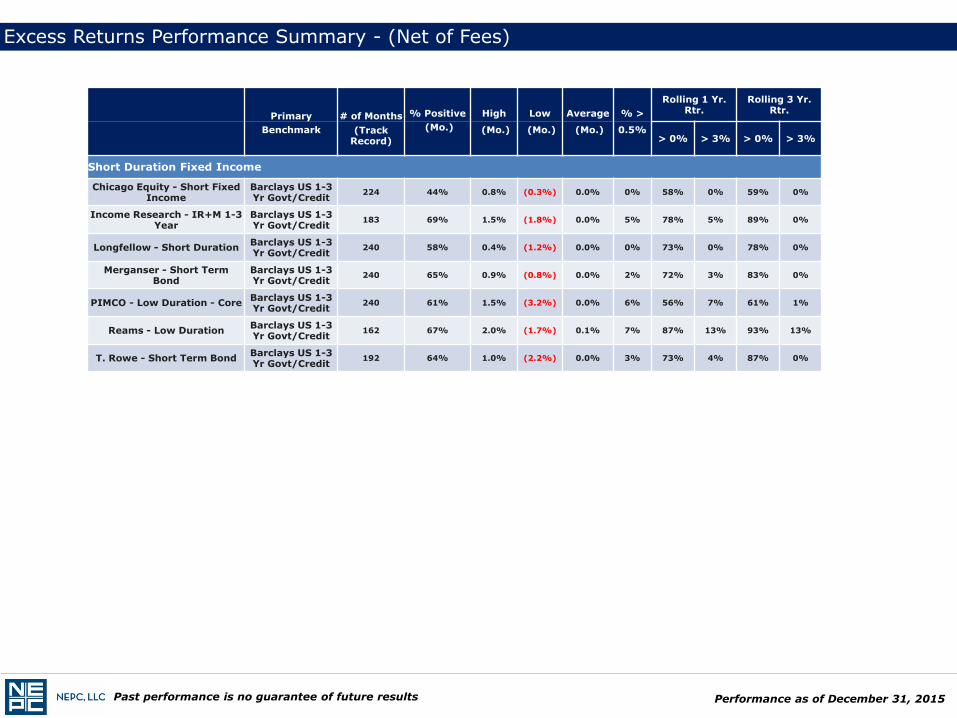
Performance as of December 31, 2015
Excess Returns Performance Summary - (Net of Fees)
Past performance is no guarantee of future results
Primary # of Months % Positive High Low Average % > Rolling 1 Yr.
Rtr. Rolling 3 Yr.
Rtr.
Benchmark (Track Record)
(Mo.) (Mo.) (Mo.) (Mo.) 0.5% > 0% > 3% > 0% > 3%
Short Duration Fixed Income
Chicago Equity - Short Fixed Income
Barclays US 1-3 Yr Govt/Credit
224 44% 0.8% (0.3%) 0.0% 0% 58% 0% 59% 0%
Income Research - IR+M 1-3 Year
Barclays US 1-3 Yr Govt/Credit
183 69% 1.5% (1.8%) 0.0% 5% 78% 5% 89% 0%
Longfellow - Short Duration Barclays US 1-3 Yr Govt/Credit
240 58% 0.4% (1.2%) 0.0% 0% 73% 0% 78% 0%
Merganser - Short Term Bond
Barclays US 1-3 Yr Govt/Credit
240 65% 0.9% (0.8%) 0.0% 2% 72% 3% 83% 0%
PIMCO - Low Duration - Core Barclays US 1-3 Yr Govt/Credit
240 61% 1.5% (3.2%) 0.0% 6% 56% 7% 61% 1%
Reams - Low Duration Barclays US 1-3 Yr Govt/Credit
162 67% 2.0% (1.7%) 0.1% 7% 87% 13% 93% 13%
T. Rowe - Short Term Bond Barclays US 1-3 Yr Govt/Credit
192 64% 1.0% (2.2%) 0.0% 3% 73% 4% 87% 0%

Performance as of December 31, 2015
Excess Returns Performance Summary - (Net of Fees)
Past performance is no guarantee of future results
# of Months Excess Return Tracking Error Information Ratio
Beta vs.
(Track Record) 1 Yr. 3 Yrs. 5 Yrs. 7 Yrs. 10 Yrs. 3 Yrs. 5 Yrs. 7 Yrs. 10 Yrs. 3 Yrs. 5 Yrs. 7 Yrs. 10 Yrs.
Primary Benchmark
Short Duration Fixed Income
Chicago Equity - Short Fixed Income
224 (0.2%) (0.4%) (0.3%) (0.1%) 0.1% 0.1% 0.2% 0.3% 0.4% (2.75) (1.41) (0.25) 0.34 1.08
Income Research - IR+M 1-3 Year
183 0.1% 0.1% 0.6% 1.5% 0.6% 0.2% 0.4% 0.9% 1.3% 0.52 1.53 1.61 0.50 0.85
Longfellow - Short Duration
240 0.1% 0.1% 0.3% 0.7% 0.4% 0.2% 0.2% 0.3% 0.6% 0.50 1.41 2.03 0.67 0.91
Merganser - Short Term Bond
240 0.2% 0.1% 0.4% 1.1% 0.4% 0.3% 0.3% 0.6% 0.9% 0.43 1.29 1.75 0.50 0.94
PIMCO - Low Duration - Core
240 (0.2%) (0.3%) 0.7% 1.4% 0.5% 1.1% 1.0% 1.3% 1.9% (0.25) 0.71 1.07 0.27 1.21
Reams - Low Duration 162 0.1% 0.3% 1.1% 2.5% 1.4% 0.4% 0.8% 1.5% 1.6% 0.83 1.49 1.71 0.92 1.21
T. Rowe - Short Term Bond
192 0.1% 0.1% 0.5% 1.2% 0.4% 0.4% 0.5% 0.7% 1.1% 0.26 1.00 1.64 0.42 0.97

Performance as of December 31, 2015
Excess Returns Performance Summary - (Net of Fees) (Least Common Denominator)
Past performance is no guarantee of future results
Primary # of Months % Positive High Low Average % > Rolling 1 Yr.
Rtr. Rolling 3 Yr.
Rtr.
Benchmark (Track Record)
(Mo.) (Mo.) (Mo.) (Mo.) 0.5% > 0% > 3% > 0% > 3%
Short Duration Fixed Income
Chicago Equity - Short Fixed Income
Barclays US 1-3 Yr Govt/Credit
162 44% 0.8% (0.2%) 0.0% 1% 54% 0% 57% 0%
Income Research - IR+M 1-3 Year
Barclays US 1-3 Yr Govt/Credit
162 71% 1.5% (1.8%) 0.1% 6% 83% 5% 87% 0%
Longfellow - Short Duration Barclays US 1-3 Yr Govt/Credit
162 65% 0.4% (1.0%) 0.0% 0% 81% 0% 96% 0%
Merganser - Short Term Bond
Barclays US 1-3 Yr Govt/Credit
162 65% 0.9% (0.8%) 0.0% 4% 73% 5% 84% 0%
PIMCO - Low Duration - Core Barclays US 1-3 Yr Govt/Credit
162 64% 1.5% (3.2%) 0.0% 7% 52% 11% 65% 2%
Reams - Low Duration Barclays US 1-3 Yr Govt/Credit
162 67% 2.0% (1.7%) 0.1% 7% 87% 13% 93% 13%
T. Rowe - Short Term Bond Barclays US 1-3 Yr Govt/Credit
162 64% 1.0% (2.2%) 0.0% 3% 77% 5% 85% 0%

Performance as of December 31, 2015
Excess Returns Performance Summary - (Net of Fees) (Least Common Denominator)
Past performance is no guarantee of future results
# of Months Excess Return Tracking Error Information Ratio
Beta vs.
(Track Record) 1 Yr. 3 Yrs. 5 Yrs. 7 Yrs. 10 Yrs. 3 Yrs. 5 Yrs. 7 Yrs. 10 Yrs. 3 Yrs. 5 Yrs. 7 Yrs. 10 Yrs.
Primary Benchmark
Short Duration Fixed Income
Chicago Equity - Short Fixed Income
162 (0.2%) (0.4%) (0.3%) (0.1%) 0.1% 0.1% 0.2% 0.3% 0.4% (2.75) (1.41) (0.25) 0.34 1.04
Income Research - IR+M 1-3 Year
162 0.1% 0.1% 0.6% 1.5% 0.6% 0.2% 0.4% 0.9% 1.3% 0.52 1.53 1.61 0.50 0.93
Longfellow - Short Duration
162 0.1% 0.1% 0.3% 0.7% 0.4% 0.2% 0.2% 0.3% 0.6% 0.50 1.41 2.03 0.67 0.85
Merganser - Short Term Bond
162 0.2% 0.1% 0.4% 1.1% 0.4% 0.3% 0.3% 0.6% 0.9% 0.43 1.29 1.75 0.50 0.92
PIMCO - Low Duration - Core
162 (0.2%) (0.3%) 0.7% 1.4% 0.5% 1.1% 1.0% 1.3% 1.9% (0.25) 0.71 1.07 0.27 1.26
Reams - Low Duration 162 0.1% 0.3% 1.1% 2.5% 1.4% 0.4% 0.8% 1.5% 1.6% 0.83 1.49 1.71 0.92 1.21
T. Rowe - Short Term Bond
162 0.1% 0.1% 0.5% 1.2% 0.4% 0.4% 0.5% 0.7% 1.1% 0.26 1.00 1.64 0.42 0.97

Performance as of December 31, 2015
Excess Monthly Returns Histogram - (Net of Fees)
Past performance is no guarantee of future results
0%
10%
20%
30%
40%
50%
60%
70%
<-3
%
-3%
to
%-2
.5
-2.5
% t
o %
-2.0
-2.0
% t
o %
-1.5
-1.5
% t
o %
-1.0
-1.0
% t
o %
-0.5
-0.5
% t
o %
0.0
0.0%
to
%0.
5
0.5%
to
%1.
0
1.0%
to
%1.
5
1.5%
to
%2.
0
2.0%
to
%2.
5
2.5%
to
%3.
0
>3%
Mo.
Mg
r. R
etu
rn (
Rel
ativ
e Fr
equ
ency
%)
Chicago Equity - Short Fixed Income
N=224 Monthly Excess Returns (Manager returns less Barclays US 1-3 Yr Govt/Credit)
0%
10%
20%
30%
40%
50%
60%
70%
<-3
%
-3%
to
%-2
.5
-2.5
% t
o %
-2.0
-2.0
% t
o %
-1.5
-1.5
% t
o %
-1.0
-1.0
% t
o %
-0.5
-0.5
% t
o %
0.0
0.0%
to
%0.
5
0.5%
to
%1.
0
1.0%
to
%1.
5
1.5%
to
%2.
0
2.0%
to
%2.
5
2.5%
to
%3.
0
>3%
Mo.
Mg
r. R
etu
rn (
Rel
ativ
e Fr
equ
ency
%)
Income Research - IR+M 1-3 Year
N=183 Monthly Excess Returns (Manager returns less Barclays US 1-3 Yr Govt/Credit)
0%
10%
20%
30%
40%
50%
60%
70%
<-3
%
-3%
to
%-2
.5
-2.5
% t
o %
-2.0
-2.0
% t
o %
-1.5
-1.5
% t
o %
-1.0
-1.0
% t
o %
-0.5
-0.5
% t
o %
0.0
0.0%
to
%0.
5
0.5%
to
%1.
0
1.0%
to
%1.
5
1.5%
to
%2.
0
2.0%
to
%2.
5
2.5%
to
%3.
0
>3%
Mo.
Mg
r. R
etu
rn (
Rel
ativ
e Fr
equ
ency
%)
Longfellow - Short Duration
N=240 Monthly Excess Returns (Manager returns less Barclays US 1-3 Yr Govt/Credit)
0%
10%
20%
30%
40%
50%
60%
70%
<-3
%
-3%
to
%-2
.5
-2.5
% t
o %
-2.0
-2.0
% t
o %
-1.5
-1.5
% t
o %
-1.0
-1.0
% t
o %
-0.5
-0.5
% t
o %
0.0
0.0%
to
%0.
5
0.5%
to
%1.
0
1.0%
to
%1.
5
1.5%
to
%2.
0
2.0%
to
%2.
5
2.5%
to
%3.
0
>3%
Mo.
Mg
r. R
etu
rn (
Rel
ativ
e Fr
equ
ency
%)
Merganser - Short Term Bond
N=240 Monthly Excess Returns (Manager returns less Barclays US 1-3 Yr Govt/Credit)

Performance as of December 31, 2015
Excess Monthly Returns Histogram - (Net of Fees)
Past performance is no guarantee of future results
0%
10%
20%
30%
40%
50%
60%
70%
<-3
%
-3%
to
%-2
.5
-2.5
% t
o %
-2.0
-2.0
% t
o %
-1.5
-1.5
% t
o %
-1.0
-1.0
% t
o %
-0.5
-0.5
% t
o %
0.0
0.0%
to
%0.
5
0.5%
to
%1.
0
1.0%
to
%1.
5
1.5%
to
%2.
0
2.0%
to
%2.
5
2.5%
to
%3.
0
>3%
Mo.
Mg
r. R
etu
rn (
Rel
ativ
e Fr
equ
ency
%)
PIMCO - Low Duration - Core
N=240 Monthly Excess Returns (Manager returns less Barclays US 1-3 Yr Govt/Credit)
0%
10%
20%
30%
40%
50%
60%
70%
<-3
%
-3%
to
%-2
.5
-2.5
% t
o %
-2.0
-2.0
% t
o %
-1.5
-1.5
% t
o %
-1.0
-1.0
% t
o %
-0.5
-0.5
% t
o %
0.0
0.0%
to
%0.
5
0.5%
to
%1.
0
1.0%
to
%1.
5
1.5%
to
%2.
0
2.0%
to
%2.
5
2.5%
to
%3.
0
>3%
Mo.
Mg
r. R
etu
rn (
Rel
ativ
e Fr
equ
ency
%)
Reams - Low Duration
N=162 Monthly Excess Returns (Manager returns less Barclays US 1-3 Yr Govt/Credit)
0%
10%
20%
30%
40%
50%
60%
70%
<-3
%
-3%
to
%-2
.5
-2.5
% t
o %
-2.0
-2.0
% t
o %
-1.5
-1.5
% t
o %
-1.0
-1.0
% t
o %
-0.5
-0.5
% t
o %
0.0
0.0%
to
%0.
5
0.5%
to
%1.
0
1.0%
to
%1.
5
1.5%
to
%2.
0
2.0%
to
%2.
5
2.5%
to
%3.
0
>3%
Mo.
Mg
r. R
etu
rn (
Rel
ativ
e Fr
equ
ency
%)
T. Rowe - Short Term Bond
N=192 Monthly Excess Returns (Manager returns less Barclays US 1-3 Yr Govt/Credit)

Performance as of December 31, 2015
Rolling 1 Year Excess Returns - (Net of Fees)
Past performance is no guarantee of future results
-10%
-5%
0%
5%
10%
15%
20%
D-98
D-99
D-00
D-01
D-02
D-03
D-04
D-05
D-06
D-07
D-08
D-09
D-10
D-11
D-12
D-13
D-14
D-15
Ro
llin
g 1
yr.
Ret
urn
Chicago Equity - Short Fixed Income
Excess Returns (Manager returns less Barclays US 1-3 Yr Govt/Credit)
-10%
-5%
0%
5%
10%
15%
20%
D-98
D-99
D-00
D-01
D-02
D-03
D-04
D-05
D-06
D-07
D-08
D-09
D-10
D-11
D-12
D-13
D-14
D-15
Ro
llin
g 1
yr.
Ret
urn
Income Research - IR+M 1-3 Year
Excess Returns (Manager returns less Barclays US 1-3 Yr Govt/Credit)
-10%
-5%
0%
5%
10%
15%
20%
D-98
D-99
D-00
D-01
D-02
D-03
D-04
D-05
D-06
D-07
D-08
D-09
D-10
D-11
D-12
D-13
D-14
D-15
Ro
llin
g 1
yr.
Ret
urn
Longfellow - Short Duration
Excess Returns (Manager returns less Barclays US 1-3 Yr Govt/Credit)
-10%
-5%
0%
5%
10%
15%
20%
D-98
D-99
D-00
D-01
D-02
D-03
D-04
D-05
D-06
D-07
D-08
D-09
D-10
D-11
D-12
D-13
D-14
D-15
Ro
llin
g 1
yr.
Ret
urn
Merganser - Short Term Bond
Excess Returns (Manager returns less Barclays US 1-3 Yr Govt/Credit)

Performance as of December 31, 2015
Rolling 1 Year Excess Returns - (Net of Fees)
Past performance is no guarantee of future results
-10%
-5%
0%
5%
10%
15%
20%
D-98
D-99
D-00
D-01
D-02
D-03
D-04
D-05
D-06
D-07
D-08
D-09
D-10
D-11
D-12
D-13
D-14
D-15
Ro
llin
g 1
yr.
Ret
urn
PIMCO - Low Duration - Core
Excess Returns (Manager returns less Barclays US 1-3 Yr Govt/Credit)
-10%
-5%
0%
5%
10%
15%
20%
D-98
D-99
D-00
D-01
D-02
D-03
D-04
D-05
D-06
D-07
D-08
D-09
D-10
D-11
D-12
D-13
D-14
D-15
Ro
llin
g 1
yr.
Ret
urn
Reams - Low Duration
Excess Returns (Manager returns less Barclays US 1-3 Yr Govt/Credit)
-10%
-5%
0%
5%
10%
15%
20%
D-98
D-99
D-00
D-01
D-02
D-03
D-04
D-05
D-06
D-07
D-08
D-09
D-10
D-11
D-12
D-13
D-14
D-15
Ro
llin
g 1
yr.
Ret
urn
T. Rowe - Short Term Bond
Excess Returns (Manager returns less Barclays US 1-3 Yr Govt/Credit)

Performance as of December 31, 2015
Rolling 1 Year Excess Returns - (Net of Fees)
Past performance is no guarantee of future results
-20%
-15%
-10%
-5%
0%
5%
10%
15%
20%
0% 5% 10% 15% 20%
Ro
llin
g 1
yr.
Mg
r. E
xces
s R
etu
rn
Rolling 1 yr. Index Return
Chicago Equity - Short Fixed Income
Excess Returns (Manager returns less Barclays US 1-3 Yr Govt/Credit)
-20%
-15%
-10%
-5%
0%
5%
10%
15%
20%
0% 5% 10% 15% 20%
Ro
llin
g 1
yr.
Mg
r. E
xces
s R
etu
rn
Rolling 1 yr. Index Return
Income Research - IR+M 1-3 Year
Excess Returns (Manager returns less Barclays US 1-3 Yr Govt/Credit)
-20%
-15%
-10%
-5%
0%
5%
10%
15%
20%
0% 5% 10% 15% 20%
Ro
llin
g 1
yr.
Mg
r. E
xces
s R
etu
rn
Rolling 1 yr. Index Return
Longfellow - Short Duration
Excess Returns (Manager returns less Barclays US 1-3 Yr Govt/Credit)
-20%
-15%
-10%
-5%
0%
5%
10%
15%
20%
0% 5% 10% 15% 20%
Ro
llin
g 1
yr.
Mg
r. E
xces
s R
etu
rn
Rolling 1 yr. Index Return
Merganser - Short Term Bond
Excess Returns (Manager returns less Barclays US 1-3 Yr Govt/Credit)

Performance as of December 31, 2015
Rolling 1 Year Excess Returns - (Net of Fees)
Past performance is no guarantee of future results
-20%
-15%
-10%
-5%
0%
5%
10%
15%
20%
0% 5% 10% 15% 20%
Ro
llin
g 1
yr.
Mg
r. E
xces
s R
etu
rn
Rolling 1 yr. Index Return
PIMCO - Low Duration - Core
Excess Returns (Manager returns less Barclays US 1-3 Yr Govt/Credit)
-20%
-15%
-10%
-5%
0%
5%
10%
15%
20%
0% 5% 10% 15% 20%
Ro
llin
g 1
yr.
Mg
r. E
xces
s R
etu
rn
Rolling 1 yr. Index Return
Reams - Low Duration
Excess Returns (Manager returns less Barclays US 1-3 Yr Govt/Credit)
-20%
-15%
-10%
-5%
0%
5%
10%
15%
20%
0% 5% 10% 15% 20%
Ro
llin
g 1
yr.
Mg
r. E
xces
s R
etu
rn
Rolling 1 yr. Index Return
T. Rowe - Short Term Bond
Excess Returns (Manager returns less Barclays US 1-3 Yr Govt/Credit)

Performance as of December 31, 2015
Rolling 3 Year Excess Returns - (Net of Fees)
Past performance is no guarantee of future results
-10%
-8%
-6%
-4%
-2%
0%
2%
4%
6%
8%
10%
D-98
D-99
D-00
D-01
D-02
D-03
D-04
D-05
D-06
D-07
D-08
D-09
D-10
D-11
D-12
D-13
D-14
D-15
Ro
llin
g 3
yr.
Ret
urn
Chicago Equity - Short Fixed Income
Excess Returns (Manager returns less Barclays US 1-3 Yr Govt/Credit)
-10%
-8%
-6%
-4%
-2%
0%
2%
4%
6%
8%
10%
D-98
D-99
D-00
D-01
D-02
D-03
D-04
D-05
D-06
D-07
D-08
D-09
D-10
D-11
D-12
D-13
D-14
D-15
Ro
llin
g 3
yr.
Ret
urn
Income Research - IR+M 1-3 Year
Excess Returns (Manager returns less Barclays US 1-3 Yr Govt/Credit)
-10%
-8%
-6%
-4%
-2%
0%
2%
4%
6%
8%
10%
D-98
D-99
D-00
D-01
D-02
D-03
D-04
D-05
D-06
D-07
D-08
D-09
D-10
D-11
D-12
D-13
D-14
D-15
Ro
llin
g 3
yr.
Ret
urn
Longfellow - Short Duration
Excess Returns (Manager returns less Barclays US 1-3 Yr Govt/Credit)
-10%
-8%
-6%
-4%
-2%
0%
2%
4%
6%
8%
10%
D-98
D-99
D-00
D-01
D-02
D-03
D-04
D-05
D-06
D-07
D-08
D-09
D-10
D-11
D-12
D-13
D-14
D-15
Ro
llin
g 3
yr.
Ret
urn
Merganser - Short Term Bond
Excess Returns (Manager returns less Barclays US 1-3 Yr Govt/Credit)

Performance as of December 31, 2015
Rolling 3 Year Excess Returns - (Net of Fees)
Past performance is no guarantee of future results
-10%
-8%
-6%
-4%
-2%
0%
2%
4%
6%
8%
10%
D-98
D-99
D-00
D-01
D-02
D-03
D-04
D-05
D-06
D-07
D-08
D-09
D-10
D-11
D-12
D-13
D-14
D-15
Ro
llin
g 3
yr.
Ret
urn
PIMCO - Low Duration - Core
Excess Returns (Manager returns less Barclays US 1-3 Yr Govt/Credit)
-10%
-8%
-6%
-4%
-2%
0%
2%
4%
6%
8%
10%
D-98
D-99
D-00
D-01
D-02
D-03
D-04
D-05
D-06
D-07
D-08
D-09
D-10
D-11
D-12
D-13
D-14
D-15
Ro
llin
g 3
yr.
Ret
urn
Reams - Low Duration
Excess Returns (Manager returns less Barclays US 1-3 Yr Govt/Credit)
-10%
-8%
-6%
-4%
-2%
0%
2%
4%
6%
8%
10%
D-98
D-99
D-00
D-01
D-02
D-03
D-04
D-05
D-06
D-07
D-08
D-09
D-10
D-11
D-12
D-13
D-14
D-15
Ro
llin
g 3
yr.
Ret
urn
T. Rowe - Short Term Bond
Excess Returns (Manager returns less Barclays US 1-3 Yr Govt/Credit)

Performance as of December 31, 2015
Rolling 3 Year Excess Returns - (Net of Fees)
Past performance is no guarantee of future results
-10%
-8%
-6%
-4%
-2%
0%
2%
4%
6%
8%
10%
0% 2% 4% 6% 8% 10%
Ro
llin
g 3
yr.
Mg
r. E
xces
s R
etu
rn
Rolling 3 yr. Index Return
Chicago Equity - Short Fixed Income
Excess Returns (Manager returns less Barclays US 1-3 Yr Govt/Credit)
-10%
-8%
-6%
-4%
-2%
0%
2%
4%
6%
8%
10%
0% 2% 4% 6% 8% 10%
Ro
llin
g 3
yr.
Mg
r. E
xces
s R
etu
rn
Rolling 3 yr. Index Return
Income Research - IR+M 1-3 Year
Excess Returns (Manager returns less Barclays US 1-3 Yr Govt/Credit)
-10%
-8%
-6%
-4%
-2%
0%
2%
4%
6%
8%
10%
0% 2% 4% 6% 8% 10%
Ro
llin
g 3
yr.
Mg
r. E
xces
s R
etu
rn
Rolling 3 yr. Index Return
Longfellow - Short Duration
Excess Returns (Manager returns less Barclays US 1-3 Yr Govt/Credit)
-10%
-8%
-6%
-4%
-2%
0%
2%
4%
6%
8%
10%
0% 2% 4% 6% 8% 10%
Ro
llin
g 3
yr.
Mg
r. E
xces
s R
etu
rn
Rolling 3 yr. Index Return
Merganser - Short Term Bond
Excess Returns (Manager returns less Barclays US 1-3 Yr Govt/Credit)

Performance as of December 31, 2015
Rolling 3 Year Excess Returns - (Net of Fees)
Past performance is no guarantee of future results
-10%
-8%
-6%
-4%
-2%
0%
2%
4%
6%
8%
10%
0% 2% 4% 6% 8% 10%
Ro
llin
g 3
yr.
Mg
r. E
xces
s R
etu
rn
Rolling 3 yr. Index Return
PIMCO - Low Duration - Core
Excess Returns (Manager returns less Barclays US 1-3 Yr Govt/Credit)
-10%
-8%
-6%
-4%
-2%
0%
2%
4%
6%
8%
10%
0% 2% 4% 6% 8% 10%
Ro
llin
g 3
yr.
Mg
r. E
xces
s R
etu
rn
Rolling 3 yr. Index Return
Reams - Low Duration
Excess Returns (Manager returns less Barclays US 1-3 Yr Govt/Credit)
-10%
-8%
-6%
-4%
-2%
0%
2%
4%
6%
8%
10%
0% 2% 4% 6% 8% 10%
Ro
llin
g 3
yr.
Mg
r. E
xces
s R
etu
rn
Rolling 3 yr. Index Return
T. Rowe - Short Term Bond
Excess Returns (Manager returns less Barclays US 1-3 Yr Govt/Credit)

Performance as of December 31, 2015
3 Year Total Risk/Returns Comparison - (Net of Fees)
Past performance is no guarantee of future results
Chicago Equity - Short Fixed Income
Income Research - IR+M 1-3 Year
Longfellow - Short Duration
Merganser - Short Term Bond
PIMCO - Low Duration - Core
Reams - Low Duration
T. Rowe - Short Term Bond Barclays US 1-3 Yr Govt/Credit
Barclays US Aggregate
0%
1%
2%
0% 1% 2% 3% 4%
Ave
rag
e A
nn
ual
Ret
urn
%
Average Standard Deviation (Risk) (%)
Higher Return Lower Risk
Lower Return Higher Risk

Performance as of December 31, 2015
5 Year Total Risk/Returns Comparison - (Net of Fees)
Past performance is no guarantee of future results
Chicago Equity - Short Fixed Income
Income Research - IR+M 1-3 Year
Longfellow - Short Duration
Merganser - Short Term Bond
PIMCO - Low Duration - Core
Reams - Low Duration
T. Rowe - Short Term Bond
Barclays US 1-3 Yr Govt/Credit
Barclays US Aggregate
0%
1%
2%
3%
4%
0% 2% 4% 6% 8% 10%
Ave
rag
e A
nn
ual
Ret
urn
%
Average Standard Deviation (Risk) (%)
Higher Return Lower Risk
Lower Return Higher Risk

Performance as of December 31, 2015
7 Year Total Risk/Returns Comparison - (Net of Fees)
Past performance is no guarantee of future results
Chicago Equity - Short Fixed Income
Income Research - IR+M 1-3 Year
Longfellow - Short Duration
Merganser - Short Term Bond
PIMCO - Low Duration - Core
Reams - Low Duration
T. Rowe - Short Term Bond
Barclays US 1-3 Yr Govt/Credit
Barclays US Aggregate
0%
1%
2%
3%
4%
5%
0% 2% 4% 6% 8% 10%
Ave
rag
e A
nn
ual
Ret
urn
%
Average Standard Deviation (Risk) (%)
Higher Return Lower Risk
Lower Return Higher Risk

Performance as of December 31, 2015
10 Year Total Risk/Returns Comparison - (Net of Fees)
Past performance is no guarantee of future results
Chicago Equity - Short Fixed Income
Income Research - IR+M 1-3 Year
Longfellow - Short Duration
Merganser - Short Term Bond
PIMCO - Low Duration - Core
Reams - Low Duration
T. Rowe - Short Term Bond
Barclays US 1-3 Yr Govt/Credit
Barclays US Aggregate
0%
1%
2%
3%
4%
5%
0% 1% 2% 3% 4%
Ave
rag
e A
nn
ual
Ret
urn
%
Average Standard Deviation (Risk) (%)
Higher Return Lower Risk
Lower Return Higher Risk

Profiles

The following pages contain profile descriptions regarding each Manager Firm and Investment Product including: • Firm Description • NEPC Investment Thesis • People • Philosophy • Investment Strategy • Portfolio Structure • Performance Expectations • Biographies
Description

Short Duration Fixed Income
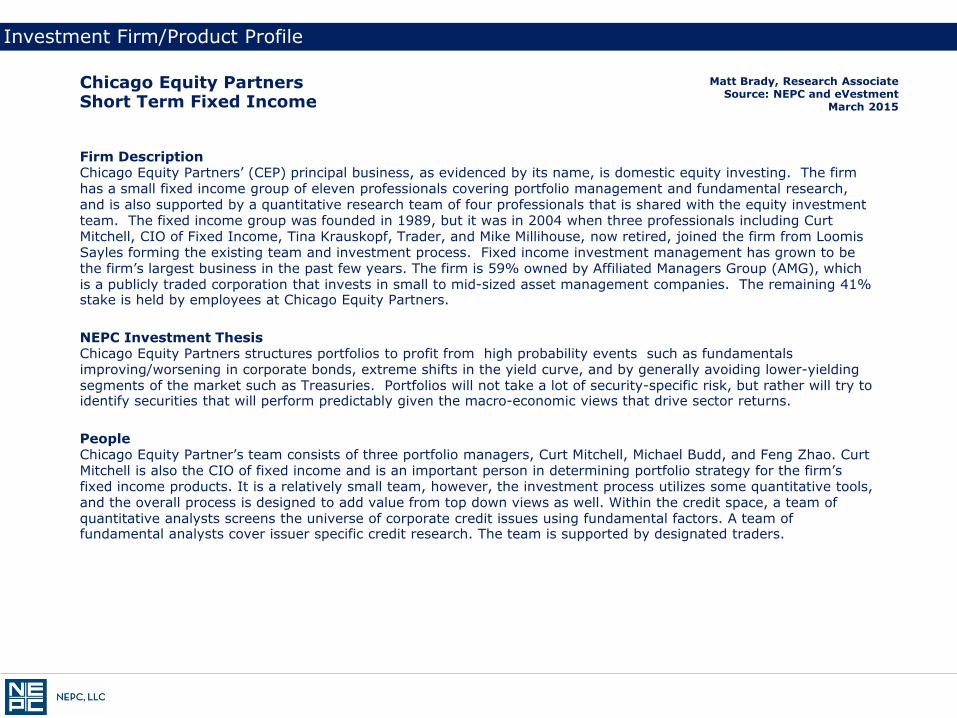
Investment Firm/Product Profile
Matt Brady, Research Associate Source: NEPC and eVestment
March 2015
Chicago Equity Partners Short Term Fixed Income
Firm Description Chicago Equity Partners’ (CEP) principal business, as evidenced by its name, is domestic equity investing. The firm has a small fixed income group of eleven professionals covering portfolio management and fundamental research, and is also supported by a quantitative research team of four professionals that is shared with the equity investment team. The fixed income group was founded in 1989, but it was in 2004 when three professionals including Curt Mitchell, CIO of Fixed Income, Tina Krauskopf, Trader, and Mike Millihouse, now retired, joined the firm from Loomis Sayles forming the existing team and investment process. Fixed income investment management has grown to be the firm’s largest business in the past few years. The firm is 59% owned by Affiliated Managers Group (AMG), which is a publicly traded corporation that invests in small to mid-sized asset management companies. The remaining 41% stake is held by employees at Chicago Equity Partners.
NEPC Investment Thesis Chicago Equity Partners structures portfolios to profit from high probability events such as fundamentals improving/worsening in corporate bonds, extreme shifts in the yield curve, and by generally avoiding lower-yielding segments of the market such as Treasuries. Portfolios will not take a lot of security-specific risk, but rather will try to identify securities that will perform predictably given the macro-economic views that drive sector returns.
People Chicago Equity Partner’s team consists of three portfolio managers, Curt Mitchell, Michael Budd, and Feng Zhao. Curt Mitchell is also the CIO of fixed income and is an important person in determining portfolio strategy for the firm’s fixed income products. It is a relatively small team, however, the investment process utilizes some quantitative tools, and the overall process is designed to add value from top down views as well. Within the credit space, a team of quantitative analysts screens the universe of corporate credit issues using fundamental factors. A team of fundamental analysts cover issuer specific credit research. The team is supported by designated traders.

Investment Firm/Product Profile
Chicago Equity Partners Short Term Fixed Income
Philosophy Chicago Equity Partners believes that excess returns are available in the non-Treasury sectors of the investment grade bond market. Portfolios are structured to gain an income advantage over the index. Thus their research efforts will focus on spread sectors such as investment grade credit and securitized bonds. They are likely to overweight spread sectors in most market environments, however, sector allocation and quality biases will change along with the outlook for improving fundamentals or worsening fundamentals. Resulting portfolios are high quality and tend to avoid unproven security structures. Portfolios will be duration neutral, but will utilize yield curve strategies to benefit from interest rate cycles.
Investment Strategy Determining the current state of the credit cycle is an important part of synthesizing the portfolio’s biases and risk appetite, and serves as a starting point for the investment process. Indications that the economy is growing, views on inflation and interest rates, and that the stock market is advancing are conducive to adding risk in corporate bonds, lower quality bonds (BBB and A rated) and in cyclical industries. Leading indicators of a slowing economy and bear market prompts a defensive portfolio positioning. General market conditions, yield curve forecasts and historical analysis of return patterns are also inputs into the top-down process.
With regards to corporate credit, CEP applies quantitative screens developed by a team of four research professionals that also develop screens for equities. Nine factors including downward earnings revisions, earnings momentum, asset turnover, leverage, earnings quality and free cash flow are applied to over 750 credit issuers in order to screen out weak credits and to identify stable to improving issuers. In-depth fundamental research including examining the legal/regulatory environment, competition, management and acquisitions/divestitures is performed on credits that are highly ranked by the screen, with ideal purchase candidates exhibiting stable and strong fundamentals at an attractive yield. A quantitatively driven, relative value model is used to evaluate opportunities in agency mortgage-backed securities. Model inputs include the level of rates, the composition of the mortgage index, the slope of the yield curve, and interest rate volatility. This process is applied exclusively to agency issued mortgage-backed securities because of their standardized underwriting platform, structural transparency, limited credit risk, and superior liquidity.

Investment Firm/Product Profile
Chicago Equity Partners Short Term Fixed Income
Portfolio Risk management is an important part of the investment process. A risk budget is established that measures interest rate, yield curve, sector, industry, quality and specific issuer risks both independently and in total. By maintaining specific guidelines for each type of risk as well as a target level for overall portfolio risk, CEP is able to pursue return enhancing strategies with full knowledge of the impact on the risk characteristics of the portfolio. Diversification rules and position limits also help maintain discipline throughout the portfolio construction process.
Duration exposure is limited to +/- 10% of the index. Lower quality credits (BBB rated) are used opportunistically to enhance yield.
Performance Expectations Historically, the strategy has performed well in both up and down credit markets. Short Duration’s strong risk controls related to sector over/under and security positions reduce the overall tracking error to the index. The strategy tends to emphasize corporate credit as the primary value add. ABS and CMBS sectors have been a component to the strategy, but are not a large source of return.

Biographies of Key Professionals
Chicago Equity Partners Short Term Fixed Income
Curt Mitchell, Director, Portfolio Manager Mr. Mitchell is a fixed income portfolio manager focusing on the corporate bond sector. He joined Chicago Equity Partners in 2003, in conjunction with the launch of our fixed income business. Prior to joining, he served as vice president and senior portfolio manager at Loomis Sayles & Company. Mr. Mitchell earned a bachelor’s degree in accounting from Illinois Wesleyan University and an MBA from the University of Illinois. He holds the Chartered Financial Analyst (CFA) designation, and is a member of the CFA Institute and the CFA Society of Chicago.
Michael Budd, Director and Portfolio Manager Mr. Budd is a fixed income portfolio manager focusing on mortgage, asset-backed and agency sectors. Prior to joining Chicago Equity Partners, he held positions at Bear Stearns and at St. Paul Federal Bank. Mr. Budd earned a bachelor’s degree in finance from the University of Notre Dame and an MBA from Loyola University. He is a trustee on the investment board of Benedictine Sisters of the Sacred Heart.

Investment Firm/Product Profile
Matt Brady, Research Associate Source: NEPC and eVestment
March 2015
Income Research & Management IR+M 1-3 Year
Firm Description Income Research and Management (IR+M) is a boutique investment manager focused on delivering fixed income products and solutions to clients. Domestic investment grade fixed income investments are its sole line of business. The firm was founded in 1987 by John and Jack Sommers and is 85% employee owned. One of the strengths of IR+M is their strong organizational culture and entrepreneurial work environment. Idea generation and creative solutions to portfolio management are a large part of IR+M’s work ethic and management style.
NEPC Investment Thesis IR+M is a bottom-up value manager with a skill set in the credit and securitized bond sectors of the market. IR+M exploits overlooked opportunities in complex and often overlooked sub-sectors, leading to portfolios that benefit from an income bias and positive convexity relative to the index. Their expected alpha is sourced in their understanding and ability to identify mispricings in bond markets as well as their expertise in the analysis of esoteric securities, such as put bonds, pre-payable CMBS bonds, hybrid ARMS, municipals, century bonds and convertible bonds.
People The investment grade fixed income team consists of more than 10 portfolio managers and more than 15 research analysts. The team has experienced a very low level of historical turnover at the portfolio manager level. IR+M strives to reduce turnover of professionals by strengthening the team through equity ownership and by utilizing a rigorous interview process that searches for professionals that would be a good fit for the team. Portfolio managers are organized as specialists within the various bond sectors and manage a team of researchers.
Philosophy IR+M believes that security selection and income are important sources of returns and can lead to superior results over time. IR+M’s process is bottom-up and value-focused, with the aim to uncover value in complex issues or overlooked sectors of the market. Often times these issues are structured with better characteristics (convexity and yield) compared to straight government or corporate bonds.The strategy is not solely focused on yield, but rather strives to increase portfolio yield and to increase the positive convexity of the portfolio so that capital is preserved in volatile interest rate environments.

Investment Firm/Product Profile
Income Research & Management IR+M 1-3 Year
Investment Strategy IR+M’s investment process expects to generate above-benchmark returns by employing rigorous bottom-up security selection and by constructing portfolios to provide yield and convexity advantages. This is achieved by emphasizing selection in investment grade corporate bonds and mortgage-backed securities. The strategies do not employ any active macro-economic decisions duration and yield curve posture are held neutral to the benchmark. IR&M believes that building a portfolio from the bottom-up is the most efficient way to earn incremental excess returns and that macro-economic decisions in the portfolio do not add value over time and instead contribute to higher tracking error.
Portfolios are built strictly on a bottom-up basis, rather than on a sector allocation basis. Overweight positions in certain bond sectors will be the result of capitalizing on market inefficiencies in various spread sectors, including corporate bonds and mortgage backed securities. IR&M seeks to purchase bonds for portfolios that meet credit standards, have attractive structure, and that are attractively priced. Oftentimes, the use of esoteric securities such as century bonds, put bonds, hybrid ARMs and occasionally convertible bonds offer attractive alternatives to plain corporate bonds or mortgage-backed securities as they have favorable structure and enhance the portfolio’s yield and convexity advantage.
The IR+M credit process begins with eliminating issuers with less than $2 billion in debt outstanding from the universe of investment grade corporate issuers. Next, companies that exhibit political, quality or liquidity risks that are too high are also eliminated. From this universe of around 182 credits, credits that exhibit deteriorating fundamentals, management issues or issues with transparency are eliminated. Credits that are deemed attractive for the portfolio have convexity benefits and favorable structure. Finally after favorable fundamental analysis, attractive valuation reveals the best credits for the portfolio. The final favorite list of credits is approximately 100 issuers in size.

Investment Firm/Product Profile
Income Research & Management IR+M 1-3 Year
Within structured product, the universe of MBS, ABS and CMBS totals near 6, 000 issues. IR+M eliminates from this list poorly structured bonds, bonds with unproven collateral and subordinated bonds. From the refined list, research focuses on bonds with limited negative convexity and strong collateral/structure. The best ideas list is examined for attractively valued securities. Within the structured product sector, IR+M has been buying CMBS securities that receive prepayment penalties. All structured product bears prepayment risk, however, IR+M buys CMBS securities that bear penalties for prepayment, and earns a little extra income on top of the coupon.
Portfolio managers and senior decision makers are heavily involved in research and idea generation. The firm's research, trading and portfolio management functions are fully integrated - portfolio managers perform their own trading and research, bringing experience to bear on execution and analytics. Analysts are also actively involved in idea generation and portfolio strategy. There are not any formal investment committees as portfolio managers and research analysts are encouraged to share ideas and strategies.
Portfolio Duration and yield curve exposures are kept within 10% of the benchmark. A typical portfolio will contain between 50 and 100 securities. Positions in any non-government issue will not exceed 5% of the portfolio.
Performance Expectations IR+M is typically underweight Treasury or Agency securities in favor of corporate or securitized sectors. The strategy will tend to lag during episodes of spread-widening, but will do better when spreads tighten. Because IR+M focuses on building positive convexity in their portfolio’s, the strategy aims to outperform in volatile interest rate environments, which should help dampen some portfolio volatility.

Biographies of Key Professionals
Income Research & Management IR+M 1-3 Year
Edmund Ingalls, CFA, Principal Mr. Ingalls joined the firm in February of 2000, and is a Senior Portfolio Manager/Analyst with over 29 years of experience in the investment services industry. Prior to IR&M, he was a Portfolio Manager and Associate Partner at INVESCO. Previously, he was an Assistant Investment Officer at Sun Life of Canada. Mr. Ingalls has a BA from Tufts University and his MBA from Boston University.
William O'Malley, CFA, Principal Mr. O’Malley joined the firm in September of 1994, and is a Senior Portfolio Manager/Analyst with over 20 years of experience in the investment services industry. Prior to IR&M, he was a Vice President at Wellington. Before joining Wellington in 1989, Mr. O’Malley worked at The Vanguard Group and in Morgan Stanley's Fixed Income Division. Mr. O’Malley has a BA from Amherst College and an MBA from The Wharton School at the University of Pennsylvania.
John Sommers, President Mr. Sommers co-founded IR&M in March 1987, and brings over 35 years of investment experience to the firm. Prior to IR&M, he was Director of Fixed Income at the Putnam Companies and was responsible for over $20 billion in fixed income assets. Mr. Sommers joined Putnam in 1976 and actively managed fixed income portfolios until 1985 when he was named President and CEO of Putnam Advisory. Prior to Putnam, Mr. Sommers was Director of Fixed Income Sales and Trading at Loeb, Rhodes & Co. and at F.S. Smithers. Mr. Sommers has a BA from Bucknell University and an MBA from NYU.
Jack Sommers, Principal Mr. Sommers is a Senior Portfolio Manager/Analyst and co-founded Income Research & Management in March 1987. Prior to IR&M, he worked for Morgan Stanley in their Fixed Income Division until 1986. Mr. Sommers has a BA from Amherst College and an MBA from Harvard Business School.

Investment Firm/Product Profile
Matt Brady, Research Associate Source: NEPC and eVestment
May 2014
Longfellow Investment Management Co. Short Duration
Firm Description Longfellow Investment Management Co. (LIM) is a boutique investment firm solely focused investment grade fixed income. The firm is 100% employee owned. The firm was founded in 1986 and was spun out from the Polaroid Corporation, where founder David Seeley managed short duration fixed income assets for the firm. Ownership is spread amongst eight Principals. The business is a majority woman owned.
NEPC Investment Thesis LIM views the fixed income markets as highly segmented in terms of the types of buyers and objectives of participants. Individual securities ideas, trading ideas, and relative value ideas are often generated from the team trading with restricted buyers, insurance, regulated, or other participants that may not be economically, but rather rule driven in their transactions. LIM’s relatively small size and focus on esoteric ABS sectors of the market also provides a source of excess return and over time has contributed to alpha.
People There are eight principals at Longfellow, five of which are on the investment team. The founder of Longfellow, David Seeley, retired from the firm and fully divested his ownership at the end of 2013. John Villela, Barbara Mckenna, Dave Steuhr, and Akshay Anand are the key investment professionals on the short duration strategy. The team is supported by seven additional analysts. John Villela and Akshay Anand together cover the asset-backed securitiy sector that was previously covered by David Seeley.
Philosophy LIM’s philosophy to fixed income investing is to avoid losses due to downgrade or default by focusing on stable to improving credits, and to utilize a top-down framework for risk management coupled with bottom-up security selection. The objective of Short Duration Fixed Income is to preserve capital and minimize volatility, while providing an attractive risk-adjusted return. Historically, the short section of the yield curve has provided good risk adjusted returns for investors, and the strategy is managed to optimize the 1-2 year segment of the curve through issue selection and sector selection.

Investment Firm/Product Profile
Longfellow Investment Management Co. Short Duration
Investment Strategy LIM’s investment process begins with a review of client objectives and guidelines to determine a suitable structure, liquidity profile and gain/loss tolerance. Broad macro-economic themes are identified such as market sentiment, risk appetite, Fed policy and technicals to determine a portfolio investment framework. Individual sector and security analysis will drive most of the active positions in the portfolio as top-down analysis is only used to determine very broad themes.
In evaluating a candidate security, LIM weighs its credit risk, call risk, event risk, and liquidity against the yield spread it offers. To determine option adjusted spreads, various specialized yield calculators are employed. In considering credit risk, LIM reviews Moody’s, Standard & Poor’s and research from several securities dealers. LIM also carefully reads the original prospectus on new issues or types of securities. LIM focuses a lot of their research efforts on the ABS sector of the market, as their size is an advantage in this market, and unique structures and collateral types offer attractive yield opportunities.
Portfolio Short Duration Fixed Income is limited to a 1-2 year portfolio duration range. Risk is significantly limited by constraining duration within these relatively narrow bands. Within the ranges, portfolio duration is set primarily to maintain the same level of risk (i.e., chance of a negative quarter) over time and secondly, to take advantage of the relative value of various market sectors. LIM does not utilize market timing, interest rate anticipation, trend following, Fed watching, or other forms of maturity management. Historically, performance of traditional fixed income management has suffered because of investors’ inability to successfully predict interest rate movements.
The defensive nature of LIM's fixed income products is based also upon other conservative investment policies. LIM believes in maintaining high credit quality. All securities purchased must have an investment grade rating by one of the major credit rating companies. Furthermore, the average rating of the portfolio will always be at least AA. A high level of diversification is achieved by limiting sector exposure to a maximum of 30% and each issuer or issue to 5%.

Investment Firm/Product Profile
Longfellow Investment Management Co. Short Duration
Performance Expectations Because the strategy will tend to overweight spread sectors of the market, performance will tend to lag when spreads widen. The strategy should perform well during periods in which credit spreads tighten.

Biographies of Key Professionals
Longfellow Investment Management Co. Short Duration
John Villela, Portfolio Manager Mr. Villela is a Principal, Portfolio Manager and Sr. Analyst with over 15 years of investment industry experience. Prior to joining Longfellow in 2005, John worked at State Street Research (SSR) from 2003-2005, as a Portfolio Analyst on the Fixed Income Team and was a member of the Market Based Group, focusing on $4 billion in credit assets along with Short/Intermediate Duration accounts. Prior to joining SSR, John was a Trader at Standish Mellon. Johns trading experience includes credit, ABS, governments and fixed income derivatives. He brings additional investment, sales and relationship experience from prior roles at Lehman Brothers and HSBC. John has an MBA and BA in Mathematics from Boston College. John is a CFA charterholder, a member of the CFA Institute and a member of the Boston Security Analysts Society. He has held NASD Series 7 & 63 registrations.
Barbara McKenna, CFA, Senior Investment Officer Ms. McKenna is a Portfolio Manager with 25 years of fixed income investment experience. Prior to joining Longfellow in 2005, Barbara was a Director and Senior Portfolio Manager at State Street Research (SSR) from 2001-2005. She was responsible for managing $14 billion of institutional fixed income accounts. As Director of Corporate Bond Strategy, she was responsible for developing and leading the implementation of corporate bond strategy across all mandates. Prior to joining SSR, Barbara was a Director at Standish, Ayer & Wood, where she was responsible for $3 billion in assets as the head of the Short Duration Team. She has also held portfolio management and investment banking positions at BayBank and Massachusetts Capital Resource Company, a venture capital firm. Barbara holds a MS and BS in Finance from Boston College. Barbara is a CFA charterholder, a member of the CFA Institute and a member of the Boston Security Analysts Society. She has held NASD Series 7 & 63 registrations. Barbara is an Associate of The Council for Women of Boston College.

Biographies of Key Professionals
Longfellow Investment Management Co. Short Duration
Dave Stuehr, CFA, Portfolio Manager Mr. Stuehr is a Portfolio Manager and Senior Analyst with over 25 years of investment experience. From 2005-2009, David was a portfolio manager and analyst at Hanover Strategic Management. Prior to that, he served as a Portfolio Manager at Seneca Capital Management. At Seneca Capital, David was responsible for the firms high yield investment portfolio and served as the lead manager on the Pacific View Fund, LLC a corporate bond-oriented hedge fund from its inception in 2002 through 2004. David also has significant experience in managing fixed income portfolios for an array of clients including high net worth individuals and insurance companies. Prior to joining Seneca, David was a Partner with Standish, Ayer & Wood. During his 12 years at the firm, he served as a Portfolio Manager and Director of Corporate Bond Research leading a 10 member analyst team. Mr. Stuehr received his MS in Finance from Boston College and MA in Economics from Bowling Green University. He also received his BS in Business Administration from Bowling Green University. David is a CFA charterholder, a member of the Boston Securities Analysts Society, and a member of the CFA Institute.
Akshay Anand, Senior Analyst Mr. Anand joined Longfellow in 2008 as an Analyst focusing on structured securities. Prior to Longfellow, Akshay worked at Babson Capital as an associate director on the Core and High Yield Teams and was responsible for fixed income portfolio analytics. He spent three years working at The Mentor Network as a Senior Treasury Analyst responsible for debt and liquidity management. He also has two years of public accounting experience. Akshay holds an MBA from Rochester Institute of Technology and a B. Com (H) in Accounting from the University of Delhi. Akshay is a CFA charterholder, a member of the CFA Institute and a member of the Boston Security Analysts Society.

Investment Firm/Product Profile
Matt Brady, Research Associate Source: NEPC and eVestment
March 2014
Merganser Capital Management, LLC Short Term Bond
Firm Description Merganser Capital Management, Inc. is a boutique investment manager focused solely on investment grade fixed income. The firm was founded in 1984 by the Treasurer of Polaroid Corporation who managed the fixed income portfolios for the firm’s corporate and retirement trust funds. Merganser was spun-out of Polaroid and began managing money as an investment advisor in 1987. The firm remained 100% employee owned until 2008, when Mr. Edward Bedrosian sold the firm’s equity to Annaly Capital Management. In 2013, Providence Equity Partners along with Merganser Management acquired all assets and business of Merganser from Annaly.
NEPC Investment Thesis Merganser adds value to client portfolios by investing in under-researched, or under-covered segments of the bond market, particularly in ABS sectors. The firm’s small size is an advantage in purchasing smaller-issue securities and an advantage in pricing. The strategy will overweight spread sectors of the bond market, capturing the higher yield provided.
People Merganser is a firm that has been managing money for a long time, and recently went through a transition of ownership three years ago. That being said, the firm did not lose any key professionals since the transition and has been relatively stable. There are four key portfolio managers that run Merganser’s strategies: Peter Kaplan, Doug Kelly, Jennifer Wynn and Andrew Smock, all of whom joined the firm in 1986, 1986, 2000, and 2003, respectively. Andrew Smock, CIO of the firm, is the key person forming investment views for Short Term Bond. Portfolio managers are supported by a team of more than five research analysts.
Philosophy Merganser believes that fixed income markets are inherently inefficient due to the fact that bonds trade over-the-counter, and that this creates certain trading opportunities. Their relatively small size and focus on certain parts of the market including asset-backed securities and potentially overlooked segments of the corporate bond market and securitized bond market support’s the value-add thesis. The firm uses both top-down and bottom-up strategies to add value.

Investment Firm/Product Profile
Merganser Capital Management, LLC Short Term Bond
Investment Strategy The investment process has essentially two parts: first the team forms a strategic outlook that guides such important themes as duration/curve posture and sector allocations. Secondly, fundamental security research is performed to identify certain bottom-up security ideas and to populate portfolios.
Merganser’s investment team meets formally each week to discuss the world economy and develop macro, top-down themes to help guide the decision making process. During these meetings, the investment team surveys the landscape of all asset classes and works as a team to develop macro themes that will persist for the foreseeable future. All investment team members have a voice and debate is encouraged in order to reach a consensus. After developing the macro themes, the team discusses sectors and sub-sectors that will do well or poorly in these environments. These sub-sectors will be the focus of the investment energy once the team returns to the trading desk.
At the trading desk, each sector specialist develops ideas that fit within the themes determined at the investment strategy meeting. These themes are not strict parameters, but instead serve as a guide for team members. They also provide a common language with which the investment team can debate cross sector value. This part of the process represents the first stage of the bottom-up focus. The sector specialists will evaluate each name that is considered with the analysis to the security type. After a security passes all of an analyst’s tests, it will be brought up with the broader team for a discussion of relative value and potential portfolio inclusion.

Investment Firm/Product Profile
Merganser Capital Management, LLC Short Term Bond
Within corporate bonds, Merganser manages a preferred list of issuers and regularly scans the market for preferred pricing. Because of the short nature of the portfolio, the firm does not look for home run trades , meaning they are not searching for upgrades or discounted issuers, but rather, they invest in stable credits with attractive yields and are instead focused on trying to eke out gains through favorable pricing. Asset-backed securities have traditionally been a significant component of the portfolio and to excess returns. Collateral types will vary from bank credit cards, and autos to more esoteric areas such as equipment receivables, equipment leases, dealer floor plans, and retailer credit cards. Research of such issues includes in depth analysis of collateral, stress-tests of collateral based on macro-economic indicators, and research on security structure, payment waterfalls and technicals.
Portfolio A typical portfolio has approximately 75 to 125 securities. The potential opportunity set of permissible investments includes all investment grade fixed income issues. The essential portfolio construction process is informal and dynamic which occurs in the trading room each day. Making tactical yield curve bets versus the benchmark is not a significant part of the investment strategy. Portfolios typically have an effective duration of +/- 10% of the benchmark. The firm purchases primarily US dollar denominated, investment grade securities including Yankee issues. In a normal market, Merganser is a buy and hold investor, and intends to hold securities to maturity. However, in times of significant volatility, Merganser will make more rapid allocation decisions to protect capital and capture value for clients. At all times, portfolios will have a minimum of three sectors represented, and more likely five or six sectors. Average maturity and average yield to maturity are driven by sector weightings, credit curve decisions and general market conditions.
Performance Expectations Merganser is usually overweight spread sectors through most market environments, and will likely trail the index during periods of spread widening, and earn most of their excess returns when spreads compress.

Biographies of Key Professionals
Merganser Capital Management, LLC Short Term Bond
Andrew Smock, CFA, CIO Mr. Smock joined the firm in 2003 and serves as Chief Investment Officer. Mr. Smock is also the team leader for the mortgage backed securities (MBS) sector team and serves as the product team leader for longer duration strategies. He is a member of Merganser’s Management Committee. Prior to joining Merganser, Mr. Smock was a management consultant with the boutique consulting firm Sibson Consulting Group. His primary clients were Fortune 500 companies in both the financial services and telecommunication industries. Mr. Smock also worked on the Chicago Board of Trade for LIT First Options. Mr. Smock holds the Chartered Financial Analyst designation and is a member of the CFA Institute and the Boston Security Analysts Society.
Douglas Kelly, CFA, CPA, President, Mr. Kelly joined the firm in 1986 and is Merganser’s President. He also serves as the co-product team leader for shorter duration strategies and is a member of Merganser’s Management Committee. Before joining Merganser, Mr. Kelly's experience included positions with American Can and Exxon Corporation. At American Can, Mr. Kelly’s primary role was Director, Pension Investments where he had responsibility for determining investment objectives, setting asset mix guidelines, reviewing actuarial assumptions and monitoring and controlling the investment program to ensure achievement of objectives. This involved the oversight of over $1 billion in pension and profit sharing plan assets, including in-house management of a $250 million fixed income portfolio.Mr. Kelly is a Certified Public Accountant, holds the Chartered Financial Analyst designation and is a member of the CFA Institute, the Boston Security Analysts Society and the Boston Bond Analysts Society. He has previously served as a member of the Investment Issues Committee of the Association of Private Pension and Welfare Plans and was a member of Pension Group East.

Biographies of Key Professionals
Merganser Capital Management, LLC Short Term Bond
Jennifer Wynn, CFA, Portfolio Manager Ms. Wynn joined the firm in 2000 and is the team leader for the credit sector, as well as a portfolio manager for shorter duration strategies. She also serves as the co-team leader for the Short Term Bond product and is a member of Merganser’s Management Committee. Before joining Merganser, Ms. Wynn worked at Camp Dresser & McKee as a Water Resources Engineer. She began her career with American National Bank and Trust Company where she served as portfolio manager on Lehman Aggregate-indexed funds. In this role she was also responsible for trading government, corporate, mortgage backed, and asset backed securities. Ms. Wynn holds the Chartered Financial Analyst designation and is a member of the CFA Institute and the Boston Security Analysts Society.
Peter Kaplan, CFA, Portfolio Manager Mr. Kaplan joined Merganser in 1986 and is the team leader for the asset backed securities (ABS) sector. He is a portfolio manager for shorter duration strategies and also serves as the co-team leader for Cash Enhancement. Prior to joining Merganser, Mr. Kaplan worked for SEI Corporation and managed the design, development and implementation of investment accounting systems. Prior to SEI Corporation, Mr. Kaplan worked at Interactive Data Corporation, where he developed investment applications for institutional investment managers.Mr. Kaplan holds the Chartered Financial Analyst designation and is a member of the CFA Institute and the Boston Security Analysts Society.

Investment Firm/Product Profile
Matt Brady, Research Associate Source: NEPC and eVestment
April 2015
PIMCO Low Duration - Core
Firm Description Pacific Investment Management Company (PIMCO) is an investment manager focused on delivering fixed income products and solutions to clients. The firm was founded in 1971 by Mr. William Gross, and as of December 2012, had approximately 1, 671 employees, of which approximately 337 were investment professionals. In 2000, PIMCO was acquired by Allianz SE, a large global financial services company based in Germany. PIMCO operates as a separate and autonomous subsidiary of Allianz, and the acquisition allowed for PIMCO’s key professionals to purchase an equity stake in the firm. Allianz will repurchase these equity interests over time, but the equity program will run through at least 2013. PIMCO also has a profit sharing plan, where 30% of profits are distributed to eligible employees. PIMCO has investment management offices around the world, in such locations as Newport Beach, CA, New York, Singapore, Tokyo, London, Sydney, Munich, Toronto and Hong Kong.
NEPC Investment Thesis PIMCO gathers and analyzes information on economic and market trends, develops a long-term secular view and applies this to their portfolios. Input from internal talent as well as prominent figures in academia and the government factor into their investment process. The source of their expected alpha is their well-informed long-term secular outlook, the periodic refinements of short-term views, their ability to capture the benefits associated with the size and depth of their organization, and their global reach and influence within the fixed income markets.
People PIMCO’s Investment Committee is responsible for setting the top-down macro-economic views for all of the firm’s fixed income strategies. PIMCO is a large organization, with more than 200 portfolio managers and over 100 research analysts firm-wide. Specific sector teams related to short duration are covered by the firm’s centralized research platform.

Investment Firm/Product Profile
PIMCO Low Duration - Core
Philosophy PIMCO’s philosophy seeks to build diversified portfolios where no single risk should dominate returns. PIMCO’s investment process expects to generate above-benchmark returns by building diversified, risk-averse portfolios based upon their long-term secular outlook. This is achieved by analyzing fundamental global trends in such areas as political factors, inflation, volatility, growth, fiscal balances, and currency, amongst others. The three to five-year secular outlook is the core element of their decision-making process, and serves as a framework for portfolio implementation. In applying the secular outlook to the portfolio, such tools as duration position, yield curve posture and country allocation are expressed to best represent the firm’s view on the macro-economic environment. Bottom-up analysis of specific securities is also an important part of the firm’s philosophy. Bonds are evaluated on a rich/cheap basis and fundamental research determines strong portfolio candidates.
Investment Strategy The process begins with PIMCO’s annual Secular Forum. The task of the forum is to determine where to invest client’s money - domestically or internationally, long duration or short duration, high quality or high yield, etc. The top-down framework is determined at this forum, and a long-term focus is emphasized. PIMCO is looking at secular trends over a three to five-year time period - the idea being to ignore short term pricing factors and emotions. All investment professionals at PIMCO attend the forum - portfolio managers, generalists and analysts. In addition to the experts employed at PIMCO, prominent figures from academia, government and other outside organizations speak at the forum to offer their expertise on various economic/market conditions.
Ben Bernanke, who is a consultant employed by PIMCO, regularly attends PIMCO’s internal meetings and offers his input and opinions on the economy. By holding this forum, PIMCO is able to gain insight into global markets from outside sources which enriches the investment process.

Investment Firm/Product Profile
PIMCO Low Duration - Core
Emerging from the Secular Forum, the Investment Strategy Group, determines the portfolio framework. A three to five-year outlook is determined for interest rate trajectory, volatilities, yield curve, credit health and country outlooks. Duration targets, yield curve posture, sector biases, quality biases and country biases are determined by the Investment Strategy Group. After the parameters have been determined by the committee, the respective generalist portfolio managers and specialist teams construct portfolios using their specialized skill sets. Short-term and cyclical trends are discussed quarterly so that PIMCO can refine their forecasts and update them to identify trends and take advantage of temporary market inefficiencies. Average duration around the index is +/- 10%years.
Portfolio PIMCO will often execute portfolio positions either in cash securities, or in derivatives markets. Part of the success PIMCO’s investment strategies is over time is attributable to their expertise in derivatives. Treasury futures, interest rate swaps, forwards and credit default swaps are some of the types of derivatives that may be utilized in portfolios. In recent time periods, PIMCO has had positions in Eurodollar futures contracts, reflecting their views on the US Treasury curve, and general unattractiveness of holding US Treasury securities in order to express their views on interest rates.
Performance Expectations PIMCO has sophisticated risk control processes and systems in place to monitor portfolio performance. Generally, tracking error is held close to the index, with the intent to eliminate large, or potentially uncorrelated positions with the index. The goal is to earn incremental return over the index over time. PIMCO’s strategy should perform well in most market environments, although the strategy will likely lag during periods of strong credit markets as PIMCO tends to be underweight corporate credit in their fixed income strategies.

Biographies of Key Professionals
PIMCO Low Duration - Core
Scott Mather, Managing Director, Portfolio Manager Mr. Mather is CIO U.S. Core Strategies and a managing director in the Newport Beach office. Previously he was Deputy CIO and head of global portfolio management. Before that, he led portfolio management in Europe, managed euro and pan-European portfolios and worked closely with many Allianz-related companies. He also served as a managing director of Allianz Global Investors KAG. Prior to these roles, Mr. Mather co-headed PIMCO's mortgage- and asset-backed securities team. Prior to joining PIMCO in 1998, he was a fixed income trader specializing in mortgage-backed securities at Goldman Sachs in New York. He has 20 years of investment experience and holds a master's degree in engineering, as well as undergraduate degrees, from the University of Pennsylvania.

Investment Firm/Product Profile
Matt Brady, Research Associate Source: NEPC and eVestment
April 2015
Reams Asset Management, a Division of Scout Investments Low Duration Fixed Income
Firm Description Reams is a division of Scout Investments, which in turn is owned by UMB Financial Corp . Reams currently manages assets for a diverse group of institutional clients, focusing exclusively on the management of U.S. fixed income portfolios. All senior professionals participate as principals of the firm and Reams has no parent organization, subsidiaries, affiliates, or joint ventures. Reams has a broad product offering in fixed income including core, core plus, multi-sector fixed income, real return strategies, long duration and absolute return fixed income.
NEPC Investment Thesis We expect Reams to add value to client portfolios through their disciplined rotation into and out of spread sectors of the marketplace, the conviction level in which they implement active positions, and by avoiding unproven securities and structures. A key part of their investment process that guides sector allocation is the analysis of price volatility in fixed income securities, the macro-economic environment and long term valuations. The utilization of scenario analysis, stressing securities for different interest rate and credit environments, is also a key part of their investment process that has distinguished the approach from competitors.
People Reams is a small boutique fixed income manager with five portfolio managers and seven research analysts. The group of portfolio managers are experienced, and have all been working together since 2001 (the most recent portfolio manager addition). Low Duration Fixed Income is managed as a team, with all of the portfolio managers and sector specialists weighing in on macro-economic decisions and security selection recommendations.
Philosophy Reams believes that volatility is a key driver of performance in fixed income markets, and that it is often mispriced or misunderstood by market participants. As such, the strategy for Low Duration seeks to add value by focusing on longer-term investment horizons, and by reacting opportunistically to volatility and valuation mismatches in the marketplace. Strategy will utilize both top-down and bottom-up elements.

Investment Firm/Product Profile
Reams Asset Management, a Division of Scout Investments Low Duration Fixed Income
Investment Strategy Reams manages fixed income portfolios using three steps. The first step is the duration decision. With this step, the portfolio's overall duration and yield curve characteristics are established. Reams approaches the duration decision as it relates to valuation, utilizing below-benchmark or short-duration portfolios when the market is unattractive or overvalued and above-benchmark or long-duration portfolios when the market is attractive or undervalued. The main tool used to establish value is the "real" or inflation-adjusted Treasury bond rate. Reams calculates the real rate by subtracting a proprietary estimate of underlying inflation, derived from an analysis of monetary policy, from the available nominal Treasury rate. The resulting real rate is then compared to historical norms to determine value. When the current real rate is above 2.5%, it is considered to be attractive and portfolio duration is scaled upwards above the benchmark. When the current real rate is below 2.5%, it is considered to be unattractive and scaled below the benchmark. Portfolios generally have a duration range of plus or minus 25% of the benchmark at the extremes. Depending on Reams' assessment of relative values along the yield curve, portfolios may be barbelled, bulleted, or laddered.
Once top-down strategy is in place, the second step of the investment process is to consider sector exposures. Sector decisions generally involve exposures to the mortgage, credit, ABS, and Government sectors. Sector exposure decisions are made on both a top-down and bottom-up basis. A bottom-up issue selection process is the major determinant of sector exposure, as the availability of attractive securities in each sector determines their underweighting or overweighting in the portfolio subject to sector exposure constraints. However, for the more generic parts of the portfolio, such as agency notes and mortgage pass-throughs, top-down considerations will drive the sector allocation process on the basis of overall measurements of sector value such as yield spreads or price levels.

Investment Firm/Product Profile
Reams Asset Management, a Division of Scout Investments Low Duration Fixed Income
Finally, the third step in the investment process is individual security selection. Reams approaches security selection on a total return basis assuming that the market will exhibit a considerable degree of both interest rate and credit volatility. Therefore, the firm's focus is generally on securities that will benefit from dynamic interest rate and credit environments. Pockets of the market that exhibit good dynamic and structural characteristics, such as putable bonds or secured debt, may be used, allowing Reams to take advantage of its relatively moderate size. They generally like to avoid callable securities due to the negative convexity associated with such instruments.
Reams relies primarily on internal research in the bond selection process. A great deal of emphasis is placed on using scenario analysis as an analytical tool, allowing Reams to determine how each security will perform in a variety of potential interest rate and credit environments. Value is determined based on the distribution of potential returns. The firm's outlook for interest rates, fundamental credit analysis, and option-adjusted spread analysis are the primary tools used when constructing these scenarios. This process identifies which bonds should perform the best under the most likely scenarios. Importantly, this process will also point out those bonds that, while attractive on the surface, are most vulnerable to risks in the bond market, and inappropriate for the portfolio. Ultimately, investment opportunities are compared, and the bonds with the highest risk-adjusted return are selected.
Portfolio Portfolios are constructed on the basis of Reams’ three-step investment process, building in top-down duration and yield curve strategies while putting in place bottom-up sector and security strategies. The duration and curve framework is immediately laid into place for a new portfolio using government and mortgage securities with instant liquidity in order to establish the desired macro portfolio structure. Security strategies and other sector strategies are then put in place as market conditions allow. Duration, convexity, and diversification limits by issuer, credit, and sector are monitored consistently in real time. Contribution to duration by yield curve position, sector, credit, and MBS are monitored daily through proprietary reports. Contribution to tracking error volatility is monitored through a third-party system. With regard to diversification limits, under normal market conditions, no single issuer (excluding government and agency securities) will exceed 1% of the total market value of the account, or 1.5 times the index percentage weight of the issuer, whichever is greater.
Investment Firm/Product Profile
Reams Asset Management, a Division of Scout Investments Low Duration Fixed Income
Performance Expectations Ream’s strategy tends to overweight spread sectors through most market environments, thus they will tend to lag when spreads widen.

Biographies of Key Professionals
Reams Asset Management, a Division of Scout Investments Low Duration Fixed Income
Robert Crider, CFA, Managing Director Mr. Robert A. Crider, CFA, Managing Director, brings nearly thirty years of investment experience to the firm, and is one of the founding members. Prior to founding Reams, Mr. Crider was employed at the State Teachers Retirement System of Ohio. Mr. Crider graduated from Ohio State University with a BA and MA.
Mark Egan, CFA, Managing Director Mr. Egan, CFA, Managing Director, joined Reams in 1990. Prior to joining Reams, Mr. Egan was employed at National Investment Services. Mr. Egan holds a BS from Marquette University and an MBA from the University of Wisconsin.
Thomas Fink, CFA, Managing Director Mr. Fink joined Reams in 2000, with prior work experience at Brandes Fixed Income Partners, Hilltop Capital Management, and Zurich Investment Management. Mr. Fink holds a BS from Marquette University and an MBA from the University of Wisconsin.

Investment Firm/Product Profile
Matt Brady, Research Associate Source: NEPC and eVestment
April 2015
T. Rowe Price Group, Inc. US Short-Term Bond Strategy
Firm Description T. Rowe Price was established in 1937 by Thomas Rowe Price as an independent investment advisory firm, and was incorporated in the state of Maryland in 1947. The firm began as an advisor for individual investors. In 1950, T. Rowe Price established its first retail mutual fund, the Growth Stock Fund, and in 1951 they accepted their first institutional separate account client. T. Rowe Price’s fixed income group was founded in 1971 and includes high yield bonds along with investment grade and global bonds. In 1986, the firm became a publicly traded corporation, listed on the NASDAQ exchange. Approximately 15% of the firm is employee owned outright, or through vested but unexercised stock options. It is the long-term goal of T. Rowe Price to grow in three major lines of business: institutional separate account management, defined contribution retirement plan management, and retail investment management.
NEPC Investment Thesis We expect T. Rowe Price to outperform the index through security selection and expertise in the corporate bond segment of the market. T. Rowe Price’s corporate credit team has historically contributed positively to excess return. The strategy will overweight corporate bonds, and even overweight BBB rated issues through most cycles, capturing the higher yield available in such securities.
People Edward Wiese is the Lead Portfolio manager for the Short Term Bond strategy. Mr. Wiese has spent his entire investment career at T. Rowe Price, and has managed the short term strategy through the majority of those years. Investment strategy is determined by a five person team of senior level professionals, of which Mr. Wiese is a member. In addition to the strategy team, an advisory committee made of individuals with varied sector backgrounds also weighs in to formulate investment views and ideas. T. Rowe Price also has a large team of analysts dedicated to fundamental research, and a team of quantitative analysts working on performance attribution, risk analysis and quantitative investment techniques.

Investment Firm/Product Profile
T. Rowe Price Group, Inc. US Short-Term Bond Strategy
Philosophy T. Rowe Price believes that in short term bond portfolios, yield plays a greater role than price appreciation in generating excess returns. Additional yield can be added to portfolios through incremental sector rotation and individual security selection. The strategy will use both top-down and bottom-up inputs to structure short term bond portfolios
Investment Strategy Corporate bonds are the most important part of T. Rowe Price’s short term bond strategy, and are a central part of the investment process. Credit research includes two elements: credit analysis and credit relative value assessment. The firm’s dedicated team of corporate fixed income research analysts make security specific and sector specific recommendations to the strategy team. Over time, the strategy will overweight corporate bonds and underweight lower yielding government securities. There are three key steps to the corporate bond research process:
1) Financial analysis. The core of the investment-grade fixed income research is the analysis of financial and economic data relevant to each debt security being considered for purchase or sale. The analysts evaluate the data under a variety of potential scenarios. Credits are assessed on a comparative basis versus their peers, including the use of ratio analysis to determine relative strengths and weaknesses.
2) Technical and legal analysis. The research approach also includes extensive legal, technical, and structural analysis. Project financings, collateralized borrowings, and asset-backed transactions are subjected to extensive document review and analysis. Also, issues that feature credit or liquidity undergo a careful review of third-party arrangements. Variable rate instruments undergo an analysis of rate-setting mechanics and tender provisions.

Investment Firm/Product Profile
T. Rowe Price Group, Inc. US Short-Term Bond Strategy
3) Qualitative factors. The investment-grade fixed income analysts also carefully consider qualitative factors, which takes the review process beyond the financial statements and legal documents. Such issues as management’s abilities and reputations, a company’s historical approach to balance-sheet management, overall industry and economic dynamics, rating agency prejudices, and underwriters’ capabilities are taken into consideration.
The output of the credit research process is a single T. Rowe Price credit rating, which is assigned to each issue based on the fundamentals of the issuer and the characteristics of the issue. This rating provides the trading and portfolio management staff with a clear and concise indication of the research group’s evaluation of the credit quality of the issue, and its suitability for a particular portfolio. The in-house rating is the starting point for an assessment of relative value.
Portfolio The portfolio is constructed relative to a benchmark using absolute market value weights, but duration contribution weighs heavily in the management decision. Duration is limited to +/- 20% of the index. Relative sector weightings are determined on the basis of sector preferences. Teams devoted to particular bond market sectors, such as mortgages or high yield bonds, develop outlooks for their particular sectors based on their research. Citigroup Yieldbook is used to assist in portfolio construction. Up to 10% non-dollar exposure is allowed.
Performance Expectations Since the strategy usually overweights spread sectors, especially corporate credit, the strategy will likely lag the benchmark when spreads widen. Within the corporate sector, the strategy may also allocate aggressively to BBB rated issues, adding incremental yield, but also more sensitivity to the credit cycle.

Biographies of Key Professionals
T. Rowe Price Group, Inc. US Short-Term Bond Strategy
Edward Wiese, CFA, Portfolio Manager Edward Wiese is head of the Fixed Income Division for T. Rowe Price, overseeing fixed income investment management. He is chairman of the Fixed Income Steering Committee and is a member of the firm’s Management Committee. Mr. Wiese also is a portfolio manager in the Fixed Income Division and serves as president and chairman of the Investment Advisory Committees of the Short-Term Bond Fund and the Limited-Term Bond Portfolio. He is on the Board of the T. Rowe Price Trust Company and is a member of the firm’s Valuation and Counterparty Risk Committees. Mr. Wiese joined T. Rowe Price in 1984. He earned a B.A. in geology from Yale University, an M.S. in biotechnology from The John Hopkins University, and an M.B.A. in finance from the Tuck School of Business at Dartmouth. Ted also has earned the Chartered Financial Analyst designation.
Brian Brenna, CFA, Portfolio Manager Mr. Brennan is a vice president of T. Rowe Price Group, Inc., and T. Rowe Price Associates, Inc. He is a portfolio manager in the Fixed Income Division involved with the management of investment-grade, global aggregate, and stable value portfolios. Mr. Brennan is chairman of the Investment Advisory Committee for the U.S. Treasury Long-Term Fund, as well as the Institutional Core Plus Fund. He is also a member of the Investment Advisory Committees for the New Income, U.S. Treasury Intermediate, Inflation Protected, GNMA, and International Bond Funds. Prior to joining the firm in 2000, he was a fixed-income manager at Howard Hughes Medical Institute. Mr. Brennan earned a B.S. in economics and computer science and an M.A. in economics from Trinity College in Hartford, Connecticut. He has also earned his Chartered Financial Analyst accreditation.

Biographies of Key Professionals
T. Rowe Price Group, Inc. US Short-Term Bond Strategy
Daniel Shackelford, CFA, Portfolio Manager Mr. Shackelford is a vice president of T. Rowe Price Group, Inc., and T. Rowe Price Associates, Inc., and is a portfolio manager in the Fixed Income Division. He manages mutual fund and institutional fixed-income portfolios, including investment-grade, global aggregate, and stable value portfolios. Mr. Shackelford chairs the Fixed Income Strategy Committee, as well as the Fixed Income Derivatives Committee. Mr. Shackelford is chairman of the Investment Advisory Committee and president of both the New Income and the Inflation Protected Bond Funds. Prior to joining the firm in 1999, he was the principal and head of fixed income for Investment Counselors of Maryland. He earned a B.S. in business administration from the University of North Carolina, Chapel Hill, and an M.B.A. in finance from Duke University, The Fuqua School of Business, where he was a Fuqua Scholar. Mr. Shackelford has also earned his Chartered Financial Analyst accreditation.

Appendix

As of December 31, 2015
Total Firm Assets
YTD 2014 2013 2012
Firm $MM # of accounts $MM # of
accounts $MM # of accounts $MM # of
accounts
Short Duration Fixed Income
Chicago Equity Partners 9,777 190 10,243 196 9,986 209 9,558 199
Income Research & Management 54,890 910 48,412 968 37,224 967 35,479 955
Longfellow Investment Management Co. 7,747 115 6,458 104 6,581 88 5,290 75
Merganser Capital Management, LLC 9,672 105 8,485 108 7,098 93 7,303 92
PIMCO 1,435,042 2,073 1,680,389 2,208 1,919,589 2,368 2,003,818 2,317
Reams Asset Management, a Division of Scout
Investments 27,185 204 31,187 201 31,171 175 23,571 169
T. Rowe Price Group, Inc. 763,100 1,850 746,800 1,806 692,400 1,709 576,800 1,652

As of December 31, 2015
Total Product Assets
YTD 2014 2013 2012
Firm/Product $MM # of accounts $MM # of
accounts $MM # of accounts $MM # of
accounts
Short Duration Fixed Income
Chicago Equity - Short Fixed Income 553 13 749 17 832 20 321 9
Income Research - IR+M 1-3 Year 2,122 34 2,164 36 1,952 38 1,436 50
Longfellow - Short Duration 1,622 25 1,241 21 1,010 19 1,386 22
Merganser - Short Term Bond 5,652 61 4,793 60 4,164 52 3,661 45
PIMCO - Low Duration - Core 14,617 26 19,435 27 26,184 33 29,874 31
Reams - Low Duration 3,992 46 3,817 42 3,280 33 2,973 24
T. Rowe - Short Term Bond 10,323 10 12,157 10 11,707 9 11,215 8

As of December 31, 2015
Product Assets By Vehicle Type
Firm/Product Separate Account Commingled Fund Inst. Mutual Fund
Retail Mutual Fund
$MM # of accounts $MM # of
accounts $MM $MM
Short Duration Fixed Income
Chicago Equity - Short Fixed Income 553 13 0 0 0 0
Income Research - IR+M 1-3 Year 1,651 33 472 1 0 0
Longfellow - Short Duration 1,622 25 0 0 0 0
Merganser - Short Term Bond 5,460 60 192 1 0 0
PIMCO - Low Duration - Core 14,140 24 0 0 389 89
Reams - Low Duration 3,939 45 0 0 53 0
T. Rowe - Short Term Bond 4,212 7 *0 *0 431 5,680
*Unfunded: See Disclosures

As of December 31, 2015
Account Minimums and Fee Schedules
Firm/Product Separate
Account Min. ($MM)
Commingled Fund Min.
($MM)
Mutual Fund Min.
($MM)
Separate Account Fee Schedule
Commingled Fund Fee Schedule
Mutual Fund Ticker and Fee
Short Duration Fixed Income
Chicago Equity - Short Fixed Income 10 NA NA
First $25 million - 0.20% Next $75 million - 0.15%
Balance - 0.10% Not Available Not Available
Income Research - IR+M 1-3 Year 50 5 NA
First $50 million - 0.25% Next $50 million - 0.15%
Balance - 0.10% All Assets at 0.25% Not Available
Longfellow - Short Duration 10 NA NA
First $50 million - 0.25% Next $50 million - 0.15%
Balance - 0.13% Not Available Not Available
Merganser - Short Term Bond 20 5 NA All Assets at 0.20% All Assets at 0.20% Not Available
PIMCO - Low Duration - Core 75 NA 1 First $50 million - 0.38%
Balance - 0.25% Not Available PLDTX - 0.50%
Reams - Low Duration 25 NA 0 First $50 million - 0.20% Balance - 0.15% Not Available SCLDX - 0.40%
T. Rowe - Short Term Bond 50 *0 0
1
First $50 million - 0.23% Next $50 million - 0.18% Next $150 million - 0.15%
All Assets at 0.41% PRWBX - 0.52% TBSIX - 0.41%
*Unfunded: See Disclosures

Litigation
Firm Manager's explanation of Prior or Pending Litigation
Short Duration Fixed Income
Chicago Equity Partners There is no prior or pending litigation.
Income Research & Management
In 2011, IR+M and its Managing Principals were named as defendants in a civil action in Suffolk Superior Court (located in Boston, Massachusetts), brought by a former IR+M employee alleging claims relating to certain terms of his employment while at IR+M. We successfully defended all claims, receiving a favorable jury verdict on June 5, 2014. On November 24, 2014, the former IR+M employee filed a notice of appeal of the final judgment of the Superior Court action; IR+M intends to defend the appeal to the fullest extent possible. In a related matter initiated by the same former employee, IR+M and its Managing Principals were named as respondents in an administrative proceeding before the Massachusetts Commission Against Discrimination ( MCAD ). On December 3, 2014, MCAD dismissed the administrative proceeding in favor of IR+M and its Managing Principals due to lack of probable cause. On December 11, 2014, the former IR+M employee filed a notice of appeal with MCAD. On April 16, 2015, MCAD affirmed its previous decision in dismissing the claims due to lack of probable cause, effectively closing the MCAD proceeding; however, all employment complaints where applicable are dual filed with the U.S. Equal Employment Opportunity Commission ( EEOC ). On September 10, 2015, the EEOC issued a Dismissal and Notice of Rights adopting the findings of MCAD, and, as is standard practice, allows the former employee to bring suit in Federal Court within 90 days of the dismissal.
Longfellow Investment Management Co. There is no prior or pending litigation.
Merganser Capital Management, LLC There is no prior or pending litigation.

Litigation
Firm Manager's explanation of Prior or Pending Litigation
Short Duration Fixed Income
PIMCO
PIMCO is not the subject of any lawsuit which could reasonably be expected to have a material adverse effect on PIMCO’s ability to provide investment management services. Although PIMCO does not expect the below matters will have a material adverse effect on its ability to provide subadvisory services, PIMCO notes the following: On December 31, 2014, a lawsuit was filed in the United States District Court for the Western District of Washington by Robert Kenny, an investor in the PIMCO Total Return Fund, against PIMCO and PIMCO Investments LLC (collectively, the ''36(b) Parties''). The complaint purports to be brought derivatively on behalf of the PIMCO Total Return Fund, a registered management investment company advised and administered by PIMCO and distributed by PIMCO Investments, and alleges that the 36(b) Parties violated Section 36(b) of the Investment Company Act of 1940 by receiving excessive compensation from the PIMCO Total Return Fund. The 36(b) Parties believe the claims are without merit and intend to vigorously defend the action. On January 28, 2015, a putative class action lawsuit was filed in the United States District Court for the Central District of California by William Hampton, an investor in the PIMCO Total Return Fund, against PIMCO, PIMCO Investments LLC and the PIMCO Total Return Fund, alleging that the named defendants violated Section 10(b) of the Securities Exchange Act of 1934 and Rule 10b-5 thereunder due to alleged misrepresentations in connection with the management of the PIMCO Total Return Fund. On July 6, 2015, an amended complaint was filed by the plaintiff. The amended complaint, which supersedes the original filing, advances a new theory, that the PIMCO Total Return Fund improperly invested in emerging markets in excess of the guidelines described in the fund’s Prospectus, and adds as additional parties the PIMCO Funds Trust and those persons who served as Trustees to the fund during the relevant period. PIMCO Investments and the PIMCO Total Return Fund were not named as defendants in the amended complaint. On November 2, 2015, the lawsuit was dismissed in its entirety with prejudice. Plaintiff filed an appeal of this judgment on November 30, 2015. On October 7, 2015, a putative class action lawsuit was filed in United States District Court for the Central District of California by two participants in the Allianz Asset Management 401(k) Plan (the Plan ), in which employees of PIMCO and other Allianz entities participate, against PIMCO, AAM, and various other Allianz entities and an executive at AAM (together, the PIMCO and Allianz Parties ). The lawsuit alleges that the Allianz defendants breached their fiduciary duty to the Plan in the selection of investment options in the Plan. The lawsuit further alleges that the Plan’s assets improperly inured to the benefit of PIMCO and other Allianz entities whose employees participated in the Plan due to the retention by these entities of the investment management fees charged to Plan participants. The PIMCO and Allianz parties believe that this lawsuit is without merit and intend to vigorously defend against it. On October 8, 2015, a lawsuit was filed in California state court by William H. Gross, a former employee of PIMCO, against PIMCO and Allianz Asset Management of America L.P., PIMCO’s direct parent company ( AAM ). Mr. Gross’s complaint alleges that PIMCO wrongfully terminated him, breached a contractual duty, and breached an implied covenant of good faith and fair dealing in connection with compensation allegedly owed to him. PIMCO and AAM filed a motion to dismiss the complaint on November 9, 2015. PIMCO and AAM believe that this lawsuit is without merit and intend to vigorously defend against it.

Litigation
Firm Manager's explanation of Prior or Pending Litigation
Short Duration Fixed Income
Reams Asset Management, a Division of Scout Investments
There is no prior or pending litigation.
T. Rowe Price Group, Inc.
From time to time in the normal course of business, T. Rowe Price Associates, Inc., its subsidiaries, affiliates, officers, and employees (collectively the ''Company'') are named as parties to minor litigation matters involving the accounts of Price mutual fund shareholders, retirement plan participants, or of retail customers in the Company's brokerage unit. Often, the Company is named as a stakeholder and, therefore, these minor litigation matters are not disclosed herein. Further, the Company has not been involved in any notable litigation matter relating to any business practice or relating to services rendered to the firm's clients during the past five years, with the following exceptions: Pending Case: Tribune Company Bankruptcy Proceeding We have received notice that several of the T. Rowe Price Funds, sub advised clients, and institutional clients may be included in a class of defendants in connection with a lawsuit that the Unsecured Creditors Committee (the Committee ) of the Tribune Company filed in Delaware bankruptcy court. We have not been formally served with that lawsuit. However, various T. Rowe Price entities and certain of the T. Rowe Price Funds, institutional clients, and sub advised clients have been sued in a number of federal and state courts in various states in connection with receipt of proceeds from a leveraged buyout ( LBO ) through which Tribune converted to a privately owned company in 2007. These lawsuits allege constructive fraudulent transfer claims in an attempt to recover payments made to shareholders at the time of the LBO. There are similar cases naming hundreds of defendants in many states, and these cases appear to be coordinated, in that plaintiffs, who are serving in a representative capacity, are Deutsche Bank Trust Co. Americas, Law Debenture Trust Co., and Wilmington Trust Company, each in its capacity as successor indenture trustee for certain debt instruments. The lawsuits do not allege that any of the T. Rowe Price defendants engaged in wrongful conduct. Closed Case: T.K. Parthasarathy, et al. (incl. Woodbury) v. T. Rowe Price International Funds, Inc., et al. On September 16, 2003, a purported class action (Woodbury v. T. Rowe Price International Funds, Inc.) was filed in the Circuit Court, Third Judicial Circuit, Madison County, Illinois, against T. Rowe Price International, Inc. and the T. Rowe Price International Funds, Inc. Two unrelated fund groups were also named as defendants. The basic allegations in the complaint were that the T. Rowe Price defendants did not make appropriate value adjustments to the foreign securities of the T. Rowe Price International Stock Fund prior to calculating the Fund’s daily share prices, thereby allegedly enabling market timing traders to trade the Fund at the expense of long-term shareholders. The case against the T. Rowe Price defendants was resolved, and it was dismissed with prejudice on February 15, 2008. Updated 7/28/2011

Contact Information
Manager Location U.S. Client Contact Phone Email
Short Duration Fixed Income
Chicago Equity Partners Chicago, Illinois Marty Dorow (312) 629-4504 [email protected]
Income Research & Management Boston, Massachusetts Matthew Drasser (617) 391-6706 [email protected]
Longfellow Investment Management Co. Boston, Massachusetts Tom Burleigh (617) 695-3504 [email protected]
Merganser Capital Management, LLC Boston, Massachusetts John Clavin (617) 528-4863 [email protected]
PIMCO Newport Beach, California
Marta Bezoari, CAIA, CFA (212) 739-4685 [email protected]
Reams Asset Management, a Division of Scout Investments Columbus, Indiana Thomas Fink, CFA (812) 372-6606 [email protected]
T. Rowe Price Group, Inc. Baltimore, Maryland William Wendler (410) 345-2239 [email protected]

Beta: A measure of volatility, or systematic risk, of a security or a portfolio in comparison to the market as a whole. Beta can be thought of as the tendency of a security’s returns to respond to swings in the market. A beta of 1 indicates that the security’s price will move with the market. A beta of less than 1 indicates that the security’s price will be less volatile than the market. Correlation: A statistical measure of how two securities move in relation to each other. Correlation is computed into a correlation coefficient which ranges between -1 to +1. A perfect positive correlation (+1) implies that as one security moves either up or down, the other security will move in the same direction. Alternatively, a perfect negative correlation (-1) means that if one security moves in either direction the security that is perfectly negatively correlated will move by an equal amount in the opposite direction. Information Ratio: A measure of portfolio management’s performance against risk and return relative to a benchmark or alternative measure. Kurtosis: A statistical measure used to describe the distribution of observed data around the mean. Kurtosis describes trends in charts. A high kurtosis portrays a chart with fat tails and a low, even distribution, whereas a low kurtosis portrays a chart with skinny tails and a distribution concentrated toward the mean. Skewness: A statistical term used to describe a situation’s asymmetry in relation to a normal distribution. A positive skew describes a distribution favoring the right tail, whereas a negative skew describes a distribution favoring the left tail. Tracking Error: A divergence between the price behavior of a position or a portfolio and the price behavior of a benchmark. Tracking errors are reported as a “standard deviation percentage” difference. It tells you the difference between the return you received and that of the benchmark you were trying to copy.
Glossary of Terms

Disclaimer
. This report contains summary information regarding the investment management approaches described herein but is not a complete description of the investment objectives, policies or portfolio management and research that supports these approaches. This analysis does not constitute a recommendation to implement any of the aforementioned approaches.
. Past performance is no guarantee of future results.
. Information on market indices was provided by sources external to NEPC, and other data used to prepare this report was obtained directly from the investment manager(s). While NEPC has exercised reasonable professional care in preparing this report, we cannot guarantee the accuracy of all source information contained within.
. This report may contain confidential or proprietary information and may not be copied or redistributed to any party not legally entitled to receive it.
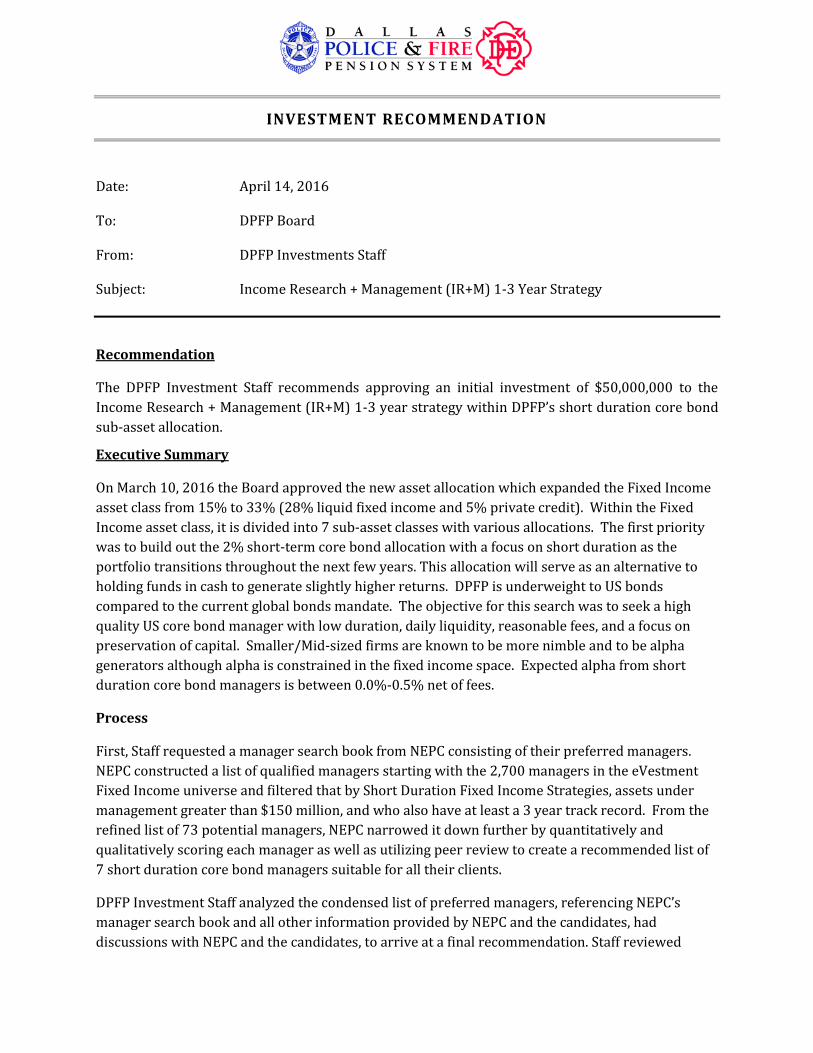
INVESTMENT RECOMMENDATION
Date: April 14, 2016 To: DPFP Board From: DPFP Investments Staff Subject: Income Research + Management (IR+M) 1-3 Year Strategy
Recommendation
The DPFP Investment Staff recommends approving an initial investment of $50,000,000 to the
Income Research + Management (IR+M) 1-3 year strategy within DPFP’s short duration core bond
sub-asset allocation.
Executive Summary
On March 10, 2016 the Board approved the new asset allocation which expanded the Fixed Income
asset class from 15% to 33% (28% liquid fixed income and 5% private credit). Within the Fixed
Income asset class, it is divided into 7 sub-asset classes with various allocations. The first priority
was to build out the 2% short-term core bond allocation with a focus on short duration as the
portfolio transitions throughout the next few years. This allocation will serve as an alternative to
holding funds in cash to generate slightly higher returns. DPFP is underweight to US bonds
compared to the current global bonds mandate. The objective for this search was to seek a high
quality US core bond manager with low duration, daily liquidity, reasonable fees, and a focus on
preservation of capital. Smaller/Mid-sized firms are known to be more nimble and to be alpha
generators although alpha is constrained in the fixed income space. Expected alpha from short
duration core bond managers is between 0.0%-0.5% net of fees.
Process
First, Staff requested a manager search book from NEPC consisting of their preferred managers.
NEPC constructed a list of qualified managers starting with the 2,700 managers in the eVestment
Fixed Income universe and filtered that by Short Duration Fixed Income Strategies, assets under
management greater than $150 million, and who also have at least a 3 year track record. From the
refined list of 73 potential managers, NEPC narrowed it down further by quantitatively and
qualitatively scoring each manager as well as utilizing peer review to create a recommended list of
7 short duration core bond managers suitable for all their clients.
DPFP Investment Staff analyzed the condensed list of preferred managers, referencing NEPC’s
manager search book and all other information provided by NEPC and the candidates, had
discussions with NEPC and the candidates, to arrive at a final recommendation. Staff reviewed
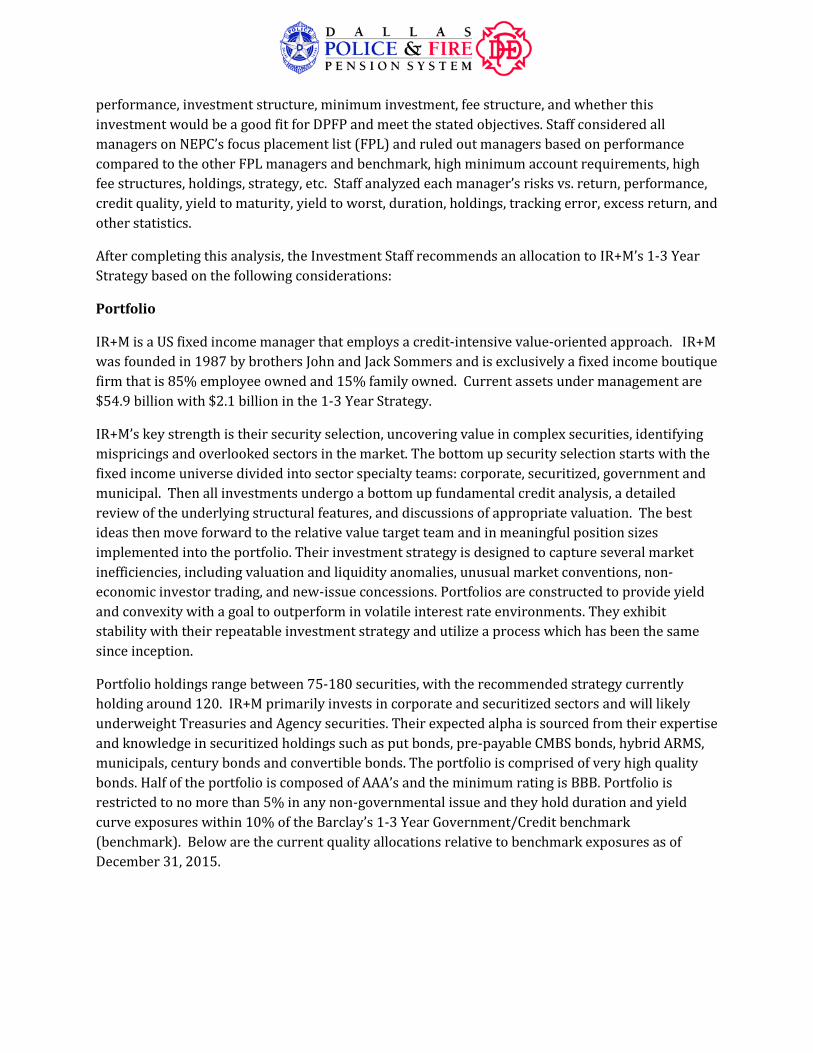
performance, investment structure, minimum investment, fee structure, and whether this
investment would be a good fit for DPFP and meet the stated objectives. Staff considered all
managers on NEPC’s focus placement list (FPL) and ruled out managers based on performance
compared to the other FPL managers and benchmark, high minimum account requirements, high
fee structures, holdings, strategy, etc. Staff analyzed each manager’s risks vs. return, performance,
credit quality, yield to maturity, yield to worst, duration, holdings, tracking error, excess return, and
other statistics.
After completing this analysis, the Investment Staff recommends an allocation to IR+M’s 1-3 Year
Strategy based on the following considerations:
Portfolio
IR+M is a US fixed income manager that employs a credit-intensive value-oriented approach. IR+M
was founded in 1987 by brothers John and Jack Sommers and is exclusively a fixed income boutique
firm that is 85% employee owned and 15% family owned. Current assets under management are
$54.9 billion with $2.1 billion in the 1-3 Year Strategy.
IR+M’s key strength is their security selection, uncovering value in complex securities, identifying
mispricings and overlooked sectors in the market. The bottom up security selection starts with the
fixed income universe divided into sector specialty teams: corporate, securitized, government and
municipal. Then all investments undergo a bottom up fundamental credit analysis, a detailed
review of the underlying structural features, and discussions of appropriate valuation. The best
ideas then move forward to the relative value target team and in meaningful position sizes
implemented into the portfolio. Their investment strategy is designed to capture several market
inefficiencies, including valuation and liquidity anomalies, unusual market conventions, non-
economic investor trading, and new-issue concessions. Portfolios are constructed to provide yield
and convexity with a goal to outperform in volatile interest rate environments. They exhibit
stability with their repeatable investment strategy and utilize a process which has been the same
since inception.
Portfolio holdings range between 75-180 securities, with the recommended strategy currently
holding around 120. IR+M primarily invests in corporate and securitized sectors and will likely
underweight Treasuries and Agency securities. Their expected alpha is sourced from their expertise
and knowledge in securitized holdings such as put bonds, pre-payable CMBS bonds, hybrid ARMS,
municipals, century bonds and convertible bonds. The portfolio is comprised of very high quality
bonds. Half of the portfolio is composed of AAA’s and the minimum rating is BBB. Portfolio is
restricted to no more than 5% in any non-governmental issue and they hold duration and yield
curve exposures within 10% of the Barclay’s 1-3 Year Government/Credit benchmark
(benchmark). Below are the current quality allocations relative to benchmark exposures as of
December 31, 2015.

IR+M has the potential to lag during credit bear markets compared to the benchmark because the
strategy has an emphasis on corporate and securitized sectors and is underweight US
Government/Agencies. The benchmark’s allocation to US Government/Agencies is 75.6% while
IR+M’s is 36.8% as of December 31, 2015. See below for the sector allocation table for IR+M vs. the
benchmark. Due largely to this underweight, IR+M also has a smaller allocation (51.3%) to AAA
rated securities compared to the benchmark (71.5%). This factor will also lead to IR+M’s spreads
widening more in a risk off environment and may cause it to lag compared to the index. Conversely
the strategy is likely to outperform the index during flat markets due to its higher coupon and
during periods of spread tightening.
Within short duration, the strategy is designed to have maturities of less than 3 years resulting in a
natural turnover of 33% every year as the securities mature. IR+M’s 2015 annual turnover was
68.5% driven by buying and selling treasuries for duration management. Their turnover is in line
with their historical annual turnover rates.
Personnel
IR+M does have the ability as a firm and team to carry out their stated investment process.
Consistent management team since inception. Out of the three managing principals, two are the
founders of IR+M. The 14 portfolio managers have an average tenure of 10 years and are broken
out into sector specialty teams. Supporting the portfolio managers are 23 research analysts. The
company also offers equity ownership in the firm to essential team members for employee
retention. As an added benefit, IR+M produces regular research communication and resources for
their clients with their perspective on key developments in the US fixed income market. They also
produce materials which explain their investment philosophy, processes, and strategies.
Investment AAA/Aaa AA/Aa A BBB/Baa BB/Ba B CCC/Caa & Below Other
IR+M 1-3 Year Strategy
51.3% 4.5% 22.4% 21.9% 0.0% 0.0% 0.0% 0.0%
Barclays US 1-3 Yr Govt/Credit
71.5% 6.9% 11.4% 10.2% 0.0% 0.0% 0.0% 0.0%
Investment US Govts/ Agencies
US Inv. Grade Corps
US High Yield Municipals Convertibles
US Agency Securitized
US Non-Agency
Securitized Other
IR+M 1-3 Year Strategy
36.8% 44.8% 0.0% 4.8% 0.0% 0.0% 13.5% 0.0%
Barclays US 1-3 Yr Govt/Credit
75.6% 24.4% 0.0% 0.0% 0.0% 0.0% 0.0% 0.0%

For complete transparency, NEPC has disclosed that 2 NEPC employees have a relationship with
employees at IR+M. Michael Manning’s wife is the Director of Client Service and Timothy
O’Connell’s brother is also in client relations.
Performance
IR+M has delivered solid, consistent performance over many market cycles for portfolios in
domestic investment grade fixed income investments. IR+M expects their 1-3 Year Strategy to
generate approximately 50-75 basis points above the benchmark’s return in a typical market cycle.
Since 2000, the 1-3 Year strategy’s percentage of positive months where it generated excess return
over the benchmark was 71% which demonstrates their ability to deliver stable and consistent
returns. IR+M has a low tracking error to the benchmark, yet consistently generates alpha. Their
lowest month for performance was down 1.8%. Refer to manager search book for tracking error
and excess performance comparison.
Pricing
This investment with IR+M would be structured as either a commingled fund or a separately
managed account. With a $50 million minimum investment, they can offer a discounted flat fee rate
of 18 basis points per annum, reduced from their standard 25 basis points even if the balance is
more or less than the $50 million. Their fee offering is the one of the lowest out of the 7 FPL
managers, which range from 18-52 basis points. IR+M provides daily liquidity with no lock up
periods.
Fit for DPFP
DPFP Investment Staff believes the IR+M 1-3 year strategy will be a good fit for DPFP because it’s a
high quality, short duration core bond investment strategy with low risk and will generate better
returns than cash. DPFP Investment Staff plans to utilize the IR+M investment portfolio as an
alternative to holding cash in a money market fund for reserves that will be used for rebalancing
purposes or to create a liquidity resource for funding a new investment. This utilization will
generate better returns than cash while preserving capital. Having daily liquidity to get in or out of
the IR+M 1-3 year strategy is essential. Staff performed an on-site due diligence in January 2016
and can attest that IR+M’s expertise and knowledge about all assets across the yield curve, their
security selection and ability to understand complex securities are their competitive advantage. If
approved, IR+M will be placed into the short–term core bond allocation providing diversification,
liquidity and low risk, while completing the build out of the short duration core bond allocation.

DISCUSSION SHEET
Regular Board Meeting – Thursday, April 14, 2016
ITEM #C6
Topic: Industry Ventures
Attendees: Ken Wallace, Managing Director Justin Burden, Managing Director
Discussion: NEPC recommended a $10 million allocation to venture/secondaries as part of the Private Markets Review and 2016 Strategic Investment Plan presented at the March 10, 2016 Board meeting. NEPC and Staff reviewed a pipeline of several private equity funds involved with venture capital and secondaries and selected Industry Ventures to present their Secondary Fund VIII and Partnership Holdings IV offerings. Industry Ventures was founded in 2000 to make venture capital investments in early stage information technology companies. Founder Hans Swildens recognized an opportunity for a specialized secondary strategy focused on venture-backed companies and began to pursue this strategy. The firm now manages over $2 billion from offices in San Francisco and Washington D.C. with a team of 18 investment professionals.
Staff Recommendation: Approve a commitment of $5 million each to Industry Ventures Secondary Fund VIII and
Industry Ventures Partnership Holdings IV within the Private Equity asset class, and authorize the Executive Director to negotiate and execute documentation, and perform all necessary acts and exercise all appropriate discretion to facilitate these investments.

1
INVESTMENT RECOMMENDATION
Date: April14,2016 To: DPFPBoardFrom: InvestmentStaff Subject: IndustryVenturesPartnershipHoldingsIVandSecondaryFundVIIIRecommendation
Theinvestmentstaffrecommendsapprovingacommitmentof$5millioneachtoIndustryVenturesPartnershipHoldingsIVandIndustryVenturesSecondaryFundVIIIwithinDPFP’sprivateequityallocation.
ExecutiveSummary
IndustryVenturesSecondaryFundVIIIisaclosedendfundthatwillmakeinvestmentsinsecondarydirectandsecondary fund investments in latestageventurebackedcompanies.Secondarydirectinvestmentsaredirectpurchasesofcompanysharesthatprovideliquidityforemployees,founders,angels,andotherinvestors.ThefundwillfocusonobtainingahighIRR.Thefundistargetinganetmultipleof1.8x‐2.2xinvestedcapitalandanet20‐25%IRR.ThefundwillhaveafinalcloseonJune30,2016.
Industry Ventures Partnership Holdings IV is a closed end fund that will make fund and directinvestments in early andmid‐stage venture backed companies. The focus is on obtaining a highmultiplebybuyingsecondary intereststhatare lessthan50%funded(early inthe fund life)andmakingprimarycommitmentstosmall,highperformingfunds.Directinvestmentswillbemadeinoperatingcompaniesthatareoutperforming.Thefundistargetinganetmultipleof2.5xinvestedcapitalandanet20‐25%IRR.ThefundhasahardcloseonJune30,2016.
Process
StaffsourcedtheseinvestmentswiththeassistanceofNEPC. Staffalsoindependentlymeetswithdozensofpotentialprivate equitymanagersduring the courseof theyear to consider strategies,evaluate performance, and generate ideas. Considering analysis of the current Private Equityportfoliocompositionandthepacingplan,StaffandNEPCtogetherreviewedseveralprivateequityofferingsfromtheconsultant’sFocusedPlacementList(FPL)andDiligencePipelineReporttoreviewwhat fundswere in themarket,whatopportunitieswereavailable,andwhen fundclosingswereanticipatedinordertodeterminethebestselection.Startingwithover20fundsacrossprivateequitystrategieswithtargetIRRsrangingfrom15‐25%,manywereeliminatedintheBuyouts,Credit,andvarious other strategies to avoid duplication of existing strategies in the DPFP portfolio. NEPC

2
recommendedexposuretoventurecapitalandsecondariesinthePrivateEquitypacingplan,andthelistincludedover8fundsintheVentureandGrowthEquityspace.SomefundsintheGrowthEquityspacewereconsideredaswell.ThislistwasfurthernarrowedtofundsthathavebeenthroughtheNEPCAlternativeAssetsCommitteeprocessandareontheFocusedPlacementList(FPL).TheseFPLfunds were then evaluated based on strategy focus and suitability for the DPFP private equityportfolio.Forexample,afundwaseliminatedbasedonconcentrationriskduetoanarrowfocusonNorthAmericanhealthcareandonlylatestageventureinvestments.Theprospectivefundswerealsoevaluatedbasedonperformanceofprior funds, includingbutnot limited toquartile rankingsonmetricssuchasIRR,DistributionstoPaidInCapital(DPI),andTotalValuetoPaidInCapital(TVPI).Both Industry Ventures funds are on the NEPC Focused Placement List and rank in the upperquartiles of these metrics (see Performance section for rankings). Staff has had severalcommunicationsbyphoneandemailwithIndustryVenturestoaddressquestionsorconcerns,andhas reviewed relevant fund materials including the Private Placement Memorandum, LimitedPartnershipAgreement,firmpresentations,andtheNEPCanalysisofthefunds.Staffalsocontacteda reference at another pension plan currently invested with Industry Ventures to discuss theirexperienceandanyconcerns.Basedonthisanalysis,StaffbelievestheIndustryVenturesplatformismost appropriatedue tomanagement teamstrengthand track record, diversifiedapproach toventurecapital,andportfoliofitoffulfillingmissingexposuretoventurecapitalandsecondaries.
Personnel
IndustryVentures,L.L.C.isanSECregisteredinvestmentadviserandspecialistinvestmentfirmwithover$2billionundermanagement,focusingexclusivelyontheventurecapitalassetclass.TheFirmwasfoundedin2000byHansSwildensandisheadquarteredinSanFrancisco,CAwithanadditionaloffice in the Washington, DC area. The experienced team of 17 professionals has built a broadportfolio of investments andmaintains strong relationshipswith venture capital firms, companymanagement teams and technology entrepreneurs. The firmmanages over 175 direct companyinvestments and 215 venture capital limited partnership investments. In 2014 and 2015 Preqinnamed IndustryVentures as a topUS “Consistent PerformingManager for Secondary Funds andFundsofFunds.”The executives managing the funds consist of Founder and CEO Hans Swildens, and ManagingDirectors JustinBurden andVictorHwang (SecondaryTeam),RolandReynolds andKenWallace(PartnershipHoldings Team). TheManagingDirectors have participated inmore than $1 billionsecondaryventurecapitaltransactionsacrossmorethan200deals.Theyhaveanaverageofmorethan20yearsof experience investing inand leadingventurebackedcompanies,andhaveraisedalmost$2billionincommittedcapitalacross13priorfunds.HansSwildenswasaco‐founderandPresidentofMicrolineSoftwareandadvisortothefoundersofSpeederaNetworks.JustinBurdenpreviouslyworkedatGEEquity,the$4billionventurecapitalarmofGeneralElectric.VictorHwangwasa founderandManagingPartnerofAgileCapitalPartners.KenWallacepreviouslyworkedatBessemerTrust.

3
Opportunity
Theventure capital secondarymarket is amulti‐billiondollarmarket that is expected to expandfurtherasventurebackedcompaniesstayprivatelonger,foundersandemployeesmoreproactivelypursueliquidityalternativespriortoanIPOorM&Aexit,andasolderventurecapitalfundsreachtheendof their terms.Thecurrentmarket imbalancebetweenthenumberofcompanies fundedandthosethatachieveexitthroughIPOorM&Acreatestheopportunitytopurchaseemployeevestedsharesatattractivevaluations.Onthefundside,themarketimbalancebetweenfundedandexitedinvestmentscreatesanopportunitytopurchasesecondaryinterestsfromendoflifeventurecapitalfunds that have a need and investor demand for liquidity. Additionally, the diversified nature ofIndustryVenturesportfolioconstructionhelpstoshortentheJ‐curveandmitigatethecapitallossriskoftraditionalventurefunds.Forexample,atraditionalventurecapitalfundhascapitallossriskbyhavingdirectinvestmentsinonlyasmallportfolioofcompanies,soonebadinvestmentmayhavealargeimpactonthetotalfundreturn.TraditionalventurefundsalsohavealongerJ‐curvesinceittakesmanyyearstoinvestinayoungcompany,thenoperateandgrowittoamatureexit.Lastly,IndustryVenturesnetworkandprocessallowsaccesstosmaller,betterperformingfundsinwhichlargeinstitutionalinvestorsarerarelyabletoinvest.
Risks
Market Environment – venture capital company valuations across various life cycles have beenincreasingoverthepastseveralyears.Ahighvaluationenvironmentmaychallengetheteam’sabilitytoproducethehighreturnssimilartopriorfunds.However,asequitymarketshavedeclined,sohaveventurecompanyvaluations,andthefundsmaybedeployingcapitalatanopportunetime.
Inherent Risk in Venture Capital – venture companies face many risks, including execution,technology, competition and obsolescence, resulting in high failure rates. The Industry Venturesfunds’ broad diversification across life stages and companies helps tomitigate the possibility ofindividualportfoliocompanyfailuressignificantlyimpactingthefund.
NoFullFundLiquidation–noneofthepriorPartnershipHoldingsfundshavecompletedafullfundliquidationatthistime,butallarestillwithinthetermsoftheirfundliveswithoutextensions.Thisposestheriskthattimingandamountsofeventualmonetizationcouldimpactthosefundinvestors’finalreturns.Thisisacommonriskinallprivateequityfundsthathaveunrealizedportfolioholdings.
PortfolioandInvestmentStrategy
The Industry Ventures platform has a sourcing advantage through its proprietary database ofquarterlyreportsfromover215fundsandover2,000underlyingcompanies,professionalnetworkof GP’s, LP’s, and bankers, and strong brand equity. The platform systematically reviews an

4
opportunitysetofover$6billionindealssourcedeachyear,utilizesinvestmentcriteriafiltertheopportunities,conductscomprehensiveduediligence,andcloseson$100‐$200millionsecondaryinvestmentsannually.Additionally,theteam’strackrecordandexperiencehashelpedthembuildanextensivenetworkofcontactsandbanksthroughoutSiliconValley.
IndustryVenturesSecondaryFundVIII
The fund will assemble a portfolio of investments in later stage venture companies and funds,focusing on the small end of the secondary market where there is less competition and moreattractiverisk‐adjustedreturns.
‐ Targetstransactionsthatare$25millionorsmaller‐ Growthbusinessthatareonaclearpathtoexit‐ Structuralflexibilitytocapturemoreopportunities
TargetStructure:
50%SecondaryDirect–directpurchasesofcompanyshares,20‐40companies 25%LPInterests–interestsinaventurefund,10‐20transactions 25%SpecialSituations–uniquedealstructuringopportunities(ex:employeeshares)
IndustryVenturesPartnershipHoldingsIV
The fundwill constructaportfolioof investments inearlyandmid‐stageventurecompaniesandfunds,seekingtoprovideadiversified,systematic,multi‐yearinvestmentprogramfocusedonsmallfunds.
‐ Primarycommitments tosmallerventure funds thatareapproximately$25million to$250millioninsize
‐ SecondaryLPinterestsinventurefundsthatarelessthan50%funded‐ Specialpurposefundsthatcapitalizeonexcesspro‐ratarights‐ Directinvestmentinportfoliocompanies
TargetStructure:
40%EarlySecondaryandSpecialPurposeFunds– interests inventure fundsandexcessproratarightsvehicles,5‐10transactions
40%PrimaryCommitments–commitmentstosmallventurefunds,12‐15managers 20%DirectInvestments–directpurchasesofcompanyshares,15‐20companies

5
PricingandTerms
IndustryVenturesSecondaryFundVIII
o Management Fee: 1.5% on committed capital through year 5, 1.5% net invested capitalthereafter
o PreferredReturn:1)PriorityReturn:6%preferredreturnpriortoGPreceivingcarriedinterest.GPcarriedinterestis17.5%
2)Non‐PriorityReturn:nopreferred,GPcarriedinterestis15%*note:NEPCmodelled variousoutcomesand scenariosand recommends theNon‐Priorityoption.
o EuropeanWaterfall:1. 100%toLP’suntiltheyreceiveafullreturnofcapitalandpreferredifapplicable2. 100%toGPascarriedinterestcatchupforapplicablecarriedinterest3. 82.5%/17.5%LP/GPforPrioritypartners,85.0%/15.5%fornon‐Priority
o Term:10years,withtwooneyearextensionsuponconsentofAdvisoryCommitteeo Commitmentperiod5yearso FundSize:$425million
IndustryVenturesPartnershipHoldingsIV
o ManagementFee:1%ofcommittedcapitalyears1‐7,thereafter95%ofprioryear’srateoncontributedcapital
o PreferredReturn:6%o EuropeanWaterfall:
1. 100%toLP’suntiltheyreceiveafullreturnofcontributedcapital2. 100%toLP’suntiltheyreceiveapreferredreturnof6%oncontributedcapital3. 100%toGPascarriedinterestcatchupforapplicablecarriedinterest(5%primaries,
10%secondaries,and20%fordirects/co‐investments4. Respectivecarrysplitbasedontypeofinvestment
o Term: 10 years,with GP option to extend additional 4 years, LP vote for additional 1yearextensionbeyondthat
o CommitmentPeriod4yearso Fundsize:$200million
Performance
IndustryVenturesisaleadinginvestmentmanagerintheventurecapitalsecondariesspace,andapreferredproviderofliquiditysolutions.ThePartnershipHoldingsandSecondaryfundsconsistently

6
rank in the topquartiles in IRR,DPI, andTVPIwhen compared to theThomsonOne/CambridgeAssociatesUSVentureUniverse.Rankingsandpriorfundperformanceinformationisshownbelow:
SecondaryFunds

7
PartnershipHoldingsFunds

8
FitforDPFPPortfolio
TheBoardapprovedthePrivateEquitypacingplanaspresentedbyNEPCat theMarch10,2016meeting.Thisplanincludes$20millioninannualcommitmentstoprivateequityfundsinordertomaintainvintageyeardiversification,remainanactiveinvestorintheassetclass,anddiversifyacrossfundtypesandstrategies.NEPChassuggestedDPFPaddasecondariesstrategytotheprivateequityportfoliosince2014,andreiteratedthissuggestionaspartofthePrivateEquitypacingplaninorderto invest in strategies that provide a combination of long term capital appreciation and J‐curvemitigation.DPFPcurrentlyhaspracticallynoexposuretoventurecapitalorsecondariesinitscurrentprivateequityallocation.Therecommendedinvestmentswouldenhancediversificationbytypeofinvestmentandcontinuediversificationbyvintageyear.TheuniquestructureofIndustryVenturefunds make them a better alternative to traditional venture capital funds, because they help tomitigate thecapital loss riskviadiversification, shorten the J‐curveduration,and incombinationprovide exposure across early, mid, and late stage venture companies. For these reasons, Staffrecommendsapprovinganallocationof$5millioneachtoIndustryVenturesPartnershipHoldingsIVandIndustryVenturesSecondaryFundVIIIwithinDPFP’sprivateequityallocation.

900 Veterans Blvd. | Ste. 340 | Redwood City, CA 94063-1741 | TEL: 650.364.7000 | www.nepc.com
BOSTON | ATLANTA | CHARLOTTE | CHICAGO | DETROIT | LAS VEGAS | SAN FRANCISCO
To: Dallas Police & Fire Pension System Trustees
From: Rhett Humphreys, CFA, Partner; Keith Stronkowsky, CFA, Senior Consultant; Jeff Roberts, Senior Consultant
Date: April 14, 2016
Subject: Industry Ventures Secondary Fund VIII & Industry Ventures Partnership Holdings IV
Executive Summary
Industry Ventures is concurrently raising two complimentary funds: Industry Ventures Secondary Fund VIII (“IVSF VIII”) and Industry Ventures Partnership Holdings IV (“IVPH IV”). IVSF VIII will make investments in secondary interests in venture capital LP interests, special purpose vehicles and direct equity in venture capital backed companies with an emphasis on investing in high quality growth stage companies that are through the J-curve and possess significantly less technology risk and business risk than a typical venture capital investment. IVPH IV will be a hybrid fund structure, consisting of direct and indirect investments in early and mid-stage venture-backed companies primarily in the information technology sector. The Fund will purchase early secondary limited partnership interests (i.e., interests less than 50% funded) while also targeting primary commitments in high performing small funds that are typically between $25 million and $150 million in size.
Client Suitability Recommendation
Currently, the Dallas Police & Fire Private Equity program lacks exposure to the secondary and venture capital strategies. Additionally, when considering the industries in which the current DPF private equity managers are investing, Information Technology/Tech-Enabled Services is not an area of focus of any of the incumbent managers. Commitments to IVSF VIII and IVPH IV will provide for additional strategy diversification as well as industry diversification within the Private Equity program in what has been, and continues to be, a high growth sector.
As evidence of demand for its products, Industry Ventures has carved out a niche by providing investors with an attractive risk adjusted exposure to venture capital. Venture-backed companies experience a high failure rate. Through its strategy of late stage investing and typically acquiring investments at discounts to fair value from sellers seeking early liquidity, IVSF VIII’s secondary strategy has been able to achieve positive returns on nearly 70% of its investments to date and provide for earlier distributions than a standard primary venture capital fund. IVPH IV will focus on investing in small venture capital funds and high growth companies as the team believes these are attractive opportunities within the venture industry relative to the current high valuations of later stage companies. The Fund will also include investments into mid-stage companies acquired through early secondary purchases, special purpose funds and direct investments. This portfolio construction strategy is differentiated from traditional venture investing and should provide investors early liquidity and thus a mitigated J-curve.

Conclusion/Recommendation:
NEPC recommends Dallas Police & Fire commit $5 million each to Industry Ventures Secondary Fund VIII & Industry Ventures Partnership Holdings IV. These commitments are in line with the 2016 Private Markets Strategic Plan approved by the Trustees on March 10, 2016 and would serve as compliments to the current Private Equity program. Additionally, both of these funds have been given a “Preferred” rating by NEPC.
DPFP 2016 Private Markets Strategic Investment Plan
– $10 million to venture/secondaries o Current action item
– $10 million to buyout/special situations – $30 million to private credit strategies
o $10 million commitment to Riverstone Credit (March 2016)

[Type text]
NEPC Private Markets Investment Due Diligence Research Report
Industry Ventures Industry Ventures Secondary Fund VIII
Report written by the NEPC Private Markets Team as of March 7, 2016.
Product Rating: Preferred

Industry Ventures Secondary Fund VIII Secondary Strategy
Confidential Information – For NEPC Client Use Only © Copyright 2016 NEPC, LLC All Rights Reserved 1
Table of Contents
Executive Summary ............................................................................................................. 3
Fund Characteristics ............................................................................................................ 5
Firm Description .................................................................................................................. 6 Firm Overview .................................................................................................................... 6 Team Overview ................................................................................................................... 6 Recent Turnover/ Key Departures ......................................................................................... 6 Succession Planning ............................................................................................................ 6
Fund Investment Strategy ................................................................................................... 7 Investment Strategy ............................................................................................................ 7 Target Return ..................................................................................................................... 7 Target Fund Size ................................................................................................................. 7 Target Investment Type ....................................................................................................... 7 Target Geographic Focus ...................................................................................................... 7 Target Deal Size.................................................................................................................. 7 Use of Leverage .................................................................................................................. 8 Recycling of Capital ............................................................................................................. 8 Manager’s View of Current Market Conditions ......................................................................... 8 Expected Fund Investor Base ................................................................................................ 9 Current Fund Investments .................................................................................................... 9 Example of a Prior Investment .............................................................................................. 9
Fund Investment Process .................................................................................................. 10 Deal Sourcing ................................................................................................................... 10 Investment Process ........................................................................................................... 10 Value Creation .................................................................................................................. 11 Risk Mitigation .................................................................................................................. 11
Fund Economics ................................................................................................................ 12 Management Fee ............................................................................................................... 12 Distribution Waterfall ......................................................................................................... 12 Allocation of Carried Interest .............................................................................................. 13 Other Fees and Expenses ................................................................................................... 13
Fund Administration, Structure and Policies ...................................................................... 14 Fund Structure .................................................................................................................. 14 ERISA Provisions ............................................................................................................... 14 UBTI Considerations .......................................................................................................... 14 Environmental, Social & Governance Disclosures ................................................................... 14 Labor Policy ...................................................................................................................... 14 Key Person Provision ......................................................................................................... 15 GP Removal Provisions ....................................................................................................... 15 Reporting ......................................................................................................................... 15 Valuation Policy................................................................................................................. 15
Litigation, Regulation and Compliance .............................................................................. 16 Current Litigation .............................................................................................................. 16 Compliance Staff and Philosophy ......................................................................................... 16 SEC Oversight .................................................................................................................. 16 Subject to Other Regulators ............................................................................................... 16 Personal Trading ............................................................................................................... 16

Industry Ventures Secondary Fund VIII Secondary Strategy
Confidential Information – For NEPC Client Use Only © Copyright 2016 NEPC, LLC All Rights Reserved 2
Firm Infrastructure ........................................................................................................... 17 Office Locations ................................................................................................................ 17 Technology Resources and Systems..................................................................................... 17 Business Continuity Planning .............................................................................................. 17 Fund Administration/ Back Office Resources ......................................................................... 17
Firm Track Record ............................................................................................................. 18 Track Record Benchmarking ............................................................................................... 19 Fund Attribution Analysis.................................................................................................... 21
Key Fund Professionals ..................................................................................................... 27 Detailed Biographies .......................................................................................................... 27
Disclaimers and Disclosures .............................................................................................. 29

Industry Ventures Secondary Fund VIII Secondary Strategy
Confidential Information – For NEPC Client Use Only © Copyright 2016 NEPC, LLC All Rights Reserved 3
Executive Summary Industry Ventures (the “Firm”) was founded by Hans Swildens in 2000 to make venture capital investments in early stage information technology companies. Mr. Swildens soon recognized an investment opportunity existed for a specialized secondary strategy that focused on venture-backed companies and assembled a team to focus on these efforts. In 2009, the Firm acquired
Little Hawk Capital (“Little Hawk”), a Washington D.C. based fund-of-funds platform founded by Roland Reynolds focused on making commitments to small, top-performing venture capital funds. Little Hawk committed to an Industry Ventures Secondaries fund, and the two firms soon recognized the merits of combining the Little Hawk fund-of-funds program with a secondary component. Subsequently, the two firms merged. The merging of the two firms broadened the knowledge base of Industry Ventures and has been additive for both strategies. Today, the Firm
has 17 employees operating out of offices in San Francisco, CA and Washington D.C. Industry Ventures is raising Industry Ventures Secondary Fund VIII (the “Fund” or “Fund VIII”) and
is seeking $425 million in commitments. The Fund will make investments in secondary interests in venture capital LP interests, special purpose vehicles and direct equity in venture capital backed companies with an emphasis on investing in high quality growth stage companies that are through the J-curve and possess significantly less technology risk and business risk than a typical venture
capital investment. The Fund will target investments of $25 million or smaller to create a portfolio of approximately 60 investments. The Fund has a return target to generate a net multiple of 1.8x-2.2x on invested capital and a net IRR of 20%-25% for its investors. Investors in Industry Ventures Secondary Fund VIII should benefit from the following positives:
Attractive Risk Adjusted Exposure to Venture Capital – Venture-backed companies experience a high failure rate. Through its strategy of late state investing and typically acquiring investments at discounts to fair value from sellers seeking early liquidity, the Fund’s secondary strategy has been able to achieve positive returns on nearly 70% of its investments to date.
Experienced Senior Team – The three Managing Directors of Fund VIII have participated in more than $1.0 billion secondary venture capital transactions across more than 200 deals. Combined, they have an average of more than 20 years of experience investing in, leading and working in venture-capital backed companies. This experience serves them well in identifying industry trends, assessing the strength of management teams and negotiating/structuring successful transactions.
Sourcing Network – The Industry Ventures platform provides a key advantage in sourcing, evaluating and selecting fund managers and direct investments. Across both secondary and primary investment platforms, the previous Industry Ventures funds have committed to approximately 215 venture capital limited partnerships. The Firm has cultivated relationships with the managers of these funds and others over the past 15 years. The strength and depth of the network of its team provides the Firm with a key sourcing advantage over other potential buyers of secondary interests.
Flexible Distribution Waterfall – Investors in Fund VIII will have the option of investing
either as Priority Return Partners whose investments are subject to a 6% preferred return and a 17.5% GP carry rate or as Non-Priority Return Partners, whose investments are not subject to a preferred return but have a lower 15.0% GP carry rate. Based on NEPC’s assessment of a relatively low break-even between these two options, NEPC believes that
the Non-Priority Return option is most attractive for investors seeking to maximize the capital returns from investment in Fund VIII.

Industry Ventures Secondary Fund VIII Secondary Strategy
Confidential Information – For NEPC Client Use Only © Copyright 2016 NEPC, LLC All Rights Reserved 4
Investors in Industry Ventures Secondary Fund VIII should be aware of the following negatives:
Relatively New Investment Team below Managing Director – Industry Ventures has historically relied heavily on its Managing Directors throughout its deal sourcing and evaluation. Over the past four years, the Firm has added three Vice Presidents (to replace two departed Managing Directors) and added two associates to replace the three who
departed for business school, making for a team that has worked together or a relatively short period of time.
High Valuation Market Environment – Venture capital pre-money valuations across the various stages have increased dramatically over the past 5-7 years, particularly in late stage technology companies. Navigating a rich valuation environment could pose a near-term challenge to the Fund’s ability to source investments at attractive valuations.
However, should there be a significant valuation correction in the venture capital sector,
Fund VIII will be well positioned to capitalize on liquidity needs of potential sellers at attractive valuations.
Inherent Risk in Venture-Backed Technology Companies – While Fund VIII’s investment strategy seeks to mitigate risk by investing in late-stage businesses and purchasing assets at discounted valuations, venture capital-backed technology businesses
have a higher risk of failure than established businesses in other, slower growth industries. As Fund VIII will concentrate its investments into this single segment, the Fund may exhibit greater investment risk than a fund that invests across a broader set of less risky industries.
Increased Competition for Deals - The success of Industry Ventures’ venture capital
focused secondary investment strategy has been attracting more competition from other fund of funds that have developed investment products with similar investment strategies. In addition, private trading platforms have emerged to help facilitate liquidity in certain well
known private companies. While the Fund may benefit from a general increased awareness of liquidity options leading to more potential sellers, new VC-focused secondary funds and trading platforms could lead to increased competition for deals and higher purchase prices.

Industry Ventures Secondary Fund VIII Secondary Strategy
Confidential Information – For NEPC Client Use Only © Copyright 2016 NEPC, LLC All Rights Reserved 5
Fund Characteristics Investment Vehicle Delaware LLC
Investment Manager Industry Ventures
Target Size/Max Size $425 million/$500 million
Amount Raised $125 million
Minimum Investment Size $5 million, subject to waiver by the General Partner (“GP”)
Target Final Close Date June 30, 2016
Investment Period Five years from the initial closing date
Fund Term 10 years from the initial closing, with two one-year extensions at Advisory Board discretion.
Sponsor’s Investment 2% (up to half through management fee waiver)
Assets Under Management $2.1 billion in commitments ($1.6 billion in secondary funds)
Investment Focus Secondary purchases of VC fund interests and secondary direct purchases of privately held venture capital-backed companies.
Geographic Focus US focused
Projected Number of Investments
Estimated total of 60 investments: 20 LP interests, 30 direct investments and 10 special purpose vehicle investments
Deal Size Transactions that are less than $25 million
Target Fund Return 20%-25% net IRR and 1.8x-2.2x net multiple on invested capital
Leverage The Fund will not utilize fund-level leverage. The Firm has a working capital line of credit used for capital calls.
Annual Management Fee 1.5% of commitments during the investment period; 1.5% of net invested capital thereafter
Other Fees The GP does not charge transaction or monitoring fees, but should any fees be received by the GP from an investment, they would be 100% offset against the management fee. The Fund will pay all legal, accounting, financial reporting, banking, custodial, audit and other professional fees, advisory board costs and fees associated with registration and compliance with regulatory agencies
Organizational Costs The Fund will bear up to of $750,000 of organizational expenses.
Carried Interest Priority Return Partners: 17.5%; Non-Priority Return Partners: 15.0%
Preferred Return Priority Return Partners: 6.0% (annual, simple); Non-Priority Return Partners: 0.0%
Distribution Waterfall First, 100% to LPs until they have received a full return of capital and (for Priority Return Partners only) a 6% preferred return on all unreturned investments in the Fund;
Then, 100% to the GP as carried interest catch up until the GP has received 17.5% of all distributions made to Priority Return Partners and 15.0% of all distributions made to Non-Priority Return Partners;
Thereafter, for Priority Return Partners a 82.5%/17.5% LP/GP split and for Non-Priority Return Partners a 85.0%/15.5% LP/GP split on all additional distributions
ERISA Fiduciary Industry Ventures does not operate as an ERISA fiduciary. Industry Ventures has ERISA investors in prior funds and plans to keep ERISA commitments below 25% in Fund VIII
Fund Auditor Ernst & Young
Fund Legal Counsel Cooley LLP
Placement Agents None
Website www.industryventures.com

Industry Ventures Secondary Fund VIII Secondary Strategy
Confidential Information – For NEPC Client Use Only © Copyright 2016 NEPC, LLC All Rights Reserved 6
Firm Description Firm Overview Industry Ventures was founded by Hans Swildens in 2000 to make venture capital investments in early stage information technology companies. In 2002, Industry Ventures purchased an interest in Speedera Networks from a public corporation. With this transaction, Mr. Swildens recognized an investment opportunity existed for a specialized secondary strategy that focused on venture-backed companies. To implement the investment strategy, Mr. Swildens assembled a team with
venture capital investment experience to establish the Firm’s secondary investment efforts. In 2009, the Firm acquired Little Hawk Capital (“Little Hawk”), a Washington D.C. based fund-of-funds platform founded by Roland Reynolds that focused on making commitments to small, top-performing venture capital funds. Little Hawk committed to an Industry Ventures secondaries fund and the two firms soon recognized the merits of combining the Little Hawk fund-of-funds program with a secondary component. Subsequently, the two firms merged.
Today, the Firm has 17 employees operating out of offices in San Francisco and Washington D.C. that are focused on two venture capital fund offerings: Industry Ventures Secondary Funds and Industry Ventures Partnership Holdings. With investments in over 215 venture capital limited partnerships and 110 direct company investments, the Firm maintains one of the most comprehensive databases of venture capital limited partnership data and portfolio company performance data. Industry Ventures now manages approximately $2.1 billion in commitments
between the two strategies.
Team Overview The Industry Ventures Secondary Team consists of eight investment professionals comprised of three Managing Directors, Hans Swildens, Justin Burden and Victor Hwang, three Vice Presidents, Lindsay Sharma, Ira Simkhovitch and Amir Malayery and two analysts. They are supported by COO
Robert May, in addition to a five-person back office team. The Secondary Team investment professionals also have the ability to leverage the network and knowledge of the three Partnership
Holdings Team professionals for sourcing and investment analysis.
Recent Turnover/ Key Departures There have been two departures at the senior level in the past five years. In 2015, Will Quist, Managing Director, left the Firm to so he could focus on primary investing opportunities in start-up companies. Mike Gridley, Managing Director, left the firm in January 2013 to pursue other opportunities. These two departed professionals accounted for the sourcing of less than 10% of the 200+ secondary deals that the Firm has completed over the past fourteen years. The Firm does not plan to hire an additional Managing Director to replace Mr. Quist, but rather view this departure as an amicable one that will create opportunity for the Firm’s Vice Presidents to increase their
responsibilities which may provide a future promotion opportunity for one of them to Managing Director. Additionally, since the start of raising Fund VII in 2013, the Firm has seen its three associates depart for business school. To mitigate the impact of these departures, over the past three years the Firm has hired three Vice
Presidents and two associates. All three of the Vice Presidents came to Industry Ventures with
prior private equity, venture capital and/or secondary investment experience in technology businesses and have MBAs from either Harvard or Columbia Business Schools. Their biographies are included near the end of this report. To support the Firm’s growing assets under management, the Firm plans to hire additional associates during the course of investing Fund VIII.
Succession Planning The Industry Ventures organization is composed entirely of professionals that work on a team basis and are in their 30s and 40s, so a formal succession plan is not currently in place. However, were Mr. Swildens unexpectedly not be available to run the Firm, responsibilities would likely shift to Justin Burden. None of the current Managing Directors expect to retire any time soon. The management company is owned by a Trust which has a process for succession in the event of the death of one of the Trustees.

Industry Ventures Secondary Fund VIII Secondary Strategy
Confidential Information – For NEPC Client Use Only © Copyright 2016 NEPC, LLC All Rights Reserved 7
Fund Investment Strategy
Investment Strategy Industry Ventures Fund VIII will build on Fund VII’s strategy of investing in later-stage companies with substantial revenue and near term profitability, seeking to avoid the high mortality rate of early-stage venture investments. Central to the strategy is that when assembled in a diversified portfolio, secondary direct investments, limited partnership interests, and other special situation investments can offer the upside of venture capital, without the same risk of capital loss as traditional venture funds. By anchoring investments in high quality, later stage companies, the
Firm’s secondary funds seek to provide capital preservation and achieve earlier liquidity, resulting in a Fund return profile with a shorter “J-curve” than primary venture capital investing and attractive long term potential. The Firm seeks generate attractive risk adjusted returns for investors by applying a unique
sourcing, underwriting and structuring approach to exploit inefficiencies in a fragmented and
underserved market. Key elements of the Firm’s investment strategy include:
Target sector leading venture-backed businesses in transactions that are $25 million or smaller;
Mitigate the typical “J-Curve” of venture capital by investing in growth businesses that are on a clear path to exit;
Maintain structural flexibility to invest through secondary direct purchases, LP interests or
special purpose vehicles to capture compelling proprietary investment opportunities; Focus on the inefficiencies of the small end of the secondary market where competition is
less and risk-adjusted returns are most attractive; Build a diversified portfolio of leading, proven, successful later stage businesses that can
generate returns in conservative exit scenarios and potentially outperform on the upside; and
Leverage the Firm’s key relationships through Silicon Valley’s investors, lawyers,
accountants, entrepreneurs and tech industry professionals to identify transactions that are not readily accessible to other potential buyers.
Target Return The team is targeting net annualized net returns of 20-25% and a 1.8x-2.2x net multiple on invested capital.
Target Fund Size The Firm is targeting $425 million in commitments for Fund VIII, with a hard cap of $500 million, which is likely to be reached. Secondary Fund VII had $430 million of commitments.
Target Investment Type Industry Ventures’ secondary strategy targets three types of venture capital investments: LP interests in venture capital funds, direct interest in privately held stock of venture backed companies and in special purpose vehicles (“SPVs”), which can be used to acquire exposure to
either LP interests or direct companies through a structured financial contract (such as in a GP restructuring). The Firm’s strategy is to be flexible; investing in whichever of these three types of
deals provides the most attractive relative risk adjusted returns. Over Funds VI and VII to date, the Fund’s deals have been 15% in LP interests, 15% in SPVs and 70% in directs.
Target Geographic Focus Fund VIII will focus on venture capital opportunities that are mainly domiciled in the United States. The team expects that 80%-100% of investments made will be in North American companies or
venture capital funds.
Target Deal Size The team anticipates the typical deal size to be $25 million or less. Within the deals, the average investment size has historically been approximately $5.0 million.

Industry Ventures Secondary Fund VIII Secondary Strategy
Confidential Information – For NEPC Client Use Only © Copyright 2016 NEPC, LLC All Rights Reserved 8
Use of Leverage The Fund does not have a formal leverage exposure policy and to date has not utilized leverage as part of the investment strategy. The Firm has a line of credit that is used for bridging capital calls and was recently renewed with First Republic Bank.
Recycling of Capital Fund VIII may recycle capital previous distributions up to 25% of the Limited Partners’ capital commitments. After three years from the time of each distribution, a capital distribution is not subject to further potential recall.
Manager’s View of Current Market Conditions The Firm estimates that the venture capital secondary market is a multi-billion dollar opportunity on an annual basis and anticipates that it will continue to expand as venture-backed companies stay private longer, founders and employees more proactively pursue liquidity alternatives prior to
an IPO or M&A exit and older venture capital funds reach the end of their terms. In recent years, the Firm has sourced and evaluated over $6 billion in potential secondary venture capital transactions. Within this large market, the Firm focuses on sub $25 million transactions as this
portion of the market remains highly fragmented and inefficient. Consistent with this focus on small transactions, the majority of the Firm’s historical pipeline of transactions has been sourced outside of an auction or brokered sale. Industry Ventures believes that the venture capital market faces an imbalance between the number of companies funded (over 3,000 per year) and those companies that achieve an exit through IPO or M&A (generally 500-600 per year). Meanwhile, the time to IPO or M&A for a venture-backed
company has extended from approximately three years throughout the 1990s to currently five years for M&A and over seven years for an IPO. The extension of the time to exit has led to a growing backlog of “unicorns” – VC-backed private companies with $1B+ valuations. The GP recognizes that venture capital valuations have risen significantly over the past few years, in some eyes exceeding “bubble” levels. While not turning a blind eye to industry trends, the Industry Ventures team continues to cautiously evaluate opportunities with an eye for identifying companies
with outlier potential. With uncertainty building throughout Silicon Valley, Industry Ventures is seeing an extremely high level of interest of unicorn employees seeking partially liquidity for their vested interests (with the support of their Boards) to harvest some gains and diversify their personal holdings. The Industry Ventures team is carefully monitoring more than 100 “unicorns” to assess which ones have the highest probability of success while patiently awaiting any near-term valuation adjustments that may spook shareholders into selling and providing Fund VIII with an opportunity to buy unicorn and other VC shares at more attractive valuations. The GP notes that
while valuations are important, the largest, most outsized returns on past investments have been less driven by purchase discount and more driven by successfully acquiring interests in break-out businesses. The GP expects to construct a portfolio that will be a blend of investments with 2-4x potential (those where the discount is a more meaningful part of the return) with some high conviction, break-out potential investments. Despite the increasing amount of venture activity (with 2015 U.S. Venture Capital investment on
track to be at the highest level since 2000) the M&A and IPO exit markets for venture-backed
companies have remained relatively flat for the past few years. The Firm believes that this imbalance between venture capital investments and exits has persisted through macroeconomic cycles and has created a strain for all types of equity holders — from general partners to limited partners to founding management teams. The GP also believes that Fund VIII is timed well to capture end of fund investments from VC funds that are 15+ years old and at the end of their
extended terms. Many of these are funds that were raised during 1996-2000 Internet boom when VC fundraising was at record high levels. The unsatisfied demand for liquidity, coupled with a dramatic increase in the number of prominent venture funded companies, presents a unique investment opportunity for secondary managers capable of identifying the most compelling opportunities.

Industry Ventures Secondary Fund VIII Secondary Strategy
Confidential Information – For NEPC Client Use Only © Copyright 2016 NEPC, LLC All Rights Reserved 9
Expected Fund Investor Base
Fund VIII is expected to have a similar breakdown of investors by type as those seen in the Firm’s prior secondary funds, as follows (approximate amounts):
Public pension funds (~50%) Asset managers & insurance companies (~25%) Endowment/Foundations (~10%)
Corporate investments (pensions & balance sheet) (~10%) Individuals and others (~5%)
Current Fund Investments The Fund has not closed on any investments to date.
Example of a Prior Investment
Prior to 2010, Industry Venture identified Alibaba Group, a leading Chinese mall, marketplace and
online retailer, as a potential acquisition target due to its rapid growth and near-term IPO potential. During 18 months from June 2010 through December 2011, Industry Ventures acquired $13.2 million of shares in Alibaba Group that were primarily purchased from hedge funds who were seeking liquidity to help fund redemptions from their own investors. In September, 2014, Alibaba Group completed its IPO on the New York Stock Exchange (NYSE: BABA), marking at that time the largest IPO ever, at $25 billion. Through a series of IPO and secondary sales, Industry Ventures
realized $132.2 million on its $13.2 million investment, for a 10x return & 66% gross IRR.

Industry Ventures Secondary Fund VIII Secondary Strategy
Confidential Information – For NEPC Client Use Only © Copyright 2016 NEPC, LLC All Rights Reserved 10
Fund Investment Process
Deal Sourcing The investment strategy is focused on smaller secondary purchases where there has historically
been little competition. Sourcing is a critical part of the strategy which can be defined as a combination of top down initiatives aimed at exploiting macro themes that may impact the secondary market, and bottom up sourcing processes which focus on identifying attractive companies and potentially motivated sellers. Thematic initiatives are researched and developed to identify themes that may impact secondaries
and develop sourcing initiatives. According to Industry Ventures, more than half of their deal flow has resulted from these initiatives which have included recognizing financial institutions as an important source of deal flow and setting out to make contact with all of those institutions. This resulted in the purchase of the Washington Mutual private equity portfolio out of bankruptcy.
The team utilizes their investments in LP interests to deeply understand all of the companies held in the Fund and identify high quality companies that they may target for additional investment.
Sourcing focuses on high quality companies and utilizes the Firm’s extensive database on venture backed companies, sponsors and investors which allows them to identify and target holders of a particular company.
Investment Process
The Firm uses a systematic investment process with multiple checkpoints to leverage the investment team’s experience and judgement. Throughout the process, the Firm’s investment professionals are trained to focus on identifying risks and risk mitigants for each investment before ascribing value to growth projections. The Industry Venture secondary investment process includes six key steps:
1. Sourcing: Opportunities are sourced through a multi-pronged approach of thematic
research, single asset targeting and seller outreach.
2. Opportunity Analysis: Opportunities that meet the Firm’s investment criteria are summarized by the Deal Team in an Early Read Memo Memorandum in order to present the investment thesis and flag potential risks, and to introduce the opportunity to the team and identify potential concerns. The memo will typically include analysis of the seller’s
motivation, market overviews, historical financials, and existing investors. In the analysis of portfolios, companies are classified as value drivers, good potential and no value.
3. Formal Due Diligence: The Firm follows a disciplined process designed to identify the
value drivers with a portfolio which typically includes:
Gathering all company details including financials and cap tables;
Contacting venture fund managers that know the market segments well; Reviewing reports to LPs to determine value;
Modeling company valuations, capitalization, liquidation options and timing and risk to projected return;
Segmenting portfolios to identify the value drivers; Contacting select bankers regarding sector dynamics and sector values; Understanding any restrictions on transfer and information rights; and
Confirming assumptions with L.P. diligence, fund manager calls.
The formal due diligence will lead to a Letter of Intent Memorandum for formal review by the Fund’s Investment Committee to reach an initial recommended value and structure before continued conversations with the seller. The Fund VIII Investment Committee is comprised of Hans Swildens, Justin Burden & Victor Hwang. Decisions are made in a
consensus style, although Mr. Swildens does have the ability to veto recommendations of the other two to stop an investment recommendation from proceeding.

Industry Ventures Secondary Fund VIII Secondary Strategy
Confidential Information – For NEPC Client Use Only © Copyright 2016 NEPC, LLC All Rights Reserved 11
4. Investment Committee Review and Structuring and Closing: The Investment
Committee will review and determine the final structure and terms which are reduced to a formal Letter of Intent. Once a Letter of Intent is issued and executed, a deal moves into the closing phase. Over this period of 15 to 30 days, the deal team is responsible for confirming earlier due diligence as well as drafting and negotiating the transaction. Once
again the aggregate findings are presented to the investment committee for final approval.
5. Monitoring and Follow-On Investments: Positions are actively monitored by the Deal Teams for opportunistic and protective follow on investment opportunities. Follow-on investments pursued by a Deal Team follows the same investment due diligence and approval process as an initial acquisition.
6. Investment Exit: When possible, Deal Teams actively manage investments to generate liquidity in an attempt to maximize returns. While most exits are achieved through an
event at the underlying investment level that is out of the Firm’s control, the Firm may pursue proactive sales of its own positions in order to maximize investment returns or reduce the Firm’s risk to valuation volatility. All sale decisions are approved by the Firm’s Investment Committee.
Value Creation Value creation for the strategy takes place in the sourcing and due diligence phase where the Firm seeks to invest in the most promising venture capital backed companies on a secondary basis. The Firm utilizes its network and reputation as a credible, reliable buyer to proactively and proprietarily source potential investments. Sourcing efforts can be general networking in nature or can be conducted to pursue specific targeted funds or companies. With more than ten years of secondary
transactions, Industry Ventures is experienced in the negotiating, structuring and transacting process to guide sellers through efficient processes. The Firm utilizes its investment team, who are experienced both in high growth technologies and in investments, to evaluate and assess the potential growth opportunities for investments under consideration. The strategy invests in
minority positions and does not take an active role in the management or Board oversight of any of its investments.
Risk Mitigation The Firm is expected to opportunistically construct a portfolio for Fund VIII that is concentrated in technology investments but likely to be diversified in number and size. However, as this is an opportunity driven strategy, the number of investments in prior secondary funds has varied. Fund V contained 90 investments, Fund VI contained 48 investments and Fund VII contains 44
investments to date. Due to the inherent riskiness of venture capital investments, Industry Ventures will not use bank debt as a means to enhance financial returns, aside from using a line of credit for working capital purposes. The Fund VIII strategy seeks to provide an element of downside protection by targeting companies with high probabilities of realizations within 2-3 years and through the purchase of secondary interests at discounts to their reported fair value. The Fund will further seek to mitigate risk through the use of special purpose vehicles, where the additional structuring can provide an element of protection or priority of return for the Fund’s investments.

Industry Ventures Secondary Fund VIII Secondary Strategy
Confidential Information – For NEPC Client Use Only © Copyright 2016 NEPC, LLC All Rights Reserved 12
Fund Economics
Management Fee The investors will pay an annual management fee of 1.5% on committed capital until the fifth
anniversary of the initial close. After the fifth anniversary, investors will pay management fees 1.5% of the net invested capital of the remaining portfolio.
Distribution Waterfall Fund VIII provides investors with two distribution waterfall options from which to elect at the time of commitment:
1. Priority Return Partners: Priority Return Partners will receive a 6% priority return on
their investment prior to the General Partner receiving carried interest distributions. The priority return is calculated on a simple but annualized interest basis on the unrealized
amount of invested capital at the time of each distribution. The Fund VIII GP will have a 17.5% carried interest rate in regards to Priority Return Partner distributions.
2. Non-Priority Return Partners: Non-Priority Return Partners do not receive a priority or
preferred return on their investments prior to the General Partner receiving carried interest distributions. The Fund VIII GP will have a 15.0% carried interest rate in regards to Non-Priority Return Partner Distributions.
The Fund will employ a European waterfall methodology that provides LPs a full return of invested
capital prior to the GP receiving profit distributions. Specifically, the distribution waterfall for Fund VIII will be as follows:
First, 100% to LPs until they have received a full return of capital and (for Priority Return Partners only) a 6% preferred return on all unreturned investments in the Fund;
Then, 100% to the GP as carried interest catch up until the GP has received 17.5% of all
distributions made to Priority Return Partners and 15.0% of all distributions made to Non-Priority Return Partners;
Thereafter, for Priority Return Partners an 82.5%/17.5% LP/GP split and for Non-Priority Partners an 85.0%/15.5% LP/GP split for all additional distributions.
NEPC modeled the potential impact of the Priority and Non-Priority Return options under multiple investment return scenarios. Under most scenarios, the break-even returns on invested capital to LPs was in the range of a gross 1.1x-1.3x return on investments. Gross investment returns below the break-even range resulted in a higher multiple on invested capital for Priority Return Partners while gross investment returns above the break-even range resulted in higher multiple on invested capital returns for Non-Priority Return Partners. Given this relatively low break-even range of
outcomes, NEPC believes that investors should elect the Non-Priority Return Partner option. In the event that the GP has received excess distributions of carried interest, at the time of the
liquidation of the Fund, the GP will repay to the LPs any excess distributions, net of Federal, State and Local income taxes.
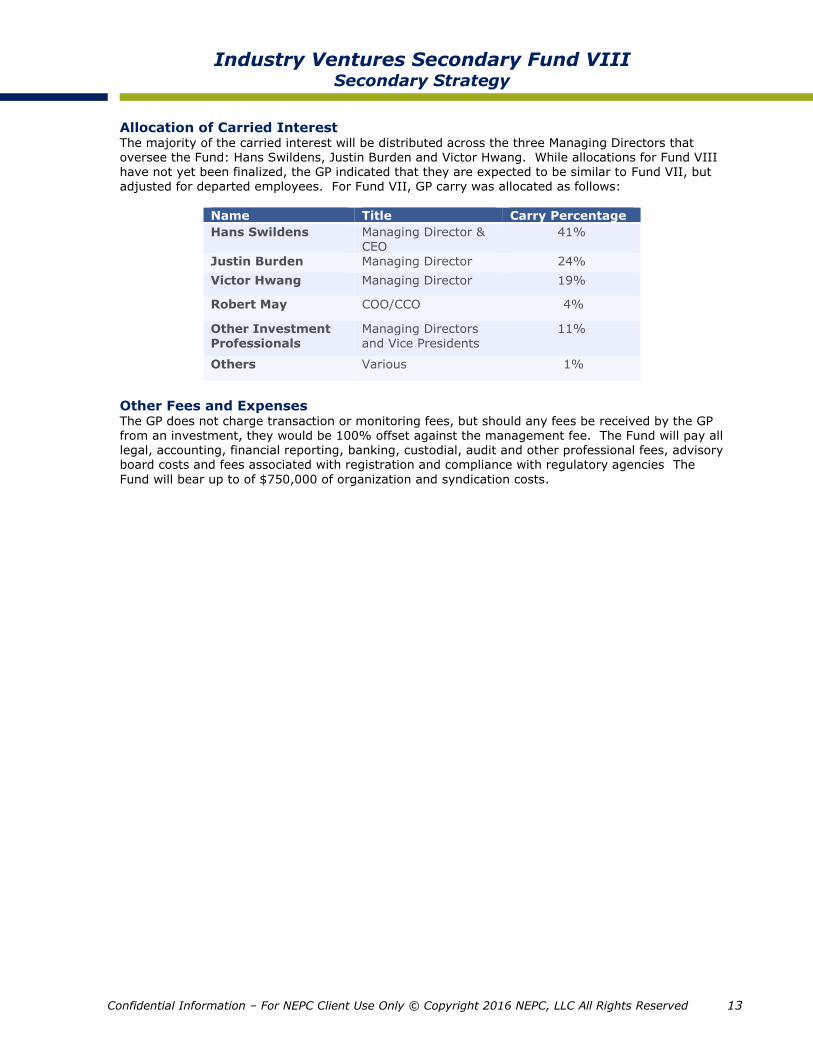
Industry Ventures Secondary Fund VIII Secondary Strategy
Confidential Information – For NEPC Client Use Only © Copyright 2016 NEPC, LLC All Rights Reserved 13
Allocation of Carried Interest The majority of the carried interest will be distributed across the three Managing Directors that oversee the Fund: Hans Swildens, Justin Burden and Victor Hwang. While allocations for Fund VIII have not yet been finalized, the GP indicated that they are expected to be similar to Fund VII, but adjusted for departed employees. For Fund VII, GP carry was allocated as follows:
Name Title Carry Percentage
Hans Swildens Managing Director & CEO
41%
Justin Burden Managing Director 24%
Victor Hwang Managing Director 19%
Robert May COO/CCO 4%
Other Investment
Professionals
Managing Directors
and Vice Presidents
11%
Others Various 1%
Other Fees and Expenses The GP does not charge transaction or monitoring fees, but should any fees be received by the GP from an investment, they would be 100% offset against the management fee. The Fund will pay all legal, accounting, financial reporting, banking, custodial, audit and other professional fees, advisory board costs and fees associated with registration and compliance with regulatory agencies The
Fund will bear up to of $750,000 of organization and syndication costs.

Industry Ventures Secondary Fund VIII Secondary Strategy
Confidential Information – For NEPC Client Use Only © Copyright 2016 NEPC, LLC All Rights Reserved 14
Fund Administration, Structure and Policies Fund Structure The partnership is structured as a Delaware limited liability corporation.
ERISA Provisions Industry Ventures does not operate as an ERISA fiduciary. Industry Ventures has ERISA investors in prior funds and may have ERISA investors in the Fund but under all circumstances they will be
limited to less than 25% of fund commitments.
UBTI Considerations The GP does not expect that significant UBTI will be generated from its investments. However, as some of the Fund’s investments are in LP interests, Industry Ventures will have limited ability in these cases to impact whether or not UBTI is generated. However, since the Fund targets
venture capital investments where leverage is rarely used (and will not be directly used by Industry Ventures), a significant amount of UBTI is not anticipated.
Environmental, Social & Governance Disclosures Industry Ventures recognizes that as venture capital fund manager, the Firm has the fiduciary duty to act in the best interest of its LPs over the long-term. In this fiduciary role, Industry
Ventures believes that environmental, social and corporate governance (ESG) issues can affect the performance of the portfolio companies (to varying degrees across companies, industry sectors, regions, and investment stages and through time). Industry Ventures also recognizes that applying these principles may better align the investments with broader objectives of society and thus may lead to better returns over the longer term.
Therefore, where consistent with the Firm’s fiduciary responsibilities, and where appropriate without causing material undue burden on Industry Ventures’ mission to act in the best long-term interest of its investors, it will be Industry Ventures’ policy to work towards the following
principles:
Industry Ventures should promote and support the incorporation of ESG issues into investment analysis and decision making processes;
Industry Ventures should incorporate ESG issues into its ownership policies and practices; Industry Ventures should seek appropriate disclosure on ESG issues by the entities in
which its funds invest; Industry Ventures should promote acceptance and implementation of these (or similar)
principles within the private equity investment industry; The members and employees of Industry Ventures should work together to enhance
effectiveness in implementing these principles; and
Industry Ventures should report on its activities and progress towards implementing these principles.
Industry Ventures plans to evaluate the effectiveness and improve the content of these principles
over time.
Labor Policy Industry Ventures does not have a formal policy with regards to unionized labor.

Industry Ventures Secondary Fund VIII Secondary Strategy
Confidential Information – For NEPC Client Use Only © Copyright 2016 NEPC, LLC All Rights Reserved 15
Key Person Provision In the event that either Hans Swildens or both Justin Burden and Victor Hwang cease to be substantially involved the management of the Fund a Key Person Event will have occurred. When a Key Person Event occurs the General Partner shall promptly notify the Limited Partners of such event, the investment period shall be automatically suspended and the Fund placed into “Limited Operations Mode”. While in Limited Operations mode the Limited Partners will remain obligated
to make cash contributions throughout the duration of the Fund to the extent needed to fund post-investment period obligations. The Limited Operations Mode may be terminated with the Fund re-enabled to make new investments upon the vote of a majority-in-interest of the LPs or the consent of the LP Advisory Committee.
GP Removal Provisions The GP may be removed “For Cause” upon at least thirty days’ notice by two-thirds (67%) in interest of the Limited Partners of the Fund. As defined by the Fund VIII LP Agreement, For
Cause shall mean situations where the General Partner has committed fraud, a felony, moral turpitude, willful misconduct, gross negligence, a breach of fiduciary duty or a material breach of applicable law in its management of the Fund. Additionally, the GP may be removed as General Partner, upon at least sixty days’ notice, by three-fourths (75%) in interest of the Limited
Partners without cause.
Reporting Limited Partners of the Fund will receive annual reports containing audited financial statements of the Fund as well as quarterly reports with relevant updates and unaudited financial statements of the Fund. In addition, Limited Partners will have access to a secure internet site that will act as a
repository for historical financial statements, schedule K-1s, partner capital account statements, capital call notices and other information relevant to Limited Partners.
Valuation Policy Portfolio entities held by the Fund and other assets of the Fund will be valued at the fair market
value as determined by the General Partner under the principles of US Generally Accepted
Accounting Principles and FASB ASC 820. In general, the fair value reported by the managers of the portfolio entities, if any, will be used by the General Partner in making its determination of value. In cases where there is no fund or transaction sponsor valuation available Industry believes that additional valuation adjustments may be warranted, Industry Ventures will determine the valuation using a range of approaches including last round, revenue and EBITDA comparables, transaction price comparables and discounted public market comparables.
Industry Ventures Secondary Fund VIII Secondary Strategy
Confidential Information – For NEPC Client Use Only © Copyright 2016 NEPC, LLC All Rights Reserved 16
Litigation, Regulation and Compliance
Current Litigation According to Industry Ventures, there is no past or pending litigation against the Firm or any of the Firm’s partners or principals.
Compliance Staff and Philosophy Robert May is the Chief Compliance Officer and Chief Operations Officer. Cordium LLC acts as the firm’s outsourced provider of compliance services and is overseen by the CCO. Cordium is a full-
service compliance firm that conducts an annual mock SEC audit as well as ongoing monitoring related to personal trading/dealing monitoring, affirmations, gift and political contribution reporting and more. In addition, Cordium LLC provides on-site compliance training for all employees on an annual basis.
SEC Oversight Since registering with the SEC on March 30, 2012, Industry Ventures has not been subjected to a regulatory exam.
Subject to Other Regulators Industry Ventures is not registered with any other regulatory bodies to which it is subject.
Personal Trading In order to prevent improper trading, avoid the appearance of conflicts of interest, or for other business or legal reasons, Industry Ventures maintains a “Restricted List” of issuers whose securities may not be transacted in by the Funds or in any personal accounts. The CCO will
maintain the Restricted List. The Restricted List is confidential, and no information about the Restricted List may be disclosed to anyone outside of the Firm. All Employees should consult the Restricted List before submitting
any pre-clearance request for the purchase or sale of securities. Generally Employees (and in certain cases the Funds) will not be allowed to trade in securities on the Restricted List. The CCO will review all information to monitor compliance.

Industry Ventures Secondary Fund VIII Secondary Strategy
Confidential Information – For NEPC Client Use Only © Copyright 2016 NEPC, LLC All Rights Reserved 17
Firm Infrastructure
Office Locations All Industry Ventures employees are based in the San Francisco office with the exception of Roland Reynolds (a Managing Director on the Partnership Holdings funds), who is based out of the office near Washington, D.C.
Technology Resources and Systems Investor Reporting is provided by an external fund administrator, Standish Management, using
Standish’s systems. Compliance ELF is the system used to monitor and track personal trading/dealing monitoring, affirmations, gift and political contribution reporting and more. This is overseen by Cordium and CCO Robert May.
Business Continuity Planning Industry Ventures maintains a comprehensive disaster recovery plan that addresses key
personnel contact information, a backup strategy with risk management, emergency response procedures, insurance, and financial and legal issues. Industry Ventures uses BlueRock Networks to provide IT services. BlueRock is familiar with Industry Ventures’ environment and is expected to assist in ongoing maintenance and the recovery process as needed.
Fund Administration/ Back Office Resources Industry Ventures uses Standish Management as the Fund Administrator for all of the Firm’s secondary funds. Standish Management assists with all functional accounting items including cash management, LP reporting, and capital account monitoring under the supervision of the COO/CCO, Robert May.

Industry Ventures Secondary Fund VIII Secondary Strategy
Confidential Information – For NEPC Client Use Only © Copyright 2016 NEPC, LLC All Rights Reserved 18
Firm Track Record
Notes:
$ in millions; data as of 09/30/2015 and provided by Industry Ventures. Secondary I-III returns reflect only secondary fund transactions made after 10/01/2002 when Industry Ventures changed its fund strategy to focus on
secondary venture capital transactions. Full returns for Secondary I-III including direct angel investments were lower. Secondary side funds represent side by side or overflow funds that supplement the capital investing in the main secondary funds. Management fee
and carried interest terms on the side funds are different from the main secondary funds, which partially explain the performance differences between the side funds and the main funds. Main funds have first allocation priority on all deals; side funds do not participate in all deals of the main funds.
Fund-Level Returns
Fund Vintage Year
Capital
Committed
Capital
Funded
Reported
Value
Amount
Distributed
Total Value,
Net of Carry
TVPI
Multiple
DPI
Multiple Current Net IRR
Secondary I-III 2003 $7 $7 $0 $23 $23 3.27x 3.27x 36.6%
Secondary IV 2006 $108 $104 $43 $95 $138 1.33x 0.91x 5.6%
Secondary V 2008 $267 $251 $290 $480 $770 3.07x 1.92x 35.0%
Secondary VI 2011 $405 $351 $275 $190 $465 1.32x 0.54x 13.8%
Secondary VII 2013 $430 $217 $233 $22 $255 1.17x 0.10x 23.5%
Secondary IV Side Funds 2006 $18 $18 $0 $24 $24 1.28x 1.28x 10.3%
Secondary V Side Funds 2008 $9 $9 $0 $22 $22 2.48x 2.48x 69.0%
Secondary VI Side Funds 2011 $157 $91 $58 $67 $125 1.38x 0.74x 14.2%
Secondary VII Side Funds 2013 $202 $0 $0 $0 $0 N/A N/A N/A

Industry Ventures Secondary Fund VIII Secondary Strategy
Confidential Information – For NEPC Client Use Only © Copyright 2016 NEPC, LLC All Rights Reserved 19
Track Record Benchmarking For benchmarking purposes, we compared past fund performance to the Thomson One/Cambridge Associates US Venture Capital Universe as of September 30, 2015.
Thomson One/Cambridge Associates - IRR Comparison
Thomson One/Cambridge Associates - DPI Multiple Comparison
Note: GREEN shaded cells indicate that the fund outperformed the benchmark; RED shaded cells indicate that the fund underperformed the benchmark. Amounts are net of fees, carried interest and expenses. Performance is as of 9/30/2015. Thomson One/Cambridge Associates data is as of 9/30/2015.
Net IRR Industry Ventures Vintage Year Benchmark Net IRR Comparison
Vintage Year Fund Current Net IRR Quartile # Funds
Upper
Quartile Median
Lower
Quartile
2003 Secondary I-III 36.6% 1 40 9.2% 3.5% -5.5%
2006 Secondary IV 5.6% 3 85 12.4% 5.9% -2.5%
2008 Secondary V 35.0% 1 66 20.4% 10.5% -0.5%
2011 Secondary VI 13.8% 3 47 33.7% 18.2% 7.9%
2013 Secondary VII 23.5% 2 49 28.5% 11.6% 0.4%
2006 Secondary IV Side Funds 10.3% 2 85 12.4% 5.9% -2.5%
2008 Secondary V Side Funds 69.0% 1 66 20.4% 10.5% -0.5%
2011 Secondary VI Side Funds 14.2% 3 47 33.7% 18.2% 7.9%
2013 Secondary VII Side Funds N/A N/A 49 28.5% 11.6% 0.4%
DPI Multiple Industry Ventures Vintage Year Benchmark DPI Multiple Comparison
Vintage Year Fund
DPI
Multiple Quartile # Funds
Upper
Quartile Median
Lower
Quartile
2003 Secondary I-III 3.27x 1 40 1.43x 0.80x 0.44x
2006 Secondary IV 0.91x 2 85 0.98x 0.61x 0.30x
2008 Secondary V 1.92x 1 66 0.76x 0.38x 0.13x
2011 Secondary VI 0.54x 1 47 0.21x 0.05x 0.00x
2013 Secondary VII 0.10x 1 49 0.05x 0.00x 0.00x
2006 Secondary IV Side Funds 1.28x 1 85 0.98x 0.61x 0.30x
2008 Secondary V Side Funds 2.48x 1 66 0.76x 0.38x 0.13x
2011 Secondary VI Side Funds 0.74x 1 47 0.21x 0.05x 0.00x
2013 Secondary VII Side Funds N/A N/A 49 0.05x 0.00x 0.00x

Industry Ventures Secondary Fund VIII Secondary Strategy
Confidential Information – For NEPC Client Use Only © Copyright 2016 NEPC, LLC All Rights Reserved 20
Thomson One/Cambridge Associates - TVPI Multiple Comparison
Note: GREEN shaded cells indicate that the fund outperformed the benchmark; RED shaded cells indicate that the fund underperformed the
benchmark. Amounts are net of fees, carried interest and expenses. Performance is as of 9/30/2015. Thomson One/Cambridge Associates data is as of 9/30/2015.
TVPI Multiple Industry Ventures Vintage Year Benchmark TVPI Multiple Comparison
Vintage Year Fund
TVPI
Multiple Quartile # Funds
Upper
Quartile Median
Lower
Quartile
2003 Secondary I-III 3.27x 1 40 1.66x 1.21x 0.73x
2006 Secondary IV 1.33x 3 85 1.78x 1.39x 0.88x
2008 Secondary V 3.07x 1 66 1.86x 1.44x 0.99x
2011 Secondary VI 1.32x 3 47 1.89x 1.51x 1.19x
2013 Secondary VII 1.17x 2 49 1.39x 1.14x 1.00x
2006 Secondary IV Side Funds 1.28x 3 85 1.78x 1.39x 0.88x
2008 Secondary V Side Funds 2.48x 1 66 1.86x 1.44x 0.99x
2011 Secondary VI Side Funds 1.38x 3 47 1.89x 1.51x 1.19x
2013 Secondary VII Side Funds N/A N/A 49 1.39x 1.14x 1.00x

Industry Ventures Secondary Fund VIII Secondary Strategy
Confidential Information – For NEPC Client Use Only © Copyright 2016 NEPC, LLC All Rights Reserved 21
Fund Attribution Analysis Total Value to Paid-In-Capital (TVPI) Deal Frequency Analysis
The chart below shows the individual portfolio investment TVPI multiples for previous Secondary fund deals. The size of the bubbles on the chart indicates the relative size of the equity commitment to a given investment. The gross TVPI multiples on this graph are capped at 4.0x. Some of the investments have generated gross TPVI multiples that were higher than 4.0x.
37% of Deals
>1.0-2.0x TVPI
Multiple
17% of Deals
>2.0-3.0x TVPI
Multiple
10% of Deals
>3.0x TVPI
Multiple
36% of Deals
0.0-1.0x TVPI
Multiple
0.00x
1.00x
2.00x
3.00x
4.00x
2001 2002 2003 2004 2005 2006 2007 2008 2009 2010 2011 2012 2013 2014 2015 2016 2017
Gro
ss T
VP
I M
ult
iple
Initial Investment Date
Investment-Level Gross TVPI Multiple History
Secondary I-III Secondary IV & Side Funds Secondary V & Side Funds Secondary VI & Side Funds Secondary VII & Side Funds
UnderWater
AboveWater

Industry Ventures Secondary Fund VIII Secondary Strategy
Confidential Information – For NEPC Client Use Only © Copyright 2016 NEPC, LLC All Rights Reserved 22
Investment-Level Returns Analysis The chart below shows the investment-level multiple dispersion by number of investments and by cost basis of investments for previous secondary fund investments.
Avg. Multiple: 1.6x
Wtd. Avg. Multiple: 2.0x
Standard Deviation: 1.0x
26% of Cost
Basis Realized
or Held Below
Cost
69% of Cost
Basis Realized
or Held Above
Cost
12%
17%
7%
23%
14%
10%
7%
10%
0%
5%
10%
15%
20%
25%
30%
35%
40%
<= 0.50x 0.51x to
<1.00x
1.00x 1.01x to
1.50x
1.51x to
2.00x
2.01x to
2.50x
2.51x to
3.00x
> 3.00x
Investment-Level
Gross TVPI Multiple Dispersion for Investments, by # of Investments
9%
17%
5%
25%
18%
9%10%
7%
0%
5%
10%
15%
20%
25%
30%
35%
40%
<= 0.50x 0.51x to
<1.00x
1.00x 1.01x to
1.50x
1.51x to
2.00x
2.01x to
2.50x
2.51x to
3.00x
> 3.00x
Investment-Level
Gross TVPI Multiple Dispersion for Investments, by Cost Basis of Investments

Industry Ventures Secondary Fund VIII Secondary Strategy
Confidential Information – For NEPC Client Use Only © Copyright 2016 NEPC, LLC All Rights Reserved 23
Investment Volume Analysis The chart below shows the annual investment volumes and performance for investments of the previous secondary funds.
Investment Number Equity Amount Current Total Wtd. Average Wtd. Average
Status of Capital Distributed Reported Equity Gross Gross
Investments Invested Equity Value Value DPI Multiple TVPI Multiple
2003 10 $7 $19 $0 $19 2.86x 2.86x
2004 9 $1 $5 $0 $5 4.65x 4.65x
2005 3 $3 $4 $0 $5 1.52x 1.68x
2006 30 $45 $63 $4 $67 1.41x 1.50x
2007 16 $55 $62 $10 $72 1.14x 1.32x
2008 16 $75 $100 $34 $134 1.34x 1.80x
2009 20 $69 $110 $36 $147 1.60x 2.12x
2010 19 $109 $362 $284 $646 3.32x 5.93x
2011 17 $149 $120 $109 $229 0.81x 1.54x
2012 22 $181 $172 $109 $282 0.95x 1.55x
2013 21 $128 $34 $160 $194 0.26x 1.51x
2014 26 $95 $3 $123 $127 0.04x 1.33x
2015 28 $109 $0 $120 $120 0.00x 1.10x
Total 237 $1,026 $1,057 $990 $2,047 1.03x 2.00x
0.0x
1.0x
2.0x
3.0x
4.0x
5.0x
6.0x
7.0x
2003 2004 2005 2006 2007 2008 2009 2010 2011 2012 2013 2014 2015
Gross DPI and TVPI Multiples by Investment year
DPI Multiple TVPI Multiple
$0
$20
$40
$60
$80
$100
$120
$140
$160
$180
$200
2003 2005 2007 2009 2011 2013 2015
Yearly Investment Volume

Industry Ventures Secondary Fund VIII Secondary Strategy
Confidential Information – For NEPC Client Use Only © Copyright 2016 NEPC, LLC All Rights Reserved 24
Investment Realization Analysis The chart below shows DPI and TVPI multiples for all realized, partially realized, and unrealized deals in previous secondary funds.
Gross DPI and TVPI Multiples Invested Capital Split
Investment Number Equity Amount Current Total Wtd. Average Wtd. Average
Status of Capital Distributed Reported Equity Gross Gross
Investments Invested Equity Value Value DPI Multiple TVPI Multiple
Realized 82 $263 $695 $3 $698 2.64x 2.65x
Partially Realized 63 $306 $361 $435 $797 1.18x 2.60x
Unrealized 92 $456 $0 $552 $552 0.00x 1.21x
Total 237 $1,026 $1,057 $990 $2,047 1.03x 2.00x
Invested Capital by Year (%)
2.64x
1.18x
0.00x
2.65x 2.60x
1.21x
0.00x
0.50x
1.00x
1.50x
2.00x
2.50x
3.00x
Realized Partially Realized Unrealized
DPI Multiple TVPI Multiple
Realized
26%
Partially
Realized
30%
Unrealized
44%
Realized Partially Realized Unrealized
0%
20%
40%
60%
80%
100%
2005 2006 2007 2008 2009 2010 2011 2012 2013 2014 2015 2016
Eq
uit
y C
ap
ita
l In
ve
ste
d
Realized Partially Realized Unrealized

Industry Ventures Secondary Fund VIII Secondary Strategy
Confidential Information – For NEPC Client Use Only © Copyright 2016 NEPC, LLC All Rights Reserved 25
Investment Sourcing Analysis The chart below shows DPI and TVPI multiples grouped by the individual who sourced each secondary transaction in the previous funds.
Gross DPI and TVPI Multiples Invested Capital Split
Deal Sourcing Number Equity Amount Current Total Wtd. Average Wtd. Average
Channel of Capital Distributed Reported Equity Gross Gross
Investments Invested Equity Value Value DPI Multiple TVPI Multiple
Hans Swildens 125 $467 $524 $569 $1,093 1.12x 2.34x
Justin Burden 54 $243 $296 $163 $459 1.22x 1.89x
Victor Hwang 34 $167 $75 $172 $247 0.45x 1.48x
Will Quist (Departed) 9 $71 $14 $66 $80 0.19x 1.12x
Other 15 $78 $148 $20 $169 1.91x 2.17x
Total 237 $1,026 $1,057 $990 $2,047 1.03x 2.00x
Invested Capital by Year
1.12x 1.22x
0.45x
0.19x
1.91x
2.34x
1.89x
1.48x
1.12x
2.17x
0.00x
0.50x
1.00x
1.50x
2.00x
2.50x
Hans Swildens Justin Burden Victor Hwang Will Quist (Departed) Other
DPI Multiple TVPI Multiple
Hans Swildens
45%
Justin Burden
24%
Victor Hwang
16%
Will Quist
(Departed)
7%
Other
8%
Hans Swildens Justin Burden Victor Hwang
Will Quist (Departed) Other
0%
20%
40%
60%
80%
100%
2005 2006 2007 2008 2009 2010 2011 2012 2013 2014 2015 2016
Eq
uit
y C
ap
ita
l In
ve
ste
d
Hans Swildens Justin Burden Victor Hwang Will Quist (Departed) Other

Industry Ventures Secondary Fund VIII Secondary Strategy
Confidential Information – For NEPC Client Use Only © Copyright 2016 NEPC, LLC All Rights Reserved 26
Investment Type Analysis The chart below shows DPI and TVPI multiples for all direct deals and purchases of LP interests in previous secondary funds.
Gross DPI and TVPI Multiples Invested Capital Split
Investment Number Equity Amount Current Total Wtd. Average Wtd. Average
Strategy of Capital Distributed Reported Equity Gross Gross
Investments Invested Equity Value Value DPI Multiple TVPI Multiple
Direct 169 $731 $771 $523 $1,294 1.05x 1.77x
LP Interest 68 $294 $285 $468 $753 0.97x 2.56x
Total 237 $1,026 $1,057 $990 $2,047 1.03x 2.00x
Invested Capital by Year
Direct
71%
LP Interest
29%
Direct LP Interest
1.05x 0.97x
1.77x
2.56x
0.00x
0.50x
1.00x
1.50x
2.00x
2.50x
3.00x
Direct LP Interest
DPI Multiple TVPI Multiple
0%
20%
40%
60%
80%
100%
2005 2006 2007 2008 2009 2010 2011 2012 2013 2014 2015 2016
Eq
uit
y C
ap
ita
l In
ve
ste
d
Direct LP Interest

Industry Ventures Secondary Fund VIII Secondary Strategy
Confidential Information – For NEPC Client Use Only © Copyright 2016 NEPC, LLC All Rights Reserved 27
Key Fund Professionals
Detailed Biographies
Hans Swildens, Founder, Managing Director & CEO Mr. Swildens is the founder of Industry Ventures and a Managing Director responsible for the origination and execution of investment opportunities for the Firm. Additionally, he directs the Firm’s investment processes, operations and limited partner relationships. Prior to founding
Industry Ventures, Mr. Swildens was the Co-Founder and President of Microline Software. Microline was acquired by Blaze Software, which was subsequently acquired by Fair Isaac. Mr. Swildens was also an advisor to the founders of Speedera Networks (acquired by Akamai), where he completed Industry Ventures’ first secondary investment and debt restructuring transaction.
Mr. Swildens holds an MBA from Columbia Business School and a BA with distinction from the University of California at Santa Barbara. Justin Burden, Managing Director
Mr. Burden concentrates on originating, valuing, and managing investment opportunities in secondary venture portfolios and serves on the Fund VIII investment committee. Since joining Industry Ventures in 2004, Justin has sourced and led the acquisition of over twenty-five
secondary transactions in both secondary directs and limited partnership interests. Previously he worked at GE Equity in San Francisco, the $4 billion venture capital arm of the General Electric Company where he sourced, structured and managed investments in the technology, consumer, media, and telecom sectors. Prior to GE Equity, Justin worked at Wells Fargo’s high yield fund purchasing debt securities in buyout transactions. Mr. Burden holds a BA from University of California, Berkeley and an MS from the London
School of Economics. Victor Hwang, Managing Director Mr. Hwang concentrates on originating, valuing and managing secondary direct investment opportunities in venture backed technology companies and serves on the Fund VIII investment
committee. Prior to joining Industry Ventures, Mr. Hwang was the founder and Managing
Partner of Agile Capital Partners, where he has focused on opportunistic investments in growth oriented technology companies. He successfully invested in and exited StepUp Commerce (sold to Intuit) and Simple Star (sold to Sonic Solutions). Prior to founding Agile Capital Partners, Mr. Hwang was an early, pre-IPO member of Internet Capital Group (ICG) and he was CEO and Vice Chairman of ICG Asia, based in Hong Kong. Mr. Hwang began his career as an investment banker at Goldman Sachs where he helped build its Internet investment banking business by leading the IPOs for eBay, GeoCities and Yahoo!.
Mr. Hwang received his BA from Stanford University and his MBA from the Stanford Graduate School of Business, where he was an Arjay Miller scholar.
Name Title Years with Firm Years of PE Experience
Hans Swildens Managing Director & CEO 15 19
Justin Burden Managing Director 12 16
Victor Hwang Managing Director 6 26
Robert May COO & CCO 5 17
Lindsay Sharma Vice President 2 5
Ira Simkhovitch Vice President 2 7
Amir Malayery Vice President <1 7

Industry Ventures Secondary Fund VIII Secondary Strategy
Confidential Information – For NEPC Client Use Only © Copyright 2016 NEPC, LLC All Rights Reserved 28
Robert May, Chief Operating Officer and Chief Compliance Officer Mr. May is the Chief Operating Officer and Chief Compliance Officer for Industry Ventures. As the COO and CCO, Mr. May is responsible for all of the financial, compliance, and operational aspects of Industry Ventures. Prior to joining Industry Ventures, Mr. May worked as a consultant for Standish Management and led the Palo Alto office. Prior to that, Mr. May was the COO and CFO for Founders Fund and also spent four years as the CFO of Thomas Weisel
Venture Partners. Mr. May graduated with honors from San Jose State University with a BS in Business Administration. Lindsay Sharma, Vice President Ms. Sharma focuses on originating, valuing and heling to manage the Firm’s secondary
investments. Prior to Industry Ventures, Ms. Sharma was a Principal in corporate strategy and development at Intuit, leading merger and acquisition activities for the company. Previously,
Ms. Sharma was one of twenty one investment professionals with Great Hill Partners, a Boston-based growth equity firm focused on tech-enabled business services investing. She began her career in investment banking with the Technology, Media and Telecommunications team at Bear Stearns in New York.
Ms. Sharma received her MBA from Harvard Business School and her BS in finance and accounting from Indiana University, graduating with high distinction.
Ira Simkhovitch, Vice President Mr. Simkhovitch focuses on originating, valuing and helping to manage the Firm’s secondary
investments. Prior to Industry Ventures, Mr. Simkhovitch worked on the Investment Team at The Carlyle Group/AlpInvest Partners where he committed capital to private equity and venture capital funds. Previously, Mr. Simkhovitch was a Senior Analyst at Commonfund Capital, investing in private equity funds, secondary investments and direct investments globally. Mr. Simkhovitch began his career at Booz Allen Hamilton on a team developing
software and analytics for the Department of Defense.
Mr. Simkhovitch received a BS in Civil Engineering from MIT and his MBA from Columbia Business School, where he graduated with Dean’s Honors. Ira is a CFA Charterholder.
Amir Malayery, Vice President
Mr. Malayery focuses on originating, valuing and helping to manage the Firm’s secondary investments. Prior to Industry Ventures, Mr. Malayery was Founder and CEO of Dapper Shopping, a mobile commerce startup focused on menswear. Previously, Mr. Malayery was an investment professional at Summit Partners, a growth equity firm where he focused on internet, media and technology investments. Mr. Malayery received his MBA from Harvard Business School and dual MA/BA degrees from
Stanford University.

Industry Ventures Secondary Fund VIII Secondary Strategy
Confidential Information – For NEPC Client Use Only © Copyright 2016 NEPC, LLC All Rights Reserved 29
Disclaimers and Disclosures
Past performance is no guarantee of future results.
The opinions presented herein represent the good faith views of NEPC as of the date of
this report and are subject to change at any time.
Information used to prepare this report was obtained directly from the investment
manager, and market index data was provided by other external sources. While NEPC
has exercised reasonable professional care in preparing this report, we cannot
guarantee the accuracy of all source information contained within.
This report may contain confidential or proprietary information and may not be copied
or redistributed to any party not legally entitled to receive it.
In addition, it is important that investors understand the following characteristics of non-
traditional investment strategies including hedge funds, real estate and private equity:
1. Performance can be volatile and investors could lose all or a substantial portion of their
investment
2. Leverage and other speculative practices may increase the risk of loss
3. Past performance may be revised due to the revaluation of investments
4. These investments can be illiquid, and investors may be subject to lock-ups or lengthy
redemption terms
5. A secondary market may not be available for all funds, and any sales that occur may
take place at a discount to value
6. These funds are not subject to the same regulatory requirements as registered
investment vehicles
7. Managers may not be required to provide periodic pricing or valuation information to
investors
8. These funds may have complex tax structures and delays in distributing important tax
information
9. These funds often charge high fees
10. Investment agreements often give the manager authority to trade in securities,
markets or currencies that are not within the manager’s realm of expertise or
contemplated investment strategy

[Type text]
NEPC Private Markets Investment Due Diligence Research Report
Industry Ventures Industry Ventures Partnership Holdings IV
Report written by the NEPC Private Markets Team as of March 2016. Product Rating: Preferred

Industry Ventures Partnership Holdings IV Venture Capital Strategy
Confidential Information – For NEPC Client Use Only © Copyright 2015 NEPC, LLC All Rights Reserved 1
Table of Contents
Executive Summary ............................................................................................................. 3 Fund Characteristics ............................................................................................................ 5
Firm Description .................................................................................................................. 6 Firm Overview .................................................................................................................. 6 Team Overview ................................................................................................................. 6 Recent Turnover/ Key Departures ........................................................................................ 6 Succession Planning .......................................................................................................... 6
Fund Investment Strategy ................................................................................................... 7 Investment Strategy .......................................................................................................... 7 Target Return ................................................................................................................... 7 Target Fund Size ............................................................................................................... 7 Target Investment Type ..................................................................................................... 7 Target Geographic Focus .................................................................................................... 7 Target Deal Size ................................................................................................................ 7 Use of Leverage ................................................................................................................ 8 Recycling of Capital ........................................................................................................... 8 Manager’s View of Current Market Conditions ........................................................................ 8 Expected Fund Investor Base .............................................................................................. 8 Current Fund Investments .................................................................................................. 8 Example of a Prior Investment ............................................................................................ 8
Fund Investment Process .................................................................................................. 10 Deal Sourcing ................................................................................................................. 10 Investment Process ......................................................................................................... 10 Value Creation ................................................................................................................ 11 Risk Mitigation ................................................................................................................ 11
Fund Economics ................................................................................................................ 12 Management Fee ............................................................................................................. 12 Distribution Waterfall ....................................................................................................... 12 Allocation of Carried Interest ............................................................................................. 12 Other Fees and Expenses ................................................................................................. 12
Fund Administration, Structure and Policies ...................................................................... 13 Fund Structure ................................................................................................................ 13 ERISA Provisions ............................................................................................................. 13 UBTI Considerations ........................................................................................................ 13 Environmental, Social & Governance Disclosures .................................................................. 13 Labor Policy .................................................................................................................... 13 Key Person Provision ....................................................................................................... 13 GP Removal Provisions ..................................................................................................... 14 Reporting ....................................................................................................................... 14 Valuation Policy............................................................................................................... 14
Litigation, Regulation and Compliance .............................................................................. 15 Current Litigation ............................................................................................................ 15 Compliance Staff and Philosophy ....................................................................................... 15 SEC Oversight ................................................................................................................ 15 Subject to Other Regulators .............................................................................................. 15 Personal Trading ............................................................................................................. 15
Firm Infrastructure ........................................................................................................... 16 Office Locations .............................................................................................................. 16 Technology Resources and Systems ................................................................................... 16 Business Continuity Planning ............................................................................................. 16

Industry Ventures Partnership Holdings IV Venture Capital Strategy
Confidential Information – For NEPC Client Use Only © Copyright 2015 NEPC, LLC All Rights Reserved 2
Fund Administration/ Back Office Resources ........................................................................ 16 Firm Track Record ............................................................................................................. 17
Track Record Benchmarking .............................................................................................. 18 Fund Attribution Analysis .................................................................................................. 19
Key Fund Professionals ..................................................................................................... 23 Detailed Biographies ........................................................................................................ 23
Disclaimers and Disclosures .............................................................................................. 24

Industry Ventures Partnership Holdings IV Venture Capital Strategy
Confidential Information – For NEPC Client Use Only © Copyright 2015 NEPC, LLC All Rights Reserved 3
Executive Summary Industry Ventures (the “Firm”) was founded by Hans Swildens in 2000 to make venture capital investments in early stage information technology companies. Mr. Swildens soon recognized an investment opportunity existed for a specialized secondary strategy that focused on venture-backed companies and assembled a team to focus on these efforts. In 2009, the Firm acquired Little Hawk Capital (“Little Hawk”), a Washington D.C. based fund-of-funds platform founded by Roland Reynolds focused on making commitments to small, top-performing venture capital funds. Little Hawk committed to an Industry Ventures Secondaries fund, and the two firms soon recognized the merits of combining the Little Hawk fund-of-funds program with a secondary component. Subsequently, the two firms merged. The merging of the two firms broadened the knowledge base of Industry Ventures and has been additive for both strategies. Today, the Firm has 18 investment team members operating out of offices in San Francisco, CA and Washington D.C. Industry Ventures is raising Industry Ventures Partnership Holdings IV, L.P. (the “Fund” or “IVPH IV”) and is seeking $200 million in commitments. IVPH IV will be a hybrid fund structure, consisting of direct and indirect investments in early and mid-stage venture-backed companies primarily in the information technology sector. The Fund will purchase early secondary limited partnership interests (i.e., interests less than 50% funded) while also targeting primary commitments in high performing small funds that are typically between $25 million and $150 million in size. The Fund will also make direct investments in operating companies typically with at least $5M-$10M in revenues that are generally outperforming expectations. The Fund is targeting a net multiple of 2.5x and a net 20%-25% internal rate of return. Investors in IVPH IV should benefit from the following positives:
Strong Track Record – Prior Partnership Holdings funds have shown strong performance
across most metrics. IVPH III has earned top quartile performance on an IRR, TVPI and DPI basis. IVPH II has produced top quartile performance on an IRR and TVPI basis and is currently in the second quartile on a DPI basis but with value that has yet to be realized. Fund I is the weakest performer in the Partnership Holdings line of funds with second and third quartile performance.
Experienced Team –The senior Partnership Holdings team has been investing together
since the merger with Little Hawk in 2009. Individually, Mr. Swildens’ experience dates back to 2000 with the founding of Industry Ventures. He also worked in the IT industry in the 1990s prior to founding the Firm. Mr. Reynolds experience dates back 15 years to his time at Columbia Capital, Kitty Hawk and now Industry Ventures. The third Managing Director, Ken Wallace, has worked as a venture capitalist for 11 years with the past eight years in his role at Industry Ventures.
Diversified Portfolio Construction – When constructing the Partnership Holdings
portfolio, the Firm will focus on investing in small venture capital funds and high growth companies as the team believes these are attractive opportunities within the venture industry. The Fund will also include investments into mid-stage companies acquired through early secondary purchases, special purpose funds and direct investments. This portfolio construction strategy is differentiated from traditional venture investing and should provide investors early liquidity and thus a mitigated J-curve.
Sourcing Network – The Industry Ventures platform provides a key advantage in
sourcing, evaluating and selecting fund managers and direct investments. Combined, the previous Industry Ventures funds have committed to more than 215 venture capital limited partnerships, and the Firm has cultivated relationships with the managers of these funds and others over the past 15 years. As a result, IVPH IV should continue to gain access to select high-performing funds and other select direct opportunities that are typically unavailable to new investors. Additionally, the bi-coastal presence of the team continues to help extend the breadth of the Firm’s network.

Industry Ventures Partnership Holdings IV Venture Capital Strategy
Confidential Information – For NEPC Client Use Only © Copyright 2015 NEPC, LLC All Rights Reserved 4
Investors in IVPH IV should be aware of the following negatives:
Small Team – Although small teams are not uncommon in venture capital, the senior investment team managing the Fund consists only of Roland Reynolds, Ken Wallace and Hans Swildens. Mr. Reynolds and Mr. Wallace are dedicated full-time to the Partnership Holdings strategy along with one investment analyst. Mr. Swildens splits time between the Partnership Holdings line of funds, the Industry Ventures Secondary line of funds, and managing the business.
Market Environment – Venture capital pre-money valuations across the various stages have increased dramatically over the past 5-7 years. Navigating in a rich valuation environment with massive liquidity chasing deals could pose a challenge to the team’s ability to produce similar returns to those experienced in previous Partnership Holdings funds. However, in Q4 2015 and Q1 2016, a dearth of venture-backed IPOs coupled with falling valuations has coalesced to make for an interesting opportunity to invest in the space.
Inherent Risk in Early-Stage Venture Capital – IVPH IV will be investing in early - stage venture-backed companies through primary fund commitments. Early-stage venture companies are generally fraught with business execution and technology risks, among others, resulting in high failure rates within the industry. Although IVPH IV targets these segments of the market, the Fund’s diversification strategy should mitigate some of the concerns around portfolio company failures significantly impacting the Fund.
Lack of a Full Fund Liquidation – Although earlier Partnership Holdings funds have attractive performance relative to other venture capital funds, IVPH I still has only returned 42% of called capital eight years into the fund life, with no deals being fully realized across IVPH I and only one full realization across all IVPH funds. Full liquidation and completion of a Partnership Holdings fund has yet to be achieved and the timing of the deal realizations and resulting fund liquidation could have a negative impact on investors’ final return numbers.

Industry Ventures Partnership Holdings IV Venture Capital Strategy
Confidential Information – For NEPC Client Use Only © Copyright 2015 NEPC, LLC All Rights Reserved 5
Fund Characteristics Investment Vehicle Delaware Limited Partnership Investment Manager Industry Ventures Partnership Holdings Target Size/Max Size $200 million/$250 million Amount Raised $180 million Minimum Investment Size $5 million, subject to waiver by the General Partner (“GP”) Target Final Close Date Q2 2016 Investment Period Four years after the latter of the initial capital contribution date or the final
close. Fund Term 10 years from final closing, with two one-year extensions at GP discretion. Sponsor’s Investment The lesser of 2% or $4 million Assets Under Management $2 billion Investment Focus Primary and secondary investments in small venture capital funds with an
allocation to direct investments and co-investments. Geographic Focus US focused Projected Number of Investments
10-15 primary investments, 10-20 secondary and/or Special Purpose Fund (“SPF”) investments, 15-20 direct company investments
Deal Size $2.5 million to $20 million for primary and secondary commitments $1 million to $4 million for directs/co-investments
Target Fund Return IVPH IV will target a net multiple of 2.5x and a net 20%-25% internal rate of return
Leverage The Fund will not utilize fund-level leverage. The Firm has a working capital line of credit used for capital calls.
Annual Management Fee Years 1-7: 1.0% of committed capital; Thereafter: management fee rate is 95% of the prior year’s rate applied to the aggregate capital contributions
Other Fees N/A
Organizational Costs The Fund will bear up to of $750,000 of organizational expenses. Carried Interest 5% on primary investments
10% on secondaries and special purpose fund investments 20% on directs/co-investments
Preferred Return 6% compounded annually
Distribution Waterfall First, 100% to LPs until they have received a full return of capital and a 6% preferred return on all investments in the Fund;
Then, 100% to the GP as carried interest catch up; Thereafter, split pro-rata according to carried interest percentages for
the underlying asset types. ERISA Fiduciary Industry Ventures does not operate as an ERISA fiduciary. Industry Ventures
has ERISA investors in prior funds and may have ERISA investors in IVPH IV, but under all circumstances they will be limited to less than 25% of fund commitments.
Fund Auditor Ernst & Young
Fund Legal Counsel Cooley LLP
Placement Agents N/A
Website www.industryventures.com

Industry Ventures Partnership Holdings IV Venture Capital Strategy
Confidential Information – For NEPC Client Use Only © Copyright 2015 NEPC, LLC All Rights Reserved 6
Firm Description Firm Overview Industry Ventures was founded by Hans Swildens in 2000 to make venture capital investments in early stage information technology companies. In 2002, Industry Ventures purchased an interest in Speedera Networks from a public corporation. With this transaction, Mr. Swildens recognized an investment opportunity existed for a specialized secondary strategy that focused on venture backed companies. To implement the investment strategy, Mr. Swildens assembled a team with venture capital investment experience to establish the Firm’s secondary investment efforts. In 2009, the Firm acquired Little Hawk Capital (“Little Hawk”), a Washington D.C. based fund-of-funds platform founded by Roland Reynolds that focused on making commitments to small, top-performing venture capital funds. Little Hawk committed to an Industry Ventures Secondaries fund and the two firms soon recognized the merits of combining the Little Hawk fund-of-funds program with a secondary component. Subsequently, the two firms merged. Today, the Firm has 18 employees operating out of offices in San Francisco and Washington D.C. that are focused on two venture capital fund offerings: Industry Ventures Secondary Funds and Industry Ventures Partnership Holdings. With investments in over 215 venture capital limited partnerships and 110 direct company investments, the Firm maintains one of the most comprehensive databases of venture capital limited partnership data and portfolio company performance data. Industry Ventures now manages approximately $2.0 billion in commitments between the two strategies. Team Overview The Industry Ventures team consists of 12 investment professionals. The Firm’s three Managing Directors, Roland Reynolds, Hans Swildens and Ken Wallace, will be the investment professionals managing the Fund. They are supported by COO Robert May, investment analyst Brian Langner, and other administrative and operations support personnel. The IVPH investment professionals also have the ability to leverage the broader Industry Ventures secondary team for sourcing and investment analysis. Recent Turnover/ Key Departures There has been one departure at the senior level in the past five years. Mike Gridley, Managing Director, left the firm in January 2013 to pursue other opportunities. NEPC was also recently notified that discussions are under way with a junior partner at the Firm regarding a potential amicable transition out of Industry Ventures. As this team member has no explicit duties with regard to the Partnership Holdings funds, the proposed transition is expected to have little to no effect on the performance of IVPH IV. Succession Planning The Industry Ventures organization is composed entirely of professionals that work on a team basis and are in their 30s and 40s, so a formal succession plan is not currently in place. None of the current Managing Directors expect to retire any time soon. The management company is owned by a Trust which has a process for succession in the event of the death of the Trustees.

Industry Ventures Partnership Holdings IV Venture Capital Strategy
Confidential Information – For NEPC Client Use Only © Copyright 2015 NEPC, LLC All Rights Reserved 7
Fund Investment Strategy Investment Strategy Industry Ventures intends to continue the same investment strategy for IVPH IV as the prior Partnership Holdings funds. Industry Ventures believes that the Fund will provide a diversified, systematic, multi-year investment program that concentrates capital in early and mid-stage venture capital companies while providing early liquidity and J-curve mitigation to investors through the inclusion of secondary LP purchases, special purpose funds and direct investments. The Firm intends to target approximately 40% of the Fund’s investments in primary commitments to smaller, early stage venture capital funds that are approximately $25 million to $250 million in size. These primary commitments will provide broad exposure to venture companies while also enhancing the Firm’s knowledge of, and relationships in, the industry. The Firm also believes that primary commitments provide the impetus and incentive for general partners to facilitate secondary transactions in prior funds and investments in existing portfolio companies. IVPH IV will invest in 10-15 venture capital fund managers with a goal of diversifying investments across: i) sectors such as information technology, healthcare IT, and communications; ii) stages, including seed, early and growth; and iii) three vintage years. The Firm will also target approximately 40% of the Fund’s investments (10-20 transactions) in a mix of secondary purchases of limited partnership stakes that are less than 50% funded and special purpose funds that aim to capitalize on excess pro-rata rights. Industry Ventures believes that the special purpose funds and secondary interests can provide early liquidity to investors due to the mid-stage assets being acquired, helping to mitigate venture capital J-curve concerns from potential LPs. Finally, the Firm intends to target approximately 20% of the Fund for investment into 15-20 direct venture investments. The team believes these direct investments will serve to further shorten the J-curve and accelerate liquidity for investors. The three sleeves of the Fund are designed to be complementary to one another in building an atypical venture portfolio. The three sleeves, once filled, provide not only diversification but also a different return profile for investors when compared to classic venture capital funds. Target Return The team is targeting net annualized returns of 20-25% and a 2.5x-3.0x net multiple on contributed capital. Target Fund Size The Firm is targeting $200 million in commitments for IVPH IV. Target Investment Type Industry Ventures intends to invest approximately 40% of the Fund into small, early stage venture capital funds. The Firm expects to invest approximately 40% of the Fund into special purpose funds and secondary commitments that are less than 50% funded, with the final 20% of the Fund targeted for direct investments into venture companies. Target Geographic Focus IVPH IV will focus on venture capital opportunities that are mainly domiciled in the United States. The team expects that at least 80% of investments made will be in North America. Target Deal Size The team anticipates the typical deal size for primary and secondary commitments to be between $2.5 million and $20 million, with investments in the range of $1 million to $4 million for directs/co-investments.

Industry Ventures Partnership Holdings IV Venture Capital Strategy
Confidential Information – For NEPC Client Use Only © Copyright 2015 NEPC, LLC All Rights Reserved 8
Use of Leverage The Fund does not have a formal leverage exposure policy and to date has not utilized leverage as part of the investment strategy. The Firm has a line of credit that is used for bridging capital calls and was recently renewed with First Republic Bank. Recycling of Capital IVPH IV may recycle capital provided that the aggregate cost basis of the Fund’s investments does not exceed 120% of the aggregate Fund subscriptions. Manager’s View of Current Market Conditions Industry Ventures believes the current environment for venture capital remains attractive, particularly for investors in the early and mid-stage companies that IVPH IV is targeting. Venture capital investors have experienced strong cash distributions over the past several years fueled by strong M&A activity and a large number of IPOs in 2014. Despite the recently healthy IPO market, the Firm has recognized the shift in the type of venture-backed exits from one that has historically been IPO-centric to one that is now driven by M&A activity. With an emphasis on small investments in early and mid-stage companies with low entry valuations and high ownership positions, the Firm believes that small funds can still produce attractive returns from more modest M&A exits with the potential for a small number of “home runs” to help drive outsized returns. The Firm also believes that as later stage, venture-backed companies grow larger and valuations become increasingly robust, IVPH investments should benefit from this dynamic as the IVPH portfolio companies grow larger and eventually blossom into attractive targets for later stage companies and investors. Expected Fund Investor Base IVPH IV is expected to have a similar breakdown of investors by type as those seen in IVPH III. The breakdown of investor type for IVPH III is as follows:
High net worth individuals: 7% Private Funds: 4% Pension plans (excluding government pension plans): 2% State or municipal governmental pension plans: 68% Other: 19%
Current Fund Investments To date, the fund has committed just over $25mm to six small venture funds and one SPV. Example of a Prior Investment Partnership Holdings recently invested $6.2M into Fastly, a next generation internet Content Delivery Network ("CDN"), which offers superior performance and a better end-user experience than traditional CDN's. A content delivery network is a system of distributed servers that deliver webpages and other Web content to a user based on the geographic locations of the user, the origin of the webpage and a content delivery server. The investment was funded via a Special Purpose Fund ("SPF") that Partnership Holdings formed with two venture capital managers, leveraging the managers’ pro-rata participation rights. Iconiq Capital, a Silicon Valley venture capital firm, recently led a $75 million Series D financing. Three existing Industry Ventures managers each separately reached out to Industry Ventures to recommend the pro-rata rights investment into the Series D for Fastly. The managers all felt that this was a compelling opportunity to invest in what is expected to be the last round of a hyper-growth company that is displacing legacy CDN providers. An IVPH III manager, OATV, seeded the company in 2011 alongside Battery Ventures. August Capital led the Series B in 2013 and IDG Ventures led the Series C in 2014. All of these Industry Ventures managers had reserved capital to invest in follow-on rounds, but due to the size of the

Industry Ventures Partnership Holdings IV Venture Capital Strategy
Confidential Information – For NEPC Client Use Only © Copyright 2015 NEPC, LLC All Rights Reserved 9
allocation available to insiders, OATV and Amplify did not have capacity to exercise all of their pro-rata rights. Partnership Holdings subsequently invested $3.4 million via a previously established SPF with OATV and $2.8 million via an SPF with Amplify. Neither vehicle is subject to a management fee. Both vehicles are subject to carried interest of 15% after a return of contributions. The OATV SPF is also cross-collateralized with a prior investment in 3D Robotics, providing some carried interest protection if one investment performs poorly. With this preferred equity investment, if the company performs as expected Partnership Holdings believes the investment will produce a 2x multiple on invested capital for investors.

Industry Ventures Partnership Holdings IV Venture Capital Strategy
Confidential Information – For NEPC Client Use Only © Copyright 2015 NEPC, LLC All Rights Reserved 10
Fund Investment Process Deal Sourcing The Firm believes that the Industry Ventures platform provides a key advantage in sourcing, evaluating and selecting fund managers due to its exclusive focus on venture capital, its prior commitments, its deep relationships, and its bi-coastal presence. Across Industry Ventures funds, the Firm has committed to more than 215 limited partnerships and developed relationships with these managers over the past 15 years. The Firm believes that it is considered a valuable limited partner due to the breadth of its capabilities to assist general partners over the lifecycle of a fund through unique deal structuring capabilities. As a result, the team anticipates that IVPH IV will enjoy access to select high-performing funds that are typically closed to new investors. Industry Ventures is also one of the few institutional investors with a focus on purchasing limited partnership interests that are less than 50% funded. As a result, the Firm anticipates that the Fund should continue to have a wealth of proprietary secondary LP opportunities from which to select. Many traditional secondary firms target near or fully-funded interests because of the relative ease in identifying and pricing the assets. Early secondary purchases generally require a portfolio fund manager analysis as well as direct company analyses. These two different activities involve a different skill set and level of due diligence that the Firm believes traditional secondary or fund-of-funds investors typically will not possess or pursue. Investment Process Industry Ventures has developed a detailed and proven investment process. The process begins with gathering information on 300-400 venture capital firms, further screening to a universe of 250-300 partnerships, in-person meetings and conference calls with 150-200, deep due diligence on 75-100 firms and ultimately investing in and monitoring approximately 15-20 of these firms. Direct co-invest, special purpose fund and early secondary due diligence typically involves leveraging the sector expertise from the Industry Ventures secondary investment team and the Firm’s proprietary database of venture-backed company information. At each step in the process, there are a number of specific activities and output documents that are created to record the knowledge acquired at each phase. The due diligence efforts culminate in a comprehensive investment memorandum that details the investment rationale and the supporting information discovered in the diligence process. This investment memorandum is reviewed and discussed by the members of the Fund’s three-person Investment Committee. The Investment Committee collectively determines to approve or reject investment opportunities for the Fund. The Investment Committee will be responsible for all final investment decisions following the performance of more extensive due diligence and preparation of a detailed investment memorandum. After the Fund’s commitments are made, the team will actively monitor the portfolio, continue to meet with the portfolio fund managers, manage capital calls and distributions, and report quarterly to the Fund’s LPs. Industry Ventures seeks to cultivate relationships with prospective portfolio fund managers over several years. Industry Ventures generally meets with managers and builds relationships when these funds are not raising capital. The Firm prefers not to meet new fund managers for the first time when they are in the market raising capital. The investment process is predicated on the three Ts:
• Thorough – multiple meetings in fund managers’ offices with entire investment teams; reference calls augment years of relationship cultivation
• Timely – Industry Ventures’ industry contacts, asset class specialization and lack of bureaucracy ensures timely decisions without compromising a rigorous process
• Transparent – the “GP ScoreCard” ensures that both Fund investors and portfolio fund managers have an understanding of Industry Ventures’ evaluation methodology
The GP ScoreCard, Industry Ventures’ proprietary manager evaluation methodology, is a key tool utilized in the investment process. This methodology has been developed based on the team’s

Industry Ventures Partnership Holdings IV Venture Capital Strategy
Confidential Information – For NEPC Client Use Only © Copyright 2015 NEPC, LLC All Rights Reserved 11
venture expertise and the industry network the team has developed. The objective of designing and implementing the GP ScoreCard is to resist “gut feel” decisions about portfolio fund managers based on an inconsistent or less rigorous process. The GP ScoreCard measures partnerships along three basic categories: people, firm, and sector. Each category carries a relative weight based on importance—all adding up to 100%. In this way, Industry Ventures can quantify the manager evaluation process and compare across firms in an objective and consistent manner. Industry Ventures believes this methodology provides a distinct competitive advantage that will enable the Fund to achieve superior investment returns through unparalleled manager selection. Value Creation The team believes that the Industry Ventures platform provides a key advantage in sourcing, evaluating and selecting fund managers given the Firm’s exclusive focus on venture capital, its list of prior commitments leading to deep relationships, and its bi-coastal presence. These advantages lead to a source of value creation for investors. The Firm believes that it is considered a valuable limited partner to GPs due to the breadth of Industry Ventures capabilities to assist GPs over the life of a fund through unique deal-structuring capabilities. As a result of being considered a value-add LP by venture fund managers, the Firm anticipates that IVPH IV will enjoy access to select high-performing managers and funds that are typically closed to new investors. As a result of this limited competition, the Firm anticipates that IVPH IV will have a wealth of proprietary primary and secondary opportunities from which to select. Risk Mitigation The Firm believes that diversification is central to risk mitigation and thus will diversify the portfolio as outlined in the preceding paragraphs. IVPH IV will also seek to provide downside protection through the purchase of secondary interests at discounts. The Fund will further mitigate risk through the use of special purpose funds and direct investing to fund mid-stage companies that should have a lower failure rate and shorter time to liquidity than early stage companies.

Industry Ventures Partnership Holdings IV Venture Capital Strategy
Confidential Information – For NEPC Client Use Only © Copyright 2015 NEPC, LLC All Rights Reserved 12
Fund Economics Management Fee The investors will pay an annual management fee of 1.0% on committed capital until the seventh anniversary of the initial close. After the seventh anniversary, investors will pay management fees equal to 95% of the prior year’s management fee rate multiplied by the investor’s respective aggregate capital contributions. Distribution Waterfall The Fund will employ a European waterfall methodology that provides LPs a full return of invested capital and a preferred return on all realized and unrealized investments prior to the GP receiving profit distributions. Specifically, the distribution waterfall for IVPH IV will be as follows: • First, distributions will be made to all Limited Partners until they receive aggregate
distributions (with any in-kind distributions being valued at the time of distribution) equal to their respective capital contributions to the Fund;
• Second, distributions will be made to all Limited Partners until they receive a preferred return equal to six percent (6%) per annum on capital contributed to the Fund;
• Third, distributions will be made one hundred percent (100%) to the General Partner until the General Partner has received the target carry of the amount by which the aggregate of all Fund distributions exceeds the aggregate of all Capital Contributions made (5% for primaries, 10% for secondaries and 20% for directs/co-investments).
• Thereafter, distributions will be made in the respective carry proportions based on the type of underlying investment.
Allocation of Carried Interest The majority of the carried interest will be distributed evenly across the three Managing Directors that oversee the Fund: Hans Swildens, Roland Reynolds and Ken Wallace will each receive 29%. Robert May, COO, will receive 3% and the remaining 10% will be distributed to the Industry Ventures secondary investment team. Other Fees and Expenses The Fund will bear up to of $750,000 of organization and syndication costs.

Industry Ventures Partnership Holdings IV Venture Capital Strategy
Confidential Information – For NEPC Client Use Only © Copyright 2015 NEPC, LLC All Rights Reserved 13
Fund Administration, Structure and Policies Fund Structure The partnership is structured as a Delaware limited partnership. ERISA Provisions Industry Ventures does not operate as an ERISA fiduciary. Industry Ventures has ERISA investors in prior funds and may have ERISA investors in the Fund but under all circumstances they will be limited to less than 25% of fund commitments. UBTI Considerations The amount of UBTI that may be realized by tax-exempt investors in the Fund will depend on the nature of the Fund’s operations and investments and the operations and investments of its underlying portfolio funds. The potential for having income characterized as UBTI may have a significant effect on any investment by a tax-exempt entity in the Fund and may make investment in the Fund unsuitable for some tax-exempt entities. Tax-exempt investors should consult tax advisors regarding all aspects on an investment in the Fund. Environmental, Social & Governance Disclosures Industry Ventures recognizes that as venture capital fund manager, the Firm has the fiduciary duty to act in the best interest of its LPs over the long-term. In this fiduciary role, Industry Ventures believes that environmental, social and corporate governance (ESG) issues can affect the performance of the portfolio companies (to varying degrees across companies, industry sectors, regions, and investment stages and through time). Industry Ventures also recognizes that applying these principles may better align the investments with broader objectives of society and thus may lead to better returns over the longer term. Therefore, where consistent with the Firm’s fiduciary responsibilities, and where appropriate without causing material undue burden on Industry Ventures’ mission to act in the best long-term interest of its investors, it will be Industry Ventures’ policy to work towards the following principles:
1) Industry Ventures should promote and support the incorporation of ESG issues into investment analysis and decision making processes.
2) Industry Ventures should incorporate ESG issues into its ownership policies and practices. 3) Industry Ventures should seek appropriate disclosure on ESG issues by the entities in
which its funds invest. 4) Industry Ventures should promote acceptance and implementation of these (or similar)
principles within the private equity investment industry. 5) The members and employees of Industry Ventures should work together to enhance
effectiveness in implementing these principles. 6) Industry Ventures should report on its activities and progress towards implementing
these principles. Industry Ventures will evaluate the effectiveness and improve the content of these principles over time. Labor Policy Industry Ventures does not have a formal labor policy. Key Person Provision In the event that prior to the completion of the investment period, any two of the three following Managing Directors cease to fulfill the following obligations: (A) with respect to Roland Reynolds and Ken Wallace, ceasing to remain active in the affairs of the General Partner or (B) with respect to Hans Swildens, ceasing to remain an active member of the Investment Committee, the General Partner shall promptly notify the LPs of such event and the investment period shall be

Industry Ventures Partnership Holdings IV Venture Capital Strategy
Confidential Information – For NEPC Client Use Only © Copyright 2015 NEPC, LLC All Rights Reserved 14
automatically suspended; provided, however, that in such event the Limited Partners will remain obligated to make cash contributions throughout the duration of the Fund to the extent needed to fund post-investment period obligations. A suspension period may be terminated at any time upon the vote of a majority in interest of the LPs or the consent of the LP Advisory Committee; provided, however, that unless within 180 days after the commencement of a suspension period, a majority in interest of the LPs or the LP Advisory Committee has elected to terminate the suspension period and re-commence normal Fund operations, the investment period shall terminate and the Managing Directors shall be permitted to raise a new fund or other entity with objectives similar to the Fund. GP Removal Provisions The GP may be removed as general partner for cause, upon at least thirty days’ notice, by two-thirds in interest of the Limited Partners. Reporting Limited Partners of the Fund will receive annual reports containing audited financial statements of the Fund as well as quarterly reports with relevant updates and unaudited financial statements of the Fund. In addition, Limited Partners will have access to a secure internet site that will act as a repository for historical financial statements, schedule K-1s, partner capital account statements, capital call notices and other information relevant to Limited Partners. Valuation Policy Portfolio entities held by the Fund and other assets of the Fund will be valued at the fair market value as determined by the General Partner. In general, the net asset value reported by the managers of the portfolio entities, if any, will be used by the General Partner in making its determination of value. The LP Advisory Committee has the right to object to the valuation of one or more assets of the Fund set forth in the Fund’s annual financial statement, with the disputed valuation being resolved pursuant to the appraisal procedure set forth in the Partnership Agreement.

Industry Ventures Partnership Holdings IV Venture Capital Strategy
Confidential Information – For NEPC Client Use Only © Copyright 2015 NEPC, LLC All Rights Reserved 15
Litigation, Regulation and Compliance Current Litigation According to Industry Ventures, there is no past or pending litigation against the Firm or any of the Firm’s partners or principals. Compliance Staff and Philosophy Robert May is the Chief Compliance Officer and Chief Operations Officer. Cordium LLC acts as the firm’s outsourced provider of compliance services and is overseen by the CCO. Cordium is a full-service compliance firm that conducts an annual mock SEC audit as well as ongoing monitoring related to personal trading/dealing monitoring, affirmations, gift and political contribution reporting and more. In addition, Cordium LLC provides on-site compliance training for all employees on an annual basis. SEC Oversight Since registering with the SEC on March 31st 2012, Industry Ventures has not been subjected to a regulatory exam. Subject to Other Regulators Industry Ventures is not registered with any other regulatory bodies to which it is subject. Personal Trading In order to prevent improper trading, avoid the appearance of conflicts of interest, or for other business or legal reasons, Industry Ventures maintains a “Restricted List” of issuers whose securities may not be transacted in by the Funds or in any personal accounts. The CCO will maintain the Restricted List. The Restricted List is confidential, and no information about the Restricted List may be disclosed to anyone outside of the Firm. All Employees should consult the Restricted List before submitting any pre-clearance request for the purchase or sale of securities. Generally Employees (and in certain cases the Funds) will not be allowed to trade in securities on the Restricted List. The CCO will review all information to monitor compliance.

Industry Ventures Partnership Holdings IV Venture Capital Strategy
Confidential Information – For NEPC Client Use Only © Copyright 2015 NEPC, LLC All Rights Reserved 16
Firm Infrastructure Office Locations All Industry Ventures employees are based in the San Francisco office with the exception of Roland Reynolds, who is based out of the office near Washington, D.C. Technology Resources and Systems Investor Reporting: Through the Fund Administrator (Q-Biz Solutions), the Partnership Holdings Funds use the Netage's Dynamo platform for all LP reporting. A project is currently underway that will transition reporting to AltaReturn. Reporting / Account: Q-Biz Solutions uses their own proprietary portfolio accounting software. Compliance: As mentioned above, Compliance ELF is the system used to monitor and track personal trading/dealing monitoring, affirmations, gift and political contribution reporting and more. This is overseen by Cordium and CCO Robert May. Business Continuity Planning Industry Ventures maintains a comprehensive disaster recovery plan that addresses key personnel contact information, a backup strategy with risk management, emergency response procedures, insurance, and financial and legal issues. Industry Ventures uses BlueRock Networks to provide IT services. BlueRock is familiar with Industry Ventures’ environment and is expected to assist in ongoing maintenance and the recovery process as needed. Fund Administration/ Back Office Resources Industry Ventures uses Q-Biz Solutions as the Fund Administrator for all of the firm’s Partnership Holdings funds. Q-Biz assists with all functional accounting items including cash management, LP reporting, and capital account monitoring under the supervision of the COO/CCO, Robert May.

Industry Ventures Partnership Holdings IV Venture Capital Strategy
Confidential Information – For NEPC Client Use Only © Copyright 2015 NEPC, LLC All Rights Reserved 17
Firm Track Record
Note: $ in millions; data as of 12/31/2014 and provided by Industry Ventures.
Fund-Level Returns
Fund Vintage YearCapital
CommittedCapital Funded
Reported Value
Amount Distributed
Total Value, Net of Carry
TVPI Multiple
DPI Multiple Current Net IRR
Partnership Holdings I 2007 $30 $28 $39 $16 $55 1.81x 0.42x 14.0%Partnership Holdings II 2011 $55 $33 $71 $4 $75 2.01x 0.11x 46.7%Partnership Holdings II-A 2011 $12 $10 $28 $4 $33 3.07x 0.41x 54.1%Partnership Holdings III 2013 $170 $39 $49 $3 $52 1.20x 0.06x 63.4%Partnership Holdings III-A 2014 $13 $5 $5 $2 $7 1.26x 0.35x 62.4%Partnership Holdings III-B 2014 $20 $3 $3 $1 $4 1.14x 0.22x 51.6%

Industry Ventures Partnership Holdings IV Venture Capital Strategy
Confidential Information – For NEPC Client Use Only © Copyright 2015 NEPC, LLC All Rights Reserved 18
Track Record Benchmarking For benchmarking purposes, we compared past fund performance to the Thomson One/Cambridge Associates US Venture Universe. Thomson One/Cambridge Associates - IRR Comparison
Thomson One/Cambridge Associates - DPI Multiple Comparison
Thomson One/Cambridge Associates - TVPI Multiple Comparison
Note: GREEN shaded cells indicate that the fund outperformed the benchmark; RED shaded cells indicate that the fund underperformed the benchmark. Amounts are net of fees, carried interest and expenses. Performance is as of 12/31/2014. Thomson One/Cambridge Associates data is as of 12/31/2014, the most recent date for which the data is available.
Vintage Year Fund Current Net IRR Quartile # FundsUpper
Quartile MedianLower
Quartile2007 Partnership Holdings I 14.0% 2 75 17.6% 12.6% 5.9%2011 Partnership Holdings II 46.7% 1 46 36.1% 19.9% 3.1%2011 Partnership Holdings II-A 54.1% 1 46 36.1% 19.9% 3.1%2013 Partnership Holdings III 63.4% 1 44 11.2% (0.1%) (16.0%)2014 Partnership Holdings III-A 62.4% 1 42 (2.8%) (9.0%) (19.2%)2014 Partnership Holdings III-B 51.6% 1 42 (2.8%) (9.0%) (19.2%)
Vintage Year FundDPI
Multiple Quartile # FundsUpper
Quartile MedianLower
Quartile2007 Partnership Holdings I 0.42x 3 75 0.99x 0.58x 0.19x2011 Partnership Holdings II 0.11x 2 46 0.15x 0.03x 0.00x2011 Partnership Holdings II-A 0.41x 1 46 0.15x 0.03x 0.00x2013 Partnership Holdings III 0.06x 1 44 0.00x 0.00x 0.00x2014 Partnership Holdings III-A 0.35x 1 42 0.00x 0.00x 0.00x2014 Partnership Holdings III-B 0.22x 1 42 0.00x 0.00x 0.00x
Vintage Year FundTVPI
Multiple Quartile # FundsUpper
Quartile MedianLower
Quartile2007 Partnership Holdings I 1.8x 2 75 2.0x 1.6x 1.3x2011 Partnership Holdings II 2.0x 1 46 1.7x 1.3x 1.1x2011 Partnership Holdings II-A 3.1x 1 46 1.7x 1.3x 1.1x2013 Partnership Holdings III 1.2x 1 44 1.1x 1.0x 0.9x2014 Partnership Holdings III-A 1.3x 1 42 1.0x 0.9x 0.9x2014 Partnership Holdings III-B 1.1x 1 42 1.0x 0.9x 0.9x

Industry Ventures Partnership Holdings IV Venture Capital Strategy
Confidential Information – For NEPC Client Use Only © Copyright 2015 NEPC, LLC All Rights Reserved 19
Fund Attribution Analysis Total Value to Paid-In-Capital (TVPI) Deal Frequency Analysis The chart below shows the individual portfolio investment TVPI multiples for previous Partnership Holdings funds. The size of the bubbles on the chart indicates the relative size of the equity commitment to a given investment.

Industry Ventures Partnership Holdings IV Venture Capital Strategy
Confidential Information – For NEPC Client Use Only © Copyright 2015 NEPC, LLC All Rights Reserved 20
Investment-Level Returns Analysis The chart below shows the investment-level multiple dispersion by number of investments and by cost basis of investments for previous Partnership Holdings funds.
Avg. Multiple: 1.7xWtd. Avg. Multiple: 1.9xStandard Deviation: 0.9x
8% of Cost Basis Realized or Held Below
Cost
82% of Cost Basis Realized or Held Above
Cost
2%
15%
9%
23%
27%
5%
10%10%
0%
5%
10%
15%
20%
25%
30%
35%
40%
<= 0.50x 0.51x to<1.00x
1.00x 1.01x to1.50x
1.51x to2.00x
2.01x to2.50x
2.51x to3.00x
> 3.00x
Investment-LevelGross TVPI Multiple Dispersion for Investments, by # of
Investments
0%
8%9%
37%
25%
4%
7%
9%
0%
5%
10%
15%
20%
25%
30%
35%
40%
<= 0.50x 0.51x to<1.00x
1.00x 1.01x to1.50x
1.51x to2.00x
2.01x to2.50x
2.51x to3.00x
> 3.00x
Investment-LevelGross TVPI Multiple Dispersion for Investments, by Cost
Basis of Investments

Industry Ventures Partnership Holdings IV Venture Capital Strategy
Confidential Information – For NEPC Client Use Only © Copyright 2015 NEPC, LLC All Rights Reserved 21
Investment Volume Analysis The chart below shows the investment level multiple dispersion by number of investments and by cost basis of investments for previous Partnership Holdings funds.
Investment Number Equity Amount Current Total Wtd. Average Wtd. AverageStatus of Capital Distributed Reported Equity Gross Gross
Investments Invested Equity Value Value DPI Multiple TVPI Multiple2006 1 $2 $2 $3 $4 0.90x 2.26x2007 6 $11 $9 $12 $22 0.88x 2.03x2008 5 $8 $2 $9 $11 0.25x 1.41x2009 2 $2 $3 $5 $8 1.18x 3.23x2010 8 $7 $1 $12 $13 0.15x 1.80x2011 15 $15 $3 $39 $42 0.20x 2.77x2012 17 $14 $3 $43 $46 0.21x 3.34x2013 24 $20 $4 $26 $30 0.21x 1.54x2014 29 $39 $3 $45 $48 0.08x 1.23xTotal 107 $118 $31 $195 $225 0.26x 1.90x
0.0x
0.5x
1.0x
1.5x
2.0x
2.5x
3.0x
3.5x
4.0x
2006 2007 2008 2009 2010 2011 2012 2013 2014
Gross DPI and TVPI Multiples by Investment year
DPI Multiple TVPI Multiple
$0
$5
$10
$15
$20
$25
$30
$35
$40
$45
2006 2008 2010 2012 2014
Yearly Investment Volume
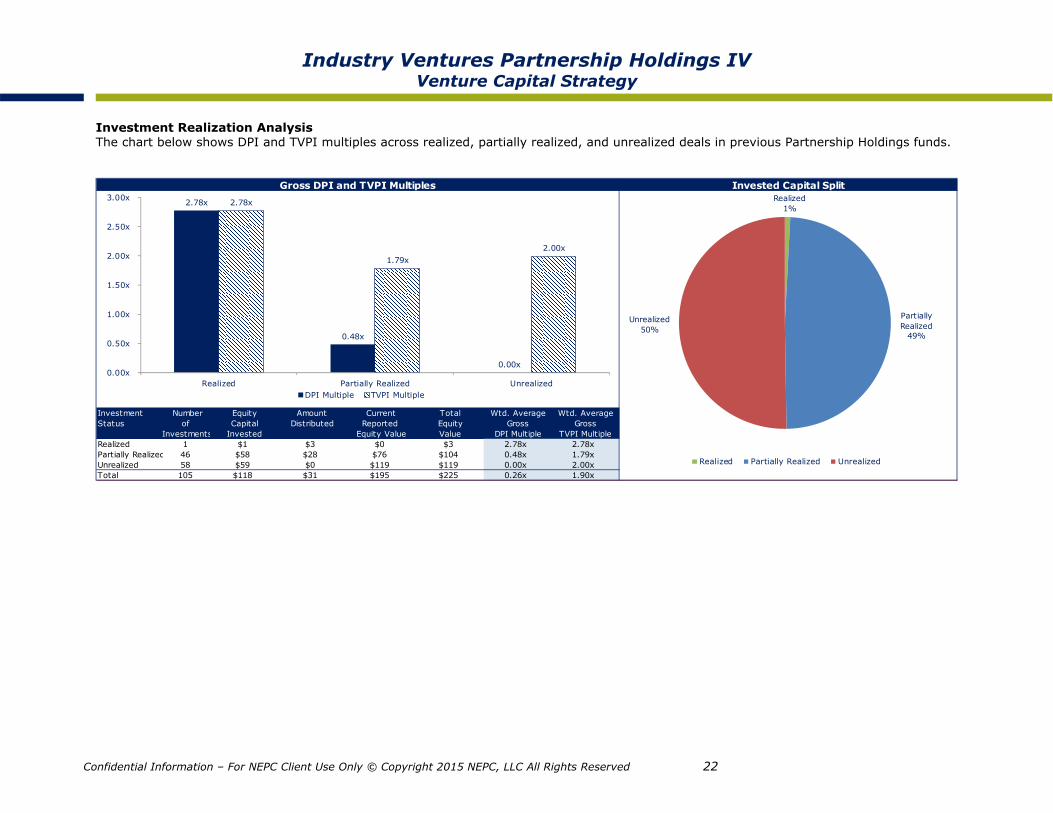
Industry Ventures Partnership Holdings IV Venture Capital Strategy
Confidential Information – For NEPC Client Use Only © Copyright 2015 NEPC, LLC All Rights Reserved 22
Investment Realization Analysis The chart below shows DPI and TVPI multiples across realized, partially realized, and unrealized deals in previous Partnership Holdings funds.
Gross DPI and TVPI Multiples Invested Capital Split
Investment Number Equity Amount Current Total Wtd. Average Wtd. AverageStatus of Capital Distributed Reported Equity Gross Gross
Investments Invested Equity Value Value DPI Multiple TVPI MultipleRealized 1 $1 $3 $0 $3 2.78x 2.78xPartially Realized 46 $58 $28 $76 $104 0.48x 1.79xUnrealized 58 $59 $0 $119 $119 0.00x 2.00xTotal 105 $118 $31 $195 $225 0.26x 1.90x
2.78x
0.48x
0.00x
2.78x
1.79x 2.00x
0.00x
0.50x
1.00x
1.50x
2.00x
2.50x
3.00x
Realized Partially Realized UnrealizedDPI Multiple TVPI Multiple
Realized1%
Partially Realized
49%
Unrealized50%
Realized Partially Realized Unrealized

Industry Ventures Partnership Holdings IV Venture Capital Strategy
Confidential Information – For NEPC Client Use Only © Copyright 2015 NEPC, LLC All Rights Reserved 23
Key Fund Professionals
Detailed Biographies Hans Swildens, Founder, Managing Director & CEO Hans is the founder of Industry Ventures and a Managing Director responsible for the origination and execution of investment opportunities for the Firm. Additionally, he directs the Firm’s investment processes, operations and limited partner relationships. Prior to founding Industry Ventures, Hans was the co-founder and President of Microline Software. Microline was acquired by Blaze Software (IPO), which was subsequently acquired by Fair Isaac. Hans was also an advisor to the founders of Speedera Networks (acquired by Akamai), where he completed Industry Ventures’ first secondary investment and debt restructuring transaction. Hans holds an MBA from Columbia Business School and a BA with distinction from the University of California at Santa Barbara. Roland Reynolds, Managing Director Roland is a Managing Director focused on sourcing and evaluating unfunded secondary purchases, primary commitments and co-investments for the Firm’s Partnership Holdings strategy. Prior to joining Industry Ventures, he was the founder and Managing Partner of Little Hawk Capital, which was acquired by Industry Ventures. Prior to that, Roland was a Principal with Columbia Capital, a leading communications and IT venture capital firm. Prior to that, Roland worked in investment banking at JP Morgan & Co. Roland received an MBA from Harvard Business School and a BA from Princeton University, where he graduated with high honors. Ken Wallace, Managing Director Ken is a Managing Director focused on sourcing and evaluating unfunded secondary purchases, primary commitments and co-investments for the Firm’s Partnership Holdings strategy. Ken joined Industry Ventures as an Associate on the secondaries investment team. Prior to joining the Firm, Ken worked as an Associate Vice President at Bessemer Trust’s Private Equity Funds Group, where he led the firm’s venture capital fund investment strategy. Prior to that, he was in business development with Bessemer Trust. Ken received an MBA from the Haas School of Business at the University California, Berkeley and a BA from Wake Forest University. Robert May, Chief Operating Officer and Chief Compliance Officer Robert is the Chief Operating Officer and Chief Compliance Officer for Industry Ventures. As the COO and CCO, Robert is responsible for all of the financial, compliance, and operational aspects of Industry Ventures. Prior to joining Industry Ventures, Robert worked as a consultant for Standish Management and led the Palo Alto office. Prior to that, Robert was the COO and CFO for Founders Fund. Prior to Founders Fund, Robert spent four years as the CFO of Thomas Weisel Venture Partners. Robert graduated with honors from San Jose State University with a BS in Business Administration.
Name Title Years with Firm
Years of PE Experience
Hans Swildens Managing Director & CEO 15 19 Roland Reynolds Managing Director 7 15 Ken Wallace Managing Director 8 11 Robert May COO & CCO 4 16

Industry Ventures Partnership Holdings IV Venture Capital Strategy
Confidential Information – For NEPC Client Use Only © Copyright 2015 NEPC, LLC All Rights Reserved 24
Disclaimers and Disclosures
Past performance is no guarantee of future results. The opinions presented herein represent the good faith views of NEPC as of the date of
this report and are subject to change at any time. Information used to prepare this report was obtained directly from the investment
manager, and market index data was provided by other external sources. While NEPC has exercised reasonable professional care in preparing this report, we cannot guarantee the accuracy of all source information contained within.
This report may contain confidential or proprietary information and may not be copied or redistributed to any party not legally entitled to receive it.
In addition, it is important that investors understand the following characteristics of non-traditional investment strategies including hedge funds, real estate and private equity:
1. Performance can be volatile and investors could lose all or a substantial portion of their investment
2. Leverage and other speculative practices may increase the risk of loss 3. Past performance may be revised due to the revaluation of investments 4. These investments can be illiquid, and investors may be subject to lock-ups or lengthy
redemption terms 5. A secondary market may not be available for all funds, and any sales that occur may
take place at a discount to value 6. These funds are not subject to the same regulatory requirements as registered
investment vehicles 7. Managers may not be required to provide periodic pricing or valuation information to
investors 8. These funds may have complex tax structures and delays in distributing important tax
information 9. These funds often charge high fees 10. Investment agreements often give the manager authority to trade in securities,
markets or currencies that are not within the manager’s realm of expertise or contemplated investment strategy

DISCUSSION SHEET
Regular Board Meeting – Thursday, April 14, 2016
ITEM #C7
Topic: North Texas Opportunity Fund extension
Attendees: Arthur Hollingsworth, Managing Partner
John McGuire, Managing Director of Operations
Discussion: The North Texas Opportunity Fund, LP commenced in May 2000 and is approaching the
expiration of the fund on May 13, 2016. The manager requests that DPFP consent to a one-
year extension in order to wind down the remaining assets in the fund and maximize investors’
return. This extension of the fund is the seventh extension requested by the manager under
the terms of the limited partnership and requires approval of two-thirds of the limited partners.
The partnership ceased payment of management fee to the Investment Manager on July 1,
2013.
DPFP committed and funded $10 million to the fund, and has received $8.8 million in
distributions, earning an IRR since inception of 3.56%. Staff and NEPC have reviewed the
fund, remaining assets, terms of the fund, and potential outcomes if no extension is granted.
Staff
Recommendation: Approve the extension and authorize the Executive Director to negotiate and execute
documentation and perform all necessary acts and exercise all appropriate discretion to
facilitate the extension.

1
INVESTMENT RECOMMENDATION
Date: April14,2016 To: DPFPBoardFrom: InvestmentStaff Subject: NorthTexasOpportunityFund7thExtensionRecommendation
Investments staff recommends approving the North Texas Opportunity Fund extension, whichextendsthedurationofthefundbyoneyearfromMay13,2016toMay12,2017.
ExecutiveSummary
TheGeneralPartneroftheNorthTexasOpportunityFundisrequestingaseventhextensionofthefundterminordertofacilitateliquidationoftheremainingassets.TheprimaryremainingassetisIrvingHoldings,Inc.(aka“YellowCab”).Thefundalsohasasmallcashpositionandescrowreceivablefromsellinganotherholding.TheGeneralPartnerexpectstoinitiatestepstowardsasaleprocessbymid‐year,andanticipatesasalebyyearend.
Performance
DPFPhasfundedthefull$10millioncommitmentmadetotheNorthTexasOpportunityFund,whichbeganinMayof2000.DPFPhasreceived$8.8millionindistributionsfromthefund,resultinginaDistributionstoPaidinCapitalratioof0.88.DPFP’smarketvalueinthefundisapproximately$5million,resultingaTotalValuetoPaidinCapitalratioof1.38asofSeptember30,2015,themostrecentdataavailable.DPFPhasachievedanIRRsinceinceptionof3.56%ontheinvestment.
Process
Staffreviewedthecontract,performance,history,andholdingsoftheNorthTexasOpportunityFund.Staffalsoanalyzedtheunderlyingfinancialstatementsoftheprimaryremainingasset.StaffmetwiththeGeneralPartnerseveraltimesandconductedmultiplephonecallsforanswerstoquestions.StaffalsoconsultedwithNEPC,whothemselvesheldphonecallswiththeGeneralPartner.
Rationale
TheGeneralPartnerintendstoinitiatekeystepstowardsasaleprocessbymid‐year,andistargetingyear‐endtocompletethesaleprocess.TheGeneralPartnerreceivesnocompensationformanagingthefundortheasset.TheGeneralPartnerhasalsoexpressedanintenttodistributesharesinkindintheeventthefundtermisnotextended.ItismoreefficienttoallowtheGeneralPartnertoconductandmanagethesaleprocesswithnocompensationthanforDPFPtoreceivethesharesinkindandattempttomonetizetheassetasadirectownerofaprivatecompany.

255 State Street | Boston, MA 02109 | TEL: 617.374.1300 | WWW.NEPC.COM BOSTON | ATLANTA | CHARLOTTE | CHICAGO | DETROIT | LAS VEGAS | SAN FRANCISCO
To: Dallas Police and Fire Pension System
From: NEPC Private Markets
Date: April 14, 2016
Subject: Request to Extend Duration of North Texas Opportunity Fund LP
Issue North Texas Opportunity Fund was originally scheduled to terminate on May 10, 2010. Since then, the General Partner has requested six one-year extensions, and has now requested a seventh. The Fund is in the liquidating stage but still has one core remaining asset, Yellow Checker Cab Company of DFW, yet to be fully realized. Additionally, there are residual payments due to DPF related to the Fund’s past investment in InStaff as well as an outstanding claim against the buyer of the Fund’s past investment in HGI Global, which pending a favorable ruling or settlement agreement, should result in additional proceeds to DPF. The General Partner of the Fund is requesting a one-year extension to permit an orderly liquidation of the remaining asset, Yellow Checker. According to the GP, the there is a potential buyer interested in Yellow Checker, however, due to entrants such as Uber in the Dallas area, the acquisition has been put off until the impact of deregulation within the industry can be better understood. Per the terms of the Limited Partnership Agreement, the Fund can be extended for one additional year through May 13, 2016 if the General Partner receives consent from 2/3 of Limited Partners interest. DPFP represents 36.6% of total LP interests. Recommendation We are recommending that DPFP agree to the extension as presented by the General Partner. The acceptance of the extension will allow the manager to continue the orderly liquidation of the remaining asset which is in the best interests of the limited partner investors. DPFP’s portions of the remaining net assets (Yellow Checker and InStaff payments) held in the portfolio are valued at ~$5M as of December 31, 2015. Additionally, the manager is no longer charging a management fee so there is no additional cost to DPFP to allow the General Partner to harvest the remaining portfolio company. It should be noted that at this time last year, the GP expected the remaining NTOF assets to be liquidated by the end of 2015, with no material progress made toward that goal. The GP stated that in Q2/Q3 2016 it will select an advisor to assist in the sale of Yellow Checker with the expectation that the Company will be sold by year end.

Foundation for the Recommendation In forming our recommendation, NEPC performed the following activities:
1. Spoke with Arthur Hollingsworth on March 30, 2016 2. Reviewed the Written Consent of Limited Partner of North Texas Opportunity
Fund LP 3. Reviewed the Fifteenth Annual Partners’ Meeting Partnership Review
Presentation 4. Reviewed the Yellow Checker Financial Overview Presentation 5. Reviewed the NTOF Limited Partnership Agreement


Page 1 of 2
WRITTEN CONSENT
OF LIMITED PARTNER OF
NORTH TEXAS OPPORTUNITY FUND LP
(a Texas partnership)
The undersigned, being a limited partner (the “Partner”) of North Texas Opportunity
Fund LP, a Texas partnership (the “Partnership”), hereby consents to the adoption of the
following resolution as of this 10th day of December, 2015:
1. Approval of Extension of Duration
WHEREAS, the Partnership’s ten-year duration commenced May 10, 2000. In March of
2010, two-thirds of the limited partners voted to extend the duration of the partnership for a
period of one year, from May 10, 2010 to May 10, 2011.
WHEREAS, in February of 2011, two-thirds of the limited partners voted to extend the
duration of the partnership for a period of one year, from May 10, 2011 to May 10, 2012.
WHEREAS, in February of 2012, two-thirds of the limited partners voted to extend the
duration of the partnership for a period of one year, from May 10, 2012 to May 10, 2013.
WHEREAS, per section 2.5 (a) of the LPA, the Partnership will cease payment of the
management fee to the Investment Manager July 1, 2013.
WHEREAS, in February of 2013, two-thirds of the limited partners voted to extend the
duration of the partnership for a period of one year, from May 10, 2013 to May 10, 2014.
Currently, the Partnership duration will expire May 10, 2014, subject to this extension consent.
WHEREAS, in May of 2014, two-thirds of the limited partners voted to extend the
duration of the partnership for a period of one year, from May 10, 2014 to May 10, 2015.
Currently, the Partnership duration will expire May 10, 2015, subject to this extension consent.
WHEREAS, in May of 2015, two-thirds of the limited partners voted to extend the
duration of the partnership for a period of one year, from May 10, 2015 to May 13, 2016.
Currently, the Partnership duration will expire May 13, 2015, subject to this extension consent.
NOW, THEREFORE, BE IT RESOLVED, that the Partner approves amending the
North Texas Opportunity Fund LP Limited Partnership Agreement (“LPA”) dated May 10, 2000
(the date of the filing for record in the Office of the Secretary of State of the State of Texas) to
effect extending the duration of the Fund by one year from May 13, 2016 to May 12, 2017
(changes in bold):

Page 2 of 2
The Partnership shall commence business upon the date upon which both (a) the General
Partner has received executed counterparts of this Agreement from Limited Partners whose
Commitments aggregate at least $12,500,000 and (b) the Certificate of Limited Partnership has
been filed for record in the Office of Secretary of the State of Texas, and shall continue through
the close of business on May 12, 2017, unless sooner terminated pursuant to the provisions of
Article IV hereof.
The undersigned has executed this Written Consent as of the date first set forth above.
GENERAL PARTNER:
NORTH TEXAS OPPORTUNITY FUND
CAPITAL PARTNERS LP
By: NTOF Capital Partners LLC, its general partner
By:
Name: Arthur Hollingsworth
Title: Partner
LIMITED PARTNER:
By:
Name:
Title:
DISCUSSION SHEET
Regular Board Meeting – Thursday, April 14, 2016
ITEM #C8
Topic: Investment reports
Discussion: Review of investment reports.

DISCUSSION SHEET
Regular Board Meeting – Thursday, April 14, 2016
ITEM #C9
Topic: 2015 audit plan
Attendees: Jill Svoboda, BDO, Partner Rachel Pierson, BDO, Manager
Discussion: Representatives from BDO, DPFP’s external independent audit firm, will be present to discuss their audit plan for the year ended December 31, 2015.

AUDIT PLANNING December 31, 2015
The following communication was prepared as part of our audit, has consequential limitations, and is intended solely for the information and use of those charged with governance (e.g., Board of Trustees and Administrative and Audit Advisory Committee) and, if appropriate, management of the System and is not intended and shall not be used by anyone other than these specified parties. BDO USA, LLP, a Delaware limited liability partnership, is the U.S. member of BDO International Limited, a UK company limited by guarantee, and forms part of the international BDO network of independent member firms.
BDO is the brand name for the BDO network and for each of the BDO Member Firms.

Tel: 215-969-7007 Fax: 214-953-0722 www.bdo.com
700 North Pearl, Suite 2000 Dallas, Texas 75201
BDO USA, LLP, a Delaware limited liability partnership, is the U.S. member of BDO International Limited, a UK company limited by guarantee, and forms part of the international BDO network of independent member firms.
BDO is the brand name for the BDO network and for each of the BDO Member Firms.
Board of Trustees Dallas Police and Fire Pension System Professional standards require us to communicate with you regarding matters related to the audit plan that are, in our professional judgment, significant and relevant to your responsibilities in overseeing the financial reporting process. This report provides an overview of our plan for the audit of the financial statements of the Dallas Police and Fire Pension System (the System) as of and for the year ending December 31, 2015, including a summary of our overall objectives for the audit, and the nature, scope, and timing of the planned audit work, including procedures applied to management’s discussion and analysis (MD&A), required supplementary information and schedules and any other permitted services requested by the System. We are pleased to be of service to the System and are always available to discuss our audit plan as well as other matters that may be of interest to you. Respectfully,

Discussion Outline
Page Client Service Team .................................................................................................. 3
Management’s Responsibilities ...................................................................................... 4
Engagement Objectives .............................................................................................. 5
Overall Audit Strategy - Planned Scope ............................................................................ 6
Primary Areas of Focus and Audit Strategy ....................................................................... 9
Audit Readiness and Overall Audit Timeline .................................................................... 15
Independence Communication .................................................................................... 16

3 AUDIT PLANNING – DECEMBER 31, 2015
Client Service Team Our engagement team members for this year’s audit are listed in the organizational chart below. As a matter of policy, we attempt to provide continuity of service to our clients to the greatest extent possible in accordance with mandated partner rotation rules and other circumstances that may impact continuity. Where engagement team rotation is necessary, we will discuss this matter with those charged with governance and determine the appropriate new individual to be assigned to the engagement based on particular experience, expertise, and engagement needs. In addition, as part of our engagement team, we will utilize the services of Actuarial Risk Management (ARM), a member firm of the BDO alliance network. Corwin Zass, Principal and founder of ARM, as well as Timothy Leier, will assist our engagement team in the review and audit of the actuarial report provided by the DPFP actuary for the audit of the December 31, 2015 financial statements. All members of the team listed above were part of the engagement team during the 2014 audit and are continuing with the engagement team for the 2015 audit.
Real Estate Valuation Reviewer Benjamin Laird [email protected]
Manager Rachel Pierson
Engagement Partner Jill Svoboda
Focused Consulting Reviewer Kristy VanderMolen

4 AUDIT PLANNING – DECEMBER 31, 2015
Management’s Responsibilities System management is responsible for preparing, with the oversight of those charged with governance, the financial statements and disclosures in conformity with accounting principles generally accepted in the United States of America (GAAP) and adhere to the guidelines established by the Governmental Accounting Standards Board (GASB) as of December 31, 2015. The System management’s responsibilities also include the following: Establish and maintain effective internal control over financial reporting and proper accounting
records.
Identify and ensure compliance with relevant laws and regulations.
Safeguard the System’s assets.
Select appropriate accounting principles.
Use reasonable judgments and accounting estimates.
Complete GAAP and GASB disclosure checklists to ensure there are no significant financial statement disclosure deficiencies.
Make all financial records and related information available to BDO.
Record material audit adjustments and affirm to BDO that the impact of uncorrected misstatements, if any, is immaterial to the financial statements taken as a whole.
Provide BDO with a letter confirming representations made during the audit.

5 AUDIT PLANNING – DECEMBER 31, 2015
Engagement Objectives Our objectives with respect to the audit of the System’s financial statements are summarized below: Plan and perform an audit to obtain reasonable assurance about whether the financial statements
are free of material misstatements, whether caused by error or fraud. An audit in accordance with auditing standards generally accepted in the United States of America and Government Auditing Standards do not provide absolute assurance relative to or any guarantee of the accuracy of the financial statements and is subject to the inherent risk that errors or fraud, if they exist, may not be detected.
As part of our engagement, we will apply certain limited procedures to the required supplementary information ("RSI") in accordance with auditing standards generally accepted in the United States of America. These limited procedures will consist primarily of inquiries of management regarding their methods of measurement and presentation, and comparing the information for consistency with management's responses to our inquiries. We will not express an opinion or provide any form of assurance on the RSI.
Obtain a sufficient understanding of the System’s internal control to plan the audit of the financial statements. However, such understanding is required for the purpose of determining our audit procedures and not to provide any assurance concerning such internal control.
Communicate our responsibilities in relation to the audit and establish an understanding of the terms of the engagement, including our engagement letter dated January 6, 2016 previously reviewed and approved by management.
Provide an overview of the overall audit strategy and planned scope and timing of the audit.
Inquire of those charged with governance about risks of material misstatement, including fraud risks, and whether those charged with governance are aware of other matters that may be relevant to the audit such as, but not limited to, violations or possible violations of laws or regulations, and complaints or concerns raised regarding accounting or auditing matters.
Communicate with System management and those charged with governance regarding significant deficiencies and material weaknesses identified during our audit, and other timely observations that are significant and relevant to the financial reporting process.
Consult regarding accounting and reporting matters as needed throughout the year.
Work with System management toward timely issuance of financial statements.
Maintain our independence with respect to the System.
Ensure that those charged with governance are kept appropriately informed in a timely manner of the System’s financial reporting matters; comply with professional standards as to communications with those charged with governance.

6 AUDIT PLANNING – DECEMBER 31, 2015
Overall Audit Strategy - Planned Scope Overall, our audit strategy is to focus on higher risk areas of material misstatement (whether due to error or fraud) and other areas of concern for System management and those charged with governance. Our audit strategy includes consideration of: Prior year audit results together with recent System results, investment industry results, regulatory
changes, significant current year events, and discussions with management and those charged with governance regarding the System’s operations, activities, and risks.
Inherent risk within the System (i.e., the susceptibility of the financial statements to material error or fraud) before recognizing the effectiveness of the control systems.
A continual assessment of materiality thresholds based upon qualitative and quantitative factors affecting the System.
Recent developments within the industry, regulatory environment, and general economic conditions.
Recently issued and effective accounting and financial reporting guidance including the disclosure requirements of GASB 67.
The System’s significant accounting policies and procedures, including those requiring significant management judgments and estimates and those related to significant unusual transactions.
The control environment, risk management and monitoring processes, and the possibility that the control systems and procedures may fail to prevent or detect a material error or fraud. We do not expect to perform tests of controls and will plan a substantive audit.
Information about systems and the computer environment in which financial records and related systems operate (including the trustee/custodian’s service provider’s systems as reported in their SOC 1 reports).
Possible internal plan changes for the audited plan year, such as the following:
Accounting systems
System management personnel or those charged with governance
Internal control processes in accounting and financial reporting
Service providers (such as actuary, legal, trustee, custodian, investment managers, etc.)
Trustee, custodian and/or investment advisor agreements
System amendments
Investment policies and practices
Workforce (significant layoffs, acquisitions, terminations, future reductions in force)
Possible issues impacting audit, such as the following:
System management’s review of the recent System results when compared to the investment industry results
Regulatory reviews or communications and/or pending litigation
Transactions with parties-in-interest
Errors or fraud related to the System
Misappropriation of System assets

Overall Audit Strategy - Planned Scope
7 AUDIT PLANNING – DECEMBER 31, 2015
Concerns about fictitious participants or distributions made to missing, ineligible, or incorrect individuals
Fees and expenses paid to inappropriate vendors
Significant assumptions used in the valuation of the System assets
Significant assumptions used in the actuarial determination of the total pension liability

Overall Audit Strategy - Planned Scope
8 AUDIT PLANNING – DECEMBER 31, 2015
Based upon our initial assessment, our audit will primarily entail substantive testing. The primary areas of focus in our overall audit strategy include the following: Fraud Risk
Entity/System Level Internal Controls Over Financial Reporting
Actuarial Valuation
Compliance with System Documents (eligibility, contributions/contribution receivables, and benefit payments)
Investments (Existence and Valuation)
Other Receivables, Payables and System Expenses
Investment Income (Loss)
Other Matters, Including Significant Unusual Transactions and Proper Disclosure of GASB 67, Accounting and Financial Reporting for Pensions
Evaluation of Related Party Transactions, Including Transactions with Parties-in-Interest, and any identified Significant Unusual Transactions
Evaluation of Legal Matter Disclosures including consideration of the status of the member lawsuit still in appeal and lawsuits with CDK

9 AUDIT PLANNING – DECEMBER 31, 2015
Primary Areas of Focus and Audit Strategy FRAUD RISK
Consideration Approach
Professional standards require us to plan and conduct our audit to obtain reasonable assurance about whether the financial statements are free of material misstatement, whether caused by error or fraud.
Fraud risk may be impacted by the following characteristics: Incentive or pressure Opportunity
Rationalization or attitude Presence of fraud risk factors and how
management’s controls and programs to detect and prevent fraud may mitigate these risks.
Risk of management override of controls.
Review System management’s controls and programs relating to fraud, and assess operating effectiveness of such programs.
Inquire of System management and other client personnel as to their knowledge of any potential fraudulent or alleged fraudulent activities.
Inquire of those charged with governance about their views about risks of material misstatements, including fraud risk and whether they are aware of: tips or complaints regarding the System’s
financial reporting; and matters relevant to the audit including, but
not limited to, violations or possible violation of laws or regulations
Consider additional procedures to address any specific fraud risks identified, including management override of controls.
Introduce an element of unpredictability into our procedures by either altering the nature, timing, or extent of the procedures when compared to procedures performed in the prior year.
Perform focused procedures on any significant unusual transactions, including gaining an understanding of the business purpose or lack thereof for the System entering into the transaction.
Obtain an understanding of the System’s financial relationships and transactions with those charged with governance of the System and the System Executive Director for risk assessment purposes.
Exercise professional skepticism.
Communicate with System management, those charged with governance and the System Executive Director, as necessary.

Primary Areas of Focus and Audit Strategy
10 AUDIT PLANNING – DECEMBER 31, 2015
ENTITY/SYSTEM LEVEL INTERNAL CONTROLS OVER FINANCIAL REPORTING
Consideration Approach
System management has controls in place to maintain compliance with applicable rules and regulations and provisions of the System Document.
The Staff or the Executive Director has controls to monitor the activities of the outside service providers.
Significant changes to personnel and internal control processes increase the risk that an internal control failure will occur due to either the design or operation of a particular control.
Consider the System’s internal control environment for purposes of planning our audit.
Review the System’s control processes in a number of areas to evaluate whether sufficient controls are in place and functioning effectively.
Review SOC 1 reports for the trustee/custodian service provider to determine whether adequate controls are in place and functioning effectively.
ACTUARIAL VALUATION
Consideration Approach
Whether the actuarial calculation appropriately applies current standards.
Whether actuarial provisions and assumptions are deemed reasonable.
Whether disclosures over actuarial assumptions and funding issues are appropriate.
Confirm the actuarial data directly with the actuary.
Have the actuarial report reviewed by Actuarial Risk Management, an Alliance Firm of BDO specializing in actuarial valuations, for reasonableness.
Perform census data reconciliations. Review funding requirements, actuarial
provisions and assumptions used for accuracy.
ELIGIBILITY
Consideration Approach
Whether all covered employees have been properly included in employee eligibility records.
Whether accurate participant data for eligible employees was supplied to the trustee/ custodian/service providers.
Test that participating employees are eligible per the System Documents on a sample basis.
Review participant personnel files.

Primary Areas of Focus and Audit Strategy
11 AUDIT PLANNING – DECEMBER 31, 2015
CONTRIBUTIONS
Consideration Approach
Whether the amounts received or due to the System have been determined, recorded, and disclosed in the financial statements in conformity with the System Document and accounting principles generally accepted in the U.S.
Test the calculation of employer and employee contributions in accordance with the System document.
Ensure that active eligible members in the Deferred Retirement Option Plan (DROP) contributions are in accordance with the System documents.
Ensure contributions are in accordance with Group A or Group B membership depending on election.
Test the reasonableness of contribution receivables.
BENEFIT PAYMENTS
Consideration Approach
Whether benefit payments are in accordance with the System Document.
Whether benefit payments are made to or on behalf of person entitled to them and only to such persons.
Whether transactions are recorded in the proper account, amount, and period.
Agree distributions to request for distribution and supporting checks.
Verify eligibility to receive the distribution. Test that proper tax withholdings, if any. Review and recalculate benefit payments.

Primary Areas of Focus and Audit Strategy
12 AUDIT PLANNING – DECEMBER 31, 2015
INVESTMENTS
Consideration Approach
Due to significant valuation issues with certain investments in the industry over the last several years, consider whether investments are properly valued and whether classified in conformity with accounting principles generally accepted in the U.S.
Whether investment transactions are recorded in conformity with accounting principles generally accepted in the U.S.
Confirm investments with third-party fund managers and/or custodians.
Test fair value of investments at year-end by comparing the carrying value to an outside third-party source, including audited financial statements presented at fair value, real estate appraisals, and partnership agreements.
Compare the investment income to rates of return per a third-party source, including audited financial statements at fair value, and test earning allocations.
Due to the specialized skill and knowledge required, utilize Valuation Manager, to assist us in corroborating the valuation of investments.
Consider the System management’s policy of reviewing valuation methodologies, inputs and assumptions.
Review the System’s investment policy in correlation with the investments in place.
OTHER RECEIVABLES, PAYABLES AND SYSTEM EXPENSES
Consideration Approach
Whether receivables and payables are appropriately recorded.
Whether liabilities recorded are complete and all expenses are captured.
Whether securities lending obligations are appropriately recorded.
For loans payable review maturity schedules and covenants, and send confirmations, if applicable.
Review schedules of uncompensated liabilities. Review securities lending arrangements. Obtain forward currency contracts and review
the appropriateness of the receivable and payable balances.
Perform a search of unrecorded liabilities. Obtain a detail break out of System expenses. Confirm fund management fees in correlation
with the investment confirms. Select a sample of expenses and agree them to
invoices and payments.

Primary Areas of Focus and Audit Strategy
13 AUDIT PLANNING – DECEMBER 31, 2015
INVESTMENT INCOME (LOSS)
Consideration Approach
Whether the realized gain or loss on investments is appropriately recorded.
Whether dividends are appropriately recorded by the System.
Whether interest earned is appropriately recorded by the System.
For a selection of transactions recalculate the realized and unrealized gains and losses.
For a selection of transactions test dividends received by the System to independent market sources.
Test interest earned by recalculating or performing reasonableness tests.
OTHER MATTERS
Consideration Approach
Ensure the financial report includes all appropriate disclosures.
Complete a disclosure checklist specific to Pension System and one specific to GASB standards.
Review the credit risk disclosure for appropriateness and adequacy.
Review legal expenses and obtain a legal confirmation for any potential commitments and contingencies that may require disclosure.

Primary Areas of Focus and Audit Strategy
14 AUDIT PLANNING – DECEMBER 31, 2015
EVALUATION OF RELATED PARTY TRANSACTIONS, INCLUDING TRANSACTIONS WITH PARTIES IN INTEREST
Consideration Approach
Consider the System’s relationships and transactions with its related parties. For the purposes of this section, the term “related party” is deemed to also incorporate the term “party in interest.”
Consider the susceptibility of the System financial statements to material misstatement (whether due to error or to fraud) that could result from the System’s related party relationships and transactions.
Assess the risk of material misstatement associated with System related party relationships and transactions.
Perform inquiry of System management regarding the identity of the System’s related parties, the nature of the System’s relationships and transactions with related parties and the System’s process for identifying, authorizing and approving, and accounting for and disclosing such relationships and transactions.
Perform inquiry and other procedures deemed appropriate to obtain an understanding of the controls, if any, that System management has established to identify, authorize and approve, and account for and disclose such relationships and transactions.
Evaluate whether the System financial statements 1) appropriately account for and disclose identified relationships and transactions with related parties and 2) are fairly presented given any such relationships and transactions identified.
Communicate to those charged with governance regarding significant matters arising from our audit.
We will communicate to those charged with governance, in a timely manner, any significant changes to the planned audit strategy or the significant risks initially identified that may occur during the audit to the results of audit procedures or in response to external factors, such as changes in the economic environment.

15 AUDIT PLANNING – DECEMBER 31, 2015
Audit Readiness and Overall Audit Timeline The following represents our anticipated schedule with regard to our audit of the System’s financial statements:
Description Date
Planning meeting; client assistance listings provided to System management
Early March, 2016
Develop audit strategy; determine nature and scope of testing Mid-March, 2016
Confirmation procedures Mid-March, 2016
Fieldwork begins Weeks of April 18, April 25
and May 2, 2016
Review draft financial statements By end of May, 2016
Final communications with those charged with governance; release opinion on financial statements (pending review of final investment audited financials that may come later in the audit process)
June 16, 2016
Release of audit opinion (Dependent on timing of audit reports from external investment managers)
Approximately June 30, 2016

16 AUDIT PLANNING – DECEMBER 31, 2015
Independence Communication Our engagement letter to you dated January 6, 2016 describes our responsibilities in accordance with professional standards and certain regulatory authorities with regard to independence and the performance of our services. This letter also stipulates the responsibilities of the System with respect to independence as agreed to by the System. Please refer to that letter for further information.

DISCUSSION SHEET
Regular Board Meeting – Thursday, April 14, 2016
ITEM #C10
Topic: Annual 2015 budget review
Discussion: Attached is a review of the Calendar Year 2015 Administrative and Professional Services
Budgets detailing expenditures for the year. Actual expenses for the combined Administrative
and Professional Services budgets, net of expenses allocated to the Supplemental Plan, are
approximately 9.9% below the budget.
Administrative expenses for the period totaled $5,542,660, 10.7% below the budget.
Professional services expenses for the period totaled $3,515,776, 8.6% below the budget.
Expense items which vary from the budget by at least 5% and $5,000 are explained in the
attached review.
Investment management expenses for the period totaled an estimated $32,774,652, 5.7%
below the budget.
Supplemental Plan expenses are deducted from total expenses in arriving at Regular Plan
expenses. Expenses are allocated to the two plans on a pro-rata basis, according to the ratio
of each plan’s assets to the total Group Trust assets. The ratio is derived from the Unitization
Report prepared by JPMorgan. The ratio is 99.28% Regular Plan to .72% Supplemental Plan
as of December 31, 2015.

2015 12-Month Budget vs Actual Review
April 14, 2016Regular Board Meeting

2015 2015 2014 OVER(UNDER) %DESCRIPTION BUDGET ACTUAL ACTUAL BUDGET BUDGET VARIANCE VARIANCESALARIES & BENEFITS:Salaries and Benefits 4,576,263 4,170,702 4,502,187 (405,561) -8.9%Supplies and Materials:Office Supplies 77,000 51,206 57,846 (25,794) -33.5%Postage 87,000 29,370 88,953 (57,630) -66.2%Educational Programs 36,000 18,461 19,641 (17,539) -48.7%Sub-Total Supplies & Materials 200,000 99,037 166,440 (100,963) -50.5%Services:Printing 78,000 57,234 52,117 (20,766) -26.6%Disability Medical Evaluations 13,000 7,160 16,860 (5,840) -44.9%Communications 99,000 68,497 84,527 (30,503) -30.8%Repairs and Maintenance 42,500 39,846 29,695 (2,654) -6.2%Leased Equipment 28,000 23,726 23,267 (4,274) -15.3%Memberships and Dues 15,500 12,978 11,012 (2,522) -16.3%Subscriptions 3,500 1,574 3,648 (1,926) -55.0%Continuing Education 245,000 184,421 205,872 (60,579) -24.7%Mileage Reimbursement 1,000 100 454 (900) -90.0%Staff Development 100,000 49,031 62,831 (50,969) -51.0%Business Continuity 50,500 36,814 36,379 (13,686) -27.1%Employment Expenses 27,000 125,519 1,745 98,519 364.9%
Contingency Reserve - 425 - 425 N/A
Sub-Total Services 703,000 607,325 528,407 (95,675) -13.6%Fixed Assets (includes Building) 770,000 705,845 48,773 (64,155) -8.3%Sub-Total, Gross of allocation to Supp Plan 6,249,263 5,582,909 5,245,807 (666,354) -10.7%Allocation to Supplemental Plan 43,845 40,249 36,336 (3,596) -8.2%Net Administrative Services Expenses Reg Plan 6,205,418 5,542,660 5,209,471 (662,758) -10.7%
DALLAS POLICE & FIRE PENSION SYSTEMADMINISTRATIVE BUDGET
12-MONTH REVIEWFISCAL YEAR 2015
2

LINE ITEMVARIANCE AMOUNT
% VARIANCE
Salaries and benefits (405,561)$ -8.9%
Office supplies (25,794)$ -33.5%
Postage (57,630)$ -66.2%
Educational programs $ (17,539) -48.7%
Printing $ (20,766) -26.6%
Disability medical evaluations $ (5,840) -44.9%
Communications (30,503)$ -30.8%
Continuing education (60,579)$ -24.7%
Staff development (50,969)$ -51.0%
Business continuity (13,686)$ -27.1%
Employment expenses 98,519$ 364.9%
Imaging support upgrade was postponed to 2016
Costs for ED and CIO searches
EXPLANATION
(1) Less conference travel; (2) Less tuition reimbursement than anticipated; (3) Cancellation of Wellness program by provider
The following expense items vary from the budgeted amount by more than 5% and $5K.
(1) Less conference travel; (3) Lower attendance of professional education courses (i.e. Wharton)
(1) Budgeted for producing newsletters monthly, but produced only bi-monthly; (2) Reduced number of printed annual reports
Fewer number of evaluations than anticipated
Administrative Budget
12-Month Review
(1) Fewer software upgrades than planned; (2) Reduced purchasing of office supplies; (3) Slight reduction in Cintas contract
(1) Reduced long distance and tablet data contract charges; (2) Fewer replacements of phones & tablets
(1) Focused reduction in meal costs; (2) No station visits; (3) Less involvement in retiree meetings (other than 1st Sunday meeting)
(1) Timing of transition from Interim Administrator to ED resulted in 1 month less total comp; (2) Hiring of CIO later than anticipated; (3) Retirement of Assistant Administrator-Investments and lack of replacment of Assistance Administrator-Operations
Fiscal Year 2015
(1) Budgeted for mailing of newsletters 12 times per year, mailed only 6 newsletters per year; (2) Reduced overnight mailings; (3) Lower daily mail volume than expected; (4) Cancelled mailing of condensed annual report and member handbooks - distributed during rookie classes & online
3

2015 2015 2014 OVER(UNDER) %DESCRIPTION BUDGET ACTUAL ACTUAL BUDGET BUDGET
VARIANCE VARIANCEActuarial Services 200,000 258,891 205,926 58,891 29.4%
Bank Custodian Services 500,000 268,115 301,973 (231,885) -46.4%
Insurance 361,000 288,116 200,310 (72,884) -20.2%
Elections 20,000 19,666 43,081 (334) -1.7%
Accounting Services 59,000 59,000 59,000 - 0.0%
Independent Audit 200,000 177,450 76,699 (22,550) -11.3%
Information Technology Projects 145,000 112,079 153,234 (32,921) -22.7%
Investment Consultant 576,000 544,449 345,730 (31,551) -5.5%
Investment Research Expense 75,000 17,674 9,376 (57,326) -76.4%
Legal Fees 750,000 771,280 1,045,343 21,280 2.8%
Legislative Consultants 251,000 262,716 248,423 11,716 4.7%
Legislative Conferences and Meetings 25,500 19,472 28,639 (6,028) -23.6%
Misc. Professional Services 139,000 257,080 478,936 118,080 84.9%
Network Security 49,000 22,721 28,501 (26,279) -53.6%
Pension Administration Software 314,000 261,670 203,212 (52,330) -16.7%
Real Estate Consultant 210,000 200,000 201,715 (10,000) -4.8%
Records Storage 1,200 927 971 (273) -22.8%
Professional Services Expenses 3,875,700 3,541,306 3,631,069 (334,394) -8.6%Allocation to Supplemental Plan 27,192 25,530 25,151 (1,662) -6.1%
Net Professional Services Expenses Reg Plan 3,848,508 3,515,776 3,605,918 (332,732) -8.6%
DALLAS POLICE & FIRE PENSION SYSTEMPROFESSIONAL SERVICES BUDGET
12-MONTH REVIEWFISCAL YEAR 2015
4

LINE ITEMVARIANCE AMOUNT % VARIANCE
Actuarial services 58,891$ 29.4%
Bank custodian services (231,885)$ -46.4%
Insurance (72,884)$ -20.2%
Independent audit (22,550)$ -11.3%
IT projects (32,921)$ -22.7%
Investment consultant (31,551)$ -5.5%
Investment research expense (57,326)$ -76.4%
Legislative conferences & meetings (6,028)$ -23.6%
Misc. professional services 118,080$ 84.9%
Network security (26,279)$ -53.6%
Pension administration software (52,330)$ -16.7%
Professional Services Budget
12-Month Review
The following expense items vary from the budgeted amount by more than 5% and $5K.
Audit fees for new firm were lower than anticipated
Premium increases were less than anticipated
Fiscal Year 2015
Services performed on revisions to assumed rate of return, potential plan amendment, GASB 68
(1) Credits from fees from prior years; (2) lack of initiation of private equity reporting software; (3) lower fees than anticipated for online services
Delay of some planned projects into 2016
Fewer changes than expected were needed for pension software as a result of plan amendment
EXPLANATION
Network security audit was delayed into 2016
(1) Allison & Partners services more than anticipated during first 1/2 of yr; (2) Search firm fees for CIO were not budgeted; (3) Higher than anticipated travel costs associated with hiring of ED; (4) Marco was budgeted for as Investment Consulting but reported as Misc. Prof Services
(1) General consulting fees slightly lower than anticipated; (2) Marco proxy consulting services were budgeted as Investment Consultant but reported as Misc. Professional Services; (3) Maples start-up fees of 25K not included in budget
Less travel than anticipated
Lack of anticipated travel for due diligence due to lack of new investments
Page 5

2015 2015 2014 OVER(UNDER) %DESCRIPTION BUDGET ACTUAL ACTUAL BUDGET BUDGET
VARIANCE VARIANCEAdministrative Expenses 6,205,418 5,542,660 5,209,471 (662,758) -10.7%
Professional Services Expenses 3,848,508 3,515,776 3,605,916 (332,732) -8.6%
Total 10,053,926 9,058,436 8,815,387 (995,490) -9.9%
DALLAS POLICE & FIRE PENSION SYSTEMTOTAL EXPENSESFISCAL YEAR 2015
(Net of Supplemental Plan Expenses)12-MONTH REVIEW
6

2015 2015 2014 OVER(UNDER) %DESCRIPTION BUDGET ACTUAL ACTUAL BUDGET BUDGET
VARIANCE VARIANCEInvestment Management Fees* 35,000,000 33,012,650 33,249,180 (1,987,350) -5.7%
Allocation to Supplemental Plan 245,560 237,998 230,308 (7,562) -3.1%
Net Investment Management Expenses Reg Plan 34,754,440 32,774,652 33,018,872 (1,979,788) -5.7% * Includes fund level fees as well as fees paid directly by DPFP. Amt presented is an estimate as final amounts will not be known until finalreporting is received from managers. Final amount will be disclosed in 2015 annual report.
DALLAS POLICE & FIRE PENSION SYSTEMINVESTMENT MANAGEMENT EXPENSES
FISCAL YEAR 201512-MONTH REVIEW
7

DISCUSSION SHEET
Regular Board Meeting – Thursday, April 14, 2016
ITEM #C11
Topic: Employee recognition – First Quarter 2016
Employee of the Quarter award
Discussion: The Chairman will present a performance award for Employee of the Quarter, First Quarter 2016.

DISCUSSION SHEET
Regular Board Meeting – Thursday, April 14, 2016
ITEM #C12
Topic: Disability recall process Portions of the discussion under this topic may be closed to the public under the terms of Section 551.078 of the Texas Government Code.
Discussion: DPFP has a Disability Pension Recall Policy dated October 12, 2006 that defines the process and procedure for the medical reexamination and recall of pensioners on disability retirement. Two specific situations are nearing the time when staff would normally begin the process for ordering a reexamination. Prior to starting the process on these two cases staff is requesting direction from the Board. Additional information will be provided at the meeting.
Staff Recommendation: Available at the meeting.
DISABILITY PENSION RECALL POLICY
As Amended Through October 12, 2006

DISABILITY PENSION RECALL POLICY
As Amended Through October 12, 2006
A. PURPOSE
1. The Board of Trustees ("Board") of the Dallas Police and Fire Pension System ("System") hereby adopts the following as its policy and procedure ("Policy") for the medical reexamination and recall of pensioners on disability retirement ("Pensioner"). This Policy is intended to establish a coordinated and documented means for considering disability recalls under the Combined Pension Plan (“Plan”).
2. Generally, disability recalls are made in accordance with the terms of
Section 6.15 of the Pension Plan to the following Pensioners:
• Group A Pensioners who have less than 20 years of pension service; • Group A Pensioners who have more than 20 years of pension service,
but who are less than 55 years of age; and • Group B Pensioners who are less than 50 years of age.
3. The Board intends that this Policy will clarify the requirements for a
disability recall, the rights and responsibilities of the Member and the role of the Staff and Board in the disability pension recall process. The System’s Administrator will adopt formal and/or informal procedures that will not conflict with this Board Policy to facilitate the disability recall process.
B. FREQUENCY OF RECALLS
The Board will designate the initial recall period at the time the disability pension is granted. Subsequent recalls will be made in accordance with instructions given by the Board. Generally, the interval will not be more often than once in a 6 month period. If the Board has reason to believe the disability has been removed or if the Pensioner requests to be allowed to return to duty, this 6 month rule shall not apply.
C. PHYSICIAN
For purposes of this Policy, the term “physician” means a licensed medical doctor or doctor of osteopathic medicine.

Disability Pension Recall Policy As Amended through October 12, 2006 Page 2 of 6 D. BOARD MEETING PROCEDURES
1. Unless the Pensioner requests otherwise, any testimony or discussion regarding the Pensioner's medical condition will be held in a session that is closed to the public. The Board will render in open session its determination concerning the Pensioner’s recall. The medical records related to the disability pension will be kept confidential pursuant to federal law.
2. The Pensioner may attend all portions of the Board meeting dealing with his
or her benefits in person or through a representative. The Pensioner, or the Pensioner’s representative, may be accompanied by legal counsel or any other person desired.
3. The Board may require the Pensioner and any persons who can provide
information regarding the Pensioner’s disability to be present during consideration of the Pensioner’s recall.
4. The Board, in its sole discretion, may subpoena witnesses (physicians, co-
workers, supervisors, or anyone else who can provide useful information). 5. The Pensioner, or the Pensioner’s representative, may present evidence that
might bear on the Pensioner's entitlement for disability benefits, including testimonial evidence given under oath by any person with knowledge of facts of the situation.
6. The Pensioner may ask the Pension Office to call any person who may have
knowledge of the facts of the disability to appear before the Board. Upon receiving such request, the Pension Office will attempt to call the person(s) to appear before the Board. The Pensioner’s request must be in writing and should be received by the Pension Office at least 10 working days before the scheduled meeting. Receipt of a request less than 10 days before the meeting may require an additional postponement of the Pensioner’s hearing. If a person who may have relevant information is not in attendance the Board may, if it sees fit, attempt to contact that person by speaker telephone during the course of the hearing. Any communication about the matter must be clearly audible to those in attendance.
7. Witnesses, whether called by the board or requested by the Member, may be
questioned under oath.

Disability Pension Recall Policy As Amended through October 12, 2006 Page 3 of 6 D. BOARD MEETING PROCEDURES (continued)
8. When reconsidering eligibility for disability benefits, the Board may decide
that additional information on some subject relating to the disability status is desirable. If so, then it may defer action until a subsequent meeting.
E. THE BOARD’S DECISION
1. The Board will make its decision whether to continue the disability retirement or require the Pensioner to return to active service in accordance with this Policy and the requirements of Section 6.15 of the Plan.
a. The Board shall have the sole and absolute duty to be the final “finder
of fact”. The Board will take into account and evaluate the claim of the Pension, any reports as to any injury or illness, as well as the evidence in reports submitted by the System’s private investigator, the Pensioner’s attending physician, the City’s Medical Officer and/or the independent physician and any other medical providers, and any other witnesses who present evidence or testimony at the Board meeting.
b. As the finder of fact, the Board will determine the weight to give to
any reports or testimony using the same considerations that they apply in everyday life when questions of truth and credibility arise. The Board will, for example, consider any possible bias or prejudice a witness may have, his or her interest, or lack of interest in the outcome of the hearing, if relevant to any event or conduct, the person’s ability to observe facts correctly, and to remember and relate them truly and accurately. No relevant fact shall be determined merely by the number of witnesses testifying for or against the fact. It shall be the quality, rather than the quantity, of testimony that controls. Whether to believe all, some or none of a witness’ testimony is for the Board alone to decide, using each Board member’s knowledge of and experience with human nature.
2. The Board’s written decision regarding the Pensioner’s recall will be
provided to the Pensioner within 10 working days of the meeting in which the decision was made.

Disability Pension Recall Policy As Amended through October 12, 2006 Page 4 of 6 F. RECONSIDERATION OF A BOARD DECISION
1. The Board will reconsider its decision to discontinue a Pensioner’s disability retirement if, within 90 days of Board’s decision, the Board receives a written request from the Pensioner along with additional medical evidence that directly relates to medical information previously considered by the Board.
2. A Pensioner’s request for reconsideration of a disability recall meeting the
above criteria will be presented at a regularly scheduled Board meeting as soon as is reasonably possible.
G. APPEAL OF THE BOARD’S DECISION
A Pensioner may seek to appeal the decision of the Board in the Dallas County District Court in accordance with the provisions of Sections 6.18(b) and (c) of the Plan.
H. BOARD SUSPENSION AND TERMINATION OF BENEFITS
1. If the System receives credible information that a disability Pensioner is
engaging in activities that are inconsistent with the statements made by or on behalf of that person or are inconsistent with payment of disability benefits, the Administrator will advise the Board Chairman of the information. Then, unless instructed by the Chairman to first present the issue to the Board at a Board meeting, the Administrator will engage the services of a private investigative service. The private investigative service is authorized to investigate the accuracy of the information received by the Board. Any such investigation shall be conducted with reasonable regard for the Pensioner’s dignity, shall not be in violation of law and any report shall be written in a thorough, proper and dignified manner. No activity on the disability pension or payment will take place pending consideration by the Board of the report of the private investigative service.
2. Any investigator who makes a report to the Board may be called upon to
testify under oath and may be examined at such time by the Board, the Pensioner, and the Pensioner’s representative.

Disability Pension Recall Policy As Amended through October 12, 2006 Page 5 of 6 H. BOARD SUSPENSION AND TERMINATION OF BENEFITS (continued)
3. If a Pensioner refuses to cooperate or otherwise takes action which leads the
Administrator to conclude that the Pensioner may be ineligible for continued benefits, the Administrator shall place the Pensioner’s name on the next Board agenda for possible suspension of benefits. The Board may, if it deems it appropriate, suspend payment of monthly benefits until any matters clouding the right to benefits are resolved. Upon completion of any necessary investigation, the Pensioner will be notified of the date of the hearing at which the right to benefits will be determined. After a hearing, including, among other things, an opportunity for the Pensioner to respond to any reports, analysis and testimony, the Board will make a determination as to the Pensioner’s eligibility for continued benefits. The effective date of the Board’s decision will be the date of the earlier suspension of benefits.
4. Timing for notice of the Board’s action and rights to appeal will be dated
from the meeting at which the decision is actually made.
I. OTHER GUIDELINES
1. The reasonable costs for medical re-examinations and completion of forms by the Pensioner’s Attending Physician, as well as other authorized medical examinations and other costs associated with the recall will be paid for by the System.
2. The Pensioner's failure to appear for any reason without good cause shown
shall not prevent the Board from considering the matter and entering a final decision based upon all the evidence presented.
3. If the Board determines that the Pensioner can return to his or her former
Department and normal or sedentary job duties are available to the Pensioner, the Pension Office will send a letter to the City of Dallas Civil Service Board requesting that the Pensioner be placed on a special Civil Service certification list. A copy of the letter, as well as the Civil Service certification, will be sent to the Chief of the Pensioner’s former Department by the Pension Office with the request that it be placed on a list for the next position opening. Should a position for the Pensioner become available, the Chief (or the Chief’s designee) will notify the Pension Office in writing.
Disability Pension Recall Policy As Amended through October 12, 2006 Page 6 of 6
4. Unless otherwise stated in this Policy, a Pensioner’s disability pension will
continue to be paid until the date before the Pensioner returns to the active payroll of his former Department.
5. If after a reasonable probationary period, the Pensioner cannot perform the
job duties of the offered position, the Pensioner’s Department will notify the Board through the Pension Office. If requested, the Board will consider the possible reinstatement of the Pensioner’s disability benefits.
6. The Board may require future medical examinations and recalls. As a
general rule, it will not require examinations or recalls more frequently than once in every 6 months.
APPROVED on October 12, 2006 the Board of Trustees of the Dallas Police and Fire Pension System.
Gerald Brown Chairman ATTEST:
Richard L. Tettamant Secretary
DOCS\POLICY\01 19 2001 Continuing Ed FINAL.DOC

DISCUSSION SHEET
Regular Board Meeting – Thursday, April 14, 2016
ITEM #C13
Topic: Disability recall
Portions of the discussion under this topic may be closed to the public under the terms of
Section 551.078 of the Texas Government Code.
Discussion: Staff will present an On-Duty disability pension for review and consideration by the Board in
accordance with Plan Section 6.15. This section provides that the Board may require that
certain Pensioners receiving a disability pension (non service-connected) or a periodic
disability compensation benefit (service-connected) to appear and undergo a medical
examination by the Health Director or, if the Health Director approves, by any licensed
medical practitioner, to determine if the Pensioner’s disability continues or the Pensioner’s
condition has improved to the extent that the Pensioner is able to resume duties with the
Department.
In accordance with Section 6.15 of the Plan and the Board Disability Recall Policy, Staff has
referred the Pensioner for medical examination and review of the Pensioner’s disability.
Detailed medical reports and recommendations regarding the disability recall will be available
on the network Board drive for review by the Trustees.
Staff
Recommendation: Available at the meeting.

DISCUSSION SHEET
Regular Board Meeting – Thursday, April 14, 2016
ITEM #C14
Topic: Legal issues Portions of the discussion under this topic may be closed to the public under the terms of Section 551.071 of the Texas Government Code: a. Police Officer and Firefighter pay lawsuits b. Potential claims involving fiduciaries and advisors
Discussion: Counsel will brief the Board on these issues.

DISCUSSION SHEET
Regular Board Meeting – Thursday, April 14, 2016
ITEM #C15
Topic: Ad hoc committee reports
Discussion: A brief update on the ad hoc committees will be provided.

DISCUSSION SHEET
Regular Board Meeting – Thursday, April 14, 2016
ITEM #C16
Topic: Business continuity update
Discussion: John Holt, IT Manager, will provide an update of the business continuity plan to the Board. The update will include a discussion of hot site options.
Staff Recommendation: Approve decommissioning of the hot site after successful test of cloud based disaster
recovery.

DISCUSSION SHEET
Regular Board Meeting – Thursday, April 14, 2016
ITEM #C17
Topic: Board Members’ reports on meetings, seminars and/or conferences attended
a. Conference: IFEBP: Investments Institute SF, CC
Dates: March 14-16, 2016 Location: Las Vegas, NV
b. Conference: Society of Pension Professionals JS, JB, GI, CW
Dates: March 15, 2016 Location: Dallas, TX
c. Conference: House Pension Public Hearing PK, JS, KG
Dates: March 15, 2016 Location: Dallas, TX
d. Conference: TEXPERS Basic Trustee Training Course CC
Dates: April 2, 2016 Location: Dallas, TX
e. Conference: TEXPERS Annual Conference SF, KH, JS, JM, JB, CC,
Dates: April 3-6, 2016 TH, BH, KG, JP, JMond Location: Dallas, TX SL, GI, CW, RW, MR, BS
f. Conference: Merit Energy Annual Meeting KH, JP, GI, CW
Dates: April 12-13, 2016 Location: Dallas, TX
Staff Recommendation: Receive and file.

DISCUSSION SHEET
Regular Board Meeting – Thursday, April 14, 2016
ITEM #D1
Topic: Reports and concerns of active members and pensioners of the Dallas Police and Fire Pension System
Discussion: This is a Board-approved open forum for active members and pensioners to address their concerns to the Board and staff.

DISCUSSION SHEET
Regular Board Meeting – Thursday, April 14, 2016
ITEM #D2
Topic: Executive Director’s report
a. Associations’ newsletters NCPERS Monitor (March 2016) NCPERS Monitor (April 2016) NCPERS PERSist (Spring 2016) TEXPERS Outlook (April 2016)
b. Future Education and Business Related Travel c. Future Investment Related Travel
Discussion: The Executive Director will brief the Board regarding the attached information.

NAT IONAL CONFERENCE ON PUBL IC EMPLOYEE RET IREMENT SYSTEMS
2016 is shaping up to be aninteresting year for publicpension reform proposals. On a
positive note, Iowa has recentlyintroduced legislation calling for thecreation of a state-run private-sectorpension plan, which brings the issueof retirement security to the forefrontand reminds voters of the success ofpublic pension plans.
On a negative note, we areunfortunately still seeing reformlegislation aimed at closing publicdefined-benefit plans and convertingthem to defined-contribution plans.Details about specific statelegislation follow.
Florida
Rep. Matt Caldwell (R)has sponsored HouseBill (HB) 87, which
would reform the FloridaRetirement System; the bill iscurrently on the House floor. The billwould change the defined-benefitpension default to a defined-contribution plan and extend thetime for employees to make thedecision from six to nine months.The bill also establishes a survivorbenefit for members of the defined-contribution plan who are killed inthe line of duty (those in the defined-
State Update
M a r c h 2 0 1 6
benefit plan already have thatbenefit) and makes the benefitretroactive to the beginning of thedefined-contribution plan in 2002. Asimilar death benefits bill (SenateBill [SB] 7012), sponsored by Sen.Jeremy Ring (D), was unanimouslypassed by the Senate in February andis en route to the House.
Georgia:
In Whitfield County,Commissioner HaroldBrooker made a motionto close the defined-
benefit pension system for new hiresand open a defined-contributionplan. Human resources directorJackie Carlo and finance directorAlicia Vaughn have been tasked withdeveloping the new plan by the endof February. No changes to thecurrent employee defined-benefitplan have been introduced.
Indiana
Rep. Robert Behning(R) has sponsored HB1004, which wouldallow teachers to
negotiate extra pay and allow schooldistricts the option to offer a defined-contribution pension. The bill is areaction to a bill that was ruled
illegal in November by the courts.Some superintendents were givenflexibility to negotiate whereteachers were placed on the payscale; however, it was ruled thatdecisions about pay can only benegotiated with unions. The new billpassed the House on February 3,despite opposition from HouseDemocrats and the teachers unions,and is moving on to the Senate.
Iowa
Sen. Janet Peterson (D)and state treasurerMichael Fitzgerald (D)have proposed a state-
run plan for private employees inorder to address retirement securityin the state. The proposal asks for$1.5 million to set up RetirementSavings Iowa, which would focus onproviding a retirement savingsoption for small business that do notoffer retirement plans. Thelegislation will seek a mandate forIowa employers to offer the state-runoption. Contributions to the planwould come from automatic payrolldeductions, and employees would beable to opt out of the plan. Theproposal must be approved by thestate legislature and signed into lawby the governor.
continued on page 2

FEDERAL news
2 • NCPERS , T h e Vo i c e f o r P u b l i c P e n s i o n s � Ma r c h 2 0 1 6
Kansas
Gov. Sam Brownback (R)could delay makingpension payments to the
Kansas Public EmployeesRetirement System (KPERS) under abill already approved by the SenateWays and Means Committee. HB 2365would allow Governor Brownback todelay payments to KPERS and thenpay with an 8 percent interest rate overtwo years. The House version of thebudget bill also allows the governor todelay contributions but does notinclude an interest rate and requires thedelayed payment to be paid the nextyear. The House and Senate are bothexpected to vote on their versions ofthe bill by the end of February.
Louisiana
On January 29, Rep.Barry Ivey (R)sponsored HB 65, a billthat would shift the
Teachers’ Retirement System ofLouisiana’s defined-benefit pension toa combination plan. The bill wouldalso raise the minimum retirement agefrom 62 to 65 for new hires as of July1, 2018, and make an automatic cost-of-living adjustment to the pensionevery other year.
Maryland
Gov. Larry Hogan (R) hasproposed a new budgetthat would provide $25million more than required
under Maryland law for the state
employees’ pension fund, which hadits annual contributions cut under theprevious administration (Gov. MartinO’Malley [D]). This budget is lumpedin with many other bills. The budget iscurrently in the General Assembly.
South Dakota
At the end of January, alegislative panelapproved SB 13, which
offers a new benefitstructure for new hires joining theSouth Dakota Retirement Systemafter July 1, 2017. The bill includes atwo-year increase in the retirementage, to 67. The legislation is now infront of the House.
Virginia
House Speaker WilliamHowell (R) has filed HB665 to create theCommission on Employee
Retirement Security and PensionReform. The commission will studythe soundness of the defined-benefitretirement plans, the impact of andstrategies for addressing anticipatingstate employees’ retirements in thenext 10 years, and the benefitpackages of state employees. The billpassed the House and has beenreferred to the Senate Committee onRules. Separately, Sen. Chris Jones(R) has introduced HB 1072, whichwould modify the current hybridretirement plan for the VirginiaRetirement System. The legislationwould increase the employercontribution from 1 percent to 2percent, decrease the employer
maximum matching contribution from2.5 percent to 1.5 percent in thedefined-contribution component of theplan, increase the employeecontribution from 1 percent to 2percent, decrease the employeemaximum contribution from 4 percentto 3 percent, and decrease theemployee contribution to the defined-benefit component from 4 percent to 3percent. The bill has been referred tothe House Committee onAppropriations.
Washington
In Seattle, city councilmembers are voting on anew retirement plan forthe Seattle City Employees’
Retirement System’s new hires. Thenew plan, called SCERS II, will givenew hires smaller pensions because ofan adjustment in how their benefits arecalculated, the retirement age will riseto 55, and employees will not beallowed to retire with full benefits untiltheir age and years of service add up to85, instead of the current 80.Employees will contribute 7 percent,instead of the current 10 percent, andthe city will contribute only 5 percent,versus the current 6 percent. The citycouncil is expected to vote on themeasure by the end of February.
Stay tuned and visitwww.NCPERS.org for moreinformation on upcoming statepension reform battles. As always, ifyour state is facing pension reformefforts and you would like NCPERS’help, please let us know.
State Update continued from page 1

NCPERS , T h e Vo i c e f o r P u b l i c P e n s i o n s � Ma r c h 2 0 1 6 • 3
FEDERAL news
Members Urged to Join March 8Webinar Spotlighting LatestNCPERS Research
NCPERS is hosting a members’ webinarMarch 8 to share two recent additions tothe NCPERS Research Series. The newstudies provide a data-drivenperspective on important questions andtrends in retirement security.
“How Did the Shift from DefinedBenefit Pensions to DefinedContribution Plans in the Private SectorImpact Retirement Savings?” publishedin February 2016, examines the impacton retirement savings resulting from thehistoric shift from defined-benefit todefined-contribution plans.
The analysis of US Department ofLabor data concludes that retirementsavings, which totaled $6.9 trillion at
the end of 2012, would have beentwice that level, or $13.9 trillion, ifeveryone had remained in defined-benefit plans. The analysis coveredthe period 1977 to 2012.
Published in March 2016, “Are Stateand Local Pension Funds TakingMore Risk Now Than Before?”examines US Bureau of Census dataon assets and investable income tocounter the assumption that publicpension funds are taking on too muchrisk. The risk analysis draws on twodata sets, covering the periods 1967to 2007 and 1993 to 2014. The datashow that public pension plans aretaking on slightly more risk togenerate returns in recent decadesthan they did in the 1960s and 1970s.However, the risk level taken togenerate a unit of return has beenrelatively stable for 30 years.
“Arguments advanced by theopponents of public pensions arebased on ideology rather than facts,”wrote Michael Kahn, the author ofboth reports and director of researchfor NCPERS.
“The findings of these studies haveimportant implications for NCPERSmembers,” said Mel Aaronson,president of NCPERS. “At a timewhen public pensions are comingunder frequent attack as too riskyand costly, and 401(k) plans arebeing held out as the model of howto move forward, it is important toknow the real facts. NCPERSresearch seriously undermines thearguments of those who opposedefined-benefit pension plans.”
To join the webinar on March 8,please click here. n
Renew Your Membershipat http://ncpers.org/Members/
Renew YourMembershipOnline Today!
DON’TDELAY!

Hank H. Kim, Esq.Executive Director
& CounselExecutive Director's Corner
At this early stage in thepresidential campaign,candidates and the
American public alike see the issuesin rough strokes. The economy,immigration, national defense, andsocietal change dominate the policyagenda, and Social Security andMedicare remain perennially hottopics. But the top concerns ofNCPERS members – ensuring thefuture of public pensions andpromoting retirement security for allAmericans – are just seeping into theconsciousness of candidates and theelectorate.
We can all play a role in sharpeningthe focus, because we know the timeis ripe for a national conversationabout ensuring a secure retirementfor all Americans. And publicpension funds, which have done thejob for decades, are a great model forthe future – a point that has beenunderscored by the US Departmentof Labor’s decision to amend theEmployee Retirement IncomeSecurity Act (ERISA) to facilitatestate-sponsored retirement plans forprivate-sector workers.
The good news is that public pensionfunds are not being used as apolitical football at the national level
the way they have been in somestates. The bad news is that none ofthe candidates are addressingretirement security with any depth,though several have staked outpositions on Social Security,focusing on privatization, payrollcaps, and the retirement age.
March through June is a keypresidential primary period and acritical time for members to helpelevate the dialogue aboutAmerica’s future. You don’t have tobe a political pro to help raise ourconcerns.
m Speak up if you are attendingevents for candidates for anyfederal, state, or local office.Ask questions about where theystand on public pensions and
fostering retirement security forall. Tell them unequivocallyhow pensions benefitcommunities.
m Stay abreast of the news inyour community and beprepared to defend publicpensions when they are attackedin newspaper articles and op-eds. Our members have beenvery successful in correctingmisconceptions about publicpensions and getting theirpositions published, and at thenational office we stand ready tohelp.
m Know our latest positions andresearch. Take part in eventssuch as our semiannuallegislative update (the next one
Election 2016 Is Right Time for NationalConversation on Retirement Security
continued on page 5
4 • NCPERS , T h e Vo i c e f o r P u b l i c P e n s i o n s � Ma r c h 2 0 1 6

Hank H. Kim, Esq.Executive Director
& CounselExecutive Director's Corner
NCPERS , T h e Vo i c e f o r P u b l i c P e n s i o n s � Ma r c h 2 0 1 6 • 5
is in July) or our forthcomingresearch update webinar to armyourself with facts you can useto stand up for public pensions.
m Keep in touch. Reach out toyour team at NCPERS to keepus apprised of the topics you areraising and how lawmakers andcandidates are responding.
Of course, you can count on us atNCPERS headquarters to continue toaddress public pension priorities withmembers of the Senate and House ofRepresentatives and with thepresidential candidates and their keyadvisers.
It is still very early in the presidentialcampaign cycle. March begins with atorrent of primaries; by the end of
March, we should have greaterclarity on who will receive thenomination when the Democratsand Republicans hold theirconventions in July. In themeantime, however, it is a long roadto November. We have a compellingstory to tell about the critical role ofpublic pensions in our communities,and over the next eight months weneed to keep telling it. �
continued from page 4
Don’t Miss NCPERS’ Social Media

The States continued from page 1
T H E
MONI TOR The Latest in Legislat ive NewsThe Monitor is published by the National Conference on Public Employee Retirement Systems. Website: www.NCPERS.org • E-mail: [email protected] North Capitol Street, NW, Suite 630 • Washington, DC 20001 • 1-877-202-5706 • (202) 624-1439 (fax)
444 North Capitol Street, NW, Suite 630Washington, DC 200011-877-202-5706(202) 624-1439 (fax)
FIRST CLASS MAIL
US POSTAGE PAID
WASHINGTON, DC

NAT IONAL CONFERENCE ON PUBL IC EMPLOYEE RET IREMENT SYSTEMS
There’s an old saying that goes,“To avoid criticism, saynothing, do nothing, be
nothing.” But that’s not how publicpension systems roll. When you doimportant work, as we do, yousometimes end up drawingdetractors as well as fans. Honest critics are one thing; agenda-driven critics are another story. Inour sphere, the Laura and JohnArnold Foundation and the PewCharitable Trusts are examples oforganizations intent on attackingpublic pensions at any cost andreplacing them with 401(k) plans orthe equivalent.
Now there’s a new group of criticstaking shape, known as theRetirement Security Initiative. Yet,RSI’s idea of “security” distorts themeaning of the word, as its aim is tochip away at the retirement securityof teachers, firefighters, socialworkers, nurses, and other publicemployees.
The National Public PensionCoalition, of which NCPERS is amember, recently shared insightsinto what RSI is and what it hopes toaccomplish. RSI maintains that it isbringing a new face and “bipartisanreformer” credentials to the dialogueover the future of public pensions.
Newly Formed Antipension Group Twists“Retirement Security” Label
A p r i l 2 0 1 6
Nothing could be further from thetruth.
RSI is a well-funded, well-connectedgroup of anti-labor Republicans andDemocrats. Its members are likely tosurface in advocacy roles, includingmeeting with lawmakers, providingtestimony, and helping to draftlegislation; writing anddisseminating public and privatedocuments that support antipensionlegislation; and offering interviewsand public appearances.
Members include the following:
m Chuck Reed, the formerDemocratic mayor of San Jose,championed a so-called reformmeasure to gut the retirementsecurity of his own workers.Reed’s former chief of staff,Peter Furman, serves as RSI’sexecutive director.
m Dan Liljenquist, a former one-term Republican state senatorfrom Utah, advocated a movefrom a defined-benefit (DB)pension to a hybrid plan.
m Lois Scott, the former chieffinancial officer in RahmEmanuel’s Chicago, paved theway for Mayor Emanuel’spension attacks, which are nowbeing challenged in court. She
resigned under fire when one ofher chief aides fled the countryto avoid prosecution.
m James Spiotto is a municipalfinance consultant with a recordof attacking DB pensions.
m Richard Ravitch, who served18 months as the appointedlieutenant governor of NewYork, has been a regular critic ofpensions for public employees.
We want to hear from you if RSImembers become a presence inyour communities! Please emailus at [email protected].
Update on Legislative Issues
This article covers the primaryfederal legislative issues ofimportance to public pension plans.Although other issues could beincluded, the issues discussed herehave the potential for movement orare new and worthy of analysis.
PEPTA and the AnnuityAccumulation Plan
The key committees in the House areinching closer to releasing theirlegislative proposals on providing
continued on page 2

FEDERAL news
2 • NCPERS , T h e Vo i c e f o r P u b l i c P e n s i o n s � Ap r i l 2 0 1 6
financial assistance, debtrestructuring authority, and greateroversight of the Commonwealth ofPuerto Rico, which is beset with debtand is losing more and more of itseducated, professional workers everyday. The proposals should be releasedby the end of March, with committeemarkups likely to take place in April.The Senate appears to be working ona slightly slower timetable.
It is important for our community tomonitor this legislation. As you mayrecall, in December 2015, SenateFinance Committee chair Orrin Hatch(R-UT) introduced S. 2381, hisversion of legislation to assist PuertoRico. The bill contains two provisionsthat have nothing to do with PuertoRico; instead, it introduces legislationthat would affect all state and localgovernmental pension plans in the 50states with new federal reportingrequirements and the promotion ofannuity accumulation plans.
The provisions are taken fromlegislation previously introduced inthe 113th Congress – H.R. 1628/S.779, known as the Public EmployeePension Transparency Act (PEPTA).Individual House legislation onPEPTA is expected to be introducedagain soon. The provisions require,for the first time in our nation’shistory, that sponsors of state andlocal governmental pension plansreport their funding status to thefederal Treasury Department. There isalso a requirement that a plan’sfunding status, if it is not calculatedusing fair market value or the specific
interest rates proscribed in thelegislation, be recalculated usingthose interest rates. As a result of therecalculation, even well-fundedpension plans will appear to bepoorly funded. This recalculationdoes not reflect economic reality andwill serve only to create negativeheadlines for public plans.
The second provision relates to a newannuity accumulation plan for stateand local governmental pensionplans. The provisions, while slightlymodified, are essentially those foundin S. 1270 (113th Congress). Let mebe clear at the outset: although theplan is purely optional for state andlocal governments, we see it as beingpositioned as an alternative and anultimate replacement for definedbenefit pension plans.
As a replacement plan, this new planhas many deficiencies. First, there areno survivor or disability benefits forfirefighters and other public safetyemployees. These benefits areessential for public safety employeesand their families. Second, employeecontributions to the annuity plans areprohibited; only employers maycontribute. This prohibition runscounter to the vast majority offunding streams for public plans inwhich both employees andemployers contribute to the plans.Finally, the plan sponsor may chooseto lower, or not make any,contributions to the plan in any givenyear, provided it is done uniformly,which would create great uncertaintyon whether the benefit will beconsistently funded from year toyear.
Windfall Elimination Provision
House Ways and Means Committeechair Kevin Brady (R-TX)introduced H.R. 711 to repeal thewindfall elimination provision(WEP), which reduces your SocialSecurity benefit if you also earn apension from noncovered earnings.This change would affect many stateand local workers. A hearing at theWays and Means Subcommittee onSocial Security is scheduled forMarch 22. Chairman Brady has saidthat, following the hearing, he isinterested in marking up thelegislation and attempting to movethe bill, either individually or as partof a larger package, through the fullHouse.
Corporate Tax Integration andDividends
As part of his effort on tax reform,Finance Chairman Hatch isdeveloping a corporate integrationtax reform proposal that wouldeliminate the double taxation ofcorporate income. Under current taxlaw, corporate earnings are taxed atthe corporate-entity level (first levelof taxation); then, if those earningsare distributed as dividends toshareholders, those dividends aretaxable income to the recipient(second level of taxation).
While the draft legislative languagehas not been made public, it is clearthat the elimination of this doubletaxation of dividends is a centralpiece of the proposal. Depending onhow this provision is structured, itmay have a significant impact on
Retirement Security continued from page 1

NCPERS , T h e Vo i c e f o r P u b l i c P e n s i o n s � Ap r i l 2 0 1 6 • 3
FEDERAL news
pension funds, endowments, andother nontaxable entities that ownequity shares in corporations andreceive dividend income from thoseinvestments.
Under the approach currently beingcontemplated by Chairman Hatch,corporate earnings distributed asdividends would be taxed one time atthe shareholder level. A tax-withholding scheme would be createdwhereby the corporation wouldwithhold tax from the dividend. Theshareholder would then receive thenet amount as a dividend. Theproposal does not differentiatebetween tax-paying and nontaxablerecipients of dividends. Sincenontaxable entities, such as pension
plans, do not currently pay tax ondividend income, they would simplyreceive a lower dividend.
Some observers have suggested that,since the corporation would no longerbe taxed at the entity level on earningsthat it distributes as dividends (theHatch proposal is expected to containa dividends-paid deduction for thecorporation), many corporationswould plus-up the gross amount of thedividend. Thus, the recipient wouldreceive, after withholding, roughly thesame amount he or she would havereceived under the current system.However, that’s just speculation andwould, of course, vary by corporation. Chairman Hatch has sent the draftlegislative language to the Joint Tax
Committee for it to be scored, whichshould take several weeks. Hatch istargeting May for unveiling thelanguage, perhaps in an introducedbill, but that’s unclear at this time.What is clear is that the corporateintegration proposal will be a part ofthe debate on tax reform that willbegin in earnest in 2017. n
Tony Roda is a partner at the Washington,D.C., law and lobbying firm Williams &Jensen, where he specializes in legislativeand regulatory issues affecting state andlocal pension plans. He representsNCPERS and individual pension plans inCalifornia, Ohio, Tennessee, and Texas.
Don’t Miss NCPERS’ Social Media

Hank H. Kim, Esq.Executive Director
& CounselExecutive Director's Corner
Education, the cornerstone ofthe NCPERS AnnualConference and Exhibition, is
the big draw for more than 1,000participants who will gather in SanDiego on May 15–19.
We also have something big tocelebrate – the 75th anniversary ofNCPERS. We mark this milestoneproudly, knowing that we are strongbecause we are constantly evolving.But just like the public pensionsystems we represent, NCPERS isn’tyet done growing and becoming thebest, most responsive organizationwe can be.
Federal Reserve interest rate hikesand other external factors are shiningan ever-brighter light on theperformance of public pension fundinvestments. This new reality will bereflected throughout the conference,making this program an excellent fitfor pension fund chief investmentofficers (CIOs) and investment staff.While investment topics havealways been a significant feature ofthe annual conference, this year’sprogram reflects the risingimportance of the CIO andinvestment staff. Tuesday’s generalsession is devoted to investmenttopics, including a CIO panel
discussion, a detailed look atindexing, and a dive into investmentgovernance. Concurrent sessionsaimed at the CIO team abound, withWednesday afternoon featuring abrand-new, hour-long forum tailoredto their concerns.
Preceding the conference, on May14 and 15, is a two-part trainingsession for those pursuing theNCPERS Accredited Fiduciary(NAF) designation. This program isideal for elected or appointed publicpension trustees who want to taketheir professional development tothe next level. In separate six-hoursessions, participants will exploretwo of the four modules required forNAF designation – Governance andthe Board’s Role, and Investment,Finance, and Accounting. Upon
completion of all four modules,participants may take an exam and,if successful, earn the NCPERSNAF designation.
You will never go wrong investingin the professional training offeredby NCPERS. Our annual conferencehas so much to offer – networkingopportunities, exposure to otherprofessionals and experts, updateson legislation and regulation, anopportunity to step away from theday-to-day and think more freely,and, yes, even a fun celebration.Ultimately, you – our members –come out for the educationalofferings. Engaging andparticipating in the annualconference is the best way for you tocapitalize on your investment in anNCPERS membership. �
NCPERS Annual Conference IntensifiesEmphasis on Investment Education
4 • NCPERS , T h e Vo i c e f o r P u b l i c P e n s i o n s � Ap r i l 2 0 1 6
The States continued from page 1
T H E
MONI TOR The Latest in Legislat ive NewsThe Monitor is published by the National Conference on Public Employee Retirement Systems. Website: www.NCPERS.org • E-mail: [email protected] North Capitol Street, NW, Suite 630 • Washington, DC 20001 • 1-877-202-5706 • (202) 624-1439 (fax)
444 North Capitol Street, NW, Suite 630Washington, DC 200011-877-202-5706(202) 624-1439 (fax)
FIRST CLASS MAIL
US POSTAGE PAID
WASHINGTON, DC

For the past four years, it hasbeen my distinct pleasure andhonor to lead our great organ-ization as president! As my
presidency draws to a close the naturaltendency is to look back on the pastaccomplishments. Over the past fouryears, NCPERS has been the leader inhelping states establish Secure Choiceretirement savings plans for the privatesector. The most significant develop-ment in this area is Department ofLabor’s proposed regulations to clarifyhow states can implement such retire-ment plans for the private sector with-out running afoul of ERISA. AnotherNCPERS achievement in 2015 was thelaunch of NCPERS Code of Conductfor Public Plan Service Providers toensure ethical behavior and minimizeconflict of interest between public pen-sions and their vendors. I’m veryproud these things have happened dur-ing my tenure.
However, I want to spend theremainder of this note on the AnnualConference & Exhibition (ACE).This year’s ACE program, held May
INSIDE THIS ISSUE (Click on Page Link)
2 Another Reason WHY Public Pensions Should Conduct PeriodicInternal Check-ups: ALTERNATIVEINVESTMENTS
3 Pension Rebalancing in a Time ofMarket Volatility
4 The Investment Case for Global ListedInfrastructure
5 Legal Report: Divestiture—When DoesDe Minimis Become “De Maximus?”
6 Why Digital Privacy Matters: A Look atthe FBI versus Apple Face-Off
14 Calendar of Events 2016
Spring 2016 • Volume 29 • Number 2
For information on how to sponsor an issue please contact Amanda Rok [email protected]
Mel AaronsonNCPERS President
15-19 at the Hilton San Diego, CA,will be the 75th ACE program!Sometimes I wonder if the foundersof our association could have imag-ined a time when our organizationwould be celebrating its 75Anniversary. For the past 75 years,NCPERS has been the premier con-ference for public pension educationand the best place to connect withpension trustees, administrators,staff members, union officials, andinvestment professionals. This year’sprogram is designed to inform atten-dees of issues facing public pensionplans, and most importantly provideyou with the tools to face theseissues. Addressing these issues ofpublic pension plans, with the fol-lowing tracks:
Monday, May 16
David A. Vaudt,Chairman,GovernmentalAccounting StandardsBoard (GASB)
In this session, the GASB Chair willpresent his views on Board activitiesdesigned to improve accounting andfinancial reporting for U.S. state andlocal governments, and highlight thekey issues and impacts NCPERSmembers should know about.Specifically, Vaudt will discuss issuesrelating to: OPEB standards finalizedin 2015, pensions, and fair value.
In these sessions, whether you arefully immersed in social media or stilltesting the waters, you will learn howto interact on various social mediaplatforms and how to get the most of
continued on page 8
Monday, May 16 andTuesday, May 17
Social Media Track, James Spellos, Meetings U

NCPERS PERSIST Spring 2016 • Return to front page2
In an effort to boost returns inrecent years, pension funds haveshifted away from traditionalfixed-income investments, such
as government and high-quality cor-porate bonds, and significantlyincreased their reliance on stocks andalternative investments, includingprivate equity, hedge funds, realestate, and commodities. This changein investment strategy and allocationhas affected the costs, fees, and com-plexity associated with pensioninvestments. Many pension boardsand beneficiaries have struggled tounderstand the structure and eco-nomic returns of alternative invest-ments, which are more complex andless transparent than stocks andbonds.
However, one consequence of the2008 financial crisis is that manypublic pension systems have takenaffirmative steps to review the costsof their investments, especially“alternative” investments, and ques-tion whether they are appropriate inlight of expected returns, risks, andupside potential. For example, inSeptember 2014, CalPERS ended itsinvestments in hedge funds owing tothe cost, complexity, and risk associ-ated with these investments.1 Manypensions have followed CalPERS’lead.2
Pension fiduciaries need to under-stand the benefits and risks of alter-native investments and assess the effi-cacy and true cost of employing out-side managers and advisers. Indeed,failure to understand and periodical-ly review pension investments may
Another Reason WHY Public PensionsShould Conduct Periodic Internal Check-ups:ALTERNATIVE INVESTMENTS
Chet B. Waldman is a graduate ofCornell University (A.B. 1982) andBoston University School of Law(J.D., 1985) (G. Joseph Tauro Scholarand Paul J. Liacos Scholar) and was amember of the American Journal ofLaw and Medicine. He was admittedto the bar for the State of New York in1986, to the US District Court for theSouthern/Eastern District of NewYork in 1988, and to the US Court ofAppeals (1st Circuit) in 2013. He pre-viously worked at Weil, Gotshal &Manges and now works at WolfPopper LLP (since 1988), where hebecame a partner as of January 1,1995, and a member of the ExecutiveCommittee as of January 1, 2015. Hehas extensive experience in litigatingcases on behalf of pension funds (pri-marily securities and merger andacquisition cases) and has been amember of the Securities LitigationCommittee and the Mergers &Acquisition Committee of the NewYork City Bar Association.
By Chet B. Waldman
come at a trustee’s peril. In a unani-mous 2015 decision in Tibble v.Edison International,3 the U.S.Supreme Court held that ERISAfiduciaries have a continuing duty tomonitor plan investments to ensurethey remain prudent, even if theywere prudent when originallyoffered.
The Tibble opinion also implicitlyapproved of a lower court’s decisionthere suggesting that where twoinvestments options are otherwisemirror images of each other (such asretail and institutional share classesof the same mutual fund), plan fidu-ciaries may be liable if they did notselect the investment option withlower expenses. If the availableinvestment options are not exactlythe same, however, courts appearreluctant to second-guess fiduciaries’investment strategy, notwithstandinga difference in cost. The lesson hereis that plan fiduciaries should have aprocedure in place to review the con-tinued prudence of their investmentsand associated costs, and be able todocument that procedure.
Pension trustees can shield them-selves from potential liability byproactively retaining their own foren-sic and legal professionals to investi-gate and review investments, invest-ment adviser performance, and relat-ed costs. Such periodic checkups alsodemonstrate to pension constituents,regulators, and the public that pen-sion trustees and management areattentive and vigilant in protectingpension assets and monitoring long-term pension sustainability.
Below is a checklist of some criticalissues that should be addressed anddocumented in an internal checkupaided by independent professionals:
m Review investment advisers witha focus on their independenceand performance.
m Review compliance with invest-ment guidelines, and considerwhether such guidelines needmodifications.
m Analyze the true costs of alterna-tive investments, including fee
continued on page 8

Return to front page • NCPERS PERSIST Spring 2016 3
1. Rebalancing policies: Doingsomething may be better thandoing nothing. Year-to-date cap-ital market moves have shiftedsome plans away from theirstrategic asset allocation targets.This development has led someplans to once again revisit theirpolicies as to when and how torebalance their portfolios. Wehave observed that having sometype of rebalancing policy, what-ever that may be, and followingit may be preferable to simplyletting asset allocation driftbased on market movements.Some plans may be concernedabout the transaction costsinvolved in rebalancing or thereality that these actions usuallyinvolve selling asset classes thathave done well and buying assetclasses that had been out offavor. Nonetheless, empiricalevidence suggests that a disci-plined policy of rebalancing canyield better Sharpe ratios for theportfolio.1
2. The question of timing: Periodicrebalancing and establishingmateriality thresholds at asset-class level is recommended.While doing something may bebetter than doing nothing, it stillleads to the question of when torebalance. There is no generalconsensus on an optimal rebal-ancing policy. Typically, rebal-ancing is effectuated either at aperiodic set time or when assetallocation drifts outside of a pre-determined threshold, or both.Frequent rebalancing, such as on
Pension Rebalancing in a Time of MarketVolatility
By Michael A. Moran
a daily basis or with a de min-imus threshold, can be subopti-mal, given cumulative transactioncosts. However, the differencesbetween rebalancing on a month-ly, quarterly, or annual basis orwhen established thresholds arebreached may be limited. Allthose strategies result in higherSharpe ratios for portfolios thandoes not rebalancing at all (withquarterly rebalancing subject to amaterial threshold having aslightly higher Sharpe ratio thanother options).
3. Differentiating rebalancing froma tactical shift: In the current envi-ronment of heightened volatility,more muted growth prospects insome economies, and increasedrecession fears in the UnitedStates, some plans are consideringshifting their risk exposures.Some clients have expressed adesire to become more defensive,including even contemplatingraising cash levels in their portfo-lio. Consequently, some plansmay seek to hold off on rebalanc-ing altogether since, given year-to-date moves, more defensive posi-tions like investing in USTreasuries have increased portfo-lios’ value while riskier assets likepublic equities make up a smallerpercentage of portfolios today.We would note that rebalancing istypically viewed as a risk manage-ment exercise, whereas a tacticalshift is typically an expression ofan investment view, and it is oftenimportant to distinguish betweenthe two concepts.
4. Integrating tactical allocationinto overall portfolio design:Plan sponsors that would like toact more tactically may want toconsider the potential advan-tages of embedding a tacticalallocation “bucket” into theportfolio. By establishing a spe-cific allocation to tactical strate-gies in the investment policystatement, the sponsor can,either directly or through the useof external managers, shift riskexposures based on their viewson various markets and sectors.By doing so, strategic allocationsto public equities and fixed-income investments are rebal-anced on schedule and the valueadded from a tactical view canbe exposed and quantified.Given that the governance struc-tures of many plans may not beconducive to effectuating suchtactical moves in a timely man-ner, for many plans, optimalimplementation may be achievedthrough the use of external tacti-cal managers.
1 Analysis and further disclosuresavailable upon request.
Michael A. Moran, CFA, Senior
Pension Strategist at Goldman Sachs
Asset Management, provides four
observations on pension rebalancing,
based on research and conversations
with clients.
continued on page 8

NCPERS PERSIST Spring 2016 • Return to front page4
Global GDP growth rates areslowing due to decliningpopulation growth rates,aging workforces, and
dwindling productivity gains. Mutedfuture growth expectations arereflected in low global bond yields.Historically, brisk GDP growthenabled companies to grow byincreasing output. In this lower-growth environment, other ways willneed to be found to stimulate earn-ings and generate real returns.
Global listed infrastructure is lessdependent on the broader economiccycle. Key assets include toll roads,airports, utilities, mobile towers, andenergy pipelines. Steady demand forinfrastructure’s essential services givesit a unique combination of character-istics: namely, predictable cash flows,strong pricing power, high barriers to
The Investment Case for Global ListedInfrastructureBy Peter Meany
Crown Castle (Adjusted Funds From Operations)
Source: Company, First State Investments
entry, and structural growth. Thesecharacteristics enable infrastructureto offer a number of valuable benefitsto an investment portfolio.
First, infrastructure earnings growthtends to be relatively insensitive toslowing GDP growth. For example,earnings growth at mobile toweroperator Crown Castle is under-pinned by growing demand formobile data, which is compelling tele-com companies to upgrade theirequipment.
Toll road operators, such asAustralian operator Transurban,derive earnings growth from stable orgrowing commuter volumes, pricingthat is linked to (or better than) infla-
Transurban (Sydney Orbital Network Proportionate EBITDA $m)
Source: Transurban, First State Investments
continued on page 9

Return to front page • NCPERS PERSIST Spring 2016 5
ly driven by the plansponsor, whereas the
Oregon decision wasdriven by Board ofHigher Educationpolicy.
What if survival ofthe entire system is
at stake? Are therules different? In
Withers v. Teachers’Retirement System, 447
F.Supp. 1248 (S.D.N.Y.1978), the Board of Trustees agreed
to buy $2.53 billion (approximately$10 billion in 2015) in New YorkCity bonds to prevent the City frombecoming insolvent. This commit-ment raised the amount of the port-folio in City securities to more than37 percent. Members of the plansued the trustees for breach of fiduci-ary duty. Ultimately, the court ruledthat trustees acted reasonably, as theinsolvency of the City would have ledto depletion of the retirement systemwithin less than 10 years. The courtrejected the claim of breach of fiduci-ary duty because the motivation ofthe decision was the long-term sol-vency of the system and not the long-term welfare of New York City. Thetrustees reasonably feared that inbankruptcy, the protection ofemployee benefits would be second-ary to claims of bondholders and thepreservation of essential public serv-ices.
Can environmental, social, and gov-ernance (ESG) issues be related to thelong-term survival of the plan spon-sor and the retirement plan? To theextent that ESG is integral to thelong-term success and prosperity of
In deciding whether to follow ordecline divestiture mandates, thecourts have looked to whetherthe effect on the portfolio is “de
minimus.” Black’s Law Dictionarydefines de minimis as “of the least” or“trifling; minimal” and a fact or thingthat is “so insignificant that a courtmay overlook it in deciding an issueor case.” In the context of an invest-ment decision, when is an effectde minimis? The term comes from aLatin legal standard, De minimis noncurat lex: “The law does not concernitself with trifles.”
At least one state, New York, rejectedthe above maxim in the context of afiduciary duty. In Sorin v. ShahmoonIndustries, 220 N.Y.S.2d 760 (Sup.Ct. N.Y. Cnty. 1961), challengeregarding waste of corporate assets,the court held that where a fiduciary’sduty to account is at issue, it is a ques-tion of “principle,” not principal.When a fiduciary is to account forfunds entrusted to his or her care, itmeans all funds, “not some, or evenmost.” This would seem to suggestthat there is no de minimis exception(at least in New York), highlightingthe confused and unsettled state of thelaw.
The leading (and really the only) casein this context remains Board ofTrustees v. Mayor and City Council,562 A.2d 720 (Md. 1989). Here thetrustees of the Baltimore city pensionfund sued to challenge ordinancesrequiring divestiture of holdings incompanies doing business with theApartheid government of SouthAfrica. In upholding the ordinances,the Court observed that given the“vast power that pension funds exertin American society, it would be
unwise to bar trusteesfrom considering thesocial consequencesof investment deci-sions,” where thecost was de min-imis. In this case,the trial courtfound that the ini-tial cost of divest-ment was 1/32 per-cent (3 basis points)and the ongoing costwas 1/20 percent (2 basispoints). To date, this remains theonly public pension case giving someconcrete definition to the term “deminimis” in the divestiture context.
A similar case concerned an actionby the Oregon Board of HigherEducation passing a divestiture reso-lution relating to investment ofendowment funds (AssociatedStudents v. Oregon InvestmentCouncil, 728 P.2d 30 [Or. App.1986]). The State InvestmentCouncil declined to adopt the resolu-tion, finding it contravened prudentinvestment standards. Various stu-dent groups whose members receivedendowment-funded scholarshipssued. An Oregon trial court held thatthe Board of Higher Education andnot the State Investment Councilcontrolled the endowment funds, butagreed that divestiture was a viola-tion of the prudent investor stan-dard. The decision was overturnedon appeal when the student plaintiffswere found to lack standing suffi-cient to challenge the investmentdecision. The trial court’s decision onprudent investment standards con-trasted with the result reached inMaryland. Significantly, theMaryland divestiture was legislative-
Divestiture—When Does De MinimisBecome “De Maximus?”By Robert D. Klausner, NCPERS General Counsel
continued on page 11

NCPERS PERSIST Spring 2016 • Return to front page6
Digital privacy, simply put,is our fundamental right ascitizens to control whereour Personally Identifiable
Information (PII) is exposed andshared. As our world becomesincreasingly digital and much of ourlives move to online systems, digitalprivacy has taken center stage. Wenow contend with all sorts of privacyconcerns: how much of my informa-tion is Google tracking? Are my textmessages encrypted? How is mysocial media usage affecting my riskof becoming a victim of identitytheft?
WHY DOES DIGITAL PRIVACY MATTER?
But why does digital privacy matter?Let’s be honest: most of us don’t havestate secrets on our cell phones orhome computers, but that doesn’tmean that we don’t have a right toprivacy or that the digital footprintswe leave behind aren’t valuable.
Many companies track consumerbehavior online and use it for adver-tising or sell the information to thirdparties. But that isn’t the only reasondigital privacy is important. Many ofus check work documents that con-tain private company informationfrom our cell phones. We also accesssensitive financial information onlineor store important personal docu-ments on our computers.
Digital privacy is important, andnothing illustrates this more than thecurrent battle between FBI andApple.
THE FBI VERSUS APPLE
In the months following the SanBernardino shootings, the FBI contin-ued to investigate the gunmeninvolved and recovered an iPhone5C. As a result of Apple’s strongencryption software, the FBI wasunable to recover all the informationon the phone, which they believe maycontain valuable leads in the case. Togain access to the information, a fed-eral judge ordered Apple to create acustom version of its iOS operatingsystem to bypass security measures.Apple contends that creating this“backdoor” would be dangerous andwould seriously endanger digital pri-vacy for all.
WHAT DOES THIS MEAN?
If Apple concedes to creating a back-door to their encryption system, itwould set a dangerous precedent inthe use of the All Writs Act of 1789and expand the FBI’s authority. AppleCEO, Tim Cook, warned that com-plying with such orders would givethe government the power to “cap-ture” anyone’s data. He also cau-tioned that the act could allow thegovernment to demand that compa-nies build surveillance software,undermining the privacy of allAmericans. Another concern is thatcreating the means to bypass thesecurity of one iPhone and allowbrute-force hacking would weaken
Why Digital Privacy Matters: A Look at theFBI versus Apple Face-Off
By Jerry Thompson
continued on page 12
Photo Illustration ©2016 Depositphoto.com

your online investments. In the digitalage, social media is more important tomembers now more than ever. Thesesessions (Social Media 101 & 201and It’s App-tastic) will give you fun-damental information you need to bepart of the social revolution.
NCPERS PERSIST Spring 2016 • Return to front page8
President’s Message continued from page 1
The complexities and challenges thatpublic plan investment professionalface are numerous and daunting.NCPERS first CIO & InvestmentStaf forum will be structured as aparticipant- driven session, provid-ing a comfortable and open settingfor CIOs and other investment personnel to discuss, learn, and network with peers. Topics willinclude timely strategies, pitfalls toavoid, governance issues, and com-
mon professional challenges.
As trustees, you can earn up to 16.5continuing education (CE) creditswith these sessions and more! Formore information on the AnnualConference & Exhibition, please visitwww.NCPERS.org/annconf.
I look forward to seeing you at the2016 NCPERS Annual Conference &Exhibition in May! ❖
arrangements and incentive com-pensation agreements with out-side managers, advisers, and con-sultants.
m Review portfolios for investmentsthat may become high risk understressed conditions (e.g., securitieslending).
m Carefully scrutinize and limitgifts from outside managers andconsultants; strive for transparen-cy and accountability.
m Establish rules regarding futureemployment for board membersand staff by outside advisers andmanagers.4 ❖
1Michael B. Marois, “Calpers to Exit Hedge Funds,Divest $4 Billion Stake,” Bloomberg Business,September 15, 2014, www.bloomberg.com/news/arti-cles/2014-09-15/calpers-to exit-hedge-funds-citing-expenses-complexity.2 For example, public pensions in Los Angeles, NewMexico, and Louisiana have eliminated or reducedtheir hedge fund investments. See ChristineWilliamson, “Hedge Fund Investing Strong in 2014,”Pensions & Investments, August 18, 2014,http://www.pionline.com/article/20140818/PRINT/308189978/hedge-fund-investing-strong-in-2014.3 __ U.S. __, 135 S. Ct. 1823 (2015).4 For example, see “CalPERS StrengthensAccountability, Transparency and Ethics” Fact Sheet,https://www.calpers.ca.gov/docs/ethics-fact-sheet.pdf.
THESE MATERIALS ARE PROVID-ED SOLELY ON THE BASIS THATTHEY WILL NOT CONSTITUTEINVESTMENT ADVICE AND WILLNOT FORM A PRIMARY BASISFOR ANY PERSON’S OR PLAN’SINVESTMENT DECISIONS, ANDGOLDMAN SACHS IS NOT AFIDUCIARY WITH RESPECT TOANY PERSON OR PLAN BY REA-SON OF PROVIDING THE MATE-RIAL OR CONTENT HEREIN.
Pension continued from page 3This information discusses generalmarket activity, industry or sectortrends, or other broad-based econom-ic, market or political conditions andshould not be construed as researchor investment advice. This material isnot financial research and was notprepared by Goldman Sachs GlobalInvestment Research (GIR).
Views and opinions expressed are forinformational purposes only and donot constitute a recommendation byGSAM.
CONFIDENTIALITY
No part of this material may, withoutGSAM’s prior written consent, be (i)copied, photocopied or duplicated inany form, by any means, or (ii) dis-tributed to any person that is not anemployee, officer, director, or author-ized agent of the recipient.
Copyright © 2016 Goldman Sachs.All rights reserved. ❖
Wednesday, May 18
NEW CIOs & Investment Staff Forum,Girard Miller, CIO of the Orange County(CA) Employees Retirement System
Check-ups continued from page 2

Return to front page • NCPERS PERSIST Spring 2016 9
tion, and the optionality of networkexpansions.
Second, infrastructure can protectinvestors from the impact of inflation.
Global continued from page 4 The chart below illustrates how listedinfrastructure has performed relativeto global equities during differentinflation environments.Outperformance has been greatestwhen inflation is highest.
This pattern of performance is basedon several factors, including regulat-ed real returns for utilities, allowedreturns explicitly linking tolls to infla-tion, and effective barriers to entrysupporting robust pricing outcomesfor sectors without explicit inflationlinks.
These factors have helped listed infra-structure produce higher returns thanglobal equities over the long termwith less risk.
Peter Meany is the Head of Listed
Infrastructure at First State
Investments.
Peter is responsible for managing
infrastructure securities on behalf of
institutional and wholesale clients in
North America, Europe, Middle East,
and Asia-Pacific. Since establishing
the strategy in 2007, he has built a
high-quality team of investment spe-
cialists who have delivered consistent
outperformance through challenging
market conditions.
Peter has more than 19 years of expe-
rience as a specialist infrastructure
portfolio manager and analyst. Prior
to his time at First State Investments,
Peter was responsible for research
coverage of the Infrastructure &
Utilities sectors at Credit Suisse
(Australia). He also gained experience
at Credit Suisse as an analyst in the
telecom and energy sectors.
Peter started his career as an analyst at
Macquarie Equities when the infra-
structure sector was in its infancy.
Infrastructure Performance During Periods of Inflation
Source: Bloomberg and First State Investments Quarterly time series from 2000-2015
Global Listed Infrastructure Relative Risk/Return
Source: Bloomberg and First State Investments
continued on page 10

NCPERS PERSIST Spring 2016 • Return to front page10
Market Cap $bn
Listed infrastructure has deliveredmore than 90 percent of the upside ofglobal equities in rising markets, butless than 60 percent of the downsidein falling ones, making it suitable forinvestors who are looking for a rela-tively defensive investment duringmarket volatility.
As a relatively new and still growingasset class, a number of clear inefficiencies exist in the listed infrastructure market, giving man-agers the scope to generate alpha by
Global continued from page 9 taking an active approach.
For example, the sector is under-researched with few broker-dealersproviding dedicated listed infrastruc-ture research coverage. Some infra-structure stocks have been listed onlyin the last decade, and investors arestill building knowledge about theassets and their management. In addi-tion, valuation differentials can ariseamong similar stocks in the same sec-tor that are listed in different coun-tries.
Specialist global listed infrastructure
teams are well positioned to identifyand capture the mispricing that aris-es as a result of carrying out on-the-ground research by conducting thor-ough due diligence and focusing onquality.
As with any asset class, there arerisks involved. The threat of politi-cal or regulatory intervention can bea key risk for infrastructureinvestors. These risks can be miti-gated by using an active managerwho is able to recognize and man-age these risks appropriately. ❖

Return to front page • NCPERS PERSIST Spring 2016 11
the plan sponsor and the employers’ability to make required employercontributions to sustain the system, itis comparable in sound fiduciarypractice to the New York City sys-tem’s decision to invest in the long-term economic survival of the primaryplan sponsor. Development of thatinformation as part of the ESG con-sideration is an appropriate means ofinsulating the decision making of thetrustees. But can a plan align its ESGpolicy, including divestiture, with themarketplace?
The Florida Attorney General opinedthat a decision by the State Board ofInvestment (which acts as the fiduci-ary for the Florida RetirementSystem) could not adopt, in theabsence of enabling legislation, anadministrative rule on divestiturebased on ethical considerations. Theopinion continued, however, thatinstability in a region (here, SouthAfrica) would be a legitimate consid-eration in making an investment deci-sion because of the potential effect oneconomic considerations.
More recently, the Attorney Generalof Maryland considered whether Iranand Sudan divestiture was inconsis-tent with the State Retirement Board’sfiduciary duty. The Attorney Generalconcluded that divestment was appro-priate only when fair market valuewas received for the divested interests;substitute investments had compara-ble returns and risks; the timing andmanner of divestment transactionswere prudent; and the effect was deminimis as compared with “total fundassets.”
A number of plans divested fromfirearms after the school deaths inSandy Hook, Connecticut, and manydivested from tobacco for socialhealth reasons. Such decisions clearlyhave an economic impact on the
retirement plan, as they take the fundout of a potentially profitable sectorof the investment environment. Inorder to be insulated as sound fiduci-ary decisions, these divestmentactions ultimately must be rooted inthe economics of the system.
Several states have recently consid-ered or have begun adopting laws thatrequire divestiture from companiesthat boycott Israel. The question afiduciary should ask is whether thedivestment is in the best interest of theretirement plan and its members.
Divestment has generally beenshunned by pension plans and largeendowments, with the notable excep-tion of church plans, as destructive ofthe mission of achieving the highestand best returns at a reasonable risk.Divestment has most recently beencriticized for causing loss of aninvestor voice in a critical industrythat directly impacts virtually everyeconomic sector in which pensionplans are invested. The goals of ESG,particularly in the area of sustainabil-ity, are directly compromised by lossof the presence at the corporate table,thereby making divestment of fossilfuels a “futile act,” according toProfessor Edward Zelinsky of theCardozo School of Law in New YorkCity.
Not all are in agreement. On June 4,2015, Georgetown Universityannounced it would make no furtherinvestments in thermal coal. (See dis-cussion in C. Hottinger, “In Supportof Fossil Fuel Divestiture,”Georgetown InternationalEnvironmental Law Review Online,June 13, 2015.) Also, in CaliforniaGovernment Code 7513.75, theLegislature made express findings thatdivestiture from thermal coal was oflong-term economic benefit toCalifornia, although not expressly inrelation to CalPERS and CalSTRS.
The general body of American trustlaw is collected in the Restatement ofthe Law of Trusts. The current versionrelating to institutional investmentdecision making is the Restatement(3d) of the Law of Trusts. Under theRestatement, investments are to beviewed on a case-by-case basis andmade based on the informationknown at the time the investmentdecision is made rather than in hind-sight.
Comment C in Section 227 of theRestatement concludes that while theduty of loyalty of a fiduciary does notpermit a trustee to ignore legal prohi-bitions, it also “...does not require thetrustee to disregard ethical principlesgenerally applicable to investmentmanagers.” In other words, theRestatement offers seemingly self-contradictory guidance.
Divestiture will continue to be a mat-ter of controversy and politicallyinfluenced legislation. Trustees areobligated to follow their governingstatutes but should remain sensitive tothe concept that divestment decisionsshould always be soundly rooted inthe economic benefit to the retirementplan and its participants. ❖
Legal Report continued from page 5
This article is a regular feature of
PERSIST. Robert D. Klausner, a well-
known lawyer specializing in public
pension law throughout the United
States, is General Counsel of NCPERS
as well as a lecturer and law professor.
While all efforts have been made to
insure the accuracy of this section, the
materials presented here are for the
education of NCPERS members and
are not intended as specific legal
advice. For more information go to
www.robertdklausner.com.

NCPERS PERSIST Spring 2016 • Return to front page12
Don’t Miss NCPERS’ Social Media
security overall and compromise thedata of any iPhone.
WHAT SHOULD WE DO MOVING
FORWARD?
We’ll have to monitor what becomesof this legal showdown, but in themeantime, follow these tips to safe-guard your privacy:
m Enable all the security measuresyour cell phone has to offer.
m Manage your privacy settings on
Digital Privacy continued from page 6 different devices, browsers,social networks, and apps.
m Regularly review and deleteyour browser’s cookies.
m Read privacy policies on web-sites, apps, and social networksand adjust your online behavioraccordingly.
No one should have to compromiseon digital privacy. Learn moreabout what you can do to manageyour digital privacy and help pro-tect your identity at www.identity-guard.com/NCPERS. ❖
Jerry Thompson is the SVP atIntersections, Inc.®, the parent com-pany of Identity Guard®. He joinedthe company after Intersectionsacquired White Sky, Inc., where Jerrywas the co-founder and Chief RevenueOfficer. As part of White Sky’s execu-tive team, he led the development andinnovation of mobile security andcommerce applications, providingnew ways for companies to interact,monetize, and retain their customersthrough solutions that consumers usedaily to protect their identities whilebanking, investing, shopping, socializ-ing, and browsing.

NCPERS PERSIST Spring 2016 • Return to front page14
National Conference on Public
Employee Retirement Systems444 North Capitol St., NW Suite 630Washington, D.C. 20001
…The Voice for Public Pensions
Trustee Educational Seminar (TEDS) May 14 – 15, 2016Hilton San Diego Bayfront | San Diego, CA
National Accredited Fiduciary (NAF)Program May 14 – 15, 2016Hilton San Diego Bayfront | San Diego, CA
Annual Conference & Exhibition May 15 – 19, 2016Hilton San Diego Bayfront | San Diego, CA
Public Pension Funding ForumAugust 21 – 23, 2016 | New Haven, CT
Public Safety Employees Pension &Benefits Conference October 23 – 26, 2016Planet Hollywood | Las Vegas, NV
Calendar of Events 2016 2015-2016OFFICERS
Mel AaronsonPresident
Daniel A. FortunaFirst Vice President
Kathy HarrellSecond Vice President
Tina FazendineSecretary
Richard WachsmanTreasurer
Pat McElligottImmediate Past President
Hank KimExecutive Director&Counsel
EXECUTIVE BOARDMEMBERS
State EmployeesClassificationStacy BirdwellKelly L. FoxBill Lundy
County EmployeesClassificationWill PryorDale Chase
Local EmployeesClassificationCarol G. StukesRobert McCarthy
Police ClassificationKenneth A. HauserAaron Hanson
Fire ClassificationDan GivensJohn Neimiec
EducationalClassificationPatricia ReillySharon Hendricks
Protective ClassificationPeter Carozza, Jr.Emmit Kane
Canadian ClassificationRick Miller
NCPERS OFFICE
444 North Capitol St., NWSuite 630Washington, D.C. 20001ph: 1-877-202-5706fax: [email protected]
Renew Your Membershipat http://ncpers.org/Members/
Renew YourMembership
Online Today!
DON’TDELAY!

April 2016
TEXPERSIssues ImpactIng publIc pensIon Funds
Te x a s A s s o c i a t i o n o f P u b l i c E m p l o y e e R e t i r e m e n t S y s t e m s
In this issue:Studies: Women Are at Greater Risk than Men ... p. 1-2New Law Changes Social Security Rules ... p. 2Morningstar Releases ESG Sustainability Ratings for 20,000 Funds ... p.3Facts about the Public-Sector Workforce Published ... p. 3Consulting Firm Releases Guidance on Keeping DB Plans Sustainable ... p. 3More Evidence that Defined Contribution 401(k)-Style Plans ... p. 4Research Shows Public Pensions Not Taking Any More Risk Today than Before ... p. 5GAO Schools DOL on Its Poor Education of Retirement Replacement ... p. 5SEC Creates Office of Risk and Strategy for Its National Exam Program ... p. 5State and Local OPEB Commitments Outlined in New Research ... p. 6CalPERS Revises Global Governance Principles ... p. 6Digital Investment Advice Comes Under the Microscope for Broker-Dealers ... p. 7State and Local Government Contributions to Public Pension Plans ... p. 7GAO Schools DOL on Its Poor Education of Retirement Replacement Rates ... p. 8Moody’s Settles CalPERS Lawsuit over Erroneous Ratings for $130 Million ... p. 8Social Security’s Chief Actuary Estimates Cost of Repealing GPO and WEP ... p. 8Stakeholders in Arizona Reach Consensus on Major Public Pension Overhaul ... p. 9Municipal Advisor Charged for Fiduciary Duty Failings ... p. 9
OUTLOOK1225 North Loop West, Ste. 909Houston, Texas 77008Phone: (713) [email protected]
BOARD OF DIRECTORS
PresidentPAUL R. BROWNBig Spring Firemen’s Relief & Retirement Fund
First Vice PresidentSHERRY MOSEHouston Municipal Employees Pension System
Second Vice PresidentTYLER C. GROSSMANEl Paso Fire & Police Pension Fund
SecretaryJOHN D. JENKINSDallas Employees’ Retirement Fund
TreasurerEYNA CANALES-ZARATECity of Austin Employees’ Retirement System
Board Member JOSE CAVAZOSDallas Area Rapid Transit Retirement Plan and Trust
Board Member DENISE CRANDONDallas Area Rapid Transit Retirement Plan and Trust
Board Member LARRY A. REEDSan Antonio Fire & Police Pension Fund
Board Member BILLY SAMUELFort Worth Employees’ Retirement Fund
Board Member JIM SMITHSan Antonio Fire & Police Pension Fund
Board Member DAVID STACYMidland Firemen’s Relief and Retirement Fund
ASSOCIATE ADVISORS
LEON RICHARDSONABNICHOLAS STANOJEVBNY Mellon DELIA M. ROGESInvescoMICHAEL SMITHJP Morgan Asset ManagementED GRANTMFS Institutional AdvisorsJASON WIDENEROFI Institutional Asset ManagementDAVID SETTLESState Street Global AdvisorsKEVIN FETZERWilliam Blair & CompanyRICHARD C. BADGERWunderlichSTAFF
Executive DirectorMAX PATTERSONContributing EditorMATT AUKOFER
Continued on p. 2
Studies: Women Are at Greater Risk than Men of Not Achieving a Secure Retirement
A woman’s path to a secure retirement is filled with obstacles, such as lower pay and time out of the workforce for parenting or caregiving, which can negatively impact her own long-term financial prospects, according to new research from several sources. Women continue to lag behind men in terms of saving and planning for retirement, even though they are better educated and enjoy better career opportunities than previous generations, according to a report by the Transamerica Center for Retirement Studies. The findings are especially concerning because women statistically tend to live longer than men, meaning there is an even greater need for savings and retirement preparations. The report lays out 16 facts about women’s retirement outlook and explains why women are at a greater risk of not achieving a financially secure retirement compared to men. Among the findings: • Half of women plan to continue working in retirement. Fifty-one percent of women plan
to work after they retire, including 40% who plan to work part-time and 11% who plan to work full-time.

Page 2 TEXPERS Outlook April 2016
Women at Risk continued from p. 1
• Most baby boomer women do not have a backup plan. Among baby boomers (born 1946 to 1964), an alarmingly low percentage of women (21%) and men (30%) have a backup plan if forced into retirement sooner than expected.
• Many women plan to self-fund their retirement. Nearly half of women (46%) expect to self-fund their retirement through 401(k) or similar retirement accounts (35%) or other savings and investments (11%).
On the Web at: https://www.transamericacenter.org/retirement-research/women-and-retirement. Meanwhile, a new study from the National Institute on Retirement Security (NIRS) documents the vulnerability for women in retirement. The study, “Shortchanged in Retirement, The Continuing Challenges to Women’s Financial Future” and released on March 1 finds that women are far more likely than men to face financial hardship in retirement, revealing that across all age groups, women have substantially less income in retirement than men. For women age 65 and older, the data indicate that their typical income is 25 percent lower than men. Furthermore, men’s income advantage expands to 44 percent by age 80 and older. Women are 80 percent more likely than men to be impoverished at age 65 and older, “while women age 75 to 79 were three times more likely to fall below the poverty level as compared to their male counterparts,” according to NIRS. The NIRS report, in addition to making these troubling findings, also contains public policy options that can help reduce women’s vulnerability to financial hardship in retirement. On the Web at: http://www.nirsonline.org/index.php?option=content&task=view&id=912 and http://www.nirsonline.org/index.php?option=com_content&task=view&id=912&Itemid=48. Finally, BNY Mellon released a new publication that explores how women in all stages of life can prepare for a secure retirement. It examines how women’s challenges evolve over the decades as they prepare for retirement, and offers ideas for actions they can take at any age. The guide, “The Retirement Challenge – Dilemmas and Decisions Through Every Decade,” is designed to help women face with the prospect of preparing for retirement. It helps answer questions such as: How will the markets affect
New Law Changes Social Security Rules about Claiming Retirement and Spousal Benefits Social Security’s rules about claiming benefits are changing. The Bipartisan Budget Act that passed last November closed two complex loopholes that were used primarily by married couples. The Social Security Administration (SSA) is educating the public about why the rules were changed, how the change might affect beneficiaries and what they should do next. The new law closed loopholes that allowed some married couples to receive higher benefits than intended. Only a small fraction of retirees used these loopholes. SSA says closing them helped restore fairness and strengthened Social Security’s long-term financing. The first change states that if you are eligible for benefits both as a retiree and as a spouse (or divorced spouse), you must start both benefits at the same time. This “deemed filing” used to apply only before full retirement age, which is currently 66. Now it applies at any age up to 70, if you turned 62 after January 1, 2016. The second rule change states that if you take your retirement benefit and then ask (on or after April 30, 2016) to suspend it to earn delayed retirement credits, your spouse or dependents generally will not be able to receive benefits on your Social Security record during the suspension. You also will not be able to receive spouse benefits on anyone else’s record during that time. On the Web at: https://www.ssa.gov/planners/retire/claiming.html.
my portfolio? Will I see reductions to my Social Security? How healthy will I be? What am I not thinking of that might send a shock wave through my plans? Women face a variety of compounding factors in retirement, such as: longer average life expectancies, lower incomes during working years, gaps in employment, lower savings levels, higher medical costs and higher taxes. The publication provides specific detail for women planning their retirement through each decade of life, starting with the twenties and ending with the seventies and beyond. On the Web at: https://www.bnymellon.com/us/en/newsroom/news/company-news/the-retirement-challenge-dilemmas-and-decisions-through-every-decade.jsp.

April 2016 TEXPERS Outlook Page 3
Morningstar Releases ESG Sustainability Ratings for 20,000 FundsMorningstar Inc. has released the investment industry’s first sustainability rating for 20,000 funds to help investors evaluate funds based on environmental, social and corporate governance (ESG). The new ratings will enable investors to evaluate mutual funds and exchange-traded funds based on how well the companies held in their funds are managing their ESG risks and opportunities. Morningstar rolled out its first batch of mutual fund scores with sustainable-investing grades related to ESG screens applied to the underlying securities in each fund. The scoring system add scores at both the fund and category levels. Funds receive scores based on ESG metrics applied to their underlying holdings, and at least 50% of funds underlying holdings need to be scored in order for the fund to receive an ESG score. Many investors are interested in sustainable investing, but unsure how to put it into practice. On the Web at: https://www.morningstar.com/news/pr-news-wire/PRNews_20160301CG33842/morningstar-introduces-industrys-first-sustainability-rating-for-20000-funds-globally-giving-investors-new-way-to-evaluate-investments-based-on-environmental-social-and-governance-esg-factors.html
Consulting Firm Releases Guidance on Keeping DB Plans Sustainable Defined benefit (DB) pension plans continue to be a great recruiting tool because employees prefer traditional pensions, according to the consulting firm Willis Towers Watson. “With so many companies changing to defined contribution (DC) plans in recent years to reduce cost and risk, organizations that still offer DB plans are finding they are instrumental in attracting and retaining employees,” firm says in introducing a new guide on making DB plans sustainable. “In fact, according to our most recent Global Benefits Attitudes Study, globally, employee desire for retirement security and guaranteed benefits has never been higher,” the firm said. “With the value of these programs growing, plan sponsors face a greater need than ever to manage, their cost and cost volatility over the long-term.” The firm’s new guidance includes 10 strategies to make DB plans sustainable. The strategies cover compliance/governance; plan design; administration; communication; assumptions; plan costs; plan funding, and more. On the Web at: https://www.towerswatson.com/en/Services/Services/sustaining-for-success and https://www.towerswatson.com/DownloadMedia.aspx?media={B8700D4F-BF67-4C65-9D0D-F3F2193B4A80}.
Facts about the Public-Sector Workforce Published More than 40% of the local government workforce will be eligible for retirement by 2017, according to a publication released by Govtech.com, the online portal to Government Technology, a division of e.Republic, Inc., whose primary focus is on public-sector innovation for state and local government and education. The publication, “Reviving the Public Sector Employee Lifecycle,” also states that it takes an average of 36 days for government agencies to hire a new employee – and even longer to fill positions that require specialized skills. Nearly 25% of federal government hires leave their jobs within two years, and the cost to replace a government employee is approximately one-fifth of salary. The publication states that governments must be more strategic in selecting employees – and more effective in retaining them. On the Web at: http://www.govtech.com/library/papers/Reviving-the-Public-Sector-Employee-Lifecycle-8747.html.
Are you on track to meet the PRB Minimum Training Requirements by
12/31/16?Ensure your plan is in compliance
Learn more: http://www.prb.state.tx.us/resource-center/trustees-administrators/educational-training-program/
PRB online classes now availableContact TEXPERS at [email protected] with questions.
TEXPERS Basic Trustee Training (BTT) meets the PRB rules:
Next Class: May 18 in Houston

April 2016TEXPERS OutlookPage 4
Have you logged in lately? http://www.texpers.org/login.asp
Members Only Can AccessAn online, searchable Membership Directory: From Your Profile >>> Left menu >>> Under BookmarksCan’t Remember Your Login? No problem! Click “Forgot Password” and Use the Email address on file with TEXPERS to receive temporary login credentials
More Evidence that Defined Contribution 401(k)-Style Plans Continue Failing Retirees
Studies and articles continue to show how wrong it is for states and localities to dismantle their traditional defined benefit (DB) pension plans in favor of 401(k)-style defined contribution (DC) plans. Dan Doonan, a senior pension specialist at the National Education Association (NEA) in Washington, wrote an article that appeared in the Feb. 24, 2016, Bloomberg BNA “Pension and Benefits” blog entitled “401(K) Plans’ Inefficiency Struggles Will Grow.”
In it, Doonan outlines why the 401(k) model “is no closer to working today” than it was when it was created, despite 35 years of “tweaking.” Doonan concludes that the system “remains inefficient, and financial advisors still can’t tell people how much they can safely withdraw per year in retirement.” “For individuals in or approaching retirement today, the fundamentals they face are brutal: historically low bond yields and a loss of principal (in “safe” bond investments) if interest rates rise,” Doonan wrote. “Meanwhile, retail investment advisors continue to fight a requirement that they work in their client’s interests – what most of us see as a basic professional responsibility!”
Meanwhile, a column in Slate authored by Helaine Olen implores: “It’s time for the presidential candidates to give it the urgency it deserves.” In “The Retirement Crisis Is Getting Truly Scary,” Olen stresses that the numbers are getting “worse and worse,” pointing out that a lot of people “still don’t seem to think they can afford to save money for retirement at all, or they can’t figure out how to do it.” “Even as expert after expert stresses the importance of saving for retirement, the percentage of prime-working-age families putting money aside in any type of retirement plan fell from 60 percent in 2000 to 53 percent in 2013,” she notes, underscoring that for “almost every age cohort, the median amount invested in retirement plans was lower in 2013 than prior to the start of the Great Recession.” The Slate article points out that with regard to the presidential campaign, Bernie Sanders “champions an expansion in Social Security benefits, financed by lifting the payroll tax cap on income greater than $250,000,” while Hillary Clinton “supports instituting a caregiver credit and recalculating the method used to determine survivor benefits.” However, as Olen also points out, addressing Social Security is only one piece of what she calls “the retirement puzzle.” But talking about how to increase retirement savings “gets no love,” she says. A new study from the Economic Policy Institute (EPI), entitled “The State of American Retirement: How 401(k)s Have failed Most American Workers,” by economist Monique Morrissey, includes a “chartbook” assessing the impact of the shift from pensions to individual savings by examining disparities in retirement
Continued on p. 6
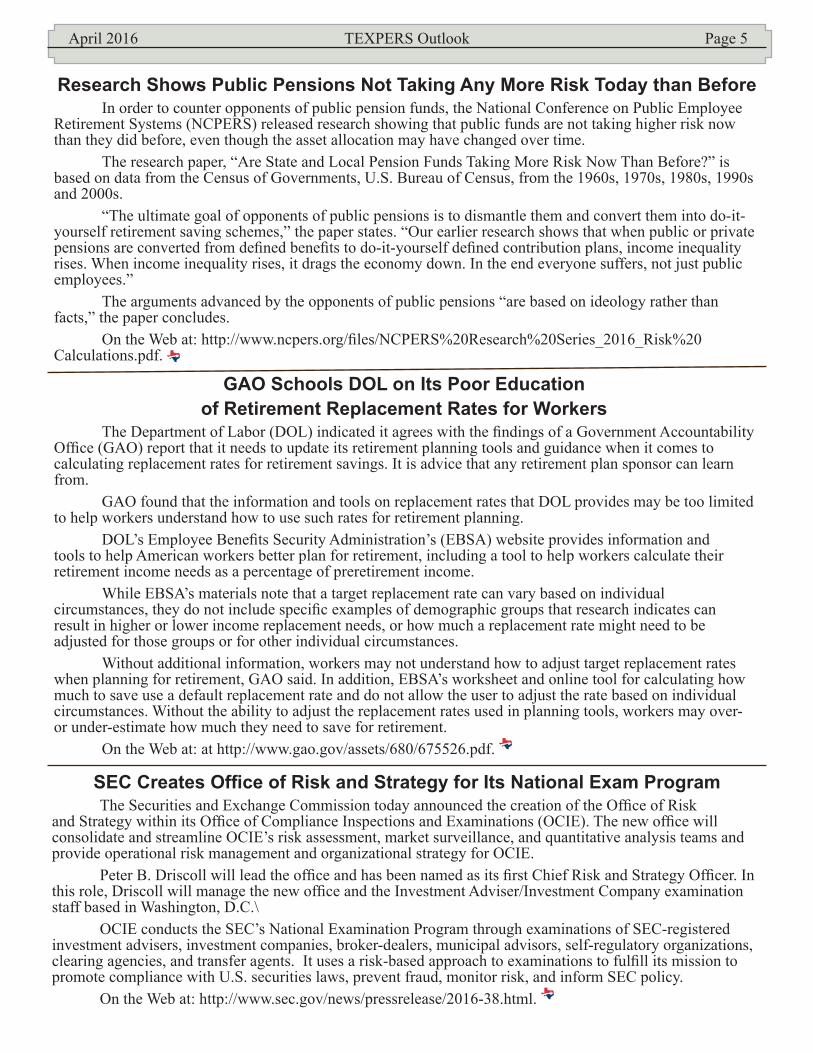
TEXPERS Outlook Page 5April 2016
Research Shows Public Pensions Not Taking Any More Risk Today than Before In order to counter opponents of public pension funds, the National Conference on Public Employee Retirement Systems (NCPERS) released research showing that public funds are not taking higher risk now than they did before, even though the asset allocation may have changed over time. The research paper, “Are State and Local Pension Funds Taking More Risk Now Than Before?” is based on data from the Census of Governments, U.S. Bureau of Census, from the 1960s, 1970s, 1980s, 1990s and 2000s. “The ultimate goal of opponents of public pensions is to dismantle them and convert them into do-it-yourself retirement saving schemes,” the paper states. “Our earlier research shows that when public or private pensions are converted from defined benefits to do-it-yourself defined contribution plans, income inequality rises. When income inequality rises, it drags the economy down. In the end everyone suffers, not just public employees.” The arguments advanced by the opponents of public pensions “are based on ideology rather than facts,” the paper concludes. On the Web at: http://www.ncpers.org/files/NCPERS%20Research%20Series_2016_Risk%20Calculations.pdf.
GAO Schools DOL on Its Poor Education of Retirement Replacement Rates for Workers
The Department of Labor (DOL) indicated it agrees with the findings of a Government Accountability Office (GAO) report that it needs to update its retirement planning tools and guidance when it comes to calculating replacement rates for retirement savings. It is advice that any retirement plan sponsor can learn from. GAO found that the information and tools on replacement rates that DOL provides may be too limited to help workers understand how to use such rates for retirement planning. DOL’s Employee Benefits Security Administration’s (EBSA) website provides information and tools to help American workers better plan for retirement, including a tool to help workers calculate their retirement income needs as a percentage of preretirement income. While EBSA’s materials note that a target replacement rate can vary based on individual circumstances, they do not include specific examples of demographic groups that research indicates can result in higher or lower income replacement needs, or how much a replacement rate might need to be adjusted for those groups or for other individual circumstances. Without additional information, workers may not understand how to adjust target replacement rates when planning for retirement, GAO said. In addition, EBSA’s worksheet and online tool for calculating how much to save use a default replacement rate and do not allow the user to adjust the rate based on individual circumstances. Without the ability to adjust the replacement rates used in planning tools, workers may over- or under-estimate how much they need to save for retirement. On the Web at: at http://www.gao.gov/assets/680/675526.pdf.
SEC Creates Office of Risk and Strategy for Its National Exam Program The Securities and Exchange Commission today announced the creation of the Office of Risk and Strategy within its Office of Compliance Inspections and Examinations (OCIE). The new office will consolidate and streamline OCIE’s risk assessment, market surveillance, and quantitative analysis teams and provide operational risk management and organizational strategy for OCIE. Peter B. Driscoll will lead the office and has been named as its first Chief Risk and Strategy Officer. In this role, Driscoll will manage the new office and the Investment Adviser/Investment Company examination staff based in Washington, D.C.\ OCIE conducts the SEC’s National Examination Program through examinations of SEC-registered investment advisers, investment companies, broker-dealers, municipal advisors, self-regulatory organizations, clearing agencies, and transfer agents. It uses a risk-based approach to examinations to fulfill its mission to promote compliance with U.S. securities laws, prevent fraud, monitor risk, and inform SEC policy. On the Web at: http://www.sec.gov/news/pressrelease/2016-38.html.

April 2016TEXPERS OutlookPage 6
preparedness and outcomes by income, race, ethnicity, education, gender, and marital status. The first section examines retirement-plan participation and retirement account savings of working-age families, focusing on those headed by someone age 32-61, “a 30-year period before the Social Security early eligibility age of 62 when most families should be accumulating pension benefits and retirement savings,” as she explains. The second section looks at seniors and their income sources, focusing on retirement outcomes of people age 65 and older. It paints a “picture of increasingly inadequate savings and retirement income for successive generations of Americans – and growing disparities by income, race, ethnicity, education, and marital status,” Morrissey warns. “Women, who by some measures are narrowing gaps with men, remain much more vulnerable in retirement due to lower lifetime earnings and longer life expectancies,” she finds. The bottom line: “Decades after the number of active participants in 401(k)-style plans edged out those in traditional pensions, 401(k)s are not delivering substantial income in retirement, and that income is not equally shared,” Morrissey concludes. The shift from pensions to account-type savings plans “has been a disaster for lower-income, black, Hispanic, non-college-educated, and single workers, who together add up to a majority of the American population,” she adds. However, she also points out that “even among upper-income white college-educated married couples, many do not have adequate retirement savings or benefits.” “The evidence presented in this chartbook—that the retirement system does not work for most workers – underscores the importance of preserving and expanding Social Security, defending defined-benefit pensions for workers who have them, and seeking new solutions for those who do not,” Morrissey concludes. On the Web at: http://www.bna.com/401k-plans-inefficiency-b57982067698/, http://www.slate.com/articles/business/the_bills/2016/03/retirement_for_americans_is_getting_even_scarier_the_candidates_need_to.html, http://www.epi.org/publication/retirement-in-america/, http://www.businessinsider.com/why-the-401k-isnt-working-2016-3 and http://www.latimes.com/business/hiltzik/la-fi-mh-six-charts-on-the-retirement-crisis-20160302-column.html
401-K Style Plans continued from p. 4 State and Local OPEB Commitments Outlined in New Research Aggregate unfunded Other Post-Employment Benefits (OPEB) liabilities are estimated to be $862 billion – nearly two thirds of which is held at the local level, according to new research conducted for the Center for State & Local Government Excellence (SLGE). These liabilities are equivalent to 28 percent of unfunded pension liabilities and while OPEB liabilities are large, several factors limit their potential drain on state and local resources, the researchers found. The research provides an updated accounting of OPEB commitments with data for 2012 or 2013. The first section describes the evolution of the new reporting framework. The second section discusses the OPEB sample. The third section compares OPEB and pension liabilities in the aggregate, and the fourth section puts the OPEB liabilities in perspective. The report, “How Big a Burden Are State and Local OPEB Benefits?” is available at: http://slge.org/wp-content/uploads/2016/03/16-03-SLGE-OPEBweb.pdf.
CalPERS Revises Global Governance Principles The California Public Employees’ Retirement System (CalPERS) Board of Administration has adopted a revised version of its Global Governance Principles, including a new provision that cautions that corporate board directors who serve more than 12 years on the same company board are at risk of compromising their independence. If a director reaches 12 years of service on a board, CalPERS’ principles now call for a company to carry out rigorous evaluations either to classify the director as non-independent or provide a detailed explanation as to why the director continues to be independent. The principles serve as framework by which CalPERS executes its shareowner proxy voting responsibilities; engages public companies to achieve long-term, sustainable risk-adjusted returns; and works with internal and external investment managers to ensure that their practices align with CalPERS’ Investment Beliefs. On the Web at: https://www.calpers.ca.gov/docs/board-agendas/201603/invest/item05a-02.pdf.

April 2016 TEXPERS Outlook Page 7
State and Local Government Contributions to Public Pension Plans Reached $121 Billion in FY’14 On average, retirement programs remain a relatively small part of state and local government spending, although required costs, benefit levels, funding levels, and funding adequacy vary widely, and this rate has been rising in recent years, according to new research by the National Association of State Retirement Administrators (NASRA). Based on the most recent U.S. Census Bureau data, 4.1 percent of all state and local government spending is used to fund pension
Digital Investment Advice Comes Under the Microscope for Broker-Dealers The Financial Industry Regulatory Authority (FINRA) is reminding broker-dealers of their obligations under FINRA rules when it comes to digital investment advice, which includes technology management, portfolio development and conflicts of interest mitigation. FINRA, a non-governmental organization that regulates member brokerage firms and exchange markets, released a new report that offers guidance for investors in evaluating investment advice derived entirely or in part from digital investment advice tools, sometimes known as “robo advisors.” The report does not create any new legal requirements or change any existing broker-dealer regulatory obligations. But it does identify practices that FINRA believes firms should consider and tailor to their business mode. The 17-page report gives broker-dealers a “firm reminder” about areas of concern with digital advice, particularly the use of algorithm-based investments and relying solely on automated questionnaires. Online advice firms have experienced explosive growth. They are expected to gather more than $655 billion in assets by 2019, up from $192.4 billion in 2014, according to research firm Tiburon Strategic Advisors. The promise of digital assets has prompted moves from a variety of firms: Merrill Lynch announced it was developing a robo advice platform, while LPL is in the pilot phase of developing its own digital advice offering. On the Web at: http://www.finra.org/sites/default/files/digital-investment-advice-report.pdf?utm_source=MM&utm_medium=email&utm_campaign=NewsRelease_031516_FINAL.
benefits for employees of state and local government. Pension costs have remained within a narrow range over a 30-year period, declining from a high point of 5.0 percent, in FY’85, to a low of 2.3 percent in FY’02, and reaching 4.1 percent in FY’13, the research found. State and local governments contributed, in aggregate, an estimated $121 billion to pension funds in FY’14, a figure that is projected to equal 4.5 percent of projected state and local direct general spending. More than $250 billion is paid out annually from these trusts to retirees and their beneficiaries, reaching virtually every city and town in the nation, according to the report, “State and Local Government Spending on Public Employee Retirement Systems.” Changes to benefit levels and required employee contributions adopted by states and cities have been widespread and diverse, depending in part on such factors as the legal authority to make changes to benefits or required employee contribution rates, and the plan’s financial condition. Generally, states and cities with a history of paying their required pension contributions are in better condition and have needed more minor adjustments to benefits or financing arrangements compared to those with a history of not adequately making their contributions, the report found. On the Web at: http://www.nasra.org/files/Issue%20Briefs/NASRACostsBrief.pdf.
Save the Date!Summer Educational
ForumAugust 14 - 16, 2016
Grand HyattSan Antonio, TX

TEXPERS OutlookPage 8 April 2016
GAO Schools DOL on Its Poor Education of Retirement Replacement Rates for Workers The Department of Labor (DOL) indicated it agrees with the findings of a Government Accountability Office (GAO) report that it needs to update its retirement planning tools and guidance when it comes to calculating replacement rates for retirement savings. It is advice that any retirement plan sponsor can learn from. GAO found that the information and tools on replacement rates that DOL provides may be too limited to help workers understand how to use such rates for retirement planning. DOL’s Employee Benefits Security Administration’s (EBSA) website provides information and tools to help American workers better plan for retirement, including a tool to help workers calculate their retirement income needs as a percentage of preretirement income. While EBSA’s materials note that a target replacement rate can vary based on individual circumstances, they do not include specific examples of demographic groups that research indicates can result in higher or lower income replacement needs, or how much a replacement rate might need to be adjusted for those groups or for other individual circumstances. Without additional information, workers may not understand how to adjust target replacement rates when planning for retirement, GAO said. In addition, EBSA’s worksheet and online tool for calculating how much to save use a default replacement rate and do not allow the user to adjust the rate based on individual circumstances. Without the ability to adjust the replacement rates used in planning tools, workers may over- or under-estimate how much they need to save for retirement. On the Web at: at http://www.gao.gov/assets/680/675526.pdf.
Moody’s Settles CalPERS Lawsuit over Erroneous Ratings for $130 Million The California Public Employees’ Retirement System (CalPERS) has won a record $130 million settlement from Moody’s and Moody’s Investors’ Services, stemming from the firms’ erroneous “AAA” ratings of certain investments that performed poorly during the 2008 and 2009 financial crisis. Early in 2015, CalPERS settled with separate defendant, Standard & Poor’s, for $125 million, bringing total recovery from the now-
concluded lawsuit to $255 million. The lawsuit is now resolved against Moody’s, and restores money that belonged to CalPERS members and employers, said Matthew Jacobs, general counsel for CalPERS. CalPERS sued Moody’s and other rating agencies in 2009 after the nation’s largest public pension plan sustained losses from investments in three structured investment vehicles that relied on the liquidity of assets that turned out to be much more illiquid than portrayed by their sellers and raters, such as subprime retail mortgage backed securities, collateralized debt obligations and other asset-backed securities. In the initial lawsuit, CalPERS alleged that Moody’s made negligent misrepresentations by assigning the investments their highest credit rating. On the Web at: https://www.calpers.ca.gov/page/newsroom/calpers-news/2016/settles-moodys-negligent-ratings-case.
Social Security’s Chief Actuary Estimates Cost of Repealing GPO and WEP The Social Security Administration’s chief actuary has responded to a senatorial request for an estimate of the financial consequences of eliminating the Government Pension Offset (GPO) and the Windfall Elimination Provision (WEP). The chief actuary, Stephen C. Goss, was responding to a request from U.S. Sen. Sherrod Brown (D-Ohio) with respect to his introduction of S. 1651, the Social Security Fairness Act of 2015, introduced on June 23, 2015. The bill would eliminate the GPO and WEP from the Social Security Act. Assuming enactment of the elimination proposals effective for all benefits payable for entitlement in January 2017 and later (without regard for when the beneficiary became initially entitled), Goss estimated the increase in benefit obligations for the Old Age, Survivor Disability Insurance program would reduce the OASDI long-range actuarial balance by 0.13% of taxable payroll, and would change the projected year of reserve depletion for the combined OASI and DI Trust Funds from 2034 under current law to 2033 under the proposal. GPO and WEP provisions reduce OASI and DI benefits for most workers who receive a pension based on earnings in employment that was not covered under the Social Security program. About one-fourth of state and local government employees are currently not covered
Continued on p. 9

TEXPERS Outlook Page 9April 2016
under Social Security. Most federal government employees who were hired before 1984 were not covered. Workers not covered incur no OASDI payroll tax liability and also earn no credit toward benefits under the program from the non-covered earnings. In addition, employers of workers not covered also pay no OASDI payroll tax based on their earnings. “As shown in the enclosed table, the cost of benefits under the OASDI program would be increased by 0.14 percent of taxable payroll over the next 75 years. This additional cost would be partly offset by increased federal income tax on OASDI benefits dedicated to the trust funds in the amount of 0.01 percent of payroll over the 75-year period,” Goss wrote. On the Web at: https://www.ssa.gov/oact/solvency/SBrown_20160224.pdf.
Social Security continued from p. 8
Stakeholders in Arizona Reach Consensus on Major Public Pension Overhaul Arizona’s sweeping overhaul of its statewide public-safety pension system is a model of reform that other states should follow if they want to curb unfunded pension liabilities, according to an article in Governing. Arizona’s Public Safety Personnel Retirement System (PSPRS) faced $12.7 billion in liabilities and $6.2 billion in assets. Spurred on by state Sen. Debbie Lesko and other legislators, the stakeholders involved made a bipartisan effort at reform and did so “thoughtfully,” including the PSPRS, firefighters’ and police officers’ associations and local governments, the authors wrote. Arizona reforms included replacing the broken cost-of-living formula structure with a traditional Consumer Price Index-based calculation for employees and retirees; offering new workers a choice between a defined-contribution plan and a traditional defined-benefit plan; and requiring new employees and their employers to share equally, 50/50, in retirement account costs. Without immediate changes, Arizona’s pension debt would have continued to escalate, with every downturn in the market putting the system at risk of collapse. On the Web at: http://www.governing.com/gov-institute/voices/col-consensus-public-pension-reform.html.
Municipal Advisor Charged for Fiduciary Duty Failings Kansas-based Central States Capital Markets, its CEO and two employees have been charged with for breaching their fiduciary duty by failing to disclose a conflict of interest to a municipal client. The case is the Securities and Exchange Commission’s (SEC) first to enforce the fiduciary duty for municipal advisors created by the 2010 Dodd-Frank Act, which requires these advisors to put their municipal clients’ interests ahead of their own. While Central States served as a municipal advisor to a client on municipal bond offerings in 2011, two of its employees, in consultation with the CEO, arranged for the offerings to be underwritten by a broker-dealer where all three worked as registered representatives, the SEC charged. The order found that Central States CEO John Stepp and employees Mark Detter and David Malone did not inform the client, identified in the order only as “the City,” of their relationship to the underwriter or the financial benefit they obtained from serving in dual roles. Municipal advisors advise municipal and conduit borrowers about the terms of offerings, including interest rates, the selection of underwriters, and underwriting fees. In the three offerings, Central States collected fees from the City for the municipal advisory work and received 90 percent of the underwriting fees the City paid to the broker-dealer. The SEC’s order found that Central States, Stepp, Detter, and Malone, breached their duty to the City by failing to disclose the conflict of interest. The order found that Detter and Malone were aware of the conflict and that Detter emailed Malone that “we should resign” as municipal advisor to serve solely as underwriter on the offerings. Central States agreed to settle the SEC’s charges by paying $289,827.80 in disgorgement and interest and an $85,000 civil penalty. Detter agreed to settle the charges by paying a $25,000 civil penalty and agreeing to a bar from the financial services industry for a minimum of two years. Malone agreed to settle the charges by paying a $20,000 civil penalty and agreeing to a bar from the financial services industry for a one-year minimum. Stepp agreed to settle the charges by paying a $17,500 civil penalty and agreeing to a six-month suspension from acting in a supervisory capacity with any broker-dealer, investment adviser, or municipal advisor. On the Web at: http://www.sec.gov/litigation/admin/2016/34-77369.pdf.

1 of 4 * New/No one has signed up
Future Education and Business Related Travel Regular Board Meeting – April 14, 2016
ATTENDING
1. Conference: Society of Pension Professionals JS, JB, GI, CW Dates: April 19, 2016 Location: Dallas, TX Est. Cost: $250.00 Per Person Annually 2. Conference: TEXPERS Secure Retirement for All SF, CC, BH Dates: April 21-22, 2016 Location: Washington, DC Est. Cost: $1,000
Special Board Meeting April 28, 2016
3. Conference: Commerce Street Capital: Bank Conference JB, KH Dates: April 28, 2016 Location: Irving, TX Est. Cost: $275 4. Conference: Wharton: Portfolio, Concepts, and Management BH, CC, TH Dates: May 2-5, 2016 Location: Pennsylvania, PA Est. Cost: $5,000

2 of 4 * New/No one has signed up
5. Conference: PRB Meeting SF, KG, JMond Dates: May 5, 2016 Location: Austin, TX Est. Cost: $250
Regular Board Meeting May 12, 2016
6. Conference: NCPERS Trustee Educational Seminar (TEDS) JM Dates: May 14-15, 2016 Location: San Diego, CA Est. Cost: $750 7. Conference: NCPERS Accredited Fiduciary (NAF) Program KH, SF, CC Dates: May 14-15, 2016 Location: San Diego, CA Est. Cost: $900
8. Conference: NCPERS Annual Conference KH, SF, JM, CC Dates: May 15-19, 2016 Location: San Diego, CA Est. Cost: $2,500 9. Conference: Pharos Annual Investor Conference KH, JB, GI Dates: June 7-8, 2016 Location: Irving, TX Est. Cost: None
Regular Board Meeting June 9, 2016

3 of 4 * New/No one has signed up
10. Conference: Society of Pension Professionals JS, JB, GI, CW Dates: June 21, 2016 Location: Dallas, TX Est. Cost: $250.00 Per Person Annually
Regular Board Meeting July 14, 2016 11. Conference: Society of Pension Professionals JS, JB, GI, CW Dates: July 19, 2016 Location: Dallas, TX Est. Cost: $250.00 Per Person Annually 12. Conference: Wharton: International and Emerging Market Investing TH, BH Dates: July 25-27, 2016 Location: San Francisco, CA Est. Cost: $6,000
Regular Board Meeting August 11, 2016 13. Conference: TEXPERS Summer Educational Forum SF Dates: August 14-16, 2016 Location: San Antonio, TX Est. Cost: TBD 14. Conference: NCPERS Public Pensions Funding Forum SF Dates: August 21-23, 2016 Location: New Haven, CT Est. Cost: TBD
Regular Board Meeting September 8, 2016

4 of 4 * New/No one has signed up
15. Conference: Society of Pension Professionals JS, JB, GI, CW Dates: September 20, 2016 Location: Dallas, TX Est. Cost: $250.00 Per Person Annually 16. Conference: TLFFRA Pension Conference * Dates: October 2-4, 2016 Location: McAllen, TX Est. Cost: TBD
Regular Board Meeting October 13, 2016 Board and Staff Workshop October 17-19, 2016 17. Conference: NCPERS Public Safety Conference SF Dates: October 23-26, 2016 Location: Las Vegas, NV Est. Cost: TBD
Regular Board Meeting November 10, 2016 Regular Board Meeting December 8, 2016
18. Conference: Society of Pension Professionals JS, JB, GI, CW Dates: December 20, 2016 Location: Dallas, TX Est. Cost: $250.00 Per Person Annually 19. Conference: PRB: MET Online Course: Benefits Administration Dates: Anytime on line Location: PRB.org

1 of 1 * New/No one has signed up
Future Investment Related Travel Regular Board Meeting – April 14, 2016
NONE