AGE AND GENDER RELATED CHANGES IN MIDSAGITTAL DIMENSIONS OF THE LUMBAR SPINE IN NORMAL EGYPTIANS:...
20
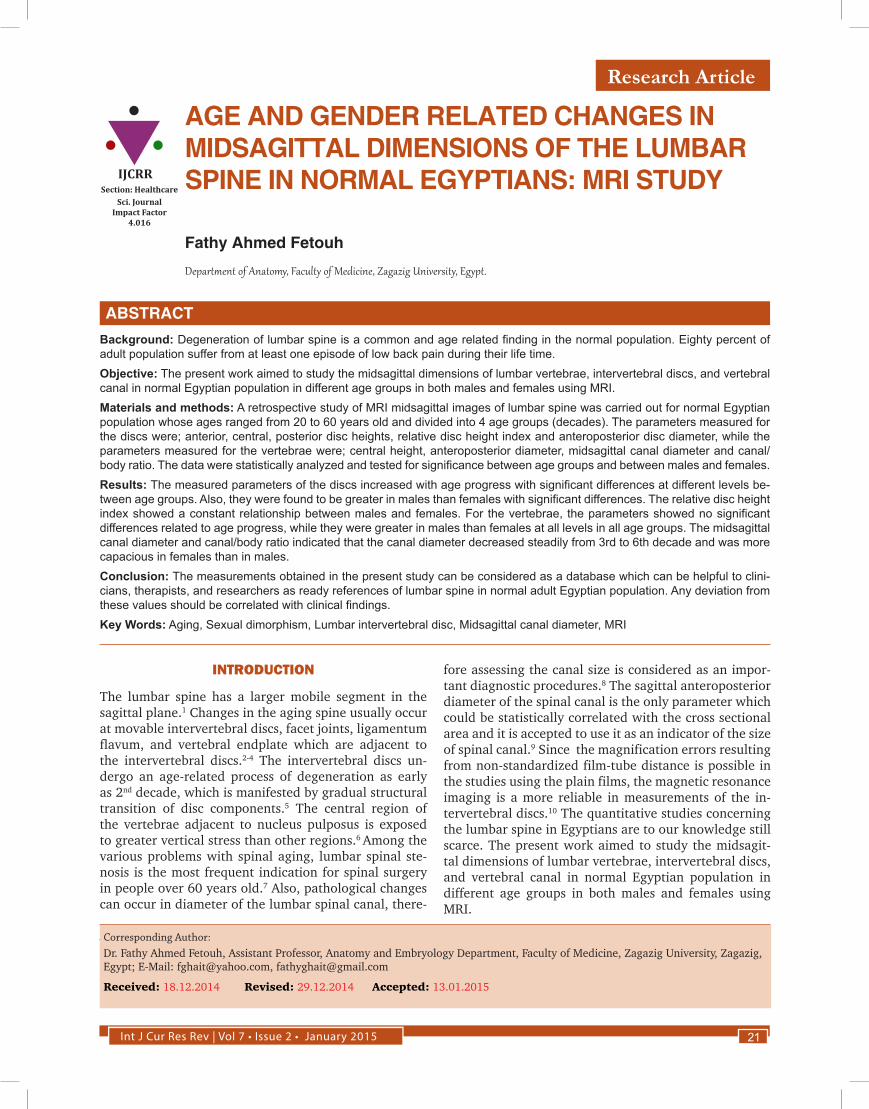
Research Article Int J Cur Res Rev | Vol 7 • Issue 2 • January 2015 21 AGE AND GENDER RELATED CHANGES IN MIDSAGITTAL DIMENSIONS OF THE LUMBAR SPINE IN NORMAL EGYPTIANS: MRI STUDY Fathy Ahmed Fetouh Department of Anatomy, Faculty of Medicine, Zagazig University, Egypt. ABSTRACT Background: Degeneration of lumbar spine is a common and age related finding in the normal population. Eighty percent of adult population suffer from at least one episode of low back pain during their life time. Objective: The present work aimed to study the midsagittal dimensions of lumbar vertebrae, intervertebral discs, and vertebral canal in normal Egyptian population in different age groups in both males and females using MRI. Materials and methods: A retrospective study of MRI midsagittal images of lumbar spine was carried out for normal Egyptian population whose ages ranged from 20 to 60 years old and divided into 4 age groups (decades). The parameters measured for the discs were; anterior, central, posterior disc heights, relative disc height index and anteroposterior disc diameter, while the parameters measured for the vertebrae were; central height, anteroposterior diameter, midsagittal canal diameter and canal/ body ratio. The data were statistically analyzed and tested for significance between age groups and between males and females. Results: The measured parameters of the discs increased with age progress with significant differences at different levels be- tween age groups. Also, they were found to be greater in males than females with significant differences. The relative disc height index showed a constant relationship between males and females. For the vertebrae, the parameters showed no significant differences related to age progress, while they were greater in males than females at all levels in all age groups. The midsagittal canal diameter and canal/body ratio indicated that the canal diameter decreased steadily from 3rd to 6th decade and was more capacious in females than in males. Conclusion: The measurements obtained in the present study can be considered as a database which can be helpful to clini- cians, therapists, and researchers as ready references of lumbar spine in normal adult Egyptian population. Any deviation from these values should be correlated with clinical findings. Key Words: Aging, Sexual dimorphism, Lumbar intervertebral disc, Midsagittal canal diameter, MRI Corresponding Author: Dr. Fathy Ahmed Fetouh, Assistant Professor, Anatomy and Embryology Department, Faculty of Medicine, Zagazig University, Zagazig, Egypt; E-Mail: [email protected], [email protected] Received: 18.12.2014 Revised: 29.12.2014 Accepted: 13.01.2015 INTRODUCTION The lumbar spine has a larger mobile segment in the sagittal plane. 1 Changes in the aging spine usually occur at movable intervertebral discs, facet joints, ligamentum flavum, and vertebral endplate which are adjacent to the intervertebral discs. 2-4 The intervertebral discs un- dergo an age-related process of degeneration as early as 2 nd decade, which is manifested by gradual structural transition of disc components. 5 The central region of the vertebrae adjacent to nucleus pulposus is exposed to greater vertical stress than other regions. 6 Among the various problems with spinal aging, lumbar spinal ste- nosis is the most frequent indication for spinal surgery in people over 60 years old. 7 Also, pathological changes can occur in diameter of the lumbar spinal canal, there- fore assessing the canal size is considered as an impor- tant diagnostic procedures. 8 The sagittal anteroposterior diameter of the spinal canal is the only parameter which could be statistically correlated with the cross sectional area and it is accepted to use it as an indicator of the size of spinal canal. 9 Since the magnification errors resulting from non-standardized film-tube distance is possible in the studies using the plain films, the magnetic resonance imaging is a more reliable in measurements of the in- tervertebral discs. 10 The quantitative studies concerning the lumbar spine in Egyptians are to our knowledge still scarce. The present work aimed to study the midsagit- tal dimensions of lumbar vertebrae, intervertebral discs, and vertebral canal in normal Egyptian population in different age groups in both males and females using MRI. IJCRR Section: Healthcare Sci. Journal Impact Factor 4.016
Transcript of AGE AND GENDER RELATED CHANGES IN MIDSAGITTAL DIMENSIONS OF THE LUMBAR SPINE IN NORMAL EGYPTIANS:...
Research Article
Corresponding Author:Anil Pawar, Assistant Professor, Department of Zoology, D.A.V. College for Girls, Yamunanagar (Haryana); Mobile:919467604205; Email: [email protected]
Received: 16.6.2014 Revised: 11.7.2014 Accepted: 29.7.2014
Int J Cur Res Rev | Vol 7 • Issue 2 • January 2015 21
AGE AND GENDER RELATED CHANGES IN MIDSAGITTAL DIMENSIONS OF THE LUMBAR SPINE IN NORMAL EGYPTIANS: MRI STUDY
Fathy Ahmed Fetouh
Department of Anatomy, Faculty of Medicine, Zagazig University, Egypt.
ABSTRACTBackground: Degeneration of lumbar spine is a common and age related finding in the normal population. Eighty percent of adult population suffer from at least one episode of low back pain during their life time. Objective: The present work aimed to study the midsagittal dimensions of lumbar vertebrae, intervertebral discs, and vertebral canal in normal Egyptian population in different age groups in both males and females using MRI.Materials and methods: A retrospective study of MRI midsagittal images of lumbar spine was carried out for normal Egyptian population whose ages ranged from 20 to 60 years old and divided into 4 age groups (decades). The parameters measured for the discs were; anterior, central, posterior disc heights, relative disc height index and anteroposterior disc diameter, while the parameters measured for the vertebrae were; central height, anteroposterior diameter, midsagittal canal diameter and canal/body ratio. The data were statistically analyzed and tested for significance between age groups and between males and females.Results: The measured parameters of the discs increased with age progress with significant differences at different levels be-tween age groups. Also, they were found to be greater in males than females with significant differences. The relative disc height index showed a constant relationship between males and females. For the vertebrae, the parameters showed no significant differences related to age progress, while they were greater in males than females at all levels in all age groups. The midsagittal canal diameter and canal/body ratio indicated that the canal diameter decreased steadily from 3rd to 6th decade and was more capacious in females than in males.Conclusion: The measurements obtained in the present study can be considered as a database which can be helpful to clini-cians, therapists, and researchers as ready references of lumbar spine in normal adult Egyptian population. Any deviation from these values should be correlated with clinical findings.Key Words: Aging, Sexual dimorphism, Lumbar intervertebral disc, Midsagittal canal diameter, MRI
Corresponding Author:Dr. Fathy Ahmed Fetouh, Assistant Professor, Anatomy and Embryology Department, Faculty of Medicine, Zagazig University, Zagazig, Egypt; E-Mail: [email protected], [email protected]
Received: 18.12.2014 Revised: 29.12.2014 Accepted: 13.01.2015
INTRODUCTION
The lumbar spine has a larger mobile segment in the sagittal plane.1 Changes in the aging spine usually occur at movable intervertebral discs, facet joints, ligamentum flavum, and vertebral endplate which are adjacent to the intervertebral discs.2-4 The intervertebral discs un-dergo an age-related process of degeneration as early as 2nd decade, which is manifested by gradual structural transition of disc components.5 The central region of the vertebrae adjacent to nucleus pulposus is exposed to greater vertical stress than other regions.6 Among the various problems with spinal aging, lumbar spinal ste-nosis is the most frequent indication for spinal surgery in people over 60 years old.7 Also, pathological changes can occur in diameter of the lumbar spinal canal, there-
fore assessing the canal size is considered as an impor-tant diagnostic procedures.8 The sagittal anteroposterior diameter of the spinal canal is the only parameter which could be statistically correlated with the cross sectional area and it is accepted to use it as an indicator of the size of spinal canal.9 Since the magnification errors resulting from non-standardized film-tube distance is possible in the studies using the plain films, the magnetic resonance imaging is a more reliable in measurements of the in-tervertebral discs.10 The quantitative studies concerning the lumbar spine in Egyptians are to our knowledge still scarce. The present work aimed to study the midsagit-tal dimensions of lumbar vertebrae, intervertebral discs, and vertebral canal in normal Egyptian population in different age groups in both males and females using MRI.
IJCRRSection: Healthcare
Sci. Journal Impact Factor
4.016

Int J Cur Res Rev | Vol 7 • Issue 2 • January 2015 22
Fetouh: Age and gender related changes in midsagittal dimensions of the lumbar spine in normal Egyptians: MRI study
MATERIALS AND METHODS
SubjectsA retrospective study of MRI midsagittal images of lum-bar spine was done for cases referred to ELnour Radiol-ogy Center in Sharkia Governorate, Egypt in the period between August 2013 and September 2014. Patients consent was not required for the retrospective review of records and images because patient anonymity was preserved.The criteria for selection included the images which were obtained for various reason such as; abdomi-nopelvic problems, muscle pain, and soft tissue injuries. MRI showing evidences of fracture, congenital anoma-lies, degenerative changes, endplate sclerosis, spinal me-tastasis or any other pathologies were excluded accord-ing to reading of radiologist. The data about age and sex were recorded. The selected cases were 104 in number (52 males and 52 females). In order to avoid uncertainty of measurements caused by secondary ossification cen-tres of vertebrae before 20 years and osteoporosis after 60 years, subjects between 20 to 60 years were selected and divided into 4 age groups (decades): 3rd decade (20-29 years), 4th decade (30 - 39 years,) 5th decade (40 - 49 years), and 6th decade (50-59 years).
TechniqueThe lumbar spine was examined with the use of GE Signa Pofile 0.2T Open MRI Scanner. T2-weighted images with sagittal plane were obtained with a repetition time (TR) of 2600 milliseconds and echo time (TE) of 100 millisec-onds. Slice thickness was 4 mm. The field of view (FOV) used was 25-30 cm. Distances and diameters were meas-ured in millimetres using the software that accompanies the MRI system.
MeasurementsMeasurements were done at the midsagittal T2-weighted images which were identified when the tips of the spine processes were seen. The landmarks for measurements were taken at extreme anterior or posterior margins of the endplates of vertebrae.11
The following dimensions were measured for interverte-bral discs:
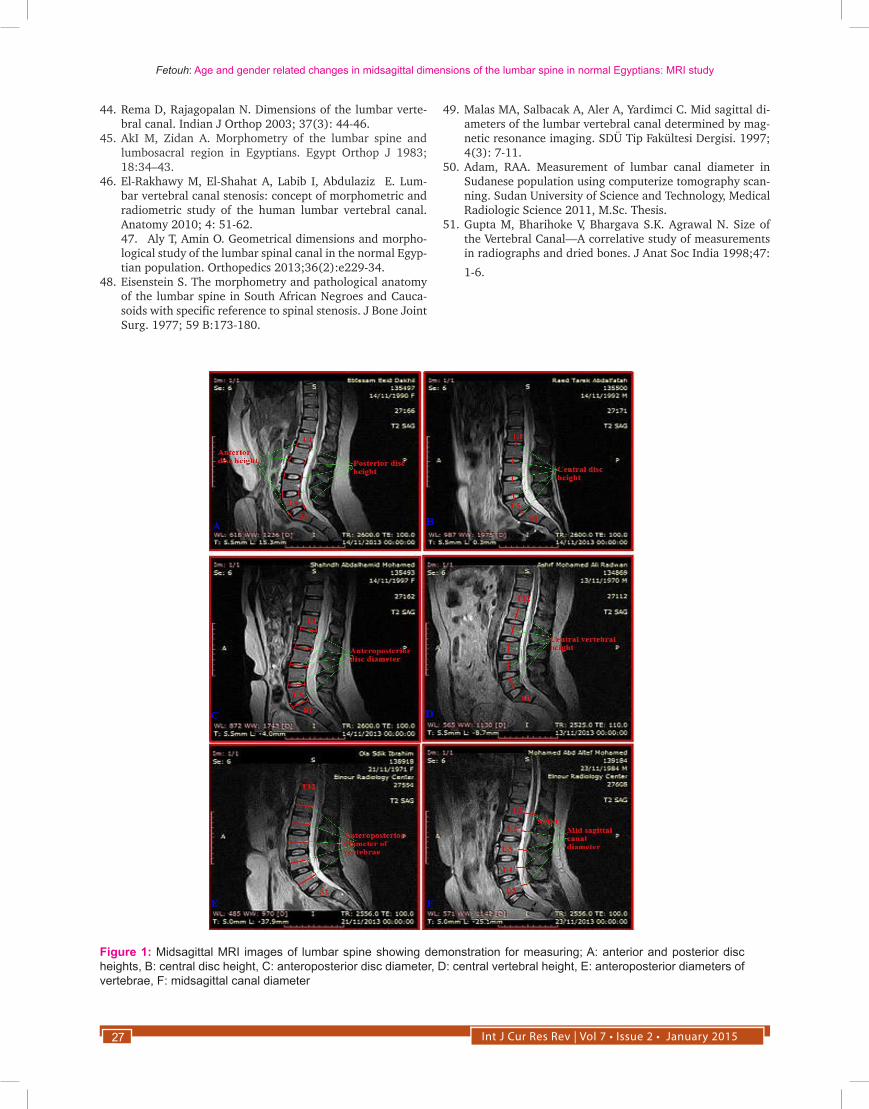
1-Anterior disc height: was measured as the distance be-tween the extreme anterior margins of the two adjacent vertebral endplates (Fig. 1A)
2-Central disc height: was measured as the distance be-tween the midpoints of the two adjacent vertebral end-plates (Fig. 1B)
3-Posterior disc height: was measured as the distance be-tween the extreme posterior margins of the two adjacent vertebral endplates (Fig. 1A)
4-Anteroposterior disc diameter: was measured as the distance between the midpoints of the anterior and pos-terior disc heights (Fig.1C)
5-Relative disc height index= mean of central disc height/mean of central vertebral height.3,11-15
For the lumbar vertebrae, the following dimensions were measured:
1-Central vertebral height: was measured as the distance between the midpoints of the superior and inferior end-plates of each vertebra (Fig.1D)
2-Anteroposterior diameter of vertebral body: was meas-ured as the greatest mid waist distance between mid-points of anterior and posterior borders of the vertebral bodies (Fig.1E)
3-Midsagittal canal diameter: was measured from mid-point of the posterior border of vertebral body to the most anterior part of spinous process. ( Fig.1F)
4-Canal/body ratio= midsagittal canal diameter/anter-oposterior diameter of the vertebra.10,16-22
All the measurements were taken 2 times and the mean was assessed to minimize the intra-observer error.
Statistical analysisStatistical analysis was carried out using SPSS for win-dows software program. Descriptive statistical analysis for all the data were presented as mean and standard de-viation. Paired sample t-test was used to evaluate the dif-ferences between male and female measurements and between successive age groups. The differences were considered significant when P value <0.05.
RESULTS
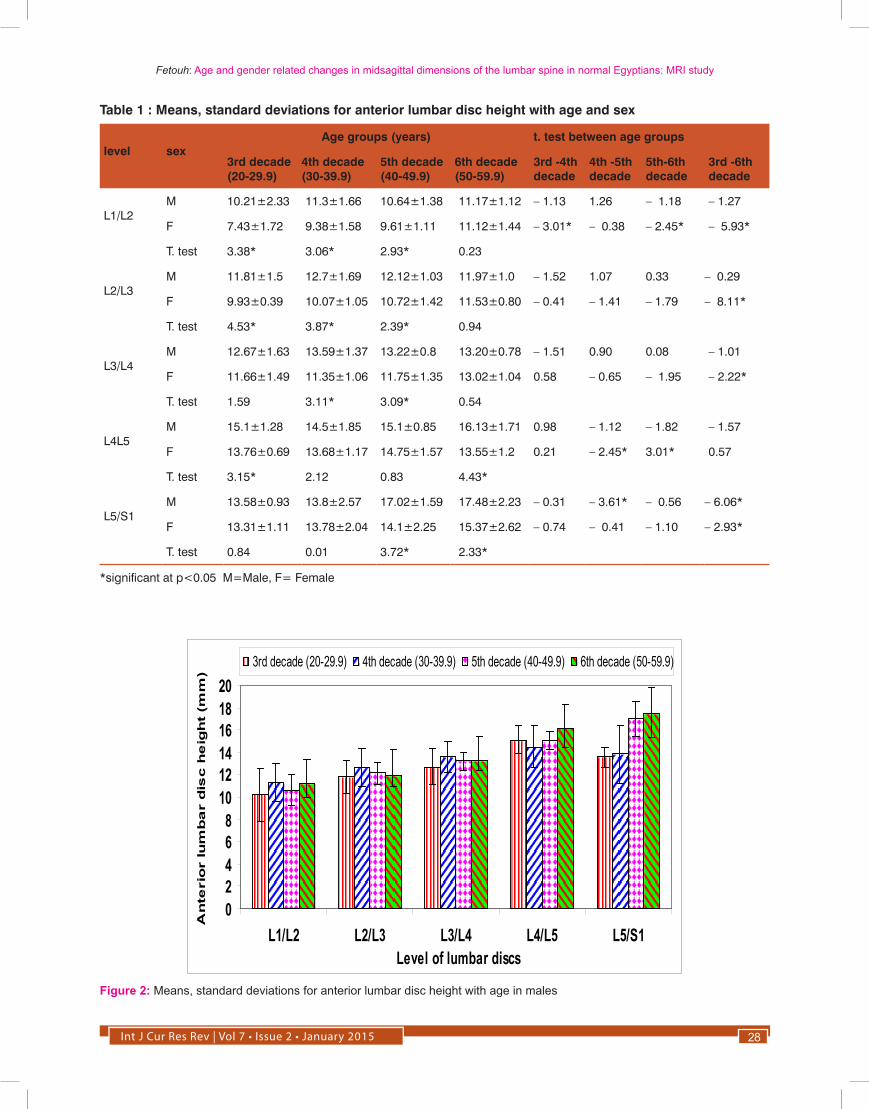
The means of anterior lumbar disc heights for males and females in different age groups are shown in table (1) and figures (2&3). The discs at levels of L1/L2, L4/L5& L5/S1 showed significant changes with age pro-gress which were more striking in females than males. The males differed from females in the response of an-terior disc height to age progress. At the upper 4 discs, the male discs showed alternating increase/decrease pattern through the age decades from 3rd-6th, while in females there was steady increase in the height to reach the maximum at 6th decade. At L5/S1 disc, both males and females showed steady increase from 3rd to 6th dec-ade. Taking the 3rd decade as a reference, the discs have gained an increase in anterior height by 6th decade which was significant mainly in females (p<0.05). Also, there was a cephalocaudal gradient of increase from L1/L2 to L5/S1 discs nearly in all decades studied except L5/S1

Int J Cur Res Rev | Vol 7 • Issue 2 • January 201523
Fetouh: Age and gender related changes in midsagittal dimensions of the lumbar spine in normal Egyptians: MRI study
disc in 3rd and 4th decades at which it decreased. The values were greater in males than females in all decades (3rd- 6th) and the differences were significant mainly in 3rd-5th decades.
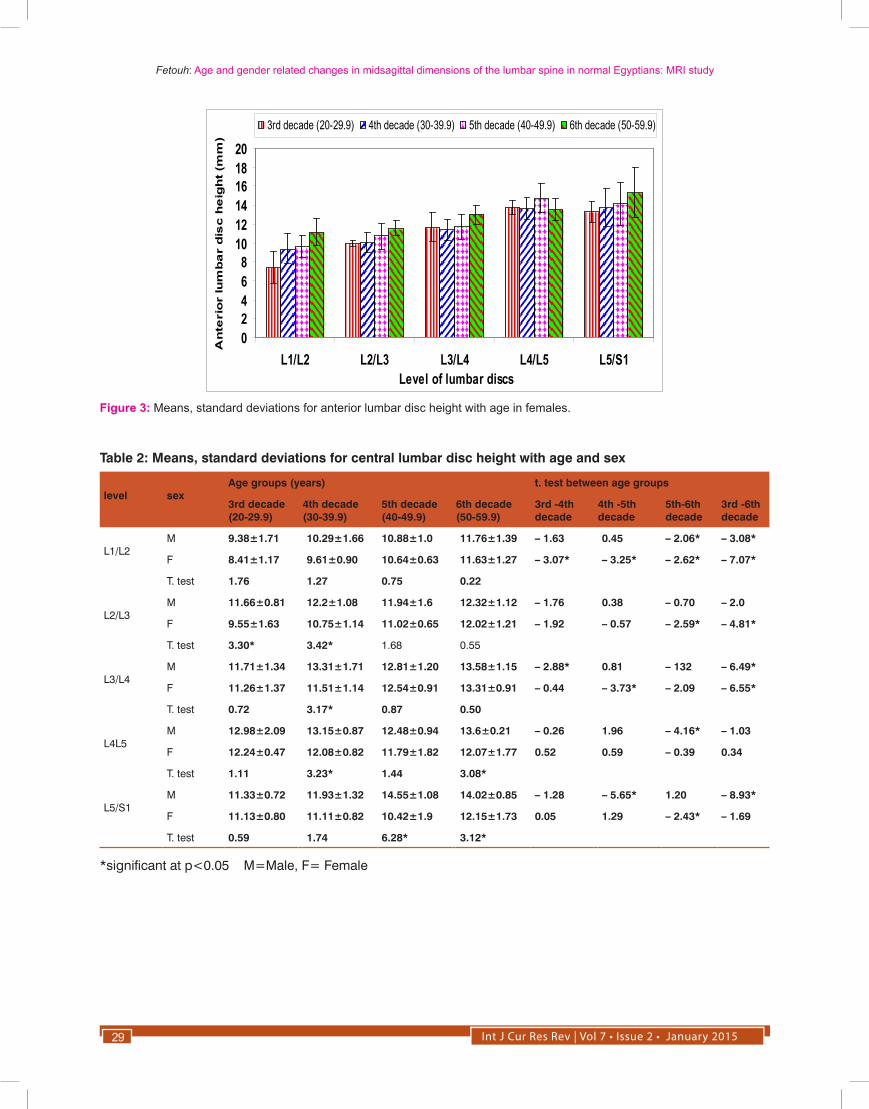
The means of central lumbar disc heights for males and females in different age groups are shown in table (2) and figures (4&5). All discs showed significant changes in their central heights with age. The males differed from females in the response of central disc height to age pro-gress. In males, there was an alternating increase/de-crease pattern at most of the disc levels, while in females there was steady increase to reach the maximum in 6th decade at most of the disc levels. Taking the 3rd decade as a reference, the discs have gained an increase in the central height by 6th decade which was significant at most of the segmental levels for both males and females (p<0.05). Cephalocaudal gradient of increase in central disc heights was observed from L1/L2-L4/L5 discs in all age group studied then, at L5/S1 disc, they decreased in 3rd and 4th decades and increased in 5th and 6th decades. The values were greater in males than females and the differences were significant mainly in 4th and 6th decades.
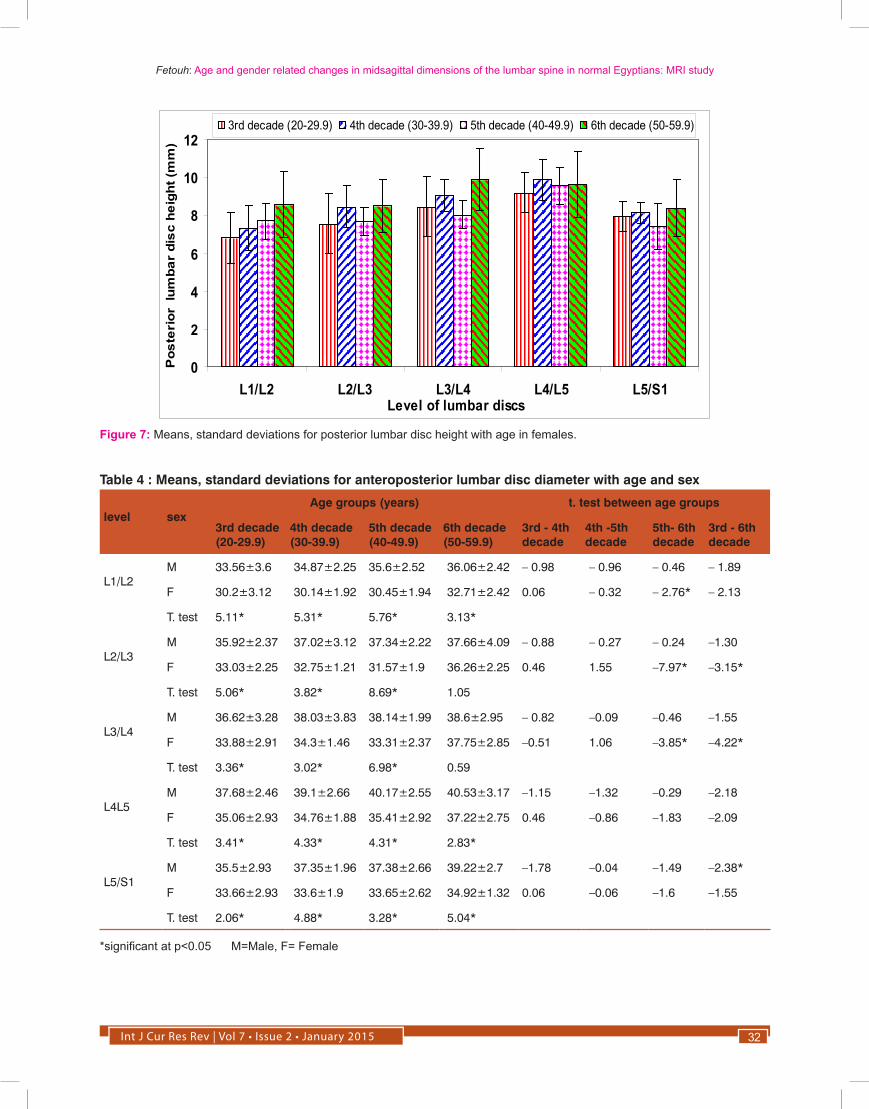
The means of posterior lumbar disc heights for males and females in different age groups are shown in table (3) and figures (6&7). The discs showed significant changes with age progress which were more evident between 4th-5th and 5th- 6th decades and in females than males. The males and females were similar in the response of posterior disc height to age progress through all dec-ades, where there was none linear alternating increase/decrease pattern of growth. The discs in 6th decade ap-peared to have gained an increase compared to 3rd dec-ade which was significant only at the level of L1/L2. There was a cephalocaudal gradient of increase from L1/L2 to L4/L5 discs followed by a decline at L5/S1 disc in both males and females and in all age groups. No sig-nificant differences were observed between males and females (p>0.05).
The means of anteroposterior diameter of lumbar discs for males and females in different age groups are shown in table (4) and figures (8&9). The discs at the upper levels (L1/L2, L2/L3& L3/L4) showed significant chang-es with age between 5th- 6th decade only in females. The males differed from females in the response of anter-oposterior diameters of the discs to age progress. In males, there was steady increase from the 3rd to 6th dec-ade, while in females there was none linear alternating increase/decrease pattern. Taking the 3rd decade as a reference, the discs have gained an increase in the anter-oposterior diameter by 6th decade which was significant at the level of L2/L3, L3/L4 & L5/S1 discs especially in females. There was a cephalocaudal gradient of increase from L1/L2 to L4/L5 discs followed by a decrease in L5/S1 disc in both males and females in all age groups. The
values were greater in males than females and the differ-ences were significant at all segmental levels nearly in all decades (p<0.05).
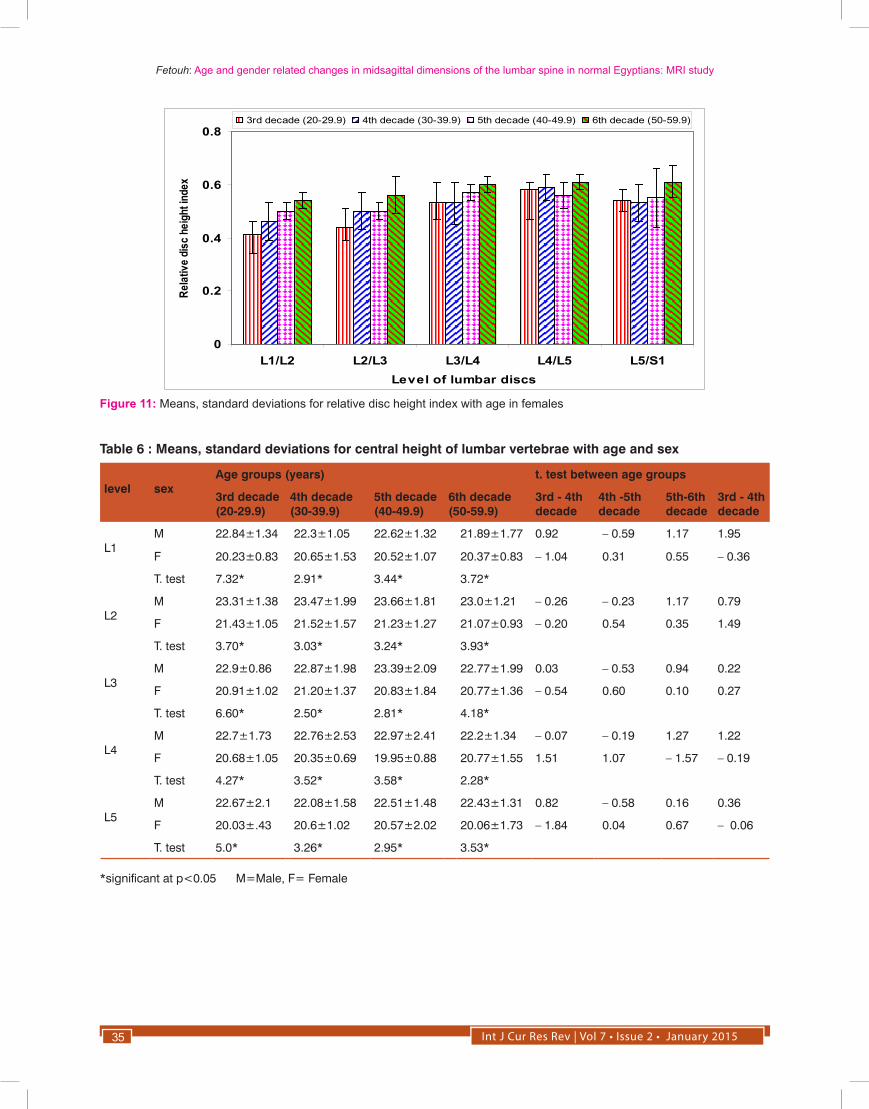
The means of relative disc height indices for males and females in different age groups are shown in table (5) and figures (10&11). No significant differences were ob-served between males and females, so a constant rela-tionship was observed at all levels, between height of the vertebral body and thickness of the disc in both males and females. Taking the 3rd decade as a reference, the discs have gained an increase in the relative disc height index by the 6th decade which was significant at all levels (p<0.05).
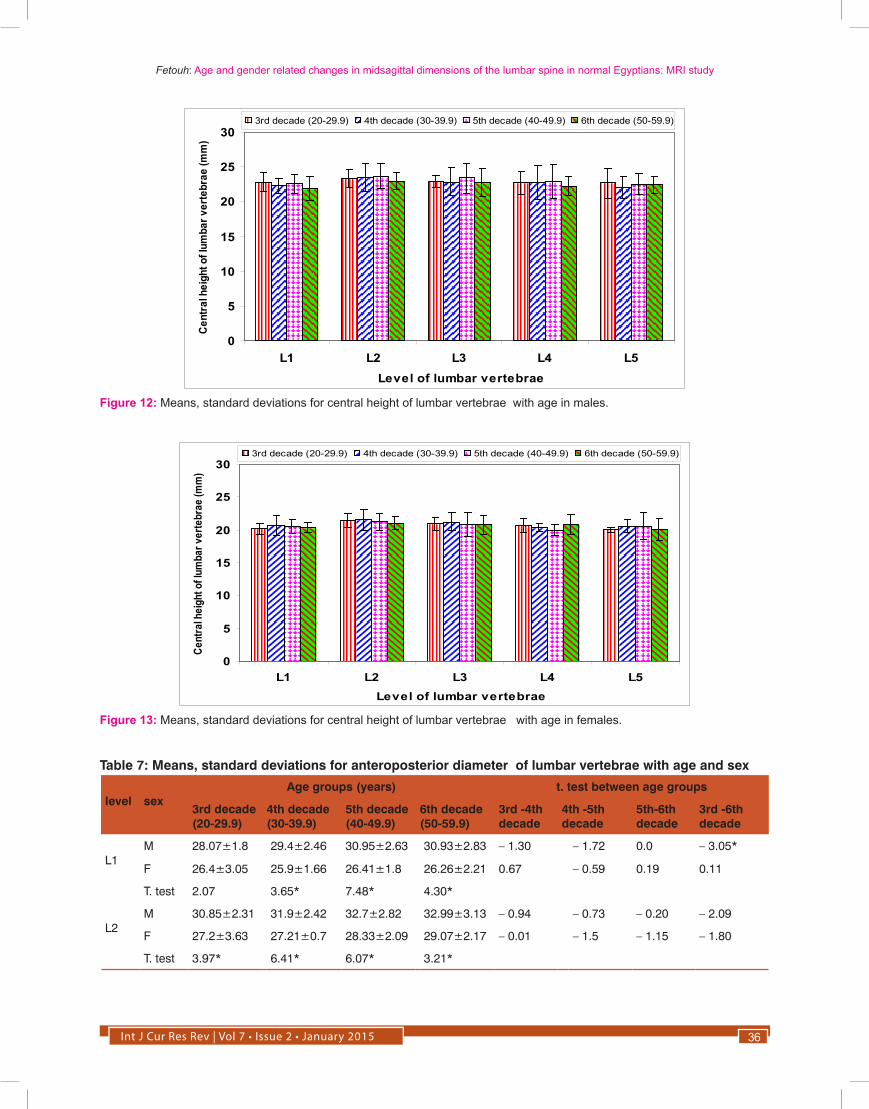
The means of central heights of lumbar vertebrae for males and females in different age groups are shown in table (6) and figures (12&13). No significant differences were observed between successive age groups at all lev-els for both males and females. No gained increase of the height in 6th decade when compared to 3rd decade. Also, no craniocaudal gradient of increase was observed between segmental levels. On the other hand, the mean values of central heights were greater in males than fe-males with significant differences at all levels in all age groups studied (p<0.05).
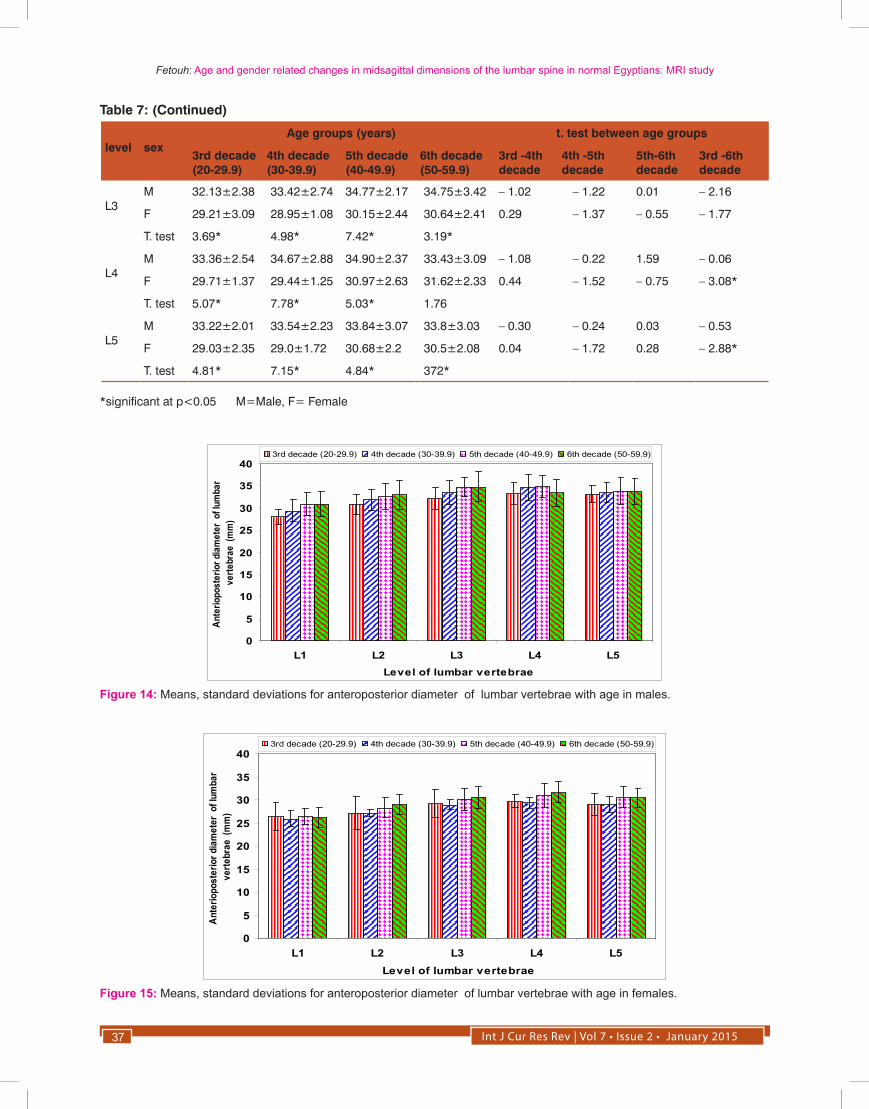
The means of anteroposterior diameters of lumbar ver-tebrae for males and females in different age groups are shown in table (7) and figures (14&15). No significant changes were observed between successive age groups at all levels for both sexes. There was only significant gradi-ent of increase in 6th decade when compared to 3rd dec-ade at L1, L4, L5. A cephalocaudal gradient of increase was observed from L1 to L3 and then became constant at L4 and L5. The values were greater in males than fe-males with significant differences at all levels and nearly in all age groups (p<0.05).
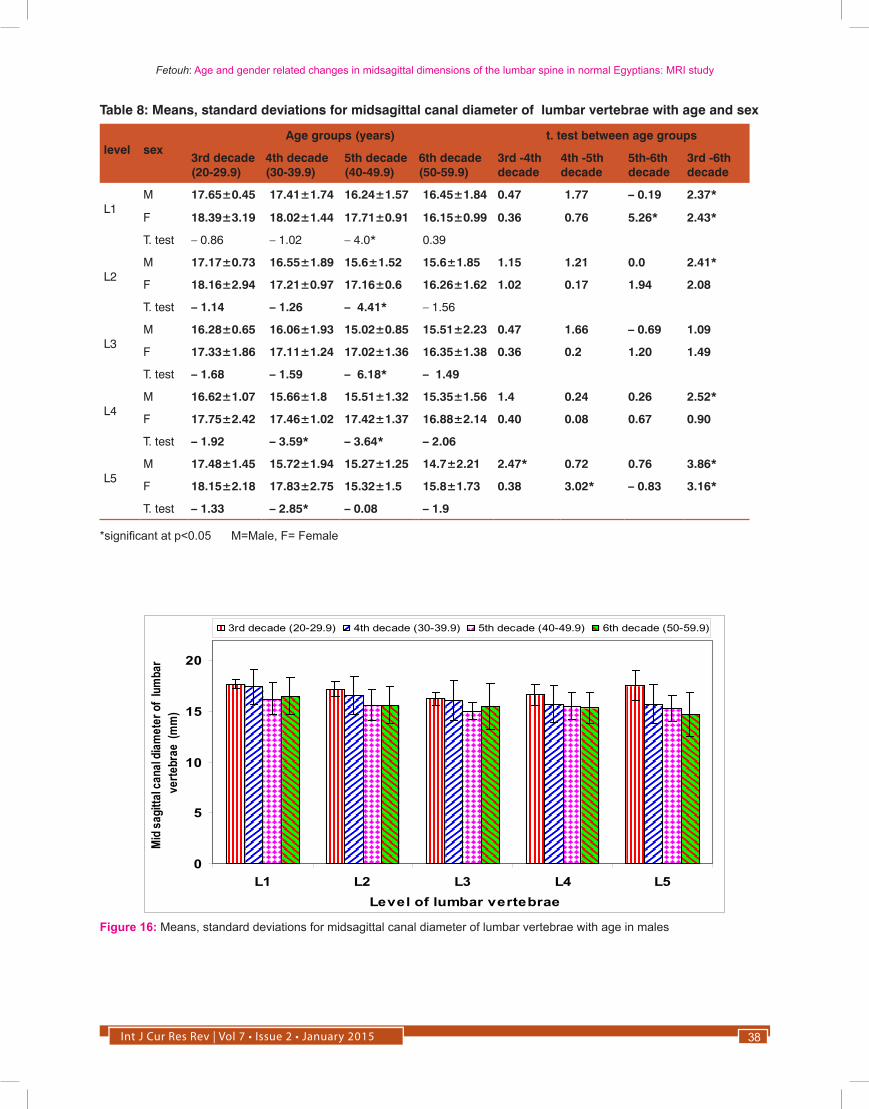
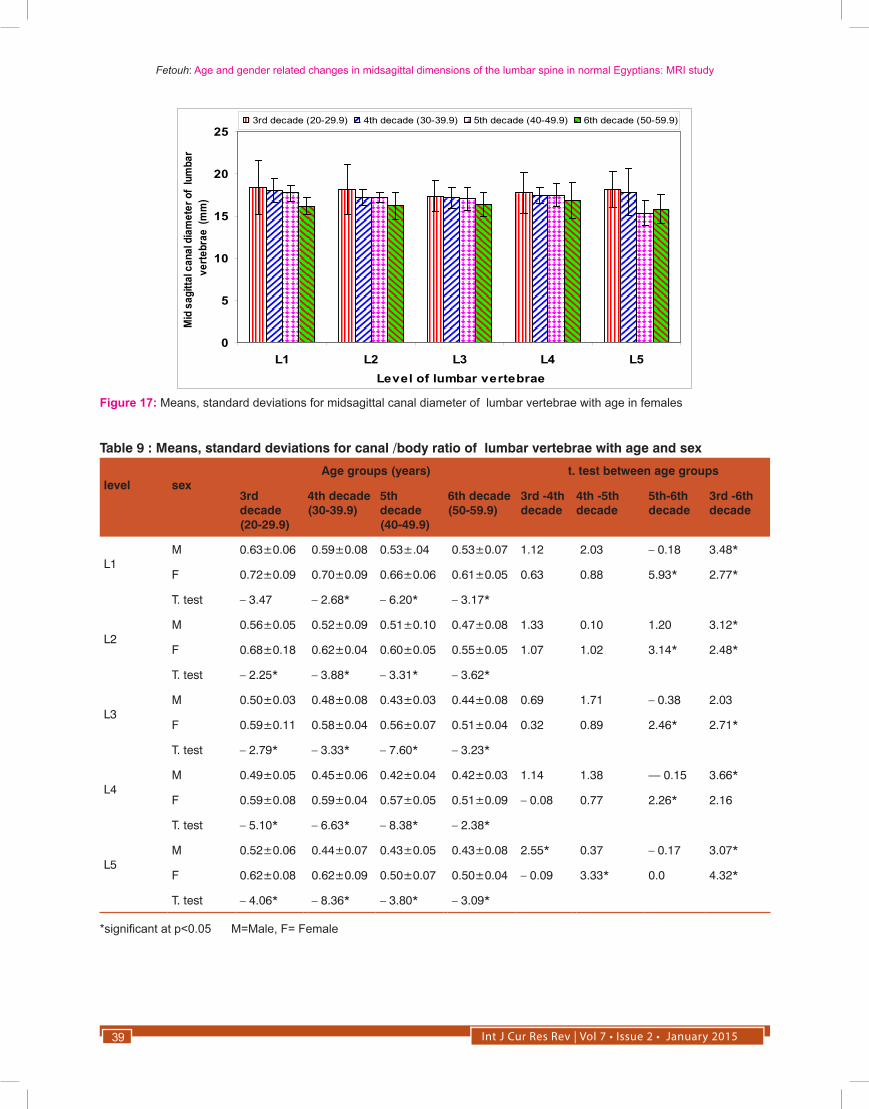
The means of midsagittal canal diameters of lumbar ver-tebrae for males and females in different age groups are shown in table (8) and figures (16&17). They decreased steadily from 3rd - 6th decade at all levels in both males and females and the differences were significant only in certain age groups at certain levels. Also, they declined in 6th decade when compared to 3rd decade and the dif-ferences were significant at most of the levels. As regards to cephalocaudal sequence, generally there was slightly steady decrease from L1 - L4 followed by steady increase at L5 in 3rd and 4th decades and general steady decrease from L1- L5 in 5th and 6th decades. The diameters were slightly wider in females than in males with significant differences at certain levels in 4th and 5th decades.
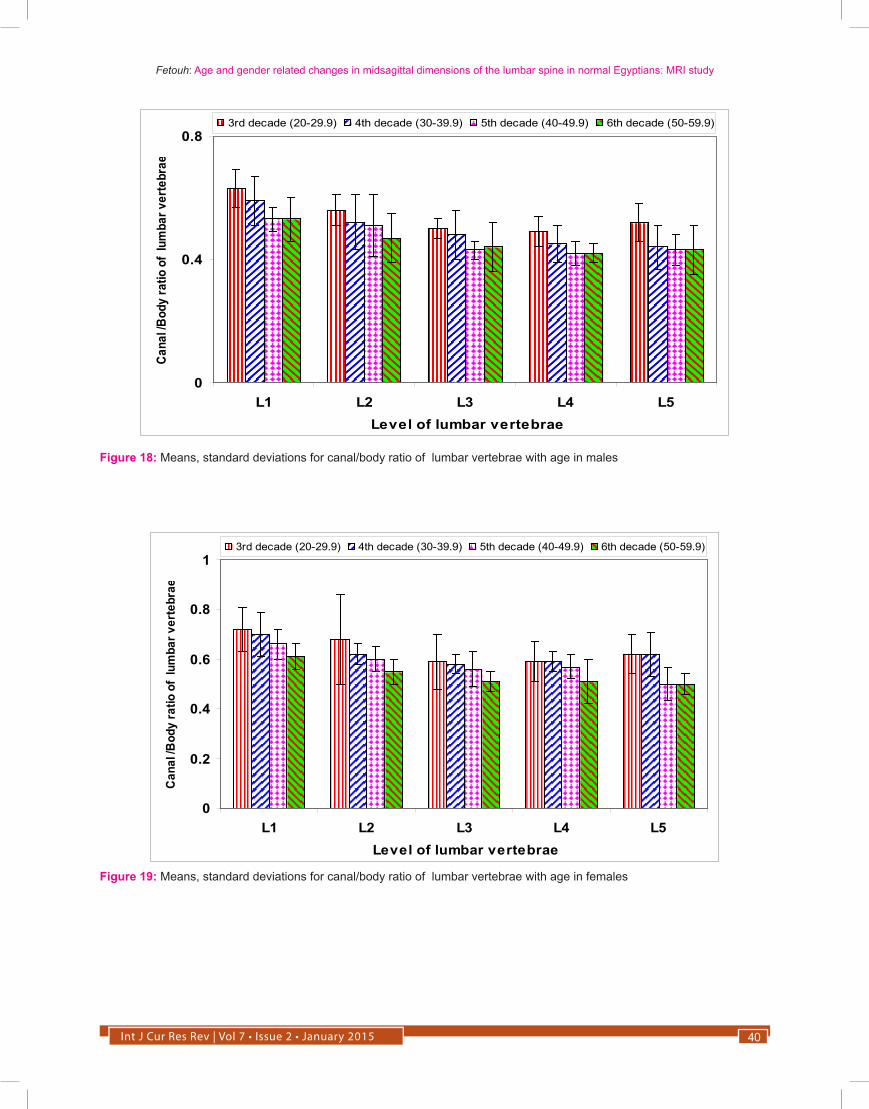
The canal/body ratio are shown in table (9) and figures (18&19). The ratio decreased steadily as age progress from 3rd- 6th decade in both males and females at all lev-els. The canal/body ratio declined at 6th decade when

Int J Cur Res Rev | Vol 7 • Issue 2 • January 2015 24
Fetouh: Age and gender related changes in midsagittal dimensions of the lumbar spine in normal Egyptians: MRI study
compared to 3rd decade with significant differences at all segmental levels. There was cephalocaudal gradient of decrease in canal/body ratio from L1- L4 then increased at L5 in 3rd and 4th decades and general steady decrease from L1- L5 in 5th and 6th decades. The ratio was higher in females than in males with significant differences in all age groups at all levels (p<0.05).
DISCUSSION
In the present study, the males differed from females in the response of their lumbar disc heights to age progress. In males, there was alternating pattern of increase/de-crease, while in females there was steady increase. This is in accordance with Al-Hadidi et al. 13 who found that the midpoint height displayed an alternating pattern which was of higher magnitude and statistically signifi-cant in males, but less evident and statistically insignifi-cant in females. The alternating increase/decrease pat-tern seems to reflect periods of growth and remodelling in relation to changes of functional demands.12,23
In the present study, there were significant differences in disc heights and diameter with age progress, Which were more striking in females than in males. This is in accord-ance with Amonoo-Kuofi 12 who found that the heights and diameters of intervertebral discs vary significantly in different age groups. On the other hand, Aydinlioglu et al. 11 found that the changes related to disc heights in females did not reach to the level of significance and the height of intervertebral discs increases with aging only in males. The disc heights in the present study, appeared to have gained an increase in 6th decade when compared to 3rd decade with significant differences in both males and females at different segmental levels. This is in agree-ment with many authors who found that the heights of intervertebral discs increase in older age groups in both males and females and these discs sink into the vertebrae.13,17,24 The aging of the disc involves structural changes in the endplate and between the age of 20 and 65 years, the endplate becomes thinner and cell death occurs in the superficial layer of the cartilage.25 Aging causes inevitable and progressive changes in disc ma-trix composition, which resemble changes in other aging cartilaginous tissues.26,27 Biochemical changes occur as a direct result of the alternation with age lead to deteriora-tion of connective tissues and loss of disc integrity.28
In the present study, a cephalocaudal gradient of in-crease was observed in the lumbar disc heights and di-ameters from the level of L1/L2 to L4/L5 discs followed by a decline at lumbosacral disc (L5/S1) especially in 5th and 6th decades. This is in accordance with Eijkelkamp et al. 29 and Moeller and Reif 30 who reported that the heights of intervertebral discs increase from L1/L2 to L4/L5 discs then decreases at L5/S1 disc. Also, Bogduk et
al. 31 reported that the L4/L5 disc is the largest interver-tebral disc of human body and this is probably related to the greater mobility at that level of lumbar spine. On the other hand, Shao et al. 14 and Gocmen-Mas et al. 15 found that the intervertebral disc height increased with increasing level from L1/L2 to L5/S1 discs in both males and females. Shukri et al. 32 found that the height of L5/S1 disc was quite variable: in some subjects it was small, however in others it was the largest one.
In the present study, the mean values of disc heights were greater in males than females with significant dif-ferences. This is in consonance with Amonoo-Kuofi 12, Frobin et al. 24 and Shukri et al. 32 who found that the mean disc height was larger in male than female subjects at all level except at L5/S1 disc at which, the disc height was slightly larger in females.
In the present study, there was a constant relationship in the relative disc height index between males and fe-males at all levels in all age groups. This is in accordance with the authors who found that in absence of degenera-tion, the relative disc height index has been shown to be constant in males and females at all disc levels. This re-flects a coordinated change affecting discs and vertebrae simultaneously.12,13 Based on this, the relative disc height index could prove helpful as an indicator for pathological conditions affecting the spine. Significant aberration of this index could be interpreted as a sign of disc degenera-tion in terms of altered coordination of disc and vertebral height.13
The central height and anteroposterior diameter of lum-bar vertebrae in the present study showed no significant changes with age progress. This disagrees with Mashara-wi et al. 33 who found that bony lumbar vertebrae change significantly usually decreasing in height and broaden-ing. Sone et al. 34 related changes in vertebral height to the osteoporosis and Goh et al. 35 related these changes to the biomechanical load acting on spine. The absence of changes in height and anteroposterior diameter of the vertebrae in present study may indicate that the osteo-porosis and biomechanic load have not affected the sub-jects of the study. In the present study, these values were greater in males than females with significant differences at all levels in all age groups. This is in agreement with Amonoo-Kuofi 12 and Shukri et al. 32 who found that the dimensions of lumbar vertebral bodies were larger in males than females at all levels. On the other hand Frobin et al. 36 reported that the height of lumbar verte-bral body is larger in females than males and Gilsanz et al. 37 found that there is no sexual dimorphism in meas-urements of lumbar vertebral bodies. A cephalocaudal gradient of increase was observed in the anteroposterior diameter from L1- L3 and became constant at L4 and L5. This is in agreement with Standring et al. 38 who report-ed that there is a cephalocaudal increase in width of the
Int J Cur Res Rev | Vol 7 • Issue 2 • January 201525
Fetouh: Age and gender related changes in midsagittal dimensions of the lumbar spine in normal Egyptians: MRI study
vertebral bodies to 3rd lumbar. Shukri et al. 32 found that the width of vertebral bodies have increased from L1- L4 then decreased at L5 level. This can be explained by that L4 and L5 have the largest flexion extension movements, so L4 and L5 are the most common sites for degenerative spine disease.39,40
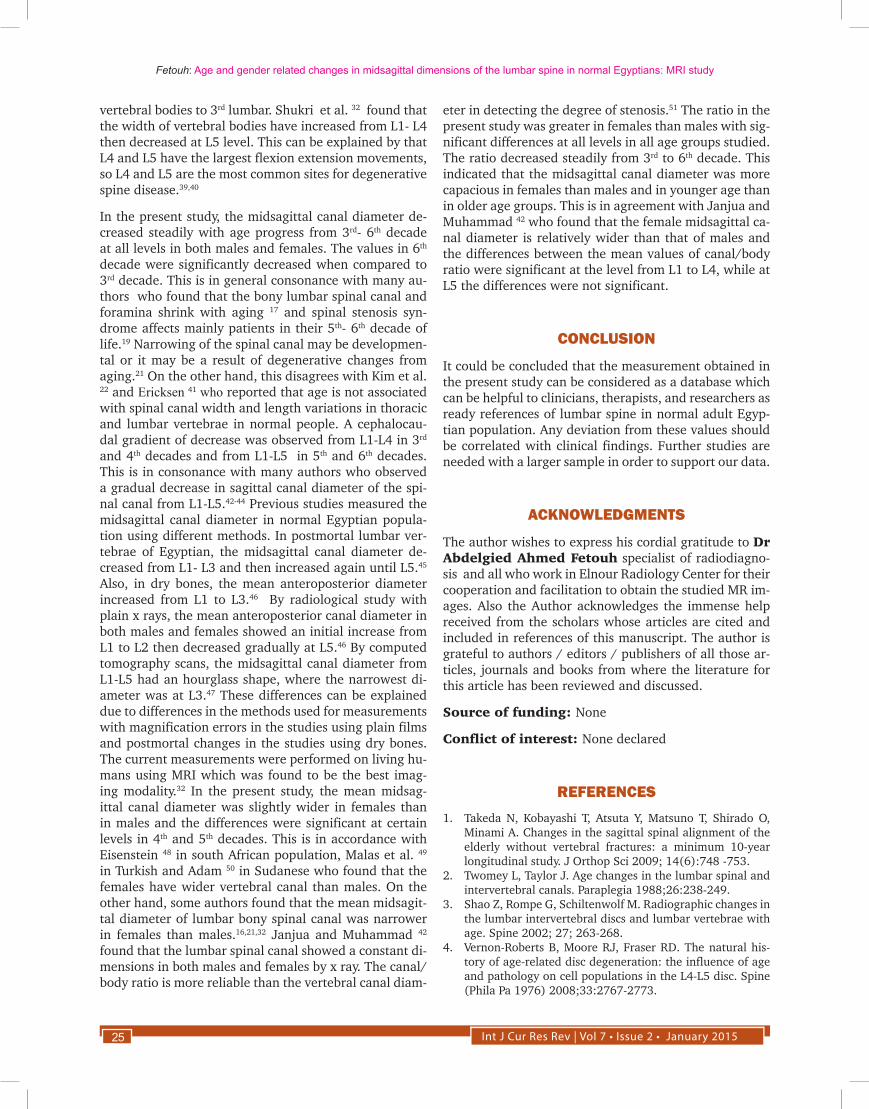
In the present study, the midsagittal canal diameter de-creased steadily with age progress from 3rd- 6th decade at all levels in both males and females. The values in 6th decade were significantly decreased when compared to 3rd decade. This is in general consonance with many au-thors who found that the bony lumbar spinal canal and foramina shrink with aging 17 and spinal stenosis syn-drome affects mainly patients in their 5th- 6th decade of life.19 Narrowing of the spinal canal may be developmen-tal or it may be a result of degenerative changes from aging.21 On the other hand, this disagrees with Kim et al. 22 and Ericksen 41 who reported that age is not associated with spinal canal width and length variations in thoracic and lumbar vertebrae in normal people. A cephalocau-dal gradient of decrease was observed from L1-L4 in 3rd and 4th decades and from L1-L5 in 5th and 6th decades. This is in consonance with many authors who observed a gradual decrease in sagittal canal diameter of the spi-nal canal from L1-L5.42-44 Previous studies measured the midsagittal canal diameter in normal Egyptian popula-tion using different methods. In postmortal lumbar ver-tebrae of Egyptian, the midsagittal canal diameter de-creased from L1- L3 and then increased again until L5.45 Also, in dry bones, the mean anteroposterior diameter increased from L1 to L3.46 By radiological study with plain x rays, the mean anteroposterior canal diameter in both males and females showed an initial increase from L1 to L2 then decreased gradually at L5.46 By computed tomography scans, the midsagittal canal diameter from L1-L5 had an hourglass shape, where the narrowest di-ameter was at L3.47 These differences can be explained due to differences in the methods used for measurements with magnification errors in the studies using plain films and postmortal changes in the studies using dry bones. The current measurements were performed on living hu-mans using MRI which was found to be the best imag-ing modality.32 In the present study, the mean midsag-ittal canal diameter was slightly wider in females than in males and the differences were significant at certain levels in 4th and 5th decades. This is in accordance with Eisenstein 48 in south African population, Malas et al. 49 in Turkish and Adam 50 in Sudanese who found that the females have wider vertebral canal than males. On the other hand, some authors found that the mean midsagit-tal diameter of lumbar bony spinal canal was narrower in females than males.16,21,32 Janjua and Muhammad 42 found that the lumbar spinal canal showed a constant di-mensions in both males and females by x ray. The canal/body ratio is more reliable than the vertebral canal diam-
eter in detecting the degree of stenosis.51 The ratio in the present study was greater in females than males with sig-nificant differences at all levels in all age groups studied. The ratio decreased steadily from 3rd to 6th decade. This indicated that the midsagittal canal diameter was more capacious in females than males and in younger age than in older age groups. This is in agreement with Janjua and Muhammad 42 who found that the female midsagittal ca-nal diameter is relatively wider than that of males and the differences between the mean values of canal/body ratio were significant at the level from L1 to L4, while at L5 the differences were not significant.
CONCLUSION
It could be concluded that the measurement obtained in the present study can be considered as a database which can be helpful to clinicians, therapists, and researchers as ready references of lumbar spine in normal adult Egyp-tian population. Any deviation from these values should be correlated with clinical findings. Further studies are needed with a larger sample in order to support our data.
ACKNOWLEDGMENTS
The author wishes to express his cordial gratitude to Dr Abdelgied Ahmed Fetouh specialist of radiodiagno-sis and all who work in Elnour Radiology Center for their cooperation and facilitation to obtain the studied MR im-ages. Also the Author acknowledges the immense help received from the scholars whose articles are cited and included in references of this manuscript. The author is grateful to authors / editors / publishers of all those ar-ticles, journals and books from where the literature for this article has been reviewed and discussed.
Source of funding: None
Conflict of interest: None declared
REFERENCES1. Takeda N, Kobayashi T, Atsuta Y, Matsuno T, Shirado O,
Minami A. Changes in the sagittal spinal alignment of the elderly without vertebral fractures: a minimum 10-year longitudinal study. J Orthop Sci 2009; 14(6):748 -753.
2. Twomey L, Taylor J. Age changes in the lumbar spinal and intervertebral canals. Paraplegia 1988;26:238-249.
3. Shao Z, Rompe G, Schiltenwolf M. Radiographic changes in the lumbar intervertebral discs and lumbar vertebrae with age. Spine 2002; 27; 263-268.
4. Vernon-Roberts B, Moore RJ, Fraser RD. The natural his-tory of age-related disc degeneration: the influence of age and pathology on cell populations in the L4-L5 disc. Spine (Phila Pa 1976) 2008;33:2767-2773.
Int J Cur Res Rev | Vol 7 • Issue 2 • January 2015 26
Fetouh: Age and gender related changes in midsagittal dimensions of the lumbar spine in normal Egyptians: MRI study
5. Naylor A. The biophysical and biochemical aspects of in-tervertebral disc herniation and degeneration. Ann R Coll Surg 1962; 31: 91-114.
6. Ferguson SJ, Steffen T. Biomechanics of the aging spine. Eur Spine J 2003; 2: S97-S103.
7. Abbas J, Hamoud K, May H, Hay O, Medlej B, Masharawi Y, et al. Degenerative lumbar spinal stenosis and lumbar spine configu ration. Eur Spine J 2010;19:1865-73.
8. Santiago FR, Milena GL, Herrera RO, Romero PA, Plazas PG. Morphometry of the lower lumbar vertebrae in pa-tients with and without low back pain. Eur Spine J 2001; 10(3):228-233.
9. Gepstein R, Folman Y, Sagiv P, Ben David Y, Hallel T. Does the anteroposterior diameter of the bony spinal canal reflect its size? An anatomical study. Surg Radiol Anat 1991;13:289-291.
10. Sevinc O, Barut C, Is M, Eryoruk N, Safak A. Influence of age and sex on lumbar vertebral morphometry deter mined using sagittal magnetic resonance imaging. Ann Anat 2008; 190:277-83.
11. Aydinlioglu A, Diyarbakirli S, Keles P. Heights of the lumbar intervertebral discs related to age in Turkish individuals. Tohoku J Exp Med 1999; 188: 11-22.
12. Amonoo-Kuofi HS. Morphometric changes in the heights and anteroposterior diameters of the lumbar intervertebral discs with age. J Anat 1991; 175: 159-168.
13. Al-Hadidi MT, Badran DH, Al-Hadidi AM, Abu-Ghaida JH. Magnetic resonance imaging of normal lumbar interverte-bral discs. Neurosciences 2001; 6 (4): 227-232.
14. Shao Z, Rompe G, Schiltenwolf M. Radiographic changes in the lumbar intervertebral discs and lumbar vertebrae with age. Spine 2004; 29:108-9.
15. Gocmen-Mas N, Karabekir H, Ertekin T, Edizer M, Canan Y Izzet duyar I. Evaluation of lumbar vertebral body and disc: a stereological morphometric study. Int J Morphol 2010;28 (3):841-847.
16. Amonoo-Kuofi HS. The sagittal diameter of the lumbar ver-tebral canal in normal adult Nigerians. J Anat 1985; 140 (1): 69-78.
17. Twomey LT, Taylor JR. Age changes in lumbar vertebrae and intervertebral discs. Clin Orthop Relat Res 1987; 224:97-104.
18. Lee HM, Kim NH, Kim HJ, Chung IH. Morphometric study of the lumbar spinal canal in the Korean population. Spine 1995 (Phila Pa 1976) 20:1679-1684.
19.TacarO,DemirantA,NasK,AltindağO.Morphologyofthelumbar spinal canal in normal adult Turks. Yonsei Med J 2003; 44(4):679-685.
20. Jahangir M, Dar S, Jeelani G. Antero-posterior measure-ment of the lumbar spinal canal on mid sagittal MRI in Kashmiri adults. JK-Practitioner.2003; 10(4): 284-285.
21. Al-Anazi A, Munir N, Khaled M, Hosam A. Radiographic measurement of lumbar spinal canal size and canal/body ratio in normal adult Saudis. Neurosurgery Quarterly 2007; 17 (1):19-22.
22. Kim KH, Park JY, Kuh SU, Chin DK, Kim KS, Cho YE. Chang-es in spinal canal diameter and vertebral body height with age. Yonsei Med J 2013;54 (6):1498-1504.
23. Oda J, Tanaka H, Tsuzuki N. Intervertebral disc changes with aging of human cervical vertebra from neonate to the eighties. Spine 1988; 13: 1205-1211.
24. Frobin W, Brinckmann P, Biggemann M, Tillotson M, Burton K. Precision measurement of disc height, vertebral height
and sagittal plane displacement from lateral radiographic views of the lumbar spine. Clin Biomech 1997; 12(1):51-63.
25. Bernick S, Cailliet R. Vertebral end-plate changes with ag-ing of human vertebrae. Spine 1982;7:97–102.
26. Anderson DG, Li X, Tannoury T, Beck G, Balian G. A fi-bronectin fragment stimulates intervertebral disc degen-eration in vivo. Spine 2003;28:2338–45.
27. Buckwalter JA. Aging and degeneration of the human in-tervertebral disc. Spine (Phila Pa 1976) 1995;20 (11):1307-14.
28. Pokharna HK, Phillips FM. Collagen cross-links in human lumbar intervertebral disc aging. Spine 1998;23:1645-1648.
29. Eijkelkamp MF, Klein JP, Veldhuizen AG, Van Hom JR, Verkerke GJ. The geometry and shape of the human in-tervertebral disc. The International Journal of Artificial Or-gans. 2001; 24: 75-83.
30. Moeller TB, Reif E. Normal Findings in CT and MRI. First edition, Thieme, Stuttgart, Germany. 2000: 82 & 174.
31. Bogduk N, Tynan W, Wilson AS. The nerve supply to the hu-man lumbar intervertebral discs. J Anat 1981; 132: 39-56
32. Shukri IG, Mahmood KA, Abdulrahman SA. a morphomet-ric study of the lumbar spine in a symptomatic subjects in Sulaimani city by magnetic resonance imaging. JSMC, 2013; 3(1):21-31.
33. Masharawi Y, Salame K, Mirovsky Y, Peleg S, Dar G, Stein-berg N, et al. Vertebral body shape variation in the thoracic and lumbar spine: characterization of its asymmetry and wedging. Clin Anat 2008;21:46-54.
34. Sone T, Tomomitsu T, Miyake M, Takeda N, Fukunaga M. Age-related changes in vertebral height ratios and verte-bral fracture. Osteoporos Int 1997; 7:113-118.
35. Goh S, Tan C, Price RI, Edmondston J, Song S, Davis S, Singer KP. Influence of age and gender on thoracic verte-bral body shape and disc degeneration: an MR investiga-tion of 169 cases. J Anat 2000; 197: 647-657.
36. Frobin W, Brinckmann P, Biggemann M, Tillotson M, Burton K. Precision measurement of disc height, vertebral height and sagittal plane displacement from lateral radiographic views of the lumbar spine. Clin Biomech (Bristol, Avon) 1997;12(suppl 1):51- 64.
37. Gilsanz V, Boechat MI, Gilsanz R, Loro ML, Roe TF, Good-man WG. Gender differences in vertebral sizes in adults: bi-omechanical implications. Radiology 1994;190: 678-682.
38. Standring S, Ellis H, Healy JC, Johnson D, Williams A, Col-lins P et al. Gray’s Anatomy: The Anatomical Basis of Clini-cal Practice. Thirty-ninth edition, Elsevier Churchill Living-stone, Edinburgh; 2005: 735-756 & 789-793.
39. Panjabi MM, White AA. 3rd Basic biomechanics of the spine. Neurosurgery 1980;7:76-93.
40. Panjabi MM, Goel V, Oxland T, Takata K, Duranceau J, Krag M, et al. Human lumbar vertebrae. Quantitative three-di-mensional anatomy. Spine (Phila Pa 1976) 1992;17:299-306.
41. Ericksen MF. Some aspects of aging in the lumbar spine. Am J Phys Anthropol 1976;45(3 pt. 2):575-580.
42. Janjua MZ, Muhammad F. Measurements of the nor-mal adult lumbar spinal canal. J Pak Med Assoc 1989; 39(10):264-8.
43. Wang TM, Shih C. Morphometric variations of the lumbar vertebrae between Chinese and Indian adults. Acta Ana-tomica 1992; 144: 23-29.
Int J Cur Res Rev | Vol 7 • Issue 2 • January 201527
Fetouh: Age and gender related changes in midsagittal dimensions of the lumbar spine in normal Egyptians: MRI study
44. Rema D, Rajagopalan N. Dimensions of the lumbar verte-bral canal. Indian J Orthop 2003; 37(3): 44-46.
45. AkI M, Zidan A. Morphometry of the lumbar spine and lumbosacral region in Egyptians. Egypt Orthop J 1983; 18:34–43.
46. El-Rakhawy M, El-Shahat A, Labib I, Abdulaziz E. Lum-bar vertebral canal stenosis: concept of morphometric and radiometric study of the human lumbar vertebral canal. Anatomy 2010; 4: 51-62.
47. Aly T, Amin O. Geometrical dimensions and morpho-logical study of the lumbar spinal canal in the normal Egyp-tian population. Orthopedics 2013;36(2):e229-34.
48. Eisenstein S. The morphometry and pathological anatomy of the lumbar spine in South African Negroes and Cauca-soids with specific reference to spinal stenosis. J Bone Joint Surg. 1977; 59 B:173-180.
49. Malas MA, Salbacak A, Aler A, Yardimci C. Mid sagittal di-ameters of the lumbar vertebral canal determined by mag-netic resonance imaging. SDÜ Tip Fakültesi Dergisi. 1997; 4(3): 7-11.
50. Adam, RAA. Measurement of lumbar canal diameter in Sudanese population using computerize tomography scan-ning. Sudan University of Science and Technology, Medical Radiologic Science 2011, M.Sc. Thesis.
51. Gupta M, Bharihoke V, Bhargava S.K. Agrawal N. Size of the Vertebral Canal—A correlative study of measurements in radiographs and dried bones. J Anat Soc India 1998;47:
1-6.
Figure 1: Midsagittal MRI images of lumbar spine showing demonstration for measuring; A: anterior and posterior disc heights, B: central disc height, C: anteroposterior disc diameter, D: central vertebral height, E: anteroposterior diameters of vertebrae, F: midsagittal canal diameter
Int J Cur Res Rev | Vol 7 • Issue 2 • January 2015 28
Fetouh: Age and gender related changes in midsagittal dimensions of the lumbar spine in normal Egyptians: MRI study
Table 1 : Means, standard deviations for anterior lumbar disc height with age and sex
level sexAge groups (years) t. test between age groups
3rd decade (20-29.9)
4th decade (30-39.9)
5th decade (40-49.9)
6th decade (50-59.9)
3rd -4th decade
4th -5th decade
5th-6th decade
3rd -6th decade
L1/L2M 10.21±2.33 11.3±1.66 10.64±1.38 11.17±1.12 – 1.13 1.26 – 1.18 – 1.27
F 7.43±1.72 9.38±1.58 9.61±1.11 11.12±1.44 – 3.01* – 0.38 – 2.45* – 5.93*
T. test 3.38* 3.06* 2.93* 0.23
L2/L3M 11.81±1.5 12.7±1.69 12.12±1.03 11.97±1.0 – 1.52 1.07 0.33 – 0.29
F 9.93±0.39 10.07±1.05 10.72±1.42 11.53±0.80 – 0.41 – 1.41 – 1.79 – 8.11*
T. test 4.53* 3.87* 2.39* 0.94
L3/L4M 12.67±1.63 13.59±1.37 13.22±0.8 13.20±0.78 – 1.51 0.90 0.08 – 1.01
F 11.66±1.49 11.35±1.06 11.75±1.35 13.02±1.04 0.58 – 0.65 – 1.95 – 2.22*
T. test 1.59 3.11* 3.09* 0.54
L4L5M 15.1±1.28 14.5±1.85 15.1±0.85 16.13±1.71 0.98 – 1.12 – 1.82 – 1.57
F 13.76±0.69 13.68±1.17 14.75±1.57 13.55±1.2 0.21 – 2.45* 3.01* 0.57
T. test 3.15* 2.12 0.83 4.43*
L5/S1M 13.58±0.93 13.8±2.57 17.02±1.59 17.48±2.23 – 0.31 – 3.61* – 0.56 – 6.06*
F 13.31±1.11 13.78±2.04 14.1±2.25 15.37±2.62 – 0.74 – 0.41 – 1.10 – 2.93*
T. test 0.84 0.01 3.72* 2.33*
*significant at p<0.05 M=Male, F= Female
02468
101214161820
L1/L2 L2/L3 L3/L4 L4/L5 L5/S1 Level of lumbar discs
An
teri
or
lum
ba
r d
isc
he
igh
t (m
m)
3rd decade (20-29.9) 4th decade (30-39.9) 5th decade (40-49.9) 6th decade (50-59.9)
Figure 2: Means, standard deviations for anterior lumbar disc height with age in males
Int J Cur Res Rev | Vol 7 • Issue 2 • January 201529
Fetouh: Age and gender related changes in midsagittal dimensions of the lumbar spine in normal Egyptians: MRI study
02468
101214161820
L1/L2 L2/L3 L3/L4 L4/L5 L5/S1 Level of lumbar discs
An
teri
or
lum
ba
r d
isc
he
igh
t (m
m)
3rd decade (20-29.9) 4th decade (30-39.9) 5th decade (40-49.9) 6th decade (50-59.9)
Figure 3: Means, standard deviations for anterior lumbar disc height with age in females.
Table 2: Means, standard deviations for central lumbar disc height with age and sex
level sexAge groups (years) t. test between age groups
3rd decade (20-29.9)
4th decade (30-39.9)
5th decade (40-49.9)
6th decade (50-59.9)
3rd -4th decade
4th -5th decade
5th-6th decade
3rd -6th decade
L1/L2M 9.38±1.71 10.29±1.66 10.88±1.0 11.76±1.39 – 1.63 0.45 – 2.06* – 3.08*
F 8.41±1.17 9.61±0.90 10.64±0.63 11.63±1.27 – 3.07* – 3.25* – 2.62* – 7.07*
T. test 1.76 1.27 0.75 0.22
L2/L3M 11.66±0.81 12.2±1.08 11.94±1.6 12.32±1.12 – 1.76 0.38 – 0.70 – 2.0
F 9.55±1.63 10.75±1.14 11.02±0.65 12.02±1.21 – 1.92 – 0.57 – 2.59* – 4.81*
T. test 3.30* 3.42* 1.68 0.55
L3/L4M 11.71±1.34 13.31±1.71 12.81±1.20 13.58±1.15 – 2.88* 0.81 – 132 – 6.49*
F 11.26±1.37 11.51±1.14 12.54±0.91 13.31±0.91 – 0.44 – 3.73* – 2.09 – 6.55*
T. test 0.72 3.17* 0.87 0.50
L4L5M 12.98±2.09 13.15±0.87 12.48±0.94 13.6±0.21 – 0.26 1.96 – 4.16* – 1.03
F 12.24±0.47 12.08±0.82 11.79±1.82 12.07±1.77 0.52 0.59 – 0.39 0.34
T. test 1.11 3.23* 1.44 3.08*
L5/S1M 11.33±0.72 11.93±1.32 14.55±1.08 14.02±0.85 – 1.28 – 5.65* 1.20 – 8.93*
F 11.13±0.80 11.11±0.82 10.42±1.9 12.15±1.73 0.05 1.29 – 2.43* – 1.69
T. test 0.59 1.74 6.28* 3.12*
*significant at p<0.05 M=Male, F= Female

Int J Cur Res Rev | Vol 7 • Issue 2 • January 2015 30
Fetouh: Age and gender related changes in midsagittal dimensions of the lumbar spine in normal Egyptians: MRI study
02468
101214161820
L1/L2 L2/L3 L3/L4 L4/L5 L5/S1 Level of lumbar discs
Ce
ntr
al l
um
ba
r d
isc
he
igh
t (m
m)
3rd decade (20-29.9) 4th decade (30-39.9) 5th decade (40-49.9) 6th decade (50-59.9)
Figure 4: Means, standard deviations for central lumbar disc height with age in males.
02468
101214161820
L1/L2 L2/L3 L3/L4 L4/L5 L5/S1 Level of lumbar discs
Ce
ntr
al l
um
ba
r d
isc
he
igh
t (m
m)
3rd decade (20-29.9) 4th decade (30-39.9) 5th decade (40-49.9) 6th decade (50-59.9)
Figure 5: Means, standard deviations for central lumbar disc height with age in females.

Int J Cur Res Rev | Vol 7 • Issue 2 • January 201531
Fetouh: Age and gender related changes in midsagittal dimensions of the lumbar spine in normal Egyptians: MRI study
Table 3 : Means, standard deviations for posterior lumbar disc height with age and sex
level sexAge groups (years) t. test between age groups
3rd decade (20-29.9)
4th decade (30-39.9)
5th decade (40-49.9)
6th decade (50-59.9)
3rd -4th decade
4th -5th decade
5th-6th dec-ade
3rd - 6th decade
L1/L2M 6.86±0.75 8.06±1.93 7.07±1.27 8.27±1.35 – 2.51* 2.11 –3.01* – 2.65*
F 6.83±1.32 7.32±1.17 7.71±0.94 8.58±1.76 – 0.94 – 0.72 – 1.46 – 2.42*
T. test 1.03 1.13 – 1.4 – 0.61
L2/L3M 8.1±1.08 8.04±1.84 7.71±1.14 8.02±1.22 0.10 0.65 – 0.64 – 0.18
F 7.55±1.61 8.45±1.11 7.68±0.75 8.5±1.41 – 1.86 2.22* – 2.37* – 1.64
T. test 1.49 – 0.72 0.06 – 0.79
L3/L4M 8.78±0.99 9.34±1.74 8.66±1.49 9.13±1.01 – 0.83 1.64 – 0.96 – 1.13
F 8.46±1.59 9.04±0.86 8.04±0.74 9.9±1.62 – 1.27 3.29* – 3.08* – 2.07
T. test 0.56 0.47 1.29 – 1.14
L4L5M 9.13±1.57 9.59±1.11 8.84±0.91 9.41±0.71 – 0.72 1.70 – 2.09 – 0.61
F 9.18±1.06 9.91±1.08 9.58±1.0 9.65±1.74 – 1.45 0.76 – 0.12 – 0.98
T. test – 0.13 – 0.82 – 1.8 – 0.42
L5/S1M 7.34±0.89 8.47±1.62 7.98±0.66 7.72±1.19 – 1.99 1.21 0.70 – 1.70
F 7.96±0.78 8.15±0.53 7.41±1.2 8.4±1.51 – 0.74 2.26* – 2.11 – 0.83
T. test – 2.0 0.62 1.33 – 1.09
*significant at p<0.05 M=Male, F= Female
0
2
4
6
8
10
12
L1/L2 L2/L3 L3/L4 L4/L5 L5/S1
Level of lumbar discs
Post
erio
r lu
mba
r dis
c he
ight
(mm
)
3rd decade (20-29.9) 4th decade (30-39.9) 5th decade (40-49.9) 6th decade (50-59.9)
Figure 6: Means, standard deviations for posterior lumbar disc height with age in males.
Int J Cur Res Rev | Vol 7 • Issue 2 • January 2015 32
Fetouh: Age and gender related changes in midsagittal dimensions of the lumbar spine in normal Egyptians: MRI study
0
2
4
6
8
10
12
L1/L2 L2/L3 L3/L4 L4/L5 L5/S1 Level of lumbar discs
Pos
teri
or l
umba
r di
sc h
eigh
t (m
m)
3rd decade (20-29.9) 4th decade (30-39.9) 5th decade (40-49.9) 6th decade (50-59.9)
Figure 7: Means, standard deviations for posterior lumbar disc height with age in females.
Table 4 : Means, standard deviations for anteroposterior lumbar disc diameter with age and sex
level sexAge groups (years) t. test between age groups
3rd decade (20-29.9)
4th decade (30-39.9)
5th decade (40-49.9)
6th decade (50-59.9)
3rd - 4th decade
4th -5th decade
5th- 6th decade
3rd - 6th decade
L1/L2M 33.56±3.6 34.87±2.25 35.6±2.52 36.06±2.42 – 0.98 – 0.96 – 0.46 – 1.89
F 30.2±3.12 30.14±1.92 30.45±1.94 32.71±2.42 0.06 – 0.32 – 2.76* – 2.13
T. test 5.11* 5.31* 5.76* 3.13*
L2/L3M 35.92±2.37 37.02±3.12 37.34±2.22 37.66±4.09 – 0.88 – 0.27 – 0.24 –1.30
F 33.03±2.25 32.75±1.21 31.57±1.9 36.26±2.25 0.46 1.55 –7.97* –3.15*
T. test 5.06* 3.82* 8.69* 1.05
L3/L4M 36.62±3.28 38.03±3.83 38.14±1.99 38.6±2.95 – 0.82 –0.09 –0.46 –1.55
F 33.88±2.91 34.3±1.46 33.31±2.37 37.75±2.85 –0.51 1.06 –3.85* –4.22*
T. test 3.36* 3.02* 6.98* 0.59
L4L5M 37.68±2.46 39.1±2.66 40.17±2.55 40.53±3.17 –1.15 –1.32 –0.29 –2.18
F 35.06±2.93 34.76±1.88 35.41±2.92 37.22±2.75 0.46 –0.86 –1.83 –2.09
T. test 3.41* 4.33* 4.31* 2.83*
L5/S1M 35.5±2.93 37.35±1.96 37.38±2.66 39.22±2.7 –1.78 –0.04 –1.49 –2.38*
F 33.66±2.93 33.6±1.9 33.65±2.62 34.92±1.32 0.06 –0.06 –1.6 –1.55
T. test 2.06* 4.88* 3.28* 5.04*
*significant at p<0.05 M=Male, F= Female

Int J Cur Res Rev | Vol 7 • Issue 2 • January 201533
Fetouh: Age and gender related changes in midsagittal dimensions of the lumbar spine in normal Egyptians: MRI study
05
10
15202530
354045
L1/L2 L2/L3 L3/L4 L4/L5 L5/S1 Level of lumbar discs
Ant
erio
post
erio
r lu
mba
r di
sc
diam
eter
(mm
)3rd decade (20-29.9) 4th decade (30-39.9) 5th decade (40-49.9) 6th decade (50-59.9)
Figure 8: Means, standard deviations for anteroposterior lumbar disc diameter with age in males .
0
5
10
15
20
25
30
35
40
L1/L2 L2/L3 L3/L4 L4/L5 L5/S1
Level of lumbar discs
Ant
erio
post
erio
r lu
mba
r di
sc
diam
eter
(mm
)
3rd decade (20-29.9) 4th decade (30-39.9) 5th decade (40-49.9) 6th decade (50-59.9)
Figure 9: Means, standard deviations for anteroposterior lumbar disc diameter with age in females.

Int J Cur Res Rev | Vol 7 • Issue 2 • January 2015 34
Fetouh: Age and gender related changes in midsagittal dimensions of the lumbar spine in normal Egyptians: MRI study
Table 5: Means, standard deviations for relative disc height index with age and sex
level sexAge groups (years) t. test between age groups
3rd decade (20-29.9)
4th decade (30-39.9)
5th decade (40-49.9)
6th decade (50-59.9)
3rd - 4th decade
4th -5th decade
5th- 6th decade
3rd - 6th decade
L1/L2M 0.40±0.07 0.45±0.07 0.47±0.03 0.51±0.04 – 2.03 – 0.77 – 2.55* – 4.24*
F 0.41±0.05 0.46±0.07 0.50±0.03 0.54±0.03 – 1.68 – 1.89 – 3.63* – 7.84*
T. test – 0.24 – 0.17 – 1.77 – 1.92
L2/L3M 0.50±0.05 0.51±0.05 0.49±0.06 0.54±0.08 – 0.89 0.73 – 2.43* – 2.14
F 0.44±0.07 0.50±0.07 0.50±0.03 0.56±0.07 – 1.64 – 0.18 – 2.41* – 4.62*
T. test 1.79 0.65 – 0.49 – 0.56
L3/L4M 0.51±0.06 0.54±0.05 0.53±0.07 0.58±0.07 – 1.99 0.29 – 1.75 –5.69*
F 0.53±0.08 0.53±0.08 0.57±0.03 0.60±0.03 0.0 – 1.36 – 2.05 – 2.47*
T. test – 0.73 0.18 – 1.57 – 1.10
L4L5M 0.55±0.11 0.59±0.07 0.56±0.07 0.59±0.02 – 0.85 – 0.86 – 1.62 – 1.43
F 0.58±0.03 0.59±0.05 0.56±0.05 0.61±0.03 – 0.51 1.18 – 0.59 – 2.72*
T. test – 0.66 0.02 0.12 – 1.25
L5/S1M 0.55±0.04 0.58±0.08 0.61±0.06 0.63±0.06 – 1.50 – 0.79 – 0.98 – 3.41*
F 0.54±0.04 0.53±0.07 0.55±0.11 0.61±0.06 – 0.33 – 0.77 – 1.72 – 3.66*
T. test 0.83 1.70 1.76 1.04
*significant at p<0.05 M=Male, F= Female
0
0.2
0.4
0.6
0.8
L1/L2 L2/L3 L3/L4 L4/L5 L5/S1 Level of lumbar discs
Relat
ive di
sc he
ight in
dex
3rd decade (20-29.9) 4th decade (30-39.9) 5th decade (40-49.9) 6th decade (50-59.9)
Figure 10: Means, standard deviations for relative disc height index with age in males
Int J Cur Res Rev | Vol 7 • Issue 2 • January 201535
Fetouh: Age and gender related changes in midsagittal dimensions of the lumbar spine in normal Egyptians: MRI study
0
0.2
0.4
0.6
0.8
L1/L2 L2/L3 L3/L4 L4/L5 L5/S1 Level of lumbar discs
Rela
tive
disc
hei
ght i
ndex
3rd decade (20-29.9) 4th decade (30-39.9) 5th decade (40-49.9) 6th decade (50-59.9)
Figure 11: Means, standard deviations for relative disc height index with age in females
Table 6 : Means, standard deviations for central height of lumbar vertebrae with age and sex
level sexAge groups (years) t. test between age groups
3rd decade (20-29.9)
4th decade (30-39.9)
5th decade (40-49.9)
6th decade (50-59.9)
3rd - 4th decade
4th -5th decade
5th-6th decade
3rd - 4th decade
L1M 22.84±1.34 22.3±1.05 22.62±1.32 21.89±1.77 0.92 – 0.59 1.17 1.95
F 20.23±0.83 20.65±1.53 20.52±1.07 20.37±0.83 – 1.04 0.31 0.55 – 0.36
T. test 7.32* 2.91* 3.44* 3.72*
L2M 23.31±1.38 23.47±1.99 23.66±1.81 23.0±1.21 – 0.26 – 0.23 1.17 0.79
F 21.43±1.05 21.52±1.57 21.23±1.27 21.07±0.93 – 0.20 0.54 0.35 1.49
T. test 3.70* 3.03* 3.24* 3.93*
L3M 22.9±0.86 22.87±1.98 23.39±2.09 22.77±1.99 0.03 – 0.53 0.94 0.22
F 20.91±1.02 21.20±1.37 20.83±1.84 20.77±1.36 – 0.54 0.60 0.10 0.27
T. test 6.60* 2.50* 2.81* 4.18*
L4M 22.7±1.73 22.76±2.53 22.97±2.41 22.2±1.34 – 0.07 – 0.19 1.27 1.22
F 20.68±1.05 20.35±0.69 19.95±0.88 20.77±1.55 1.51 1.07 – 1.57 – 0.19
T. test 4.27* 3.52* 3.58* 2.28*
L5M 22.67±2.1 22.08±1.58 22.51±1.48 22.43±1.31 0.82 – 0.58 0.16 0.36
F 20.03±.43 20.6±1.02 20.57±2.02 20.06±1.73 – 1.84 0.04 0.67 – 0.06
T. test 5.0* 3.26* 2.95* 3.53*
*significant at p<0.05 M=Male, F= Female
Int J Cur Res Rev | Vol 7 • Issue 2 • January 2015 36
Fetouh: Age and gender related changes in midsagittal dimensions of the lumbar spine in normal Egyptians: MRI study
0
5
10
15
20
25
30
L1 L2 L3 L4 L5 Level of lumbar vertebrae
Cen
tral
hei
ght o
f lum
bar v
erte
brae
(mm
)
3rd decade (20-29.9) 4th decade (30-39.9) 5th decade (40-49.9) 6th decade (50-59.9)
Figure 12: Means, standard deviations for central height of lumbar vertebrae with age in males.
0
5
10
15
20
25
30
L1 L2 L3 L4 L5 Level of lumbar vertebrae
Cent
ral h
eigh
t of l
umba
r ver
tebr
ae (m
m)
3rd decade (20-29.9) 4th decade (30-39.9) 5th decade (40-49.9) 6th decade (50-59.9)
Figure 13: Means, standard deviations for central height of lumbar vertebrae with age in females.
Table 7: Means, standard deviations for anteroposterior diameter of lumbar vertebrae with age and sex
level sexAge groups (years) t. test between age groups
3rd decade (20-29.9)
4th decade (30-39.9)
5th decade (40-49.9)
6th decade (50-59.9)
3rd -4th decade
4th -5th decade
5th-6th decade
3rd -6th decade
L1M 28.07±1.8 29.4±2.46 30.95±2.63 30.93±2.83 – 1.30 – 1.72 0.0 – 3.05*
F 26.4±3.05 25.9±1.66 26.41±1.8 26.26±2.21 0.67 – 0.59 0.19 0.11
T. test 2.07 3.65* 7.48* 4.30*
L2M 30.85±2.31 31.9±2.42 32.7±2.82 32.99±3.13 – 0.94 – 0.73 – 0.20 – 2.09
F 27.2±3.63 27.21±0.7 28.33±2.09 29.07±2.17 – 0.01 – 1.5 – 1.15 – 1.80
T. test 3.97* 6.41* 6.07* 3.21*
Int J Cur Res Rev | Vol 7 • Issue 2 • January 201537
Fetouh: Age and gender related changes in midsagittal dimensions of the lumbar spine in normal Egyptians: MRI study
level sexAge groups (years) t. test between age groups
3rd decade (20-29.9)
4th decade (30-39.9)
5th decade (40-49.9)
6th decade (50-59.9)
3rd -4th decade
4th -5th decade
5th-6th decade
3rd -6th decade
L3M 32.13±2.38 33.42±2.74 34.77±2.17 34.75±3.42 – 1.02 – 1.22 0.01 – 2.16
F 29.21±3.09 28.95±1.08 30.15±2.44 30.64±2.41 0.29 – 1.37 – 0.55 – 1.77
T. test 3.69* 4.98* 7.42* 3.19*
L4M 33.36±2.54 34.67±2.88 34.90±2.37 33.43±3.09 – 1.08 – 0.22 1.59 – 0.06
F 29.71±1.37 29.44±1.25 30.97±2.63 31.62±2.33 0.44 – 1.52 – 0.75 – 3.08*
T. test 5.07* 7.78* 5.03* 1.76
L5M 33.22±2.01 33.54±2.23 33.84±3.07 33.8±3.03 – 0.30 – 0.24 0.03 – 0.53
F 29.03±2.35 29.0±1.72 30.68±2.2 30.5±2.08 0.04 – 1.72 0.28 – 2.88*
T. test 4.81* 7.15* 4.84* 372*
*significant at p<0.05 M=Male, F= Female
0
5
10
15
20
25
30
35
40
L1 L2 L3 L4 L5 Level of lumbar vertebrae
Ante
riopo
ster
ior d
iam
eter
of l
umba
r ve
rtebr
ae (
mm
)
3rd decade (20-29.9) 4th decade (30-39.9) 5th decade (40-49.9) 6th decade (50-59.9)
Figure 14: Means, standard deviations for anteroposterior diameter of lumbar vertebrae with age in males.
0
5
10
15
20
25
30
35
40
L1 L2 L3 L4 L5 Level of lumbar vertebrae
Ante
riopo
ster
ior d
iam
eter
of l
umba
r ve
rtebr
ae (
mm
)
3rd decade (20-29.9) 4th decade (30-39.9) 5th decade (40-49.9) 6th decade (50-59.9)
Figure 15: Means, standard deviations for anteroposterior diameter of lumbar vertebrae with age in females.
Table 7: (Continued)
Int J Cur Res Rev | Vol 7 • Issue 2 • January 2015 38
Fetouh: Age and gender related changes in midsagittal dimensions of the lumbar spine in normal Egyptians: MRI study
Table 8: Means, standard deviations for midsagittal canal diameter of lumbar vertebrae with age and sex
level sexAge groups (years) t. test between age groups
3rd decade (20-29.9)
4th decade (30-39.9)
5th decade (40-49.9)
6th decade (50-59.9)
3rd -4th decade
4th -5th decade
5th-6th decade
3rd -6th decade
L1M 17.65±0.45 17.41±1.74 16.24±1.57 16.45±1.84 0.47 1.77 – 0.19 2.37*
F 18.39±3.19 18.02±1.44 17.71±0.91 16.15±0.99 0.36 0.76 5.26* 2.43*
T. test – 0.86 – 1.02 – 4.0* 0.39
L2M 17.17±0.73 16.55±1.89 15.6±1.52 15.6±1.85 1.15 1.21 0.0 2.41*
F 18.16±2.94 17.21±0.97 17.16±0.6 16.26±1.62 1.02 0.17 1.94 2.08
T. test – 1.14 – 1.26 – 4.41* – 1.56
L3M 16.28±0.65 16.06±1.93 15.02±0.85 15.51±2.23 0.47 1.66 – 0.69 1.09
F 17.33±1.86 17.11±1.24 17.02±1.36 16.35±1.38 0.36 0.2 1.20 1.49
T. test – 1.68 – 1.59 – 6.18* – 1.49
L4M 16.62±1.07 15.66±1.8 15.51±1.32 15.35±1.56 1.4 0.24 0.26 2.52*
F 17.75±2.42 17.46±1.02 17.42±1.37 16.88±2.14 0.40 0.08 0.67 0.90
T. test – 1.92 – 3.59* – 3.64* – 2.06
L5M 17.48±1.45 15.72±1.94 15.27±1.25 14.7±2.21 2.47* 0.72 0.76 3.86*
F 18.15±2.18 17.83±2.75 15.32±1.5 15.8±1.73 0.38 3.02* – 0.83 3.16*
T. test – 1.33 – 2.85* – 0.08 – 1.9
*significant at p<0.05 M=Male, F= Female
0
5
10
15
20
L1 L2 L3 L4 L5 Level of lumbar vertebrae
Mid
sag
ittal
can
al d
iam
eter
of
lum
bar
verte
brae
(m
m)
3rd decade (20-29.9) 4th decade (30-39.9) 5th decade (40-49.9) 6th decade (50-59.9)
Figure 16: Means, standard deviations for midsagittal canal diameter of lumbar vertebrae with age in males
Int J Cur Res Rev | Vol 7 • Issue 2 • January 201539
Fetouh: Age and gender related changes in midsagittal dimensions of the lumbar spine in normal Egyptians: MRI study
0
5
10
15
20
25
L1 L2 L3 L4 L5 Level of lumbar vertebrae
Mid
sag
ittal
can
al d
iam
eter
of
lum
bar
verte
brae
(m
m)
3rd decade (20-29.9) 4th decade (30-39.9) 5th decade (40-49.9) 6th decade (50-59.9)
Figure 17: Means, standard deviations for midsagittal canal diameter of lumbar vertebrae with age in females
Table 9 : Means, standard deviations for canal /body ratio of lumbar vertebrae with age and sex
level sexAge groups (years) t. test between age groups
3rd decade (20-29.9)
4th decade (30-39.9)
5th decade (40-49.9)
6th decade (50-59.9)
3rd -4th decade
4th -5th decade
5th-6th decade
3rd -6th decade
L1M 0.63±0.06 0.59±0.08 0.53±.04 0.53±0.07 1.12 2.03 – 0.18 3.48*
F 0.72±0.09 0.70±0.09 0.66±0.06 0.61±0.05 0.63 0.88 5.93* 2.77*
T. test – 3.47 – 2.68* – 6.20* – 3.17*
L2M 0.56±0.05 0.52±0.09 0.51±0.10 0.47±0.08 1.33 0.10 1.20 3.12*
F 0.68±0.18 0.62±0.04 0.60±0.05 0.55±0.05 1.07 1.02 3.14* 2.48*
T. test – 2.25* – 3.88* – 3.31* – 3.62*
L3M 0.50±0.03 0.48±0.08 0.43±0.03 0.44±0.08 0.69 1.71 – 0.38 2.03
F 0.59±0.11 0.58±0.04 0.56±0.07 0.51±0.04 0.32 0.89 2.46* 2.71*
T. test – 2.79* – 3.33* – 7.60* – 3.23*
L4M 0.49±0.05 0.45±0.06 0.42±0.04 0.42±0.03 1.14 1.38 –– 0.15 3.66*
F 0.59±0.08 0.59±0.04 0.57±0.05 0.51±0.09 – 0.08 0.77 2.26* 2.16
T. test – 5.10* – 6.63* – 8.38* – 2.38*
L5M 0.52±0.06 0.44±0.07 0.43±0.05 0.43±0.08 2.55* 0.37 – 0.17 3.07*
F 0.62±0.08 0.62±0.09 0.50±0.07 0.50±0.04 – 0.09 3.33* 0.0 4.32*
T. test – 4.06* – 8.36* – 3.80* – 3.09*
*significant at p<0.05 M=Male, F= Female
Int J Cur Res Rev | Vol 7 • Issue 2 • January 2015 40
Fetouh: Age and gender related changes in midsagittal dimensions of the lumbar spine in normal Egyptians: MRI study
0
0.4
0.8
L1 L2 L3 L4 L5 Level of lumbar vertebrae
Cana
l /Bod
y ra
tio o
f lu
mba
r ver
tebr
ae
3rd decade (20-29.9) 4th decade (30-39.9) 5th decade (40-49.9) 6th decade (50-59.9)
Figure 18: Means, standard deviations for canal/body ratio of lumbar vertebrae with age in males
0
0.2
0.4
0.6
0.8
1
L1 L2 L3 L4 L5 Level of lumbar vertebrae
Can
al /B
ody
ratio
of
lum
bar v
erte
brae
3rd decade (20-29.9) 4th decade (30-39.9) 5th decade (40-49.9) 6th decade (50-59.9)
Figure 19: Means, standard deviations for canal/body ratio of lumbar vertebrae with age in females