AFRL-ML-WP-TR-2003-4169 - Strategic Environmental ...
169
AFRL-ML-WP-TR-2003-4169 STRUCTURAL TECHNOLOGY AND ANALYSIS PROGRAM (STAP) Delivery Order 0010: Sol-Gel Technology for Surface Preparation of Metal Alloys for Adhesive Bonding and Sealing Operations Kay Y. Blohowiak Robert A. Anderson Ronald R. Stephenson The Boeing Company, Phantom Works P.O. Box 3999, M/S 73-09 Seattle, WA 98124-2499 MARCH 2001 Final Report for 01 January 1998 – 31 March 2001 Approved for public release; distribution is unlimited. STINFO FINAL REPORT MATERIALS AND MANUFACTURING DIRECTORATE AIR FORCE RESEARCH LABORATORY AIR FORCE MATERIEL COMMAND WRIGHT-PATTERSON AIR FORCE BASE, OH 45433-7750
-
Upload
khangminh22 -
Category
Documents
-
view
2 -
download
0
Transcript of AFRL-ML-WP-TR-2003-4169 - Strategic Environmental ...

AFRL-ML-WP-TR-2003-4169
STRUCTURAL TECHNOLOGY AND ANALYSIS PROGRAM (STAP) Delivery Order 0010: Sol-Gel Technology for Surface Preparation of Metal Alloys for Adhesive Bonding and Sealing Operations Kay Y. Blohowiak Robert A. Anderson Ronald R. Stephenson The Boeing Company, Phantom Works P.O. Box 3999, M/S 73-09 Seattle, WA 98124-2499
MARCH 2001 Final Report for 01 January 1998 – 31 March 2001
Approved for public release; distribution is unlimited.
STINFO FINAL REPORT
MATERIALS AND MANUFACTURING DIRECTORATE AIR FORCE RESEARCH LABORATORY AIR FORCE MATERIEL COMMAND WRIGHT-PATTERSON AIR FORCE BASE, OH 45433-7750
NOTICE USING GOVERNMENT DRAWINGS, SPECIFICATIONS, OR OTHER DATA INCLUDED IN THIS DOCUMENT FOR ANY PURPOSE OTHER THAN GOVERNMENT PROCUREMENT DOES NOT IN ANY WAY OBLIGATE THE U.S. GOVERNMENT. THE FACT THAT THE GOVERNMENT FORMULATED OR SUPPLIED THE DRAWINGS, SPECIFICATIONS, OR OTHER DATA DOES NOT LICENSE THE HOLDER OR ANY OTHER PERSON OR CORPORATION; OR CONVEY ANY RIGHTS OR PERMISSION TO MANUFACTURE, USE, OR SELL ANY PATENTED INVENTION THAT MAY RELATE TO THEM. THIS REPORT HAS BEEN REVIEWED BY THE OFFICE OF PUBLIC AFFAIRS (ASC/PA) AND IS RELEASABLE TO THE NATIONAL TECHNICAL INFORMATION SERVICE (NTIS). AT NTIS, IT WILL BE AVAILABLE TO THE GENERAL PUBLIC, INCLUDING FOREIGN NATIONS. THIS TECHNICAL REPORT HAS BEEN REVIEWED AND IS APPROVED FOR PUBLICATION.
/s/ /s/ __________________________________________ ________________________________________ JAMES MAZZA MARY ANN PHILLIPS Team Lead Chief Adhesives, Composites & Elastomers Team Materials Integrity Branch Materials Integrity Branch Materials & Manufacturing Directorate /s/ __________________________________________ GARY KEPPLE Deputy Chief Systems Support Division Materials & Manufacturing Directorate Do not return copies of this report unless contractual obligations or notice on a specific document require its return.
i
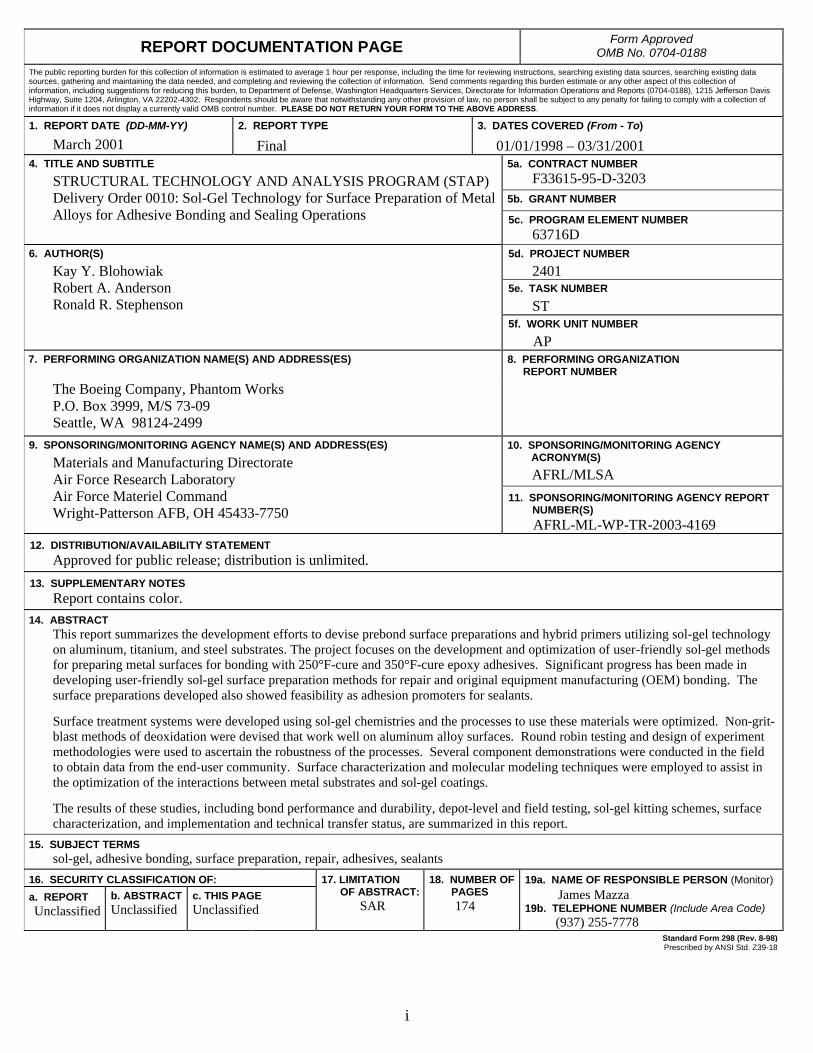
REPORT DOCUMENTATION PAGE Form Approved OMB No. 0704-0188
The public reporting burden for this collection of information is estimated to average 1 hour per response, including the time for reviewing instructions, searching existing data sources, searching existing data sources, gathering and maintaining the data needed, and completing and reviewing the collection of information. Send comments regarding this burden estimate or any other aspect of this collection of information, including suggestions for reducing this burden, to Department of Defense, Washington Headquarters Services, Directorate for Information Operations and Reports (0704-0188), 1215 Jefferson Davis Highway, Suite 1204, Arlington, VA 22202-4302. Respondents should be aware that notwithstanding any other provision of law, no person shall be subject to any penalty for failing to comply with a collection of information if it does not display a currently valid OMB control number. PLEASE DO NOT RETURN YOUR FORM TO THE ABOVE ADDRESS.
1. REPORT DATE (DD-MM-YY) 2. REPORT TYPE 3. DATES COVERED (From - To)
March 2001 Final 01/01/1998 – 03/31/2001 5a. CONTRACT NUMBER
F33615-95-D-3203 5b. GRANT NUMBER
4. TITLE AND SUBTITLE
STRUCTURAL TECHNOLOGY AND ANALYSIS PROGRAM (STAP) Delivery Order 0010: Sol-Gel Technology for Surface Preparation of Metal Alloys for Adhesive Bonding and Sealing Operations 5c. PROGRAM ELEMENT NUMBER
63716D 5d. PROJECT NUMBER
2401 5e. TASK NUMBER
ST
6. AUTHOR(S)
Kay Y. Blohowiak Robert A. Anderson Ronald R. Stephenson
5f. WORK UNIT NUMBER
AP 7. PERFORMING ORGANIZATION NAME(S) AND ADDRESS(ES) 8. PERFORMING ORGANIZATION
REPORT NUMBER
The Boeing Company, Phantom Works P.O. Box 3999, M/S 73-09 Seattle, WA 98124-2499
10. SPONSORING/MONITORING AGENCY ACRONYM(S)
AFRL/MLSA
9. SPONSORING/MONITORING AGENCY NAME(S) AND ADDRESS(ES)
Materials and Manufacturing Directorate Air Force Research Laboratory Air Force Materiel Command Wright-Patterson AFB, OH 45433-7750
11. SPONSORING/MONITORING AGENCY REPORT NUMBER(S)
AFRL-ML-WP-TR-2003-4169 12. DISTRIBUTION/AVAILABILITY STATEMENT
Approved for public release; distribution is unlimited. 13. SUPPLEMENTARY NOTES
Report contains color. 14. ABSTRACT
This report summarizes the development efforts to devise prebond surface preparations and hybrid primers utilizing sol-gel technology on aluminum, titanium, and steel substrates. The project focuses on the development and optimization of user-friendly sol-gel methods for preparing metal surfaces for bonding with 250°F-cure and 350°F-cure epoxy adhesives. Significant progress has been made in developing user-friendly sol-gel surface preparation methods for repair and original equipment manufacturing (OEM) bonding. The surface preparations developed also showed feasibility as adhesion promoters for sealants. Surface treatment systems were developed using sol-gel chemistries and the processes to use these materials were optimized. Non-grit-blast methods of deoxidation were devised that work well on aluminum alloy surfaces. Round robin testing and design of experiment methodologies were used to ascertain the robustness of the processes. Several component demonstrations were conducted in the field to obtain data from the end-user community. Surface characterization and molecular modeling techniques were employed to assist in the optimization of the interactions between metal substrates and sol-gel coatings. The results of these studies, including bond performance and durability, depot-level and field testing, sol-gel kitting schemes, surface characterization, and implementation and technical transfer status, are summarized in this report.
15. SUBJECT TERMS sol-gel, adhesive bonding, surface preparation, repair, adhesives, sealants
16. SECURITY CLASSIFICATION OF: 19a. NAME OF RESPONSIBLE PERSON (Monitor)
a. REPORT Unclassified
b. ABSTRACT Unclassified
c. THIS PAGE Unclassified
17. LIMITATION OF ABSTRACT:
SAR
18. NUMBER OF PAGES
174 James Mazza 19b. TELEPHONE NUMBER (Include Area Code)
(937) 255-7778 Standard Form 298 (Rev. 8-98)
Prescribed by ANSI Std. Z39-18

iii
Table of Contents 1 EXECUTIVE SUMMARY................................................................................................................................1
2 INTRODUCTION..............................................................................................................................................2 2.1 BACKGROUND .............................................................................................................................................2
2.1.1 Surface Treatments ................................................................................................................................2 2.1.2 Hybrid Primers ......................................................................................................................................3 2.1.3 Sealants..................................................................................................................................................4
2.2 REPORT STRUCTURE....................................................................................................................................5 3 EXPERIMENTAL PROCEDURES.................................................................................................................7
3.1 MATERIALS .................................................................................................................................................7 3.1.1 General ..................................................................................................................................................7 3.1.2 Manual Deoxidation Materials and Equipment.....................................................................................7 3.1.3 Primers and Adhesives...........................................................................................................................7 3.1.4 Sealants..................................................................................................................................................8 3.1.5 Hybrids ..................................................................................................................................................8
3.2 TESTING ......................................................................................................................................................8 3.2.1 Adhesives ...............................................................................................................................................8 3.2.2 Sealants..................................................................................................................................................9
4 ALUMINUM RESULTS .................................................................................................................................10 4.1 SUMMARY .................................................................................................................................................10 4.2 CONTROLS .................................................................................................................................................11
4.2.1 Validation of Equipment With PAA Round-Robin Testing...................................................................11 4.2.2 Pasa-Jell 105 Controls ......................................................................................................................12
4.3 PRETREATMENT STUDIES ..........................................................................................................................13 4.3.1 Screening of Valid Pretreatment Methods ...........................................................................................13 4.3.2 Abrasion Media Testing.......................................................................................................................15 4.3.3 Preliminary Scotch-Brite Roloc Disc Abrasion Study......................................................................16 4.3.4 Sanding Variation Study ......................................................................................................................17 4.3.5 Reproducibility of Individual Sanding Techniques ..............................................................................19 4.3.6 Solid State Cleaning Testing................................................................................................................21
4.4 ALLOY EFFECTS ........................................................................................................................................22 4.4.1 Initial Alloy Comparison Studies .........................................................................................................22 4.4.2 Clad vs. Bare Comparison...................................................................................................................25 4.4.3 Peel Testing..........................................................................................................................................27
4.5 SOL-GEL CHEMISTRY................................................................................................................................30 4.5.1 Sol-Gel Concentration Evaluation Study.............................................................................................30 4.5.2 FC 170 C Surfactant Study ..................................................................................................................32 4.5.3 Re-evaluation of Heat Curing of Sol-Gel Coating...............................................................................33 4.5.4 Extended Pot-Life Testing....................................................................................................................34 4.5.5 Stock Chemical Evaluation ..................................................................................................................35 4.5.6 Alternate Sol-Gel Chemistries .............................................................................................................37
4.6 APPLICATION PROCEDURE TESTING ..........................................................................................................38 4.6.1 Sol-Gel Wet Residence Time and Blow-Off Testing.............................................................................38 4.6.2 Increasing Sol-Gel Dry Time Prior to Wipe-on Primer.......................................................................41
4.7 PRIMER CHEMISTRY ..................................................................................................................................42 4.7.1 Primer Compatibility Evaluation.........................................................................................................42 4.7.2 Preliminary Evaluation of Repair Process Procedures .......................................................................45 4.7.3 Cocuring ..............................................................................................................................................46 4.7.4 BR 6757 Study......................................................................................................................................46

iv
4.8 VACUUM CURING......................................................................................................................................47 4.9 PASTE ADHESIVES .....................................................................................................................................48
4.9.1 Paste Evaluation with Bond Primer.....................................................................................................50 4.9.2 Durability of Bondlines in Nonprimed Systems ...................................................................................52
4.10 CONTAMINATION EFFECT STUDIES ...........................................................................................................53 4.11 CORROSION ANALYSIS OF BONDLINE........................................................................................................54
4.11.1 Baseline Corrosion Analysis ...........................................................................................................54 4.11.2 Nonchromate Inhibitor Incorporation into the Bondline ................................................................56
4.12 TEAM BASELINE PROCEDURES ..................................................................................................................58 4.12.1 Baseline Grit-blast Process for Aluminum......................................................................................58 4.12.2 Team Sanded Specimens .................................................................................................................60 4.12.3 Team Cocured Sanded Specimens...................................................................................................61 4.12.4 Wedge Test at 120°F .......................................................................................................................62
5 TITANIUM RESULTS....................................................................................................................................63 5.1 SUMMARY .................................................................................................................................................63 5.2 MANUAL DEOXIDATION SCREENING TESTING ..........................................................................................64 5.3 GRIT-BLAST VARIATIONS .........................................................................................................................65
5.3.1 Grit-Blast Parameters..........................................................................................................................65 5.3.2 Wet Grit-Blast Study ............................................................................................................................67 5.3.3 Sanding Variations ..............................................................................................................................67 5.3.4 Scotch-Brite Roloc Disc Abrasion Testing .......................................................................................68 5.3.5 Revalidation of Scotch-Brite Processing..........................................................................................69
5.4 TITANIUM-BONDING DEVELOPMENT FOR OEM APPLICATIONS ................................................................70 5.4.1 Comparison of Chemical Pretreatments to Mechanical Pretreatments...............................................70 5.4.2 Turco Pretreatment Evaluations..........................................................................................................71
5.5 ALTERNATE DEOXIDATION METHODOLOGIES...........................................................................................76 5.5.1 Navy Laser Etch (Lasertronics) ...........................................................................................................76
5.6 SOL-GEL CHEMISTRIES .............................................................................................................................77 5.6.1 Effect of Surfactants.............................................................................................................................77 5.6.2 Search for an Alternate Surfactant ......................................................................................................78
5.7 PRIMER CHEMISTRIES................................................................................................................................79 5.7.1 Manual Primer Application .................................................................................................................79
5.8 ALTERNATE ADHESIVE DATA ...................................................................................................................80 5.8.1 Testing with BMS 5-154 Adhesive .......................................................................................................80 5.8.2 Compatibility with AF 191 350°F Adhesive.........................................................................................82
5.9 TEAM BASELINE GRIT-BLAST PROCESS.....................................................................................................83 6 STEEL RESULTS............................................................................................................................................84
6.1 BASELINE TESTING....................................................................................................................................85 6.2 STAINLESS 301 TESTING............................................................................................................................86 6.3 ALTERNATIVE MANUAL DEOXIDATION TECHNIQUES ...............................................................................88 6.4 AM355 TESTING .......................................................................................................................................89 6.5 TEAM GRIT-BLAST SPECIFICATION TESTING ON STAINLESS ......................................................................90
7 SOL-GEL KIT DEVELOPMENT..................................................................................................................92 7.1 SUMMARY .................................................................................................................................................92 7.2 KIT SPECIFICATIONS..................................................................................................................................92 7.3 FIRST-GENERATION KIT STUDIES ..............................................................................................................93
7.3.1 4-Week Old Kits ...................................................................................................................................93 7.3.2 7-Week Old Kits ...................................................................................................................................99 7.3.3 6-Month Old Kits ...............................................................................................................................102 7.3.4 12-Month Old Kits .............................................................................................................................104
7.4 SPRAYER EQUIPMENT..............................................................................................................................106 7.5 KIT FORMULATION TOLERANCE MEASUREMENTS ..................................................................................108 7.6 SECOND-GENERATION KITTING MATRIX .................................................................................................110

v
7.6.1 Testing of New (No-Aging) Second-generation Kits ..........................................................................110 7.6.2 Second-generation Kits with 1-Month Shelf-life Testing ...................................................................111 7.6.3 Second-Generation Kits with 6-Month Shelf-life Testing...................................................................112 7.6.4 Second-Generation Kits with 12-Month Shelf-life Testing.................................................................113
7.7 SIMPLIFIED KIT MIXING ..........................................................................................................................115 7.7.1 Verification of Simplified-Mix Process for Kits .................................................................................117
7.8 VENDOR-SUPPLIED SOL-GEL KIT EVALUATION......................................................................................118 8 CHARACTERIZATION...............................................................................................................................120
8.1 GLOSS METER MEASUREMENTS..............................................................................................................120 8.2 X-RAY ABSORPTION SPECTROSCOPY (XAS) ..........................................................................................120 8.3 INFRARED SPECTROSCOPY CHARACTERIZATION STUDY .........................................................................121
8.3.1 Sol-Gel Chemistry Evaluation ...........................................................................................................121 8.3.2 Characteristic Group Frequencies ....................................................................................................122 8.3.3 TPOZ, GAA, and H2O........................................................................................................................123 8.3.4 GTMS-Based Sol-Gel Solution...........................................................................................................124 8.3.5 GTMS-based Sol-Gel Panels .............................................................................................................127
8.4 NAVY TITANIUM SURFACE ANALYSIS.....................................................................................................130 8.5 INCORPORATION OF DYES INTO SOL-GEL COATINGS ..............................................................................130
8.5.1 Sample Preparation ...........................................................................................................................131 8.5.2 Dyed Panel Analysis ..........................................................................................................................131
9 SEALANT SURFACE PREPARATIONS...................................................................................................134 9.1 SUMMARY ...............................................................................................................................................134 9.2 TITANIUM PEEL TESTING ........................................................................................................................134
10 HYBRID DEVELOPMENT..........................................................................................................................137 10.1 SUMMARY ...............................................................................................................................................137 10.2 NANOCOMPOSITE COATINGS ...................................................................................................................137
10.2.1 Initial Primer Formulation Attempts.............................................................................................137 10.2.2 Formulation of Bisphenol-A Epoxy Resin Based Primers.............................................................138 10.2.3 Second Round Testing ...................................................................................................................139 10.2.4 Optimization of Bisphenol-A Epoxy Resin Primers.......................................................................139 10.2.5 Addition of Adhesion Promoters ...................................................................................................141
10.3 HYBRID COPOLYMERIZATION .................................................................................................................144 10.3.1 Baseline Mechanical Property Testing .........................................................................................144 10.3.2 Screening Tests .............................................................................................................................145 10.3.3 Parameter Optimization................................................................................................................148
11 TECHNOLOGY TRANSFER APPLICATIONS .......................................................................................153 11.1 DURABILITY PATCH APPLICATION DEMONSTRATION ON B-52 FUSELAGE SECTION ...............................153 11.2 B-52 TECHNOLOGY DEMONSTRATION ....................................................................................................158
12 CONCLUSIONS ............................................................................................................................................161
13 REFERENCES...............................................................................................................................................162

vi
ACKNOWLEDGEMENTS: This research was partially funded by the Strategic Environmental Research and Development Program (SERDP) under Project PP-1113. The Boeing Company is pleased to be part of a Tri-Services/Industry working team developing technology for this project. The Boeing Company leads the sol-gel development and technical integration associated with this effort under Air Force contract F33615-95-D-3203, Delivery Order 0010. The United States Air Force, Navy, and Army lead the process development efforts for aluminum, titanium, and steel alloys, respectively. This report encompasses portions of work from all members of the SERDP Tri-Services team, but does not include all of the body of work conducted by the team members. All PP-1113 team members and external collaborators are thanked for contributions to this report and to the overall effort.

1
1 Executive Summary
The Strategic Environmental Research and Development Program (SERDP) has funded a Tri-Service team to develop prebond surface preparations and hybrid primers utilizing sol-gel technology on aluminum, titanium, and steel substrates. This project focuses on the development and optimization of user-friendly sol-gel methods for preparing metal surfaces for bonding with 250°F-cure and 350°F-cure epoxy adhesives. The goals of this program are to design a process that 1) increases durability, 2) improves process robustness, 3) decreases repair time, 4) uses simple equipment and processes, 4) uses environmentally friendly materials, and through all of these 5) increases affordability. Depot sites, including NADEP-North Island, NADEP-Cherry Point NADEP-Jacksonville, Warner Robins ALC, and Corpus Christi Army Depot are involved in the requirements generation and testing cycle to ensure end-user needs are being met and technology transition issues are assessed.
Significant progress has been made by the team in developing user-friendly sol-gel surface preparation methods for repair and original equipment manufacturing (OEM) bonding. The feasibility of using these same approaches as sealant adhesion promoters was also demonstrated. Round robin testing and design of experiment methodologies have been used to ascertain the robustness of the processes. Several component demonstrations have been conducted in the field to obtain data from the end-user community. Surface characterization and molecular modeling techniques have been employed to assist in the optimization of the interactions between metal substrates and sol-gel coatings.
The development of a new hybrid primer system, which combines aspects of the surface treatment and adhesive bond primer was also a focus of this effort. Critical progress was made towards identifying an effective hybrid inorganic/organic polymer chemistry and developing the system to result in a candidate room-temperature bond primer that can be used in conjunction with low-temperature-curing two-part paste adhesive systems.
Implementation of these technologies will result in potentially significant cost savings through reduced manufacturing flow-times, reduced repair times, reductions in hazardous materials use and disposal costs, while at the same time dramatically improving the robustness and durability of bonded metal joints.
The results of these studies, including bond performance and durability, depot-level and field testing, sol-gel kitting schemes, surface characterization, and implementation and technical transfer status, are summarized in this report.

2
2 Introduction
2.1 Background
2.1.1 Surface Treatments
The use of adhesive bonding in the design and repair of air vehicles is an efficient way to minimize weight and increase metal fatigue life through the elimination of mechanically fastened hardware. Metal treatment prior to bonding is a key factor for both the initial adhesion of a bonded joint and its long-term environmental durability.1 Current metal prebond surface preparations are either inconvenient or complex to use (especially in the field), contain hazardous materials (strong acids or caustics, hexavalent chromium, volatile organic compounds), and/or do not provide the performance necessary for successful long-term durable bonds. Past bond failures, primarily due to inadequate surface preparation, have been a limiting factor in the current use of bonded hardware, especially for structure critical to flight safety.
Conventional approaches to preparing metal surfaces for bonding (anodizing and etching) promote adhesion by producing a high surface area structure (on a micrometer scale) which has both mechanical and physical (Lewis acid-base, dispersion, hydrogen bonding, etc.) interactions with the adhesive primer.2 Alternative approaches, such as the grit-blast/silane (GBS) process3 have also been successfully used, but are not widely implemented, largely due to processing issues including concerns associated with containment of the grit and long process times.
With sol-gel chemistry, adhesion results from the chemical interaction at the interfaces between the metal and the sol-gel and the sol-gel and the primer.4 In previous contract efforts5, Boeing developed formulations using waterbased silicon-zirconium sol-gel chemistries to produce thin film coatings that effectively form a gradient from the metallic surface through a hybrid inorganic/organic layer to the organic resin, as depicted notionally in Figure 2.1-1. Using appropriate precursors, sol-gel films promoting adhesion of organic resins, such as adhesives, paints, and coatings, can be produced. The chemistry formulated for use with epoxies is designated for research and development (R&D) use as Boegel-EPII. At the completion of this contract, the name for the commercially available sol-gel material with the same composition is AC130 from Advanced Chemistry and Technology.

3
MetalHardware
Metal Part Surface
O
ZrZr
Organic Resin
NH2NH2 NH2 NH2
O
O O
SiZr
O
OO
Si
O
O
O
o
ZrO
Si
O
o
ZrO O
O
O
O
O
O
Zr
O
OZr
O
O
O
o
O
o
O
NH2
o
O
SiO
SiO
Zr
O
OHO
SiO
ZrO
Zr
O
Zr
Si SiO
Si
Si
Sol-GelLayer
OrganicResin
O
O
O
O
OHO
Zr
Si
Si
O
O
O
OH
SiO
Si
O
O
O
O
Zr
O
Figure 2.1-1. Notional schematic of sol-gel adhesion-promoting coating on a metal part
2.1.2 Hybrid Primers
A second task in this program was development of a hybrid adhesive primer coating. The team pursued two parallel approaches during this program to lower the risk of development for the hybrid systems. These general approaches are depicted in Figure 2.1-2.
RR R R R R R R R R R
Hybrid copolymerization Polymer Blends/Interpenetrating Networks
R R R R • Formation of colloidal particles or fractal structures• Incorporate into organic matrix• Inorganic portion may be functionalized
• Uses methodologies of traditional polymer science• Nanoregions of inorganic polymer lend characteristics• Inorganic portion may be functionalized
Nanocomposite CoatingsR R R R
RR
R
Colloidal Particle
Inorganic Polymer
Organic Polymer
Functional Group
LEGEND
Figure 2.1-2 Hybrid adhesive primer development approaches

4
The first approach was taken by our subcontractor, Chemat Technologies, and was based on nanocomposite coating development. The nanocomposite approach is based on forming colloidal particles, in this case alumina-silica based, and imbedding them within an essentially organic matrix. The nanocomposites are coatings with very small nanoregions that have discrete inorganic character. These discrete inorganic particulate regions modify the network formation of the organic matrix providing a unique material that is not achievable using organic means alone. The colloidal particles are not necessarily completely 'ceramic-like' in nature. They are more or less like tumbleweed units with alumina-silica character that are also potentially functionalized on the surface. They can use the surface functionalization to couple directly into the organic matrix.
The second approach was a hybrid copolymer or polymer blend. This approach is defined by using the traditional methodologies of organic polymer chemists, but using new polymer feedstocks. A polymer blend in traditional organic polymer terminology is where a portion of one type of polymer is mixed with a portion of another type of polymer. There are many successful products based on this fairly simple concept.
The hybrid copolymer is defined by having the inorganic elements as part of the polymer backbone. So, short oligomeric portions of the polymer may be C-C-C-C- and short oligomeric portions may be Si-O-Si-O-Si-O- (for example).
The eventual focus of the hybrid effort was to develop a room-temperature-curing nonchromated waterborne primer for use with paste adhesive systems. Currently, there is no bond primer system that can be cured at room temperature, yet still produce bonded joints with acceptable strength and durability properties using paste adhesive systems. Section 10.0 describes the results of this developmental work.
2.1.3 Sealants
The goal of this small task was to assess the sol-gel surface preparation technology as an adhesion promoter for polysulfide and polythioether sealants. Currently, sealants require the use of an adhesion promoter to obtain the maximum adhesion performance and durability of the system. Often these adhesion promoters contain very high levels of volatile solvents, resulting in a product that may not meet local and federal environmental restrictions.
Some waterborne adhesion promoters exist, but are typically optimized for a specific sealant system. In this study, the baseline sol-gel surface treatment, using the Boegel-EPII formulation, was assessed to determine if it would yield acceptable sealant adhesion and durability performance when used as an adhesion promoter. This would allow depots to stock fewer chemicals on their shelves, since the Boegel-EPII could potentially be used for more than one application.
Additionally, there are times when a primer (often chromated) is applied to the surface of a metal part just to enable acceptable adhesion of the subsequently applied sealant. By using a sol-gel surface treatment directly over a metal surface, the use of primer can be potentially avoided. This would be particularly attractive on titanium substrates where there is no need for the corrosion inhibitor in the primer. Testing on this program was therefore focused on titanium substrates.

5
2.2 Report Structure
This final report is a summary of the work conducted at The Boeing Company on the SERDP-PP-1113 program. It represents a portion of the work carried out on the total PP-1113 effort and is not meant to be inclusive of all work carried out on that program. Since this was a coordinated team effort, tasks were shared throughout the team structure. Therefore, in some areas of the report, data have been added from the project partners where necessary to make the report report more readable. The entire work package for the SERDP PP-1113 effort will be reported in a separate document at the conclusion of the program. The Tri-Services DoD/Industry effort structure is shown in Figure 2.2-1.
Al Bonding
USAF: AFRL/MLSAWarner Robins ALCOC-ALC, OO-ALC
Program Managers:Jim Mazza AFRL/MLSA
Georgette Gaskin NAVAIR/Pax River
Sol-Gel Chemistry, Tech Integrator,Hybrids, Sealant Promoters
Ti Bonding
Navy: NAVAIRNADEPs North Island
Cherry Point and Jax
AnalyticalCharacterization
Steel Bonding
ARMY - ARDECPicatinny Arsenal
CCAD
ModelingPrimer
Sol-Gel Kits, Packaging
Al Bonding
USAF: AFRL/MLSAWarner Robins ALCOC-ALC, OO-ALC
Program Managers:Jim Mazza AFRL/MLSA
Georgette Gaskin NAVAIR/Pax River
Sol-Gel Chemistry, Tech Integrator,Hybrids, Sealant Promoters
Ti Bonding
Navy: NAVAIRNADEPs North Island
Cherry Point and Jax
AnalyticalCharacterization
Steel Bonding
ARMY - ARDECPicatinny Arsenal
CCAD
ModelingPrimerPrimer
Sol-Gel Kits, Packaging
Figure 2.2-1. SERDP PP-1113 program structure
The sol-gel development effort involves all of the DoD Services, the Department of Energy (DOE) and industry. The Air Force has taken the lead for aluminum substrate applications, the Navy for titanium, and the Army for stainless steel. Boeing, Battelle, Cytec Fiberite and the DOE support the development on all three substrates. In addition, the service representatives maintain open communication to their respective maintenance organizations to initiate limited field trials, enhance transition opportunities, and receive feedback about proposed repair processes and techniques.
The Boeing contract was divided into four tasks. The first task is the primary effort and focuses on development and optimization of sol-gel surface preparation processes for adhesive bonding of metallic structures that are compatible with experimental waterborne and low volatile organic compound (VOC) adhesive bond primers. This is being accomplished by optimizing the sol-gel chemistry and by developing application procedures. Epoxy adhesives are the primary focus. Once the sol-gel/primer system(s) are optimized, they will be demonstrated at depot facilities. The goal of this task is to find an environmentally friendly pretreatment/primer system that can be implemented in the near term.

6
The second task is to develop a one-step process that combines the adhesive primer and sol-gel surface treatment into one consolidated interfacial layer. This approach will eliminate the need for a separate primer step. It also has the potential to eliminate or minimize the number of different primers now used for different service temperature applications. This task involves the development of a new hybrid primer that incorporates components of the mostly inorganic surface preparation with components of the primer into a nanostructured hybrid layer. The third task involves testing of this new hybrid primer over phosphoric acid anodize treated aluminum alloys to see how it functions as a standard adhesive bond primer. Task 3 was cancelled as part of this development effort for practical reasons. The two-step approach employing the waterborne sol-gel plus the waterborne adhesive bond primer yielded acceptable bond performance results and solved the environmental issues which were the object of the original Task 3. Thus, the team’s efforts were focused on optimizing the processes in the other areas.
The fourth task involves testing of the sol-gel treatments as adhesion promoters for sealants. The baseline Boegel-EPII surface preparation was evaluated as were chemically modified versions that had been optimized for the particular sealant chemistries screened.
For ease of reading, the report is separated into sections based on technical function, as delineated in the table of contents. The report is organized in terms of historical data collection, with some of the earlier results being the basis decision of making for latter test studies. Some of the earlier test results are not as good as later studies, due to unidentified and uncontrolled test parameters during the evaluation process. At the beginning of each major section, a summary is given to outline the major accomplishments in that area.
7
3 Experimental Procedures
3.1 Materials
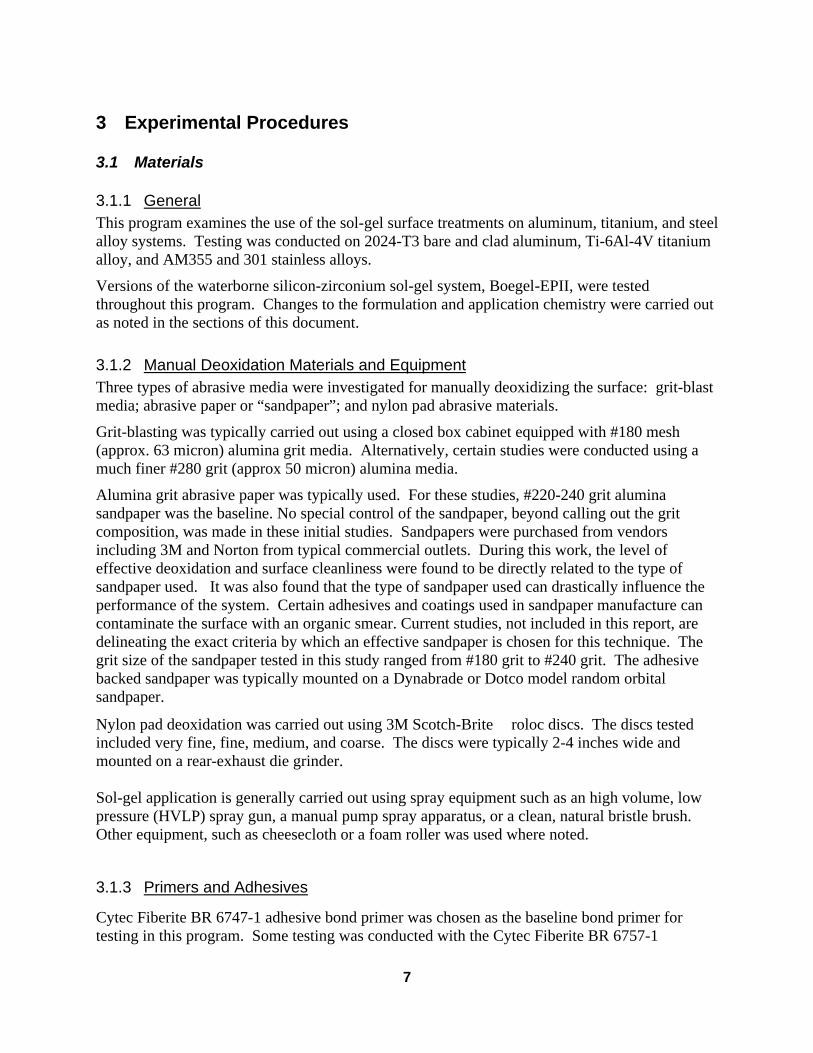
3.1.1 General This program examines the use of the sol-gel surface treatments on aluminum, titanium, and steel alloy systems. Testing was conducted on 2024-T3 bare and clad aluminum, Ti-6Al-4V titanium alloy, and AM355 and 301 stainless alloys.
Versions of the waterborne silicon-zirconium sol-gel system, Boegel-EPII, were tested throughout this program. Changes to the formulation and application chemistry were carried out as noted in the sections of this document.
3.1.2 Manual Deoxidation Materials and Equipment Three types of abrasive media were investigated for manually deoxidizing the surface: grit-blast media; abrasive paper or “sandpaper”; and nylon pad abrasive materials.
Grit-blasting was typically carried out using a closed box cabinet equipped with #180 mesh (approx. 63 micron) alumina grit media. Alternatively, certain studies were conducted using a much finer #280 grit (approx 50 micron) alumina media.
Alumina grit abrasive paper was typically used. For these studies, #220-240 grit alumina sandpaper was the baseline. No special control of the sandpaper, beyond calling out the grit composition, was made in these initial studies. Sandpapers were purchased from vendors including 3M and Norton from typical commercial outlets. During this work, the level of effective deoxidation and surface cleanliness were found to be directly related to the type of sandpaper used. It was also found that the type of sandpaper used can drastically influence the performance of the system. Certain adhesives and coatings used in sandpaper manufacture can contaminate the surface with an organic smear. Current studies, not included in this report, are delineating the exact criteria by which an effective sandpaper is chosen for this technique. The grit size of the sandpaper tested in this study ranged from #180 grit to #240 grit. The adhesive backed sandpaper was typically mounted on a Dynabrade or Dotco model random orbital sandpaper.
Nylon pad deoxidation was carried out using 3M Scotch-Brite roloc discs. The discs tested included very fine, fine, medium, and coarse. The discs were typically 2-4 inches wide and mounted on a rear-exhaust die grinder. Sol-gel application is generally carried out using spray equipment such as an high volume, low pressure (HVLP) spray gun, a manual pump spray apparatus, or a clean, natural bristle brush. Other equipment, such as cheesecloth or a foam roller was used where noted.
3.1.3 Primers and Adhesives
Cytec Fiberite BR 6747-1 adhesive bond primer was chosen as the baseline bond primer for testing in this program. Some testing was conducted with the Cytec Fiberite BR 6757-1

8
nonchromated version of this adhesive bond primer. Where noted, evaluations were conducted without the addition of a bond primer.
For 250°F-cure BMS5-101 film adhesive testing, specimens were bonded with 0.06 psf AF 163-2M film adhesive from 3M Company, unless otherwise noted. The adhesive was cured for 60-90 minutes at 250°F and 35-40 psi in an autoclave, unless otherwise noted.
The Air Force Research Laboratory (AFRL/MLSA) evaluated several ambient-curable adhesives, including Hysol’s EA 9309.3NA, EA 9320NA, EA 9330.3, EA 9394, and EA 9396 as well as 3M Company’s EC 2615 and EC 3333. Polyester random mat scrim cloth was used for bondline control with all adhesives except EA 9309.3NA, which was manufactured with glass beads to control the bondline thickness to approximately 0.005 inches. Adherends were bonded with the epoxy paste adhesives according to the manufacturers’ recommendations and cured at ambient temperature using either 35 psi positive pressure or 15-25 in Hg vacuum pressure. Vacuum pressure was applied in order to replicate field-level curing conditions. Pressure was applied to the panels for only the first 24 hours. Panels were then held at ambient conditions for an additional six days until fully cured. Additional testing was performed on panels cured according to the manufacturers’ recommended elevated-temperature cure cycle to accelerate the cure of the paste adhesives. Accelerated cure of paste adhesives is common in the field in order to decrease the amount of time required to perform a repair. Panels were heated at a rate of 5°F per minute to the recommended cure temperature and held at that temperature for 60 minutes while under pressure.
3.1.4 Sealants Sealant testing in this study was conducted over Ti-6Al-4V alloy substrates. No primer was applied over the sol-gel coating to test the compatibility of the sol-gel with the sealant. Phosphate fluoride per BAC5861 was used as the baseline control on Ti-6AL-4V for comparison to the adhesion performance of the sol-gel surface preparations. Sealants tested include Courtaulds Aerospace polysulfide sealants PR-1776, Class B-2 and PR-1750 as well as polythioether sealants PR-1826 and PR-1828.
3.1.5 Hybrids Hybrid development was conducted using dual approaches with a mid-term program downselect. Chemat Technologies developed formulations based on mixing primer chemistries with their AL9201 sol-gel formulation. In parallel, chemistries were formulated at Boeing based on Altana (formerly Shell) resin components and sol-gel resin components. The development of these materials is described in Section 9.0
3.2 Testing
3.2.1 Adhesives The primary screening test used in this program, intended to assess the long-term environmental durability of the bonded joints is the wedge test (ASTM D 3762).6 Treated adherends, sized 6 inch x 6 inch, are bonded together, and the panels are machined into 1-inch wide specimens. The thickness of the panels used in the screening studies was a function of the alloy used. Typically for aluminum alloys, the nominal sheetstock thickness used was 0.125 inch; for titanium it was

9
0.050 inch and for the stainless it was 0.050 inch. A wedge is inserted into one end of the panel bondline and the resultant crack generated within the adhesive is measured. The sample is placed in a hot/wet environment and the crack length is measured periodically. For screening purposes, bonds exhibiting at least 95% cohesive failure within the adhesive with minimal crack growth after 28 days are considered acceptable.
The environmental conditions utilized are 120°F and >98% relative humidity (RH) or 140°F & >98% RH. The crack growths and failure modes of the specimens were used to calculate the significance of each factor tested. Most wedge test specimens with optimum processing conditions exhibited crack growths of <0.25 inches with cohesive failure modes (within the adhesive layer). Small “nicks” of adhesive failure (at the metal interface) were sometimes detected at the edges of these specimens. It was estimated that the area of these small nicks was roughly 5% or less of the specimen test area. Failure modes for all developmental specimens are reported in conjunction with the wedge crack extension data.
Additional screening utilized tensile lap shear per ASTM D 10027 as well as climbing drum peel testing per Boeing specification BSS 7206 and floating roller peel testing to both BSS 7206 and ASTM D3167.8
3.2.2 Sealants
Peel testing was conducted according to BSS 7257 at ambient temperature and after exposure to Jet Reference Fuel at 140°F for 7 days.

10
4 Aluminum Results
4.1 Summary Currently, surface preparation techniques such as phosphoric acid anodize (PAA) or sulfuric acid-sodium dichromate etching are used to provide acceptable surfaces for bonding. These methods utilize hazardous materials and generate waste that must be disposed of in an appropriate fashion. In repair situations, the complexity, location in an assembly, or size of the hardware is often not conducive to preparing the surface for bonding in a tankline or using the on-aircraft anodize or paste etch methods.9 In these situations, the sol-gel procedure provides an excellent environmentally friendly alternative to achieve the high performance required at low cost. The sol-gel solution can be brushed or sprayed on the surface to be treated and does not require rinsing. The sol-gel process is similar to the silane surface preparations currently used by a number of organizations, but is quicker, eliminates the elevated-temperature drying step and can eliminate the grit-blasting step for many applications.
With the sol-gel process, it is possible to achieve a reproducible surface that results in durable bonded interfaces using readily available materials. Bonding performance was measured using the wedge test, which assesses the environmental durability of the bonded joint. The results on aluminum, as compared to standard controls, are shown in Figure 4.1-1.
1.001.101.201.301.401.501.601.701.801.902.00
0 200 400 600 800
Hours of Exposure to 140°F and >98% Relative Humidity
To
tal C
rack
Len
gth
(in
ches
) P 43-1 2024-T3, #180Alumina Grit Blasted,Boegel-EPII Coated, BR6747-1, AF 163-2
P 37-2 2024-T3,Phosphoric AcidAnodized, BR 6747-1,AF 163-2
R 51-2 2024-T3, FineScotch-Brite DiscAbraded, Pasa Jell 105Treated, BR 6747-1,AF 163-2
Figure 4.1-1. Wedge crack extension of sol-gel treated Al 2024-T3 specimens exposed to 140°F and >98% RH
Metal pretreatment prior to sol-gel deposition consists of manually deoxidizing the surface by either 1) grit-blasting; 2) 3M Company Scotch-Brite pad abrasion; or 3) sanding with #220 or finer Al2O3 grit sandpaper. The success of the bonding operation relies on the thorough deoxidation and preparation of the metal surface. The results in this report show examples of all of these types of abrasion techniques. A comparison of different manual deoxidation methods on bare and clad 2024-T3 aluminum wedge test performance is shown in Figure 4.1-2.

11
0.8
0.9
1
1.1
1.2
1.3
1.4
1.5
0 200 400 600 800 1000
Hours of Exposure to 140°F and >98% Relative Humidity
To
tal C
rack
Len
gth
, in
ches
S 55-1 Alclad 2024 T3, 50Micron Grit Blasted
S 55-2 Alclad 2024 T3,MED Maroon ScotchbriteRoloc Disc Abraded
S 55-3 Alclad 2024 T3,#220 Alumina SandpaperSanded
S 55-4 Bare 2024 T3, #180Alumina Grit Blasted
S 55-7 Bare 2024 T3, #220Alumina Sandpaper Sanded
S 55-9 Bare 2024 T3, 50Micron Alumina Grit Blasted
Figure 4.1-2. Wedge test results for Alclad and bare 2024-T3 aluminum using
various mechanical deoxidation pretreatment methods
4.2 Controls
4.2.1 Validation of Equipment With PAA Round-Robin Testing The Tri-Services/Industry team conducted a series of round-robin tests to ascertain whether the equipment and procedures used for testing and evaluation of wedge test coupons was the same at each site. That way, the team could be sure that changes in results would be a direct reflection of the change in test parameters rather than differences in measurement and test conditions. To carry out this task, phosphoric acid anodized (PAA) panels were prepared and cut up at Air Force Research Laboratory (AFRL/MLSA) and tested at each of the sites to determine the uniformity in the testing for all of the participants. The wedge test performance is shown in Figure 4.2-1.
98% coh 98% coh
98% coh
96% coh
98% coh
94% coh

12
0
0.05
0.1
0.15
0.2
0.25
0 100 200 300 400 500 600 700 800
Hrs of Expsoure to 140°F and >98% RH
Cra
ck G
row
th (
inch
es)
Chemat
Boeing
Navy
Air Force
Army
Figure 4.2-1. Round robin #2 PAA wedge crack extension results
The data were all relatively uniform with the exception of those from the Air Force. Although crack growth for the Air Force specimens was larger, failure modes were cohesive within the adhesive layer.
4.2.2 Pasa-Jell 105 Controls
Compared to the Pasa-Jell 105 process for aluminum, the sol-gel process offers several advantages, hazardous waste reduction and increased user safety being two of them. The use of Pasa-Jell 105 on 1.5 ft2 of aluminum wedge crack substrates (3 pairs of 6-inch x 6-inch panels) generates about 4 liters of chromate-contaminated, acidic rinse water and about 0.10 ft3 of solid hazardous waste. The solid waste is composed of the used Pasa-Jell 105 paste (containing sulfuric acid and potassium dichromate), the brush used to apply the Pasa-Jell, the cheesecloth used to wipe the Pasa-Jell from the treated panels, used gloves and the plastic film used to protect the table top during the treatment process.
The Pasa-Jell process is a fairly messy operation and containment of the thixotropic acid etch paste and subsequent rinsewater is difficult. It’s not as difficult in a laboratory environment where the facility is designed for chemical processes and there is ready access to sinks and chemical waste containers, but its use in repair shop environments can easily cause many problems. However, it has been used extensively throughout the repair community with relative success in past performance.
To assess the performance of the sol-gel treatment in comparison to Pasa-Jell 105, Al 2024-T3 wedge crack specimens were prepared using both techniques in comparative testing. The Pasa-Jell 105 specimens were primed with Cytec Fiberite BR 127 adhesive bond primer whereas the sol-gel specimens were primed Cytec Fiberite BR 6747. The samples were bonded with AF 163-2 adhesive and were exposed to 140°F & 98% RH to compare their wedge crack performance. Three sets of specimens were prepared using various Scotch-Brite disc abrasion methods as the pretreatment. The performance of the wedge crack samples is plotted in Figure 4.2-2.

13
0
0.5
1
1.5
2
2.5
0 100 200 300 400 500 600 700 800
Hours of Exposure to 140°F and >98% Relative Humidity
To
tal C
rack
Len
gth
, (in
ches
)R 51-1 Abraded With Blue, VeryFine Scotch-Brite Disc, Pasa Jell105 Treated
R 51-2 Abraded With Maroon,Fine Scotch-Brite Disc, Pasa Jell105 Treated
R 51-2 Abraded With Brown,Medium Grit Al2O3 SandpaperDisc, Pasa Jell 105 Treated
R 21-3 Sanded With #220Alumina Sandpaper, Not DI H2ORinsed, Sol-Gel Coated
Figure 4.2-2. Wedge crack extension performance of Pasa-Jell 105 treated Al 2024-T3 specimens
compared with sol-gel treated specimens bonded with AF163-2 250°F-cure adhesive
The only difference in the preparation of the three Pasa-Jell samples was the use of different abrasive materials during the mechanical deoxidation surface pretreatment. Very fine (DESCO #RL2S-VF) Scotch-Brite discs were used on R 51-1 samples, medium (DESCO #RL2S-M) Scotch-Brite discs were used on R 51-2, and very fine bonded alumina grit sandpaper surface conditioning discs (DESCO #BF2NH-VF) were used on R 51-3. A 12,000-RPM compressed air driven grinder (DESCO Model 2003) was used with each of the three types of abrasives. The results of this study show that the Pasa-Jell process can produce durable bonds when used appropriately, however still represents a significant hazardous materials use.
4.3 Pretreatment Studies
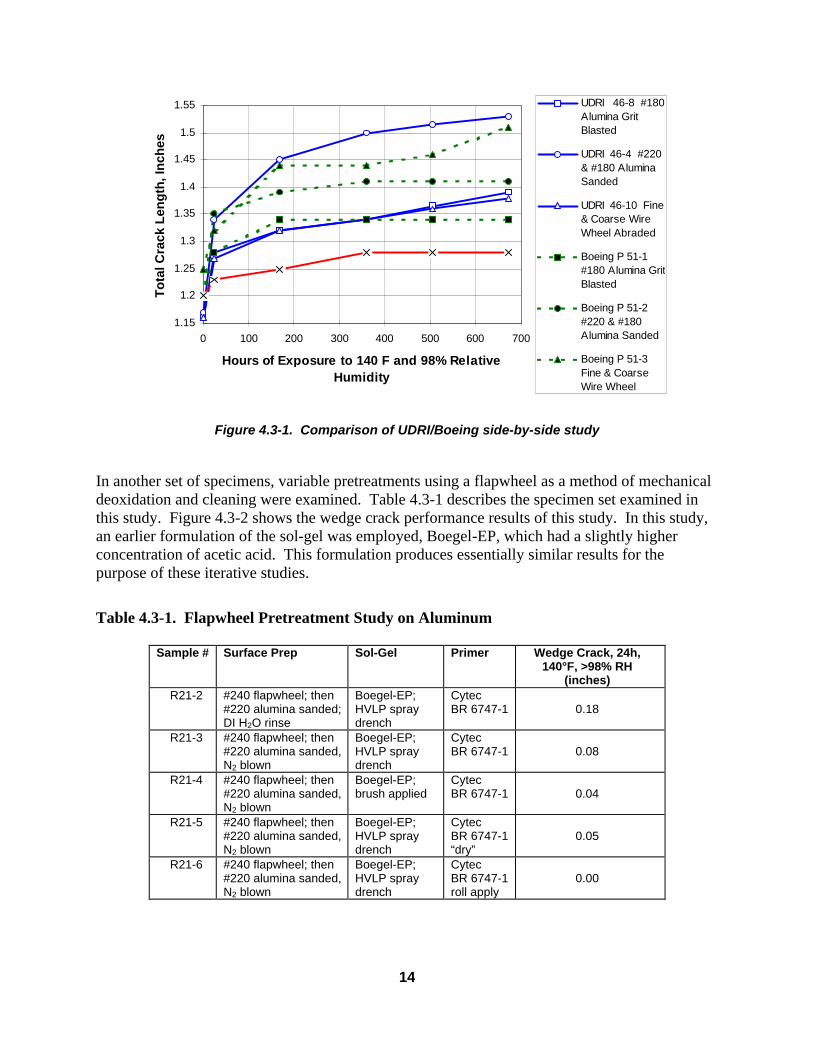
4.3.1 Screening of Valid Pretreatment Methods To determine the viability of various manual deoxidation treatments on the surface of the aluminum alloys, several sets of Al 2024-T3 specimens were processed using grit-blast, sanding, and wire wheel pretreatments followed by application of the Boegel-EPII solution. Representatives from the University of Dayton Research Institute (UDRI) prepared half of the panels and half were prepared by Boeing personnel. All the panels were primed with Cytec BR 6747-1 primer. The specimens prepared by the UDRI personnel were brought back to Dayton to be bonded and tested in their laboratories. Likewise, the Boeing-processed panels were bonded and tested at Boeing facilities. The bond performance of these specimens was monitored and compared between the two groups as a means of determining process continuity from site to site. Wedge crack extension data from the UDRI/Boeing side-by-side tests are shown in Figure 4.3-1. The red line indicates the PAA control data. The relatively poorer performance of the UDRI specimens was possibly from differences in application of the mechanical deoxidation processes and/or differences in the hot/wet exposure.
14
Sol-Gel Formulation
1.15
1.2
1.25
1.3
1.35
1.4
1.45
1.5
1.55
0 100 200 300 400 500 600 700
Hours of Exposure to 140 F and 98% Relative Humidity
To
tal C
rack
Len
gth
, In
ches
UDRI 46-8 #180Alumina GritBlasted
UDRI 46-4 #220& #180 AluminaSanded
UDRI 46-10 Fine& Coarse WireWheel Abraded
Boeing P 51-1 #180 Alumina GritBlasted
Boeing P 51-2 #220 & #180Alumina Sanded
Boeing P 51-3 Fine & CoarseWire Wheel
Figure 4.3-1. Comparison of UDRI/Boeing side-by-side study
In another set of specimens, variable pretreatments using a flapwheel as a method of mechanical deoxidation and cleaning were examined. Table 4.3-1 describes the specimen set examined in this study. Figure 4.3-2 shows the wedge crack performance results of this study. In this study, an earlier formulation of the sol-gel was employed, Boegel-EP, which had a slightly higher concentration of acetic acid. This formulation produces essentially similar results for the purpose of these iterative studies.
Table 4.3-1. Flapwheel Pretreatment Study on Aluminum
Sample # Surface Prep Sol-Gel Primer Wedge Crack, 24h, 140°F, >98% RH
(inches) R21-2 #240 flapwheel; then
#220 alumina sanded; DI H2O rinse
Boegel-EP; HVLP spray drench
Cytec BR 6747-1
0.18
R21-3 #240 flapwheel; then #220 alumina sanded, N2 blown
Boegel-EP; HVLP spray drench
Cytec BR 6747-1
0.08
R21-4 #240 flapwheel; then #220 alumina sanded, N2 blown
Boegel-EP; brush applied
Cytec BR 6747-1
0.04
R21-5 #240 flapwheel; then #220 alumina sanded, N2 blown
Boegel-EP; HVLP spray drench
Cytec BR 6747-1 “dry”
0.05
R21-6 #240 flapwheel; then #220 alumina sanded, N2 blown
Boegel-EP; HVLP spray drench
Cytec BR 6747-1 roll apply
0.00

15
1
1.2
1.4
1.6
1.8
2
2.2
2.4
0 100 200 300 400 500 600 700 800
Hrs of Exposure to 140°F and >98% Relative Humidity
To
tal C
rack
Len
gth
(in
ches
)R 21-2 Substrate Rinsed in DIH2O Before HVLP Spray DrenchCoating With Sol-gel Solution
R 21-3 Not DI H2O RinsedBefore HVLP Spray DrenchCoating With Sol-Gel Solution
R 21-4 Not DI H2O Rinsed,Brush Applied Sol-Gel Coating
R 21-5 Not DI H2O RinsedBefore HVLP Spray DrenchCoating, Primer Spray AppliedWithout Forming Wet Film
R 21-6 Not DI H2O RinsedBefore HVLP Spray DrenchCoating,Primer Applied WithDisposable Foam Roller
Figure 4.3-2. Pretreatment variation study The flapwheel abrasive tools used in this study were flaps of alumina imbedded abrasive paper on a wheel, which could be mounted on an air driven tool, such as a die grinder. Initial (24 hr 140°F, 100% RH exposed) wedge crack results indicate several trends. First, it may be detrimental to rinse abrasion media off of the aluminum alloy substrates with water after mechanical deoxidation. Secondly, the brush-applied sol-gel appears to be initially as good as the spray-drench applied. In the last specimen (Sample #R21-6), the primer, as applied to the surface using a disposable foam roller, was very thin (<0.1 mil). Further primer application test development can be found in Section 4.7.
4.3.2 Abrasion Media Testing
A range of different sandpaper grits were tested for this study, including #400 and #600 SiC paper and #220 Al2O3 paper. The abrasion pretreatments used on most of the R45 samples consisted of two, 30 second long sanding periods using a fresh piece of sandpaper for each period. In contrast, each panel used in the preparation of the R 21 samples was #240 Al2O3 flapwheel abraded for 3 minutes, prior to an additional 3 minutes of sanding with #220 Al2O3 sandpaper. Wedge crack test results are shown in Figure 4.3-3.

16
0
0.5
1
1.5
2
2.5
0 200 400 600 800 1000
Hrs of Exposure to 140°F and >98% RH
To
tal C
rack
Len
gth
(in
ches
)
R 45 -1 #220 Al2O3 Sandpaper
R 45-2 #400 SiC Sandpaper
R 45-3 #600 SiC Sandpaper
R 45-4 #220 Al2O3 Sandpaper, DI H2ORinsed
R 45-5 #220 Al2O3 Sandpaper, DI H2ORinsed, 1% H3 PO4 Wiped
R 21-3 #240 Al2O3 Flapwheel; then#220 Al2O3 Sandpaper
R 21-2 #240 Al2O3 Flapwheel; then#220 Al2O3 Sandpaper, DI H2O Rinse
Figure 4.3-3. Wedge crack performance of Al 2024-T3 panels processed with various sandpaper pretreatments
These results indicate clearly that treating the freshly abraded surface of the aluminum with water or some type of aqueous solution significantly degrades the properties under hot/wet conditions. This was true with water or dilute acid post-treatments. The method of sanding did not yield as significant of an effect. Optimization of the sanding parameters is discussed in Section 4.3.4.
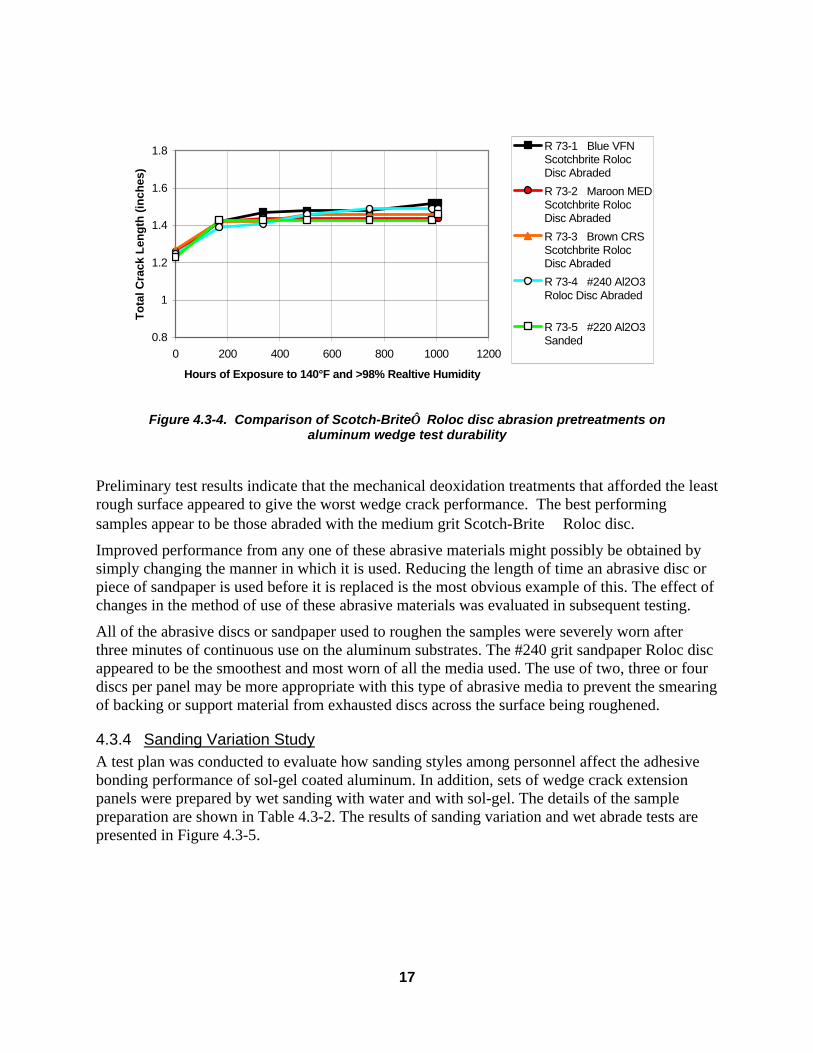
4.3.3 Preliminary Scotch-Brite Roloc Disc Abrasion Study Preliminary testing was carried out examining nylon pad abrasion as a deoxidation technique prior to sol-gel deposition. Exposure test results comparing wedge crack test samples mechanically deoxidized prior to sol-gel coating using five different abrasive materials are shown in Figure 4.3-4. These included Scotch-Brite Roloc surface conditioning discs, loaded with very fine, medium, and coarse alumina abrasive, as well as #240 sandpaper Roloc discs, used in conjunction with a 20,000 RPM die grinder. The last sample in this series was sanded with #220 alumina sandpaper using an orbital sander. Each 6-inch by 6-inch substrate was abraded for 3 minutes with one of the various grit Roloc discs or one piece of the #220 sandpaper.
17
0.8
1
1.2
1.4
1.6
1.8
0 200 400 600 800 1000 1200
Hours of Exposure to 140°F and >98% Realtive Humidity
To
tal C
rack
Len
gth
(in
ches
)R 73-1 Blue VFNScotchbrite RolocDisc Abraded
R 73-2 Maroon MEDScotchbrite RolocDisc Abraded
R 73-3 Brown CRSScotchbrite RolocDisc Abraded
R 73-4 #240 Al2O3Roloc Disc Abraded
R 73-5 #220 Al2O3Sanded
Figure 4.3-4. Comparison of Scotch-Brite Roloc disc abrasion pretreatments on aluminum wedge test durability
Preliminary test results indicate that the mechanical deoxidation treatments that afforded the least rough surface appeared to give the worst wedge crack performance. The best performing samples appear to be those abraded with the medium grit Scotch-Brite Roloc disc.
Improved performance from any one of these abrasive materials might possibly be obtained by simply changing the manner in which it is used. Reducing the length of time an abrasive disc or piece of sandpaper is used before it is replaced is the most obvious example of this. The effect of changes in the method of use of these abrasive materials was evaluated in subsequent testing.
All of the abrasive discs or sandpaper used to roughen the samples were severely worn after three minutes of continuous use on the aluminum substrates. The #240 grit sandpaper Roloc disc appeared to be the smoothest and most worn of all the media used. The use of two, three or four discs per panel may be more appropriate with this type of abrasive media to prevent the smearing of backing or support material from exhausted discs across the surface being roughened.
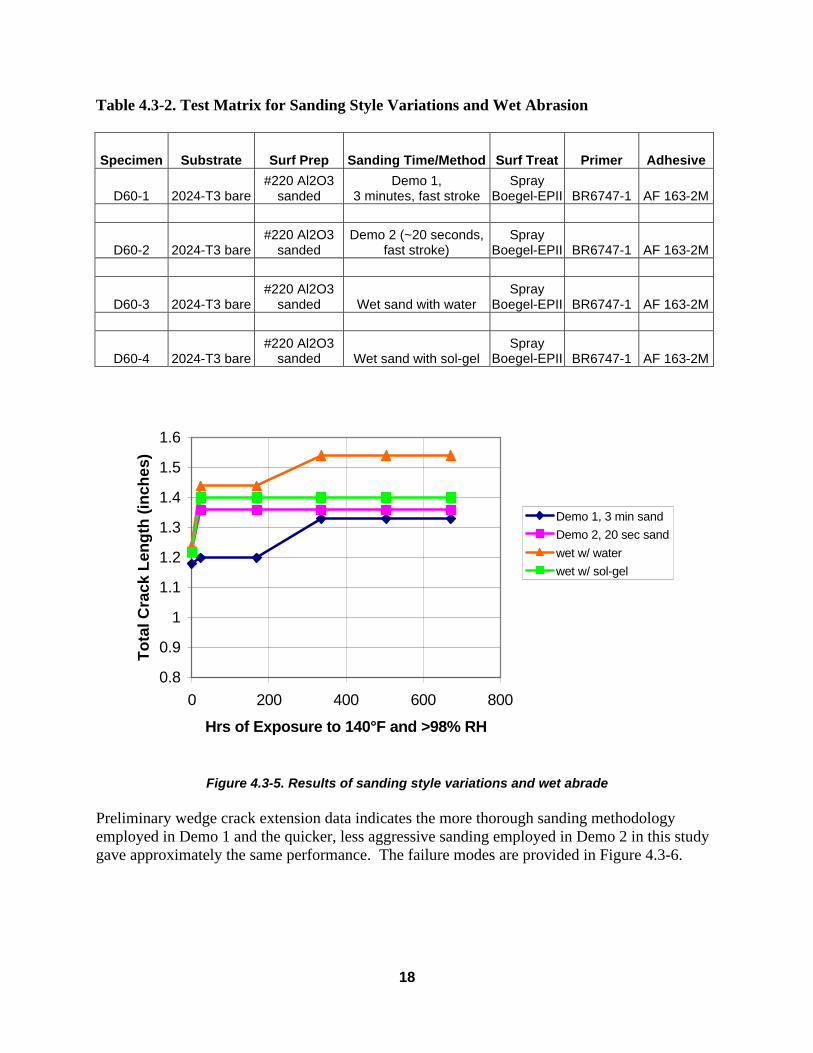
4.3.4 Sanding Variation Study A test plan was conducted to evaluate how sanding styles among personnel affect the adhesive bonding performance of sol-gel coated aluminum. In addition, sets of wedge crack extension panels were prepared by wet sanding with water and with sol-gel. The details of the sample preparation are shown in Table 4.3-2. The results of sanding variation and wet abrade tests are presented in Figure 4.3-5.
18
Table 4.3-2. Test Matrix for Sanding Style Variations and Wet Abrasion
Specimen Substrate Surf Prep Sanding Time/Method Surf Treat Primer Adhesive
D60-1 2024-T3 bare #220 Al2O3
sanded Demo 1,
3 minutes, fast stroke Spray
Boegel-EPII BR6747-1 AF 163-2M
D60-2 2024-T3 bare #220 Al2O3
sanded Demo 2 (~20 seconds,
fast stroke) Spray
Boegel-EPII BR6747-1 AF 163-2M
D60-3 2024-T3 bare #220 Al2O3
sanded Wet sand with water Spray
Boegel-EPII BR6747-1 AF 163-2M
D60-4 2024-T3 bare #220 Al2O3
sanded Wet sand with sol-gel Spray
Boegel-EPII BR6747-1 AF 163-2M
0.8
0.9
1
1.1
1.2
1.3
1.4
1.5
1.6
0 200 400 600 800
Hrs of Exposure to 140°F and >98% RH
To
tal C
rack
Len
gth
(in
ches
)
Demo 1, 3 min sandDemo 2, 20 sec sandwet w/ waterwet w/ sol-gel
Figure 4.3-5. Results of sanding style variations and wet abrade Preliminary wedge crack extension data indicates the more thorough sanding methodology employed in Demo 1 and the quicker, less aggressive sanding employed in Demo 2 in this study gave approximately the same performance. The failure modes are provided in Figure 4.3-6.

19
78
80
82
84
86
88
90
92
94
96
98
Demo 13 min sand
Demo 220 sec sand
wet w/solgel wet w/water
% C
oh
esiv
e F
ailu
re
Figure 4.3-6. Failure modes (at 672 hrs exposure) of sanding variation study
Sanding with water appeared to degrade the bondline, as was confirmed with earlier data on this technique. However, sanding with the sol-gel solution does not seem to be as deleterious to performance in this study.
4.3.5 Reproducibility of Individual Sanding Techniques
Additional tests were conducted to observe changes in bond performance due to differences in individual sanding techniques, and to evaluate the reproducibility of the bond performance per individual. A baseline sanding process was designated where each 6-inch x 6-inch area was sanded with one fresh piece of #220 alumina sandpaper for a two-minute period. Four different test technicians were used to evaluate the process robustness and reproducibility. Each individual sanded three sets of wedge crack extension panels on each day over a three-day period. Substrates were bare 2024-T3 aluminum alloy sanded with #220 Al2O3 using a random orbital sander. Specimens were sprayed with Boegel-EPII, air-dried, spray-primed with Cytec BR 6747-1, and bonded with AF 163-2M. The wedge test results are presented in Table 4.4-3.
The effect of slight variations in sanding techniques among personnel appears to be minimal. Only the DM series of data exhibits any change in performance with a minor increase in total crack extension and a lower cohesive failure.

20
Table 4.3-3. Wedge Test Results of Reproducibility Evaluation Among Individuals
Sander Hours of Exposure to 140°F and >98%RH / Total Crack Length (inches)
Crack Extension, 7 days (inches) Failure Mode
0 1 24 96 120 168 % coh RA-1-1 1.20 1.23 1.40 1.40 0.20 97 RA-1-2 1.23 1.26 1.37 1.40 0.17 97 RA-1-3 1.28 1.31 1.47 1.47 0.19 98 RA-2-1 1.23 1.28 1.39 1.39 0.16 98 RA-2-2 1.20 1.26 1.39 1.39 0.19 98 RA-2-3 1.29 1.34 1.47 1.47 0.18 98 RA-3-1 1.23 1.29 1.42 1.42 0.19 98 RA-3-2 1.24 1.29 1.41 1.45 0.21 98 RA-3-3 1.21 1.26 1.41 1.41 0.20 97
JF-1-1 1.27 1.31 1.37 1.45 1.45 0.18 98 JF-1-2 1.23 1.25 1.36 1.37 1.40 0.17 97 JF-1-3 1.27 1.31 1.40 1.47 1.47 0.20 98 JF-2-1 1.21 1.23 1.33 1.38 1.40 0.19 98 JF-2-2 1.23 1.27 1.35 1.37 1.43 0.18 98 JF-2-3 1.24 1.27 1.37 1.41 1.42 0.18 98 JF-3-1 1.22 1.26 1.33 1.36 1.36 0.14 97 JF-3-2 1.25 1.27 1.33 1.37 1.37 0.12 97 JF-3-3 1.23 1.26 1.37 1.39 1.40 0.17 96
MG-1-1 1.23 1.25 1.43 1.44 0.21 98 MG-1-2 1.17 1.21 1.34 1.34 0.17 98 MG-1-3 1.23 1.27 1.38 1.38 0.15 99 MG-2-1 1.22 1.26 1.39 1.44 0.22 99 MG-2-2 1.22 1.26 1.40 1.40 0.18 97 MG-2-3 1.23 1.28 1.41 1.44 0.21 96 MG-3-1 1.24 1.28 1.43 1.43 0.19 98 MG-3-2 1.30 1.34 1.41 1.45 0.15 97 MG-3-3 1.26 1.29 1.34 1.42 0.16 98
DM-1-1 1.25 1.28 1.36 1.46 1.51 0.26 96 DM-1-2 1.24 1.27 1.39 1.45 1.45 0.21 95 DM-1-3 1.22 1.25 1.36 1.42 1.43 0.21 96 DM-2-1 1.19 1.23 1.34 1.42 1.46 0.27 95 DM-2-2 1.26 1.30 1.36 1.43 1.43 0.17 98 DM-2-3 1.23 1.26 1.29 1.43 1.43 0.20 96 DM-3-1 1.21 1.26 1.37 1.40 1.40 0.19 96 DM-3-2 1.26 1.28 1.36 1.41 1.41 0.15 96
DM-3-3 1.23 1.27 1.34 1.41 1.42 0.19 96
21
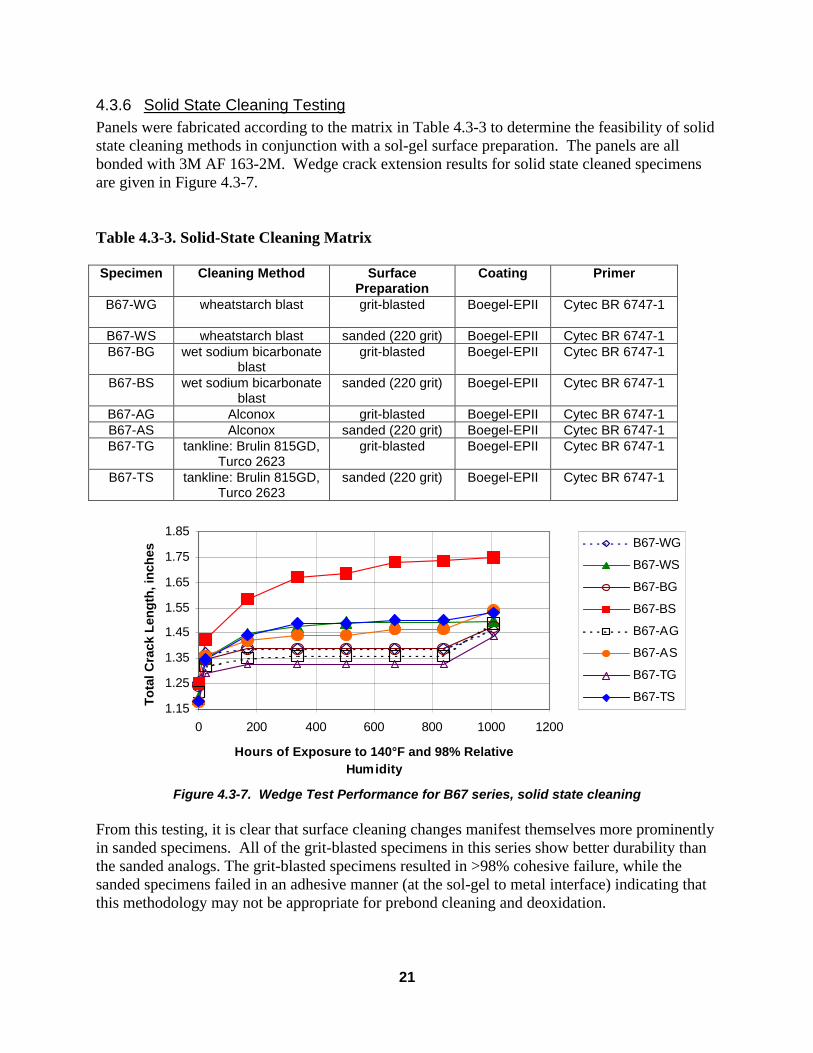
4.3.6 Solid State Cleaning Testing Panels were fabricated according to the matrix in Table 4.3-3 to determine the feasibility of solid state cleaning methods in conjunction with a sol-gel surface preparation. The panels are all bonded with 3M AF 163-2M. Wedge crack extension results for solid state cleaned specimens are given in Figure 4.3-7. Table 4.3-3. Solid-State Cleaning Matrix Specimen Cleaning Method Surface
Preparation Coating Primer
B67-WG wheatstarch blast grit-blasted
Boegel-EPII Cytec BR 6747-1
B67-WS wheatstarch blast sanded (220 grit) Boegel-EPII Cytec BR 6747-1 B67-BG wet sodium bicarbonate
blast grit-blasted Boegel-EPII Cytec BR 6747-1
B67-BS wet sodium bicarbonate blast
sanded (220 grit) Boegel-EPII Cytec BR 6747-1
B67-AG Alconox grit-blasted Boegel-EPII Cytec BR 6747-1 B67-AS Alconox sanded (220 grit) Boegel-EPII Cytec BR 6747-1 B67-TG tankline: Brulin 815GD,
Turco 2623 grit-blasted Boegel-EPII Cytec BR 6747-1
B67-TS tankline: Brulin 815GD, Turco 2623
sanded (220 grit) Boegel-EPII Cytec BR 6747-1
1.15
1.25
1.35
1.45
1.55
1.65
1.75
1.85
0 200 400 600 800 1000 1200
Hours of Exposure to 140°F and 98% Relative Humidity
To
tal C
rack
Len
gth
, in
ches
B67-WG
B67-WS
B67-BG
B67-BS
B67-AG
B67-AS
B67-TG
B67-TS
Figure 4.3-7. Wedge Test Performance for B67 series, solid state cleaning
From this testing, it is clear that surface cleaning changes manifest themselves more prominently in sanded specimens. All of the grit-blasted specimens in this series show better durability than the sanded analogs. The grit-blasted specimens resulted in >98% cohesive failure, while the sanded specimens failed in an adhesive manner (at the sol-gel to metal interface) indicating that this methodology may not be appropriate for prebond cleaning and deoxidation.
22
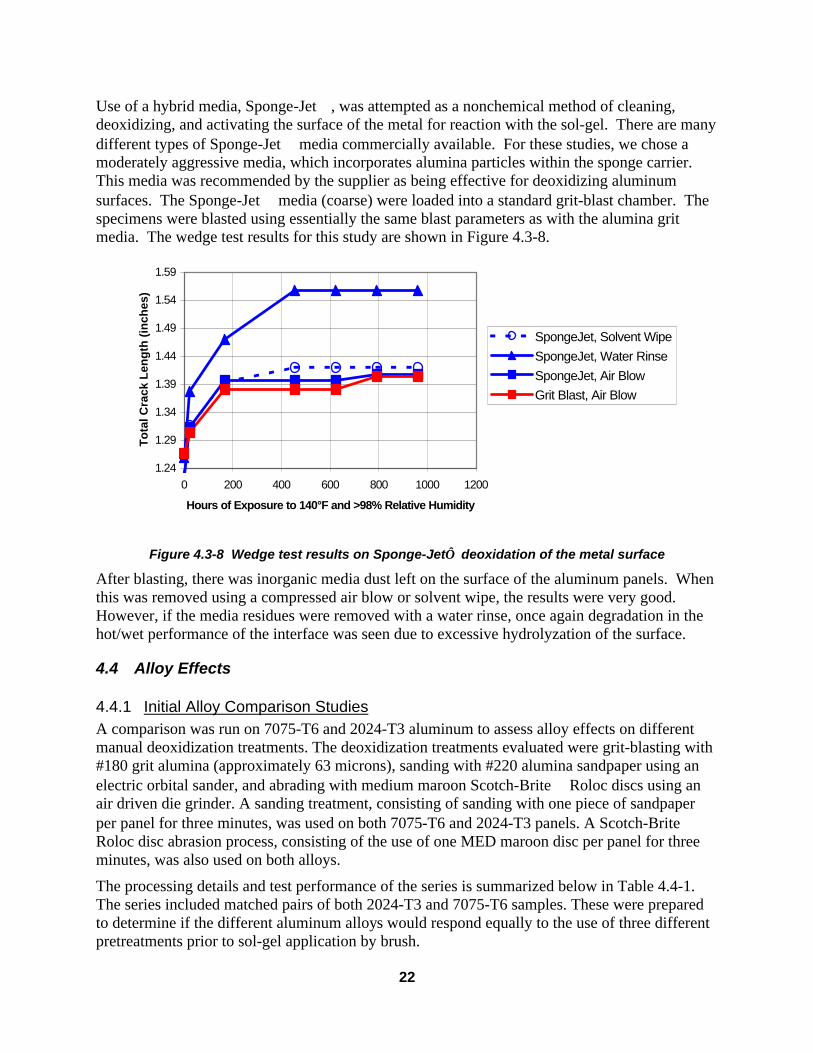
Use of a hybrid media, Sponge-Jet, was attempted as a nonchemical method of cleaning, deoxidizing, and activating the surface of the metal for reaction with the sol-gel. There are many different types of Sponge-Jet media commercially available. For these studies, we chose a moderately aggressive media, which incorporates alumina particles within the sponge carrier. This media was recommended by the supplier as being effective for deoxidizing aluminum surfaces. The Sponge-Jet media (coarse) were loaded into a standard grit-blast chamber. The specimens were blasted using essentially the same blast parameters as with the alumina grit media. The wedge test results for this study are shown in Figure 4.3-8.
1.24
1.29
1.34
1.39
1.44
1.49
1.54
1.59
0 200 400 600 800 1000 1200
Hours of Exposure to 140°F and >98% Relative Humidity
To
tal C
rack
Len
gth
(in
ches
)
SpongeJet, Solvent WipeSpongeJet, Water RinseSpongeJet, Air BlowGrit Blast, Air Blow
Figure 4.3-8 Wedge test results on Sponge-Jet deoxidation of the metal surface
After blasting, there was inorganic media dust left on the surface of the aluminum panels. When this was removed using a compressed air blow or solvent wipe, the results were very good. However, if the media residues were removed with a water rinse, once again degradation in the hot/wet performance of the interface was seen due to excessive hydrolyzation of the surface.
4.4 Alloy Effects
4.4.1 Initial Alloy Comparison Studies A comparison was run on 7075-T6 and 2024-T3 aluminum to assess alloy effects on different manual deoxidization treatments. The deoxidization treatments evaluated were grit-blasting with #180 grit alumina (approximately 63 microns), sanding with #220 alumina sandpaper using an electric orbital sander, and abrading with medium maroon Scotch-Brite Roloc discs using an air driven die grinder. A sanding treatment, consisting of sanding with one piece of sandpaper per panel for three minutes, was used on both 7075-T6 and 2024-T3 panels. A Scotch-Brite Roloc disc abrasion process, consisting of the use of one MED maroon disc per panel for three minutes, was also used on both alloys.
The processing details and test performance of the series is summarized below in Table 4.4-1. The series included matched pairs of both 2024-T3 and 7075-T6 samples. These were prepared to determine if the different aluminum alloys would respond equally to the use of three different pretreatments prior to sol-gel application by brush.

23
The reflectance of the sanded surfaces of the 7075-T6 aluminum panels appeared to be more specular than that of the sanded 2024-T3 panels. No other significant differences between the samples from either aluminum alloy were noted at the time of abrasion.
Sanding and Scotch-Brite Roloc disc abrasion of the panels were performed within 30 minutes of the brush application of the sol-gel solution. The panels receiving the grit-blasting treatment were blasted one day before being brushed with the sol-gel solution. Solution application time for all samples was four minutes per set, and all panels were placed vertically in racks to drain and dry naturally in a fume hood. All of the aluminum samples prepared were sprayed with BR 6747-1 primer and bonded with AF 163 –2M adhesive.
Table 4.4-1. Processing Details for the R 131 Aluminum Sample Series
Sample Number
Aluminum Alloy
Surface Preparation Sol-Gel Formulation
Application Time
Drying Method
R 131-1A 7075 T6 #180 Alumina Grit-blasted
3% Boegel EP II, 0.0018g
FC 170 C / liter
4 Minutes
Air
R 131-1B 2024 T3 #180 Alumina Grit-blasted
“ 4 Minutes Air
R 131-2A 7075 T6 #220 Alumina Sandpaper Sanded, 3 Min. / Panel / Piece
“ 4 Minutes Air
R 131-2B 2024 T3 #220 Alumina Sandpaper Sanded, 3 Min. / Panel / Piece
“ 4 Minutes Air
R 131-3A 7075 T6 MED Maroon Scotch-Brite Roloc Disc Abrade, 3 Min/ Panel/Disc
“ 4 Minutes Air
R 131-3B 2024 T3 MED Maroon Scotch-Brite Roloc Disc Abrade, 3 Min/ Panel/Disc
“ 4 Minutes Air
The wedge test results for these samples are plotted in Figure 4.4-1. In general, the results obtained were in agreement with data from previous 7075-T6 and 2024-T3 wedge crack extension testing conducted at Boeing three years earlier. The performance of 7075-T6 samples appears to be the same or possibly better than that of the 2024-T3 samples when the same manual deoxidization techniques are employed.

24
0.8
0.9
11.1
1.2
1.3
1.4
1.5
1.6
1.7
1.8
0 100 200 300 400 500 600
Hrs of Exposure to 140°F and >98 RH
To
tal C
rack
Len
gth
(in
ches
)R 131-1A 7075-T6, #180 Grit Blasted
R 131-1B 2024-T3 #180 Grit Blasted
R 131-2A 7075-T6, Sanded With 1 Piece#220 Alumina Sandpaper for 3 Min / Panel
R 131-2B 2024-T3, Sanded With 1 Piece#220 Alumina Sandpaper for 3 Min / Panel
R 131-3A 7075-T6, Abraded With 1 MEDMaroon Scotch-Brite Roloc Disc for 3 Min /Panel
R 131-3B 2024-T3, Abraded With 1 MEDMaroon Scotch-Brite Roloc Disc for 3 Min /Panel
Figure 4.4-1. Wedge test results for Boegel-EPII coated 7075-T6 and 2024-T3 aluminum samples
The performance for of the samples in this series is worse than expected when compared to that of previous 2024-T3 samples prepared using similar methods over the last few months. Crack growth appears to be from 0.05 inch to 0.10 inch above normal for all samples in this test series regardless of surface roughening treatment they received. As discussed above, these variations in performance were possibly due to aging or contamination of precursor chemicals or primer used in this study. The affects of aging chemicals are discussed in more detail in Section 4.5. A summary of the crack growth values and failure modes for the R 131 sample series are listed below in Table 4.4-2. Table 4.4-2. R 131 Sample Series Performance Summary
Sample Number
Aluminum Alloy
Surface Preparation Initial Crack Length, Inches
5 Week Crack Growth, Inches
% Cohesive
Failure R 131-1A 7075-T6 #180 Alumina Grit-
blasted 1.19 0.22 92%
R 131-1B 2024-T3 #180 Alumina Grit-blasted
1.22 0.19 91%
R 131-2A 7075-T6 #220 Alumina Sandpaper Sanded
1.18 0.32 60%
R 131-2B 2024-T3 #220 Alumina Sandpaper Sanded
1.21 0.31 85%
R 131-3A 7075-T6 MED Maroon Scotch-Brite Roloc Disc Abraded
1.21 0.30 74%
R 131-3B 2024-T3 MED Maroon Scotch-Brite Roloc Disc Abraded
1.18 0.24 90%

25
Two specimens from each sample series were removed after 672 hours of testing and split open. The 2024-T3 samples tended to have smaller “nicks” along the edges of the crack tip zone and cohesive failure modes ranging from 85% to 95%. The 7075-T6 samples had larger “nicks” in the crack tip zone that extended as much as ¼ inch into the sample from the edges. Cohesive failure modes ranged from 60% to 95%, with the sanded samples showing the most adhesive failure at the sol-gel to metal interface.
4.4.2 Clad vs. Bare Comparison
A test series was conducted to evaluate performance differences between clad and bare 2024-T3 samples (Table 4.4-3). No attempt was made to remove the pure aluminum layer from the Alclad substrates before they were roughened using three different techniques. Grit-blasting with 50 micron alumina was performed at an angle of 45° and at a distance of approximately 6 inches. Medium maroon Scotch-Brite Roloc disc abrasion and # 220 alumina sandpaper sanding were performed for 3 minutes per 6 inch x 6 inch panel, with either one disc or one piece of sandpaper per panel. Table 4.4-3. Substrate Preparation, Coating and Drying Details for Clad Vs. Bare Test
Sample #
Substrate Type
Abrasion Method
Boegel-EPII Application
Method
Application Time
Drying Method
Air Drying Time Before
Priming S 55-1 Alclad
2024-T3 50 Micron
Alumina Grit-blast
Brush 2 Minute Air 111 Minutes
S 55-2 Alclad 2024-T3
MED Maroon Scotch-Brite
Roloc disc
Brush 2 Minute Air 61 Minutes
S 55-3 Alclad 2024-T3
#220 Alumina Sandpaper
Sanded
Brush 2 Minute Air 116 Minutes
S 55-4 Bare 2024-T3
#180 Alumina Grit-blast
Brush 2 Minute Air 104 Minutes
S 55-5 Bare 2024-T3
#180 Alumina Grit-blast
Brush 2 Minute Air 99 Minutes
S 55-6 Bare 2024-T3
#180 Alumina Grit-blast
Brush 2 Minute Air 93 Minutes
S 55-7 Bare 2024-T3
#220 Alumina Sandpaper
Sanded
Brush 2 Minute Air 127 minutes
S 55-8 Bare 2024-T3
#220 Alumina Sandpaper
Sanded
Brush 2 Minute 30 Minute
Bake @ 250°F
115 Minutes Air Drying, In Addition to 30 Minute Bake
S 55-9 Bare 2024-T3
50 Micron Alumina Grit-
blast
Brush 2 Minute Air 86 Minutes
The remaining samples compared the effects of air drying versus a 30 minute bake at 250°F on bare 2024-T3 wedge crack extension performance, or acquired more baseline performance data

26
from specimens bonded with EA 9394 paste adhesive. All samples were cleaned in Brulin 815 GD and Turco 2623, but not deoxidized, prior to being abraded. Boegel-EPII solution was used to coat the samples. Table 4.4-4 below lists further details of the sample preparation.
Table 4.4-4. Priming and Adhesive Details for AlClad Data Set
Sample Number
Primer Primer Batch Number
Primer Application Method
Adhesive Adhesive Cure Method
S 55-1 BR 6747-1 #5767000 (Mfg Date. 2-15-99 )
HVLP Spray AF 163-2M Autoclave
S 55-2 “ “ “ “ “ “ “ S 55-3 “ “ “ “ “ “ “ S 55-4 “ “ “ “ “ “ “ S 55-7 “ “ “ “ AF 163-2M Autoclave S 55-8 “ “ “ “ “ “ “ S 55-9 “ “ “ “ “ “ “
The wedge crack test performance of the samples bonded with AF 163-2 is shown in Figure 4.4-2. The initial crack lengths of the bare 2024-T3 samples were longer than those of the clad 2024-T3 samples, possibly the result of the bare substrates being slightly stiffer than those coated with layers of soft, pure aluminum.
0.8
1
1.2
1.4
1.6
1.8
0 200 400 600 800 1000
Hrs of Exposure to 140°F and >98% RH
To
tal C
rack
Len
gth
(in
ches
)
S 55-1 Clad 2024-T3, 50Micron Grit Blasted
S 55-2 Clad 2024-T3, MEDMaroon Scotch-Brite RolocDisc Abraded
S 55-3 Clad 2024-T3, #220Alumina Sandpaper Sanded
S 55-4 Bare 2024-T3, #180Alumina Grit Blasted
S 55-7 Bare 2024-T3, #220Alumina Sandpaper Sanded
S 55-9 Bare 2024-T3, 50Micron Alumina Grit Blasted
Figure 4.4-2. Wedge test results for clad and bare 2024-T3 aluminum wedge crack samples
Within the group of clad samples, all of the methods of deoxidation gave similar wedge results with cohesive failure modes all over 90%. Previous wedge crack extension testing of sanded aluminum samples has shown that 2024-T3 (HB 120) samples tend to have higher cohesive
96%
97%
98% 94%
98%
98%
27
failure modes than 7075-T6 (HB 150) when they are given identical processing. The sanding of the comparatively softer, pure aluminum layer on the clad substrates might produce a surface with greater area or with higher aspect ratio features which may lead to the formation of more durable adhesive bonds. SEM comparisons of #220 alumina sandpaper sanded clad 2024-T3, bare 2024-T3 and bare 7075-T6 aluminum panels may show how their surfaces differ and give clues as to what type of surface features promote effective adhesive bonds. Profilometer measurements of these same surfaces may give somewhat misleading results if the measuring tip cuts through soft, thin features rather than simply moving over them.
Specimen S55-8, which had the 250°F cure of the sol-gel coating, was not plotted on the same chart, due to the differences in the processing. This specimen had a greater crack growth (approximately 0.4 inches) than the ones with no sol-gel thermal cure, and also had a lower cohesive failure mode (86%). It is believed that the thermal cure causes more of the epoxy rings to open and cross-link on the surface of the sol-gel, leaving fewer active groups available for crosslinking with the adhesive primer.
4.4.3 Peel Testing Peel specimens were prepared from 2024-T3 bare and Alclad. Each group of five samples was prepared using a different surface preparation technique to determine how various surface roughening techniques might affect sample performance. Each of the three groups of samples included both roller peel and climbing drum peel test specimens. All peel test samples were spray-coated with Boegel-EPII for an application time of two minutes, primed with BR 6747-1 and autoclave bonded with AF 163-2M film adhesive. Tables 4.4-5 below lists more details of their preparation and planned conditioning treatments prior to testing. The term “water spray” refers to the spray application of water to the crack tip region of specific roller peel samples over the course of the test. This is done to determine if the presence of water at the bond interface and crack tip reduces the test values. Table 4.4-6 and 4.4-7 show results of the peel testing for the aluminum 2024-T3 bare and clad specimens.
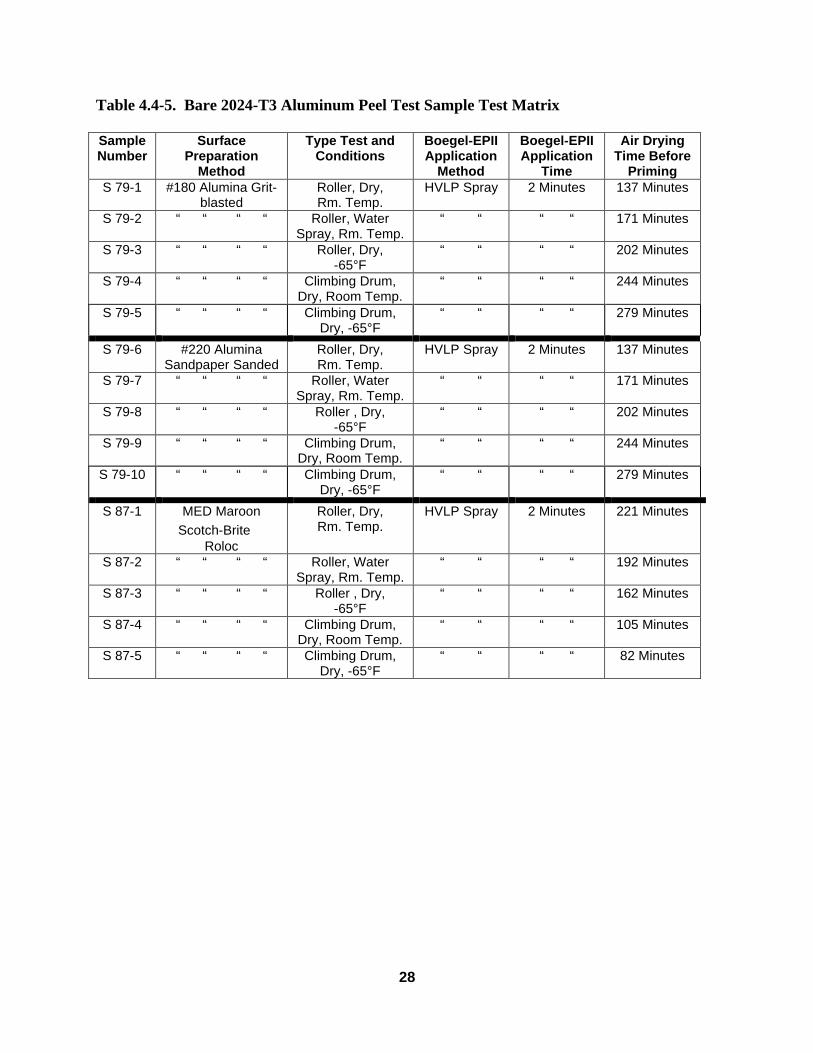
28
Table 4.4-5. Bare 2024-T3 Aluminum Peel Test Sample Test Matrix Sample Number
Surface Preparation
Method
Type Test and Conditions
Boegel-EPII Application
Method
Boegel-EPII Application
Time
Air Drying Time Before
Priming S 79-1 #180 Alumina Grit-
blasted Roller, Dry, Rm. Temp.
HVLP Spray 2 Minutes 137 Minutes
S 79-2 “ “ “ “ Roller, Water Spray, Rm. Temp.
“ “ “ “ 171 Minutes
S 79-3 “ “ “ “ Roller, Dry, -65°F
“ “ “ “ 202 Minutes
S 79-4 “ “ “ “ Climbing Drum, Dry, Room Temp.
“ “ “ “ 244 Minutes
S 79-5 “ “ “ “ Climbing Drum, Dry, -65°F
“ “ “ “ 279 Minutes
S 79-6 #220 Alumina Sandpaper Sanded
Roller, Dry, Rm. Temp.
HVLP Spray 2 Minutes 137 Minutes
S 79-7 “ “ “ “ Roller, Water Spray, Rm. Temp.
“ “ “ “ 171 Minutes
S 79-8 “ “ “ “ Roller , Dry, -65°F
“ “ “ “ 202 Minutes
S 79-9 “ “ “ “ Climbing Drum, Dry, Room Temp.
“ “ “ “ 244 Minutes
S 79-10 “ “ “ “ Climbing Drum, Dry, -65°F
“ “ “ “ 279 Minutes
S 87-1 MED Maroon Scotch-Brite
Roloc
Roller, Dry, Rm. Temp.
HVLP Spray 2 Minutes 221 Minutes
S 87-2 “ “ “ “ Roller, Water Spray, Rm. Temp.
“ “ “ “ 192 Minutes
S 87-3 “ “ “ “ Roller , Dry, -65°F
“ “ “ “ 162 Minutes
S 87-4 “ “ “ “ Climbing Drum, Dry, Room Temp.
“ “ “ “ 105 Minutes
S 87-5 “ “ “ “ Climbing Drum, Dry, -65°F
“ “ “ “ 82 Minutes

29
Table 4.4-6. Bare 2024-T3 Aluminum Peel Test Results Sample Surface
Prep. Test Type and
Conditions Air-Dry
Before Prime Peel
Strength Failure Mode
S 79-1 #180 Alumina Grit-blasted
RT Dry Roller 137 Minutes 84.10 lbf Mixed
S 79-2 " RT Water Spray Roller 171 Minutes 102.03 lbf Mixed S 79-3 " -65°F Dry Roller 202 Minutes 53.74 lbf 0-5% Cohesive S 79-4 " RT Dry Climb. Drum 244 Minutes 90.38 in-lb/in 100% Cohesive S 79-5 " -65°F Dry Climb. Drum 279 Minutes 56.64 in-lb/in Mixed S 79-6 #220 Alumina
Sanded RT Dry Roller 137 Minutes 86.56 lbf Mixed
S 79-7 " RT Water Spray Roller 171 Minutes 100.07 lbf Mixed S 79-8 " -65°F Dry Roller 202 Minutes 38.86 lbf 0-10% Cohesive S 79-9 " RT Dry Climb. Drum 244 Minutes 81.91 in-lb/in 100% Cohesive S 79-10 " -65°F Dry Climb. Drum 279 Minutes 55.19 in-lb/in Mixed S 87-1 MED Maroon
Scotch-Brite
RT Dry Roller 221 Minutes 85.85 lbf 95-100% Cohesive
S 87-2 " RT Water Spray Roller 192 Minutes 87.08 lbf Mixed S 87-3 " -65°F Dry Roller 162 Minutes 48.75 lbf 0-20% Cohesive S 87-4 " RT Dry Climb. Drum 105 Minutes
80.15 in-lb/in 100% Cohesive
S 87-5 " -65°F Dry Climb. Drum 82 Minutes 55.84 in-lb/in Mixed Table 4.4-7. Alclad 2024-T3 Peel Test Results
Sample Surface Prep.
Test Type and Conditions
Air-Dry Before Prime
Peel Strength Failure Mode
S 91-1 #180 Alumina Grit-blasted
RT Dry Roller 180 Minutes 90.37 lbf 100% cohesive
S 91-2 " RT Water Spray Roller 213 Minutes 82.37 lbf Mixed S 91-3 " -65°F Dry Roller 262 Minutes 77.22 lbf Mixed S 91-4 " RT Dry Climb. Drum 296 Minutes 70.5 lbf 100% cohesive S 91-5 " -65°F Dry Climb. Drum 320 Minutes 52.3 lbf 70% cohesive S 91-6 #220 Alumina
Sanded RT Dry Roller 180 Minutes 76.41 lbf 60% Cohesive
S 91-7 " RT Water Spray Roller 213 Minutes 65.96 lbf 40% Cohesive S 91-8 " -65°F Dry Roller 262 Minutes 40.51 lbf 15% Cohesive S 91-9 " RT Dry Climb. Drum 296 Minutes 81.5 lbf 100% cohesive S 91-10 " -65°F Dry Climb. Drum 320 Minutes 38.8 lbf 25% cohesive
The areas of the samples tested at room temperature that were labeled as adhesive failures were actually covered with small patches of adhesive over an intact primer layer. The failure was cohesive within the primer coating. In contrast, the samples tested at –65°F appeared to have no adhesive residues on the peeled 0.020-inch thick peeled aluminum portion of the sample. Primer still appeared to be present on this portion of the sample. The failure is suspected to have occurred within the primer layer, rather than at the interface with the adhesive. The failures
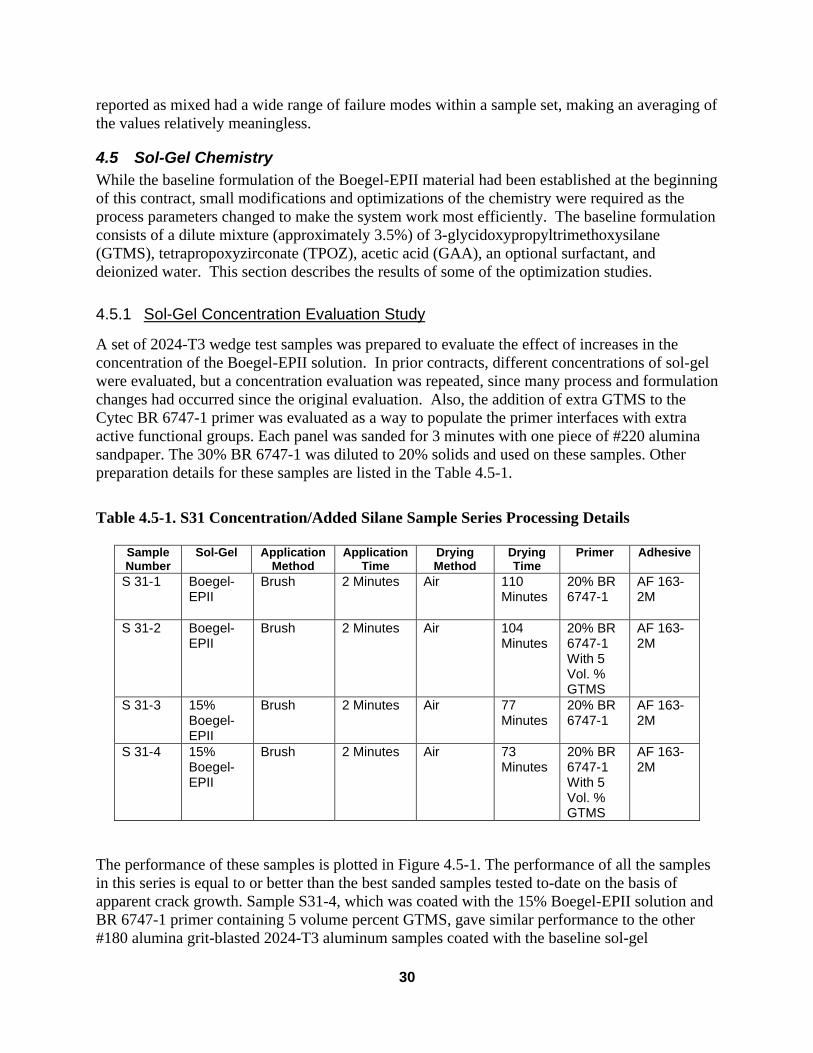
30
reported as mixed had a wide range of failure modes within a sample set, making an averaging of the values relatively meaningless.
4.5 Sol-Gel Chemistry While the baseline formulation of the Boegel-EPII material had been established at the beginning of this contract, small modifications and optimizations of the chemistry were required as the process parameters changed to make the system work most efficiently. The baseline formulation consists of a dilute mixture (approximately 3.5%) of 3-glycidoxypropyltrimethoxysilane (GTMS), tetrapropoxyzirconate (TPOZ), acetic acid (GAA), an optional surfactant, and deionized water. This section describes the results of some of the optimization studies.
4.5.1 Sol-Gel Concentration Evaluation Study
A set of 2024-T3 wedge test samples was prepared to evaluate the effect of increases in the concentration of the Boegel-EPII solution. In prior contracts, different concentrations of sol-gel were evaluated, but a concentration evaluation was repeated, since many process and formulation changes had occurred since the original evaluation. Also, the addition of extra GTMS to the Cytec BR 6747-1 primer was evaluated as a way to populate the primer interfaces with extra active functional groups. Each panel was sanded for 3 minutes with one piece of #220 alumina sandpaper. The 30% BR 6747-1 was diluted to 20% solids and used on these samples. Other preparation details for these samples are listed in the Table 4.5-1.
Table 4.5-1. S31 Concentration/Added Silane Sample Series Processing Details
Sample Number
Sol-Gel Application Method
Application Time
Drying Method
Drying Time
Primer Adhesive
S 31-1 Boegel-EPII
Brush
2 Minutes
Air
110 Minutes
20% BR 6747-1
AF 163-2M
S 31-2 Boegel-EPII
Brush 2 Minutes Air 104 Minutes
20% BR 6747-1 With 5 Vol. % GTMS
AF 163-2M
S 31-3 15% Boegel- EPII
Brush 2 Minutes Air 77 Minutes
20% BR 6747-1
AF 163-2M
S 31-4 15% Boegel- EPII
Brush 2 Minutes Air 73 Minutes
20% BR 6747-1 With 5 Vol. % GTMS
AF 163-2M
The performance of these samples is plotted in Figure 4.5-1. The performance of all the samples in this series is equal to or better than the best sanded samples tested to-date on the basis of apparent crack growth. Sample S31-4, which was coated with the 15% Boegel-EPII solution and BR 6747-1 primer containing 5 volume percent GTMS, gave similar performance to the other #180 alumina grit-blasted 2024-T3 aluminum samples coated with the baseline sol-gel

31
formulation and primer. As a result of these studies, no major change to the sol-gel formulation was made.
1.1
1.15
1.2
1.25
1.3
1.35
1.4
1.45
1.5
0 100 200 300 400 500 600 700 800 900 1000
Hours of Exposure to 140°F and >98% Relative Humidity
To
tal C
rack
Len
gth
(in
ches
)
S 31-1 3% Boegel EP II, No Surfactant, StockBR 6747-1
S 31-2 3% Boegel EP II, No Surfactant, BR6747-1 + 5 Vol.% GTMS
S 31-3 15% Boegel EP II, No Surfactant, StockBR 6747-1
S 31-4 15% Boegel EP II, No Surfactant, BR6747-1 + 5 Vol.% GTMS
Figure 4.5-1. Wedge crack test results for bare 2024-T3 aluminum samples sanded with #220
alumina sandpaper before coating with two different sol-gel formulations and primers
A summary of the S31 series performance data is listed below in Table 4.3-2. The performance of the S31-1 control sample appears to be better than other recent sanded 2024-T3 samples given the same processing. Differences in the preparation of the S31 sample series from previous ones included the use of a new batch of 30% BR 6747-1 primer, diluted to 20% solids before application, and the use of a water-jet cutter to cut individual specimens from the bonded panels. All previous aluminum wedge crack specimens had been cut with the use of a gang saw.
Table 4.5-2. Performance Summary for #220 Alumina Sandpaper Sanded Bare 2024-T3 Samples in the S31 Series
Sample Sol-gel
Coating Primer Initial
Crack Length, Inches
2 Week Crack
Growth, inches
2 Week Failure Modes
5 Week Crack
Growth, inches
5 Week Failure Modes
S 31-1 3% Boegel-EPII
20% BR 6747-1
1.19 0.19 90% Cohesive
0.21 87% Cohesive
S 31-2 3% Boegel-EPII
20% BR 6747-1 and 5 Vol.% GTMS
1.24
0.20 86% Cohesive
0.22 81% Cohesive
S 31-3 15% Boegel-EPII
20% BR 6747-1
1.26 0.17 93% Cohesive
0.21 89% Cohesive
S 31-4 15% Boegel-
EPII 20% BR 6747-1 and 5 Vol.% GTMS
1.24 0.14 96% Cohesive
0.17 93% Cohesive

32
4.5.2 FC 170 C Surfactant Study
To obtain a more uniform coating over the surface of the metal, the use of a surfactant was tested in the sol-gel formulation. In previous contracts, a series of surfactants were screened as to their utility in this application. The ideal surfactant would provide surface leveling and coating uniformity without affecting adhesion or durability properties. To test this, a set of #220 alumina sandpaper sanded wedge crack samples were prepared to conduct a reevaluation of the use of FC 170 C surfactant in the Boegel-EPII and the relative performance of sanded 2024-T3 versus 7075-T6 samples. Details of their processing appear below in Table 4.5-3. The wedge crack test results from these samples are plotted in Figure 4.5-2.
Table 4.5-3. Surfactant Study Sample Preparation Details
Sample Number
Aluminum Alloy
Surface Preparation
Sol-Gel Formulation
Application Method
Application Time
S 7-4 Bare 2024-T3 #220 Alumina Sandpaper Sanded, 3 Min. / Panel / Piece
3% Boegel EP II, No Surfactant
Brush 2 minutes
S 7-5 Bare 7075-T6 “ “ Brush 2 Minutes S 7-6 Bare 2024-T3 “ 3% Boegel
EP II, 0.0018g FC 170C / Liter
Brush 2 Minutes
Sample Number
Drying Time Before Priming
Primer and Batch Number
Application Method
Adhesive Cure Method
S 7-4 89 Minutes Air Drying
BR 6747-1, #5767000, Manf. 2-15-99
HVLP Spray AF 163-2M Autoclave
S 7-5 96 Minutes Air Drying
“ “ “ “
S 7-6 93 Minutes Air Drying
“ “ “ “
There was no significant difference in crack growth between the sanded 2024-T3 samples coated with Boegel EP II solution with or without FC 170 C surfactant. Additionally, there was little difference in performance between the sanded 2024-T3 and 7075-T6 aluminum wedge test samples. However, for unidentified reasons, the crack growth was longer than was expected for this type of sample configuration. A performance summary of these samples appears in Table 4.5-4.
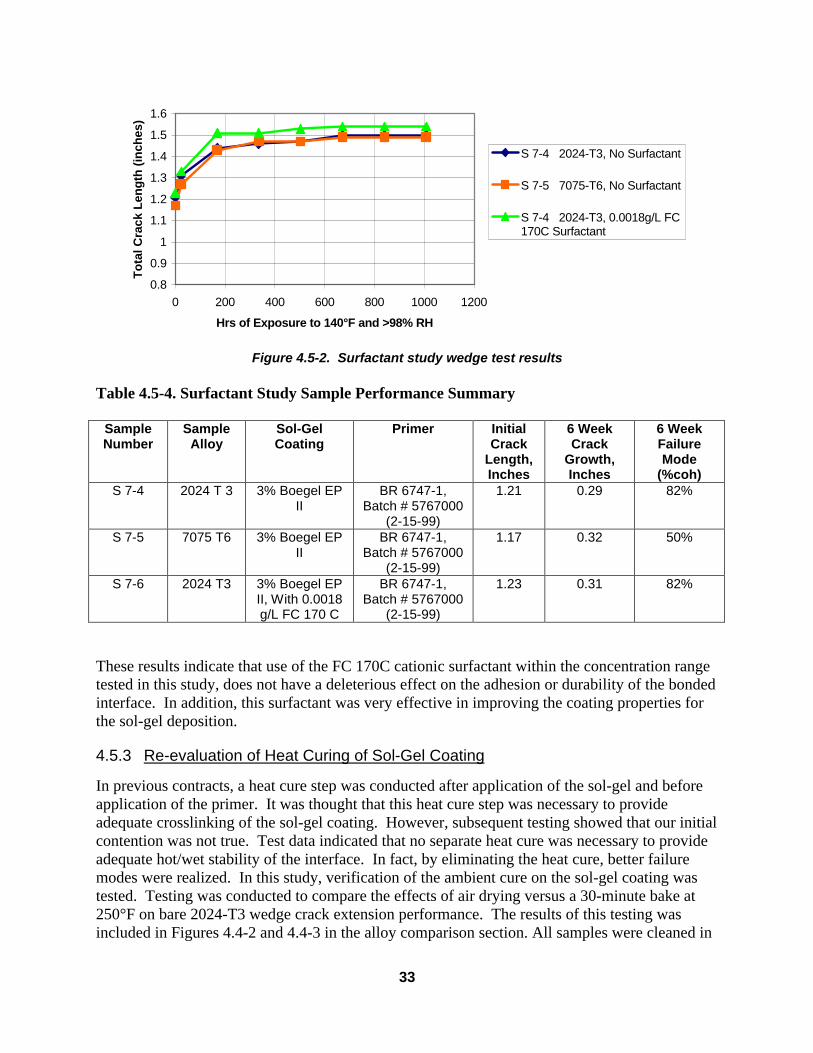
33
0.8
0.9
1
1.1
1.2
1.3
1.4
1.5
1.6
0 200 400 600 800 1000 1200
Hrs of Exposure to 140°F and >98% RH
To
tal C
rack
Len
gth
(in
ches
)S 7-4 2024-T3, No Surfactant
S 7-5 7075-T6, No Surfactant
S 7-4 2024-T3, 0.0018g/L FC170C Surfactant
Figure 4.5-2. Surfactant study wedge test results
Table 4.5-4. Surfactant Study Sample Performance Summary
Sample Number
Sample Alloy
Sol-Gel Coating
Primer Initial Crack
Length, Inches
6 Week Crack
Growth, Inches
6 Week Failure Mode
(%coh) S 7-4 2024 T 3 3% Boegel EP
II BR 6747-1,
Batch # 5767000 (2-15-99)
1.21
0.29 82%
S 7-5 7075 T6 3% Boegel EP II
BR 6747-1, Batch # 5767000
(2-15-99)
1.17 0.32 50%
S 7-6 2024 T3 3% Boegel EP II, With 0.0018 g/L FC 170 C
BR 6747-1, Batch # 5767000
(2-15-99)
1.23 0.31 82%
These results indicate that use of the FC 170C cationic surfactant within the concentration range tested in this study, does not have a deleterious effect on the adhesion or durability of the bonded interface. In addition, this surfactant was very effective in improving the coating properties for the sol-gel deposition.
4.5.3 Re-evaluation of Heat Curing of Sol-Gel Coating
In previous contracts, a heat cure step was conducted after application of the sol-gel and before application of the primer. It was thought that this heat cure step was necessary to provide adequate crosslinking of the sol-gel coating. However, subsequent testing showed that our initial contention was not true. Test data indicated that no separate heat cure was necessary to provide adequate hot/wet stability of the interface. In fact, by eliminating the heat cure, better failure modes were realized. In this study, verification of the ambient cure on the sol-gel coating was tested. Testing was conducted to compare the effects of air drying versus a 30-minute bake at 250°F on bare 2024-T3 wedge crack extension performance. The results of this testing was included in Figures 4.4-2 and 4.4-3 in the alloy comparison section. All samples were cleaned in

34
Brulin 815 GD and Turco 2623, but not deoxidized, prior to being abraded. The Boegel-EPII solution without surfactant was used to coat the samples.
The effect of heat curing applied sol-gel coatings at 250°F for 30 minutes rather than air drying can be seen by comparing the performance of samples S 55-7 and S 55-8. Both samples received identical processing except for the method of drying the sol-gel coating. The S55-7 sample was air dried at room temperature for 127 minutes before priming, while the S 55-8 sample was baked for 30 minutes at 250°F. Although there is only a 0.03” difference in crack growth between these samples, the S 55-8 specimens that had received the heated cure treatment had more adhesive failure at the sol-gel to metal interface than the air-dried S 55-7 samples.
4.5.4 Extended Pot-Life Testing
A test was conducted to determine any bond performance effects due to increased pot-life of the Boegel EPII formulation on aluminum. Pot-life is the length of time that the sol-gel solution is active after mixing of the sol-gel components. Substrates were bare 2024-T3 aluminum alloy, sanded (#220) and treated with Boegel-EPII. Specimens were primed with Cytec BR6747-1 and bonded with AF 163-2M. Specimens were sol-gel treated at the following pot-life times:
Sample Pot-Life AA05-1X 0.5 hr AA05-2X 4 hr AA05-3X 8 hr AA05-4X 10 hr AA05-5X 24 hr AA05-6X 72 hr
Wedge test results are shown in Figure 4.5-3. After one week, the failure modes on all of the specimens were approximately 98% cohesive failure. This shows that even with the difference in crack extension, there was no significant difference in hot/wet performance.
1.00
1.10
1.20
1.30
1.40
1.50
0 200 400 600 800 1000 1200
Hours of Exposure to 140°F and >98%RH
To
tal C
rack
Len
gth
(in
ches
)
AA05-1XAA05-2XAA05-3XAA05-4XAA05-5XAA05-6X
Figure 4.5-3. Extended pot-life performance results

35
While extended pot-lives did not appear to cause a performance difference in this study, they are not recommended, as many other factors can influence the performance of the formulation. These tests were conducted under controlled laboratory conditions. Effects of temperature and humidity and chemical handling can all significantly reduce the pot-life of the material. Additionally, the age of the chemical affect this parameter. For the purpose of obtaining process robustness, a maximum pot-life of ten hours was assigned to the sol-gel for use under all conditions. This will ensure that every user can guarantee consistent results.
4.5.5 Stock Chemical Evaluation Due to a series of unusually poorly performing specimens, the stock chemicals and primers were assessed by conducting a standard series of tests to determine their viability. Table 4.5-5 describes the test matrix for this series of tests. The wedge crack extension results are in Figures 4.5-4 and 4.5.5. The performance of the grit-blasted and sanded specimens in this series was representative of previous results obtained with these surface preparations. The grit-blasted specimens were >93% cohesive and the sanded specimens were 75 - 80% cohesive when split open after 6 weeks of exposure, fairly typical of previous performance. The reason for the series of poorly performing specimens was attributed to any one variable and the problem disappeared in subsequent testing. Table 4.5-5. C52 Stock Chemical Evaluation Test Matrix
Surface Prep Boegel-EPII, no surfactant
Boegel-EPII, surfactant from stock solution,
final c = 0.018 g/L
Boegel-EPII, fresh
surfactant, c = 0.018 g/L
Boegel-EPII, no surfactant
Boegel-EPII, no
surfactant
Boegel-EPII, no
surfactant
Sanded: Jitterbug,
#220 alumina, 3 minute
sanding time
New chemicals, New Primer
C52-SN
New Chemicals, New Primer
C52-SS
New Chemicals, New Primer
C52-SF
Grit-blasted: #180 alumina
New Chemicals, New Primer
C52-GN
New Chemicals, New Primer
C52-GS
New Chemicals, New Primer
C52-GF
Old Chemicals, New Primer C52-GN2
Old Chemicals, Old Primer C52-GN3
New Chemicals, Old Primer C52-GN4
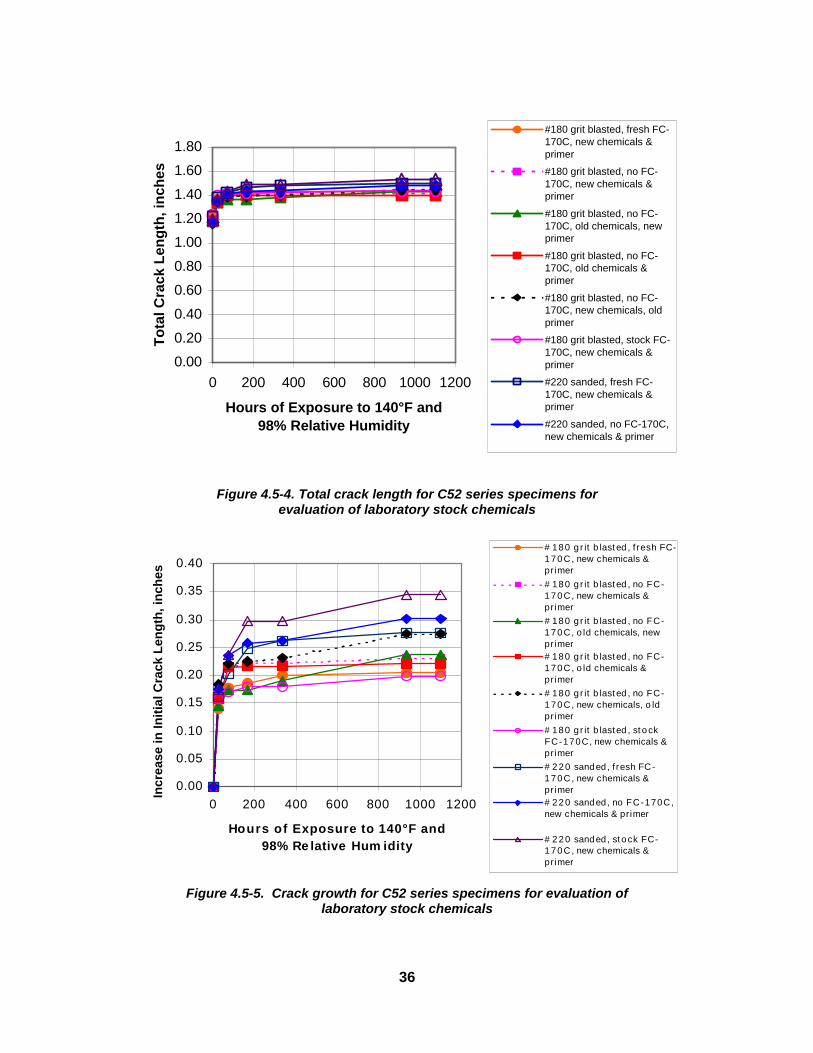
36
0.00
0.20
0.40
0.60
0.80
1.00
1.20
1.40
1.60
1.80
0 200 400 600 800 1000 1200
Hours of Exposure to 140°F and 98% Relative Humidity
To
tal C
rack
Len
gth
, in
ches
#180 grit blasted, fresh FC-170C, new chemicals &primer
#180 grit blasted, no FC-170C, new chemicals &primer
#180 grit blasted, no FC-170C, old chemicals, newprimer
#180 grit blasted, no FC-170C, old chemicals &primer
#180 grit blasted, no FC-170C, new chemicals, oldprimer
#180 grit blasted, stock FC-170C, new chemicals &primer
#220 sanded, fresh FC-170C, new chemicals &primer
#220 sanded, no FC-170C,new chemicals & primer
Figure 4.5-4. Total crack length for C52 series specimens for evaluation of laboratory stock chemicals
0.00
0.05
0.10
0.15
0.20
0.25
0.30
0.35
0.40
0 200 400 600 800 1000 1200
Hours of Exposure to 140°F and 98% Re lative Hum idity
Incr
ease
in In
itia
l Cra
ck L
eng
th, i
nch
es
# 180 g r it b lasted , f resh FC-170C, new chemicals &primer# 180 g r it b lasted , no FC-170C, new chemicals &primer# 180 g r it b lasted , no FC-170C, o ld chemicals, newprimer# 180 g r it b lasted , no FC-170C, o ld chemicals &primer# 180 g r it b lasted , no FC-170C, new chemicals, o ldprimer# 180 g r it b lasted , st o ckFC-170C, new chemicals &primer# 2 2 0 sanded , f resh FC-170C, new chemicals &primer# 2 2 0 sanded , no FC-170C,new chemicals & primer
# 2 2 0 sanded , st ock FC-170C, new chemicals &primer
Figure 4.5-5. Crack growth for C52 series specimens for evaluation of
laboratory stock chemicals

37
4.5.6 Alternate Sol-Gel Chemistries An alternate sol-gel chemistry developed by Chemat Technologies was evaluated for performance and hot/wet durability by the Tri-Services/Industry team. Chemat had developed a waterborne sol-gel formulation and process based on an aluminum-silicon chemistry. This chemistry was tested in round robin testing by the DoD/Industry Team. The 28-day wedge crack extension test for the Chemat-prepared specimens XP500-12A on aluminum 2024-T3 are shown in Figure 4.5-6. A test specimen split open after 6 days of exposure exhibited 100% adhesive failure at the metal to sol-gel interface, as shown in Figure 4.5-7. The lap shear results are given in Figure 4.5-8, and Figure 4.5-9 illustrates the roller peel data. The lap and peel specimens all failed in a 100% adhesive mode at the metal to sol-gel interface.
1.00
1.10
1.20
1.30
1.40
1.50
1.60
1.70
1.80
1.90
0 400 800 1200
Hours of Exposure to 140°F and >98% RH
To
tal C
rack
Len
gth
(in
ches
)
Chemat Round 1Coating System
Figure 4.5-6. Total crack length for Chemat-coated specimens (ID #XP500-12A)
Figure 4.5-7. Failure mode evaluation of the Chemat-coated specimen after 6 days exposure to
140°F and 98% relative humidity

38
0.0
500.0
1000.0
1500.0
2000.0
2500.0
3000.0
3500.0
4000.0
4500.0
-65 75 (R.T.) 180
Testing Temperature (°F)
Lap
Sh
ear
Str
eng
th (
psi
)
Figure 4.5-8 Lap shear results for Chemat-coated specimens (ID #XP500-12A)
0
10
20
30
40
50
60
70
-65 75 (R.T.) 180
Testing Temperature (°F)
Ro
ller
Pee
l Str
eng
th (
lbf/
in)
Figure 4.5-9. Roller peel results for Chemat-coated specimens (ID #XP500-12A)
4.6 Application Procedure Testing
4.6.1 Sol-Gel Wet Residence Time and Blow-Off Testing
A series of panels was prepared to examine the effect of wet time of the sol-gel on the aluminum surface and effects of in-place drying versus blowing off of excess sol-gel solution. This series used exclusively #180 alumina grit-blasted 2024-T3 aluminum substrates. The length of

39
application times tested included 10 seconds, 1 minute, 5 minutes and 10 minutes. A 1-inch wide natural bristle brush was used to apply the sol-gel solution to panels which were laid flat in a shallow tray. Ten seconds was about the minimum time required to completely brush across the width and down the length of a single 6-inch x 6-inch panel surface.
For samples with application times longer than 10 seconds, fresh solution was applied to the panels by immersing the brush in a small bottle containing 40 mL of sol-gel solution and then repeating the brush application procedure again and again. Solution was applied simultaneously to both of the panels making up a single sample set. Each cycle of solution brush application and brush re-wetting took about 15 seconds to complete. A 1-inch wide brush appeared to be about the minimum width feasible for coating this 6-inch x 12-inch area. Use of significantly smaller brushes to treat this size area appears to increase the effort required to accomplish the same task. Areas much larger than 6-inch x 12-inch would require correspondingly larger brushes.
Five minutes of brush application consumed about half of the original 40 ml of sol-gel coating solution. The remaining solution was heavily contaminated with residual alumina grit that had not been removed when the panels were initially cleaned by blowing them off with 30-psi compressed air. The solution used on samples receiving the 10-minute brush application treatment was replaced with new, uncontaminated solution midway through the process.
Two sets of samples were prepared for each of the four solution application times tested. The first was placed in a vertical position and allowed to dry naturally. Excess solution on the remaining set was blown off immediately upon completion of the application procedure. Removal of the residual coating solution was performed with a compressed air gun fitted with a safety nozzle and supplied with 30-psi compressed air. Complete drying of these panels required between 15 and 20 seconds of continuous use of the air gun. The air gun was held 4 inches to 6 inches from the panels at an angle of about 45 degrees with the panel surface.
All of the panels from each of the four different solution application times were allowed to dry at approximately 70°F and 50% relative humidity for between 75 and 80 minutes before being primed with BR 6747-1 (Batch # 51122-00, manufactured 9-16-97). The primed panels were cured for 59 minutes at 255°F in a circulating air oven.
Wedge test results are shown in Figures 4.6-1 and 4.6-2. The data show two significant features. Despite the large variations in processing conditions, the data points appear to lie very close together. It had been expected that significant differences in performance would be noted between samples brushed with the sol-gel coating solution for between 10 seconds and 10 minutes, or between samples that were allowed to either air dry or blown dry with compressed air. If real differences between the samples exist, they are much smaller than expected.
Secondly, the entire batch of specimens showed generally poorer performance than we have typically been seeing. Crack growths for these samples is from 0.10 to 0.15 inch greater than typically observed for grit-blasted and sol-gel coated 2024-T3 prepared at Boeing. Possible reasons include systematic damage during machining operations and differences in surfactant methodologies.
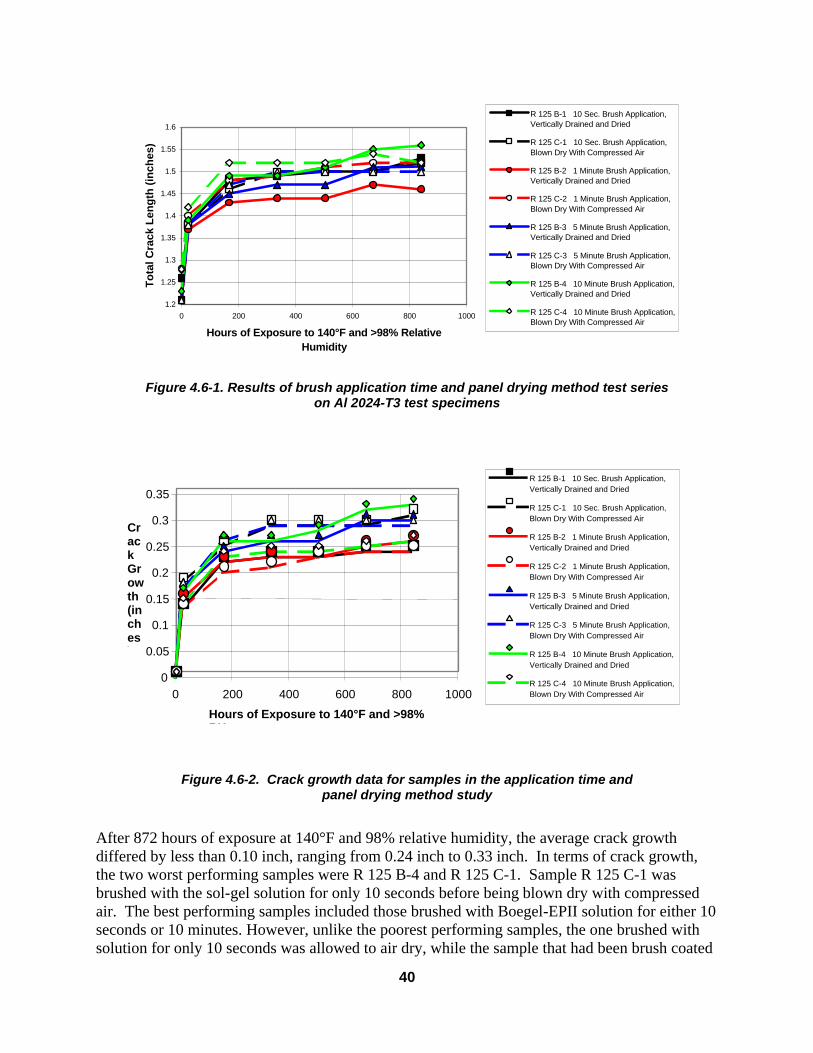
40
1.2
1.25
1.3
1.35
1.4
1.45
1.5
1.55
1.6
0 200 400 600 800 1000
Hours of Exposure to 140°F and >98% Relative Humidity
To
tal C
rack
Len
gth
(in
ches
)
R 125 B-1 10 Sec. Brush Application,Vertically Drained and Dried
R 125 C-1 10 Sec. Brush Application,Blown Dry With Compressed Air
R 125 B-2 1 Minute Brush Application,Vertically Drained and Dried
R 125 C-2 1 Minute Brush Application,Blown Dry With Compressed Air
R 125 B-3 5 Minute Brush Application,Vertically Drained and Dried
R 125 C-3 5 Minute Brush Application,Blown Dry With Compressed Air
R 125 B-4 10 Minute Brush Application,Vertically Drained and Dried
R 125 C-4 10 Minute Brush Application,Blown Dry With Compressed Air
Figure 4.6-1. Results of brush application time and panel drying method test series
on Al 2024-T3 test specimens
0
0.05
0.1
0.15
0.2
0.25
0.3
0.35
0 200 400 600 800 1000 Hours of Exposure to 140°F and >98% RH
Crack Growth (inches)
R 125 B-1 10 Sec. Brush Application, Vertically Drained and Dried R 125 C-1 10 Sec. Brush Application, Blown Dry With Compressed Air R 125 B-2 1 Minute Brush Application, Vertically Drained and Dried R 125 C-2 1 Minute Brush Application, Blown Dry With Compressed Air R 125 B-3 5 Minute Brush Application, Vertically Drained and Dried R 125 C-3 5 Minute Brush Application, Blown Dry With Compressed Air R 125 B-4 10 Minute Brush Application, Vertically Drained and Dried R 125 C-4 10 Minute Brush Application, Blown Dry With Compressed Air
Figure 4.6-2. Crack growth data for samples in the application time and panel drying method study
After 872 hours of exposure at 140°F and 98% relative humidity, the average crack growth differed by less than 0.10 inch, ranging from 0.24 inch to 0.33 inch. In terms of crack growth, the two worst performing samples were R 125 B-4 and R 125 C-1. Sample R 125 C-1 was brushed with the sol-gel solution for only 10 seconds before being blown dry with compressed air. The best performing samples included those brushed with Boegel-EPII solution for either 10 seconds or 10 minutes. However, unlike the poorest performing samples, the one brushed with solution for only 10 seconds was allowed to air dry, while the sample that had been brush coated

41
for 10 minutes was blown dry with compressed air. The remaining two top performing samples had both been brushed with Boegel-EPII for one minute, and then either been blown dry with compressed air or allowed to air dry.
These results suggest that the wedge test performance of samples brushed with Boegel-EPII solutions for either very short or very long periods of time require different drying conditions for optimum performance. Samples brushed with solution for one minute appear to respond equally well to either of the two panel drying methods tested. The key issue could be which combination of brush application time and panel-drying method is used, rather than simply how long panels are brushed with solution or whether they are blown dry or not. Further testing will be required to both duplicate these test results and substantiate this interpretation of the data. Studies based on a controlled design of experiments approach were carried out by the Air Force to delineate the relationship between all of the parameters involved in this process. In these tests, reported in detail elsewhere10, it was found that blowing off the surface with air after sol-gelling was much more critical for sanded or Scotch-Brited surfaces than it was for grit-blasted surfaces. The grit-blasted surfaces were more robust in the techniques one could use for expediting the processing.
4.6.2 Increasing Sol-Gel Dry Time Prior to Wipe-on Primer
Wedge crack extension tests were performed to determine the optimum sol-gel dry time prior to priming with the wipe-on method. The objective was to examine whether wiping on the primer too soon after sol-gel application would be destructive to the sol-gel coating. In essence, to determine whether the sol-gel coating would be wiped off during the wipe-on primer application.
Substrates were bare 2024-T3 aluminum alloy sanded with #220 Al2O3 using a random orbital sander. Specimens were treated with Boegel-EPII, air-dried for various times, primed with Cytec BR 6747-1 using a wipe-on process with a folded piece of clean cheesecloth, and bonded with AF 163-2M. The drying times tested are given in Table 4.6-1. The failure modes (after 672 hours of exposure) are shown in Figure 4.6-3 and the wedge crack results are provided in Figure 4.6-4. There appears to be a decrease in cohesive failure of the 20-hour result compared to the average of the ‘same day’ results, and overall, the values are slightly lower than spray-on primer. The primer using the wipe-on method was visibly less uniform in thickness than the spray-on method. There may be some minimal effect, whether mechanical or from the less uniform thickness of wipe-on primer, that causes the reduction in performance.
Table 4.6-1. Sol-Gel Dry Times Prior to Priming by the Wipe-On Method
Specimen Identification Ambient Dry Time D59-1 Immediately after sol-gel appears dry (~10 minutes) D59-2 30 minutes D59-3 60 minutes D59-4 End of Day D59-5 Overnight (~20 hours)
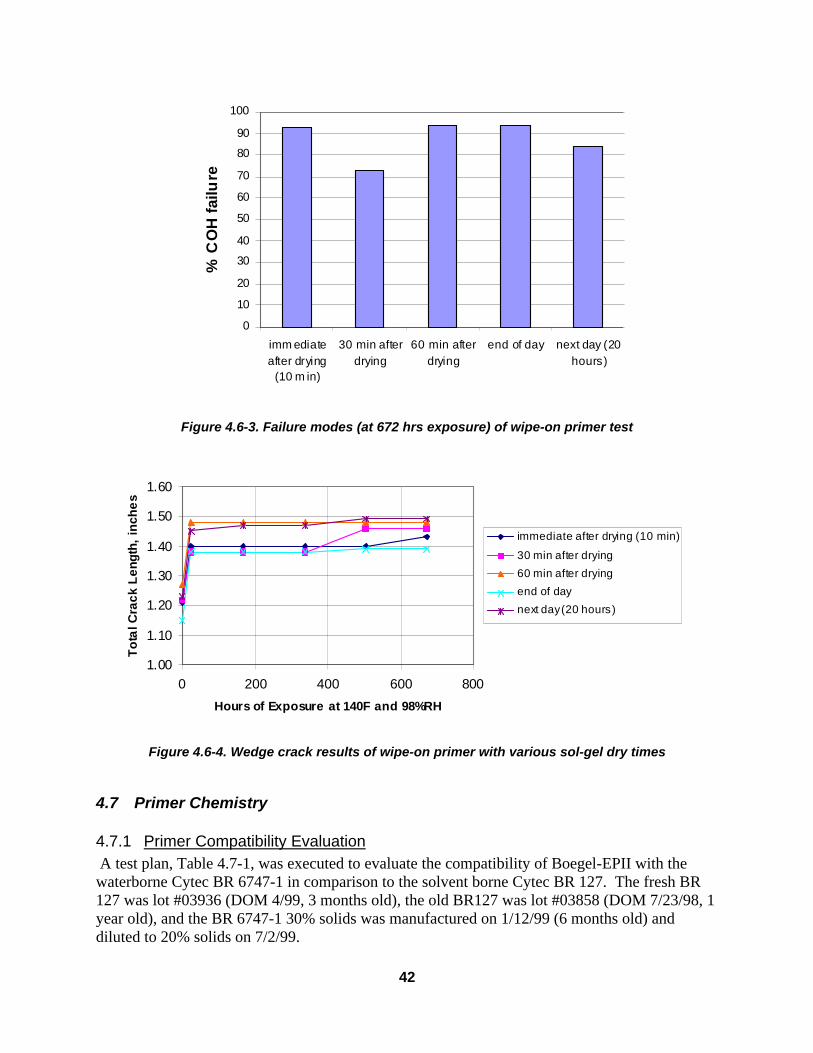
42
0
10
20
30
40
50
60
70
80
90
100
imm ediateafter drying
(10 m in)
30 min afterdrying
60 min afterdrying
end of day next day (20hours)
% C
OH
fai
lure
Figure 4.6-3. Failure modes (at 672 hrs exposure) of wipe-on primer test
1.00
1.10
1.20
1.30
1.40
1.50
1.60
0 200 400 600 800
Hours of Exposure at 140F and 98%RH
To
tal C
rack
Len
gth,
inch
es
immediate after drying (10 min)
30 min after drying
60 min after drying
end of day
next day (20 hours)
Figure 4.6-4. Wedge crack results of wipe-on primer with various sol-gel dry times
4.7 Primer Chemistry
4.7.1 Primer Compatibility Evaluation A test plan, Table 4.7-1, was executed to evaluate the compatibility of Boegel-EPII with the waterborne Cytec BR 6747-1 in comparison to the solvent borne Cytec BR 127. The fresh BR 127 was lot #03936 (DOM 4/99, 3 months old), the old BR127 was lot #03858 (DOM 7/23/98, 1 year old), and the BR 6747-1 30% solids was manufactured on 1/12/99 (6 months old) and diluted to 20% solids on 7/2/99.
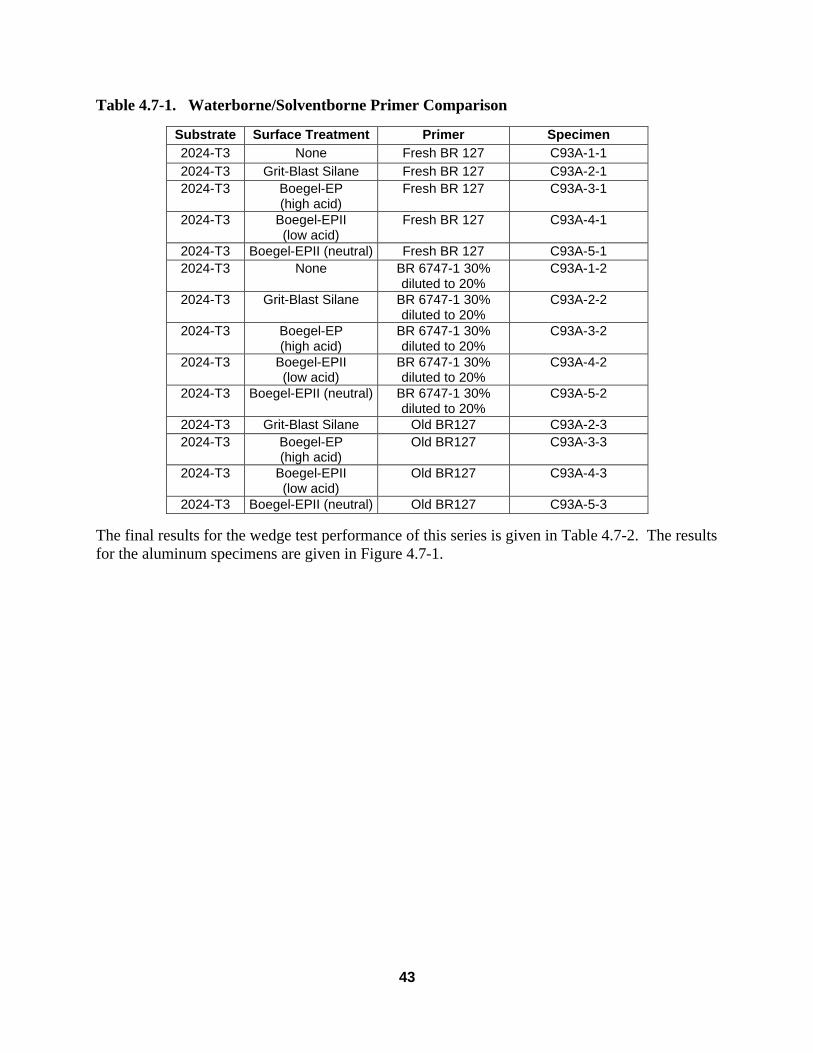
43
Table 4.7-1. Waterborne/Solventborne Primer Comparison
Substrate Surface Treatment Primer Specimen 2024-T3 None Fresh BR 127 C93A-1-1 2024-T3 Grit-Blast Silane Fresh BR 127 C93A-2-1 2024-T3 Boegel-EP
(high acid) Fresh BR 127 C93A-3-1
2024-T3 Boegel-EPII (low acid)
Fresh BR 127 C93A-4-1
2024-T3 Boegel-EPII (neutral) Fresh BR 127 C93A-5-1 2024-T3 None BR 6747-1 30%
diluted to 20% C93A-1-2
2024-T3 Grit-Blast Silane BR 6747-1 30% diluted to 20%
C93A-2-2
2024-T3 Boegel-EP (high acid)
BR 6747-1 30% diluted to 20%
C93A-3-2
2024-T3 Boegel-EPII (low acid)
BR 6747-1 30% diluted to 20%
C93A-4-2
2024-T3 Boegel-EPII (neutral) BR 6747-1 30% diluted to 20%
C93A-5-2
2024-T3 Grit-Blast Silane Old BR127 C93A-2-3 2024-T3 Boegel-EP
(high acid) Old BR127 C93A-3-3
2024-T3 Boegel-EPII (low acid)
Old BR127 C93A-4-3
2024-T3 Boegel-EPII (neutral) Old BR127 C93A-5-3
The final results for the wedge test performance of this series is given in Table 4.7-2. The results for the aluminum specimens are given in Figure 4.7-1.

44
Table 4.7-2. Waterborne/Solventborne Primer Comparison
Specimen Substrate Surface Treatment Primer Failure Mode C93A-1-1 2024-T3 None Fresh BR 127 0% cohesive C93A-2-1 2024-T3 Grit-Blast Silane Fresh BR 127 81% cohesive C93A-3-1 2024-T3 Boegel-EP
(high acid) Fresh BR 127 92% cohesive
C93A-4-1 2024-T3 Boegel-EPII (low acid)
Fresh BR 127 78% cohesive
C93A-5-1 2024-T3 Boegel-EPII (neutral)
Fresh BR 127 75% cohesive
C93A-1-2 2024-T3 None BR 6747-1 30% diluted to 20%
0% cohesive
C93A-2-2 2024-T3 Grit-Blast Silane BR 6747-1 30% diluted to 20%
89% cohesive
C93A-3-2 2024-T3 Boegel-EP (high acid)
BR 6747-1 30% diluted to 20%
96% cohesive
C93A-4-2 2024-T3 Boegel-EPII (low acid)
BR 6747-1 30% diluted to 20%
96% cohesive
C93A-5-2 2024-T3 Boegel-EPII (neutral)
BR 6747-1 30% diluted to 20%
94% cohesive
C93A-2-3 2024-T3 Grit-Blast Silane Old BR 127 52% cohesive C93A-3-3 2024-T3 Boegel-EP
(high acid) Old BR 127 29% cohesive
C93A-4-3 2024-T3 Boegel-EPII (low acid)
Old BR 127 14% cohesive
C93A-5-3 2024-T3 Boegel-EPII (neutral)
Old BR 127 32% cohesive
1.20
1.25
1.30
1.35
1.40
1.45
1.50
1.55
1.60
1.65
0 200 400 600 800 1000 1200
Hours of Exposure to 140°F and 98% Relative Hum idity
To
tal C
rack
Len
gth
, in
ches
2024/GB Silane/FreshBR127
2024/Hi Ac idB o egel/Fresh BR127
2024/Lo Ac idB o egel/Fresh BR127
2024/NeutralB o egel/Fresh BR127
2024/GBSilane/BR6747-1
2024/Hi Ac idB o egel/BR6747-1
2024/Lo Ac idB o egel/BR6747-1
2024/NeutralB o egel/BR6747-1
2024/GB Silane/OldBR127
2024/Hi Ac idB o egel/Old BR127
2024/Lo Ac idB o egel/Old BR127
2024/NeutralB o egel/Old BR127
Figure 4.7-1. Total crack length for primer comparison series 2024-T3 surface treated specimens
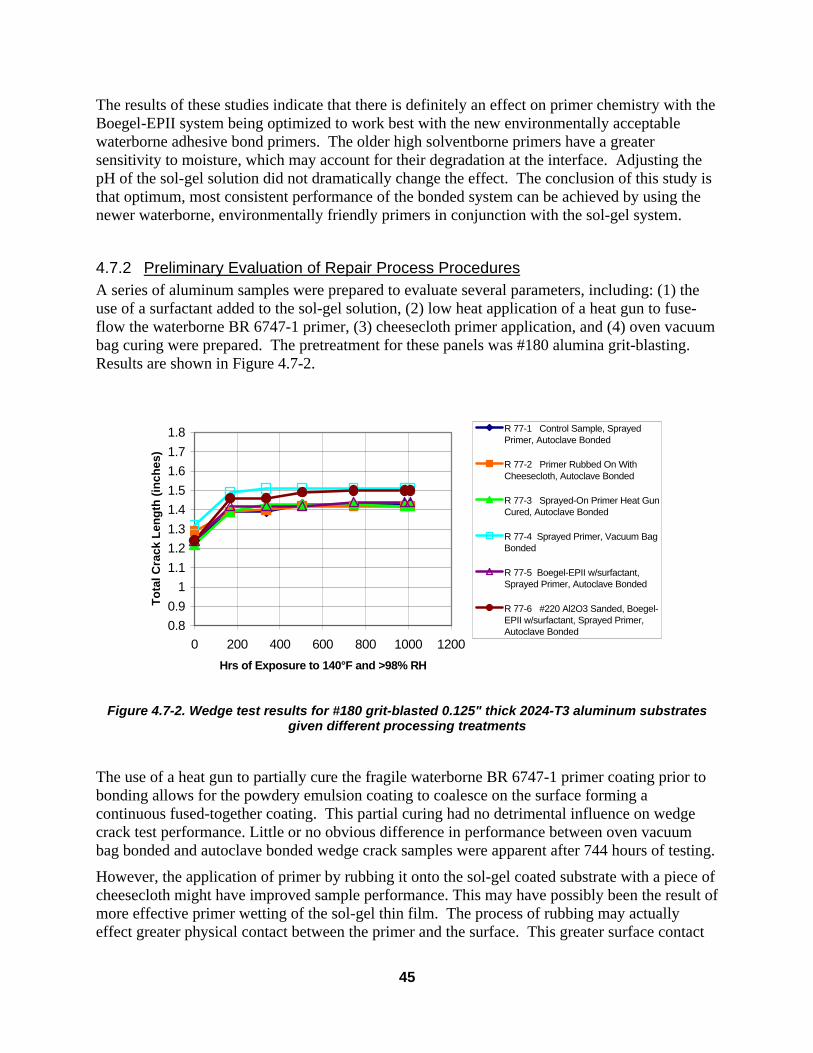
45
The results of these studies indicate that there is definitely an effect on primer chemistry with the Boegel-EPII system being optimized to work best with the new environmentally acceptable waterborne adhesive bond primers. The older high solventborne primers have a greater sensitivity to moisture, which may account for their degradation at the interface. Adjusting the pH of the sol-gel solution did not dramatically change the effect. The conclusion of this study is that optimum, most consistent performance of the bonded system can be achieved by using the newer waterborne, environmentally friendly primers in conjunction with the sol-gel system.
4.7.2 Preliminary Evaluation of Repair Process Procedures A series of aluminum samples were prepared to evaluate several parameters, including: (1) the use of a surfactant added to the sol-gel solution, (2) low heat application of a heat gun to fuse-flow the waterborne BR 6747-1 primer, (3) cheesecloth primer application, and (4) oven vacuum bag curing were prepared. The pretreatment for these panels was #180 alumina grit-blasting. Results are shown in Figure 4.7-2.
0.80.9
11.11.21.31.41.51.61.71.8
0 200 400 600 800 1000 1200
Hrs of Exposure to 140°F and >98% RH
To
tal C
rack
Len
gth
(in
ches
)
R 77-1 Control Sample, SprayedPrimer, Autoclave Bonded
R 77-2 Primer Rubbed On WithCheesecloth, Autoclave Bonded
R 77-3 Sprayed-On Primer Heat GunCured, Autoclave Bonded
R 77-4 Sprayed Primer, Vacuum BagBonded
R 77-5 Boegel-EPII w/surfactant,Sprayed Primer, Autoclave Bonded
R 77-6 #220 Al2O3 Sanded, Boegel-EPII w/surfactant, Sprayed Primer,Autoclave Bonded
Figure 4.7-2. Wedge test results for #180 grit-blasted 0.125" thick 2024-T3 aluminum substrates
given different processing treatments
The use of a heat gun to partially cure the fragile waterborne BR 6747-1 primer coating prior to bonding allows for the powdery emulsion coating to coalesce on the surface forming a continuous fused-together coating. This partial curing had no detrimental influence on wedge crack test performance. Little or no obvious difference in performance between oven vacuum bag bonded and autoclave bonded wedge crack samples were apparent after 744 hours of testing.
However, the application of primer by rubbing it onto the sol-gel coated substrate with a piece of cheesecloth might have improved sample performance. This may have possibly been the result of more effective primer wetting of the sol-gel thin film. The process of rubbing may actually effect greater physical contact between the primer and the surface. This greater surface contact
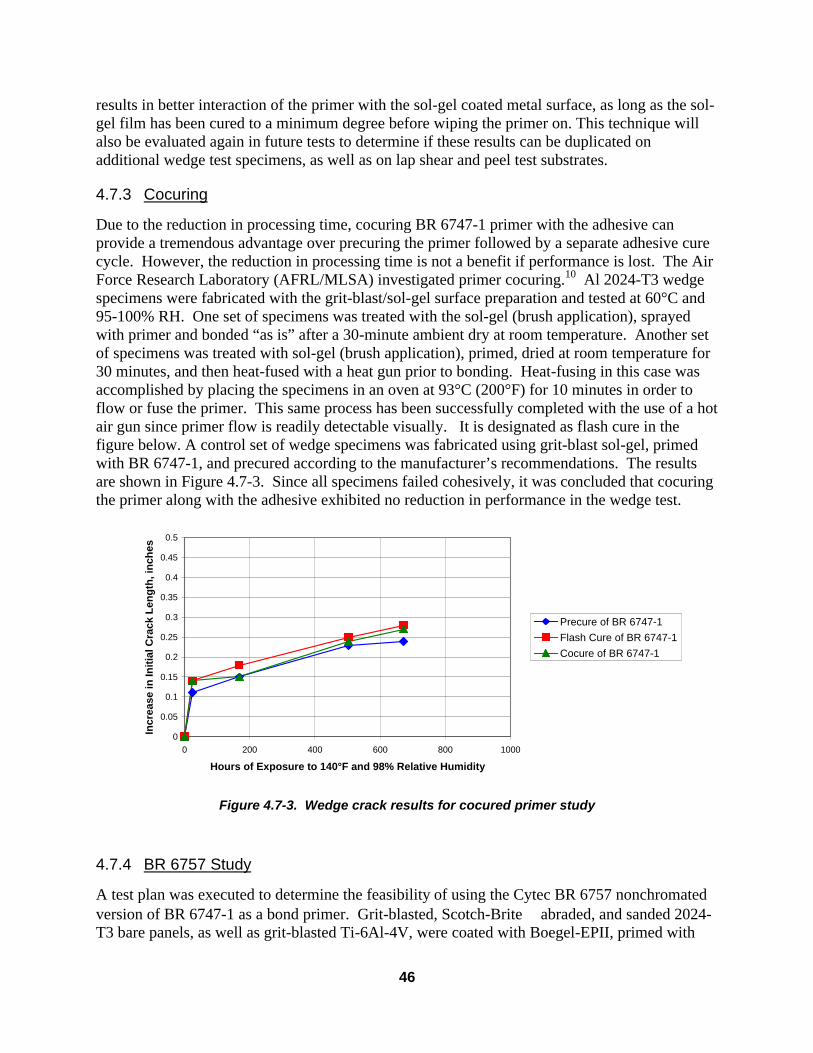
46
results in better interaction of the primer with the sol-gel coated metal surface, as long as the sol-gel film has been cured to a minimum degree before wiping the primer on. This technique will also be evaluated again in future tests to determine if these results can be duplicated on additional wedge test specimens, as well as on lap shear and peel test substrates.
4.7.3 Cocuring
Due to the reduction in processing time, cocuring BR 6747-1 primer with the adhesive can provide a tremendous advantage over precuring the primer followed by a separate adhesive cure cycle. However, the reduction in processing time is not a benefit if performance is lost. The Air Force Research Laboratory (AFRL/MLSA) investigated primer cocuring.10 Al 2024-T3 wedge specimens were fabricated with the grit-blast/sol-gel surface preparation and tested at 60°C and 95-100% RH. One set of specimens was treated with the sol-gel (brush application), sprayed with primer and bonded “as is” after a 30-minute ambient dry at room temperature. Another set of specimens was treated with sol-gel (brush application), primed, dried at room temperature for 30 minutes, and then heat-fused with a heat gun prior to bonding. Heat-fusing in this case was accomplished by placing the specimens in an oven at 93°C (200°F) for 10 minutes in order to flow or fuse the primer. This same process has been successfully completed with the use of a hot air gun since primer flow is readily detectable visually. It is designated as flash cure in the figure below. A control set of wedge specimens was fabricated using grit-blast sol-gel, primed with BR 6747-1, and precured according to the manufacturer’s recommendations. The results are shown in Figure 4.7-3. Since all specimens failed cohesively, it was concluded that cocuring the primer along with the adhesive exhibited no reduction in performance in the wedge test.
0
0.05
0.1
0.15
0.2
0.25
0.3
0.35
0.4
0.45
0.5
0 200 400 600 800 1000
Hours of Exposure to 140°F and 98% Relative Humidity
Incr
ease
in In
itia
l Cra
ck L
eng
th, i
nch
es
Precure of BR 6747-1Flash Cure of BR 6747-1Cocure of BR 6747-1
Figure 4.7-3. Wedge crack results for cocured primer study
4.7.4 BR 6757 Study
A test plan was executed to determine the feasibility of using the Cytec BR 6757 nonchromated version of BR 6747-1 as a bond primer. Grit-blasted, Scotch-Brite abraded, and sanded 2024-T3 bare panels, as well as grit-blasted Ti-6Al-4V, were coated with Boegel-EPII, primed with

47
BR 6757, and bonded with AF 163-2M. The wedge crack extension results are shown in Figure 4.7-3. Air Force and Navy testing verified the poor performance of this particular batch of BR 6757 primer. Previous studies had shown that acceptable performance could be achieved with other batches of this primer chemistry. Discussions with Cytec regarding resolution of performance issues did not pin down the particular reason for the poor performance in this series.
0.75
0.95
1.15
1.35
1.55
1.75
1.95
0 200 400 600 800 1000 1200
Hours of Exposure to 140°F and 98% Relative Humidity
To
tal C
rack
Len
gth
, in
ches
2024-T3, #180 grit blasted
2024-T3, #220 sanded
2024-T3, MED Scotch-Brite abraded
Ti-6Al-4V, #180 grit blasted
Figure 4.7-3. Total crack length for specimens primed with Cytec BR 6757
4.8 Vacuum Curing The effects of a vacuum cure cycle versus an autoclave cure cycle were investigated, since most repair scenarios use vacuum pressure. The optimized Scotch-Brite / sol-gel (SBSG) and grit-blast / sol-gel processes were used to fabricate wedge test specimens with Al 2024-T3 and AF 163-2M. 3M medium Scotch-Brite pads were used for the deoxidation step for the SBSG surface prep. BR 6747-1 primer was used in both surface preps. The primer was cocured with the adhesive for 60 minutes at 250°F and 27 inches Hg. The specimens were tested at 140°F and 95-100% RH. Results are shown in Figure 4.8-1. These data indicate that there is no reduction in performance of the sol-gel surface preparations due to vacuum curing.
25% coh
15% coh
70% coh
10% coh
30% coh
0% coh
97% coh 97% coh
0% coh
98% coh
0% coh
0% coh

48
1
1.05
1.1
1.15
1.2
1.25
1.3
1.35
1.4
1.45
1.5
0 200 400 600 800 1000
Hours of Exposure to 140°F and 98% Relative Humidity
To
tal C
rack
Len
gth
, in
ches
#180 alumina grit blasted,Boegel-EPIIMED Scotch-Brite abraded,Boegel-EPII
Figure 4.8-1. Effect of vacuum curing on sol-gel surface preparations
4.9 Paste Adhesives
Aluminum wedge crack extension samples were prepared to acquire baseline data for paste adhesive bonding. The series included 3 sets of #180 alumina grit-blasted bare 2024-T3 aluminum panels that were brushed with the standard Boegel-EPII solution, primed with BR 6747-1 and then bonded with EA 9394 paste adhesive. Further processing details for these samples are given in the Table 4.9-1 below.
Table 4.9-1. Paste Adhesive Bonded Samples Processing Details
Sample Number
Sol-Gel Formulation
Application Method
Application Time
Drying Method
Drying Time
S 7-1 Boegel-EPII Brush
2 Minutes Air 134 Minutes
S 7-2 Boegel-EPII Brush 2 Minutes Air 128 Minutes S 7-3 Boegel-EPII Brush 2 Minutes Air 122 Minutes S 7-1 20% BR
6747-1 #5767000,
2-15-99 HVLP Spray EA 9394,
9-21-98 Autoclave,
35 psi, 120°F S 7-2 20% BR
6747-1 #5767000,
2-15-99 HVLP Spray EA 9394,
9-21-98 Autoclave,
35 psi, 120°F S 7-3 20 % BR
6747-1 #5767000,
2-15-99 HVLP Spray EA 9394,
9-21-98 12 in Hg Vac.,
Rm. Temp. Bag Cure
After bonding, there was some porosity in the adhesive noted along the edges of the cut specimens. It is not known whether insufficient adhesive or uneven spreading of the applied adhesive was the cause of these defects. The room temperature, partial vacuum bag cured specimens were tested at 140°F and 98% RH. Performance of these samples at 140°F and 98% relative humidity is shown in Figure 4.9-1. The two autoclave bonded sample sets were to be

49
tested at 120°F and 98% RH and 140°F and 98% RH, but due to a mistake, both sets of the autoclave cured specimens were tested at 140°F, instead of one at 120°F and one set at 140°F as originally planned.
2
2.1
2.2
2.3
2.4
2.5
2.6
2.7
2.8
0 200 400 600 800 1000 1200
Hours of Exposure to 140°F and >98% RH
To
tal C
rack
Len
gth
(in
ches
)
S 7-1 Autoclave Cured at120°F & 35 PSI
S 7-2 Autoclave Cured at120°F & 35 PSI
S 7-3 RoomTemperature, VacuumBag Cured
Figure 4.9-1. EA 9394 paste adhesive sample performance
The failure modes of these paste adhesive samples were different from those of other #180 GB/Boegel-EPII/BR 6747-1/AF163-2M film adhesive samples. Significant areas of primer to adhesive failures were observed in the crack region created by the initial wedge insertion. Once exposed to 140°F and 98% relative humidity, the predominant mode of failure was cohesive. A summary of the performance of these samples is listed below in Table 4.9-2. Table 4.9-2. Performance Summary for the S 7 Series of EA 9394 Paste Adhesive Samples Sample Sol-Gel
Coating Primer Adhesive Initial Crack
Length, Inches 6 Week Crack
Growth, Inches 6 Week Failure
Modes S 7-1 3% Boegel
EP II BR 6747-1 Batch #5767000
EA 9394 2.28 0.48 100% Cohesive
S 7-2 “ “ “ 2.24 0.44 “ S 7-3 “ “ “ 2.39 0.10 “
Further paste adhesive testing was conducted using Hysol EA 9309.3NA. This tougher adhesive yields shorter initial crack lengths and provides a more discriminating test of the various surface treatments.
The results for two duplicate sets of wedge crack extension samples bonded with room temperature cured Hysol EA 9394 paste adhesive, S 55-5 and S 55-6, are shown in Figure 4.9-2. A summary of results can be found in Table 4.9-3.

50
1.5
2
2.5
3
3.5
0 500 1000 1500
Hrs of Exposure to 140°F and >98% RH
To
tal C
rack
Len
gth
(in
ches
)
S 55-5S 55-6
Figure 4.9-2. Total crack lengths for EA 9394 paste adhesive samples
Table 4.9-3. Summary of Paste Adhesive Sample Results after Testing at 140°F and 98%
Relative Humidity Sample Substrate
Material Surface
Preparation Sol-Gel Coating Drying Before
Priming
Initial Crack
Length, inches
5 Week Crack
Growth, inches
5 Week Failure Mode
S 55-5 Bare 2024 T3
#180 Alumina Grit-blast
Air Dried 99 Minutes
2.58 0.22 100% Cohesive
S 55-6 Bare 2024 T3
#180 Alumina Grit-blast
Air Dried 99 Minutes
2.58 0.42 100% Cohesive
Both paste adhesive samples were prepared using the same processing and materials up to the point of panel lay-up. At that time, two different people separately applied adhesive to each sample from the same batch of EA 9394.
Despite the difference in apparent crack growth between the two samples, there was no adhesive failure between the metal substrate and either the primer or adhesive in either sample. Adhesive failure between the primer and adhesive layer was the predominant mode of failure produced by wedge insertion under ambient conditions. However, upon exposure to a 140°F and 98% RH environment, the failures in both samples began to occur within the polyester random fiber mat scrim embedded in the adhesive layer and became 100% cohesive.
4.9.1 Paste Evaluation with Bond Primer A test plan was executed to determine the compatibility of sol-gel with various paste adhesives and a room-temperature cure-primer, 3M Company EC 1945. Panels were abraded, coated with
100% coh
100% coh

51
Boegel-EPII, primed with EC 1945 and bonded. The abrasion, primer, adhesive, and cure parameters are given in the legend. The results are shown in Figure 4.9-3.
1.20
1.70
2.20
2.70
3.20
3.70
4.20
0 200 400 600 800 1000 1200
Hours of Exposure to 140°F and 98% Relative Humidity
To
tal C
rack
Len
gth
, in
ches
# 220 alumina sandpaper (DynabradeROS), BR 6747-1, EA 9309.3NA, RTvacuum bag
# 220 alumina sandpaper (DynabradeROS), EC 1945, EA 9309.3NA, RTvacuum bag
# 220 alumina sandpaper (DynabradeROS), BR 6747-1, EA 9394, RTvacuum bag
# 220 alumina sandpaper (DynabradeROS), BR 6747-1, EA 9394, Platenpress at 35 psi overnight
# 220 alumina sandpaper (DynabradeROS), EC 1945, EA 9394, RT vacuumbag
# 180 alumina grit blast, BR 6747-1,EA 9394, Platen press at 35 psiovernight
# 180 alumina grit blast, BR 6747-1,EA 9394, RT vacuum bag
# 220 alumina sandpaper (DynabradeROS), No Primer, EA 9309.3NA, RTvacuum bag
# 220 alumina sandpaper (DynabradeROS), No Primer, EA 9394, RT vacuumbag
Figure 4.9-3. Total crack length for specimens bonded with paste adhesives
The data indicates that the 3M EC 1945 room temperature curing primer yielded very poor performance. There was no interaction between the primer and adhesive, and the specimens' initial crack and exposure yielded almost complete failure at the primer-to-adhesive interface over the length of the specimen. Samples without primer, where the paste adhesive was applied directly over the sol-gel, faired much better than the EC 1945 specimens. The failure mode was adhesive for the unprimed specimens, with the failure either occurring at the metal to sol-gel or sol-gel to adhesive interface. Specimens were prepared with Cytec BR6747-1 primer as a control, and these gave the best performance of the series.
100 100 100
0 0 0
100 100 100
0 10 35
0 0 0
100 100 50
100 70 88
0 0 0
0 0 0
% cohesive failure 24 hrs
30 days
6 wks

52
4.9.2 Durability of Bondlines in Nonprimed Systems A test plan, Table 4.9-4, was executed to determine the benefits of adding a corrosion inhibitor to the bondline in a completely room temperature cure bonded system without primer. Potassium dichromate was used as the active inhibitor to demonstrate feasibility of the concept. The EA 9309.3NA paste adhesive was used since it performed the best in previous studies. The wedge test panels were cured at room temperature under a vacuum bag. Glass beads in the adhesive bondline controlled the bondline thickness and a scrimcloth was added to improve consistency. Wedge crack extension results are shown in Figure 4.9-4.
Table 4.9-4. Test Plan for Paste Adhesives over Unprimed, Sol-Gel Coated Substrates with
a Corrosion Inhibitor in the Bondline
Specimen Substrate Surface Prep Abrasion Time
Boegel-EPII
D33-1 2024-T3 MED Scotch-Brite
2-3 min Brush. Add 1% Potassium Dichromate (K2Cr2O7)
D33-2 2024-T3 MED Scotch-Brite
2-3 min Brush. Add 0.5% Potassium Dichromate (K2Cr2O7)
D33-3 2024-T3 MED Scotch-Brite
2-3 min Brush. Add 0.1% Potassium Dichromate (K2Cr2O7)
D33-4 2024-T3 MED Scotch-Brite
2-3 min Brush. Add 0.01% Potassium Dichromate (K2Cr2O7)
Specimens were tested at 120°F. The specimens were removed early due to mechanical failure of the humidity cabinet. The specimens with lower levels of potassium dichromate in the sol-gel layer performed best. All specimens showed adhesive failure at the metal to sol-gel interface after 30 days and 6 weeks of exposure, with the exception of the specimens with 0.1% potassium dichromate incorporated in the sol-gel layer. The percentage cohesive failure for each test specimen is detailed in Figure 4.9-4.

53
1.50
1.70
1.90
2.10
2.30
2.50
2.70
2.90
3.10
0 200 400 600 800 1000
Hours of Exposure to 120°F and 98% Relative Humidity
To
tal C
rack
Len
gth
, in
ches
Boegel-EPII with 1%Potassium Dichromate(K2Cr2O7)
Boegel-EPII with 0.5%Potassium Dichromate(K2Cr2O7)
Boegel-EPII with 0.1%Potassium Dichromate(K2Cr2O7)
Boegel-EPII with 0.01%Potassium Dichromate(K2Cr2O7)
Figure 4.9-4. Total crack length for 2024-T3 Scotch-Brite abraded specimens coated with
chromated Boegel-EPII and bonded with EA 9309.3NA paste adhesive
4.10 Contamination Effect Studies A test plan, Table 4.10-1, was executed to determine methodologies for continuing a repair procedure after contamination has occurred. The substrates were MED Scotch-Brite abraded 2024-T3 bare, coated with Boegel-EPII, primed with BR 6747-1, and bonded with AF 163-2M. The results of wedge crack extension testing for this study are shown in Figure 4.10-1.
Table 4.10-1. Contamination Study
ID Specimen D35-1 Scotch-Brite, contaminate with oil (i.e. similar to what would drip from tool), solvent
wipe, lightly hand sand with alumina sandpaper, immediately sol-gel, then prime and bond
D35-2 Scotch-Brite, immediately sol-gel, let sol-gel dry at ambient for 1 hour, contaminate surface with oil or grease, solvent wipe, prime and bond
D35-3 Control - no contamination
59% coh
0% coh
0% coh
100% coh

54
1.00
1.10
1.20
1.30
1.40
1.50
1.60
0 200 400 600 800 1000 1200
Hrs of Exposure to 140°F and >98% RH
To
tal C
rack
Len
gth
(in
ches
)
D35-1
D35-2
D35-3, control
Figure 4.10-1. Total crack length for specimens contaminated with oil or
grease during processing
The failure modes on the test specimens indicate that solvent wiping alone may not be sufficient to remove organic contaminants on the surface of the metal down to the molecular level necessary to get good subsequent adhesion of the sol-gel. When a light hand sand was added after the solvent wiping to remove the contamination, the surface was adequately reactivated to provide good adhesion and hot/wet durability with the sol-gel.
4.11 Corrosion Analysis of Bondline Studies were undertaken to determine whether elimination of an oxide layer or active inhibitors at the interface through use of the uninhibited sol-gel is going to cause corrosion protection concerns for the bonded system.
4.11.1 Baseline Corrosion Analysis
To determine the effect of corrosion on the bondline of aluminum specimens, environmental exposure corrosion tests were run. In Boeing’s 250°F-cure bond primer specification, BMS 5-89, salt spray, filiform, and humidity testing requirements are required. In the salt spray and humidity tests, specimens are surface prepped, coated with bond primer, and scribed. In the filiform corrosion test, specimens are surface prepped, primed with bond primer, and coated with an exterior gloss white topcoat. The test matrix is shown in Table 4.11-1.
The filiform test involves scribing the 4 inch x 6 inch specimens with an X-scribe. The specimens are then exposed to 12 Normal HCl vapor for one hour at 75±5°F. Immediately following exposure, they are placed in a 100% relative humidity environment at 120°F for 30 days. At the completion of the test, specimens are tested for scribed adhesion per BSS 7225, Class3, and also examined for filiform corrosion. The passing criteria for filiform corrosion are no blisters, corrosion, or loss of adhesion beyond 0.125 inches from the scribe.
50% coh
55% coh
95% coh
92% coh 90% coh
90% coh 57% coh
32% coh
82% coh
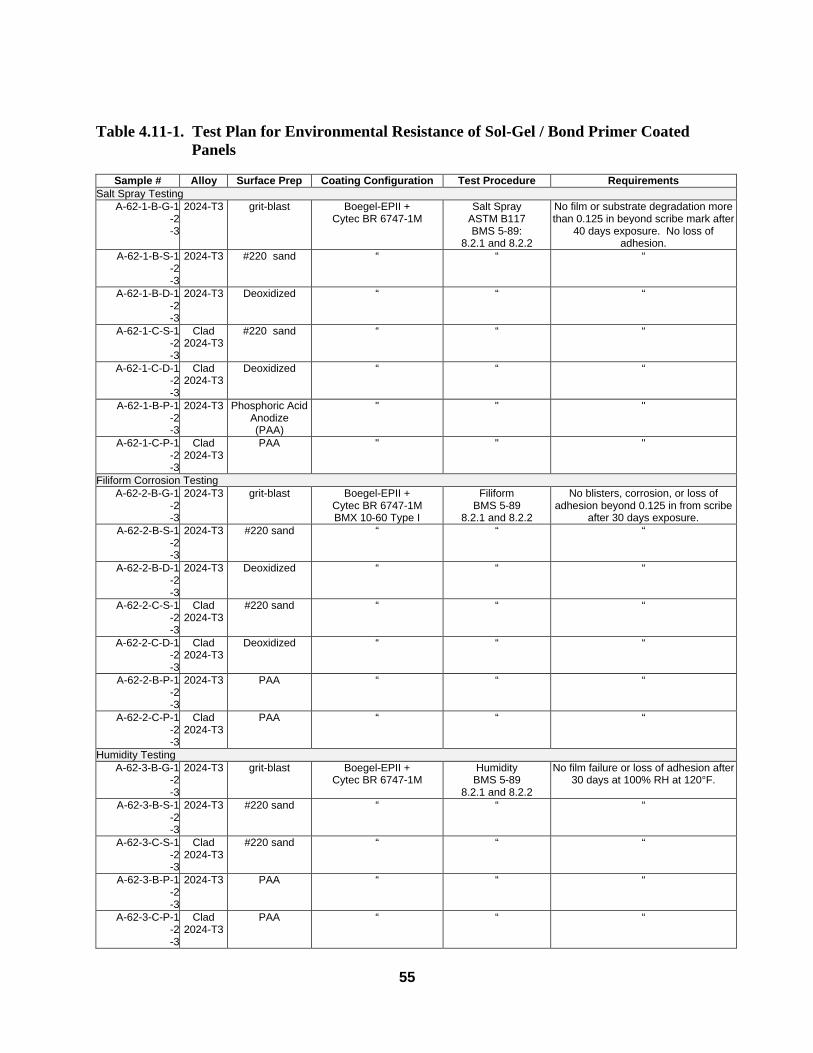
55
Table 4.11-1. Test Plan for Environmental Resistance of Sol-Gel / Bond Primer Coated
Panels
Sample # Alloy Surface Prep Coating Configuration Test Procedure Requirements Salt Spray Testing
A-62-1-B-G-1-2-3
2024-T3 grit-blast Boegel-EPII + Cytec BR 6747-1M
Salt Spray ASTM B117 BMS 5-89:
8.2.1 and 8.2.2
No film or substrate degradation more than 0.125 in beyond scribe mark after
40 days exposure. No loss of adhesion.
A-62-1-B-S-1-2-3
2024-T3 #220 sand “ “ “
A-62-1-B-D-1-2-3
2024-T3 Deoxidized “ “ “
A-62-1-C-S-1-2-3
Clad 2024-T3
#220 sand “ “ “
A-62-1-C-D-1-2-3
Clad 2024-T3
Deoxidized “ “ “
A-62-1-B-P-1-2-3
2024-T3 Phosphoric Acid Anodize (PAA)
" " "
A-62-1-C-P-1-2-3
Clad 2024-T3
PAA " " "
Filiform Corrosion Testing A-62-2-B-G-1
-2-3
2024-T3 grit-blast Boegel-EPII + Cytec BR 6747-1M BMX 10-60 Type I
Filiform BMS 5-89
8.2.1 and 8.2.2
No blisters, corrosion, or loss of adhesion beyond 0.125 in from scribe
after 30 days exposure. A-62-2-B-S-1
-2-3
2024-T3 #220 sand “ “ “
A-62-2-B-D-1-2-3
2024-T3 Deoxidized “ “ “
A-62-2-C-S-1-2-3
Clad 2024-T3
#220 sand “ “ “
A-62-2-C-D-1-2-3
Clad 2024-T3
Deoxidized “ “ “
A-62-2-B-P-1-2-3
2024-T3 PAA “ “ “
A-62-2-C-P-1-2-3
Clad 2024-T3
PAA “ “ “
Humidity Testing A-62-3-B-G-1
-2-3
2024-T3 grit-blast Boegel-EPII + Cytec BR 6747-1M
Humidity BMS 5-89
8.2.1 and 8.2.2
No film failure or loss of adhesion after 30 days at 100% RH at 120°F.
A-62-3-B-S-1-2-3
2024-T3 #220 sand “ “ “
A-62-3-C-S-1-2-3
Clad 2024-T3
#220 sand “ “ “
A-62-3-B-P-1-2-3
2024-T3 PAA “ “ “
A-62-3-C-P-1-2-3
Clad 2024-T3
PAA “ “ “

56
After 30 days of humidity exposure, the samples all passed the scribe adhesion test, as specified in the test document. After exposure to filiform conditions, the sol-gelled panels that were grit-blasted passed the test criteria. Sol-gelled panels that had been sanded or deoxidized prior to sol-gelling, failed the filiform criteria. The filiform panels mostly followed the trend whereby the pretreatment of the sol-gelled panels affected the results as follows: the grit-blast panels performed best, followed by the sanded specimens, followed by the chemically deoxidized specimens. It did not make a big performance difference, as a whole, whether the panels were 2024-T3 bare or clad. The cause of this performance trend is unclear at this point. Further studies on variations of the sol-gel treatment and pretreatment conditions will be required to understand this phenomenon. Phosphoric acid anodize controls all passed this test criteria.
4.11.2 Nonchromate Inhibitor Incorporation into the Bondline
Wedge crack extension and filiform corrosion testing were performed on bare aluminum alloy 2024-T3 specimens prepared with the addition of several candidate nonchromated inhibitors, according to Table 4.11-2. Wedge crack extension testing was carried out on grit-blasted specimens treated with Boegel-EPII, primed with Cytec BR6747-1, and bonded with 3M AF163-2M. Filiform corrosion testing was carried out per BMS5-89 sections 8.2.1 and 8.2.2. The panels were deoxidized in Boeclene per BAC5765, treated with Boegel-EPII, primed with Cytec BR6747-1, and topcoated with BMS10-60 gloss white. The wedge crack extension results are illustrated in Figure 4.11-2. Two of the five specimens from each panel were removed after 30 days of exposure to determine the failure mode. The average failure mode for all specimens was >95% cohesive. The filiform corrosion results are given in Figure 4.11-3. One of the remaining three specimens was removed after 10 weeks of exposure. The failure mode for all specimens was >95% cohesive.
Table 4.11-2. Bondline Inhibitor Incorporation Matrix
Specimen Inhibitor 1 Amount Inhibitor 2 Amount Other pH
B-31-C None N/A None N/A 3.66
B-31-N None N/A None N/A 7.01
B-31-928 Cobratec 928 0.05 mL None N/A add to neutral sol-gel 6.53
B-31-BM barium metaborate 0.0519 g None N/A pH 2.9 for wedges 3.51
B-31-CA cerium acetate 0.0519 g None N/A 2.97
B-31-CO cerium oxalate 0.0519 g None N/A 2.9
B-31-B benzotriazole 0.0519 g None N/A 2.9
B-31-HTP 4-hydroxythiophenol 0.0519 g None N/A 3.02
B-31-EG ethylene glycol monoethyl ether 12.6 mL None N/A only 1.2 mL GAA 3.69
B-31-HTP+CA 4-hydroxythiophenol 0.0260 g cerium acetate 0.0260 g 3.2
B-31-HTP+BM 4-hydroxythiophenol 0.0260 g barium metaborate 0.0260 g 3.29
B-31-928+CO Cobratec 928 0.0240 mL cerium oxalate 0.0260 g add to neutral sol-gel 6.45

57
1.15
1.20
1.25
1.30
1.35
1.40
1.45
1.50
0 500 1000 1500 2000
Hours of Exposure to 140°F and 98% Relative Humidity
To
tal C
rack
Len
gth
, in
ches
B-31-C
B-31-N
B-31-928
B-31-BM
B-31-CA
B-31-CO
B-31-B
B-31-HTP
B-31-EG
B-31-HTP+CA
B-31-HTP+BM
B-31-928+CO
Figure 4.11-2. Total crack length for B-31 series panels with inhibitors
incorporated in the bondline
0.000
0.050
0.100
0.150
0.200
0.250
0.300
none
, pH 3.
66
none
, pH 7
Cobrat
ec 92
8
bariu
m meta
borat
e
ceriu
m aceta
te
ceriu
m oxala
te
benz
otriaz
ole
4-hyd
roxyth
iophe
nol
glyco
l ethe
r (les
s GAA)
HTP +
ceriu
m aceta
te
HTP +
bariu
m meta
borat
e
928 +
ceriu
m oxala
te
Inhibitor
Fili
form
Ext
ensi
on
fro
m S
crib
e,
inch
es
012345678910
Filifo
rm R
ating
Average Extension from Scribe(inches)
Average Filiform Rating
Figure 4.11-3. Filiform corrosion results for B-31 series panels with inhibitors incorporated in the bondline
The results of these inhibitor incorporation studies are somewhat inconclusive, and clearly more work is needed in the area to understand the complex mechanistic implications of adding an inhibitor to the system. However, they do indicate that it is indeed feasible to incorporate an inhibitor into these sol-gel networks, and that the chemistry of the interface can be manipulated.
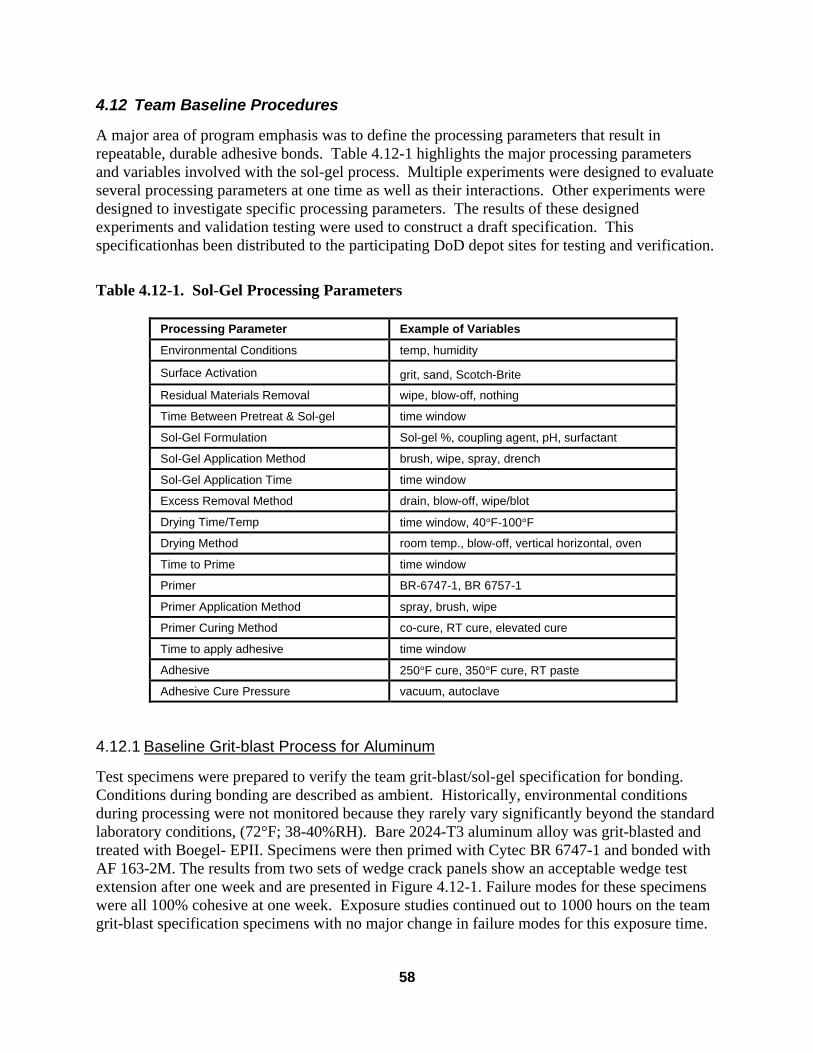
58
4.12 Team Baseline Procedures
A major area of program emphasis was to define the processing parameters that result in repeatable, durable adhesive bonds. Table 4.12-1 highlights the major processing parameters and variables involved with the sol-gel process. Multiple experiments were designed to evaluate several processing parameters at one time as well as their interactions. Other experiments were designed to investigate specific processing parameters. The results of these designed experiments and validation testing were used to construct a draft specification. This specificationhas been distributed to the participating DoD depot sites for testing and verification.
Table 4.12-1. Sol-Gel Processing Parameters
Processing Parameter Example of Variables
Environmental Conditions temp, humidity
Surface Activation grit, sand, Scotch-Brite
Residual Materials Removal wipe, blow-off, nothing
Time Between Pretreat & Sol-gel time window
Sol-Gel Formulation Sol-gel %, coupling agent, pH, surfactant
Sol-Gel Application Method brush, wipe, spray, drench
Sol-Gel Application Time time window
Excess Removal Method drain, blow-off, wipe/blot
Drying Time/Temp time window, 40°F-100°F
Drying Method room temp., blow-off, vertical horizontal, oven
Time to Prime time window
Primer BR-6747-1, BR 6757-1
Primer Application Method spray, brush, wipe
Primer Curing Method co-cure, RT cure, elevated cure
Time to apply adhesive time window
Adhesive 250°F cure, 350°F cure, RT paste
Adhesive Cure Pressure vacuum, autoclave
4.12.1 Baseline Grit-blast Process for Aluminum
Test specimens were prepared to verify the team grit-blast/sol-gel specification for bonding. Conditions during bonding are described as ambient. Historically, environmental conditions during processing were not monitored because they rarely vary significantly beyond the standard laboratory conditions, (72°F; 38-40%RH). Bare 2024-T3 aluminum alloy was grit-blasted and treated with Boegel- EPII. Specimens were then primed with Cytec BR 6747-1 and bonded with AF 163-2M. The results from two sets of wedge crack panels show an acceptable wedge test extension after one week and are presented in Figure 4.12-1. Failure modes for these specimens were all 100% cohesive at one week. Exposure studies continued out to 1000 hours on the team grit-blast specification specimens with no major change in failure modes for this exposure time.

59
1.00
1.10
1.20
1.30
1.40
1.50
0 200 400 600 800 1000 1200
Hrs of Exposure to 140°F and >98% RH
To
tal C
rack
Len
gth
(in
ches
)
AA03-1
AA03-2
Figure 4.12-1. Grit-blast 2024-T3 team process verification The team grit-blast testing was repeated using Al 7075-T6 to provide data for 7000 series aluminum in the Team process. The material was 180# grit-blasted, coated with Boegel EPII, primed with Cytec Fiberite BR 6747-1 and bonded with FM 163-2. The results are displayed in Figure 4.12-2. Initial crack length is longer than 2024-T3, as expected, and crack extension at 672 hours is somewhat less. The failure mode of two pulled samples revealed 100% cohesive failure.
1.1
1.15
1.2
1.25
1.3
1.35
1.4
1.45
0 200 400 600 800 1000 1200
Hrs of Exposure to 140°F and >98%RH
To
tal C
rack
Len
gth
(in
ches
)
C21-9C21-10
Figure 4.12-2. Team grit-blast Al 7075-T3

60
4.12.2 Team Sanded Specimens
Sanded Al 2024-T3 wedge panels were sent to each Team member for hot/wet exposure in each facility. All panels were sanded, sol-gelled, primed, bonded and cut at Boeing. The sanding was performed using 3M #220 Al oxide sandpaper and the sol-gel applied within 30 minutes of sanding. The panels were then primed with Cytec BR 6747-1 and bonded with AF163-2M. The panels were cut into specimens prior to shipping.
Wedge crack extension results for the two Boeing tested sets as of 672 hours exposure are shown in Figure 4.12-3. The data is consistent with previous values for sanded Al 2024-T3 and reproducibility between the sets is satisfactory. Representative specimens were pulled apart to reveal the failure mode, which was found to be approximately 90% cohesive failure.
0.80
1.00
1.20
1.40
1.60
1.80
0 250 500 750 1000 1250
Hrs of Exposure to 140°F & >98% RH
To
tal C
rack
Len
gth
(in
ches
)
C21-1
C21-2
Figure 4.12-3. Boeing-tested team sanded results
The results of this study were rather mixed. The results from all of the Team members varied, with the amount of cohesive failure mode in some cases as low as 50%. The 50% adhesive failure in these cases was typically at the sol-gel to metal interface. The average cohesive failure mode was approximately 90%. When Team members tried to reproduce the sanding process in their own laboratories, there was even greater variability in the results. This variability is most likely due to processing conditions, including abrasive paper materials and sanding tools. Different papers can leave residue on the surface of the metal, which can interfere with the crosslinking of the sol-gel to the metal oxide. Some abrasive papers can yield adequate performance under certain conditions, where the rpm level of the tool is controlled or similar process parameters. Current efforts are focused at delineating the process parameter windows around the abrasive paper sanding deoxidation steps and materials and will incorporate these lessons-learned into the eventual specifications.

61
4.12.3 Team Cocured Sanded Specimens
Sanded Al 2024-T3 wedge panels were sent to each Team member for hot/wet exposure in each facility. The C58 series of panels were sanded, sol-gelled, and primed at Boeing. The sanding was done using 3M #220 Al oxide sandpaper and sol-gel applied within 30 minutes of sanding. The panels were then primed with Cytec BR6747-1. The primer was allowed to dry at room temperature with no heat curing, and then was co-cured during bonding with the AF163-2. Bonded panels were then sent to Team members for testing.
The initial set, C58, was not immediately bonded due to a lab schedule conflict, so an additional set was prepared (C58B). The C58 panels were assembled and bagged under vacuum for one week, then both sets were bonded all together. Additionally, during the course of the humidity exposure testing, an earthquake shut down the power and water to the unit, causing a period in which there was no elevated temperature or humidity exposure.
Wedge crack extension results of the Boeing tested sets (C58 & C58B series) at 168 hours are shown in Figure 4.12-4. Representative specimens were pulled apart after 168 hours of exposure to reveal the failure mode. The samples were removed from the humidity chamber before the customary length of testing, because the earthquake in Seattle caused the humidity chambers to lose water and power for an unknown period of time. The specimens were removed from the hot/wet chamber after several days of no exposure, at least no humidity, once the lab was reopened. The C58 specimens, in which the bonding was delayed for one week after priming, averaged 79% cohesive failure mode and C58B, which were bonded the same day, averaged 91% cohesive failure, signifying the importance of prompt bonding of cocured specimens.
0.8
1
1.2
1.4
1.6
1.8
0 50 100 150 200
Hrs of Exposure to 140°F and >98% RH
To
tal C
rack
Len
gth
(in
ches
)
C58-1
C58-2
C58B-1
C58B-2
Figure 4.12-4. Boeing-tested Team sanded cocure results

62
4.12.4 Wedge Test at 120°F
Baseline sol-gel panels (#180 grit-blast, #220 sanded, and Scotch-Brite abraded) were prepared and tested at 120°F/98% RH in order to gather some comparative failure mode data at these temperatures. The panels were abraded with #220 sandpaper, coated with Boegel-EPII, primed with Cytec BR 6747-1, and bonded with AF 163-2M. Testing was delayed for over a month due to mechanical difficulties with the humidity chamber. The results are shown in Figure 4.12-5.
1.15
1.20
1.25
1.30
1.35
1.40
1.45
0 200 400 600 800 1000 1200
Hours of Exposure to 120°F and 98% Relative Humidity
To
tal C
rack
Len
gth
, in
ches
#180 grit blast
#220 sanded
MED Scotch-Brite
Figure 4.12-5. Total crack length of baseline sol-gel coated panels tested at 120°F/98% RH
100% cohesive
99% cohesive
96% cohesive
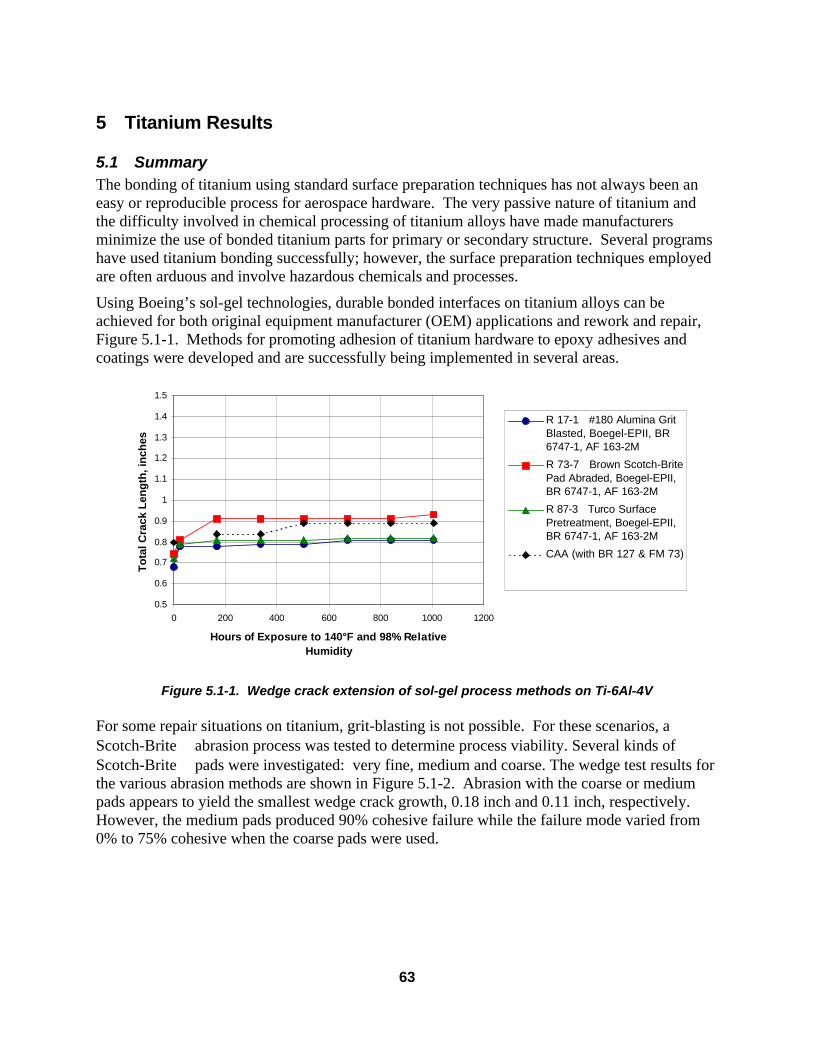
63
5 Titanium Results
5.1 Summary The bonding of titanium using standard surface preparation techniques has not always been an easy or reproducible process for aerospace hardware. The very passive nature of titanium and the difficulty involved in chemical processing of titanium alloys have made manufacturers minimize the use of bonded titanium parts for primary or secondary structure. Several programs have used titanium bonding successfully; however, the surface preparation techniques employed are often arduous and involve hazardous chemicals and processes.
Using Boeing’s sol-gel technologies, durable bonded interfaces on titanium alloys can be achieved for both original equipment manufacturer (OEM) applications and rework and repair, Figure 5.1-1. Methods for promoting adhesion of titanium hardware to epoxy adhesives and coatings were developed and are successfully being implemented in several areas.
0.5
0.6
0.7
0.8
0.9
1
1.1
1.2
1.3
1.4
1.5
0 200 400 600 800 1000 1200
Hours of Exposure to 140°F and 98% Relative Humidity
To
tal C
rack
Len
gth
, in
ches
R 17-1 #180 Alumina GritBlasted, Boegel-EPII, BR6747-1, AF 163-2M
R 73-7 Brown Scotch-BritePad Abraded, Boegel-EPII,BR 6747-1, AF 163-2M
R 87-3 Turco SurfacePretreatment, Boegel-EPII,BR 6747-1, AF 163-2M
CAA (with BR 127 & FM 73)
Figure 5.1-1. Wedge crack extension of sol-gel process methods on Ti-6Al-4V
For some repair situations on titanium, grit-blasting is not possible. For these scenarios, a Scotch-Brite abrasion process was tested to determine process viability. Several kinds of Scotch-Brite pads were investigated: very fine, medium and coarse. The wedge test results for the various abrasion methods are shown in Figure 5.1-2. Abrasion with the coarse or medium pads appears to yield the smallest wedge crack growth, 0.18 inch and 0.11 inch, respectively. However, the medium pads produced 90% cohesive failure while the failure mode varied from 0% to 75% cohesive when the coarse pads were used.
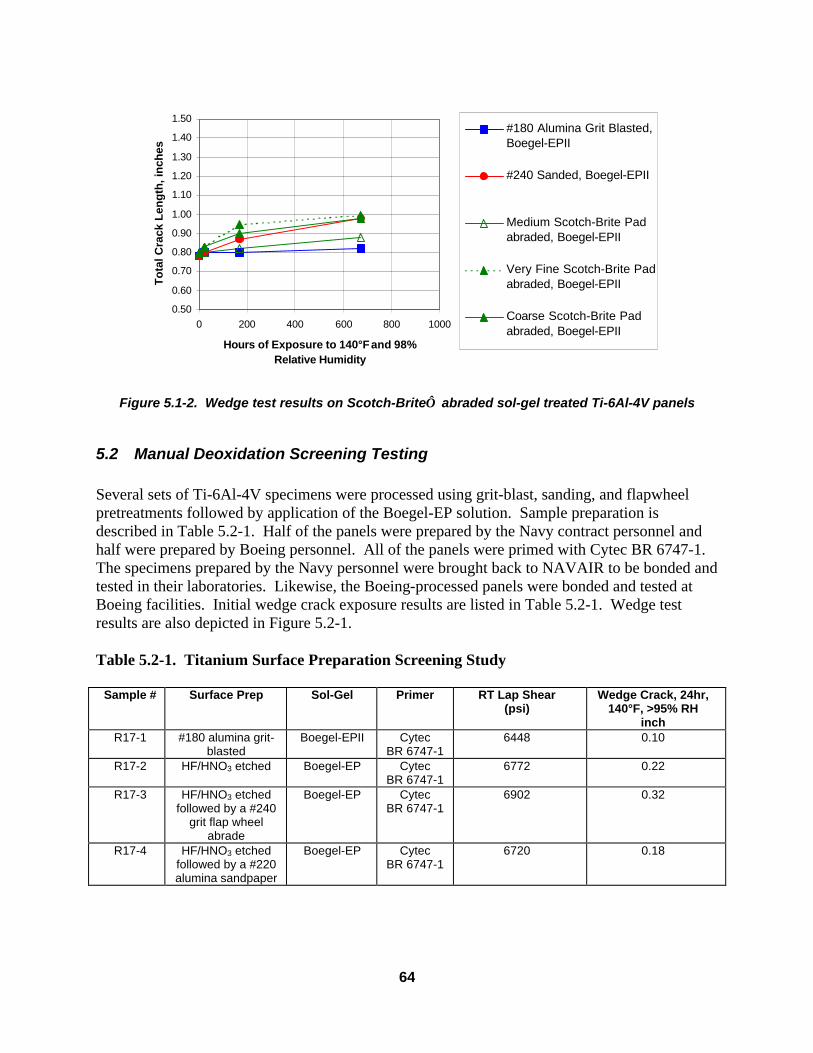
64
0.50
0.60
0.70
0.80
0.90
1.00
1.10
1.20
1.30
1.40
1.50
0 200 400 600 800 1000
Hours of Exposure to 140°F and 98% Relative Humidity
To
tal C
rack
Len
gth
, in
ches
#180 Alumina Grit Blasted,Boegel-EPII
#240 Sanded, Boegel-EPII
Medium Scotch-Brite Padabraded, Boegel-EPII
Very Fine Scotch-Brite Padabraded, Boegel-EPII
Coarse Scotch-Brite Padabraded, Boegel-EPII
Figure 5.1-2. Wedge test results on Scotch-Brite abraded sol-gel treated Ti-6Al-4V panels
5.2 Manual Deoxidation Screening Testing Several sets of Ti-6Al-4V specimens were processed using grit-blast, sanding, and flapwheel pretreatments followed by application of the Boegel-EP solution. Sample preparation is described in Table 5.2-1. Half of the panels were prepared by the Navy contract personnel and half were prepared by Boeing personnel. All of the panels were primed with Cytec BR 6747-1. The specimens prepared by the Navy personnel were brought back to NAVAIR to be bonded and tested in their laboratories. Likewise, the Boeing-processed panels were bonded and tested at Boeing facilities. Initial wedge crack exposure results are listed in Table 5.2-1. Wedge test results are also depicted in Figure 5.2-1. Table 5.2-1. Titanium Surface Preparation Screening Study
Sample # Surface Prep Sol-Gel Primer RT Lap Shear (psi)
Wedge Crack, 24hr, 140°F, >95% RH
inch R17-1 #180 alumina grit-
blasted Boegel-EPII Cytec
BR 6747-1 6448 0.10
R17-2 HF/HNO3 etched Boegel-EP Cytec BR 6747-1
6772 0.22
R17-3 HF/HNO3 etched followed by a #240
grit flap wheel abrade
Boegel-EP Cytec BR 6747-1
6902 0.32
R17-4 HF/HNO3 etched followed by a #220 alumina sandpaper
Boegel-EP Cytec BR 6747-1
6720 0.18

65
0
0.2
0.4
0.6
0.8
1
1.2
1.4
1.6
1.8
2
0 100 200 300 400 500 600 700 800
Hrs of Exposure to 140°F and >98% Relative Humidity
To
tal C
rack
Len
gth
(n
ches
) R 17-1 #180Alumina Grit Blasted
R 17-2 HF/HNO3Etched
R 17-3 #240Alumina Flap WheelAbraded
R 17-4 #220Alumina SandpaperSanded
Figure 5.2-1. Wedge test results on titanium surface preparation screening study
The initial crack length was within the acceptable range for all of the specimens with the exception of the HF/HNO3 etched specimens. In that case, the initial crack was over twice as long as is typical, and the crack length is increasing in hot/wet exposure. In the past, Boeing has not always been able to achieve reproducible results on acid etched panels, but have not yet attributed the performance to any one particular parameter.
5.3 Grit-Blast Variations
5.3.1 Grit-Blast Parameters
A series of #180 alumina grit-blasted titanium wedge test specimens were prepared to evaluate the effects of using cleaned and degreased Ti-6Al-4V panels rather than HF/HNO3 deoxidized panels, the effect of blasting from a distance of either 4 inches or 6 inches and the effect of air drying (ambient curing) or heat curing of the applied Boegel-EPII coating. The details of the test matrix are shown in Table 5.3-1.
All grit-blasting was performed at an angle of 45°. A Boegel-EPII solution was brush-applied to each of the substrates for two minutes. All samples were coated with BR 6747-1 using a HVLP spray gun. Table 13 lists further preparation details of this sample series.
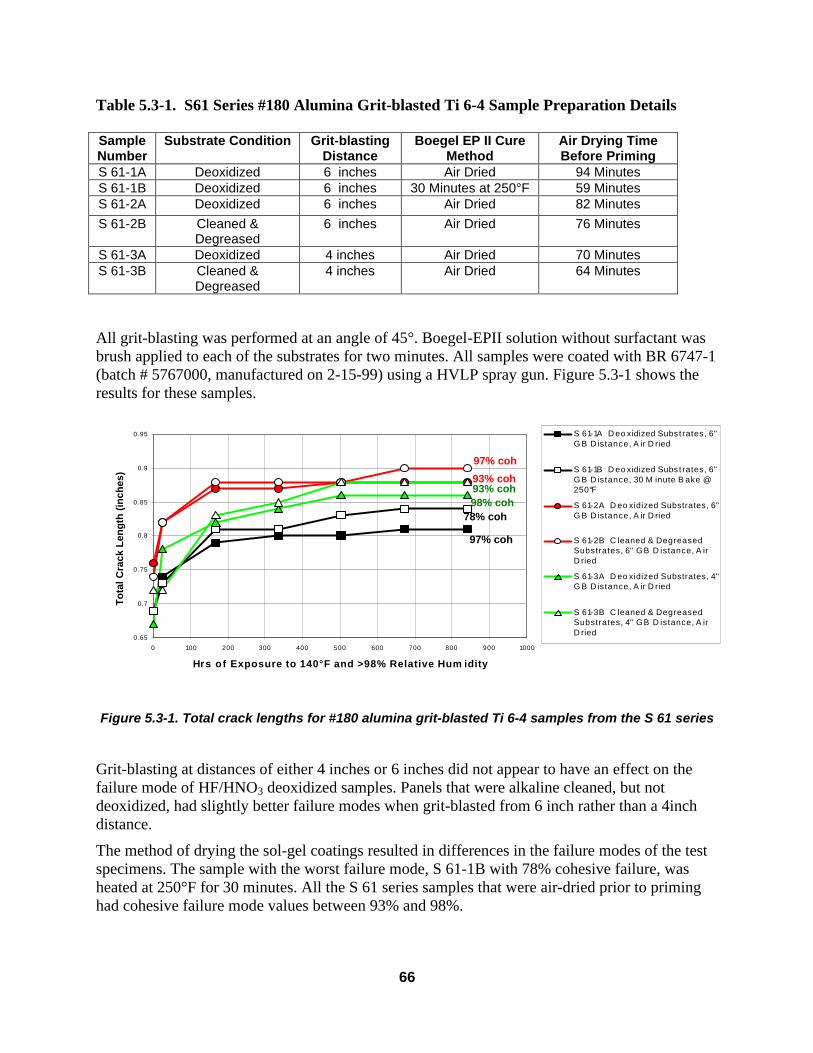
66
Table 5.3-1. S61 Series #180 Alumina Grit-blasted Ti 6-4 Sample Preparation Details Sample Number
Substrate Condition Grit-blasting Distance
Boegel EP II Cure Method
Air Drying Time Before Priming
S 61-1A Deoxidized 6 inches Air Dried 94 Minutes S 61-1B Deoxidized 6 inches 30 Minutes at 250°F 59 Minutes S 61-2A Deoxidized 6 inches Air Dried 82 Minutes S 61-2B Cleaned &
Degreased 6 inches Air Dried 76 Minutes
S 61-3A Deoxidized 4 inches Air Dried 70 Minutes S 61-3B Cleaned &
Degreased 4 inches Air Dried 64 Minutes
All grit-blasting was performed at an angle of 45°. Boegel-EPII solution without surfactant was brush applied to each of the substrates for two minutes. All samples were coated with BR 6747-1 (batch # 5767000, manufactured on 2-15-99) using a HVLP spray gun. Figure 5.3-1 shows the results for these samples.
0.65
0.7
0.75
0.8
0.85
0.9
0.95
0 100 200 300 400 500 600 700 800 900 1000
Hrs of Exposure to 140°F and >98% Relative Hum idity
To
tal C
rack
Len
gth
(in
ches
)
S 61-1A D eo xidized Subs t rates, 6"G B D istance, A ir D ried
S 61-1B D eo xidized Subs t rates, 6"G B D istance, 30 M inute B ake @250°F
S 61-2A D eo xidized Substrates, 6"G B D istance, A ir D ried
S 61-2B C leaned & DegreasedSubstrates, 6" GB D istance, A irD ried
S 61-3A D eo xidized Substrates, 4"G B D istance, A ir D ried
S 61-3B C leaned & DegreasedSubstrates, 4" GB D istance, A irD ried
Figure 5.3-1. Total crack lengths for #180 alumina grit-blasted Ti 6-4 samples from the S 61 series
Grit-blasting at distances of either 4 inches or 6 inches did not appear to have an effect on the failure mode of HF/HNO3 deoxidized samples. Panels that were alkaline cleaned, but not deoxidized, had slightly better failure modes when grit-blasted from 6 inch rather than a 4inch distance.
The method of drying the sol-gel coatings resulted in differences in the failure modes of the test specimens. The sample with the worst failure mode, S 61-1B with 78% cohesive failure, was heated at 250°F for 30 minutes. All the S 61 series samples that were air-dried prior to priming had cohesive failure mode values between 93% and 98%.
93% coh
97% coh
93% coh
97% coh
98% coh 78% coh

67
5.3.2 Wet Grit-Blast Study Grit-blasting in a unit where water is added to the grit-blast media and bombarded on the surface was evaluated as an alternate grit-blast technique. By adding water to the slurry, it is possible that less grit will be imbedded in the metal surface. Surface profilometry was performed on the two wet grit-blasted panels (C79-WG) produced by the Navy. The surface roughness was 31-32 Ra. The panels were coated with sol-gel and primed with Cytec BR6747-1. The wedge test results for the wet grit-blasted Ti-6Al-4V panels (C79-WG) are given in Figure 5.3-2. The specimens were wet grit-blasted weeks before they were sol-gelled and primed, which may account for the poor failure mode.
0.50
0.60
0.70
0.80
0.90
1.00
0 200 400 600 800 1000 1200
Hours of Exposure to 140°F and >98% Relative Humidity
To
tal C
rack
Len
gth
(in
ches
)
Figure 5.3-2. Total crack length for Ti-6Al-4V wet grit-blasted specimen (C79-WG)
5.3.3 Sanding Variations
The series of test specimens R45-6 were prepared by sanding HF/HNO3 etched panels with two pieces of #400 SiC paper per panel. Each piece of sandpaper was used for 30 seconds and then discarded. An electric orbital sander was used during the sanding process. The performance of these and other related samples is shown in Figure 5.3-3.
The performance of the sanded R45-6 samples also is inferior to that of the R17-4 samples, the first set of sanded Ti 6Al-4V wedge crack specimens prepared under this contract. The HF/HNO3 etched panels used in the R 17-4 samples were each sanded for 3 minutes with one piece of #220 Al2O3 sandpaper using the same electric sander used on the R 45-6 samples.
These first attempts to roughen Ti 6Al-4V panels with sanding methods deliberately made use of the same abrading procedures used to prepare 2024-T3 aluminum wedge crack samples. The results reported above may indicate that either coarser grit sandpapers, longer periods of sanding or increased/decreased pressure during the sanding process may be required with the titanium substrates.
60% coh

68
0
0.2
0.4
0.6
0.8
1
1.2
1.4
1.6
1.8
2
0 200 400 600 800 1000 1200
Hrs of Exposure to 140°F and >98% RH
To
tal C
rack
Len
gth
(in
ches
) R 45-6 Sanded Twice With TwoPieces of # 400 SiC Paper /Panel, 30 Seconds / Piece / Panel
R 17-4 Sanded Once With OnePiece # 220 Al2O3 Paper / Panel,180 Seconds / Piece / Panel
R 17-2 HF/HNO3 Etched, 15minute DI H2O Soak Before Sol-Gel Coat ing
R 17-1 # 180 Alumina GritBlasted
Figure 5.3-3. Comparison of wedge crack test results for Ti- 6Al-4V panels given
different surface preparation treatments
5.3.4 Scotch-Brite Roloc Disc Abrasion Testing Roloc disc tools fitted onto a die grinder were tested as methods of abrasion for the titanium alloy panels. The titanium wedge crack samples were abraded with either coarse Scotch-Brite Roloc surface conditioning discs or #240 alumina sandpaper Roloc discs. The wedge test specimens were tested at 140°F and 98% relative humidity, Figure 5.3-4. The total crack length of the coarse Scotch-Brite Roloc disc abraded sample was 0.91 inches after one month, making it the best performing set of manually abraded, non-grit-blasted titanium samples prepared in this program. Performance of the other set of titanium samples that were abraded with #240 sandpaper is considerably worse, with a total crack length of 1.19 inches and an increase in initial crack length of 0.40 inches.

69
0
0.2
0.4
0.6
0.8
1
1.2
1.4
0 200 400 600 800 1000 1200
Hours of Exposure to 140°F and >98% RH
To
tal C
rack
Len
gth
(in
ches
)
R 73-6 #240Al2O3 Roloc DiscAbraded
R 73-7 Brow nCRS ScotchbriteRoloc DiscAbraded
Figure 5.3-4. Wedge crack test results for Ti-6Al-4V substrates roughened using different abrasive media prior to sol-gel coating
5.3.5 Revalidation of Scotch-Brite Processing Two sets of specimens were prepared by deoxidizing the surface with coarse, brown Scotch-Brite Roloc disc abrasion tools, applying a Boegel-EPII sol-gel coating, and priming with Cytec BR 6747-1 primer. The first sample set was prepared using the same surface preparation procedures used on Ti-6Al-4V sample R 73-7 in order to attempt to duplicate that sample’s performance. On both of these samples, one coarse, brown Scotch-Brite Roloc disc was used to abrade a single 6 inch x 6 inch panel for three minutes using an air driven die grinder.
The second set of titanium samples was prepared using two of the coarse, brown Scotch-Brite Roloc discs per 6 inch x 6 inch panel for 90 seconds each during the abrasion process. The use of two discs rather than just one over a 3 minute period of abrasion was tested to determine if a single disc was being worn out before the end of the 3 minute abrasion treatment and adversely affecting wedge crack extension performance.
During the abrasion of both of the titanium sample sets, numerous dark specks appeared on the panel surface. These spots seemed to be oily in nature and could be easily smeared. The spots appeared to be far more obvious on Scotch-Brite Roloc disc abraded titanium samples than they were on Scotch-Brite Roloc disc abraded aluminum panels. Whether this was simple coincidence or the result of actual physical differences in the abrasion of titanium and aluminum panels with Scotch-Brite Roloc discs is not known. Prior to the brush application of sol-gel solution, these specks were removed by rubbing the panels with wipe tissues soaked with 2-propanol. These panels were subsequently sprayed with BR 6747-1 primer and bonded with AF 163-2M.
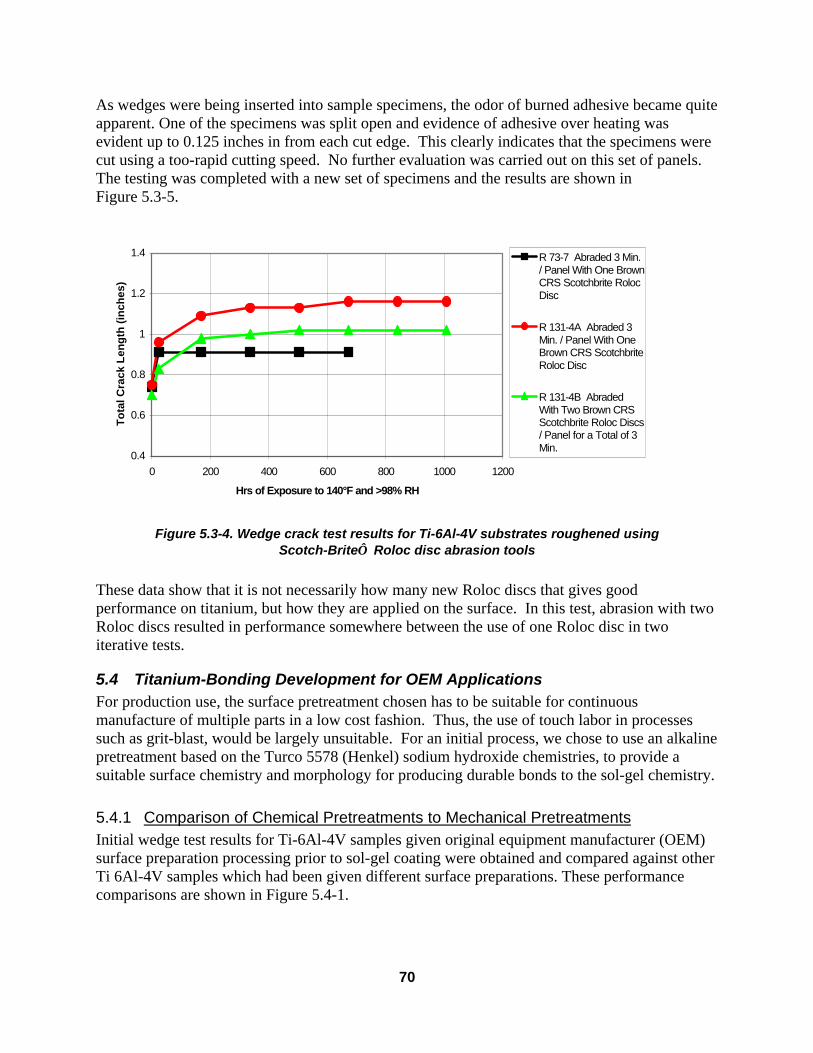
70
As wedges were being inserted into sample specimens, the odor of burned adhesive became quite apparent. One of the specimens was split open and evidence of adhesive over heating was evident up to 0.125 inches in from each cut edge. This clearly indicates that the specimens were cut using a too-rapid cutting speed. No further evaluation was carried out on this set of panels. The testing was completed with a new set of specimens and the results are shown in Figure 5.3-5.
0.4
0.6
0.8
1
1.2
1.4
0 200 400 600 800 1000 1200
Hrs of Exposure to 140°F and >98% RH
To
tal C
rack
Len
gth
(in
ches
)
R 73-7 Abraded 3 Min./ Panel With One BrownCRS Scotchbrite RolocDisc
R 131-4A Abraded 3Min. / Panel With OneBrown CRS ScotchbriteRoloc Disc
R 131-4B AbradedWith Two Brown CRSScotchbrite Roloc Discs/ Panel for a Total of 3Min.
Figure 5.3-4. Wedge crack test results for Ti-6Al-4V substrates roughened using
Scotch-Brite Roloc disc abrasion tools
These data show that it is not necessarily how many new Roloc discs that gives good performance on titanium, but how they are applied on the surface. In this test, abrasion with two Roloc discs resulted in performance somewhere between the use of one Roloc disc in two iterative tests.
5.4 Titanium-Bonding Development for OEM Applications For production use, the surface pretreatment chosen has to be suitable for continuous manufacture of multiple parts in a low cost fashion. Thus, the use of touch labor in processes such as grit-blast, would be largely unsuitable. For an initial process, we chose to use an alkaline pretreatment based on the Turco 5578 (Henkel) sodium hydroxide chemistries, to provide a suitable surface chemistry and morphology for producing durable bonds to the sol-gel chemistry.
5.4.1 Comparison of Chemical Pretreatments to Mechanical Pretreatments Initial wedge test results for Ti-6Al-4V samples given original equipment manufacturer (OEM) surface preparation processing prior to sol-gel coating were obtained and compared against other Ti 6Al-4V samples which had been given different surface preparations. These performance comparisons are shown in Figure 5.4-1.
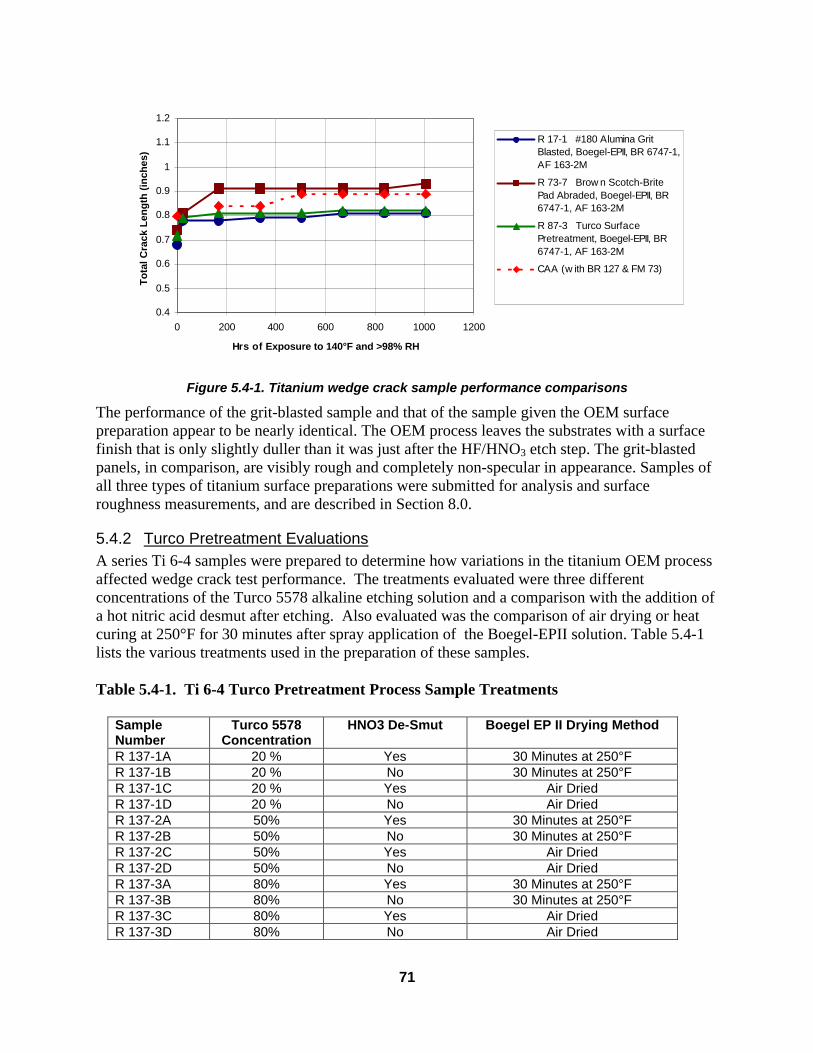
71
0.4
0.5
0.6
0.7
0.8
0.9
1
1.1
1.2
0 200 400 600 800 1000 1200
Hrs of Exposure to 140°F and >98% RH
To
tal C
rack
Len
gth
(in
ches
)R 17-1 #180 Alumina GritBlasted, Boegel-EPII, BR 6747-1,AF 163-2M
R 73-7 Brow n Scotch-BritePad Abraded, Boegel-EPII, BR6747-1, AF 163-2M
R 87-3 Turco SurfacePretreatment, Boegel-EPII, BR6747-1, AF 163-2M
CAA (w ith BR 127 & FM 73)
Figure 5.4-1. Titanium wedge crack sample performance comparisons
The performance of the grit-blasted sample and that of the sample given the OEM surface preparation appear to be nearly identical. The OEM process leaves the substrates with a surface finish that is only slightly duller than it was just after the HF/HNO3 etch step. The grit-blasted panels, in comparison, are visibly rough and completely non-specular in appearance. Samples of all three types of titanium surface preparations were submitted for analysis and surface roughness measurements, and are described in Section 8.0.
5.4.2 Turco Pretreatment Evaluations A series Ti 6-4 samples were prepared to determine how variations in the titanium OEM process affected wedge crack test performance. The treatments evaluated were three different concentrations of the Turco 5578 alkaline etching solution and a comparison with the addition of a hot nitric acid desmut after etching. Also evaluated was the comparison of air drying or heat curing at 250°F for 30 minutes after spray application of the Boegel-EPII solution. Table 5.4-1 lists the various treatments used in the preparation of these samples. Table 5.4-1. Ti 6-4 Turco Pretreatment Process Sample Treatments
Sample Number
Turco 5578 Concentration
HNO3 De-Smut Boegel EP II Drying Method
R 137-1A 20 % Yes 30 Minutes at 250°F R 137-1B 20 % No 30 Minutes at 250°F R 137-1C 20 % Yes Air Dried R 137-1D 20 % No Air Dried R 137-2A 50% Yes 30 Minutes at 250°F R 137-2B 50% No 30 Minutes at 250°F R 137-2C 50% Yes Air Dried R 137-2D 50% No Air Dried R 137-3A 80% Yes 30 Minutes at 250°F R 137-3B 80% No 30 Minutes at 250°F R 137-3C 80% Yes Air Dried R 137-3D 80% No Air Dried
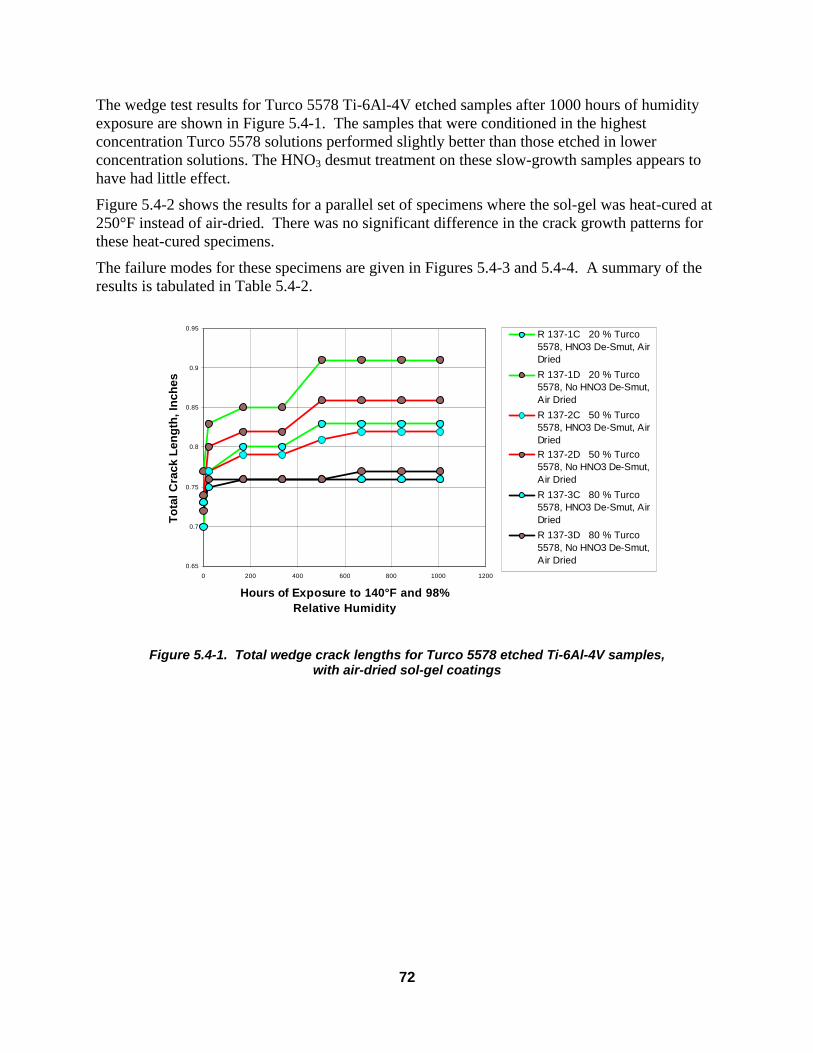
72
The wedge test results for Turco 5578 Ti-6Al-4V etched samples after 1000 hours of humidity exposure are shown in Figure 5.4-1. The samples that were conditioned in the highest concentration Turco 5578 solutions performed slightly better than those etched in lower concentration solutions. The HNO3 desmut treatment on these slow-growth samples appears to have had little effect.
Figure 5.4-2 shows the results for a parallel set of specimens where the sol-gel was heat-cured at 250°F instead of air-dried. There was no significant difference in the crack growth patterns for these heat-cured specimens.
The failure modes for these specimens are given in Figures 5.4-3 and 5.4-4. A summary of the results is tabulated in Table 5.4-2.
0.65
0.7
0.75
0.8
0.85
0.9
0.95
0 200 400 600 800 1000 1200
Hours of Exposure to 140°F and 98% Relative Humidity
To
tal C
rack
Len
gth
, In
ches
R 137-1C 20 % Turco5578, HNO3 De-Smut, AirDried
R 137-1D 20 % Turco5578, No HNO3 De-Smut,Air Dried
R 137-2C 50 % Turco5578, HNO3 De-Smut, AirDriedR 137-2D 50 % Turco5578, No HNO3 De-Smut,Air Dried
R 137-3C 80 % Turco5578, HNO3 De-Smut, AirDried
R 137-3D 80 % Turco5578, No HNO3 De-Smut,Air Dried
Figure 5.4-1. Total wedge crack lengths for Turco 5578 etched Ti-6Al-4V samples, with air-dried sol-gel coatings

73
0.65
0.7
0.75
0.8
0.85
0.9
0.95
1
0 200 400 600 800 1000 1200
Hours of Exposure to 140°F and >98% RH
To
tal C
rack
Len
gth
(in
ches
)R 137-1A 20 % Turco5578, HNO3 Desmut, 30Min. @ 250 FR 137-1B 20 % Turco5578, No HNO3 Desmut,30 Min. @ 250 FR 137-2A 50 % Turco5578, HNO3 Desmut, 30Min. @ 250 FR 137-2B 50 % Turco5578, No HNO3 Desmut,30 Min. @ 250 FR 137-3A 80 % Turco5578, HNO3 Desmut, 30Min. @ 250 FR 137-3B 80 % Turco5578, No HNO3 Desmut,30 Min. @ 250 F
Figure 5.4-2. Total wedge crack lengths for Turco 5578 etched Ti-6Al-4V samples,
with 250°F heat-cured sol-gel coatings
The crack growth and percentage cohesive failure of the Turco 5578 etched samples slightly improved as the concentration of the alkaline etching solution was increased from 20% to 80%. The average crack growth of all twelve samples was less than 0.25” after six weeks of testing. However, three sample series had average cohesive failure values less than 95%. All three of these samples came from the series etched in 20% Turco 5578. Only one of these three series, R 137-1A, showed large amounts of adhesive failure at the sol-gel to metal interface. The remaining two samples from this group had cohesive failure values just below the 95% level.
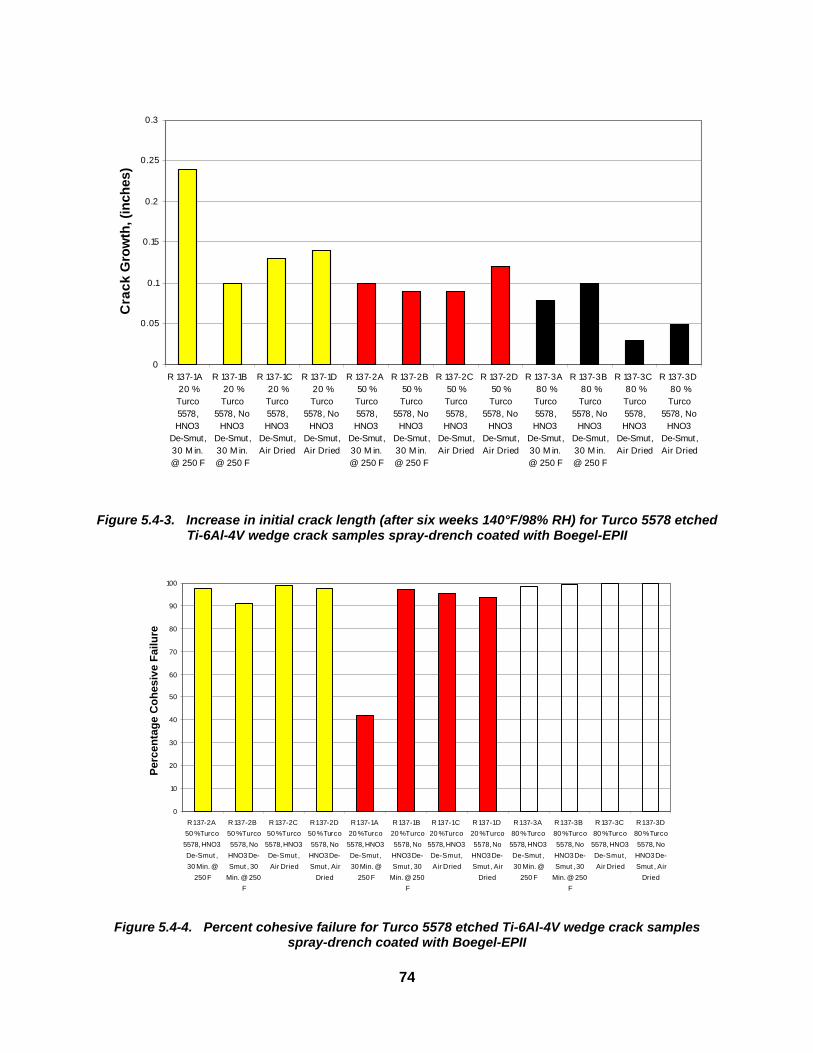
74
0
0.05
0.1
0.15
0.2
0.25
0.3
R 137-1A 20 %Turco5578,HNO3
De-Smut,30 M in.@ 250 F
R 137-1B 20 %Turco
5578, NoHNO3
De-Smut,30 M in.@ 250 F
R 137-1C 20 %Turco5578,HNO3
De-Smut,Air Dried
R 137-1D 20 %Turco
5578, NoHNO3
De-Smut,Air Dried
R 137-2A 50 %Turco5578,HNO3
De-Smut,30 M in.@ 250 F
R 137-2B 50 %Turco
5578, NoHNO3
De-Smut,30 M in.@ 250 F
R 137-2C 50 %Turco5578,HNO3
De-Smut,Air Dried
R 137-2D 50 %Turco
5578, NoHNO3
De-Smut,Air Dried
R 137-3A 80 %Turco5578,HNO3
De-Smut,30 M in.@ 250 F
R 137-3B 80 %Turco
5578, NoHNO3
De-Smut,30 M in.@ 250 F
R 137-3C 80 %Turco5578,HNO3
De-Smut,Air Dried
R 137-3D 80 %Turco
5578, NoHNO3
De-Smut,Air Dried
Cra
ck G
row
th, (
inch
es)
Figure 5.4-3. Increase in initial crack length (after six weeks 140°F/98% RH) for Turco 5578 etched Ti-6Al-4V wedge crack samples spray-drench coated with Boegel-EPII
0
10
20
30
40
50
60
70
80
90
100
R 137-2A
50 % Turco
5578, HNO3
De-Smut ,
30 Min. @
250 F
R 137-2B
50 % Turco
5578, No
HNO3 De-
Smut , 30
Min. @ 250
F
R 137-2C
50 % Turco
5578, HNO3
De-Smut ,
Air Dried
R 137-2D
50 % Turco
5578, No
HNO3 De-
Smut , Air
Dried
R 137-1A
20 % Turco
5578, HNO3
De-Smut ,
30 Min. @
250 F
R 137-1B
20 % Turco
5578, No
HNO3 De-
Smut , 30
Min. @ 250
F
R 137-1C
20 % Turco
5578, HNO3
De-Smut,
Air Dried
R 137-1D
20 % Turco
5578, No
HNO3 De-
Smut , Air
Dried
R 137-3A
80 % Turco
5578, HNO3
De-Smut ,
30 Min. @
250 F
R 137-3B
80 % Turco
5578, No
HNO3 De-
Smut , 30
Min. @ 250
F
R 137-3C
80 % Turco
5578, HNO3
De-Smut,
Air Dried
R 137-3D
80 % Turco
5578, No
HNO3 De-
Smut , Air
Dried
Per
cen
tag
e C
oh
esiv
e F
ailu
re
Figure 5.4-4. Percent cohesive failure for Turco 5578 etched Ti-6Al-4V wedge crack samples
spray-drench coated with Boegel-EPII

75
Table 5.4-2. Summary of R 137 Sample Series Performance
Sample Number
Turco 5578 Concentration
HNO3 De-Smut
Boegel EP II Drying Method
Initial Crack
Length, inches
6 Week Crack
Growth, inches
6 Week Failure Mode, % coh
R 137-1A 20% Yes 30 Minutes @ 250°F
0.72 0.24 24.1%
R 137-1B 20% No 30 Minutes @ 250°F
0.70 0.10 94.3%
R 137-1C 20% Yes Air Dried 0.70 0.13 91.7% R 137-1D 20% No Air Dried 0.77 0.14 96.3% R 137-2A 50% Yes 30 Minutes @
250°F 0.72 0.10 97.3%
R 137-2B 50% No 30 Minutes @ 250°F
0.75 0.09 96.4%
R 137-2C 50% Yes Air Dried 0.73 0.09 99.6% R 137-2D 50% No Air Dried 0.74 0.12 96.8% R 137-3A 80% Yes 30 Minutes @
250°F 0.72 0.08 99.0%
R 137-3B 80% No 30 Minutes @ 250°F
0.72 0.10 98.2%
R 137-3C 80% Yes Air Dried 0.73 0.03 98.5% R 137-3D 80% No Air Dried 0.72 0.05 99.6%
Heat-curing the applied Boegel-EPII coatings for 30 minutes at 250°F, rather than air-drying them before priming with BR 6747-1, produced relatively small differences in performance between the majority of the samples etched in 50% or 80% Turco 5578. However, the performance of samples etched in the 20% Turco solution were found to be highly dependent on the combinations of desmutting treatment and method of curing used.
For the samples etched in 20% Turco 5578 solution, the oven curing of the applied Boegel-EPII coating produced negative effects on the failure modes for samples which had been desmutted in 35% HNO3 at 140°F. Heat curing did not negatively affect the performance of the corresponding sample that had not been desmutted in the HNO3 solution. Among the remaining samples etched in the 20% Turco solution and air-dried after the application of Boegel-EPII, the differences in performance between samples that were desmutted or not were much smaller. However, regardless of the Boegel-EPII coating curing method on the 20% Turco 5578 conditioned substrates, desmutted samples had poorer failure modes than those that were not desmutted.
The performance differences between the samples in the R 137 series might be explained by the interaction between Boegel-EPII coatings and substrates with varied surface areas and morphologies. Surface profilometer and gloss meter measurements of the surfaces of Ti-6Al-4V witness panels etched in 20%, 50% or 80% Turco 5578 indicated that the surface roughness of the Turco-conditioned panels increases with solution concentration. It is possible that in addition to macroscopic roughness, morphological features or surface chemistry changes that have positive influences on the formation and maintenance of durable bonds might also be formed during the Turco 5578 conditioning process.

76
The quality and characteristics of the surfaces produced by immersion in 50% or 80% Turco 5578 solutions may be sufficient to compensate for limited reductions in Boegel-EPII coating effectiveness. These reductions might stem from such things as oven curing the Boegel-EPII coated substrates at 250°F or the use of primers with relatively low chemical affinity for the Boegel-EPII coating, such as Cytec BR 127.
5.5 Alternate Deoxidation Methodologies
5.5.1 Navy Laser Etch (Lasertronics)
Laser etching was examined as a alternate “nonchemical” method for deoxidizing and activating the metal surface prior to sol-gelling. Three sets of laser-etched Ti 6Al-4V and 1 set of Al 7075 were laser etched at the Lasertronics facility. Boegel-EPII was then applied to the laser etched surfaces by spraying with a hand-pump spray gun. Priming was also carried out using the hand-sprayer using Cytec BR6747-1. This was the only type of spray equipment available on the site. The configuration is described in Table 5.5-1. Use of the hand-pump spray bottle resulted in a relatively uneven primer coating thickness. Once received, the panels were bonded using AF 163-2M adhesive and machined into wedge crack specimens. The wedge crack results are presented in Figure 5.5-1.
Table 5.5-1. Specimen Configuration for Lasertronics Etch Study
Specimen #
Metal Substrate
Failure Mode (%coh)
D62-1 Ti 6Al-4V 0% D62-2 Ti 6Al-4V 0% D62-3 Ti 6Al-4V 0% D62-4 Al 7075 78%

77
0.00
0.200.40
0.600.80
1.00
1.201.40
1.601.80
2.00
0 200 400 600 800 1000 1200
Hrs of Exposure to 140°F and >98%RH
To
tal C
rack
Len
gth
(in
ches
)D62-1
D62-2
D62-3
D62-4
Figure 5.5-1. Results of Navy laser-etched specimens
The failure modes are 100% adhesive at the sol-gel to metal interface on all Ti specimens (D62-1,2,3) and approximately 75% coh on the Al 7075. Analysis of the specimens shows a close relation between the failure modes and the primer application. The primer was very thick in areas and very uneven overall.
5.6 Sol-Gel Chemistries
5.6.1 Effect of Surfactants
A study was begun to understand the effect of added surfactants on titanium bond performance. Addition of a surfactant to the aqueous based sol-gel can improve the wettability of the sol-gel solution on titanium and result in a more uniform coating. This more uniform coating may (or may not) address the issue of the mixed mode failures that are typically observed with the sol-gel technologies. It has been routinely observed that in a given wedge crack test, mixed mode failure are observed without substantial crack growth. In fact, when the failure mode is driven to the metal surface, it does not continue to adhesively fail along this interface. It is postulated that (1) this may be an inherent method of failure for the sol-gel systems that may be related to the chemical bonding interaction versus the mechanical interlock, or (2) an uneven coating is being deposited on the surface resulting in adhesive failure in areas where the metal is not coated sufficiently. The latter problem could theoretically be addressed by improving coating uniformity over the surface. The results of the surfactant testing are shown in Figure 5.6-1.
Titanium
Aluminum

78
0
0.05
0.1
0.15
0.2
0.25
0.3
0.35
0 200 400 600 800 1000
Hours of Exposure to 140°F and >98% RH
Cra
ck G
row
th (
inch
es)
P 25-1 0.0250gFC 170 C / Liter
P 25-2 0.0125gFC 170C / Liter
P 25-3 0.0062gFC 170C / Liter
R 17-1 NoSurfactant
R 17-4 Sanded,No Surfactant
Figure 5.6-1. Influence of a cationic surfactant on Ti bond performance
5.6.2 Search for an Alternate Surfactant
During the course of this program, 3M’s FC 170C was discontinued along with all of the other 3M surfactants. Thus, the surfactant screening studies were rerun to find a replacement that is adequate or better in improving the sol-gel coating and uniformity, especially over smooth surfaces. To this regard, screening studies were performed on several new surfactant systems on Turco 5578 treated titanium surfaces. One surfactant in particular appeared to yield a relatively uniform coating. Thus, after initial appearance uniformity studies, wedge tests were performed using a product from CPS Chemical called Agesperse PA8405. This is an acrylic polymer in aqueous solution.
The surfactant was added to serial dilutions of Boegel EPII: full strength, ½ and ¼ strength. Normal sol-gel (sans surfactant) was also included as a control. The concentration of surfactant was 0.05 wt % in all solutions. The solutions were applied to Ti 6Al–4V which had been processed through a 20% Turco tankline, primed with BR6747-1, then bonded using AF 163-2 adhesive. Figure 5.6-2. shows the wedge test performance at 3 weeks. The failure modes at three weeks are shown next to the chart legend.

79
0.6
0.7
0.8
0.9
1
1.1
0 100 200 300 400
Hrs of Exposure to 140°F and >98% RH
To
tal C
rack
Len
gth
(in
ches
)
C52-1 1/4 strengthC52-2 Full strengthC52-3 1/2 strengthC52-4 control
Figure 5.6-2. Boegel EPII dilutions with 0.05 wt% Agesperse PA8405 surfactant
All of the specimens in this dataset performed similarly, within experimental error. Thus, the added surfactant does not appear to degrade the performance of the bondline.
5.7 Primer Chemistries
5.7.1 Manual Primer Application Three Cytec BR 6747-1 primers were brushed on grit-blasted, Roloc disc abraded, and #220 alumina sanded Ti-6Al-4V panels using a foam brush: 20%, 30%, and 50% solids. The 50% solide primer brushed on very nicely, giving a uniform coating. The cured coating thicknesses for the various substrates are listed in Table 5.7-1. All panels received only one brush pass of primer. The wedge tests results for the Cytec BR 6747-1 50% solids brushed-on primer over Ti-6Al-4V (C79-1) are shown in Figure 5.7-2. Table 5.7-1. Cytec BR6747-1 Primer Thicknesses
Panel Surface Prep BR6747-1 Primer - % Solids
Average Primer Thickness (mils)
C79-1 #180 grit-blast 50 0.20 C79-2 #180 grit-blast 50 0.35
C79-3 #220 sanded 20 0.01 C79-3 #220 sanded 30 0.05 C79-3 #220 sanded 50 0.28 C79-4 Roloc abraded 20 0.03 C79-4 Roloc abraded 30 0.01 C79-4 Roloc abraded 50 0.43
80% coh 86% coh
98% coh 81% coh

80
0.60
0.65
0.70
0.75
0.80
0.85
0.90
0 200 400 600 800 1000 1200
Hours of Exposure to 140°F and 98% Relative Humidity
To
tal C
rack
Len
gth
, in
ches
Figure 5.7-2. Total crack length for Ti-6Al-4V with brushed-on Cytec BR6747-1 50% solids primer
5.8 Alternate Adhesive Data
5.8.1 Testing with BMS 5-154 Adhesive Sets of wedge test, climbing drum peel, flatwise tensile, and lap shear specimens were fabricated from Ti-6Al-4V alloy. The specimens were precleaned, etched in HF/HNO3, and treated with 20% Turco 5578, followed by a nitric acid desmut. The specimens were then sprayed with Boegel-EP and primed with Cytec BR 6747-1 primer, and bonded with BMS 5-154 adhesive. This particular adhesive system was chosen for its use in titanium honeycomb structures, which is one of Boeing’s uses of titanium bonding in production hardware applications. These specimens were actually coated with an older, higher-acid content version of the sol-gel that was used for bonding. The wedge crack extension data are shown in Figures 5.8-1 and 5.8-2. The data shown in the following figures are the average for 3 of the 5 specimens over 1000 hours. Two specimens from the panel set were removed at 30 days to determine the failure modes. The specimens removed at 30 days showed 0% cohesive failure and 40% cohesive failure. The three specimens tested for 1000 hours all failed adhesively. No surface analyses were conducted to determine the exact mode of interfacial failure.
95% coh
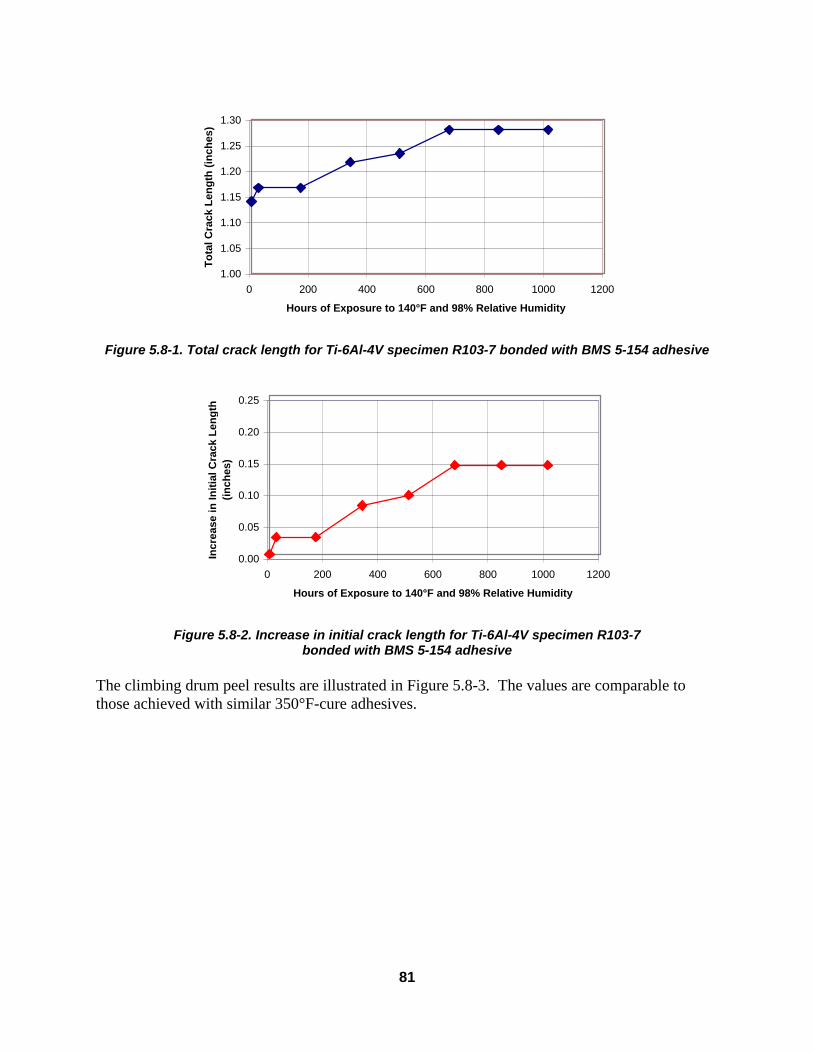
81
1.00
1.05
1.10
1.15
1.20
1.25
1.30
0 200 400 600 800 1000 1200
Hours of Exposure to 140°F and 98% Relative Humidity
To
tal C
rack
Len
gth
(in
ches
)
Figure 5.8-1. Total crack length for Ti-6Al-4V specimen R103-7 bonded with BMS 5-154 adhesive
0.00
0.05
0.10
0.15
0.20
0.25
0 200 400 600 800 1000 1200
Hours of Exposure to 140°F and 98% Relative Humidity
Incr
ease
in In
itia
l Cra
ck L
eng
th
(in
ches
)
Figure 5.8-2. Increase in initial crack length for Ti-6Al-4V specimen R103-7
bonded with BMS 5-154 adhesive
The climbing drum peel results are illustrated in Figure 5.8-3. The values are comparable to those achieved with similar 350°F-cure adhesives.

82
0.00
1.00
2.00
3.00
4.00
5.00
6.00
7.00
RT -65F
T e sting Te m p e rature
Pee
l S
tren
gth
(in
-lb
)
67%
adhes iv e
95%
adhesiv e
Figure 5.8-3. Climbing drum peel results for Ti-6Al-4V specimen R103-7 bonded
with BMS 5-154 adhesive
The flatwise tensile test results are given in Table 5.8-1, and the lap shear results are shown in Table 5.8-2. Table 5.8-1. Flatwise Tensile Strengths of Bonded Ti Honeycomb Core Specimens with
BMS 5-154
Specimen Test Temp (°F) Average Tensile Strength (psi)
Required Minimum Average (psi)
R103-1 75 (R.T.) 1180 600
R103-6 -65 1273 600
R103-11 160 997 500
R103-16 160 H/W 998 390
Table 5.8-2. Lap Shear Results on Ti-6Al-4V with BMS 5-154
Specimen No. Test Temp (°F) Average Strength (psi)
R103-1 75 (R.T.) 3044.6
R104-1 -65 2984.0
R105-1 180 2647.6
5.8.2 Compatibility with AF 191 350°F Adhesive
The Team investigated the compatibility of other 350°F-cure epoxy adhesives with the sol-gel bonding system. For example, wedge crack extension performance for sol-gel on titanium using 3M Company AF 191, in comparison with the 250°F system, is shown in Figure 5.8-4. The failure mode was 100% cohesive. These specimens exhibited very small crack extension (0.02 inches).
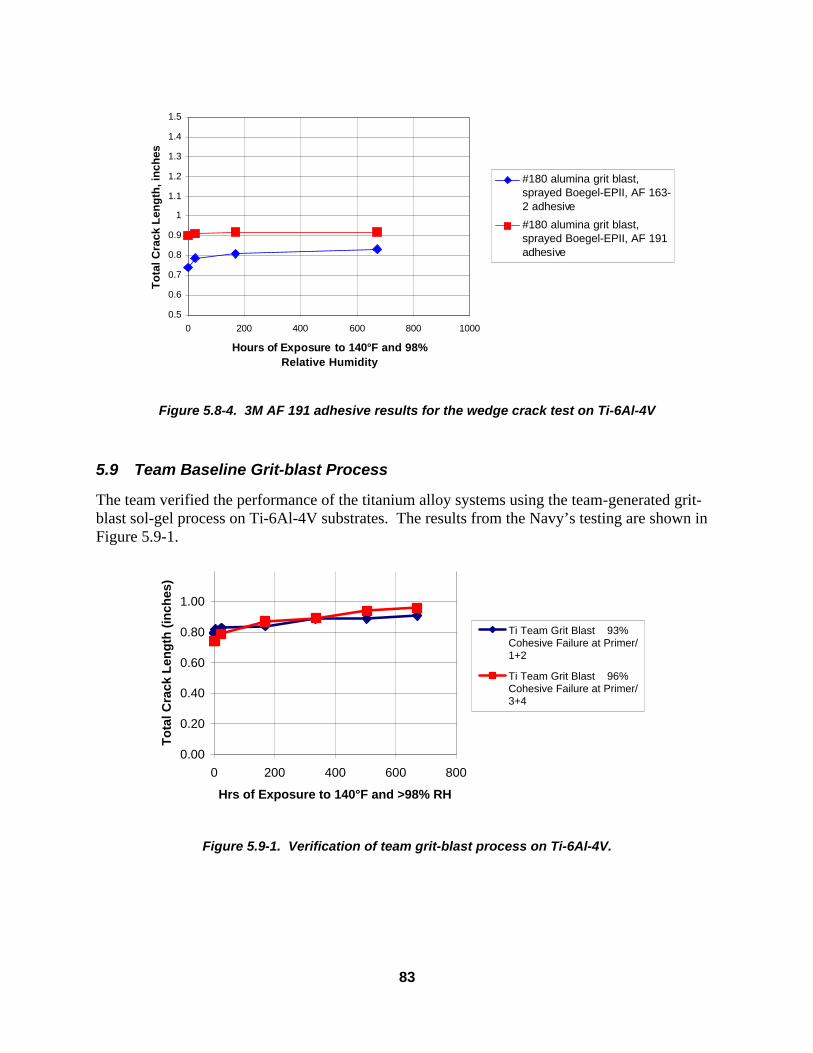
83
0.5
0.6
0.7
0.8
0.9
1
1.1
1.2
1.3
1.4
1.5
0 200 400 600 800 1000
Hours of Exposure to 140°F and 98% Relative Humidity
To
tal C
rack
Len
gth
, in
ches
#180 alumina grit blast,sprayed Boegel-EPII, AF 163-2 adhesive
#180 alumina grit blast,sprayed Boegel-EPII, AF 191adhesive
Figure 5.8-4. 3M AF 191 adhesive results for the wedge crack test on Ti-6Al-4V
5.9 Team Baseline Grit-blast Process
The team verified the performance of the titanium alloy systems using the team-generated grit- blast sol-gel process on Ti-6Al-4V substrates. The results from the Navy’s testing are shown in Figure 5.9-1.
0.00
0.20
0.40
0.60
0.80
1.00
0 200 400 600 800
Hrs of Exposure to 140°F and >98% RH
To
tal C
rack
Len
gth
(in
ches
)
Ti Team Grit Blast 93%Cohesive Failure at Primer/1+2
Ti Team Grit Blast 96%Cohesive Failure at Primer/3+4
Figure 5.9-1. Verification of team grit-blast process on Ti-6Al-4V.

84
6 Steel Results The feasibility of forming durable adhesive bonds with other metals, such as steel and nickel-based alloys, has been demonstrated with this sol-gel system. For example, wedge test results for grit-blast/sol-gel treated AM355 stainless steel panels primed with BR6747-1 and bonded with Cytec Fiberite FM 94 adhesive, in comparison to the ferric chloride (FCHAE) etch process (HP 4-121), are shown in Figure 6.0-1.
0.600
0.650
0.700
0.750
0.800
0.850
0.900
0 200 400 600 800 1000 1200
Hours of Exposure to 140°F and 80%+ Relative Humidity
To
tal C
rack
Len
gth
, in
ches
Sol GelHP 4-121
Figure 6.0-1. Comparison of wedge crack extension on AM355 stainless bonded with Cytec BR
6747-1 primer and Cytec FM 94 adhesive
For applications where grit-blasting is not possible, the feasibility of using sanding mechanical deoxidation methods on steel was assessed. The wedge test results for 0.040-thick 301 stainless steel panels which have been grit-blasted or sanded, sol-gel treated, primed with BR6747-1, and bonded with AF 163-2M are shown in Figure 6.0-2.
0.5
0.55
0.6
0.65
0.7
0.75
0.8
0.85
0.9
0.95
0 500 1000 1500
Hrs of Exposure to 140°F and >98% RH
To
tal C
rack
Len
gth
(in
ches
)
R 41-1 #180 Alumina GritBlasted
R 41-2 #400 SiCSandpaper; #220 SiCSandpaper
Figure 6.0-2. Wedge crack extension for 301 stainless treated with sol-gel, BR6747-1,
and bonded with 3M AF163-2M
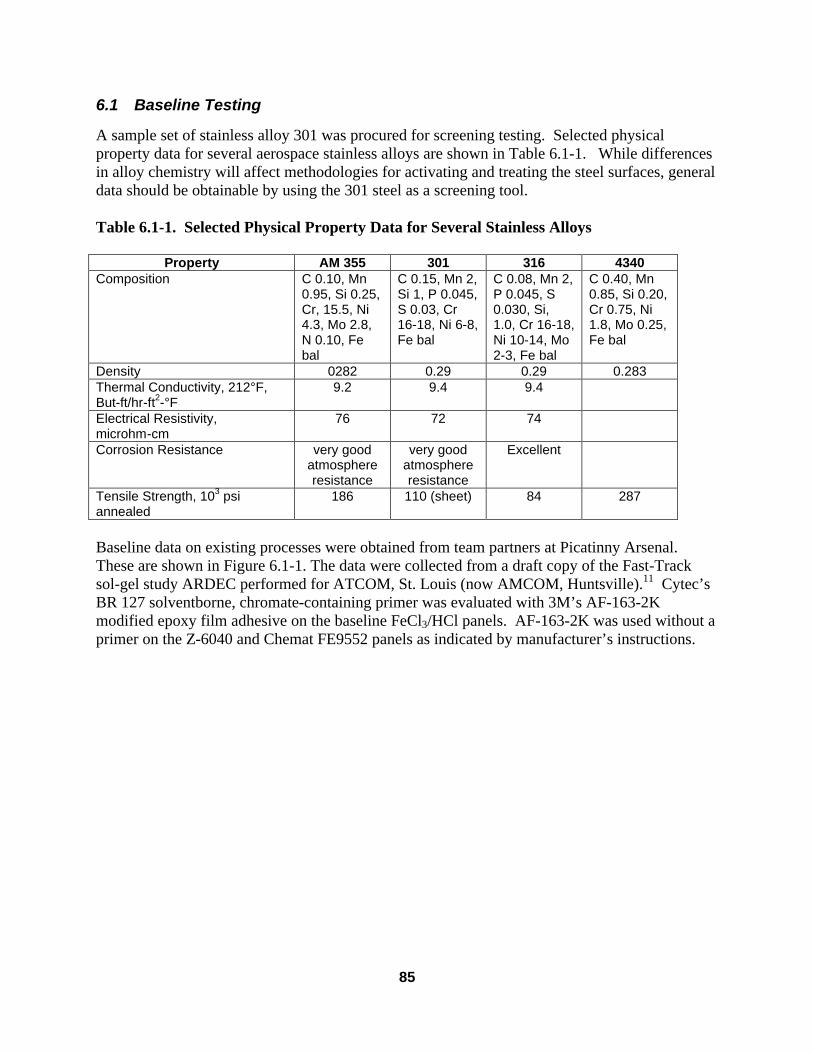
85
6.1 Baseline Testing
A sample set of stainless alloy 301 was procured for screening testing. Selected physical property data for several aerospace stainless alloys are shown in Table 6.1-1. While differences in alloy chemistry will affect methodologies for activating and treating the steel surfaces, general data should be obtainable by using the 301 steel as a screening tool. Table 6.1-1. Selected Physical Property Data for Several Stainless Alloys
Property AM 355 301 316 4340 Composition C 0.10, Mn
0.95, Si 0.25, Cr, 15.5, Ni 4.3, Mo 2.8, N 0.10, Fe bal
C 0.15, Mn 2, Si 1, P 0.045, S 0.03, Cr 16-18, Ni 6-8, Fe bal
C 0.08, Mn 2, P 0.045, S 0.030, Si, 1.0, Cr 16-18, Ni 10-14, Mo 2-3, Fe bal
C 0.40, Mn 0.85, Si 0.20, Cr 0.75, Ni 1.8, Mo 0.25, Fe bal
Density 0282 0.29 0.29 0.283 Thermal Conductivity, 212°F, But-ft/hr-ft2-°F
9.2 9.4 9.4
Electrical Resistivity, microhm-cm
76 72 74
Corrosion Resistance very good atmosphere resistance
very good atmosphere resistance
Excellent
Tensile Strength, 103 psi annealed
186 110 (sheet) 84 287
Baseline data on existing processes were obtained from team partners at Picatinny Arsenal. These are shown in Figure 6.1-1. The data were collected from a draft copy of the Fast-Track sol-gel study ARDEC performed for ATCOM, St. Louis (now AMCOM, Huntsville).11 Cytec’s BR 127 solventborne, chromate-containing primer was evaluated with 3M’s AF-163-2K modified epoxy film adhesive on the baseline FeCl3/HCl panels. AF-163-2K was used without a primer on the Z-6040 and Chemat FE9552 panels as indicated by manufacturer’s instructions.

86
0
0.4
0.8
1.2
1.6
2
0 40 80 120 160 200
Hours of Exposure to 140°F and 98% RH
To
tal C
rack
Len
gth
(in
ches
)
Baseline FerricChloride / HCl Etch
Grit Blast / Z-6040Silane
Chemat FE 9552Sol-Gel
Figure 6.1-1. Wedge test performance data for baseline processes on stainless
AM355 (0.040”-thick) specimens The wedge crack data compare the original production process using a ferric chloride etch, a grit-blast / silane process, and the Al/Si Chemat sol-gel. The ferric chloride process has recently undergone an upgrade by adding a grit-blast pretreatment step. This grit-blast step dramatically increases the hot/wet performance of this surface treatment. The Chemat FE 9552 sol-gel is a mixture of Chemat’s alumina-silica aqueous sol-gel chemistry with the Cytec BR 6747-1 bond primer chemistry. At the date of this study, it had mixed results with regards to bond durability. Further studies will compare the performance of the improved ferric chloride process with the sol-gel candidate processes.
6.2 Stainless 301 Testing
Initial feasibility tests were performed using the existing Boegel-EPII formulation and process conditions to see what type of bond performance and durability this system will yield on a stainless substrate. Stainless specimens sized 6 inch x 6 inch x 0.040 inch were used for this test. The specimens were grit-blasted with #180 alumina grit and spray-drenched with the Boegel-EPII solution. The samples were primed with Cytec BR 6747-1 primer and bonded with 3M AF163-2M adhesive. Initial wedge crack extension performance is shown in Figure 6.2-1.
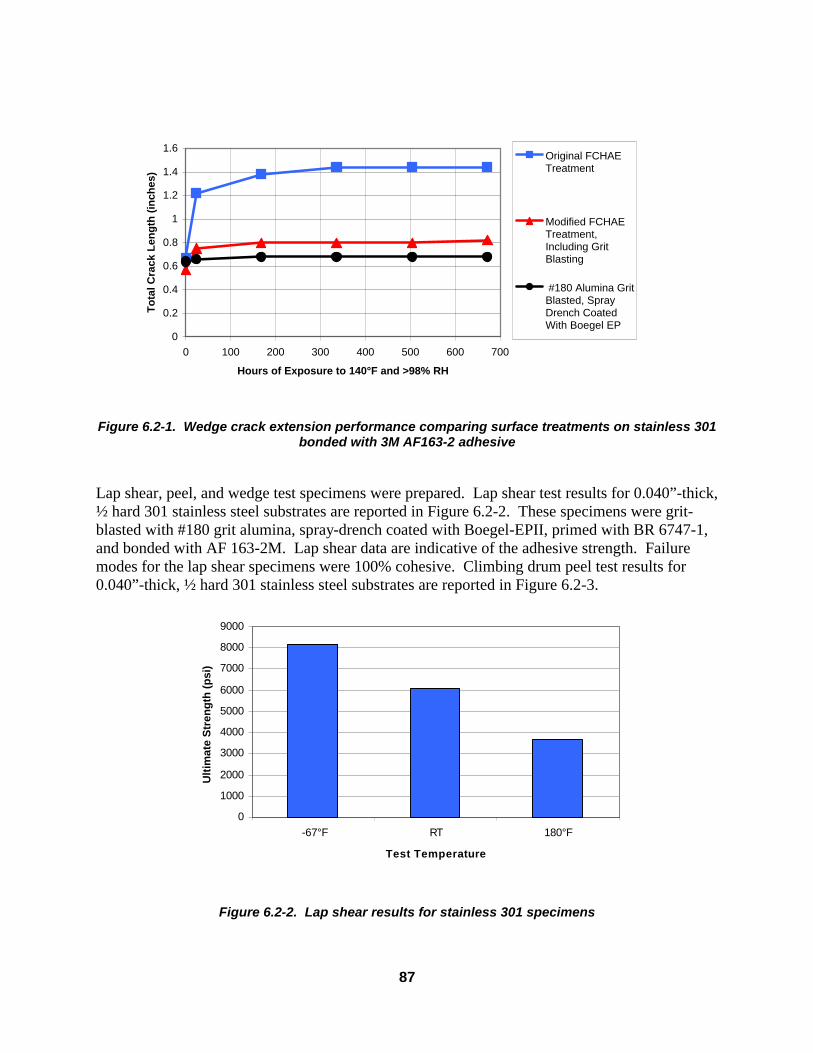
87
0
0.2
0.4
0.6
0.8
1
1.2
1.4
1.6
0 100 200 300 400 500 600 700
Hours of Exposure to 140°F and >98% RH
To
tal C
rack
Len
gth
(in
ches
)Original FCHAETreatment
Modified FCHAETreatment,Including GritBlasting
#180 Alumina GritBlasted, SprayDrench CoatedWith Boegel EP
Figure 6.2-1. Wedge crack extension performance comparing surface treatments on stainless 301
bonded with 3M AF163-2 adhesive
Lap shear, peel, and wedge test specimens were prepared. Lap shear test results for 0.040”-thick, ½ hard 301 stainless steel substrates are reported in Figure 6.2-2. These specimens were grit-blasted with #180 grit alumina, spray-drench coated with Boegel-EPII, primed with BR 6747-1, and bonded with AF 163-2M. Lap shear data are indicative of the adhesive strength. Failure modes for the lap shear specimens were 100% cohesive. Climbing drum peel test results for 0.040”-thick, ½ hard 301 stainless steel substrates are reported in Figure 6.2-3.
0
1000
2000
3000
4000
5000
6000
7000
8000
9000
-67°F RT 180°F
Test Temperature
Ult
imat
e S
tren
gth
(p
si)
Figure 6.2-2. Lap shear results for stainless 301 specimens

88
0
10
20
30
40
50
60
70
R 41-1-1 R 41-1-2 R 41-1-3 R 41-1-4 R 41-1-5 R 41-1-6
Sample Number
Pee
l Str
eng
th, l
bs
/ in
ch
Figure 6.2-3. Climbing drum peel results for stainless 301 specimens bonded with AF163-2
6.3 Alternative Manual Deoxidation Techniques As an alternate to grit-blasting, testing was carried out on the stainless alloys to see if a non-grit-blast manual deoxidation treatment could be found that would activate the stainless steel surface. Sanding and Scotch-Brite abrasion methods were evaluated as methods to provide an active steel surface. Wedge crack test performance of 301 stainless steel samples that were either grit-blasted or sanded prior to sol-gel coating is shown in Figure 6.3-1. The performance of these samples is compared with the original ferric chloride (FCHAE) and improved ferric chloride process control data supplied by the Army-Picatinny Arsenal. The R41-2 samples were prepared by sanding each panel a total of four times for 30 seconds each using two pieces of #400 SiC paper, followed by two pieces of #220 SiC paper. The increase in crack length for the sanded samples, R41-2, is about 0.15 inches greater than that of the grit-blasted samples.

89
0.4
0.5
0.6
0.7
0.8
0.9
1
1.1
1.2
0 500 1000 1500
Hrs of Exposure to 140°F and >98% RH
To
tal C
rack
Len
gth
(in
ches
)R 41-1 #180 Alumina Grit-Blast/Boegel-EPII
R 41-2 #400 SiCSandpaper, #220 SiCSandpaper/Boegel-EPII
Modified FCHAE Treatment
Figure 6.3-1. Wedge crack test results for 0.040"-thick 301 stainless panels treated with various surface preparations
6.4 AM355 Testing Wedge crack extension, floating roller peel, and lap shear specimens were fabricated from AM355 steel (B66 series). The substrates were grit-blasted, treated with Boegel-EPII, primed with Cytec BR6747-1, and bonded with 3M AF163-2M adhesive. Unfortunately, the wedge test and peel specimens were badly burnt during the machine-cutting step, so all testing results are nullified. The lap shear specimens, however, were not destroyed from the cutting operation and the results are shown in Figure 6.3-1. The mode of failure at both testing temperatures was cohesive.
0.01000.02000.03000.04000.05000.06000.07000.08000.09000.0
-65 R.T.
Testing Temperature, °F
Lap
Sh
ear
Str
eng
th, p
si
Figure 6.3-1. Lap shear results for AM355 steel specimens B66-L

90
Wedge crack extension specimens were fabricated a second time from AM355 steel. The substrates were grit-blasted, treated with Boegel-EPII, primed with Cytec BR6747-1, and bonded with 3M AF163-2M adhesive. The wedge test results are illustrated in Figure 6.3-2. One specimen was removed from the test after 2 weeks to determine the failure mode. This specimen exhibited approximately 95% cohesive failure. Any adhesive failure was at the edges of the specimen, which were burned during machining. The specimens exposed for 1000 hours also exhibited cohesive failure. Some failure was observed between the primer and the adhesive, which most likely occurred during the forced opening of the specimens during the failure analysis.
0.00
0.20
0.40
0.60
0.80
1.00
0 200 400 600 800 1000 1200
Hours of Exposure to 140°F and 98% Relative Humidity
To
tal C
rack
Len
gth
(in
ches
)
Figure 6.3-2. Total crack length for AM355 specimen B9-1
6.5 Team Grit-blast Specification Testing on Stainless
The Team negotiated a specification for a grit-blast / sol-gel surface preparation for stainless alloys. The simplified-mix procedure was used for this testing (described in Section 7.7). Figure 6.5-1 shows the Army data verification of that process after 30 days of exposure to 140°F and >98% relative humidity. The results show that the process on stainless alloys gave reproducible results.
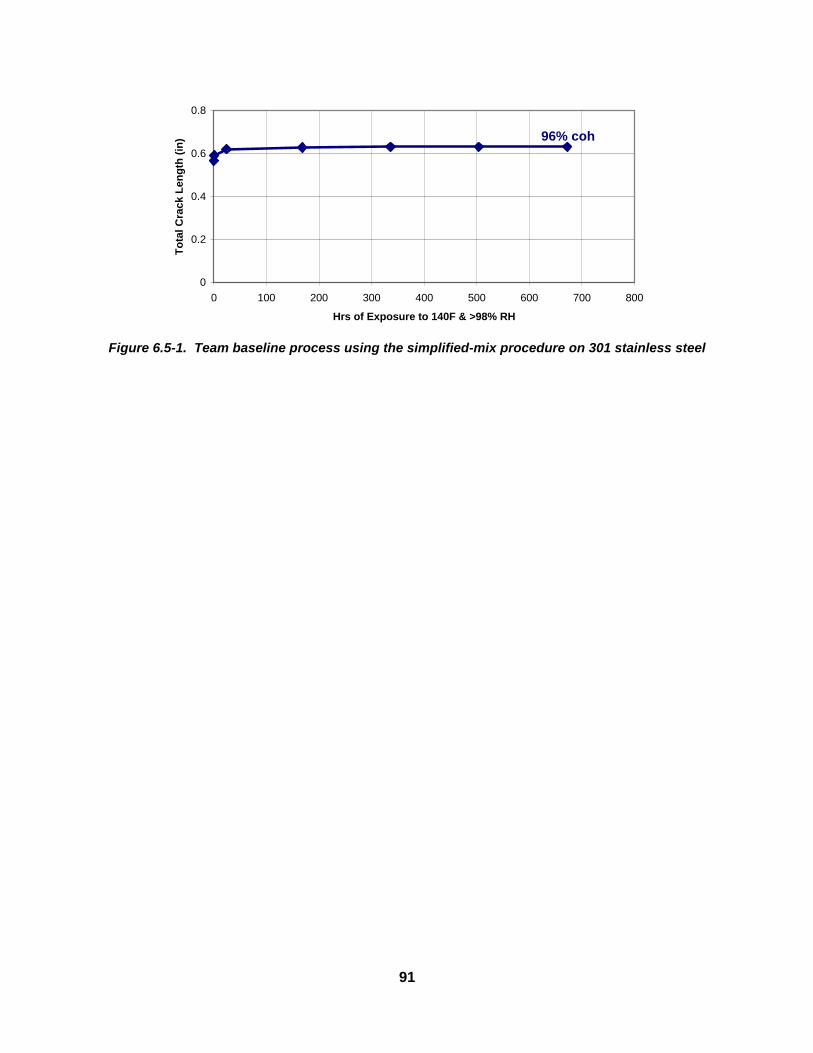
91
0
0.2
0.4
0.6
0.8
0 100 200 300 400 500 600 700 800
Hrs of Exposure to 140F & >98% RH
To
tal C
rack
Len
gth
(in
)
Figure 6.5-1. Team baseline process using the simplified-mix procedure on 301 stainless steel
96% coh

92
7 Sol-Gel Kit Development
7.1 Summary
The purpose of this task is to make the sol-gel process more user-friendly. For current hardware applications, a rudimentary kitting system was developed that worked quite well for laboratory operations. The sol-gel components were packaged in high density polyethylene or polypropylene syringes with plastic caps and sealed to prevent ingression of air and moisture. This kitting concept is shown in Figure 7.0-1.
Figure 7.0-1. Rudimentary kitting concept for sol-gel components
A goal of the testing for this program was to limit the number of components in the kit to simplify the deployment, especially for field-use conditions. Currently, there are four separate components in the sol-gel kits: 3-glycidoxypropyltrimethoxysilane; zirconium tetrapropoxide, glacial acetic acid, and water. Testing indicates that precombining the acetic acid and zirconium tetra-propoxide components provides a stable mixture that gives good performance results for kits aged up to a year old shelf-life. Additionally, the number of kit components could be reduced even further by combining the acetic acid, zirconium tetra-propoxide, and water. This mixture of three chemicals also gave acceptable results in kits with a shelf-life of one year. This latter premixed kit would present the most ideal situation, as only two components would be involved in the sol-gel kit.
Verification of the initial testing using the commercial sol-gel supplier is required before carrying out any change in the kit configuration. This testing is currently in progress at the time of this report.
7.2 Kit Specifications Kits should be clearly labeled with concise mixing instructions and chemical hazard warnings. The containers should be either high-density polyethylene (HDPE) or polypropylene (PP) or a similar nonreactive material to prevent attack by the chemicals, leakage, and breakage during shipping and use. Certain reagents used in the sol-gel formulation are sensitive to moisture. The color and/or presence of precipitates can indicate whether the chemicals in the kit are viable after

93
a certain shelf-life. Therefore, the optimal containers would be natural, or translucent, HDPE or PP, the physical appearance of the liquid can be easily determined. To make the mixing process as easy as possible, the ideal kit will use a mixing procedure using terminology similar to that used in mixing multi-part paint kits. The sol-gel mixture will be sprayed, swabbed, or brushed onto the substrate and the kit may also contain the necessary materials for that application procedure.
Ideally, the kit will contain a minimum number of components in order to reduce the amount of mixing and limit exposure to the chemicals. It is particularly desirable to limit exposure to glacial acetic acid (GAA), possibly through pre-mixing with zirconium n-propoxide (TPOZ). Water and surfactant, if used, should be combined in the kit, as the amount of surfactant used in the formulation is extremely small. A minimum shelf-life of one year is desired.
7.3 First-generation Kit Studies
Screening tests were conducted to ascertain how the sol-gel chemical components would survive over an identified shelf-life when packaged in appropriate vessels. Initial kitting studies were performed on #180 grit-blasted aluminum 2024-T3 surfaces. Parallel to the performance verification effort, the individual candidate kit components were characterized by infrared spectroscopy (IR). Each component combination was tested by infrared spectroscopy at various aging times to determine its stability over time.
The test matrix in Table 7.3-1 was followed. The control specimens contain no premixed components. The various combinations were pre-mixed and were stored in containers at ambient conditions for 4 weeks, 7 weeks, 6 months, and 12 months. At the specified time, shown in Table 7.3-2, the sol-gel test formulation was mixed using the appropriate test components and applied to a set of grit-blasted Al 2024-T3 specimens.
Wedge testing was conducted to assess the adhesive-bonded surface durability. Selection criteria were based on the historical database of performance for the grit-blasted Boegel-EPII specimens and how they compare to phosphoric acid anodize treated panels.
7.3.1 4-Week Old Kits As shown in Figure 7.3-1, two specimens exhibited an average crack extension greater than 0.25 inch after 500 hours of exposure to 140°F and >95%RH. These specimens, I4-1-1 and I5-1-1, had crack extensions of 0.9 and 0.91 inch, respectively. They were the only combinations that included the premixing of water and GTMS. It was concluded that combining GTMS and water in a kit causes the condensation reaction to take place with the sol-gel components long before the mixture is applied to the substrate. The initiation of the condensation reaction and formation of a polymer before application to the substrate results in poor adhesion and bonding performance. This is due to the lack of open attachment sites on the polymeric chain. The longer GTMS and water are in contact, the further the reaction will proceed and the fewer available sites for attachment to the metal substrate. The resultant degradation in bonding performance is exhibited by large crack extensions. It was concluded that water and GTMS should be kept separate in the sol-gel kit. Specimen I2-1-1, containing a premixed combination of deionized water and FC 170C surfactant, exhibited crack growth similar to the controls. The specimen in which deionized

94
water and FC 170C were premixed demonstrated essentially similar crack extension performance as the controls. A preliminary conclusion was made that a sol-gel kit containing deionized water mixed with FC 170C surfactant was acceptable. Table 7.3-1: Kitting Chemical Compatibility Matrix
TEST CATEGORY TEST TEST LABEL 4 WKS 6WKS 7 MONTHS 12 MONTHS
ALL COMPONENTS Control1. H2O2. FC170C3. GTMS4. GAA5. IPA A1-1-1 A1-3-16. TPOZ A1-1-2 A1-3-2
1. H202. FC170C3. GTMS A2-1-1 A2-2-1 A2-3-1 A2-4-14. GAA + TPOZ + IPA A2-1-2 A2-2-2 A2-3-2 A2-4-2
1. H202. FC170C3. GTMS + TPOZ + IPA A3-1-1 A3-2-1 A3-3-1 A3-4-14. GAA A3-1-2 A3-2-2 A3-3-2 A3-4-2
W/OUT SURFACTANT Control1. H2O2. GTMS3. GAA4. IPA S1-1-1 S1-3-15. TPOZ S1 S1-1-2 S1-3-2
1. H202. GTMS3. GAA S2-1-1 S2-2-1 S2-3-1 S2-4-14. TPOZ + IPA S2 S2-1-2 S2-2-2 S2-3-2 S2-4-2
1. H202. GTMS + TPOZ3. GAA S3-1-1 S3-2-1 S3-3-1 S3-4-14. IPA S3 S3-1-2 S3-2-2 S3-3-2 S3-4-2
W/OUT IPA Control1. H2O2. FC170C3. GTMS4. GAA I1-1-1 I1-3-15. TPOZ I1 I1-1-2 I1-3-2
1. H20 + FC170C2. GTMS3. GAA I2-1-1 I2-2-1 I2-3-1 I2-4-14. TPOZ I2 I2-1-2 I2-2-2 I2-3-2 I2-4-2
1. H20 2. GTMS + FC170C3. GAA I3-1-1 I3-2-1 I3-3-1 I3-4-14. TPOZ I3 I3-1-2 I3-2-2 I3-3-2 I3-4-2
A1
A2
A3

95
Table 7.3-1: Kitting Matrix, cont.
TEST CATEGORY TEST TEST LABEL 4 WEEKS 7 WEEKS 6 MONTHS 12 MONTHS
W/OUT IPA1. H20 + GTMS 2. FC170C3. GAA I4-1-1 I4-2-1 I4-3-1 I4-4-14. TPOZ I4 I4-1-2 I4-2-2 I4-3-2 I4-4-2
1. H20 + GTMS + FC170C2. GAA I5-1-1 I5-2-1 I5-3-1 I5-4-13. TPOZ I5 I5-1-2 I5-2-2 I5-3-2 I5-4-2
1. H202. FC170C3. GTMS I6-1-1 I6-2-1 I6-3-1 I6-4-14. GAA + TPOZ I6 I6-1-2 I6-2-2 I6-3-2 I6-4-2
1. H202. FC170C3. GTMS + TPOZ I7-1-1 I7-2-1 I7-3-1 I7-4-14. GAA I7 I7-1-2 I7-2-2 I7-3-2 I7-4-2
1. H202. GTMS + TPOZ + FC170C I8-1-1 I8-2-1 I8-2-1 I8-4-13. GAA I8-1-2 I8-2-2 I8-3-2 I8-4-2
1. TAP H202. FC170C3. GTMS4. GAA I9-1-1 I9-2-1 I9-3-1 I9-4-15. TPOZ I9 I9-1-2 I9-2-2 I9-3-2 I9-4-2
W/OUT SURFACTANT OR IPAControl1. H2O2. GTMS3. GAA SI1-1-1 SI1-3-14. TPOZ SI1 SI1-1-2 SI1-3-2
1. H202. GTMS SI2-1-1 SI2-2-1 SI2-3-1 SI2-4-13. GAA + TPOZ SI2 SI2-1-2 SI2-2-2 SI2-3-2 SI2-4-2
I8

96
Table 7.3-2. Sol-Gel Testing Dates
Test Contents Bottled 4 wks 7 wks 6 months 12 months
S3 GTMS, TPOZ 7-15-98 8-12-98 9-2-98 1-15-99 7-15-99SI2 GAA, TPOZ 7-20-98 8-17-98 9-7-98 1-20-99 7-20-99I2 H20, FC170C 7-20-98 8-17-98 9-7-98 1-20-99 7-20-99I4 H20, GTMS 7-21-98 8-18-98 9-8-98 1-21-99 7-21-99I5 H20, GTMS, FC170C 7-22-98 8-18-98 9-8-98 1-21-99 7-21-99I6 GAA, TPOZ 7-22-98 8-19-98 9-9-98 1-22-99 7-22-99I7 GTMS, TPOZ 7-22-98 8-19-98 9-9-98 1-22-99 7-22-99I8 GTMS, TPOZ, FC170C 7-22-98 8-19-98 9-9-98 1-22-99 7-22-99I3 GTMS, FC170C 7-23-98 8-20-98 9-10-98 1-23-99 7-23-99A2 GAA, TPOZ, IPA 7-27-98 8-24-98 9-14-98 1-27-99 7-27-99A3 GTMS, TPOZ, IPA 7-27-98 8-24-98 9-14-98 1-27-99 7-27-99S2 TPOZ, IPA 7-27-98 8-24-98 9-14-98 1-27-99 7-27-99
1.20
1.40
1.60
1.80
2.00
2.20
2.40
0 100 200 300 400 500 600
Hours of Exposure to 140° F and >98% RH
To
tal C
rack
Len
gth
(in
ches
)
I5-1: H2O + GTMS + FC-170Ccombined prior to preparation
I4-1: H2O + GTMS combined prior topreparation
I6-1: GAA + TPOZ combined prior topreparation
I2-1: H2O + FC-170C combined priorto preparation
I7-1: GTMS + TPOZ combined priorto preparation
RI1-1: Control, no pre-mixing ofcomponents
I3-1: GTMS + FC-170C combinedprior to preparation
I8-1: GTMS + TPOZ + FC-170Ccombined prior to preparation
I9-1: Tap Water (Instead of DI H2O)
Figure 7.3-1. Wedge test results for 4-week old sol-gel kit trials
As shown in Figure 7.3-2, the use of City of Kent tap water rather than deionized water, I9-1-1, did not degrade the performance of the specimen. However, the pH and contamination levels of tap water vary widely across the world and are difficult to control. It was determined that the
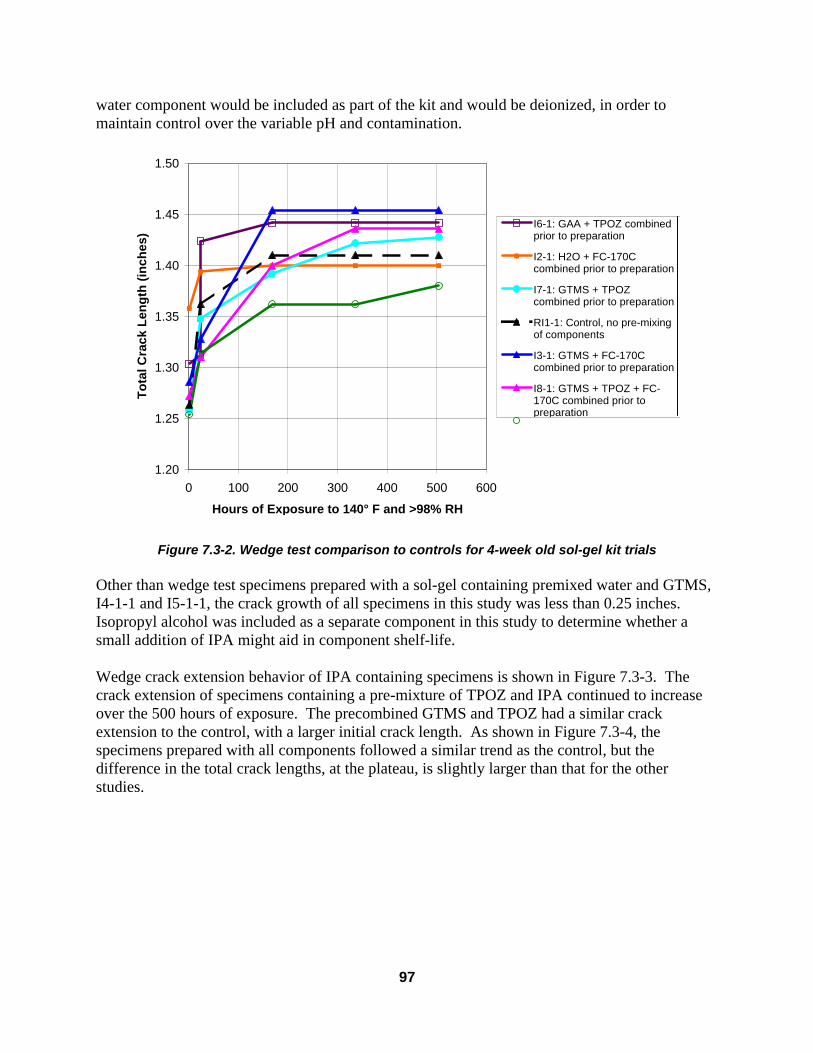
97
water component would be included as part of the kit and would be deionized, in order to maintain control over the variable pH and contamination.
1.20
1.25
1.30
1.35
1.40
1.45
1.50
0 100 200 300 400 500 600
Hours of Exposure to 140° F and >98% RH
To
tal C
rack
Len
gth
(in
ches
)
I6-1: GAA + TPOZ combinedprior to preparation
I2-1: H2O + FC-170Ccombined prior to preparation
I7-1: GTMS + TPOZ combined prior to preparation
RI1-1: Control, no pre-mixingof components
I3-1: GTMS + FC-170Ccombined prior to preparation
I8-1: GTMS + TPOZ + FC-170C combined prior topreparationI9-1: Tap Water (Instead of DI
Figure 7.3-2. Wedge test comparison to controls for 4-week old sol-gel kit trials Other than wedge test specimens prepared with a sol-gel containing premixed water and GTMS, I4-1-1 and I5-1-1, the crack growth of all specimens in this study was less than 0.25 inches. Isopropyl alcohol was included as a separate component in this study to determine whether a small addition of IPA might aid in component shelf-life. Wedge crack extension behavior of IPA containing specimens is shown in Figure 7.3-3. The crack extension of specimens containing a pre-mixture of TPOZ and IPA continued to increase over the 500 hours of exposure. The precombined GTMS and TPOZ had a similar crack extension to the control, with a larger initial crack length. As shown in Figure 7.3-4, the specimens prepared with all components followed a similar trend as the control, but the difference in the total crack lengths, at the plateau, is slightly larger than that for the other studies.

98
1.20
1.25
1.30
1.35
1.40
1.45
1.50
0 100 200 300 400 500 600
Hours of Exposure to 140° F and >98% RH
To
tal C
rack
Len
gth
(in
ches
)S3-1: GTMS +TPOZ combinedprior to preparation
S2-1: TPOZ + IPAcombined prior topreparation
RS1-1: Control, nopre-mixing ofcomponents
Figure 7.3-3. Wedge test results of a 4-week aged sol-gel kit with IPA added
1.20
1.25
1.30
1.35
1.40
1.45
1.50
0 100 200 300 400 500 600
Hours of Exposure to 140° F and >98% RH
To
tal C
rack
Len
gth
(in
ches
) A2-1: GAA +TPOZ + IPAwere combinedprior topreparation
A3-1: GTMS+TPOZ + IPAwere combinedprior topreparation
RA1-1: Control,no pre-mixingof components
Figure 7.3-4. Wedge test results of a 4-week aged sol-gel kit with all components One of the biggest payoffs can occur if the TPOZ and glacial acetic acid (GAA) can be precombined in the kit. As previously mentioned, this would limit the number of components and minimize any exposure to acid components in the kit. As illustrated in Figure 7.3-5, the sample prepared with a premixture of GAA and TPOZ had a total crack length trend similar to

99
that of the control, with a slightly larger initial crack length. Further testing will show whether these premixtures will continue to yield acceptable results as the shelf-life of the premixed components increase.
1.20
1.25
1.30
1.35
1.40
1.45
0 100 200 300 400 500 600
Hours of Exposure to 140° F and >98% RH
To
tal C
rack
Len
gth
(in
ches
)
SI2-1: GAA +TPOZ combinedprior topreparation
RSI1-1: Control,no pre-mixing ofcomponents
Figure 7.3-5. Wedge test comparison of the controls with a 4-week aged sol-gel kit with precombined TPOZ and GAA
Preliminary results indicate that several options may be acceptable for a sol-gel kit. Further testing is being performed to ensure the shelf-life of these material combinations is adequate to meet the requirements of depot and field repair.
7.3.2 7-Week Old Kits
Wedge test results from application of the 7-week-old kits (Trial 2) on aluminum were evaluated. Specimens I4 and I5, containing a combination of GTMS and deionized water, were dropped from the matrix due to poor performance from application of the 4-week-old kits. Specimen I9 was not tested after a 7-week shelf-life since it was simply a substitution of tap water for deionized water. Specimens A2 and A3 are not included in this trial due to mislabeling of specimens, but will be included in Trials 3 and 4 (6 and 12 month shelf-lives). The average crack extensions for the samples tested in this trial are shown in Figures 7.3-6, 7.3-7, and 7.3-8. The failure mode of all these specimens was predominantly cohesive (>90% cohesive).

100
0.00
0.05
0.10
0.15
0.20
0.25
0 100 200 300 400 500 600
Hours of Exposure to 140°F and >98% RH
Cra
ck G
row
th (
inch
es)
RI1: Control, no pre-m ixing ofcomponents
I2-2: H20 + FC-170Ccombined prior topreparation
I3-2A: GTMS + 1mLFC-170C StockSolution combinedprior to preparationI6-2: GAA + TPOZcombined prior topreparation
I7-2: GTMS + TPOZcombined prior topreparation
I8-2: GTMS + TPOZ+ FC-170C combinedprior to preparation
Figure 7.3-6. Average crack extension for sol-gel panels prepared with 7-week-old kits
with premixed components
0.00
0.02
0.04
0.06
0.08
0.10
0.12
0.14
0.16
0.18
0 100 200 300 400 500 600Hours of Exposure to 140°F and >98% Relative Humidity
Cra
ck G
row
th (
inch
es)
S2-2: TPOZ + IPAcombined prior topreparationS3-2: GTMS + TPOZcombined prior topreparationRS1: Control, no pre-mixing of components
Figure 7.3-7: Crack extension for sol-gel panels prepared without FC-170C surfactant; 7-week-old kits with pre-mixed components

101
0.00
0.02
0.04
0.06
0.08
0.10
0.12
0.14
0.16
0.18
0.20
0 100 200 300 400 500 600Hours of Exposure to 140°F and >98% Relative Humidity
Cra
ck G
row
th (
inch
es)
SI2-2: GAA + TPOZcombined prior topreparation
RSI1: Control, no pre-mixing of components
Figure 7.3-8. Crack extension for sol-gel panels prepared without FC-170C surfactant or IPA; 7-week-old kits with pre-mixed components
The premixed solutions of GAA and TPOZ form a solid, white mass that is difficult to remove from the bottle to prepare the sol-gel solution. Ideally for ease of use, all kit components should remain in solution. It was determined that adding a small amount of deionized water to the solution of GAA and TPOZ stabilizes the liquid phase. Ongoing IR analysis, Figure 7.3-9, has shown this solution to be stable over time.
-0.20
0.30
0.80
1.30
1.80
2.30
650115016502150265031503650
Wavenumber (cm-1)
Abs
orba
nce
TPOZ + GAA + H2O, TimeZeroTPOZ + GAA + H2O, 4 WK
Figure 7.3-9. IR spectra of TPOZ, GAA, H2O solutions showing changes in stability between the
initial mixing and 4 weeks. overlapping peaks show that the mixture is essentially stable over this time period
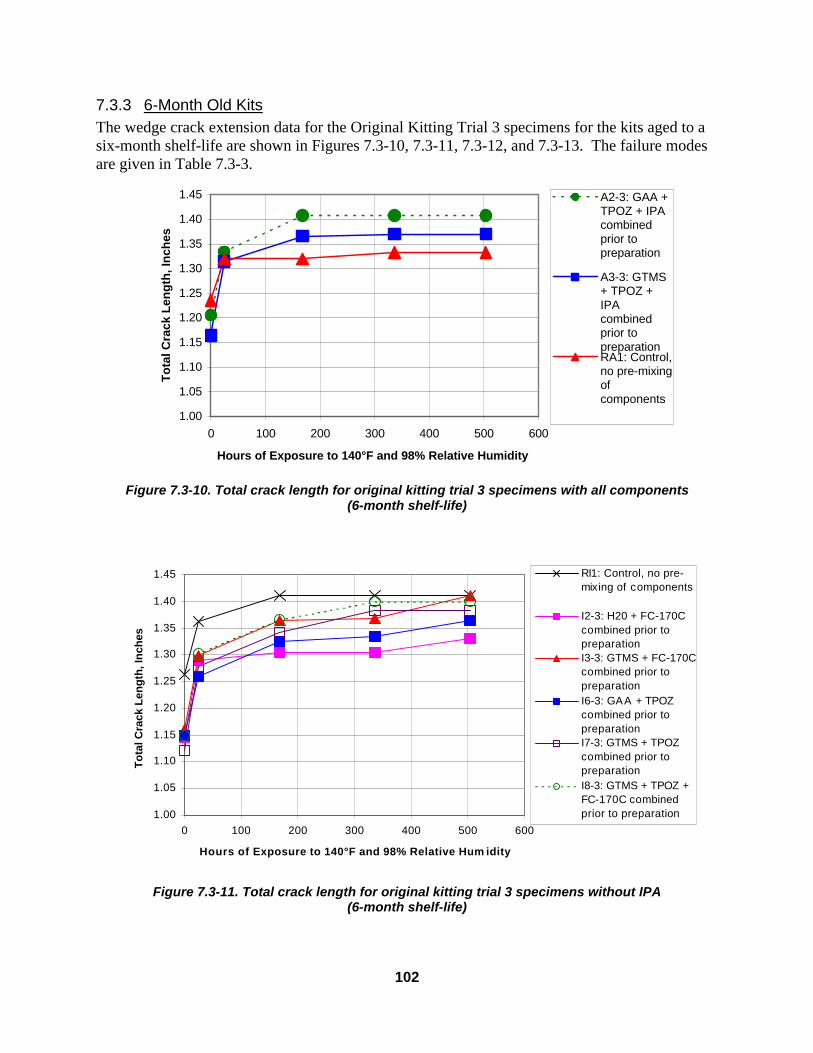
102
7.3.3 6-Month Old Kits The wedge crack extension data for the Original Kitting Trial 3 specimens for the kits aged to a six-month shelf-life are shown in Figures 7.3-10, 7.3-11, 7.3-12, and 7.3-13. The failure modes are given in Table 7.3-3.
1.00
1.05
1.10
1.15
1.20
1.25
1.30
1.35
1.40
1.45
0 100 200 300 400 500 600
Hours of Exposure to 140°F and 98% Relative Humidity
To
tal C
rack
Len
gth
, In
ches
A2-3: GAA +TPOZ + IPAcombinedprior topreparation
A3-3: GTMS+ TPOZ +IPAcombinedprior topreparationRA1: Control,no pre-mixingofcomponents
Figure 7.3-10. Total crack length for original kitting trial 3 specimens with all components
(6-month shelf-life)
1.00
1.05
1.10
1.15
1.20
1.25
1.30
1.35
1.40
1.45
0 100 200 300 400 500 600
Hours of Exposure to 140°F and 98% Relative Hum idity
To
tal C
rack
Len
gth
, In
ches
RI1: Control, no pre-mixing of components
I2-3: H20 + FC-170Ccombined prior topreparationI3-3: GTMS + FC-170Ccombined prior topreparationI6-3: GAA + TPOZcombined prior topreparationI7-3: GTMS + TPOZcombined prior topreparationI8-3: GTMS + TPOZ +FC-170C combinedprior to preparation
Figure 7.3-11. Total crack length for original kitting trial 3 specimens without IPA
(6-month shelf-life)

103
1.00
1.05
1.10
1.15
1.20
1.25
1.30
1.35
1.40
1.45
0 100 200 300 400 500 600
Hours of Exposure to 140°F and >98% Relative Humidity
To
tal C
rack
Len
gth
(in
ches
)
S2-3: TPOZ +IPA combinedprior topreparation
S3-3: GTMS +TPOZcombined priorto preparation
RS1: Control,no pre-mixing ofcomponents
Figure 7.3-12. Total crack length for original kitting trial 3 specimens without surfactant
(6-month shelf-life)
1.00
1.05
1.10
1.15
1.20
1.25
1.30
1.35
1.40
1.45
0 100 200 300 400 500 600
Hours of Exposure to 140°F and 98% Relative Humidity
To
tal C
rack
Len
gth
, In
ches
SI2-3: GAA +TPOZcombined priorto preparation
RSI1: Control,no pre-mixingof components
Figure 7.3-13. Total crack length for kitting trial 3 specimens without IPA or surfactant
(6-month shelf-life)

104
Table 7.3-3. Failure Modes for Kitting Trial 3 Specimens
Specimen #
Premixed Components
Failure Mode (% coh)
A2-3 GAA/TPOZ/IPA 97 A3-3 GTMS/TPOZ/IPA 72 I2-3 H2O/FC-170C 92 I3-3 GTMS/FC-170C 95 I6-3 GAA/TPOZ 98 I7-3 GTMS/TPOZ 86 I8-3 GTMS/TPOZ/FC-170C 96
SI2-3 GAA/TPOZ 95 S2-3 TPOZ/IPA 94 S3-3 GTMS/TPOZ 75
7.3.4 12-Month Old Kits The results for year-old kits containing all components are given in Figure 7.3-14. The results for year-old kits without IPA are shown in Figure 7.3-15. Figure 7.3-16 illustrates the wedge test results for year-old kits without surfactant. Wedge test results for year-old kits without surfactant or IPA are in Figure 7.3-17.
1.15
1.20
1.25
1.30
1.35
1.40
1.45
1.50
1.55
0 100 200 300 400 500 600
Hours of Exposure to 140°F and 98% Relative Humidity
To
tal C
rack
Len
gth
(in
ches
)
A2-4: GAA + TPOZ + IPA combined priorto preparationA3-4: GTMS + TPOZ + IPA combined priorto preparationRA1: Control, no pre-mixing of components
Figure 7.3-14. Total crack length for year-old first-generation kits with all components
21% coh
97% coh
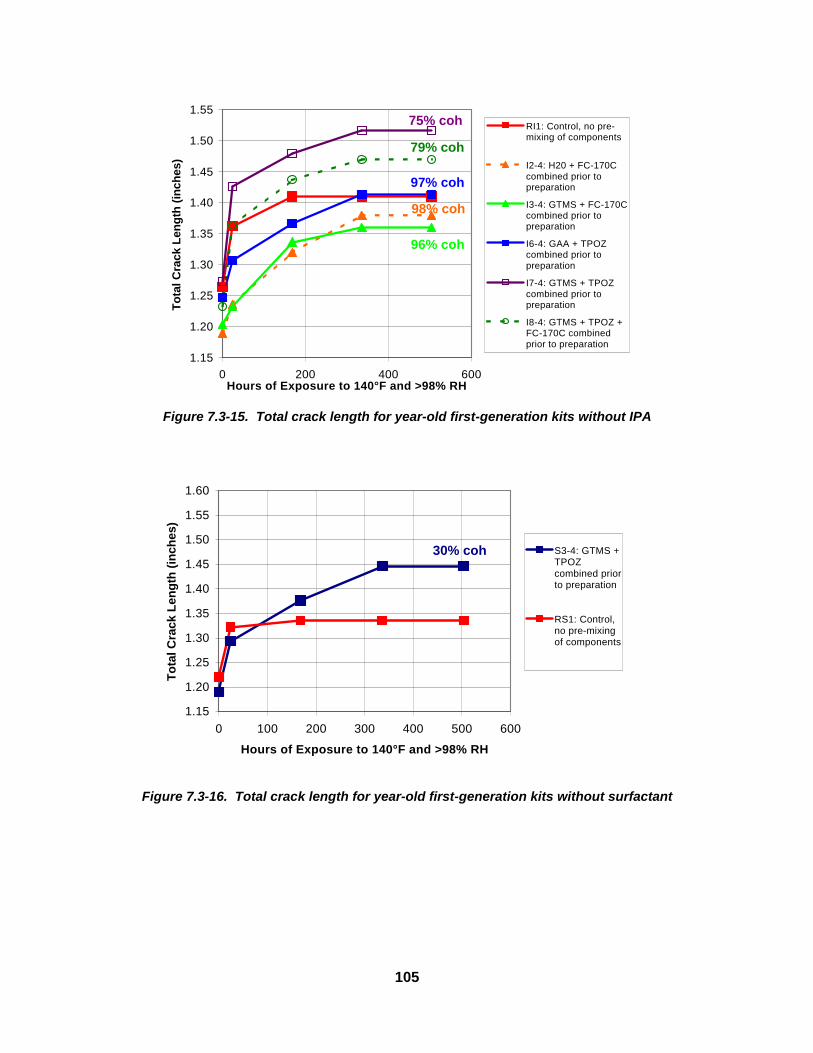
105
1.15
1.20
1.25
1.30
1.35
1.40
1.45
1.50
1.55
0 200 400 600Hours of Exposure to 140°F and >98% RH
To
tal C
rack
Len
gth
(in
ches
)
RI1: Control, no pre-mixing of components
I2-4: H20 + FC-170Ccombined prior topreparation
I3-4: GTMS + FC-170Ccombined prior topreparation
I6-4: GAA + TPOZcombined prior topreparation
I7-4: GTMS + TPOZcombined prior topreparation
I8-4: GTMS + TPOZ +FC-170C combinedprior to preparation
Figure 7.3-15. Total crack length for year-old first-generation kits without IPA
1.15
1.20
1.25
1.30
1.35
1.40
1.45
1.50
1.55
1.60
0 100 200 300 400 500 600
Hours of Exposure to 140°F and >98% RH
To
tal C
rack
Len
gth
(in
ches
)
S3-4: GTMS +TPOZcombined priorto preparation
RS1: Control,no pre-mixingof components
Figure 7.3-16. Total crack length for year-old first-generation kits without surfactant
75% coh coh
79% coh
97% coh
98% coh
96% coh
30% coh
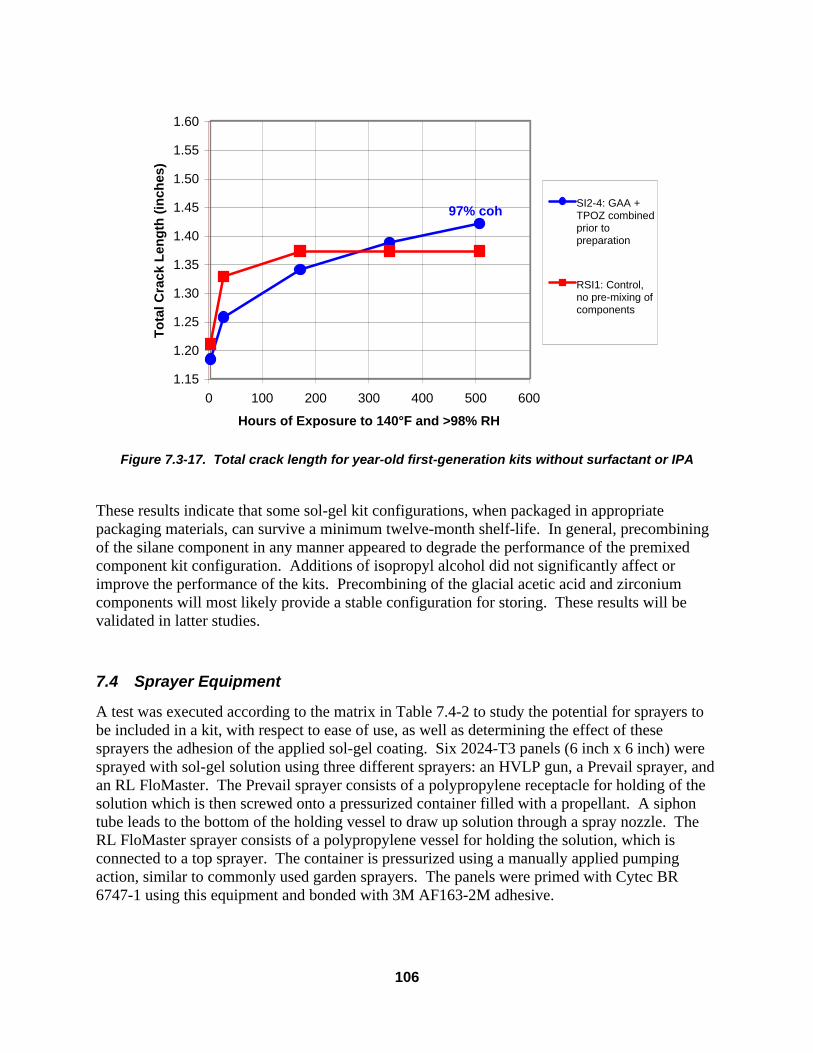
106
1.15
1.20
1.25
1.30
1.35
1.40
1.45
1.50
1.55
1.60
0 100 200 300 400 500 600
Hours of Exposure to 140°F and >98% RH
To
tal C
rack
Len
gth
(in
ches
)
SI2-4: GAA +TPOZ combinedprior topreparation
RSI1: Control,no pre-mixing ofcomponents
Figure 7.3-17. Total crack length for year-old first-generation kits without surfactant or IPA
These results indicate that some sol-gel kit configurations, when packaged in appropriate packaging materials, can survive a minimum twelve-month shelf-life. In general, precombining of the silane component in any manner appeared to degrade the performance of the premixed component kit configuration. Additions of isopropyl alcohol did not significantly affect or improve the performance of the kits. Precombining of the glacial acetic acid and zirconium components will most likely provide a stable configuration for storing. These results will be validated in latter studies.
7.4 Sprayer Equipment
A test was executed according to the matrix in Table 7.4-2 to study the potential for sprayers to be included in a kit, with respect to ease of use, as well as determining the effect of these sprayers the adhesion of the applied sol-gel coating. Six 2024-T3 panels (6 inch x 6 inch) were sprayed with sol-gel solution using three different sprayers: an HVLP gun, a Prevail sprayer, and an RL FloMaster. The Prevail sprayer consists of a polypropylene receptacle for holding of the solution which is then screwed onto a pressurized container filled with a propellant. A siphon tube leads to the bottom of the holding vessel to draw up solution through a spray nozzle. The RL FloMaster sprayer consists of a polypropylene vessel for holding the solution, which is connected to a top sprayer. The container is pressurized using a manually applied pumping action, similar to commonly used garden sprayers. The panels were primed with Cytec BR 6747-1 using this equipment and bonded with 3M AF163-2M adhesive.
97% coh
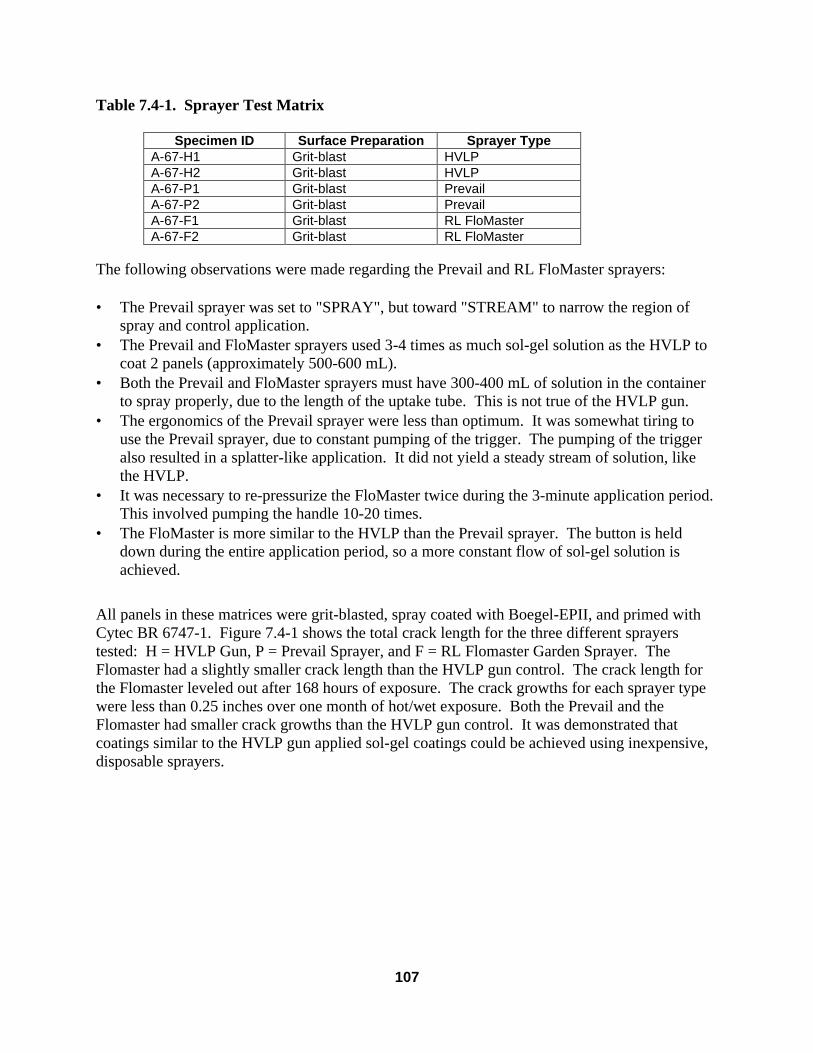
107
Table 7.4-1. Sprayer Test Matrix
Specimen ID Surface Preparation Sprayer Type A-67-H1 Grit-blast HVLP A-67-H2 Grit-blast HVLP A-67-P1 Grit-blast Prevail A-67-P2 Grit-blast Prevail A-67-F1 Grit-blast RL FloMaster A-67-F2 Grit-blast RL FloMaster
The following observations were made regarding the Prevail and RL FloMaster sprayers: • The Prevail sprayer was set to "SPRAY", but toward "STREAM" to narrow the region of
spray and control application. • The Prevail and FloMaster sprayers used 3-4 times as much sol-gel solution as the HVLP to
coat 2 panels (approximately 500-600 mL). • Both the Prevail and FloMaster sprayers must have 300-400 mL of solution in the container
to spray properly, due to the length of the uptake tube. This is not true of the HVLP gun. • The ergonomics of the Prevail sprayer were less than optimum. It was somewhat tiring to
use the Prevail sprayer, due to constant pumping of the trigger. The pumping of the trigger also resulted in a splatter-like application. It did not yield a steady stream of solution, like the HVLP.
• It was necessary to re-pressurize the FloMaster twice during the 3-minute application period. This involved pumping the handle 10-20 times.
• The FloMaster is more similar to the HVLP than the Prevail sprayer. The button is held down during the entire application period, so a more constant flow of sol-gel solution is achieved.
All panels in these matrices were grit-blasted, spray coated with Boegel-EPII, and primed with Cytec BR 6747-1. Figure 7.4-1 shows the total crack length for the three different sprayers tested: H = HVLP Gun, P = Prevail Sprayer, and F = RL Flomaster Garden Sprayer. The Flomaster had a slightly smaller crack length than the HVLP gun control. The crack length for the Flomaster leveled out after 168 hours of exposure. The crack growths for each sprayer type were less than 0.25 inches over one month of hot/wet exposure. Both the Prevail and the Flomaster had smaller crack growths than the HVLP gun control. It was demonstrated that coatings similar to the HVLP gun applied sol-gel coatings could be achieved using inexpensive, disposable sprayers.
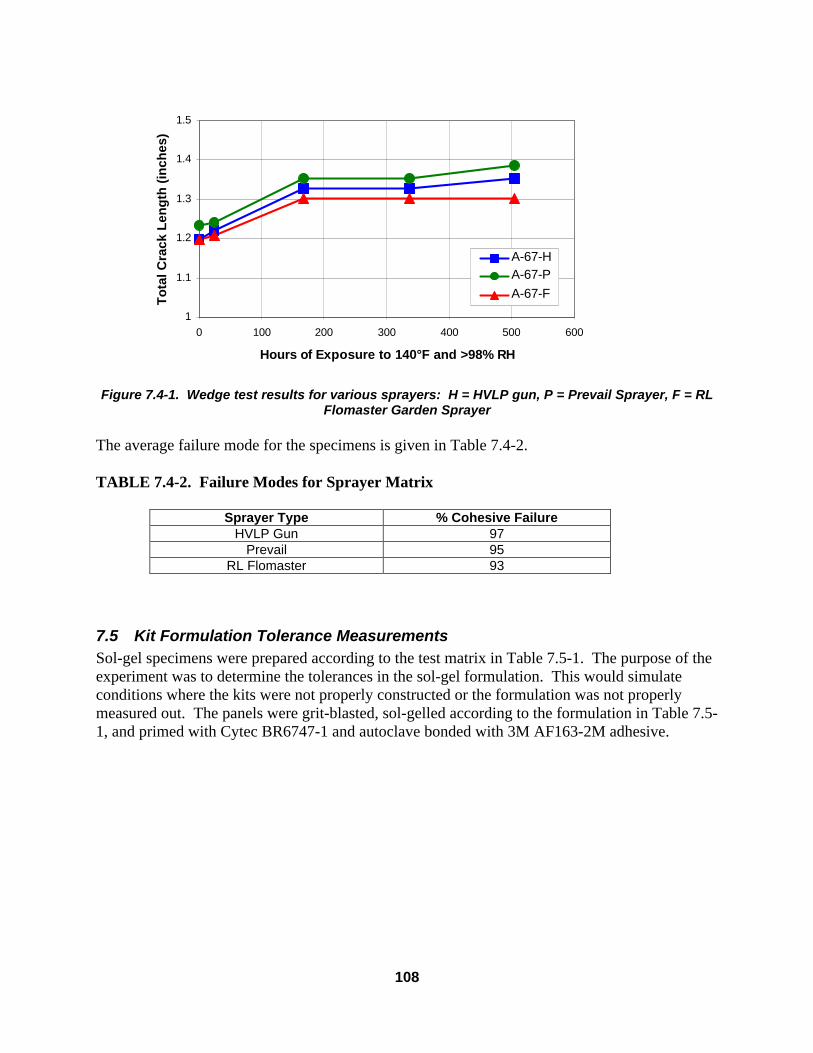
108
1
1.1
1.2
1.3
1.4
1.5
0 100 200 300 400 500 600
Hours of Exposure to 140°F and >98% RH
To
tal C
rack
Len
gth
(in
ches
)
A-67-HA-67-PA-67-F
Figure 7.4-1. Wedge test results for various sprayers: H = HVLP gun, P = Prevail Sprayer, F = RL
Flomaster Garden Sprayer The average failure mode for the specimens is given in Table 7.4-2. TABLE 7.4-2. Failure Modes for Sprayer Matrix
Sprayer Type % Cohesive Failure HVLP Gun 97
Prevail 95 RL Flomaster 93
7.5 Kit Formulation Tolerance Measurements Sol-gel specimens were prepared according to the test matrix in Table 7.5-1. The purpose of the experiment was to determine the tolerances in the sol-gel formulation. This would simulate conditions where the kits were not properly constructed or the formulation was not properly measured out. The panels were grit-blasted, sol-gelled according to the formulation in Table 7.5-1, and primed with Cytec BR6747-1 and autoclave bonded with 3M AF163-2M adhesive.

109
Table 7.5-1. Formulation Tolerances Test Matrix
SPECIMEN ID DI WATER (mL)
FC 170C (g/L)
GAA (mL) GTMS (mL) TPOZ (mL)
T-C-1 500 0.018 2.25 10 5 T-C-2 500 0.018 2.25 10 5 T-A3-1 500 0.018 2.5 11 5.5 T-A3-2 500 0.018 2.5 11 5.5 T-AS-1 500 0.018 2.25 11 5 T-AS-2 500 0.018 2.25 11 5 T-AZ-1 500 0.018 2.25 10 5.5 T-AZ-2 500 0.018 2.25 10 5.5 T-S3-1 500 0.018 2 9 4.5 T-S3-2 500 0.018 2 9 4.5 T-SS-1 500 0.018 2.25 9 5 T-SS-2 500 0.018 2.25 9 5 T-SA-1 500 0.018 2 10 5 T-SA-2 500 0.018 2 10 5 T-SZ-1 500 0.018 2.25 10 4.5 T-SZ-2 500 0.018 2.25 10 4.5
Adding or subtracting 10% from one or more components was tested to ascertain the tolerance level of chemicals in the sol-gel formulation. The various formulations tested and the failure modes are listed in Table 7.5-2. Wedge crack extension performance is reported in Figure 7.5-1. Table 7.5-2. Tolerance Matrix Specimens
Specimen Formulation % Cohesive Failure T-C Boegel-EPII 93 T-A3 Boegel-EPII + 10% more GAA, GTMS, TPOZ 97 T-AS Boegel-EPII + 10% more GTMS 96 T-AZ Boegel-EPII + 10% more TPOZ 93 T-S3 Boegel-EPII less 10% GAA, GTMS, TPOZ 77 T-SS Boegel-EPII less 10% GTMS 98 T-SA Boegel-EPII less 10% GAA 97 T-SZ Boegel-EPII less 10% TPOZ 66
The failure modes for most of the specimens were similar, but with one striking exception. Specimens prepared with 10% less TPOZ and 10% less of TPOZ, GAA, and GTMS give significantly worse failure modes. Since the failure modes for 10% less GAA and 10% less GTMS were >97% cohesive, it is probable that the variation in TPOZ is the critical factor. Figure 7.5-1 illustrates the wedge test data of the tolerance matrix specimens over 500 hours of exposure to 140°F and 98% relative humidity. With the exception of specimens with 10% more TPOZ and 10% less GTMS, all specimens were approximately equal to the control. All specimens showed relatively similar crack growth with less than 0.25 inches of crack growth over 30 days in a hot/wet environment. The specimen with 10% less GAA showed less crack growth than the control.
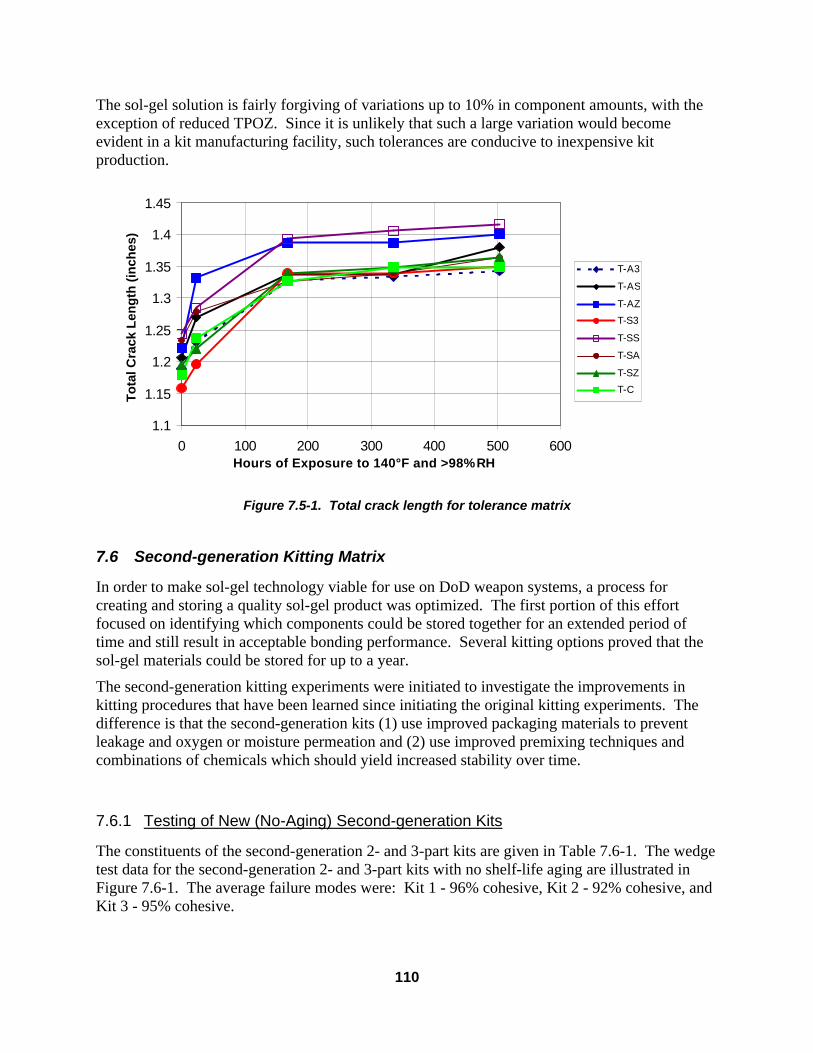
110
The sol-gel solution is fairly forgiving of variations up to 10% in component amounts, with the exception of reduced TPOZ. Since it is unlikely that such a large variation would become evident in a kit manufacturing facility, such tolerances are conducive to inexpensive kit production.
1.1
1.15
1.2
1.25
1.3
1.35
1.4
1.45
0 100 200 300 400 500 600Hours of Exposure to 140°F and >98% RH
To
tal C
rack
Len
gth
(in
ches
)
T-A3
T-AS
T-AZ
T-S3
T-SS
T-SA
T-SZ
T-C
Figure 7.5-1. Total crack length for tolerance matrix
7.6 Second-generation Kitting Matrix
In order to make sol-gel technology viable for use on DoD weapon systems, a process for creating and storing a quality sol-gel product was optimized. The first portion of this effort focused on identifying which components could be stored together for an extended period of time and still result in acceptable bonding performance. Several kitting options proved that the sol-gel materials could be stored for up to a year.
The second-generation kitting experiments were initiated to investigate the improvements in kitting procedures that have been learned since initiating the original kitting experiments. The difference is that the second-generation kits (1) use improved packaging materials to prevent leakage and oxygen or moisture permeation and (2) use improved premixing techniques and combinations of chemicals which should yield increased stability over time.
7.6.1 Testing of New (No-Aging) Second-generation Kits
The constituents of the second-generation 2- and 3-part kits are given in Table 7.6-1. The wedge test data for the second-generation 2- and 3-part kits with no shelf-life aging are illustrated in Figure 7.6-1. The average failure modes were: Kit 1 - 96% cohesive, Kit 2 - 92% cohesive, and Kit 3 - 95% cohesive.

111
Table 7.6-1. Second-generation 2-Part and 3-Part Sol-Gel Kit Components
Kit Number
Container 1 Container 2 Container 3 Container 4 Container 5
1 H2O, surfactant, GAA, and TPOZ
GTMS
2 H2O and surfactant
GTMS GAA, TPOZ, H2O
3 H2O and surfactant
GTMS GAA, TPOZ, IPA
Control H2O and surfactant
GTMS Empty GAA TPOZ
1.10
1.15
1.20
1.25
1.30
1.35
1.40
1.45
1.50
0 200 400 600 800 1000 1200
Hrs of Exposure to 140°F and >98% RH
To
tal C
rack
Len
gth
(in
ches
)
A-106-1-0: 2part
A-106-2-0: 3part w/water
A-107-3-0: 3part w/IPA
A-119-C-0: 5part
Figure 7.6-1. Initial wedge testing for the second-generation 2- and 3- part kits (no aging)
7.6.2 Second-generation Kits with 1-Month Shelf-life Testing
The wedge test data for the 2- and 3-part kits aged for 1-month are given in Figure 7.6-3.

112
1.00
1.051.10
1.151.20
1.25
1.301.35
1.401.45
1.50
0 200 400 600 800
Hours of Exposure to 140°F and >98% RH
To
tal C
rack
Len
gth
(in
ches
)A-107-1-1: 2part
A-109-2-1: 3part w/water
A-109-3-1: 3part w/IPA
A-114-C-1: 5part
Figure 7.6-3. Total crack length for second-generation 2- and 3- part kits (1-month shelf-life)
The average failure modes for the wedge specimens at the different shelf-life conditions are listed in Table 7.6-2. Table 7.6-2. Average Failure Modes for 2- and 3- Part Kits
Shelf-life Kit None 1-Month 1 96% cohesive 96% cohesive 2 92% cohesive 96% cohesive 3 95% cohesive 95% cohesive
Control 96% cohesive 96% cohesive
7.6.3 Second-Generation Kits with 6-Month Shelf-life Testing
Specimens were prepared from 6-month old kits, according to Table 7.6-3. Six-month shelf-life wedge crack data on kitted options are shown in Figure 7.6-5. These are compared against the control, which has all of the components packaged separately. Table 7.6-3. Second-Generation Kit Matrix
Kit Number
Container 1 Container 2 Container 3 Container 4 Container 5
1 H2O, surfactant, GAA, and TPOZ
GTMS
2 H2O and surfactant GTMS GAA, TPOZ, H2O
3 H2O and surfactant GTMS GAA, TPOZ, IPA
Control H2O and surfactant GTMS Empty GAA TPOZ
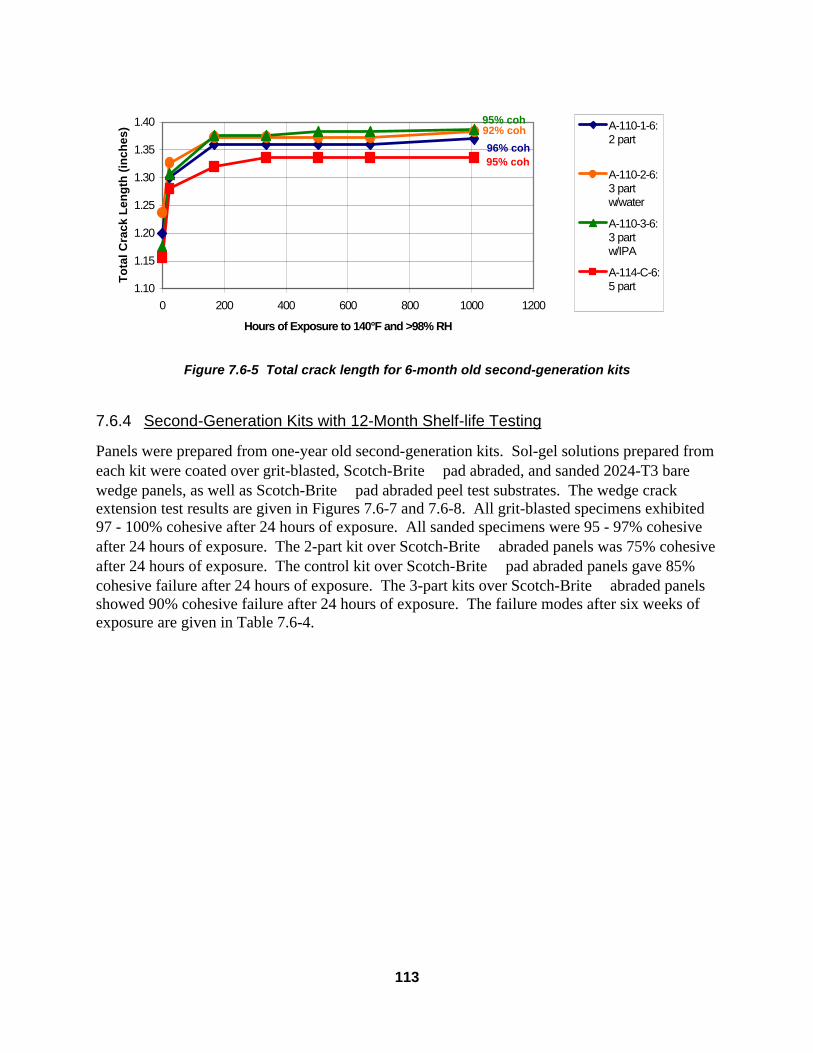
113
1.10
1.15
1.20
1.25
1.30
1.35
1.40
0 200 400 600 800 1000 1200
Hours of Exposure to 140°F and >98% RH
To
tal C
rack
Len
gth
(in
ches
) A-110-1-6:2 part
A-110-2-6:3 partw/water
A-110-3-6:3 partw/IPA
A-114-C-6:5 part
Figure 7.6-5 Total crack length for 6-month old second-generation kits
7.6.4 Second-Generation Kits with 12-Month Shelf-life Testing
Panels were prepared from one-year old second-generation kits. Sol-gel solutions prepared from each kit were coated over grit-blasted, Scotch-Brite pad abraded, and sanded 2024-T3 bare wedge panels, as well as Scotch-Brite pad abraded peel test substrates. The wedge crack extension test results are given in Figures 7.6-7 and 7.6-8. All grit-blasted specimens exhibited 97 - 100% cohesive after 24 hours of exposure. All sanded specimens were 95 - 97% cohesive after 24 hours of exposure. The 2-part kit over Scotch-Brite abraded panels was 75% cohesive after 24 hours of exposure. The control kit over Scotch-Brite pad abraded panels gave 85% cohesive failure after 24 hours of exposure. The 3-part kits over Scotch-Brite abraded panels showed 90% cohesive failure after 24 hours of exposure. The failure modes after six weeks of exposure are given in Table 7.6-4.
95% coh 96% coh
92% coh 95% coh

114
1.15
1.20
1.25
1.30
1.35
1.40
1.45
1.50
0 200 400 600 800 1000 1200
Hours of Exposure to 140°F and 98% Relative Humidity
To
tal C
rack
Len
gth
, in
ches
A-111-1-12A: 2 part
A-111-2-12A: 3 part w/water
A-111-3-12A: 3 part w/IPA
A-115-C-12A: 5 part
Figure 7.6-7. Wedge crack test data for grit-blasted specimens prepared from one-year old second-generation kits
1.10
1.20
1.30
1.40
1.50
1.60
1.70
1.80
0 200 400 600 800 1000 1200
Hours of Exposure to 140°F and 98% Relative Hum idity
To
tal C
rack
Len
gth
, in
ches
A -111-1-12A : B o egel-EP II from a year o ld 2-partkit over grit blasted 2024-T3
A -111-1-12B : B o egel-EP II from a year o ld 2-partkit over Scotch-Brite abraded 2024-T3
A -111-1-12C: B o egel-EP II from a year o ld 2-partkit over sanded 2024-T3
A -111-2-12A : B o egel-EP II from a year o ld 3-partw/water kit over grit blasted 2024-T3
A -111-2-12B : B o egel-EP II from a year o ld 3-partw/water kit over Scotch-B rite abraded 2024-T3
A -111-2-12C: B o egel-EP II from a year o ld 3-partw/water kit over sanded 2024-T3
A -111-3-12A : B o egel-EP II from a year o ld 3-partw/IPA k it over grit blasted 2024-T3
A -111-3-12B : B o egel-EP II from a year o ld 3-partw/IPA k it over Scotch-Brite abraded 2024-T3
A -111-3-12C: B o egel-EP II from a year o ld 3-partw/IPA k it over sanded 2024-T3
A -115-C-12A : B o egel-EP II from a year o ld 5-partkit over grit blasted 2024-T3
A -115-C-12B : B o egel-EP II from a year o ld 5-partkit over Scotch-Brite abraded 2024-T3
A -115-C-12C: B o egel-EP II from a year o ld 5-partkit over sanded 2024-T3
Figure 7.6-8. Wedge crack test data for all specimens prepared from
one-year old second-generation kits
100% coh
98% coh
100% coh
97% coh 97% coh
96% coh
99%
96% coh
90% coh
97% coh
98% coh
98% coh

115
Table 7.6-4. Failure Modes of Specimens Prepared from 1-Year Old Kits after Six Weeks of Exposure (Wedge Test)
Sanded Substrate Scotch-Brite Pad
Abraded Substrate Grit-blasted Substrate
Control Kit 67% cohesive 22% cohesive 90% cohesive 2-Part Kit 82% cohesive 20% cohesive 97% cohesive
3-Part with Water 58% cohesive 47% cohesive 98% cohesive 3-Part with IPA 25% cohesive 23% cohesive 98% cohesive
A comparison of wedge test performance for grit-blasted specimens prepared from second-generation kits is shown in Figure 7.6-9.
0.00
0.05
0.10
0.15
0.20
0.25
0.30
No Shelf-Life 1-Month 6-Month 12-Month
Kit Shelf Life
Cra
ck G
row
th (
inch
es)
1.32
1.34
1.36
1.38
1.40
1.42
1.44
1.46
1.48
1.50
Total Crack Length
(inches)
Control, 5 part 2 part 3 part, w/ water 3 part, w/ IPA
Control, 5 part 2 part 3 part, w/ water 3 part, w/ IPA
Figure 7.6-9. Comparison of grit-blasted specimens prepared from kits of different ages after 1000 hrs of exposure to 140°F and 98% RH. Bars show crack extension and the lines show the total
crack length. Unless otherwise noted, failure mode is at least 95% cohesive.
7.7 Simplified Kit Mixing A kit mixing procedure that greatly simplifies the stepwise sequence of chemical mixing, was tested for its end-effects on bond durability. Wedge test substrates of 2024-T3 bare were grit-and coated with Boegel-EPII, mixed according to the variables in Table 7.7-1. All were primed with Cytec BR 6747-1, 20% solids, within 24 hours and were bonded with AF 163-2M. Wedge crack extension test results are given in Figure 7.7-1. All had approximately 98% cohesive failure after 1000 hours of exposure.
93%
co
h
93%
co
h
90%
co
h
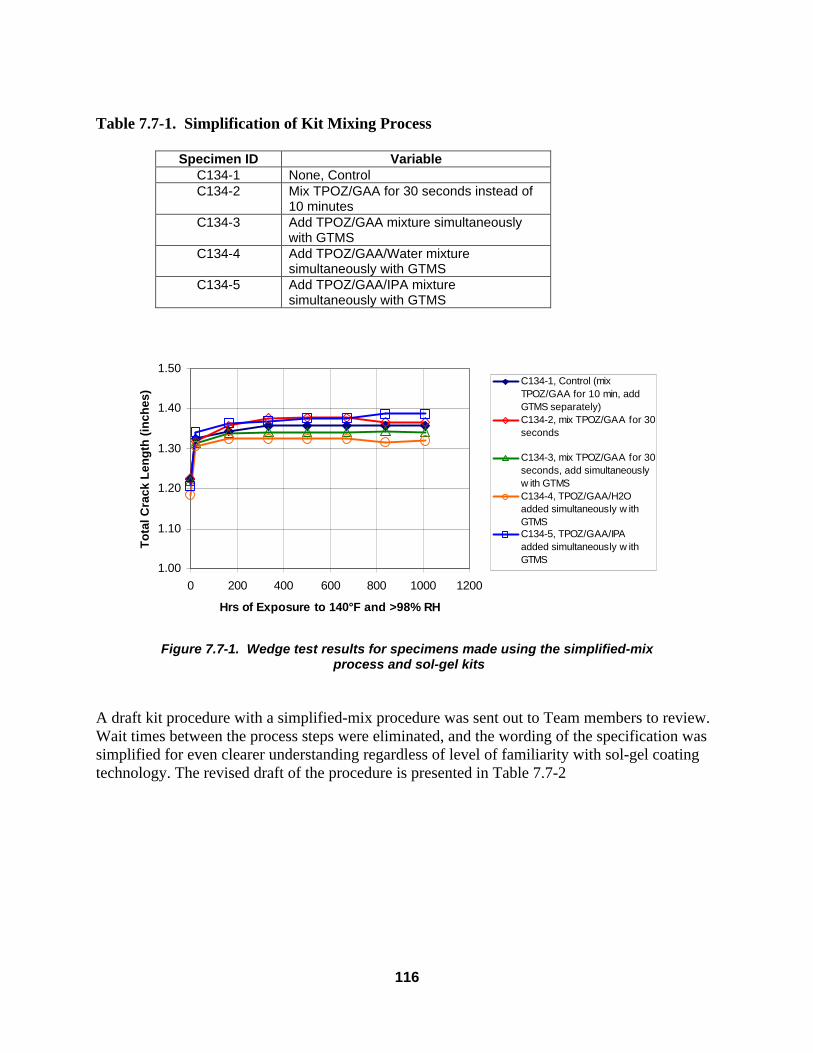
116
Table 7.7-1. Simplification of Kit Mixing Process
Specimen ID Variable C134-1 None, Control C134-2 Mix TPOZ/GAA for 30 seconds instead of
10 minutes C134-3 Add TPOZ/GAA mixture simultaneously
with GTMS C134-4 Add TPOZ/GAA/Water mixture
simultaneously with GTMS C134-5 Add TPOZ/GAA/IPA mixture
simultaneously with GTMS
1.00
1.10
1.20
1.30
1.40
1.50
0 200 400 600 800 1000 1200
Hrs of Exposure to 140°F and >98% RH
To
tal C
rack
Len
gth
(in
ches
)
C134-1, Control (mixTPOZ/GAA for 10 min, addGTMS separately)C134-2, mix TPOZ/GAA for 30seconds
C134-3, mix TPOZ/GAA for 30seconds, add simultaneouslyw ith GTMSC134-4, TPOZ/GAA/H2Oadded simultaneously w ithGTMSC134-5, TPOZ/GAA/IPAadded simultaneously w ithGTMS
Figure 7.7-1. Wedge test results for specimens made using the simplified-mix
process and sol-gel kits A draft kit procedure with a simplified-mix procedure was sent out to Team members to review. Wait times between the process steps were eliminated, and the wording of the specification was simplified for even clearer understanding regardless of level of familiarity with sol-gel coating technology. The revised draft of the procedure is presented in Table 7.7-2

117
Table 7.7-2. Sol-Gel Simplified Kit Mix Procedure The sol-gel solution, Boegel-EPII , shall be prepared according to the kitting procedure shown in Table. Use kit size appropriate for size of area to be treated. For example, approximately 100 mL of the sol-gel solution will be enough to coat about 2 square feet of bond zone. Scale up as required. Step Procedure Equipment Control
1 Dispense Syringe A1 into container A and shake or agitate for 1-3 minutes.
Syringe A1 Container A
Liquid in Syringe A1 and Container A should be clear and colorless. Mixture should be clear and colorless.
2 Dispense Syringe B1 into empty Container B. CAUTION: Avoid skin contact with the liquid.
Syringe B1 Container B
Liquid in Syringe B1 should be clear and colorless. Container B should be clean and empty prior to use.
3 Dispense Syringe B2 into Container B and shake or agitate for 1-3 minutes. CAUTION: Some heat may be released as the reaction is exothermic.
Syringe B2 Container B
Syringe B2: There should be no white particles in the yellow liquid. White matter clogging the syringe tip is acceptable. If syringe is clogged, pull back slightly on the plunger to release the clog and dispense liquid.
4 Pour Container B contents into Container A. Shake vigorously for 1-3 minutes.
Container A Container B
Solution should be clear to slightly cloudy (milky looking).
5 Allow solution in Container A to sit at room temperature for a minimum induction time of 30 minutes.
Container A
6 Shake Container A for a minimum of one minute immediately prior to application.
Container A
b. The induction time for the sol-gel solution is 30 minutes. The pot life of the mixed solution is 10 hours after induction time is complete. Clearly label the sol-gel solution with the allowed application period or pot-life (time from completion of step 5 plus 10 hours).
7.7.1 Verification of Simplified-Mix Process for Kits
The simplified-mix process was verified at Boeing by performing tests on grit-blasted, sanded and Scotch-Brited bare 2024-T3 aluminum alloy. Two sets of each were treated with Boegel-EPII (simplified kit procedure), primed with Cytec BR6747-1 and bonded using AF 163-2M adhesive. Parallel sets were prepared using the standard lab-mixed procedure. Specimens were given the following designations:
Grit-blasted AA04-1 & AA04-2 and AA04-1X & AA04-2X Sanded AA04-3 & AA04-4 and AA04-3X & AA04-4X Scotch-Brite abraded AA04-5 & AA04-6 and AA04-5X & AA04-6X
The designation X after the sample number signifies sets treated with simplified kit process. All other sets were mixed using the baseline process. The wedge test results are presented in Figures 7.7-2 and 7.7-3.

118
1.00
1.10
1.20
1.30
1.40
1.50
1.60
0 200 400 600 800
Hrs of Exposure to 140°F and >98% RH
To
tal C
rack
Len
gth
(in
ches
)
AA04-1
AA04-2
AA04-3
AA04-4
AA04-5
AA04-6
Figure 7.7-2. Standard-mixed sol-gel kit procedure
1.00
1.10
1.20
1.30
1.40
1.50
1.60
0 200 400 600 800 1000 1200
Hrs of Exposure to 140°F and >98% RH
To
tal C
rack
Len
gth
(in
ches
)
AA04-1X
AA04-2X
AA04-3X
AA04-4X
AA04-5X
AA04-6X
Figure 7.7-3. Simplified-mix procedure initial run study
7.8 Vendor-Supplied Sol-Gel Kit Evaluation
Tests of prototype sol-gel kits prepared by an external vendor were conducted to confirm the performance on aluminum alloy. A prototype dual-pack GAA/TPOZ was received from a commercial vendor. Upon receipt, the outside of the package had an acetic acid odor, suggesting

119
the dual-pack polymeric packaging material is somewhat permeable to GAA or that a small amount was spilled onto the outside the pack during preparation leaving a residual material that was causing the odor.
Initial testing of the concept package showed that it was relatively inconvenient to use. It was noted that there was some white precipitate in the TPOZ side of the bag before it was opened. The white precipitate remained in the mixture of TPOZ and GAA even after mixing. However, the experiment was allowed to proceed with these inferior materials. It was difficult to remove all of the material from the package. The technician rolled the plastic bag down from the top to the bottom to try and get all of the material out of the bag, but it was a messy and inexact process. The bag and material were weighed before and after to make sure that an appropriate amount of material was deployed from the package. The weight of the material removed from the package was 7.19 grams of the 7.25 grams that theoretically should have been in the package, a loss of about 1% of the weight.
The mixing process was accomplished by removing the clip at the middle of the clip-pack and manipulating the package around to mix up the materials within. The mixing was carried for ten minutes to keep with the standard mixing procedure. At the conclusion of the mix period, the TPOZ/GAA mixture was dispensed by cutting off a corner of the package and pouring the contents into the mix vessel through the cut opening. It is important to note that a scissors was required to open the package. Use of extraneous tools is undesirable since they may or may not be available at the repair location site.
Two sets of #180 grit-blast (1212-1 & 4) and two sets of #220 alumina sanded (1212-6 & 8) Al 2024-T3 6 inch x 6 inch specimens were treated, primed with Cytec BR6747-1 and bonded with 3M AF163-2M to test the performance of these materials. Specimens pulled at 2 weeks show failure modes of 99% cohesive and 94% cohesive for grit-blasted and sanded specimens respectively. Wedge test results are presented in Figure 7.8-1. Additional development of simple kits will be carried out in conjunction with commercial sol-gel kit suppliers.
1.15
1.20
1.25
1.30
1.35
1.40
0 200 400 600 800 1000 1200
Hrs of Exposure to 140°F & >98% RH
To
tal C
rack
Len
gth
(in
ches
)
AA07-1A; GB/BR200
AA07-1B; GB/BR200
AA07-2A;sand/BR200
AA07-2B;sand/BR200
Figure 7.8-1. Prototype vendor-supplied kit performance (standard-mix procedure)

120
8 Characterization
This section details a portion of the characterization studies that were carried out under this program. Much of the characterization work was carried out in conjunction with our Team members, and a detailed accounting of this work will be accounted for in the Team’s final technical report. Portions of the testing carried out at Boeing are described below.
8.1 Gloss Meter Measurements To give a semiquantitative idea of the degree of surface roughness that is achieved using the various mechanical deoxidation processes, a gloss meter was employed to see if the level of gloss and degree of mechanical treatment could be correlated. Several of Al 2024-T3 panels were cleaned and/or mechanically deoxidized using different methods as described in Table 8.1-2. The testing was all performed on mill-annealed sheet as supplied from the vendor. Actual hardware surfaces to be bonded may be formed from other types of stock with different surface finishes. Table 8.1-2. Gloss Meter Measurements for Various Pretreatments on Aluminum 2024-T3 Angle of Measurement on Gloss Meter
Sample # Pretreatment 20° 60° 85° R29-1 MEK solvent wiped, bare >200 >200 128.5 R29-2 #180 alumina grit-blasted, bare 1.4 4.2 4.6 R29-3 Brulin 815GD degreased, Turco
2623 alkaline cleaned, and Boeclene etched, bare
196.6 >200 130.4
R29-4 0.005” stainless steel wire wheel abraded, bare
18.7 94.1 40.0
R29-5 #240 alumina flapwheel abraded, bare
37.0 150.0 84.7
R29-6 #220 alumina sanded, bare 26.1 95.5 35.1 R29-7 #400 SiC sanded, bare 14.0 64.1 38.2 R29-8 #600 SiC sanded, bare 10.1 46.1 32.3 R29-9 #1500 SiC sanded, bare 53.6 126.1 110.5
8.2 X-Ray Absorption Spectroscopy (XAS)
This section summarized the results of X-Ray Absorption Spectroscopy (XAS) measurements, including extended x-ray absorption fine structure (EXAFS) and x-ray absorption near edge structure (XANES), of the sol-gel materials carried out at the Stanford Synchrotron. Of particular interest was the nature of the chemical bonding and the effect of selected process variations. XAS is ideally suited for these measurements since it is sensitive to coordination number, bond length, disorder, valency, and site symmetry in these amorphous materials.
XANES has been shown to be sensitive to the site symmetry and coordination of the absorbing atom. Several standard zirconium-containing reference compounds were analyzed to model the different coordination sites possible for this atom. It can be postulated, using the standard reference compounds as a guide, that the sol-gels exhibiting a doublet feature since their XANES have a large fraction of Zr in network-forming octahedra that are joined primarily at the corners. It appears that the Zr is not in such a site unless the silane component is present and both are on a

121
metal substrate. The plots indicate that Zr is found in a mix of 6-fold and 8-fold sites. The plots also indicate that the valency of the Zr in the sol-gels is approximately 3+. Close examination shows a chemical shift of the position of the Zr K-edge when the sol-gel is deposited on a metal substrate.
EXAFS results indicated that sol-gel powders (that had been deposited on polyethylene, removed, and ground up, but never deposited on a metal surface) have a longer Zr-O bond length, which implies coordination numbers of 7 or 8. Coatings formulated from TPOZ alone, without any GTMS, deposited on a metal surface also show a longer Zr-O bond. When both the Zr and Si components are used and the sol-gel is deposited on a titanium surface, the Zr-O bond length shortens.
A peak exists for specimens with sol-gel deposited on a titanium surface that does not occur in the free sol-gel polymer. This analysis was used to infer the presence of a Zr-O-Ti bond in the sol-gel. More analysis is necessary to verify the presence of this bond.
Sol-gel coating samples that were cured in air at RT or at 255°F were examined. The XANES and EXAFS data suggest only subtle differences between these methods of curing and indicate that the bonding at the Zr is essentially the same.
Investigations of aged specimens of sol-gel coated titanium samples that had been left under ambient conditions for over a year, indicate no great differences in the first neighbor coordinating atoms.
8.3 Infrared Spectroscopy Characterization Study
Sol-gel solutions, using the Boegel-EPII formulation, and coated panels were analyzed using infrared spectroscopy. There were several goals for this initial characterization effort. First, to determine whether the epoxy linkage in the organosilane component could be observed during the processing, and what the fate of this functionality was over the course of the processing. Secondly, to determine what was happening to the chemistry of the coating, and network formation, during curing at both room temperature and elevated temperatures. This would help determine processing conditions to call out in the specified process documents. To understand the aging characteristics of the sol-gel solution and the structure/property changes in the deposited sol-gel coating, the following infrared analysis studies were conducted.
8.3.1 Sol-Gel Chemistry Evaluation
The sol-gel solution contains GTMS, zirconium n-propoxide (TPOZ), n-propanol (TPOZ solution contains 25% n-propanol and TPOZ hydrolyzes to produce n-propanol), glacial acetic acid (GAA), methanol (produced during the hydrolysis of the GTMS) and water. The sol-gel solution is formed by adding a TPOZ / GAA solution to a flask containing the hydrated silane. A solution of TPOZ, GAA and water is currently under evaluation as a kitting component and an IR scan of the solution was carried out and subjected to spectral analysis.

122
Four different sol-gel based solutions were analyzed. These were:
(1) GTMS-based sol-gel solution This is a scan of a standard GTMS-based sol-gel solution. The solution was aged 15 minutes prior to scanning. A water blank was used to correct for the presence of water in the sample (automatically subtracts the absorbance due to water).
(2) GTMS-based sol-gel solution, aged 4 weeks
This is the same solution used in the previous scan. However, as part of an ongoing aging study of the kitting components it was scanned again after aging for 4 weeks. As before, a water background was used to remove the water absorptions.
(3) GTMS-based sol-gel, RT-dried
This is an IR pattern of an aluminum panel (2024 T3 bare) that was treated with the GTMS-based sol-gel (solution age 30 minutes) and then air dried 30 minutes prior to scanning. An aluminum blank was used to remove the background.
(4) GTMS-based sol-gel, 250 °F cure
This is an IR pattern of an aluminum panel treated in the same manner as before. However, in this case the sol-gel film was cured for 30 minutes at 250°F (done after the 30 minute air dry). As before, an aluminum blank was used to remove the background.
The interpretation of an infrared spectrum is not a simple matter and is described in Section 8.3.2 below. Absorption bands may be obscured by the overlapping of other bands. In addition, the absorption bands of a particular group may be shifted by various structural features such as electron withdrawal by a neighboring group and hydrogen bonding (particularly a problem in aqueous solutions). All the peaks in the pattern are really a composite of absorption bands from all the components. Therefore, the peak identifications only show the species with the major absorption in that area of the spectrum.
Most of the peaks in the IR patterns have been identified. However, a number of smaller peaks (particularly in the region of 1600 cm-1 to 1200 cm-1) were not identified. These bands are in the fingerprint region and are due to a number of different potential absorbencies.
8.3.2 Characteristic Group Frequencies
The characteristic group frequencies for methanol, silicon-oxygen-silicon (Si-O-Si), epoxide and silicon bonded to a methoxy group (Si-OCH3) are summarized in Table 8.3-1.
Table 8.3-1. Characteristic Group Frequencies
Species Characteristic Absorbencies (cm-1) Methanol 2950, 2840, 1460-1420, 1120, 1030 - 1015 Strong Si - O - Si 1100 - 1000 Epoxide 3059, 2999, 1479, 1256, 914, 851

123
8.3.3 TPOZ, GAA, and H2O
The initial IR scan of the TPOZ / GAA / H20 solution is shown in Figures 8.3-1 and 8.3-1.
2879
29392964
3373
0.0
0.2
0.4
0.6
0.8
1.0
1.2
1.4A
bsor
banc
e
2200 2400 2600 2800 3000 3200 3400 3600 3800 Wavenumbers (cm-1)
Figure 8.3-1. TPOZ / GAA/ H2O initial scan (4000 cm-1 - 2000 cm-1)
860888
965
1016
1051
1068
1097
12691417
1452
1556
1645
1714
0.0
0.2
0.4
0.6
0.8
1.0
1.2
1.4
1.6
1.8
Abs
orba
nce
800 1000 1200 1400 1600 1800 2000 Wavenumbers (cm-1)
Figure 8.3-2. TPOZ / GAA/ H2O initial scan (2000 cm-1 - 650 cm-1)
The relative peak intensity (A/Ao) is a percentage of the peak height relative to the maximum absorption in the pattern. The value is commonly used to index a spectrum. However, care must be taken when interpreting the data, as changes in background or peaks located on the shoulders of other peaks will affect the values. The IR pattern and the identified absorbing species for the TPOZ / GAA / H20 solution are presented in Table 8.3-2.

124
Table 8.3-2. IR Pattern for TPOZ / GAA / H2O Solution
Frequency cm-1
A/Ao Species
3373 67 OH from H2O and n-Propanol 2964 46 CH3 out of phase 2939 41 CH2 out of phase 2879 36 CH3 in phase 1714 49 CH3COOH un-dimerized, carbonyl stretch
1645 36 H2O scissoring 1556 53 CH3CO2
- salt, CO2 out of phase stretch 1452 76 CH3 out of phase, CH2 scissoring 1417 68 n-propanol, OH in phase, CO2
- in phase stretch
1269 59 C-O (carbon single bond to oxygen from GAA)
1097 31 n-propanol 1068 66 n-propanol 1051 91 n-propanol 1016 74 n-propanol 965 100 n-propanol 888 56 n-propanol 860 56 n-propanol
With the exception of the CH3 and CH2 absorptions, no bands were identified as resulting from zirconium compounds. This was not unexpected, as the zirconium mole fraction is around 5%.
8.3.4 GTMS-Based Sol-Gel Solution
The IR scan of the initial GTMS-based sol-gel solution is shown in Figures 8.3-3 and 8.3-4.
28542873
29262953
-0.005
0.000
0.005
0.010
0.015
0.020
0.025
0.030
0.035
0.040
0.045
0.050
0.055
Abs
orba
nce
2300 2400 2500 2600 2700 2800 2900 3000 Wavenumbers (cm-1)
Figure 8.3-3. GTMS sol-gel aged 30 minutes (3100 cm-1 - 2100 cm-1)

125
851
913
963
1016
10481069
1095
1201
12611275
1350
14171450
-0.010
0.000
0.010
0.020
0.030
0.040
0.050
0.060
0.070
0.080
0.090
0.100
0.110
Abs
orba
nce
800 900 1000 1100 1200 1300 1400 1500 Wavenumbers (cm-1)
Figure 8.3-4. GTMS sol-gel aged 30 minutes (1500 cm-1 - 650 cm-1)
The epoxide group can be seen in several of the bands (1261, 913 and 851 cm-1). The peaks at 913 and 851 cm-1 are the most visible and are particularly important. The noncyclic ether peak is at 1095 cm-1. Methanol from the hydrolysis of the GTMS is evident in two peaks (1417 and 1016 cm-1). No peaks could be identified that could be assigned to the methoxy protection groups. In addition, work on other silanes with methoxy protection groups has shown that the strongest methoxy absorbencies (in a water-alcohol solution) are at 1192, 1061 and 807 cm-1
. The 1192 and 807 bands are missing from the pattern. Therefore, it is believed that the methoxy groups have been hydrolyzed.
The IR scan of the aged GTMS-based sol-gel solutions are shown in Figures 8.3-5 and 8.3-6.
2850
2885
2945
-0.005
0.000
0.005
0.010
0.015
0.020
0.025
0.030
0.035
0.040
0.045
0.050
Abs
orba
nce
2200 2300 2400 2500 2600 2700 2800 2900 3000 Wavenumbers (cm-1)
2952
Figure 8.3-5. GTMS sol-gel aged 4 weeks (3100 cm-1 - 2100 cm-1)

126
916962
1016
1049
10681095
12011275
14131450
-0.010
0.000
0.010
0.020
0.030
0.040
0.050
0.060
0.070
0.080
0.090
0.100
0.110
0.120
Abs
orba
nce
800 900 1000 1100 1200 1300 1400 1500
Wavenumbers (cm-1)
850
Figure 8.3-6. GTMS sol-gel aged 4 weeks (1500 cm-1 - 650 cm-1)
After aging, the epoxide bands at 1261, 916 and 850 cm-1 became significantly smaller. The amount of IR radiation absorbed is directly related to the total number of bonds responding to that particular frequency. This makes the absorption directly related to the molar concentration. Therefore, the reduction in the epoxide peak area indicates a decrease in the epoxide concentration. In addition, the CH2 peaks at 2945 and 2885 cm-1 are different and indicate a new type of CH2 group that formed when the epoxide ring opened. The peak for the non-cyclic ether remained relatively constant, and that ether appears to be stable under these conditions.
The IR patterns and the identified absorbing species for both the initial and aged sol-gel solutions are presented in Table 8.3-3.
Table 8.3-3. IR Pattern for Initial GTMS-Based Sol-Gel Solutions
Initial Solution Aged Solution Species cm-1 A/Ao cm-1 A/Ao 2953 41 2952 30 CH3 2926 45 2944 31 CH2 2873 29 2885 24 CH3 2854 28 2850 19 CH2 1450 25 1450 23 CH3, CH2 1417 23 1414 24 OH in plane (methanol) 1350 8 1352 12 1275 13 1275 18 1261 12 *** *** C-O stretch (epoxide) 1201 8 1201 15 1165 6 *** *** 1095 56 1095 64 C-O-C (non-cyclic ether) 1069 46 1068 59 n-propanol 1048 45 1049 59 n-propanol 1016 100 1016 100 C-OH (methanol) 963 28 962 28 n-propanol 913 53 916 31 epoxide (out of phase ) 851 27 851 17 epoxide (out of phase )
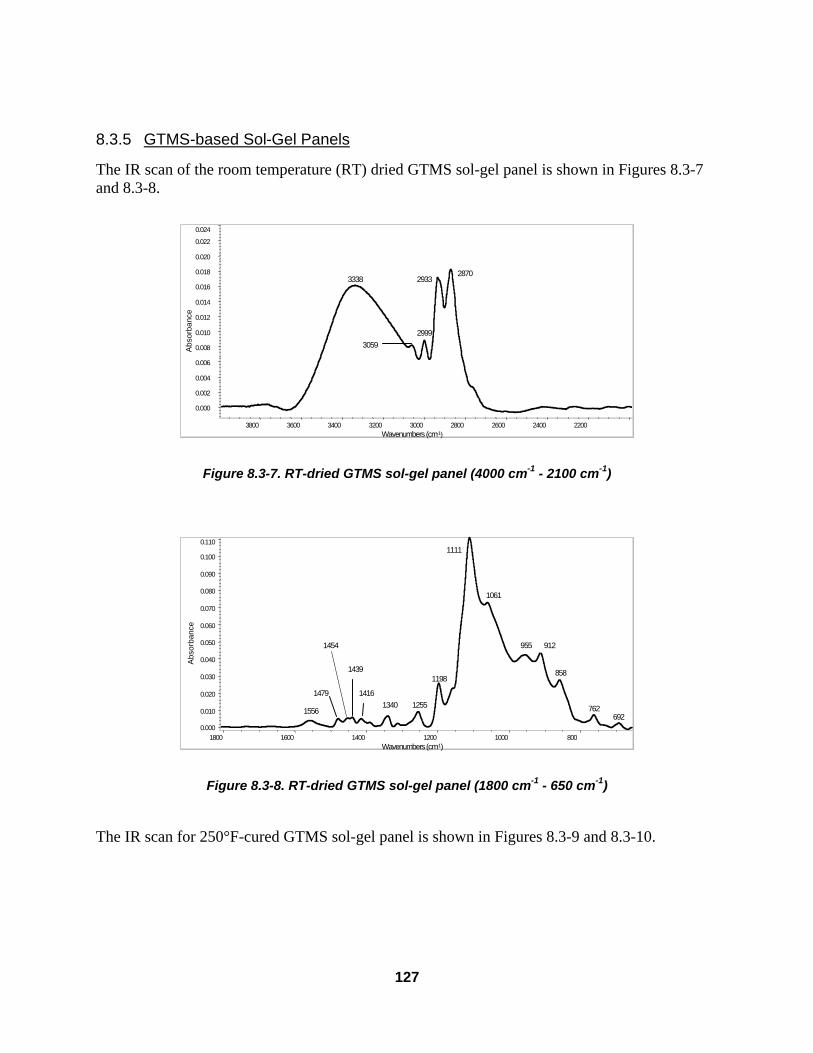
127
8.3.5 GTMS-based Sol-Gel Panels
The IR scan of the room temperature (RT) dried GTMS sol-gel panel is shown in Figures 8.3-7 and 8.3-8.
28702933
29993059
3338
0.000
0.002
0.004
0.006
0.008
0.010
0.012
0.014
0.016
0.018
0.020
0.022
0.024
Abs
orba
nce
2200 2400 2600 2800 3000 3200 3400 3600 3800 Wavenumbers (cm-1)
Figure 8.3-7. RT-dried GTMS sol-gel panel (4000 cm-1 - 2100 cm-1)
692762
858
912955
1061
1111
1198
125513401416
1439
1454
1479
1556
0.000
0.010
0.020
0.030
0.040
0.050
0.060
0.070
0.080
0.090
0.100
0.110
Abs
orba
nce
800 1000 1200 1400 1600 1800 Wavenumbers (cm-1)
Figure 8.3-8. RT-dried GTMS sol-gel panel (1800 cm-1 - 650 cm-1)
The IR scan for 250°F-cured GTMS sol-gel panel is shown in Figures 8.3-9 and 8.3-10.

128
2868
2921
3376
3739
0.000
0.002
0.004
0.006
0.008
0.010
0.012
0.014
0.016
0.018
0.020
0.022
0.024
0.026
0.028 0.030
Abs
orba
nce
2200 2400 2600 2800 3000 3200 3400 3600 3800 Wavenumbers (cm-1)
Figure 8.3-9. 250°F-cured GTMS sol-gel panel (4000 cm-1 - 2100 cm-1)
692777858
955
1119
1198
12671346
1411
14561477
15561722
0.000
0.010
0.020
0.030
0.040
0.050
0.060
0.070
0.080
0.090
0.100
Abs
orba
nce
800 1000 1200 1400 1600 1800 2000 Wavenumbers (cm-1)
Figure 8.3-10. 250°F-cured GTMS sol-gel panel (2100 - 650 cm-1)
The IR patterns and the identified absorbing species for the cured and noncured panels are presented in Table 8.3-4.
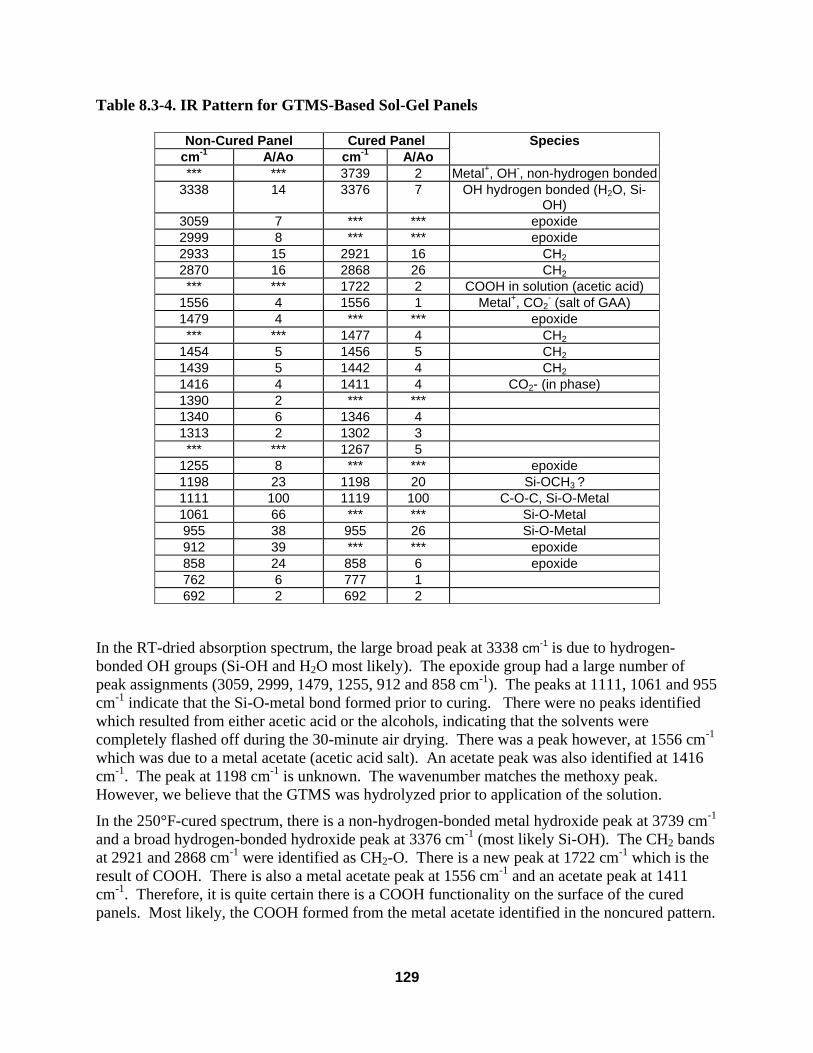
129
Table 8.3-4. IR Pattern for GTMS-Based Sol-Gel Panels
Non-Cured Panel Cured Panel Species cm-1 A/Ao cm-1 A/Ao *** *** 3739 2 Metal+, OH-, non-hydrogen bonded
3338 14 3376 7 OH hydrogen bonded (H2O, Si-OH)
3059 7 *** *** epoxide 2999 8 *** *** epoxide 2933 15 2921 16 CH2 2870 16 2868 26 CH2 *** *** 1722 2 COOH in solution (acetic acid)
1556 4 1556 1 Metal+, CO2- (salt of GAA)
1479 4 *** *** epoxide *** *** 1477 4 CH2
1454 5 1456 5 CH2 1439 5 1442 4 CH2 1416 4 1411 4 CO2- (in phase) 1390 2 *** *** 1340 6 1346 4 1313 2 1302 3 *** *** 1267 5
1255 8 *** *** epoxide 1198 23 1198 20 Si-OCH3 ? 1111 100 1119 100 C-O-C, Si-O-Metal 1061 66 *** *** Si-O-Metal 955 38 955 26 Si-O-Metal 912 39 *** *** epoxide 858 24 858 6 epoxide 762 6 777 1 692 2 692 2
In the RT-dried absorption spectrum, the large broad peak at 3338 cm-1 is due to hydrogen-bonded OH groups (Si-OH and H2O most likely). The epoxide group had a large number of peak assignments (3059, 2999, 1479, 1255, 912 and 858 cm-1). The peaks at 1111, 1061 and 955 cm-1 indicate that the Si-O-metal bond formed prior to curing. There were no peaks identified which resulted from either acetic acid or the alcohols, indicating that the solvents were completely flashed off during the 30-minute air drying. There was a peak however, at 1556 cm-1 which was due to a metal acetate (acetic acid salt). An acetate peak was also identified at 1416 cm-1. The peak at 1198 cm-1 is unknown. The wavenumber matches the methoxy peak. However, we believe that the GTMS was hydrolyzed prior to application of the solution.
In the 250°F-cured spectrum, there is a non-hydrogen-bonded metal hydroxide peak at 3739 cm-1 and a broad hydrogen-bonded hydroxide peak at 3376 cm-1 (most likely Si-OH). The CH2 bands at 2921 and 2868 cm-1 were identified as CH2-O. There is a new peak at 1722 cm-1 which is the result of COOH. There is also a metal acetate peak at 1556 cm-1 and an acetate peak at 1411 cm-1. Therefore, it is quite certain there is a COOH functionality on the surface of the cured panels. Most likely, the COOH formed from the metal acetate identified in the noncured pattern.

130
In addition, there was a reduction in the epoxide concentration. This can best be seen in the peaks at 3059 and 2999 cm-1.
8.4 Navy Titanium Surface Analysis
Titanium specimens with different processing steps were prepared for surface analysis. The material was Ti-6Al-4V, 4”x 6”x 0.20”. Specimens were subject to various pretreatment with and w/out Boegel-EPII. These specimens were carefully packaged and sent to the Naval Weapons Center at China Lake, California. Table 8.4-1 shows how the samples were prepared.
Table 8.4-1. Treatment of Titanium Specimens Delivered to Navy for Surface Analysis
sample # degreaser HF/HNO3 deox 20% Turco 5578 Grit-blast sol-gel1 X X2 X X X3 X X4 X X X5 X X X X6 X X X7 X
Ti samples were analyzed using three different FTIR methods; (1) Polarized LASR at 80 deg referenced to Au, (2) Polarized LASR at 85 deg referenced to Au, and (3) Diffuse reflectance FTIR referenced to Al mirror.
Sol-gel Si-O-Si vibrations as well as other vibrations were easily observed on samples Ti #4, 5 and 6 by all three FTIR methods. Ratio spectra of Ti#4/Ti#1 (cleaned-deoxidized with sol-gel/cleaned-deoxidized), Ti#5/Ti#2 (cleaned-deoxidized-Turco 5578 with sol-gel/cleaned-deoxidized-Turco 5578) and Ti#6/Ti#3 (cleaned-grit-blasted with sol-gel/cleaned-grit-blasted) show that the cleaned-deoxidized treatment (Ti#4) has a slightly higher sol-gel intensity than cleaned-deoxidized-Turco (Ti#5) and a much higher sol-gel intensity than cleaned-grit-blasted (Ti#6). Changes in surface species were also observed for ratio spectra of the different Ti treatments. For example Ti#2 (cleaned-deoxidized-Turco 5578)/Ti#1 (cleaned-deoxidized) ratio spectra show a strong broad band from about 1000-700 cm-1 that must be from Turco 5578 processing on the surface.
Grit-blasting appears to leave an oxide on the surface, but shifts and changes due to FTIR method make assignments difficult without information on the grit-blasting technique. The diffuse reflectance spectra in some cases shows shifts and significant differences compared to the LASR spectra (these differences may be related to surface roughness).
8.5 Incorporation of Dyes into Sol-Gel Coatings The incorporation of visible dyes into the sol-gel formulation was studied as a means of providing a quality control technique to determine whether the sol-gel has been applied to the surface of a metal. In the initial studies, screening studies were conducted on a variety of dyes to determine whether the chemistries of the dyes were compatible with the sol-gel chemistry. Dyes were added to the sol-gel solution and the resulting coating applied to an aluminum substrate to determine which dyes produce a visually discernible sol-gel coating.

131
8.5.1 Sample Preparation Dyes were used at a concentration of approximately two to four grams per liter. One hundred milliliters of each dyed sol-gel solution was formulated for each test batch. The dye concentration = 5% of active sol-gel components (GTMS and TPOZ)= 0.05(2g GTMS/100 ml Sol-Gel + (0.75)1g TPOZ/100 ml Sol-Gel) = 0.1375g dye/100 ml sol-gel.
Dye was added directly to the sol-gel solution at room temperature. All dyes, except for test #10, were powders and were predissolved by diluting with water in a bottle and shaking. All solutions were vividly colored, although it was evident that not all dyes were completely dissolved. Dyed solutions were left to sit for approximately one hour while the substrates were being prepared. The substrates for this test were 4 inches x 6 inches x 0.040inches 2024-T3 bare aluminum (QQ-A-250/4) panels. Panels were aqueous degreased (Brulin Formula 815GD) and alkaline cleaned (Isoprep 44). Panels were then sanded using 3M #220 grit aluminum oxide sandpaper using an orbital sander. The sol-gel solutions were shaken immediately prior to application. Substrates were brush coated using a 1 inch natural bristle varnish brush. Several passes of sol-gel were completed during a two-minute wetting period. Panels were left to dry overnight vertically in a panel rack under ambient conditions.
8.5.2 Dyed Panel Analysis A subjective scale of A, B, and C showing the degree of solubility of the dyes after the dyed sol-gel solutions had sat overnight. A visual judgment was made by looking at the amount of dye that appeared to be in the bottom of the test bottle. A indicates no visible solids, B indicates a small amount of solid, and C indicates significant solids. This analysis was conducted while noting that the 10 hour pot life had expired the previous evening.
A subjective scale of A, B, and C for the application process indicated the ease of application and appearance of the panel during application, with A being the best looking specimens and C referring to the worst looking specimens. Some of the solutions had a significant amount of undissolved particles. These particulate-laden solutions were then applied onto the panels resulting in a uneven coating. Several solutions were frothy and foam was present when the solution was applied onto the substrate resulting in a degradation in coating uniformity.
Results from the initial dye incorporation study are shown in Table 8.5-1. Comments on the appearance of the sol-gelled panels after drying overnight are made within the table. Based on appearance of the substrate the following dyes were chosen for further evaluation: Bordeaux #4, Yellow #2, Orange No. 4, Sanodal Turquoise Liquid, and Specialty Blue #1.
A downselect of these dyes was made based on which ones gave the most uniform coating appearance. Wedge testing was carried out on these selected specimens to assess the effect of the incorporated dyes on the adhesion and durability of the bonded system and is reported in Figure 8.5-1.
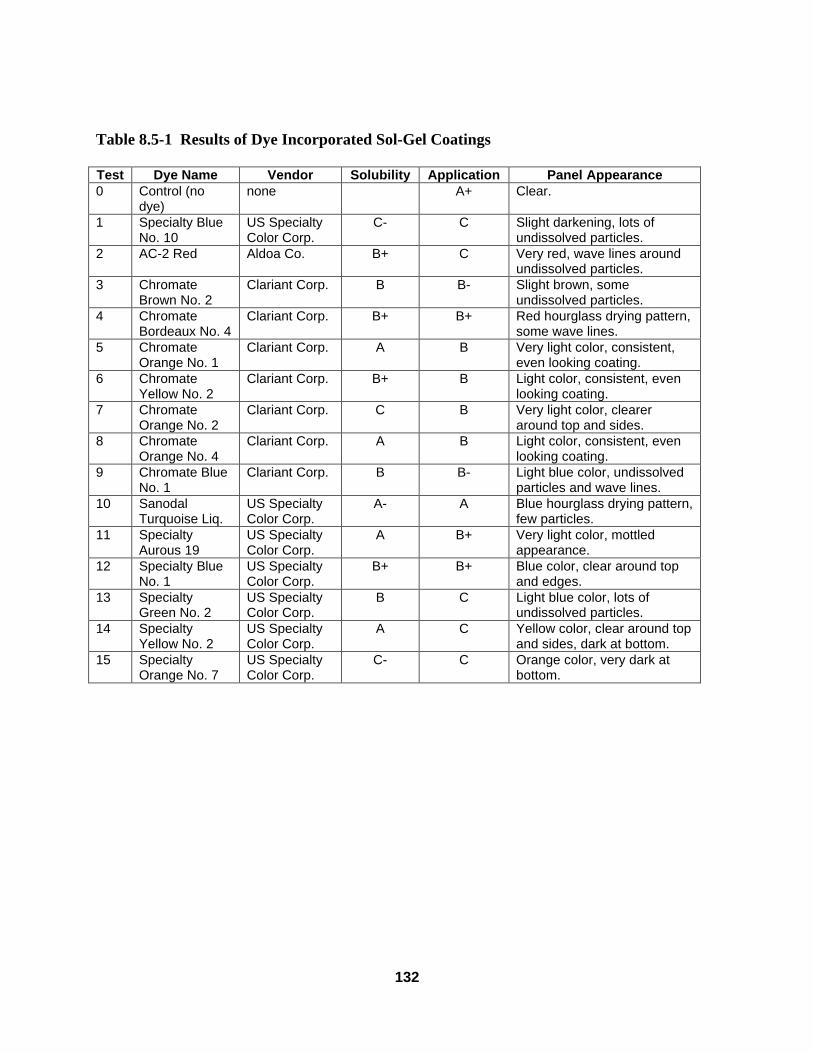
132
Table 8.5-1 Results of Dye Incorporated Sol-Gel Coatings Test Dye Name Vendor Solubility Application Panel Appearance 0 Control (no
dye) none A+ Clear.
1 Specialty Blue No. 10
US Specialty Color Corp.
C- C Slight darkening, lots of undissolved particles.
2 AC-2 Red Aldoa Co. B+ C Very red, wave lines around undissolved particles.
3 Chromate Brown No. 2
Clariant Corp. B B- Slight brown, some undissolved particles.
4 Chromate Bordeaux No. 4
Clariant Corp. B+ B+ Red hourglass drying pattern, some wave lines.
5 Chromate Orange No. 1
Clariant Corp. A B Very light color, consistent, even looking coating.
6 Chromate Yellow No. 2
Clariant Corp. B+ B Light color, consistent, even looking coating.
7 Chromate Orange No. 2
Clariant Corp. C B Very light color, clearer around top and sides.
8 Chromate Orange No. 4
Clariant Corp. A B Light color, consistent, even looking coating.
9 Chromate Blue No. 1
Clariant Corp. B B- Light blue color, undissolved particles and wave lines.
10 Sanodal Turquoise Liq.
US Specialty Color Corp.
A- A Blue hourglass drying pattern, few particles.
11 Specialty Aurous 19
US Specialty Color Corp.
A B+ Very light color, mottled appearance.
12 Specialty Blue No. 1
US Specialty Color Corp.
B+ B+ Blue color, clear around top and edges.
13 Specialty Green No. 2
US Specialty Color Corp.
B C Light blue color, lots of undissolved particles.
14 Specialty Yellow No. 2
US Specialty Color Corp.
A C Yellow color, clear around top and sides, dark at bottom.
15 Specialty Orange No. 7
US Specialty Color Corp.
C- C Orange color, very dark at bottom.

133
1
1.1
1.2
1.3
1.4
1.5
1.6
1.7
0 200 400 600 800 1000 1200
Hrs of Exposure to 140°F and >98 % RH
To
tal C
rack
Len
gth
(in
ches
) 010306-1 Control
010306-2 ChromateBordeaux #4
010306-3 ChromateYellow #2
010306-4 ChromateOrange #4
010306-5 SanodalTurquoise
010306-6 SpecialityBlue # 1
Figure 8.5-1. Wedge test performance of sol-gel coatings with selected incorporated dyes
The wedge crack data show that only one of the dyes, Specialty Blue #1 appeared to severely degrade wedge performance. Three of the dyes were tested were chromate based, albeit Cr 3+, and will not be included in further testing. That leaves one dye, the Sanodal Turquoise, as a potential agent for incorporation to facilitate QC analyses. Failure modes for these specimens are shown in Table 8.5-2. Failure analyses indicates that the Sanodal Turquoise also degrades the performance of the bonded specimen. At this point, no further testing with these dyes in anticipated.
Table 8.5-2. Failure Modes for Incorporated Dye Specimens Specimen # Dye Failure Mode
010306-1 None 93% coh* 010306-2 Chromate Bordeaux #4 92% coh 010306-3 Chromate Yellow #2 94% coh 010306-4 Chromate Orange #4 91% coh* 010306-5 Sanodal Turquoise Liquid 78% coh 010306-6 Specialty Blue #1 14% coh
*Some observable primer to adhesive failure

134
9 Sealant Surface Preparations
9.1 Summary
This purpose of this task was to assess the sol-gel surface preparation technology as an adhesion promoter for polysulfide and polythioether sealants. Currently, sealants require the use of an adhesion promoter to obtain maximum adhesion performance and durability. Often these adhesion promoters contain very high levels of solvents, resulting in a high-VOC product that may not meet local and federal environmental restrictions. In these studies, it was demonstrated that use of the baseline Boegel-EPII sol-gel surface preparation system and a system that was chemically optimized for the sulfur-based sealant systems, acceptable adhesion and durability performance to titanium substrates was achieved.
9.2 Titanium Peel Testing
Two formulations were tested in this study. First was the baseline Boegel-EPII system containing an epoxy-coupling agent. Second was a formulation where half of the glycidoxypropyl trimethoxysilane was substituted with a thiol-substituted coupling agent, 3-mercaptopropyl trimethoxysilane. Sealant peel specimen preparation was begun according to the test plan in Table 9.2-1. The sol-gels were applied over #180 alumina grit-blasted Ti-6Al-4V substrates. No primer was applied over the sol-gel coating to test the compatibility of the sol-gel and the sealant. Sealant was applied to the test panels and cured according to the manufacturer’s recommendations. A metal screen was embedded into the sealant during the application process. Peel testing was accomplished by pulling on this embedded screen, according to BSS 7257, at ambient temperature and after exposure to Jet Reference Fuel at 140°F for 7 days. Both polysulfide and polythioether sealant candidates were evaluated.
The results of the peel testing are given in Figure 9.2-1.

135
Table 9.2-1. Sealant Test Plan on Ti-6Al-4V Alloy Specimen Abrasion Conv. Coating Promoter Sealant Type Spec
C31-C-1826-1 C31-C-1826-2
none phosphate fluoride (PF)
PR 187 PR 1826 polythioether AMS 3277 Ty I
C31-C-1828-1 C31-C-1828-2
none phosphate fluoride none PR 1828 polythioether AMS 3277 Ty II
C31-C-1776-1 C31-C-1776-2
none phosphate fluoride PR 182 PR 1776 Class B-2
polysulfide AMS 3281
C31-C-1750-1 C31-C-1750-2
none phosphate fluoride PR 182 PR 1750 polysulfide AMS 3276
C31-B-1826-1 C31-B-1826-2
grit-blast Boegel-EPII none PR 1826 polythioether AMS 3277 Ty I
C31-B-1828-1 C31-B-1828-2
grit-blast Boegel-EPII none PR 1828 polythioether AMS 3277 Ty II
C31-B-1776-1 C31-B-1776-2
grit-blast Boegel-EPII none PR 1776 Class B-2
polysulfide AMS 3281
C31-B-1750-1 C31-B-1750-2
grit-blast Boegel-EPII none PR 1750 polysulfide AMS 3276
C31-M-1826-1 C31-M-1826-2
grit-blast sol-gel (1/2 GTMS, 1/2 mercaptosilane)
none PR 1826 polythioether AMS 3277 Ty I
C31-M-1828-1 C31-M-1828-2
grit-blast sol-gel (1/2 GTMS, 1/2 mercaptosilane)
none PR 1828 polythioether AMS 3277 Ty II
C31-M-1776-1 C31-M-1776-2
grit-blast sol-gel (1/2 GTMS, 1/2 mercaptosilane)
none PR 1776 Class B-2
polysulfide AMS 3281
C31-M-1750-1 C31-M-1750-2
grit-blast sol-gel (1/2 GTMS, 1/2 mercaptosilane)
none PR 1750 polysulfide AMS 3276

136
0
20
40
60
80
100
120
140
PR-1828 PR-1826 PR-1750 PR-1776
Sealant
Pee
l Str
eng
th, p
iw
Over PF, No Exposure
Over PF, After Exposure toJP-7 at 140°F for 7 Days
Over Boegel-EPII, NoExposure
Over Boegel-EPII, AfterExposure to JP-7 at 140°Ffor 7 Days
Over GTMS/ Mercaptosilanesol-gel, No Exposure
Over GTMS/ Mercaptosilanesol-gel, After Exposure toJP-7 at 140°F for 7 Days
Figure 9.2-1. Sealant peel test results over Ti-6Al-4V alloy
These studies show that the sol-gel sealant adhesion promoters gave the same or better performance as the phosphate fluoride (PF) controls. With the exception of an unusually high ambient peel number on the PR 1750, the numbers were well within the margins expected. Both the baseline Boegel-EPII formulation and the formulation with the mercaptosilane gave good results. Exposure to JP-7 did not appear to affect the performance of the sealant adhesive bondline.
To
o s
tro
ng
fo
r p
eel s
trip
95%
coh
90%
coh
93%
coh
100% cohesive, unless
otherwise noted

137
10 Hybrid Development
10.1 Summary The objective of this task was to develop a hybrid system that would provide the functional role of both the surface preparation and the adhesive bond primer. To enable such a technology, components of both the sol-gel chemistry and primer chemistry would have to be incorporated into the hybrid coating system. Implementation of such a coating would reduce the amount of hazardous materials, chromates, acids, and bases used both in the surface preparation process and the primer application. Additionally, use of a single coating would save time and cost in the application process for metal bond repairs.
The focus of this effort was on developing a room-temperature cure, nonchromated waterborne adhesive bond primer for use in conjunction with paste adhesive systems. In many depot repair scenarios, heat cannot be applied to the structural hardware, or it may result in more damage. Therefore two-part paste adhesive systems that can be cured at ambient or slightly elevated temperatures are employed for repair. However, there is currently no acceptable bond primer which can also be cured at ambient temperature and achieve an acceptable level of durability performance. This task focuses on that goal.
At the completion of this effort, a candidate hybrid adhesive primer system based on a hybrid copolymer approach was identified. Optimization of spray and application parameters and curing conditions and durability are required before implementation of this system.
10.2 Nanocomposite Coatings
10.2.1 Initial Primer Formulation Attempts
The development of a nanocomposite coating was carried out at Chemat Technology, Inc. The silane component of Chemat’s original Al 9201 sol-gel surface treatment solution is mainly 3-aminopropyl silane (3-APS). While the interaction of this sol-gel coating with adhesive primers was good when the sol-gel underwent a separate curing step at 250°F, it was found to be susceptible to water if cured at room temperature. The sensitivity of the sol-gel coating to water is partly due to the presence of unreacted amino groups, which are hydrophilic in nature. During cure at elevated temperatures, the amino groups in the sol-gel coating form chemical bonds with epoxy functional groups in the primer or adhesive. Such chemical bonding results in (1) strong bonding between the sol-gel coating and the primer/adhesive and (2) resistance to water.
A modified room temperature cure Al 9201 solution was developed with vinyl silane as the main silane component. The vinyl groups are hydrophobic so, theoretically, the sol-gel coating is not as susceptible to water. However, the vinyl group is chemically less reactive to primer/adhesive. An epoxy functionalized silane was selected as the main silane group in the sol-gel solution. Different proportions of epoxy silane, 3-glycidoxypropyltrimethoxysilane, were formulated into the sol-gel solution. In the final sol-gel solution the molar ratios of silane to aluminum sec-butoxide were 4.5, 3.9, 3.3, 2.8 and 2.2, respectively.

138
10.2.2 Formulation of Bisphenol-A Epoxy Resin Based Primers
The formulation of the bisphenol-A epoxy resin based primers was based on the following components: a bisphenol-A epoxy based resin such as Shell’s water based EPI-REZTM 3519-W-50, or 2522-W-60 resins; an extra multifunctional epoxy resin (about 10% of the main epoxy resin) such as Shell’s EPON resin SU-8, or Dow’s DER 669 epoxy resin to impart improved high temperature strength, thermal stability, reactivity and chemical resistance; silica particles in water for use as filler and rheology control; dicyandiamide based latent curing agent for curing at elevated temperatures( 250-300oF) which remains inactive at room temperature in order to prolong the shelf-life of the formulated primer (for stability at least in 6 months); a small amount of an imidazole such as 2-methyl imidazole, and 2-phenyl imidazole as the curing accelerator. The formulation contains about 30% of total solid content and the rest is water.
Wedge tests were performed on 2024-T3 aluminum alloy panels treated with (1) Fe 9552-1(stored at room temperature for one year), which is a mixture of Cytec’s BR 6747 primer with Chemat’s Al 9201 (1:1); (2) Chemat’s formulated primer according to the formulation described above, with and without chromated corrosion inhibitors; (3) Chemat’s formulated primer mixture with Al 9201 at 1:1 ratio. 3M’s AF163-2M film adhesive was used in all cases. Phosphoric acid anodized aluminum primed with BR 127 primer was used as the control.
The wedge crack growth after one week is shown in Figure 10.2-1. The PAA treated panel primed with BR 127 (1) showed best performance with a crack growth of only 0.03 inches after 7 days exposure to 140°F and >98% relative humidity; (2) bonded panels treated with Fe 9552-1 (stored at room temperature for one year) showed a crack growth of 0.24 inches in 7 days; (3) Chemat’s formulated primer without chromates CPR-1 grew 0.82 inches; (4) ) Chemat’s formulated primer with chromates CPR-2 grew 1.1 inches; and (5) CPR-1 mixture Al 9201 (1:1) grew a total of 0.59 inches.
0
0.2
0.4
0.6
0.8
1
1.2
PAA/BR127 Fe9552-1 CPR-1 Hybrid CPR-1 + Cr CPR-1 +Al9201
Wed
ge
Cra
ck G
row
th (
in)
Figure 10.2-1. Wedge crack growth of nancomposite hybrid primers bonded with AF 163-2M
adhesives exposed for 7 days to 140°F and >98% relative humidity
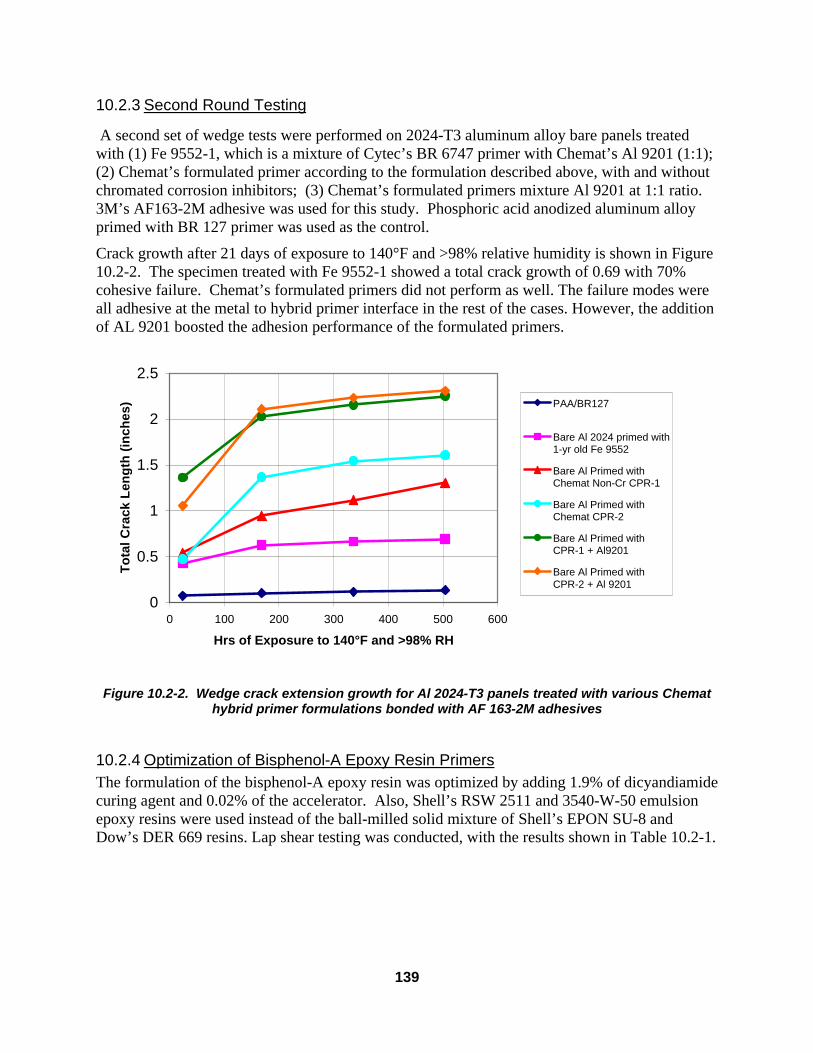
139
10.2.3 Second Round Testing
A second set of wedge tests were performed on 2024-T3 aluminum alloy bare panels treated with (1) Fe 9552-1, which is a mixture of Cytec’s BR 6747 primer with Chemat’s Al 9201 (1:1); (2) Chemat’s formulated primer according to the formulation described above, with and without chromated corrosion inhibitors; (3) Chemat’s formulated primers mixture Al 9201 at 1:1 ratio. 3M’s AF163-2M adhesive was used for this study. Phosphoric acid anodized aluminum alloy primed with BR 127 primer was used as the control.
Crack growth after 21 days of exposure to 140°F and >98% relative humidity is shown in Figure 10.2-2. The specimen treated with Fe 9552-1 showed a total crack growth of 0.69 with 70% cohesive failure. Chemat’s formulated primers did not perform as well. The failure modes were all adhesive at the metal to hybrid primer interface in the rest of the cases. However, the addition of AL 9201 boosted the adhesion performance of the formulated primers.
0
0.5
1
1.5
2
2.5
0 100 200 300 400 500 600
Hrs of Exposure to 140°F and >98% RH
To
tal C
rack
Len
gth
(in
ches
) PAA/BR127
Bare Al 2024 primed with1-yr old Fe 9552
Bare Al Primed withChemat Non-Cr CPR-1
Bare Al Primed withChemat CPR-2
Bare Al Primed withCPR-1 + Al9201
Bare Al Primed withCPR-2 + Al 9201
Figure 10.2-2. Wedge crack extension growth for Al 2024-T3 panels treated with various Chemat
hybrid primer formulations bonded with AF 163-2M adhesives
10.2.4 Optimization of Bisphenol-A Epoxy Resin Primers The formulation of the bisphenol-A epoxy resin was optimized by adding 1.9% of dicyandiamide curing agent and 0.02% of the accelerator. Also, Shell’s RSW 2511 and 3540-W-50 emulsion epoxy resins were used instead of the ball-milled solid mixture of Shell’s EPON SU-8 and Dow’s DER 669 resins. Lap shear testing was conducted, with the results shown in Table 10.2-1.

140
Table 10.2-1. Lap-Shear Tensile Strength for 2024-T3 Aluminum Bonding
Primer
Adhesive
Surface Preparation
Average Lap-shear Tensile Strength (psi)
Chemat X-1 hybrid 3M AF 163-2M P2 etch 4872 Blank w/o primer 3M AF 163-2M P2 etch 4723
Chemat Fe 9552 (1 year) hybrid
Cytec FM 73 P2 etch 4363
Chemat X-1 hybrid Cytec FM 73 P2 etch 4164 Blank w/o primer Cytec FM 73 P2 etch 3901
Chemat X-1 hybrid Epon Epoxy Resin 826 Alkaline Cleaning 2713 Chemat Fe 9552 (1 year) hybrid
Epon Epoxy Resin 826 Alkaline Cleaning 2727
Blank w/o primer Epon Epoxy Resin 826 Alkaline Cleaning 1270 Chemat X-1 hybrid Epon Epoxy Resin 826 Grit-blast 3528 Blank w/o primer Epon Epoxy Resin 826 Grit-blast 1800
Chemat X-1 hybrid 3M 2214 Scotch-Brite abrasion 3622
Blank w/o primer 3M 2214 Scotch-Brite abrasion 2763
Chemat X-1 hybrid 3M 2214 Grit-blast 4235 Blank w/o primer 3M 2214 Grit-blast 4014
Chemat X-1 hybrid 3M 2214 Boeclene deoxidizer 4402 Blank w/o primer 3M 2214 Boeclene deoxidizer 3312
The performance of the hybrid primer based on Chemat’s bisphenol-A epoxy resin based primer was comparable to that of the Fe 9552 hybrid primer based on the Cytec BR 6747 blend chemistry. However, lap shear tests are not very sensitive to surface pretreatment factors, so the hybrid primers showed effective bonding on P2 etched surface and grit-blasted surfaces. Additionally, the Boeclene-deoxided surfaces showed similar performance to the grit-blast and Scotch-Brite abrasion pretreatments.
Wedge test performance of the hybrid primers on 2024-T3 aluminum panels is shown in Figure 10.2-3. In this study, Cytec's BR 6747-1 and BR 6757 primers were compared to Chemat's FX-5 primer solution. The FX-5 chemistry is an optimized version of the bisphenol-A resin primer. A PAA panel primed with Cytec BR 127 was included as the control. The primers were either applied over Al-9201 sol-gel coated panels, or applied as a 1:1 mixed solution of primer and Al 9201 sol-gel solution. All panels were bonded with 3M AF-163-2 250°F-cure film adhesive.

141
0
0.5
1
1.5
2
2.5
3
0 250 500 750 1000 1250 1500
Hrs of Exposure to 140°F and >98% RH
To
tal C
rack
Len
gth
(in
ches
)FX-5 Mix
FX-5/Al9201
BR6757 Mix
BR6757/Al9201
BR6747-1Mix
BR6747-1/Al9201
PAA
Figure 10.2-3. Wedge test behavior of optimized Chemat hybrid primers compared with Cytec
bond primers on Al 2024-T3 panels bonded with AF163-2M 250°-cure adhesive
Wedge test results show that the performance of Cytec BR 6757 mixed with the Al 9201 was better then that of the BR 6757 over the separately applied Al 9201. The performance of Chemat's hybrid primer, FX-5, showed a need for improvement in the flexibility and water sensitivity.
10.2.5 Addition of Adhesion Promoters Formulations were made and evaluated with various adhesion and bonding promoters in an improved FX-5 formulation. Table 10.2-2 describes the formulations tested in this study. T-peel evaluation was used as a screening technique for these specimens, and results are shown in Figure 10.2-4. In general, the results show that varying the ratio of Al9201 to primer-base in the bisphenol-A epoxy resin based hybrid primer does not have a significant impact on the adhesive bonding performance as tested by T-peel. Wedge crack specimens were fabricated for each formulation on P-2 etched and degreased 2024-T3 panels. The primer was flash cured and the panels bonded with 3M AF163-2M adhesive. Wedge crack results are shown in Figure 10.2-5.
Table 10.2-2. Al 9201 Hybrid Primer Formulations Sample Epoxy Resin Binder SKW 100 SKW
Accelerator BTC BTR PVA
005-1* 43.89% 1.00% 0.096% - - - 005-2 52.89% 1.06% 0.102% - - - 005-3 43.89% 1.03% 0.100% - - - 005-4 43.89% 1.24% 0.120% - - - 005-6 43.89% 0.83% 0.080% 0.10% 0.10% 2.50%

142
* Formulation 005-1 was not tested.
6.557.76 8.01
10.79
0
2
4
6
8
10
12
005-2 005-3 005-4 005-6
Formulation
Tee-
Pee
l Str
engt
h (lb
./sq
in.)
10%
coh
50%
coh
60%
coh
50%
coh
Figure 10.2-4. T-peel strengths for 2024-T3 panels primed with bisphenol-A epoxy resin based hybrid primers
1.00
1.50
2.00
2.50
3.00
3.50
0 200 400 600 800
Hrs of Exposure to 140°F and 98% RH
To
tal C
rack
Len
gth
(in
ches
)
005-2
005-3
005-4
005-6
FX-5
Figure 10.2-5. Total crack length for Al 9201 hybrid primer formulations in comparison with the chromated FX-5 formulation
A new series of wedge crack tests were initiated for a hybrid nonchromated adhesive bond primer based on the findings detailed above. The T-peel test results showed that incorporation of up to 0.6 parts of alkoxy silane coupling agent in the Al 9201 hybrid primer improved the tee peel strength by 48% (9.2 psi vs. 6.2 psi) for the hybrid formula without additional alkoxy silane in the Al9201. This improvement was incorporated into the hybrid primer system. In the current hybrid system, the level of Al9201 sol-gel was adjusted to render 16% resin content. The wedge

143
test results for the set of XP500-12A specimens are given in Figure 10.2-6. The failure modes on these specimens was 0-20% cohesive, with the adhesive failure being at the hybrid to metal interface.
1.00
1.10
1.20
1.30
1.40
1.50
1.60
1.70
1.80
1.90
0 200 400 600 800 1000 1200
Hours of Exposure to 140°F and 95% Relative Humidity
To
tal C
rack
Len
gth
, in
ches
Figure 10.2-6. Total crack length for specimen XP500-12A
The lap shear and roller peel results for specimens prepared with this coating (XP-005-25-B1) are given in Figures 10.2-7 and 10.2-8. The specimens failed adhesively at the hybrid to metal interface.
0.0
500.0
1000.0
1500.0
2000.0
2500.0
3000.0
3500.0
4000.0
-65°F 75°F 180°F
Testing Temperature (°F)
Lap
Sh
ear
Ult
imat
e S
tren
gth
(p
si)
Figure 10.2-7. Lap shear results for Chemat-coated specimens (ID #XP-005-25-B1)

144
6.65
6.66
6.67
6.68
6.69
6.7
6.71
6.72
6.73
6.74
-65°F 75°F
Testing Temperature (°F)
Mo
dif
ied
Ro
ller
Pee
l Str
eng
th (
lbf/
in)
Figure 10.2-8. Roller peel test results for Chemat-coated specimens (ID #XP-005-25-B1)
Due to the lack of hot/wet properties exhibited using this approach, further efforts aimed at improving the process and adhesive bond primer based on optimization of the this hybrid process were terminated.
10.3 Hybrid Copolymerization
10.3.1 Baseline Mechanical Property Testing The hybrid coplymerization strategy was used to formulate fourteen coating systems using Shell’s bisphenol-A epoxy coating (EpiRez 5522-WY-55 epoxy and 5.0 g EpiCure 8290-Y-60 curing agent). In order to establish baseline mechanical properties, percent elongation and impact resistance were evaluated using impact adhesion and GE impact tests in accordance with BMS10-72. It is assumed that bond adhesion will be enhanced if adhesion and impact resistance of the bond primer is enhanced. Additional wedge test data was obtained to evaluate the best performing coatings and justify adoption of the impact tests data as a screening tool. Coatings for wedge test specimens were applied to two 6 inch x 6 inch x 0.125 inch 2024-T3 aluminum panels. Coatings were allowed to cure at room temperature for a minimum of 7 days. At that point, Hysol 9309.3 NA paste adhesive was applied over glass scrim with a notched trowel to control the bondline thickness between the coated panels. The sandwiched part was cured by bagging under vacuum at room temperature for 7 days before being cut into 5 test specimens. Crack growth was measured after 1 and 24 hours of initiating the crack with a wedge under ambient conditions. Crack growth on other specimens in each system was measured after 4 and 7 days exposure to 120°F and 98% RH.
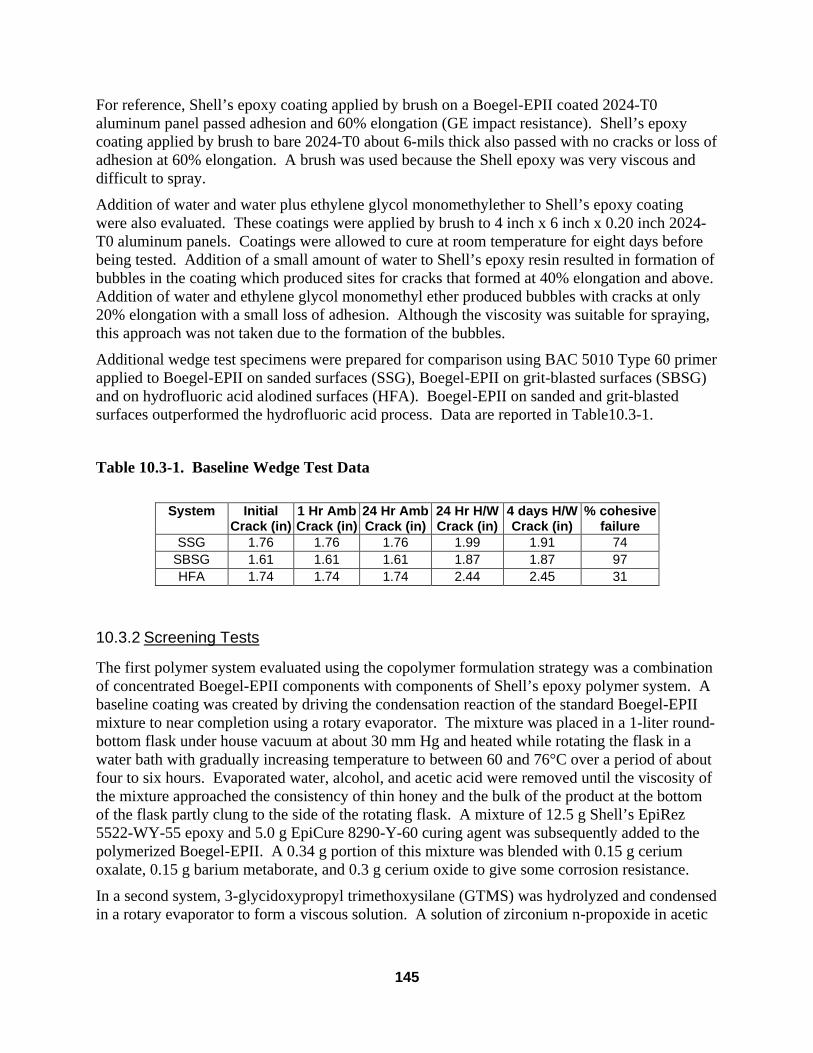
145
For reference, Shell’s epoxy coating applied by brush on a Boegel-EPII coated 2024-T0 aluminum panel passed adhesion and 60% elongation (GE impact resistance). Shell’s epoxy coating applied by brush to bare 2024-T0 about 6-mils thick also passed with no cracks or loss of adhesion at 60% elongation. A brush was used because the Shell epoxy was very viscous and difficult to spray.
Addition of water and water plus ethylene glycol monomethylether to Shell’s epoxy coating were also evaluated. These coatings were applied by brush to 4 inch x 6 inch x 0.20 inch 2024-T0 aluminum panels. Coatings were allowed to cure at room temperature for eight days before being tested. Addition of a small amount of water to Shell’s epoxy resin resulted in formation of bubbles in the coating which produced sites for cracks that formed at 40% elongation and above. Addition of water and ethylene glycol monomethyl ether produced bubbles with cracks at only 20% elongation with a small loss of adhesion. Although the viscosity was suitable for spraying, this approach was not taken due to the formation of the bubbles.
Additional wedge test specimens were prepared for comparison using BAC 5010 Type 60 primer applied to Boegel-EPII on sanded surfaces (SSG), Boegel-EPII on grit-blasted surfaces (SBSG) and on hydrofluoric acid alodined surfaces (HFA). Boegel-EPII on sanded and grit-blasted surfaces outperformed the hydrofluoric acid process. Data are reported in Table10.3-1.
Table 10.3-1. Baseline Wedge Test Data
System Initial
Crack (in) 1 Hr Amb Crack (in)
24 Hr Amb Crack (in)
24 Hr H/W Crack (in)
4 days H/W Crack (in)
% cohesive failure
SSG 1.76 1.76 1.76 1.99 1.91 74 SBSG 1.61 1.61 1.61 1.87 1.87 97 HFA 1.74 1.74 1.74 2.44 2.45 31
10.3.2 Screening Tests
The first polymer system evaluated using the copolymer formulation strategy was a combination of concentrated Boegel-EPII components with components of Shell’s epoxy polymer system. A baseline coating was created by driving the condensation reaction of the standard Boegel-EPII mixture to near completion using a rotary evaporator. The mixture was placed in a 1-liter round-bottom flask under house vacuum at about 30 mm Hg and heated while rotating the flask in a water bath with gradually increasing temperature to between 60 and 76°C over a period of about four to six hours. Evaporated water, alcohol, and acetic acid were removed until the viscosity of the mixture approached the consistency of thin honey and the bulk of the product at the bottom of the flask partly clung to the side of the rotating flask. A mixture of 12.5 g Shell’s EpiRez 5522-WY-55 epoxy and 5.0 g EpiCure 8290-Y-60 curing agent was subsequently added to the polymerized Boegel-EPII. A 0.34 g portion of this mixture was blended with 0.15 g cerium oxalate, 0.15 g barium metaborate, and 0.3 g cerium oxide to give some corrosion resistance.
In a second system, 3-glycidoxypropyl trimethoxysilane (GTMS) was hydrolyzed and condensed in a rotary evaporator to form a viscous solution. A solution of zirconium n-propoxide in acetic
146
acid was then added and mixed. One panel coated with the condensed coating was cured at 221°F for three hours.
Rotary evaporation of the baseline polymer constituents under vacuum initially resulted in precipitation of silicon and zirconium compounds in approximately equal molar ratios as evidenced by FTIR spectroscopy and ICP. If the reaction mixture was allowed to stand at atmospheric pressure for four to eight hours, the precipitate would hydrolyze and redissolve. Attempts to spray this material resulted in formation of irregular films with occasional flaws resulting from solvent popping. Best results were produced by mist coating, but replication was difficult due to differences in batch to batch viscosities. Casting produced coatings that had the least number of defects. Adjusting the viscosity of the material resulted in a coating that leveled well and could be applied by brush.
Addition of FC-170C surfactant to the condensed baseline coating did not significantly improve coating appearance. Addition of acetone as a cosolvent aided in leveling, but produced a milky appearance with some orange peel. As an alternative, addition of ethylene glycol monoethyl ether resulted in a film that did not wet out the surface of the aluminum panel and shrank as solvent evaporated.
Variations on the synthesis procedure of the baseline coating met with mixed results. In one attempt, hydrolyzed GTMS underwent a condensation reaction in a rotary evaporator to form a slightly viscous, clear solution. Addition of zirconium n-propoxide in acetic acid resulted in rapid bubbling and precipitation of a polymer like substance that floated in the mixture. Subsequent heating partially dissolved the precipitate, but not enough to produce a smooth defect-free coating.
The condensed baseline coatings were applied 1 to 3 mils thick and cured under ambient conditions for eight days or cured at 221°F for three hours. These coatings failed all adhesion and impact tests. A panel coated with Boegel-EPII mixed with an equal volume of Shell’s epoxy also failed adhesion and impact testing.
A series of twelve additional room-temperature cured polymeric systems were synthesized using the previously described organosilane and epoxy-amine monomers. Some of the systems are similar but differ mainly in synthetic procedures. Brief descriptions of the polymer systems and their variations are listed below:
RS-HY: A bidentate silane triol/BPA epoxy blend was formulated from hydrolyzed and partially prereacted (3-glycidoxypropyl)trimethoxysilane and EpiCure 8290-Y-60 blended with Shell’s waterborne EpiRez 5522-WY-55 epoxy and EpiCure 8290-Y-60 curing agent.
4-12: A 20,000 formula molecular weight silane triol endcapped BPA epoxy was synthesized
by endcaping Shell’s water-borne epoxy with hydrolyzed (3-glycidoxypropyl)trimethoxysilane.
4-14, 4-21: Two similar zirconium dioxide-silane triol/BPA epoxy nanocomposites were
synthesized using variations on a method described by Schmidt using Shell’s waterborne EpiRez 5522-WY-55 epoxy and EpiCure 8290-Y-60 curing agent.
147
4-24, 4-25: Two similar zirconium dioxide-silane triol/epoxy nanocomposites were synthesized using Shell’s EpiCure 8290-Y-60 amine.
4-26: A tridentate silane triol/BPA epoxy blend was formulated from hydrolyzed and
partially prereacted (3-glycidoxypropyl)trimethoxysilane and (3-aminopropyl)triethoxysilane blended with Shell’s water-borne EpiRez 5522-WY-55 epoxy and EpiCure 8290-Y-60 curing agent.
4-27, 4-27b: Two similar BPA epoxy with silane triol pendant group polymers were
synthesized from Shell’s water-borne EpiRez 5522-WY-55 epoxy and (3-aminopropyl)triethoxysilane.
5-3, 5-4, 5-4b: Three similar tridentate silane triol/epoxy blends were synthesized from
hydrolyzed and partially prereacted (3-glycidoxypropyl)trimethoxysilane and (3-aminopropyl)triethoxysilane blended with Shell’s water-borne EpiRez 5522-WY-55 epoxy and (3-aminopropyl)triethoxysilane.
5-5, 5-5b: Two similar tridentate silane triol/epoxy blends were synthesized from hydrolyzed
and partially prereacted (3-glycidoxypropyl)trimethoxysilane and (3-aminopropyl)triethoxysilane blended with Shell’s waterborne EpiRez 5522-WY-55 epoxy prereacted with a 50/50 ratio of EpiCure 8290-Y-60 curing agent and (3-aminopropyl)triethoxysilane.
5-16: 20,000 formula molecular weight silane triol produced from a 50/50 blend of (3-
aminopropyl)trimethoxysilane and Shell’s waterborne EpiRez 5522-WY-55 epoxy and encapped with (3-glycidoxypropyl)trimethoxysilane. The reaction was catalyzed with 2, 4, 6 – tris(dimethylamino)phenol.
5-23: Tridentate (monoaminophenyl)silane triol epoxy blend formulated from
aminophenyltrimethoxysilane reacted with (3-glycidoxypropyl)trimethoxysilane and blended with Shell’s waterborne EpiRez 5522-WY-55 epoxy and EpiCure 8290-Y-60 curing agent.
5-26A: Epoxysilane copolymer formulated from a blend of Shell’s water-borne EpiRez
5522-WY-55 epoxy and EpiCure 8290-Y-60 curing agent with (3-aminopropyl)trimethoxysilane.
5-26B: 20,000 formula molecular weight silane triol endcapped epoxysilane formulated from
a blend of Shell’s waterborne EpiRez 5522-WY-55 epoxy and EpiCure 8290-Y-60 curing agent with (3-aminopropyl)trimethoxysilane and endcapped with (3-glycidoxypropyl)trimethoxysilane.
Of the 12 basic hybrid systems presented in Table 10.3-2, RS-HY, 4-12a, and 4-21 gave the best hot/wet properties. The values presented closely approach wedge test data for the hydrofluoric acid / alodine surface preparation process.

148
Table 10.3-2. Hybrid Coating Test Data System Date
Applied GE
Impact Reverse Impact
Adhesion Initial Crack (in)
1 Hr Amb
Crack (in)
24 Hr Amb
Crack (in)
24 Hr H/W Crack (in)
4 days H/W Crack (in)
% cohesive
RS-HY 4/6/00 60% Pass Pass 1.54 1.57 1.63 2.64 2.69 - 4-12a 4/12/00 60% Pass Pass 1.33 1.41 1.60 2.86 N/C 2 4-12b 4/12/00 60% Pass Pass 1.56 1.75 1.99 4.09 N/C 3 4-14 4/14/00 Fail Fail Pass 1.97 2.10 2.23 3.02 N/C 2 4-21 4/21/00 20% Fail Pass 1.65 N/C 1.84 2.48 2.55 3 4-24 4/25/00 Fail Fail Fail 3.00 N/C 3.13 Full Full 2 4-25 4/26/00 10% Fail Fail 3.01 N/C 3.30 4.42 Full 0 4-26 4/26/00 60% Pass Pass 1.66 N/C 1.89 4.28 N/C 0 4-27 4/27/00 60% Fail Fail 2.33 N/C 2.39 3.11 N/C 0 4-27b 5/8/00 40% Pass Pass - - - - - - 5-3 5/3/00 Fail Fail Fail 2.74 N/C 2.76 2.8 3.24 0 5-4 5/4/00 Fail Fail Fail - - - - - - 5-5 5/5/00 - - - 2.17 N/C 2.23 3.1 3.45 0 5-5b 5/8/00 60% Pass Pass - - - - - -
5-16b1 5/18/00 Fail Fail Pass - - - - - - 5-16b2 5/18/00 Fail Fail Pass - - - - - -
5-23 5/24/00 10% Pass Pass - - - - - - 5-26A 5/26/00 60% Pass Pass 1.66 N/C 1.77 3.68 3.83 0 5-26B 5/26/00 60% Pass Pass 3.01 N/C 3.02 3.76 3.98 0
10.3.3 Parameter Optimization
Changes in cosolvent, stoichiometry and reaction time were evaluated to optimize mechanical properties and prepare a sprayable version of the RS-HY system. Three of the best performing hybrids, based on hot/wet wedge crack data, were downselected for optimization of properties.
Photomicrographs were taken of each of the hybrid systems at 350X magnification with crossed-polarized light to identify specific characteristics leading to level of adhesive performance. Stratification of crystalline domains can lead to crack initiation sites. Evaluation of the index of refraction of formations within each of the coatings was used to determine the number of crystalline phases for each coating.
Wedge test data are described in Table 10.3-2. The failure modes on all of these specimens were adhesive at the metal to hybrid interface. The three hybrid systems that performed the best in terms of crack length after hot/wet exposure also had poor failure modes. However, for hybrid 4-21, the failure mode was at the interface between the adhesive and the hybrid coating. Hybrid 4-21 also had the least hot/wet crack growth of the hybrid systems. Specimens prepared using the hydrofluoric acid / alodine process performed only marginally better.
Photomicrographs of each of the coatings showed no obvious differences that may be attributable to the differences in levels of performance between each of the hybrid systems. RS-HY formed a smooth rolling surface with two crystalline phases dispersed in a clear matrix.

149
Hybrid 4-12a produced a surface with spheres and irregular globs. The body of the film consisted of a single crystalline phase dispersed in a clear matrix. Hybrid coating 4-21 produced a surface with a swirl pattern and also had a single crystalline phase dispersed in a clear matrix.
Variations on the order of addition of reactants for the RS-HY system reported in Table 10.3-3 did not improve impact resistance. Changes in cosolvents and surfactants also produced minor improvements. This hybrid was difficult to spray as a mist and formed a relatively uniform, mottled coating. Heavy applications result in a rougher texture. Variations in the ratio of ingredients at even stoichiometry noticeably affected impact resistance. An increase in cosolvent (including water) resulted in better leveling but also caused sagging. Sample 9-13 was sprayed in successive layers to evaluate leveling effects. Approximately 5 mist coats were required to produce a 2.2 mil coating that leveled and was fairly smooth.
Impact data for coating 4-12a variations are recorded in Table 10.3-4. Reverse impact failure was due to small cracks formed at the impact radius and not due to coating removal.
Hybrid formulations 4-21 is based on a nanocomposite structure resulting from a combination of zirconium n-propoxide, (3-glycidoxypropyl)trimethoxysilane, aliphatic amine and bisphenol A epoxy (4-21 in Table 10.3-5). Addition of 4% by weight of 3M G-400 microspheres resulted in excessive bubbling and produced a lumpy mixture that was not suitable for spraying or application by brush. Reverse impact testing failed and GE impact was limited to 20 % elongation. Addition of 4% by weight of microspheres was also added to 10-9 and 10-11 reported in Table 10.3-4. This greatly improved handling of these hybrid systems when spraying. However, hot/wet properties and impact resistance were severely impacted.
Testing of 3% by weight addition of microspheres (W-210) from 3M with an alkaline pH to a 30,000 FMW endcapped system (11-19a) and the RS-HY formulation improved handling and leveling of both hybrid systems. Impact performance was greatly improved and resulted in passing performance for all systems tested. However, wedge durability was adversely affected in combination with severe adhesive failure.
Additional testing was performed to evaluate pot-life on a 25,000 FMW system (11-26a, 11.26b, 11-26c). Results indicate that when tested in terms of sprayability and impact resistance, the system has a minimum life of 3 hr. Testing for a longer period was not evaluated. Results are inconclusive since no pattern in the change in crack growth was noted and all specimens failed cohesively. Coating thickness also did not appear to affect impact resistance when evaluated between 1.3 to 5.3 mils. However crack growth increased progressively with an increase in coating thickness. Use of FC170 surfactant on the RS-HY formulation also improved coating uniformity and resulted in passing impact performance. Wedge test data of selected hybrid specimens is depicted in Figure 10.3-1.

150
Table 10.3-3 Variations in RS-HY Hybrid System 7 d H/W
crack growth inch 1
mil GE Impact
Rev Impact
% coh1
Comments
RS-HY 1.15 5-7 60% Fail 0 Original formulation, does not spray well with HPLV
8-3-1 0.54 3-4 60% Fail 94 Increased mole ratio of silane, does not spray well – splatters
8-3-2 - 2 Fail Fail - Changed order of addition, sprayed better but not well, formulation error
8-3-3 0.58 2 60% Pass 100 Repeated 8-3-2 with no error, levels if apply heavily, high gloss
8-3-4 0.64 1 10% Fail 97 Increased silane ratio, less gloss than 8-3-3 8-3-5 - 2 20% Fail - Lower silane ratio than original, more water 8-3-5b 0.97 1 20% Fail 95 More water, doesn’t spray well 8-29 - 5-8 60% Fail - Repeat of RS-HY, doesn’t spray well – nice
splatter coat 8-30 0.63 1-2 40% Fail 74 Repeat of RS-HY increased water to improve
spraying, still not good 8-31a - 1.5 60% Pass - Similar to 8-30 b with S-405 surfactant and more
water, sags, splatters 8-31b 0.62 2 60% Pass 95 Same as 8-31a but less water, slightly better in
appearance 9-1 - 1-2 60% Pass - Same as 8-31b but with cosolvent, better but too
thin 9-5 - 1-2 60% Fail - Same as 9-1 but FC-170 surfactant, still splatters
and sags but will level 9-13 0.55 2.2 60% Pass 99 Same as 8-31a but amt. of water between 8-31a
and b 11-19b 1.01 1.3-2.8 60% Pass 0 Same as 9-13 but changed order of add and
added 3% W-210 microspheres 11-23 - 1.4-2.1 60% Pass - Same as 9-13 but FC-170 surfactant 11-24a 1.57 2.2- 4 60% Pass 0 Same as 11-23 but added W-210 microspheres 11-24b 0.73 0.8-1.2 60% Pass 81 Same as 9-13 11-25 1.72 60% Pass 8 Same as 9-13 but with W-210 microspheres 1) Average of 3 specimens

151
Table 10.3-4 Variations in 4-12a System 7 d H/W
crack growth inch 1
mil GE Impact
Rev Impact
% coh1 Comments
4-12a 1.54 6 60% Fail 0 20,000 FMW, 9-20 - 2.2 60% Fail - 15,000 FMW, didn’t level well, didn’t sag 9-26 0.79 2.1-2.2 60% Pass 31 15,000 FMW, more water than 9-20, tended
to run 9-27 0.38 2.1 60% Pass 58 25,000 FMW, formed picture frame and
flowed to bottom of panel 10-9 1.10 40% Fail 52 15,000 FMW, addition of microspheres,
excess epoxy 10-11 1.04 40% Fail 35 15,000 FMW, addition of microspheres 11-17 0.83 0.4-1.1 - - 30 30,000 FMW, used wrong gauge for impact
test panel 11-19a 1.40 0.9-1.9 60% Pass 0 30,000 FMW, same as 11-17 but added
water and W-210 microspheres 11-26a 1.57 60% Pass 0 25,000 FMW, same as 9-27 but evaluate pot
life – applied after induction 11-26b 1.88 60% Pass 0 25,000 FMW, same as 9-27 but evaluate pot
life – applied after +1.5 hr 11-26c 1.41 60% Pass 0 25,000 FMW, same as 9-27 but evaluate pot
life – applied after +3 hr 21-01a 1.30 1.3-2.1 - - 2 25,000 FMW, same as 9-27 w/ less water,
coat thickness evaluation – 2 coats 21-01b 1.54 2.1-2.9 - - 0 25,000 FMW, same as 9-27 w/ less water,
coat thickness evaluation – 4 coats 21-01c 1.65 4.6-5.3 - - 0 25,000 FMW, same as 9-27 w/ less water,
coat thickness evaluation – 6 coats 1) Average of 3 specimens Table 10.3-5 Variations in 4-21 System 7 d H/W
crack growth inch 1
mil GE Impact
Rev Impact
% coh1 Comments
4-21 0.90 20% Fail 3 Zirconium dioxide-silane triol/BPA epoxy nanocomposite
10-16 - 20% Fail - Addition of G-400 microspheres and FC-170 to 4-21
1) Average of 3 specimens
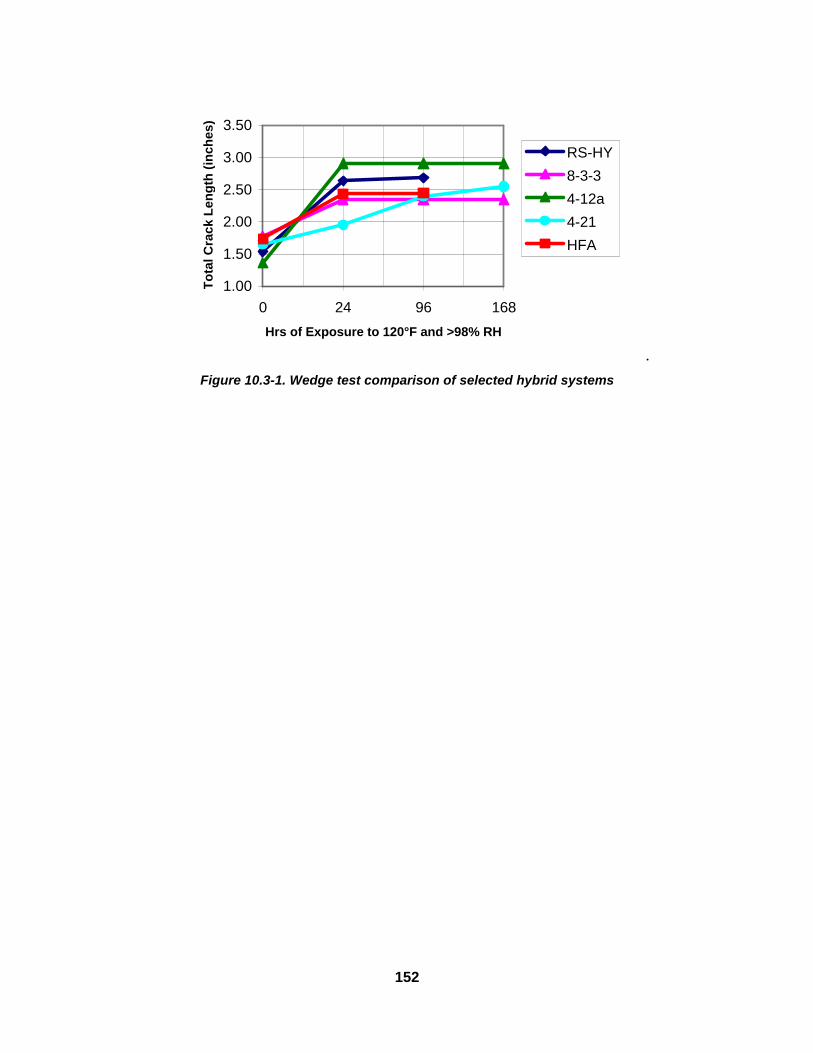
152
1.00
1.50
2.00
2.50
3.00
3.50
0 24 96 168
Hrs of Exposure to 120°F and >98% RH
To
tal C
rack
Len
gth
(in
ches
)
RS-HY
8-3-3
4-12a
4-21
HFA
. Figure 10.3-1. Wedge test comparison of selected hybrid systems
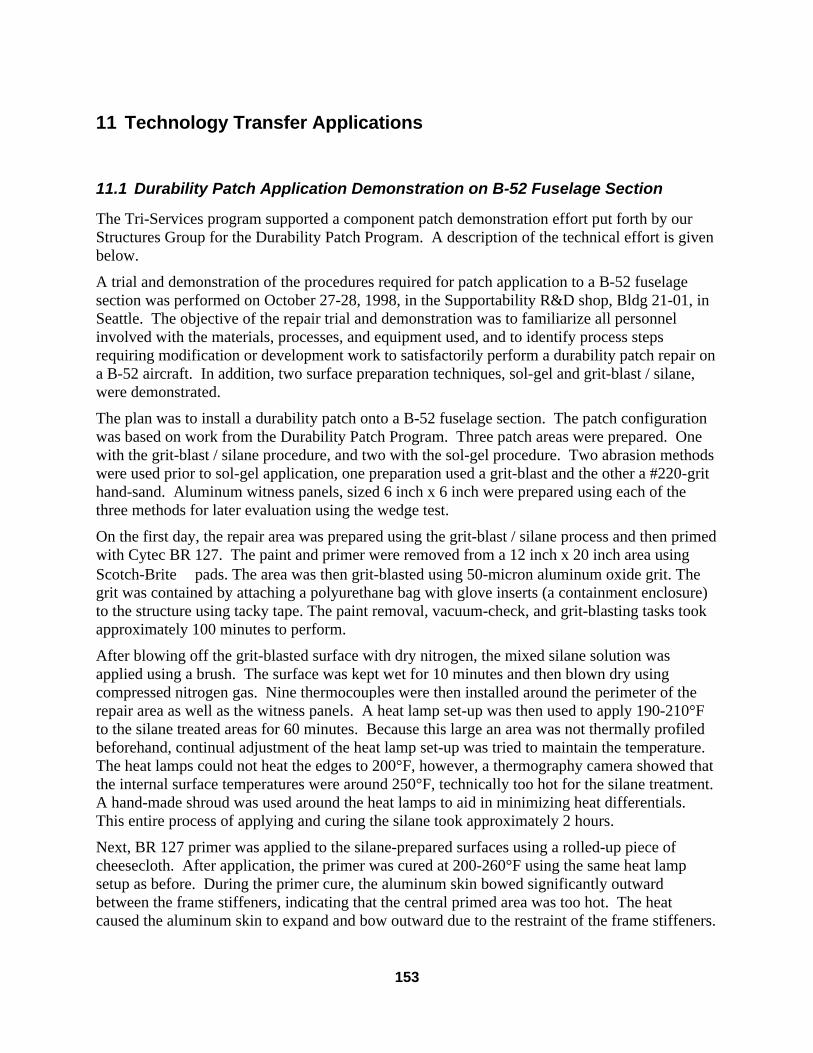
153
11 Technology Transfer Applications
11.1 Durability Patch Application Demonstration on B-52 Fuselage Section
The Tri-Services program supported a component patch demonstration effort put forth by our Structures Group for the Durability Patch Program. A description of the technical effort is given below.
A trial and demonstration of the procedures required for patch application to a B-52 fuselage section was performed on October 27-28, 1998, in the Supportability R&D shop, Bldg 21-01, in Seattle. The objective of the repair trial and demonstration was to familiarize all personnel involved with the materials, processes, and equipment used, and to identify process steps requiring modification or development work to satisfactorily perform a durability patch repair on a B-52 aircraft. In addition, two surface preparation techniques, sol-gel and grit-blast / silane, were demonstrated.
The plan was to install a durability patch onto a B-52 fuselage section. The patch configuration was based on work from the Durability Patch Program. Three patch areas were prepared. One with the grit-blast / silane procedure, and two with the sol-gel procedure. Two abrasion methods were used prior to sol-gel application, one preparation used a grit-blast and the other a #220-grit hand-sand. Aluminum witness panels, sized 6 inch x 6 inch were prepared using each of the three methods for later evaluation using the wedge test.
On the first day, the repair area was prepared using the grit-blast / silane process and then primed with Cytec BR 127. The paint and primer were removed from a 12 inch x 20 inch area using Scotch-Brite pads. The area was then grit-blasted using 50-micron aluminum oxide grit. The grit was contained by attaching a polyurethane bag with glove inserts (a containment enclosure) to the structure using tacky tape. The paint removal, vacuum-check, and grit-blasting tasks took approximately 100 minutes to perform.
After blowing off the grit-blasted surface with dry nitrogen, the mixed silane solution was applied using a brush. The surface was kept wet for 10 minutes and then blown dry using compressed nitrogen gas. Nine thermocouples were then installed around the perimeter of the repair area as well as the witness panels. A heat lamp set-up was then used to apply 190-210°F to the silane treated areas for 60 minutes. Because this large an area was not thermally profiled beforehand, continual adjustment of the heat lamp set-up was tried to maintain the temperature. The heat lamps could not heat the edges to 200°F, however, a thermography camera showed that the internal surface temperatures were around 250°F, technically too hot for the silane treatment. A hand-made shroud was used around the heat lamps to aid in minimizing heat differentials. This entire process of applying and curing the silane took approximately 2 hours.
Next, BR 127 primer was applied to the silane-prepared surfaces using a rolled-up piece of cheesecloth. After application, the primer was cured at 200-260°F using the same heat lamp setup as before. During the primer cure, the aluminum skin bowed significantly outward between the frame stiffeners, indicating that the central primed area was too hot. The heat caused the aluminum skin to expand and bow outward due to the restraint of the frame stiffeners.

154
Upon cool-down, the bow in the skin disappeared. The primer application and cure process took approximately 2.5 hours to perform.
On the next day, the second “repair” area was grit-blasted using the same technique as before. After removing the grit using dry nitrogen, the sol-gel solution (made from a 4-part kit of deionized water and surfactant, silane, zirconium n-propoxide, and glacial acetic acid) was applied using a brush, similar to the silane solution. The aluminum surface was kept wet with the sol-gel solution for a period of 5 minutes. Then, the surface was allowed to air dry (ambient) for 60 minutes.
Next, the waterborne Cytec BR 6747-1 primer was applied. The primer was applied using a rolled-up piece of cheesecloth, however, a rod was used for stiffening the cloth to aid in distributing the primer evenly. After the area was primed, thermocouples were attached, and the primer was cured using a modified heat lamp rack. This set-up worked better, but the temperatures at the edges of the repair area still did not reflect the actual, internal temperatures. The primer was cured for 60 minutes at 200°F. The skin bowed outward as before.
Next, the durability patch was fabricated and installed over the primed surface of the sol-gel/grit-blast prepared area. The durability patch consisted of 14 tapered (wedding cake style) plies of a 250°F cure fiberglass/epoxy prepreg (BMS 8-79, 7781 style) and one layer of viscoelastic material (VEM) located at the bottom (as large as the 5th fiberglass/epoxy ply). The patch was bonded using FM-73M OST film adhesive (BMS 5-101). The vacuum bag arrangement provided only edge bleed, as the prepreg is a net-resin system. The hotbonder provided the repair team with some challenges as it was not working properly, however, the cure was still accomplished. Upon cooldown, the patch was noticeably bowed outward between the frame stiffeners and appeared to have some resin starvation in the center. The bowing of the patch is due to the patch set at the 250°F dwell stage, when the aluminum skin expanded and bowed out. Apparently, the bond is fairly strong as no disbonding occurred between the patch and structure upon cooldown.
The third “repair” area was prepared using #220-grit aluminum oxide sandpaper and a palm sander. The sol-gel was applied as before, allowed to sit for 60 minutes in ambient air, and the Cytec BR 6747-1 waterborne primer was applied and cured.
Witness panels were prepared for both sol-gel (grit-blast and hand-sand) and grit-blast / silane preparation methods. The witness panels were bonded in an autoclave with Cytec FM-73M OST adhesive. The sanded/sol-gel specimen evaluation was delayed as the panels were not available until later. The sanded/sol-gel specimen was bonded with 3M AF163-2M OST adhesive instead of the FM 73M, by mistake. Continued exposure of the wedge crack specimens fabricated in the B-52 demo test is shown in Figure 11.1-1. The AF163-2M bonded specimen was included in the test comparison, to show general trends.
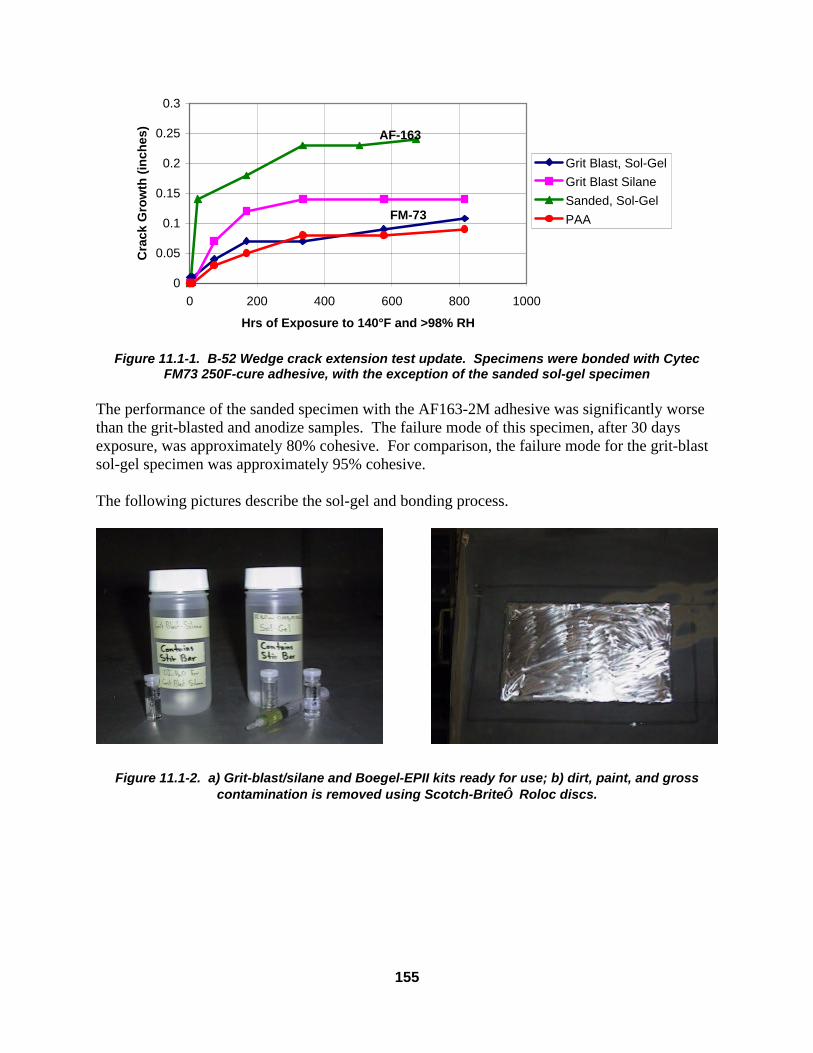
155
0
0.05
0.1
0.15
0.2
0.25
0.3
0 200 400 600 800 1000
Hrs of Exposure to 140°F and >98% RH
Cra
ck G
row
th (
inch
es)
Grit Blast, Sol-GelGrit Blast SilaneSanded, Sol-GelPAA
AF-163
FM-73
Figure 11.1-1. B-52 Wedge crack extension test update. Specimens were bonded with Cytec
FM73 250F-cure adhesive, with the exception of the sanded sol-gel specimen The performance of the sanded specimen with the AF163-2M adhesive was significantly worse than the grit-blasted and anodize samples. The failure mode of this specimen, after 30 days exposure, was approximately 80% cohesive. For comparison, the failure mode for the grit-blast sol-gel specimen was approximately 95% cohesive. The following pictures describe the sol-gel and bonding process.
Figure 11.1-2. a) Grit-blast/silane and Boegel-EPII kits ready for use; b) dirt, paint, and gross contamination is removed using Scotch-Brite Roloc discs.
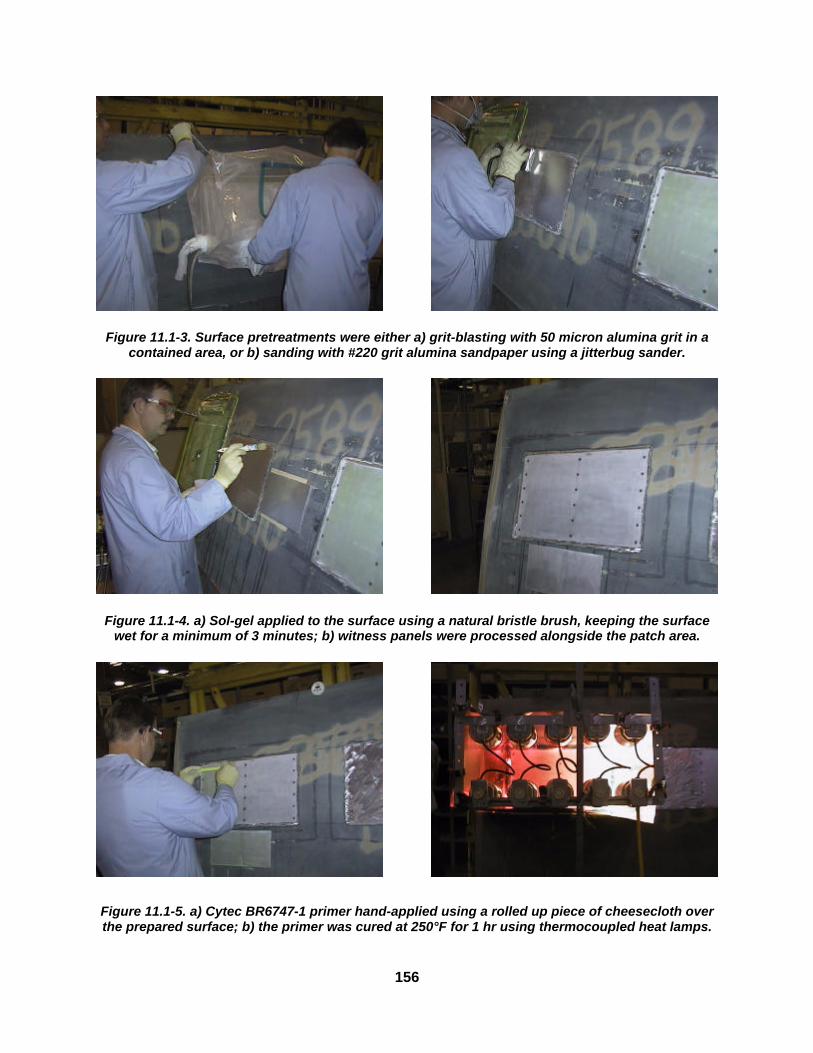
156
Figure 11.1-3. Surface pretreatments were either a) grit-blasting with 50 micron alumina grit in a contained area, or b) sanding with #220 grit alumina sandpaper using a jitterbug sander.
Figure 11.1-4. a) Sol-gel applied to the surface using a natural bristle brush, keeping the surface wet for a minimum of 3 minutes; b) witness panels were processed alongside the patch area.
Figure 11.1-5. a) Cytec BR6747-1 primer hand-applied using a rolled up piece of cheesecloth over the prepared surface; b) the primer was cured at 250°F for 1 hr using thermocoupled heat lamps.
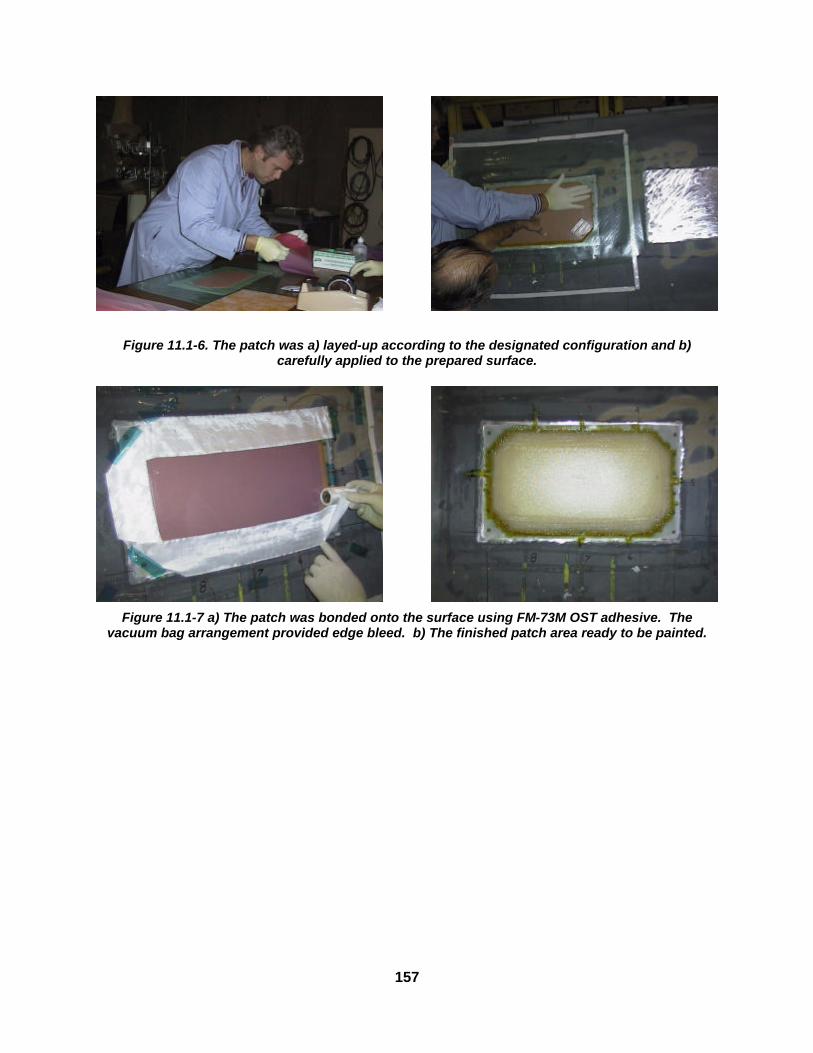
157
Figure 11.1-6. The patch was a) layed-up according to the designated configuration and b) carefully applied to the prepared surface.
Figure 11.1-7 a) The patch was bonded onto the surface using FM-73M OST adhesive. The
vacuum bag arrangement provided edge bleed. b) The finished patch area ready to be painted.

158
11.2 B-52 Technology Demonstration
A demonstration was conducted at Davis-Monthan AFB March 8-10, 1999 to show the feasibility of using the sanded/sol-gel prebond process to bond a composite doubler patch to a repair area on a B-52. Boeing B-52 and Air Force B-52 program personnel were also present for this demonstration. Boeing B-52 technical personnel carried out the application of the sol-gel by themselves. The following observations were noted during the demonstration.
Work started at 7 a.m. with the weather being about 50°F, dry, and slightly windy. The surface to be treated was on the crown skin of the B-52, which is on the upper fuselage of the aircraft near where the wing to body joint is. The patch is intended to repair and prevent fatigue cracks running between fasteners around the corner of an access door panel. This particular area receives a lot of stress due to its location on the vehicle. The paint was removed the day before using #160 grit alumina sandpaper on a Dynabrade orbital sander. Progressively finer sandpapers were used up to #400 grit to achieve complete removal of contamination from grooves and crevices.
At 8:25, two 100 mL sol-gel kits were mixed. The outside temperature was probably around 58°F. During the mixing process, it was noted that the syringes were somewhat difficult to use in the field and tended to slosh and spill over the small containers that had been included for mixing. It was clear that a more robust method for kitting needs to be developed. The mixing process was completed and the kits were left without stirring for the 30 minute induction period.
The aluminum repair area was scrupulously cleaned with MEK and clean wipe cloths. At approximately 10:00, the final manual abrasion of the repair surface was started. A medium 3”-diameter Scotch-Brite Roloc disc was mounted onto a die grinder. The repair area was divided into 3 informal zones consisting of approximately 6 inch x 6 inch sections. Each one was abraded with a fresh Roloc disc. The first zone was abraded for two minutes. It was decided that this was too much abrasion time, so the second and third zones were abraded for one minute each. It appeared that the medium Roloc discs were probably too aggressive for this type of skin repair because they remove too much material. Additionally, during the abrasion process, the tool, which did not have a shield or rear exhaust, tended to drip oil from the front of the grinder. Thus, the surface had to be solvent wiped at the conclusion of the manual abrasion process. The orbital sander may have avoided this contamination, and looks to be the tool of choice for this particular repair scenario. The abrasion of the surface is shown in Figures 11.2-1 a and b.

159
Figure 11.2-1. a) Abrasion with alumina sandpaper and Dyanabrade sander; b) abrasion of bond
area with grinder fitted with medium Roloc disc. At approximately 10:20, the sol-gel application was started. The outside temperature was approximately 65°F. The sol-gel solution was shaken in the container for two minutes before application. The sol-gel was applied using a 2 inch-wide natural bristle brush. The brush was too wide to fit into the mouth of the container, so the sol-gel was poured onto the surface of the repair area and brushed around for about 3 minutes. The remainder of the solution was poured onto the bond area at the conclusion of the wetting period to remove some bristles left by the low quality brush. The surface was visually ‘dry’ within about five minutes. Application of the sol-gel is shown in Figure 11.2-2.
Figure 11.2-2. Application of the sol-gel using natural bristle brush
At 12:00, the Cytec 6747-1 30% solids primer was wipe-applied using a folded piece of cheesecloth. After drying at ambient temperature (approx. 70°F), the primer was covered with a thermal blanket and cured using a Zimac hot bonder. Figure 11.2-3 shows application and curing of the primer.

160
Figure 11.2-3. a) Application of waterborne Cytec BR6747-1 primer; b) Primer cure.
After the cure cycle, the primer was tested for solvent resistance by MEK wiping (a good indicator of complete cure). Some primer was removed, indicating incomplete curing. However, since this was a nonoperating patch, the demo was continued. The repair area was covered and left overnight. The next day, the boron/epoxy patch was applied to the primed surface and cured. A significant amount of time was spent putting together the vacuum bag and eliminating leaks. Figure 11.2-4 shows the completed patch area.
Figure 11.2-4. Completed boron epoxy patch

161
12 Conclusions A surface preparation process based on sol-gel technology has been developed that minimizes hazardous material usage in metal adhesive bonding applications. The development effort was conducted by a team that includes both research and repair depot personnel from the Air Force, Navy and Army as well as industry and academia experts. The sol-gel process deposits an organic/inorganic coating from a waterborne solution by spraying or brushing. Heating and rinsing steps are not required. This new approach eliminates strong acids/bases and contaminated wastewater associated with existing metal prebond treatments. Hexavalent chromium and volatile solvent consumption are also reduced. For optimal performance, the sol-gel treatments are used with a waterborne adhesive primer. They are also compatible with nonchromated adhesive primers currently under development. Sol-gel kits are now available from a commercial supplier, and procedures have been developed for repair bonding of aluminum, titanium and steel in addition to production bonding of titanium and steel. The procedures deposit a thin sol-gel film on cleaned/deoxidized metal, with adhesion achieved via chemical bonding of the film to both the metal and adhesive (or primer). Optimization studies show that cleaning/deoxidizing steps are critical for obtaining the appropriate metal surface activation required to achieve the desired durable chemical bonds. Therefore, the effects of mechanical and chemical surface variations have been documented. In addition, adhesion and moisture durability data have been generated for metal bonds using a number of adhesives and metal alloys. Transition efforts have begun for select applications using film and paste adhesives, primarily epoxies. Limited demonstrations have also been conducted on transport, fighter and rotary wing aircraft. Transition potential is high since the sol-gel procedures are quick, simple and inexpensive.

162
13 References
1. A.A. Baker and R.J. Chester, “Minimum Surface Treatments for Adhesively Bonded Repairs,” Int. J. Adhesion and Adhesives, Vol 12, No. 2, page 74, April 1992.
2. M.H. Kuperman and R.E. Horton, Adhesive Bonding of Aluminum Alloys, E.W. Thrall and R.W. Shannon (editors), Marcel Dekker, Inc., New York, page 444, 1985.
3. J.J. Mazza, J.B. Avram, and R.J. Kuhbander, “Grit-Blast/Silane (GBS) Aluminum Surface Preparation for Structural Adhesive Bonding,” WL-TR-94-4111.
4. K.Y. Blohowiak, et.al., “Repair Techniques Using Sol-Gel Surface Preparations,” The Second Joint NASA/FAA/DoD Conference on Aging Aircraft, NASA/CP-1999-208982/Part 1, 1999.
5. a) K.Y. Blohowiak, J. H. Osborne, K. A. Krienke, and D. F. Sekits, “Nonchemical Surface Treatment for Titanium Alloys,” Final Report for Contract Number F33615-92-D-5812, Air Force Wright Laboratory, April 1996. b) “K. Y. Blohowiak, K. A. Krienke, D. F. Sekits, “Optimization and Scale-Up of Sol-Gel Technology for Preparation of Titanium and On-Aircraft Aluminum Adhesive Bonding,” Final Report for Contract Number F33615-95-D-5615, Delivery Order #007, February 1997.
6. ASTM D 3762, “Standard Test Method for Adhesive-Bonded Surface Durability of Aluminum (Wedge Test),” Annual Book of ASTM Standards, Volume 15.06: Adhesives.
7. ASTM D 1002, “Standard Test Method for Apparent Shear Strength of Single-Lap-Joint Adhesively Bonded Metal Specimens by Tension Loading (Metal-to-Metal),” Annual Book of ASTM Standards, Volume 15.06: Adhesives.
8. ASTM D 3167, “Standard Test Method for Floating Roller Peel Resistance of Adhesives,” Annual Book of ASTM Standards, Volume 15.06: Adhesives.
9. S.S. Saliba, “The Surface Preparation of Aluminum Alloys Using the Phosphoric Acid Containment System for Repair,” WL-TR-94-4112, September 1994.
10. D.B. McCray and J.J. Mazza, “Optimization of Sol-Gel Surface Preparations for Repair Bonding of Aluminum Alloys,” SAMPE 2000 Conference Proceedings, Long Beach CA, Society for the Advancement of Material and Process Engineering, May 2000.
11. W.S. De Piero, “Fast-Track Study of Alternative Surface Preparation for AH-64 Apache Main Rotor Blades,” US Army Research, Development, and Engineering Center, Picatinny Arsenal NJ, February 1998.