advisory board of indian educational review - NCERT
126
ADVISORY BOARD OF I NDIAN EDUCATIONAL REVIEW PROFESSOR PARVIN SINCLAIR Director NCERT, Sri Aurobindo Marg, New Delhi 110 016 Members PROFESSOR ANGELA LITTLE Institute of Education Univerisity of London 20 Bedford Way London WCI HOAL United Kingdoms PROFESSOR D.N. DHANAGARE B-7, Divya Kunj Apartment 1076, Gokhale Road Model Colony P.O. Pune 411 016, India PROFESSOR GEETHA NAMBISSAN Jawahar Lal Nehru University New Delhi 110 067, India PROFESSOR GOPINATHAN Nanyang Technological University Singapore 637 616 DR. H IDEAKI SHIBUYA Tokyo Gakugei University 4-1-1, Nukui-Kita-Machi Kognei-shi, Tokyo, 184-8501, Japan DR. HRIDAYA R ATNA BAJRACHARYA CERID, Tribhuvan University P.O. Box No. 2161 Balkhu, Kathmandu Nepal DR. MALAVIKA KARLEKAR Centre for Women’s Development Studies 25, Bhai Veer Singh Marg Gole Market, New Delhi, India DR. MATHEW Z ACHARIAH 25, Scimitar Heath NW Calgary AB T3L 2EI, Canada PROFESSOR M.S. Y ADAV C-3/3038, Vasant Kunj New Delhi 110 070, India PROFESSOR N. J AYARAM Tata Institute of Social Sciences V.N. Purav Marg, Deonar Mumbai 40 088, India PROFESSOR NARGIS P ANCHAPAKESAN K-110, Hauz Khas Enclave New Delhi 110016, India PROFESSOR N IRMALANGSHU MUKHERJI Department of Philosophy University of Delhi, India SHRI S AMIR R. NATH BARC 75, Mohakali, Dhaka, Bangladesh PROFESSOR SWARNA W IJETUNGE University of Colombo Colombo, Sri Lanka Academic Editor POONAM A GRAWAL
-
Upload
khangminh22 -
Category
Documents
-
view
2 -
download
0
Transcript of advisory board of indian educational review - NCERT

ADVISORY BOARD OF INDIAN EDUCATIONAL REVIEW
PROFESSOR PARVIN SINCLAIR
Director
NCERT, Sri Aurobindo Marg, New Delhi 110 016
Members
PROFESSOR ANGELA LITTLE
Institute of Education
Univerisity of London
20 Bedford Way
London WCI HOALUnited Kingdoms
PROFESSOR D.N. DHANAGARE
B-7, Divya Kunj Apartment
1076, Gokhale Road
Model Colony P.O.
Pune 411 016, India
PROFESSOR GEETHA NAMBISSAN
Jawahar Lal Nehru University
New Delhi 110 067, India
PROFESSOR GOPINATHAN
Nanyang Technological UniversitySingapore 637 616
DR. H IDEAKI SHIBUYA
Tokyo Gakugei University
4-1-1, Nukui-Kita-Machi
Kognei-shi,
Tokyo, 184-8501, Japan
DR. HRIDAYA RATNA BAJRACHARYA
CERID, Tribhuvan University
P.O. Box No. 2161
Balkhu, Kathmandu
Nepal
DR. MALAVIKA KARLEKAR
Centre for Women’s Development Studies
25, Bhai Veer Singh Marg
Gole Market, New Delhi, India
DR. MATHEW ZACHARIAH
25, Scimitar Heath NW
Calgary AB T3L 2EI, Canada
PROFESSOR M.S. YADAV
C-3/3038, Vasant Kunj
New Delhi 110 070, India
PROFESSOR N. JAYARAM
Tata Institute of Social SciencesV.N. Purav Marg, Deonar
Mumbai 40 088, India
PROFESSOR NARGIS PANCHAPAKESAN
K-110, Hauz Khas EnclaveNew Delhi 110016, India
PROFESSOR NIRMALANGSHU MUKHERJI
Department of Philosophy
University of Delhi, India
SHRI SAMIR R. NATH
BARC
75, Mohakali, Dhaka, Bangladesh
PROFESSOR SWARNA WIJETUNGE
University of Colombo
Colombo, Sri Lanka
Academic EditorPOONAM AGRAWAL

GUIDELINES FOR AUTHORS
The articles received for publication in the IER are reviewed by one
or more referees for their relevance, clarity, length and style. Theopinion expressed in the IER does not necessarily reflect the opinions
of the National Council of Educational Research and Training. TheIER policy prohibits an author from submitting the same manuscriptfor concurrent consideration by any other publication.
Articles should be sent in English, typed in double space, on oneside of A-4 paper with sufficient margins, to the Academic Editor IER,
DERPP, National Council of Educational Research and Training, SriAurobindo Marg, New Delhi 110 016, Tel 26563980 e-mail:[email protected]. All finalised articles should be submitted
both in Soft (floppy/CD) and Hard Copy format.References should be listed at the end of the article, in
alphabetical order, as follows:LANIER, J. and LITTLE, J. 1986. Research on teacher education. In
M. WITTROCK (Ed.), Handbook of Research on Teaching, 3rd ed.
Macmillan, New York.NARAYAN, JAYANTHI and AJIT, M. 1991. Development of skills in a
mentally retarded child: The effect of home training. IndianEducational Review. Vol. 28. No. 3. pp. 29-41.
Diagram or line drawings should be complete and supplied
separately, numbered neatly for identification and their position inthe text clearly indicated. Tables can be given as part of the text.
Captions should be supplied wherever necessary.In order to prepare the manuscripts, authors are requested to
follow the directions in the Publication Manual of the American
Psychological Association (1983, 3rd ed.). Specifically, the followingpoints may be taken care of before the typescript is sent to the editorial
office:— Leave a margin of at least one inch on all sides of the paper.— Double space everything, including references, footnotes, tables
and figure captions.— Type the title of the work, corresponding author’s name, complete
address, phone number, fax number on a separate page afterthe title page of the manuscript.
— An abstract of the paper in not more than 120 words should be
sent with each manuscript.— Authors may provide brief descriptions about themselves along
with areas of their specialisations.
The views expressed by individual authors are their own and do not
necessarily reflect the policies of the NCERT, or the views of the editor.

CONTENTS
EDITORIAL 2
RESEARCH PAPERS
Modification of Teaching Behaviour through Micro Teaching 5SARFARAZ AHMAD AND AFROZ SULTANA
Gender Inequality in School Education 13with Special Reference to North East IndiaDEIGRACIA NONGKYNRIH
Localised Learning in Rural School Context: 31Problems and ProspectsPRAJNYA PARAMITA JENA
Self-Instructional Material ‘Nai Dishayan’–A Training Module 40for Capacity Building of Teachers in Promoting InclusiveEducation: An EvaluationMANOJ KUMAR DASH
Effect of Mastery Learning Strategy on Achievement in 61English in Relation to IntelligenceRAM MEHAR
A Study of Academic and Infrastructural Input and Achievement 74of Scheduled Caste Students of Residential Schools ofMadhya PradeshANIL KUMAR M.B. PILLAI
Defence Mechanism Styles and Personality Types 93among AdolescentsREENA GEORGE
Effect of Parental Support on Curiosity of 97School going ChildrenSHABANA AND KHALIDA BEGUM
How Proficient are Class V Students in Language? 106SANTOSH KUMAR, MAMTA AGARWAL AND MANIKA SHARMA
Assessing the Effectiveness of Individualised Integrated 114Intervention Strategies to Turn Around Slow Learners:An Experimental StudyS. SUBRAMANIAN
Participatory Learning and Action for Environmental Education 120M.A. SUDHIR
HALF-YEARLY JOURNAL OF EDUCATIONAL RESEARCH
INDIAN EDUCATIONAL REVIEW
Volume 51 Number 1 January 2013
ISSN 0019-561x

EDITORIAL
The approach paper to the twelfth Five Year Plan of India focuses onfaster, sustainable and more inclusive growth. While the planenvisages education as the single most crucial tool to bring the desiredtransformations in the country, the education sector will have togear up with a high momentum to reach all, retain all and prepareall to face the challenges at varied fronts. This calls for expandingthe system without compromising, in fact upgrading, the quality.Education serves multiple objectives and the relative importance ofeach of these objectives can be very personal. The varied emphasison the expected outcome is a result of the diverse economic, social,spiritual, cultural and political realities in an individual's life. Througheducation only one develops an individual identity. Thus, educationhas to meet individual's goals in life as well as national goals fordevelopment and social cohesion. Education is delivered by variousmodes and how we measure success in school is a predictive indicatorof the future success in society and indeed, one could argue, discoverand rediscover as to how the education system should be, how shouldit respond to the emerging needs and how should success bemeasured. We present the research initiatives of some more scholarsin this issue of the journal.
The first paper assesses the modification of teaching behaviourthrough Micro teaching. In this paper Micro teaching comes as aremedy for the modification of teaching behaviour and in the resultsit is shown that teaching behaviour can be improved through Microteaching. The paper from North East has once again raised thequestion of gender inequality existing in school education which needsto be addressed. The third paper examines the problems andprospects in localised learning in the contexts of rural school. Thefourth paper examines Self-instructional material 'Nai Dishayan' Atraining module for capacity building of teachers in promotingInclusive Education which is very useful to promote the InclusiveEducation and will enhance the capacity of In-service teachers. Thefifth paper is on Effect of Mastery learning strategy on achievementin English in relation to intelligence. Sixth paper reflects the studywhich aims to examine infrastructural and academic inputs beingprovided and the outcome of schooling in terms of achievement ofscheduled caste students of Residential Schools of Madhya Pradesh.We have also included three research notes in this issue which aimto explore some additional dimensions. The first research note is ondefence mechanism styles and personality types among adolescentswhich give an idea about the behavioural strategies adopted by an

individual to reduce anxiety and enhance one's sense of well beingand second research note is on Effect of Parental support on curiosityof school going children. Third research note is a summary of aNational Achievement Survey conducted by NCERT to find out theachievement level of students in language.
This issue also contains summaries of two research projectsfunded by NCERT under ERIC. These are:1. Assessing The Effectiveness of Individualised Integrated
Intervention Strategies to Turn Around Slow Learners: AnExperimental Study
2. Participatory Learning and Action for Environmental EducationThe Indian Educational Review focuses on enriching the discipline
of education by disseminating findings of educational research,providing opportunities for exchanging research experience amongfellow researchers, motivating young researchers and providinginputs to all those involved in policy making and planning.Contributions of academicians, researchers, research writers andinstitutions are cordially invited for the next issue. We welcome yoursuggestions for bringing improvement in the quality of journal.
POONAM AGRAWAL
Academic Editor

Indian Educational Review
Indian Educational Review aims to enhance the theory and practiceof research in education. It is a journal of opinion and research inthe field of education. Contributions may comprise scholarlydiscussion of new issues, reports of research, reviews of researchesin particular field, reports of developments, and debate on educationalresearch generally or on specific issues. Contributions are also invitedreporting all kinds of empirical research in education, whethersociological, psychological, economic or organisational. The journal isintended to cover a wide range, including interdisciplinary studies.
In addition, the purpose of this journal is to provide a medium fordissemination of educational research and exchange of experiencesamong research workers, scholars, teacher-educators, teachers andothers interested in educational research and related fields andprofessions.
Indian Educational Review is published half-yearly, in Januaryand July by the National Council of Educational Research andTraining (NCERT), New Delhi. Copyright of the articles published inthe Journal will vest with the NCERT and requests for reproducingthe material should be addressed to the Academic Editor. The journalis indexed in Indian Psychological Abstracts and Reviews, Sociological
Abstracts and Contents Pages in Education (U.K.).
Academic Editor
POONAM AGRAWAL
Publication Team
Head : ASHOK SRIVASTAVA
Chief Production Officer : KALYAN BANERJEE
Chief Editor : SHVETA UPPAL
Editor : BIJNAN SUTAR
Chief Business Manager : GAUTAM GANGULY
Production Assistant : MUKESH GAUR
Cover Design
AMIT KUMAR SRIVASTAVA
OFFICES OF THE PUBLICATION
DIVISION, NCERT
NCERT CampusSri Aurobindo MargNew Delhi 110 016 Phone: 011-26562708
108, 100 Feet RoadHosdakere Halli ExtensionBanashankari III StageBangaluru 560 085 Phone: 080-26725740
Navjivan Trust BuildingP.O. NavjivanAhmedabad 380 014 Phone: 079-27541446
CWC CampusOpp. Dhankal Bus StopPanihatiKolkata 700 114 Phone: 033-25530454
CWC ComplexMaligaonGuwahati 781 021 Phone: 0361-2674869
Price: Single Copy: ` 50.00; Annual Subscription: ` 100.00

Indian Educational Review, Vol. 51, No.1, January 2013 5
Modification of Teaching Behaviour through Micro Teaching
Modification of Teaching Behaviour
through Micro Teaching
DR. SARFARAZ AHMAD* AND DR. AFROZ SULTANA**
ABSTRACT
Teacher education programme in India requires too much of improve-
ment. Microteaching comes as remedy to the difficulties of teacher
education programme. Present study aimed to study the modification
of teaching behaviour of pupil teachers through micro-teaching ap-
proach. The sample consisted of 60 pupil teachers at teachers training
colleges of Gorakhpur University. The testing of hypothesis is done by
comparing the scores of the two group using the “t” test. Result indi-
cated there is remarkable change in teaching behaviours of teachers
through microteaching programme.
Research Papers
* Assistant Professor, Department of Teachers Training, Halim Muslim P.G.
College, Kanpur** Head, Department of Teachers Training, Subhash Degree College, Kanpur
To improve the quality and efficiency of teaching is an importantobjective of Teacher Education. This objective is not properly realisedin our country due to so many factors. Absence of adequate feedback,short coming in the way of modifying as well as improving teacherbehaviour. A number of techniques have been developed andintroduced during the last decade for providing feed back andmodification of teachers’ behaviour. These techniques are simulatedsocial skill training, Team-Teaching, Flander’s interaction analysis,personalised system of instruction etc. These are the innovations inTeachers education. Promotion of new idea or practice in educationand teaching is known as innovation. Some other techniques areT-group, educational games etc., have been tried out innovations inteachers’ education. Micro Teaching is one of these techniques.
Concept of Micro-Teaching – Microteaching is a new design forteacher education which provides trainees with information abouttheir performance immediately after completion of their lesson. It is

Modification of Teaching Behaviour through Micro Teaching
Indian Educational Review, Vol. 51, No.1, January 20136
a laboratory technique of teaching in which the complexities ofnormal classroom teaching are simplified. It is scaled down withrespect to teaching complexity also. Teaching is considered to bemade up of a number of teaching skill and each teaching skill is aset of related teaching behaviours which tend to facilitate pupil’slearning. Such skills can be defined, practiced, controlled, observedand evaluated. The student teacher (Micro-teacher) gives a shortlesson based on a single teaching skill (Micro-lesson). This lesson isrecorded, observed and followed by immediate feedback by theobserver. This lesson is re-planned in the light of the feedback receivedand re-taught generally to a different set of pupils. This is followedby re-feedback from the same observers. This completes onemicroteaching cycle. It can be represented as:
Core Teaching Skills : NCERT in its publication core teachingskills (1982) has laid stress 19th teaching skills but it is not possibleto train all the pupil teachers in all these skills in any trainingprogramme because of the constraint of time. Therefore a set ofteaching skills which cut across the subject has been identified.They can be very useful for every teacher. The set of these skills areknown as core teaching skills.1. Introducing a Lesson 4. Reinforcement2. Questioning 5. Increasing Pupil's Participation3. Probing Question 6. Experimentation
The Department of Teacher Education in the National Council ofEducational Research and Training (NCERT) designed a project tostudy the effectiveness of micro-teaching in 1975 in collaborationwith the center of Advanced Study in Education (CASE), Baroda.Research and training programme, for teacher educators were also

Indian Educational Review, Vol. 51, No.1, January 2013 7
Modification of Teaching Behaviour through Micro Teaching
initiated in collaboration with the department of education, universityof Indore in 1979. Instructional material on micro teaching developedby Passi (1976), Singh (1976, 1979) and Jangira (1978) was used forthe training of teacher educators.
The term modification of teaching or teacher behaviour refers tothe attempts or measures adopted for bringing desirable improvementor modification in the existing entry behaviour of a teacher for helpingthem to attain the desired terminal behaviour in order to exercisehis professional duties as effectively as possible. It can be properlymodified through the adoption of a variety of techniques includingthe most commonly used techniques such as micro teaching.
N.C.T.E. has given equal weight to micro teaching. Parallel to macroteaching seeing its utility and importance in the present curriculumof B.Ed. probably essential changes can be brought in the teachingbehaviour of pupil teacher by following the practice of microteaching.Teaching of pupil teacher is affected with micro teaching to a largeextent. The gist of its research paper is to know how much microteaching influences the teaching behaviour of pupil teacher.
Objectives: The objectives of the study are as follows:1. To study the modification of teaching behaviour of pupil teachers
through micro-teaching approach.2. To study the modification of teaching behaviour of pupil teacher
through microteaching approach between first teaching sessionand fifth teaching session (on evaluation sheet) with respect tocore teaching skills.
Hypothesis: The following null hypothesis are formulated:1. There is no significant difference in teaching behaviour (on
evaluation sheet) of pupil-teachers of first teaching session andfifth teaching session with respect to core teaching skills(Introducing a lesson, Questioning, Probing Question,Reinforcement, Increasing Pupils Participation andExperimentation)
RESEARCH DESIGN
Single group pre-test and post test type design selected for the study.The mean scores of first and final tests are compared to ascertainwhat difference, if any, the exposure to X (teaching through Micro-teaching Cycle) has made. An appropriate statistical technique hasbeen used to ascertain whether the difference is statistically

Modification of Teaching Behaviour through Micro Teaching
Indian Educational Review, Vol. 51, No.1, January 20138
significant or not. Line paradigm for designed single groups is givenbelow:
Paradigm for the design: Single group Design
Pre-test Independent Variable Post-test
T1 X T2
Mean of the first Treatment through Mean of the final
Observation Micro-teaching Cycle Observation
Sample: A sample of 60 pupil-teachers have been selected randomlyout of 150 students studied at Teachers-training colleges ofGorakhpur University. These 60 pupil-teachers are divided into sixgroups as is evident from the Table-1.
Table 1 Structure of the Sample
S.No. Microteaching Skill Group Pupil-Teacher
1. Introducing a lesson First 10
2. Questioning Second 10
3. Probing question Third 10
4. Reinforcement Fourth 10
5. Increasing students participation Fifth 10
6. Experimentation Sixth 10
Total 6 60
TOOL
Evaluation sheets for core teaching skills
For observing the above six core teaching skills rating type evaluationproforma is used. This is developed at the Centre of Advanced Study
in Education, Baroda. This rating type evaluation proforma is usedby expert after the lesson
Procedure: The five B.Ed. trainees and one investigator for one skillhave been observed through this procedure. The investigator actsas supervisor sits in the rear of the classroom. The trainee startsteaching his micro-lesson. When he has taught his lesson for sixminutes, his teaching behaviour related to the various aspects ofthe skill was carefully examined by rating type observations performa.The investigetor gives five attempts to B.Ed. trainee for modificationof teaching behaviour.

Indian Educational Review, Vol. 51, No.1, January 2013 9
Modification of Teaching Behaviour through Micro Teaching
Statistical Technique: In the present study the data were giventhe following statistical treatment:1. Mean of difference (M
D)
2. Standard deviation of difference (S.DD)
3. Standard error of difference (S,E MD)
4. ‘T’ test
Analysis and Interpretation: The skill wise study of the pupilteachers has been presented in table no. 2. Each skill has equal sizeof sample i.e. 10 pupil teachers in each skill. Core teaching skillshave been presented for the purpose of the study.
Table 2
Skill-wise't' - values
S.N. Skills No. of pupil MD
SDD
SEMD
t-value
teachers
1 Introducing a lesson 10 26 6.79 2.77 9.38**
2 Questioning 10 17.75 6.03 2.13 8.33**
3 Probing Question 10 24 6.78 3.03 7.92**
4 Reinforcement 10 12 16.22 5.41 2.21
5 Increasing pupil's 10 23 29.35 11.98 1.92
6 Experimentation 10 25 1.41 .705 35.46**
participation
* Significant at 0.05 level
** Significant at 0.01 level
The first skill is introducing the lesson for which the means ofdifference, standard deviation of difference and standard error ofmean of difference are 26, 6.79 and 2.77 respectively. Aftercomputation of the value of 't' comes out 9.38 which is significant atboth the levels i.e. 0.05 level and 0.01 level after getting feedback. Itmeans that there is a significant change in the behaviour of teacherstowards this skill due to the awareness of pupil teachers towardsthe introducing of the lesson.
The second skill presented on the above table is questioning. Italso includes 10 teachers. Here mean of difference, standard deviationof difference and standard error of mean of difference are 17.75,6.03 and 2.13 respectively. The computed 't' value comes out 8.33which is significant at both the level i.e. 0.05 level and 0.01 levelafter getting feedback. It means that there is significant change inthe behaviour of teachers towards this skill due to the awareness ofpupil teachers towards the question and questioning technique.

Modification of Teaching Behaviour through Micro Teaching
Indian Educational Review, Vol. 51, No.1, January 201310
The third skill is probing questioning. For this skill the value ofmean of difference, the standard deviation of difference are 24, 6.78,3.03 and 't' value comes out 7.42. this value of 't' is significant atboth the levels i.e. 0.05 level and 0.01 level after getting feedback. Itmeans that there is a significant change in the behaviour of teacherstowards this skill due to the awareness of pupil teachers towardsthe probing questioning technique.
The fourth skill is reinforcement. For this skill the value of meanof difference, standard deviation of difference, standard error of meanof difference for these teachers are 12, 16.22 and 5.41 and finally 't'value comes 2.21 which is not significant at any level i.e. 0.05 leveland 0.01 level. It means that there is no remarkable change havetaken place in the behaviour of teachers on the skill of reinforcement.The reason behind it is that the pupil teachers are trained in such amanner that they know quite well about the skill reinforcement. Sothe change on this skill, after feedback does not come significant.
The fifth skill is increasing pupil's participation. For this skillthe value of mean of difference, the standard deviation of differenceand standard error of mean of difference are 23, 29.35 and 11.98respectively. The computed 't' value is 1.92 which is not significantat any level i.e. 0.05 level and 0.01 level. This shows that teachersare not aware towards the skill of increasing pupil's participationbefore starting the microteaching cycle as well as after completion ofmicroteaching cycle.
The sixth and last skill is skill of experimentation which coversthe behaviour of 10 teachers. The values of mean of difference,standard deviation of difference, standard error of mean of differencefor these teachers are 25, 1.41, .705. After calculating the value of 't'it comes out 35.46 which is very high and significant at 0.05 level aswell as 0.01 level. It also concludes that there is a very clear cut andnotable change has taken place in the behaviour of teachers on theskill. The main reason of this major change is unawareness of use ofexperimentation before the practice teaching but after startingpractice teaching each and every pupil teacher has used verycommonly skill of experimentation. So after getting feedback fromthe investigator who is also a supervisor, the measurable changeshave taken place on this skill.
FINDINGS
1. There is significant difference for the skill of introducing a lesson ofpupil teachers between first teach session and fifth teach session.

Indian Educational Review, Vol. 51, No.1, January 2013 11
Modification of Teaching Behaviour through Micro Teaching
2. There is significant difference for the skill of questioning of pupilteachers between first teach session and fifth teach session.
3. There is significant difference for the skill of probing question ofpupil teachers between first teach session and fifth teach session.
4. There is no significant difference for the skill of re-inforcementof pupil teachers between first teach session and fifth teachsession.
5. There is no significant difference for the skill of increasing pupilsparticipation of pupil teachers between first teach session andfifth teach session.
6. There is significant difference for the skill of experimentation ofpupil teachers between first teach session and fifth teach session.
CONCLUSION
The teaching behaviour of the pupil teacher has been remarkablechanged after providing the feedback which has been provided bythe supervisor. It provides trainees with proper information abouttheir perforamcne immediately after completion of this lesson.Reported by Kaur and Meenakshi (2007) who found that significantimpact of teacher training programe on B.Ed. students attitudetowards teaching and personality. Jain (2008) study reveal that tribalB.Ed. trainees who gone through the training programmes forcreativity development have shown significantly higher fluency,flexibility and total creativity in comparison to untrained group.
EDUCATIONAL IMPLICATION
Teacher-education programme in India requires too much ofimprovement. Micro-teaching comes as a remedy to the difficultiesof teacher education programme. In this method an effective feedbackprovided for modification of behaviour. The knowledge and practiceteaching skill viz. introduction, questioning, probing, reinforcement,interaction and experimentation are developed throughmicroteaching at analysed the performance of pupils by use of video-tape. It is economical and takes less time.
REFERENCE
JAIN, SIDDHARTH. 2008. 'Effect of Creativity Development Programme of B.Ed.
Trainee', Indian Journal of Psychometric and Education Vol. 39(1),January, 67pp.

Modification of Teaching Behaviour through Micro Teaching
Indian Educational Review, Vol. 51, No.1, January 201312
KAUR, HARPREET AND MEENAKSHI. 2007. Impact of teachers training programme on
B.Ed. students motivity, attitude towards teaching and personality; Indian
Journal of Psychometric and Education vol. 37(1), January 81 pp.
PASSI, B.K. (1976). Becoming Better Teacher (Microteaching Approach) CentreOf Advanced Study in Education, M.S. University of Baroda.
SINGH, L.C. (1976). "Microteaching in Teacher Education", A review of research
(MIMCS) NCERT, New Delhi.

Indian Educational Review, Vol. 51, No.1, January 2013 13
Gender Inequality in School Education...
Gender Inequality in School Education with
Special Reference to North East India
DEIGRACIA NONGKYNRIH*
ABSTRACT
Education is viewed as a key factor in the development of human
capital. However, in India it is marked by high levels of gender in-
equality. The objective of this paper is to examine the extent of gender
inequality in school education (up to higher secondary) for the North
East (NE) states vis-à-vis the all India level. Secondary data from vari-
ous sources has been employed to examine this issue. The study con-
cludes that gender disparity is very much in existence in NE states
though it is relatively less than the all India level. Further the gender
disparity is revealing declining trends in past decade in these states
but at a slower pace. The smaller states of Mizoram and Meghalaya
are showing better gender equality than the relatively larger states of
Assam and Arunachal Pradesh in NE.
Introduction
Over the past few decades there has been an increased focus on thedevelopment of human capital as an engine for growth (Azariadisand Drazen, 1990; Barro, 1991; Mankiw et al., 1992). The interactionbetween human development and economic growth has been summedup by Ranis (2004) when he stated the existence of a two way relationbetween the two. Human development will have a positive effect ongrowth when human capabilities and freedom are enhanced foreconomic growth to take place. On the other hand, economic growthwill enhance human development when increased incomes widenchoices and capabilities of people at large. Human capital being a
* Assistant Professor, Department of Economics, North Eastern Hill University
(NEHU), Shillong

Gender Inequality in School Education...
Indian Educational Review, Vol. 51, No.1, January 201314
major component of the overall capital formation required in theprocess of growth and development, enhancing educationalattainment would therefore assume a central and key position insuch efforts. The pioneering work of Sen (1985) drew attention onthe role of literacy rate and education as a measure of the standardof living of countries (Basu and Foster, 1998). The role of education isnot only limited to human capital formation but encompasses a muchbroader spectrum. Most important of all, it is viewed as a means tobridge inequality amongst peoples and nations. However, in mostdeveloping countries including India, gender inequality in educationhas been one of the major eyesores eclipsing their growth anddevelopmental efforts. One of the many indicators of gender inequalityis in fact access to education and it specifically applies to:1. The numbers and percentage of literate persons, by age and
sex2. Years of schooling completed, by level and sex3. Gross primary and secondary school enrolment ratios for girls
and boys.The North East Region (NER) of India comprises the eight states
of Arunachal Pradesh (AP), Assam (ASM), Manipur (MAN), Meghalaya(MEG), Mizoram (MIZ), Nagaland (NGL), Sikkim (SKM) and Tripura(TRI). These states collectively account for eight per cent of the totalgeographical area of the country and roughly four per cent of thetotal population of the country. The region is widely known for itsethnic, linguistic and cultural diversity. A major chunk of thepopulation comprise of the tribals who are the main inhabitants ofthe region. However, in a few states like Assam and Tripura, tribalsconstitute a minority of the population. Being largely tribal societies,and in some states like Meghalaya the practice of the matrilinealsystem has facilitated an almost equal treatment given to both boysand girls. The region is considered to be one of the most economicallybackward in the country. Another feature related to the origin ofeducation in this region is that it is largely a contribution made bythe Christian missionaries for over more than a century. Over thecourse of time, this has evolved to a greater participation of both thepublic and private players. Further, special incentives and packages(such as the provision for setting up of central universities to caterto higher education) have been announced by the Government fromtime to time to improve the lot of the people residing in this remotepart of the country.
From this, therefore, it would naturally be anticipated thateducation in the NE region would a typically be much favoured with

Indian Educational Review, Vol. 51, No.1, January 2013 15
Gender Inequality in School Education...
respect to girls as opposed to the all India situation and that theirlevels of educational attainment would be much higher than therest of India. Further, it would also be anticipated that the gendergap in education would be non-existent due to the unbiased treatmentof girls in the indigenous tribal societies. In light of this, this paper isan attempt to present a profile of girl’s education in the region andfurther examine the extent of women’s education in NER by reviewingits progress over the past decades. The remaining paper is organisedas follows: Section 2 deals with the source and treatment of data.The empirical analysis and interpretation of various features arediscussed in section 3. The last section is devoted to summary ofconclusions and their relevant policy implications.
Data Sources
The data that has been used for this study is obtained from secondarysources namely; the Census data collected by the Government ofIndia (GoI) for 1981, 1991 and 2001, Selected Educational Statistics,Ministry of Human Resources Development, GoI and the NationalSample Survey Organisation (NSSO) unit data surveyed during the50th (1993-94), 61 st rounds (2004-05), respectively and NSSO reportfor the 64th round (2007-08). NSSO data has information on severaleasily quantifiable welfare indicators which is not available in theCensus data. An important characteristic of NSSO data is that it iscollected at the unit household level. The present study uses thisunit record level statistics which enhances the reliability of itsempirical results. It may be mentioned here that the main limitationof the study is the variations in data sources which may make theobservations not strictly comparable.
Profile of Girl’s Education in North East India
In this section we present a profile of the trends and thereof of girl’seducation in NE India. In order to examine the trends in girl’seducation we will examine the literacy rates by gender; years ofschooling completed by level and gender and gross school enrolmentratios for girls and boys at the primary, middle and secondary andhigher secondary levels.
Literacy Rate
Literacy rate has been measured as the proportion of populationaged seven years and over that can read and write (and understand)

Gender Inequality in School Education...
Indian Educational Review, Vol. 51, No.1, January 201316
a simple message (GoI, 2001). It may be worthwhile to look at therepresentation of women vis-à-vis men in terms of their literacy ratesas given in table I.
Source: Census of India, (Various Years); (* 2011 Provisional Report)
From table I it can be seen that there has been a substantialimprovement in the educational attainment of the Indian populationover the last several decades. Overall the literacy rate has increasedsubstantially from 36.2 per cent in 1981 to 74 per cent in 2011.Female literacy rate is higher in all the NE states except ArunachalPradesh than all India average in the year 2011. Female literacyregistered an increase from around 25 per cent in 1981 and currentlystands at 65.5 per cent in 2011 at the all India level. On the otherhand, the literacy rates of males which were 47 per cent in 1981increased to around 82 per cent in 2011. Despite the higher growthof female literacy rate (40.5 per cent) during the period 1981 to 2011compared to male literacy rate (35 per cent); yet the gender gap ineducation has not narrowed down appreciably over the past decadesas it still remains at around 17 per cent in 2011(Figure I). This goesto show that in the face of the improvements in literacy rates, theeducational gap between males and females still continues to exist.
Table I
Literacy Rates in North East States by Gender (in %)
States AP ASM MAN MEG MIZ NGL SKM TRI India
1981
Males 28.9 NA 53.3 37.9 64.5 50.1 43.9 51.7 46.9
Females 11.3 NA 29.1 30.1 54.9 33.9 22.2 32.0 24.8
Persons 20.8 NA 41.4 34.1 59.9 42.6 34.1 42.1 36.2
1991
Males 55.5 61.9 71.6 53.1 85.6 67.6 65.7 70.6 64.1
Females 29.7 43.0 47.6 44.9 78.6 54.8 46.7 49.7 39.3
Persons 41.6 52.9 59.89 49.1 82.3 61.7 56.9 60.4 52.2
2001
Males 63.8 71.3 80.3 65.4 90.7 71.2 76.0 81.0 75.3
Females 43.5 54.6 60.5 59.6 86.8 61.5 60.4 64.9 53.7
Persons 54.3 63.3 70.5 62.6 88.8 66.6 68.8 73.2 64.8
2011*
Males 73.7 78.8 86.5 77.2 93.7 83.3 87.3 92.2 82.1
Females 59.6 67.3 73.2 73.8 89.4 76.7 76.4 83.2 65.5
Persons 66.9 73.2 79.9 75.7 91.6 80.1 82.2 87.8 74.0

Indian Educational Review, Vol. 51, No.1, January 2013 17
Gender Inequality in School Education...
Figure I: Gender Gap in Literacy Rates
Source: Complied from Census Reports (Various Years)
As at the all India level, for the NER too literacy rates of malesare observed to be at much higher levels than that of females. However,the gender gap is narrower for the NER compared to the all Indiasituation (Figure I). This is largely due to higher female literacy ratesin the NE states compared to the all-India average. In 2011, gendergap in literacy was the highest for Arunachal Pradesh at 14 per centand the lowest for Meghalaya at around three per cent, Mizoram atfour percent and Nagaland at six per cent, respectively. For theremaining states the gender gap in literacy was around 10 to 13per cent. The question that ensues is whether the figures indicatethat gender discrimination in education is much lower in the NERcompared to the rest of India?
Examining literacy rates by area in the different NE states revealsthe existence of not just the gender gap but also the urban-ruraldifferences. Despite the steady improvement in female literacy inthe NE states over the decades, the urban-rural gap is still anextension of the all India scenario. The figures indicate higher literacyrates for the urban residents compared to the rural residents. Forinstance in 2001, urban literacy rates stood at 80.3 per centcompared to 59.4 per cent for the rural areas. Across states, ruralliteracy rates are almost half the urban literacy rates. The only upsideto this is that the urban-rural gap appears to be converging witheach and every decade. To better shed light on this we have presentedfemale literacy rates by area for the different NE states in table II.
Gen
der G
ap (%
)
States* (AP-Arunachal Pradesh, ASM-Assam, MAN-Manipur, MEG-
Meghalaya, MIZ-Mizoram, NGL-Nagaland, SKM-Sikkim, TRI-Tripura)

Gender Inequality in School Education...
Indian Educational Review, Vol. 51, No.1, January 201318
Table II
Female Literacy Rates by Area (in %)
As can be observed from table II, while rural literacy rates continueto be lower than urban literacy rates, women in rural NE stateshave a comparatively higher literacy rate than the all India average.The same is also observed for women in the urban areas. Thisindicates a steady improvement in women's education. Across statesminor variations are observed. For instance, while all the other NEstates are showing a fairly consistent improvement in the urban-rural gap, the only exception is observed for Arunachal Pradesh,and Assam. In these states, the urban-rural divide in womeneducation stands much higher than the all India level, as of 2001.Even though Arunachal Pradesh has shown an improvement overthe years, yet it is exhibiting the lowest literacy rates in the entireNE. This stands in sharp contrast to states like Mizoram with arelatively higher literacy rate recorded for both men and women.
An examination of the literacy rates by gender and area yieldsthe following: First, women still have lower educational attainmentthen men. The gender gap in literacy is still very much in existence,even though it has narrowed down over the years. Second, the urban-rural divide has not been bridged as the urban population still has ahigher educational attainment than the rural population. Third, ruralwomen's educational attainment exhibits very slow progress andcontinues to remain at lower levels.
Years of Schooling Completed
The extent of literacy depends to a greater level on the attendanceand non attendance in schools. To examine the proportion of childrenattending and not attending schools at different levels, NSSO data
1981 1991 2001
States Rural Urban U-R Rural Urban U-R Rural Urban U-R
AP 9.6 41.2 31.6 25.3 62.2 36.9 36.9 69.5 32.6
ASM NA NA NA 39.2 73.3 34.1 50.7 80.2 29.5
MAN 25.1 40.2 15.1 43.3 58.7 15.4 57.0 70.0 13.1
MEG 24.0 58.8 34.9 37.1 77.3 40.2 53.2 83.5 30.3
MIZ 49.9 70.5 20.6 67.0 91.6 24.6 77.3 95.8 18.5
NAG 30.3 56.9 26.7 50.4 79.1 28.7 57.5 81.4 23.9
SKM 18.2 45.4 27.2 43.9 74.9 31.0 58.0 79.2 21.2
TRI 27.6 67.1 39.5 44.3 76.9 32.6 60.5 85.0 24.5
India 18.0 47.8 29.9 30.6 64.1 33.4 46.1 72.9 26.7
Source: Census of India, (Various Years). U-R = Urban Rural gap

Indian Educational Review, Vol. 51, No.1, January 2013 19
Gender Inequality in School Education...
for the 50th (1993-94), 61st (2004-05) and 64th (2007-08) rounds onemployment and unemployment has been used. The informationprovided in this data set is reported in table III.
Table III
Proportion of Children Attending Schools in NE States (in %)
An examination of the level of current attendance of children atdifferent levels of schooling for all the NE states reveals the following:First, the proportion of children attending school in all the NE stateshas increased over time. Second, the urban-rural divide is still inexistence. Rural boys and girls have lower attendance compared tourban boys and girls. The only exception here is for the state of Sikkim,where the proportion of rural children is relatively higher than that ofthe urban children. This could be attributable to a higher proportionof children in the rural areas. Third, the gender gap in education isvery much in existence. The gender-gap increases as one progress tohigher levels of schooling (see appendix tables III: A, B and C at page29). While at lower levels of schooling (primary and middle levels)
1993-94 2004-05 2007-08*
States Area Girls Boys Total Girls Boys Total Girls Boys Total
AP Rural 20.7 24.8 22.8 40.4 48.6 44.7 50.6 57.4 54.1
Urban 40.5 32.2 36.2 61.7 67.8 64.9 65.0 72.2 78.7
ASM Rural 23.2 27.3 25.4 44.4 47.7 46.1 44.1 55.6 50.2
Urban 28.6 20.2 24.4 46.9 50.6 48.7 44.3 46.9 45.6
MAN Rural 33.7 35.3 34.5 54.7 62.9 58.9 52.1 59.6 56.1
Urban 43.8 38.5 41.2 63.8 71.8 67.9 63.4 66.3 65.2
MEG Rural 18.2 18.6 18.4 46.0 45.6 45.8 52.2 55.0 53.6
Urban 32.6 26.8 29.8 52.6 63.7 57.7 58.2 51.8 55.5
MIZ Rural 26.4 27.6 27.0 48.4 48.8 48.6 55.8 59.7 57.9
Urban 31.9 25.3 28.7 61.5 70.2 65.9 54.5 62.0 58.4
NAG Rural 39.5 45.1 42.4 50.1 59.7 55.0 38.5 44.8 41.8
Urban 35.8 33.1 34.3 54.8 64.9 60.0 48.8 58.5 53.9
SKM Rural 30.3 29.7 30.0 55.7 54.2 54.9 53.1 57.5 55.3
Urban 38.0 23.6 30.3 44.0 51.6 48.1 35.4 41.1 38.7
TRI Rural 27.9 32.1 30.1 48.8 50.2 49.5 44.2 48.3 46.4
Urban 29.5 27.0 28.3 39.3 48.7 43.6 43.2 53.3 48.2
Rural 15.8 22.7 19.3 36.7 44.4 40.7 44.6 51.7 48.3
Urban 24.3 22.0 23.2 43.8 44.9 44.4 43.4 45.4 44.6
Source: NSSO 50th, 61st& 64th Round Employment and Unemployment Data.
All
India

Gender Inequality in School Education...
Indian Educational Review, Vol. 51, No.1, January 201320
girls are observed to be almost at par with boys in terms of attendance,the situation is the opposite for high and higher secondary levels.Attendance of girls at different levels of schooling diminishes at eachand every successive stage. For all NE states uniformly, boys areobserved to be having a higher percentage of attendance comparedto girls. This difference is also observed at the all India level.
It has been noted by researchers that the proportion of childrenattending school declines as one progress to higher levels of education(Velkoff, 1999; World Bank, 2003). Accordingly, it can also be inferredthat the proportion of girls not attending schools would naturally behigh. This can be verified by an examination of the proportion ofchildren not attending schools.
Table IV reports the proportion of children not attending schoolsfor all stages, that is primary, middle and secondary and highersecondary stages, for all the NE states.
Table IV
Proportion of Children Not Attending School in NE States (in %)
1993-94 2004-05 2007-08
States Sector Girls Boys Total Girls Boys Total Girls Boys Total
AP Rural 78.9 74.9 76.8 59.3 51.1 55.1 44.4 38.3 40.9
Urban 58.7 59.9 59.3 37.5 30.9 33.9 27.7 18.7 23.3
ASM Rural 76.1 71.6 73.7 55.1 51.5 53.2 52.8 41.4 46.7
Urban 68.6 68.0 68.3 49.7 46.4 48.1 49.8 43.9 46.8
MAN Rural 64.7 62.0 63.4 44.6 36.3 40.3 42.4 34.4 38.1
Urban 54.8 53.4 54.1 33.8 25.4 29.5 29.9 28.1 28.9
MEG Rural 81.5 80.7 81.1 53.6 54.2 53.9 38.1 33.5 35.8
Urban 65.3 64.5 64.9 45.8 34.7 40.6 25.7 28.5 27.0
MIZ Rural 72.7 71.6 72.2 51.4 50.8 51.1 41.1 39.7 40.4
Urban 65.4 64.3 64.8 36.6 28.2 32.4 38.4 29.1 33.7
NGL Rural 59.8 54.0 56.8 48.6 38.6 43.5 54.3 48.5 51.5
Urban 62.4 56.2 58.8 41.7 32.1 36.7 41.6 35.0 38.2
SKM Rural 69.3 69.7 69.5 43.9 45.5 44.7 41.4 36.2 38.7
Urban 61.6 69.1 65.8 52.9 45.4 48.8 57.8 48.6 52.4
TRI Rural 71.6 66.9 69.2 50.8 49.3 50.1 53.4 44.5 51.5
Urban 68.6 66.4 67.5 58.5 48.8 54.0 45.3 38.4 42.1
Rural 83.9 76.4 80.0 62.5 54.5 58.4 52.6 44.3 48.3
Urban 73.6 70.3 71.9 53.2 51.4 52.2 47.8 45.6 46.7
Source: As in Table III
All
India

Indian Educational Review, Vol. 51, No.1, January 2013 21
Gender Inequality in School Education...
It can be gauged from table IV that India and the NER in particularhave a very high rate of children not attending schools. For the NEstates the figures in the rural areas average around 43 per cent ofboys and girls that do not attend educational institutions in 2007-08, and around 37 percent in the urban areas, while it is around 47to 48 per cent, respectively for all India. This difference reflects thedistortion of the educational system existing in the rural and urbanareas. Further, gender difference of non-attendance in educationalinstitutions is also very much visible. As can be seen from the table,be it for individual states in the NE region or the country as a whole,girls constitute a higher proportion of children not attending schools.Even though the figures have declined from the years 1993-94 to2007-08, it still becomes obvious that girls are generally given asecondary status when it comes to education.
Gross School Enrolment Ratios
To further explore the issue of such disparities we will examine thegross school enrolment at different educational stages. Grossenrolment ratio (GER) is defined as the percentage of enrolment inclasses I-V, VI-VIII and IX -XII to the estimated population in the agegroup 6 to below 11 years and 11 to below 14 years and 14 to 18years respectively. Enrolment in these stages includes under-ageand over-age children. Hence, the percentage may be more than100 per cent in some cases. The GER at the primary, middle, andhigher secondary levels by gender across the NE states has beenreported in table V.
Table V
Gender-wise Gross Enrolment Ratio by Stages/Classes (in %)
Stages Year Sex AP ASM MAN MEG MIZ NGL SKM TRI India
1980-81 Boys 94.5 78.8 125.7 64.5 82.6 103.7 122.6 121.4 95.8
Girls 50.7 62.6 103.2 67.2 74.2 83.4 85.9 93.6 64.1
1990-91 Boys 121.4 109.7 118.7 67.4 153.4 113.2 130.0 144.0 114.0
Girls 58.1 89.7 105.1 60.8 146.1 99.1 115.2 122.7 85.5
2004-05 Boys 130.0 105.6 154.4 145.3 132.3 88.7 144.5 133.7 110.7
Girls 115.9 104.8 148.9 150.0 122.7 87.2 142.7 128.3 104.7
2007-08 Boys 149.1 106.0 176.0 193.5 176.1 92.5 149.3 149.4 115.3
Girls 136.6 106.2 170.3 189.5 165.7 92.5 146.7 146.2 112.6
1980-81 Boys 29.0 48.8 60.8 31.6 52.2 45.4 43.7 48.2 54.3
Girls 13.4 31.0 41.0 28.3 45.0 34.2 25.1 34.5 28.6
PrimaryI-V

Gender Inequality in School Education...
Indian Educational Review, Vol. 51, No.1, January 201322
Middle
VI-VIII
Higher
Secondary
IX-XII
1990-91 Boys 54.7 60.3 69.8 38.8 78.3 67.3 46.8 80.2 76.6
Girls 33.3 43.9 61.3 38.0 79.4 63.0 45.1 64.7 47.0
2004-05 Boys 81.8 72.1 97.7 72.1 82.2 55.7 61.5 80.7 74.3
Girls 69.2 67.2 91.5 81.0 81.3 55.5 72.2 75.6 65.1
2007-08 Boys 100.9 92.0 107.6 99.7 86.3 58.9 67.6 88.0 81.5
Girls 87.7 90.5 100.9 107.0 85.0 61.3 81.9 87.6 74.4
1980-81 Boys 13.2 27.0 40.9 18.7 28.0 19.7 10.9 27.4 34.2
Girls 4.8 14.7 24.0 16.5 21.9 11.0 6.0 18.2 15.4
1990-91 Boys 29.5 26.9 40.1 13.7 24.7 21.2 23.3 35.7 33.9
Girls 14.6 18.1 28.7 12.5 24.4 18.9 18.6 24.6 10.3
2004-05 Boys 0.6 35.9 50.5 32.6 44.2 21.5 33.1 41.3 44.3
Girls 0.5 28.3 46.8 33.9 45.1 21.1 33.5 36.3 35.1
2007-08 Boys 65.4 46.3 77.0 49.1 67.1 27.2 44.4 59.9 62.6
Girls 60.6 41.9 77.4 53.7 70.3 30.1 45.1 59.8 53.2
Source: Selected Educational Statistics (Various Issues)
It can be inferred from table V that, while, enrolments at theprimary stages continue to remain at higher levels for both boys andgirls, the same is not evident for middle and higher secondary stages.The ratio of school enrolment appears to be waning as one proceedsto higher levels of education. A major educational problem facingboth boys and girls is that although they may be enrolled at thebeginning of the year, they don't always remain in school. Animportant point to note is that girls' enrolment although decliningfrom one stage to another, remains much lower than those of boys.UNICEF (1999) estimated that 41 per cent of Indian girls under theage of 14 years do not attend school and are often taken out of schoolto help with the family responsibilities. This in fact is one of the mostdistressing aspects of the educational system in contemporary India.NSSO (2007-08) reported that the primary factor responsible for non-enrolment of children is that parents are not interested in theeducation of their children. Besides, financial constraints and thebelief that education is not necessary are the other major factors.
Examining the gross enrolment for the different NE states wealso see the existence of gender disparities in enrolment. For stagesI to V we witness a lower girls to boys enrolment which graduallyimproved over the years. On an average, girls enrolment at stages Ito V, in 1980-81 was only 77.6 per cent while boys was 99.2 per centrespectively which increased to 144.2 and 149 per cent respectivelyin 2007-08. For middle and higher secondary levels we observe a

Indian Educational Review, Vol. 51, No.1, January 2013 23
Gender Inequality in School Education...
gradual deceleration of enrolment for both boys and girls. In2007-08, enrolment for both sexes in VI to VII stages was around88 per cent and 55 per cent for IX to XII stages. This shows a decliningenrolment as one proceeds to higher educational levels. Inter-statedifference in enrolment is also evident. For instance, Nagaland andAssam continue to have the lowest enrolments for all levels ofeducation compared to the other NE states. Sikkim has also notfared well for secondary and higher secondary levels as theenrolments are still less than the rest of the NE and the all Indialevel. On the other hand, Arunachal Pradesh has shown slightimprovement in enrolments at higher educational stages. Meghalayaand Mizoram have exhibited an almost proportional enrolment amongboys and girls over the years.
The declining enrolment rate of girls at different stages ofschooling can be weighed against the total enrolment of studentsat each corresponding stage. This is shown in table VI where wepresent the percentage of girls' enrolment to total enrolment indifferent stages/classes of education for the different NE statesfor 2004-05 and 2007-08.
Table VI
Percentage of Girls Enrolment in Different Stages/Classes
2004-05 2007-08
States Primary Middle Secondary Primary Middle Secondary
(I-V) (VI-VIII) (IX-XII) (I-V) (VI-VIII) (IX-XII)
AP 45.8 45.2 41.3 46.7 45.9 44.9
ASM 48.9 47.0 42.5 49.2 48.5 45.2
MAN 48.2 47.3 47.9 48.3 47.4 47.9
MEG 50.3 52.1 50.3 49.0 51.2 51.5
MIZ 47.6 48.9 49.9 48.5 48.8 49.6
NGL 47.8 48.0 47.4 48.2 48.9 48.2
SKM 49.7 52.8 50.3 49.2 53.7 50.9
TRI 47.8 47.1 45.5 48.5 48.8 46.8
India 46.7 44.4 41.5 47.5 45.7 43.4
As suggested by table VI, the percentage of girls enrolled atdifferent stages of education has marginally increased over time.However, with every increase in educational stages, the percentageof girls' enrolment is exhibiting a declining trend. This implies thatgirls' enrolment at different stages of education peaks only at theprimary level and from then on starts the downward movement with
Source : Compiled from Selected Educational Statistics (Various issues).

Gender Inequality in School Education...
Indian Educational Review, Vol. 51, No.1, January 201324
every higher level of education. On the other hand, it also impliesboys' enrolment increases with every higher stages of education.The only upswing is the relatively high and increasing enrolmentfor girls in Meghalaya, Mizoram and Sikkim at around 49 to50 per cent for all stages as of 2007-08. Clearly a lot still needs to bedone towards achieving higher enrolment of girls at all stages ofeducation.
This disparity in the school enrolment of girls and boys becomesnoticeable when we examine the gender parity index (GPI) ineducation. GPI is calculated by dividing girl's GER by boy's GER of agiven level of education. It measures progress towards gender equityin education. When the GPI shows a value equal to one at any levelof education it shows that there is no gender disparity at that leveland learning opportunities are available for girls equally to that ofboys. Figure II presents the gender parity index in education.
Figure II : Gender Parity Index
Source : Compiled from Selected Educational Statistics (Various Issues)
Figure II corroborates the existence of an imbalance in enrolmentand educational attainment of boys and girls for all levels ofeducation. For instance, in 2007-08 the index is less than one for allother stages of education except for stages VI to VIII only wherein itis greater than one. Comparing between the educational attainmentof children in the NE states and the all India figure, the index ismuch higher in the former compared to the latter. Thus, it couldlead to the belief that there is less gender discrimination in the NEstates. However, it is important to note that even if that were thecase the figures still exhibits a disparity between the educationalattainment of boys and girls in the NE states in particular and Indiain general. The persistent problem of educational inequality
Cla
sses a
nd Y
ears

Indian Educational Review, Vol. 51, No.1, January 2013 25
Gender Inequality in School Education...
confronting these societies today could also be attributed to highdrop out rates of children in these states. We present the drop-outrates for the different NE states in table VII. The drop-out raterepresents the percentage of pupils who drop out from a given gradeor cycle or level of education in a given school year.
Table VII
Drop-Out Rate from I-X stages of school education in NE India
Clearly, the NE states inspite of having a better performance interms of the overall literacy levels and enrolments compared to therest of India is, suffering from high levels of school drop outs amongstboys and girls. There has been a higher drop-out rate of both girlsand boys in all the NE states, with the lowest only for Manipur. Forthe rest of the states their dropout rates are much higher than thenational average. Similarly, gender breakup of the drop-out ratesalso reveals the same picture. From table VII it can be noticed thatin all the three time periods (1990-91, 2004-05 and 2007-08), drop-out rates of females are much higher than males in all levels ofeducation. This is one of the major causes of the low levels ofeducational attainment of females in not just the NE states but forIndia as a whole. The reason for high drop-outs though varied isdependent on various factors. NSSO (2007-08) reported that21.4 per cent of drop-outs in the country are commonly due to financialconstraints and 20 per cent is due to the child's lack of interest intheir studies. Other factors includes the inability to cope up or failurein their studies, completion of the desired level or class of educationand parents' lack of interest in their children's studies. This proves
1990-91 2004-05 2007-08
States I-X I-X I-X
Boys Girls Total Boys Girls Total Boys Girls Total
AP 79.1 82.2 80.2 69.6 72.3 70.8 63.7 62.2 63.0
ASM 79.8 83.4 81.4 75.2 74.7 74.9 80.1 80.2 75.7
MAN 74.2 78.4 76.1 46.0 39.6 43.0 47.9 40.8 44.6
MEG 66.0 59.7 63.1 79.6 78.7 79.2 76.8 75.5 76.1
MIZ 45.4 42.2 43.9 69.5 64.1 66.9 72.1 67.9 70.2
NGL 68.9 68.8 68.9 66.9 67.6 67.3 74.6 73.4 74.0
SKM 84.9 85.9 85.4 83.3 81.2 82.3 80.6 79.3 79.9
TRI 83.5 85.7 84.5 73.6 73.1 73.4 73.5 73.4 73.4
India 67.5 76.9 71.3 60.4 63.9 61.9 56.6 57.3 56.7
Source: Selected Educational Statistics (Various Issues)

Gender Inequality in School Education...
Indian Educational Review, Vol. 51, No.1, January 201326
that gender bias is very much in existence even in these states as isin the all India situation, though at lower levels in comparison tothe latter.
Conclusion and Implications
To sum up, this paper has highlighted the status of female educationin NE India. By examining the various aspects of education such asthe literacy rates, years of schooling completed and school enrolmentratios, it can be safely stated that gender equality in school educationhas not been achieved in the NE states. Gender inequality is still inexistence, even though it is relatively less than the all India level.Further the gender disparity is revealing declining trends in pastdecade in these states but at a slower pace. Despite high literacyrates, girls' education in NE India still suffers from low enrolments,especially at higher stages of schooling. This is further compoundedby the high level of dropout rates among the girls. Moreover, theexistence of the gender gap in education suggests that boy's educationis still preferred over that of girls. Some smaller states like Mizoramand Meghalaya are showing better gender equality than the relativelylarger states of Assam and Arunachal Pradesh in NER. It may bepointed here, that the former states are largely tribal and Christiandominated states as opposed to the latter, which is a mix populationof tribals and non-tribals and are mostly Hindu dominated. Thiscomparatively lower gender inequality in the former states on theone hand could reflect the role and influence of missionary education.Most importantly, on the other, the practice of matriliny anddomination of tribal culture appears to be the main influencing factorof lower gender inequality.
Efforts at reducing this problem of inequality while in place asprovided for by various governmental schemes, the lacunae appearsto be in the implementation. If this loophole is not properly addressedthe consequent impact at higher levels of education will lead to afurther divergence rather than a convergence of the gender gap ineducation. The other issue is related to appropriate and effectiveplanning and its implementation. In this context regional educationalplanning taking into consideration the regional situations is of utmostimportance. This requires the immediate attention of policy makers.By registering the number of children born, the authorities can planfor their education by putting in place the requisite infrastructurefor the future. This will not only aid in enrolment through theavailability of schools but most importantly the retention of children

Indian Educational Review, Vol. 51, No.1, January 2013 27
Gender Inequality in School Education...
in schools. Finally, the regional differences in education as well asurban-rural disparities also need to be addressed. The concentrationof better educational institutions in urban and metropolis areas isresulting in a large number of rural children to drop out of schools.A more concerted effort is therefore required to genuinely improveinfrastructure in such backward areas of the country. The mainchallenge for us, however, remains that we bridge this gap ineducation by increasing equality of opportunities for girls withemphasis to be laid not just on primary but also higher education.One important factor that would work in favour of this effort atreducing gender inequality lies in the inherent structure of the NEsocieties themselves. The social practices prevalent in these societies– which manifest in the equal treatment of both boys and girls –should be further encouraged to achieve the desired goals ineducation.
REFERENCES
AZARIADIS, C. AND DRAZEN, A. 1990. "Threshold Externalities in EconomicDevelopment", The Quarterly Journal of Economics, 105(2), pp.501-526.
BARRO, R. 1991. "Economic Growth in a Cross Section of Countries", The
Quarterly Journal of Economics, 106(2), pp.407-443.
BASU, K. AND FOSTER, J.E. 1998. "On Measuring Literacy", The Economic Journal,
108(451), pp.1733-1749.
MANKIW, N.G., ROMER, D AND WEIL, D.N. 1992. "A Contribution to the Empiricsof Economic Growth", The Quarterly Journal of Economics, 107(2),
pp.407-437.
MHRD. 1993-94. Selected Education Statistics, 1993-94, Ministry of Human
Resource Development, New Delhi.
______ (2004-05) Selected Education Statistics, 2004-05, Ministry of HumanResource Development, New Delhi.
______ (2007-08) Selected Education Statistics, 2007-08, Ministry of Human
Resource Development, New Delhi.
NATIONAL SAMPLE SURVEY (NSSO) 2007-08. Education in India: 2007-08 –
Participation and Expenditure. NSS 64th Round, Report No. 532(64/25.2/1).
RANIS, G. 2004. "Human Development and Economic Growth", Center
Discussion Paper No. 887, Economic Growth Center, Yale University.
REGISTRAR GENERAL OF INDIA. 1981. Census of India 1981, B Series, New Delhi.
_______ (1991), Census of India 1991, B Series, New Delhi.
_______ (2001), Census of India 2001, B Series, New Delhi.

Gender Inequality in School Education...
Indian Educational Review, Vol. 51, No.1, January 201328
_______ (2011), Census of India 2011, Provisional Population Totals India:
Paper1, Report available online at: http://www.censusindia.gov.in/
2011-prov-results/prov_results_paper1_india.html
VELKOFF, V. 1998. Women's Education in India, U.S. Department of Commerce,Economics and Statistics Administration, Bureau of the Census.
UNICEF. 1999. The State of the World's Children 1999- Education, Report
available online at: http://www.unicef.org/sowc99/sowc99e.pdf.
WORLD BANK. 2003. Achieving Universal Primary Education by 2015: A Chance
for Every Child, The World Bank, Washington, D.C.

Indian Educational Review, Vol. 51, No.1, January 2013 29
Gender Inequality in School Education...
Appendix
Table III B
Proportion of Children Attending Middle School in NE States (in %)
1993-94 2004-05 2007-08
States Sector Girls Boys Total Girls Boys Total Girls Boys Total
AP Rural 4.4 5.7 5.1 9.2 10.5 9.9 12.4 10.9 11.7
Urban 12.1 8.7 10.3 15.5 13.3 14.3 17.1 19.2 18.2
ASM Rural 5.6 7.1 6.4 10.0 10.7 10.3 14.0 13.4 13.7
Urban 7.3 7.6 7.4 12.7 10.9 11.9 13.6 12.5 13.0
MAN Rural 8.0 8.2 8.1 11.6 13.6 12.69 11.8 13.5 12.7
Urban 8.4 7.6 8.0 12.5 15.2 13.9 13.0 15.9 14.6
MEG Rural 6.0 6.7 6.4 8.2 7.2 7.7 15.7 14.4 15.1
Urban 10.4 9.2 9.8 9.0 11.6 10.2 19.2 9.7 15.1
Table III A
Proportion of Children Attending Primary School in NE States (in %)
1993-94 2004-05 2007-08*
States Sector Girls Boys Total Girls Boys Total Girls Boys Total
AP Rural 9.4 10.8 10.1 21.2 25.1 23.2 29.3 30.4 29.9
Urban 11.7 12.4 12.1 27.9 29.8 28.9 30.2 27.6 28.9
ASM Rural 10.3 11.4 10.9 24.3 25.1 24.7 21.3 31.1 26.5
Urban 9.3 8.0 8.6 17.3 22.3 19.7 20.6 22.7 21.7
MAN Rural 10.6 9.2 9.9 22.5 24.1 23.3 28.7 32.3 30.6
Urban 9.6 13.3 11.5 25.6 27.2 26.4 32.5 31.8 32.2
MEG Rural 7.5 7.1 7.3 20.7 24.2 22.5 29.2 31.8 30.5
Urban 9.3 11.1 10.2 16.4 23.2 19.5 26.2 26.2 26.2
MIZ Rural 9.6 8.1 8.8 23.2 21.5 22.3 30.1 32.7 31.5
Urban 11.6 10.4 11.0 17.9 23.6 20.7 24.9 23.9 24.4
NGL Rural 12.3 12.1 12.2 20.2 22.7 21.5 18.0 23.4 20.7
Urban 10.4 12.7 11.8 16.3 19.0 17.7 20.3 23.9 22.2
SKM Rural 13.2 11.6 12.3 27.4 23.9 25.6 29.1 31.7 30.4
Urban 13.4 9.8 11.4 14.4 21.6 18.4 22.4 27.8 25.6
TRI Rural 14.2 15.8 15.0 24.3 23.2 23.8 21.9 24.7 23.4
Urban 12.8 12.2 12.5 17.8 16.4 17.1 19.6 19.7 19.7
India Rural 7.9 10.1 9.04 20.4 22.8 21.6 25.2 27.8 26.6
Urban 9.3 9.9 9.61 17.1 17.3 17.2 19.6 20.8 20.3
Source: As in table III

Gender Inequality in School Education...
Indian Educational Review, Vol. 51, No.1, January 201330
MIZ Rural 7.4 8.6 8.1 12.4 11.6 12.0 16.1 18.4 17.3
Urban 7.5 8.8 8.2 16.4 16.0 16.2 15.0 20.4 17.8
NGL Rural 11.1 10.6 10.8 11.0 11.3 11.2 10.2 9.5 9.9
Urban 10.3 9.6 9.9 7.8 10.1 9.0 11.2 15.3 13.4
SKM Rural 7.5 7.7 7.6 15.5 15.1 15.3 15.5 15.4 15.5
Urban 7.7 6.7 7.2 10.9 14.4 12.8 7.1 8.7 8.0
TRI Rural 6.6 9.4 8.0 12.2 12.6 12.4 14.0 12.1 13.0
Urban 8.3 8.4 8.4 8.1 13.3 10.5 8.3 14.5 11.4
India Rural 3.4 5.1 4.3 8.1 10.0 9.1 11.7 13.5 12.6
Urban 5.8 5.9 5.9 9.8 9.6 9.7 12.0 12.0 12.0
Source: As in Table III
Table III C
Proportion of Children Attending Secondary School in NE States (in %)
1993-94 2004-05 2007-08
States Sector Girls Boys Total Girls Boys Total Girls Boys Total
AP Rural 2.5 4.7 3. 7 6.5 8.7 7.7 8.9 16.1 12.5
Urban 10.0 9.1 9.5 12.0 15.0 13.6 17.7 25.4 31.6
ASM Rural 5.8 7.7 6.8 8.1 9.0 8.6 8.8 11.1 10.0
Urban 9.7 9.5 9.6 11.4 11.4 11.4 10.1 11.7 10.9
MAN Rural 7.2 9.9 8.5 14.24 16.8 15.6 11.6 13.8 12.8
Urban 8.7 8.6 8.7 16.7 17.7 17.2 17.9 18.6 18.4
MEG Rural 2.6 2.7 2.7 6.97 6.9 6.9 7.3 8.8 8.0
Urban 8.9 8.6 8.7 18.47 18.8 18.6 12.8 15.9 14.2
MIZ Rural 5. 7 6. 9 6.3 10.1 11.9 11.0 9.6 8.6 9.1
Urban 9.5 9.8 9.7 20.8 22.57 21.7 14.6 17.7 16.2
NGL Rural 11.6 17.6 14.8 12.3 17.2 14.8 10.3 11.9 11.2
Urban 9.4 11.6 10.6 18.5 22.4 20.5 17.3 19.3 18.3
SKM Rural 3.9 3.8 3.8 9.4 11.1 10.3 8.5 10.4 9.4
Urban 9.9 7.5 8. 6 8.9 7.5 8.1 5.9 4.6 5.1
TRI Rural 2.7 3.3 3.0 7.4 9.4 8.5 8.3 11.5 10.0
Urban 4.0 6.6 5.3 8.0 11.6 9.7 15.3 19.1 17.1
India Rural 1.9 4.1 3.0 5.5 8.3 6.9 7.7 10.4 9.1
Urban 4.9 5.6 5.3 10. 7 11.3 11.0 11.8 12.6 12.3

Localised Learning in Rural School Context: Problems and Prospects
Indian Educational Review, Vol. 51, No.1, January 2013 31
Localised Learning in Rural School
Context: Problems and Prospects
PRAJNYA PARAMITA JENA*
ABSTRACT
Although the approach of localised learning being advocated in school
curriculum frameworks, its implementation has not been widespread.
Nonetheless, localised learning tends for the most part to be dominated
by issues, while the method of making learning localised remain
comparatively neglected. Considering the issue of low quality of school
education, particularly in rural areas, it is presumed that only the
teachers with positive motivation, skill and professionalism can make
the localised learning successful with the availability of proper
educational resources.
This paper interprets the concept of localised learning and presents
the author’s own past experience as a rural school teacher as well as
her identification of different issues that constrains localised learning
and views on the roadmap for implementing localised learning.
Introduction
Education is recognised as significant for economic growth andpoverty reduction whereas the school is assigned with the task ofinculcating knowledge, skills and values among future citizens andpromising for 'promoting education for all'. But, the school systemand the teacher being guided by the socio-economic-political ethosof the society do not play in the same way all over the country.Considering the ASER report (Rural) (2012) it is inferred that despitehigh investment there is low participation and under-achievementof students in many aspects, particularly in rural areas. The report
* Research Scholar, (Ph.D), Faculty of Education, Jamia Millia Islamia

Localised Learning in Rural School Context: Problems and Prospects
Indian Educational Review, Vol. 51, No.1, January 201332
found that the proportion of out of school children has increased,especially among girls in the age group of 11 to 14. Across ruralIndia, 48.9 per cent children enrolled in Std. V could read Englishwords or more, and 22.5 per cent could read simple English sentences.For improving the accessibility, availability and quality of schooleducation in India, major reforms including improvement of schoolingfacilities through Sarva Shiksha Abhiyan, National CurriculumFramework 2005(NCF 2005), decentralisation of examinations, Rightto Education Act 2009 and Rashtriya Madhyamik Shiksha Abhiyanfor Universalisation of Secondary Education have been introduced.The curriculum reform (NCF 2005) advocating for a facilitating roleof teachers in children's learning and approaching the curriculumas flexible and integrated, allows the teachers for relating teaching-learning to the local environment or community of the children. Inthis manner, the recent curriculum framework promotes a localisedapproach for curriculum transaction as teachers have the flexibilityto utilise the immediate experience of the children gained from theirhome, community as the basis of learning for dealing with theprescribed content. Although this approach to the learning beingadvocated, its implementation has not been widespread. Observingthe problems faced by rural education sector, the complexity relatedwith the success of localised learning is lack of availability ofappropriate learning resources and teachers with lack of skill,motivation and professionalism. This article interprets the conceptof localised learning and presents the author's own past experienceas a rural school teacher as well as her identification of differentissues that constrains localised learning and views on the roadmapfor implementing localised learning.
Concept of Localised Learning
The concept localised learning emerged in relation to globalisation.Localised learning contributed with an account of contemporaryindustrial transformation that emphasised how the current economicdevelopment of a specific region or country cannot be separated fromthe particular endowment of social, cultural and institutionalpatterns with which it is intimately related (Malmberg & Maskell,2006).) The general assumption underlying the localised learningargument is that with the increasing speed of globalisation (i.e.growing exports of both finished and semi-finished goods, andubiquitification of production factors), differences in regions learningabilities matter still more (Amin and Thrift, Maskell et al., Garnsey,

Localised Learning in Rural School Context: Problems and Prospects
Indian Educational Review, Vol. 51, No.1, January 2013 33
Amin and Wilkinson in Lorenzen 1999). Localised learning outlineshow local conditions and spatial proximity between actors enablethe formation of distinctive cognitive repertoires and influence thegeneration and selection of skills, processes and products within afield of knowledge or activity (Malmberg and Maskell, 2006).
As far as my view is concerned in educational perspective localisedlearning means connecting the learning to real-life situations andassociating the contents of the curriculum to the local surroundingsof children. The curriculum and teaching learning process need bebased on the local needs and relevance for the learners.
In order to enhance a child's learning, it is imperative to relatethe contents of the curriculum somehow to the child's own real lifeexperiences, and accordingly to assimilate the whole learningexperience. Learning becomes unproblematic when outside schoolexperience that the child gains in home and community is related toschool experience through the formal curriculum. In this way thelearning should be localised or contextualised.
The aim of this strategy of localised learning is to inculcate betterunderstanding of concepts, well organised application of localknowledge in formal learning, better performance in examinations,increase in achievement rate and ultimately making the learningeffective. Localised learning takes place when the content of thecurriculum, the approaches and the learning materials are connecteddirectly to the immediate experience and environment of the learner.Learning can be localised when teachers tend to use the experienceof the learners as a basis for learning in dealing with the prescribedcontent. Localised learning can place the learner in the heart oflearning process and assist to maintain the links among school,home and community, enhancing the effectiveness of learning inthe school in rural areas. National Curriculum Framework 2005advocated for integrated approach to curriculum development, whichis encouraging to the use of localised learning in schools, as teacherscan connect learning to the local context.
The Education in Rural Context
The rural context is characterised by complexities associated withsocio-economic factors. The income of rural people is very low. Inrural areas, parents being less educated give low importance toschooling of their children. Children are frequently expected to assisttheir parents in earning for their bread, and so are irregular inattending the school. Schools in rural context fail to meet the needs

Localised Learning in Rural School Context: Problems and Prospects
Indian Educational Review, Vol. 51, No.1, January 201334
of children's learning. Sometimes children come to schoolundernourished. The disadvantaged children in rural areas havinglimited background of language and learning experiences in theirhome and community face difficulty in understanding the languageand the concepts used by their teachers and in books. There bychildren lacking the appropriate experience are less interested inlearning. Students are passive listeners in the classroom withoutgetting any learning assistance at home. Hence the contextualfactors in rural areas reinforce the vicious circle of poverty andilliteracy. Taylor and Mulhall (2001) citing Ader advocated for a systemof education which would develop the learning potential of ruralchildren and take care of rural needs in relation to resources andfuture changes.
The adverse situation resulting from deprivation of parentalsupport in learning is further worsen when teachers beinguninformed of the poor academic background and support at homeinitiate teaching with unknown and inexperienced, but not withknown to unknown. This is due to the lack of training of teachers inrural pedagogy. Sometimes teachers from urban areas are appointedin rural schools. They have small or no familiarity with thebackground of their students and have less to dedication for work asthey have to travel a long distance to school. Being demotivated tothe profession, their pedagogical practices are likely to be poor.
Education in Rural Odisha
The National Family Health Survey-3 (2005-06) shows that in Odisha,only 65 per cent of children ages 6-17 years attend school. Schoolattendance in Odisha is 12 percentage points higher in urban areas(75%) than in rural areas (63%). Eighty-six per cent of primary-schoolage children (6-10 years) attend school (96% in urban areas and84% in rural areas). The drop in school attendance with an increasein age is somewhat larger in rural areas than in urban areas. Inurban areas, school attendance is almost the same for boys andgirls in the age groups 6-10 years (95-96%) and 15-17 years (36-37%), and slightly higher for girls than boys in the age group 11- 14years (81% of girls compared with 78% of boys). By contrast, in ruralareas, girls in all age groups are less expected to attend school thanthe boys, with the differential increasing substantially with age. Inrural areas, at age 6-10 years 86 per cent of boys and 82 per cent ofgirls are attending school; by age 15-17 years, only 32 per cent ofboys and 13 per cent of girls are attending school. However, the extent

Localised Learning in Rural School Context: Problems and Prospects
Indian Educational Review, Vol. 51, No.1, January 2013 35
and direction of this gender inequality in schooling varies significantlyby age and urban-rural residence. The various factors as identifiedabove in rural context may be the cause of this deplorable conditionof schooling in rural areas of Odisha.
My Experience of Localised Learning
From my teachership experience in government schools, both atelementary and secondary stage in rural areas in Bhadrak districtof Odisha, I felt that the usual pedagogical approach for teaching inrural government schools is chalk and talk and lecture method. Butmany times we (I and my teacher colleagues) used to narrate thecontents to the real life experiences of students. Health and Foodtopics were narrated by exemplifying home circumstances.Environmental pollution, soil erosion, soil conservation and land useetc. topics were often taught by relating to children's experiences inagriculture. It was realised by us that children understand theabstract concepts well by familiar and real life examples. Learningcan be localised when contextual (both home and community)experience of children applied to school learning. But I as a teacherconfess that neither I nor my colleagues didn't practice this pedagogyin a regular manner. Planning of such strategies was rare.
There are many reasons behind the reluctance of teachers inpractising this pedagogy of localised learning. Teachers lack therequired skills to connect school learning to the daily life experiencesof students, as they were trained neither during pre-service nor in-serviced professional development programmes. The curricula, syllabiand textbooks are basically theory oriented, with rare reference topractical activities. The curriculum is unrelated with the daily lifeexperiences of the students, and it includes some content areas whichcannot be related to practical real-life circumstances. There is noflexibility for schools to include some input in curriculum. Theresponsibility of preparing school curriculum is at the state levelagencies. The teachers have no flexibility in adopting appropriateteaching strategies as they move with tremendous anxiety of coveringthe syllabus in accordance with the prescribed plan and therequirements of the examination system. On the other hand theyundergo less pressure by teaching through lecture method usingbooks, requiring no immense effort or imaginative and innovativeplanning of teaching-learning experiences. The teachers in ruralareas are demotivated and less accountable as there is little prospectfor appreciation or admiration of excellent and creative work by themfor professional development.

Localised Learning in Rural School Context: Problems and Prospects
Indian Educational Review, Vol. 51, No.1, January 201336
A Step for Localising Early Learning through Farming
In rural schools, most of the students have thorough familiarity
with farming, either from direct observation of their locality or fromthe self participation and contribution to the family earnings. If
farming would be used as a means for localising some portion of theformal syllabus, children would get an opportunity to learn by the
help of their repeated experiences. In this perspective Taylor andMulhall (2001) advocated that agriculture and the local environment
can be the basis of integrated projects incorporated in the schoolcurriculum, with academic activities chosen for their locally relevant,
experimental attributes. The 'Landcare in Schools' programme inthe Philippines is an example of using agricultural experiences in a
way that is innovative, learner-oriented, and strongly linked to therealities of pupils, parents and communities (Vandenbosch, 2002).
Farming practice can offer the greatest means for localisinglearning in all subjects, together with languages, mathematics,
science, social studies etc. in rural contexts. The learning of languagewould be localised by motivating children to make descriptions and
resemblances using their own language and their own farmingexperience. Locally relevant examples could be brought into the lesson
along with the use of vernacular languages and terms, hencemeaning would be better communicated and the text would be better
understood. In this way children will be assisted in understandingthe concepts and contexts of different locations interpreted in the
formal curriculum. For localisation of learning in Science, farmingpresents many practical and problem solving activities that are based
on scientific procedures. Farming also contributes for localisingmathematics teaching by allowing children to conceptualise
mathematical rules and formulas by associating familiar farmingrelated experiences. Farming adds value as a way of teaching social
concerns. The issue of population explosion, poverty, unemploymentcould be comprehended by examining the impact of increase in rate
of population on farming production and explaining the involvementof rural people to farming systems. The use of farming as a means of
transacting the curriculum can be helpful in this manner. It wouldpersuade the parents for schooling of their children when they would
understand that their environmental knowledge is useful for learningand appreciate that the approach facilitates the children's learning
in a more useful way.

Localised Learning in Rural School Context: Problems and Prospects
Indian Educational Review, Vol. 51, No.1, January 2013 37
Problems of Localised Learning in Rural Context
The researcher's experience as well as review of literature showsthat there are numerous problems persist in the teaching-learningsettings of rural schools.• The problems relating to the facilities available in rural school
context are overcrowding and large classes, few information andcommunication facilities and no regular access to electricitysupply, frequent non-attendance of students and teachers, lackof reading materials for the pupils, lack of teaching aids, shortageof classrooms and school furniture.
• The problems relating to curriculum are lack of re-orientation ofteachers with the new curriculum introduction, lack ofpreparation and wide availability textbooks and teachers'handbooks with the curriculum development, heavy burden ofcurricular contents to be covered during stipulated time period,a gamut of content having irrelevance to rural living.
• The problems relating to rural teachers are presence bothuntrained, de-motivated teachers in rural schools as generallythey remain unnoticed from educational authorities, lack ofincentives or special facilities for teachers serving in rural anddeprived areas, limited opportunities for professional developmentteachers in rural schools, low and irregular salaries, poortransport conditions in rural areas, overloaded work due toshortage of teachers.
• The problems relating to rural home environments are poverty,poor health and malnourishment of children, no parentalawareness about the children's schooling, lack of academicsupport from parents etc.
Prospects of Localised Learning
However, the prospects of localised teaching and learning in ruralschools include:• Policymakers and educational personnel at school level have to
look for the strategies for using the local environment as aresource of learning and thereby making the content andapproaches of curriculum more realistic and useful.
• Appropriate training and support for teachers are significantfactors for adoption of localised learning in rural schools. Effortsshould be taken to reorient teacher education programmes tolocalised learning using natural resources can empower teachersin making education relevant for students in rural context.

Localised Learning in Rural School Context: Problems and Prospects
Indian Educational Review, Vol. 51, No.1, January 201338
• There is need for more flexibility in leaving scope forsupplementary content based on the local situation in thenational curricula and more support in decentralised curricularinterpretation.
• Teaching-learning materials used by the teachers forcomprehending the contents need to be related to the local contextand real life experiences of learners.
• Initiatives need to be taken to invite local experts whose vastexperience in appropriate knowledge and proficiencies as resourcepersons to schools and assist both the teachers and students inlearning about the local environment in a detailed andcomprehensive manner.
• The school authorities need to create a collegial atmosphere inschool campus where staffs can freely discuss the problems anddifficulties of teaching with each other and get suggestions fromeach other.
• Parents need to consider that orientation of the local context inlearning is not reducing the importance of schooling; rather as asubstitute it is constructing the capabilities of their children forlearning.
Conclusion
Although the attempts by the NCERT in the form of curriculumframeworks for reorienting the contents of the curriculum towardscontextualised learning or localised learning have been recognised,comparatively less importance has been given on the developmentand dissemination of proper transaction strategies and approachesinvolving use of local context. While the process of localised learningenables teachers to comprehend the contents by associating learningto the local environment and making the decentralisationinterpretation of the curriculum, many teachers apply the practicesrarely. And even if when they adopt localised learning by exemplifyingthe real life situations, they are uninformed of the appropriateapproaches. Teachers can initiate and apply creative curriculumtransaction practices when they would be well-awared about thesuitable approaches. In this context, the task of curriculumdevelopment and its transaction need to be decentralised fromcurriculum developers to teachers, teacher educators and ultimatelyto learners. The success of this approach necessitates a new-vision,dedication, devotion, persistence, sustenance and co-operationamong educationists, policy planners, educational administrators,teachers, students, parents and community as a whole.

Localised Learning in Rural School Context: Problems and Prospects
Indian Educational Review, Vol. 51, No.1, January 2013 39
REFERENCES
IIPS and MACRO INTERNATIONAL. 2008. National Family Health Survey (NFHS-3),
India, 2005-06: Odisha, International Institute for Population Sciences,
Mumbai.
LORENZEN , M. 1999. "Regional Competitiveness, Localised Learning, andPolicy". Working paper No: 99-13, Department of Industrial Economics
and Strategy, Retrieved on 8th March, 2013 from: http://
openarchive.cbs.dk/bitstream/handle/10398/7217/wp99-
13.pdf?sequence=1
LORENZEN, M. 2001. "Localised Learning and Policy: academic advice onenhancing regional competitiveness through learning". European
Planning Studies.Vol. 9 No.2 pp.163-185.
MALMBERG, A. and MASKELL, P. 2006. Localised Learning Revisited. Growth and
Change.Vol. 37 No.1. pp.1-18.
MASKELL, P., ESKELINEN, H., HANNIBALSSON, I., MALMBERG, A. AND VATNE, E. 1998.Competitiveness, localised learning, and regional development:
Specialisation and Prosperity in Small Open Economies, Routledge, London.
PRATHAM. 2013. Annual Status of Education Report (Rural) 2012 (Provisional).
ASER Centre, New Delhi. Retrieved on 5th March, 2013 from:
www.pratham.org/ file/ASER-2012report.pdf
TAYLOR, P. AND MULHALL A. 2001. "Linking learning environments through
agricultural experience-Enhancing the learning process in rural primary
schools". International Journal of Educational Development. Vol.21. pp.
135-148.
VANDENBOSCH , T. 2002. "Landcare in the Philippines: Developing capacities offarmers of the future and their communities". In UNESCO (Ed.),
Education of Rural Development in Asia - Experiences and policy lessons.
UNESCO: IIEP, Paris.

Self-Instructional Material ‘Nai Dishayan’...
Indian Educational Review, Vol. 51, No.1, January 201340
Self-Instructional Material ‘Nai Dishayan’–
A Training Module for Capacity Building of
Teachers in Promoting Inclusive
Education: An Evaluation
MANOJ KUMAR DASH*
ABSTRACT
In India Capacity building of teachers and teacher educators at school
level through distance mode started a decade back. The Distance
Education Programme (DEP) a national component under DSE&L,
MHRD, Govt. of India aims at effective utilisation/integration of
technology for training of functionaries associated with school education
across the country under Indira Gandhi National Open university. It
supports in terms of design, development and implementation of Self
Learning Materials (SLM) and other electronic materials also. DEP-
SSA in collaboration with SSA Uttarakhand developed a SLM ‘Nai
Dishayan’ for training and orientation of functionaries associated with
education of children with special needs at school level. The SLM was
implemented across the state as a part of five days compulsory training
of teachers in all seven blocks of Haridwar District. Therefore, a study
was conducted to evaluate the effectiveness of this SLM in terms of
capacity building of teachers, BRCCs/CRCCs and other SSA
functionaries. The findings of the study would helps to review and
update the SLM and develop strategic plan of action for its better
implementation in future. This paper reflects many more strategies
in the form of suggestions and implications for improving designing,
development and effective implementations of SLM as training
modules for recurrent training of teachers.
Introduction
Universalisation of Elementary Education (UEE) has been a nationalagenda to respond to the call of 'Education for All' (EFA) resolution of
* Regional Director, IGNOU Regional Centre, Delhi-3

Self-Instructional Material ‘Nai Dishayan’...
Indian Educational Review, Vol. 51, No.1, January 2013 41
world conference held in March 1990 in Jomtein (Thailand). Thechildren of age group 6-14 years were to receive free and compulsoryelementary education under the article 45 of Indian constitution.Government of India has made education of children from 6-14 yrsage as a fundamental right through Right to Education Act being inthe process of implementation since April 1, 2010. There are 187.62million (134.37 million at primary and 53.35 million at upper primarylevel) children at elementary level in India (DISE 2008-09; NUEPA).Though there are many disparities pertaining to education ofchildren, major steps has been taken by way of legislative actionand implementation of specific need based plans and programmes(Jangira, 1985). The children with special needs have remainedneglected and largely segregated (Mani, 1994). The enrolment ofchildren with special needs varies from year to year. In the year2003-04, there were 1.75 million such children as against 1.39million in 2008-09 (0.74 per cent of total enrolment). However, theirnumber has always remained around one per cent of total enrolmentin elementary classes. Bringing them into the mainstream schoolsis a challenging assignment (MHRD, 2004).
The concept of inclusion of children with special needs is notnew. In 1966, the Kothari Commission in its report had stated theneed for an integrated education programme.But after 15 years in1982 Govt. of India formulated a scheme 'Integrated Education forDisabled'(IED). In 1987 Project on Integrated Education for theDisabled (PIED) was launched by National Council of EducationalResearch and Training (NCERT) in collaboration with UNESCO. TheUNESCO conference at Salamanca (Spain) in 1994 declared to adopta matter of law or policy the principle of inclusive education. In 1995Govt. of India passed Person with Disability Act on equal opportunity,protection of rights, and full participation of disabled persons whereinall children with disability be integrated in normal school. The DistrictPrimary Education Programme (DPEP) launched in 1994 and SarvaShiksha Abhiyan (SSA) launched in 2002 supported by the WorldBank and MHRD, Government of India adopted Inclusive Educationto achieve the goal of Education for All. The basic aim of inclusiveeducation is to make our schools more responsive to all childrenincluding children with special needs.
Background
Capacity building of teachers and teacher educators is essential forproviding quality education to all children including children with

Self-Instructional Material ‘Nai Dishayan’...
Indian Educational Review, Vol. 51, No.1, January 201342
special needs and ensuring their learning as well. Target of SSA,objectives of EFA and vision of RTE could be realised if and only if, allchildren including children with special needs are included in theambit of elementary education. Experiences from DPEP, SSA andother research studies shown that with adequate support serviceschildren with special needs can be provided quality education in allregular schools. Realising the importance of integrating children withspecial needs in regular schools, SSA framework has made adequateprovisions for educating children with special needs. SSA ensuresthat every child with special needs, irrespective of the kinds, category,and degree of disability, is provided meaningful and quality education.No child having special needs should be deprived of the right toeducation (zero rejection policy). National Curriculum Frameworkfor School Education (NCFSE, 2005) recommended inclusive schoolsfor all without specific reference to children with special needs as away of providing quality education to all. Segregation or isolation isgood neither for children with disabilities nor for children withoutdisabilities. Social integration is that all children with special needsshould be educated along with other children of their normalcounterparts in regular schools, which is cost effective and havesound pedagogical practices as well.
Rationale of the Study
Capacity building of institutions and personnel at state, district andsub-district levels in terms of designing, developing, producing anddelivering distance learning materials is the major goal of DEP-SSAunder DSE&L, MHRD, GOI. It aims at improving quality of in-serviceeducation of teachers. One of the objectives of DEP-SSA is to providetraining and orientation to teachers and other functionaries like;BRCCs and CRCCs in the area of inclusive education to facilitatethe education of children with special needs in regular schools. DEP-SSA designed and develops self-instructional print materials (SLMs)like; ‘Abhiprerana; Prerana’, 'Nai Dishayen' etc. Besides SLM,promotional materials like; broachers, calendars, pamphlets havebeen developed for developing awareness and sensitising communityfor the education of children with special needs. With the support ofDEP-SSA audio-video materials were also developed in many stateslike; Gujarat, Odisha, Jharkhand, Maharastra, Andhra Pradesh,Assam, Haryana, Madhya Pradesh, Rajasthan, and Karnataka etc.
Although various steps have been taken through DEP-SSA forfacilitating education of children with special needs, 'Rahen' and

Self-Instructional Material ‘Nai Dishayan’...
Indian Educational Review, Vol. 51, No.1, January 2013 43
'Nai Dishayan' are two SLMs produced in collaboration with SSAUttarakhand and were implemented widely for the training andorientation of teachers at elementary school level. Nai Dishayan isan attempt to provide quality and meaningful education to childrenwith all kind of disabilities in regular schools. DEP-SSA designedand developed this SLM under the guidance of DSE & L, MHRD forSSA Uttarakhand. The major objectives were to ensure professionalcompetencies of teachers and other functionaries (BRCCs/CRCCs)to accommodate children with special needs in regular classroomsand plan their T-L processes effectively for ensuring learning of allchildren. All important indicators for each category of disabledchildren were considered while designing this SLM. Experts fromeach field of disability were invited for finalisation of chapter for eachcategory of disabilities and educational interventions for them tointegrate with classroom T-L process. The following chapters weredesigned and developed and find a place in the SLM for capacitybuilding of teachers, teacher educators, BRCCs and CRCCs.1. Unit 1: Visually Impaired2. Unit 2: Hearing Impaired3. Unit 3: Physically Handicapped4. Unit 4: Learning Disability
The SLM was designed and developed as an experiment toimprove teaching learning process for facilitating and promotinginclusion of children with special needs in regular school andclassrooms. Four thousand copies of the SLM 'Nai Dishayan' weredistributed in Haridwar district for extensive training of teachersand other field functionaries in Haridwar district of Uttarakhandstate. Therefore, it was felt essential to study the effectiveness ofthis self-instructional material for capacity building of teachers,BRCCs, CRCCs and teacher educators also. At the same time it isessential to review and update the SLMl on the basis of need, demandand feedback of field level functionaries.
Research Questions
Although self-instructional material is used as a training medium,it raises several research questions to be addressed. The study willbe able to answer the following major research questions;• Do the teachers, BRCCs, CRCCs and other functionaries have
favourable perceptions towards the distance learning material‘Nai Dishayan’ in relation to; i) acceptance of the material; ii)readiness to use this learning material; iii) access, feasibility and

Self-Instructional Material ‘Nai Dishayan’...
Indian Educational Review, Vol. 51, No.1, January 201344
viability of this material; iv) adequacy of the content coverage; v)presentation of content; vi) use of language; and vi) verbal andnon-verbal mode of communication reflected.
• Does the training through this material help in improvingprofessional competencies of teachers, BRCCs, CRCCs andother functionaries in relation to; i) improvement of subjectmatter knowledge on IED/ Inclusive education; ii) pedagogy anduse of appropriate TLM; iii) classroom management; iv)understanding classroom dynamics and group behaviour; v)modification of teaching learning strategies; vi) communitymobilisation and ensuring their participation in education ofchildren with special needs.
• Does the teachers, BRCCs, CRCCs and other functionaries faceany difficulties during; i) handing this material in trainingsession; ii) managing inclusive classroom; iii) teaching learningprocess in inclusive classroom; and iv) assessment andevaluation of performance of children with special needs ininclusive classroom.
• How the self-instructional material be made more effective?
Review of Related Literature
Review of literature to the problem under study is essential for theinvestigator to develop a thorough knowledge of the work done in thearea of inclusive education. Use of self-instructional material as atraining module for training and orientation of teachers at elementaryschool level is relatively a new approach in our country. In the presentstudy, the investigator has scanned most of the relevant reportedstudies carried out related to the field.
The SIM entitled 'Abigyan' developed under DEP-DPEP, Assam fortraining of teachers shown a new direction to teachers, and acquaintedthem of using multiple strategies in their classroom. (DEP-DPEP,ASSAM). Multimedia packages and SIMs developed under DEP-DPEP,Gujarat were found to be useful and appreciated by teachers. Theinterest of children were found to be increased and made teaching easierfor teachers and learning effective for children.(DEP-DPEP, Gujarat).SIM'Samvridhi' indicated that the presentation of content was interesting,subject matter was easy to comprehend, interest of teachersenhanced, and content covered were relevant to the teaching learningprocesses. Content and activities were very helpful in understandingvarious concepts. It was found that self-assessment exercises werehelpful in keeping track of progress of children and provding themvaluable feedback. It was revealed that the SIM 'Samvridhi' was found

Self-Instructional Material ‘Nai Dishayan’...
Indian Educational Review, Vol. 51, No.1, January 2013 45
to give a sense of achievement to all children (DEP-DPEP, HimachalPradesh). A Self-Learning material 'Uravu' designed and developedunder DEP-DPEP, Kerala for supporting and strengthening thetraining programmes for primary school teachers. It was found thatthe demand of the material was overwhelming. Teachers felt thatthere should be an orientation programme on how to use this SIMeffectively (DEP-DPEP, Kerala). Govt. of Odisha conducted a study onnecessity of SIMs for capacity building of teachers and found that; i)teachers had to be provided scope for their content knowledgeupgradation on a recurrent basis besides strengthening theirpedagogical skills; ii) content upgradation could be inbuilt in thepedagogic strengthening programmes; iii) distance modes ofinstruction like providing print materials and audio-video supportcould be adopted on a wide scale; iv) cluster centers needed to beactivated to develop their own programmes to cater to their localneeds using local specific materials and language (DEP-DPEP,Odisha). A study was undertaken by DEP-DPEP, Odisha to ascertainthe usage and benefits of the SIM Mathematics with the objectives ofunderstanding the views of the target group on the quality of SIMlike; its usefulness in the content classification, and contenttransaction and its use in their professional development. The studyalso obtained the suggestions of the target groups for improvementin training through SIMs. The sample of the study was selected fromthree districts of Odisha (Dhenkanal, Sambalpur and Keonjhar). Datafor the study was collected through an achievement test,questionnaire and an interview schedule. The major findings of thestudy were: Teachers appreciated language and content presentationof SIM in Mathematics; ii) examples presented in the SIM were selfexplanatory but areas like fraction and decimal needed furtherelaboration; iii) the SIM help teachers upgrade their contentknowledge in various areas of Mathematics. Teachers got academicsupport through the SIM; and iv) the SIM helped teachers inclassroom transaction (DEP-DPEP, Odisha) (DEP-SSA, IGNOU; 2003).The classification and categorisation continues for the assessmentof disability for eligibility to restorative and social welfare benefit(MHRD, 1994). In spite of much diverse practices for education ofCWSN nearly half of the population of CWSN was not in school dueto the obstacles faced by the local Govts. For educating CWSNInventive approaches were used by state level practitioners. Aboveall there is a need for capacity buildings at all levels and managingattitudinal barriers for facilitating inclusive Education. Majority of

Self-Instructional Material ‘Nai Dishayan’...
Indian Educational Review, Vol. 51, No.1, January 201346
teachers teaching in integrated/inclusive schools do not adaptinstructions frequently in the classroom to meet the special needs ofthe children. Teachers' lack of knowledge and empowerment wasthe reason for making no adaptations. The literature complies thatmany teachers did not find these strategies very feasible in Indianclassrooms (JULKA, 2005). There is a need to revise the existingteacher education course contents to face diversified classroomconditions, orient teachers in all teacher-education institutions forcapacity building of the trainers in DIETs, resource materials tosupport new methods appropriate for inclusive classroom andresearchers undertaken at the DIET level must also include topicsrelated to education of learners with Special Education Needs(JULKA, 2003). There is no significant difference between theperceptions of male and female respondents in terms of variousfacilities available for education of children with special needs andthere are no district Wise variations also. Special facilities for disabledchildren were not found, VECs are not aware for the Education ofCWSN, parents, teachers and disabled children are not aware of theprovisions of facilities for disabled children under SSA andorganisation of awareness programmes for the community to promoteeducation of disabled children is needed (Soni, 2003).
There is no special teachers to help children with disabilities areappointed. Orientation given to the general teachers in the area toinclusive education and the teaching learning strategies being usedin the classroom did not meet specific needs of different categories ofdisabled children. Therefore, teachers need intensive training forattitude change for successful implementation of inclusive education.Steps need to be taken for removal of architectural barriers in thestates (Soni, 2005). It is strongly suggested to reduced their work loadwith children in the class with peer group or older children sharingtheir task in the school (Verma, 2005). PTA is helped to promoteinclusive education and were able to develop healthy relationshipbetween disabled and non-disabled children (Verma, 2004).
Integrated education of disabled has helped in improving theattendance of CWSN in schools, facilitated their progress andparticipation in curricular and co-curricular activities. It helped indeveloping positive attitude among general teachers and non-disabledchildren, improved their personal, social and academic skills, self-esteem of children with disabilities and reduced the drop-out rate.Steps need to be taken for capacity building of teachers toaccommodate pupil's diversity in their classroom (Verma, 2002).

Self-Instructional Material ‘Nai Dishayan’...
Indian Educational Review, Vol. 51, No.1, January 2013 47
Parents were not given any training for use of aids and appliancesprovided to their children. Some instances of CWSN being providedwith aids and appliances which they do not need were also reported.For accurate assessment of disability of CWSN, medical camps needto be organised for a limited number of children. Organise trainingprogrammes for parents and teachers on proper use of aids andappliances. Provision for repair of aids and appliances by trainedpersonnel should be made. Baruah, et. al 2009). Consultative Bodyat state and district level may be formed for assisting andcoordinating the awareness programme of IED. NGOs may be involvedin providing support services to CWSN. Aids and appliances for CWSNshould be of good quality and adequate in number. Architecturalbarriers in schools to be removed for easy access to CWSNs. Remedialclasses for CWSN should be carried out. (Choudhary, et. al 2008).Level of disability of CWSN and Lack of parental cooperation is themajor problem faced in implementation of IED intervention. There isinsufficient infrastructure in schools for accommodating childrenwith special needs. Out of total identified children with special needs2/3rd were enrolled (Das, 2007). Attendance of CWSN in school isvery poor and Less CWSN uses aids and appliances. Performance ofCWSN in average and needs extra support in the class (Chaudasama,et.al. 2006).
NGO have progressive perspective of inclusive education(Banerjee and Mehandale, 2006). The facilities included providingsuitable physical infrastructure and equipments, district levelplanning, budgeting and conducting training programmes for personsinvolved in providing service to CWSN and awards to exceptionalpersons among the specially challenged. Programmes for developingsensitivity and awareness among community for the needs of suchchildren need to be organised (Venkatesh, 2006). Individualised,structured, consistent and contextual interventions need to beimplemented for social integration as well as for developing selfesteem, co-operative learning procedures, modeling of appropriatesocial behaviour, play group, leisure activity arrangements, involvingparents and NGOs to nurture and bring forward disabled achieversas models for the disabled (Seethram, 2005). The intellectual capacityof the children with learning ability was significantly higher thanthat of those with learning disability. Children with learning disabilityshowed better academic performance after remedial programme.Orientation programmes regarding learning disability may bearranged in collaboration with NGOs for the teachers. Awarenessand remedial programmes about learning disability to be conducted

Self-Instructional Material ‘Nai Dishayan’...
Indian Educational Review, Vol. 51, No.1, January 201348
through print and electronic media. Periodical counselingprogrammes to be arranged for teachers and parents in this regard(Santhanam, 2005).
Objectives
1. To study the perception of teachers and teacher educatorstowards different aspects of SIM ‘Nai Dishayan ’ for training ofteachers.
2. To study the effectiveness of SIM ‘Nai Dishayan’ for professionaldevelopment of teachers and BRCCs/CRCCs in relation toeducation of children with special needs.
3. To study the perception of teachers, BRCCs/CRCCs andadministrators towards effective implementation of SIM ‘NaiDishayan’ for facilitating inclusive education.
4. To suggest measures for further improvement in designing anddevelopment of SIM for facilitating education of children withspecial needs and development of professional competencies offunctionaries associated with education of children with specialneeds in regular schools.
Methodology
Population
The population of the present study comprised of all teachers, BRCCs,CRCCs and administrators of Uttarakhand associated with training/orientation of teachers under SSA.
Sample
Keeping in mind the size of the population and nature of clientele,stratified Random Sampling technique were used for the selection ofsample at the district level.
Haridwar district of Uttarakhand was selected as the sampledistrict. From Haridwar district all eight blocks (Narsen, Haridwar,Bahadrabad, Laskar, Roorkee (Rural), Roorkee (Urban), Mangalore,and Bhawanpur) were selected as sample blocks.
From each block two clusters were selected randomly and fromeach cluster five schools were selected randomly. All teachers ofsample schools were taken as the sample of the study. Allfunctionaries of sample BRCCs and CRCCs were taken as the sampleand at the same time all administrators of District Project Office

Self-Instructional Material ‘Nai Dishayan’...
Indian Educational Review, Vol. 51, No.1, January 2013 49
associated with training of teachers were selected as the sample ofthe study.
Tools
The following tools were used in the present study to collect necessaryrelevant data from teachers, BRCCs/CRCCs and administrators inHaridwar District of Uttaranchal State.1. Questionnaires for teachers, BRCCs/CRCCs and administrators.2. Focus Group Discussion (FDG) with DIET faculty, BRCCs, CRCCs,
and teachers
Method
Descriptive survey research method was adopted for the study withthe help of questionnaires and focus group discussion. Teachers,CRCCs and administrators were contacted through concerned BlockResource Center Coordinators to ensure that they responded thequestionnaires. BRCCs were given adequate orientation on how toadminister the questionnaire on the sample.
For analysis and interpretation of data chi square test has beenemployed to find difference in perception of sample with regard toeach item. A comparison has been made between the calculated chisquare value with table value at two different levels (0.01 levels and0.05 level). On the basis of comparison of two values (calculated valueand table value) the difference between the two mean percentages(whether significant at a particular level or not) is determined. *indicates level of significance at 0.05 level and ** indicates level ofsignificance at 0.01 level
A focus group discussion was organised with BRCCs, CRCCs,Teachers and Teacher Educators at DIET Rookree. All participants(BRCCs, CRCCs, and Teachers) were from eight different blocks ofHaridwar district and teacher educators were from DIET Rookree only.Forty participants participated in the discussion comprised of eightBRCCs, eight CRCCs, 16 teachers and eight teacher educators). Thediscussion was organised in two phases. In phase I, the participantswere divided into four groups. Each group comprised of two BRCCs,two CRCCs, four teachers and two teacher educators. Each groupassigned a topic for discussion and interaction under the leadershipof one teacher educator. The topics for discussion were as follows:1. Relevance of the SLM for improving school effectiveness
programmes for education of children with special needs.

Self-Instructional Material ‘Nai Dishayan’...
Indian Educational Review, Vol. 51, No.1, January 201350
2. Effectiveness of the SLM for ensuring community support/participation to facilitate inclusive education.
3. Importance of the SLM in the context of training of functionariesto facilitate inclusive education.
4. Dissemination of success stories for promoting inclusiveeducation.Each group discussed with one another for an hour and prepares
a brief report of their discussion. Phase II, each group presented thethemes of their discussion and interaction before all. The presentationwas followed by open discussion among the members of all the groups.The session was moderated by the investigator. Necessaryarrangements were made to note the proceedings of the discussion.These proceedings were collected and analysed as qualitative datain support of the objectives of the study. The following importantquestions were raised by the investigator during the course ofdiscussion among the participants. Feedback and suggestionsreceived from the participants were noted and accordingly analysedand interrelated.
(i) What is the perceptions of field functionaries towards the SLM'Nai Dishyen' in relation to facilitating different dimensions ofinclusive education?
(ii) Do you think this SLM is helpful in improving professionalcompetencies of teachers, BRCCs/CRCCs and otherfunctionaries in promoting inclusive education?
(iii) What are the types of difficulties faced by the teachers, BRCCs/CRCCs and other functionaries in handing this SLM duringtraining sessions?
(iii) What suggestions you would like to give for further improvementof this SLM to make it more teachers friendly?
(v) What steps should be taken at field level for facilitatinginclusive education initiatives?
Findings of the Study
The findings of the study are presented under than four differentsections such as: Section A: Findings pertaining to responses ofteachers; Section B: Findings pertaining to responses of BRCCs/CRCCs; Section C: Findings pertaining to responses ofadministrators; and Section D: Findings from Focus GroupDiscussion

Self-Instructional Material ‘Nai Dishayan’...
Indian Educational Review, Vol. 51, No.1, January 2013 51
Section A: Findings pertaining to responses of teachers
General aspects of inclusive education: The major focus of thestudy was to assess the effectiveness of SIM 'Nai Dishayan'. It wasfound that there is a significant difference between the responses ofteachers with respect to; i) understanding of the SLM (4.02); ii) effectivemanagement of inclusive classrooms (6.08); and iii) making betterseating arrangement in inclusive classroom (4.02).Teachers are ofthe opinion that this SLM helps in effective management of inclusiveclassrooms (62.72 per cent) and making appropriate seatingarrangement (64.49 per cent) in inclusive classrooms. Most of thesample teachers (51.47 per cent) find difficulties in inclusiveclassroom in dealing children with Special Needs. However, 62.72per cent of sample teachers did not go through the SLM. It is alsofound that 56.22 per cent of teachers viewed that the SLM helpsthem in understanding children with Special Needs. This shows thatSLM ‘Nai Dishyan’ is of quite beneficial for the teachers in developinga thorough understanding towards children with special needs anddevelop confidence in handling children with special needs ininclusive classrooms. Improving instructional strategies: Thereis a significant difference between the responses of teachers withregard to; i) organisation of various activities in classroom in makingT-L process effective (4.68) and ii) effective communication withchildren with special needs (6.86). Responses of the teachers go infavour of the effectiveness of the SLM. About 50 per cent teachersare of the opinion that this SLM helps in designing, developing andadopting TLM effectively in classroom to meet the need of childrenwith special needs and 41.42 per cent felt that the SLM is useful inmodifying transactional strategies for the benefit all children includingchildren with special needs. About 57.39 per cent of teachers viewedthat this SLM is quite helpful in selecting and organising co-curricularactivities for promoting inclusiveness in regular classroom. This isdefinitely a positive indication on the part of academic effectivenessof this SLM in bringing a meaningful change in T- L process ininclusive classrooms. Building Partnership and Cooperation: Thereis no significant difference between the response of teacherspertaining to effectiveness of this SLM in building partnership andcooperation for facilitating education of children with special needs.59.76 per cent of the teachers opined that this SLM is helpful forteachers in developing motivation in parents, particularly their activeinvolvement in various activities. Similarly 55.62 per cent teachersexpressed that it is useful to motivate community members to meet

Self-Instructional Material ‘Nai Dishayan’...
Indian Educational Review, Vol. 51, No.1, January 201352
the needs of children with special needs and 41.47 per cent viewedthat it is quite beneficial in selecting and assigning activities forchildren according to their potential. It is found that more than 50per cent of teachers are strongly in favour of the effectiveness of thisSLM and about 50 per cent viewed that this material is quite helpfulin comprehensive evaluation of children with special needs ininclusive setting. At the same time, more than 40 per cent of teachersdid not responded positively against the items pertaining to relevanceof this SLM in developing partnership and cooperation for makinginclusion a success. This gives an indication that the content of theSLM may be improved for helping and motivating teachers indeveloping partnership and cooperation with parents and communitymembers for the success of inclusive education. Facilitating
inclusive education: There is no significant difference between theresponses of teachers with regard to various aspects related toeffectiveness of this training module. Developing professionalcompetencies of teachers to deal children with special needseffectively and motivating parents and community to send theirchildren to school are some of the major objectives of this SLM 43.19per cent of sample teachers reported that this SLM helps indevelopment of their competencies to deal all children in inclusiveclassrooms. It also helps in motivating parents and establishes arapport with them for better education of children to schools withspecial needs (47.92 per cent). It is found that about 55.03 per centof teachers developed a positive attitude towards all children ininclusive classrooms. Similarly, with regard to effectiveness of thisSLM in promoting inclusion and socialisation of children and inmotivating children with special needs to come to school this SLM isfound to be very useful. Overall effectiveness: There is no significantdifference between the responses of teacher pertaining to therelevance of the module in facilitating inclusive education atelementary level. However, there is a significant difference inresponses of teachers with regard to training of functionaries to makeuse of this SLM effectively. 78.11 per cent of sample teachers viewedthat they have not received any training/orientation on effective useof this SLM. This is found to be a serious drawback in obtainingdesired result out of this SLM. Some of the teachers found to bebenefitted out of the SLM on the basis of their own proactive initiativesonly. Fifty two per cent of teachers viewed that they are constantlytrying to develop self-confidence of children with special needs andperformance of those children are found to be improved in inclusive

Self-Instructional Material ‘Nai Dishayan’...
Indian Educational Review, Vol. 51, No.1, January 2013 53
classrooms. It is encouraging to note that 50.03 per cent of teachersviewed that this SLM helps in building their confidence to facechallenges in inclusive classroom and 49.11 per cent of teacherspointed that this SLM helps them to ensure better inclusion ofchildren with special needs in regular schools.
Section B: Findings pertaining to responses of BRCCs/CRCCs
Training on inclusive education: It is found that this SLM is quiterelevant for teachers to improve their professional competencies infacilitating education of children with special needs in regularschools. 63.68 per cent of BRCCs/CRCCs viewed that this SLM isrelevant to equip competencies of teachers in effectively handling allchildren in inclusive classrooms. About 73.13 per cent of BRCCs/CRCCs are orientated on different areas of education of childrenwith special needs. 87.07 per cent of BRCCs/CRCCs viewed that inthe present scenario the training/orientation planned and providedto teachers are not sufficient. They need additional training/orientation to improve their skills, and competencies pertaining toeffective implementation of inclusive education programme ininclusive classrooms. It is equally important for both children withspecial needs and their normal counterparts also. This SLM willactively support in facilitating inclusive education programmes andact as a guide for teachers, and other functionaries associated witheducation of children under inclusive education programme. This isa paradigm shift in the field of elementary education. It needs athorough planning and systematic approach of implementation ofvarious plans and programmes with cooperation of the society andcommunity at village level. Effectiveness of the 'Nai Dishayan':
there is a significant difference in the perception of teacherspertaining to; i) developing confidence of teachers in handlingchildren with special needs in inclusive schools and classrooms(10.33**); ii) improving effectiveness of training in inclusive education(13.70**); and iii) helping teachers to develop awareness amongparents and community members about education of children withspecial needs in general and inclusive education in particular (3.96**).In all the three aspects the difference goes in favour of the utility andrelevance of the SLM 'Nai Dishayen'. This SLM is of quite effective withregard to providing training to teachers on various aspects of inclusiveeducation. 62.28 per cent of BRCCs/CRCCs viewed that adequatefacilities are available in schools for accommodating children withspecial needs and 74.63 per cent of teachers are confident in handling

Self-Instructional Material ‘Nai Dishayan’...
Indian Educational Review, Vol. 51, No.1, January 201354
children with special needs effectively in regular schools. 77.61 percent of BRCCs/CRCCs pointed that this SLM is quite beneficial forproviding training to teachers. 76.16 per cent BRCCs/CRCCsresponded that the document 'Nai Dishayen' helps teachers to developawareness in parents and community for better education of childrenwith special needs with maximum utilisation of available resources.
Section C: Findings pertaining to responses of administrators
With regard to the perception of administrators on various aspectsof training through this SLM it is found that only 33.33 per cent ofadministrators have received regular feedback from teachers andother SSA functionaries about the relevance of this document. 66.67per cent of administrators viewed that they have not received anysuch feedback. This clearly indicates the difficulties of administratorstowards effective implementation of this SLM. Only 16.67 per cent ofadministrators arranged training programmes for the teachers andother functionaries on the use of this SLM. This is considered to bea serious drawback on the part of administrators in facilitating theinitiatives for promoting inclusive education and developingcompetencies of teachers and other functionaries also. 25 per centof administrators viewed that functionaries are equipped themselvesin using this SLM. Though most of the administrators (95.83 percent) are agreed that this SLM is useful for teachers, but hardlythey are serious on the implementation of this SLM for the benefit ofteachers and children with special needs. 91.67 per cent ofadministrators pointed that they find change/improvement ininclusive education programme for promoting education of CWSNsin regular schools, but active involvement of all stockholders is yetto be seen.
There is lack of strategic plan for implementation of this SLMunder inclusive education initiatives in one hand and lack ofinitiatives on the part of administrators and implementers in makingeffective use of new plans, programmes for capacity building offunctionaries at different levels.
Section D: Findings from Focus Group Discussion
Content Related Issues: A wide range of content covered in themodule aims at building confidence of teachers in accommodatingchildren with different categories of disabilities in regular school andclassroom but hardly give any inputs pertaining to curricular

Self-Instructional Material ‘Nai Dishayan’...
Indian Educational Review, Vol. 51, No.1, January 2013 55
adaptation/modifications for facilitating teaching learning processin inclusive classroom. Strategies pertaining to classroommanagement, seating arrangement, building partnership etc. werereflected clearly for the benefit of teachers and trainers but at thesame time it is noticed that there is lack of examples and illustrationsto develop clarity/understanding. For making the content morerelevant and useful, case studies would have included but thismodule does not contain any such items. Characteristics andidentification of different categories of children constitute an integralpart of this module but this part is delta with theoretical explanationsonly. This could have explained with examples and illustrations forbetter understanding of teachers and other functionaries. Thecontent used in the module is adequate and appropriate for improvingcompetencies of teachers but each aspect of the content should havesupported by some real examples and illustrations.
At the time of selection of content for a training module interestof children with special needs must constitute an important part.Teachers need to be trained in appropriate teaching learning processso as to make the inclusive classroom interactive and participatory.Problems of various categories of children must be reflected and atthe same time these problems should be analysed with citingappropriate remedies. Documentation of best practices for eachcategories child with special needs should constitute a part of thetraining module. Evaluation is an important part of teaching learningprocesses. Evaluation in inclusive classroom is a challengingassignment for teachers. Therefore, module for inclusive educationmust reflects the means of evaluation of teaching learning processin inclusive classroom with examples and illustrations. Cooperationof parents and community is the key to the success of inclusiveeducation. This aspect must be dealt with appropriate case studiesand illustrations for motivating teachers. Guidance and counselingshould also constitute an important part of teachers training modulein inclusive education. Language Related Issues: Language usedin the training module is quite simple and understandable on thepart of teachers and trainers associated with education of childrenat elementary level. But many teachers viewed that it should bemore motivating and interesting. Faculties of DIET are of the opinionthat the language used in the module is simple but not contextualisedin local context. It needs to be more local specific to facilitate easyunderstanding of teachers. The technical terms used in the contentneeds further clarifications. There are certain points, which create

Self-Instructional Material ‘Nai Dishayan’...
Indian Educational Review, Vol. 51, No.1, January 201356
ambiguity/confusion in the mind of teachers with respect to takingappropriate steps to facilitate inclusion of children with special needsin one hand and providing them education of their interest on theother hand. Presentation Related Issues: Content material hasbeen organised sequentially and systematically, which createmotivation in teachers and teacher educators. Presentationstrategies adopted in the content hardly reflects teaching-learningprocess. It is more of informative with theoretical details anddescriptions. Participants are satisfied with the interactive andfriendly mode of presentation. They were expecting pedagogic aspectsin the presentation, which could help them in making the teachinglearning process effective and satisfying in inclusive classroom.Participants suggested that taking into consideration of differentcategories of children with special needs interactive multimediaprogramme can be designed to supplement this SLM but this aspectdid not find a place in it. More pictures should have been includedfor making the content lively. Relevance Related Issues: The SLM‘Nai Dishayen’ is considered to be a very good supporting documentfor the teachers at early stage (primary level) of inclusive education.It serves as a reference material for designing and development ofappropriate teaching learning materials for inclusive classrooms.Trainers and master trainers need specific and strategic orientation/training pertaining to how effectively this module can be used forthe benefits of teachers during in-service training. No steps havebeen taken for organising training and orientation of field levelfunctionaries. This certainly creates a difficulty in teachers and otherfunctionaries in realising the importance of this SLM andunderstands its significance.
Faculties of DIET are of the opinion that directly they are notassociated with training of teachers. Out of all faculties only one facultydeveloped inclination and interest towards inclusive education. ThoughDIET Roorkee is one of the study centers of MP Bhoj Open Universityfor foundation course in disability but none of the functionaries ofDIET associated with in-service training programme with SSA forfacilitating inclusive education and never they explore any possibilityof strengthening education of children with special needs with buildingpartnership with parents and community.
Educational Implications
The content of the material may be improved to meet the expectationsof target group with incorporation of classroom based examples and

Self-Instructional Material ‘Nai Dishayan’...
Indian Educational Review, Vol. 51, No.1, January 2013 57
illustrations. The teachers must be provided adequate training/orientation to use this material effectively. Teachers working atdifferent levels must be given a strategic orientation/training oninclusive education in general and effective use of training modulesin particular for facilitating education of children with special needsin regular schools. There is a need to develop a strategic interventionfor improving the use of this document during in-service training ofteachers to develop their competencies to handle situation forpromoting inclusion of children with special needs in regular schools.Modification of transactional strategies to make it suitable for childrenwith special needs is a challenging aspect for the academicimprovement of children with special needs. Teachers at elementarylevel face many difficulties in this area. Hence, there is a need toimprove the usefulness of this training module 'Nai Dishayen' tomeet the need of teachers? There is the need of a structured thematictraining/orientation for the teachers on effective implementation oftraining modules. Therefore, it is essential to improve the qualitativeaspect of this module pertaining to modification of transactionalstrategies and providing appropriate training/orientation to teachersfor making inclusion a reality
Improving instructional strategies for facilitating learningimprovement of CWSNs is a challenge, which must be taken care ofwith appropriate strategies. It is a serious concern which needsfurther improvement on the part of improving the content of SIM'Nai Dishayen'. The SIM needs to be revised and modified to maketeacher competent in selecting and organising appropriate scholasticand co-scholastic activities for facilitating inclusive education inregular schools. Building partnership and cooperation among variousstakeholders to realise the goal of education for all is one of theobjectives of this training module. So this aspect must be taken careof in real sense. Much need to be done in the light of citing examples,illustrations, case studies etc for improving effectiveness of SIM forensuring cooperation from all around. It is essential to organisethematic and intensive training for the teachers, teacher educatorsand other functionaries to develop strategy plan for facilitatinginclusive education. It is essential to promote effective use of trainingmodules for wider benefit of the teachers working at elementary level.It is possible by providing recurrent training to teachers on variousaspects of inclusive education. Developing confidence of teachers toface challenges related to inclusive education must be the first priorityof in-service training. Strategic steps must be taken to review various

Self-Instructional Material ‘Nai Dishayan’...
Indian Educational Review, Vol. 51, No.1, January 201358
dimensions of this SLM 'Nai Dishayen' to make it more effective anduseful. There is the need of continuous upgradation and updating ofknowledge and skills of the teachers to improve their competenciespertaining to making inclusion effective. Hence, a recurrent trainingprogramme may be designed for BRCCs/CRCCs, so that they will beable to make the teachers confident in carrying out the challengingtask of inclusive education. BRCCs/CRCCs are not clear, andconfident about their role and responsibility for making training oninclusive education meaningful and effective. There is the need ofadditional training/orientation to improve the skills andcompetencies of teachers pertaining to inclusive education. Fromthis, it is concluded that training/orientation aspects related toinclusive education needs a thorough review and on the basis ofwhich it is to be redesigned to improve relevant skills in teachers,BRCCS/CRCCs and other functionaries.
BRC/CRC functionaries have not received any training/orientation on education of CWSNs in regular school. It is a greathurdle in implementation of inclusive education programme andrealising its effectiveness as well. BRC/CRC functionaries are ofthe opinion that teachers are provided with adequate training/orientation to develop their capacity to handle CWSNs in regularschools. But at the same time, they admit that competencies ofteachers need to be improved for handing such category of childrenin regular school and they need additional training/orientation toimprove their skills and competencies pertaining to inclusiveeducation. Therefore, it is realised that effective orientation/trainingmust be designed and developed for providing adequate exposure toBRC/CRC functionaries, trainers, master trainers and resourcepersons working at various level first, to realise the goal of inclusiveeducation a real success. Equipping competencies of teachers ineffective handling of children with special needs in regular school isprime concern for facilitating education of children with special needs.
A resource group needs to be formulated at each cluster forproviding training/orientation to teachers. During training attemptshould be taken by the resource group to simplify the language tomake the programme a real success. Attempt must be taken for thecapacity building of resource group formed at the cluster level.Efficient interpretation of language is a key to derive maximum benefitfrom the training module. Instead of planning for examples andillustrations for individual category of children, it is advisable to framecertain common examples and illustrations that will find beneficial

Self-Instructional Material ‘Nai Dishayan’...
Indian Educational Review, Vol. 51, No.1, January 2013 59
of all categories of learners. In a single activity/example/illustrationthere should be scope for involvement and participation of allcategories of children to develop inclusive ethos in them. Clear andsimple language has been used in the presentation of content in themodule.
Simply design and development of training module will not servethe purpose of improving the quality of education unless there isstrategic planning for its effective implementation. How best a trainingmodule may be the overall effectiveness depends on acceptabilityand ownership on the part of field functionaries. This is possible ifand only if, all field level functionaries will be given appropriate,adequate and need based recurrent training/orientation. There isthe need of strong will and motivation on the part of teacher toeffectively operationalise the programme of inclusive education withappropriate modification of curriculum transaction strategy. Thereis the need of a structured training/orientation for all teachers andBRCCs/CRCCs in effective implementation of training modules ingeneral and SLM in particular for the benefit of field levelfunctionaries.
REFERENCES
BANERJEE, R. AND MEHANDALE, A. 2006. Understanding Inclusive practice and
community initiatives to make education accessible to all. Seva in action
Association, Bengaluru, Karnataka
BARUAH, P.ET AL. 2009. Impact of aids and appliances on educational performance
of children with special needs. Tezpur University, Tezpur
CHOUDHARY, A. N., ET AL. 2008. Impact of IED intervention in the area with full
resources support and partial resources support provided from SSA– a
comparative analysis. Xavier's Foundation for Social and Educational
Deployment and Research, Guwahati
CHAUDASAMA, G., ET AL. 2006. Impact of integrated education for disabled children–
IEDC scheme under SSA Shiksham Ane Samaj Kalyan Kendra, Amreli
DAS , D. 2007. Evaluation of the impact of IED intervention with focus on
enrollment and retention in the school, Gawahati University, Gawahati
DEP-SSA, IGNOU. 2003. Distance Education Initiatives in Distirct Primary
Education Programmes (DEP-DPEP), MHRD, Govt. of India; Indira
Gandhi National Open University, New Delhi
JANGIRA , N. K. 1985. Special Education in India – Search for operating in Britain
and India, Academic Press, Gurgaon, Haryana
JULKA , A. 2005A. A Study of programme and practices for education of children
with special education needs in different states, Department of Education
of Groups with Special Needs, NCERT, New Delhi

Self-Instructional Material ‘Nai Dishayan’...
Indian Educational Review, Vol. 51, No.1, January 201360
JULKA, A. 2005B. A Review of existing instructional adaptations (general and
specific) being used in integrated / inclusive classrooms, Department of
Education of Groups with Special Needs, NCERT, New Delhi
JULKA , A. 2003. Strengthening the teacher education curriculum of DIETs from
the perspective of special needs education, Department of Education of
Groups with Special Needs, NCERT, New Delhi
MANI, M. N. G. 1994., Project Integrated Education for the Disabled-Evaluation
Study, Phase I, UNICEF, New Delhi
MHRD. 2004. Selected Educational Statistics. 2002-03; Planning, Monitoring
and Statistics Division Department of Secondary and Higher Education
Ministry of Human Resource Development. Govt. of India. New Delhi
NUEPA. 2010. District Report Cards 2008-09, Elementary Education In India,
National University of Educational Planning and Administration, New
Delhi
SANTHANAM, P. 2005. Remedial Programmes for children with Learning difficulties.
SDS Institute of Behavioral Sciences, Chennai, Tamil Nadu
SEETHRAM, R . 2005. A study on the social integration of children with mild and
moderate disabilities in main stream classroom under SSA. Tamil Nadu.
Department of Education., University of Madras, Tamil Nadu.
SONI, R. B. L.2005. Interventions for education of children with disabilities.
Department of Education of Groups with Special Needs, NCERT, New
Delhi
SONI, R. B. L. 2003. Perception of parents, teachers and students about education
of disabled children. Department of Education of Groups with Special
Needs, NCERT, New Delhi
VENKATESH, M.N. 2006. An evaluation of the schemes and programmes of inclusive
Education of the disabled children in Karnataka. Department of Folklore
and Tribal Studies, Dravidian University Kuppam, Chittore Dist., A.P.
VERMA, J. 2005. Innovative teaching strategies for promoting inclusive Education.
Department of Education of Groups with Special Needs, NCERT, New
Delhi
VERMA, J. 2004. Role of parent Teacher Association for promoting Inclusive
Education. Department of Education of Groups with Special Needs,
NCERT, New Delhi
VERMA, J. 2002. An evaluation study of integrated Education for disabled children
(IEDC). Department of Education of Groups with Special Needs, NCERT,
New Delhi

Effect of Mastery Learning Strategy on Achievement in English...
Indian Educational Review, Vol. 51, No.1, January 2013 61
Effect of Mastery Learning Strategy on
Achievement in English in Relation to
Intelligence
DR. RAM MEHAR*
ABSTRACT
The present study investigates the effect of mastery learning strategy
on achievement in English in relation to intelligence. The sample was
drawn of IXth class students taken from two different schools of
Panchkula (Haryana), affiliated to CBSE, New Delhi. Instructional
material based on mastery learning strategy were prepared and
implemented to the experimental group after pre-testing. The gain scores
were computed after post-test for all the students. General Mental
Ability Test (1972) by Jalota was also administered. A 2 ×3 analysis
of variance was used to arrive at the following conclusions: (i) Mastery
learning strategy group was found to attain significantly higher
achievement scores as compared to conventional group, (ii) Performance
of students with different intelligence levels through mastery learning
strategy was found significant, (iii) Significant interaction effect was
found to exist between the two variables.
Introduction
Teaching is an activity which is designed and performed for theattainment of some broad goals or a large number of specific objectsin terms of change in pupil's cognitive structure and behaviour.Teacher in an experimental situation may use a simple model. Butin actual practice no teacher sticks to one model. There are variousmodels of teaching. Eggen, Kauchak and Harder (1979) defined"Models are prescriptive teaching strategies designed to accomplishparticular instructional goals".
Teaching is a difficult task. It requires different types of methodand teaching aids. The selection of these methods and techniques
* Senior Assistant Professor, Department of Education, USOL, Panjab University,Chandigarh

Effect of Mastery Learning Strategy on Achievement in English...
Indian Educational Review, Vol. 51, No.1, January 201362
depends upon the nature of content, learning objectives, learnerabilities and students entering behaviours (Davis and Sorrell,1995).The main focus of teaching is to bring about a desirable change inthe behaviour of learner. It is brought about the teacher usingteaching strategies to achieve his objective. But traditionally we havebeen using teaching method for content presentation. In order toincrease the effectiveness of the presentation, the audio visual aidsare also used.
According to Joyce and Weil (1985), "Model of teaching is a patternor plan which can be used to shape a curriculum or course, to select,instructional material and to guide teacher's action. Models aredesigned to attain specific goals. When a teacher identifies a goal,selects a particular strategy designed to attain goal, we can say heis using a model approach". According to Shahid (2000), "Model ofteaching can be defined as instructional design which describes theprocess of specifying and producing particular environmentalsituation that cause the students to interact in such way that aspecific change occurs in their behaviour".
According to Bloom (1971), "Mastery learning is based on thebelief that any teacher can virtually help all students to learnexcellently, quickly and self confidently. Mastery learning believethat it can be implemented simply by modifying traditional groupinstructional procedures to ensure that some students have moretime and they receive appropriate additional instruction accordingto the result of the formative evaluation".
"Mastery learning uses differentiated and individualisedinstruction, progress monitoring, formative assessment, feedback,corrective procedures, and instructional alignment to minimiseachievement gaps (Bloom, 1971; Zimmerman & Dibenedetto, 2008).The strategy is based on Bloom's learning for mastery model, whichemphasises differentiated instructional practices as strategies toincrease student achievement. Drawing from the principles of effectivetutoring practices and learning strategies, mastery learning usesfeedback, corrective procedures, and classroom assessment to informinstruction. Rather than focusing on changing content, this strategyendeavours to improve the process of mastering it" (Bloom ,1971).
According to Davis and Sorrell (1995), "The mastery learningdivided subject matter into units that have predetermined objectives.Students, alone or in groups, work through each unit in an organisedfaction. Students must demonstrate mastery on unit exams, typically80 per cent before moving on to new material. Students who do not

Effect of Mastery Learning Strategy on Achievement in English...
Indian Educational Review, Vol. 51, No.1, January 2013 63
achieve mastery receive remediation through, peer monitoring, smallgroup discussions, or additional homework. So, students with minimalprior knowledge of material have higher achievement through masterylearning than with traditional methods of instructions".
According to Bloom (1968), mastery learning offers a powerfulnew approach to student learning which can provide almost allstudents with the successful and rewarding learning experiences.What Cioch (1977) proposes for food service courses is also relevantin other settings i.e. almost all students can master what they aretaught. Further, procedures suggested whereby each student'sinstruction and learning can be managed within the context ofordinary group-based classroom instruction so as to promote hisfullest development. Mastery learning makes student learning moreefficient than conventional approaches. Mastery learning differs fromtraditional curricular programmes. The emphasis is on assuring thatevery student achieves or 'masters' the curriculum and only movesahead once demonstrating an acceptable level of performance (Bloom,1976). Mastery learning helps students to learn more content inless time. It also helps in developing learner's interest and attitudetowards the subject taught than usual classroom methods. Masterylearning has an impact on the affective outcomes of education likemodification in self-concept and to some extent development ofpositive attitude towards the subject. When learners are conceivedthat they can learn effectively, they will confront any learning taskwith the quite strength of knowing they will able to cope. Teachingstrategies, which help reducing student anxiety, also enhancestudent achievement. The mastery learning approach came intopractice in the decade though the concept is an old one. The differentauthors from different field defined mastery learning in a variety ofways (Bloom, 1968).
The word 'intelligence' is said to be the literal translation forAristotle's term 'diagnoses'. Plato was the first to begin the discussionon intelligence with his tripartite division of the 'nous' which coveredthe soul, mind, spirit and thinking as well as that of mental ability.Intelligence is generally considered as the most important correlatesof achievement. So intelligence is the common factor to affect theachievement of the learner. It is a descriptive concept. Commonly itis associated with the general behaviour of an individual so that itbecomes synonymous of brightness of being brainy. A psychologistpresents it as theoretical construct which may vary from very low tovery high. Generally intelligence conveys three messages such as

Effect of Mastery Learning Strategy on Achievement in English...
Indian Educational Review, Vol. 51, No.1, January 201364
ability to adjust, ability to learn and ability to carry on abstractthinking.
According to MacMillan (1990), "In education, intelligence is theability to learn or understand or to deal with new or challengingsituations. In psychology, the term intelligence may more specificallydenote the ability to apply knowledge to manipulate one'senvironment or to think abstractly as measured by objective criteria.Intelligence is usually thought of as deriving from a combination ofinherited characteristics and environmental factors. The subjectremains hotly debated and many have tried to show that either biology(especially genes) or environment are more or less exclusivelyresponsible for producing differences in intelligence. Particularlycontested have been studies purporting to show links between ethnicheritage and intelligence, most of which have not been accepted inthe scientific community. General intelligence is often said to comprisevarious specific abilities but critics contend that such compartmentsfail to reflect the nature of cognition and that other models, perhapsbased on information processing, are needed. High intelligence issometimes shown to correlate with social achievement, but mostexperts believe other factors are important and that intelligence isno guarantor of success. Intelligence means the ability to reasonand profit by experience. An individual level of intelligence isdetermined by a complex interaction between his heredity andenvironment".
Need and Significance of the Study
The proper teaching strategies help teachers in solving learners'problems and bring remarkable improvement in their overallbehaviour. Review of the literature shows that use of various teachingstrategies gave quite positive results in comparison to traditionalteaching methodology. While teaching high school English student's,investigator found conventional method not that much effective.Investigator thought to conduct research study by using masterylearning strategy for teaching experimental group and conventionalmethod for second group of students and investigate whether theuse of mastery learning strategy is effective or not. Intelligence affectshow students go about studying. Thus, the present study gives widerrange of knowledge regarding the effect of mastery learning strategyand relationship with student's intelligence in English grammar. Thefindings of the present study are also be helpful to assist the students

Effect of Mastery Learning Strategy on Achievement in English...
Indian Educational Review, Vol. 51, No.1, January 2013 65
to improve their learning skills in English. The results of the presentstudy are also helpful for teachers in understanding and adoptingthe approach of a strategy and break the monotony of theconventional teaching strategy. Therefore, the investigator made anattempt to enquire into the effect of mastery learning strategy onachievements in English in relation to intelligence.
Objectives
1. To compare the performance of groups taught through masterylearning strategy and conventional teaching strategy.
2. To compare the performance of groups having differentintelligence levels.
3. To examine the interaction effect between teaching strategy andintelligence levels.
Hypotheses
H1 : The performance on English grammar of mastery learningstrategy group is higher than the conventional group.
H2 : The performance of groups having different intelligence levelsis significantly different from one another on English grammar.
H3 : There exists significant interaction effect between masterylearning strategy and intelligence levels.
Methodology of the Study
It is necessary to adopt a systematic procedure to collect thenecessary data which helps to test the hypotheses of the study underinvestigation. Various steps of research methodology followed in thepresent study are as follows.
Sample
The study was carried out on 100 students of IXth class of Panchkulai.e. Hans Raj Public School Panchkula (Haryana) and D.A.V. SeniorSecondary School, Panchkula (Haryana). It was random andpurposive sample. The two schools were randomly selected from thetotal schools of Panchkula. The study was conducted on two intactgroups viz. one is experimental group and other is control group ineach school. From each school, the two intact sections of 25 studentswere selected.

Effect of Mastery Learning Strategy on Achievement in English...
Indian Educational Review, Vol. 51, No.1, January 201366
Design
2×3 analysis of variance was employed for analysis of mean gainscores on achievement. The main dependent variable wasperformance gain. The two independent variables were instructionaltreatment and intelligence levels. The variables of teaching strategywere examined at two levels, namely mastery learning strategy andconventional teaching strategy. The classification of intelligencegroup was done for intelligence variable operating at three levels viz.high, average and low intelligence.
Tools used
The following tools were used for the collection of data:1. General Mental Ability Test by Jalota (1972) was used.2. Achievement Test in English grammar was prepared by the
investigator.3. Five Lessons in English grammar based on mastery learning
strategy and conventional teaching strategy were prepared bythe investigator.
Procedure
After the selection of the sample and allocation of students to thetwo instructional strategies, the experiment was conducted in fourphases. Firstly, the General Mental Ability Test was administratedin each school, in order to identity intelligence levels of the students.Secondly, a pre-test was administered to the students of experimentaland control groups. The answer-sheets were scored to obtainedinformation regarding the previous knowledge of the students.Thirdly, one group was taught through mastery learning strategyand another group was taught through conventional teachingstrategy by the investigator. Fourthly, after the completion of thecourse, the post-test was administered to the students of both thegroups. The answer-sheets were scored with the help of scoring key.Time limit for the test was one hour.
Analysis and Interpretation of the Results
Analysis of Descriptive Statistics
The data was analysed to determine the nature of the distribution ofscores by employing mean and standard deviation. The analysis ofvariance was used to test the hypotheses related to strategies of

Effect of Mastery Learning Strategy on Achievement in English...
Indian Educational Review, Vol. 51, No.1, January 2013 67
teaching and intelligence levels. The mean and standard deviationof different sub groups have been presented in table - 1, 2 and 3.
Table 1
Means and SD of Achievement Scores for the Different Sub Groups
Intelligence Groups Teaching
Mastery Learning Conventional Total
Strategy Strategy
N Mean SD N Mean SD N Mean SD
High Intelligence 13 5.92 4.16 13 2.92 2.55 26 4.42 5.65
Average Intelligence 24 11.21 5.34 24 4.46 2.94 48 7.83 9.70
Low Intelligence 13 15.38 3.02 13 5.85 3.01 26 10.62 11.87
Total 50 10.92 5.67 50 4.42 3.07 N= 100
Source: Field Study, 2011
It may be observed from the Table-1 that the mean scores ofmastery learning strategy (M=10.92) is higher than the conventionalteaching strategy (M=4.42). This shows that mastery learning strategyis more effective than that of the conventional teaching strategy. Itis also confirmed that the mean of the three groups i.e. high, 6average and low intelligence group is 4.42, 7.83 and 10.62respectively. It is concluded that the gain mean with mastery learningstrategy has shown significant differences for high, average and lowintelligence students. These differences are also found in respect ofthe different intelligence group taught through conventional teachingstrategy.
Analysis of Variance on Achievement Scores
The mean of different sub-groups, sum of squares, degree of freedom,mean sum of squares and the F-ratio have been presentedin Table - 2.
* Significant at 0.05 level ** Significant at 0.01 level
(Critical Value 3.94 at 0.05 and 6.91 at 0.01 level, df 1/94)
(Critical Value 3.09 at 0.05 and 4.84 at 0.01 level, df 2/94)
Table 2
Summary of Analysis of Variance (2×3) Factorial Designs
Source of Variance Sum of Squares df Mean Sum of Squares F-ratio
Treatment (A) 1056.25 1 1056.25 69.13**
Intelligence (B) 500.94 2 250.47 16.39**
Interaction (A × B) 140.41 2 70.21 4.59*
Error 1436.51 94 15.28

Effect of Mastery Learning Strategy on Achievement in English...
Indian Educational Review, Vol. 51, No.1, January 201368
Treatment (A)
It may be observed from the Table - 2 that the F-ratio for difference inmean gain scores of mastery learning strategy and conventionalteaching strategy group is 69.13, which in comparison to the tablevalue was found significant at 0.01 level of significance. It showsthat the groups were not different beyond the contribution of chance.Hence, the hypothesis H1: The performance on English grammar ofmastery learning strategy group is higher than the conventionalteaching strategy group, is accepted. The result indicates that theperformance of mastery learning strategy group is more effective thanthat of the conventional teaching strategy group.
Intelligence Groups (B)
Table-2 shows that the F-ratio for difference in means of the threegroups of intelligence level are 16.39, which in comparison to thetable value was found significant at 0.01 level of significance. It showsthat the three groups were different beyond doubt of operating chancefactor. The result indicates that three intelligence lever differsignificantly in respect of achievement course irrespective of strategyof teaching. Hence, the hypothesis H2 : The performance of groupshaving different seven intelligence levels is significantly different fromone another on English grammar, is accepted at 0.01 level ofsignificance. The observed difference may be attributed to the chancefactor. The result indicates that the high, average and low intelligencegroup did not yield equal level of achievement.
In order to probe deeper, the ratio was followed by t-test. Thevalue of the t- ratio for the different combinations have been given inthe following Table-3
Intelligence Groups High Intelligence Average Intelligence Low Intelligence
N Mean SD N Mean SD N Mean SD
High Intelligence
N Mean SD -- 1.91 2.40*
Average Intelligence
N Mean SD -- -- 1.03
Low Intelligence
N Mean SD -- -- --
Table-3: t-ratio for different combinations of intelligence levels
*Significant at 0.05 level
(Critical Value 2.00 at 0.05 and 2.65 at 0.01 level, df 72)(Critical Value 2.01 at 0.05 and 2.68 at 0.01 level, df 50)

Effect of Mastery Learning Strategy on Achievement in English...
Indian Educational Review, Vol. 51, No.1, January 2013 69
It may be observed from the Table - 3 that the t-ratio for thedifference in gain means of high and average intelligence groups is1.91, which in comparison to the table value was not found significanteven at 0.05 level of significance. Hence, the hypothesis of significantdifferences is rejected in case of high and average intelligenceirrespective of grouping across other variable. The result indicatesthat the achievement of high and average intelligence groups wasnot significantly different in respect of gain scores.
Table - 3 shows that the t-ratio for the difference in gain meansof high and low intelligence groups is 2.40, which in comparison tothe table value was found significant at 0.05 level of significance.Hence, the hypothesis of significant differences is not rejected incase of high and low intelligence irrespective of grouping across othervariable. This infers that low intelligence group performs significantlybetter than that of high intelligence groups on achievement in respectof gain scores.
Table - 3 shows that the t-ratio for the difference in gain meansof average and low intelligence groups is 1.03, which in comparisonto the table value was not found significant even at 0.05 level ofsignificance. Hence, the hypothesis of significant differences isrejected in case of average and low intelligence irrespective of groupingacross other variable. The result indicates that the achievement ofaverage and low intelligence groups was not significantly differentin respect of gain scores.
Interaction Effect (A × B)
It may be observed from the Table-2 that the F- ratio for the interactionbetween treatment and intelligence groups is 4.59, which incomparison to the table value was found significant at 0.05 level ofsignificance. It indicates that the two variables do interact with eachother. Hence, the hypothesis H3, there exists significant interactioneffect between mastery learning strategy and intelligence levels, isaccepted. So, mastery learning strategy and conventional teachingstrategy have not yielded equal levels of achievement for high, averageand low intelligence level for the students.
Discussion
The result of the present investigation have lead to the conclusionthat mastery learning strategy yields higher levels of attainment inEnglish grammar as compared to the conventional group. The results

Effect of Mastery Learning Strategy on Achievement in English...
Indian Educational Review, Vol. 51, No.1, January 201370
are supported by the findings of Kulik, Kulik and Bangert - Drowns(1990) found that positive correlation of students attitudes towardsinstruction and content of mastery learning programmes. Lazaowitz,Baird, Bowlden and Lazaowitz (1996) found that group of masterylearning students did better in some topics as compared toindividualise mastery learning. Dutt and Kumar (2002) found thatmastery learning strategy is better on achievement in economicsthan the traditional method of teaching. Wachanga and Gamba (2004)found that mastery learning approach facilities students learningchemistry better than the regular teaching methods. Dillashaw andOkey (2006) result indicates that achievement of mastery learningstudents were significantly higher than that of non-mastery controlstudents. Adeyemi (2007) found that mastery learning approach onstudent's performance in social studies was more effective than theconventional method of teaching. Wambugu and Changeiywo (2008)concludes that mastery learning approach is an effective teachingmethod which physics teachers should be encouraged to use andshould be implemented in all teacher education programmes inKenya. Damavandi and Kashani (2010) found that mastery learningmethod is more effective on performance of weak students in higherlevels of learning method than in common learning method. Sakiz(2011) found that mastery approach goal orientation was significantlypositively associated with college students.
The performances of students in English grammar throughmastery learning strategy have shown significant differences for high,average and low intelligence students. The results were consistentwith the findings of Dutt (1987) found that intelligence of the problemsolver significantly affect the problem solving ability irrespective ofstrategies of training. Gill (1989) found that high intelligence studentsscored higher on originality than low intelligent subjects irrespectiveof training strategies. Bal (1992) found that intelligence had asignificant effect on acquisition and retention of higher level writingskills in English. Riding and Pearson (1994) revealed that effect ofintelligence on performance in different subjects showed significanteffects. Bogaards (1996) found that intelligence played significantrole to influences language learning. Mishra (1997) foundachievement of students differ significantly at different levels ofintelligence. Kohli (1999) found that intelligence have significanteffect on the achievement of students. Mehra and Mondal (2005)indicated that the high intelligence group performed better onachievement in Science than the low intelligence group taught by

Effect of Mastery Learning Strategy on Achievement in English...
Indian Educational Review, Vol. 51, No.1, January 2013 71
traditional instruction. Singh (2005) found that the studentsbelonging to high level of intelligence had better performance thanthe low level of intelligence and Aruna and Usha (2006) found thatintelligence have significant positive correlation with processoutcomes in Science.
The performance of mastery learning strategy was foundinteracting with each other at different levels of intelligence. Itindicates that performance through mastery learning strategy ofteaching was different for different levels of intelligence.
Conclusion
The present study reveals that performance in English grammar ofstudents taught through mastery learning strategy was significantlyhigher than those which were taught through conventional teachingstrategy. The gain mean with different teaching strategy at differentdimension of intelligence levels groups do differ to each other.Further, the gain means with mastery learning strategy has shownsignificant differences for high, average and low intelligence students.However, the difference in mean score for interaction across differentgrouping did turn out to be significant. The 10 study recommendsthe use of mastery learning strategy for better performance of Englishstudents at secondary stage.
REFERENCES
ADEYEMI, B. A. 2007. "Learning social studies through mastery learning".
Educational Research and Review. 2 (4), 60-63.
ARUNA , P. K. AND USHA, P. 2006. Influence of Cognitive Style, Intelligence and
Classroom Climate on Process Outcomes in Science. EduTrack,
6(10), 30-33.
BAL, N. 1992. "The efficacy of guided discovery and expository teaching
strategies on acquisition, retention and transfer of writing skills inEnglish among students of +2 stage in relation to intelligence and
cognitive styles". Unpublished doctoral thesis, Panjab University,
Chandigarh.
BLOOM, B. S. 1971. "Mastery learning". In J. H. Block (Ed.), Mastery Learning:
Theory and Practice. Holt, Rinehart & Winston, New York. Bloom, B. S.1968. Learning for mastery. UCLA Evaluation Comment, 1 (2), 1-8.
BLOOM, B. 1976. Human Characteristics and School Learning. McGraw-Hill,
New York.

Effect of Mastery Learning Strategy on Achievement in English...
Indian Educational Review, Vol. 51, No.1, January 201372
BOGAARDS, P. 1996. "Intelligence, social class and social context-measurable
effect on success in foreign language learning at school". Retrieved
from http: //www.eric.ed.gov/ PDFS / ED394337.pdf
CIOCH , J.J. 1977. "Mastery Learning for Quantity Food Service Courses".Journal of Hospitality and Tourism Research. 1: 55-66.
DAMAVANDI, M. E. and Kashani, Z. H. 2010. "Effect of mastery learning method
on performance and attitude of the weak students in chemistry". Journal
of Social and Behavioural Sciences 5, 1574-1579.
DAVIS, D. AND SORRELL, J. 1995. "Mastery learning in public schools. Paperprepared for PSY 702: Conditions of Learning". Valdosta State University,
Valdosta Retrieved August 6, 2013 from http:// edutechwiki.unige.ch/
en/Mastery_learning#References
DILLASHAW , F. G. AND OKEY, J. R. 2006. "Effect of modified mastery learning
strategy on achievement, attitudes and on-task behaviour of high schoolchemistry students". Journal of Research in Science Teaching, 20 (3),
203-211.
DUTT, S. 1987. "The effect of problem solving strategies on problem solving
ability in science of high school students in relation to anxiety level,
cognitive style and intelligence". Unpublished doctoral thesis, PanjabUniversity, Chandigarh
DUTT, S. AND KUMAR , D. 2002. "Mastery learning strategies-their effectiveness
on achievement in economics in relation to cognitive style". Indian
Educational Review, 45 (3), 49-51.
EGGEN , P. D., KAUCHAK, D. P. and Harder, R. J. 1979. "Strategies for Teachers-Information Processing Model in the Classroom". Englewood Cliffs,
NJ: Prentice-Hall.
GILL, T. K. 1989. "Effect of training strategies on creative problem solving
skills and cerebal dominance in relation to intelligence, personality,
cognitive style". Unpublished doctoral thesis, Punjab University,Chandigarh.
JALOTA, S.S. 1972. Manual for General Mental Ability Test. Agra: Psychological
Corporation.
JOYCE , B. AND WEIL, M. 1985. Models of Teaching . New Delhi: Prentice Hall.
KOHLI , V. 1999. "Effectiveness of self-learning models on achievement ingeography in relation to mastery and non-mastery teaching strategies,
intelligence and study habits". Unpublished doctoral thesis, Punjab
University, Chandigarh.
KULIK, C., KULIK, J. AND BANGERT- DROWNS, R. L. 1990. "Effectiveness of mastery
learning programs: A meta- analysis". Review of Educational Research,60 (2), 265- 306.
LAZAOWITZ, R., BAIRD, H. J., BOWLDEN, R. AND LAZAOWITZ, R. H. 1996. "Teaching
Biology in group mastery and effective outcomes". International Journal
of Science Education, 18 (4), 447-461.

Effect of Mastery Learning Strategy on Achievement in English...
Indian Educational Review, Vol. 51, No.1, January 2013 73
MACM ILLAN, D. B. 1990. Dictionary of Psychology . London and Basic Stoke:
Macmillan Press Ltd.
MEHRA, V. AND MONDAL, H. R. 2005. "Effects of peer tutoring on learning
outcomes of high school science students". Indian Educational
Review , 41(1), 41- 58.
MISRA, B. B. 1997. "Correlation of academic achievement of high school
students in India". Journal of Educational Review , 103 (2), 21- 25.
RIDING, R. J. AND PEARSON, F. 1994. "The relationship between cognitive style
and intelligence". Educational Psychology, 16(1), 81-106.
SAKIZ, G. 2011. "Mastery and performance approach goal orientations in
relation to academic self efficacy beliefs and academic help seeking
behaviours of college students in Turkey". Educational Research, 2(1),
771-778.
SHAHID, S. M., 2000. Modern Approach to Teaching. Lahore: Majid Book Depot.
SINGH, P. 2005. "Comparative study of concept attainment model, advance
organiser model and conventional method of teaching of Physics in
relation to intelligence and achievement motivation of ninth class
students". Unpublished doctoral thesis, Punjab University, Patiala.
WACHANGA, S. W. AND GAMBA, P. P. 2004. "Effects of mastery learning approachon secondary school students' achievement in chemistry in Nakuru
District Kenya". Egerton Journal of Humanities Social Sciences and
Education, 5 (2), 221-235.
WAMBUGU, P. W. AND CHANGEIYWO, J. M. 2008. "Effects of mastery learning
approach on secondary school students physics achievement".Eurasia Journal of Mathematics, Science and Technology Education,
4 (3), 293-302.
ZIMMERMAN, B. J. AND DIBENEDETTO, M. K. 2008. "Mastery learning and
assessment: Implications for students and teachers in an era of high-
stakes testing". Psychology in the Schools, 45(3), 206-216.
A Study of Academic and Infrastructural Input...
Indian Educational Review, Vol. 51, No.1, January 201374
A Study of Academic and Infrastructural
Input and Achievement of Scheduled Caste
Students of Residential Schools of
Madhya Pradesh
DR. ANIL KUMAR MB PILLAI*
ABSTRACT
The study is an attempt to examine infrastructural and academic
inputs being provided and the outcome of schooling in terms of
achievement of scheduled caste students of Residential Schools of
Madhya Pradesh.
The findings of the study depicts that there are acute deficiency of
infrastructural facilities in Residential Schools during the study period.
Achievement of students in subjects like Physics, Chemistry, Mathematics
and General English is not satisfactory. There is a need to create congenial
environment to promote learning in the campus of Residential Schools.
The levels of achievement of learners are increasing in these institutions,
thus the Government should continue the scheme of Residential Schools
for scheduled castes and it must be further strengthened.
Introduction
India as a nation is bound by its constitution to establish anegalitarian social order in which every citizen is guaranteed liberty,equality and justice – social, economic and political. It has been thenational society with rigid social stratifications, wide economic andcultural disparities persisting through centuries. It is a Herculeantask to eradicate these inequalities and to establish an egalitariansocial order.
Article 45 of the constitution of the country directs that 'free andcompulsory education should be provided for all children up to theage of 14 years'. It is widely recognised that the spread of educationplays a vital role in the socio-economic and cultural modernisationof the country in general and social mobility of the weaker sections
* Lecturer, Tribal Welfare Department, Govt. of Madhya Pradesh

A Study of Academic and Infrastructural Input...
Indian Educational Review, Vol. 51, No.1, January 2013 75
in particular. Many efforts are to be made by all concerned witheducation to make it liberal in reality. Unless access to educationand equality of opportunity and outcome are insured, democracycannot be strengthened. Right To Education Act 2009 came into effectfrom 1st April 2010 is a step to achieve this objective. With this Indiahas moved forward to a right based framework that costs a legalobligation on the Central and state government to implement thisfundamental child right as enshrined in the Article 21A ofconstitution, in accordance with the provision of the RTE Act.
The directive principles of state policy embodied in part IV of ourconstitution is a unique feature. Article 46 of the constitution dealswith 'the promotion of educational and economic interests ofScheduled Caste, Scheduled Tribes and other weaker sections'. Itsays - "The state shall promote with special care the educationaland economic interests of the weaker sections of the people, and inparticular, of the Scheduled Castes and Scheduled Tribes and shallprotect them from social injustice and all forms of exploitation.'' Tofulfill the directive principle, as mentioned above, Central and StateGovernments formulated and enacted the policy of not only thereservation for SC/ST students in educational institutes but alsolaunched programmes with special emphasis to these otherwiseunderprivileged sections of the society.
Profile of Scheduled Castes in India
Scheduled Castes are notified in 31 states and union territories ofIndia. The total population of SCs in India is 20.14 crore (census2011) which constitutes 16.6 per cent of the total population of India.Scheduled Castes population increased by 20.8 per cent in theprevious decade. Total Population of India grew by 17.7 per centduring 2001-11 against 21.5 per cent in the previous decade. Thevariation in the SC population of India and Madhya Pradesh(sex wise) during 2001-11 is shown below:
Table 1
Population of SCs: 2011
(in crore)
India Madhya Pradesh
2001 2011 Variation(%) 2001 2011 Variation(%)
Total 16.66 20.14 + 20.8 0.92 1.13 + 23.9
Males 8.61 10.35 + 20.3 0.48 0.59 + 23.0
Females 8.05 9.79 + 21.5 0.44 0.54 + 24.9

A Study of Academic and Infrastructural Input...
Indian Educational Review, Vol. 51, No.1, January 201376
To protect and safeguard the rights of scheduled castesGovernment of India is conducting various economic and educationalschemes directly and through State Governments. Scheduled CasteSub Plan (SCSP) has been introduced in accordance with Tribal SubPlan (TSP) for tribal. Under this plan fund is released to stategovernments for the educational and socio economical developmentof these communities exclusively.
Profile of Scheduled Castes in Madhya Pradesh
Madhya Pradesh is the state having an area of 3,08,800 sq km andpopulation of 7.26 crore (census 2011). Madhya Pradesh is the 8thlargest state in India having 1.13 crore (15.5 per cent) ScheduledCaste population. The decadal growth of Scheduled Caste populationis 23.9 per cent. Forty eight castes are notified in the state. Out ofthe total Scheduled Caste population 72.9 per cent are rural and27.1 per cent are urban by habitat (census 2011).
Literacy– Madhya Pradesh and India
Literacy and education are important indicators in a society and playa central role in human development. The present literacy rate of thestate is 69.3 per cent and the national literacy rate is 73.0 per cent(census-2011). The same is depicted in the following table:
It is evident from the above table that during the last decade theincrease in female literacy was higher than their male counterpartsboth at national (Females-20.3 per cent, Males-7.4 per cent) andsate level (Females-8.9 per cent Males-3.3 per cent).
Table 2
Total Literacy rate of India and Madhya Pradesh: 2001 and 2011
India Madhya Pradesh
2001 2011 Difference 2001 2011 Difference
(2011-2001) (2011-2001)
(% of diff.) (% of diff.)
Persons 64.8 73.0 + 8.2 63.7 69.3 + 5.6
(12.7%) (8.1%)
Males 75.3 80.9 + 5.6 76.1 78.7 + 2.6
(7.4%) (3.3%)
Females 53.7 64.6 + 10.9 50.3 59.2 + 8.9
(20.3%) (15.0%)

A Study of Academic and Infrastructural Input...
Indian Educational Review, Vol. 51, No.1, January 2013 77
As the caste wise literacy rate of Madhya Pradesh is not yet beenpublished by the Census, to know literacy status of Scheduled Castesand total literacy of the state and the country we have to take help ofcensus 2001.
Table 3
Literacy–India and Madhya Pradesh (2001)
Madhya Pradesh India
Total Literacy SC Literacy Total Literacy SC Literacy
Total Male Female Total Male Female Total Male Female Total Male Female
Total 63.7 76.1 50.3 58.6 72.3 43.3 64.8 75.3 53.7 54.7 66.6 41.9
Rural 57.8 71.7 42.8 55.4 69.7 39.4 58.7 70.7 46.1 51.2 63.7 37.8
Urban 79.4 87.4 70.5 68.0 80.1 54.7 79.9 86.8 72.9 68.1 77.9 57.5
Source: Census 2001
It is clear from the above table that total literacy rate in MadhyaPradesh as per census 2001 is 63.7 and that of SC's is 58.6. Whereas at national level the total literacy is 64.8 and that of SC's is 54.7.Thus literacy among SC's in the state is still less than the nationalaverage. Both at State and National level, Rural female literacy isless than total Rural literacy. There is a sharp difference between
the urban total female literacy and Urban SC female literacy at Statelevel (70.5and 54.7 respectively) and same is the scenario at nationallevel (72.9 and 57.5 respectively).
Educational development of SCs in India
Following are some of the major educational development of SCs:• Admission/ Tuition fees are exempted in KVs up to Class XII, for
SC students. They are given concession in fees in NationalInstitute of Open Schooling (NIOS).
• The SC students are given concessional fees to the extent of` 450/- for Secondary Courses and 525/- for Senior Secondarycourses.
• Under the Scheme of "Strengthening of Boarding and Hostelfacilities for Girls students of Secondary and Higher SecondarySchools", 100 per cent financial assistance is given to voluntaryorganisations to improve enrolment of adolescent girls belongingto weaker sections.
• NCERT operates "National Talent Search Scheme"– 1000Scholarships in Science and Social Science up to doctoral level,in medicine and engineering courses up to second degree level,

A Study of Academic and Infrastructural Input...
Indian Educational Review, Vol. 51, No.1, January 201378
are being offered. Among these, 150 and 75 are reserved for SCand ST students respectively.
• Educational development of SCs is major concern of NationalUniversity of Educational Planning and Administration (NUEPA).
UGC
(a) Provides financial assistance for the establishment of SC/ STcells in Universities for the implementation of reservation policy,
(b) Issues guidelines for the implementation of the reservation policy,(c) Provides financial assistance for coaching facilities to prepare
for NET conducted by UGC/ CSIR,(d) Introduced "Remedial Coaching Scheme" at UG/ PG level for
under privileged students to improve academic skill andcomprehension of basic subjects,
(e) Created a Central Pool Data base for SC/ ST candidates.• The Scheme of "Community poly techniques" (since 1978-79)
undertakes rural/ community development activities throughapplication of S& T.
Engineering Colleges: The higher educational institutionsadministered by the Central Govt. including IITs, IIMs, NationalInstitutes of Technology, NLUs etc. provide reservation to the extentof 15 per cent and 7.5 per cent for SC and ST students respectively.
Reservation Policy
Reservation in India is a form of affirmative action designed to improvethe well-being of peoples of deprived classes, wherein a certainpercentage of total available vacancies in educational institutes andgovernment jobs are set aside for people from these communities.Scheduled Castes, Scheduled Tribes and Other Backward Classesare the beneficiaries of the reservation policies under the constitution.The reservation system has received a mixed response from Indianssince its inception. It has been praised for diminishing the gapbetween the upper and lower castes by allowing the latter to enjoythe further increased opportunities as the former in jobs, educationand governance by allotting seats exclusively for them. It has alsobeen criticised for discouraging merit-based system (Wikipedia).
According to a recent survey conducted by Human ResourceDevelopment, GOI, the percentage of students from SC Communitiesenrolled in higher education is only 10.2 per cent of the total enrolment(All India Survey on Higher Education-2012).

A Study of Academic and Infrastructural Input...
Indian Educational Review, Vol. 51, No.1, January 2013 79
The debate (Manoj Joshi, 2006 Guru Charan Das, 2006, ArindamChoudhary, 2006 and Malay Choudhary, 2006) on reservation policyalso extracted the fact that the students of weaker section should beprovided with all facilities in the early stages of schooling so thatthey may be at par with general candidates, when grow up. Thusspecial attention must be given, while providing school education tothe students of weaker sections (Arindam and Malay Choudhary2006) some of them are:• A healthy environment and all possible facilities should be
provided to these students.• Special attention must be given to improve the academic skills,
linguistic proficiency and level of comprehension in varioussubjects.
• Besides normal diet, nutritious food should be provided to them,so that they may became physically and mentally strong enoughto compete with the students.
• Rich library should be provided so that self-learning habit shouldbe inculcated in them.
• All possible facility should be provided to meritorious students ofthese sections.To fulfill such provisions the State Government felt that the
students of weaker section should be provided with all facilities inthe early stages of schooling so that they may be at par with generalcandidates.
Educational Initiatives taken by Madhya Pradesh for theupliftment of SCs– Residential Schools for SC students.
Madhya Pradesh has launched a large number of innovative schemesto promote education especially among the poor and deprived.Educational development of SCs is a major concern of ScheduledCaste Welfare Department, Madhya Pradesh. The department isrunning various schemes for the upliftment of SCs. In MadhyaPradesh, Scheduled Caste Welfare Department started ResidentialSchools for Scheduled Caste students at seven divisions with thelogic of providing a healthy environment, nutritious foods, rich library,infrastructural facilities and to provide an environment which ismore conducive to learning. They are opened in Bhopal, Gwalior,Ujjain, Indore, Jabalpur, Rewa and Sagar in the year 2003-04. Themain objective of these Residential Schools is to provide qualityeducation for Scheduled Caste students and to provide them allpossible facilities free of cost.

A Study of Academic and Infrastructural Input...
Indian Educational Review, Vol. 51, No.1, January 201380
Some of the specific features of the scheme of Residential Schoolsat Divisional Head Quarters are:• These Residential Schools were established in seven divisional
head quarters. (These institutions are besides the hostels andashram run by the department). These institutes have classesfrom 6th to 12th. The total number of seats sanctioned in each ofthese institutes is 280 (140 for boys and 140 for girls). Themaximum strength in each class is kept ideal as 40. Studentsadmitted in these schools are provided with stipend of 500/-per month and `100/- per month for nutritious food. ` 2000/-per month is provided to each residential school as contingencyexpenditure. 30,000/- per year per school is allotted for library,There is also provision for computer education.
• Minimum 60 per cent mark is required in previous boardexamination for admission. Scheduled Caste students were givenadmission to these schools in class 6th, 9th and 11th on thebasis of the merit list, based on marks obtained in the previousclass and marks obtained in the entrance test.
• A committee headed by the Divisional Deputy Commissioner,Tribal welfare supervises the management of these schools.Though the scheme was introduced in 2003-04 and more than
10 years have passed, no systematic and scientific effort has beenmade to find out the effectiveness of the scheme. A look at differentreference materials and Government report reveal that so far nostudy is conducted by either Government or private agency at anylevel and at any point of time. Thus there is an urgent need toundertake an evaluation study of the effectiveness of ResidentialSchools for Scheduled Caste students in Madhya Pradesh. Therefore,following problem statement was specifically framed for the study.
"A Study of Academic and Infrastructural Input and
achievement of Scheduled Caste Students of Residential Schools
of Madhya Pradesh"
The study, is hoped, will not only provide the status of the schemebut will also contribute for the betterment and further impetus tothe scheme.
Objectives of the Study
Investigator laid following objectives for the present study:
1. To study the status of Academic Inputs of residential schools(Sambhagiya Awasiya Vidyalaya) in terms of the following:• Duration of Teaching

A Study of Academic and Infrastructural Input...
Indian Educational Review, Vol. 51, No.1, January 2013 81
• Number of working days• Teacher student ratio• Teachers qualification• Teachers experience• Government Assistance
2. To study the status of infrastructural facilities of ResidentialSchools (Sambhagiya Awasiya Vidyalaya) of Madhya Pradesh.
3. To study the reaction of students and teachers towards academicinputs provided and infrastructural facilities available inResidential Schools (Sambhagiya Awasiya Vidyalaya) of MadhyaPradesh.
4. To study the outcome of schooling in terms of Achievements ofstudents of Sambhagiya Awasiya Vidyalaya of Madhya Pradesh.
Delimitations of the study
The present study was delimited to:1. Achievement of learners is limited to 2007 to 2009.2. The academic and infrastructural inputs of Residential Schools
were measured from 2007 to 2009.
Methodology
The methodology used in conducting the study is discussed underthe following topics:
Design of the study
The design of the present study was Descriptive Survey.
Sample
The sample of the study comprised of seven principals, 59 teachersand 209 students. The details are as follows:1. Residential School scheme for Scheduled Caste students in
Madhya Pradesh is implemented through seven residentialschools (Jabalpur, Indore, Ujjain, Gwalior, Rewa, Sagar andBhopal) situated in seven divisional head quarters of MadhyaPradesh. The present study comprises all the seven ResidentialSchools (Sambhagiya Awasiya Vidyalaya) opened for ScheduledCastes by Government of Madhya Pradesh. They are situated inseven divisional head quarters of Madhya Pradesh.

A Study of Academic and Infrastructural Input...
Indian Educational Review, Vol. 51, No.1, January 201382
The duration of the study was from 2006-07 to 2008-09.To furtherselect appropriate sample for the study from these above residentialschools, following consideration were made.
(a) Since in the present study besides academic andinfrastructural input, achievements of students of ResidentialSchools are also included, the learners of class 12th werechosen for the study.
(b) To know the reactions of learners towards academic andinfrastructural input all learners studying in 12th class inacademic year 2007-08 and 2008-09 were included in the study.
(c) To study academic inputs, infrastructural facilities providedand achievement of students data for three consecutive yearswere collected.
Tools
As per the objectives of the study, for knowing the infrastructuralfacilities available, academic inputs and reaction of teachers andstudents following questionnaires were designed by the researcherfor the present study:• Questionnaire for Principals• Questionnaire for Teachers• Questionnaire for Students
These questionnaires were designed and developed looking intothe need of the content. These questionnaires were also validatedwith the help of principal and teachers of one of the residential schoolsfor the authenticity of the content and language of the tool beforeactual use.
Marks obtained by the learners in higher secondary schoolcertificate examination (12th), conducted by Board of SecondaryEducation Madhya Pradesh was taken as achievement of learnersin the present study. Subject wise marks scored by each student ofall Residential Schools for three consecutive years were collectedfrom all residential schools.
Data collection and Administration of Tools
Data were collected through survey in all Residential Schools. Foradministration of tools the investigator personally visited theseschools, established rapport with Principals, teachers and learners.Explained the purpose of the study and administrated the tools.Information was collected from principals, teachers and learners ofall schools.

A Study of Academic and Infrastructural Input...
Indian Educational Review, Vol. 51, No.1, January 2013 83
Analysis of Data
The data were scrutinised and put in a tabular form. The descriptivestatistical technique (frequency distribution and percentage) wasused for analysis of data. To analyse the reactions of students andteachers inferential statistics of Chi-square test was employed.
Findings
Findings of the study are presented under the following headings
1. Academic Inputs
a. The duration of teaching varied from 32.4 to 44 hours per weekfrom school to school and year to year.
This variation may be because of following reasons:• Variation in duration of single period/class.• Adjustment of time for organising two shifts.
b. In the session 2008 and 2009, in all the seven schools thenumbers of working days were six days in a week.In Residential School Rewa, only in the year 2007, the workingdays were 5.5 days (as one day was half day because of the localweekly market day).
c. Teacher student ratio varied from 1 to 5 teachers per student indifferent schools and across the three year duration of the study.
The variation in the teacher student ratio may be due to thefollowing reasons:• Residential Schools started without sanctioned permanent
post of teachers.• The actual posts of teachers sanctioned in these schools were
of Shiksha Karmi and Samvida Shikshak (para teachers). Theyleave the school whenever they get a better opportunity, Thesalary of these posts is not attractive at all. In some schoolsteachers of other departments managed to get posting ondeputation.
d. The findings about the qualifications of teachers are as follows:• The percentage of trained teachers varied from 62.2 per cent
to 65.9 per cent during the study period.• Similarly the percentage of untrained teacher varied from
34.1 per cent to 37.9 per cent.• The percentage of post graduate teachers varied from
86.7 per cent to 93.3 per cent.

A Study of Academic and Infrastructural Input...
Indian Educational Review, Vol. 51, No.1, January 201384
• The percentage of graduate teachers varied from 9.1 per centto 13.3 per cent in the study period.The above mentioned variation in teachers' qualifications maybe due to the same reason described in sub objective (c) above.
e. Regarding experience the status was as shown below:39 per cent of teachers have more than 10 years teaching experience27.1 per cent teachers have less than two years experience.This variation in experience may be due to :• Teachers who are on deputation have higher teaching
experience.• Shiksha Karmi/Samvida Shikshak have very less or almost no
experience.f. Following government assistance were provided to students of
Residential Schools:• All students of residential schools are getting same amount of
stipend.• Besides stipend, the learners of these schools are getting
2000/- per year for contingency expenditure. This contingencyexpenditure help them in getting stationery, uniforms etc.
2. Infrastructural Facilities
a. Infrastructural facilities available in these schools are notsatisfactory, especially library, laboratory, playground, commonrooms for girls, teaching aids and quarters meant for teachers.• The available infrastructure is not able to meet all the
requirement of the schools.• There is a need to provide more infrastructural facilities in
Residential Schools. This will improve the quality of education,being provided in these schools.
Reaction of Students and Teachers
For analysing the reaction of students and teachers descriptivestatistics of frequency, percentage and inferential statistics ofChi-square test were employed.
A. Reaction of Students
1. Students agree that infrastructural facilities provided inResidential Schools are not sufficient. Following may be thereasons:

A Study of Academic and Infrastructural Input...
Indian Educational Review, Vol. 51, No.1, January 2013 85
• Most of the Residential Schools were running on rentedbuildings or some other Government institutions.
• Most of the schools lack facilities of library, laboratory, playground etc.
There is a need to provide adequate infrastructural facilities inthese schools.
2. Students agree that the teachers posted in Residential Schoolsare not sufficient according to the subjects and number ofstudents. The reasons may be:• Full time teachers are not sanctioned in these schools.• The Shiksha Karmi/Samvida Shikshak appointed in these
schools may not be according to subjects.There is a need to appoint subject wise teachers according to thenumber of students admitted in these schools.
3. Students of Residential School agree that they are motivated tolearn by Scholarship. The reasons may be:• Most of the students belong to low SESS category.• Thus free schooling and stipend might be a motivating factor
for the students of Residential Schools to learn.4. Students of Residential Schools agree that the amount of
scholarship given to students is not sufficient.• Scholarship amount provided to students are not very
attractive.• Only 250/- pa for boys and 260/- pa for girls is provided at
present.• This amount is quite meager and need to be enhanced for
meet with the present day requirement.5. Students agree that the amount provided as stipend to the
learners residing in hostels is not sufficient to meet out theirneeds.• 700/- pm is given to students to meat out the expenditure of
mess and nutritive food in residential schools.• This amount is less and need to be enhanced to meet with the
present day requirement.6. The students agree that facilities available in hostels of Residential
Schools are not sufficient.• Hostels in most of Residential Schools were running in rented
buildings or alternative arrangements have been made.• Due to this reason, all facilities could not be made available in
these hostels by the Government.• These hostels need to be upgraded to suit the requirement of
the learners residing in it.

A Study of Academic and Infrastructural Input...
Indian Educational Review, Vol. 51, No.1, January 201386
B. Reaction of Teachers
1. Teachers of Residential Schools opined that there is no need toincrease the duration of teaching in schools. The reasons may be:• Most of Residential Schools have seven periods of 40-45
minutes in a day.• Thus teachers of the Residential Schools are of the opinion
that there is no need to increase the duration of teaching.2. Teachers of Residential Schools agree that working days of
Residential Schools are sufficient. The reasons may be:• The working days are six days a week.• This is the maximum possible working days.• Thus working days in Residential Schools are sufficient.
3. The teachers of Residential Schools agree that the number ofteachers is not sufficient according to the number of students.The reasons may be:• Due to the policy of appointing Samvida Shikshak, some schools
may not be having sufficient number teachers.• More teachers are to be posted in Residential Schools.
4. The teachers of Residential Schools agree that the amount ofscholarship/stipend provided to the learners of ResidentialSchools is to be increased. The reasons may be:• The prices of all commodities have been increased,• Thus there is a need to increase the rate of stipend and
scholarship.5. In the opinion of teachers, teachers of Residential Schools are
well qualified.• The same is also revealed in objective 1 of the present study.• 86.7 per cent to 93.3 per cent teachers teaching in Residential
Schools were post graduate.6. In the opinion of teachers, teachers teaching in class 12th of
Residential Schools are experienced.• But data regarding experience of these teachers shows a
different story.• Only 39 per cent teachers are with more than 10 years of
experience.7. The teachers agree that the class rooms available in Residential
Schools are not sufficient. The reasons may be:• Most of Residential Schools were running in rented buildings
or some other buildings.• The class rooms needed for these schools are insufficient.• This also matches with finding of objective 2 of this study.

A Study of Academic and Infrastructural Input...
Indian Educational Review, Vol. 51, No.1, January 2013 87
8. The teachers agree that the students are not benefiting from thelibrary.• Most of the Residential Schools don't have library.• There is a need to provide library facility in Residential Schools.The same is also revealed under objective 1 of the present study.
9. The teachers agree that there is sufficient arrangement of drinkingwater in Residential Schools.
10. The teachers agree that Quarters are not allotted to them.• Most of the teachers have not allotted government quarters in
school premises.• There is a need to provide government quarters to teachers.
C. Achievements of students of Residential Schools of MadhyaPradesh.
The findings revealed that:• Overall results of Residential Schools in the year 2007, 2008
and 2009 were 75.2 per cent, 86.9 per cent and 86.6 per centrespectively.
• The maximum percentage of learners who have scored above79 per cent is 6 per cent through out the study period.
• In the year 2007, 37 per cent learners of Residential Schoolsscored marks between 45 per cent and 59 per cent.
• In 2008, 42 per cent learners scored marks between 60 per centand 69 per cent. In 2009, 50 per cent learners passed with marksbetween 60 per cent and 69 per cent. Thus the percentage oflearners passing in higher marks range increased during thestudy period.
• Students mainly failed in Physics, Chemistry, Mathematics andGeneral English.
• It seems that with the execution of the scheme, year by yearthere is an improvement in the result of Residential Schools.
Conclusion, Discussion and Suggestions
• There is a need to provide better infrastructural facilities as theseinfrastructural facilities contribute significantly in creating betterlearning environment and foster the learning of the student.
• It is revealed that either there are no laboratories or they are notwell maintained. To enhance the effectiveness of learning,laboratory is one of the important activity places for students.
• Achievements of students in subjects like Physics, Chemistry,Mathematics and General English are not good. This requiresproper care on the part of subject teachers.

A Study of Academic and Infrastructural Input...
Indian Educational Review, Vol. 51, No.1, January 201388
• Concept of remedial teaching or extra coaching may be introducedin these schools especially for students who are poor achiever inthese subjects.
• Presently very less amount of scholarship/stipend is given tothe students. Looking into the need of the hour there is a need toincrease the stipend/scholarship. Scholarship/Stipend shouldbe increased so that it may work as an incentive for ScheduledCaste students.
• As per the provision of the scheme, Shiksha Karmi/Samvida
Shikshak is to be employed in Residential Schools for teachingpurpose. It has been observed that these teachers do not thinkof accountability, which in turn affects their performance in theclassroom. It would be much better if provisions are made toappoint regular teachers in Residential Schools under thescheme instead of Shiksha Karmi/Samvida Shikshak.
• As per the provision of the scheme teachers are to be providedresidential quarters in the premises of Residential Schools. Thereis a shortage of residential facilities for teachers. Efforts shouldbe made to construct and allot residential quarters in the campusfor teachers of these schools.Overall it is revealed in the present study after the introduction
of this Residential School scheme, the level of achievement ofstudents of these school is improving. There is a need to continuesuch schemes; if possible this scheme may be further strengthened.
REFERENCES
ACZEL, AMIR D,PANDIAN. 2006. Complete Business Statistics, Mc Graw Hills,
New Delhi
AMBASHT, N. K. AND RATH, K. B. 1995. “Effect of household, community and
school factors on the enrollment retention and achievement ofscheduled tribes children at primary level”. In School Effectiveness and
Learning Achievement at Primary Stage: International Perspective, NCERT,.
AMBASHT, N. K. 1970. A Critical Study of Tribal Education , New Delhi, S.
Chand & Co., pp. 61-69.
AURORA G.S. 1972. Tribe, Caste, Class Encounters, Administrative Staff Collegeof India, Hyderabad.
AWASTHI, B.P. 1987. “A study of the Inter-relationship between education of
the scheduled tribes and their socio-economic mobility, Independent
study”. NCERT.

A Study of Academic and Infrastructural Input...
Indian Educational Review, Vol. 51, No.1, January 2013 89
BEST, JOHN. W. AND KHAN, JAMES, V.1992. Research in Education. Prentice Hall
of India Pvt. Ltd., New Delhi.
BEST, J.W. AND KAHN,J.V. Research in Education. Prentice-Hall of India Ltd.,
New Delhi, 1989.
BHATNAGAR, S. Kothari Commission Recommendations and Evaluation on National
policy on Education. Moti Barar Deharadun Publications, Deharadun,
1983.
BIHARI, L.R. 1991. Wastage and stagnation in primary education among the
tribals. Tribal Research and Training Institute, Gujrat Vidyapath,Ahmedabad.
BLACK, JAMES A. AND CHAMPION, DEAN J. 1976. Methods in Social Research. John
Wiley & Sons, Inc., New York.
BOOCOCK'S 1971. The Encyclopedia of Education V4,
BROWN, F. J. 1961. Educational Psychology, Asia Publishing House, pp. 185.
BUCH, M.B.(Ed). Fifth Survey of Research in Education. NCERT, New Delhi,
1988-92.
BUCH,M.B.(Ed). Fourth Survey of Research in Education .Vol.1, NCERT, New
Delhi, 1983-88.
BUCH,M.B.(Ed). Third Survey of Research in Education. NCERT, New Delhi,1978-83.
CENSUS 2001(India). Primary Census Abstract.
CENSUS 2011(India). Primary Census Abstract.
CENSUS OF M.P 2001. State Primary Census Abstract for SC's.
CENSUS OF M.P 2011. State Primary Census Abstract.
CHATTERJEE ,S.K. Educational Development of Scheduled Castes. Gyan
Publishing House, New Delhi, 2000.
CHAUHAN, C. Modern Indian Education. Kanishka Publishers, Distributors,
New Delhi, 2004.
CHOUDHARY, ARINDAM. 2006. Empower them, Give them Education not Reservation,
Business and Economy.
CHOUDHARY, MALAY . 2006. The Great Indian Dream. IIPM
CHOUDBURY, B.Ed. 1982. Tribal Development in India: Problems and Prospects.
Inter India Publications, Delhi, pp. 403-8.
COLEMAN, J.S, eL al. 1969. Educational Research for Tomorrow's School. MacMillan Company, National Academy of Education, 227 pp.
COOK, D.R. AND N.K. LAFLEUR. 1975. A Guide of Educational Research. Boston:
Allyn and Bacon, Inc.
CURIE ADAM. 1962. “Some Aspects of Educational Planning in Underdeveloped
Areas”. Harvard Educational Review, Vol. 32, No. 3. pp. 300.
DREZE JEAN. 1999. “For basic Education to all”. Frontline, Feb. 12.

A Study of Academic and Infrastructural Input...
Indian Educational Review, Vol. 51, No.1, January 201390
DURKHEIM E. 1956. Sociology and Education, New York: Amerirwah Book Comp.
ENGLEHART, M.D. 1972. Methods of Educational Research, Chicago : Rand Me
Nally and Company.
FATMI,R.S. “A study of achievement related motivation among tribal andnon-tribal high school students”. Ph.D.(Psy), Magadh University,1986.
FELD HUSEN J.F. AND KLAUSMEIR H.J. 1962. “Anxiety, Intelligence and
Achievements in Children of low, average, and high intelligence', Child
Development”, 33, pp. 403-409.
FISHER, R.A. 1936. Statistical Methods for Research Workers. Edinburg : Oliverand Boyd.
FRIEND M.H. “On the concepts of Tribe and Tribal Society, in Essays on the
problem of Tribe” (ed) J.
G. SAMANT. 1966. The Marking of Educational Research. Bombay :Popular
Prakashan, 92 pp.
GARREET, E. HENERY. 1981. Statistics is Psychology And Education. Feffer and
Simons Ltd., Mumbai.
GAUR, J.S. Psychological Basis of Educational and Vocational Development of
Scheduled Castes Students. NCERT, 1988.
GAUTAM, R. “A study of creativity, values, educational achievement, andattitude towards education among scheduled castes and other castes
students”. Ph.D. (Edu), Agra Univ., 1990.
GOOD W.J. AND HATT P.K. 1952. Methods in Social Research. M.C. Graw Hill
Kogakusha L.T.D., New York.
GOOD. V.C 1973. Dictionary of Education. New York, McGraw Hill Book Co.
GUPTA, B.S. “Comparative study of educational achievement of scheduled
castes and scheduled tribe students of Class X of Uttar Pradesh”.
NCERT,1988.
HALSEY, A. H. 1970. “The Sociology of Education” in N. J. Smesler (edt).
Sociology : An Introduction. New Delhi, Wiley Eastern, pp. 414.
HENRY, E. GARRETT. 2004. Statistics in Psychology and Education . Paragon
International Publishers, New Delhi.
IGNOU. Indian Journal of Open Learning. Vol. 7, No. 3, New Delhi, Sept.
1998.
IINDQUIST, E.F. 1970. Statistical Analysis in Educational Research. Calcutta
JADAV, S.K. 1981. “A study of the Scheduled Caste awareness about the
schemes for their educational progress”, Ph.D. unpublished thesis,
M.S.U.
JAIN, V. “A study of the interests and values of school students belonging to
Scheduled Castes and backward classes”. Ph.D.(Edu), Agra Univ., 1988.
JOSHI, S.D. 1980. “Educational problems of the schedules caste and scheduled
tribes of Borada district”, Ph.D. unpublished thesis, Maharaj Sivajirao
University.

A Study of Academic and Infrastructural Input...
Indian Educational Review, Vol. 51, No.1, January 2013 91
KAKKAR, S.B. “The personality characteristics and educational problems of
scheduled castes students”. Punjab Univ., 1990.
KRISHNAN, SUJAYA . DPRP calling Ministry of Human Resource Development
(Department of Education) Printed Nikliil Offset, New Delhi. January,1997.
KUMAR,G. AND S INGH, S. “A study on different dimensions of creativity in
relation to locality of scheduled caste and non-scheduled caste students”.
Journal of Psychological Researches . Vol. 24, 1999.
LINGUIST, E.F. Statistical Analysis in Education Research. New Delhi, Oxfordand I.B.H. Publishing Co. ,1968.
M.H.R.D. Base Statistic on Literacy and Primary Education. NIEPA. New
Delhi S1993.
M.H.R.D. Programme of Action National Policy on Education 1986. New Delhi,
1986
MITTAL, S. “A comparative study of the self-concept and personality factors
of scheduled castes and non-scheduled castes students”. Ph.D.(Edu),
Agra Univ., 1990.
N.C.E.R.T. Education for Indian Emerging Society. N.C.E.R.T. 1987.
NAYAL B.K. Physiology' for the Elementary School Teacher. 1986.
NCERT.1964. Internist in Teaching. NCERT, New Delhi.
NCRRT. 1991. Secondary Teacher Education Curriculum - Guidelines and
Syllabi. New Delhi.
PAL, R. “A comparative study on personality patterns of scheduled caste
and high caste students in the stste of Haryana”. Ph.D. (Edu) KarnatakaUniv., 1984.
PANDEY M.M. Principle of Education. Vinod Pustak Mandir, Agra, 1990.
PANDEY, R.S.1992. National Policy on Education in India. Horizon Publisher,
Allahabad.
PANDEY, R.S. Universalisation of Elementary Education . Prakash Publication,Pvt. Ltd.. 1994.
R.N. TRIVEDI 1993. Research Methodology. College Book Dept, Jaipur.
S.C.E.R.T. Rajiv Gandhi Shiksha Mission Do sal. Coronet Printing House Pvt
Ltd., 1996.
S.S.KAPUR. Principles and Methods of Education. Panel Publication, GopalNagar, Punjab. 1984.
SARGENT, S. S. AND WILLIAMSON, R. C. 1956. Social Psychology: An Integrative
Interpretation. New York.
SC/ST WELFARE DEPTT. Prashasanik Prativedan-2008-09
SC/ST WELFARE DEPTT. Prashasanik Prativedan-2009-10
SEDWAL, MONA AND KAMAT SANGEETA. 2008. Education and Social Equity: With
Special Focus on Scheduled Caste and Scheduled Tribes, CREATE,
Brighton,UK

A Study of Academic and Infrastructural Input...
Indian Educational Review, Vol. 51, No.1, January 201392
SHARMA, R.A. Shiksha Anushandhan. R.Lal book Dipo, Merit, 1993.
SHARMA, R.A. Vidhyalay sangathan avom shiksha prasasan. Surya Publication,
Merit, 1995.
SHARMA,Y. Sociological Philosophy of Education. Kanishka Publishers,Distributors, New Delhi, 2004.
SIDHL R.S. Methodology' of Research in Education , New Delhi, Sterling
Publishers, Pvt. Ltd., 1985.
SUJATHA, B.N. AND YESHODHARA, K. A comparative study of some educational
variables of SC/ST students . Department of Education, MysoreUniv.,1986.
VYAS, U. “A comparative study of the academic achievement of scheduled
caste and non-scheduled caste students in relation to self-concept and
locus of control”. Ph.D. (Edu), Agra Univ., 1992.
YOUNG, P. V. 1966. Scientific Social Surveys and Research. Prentice Hall Inc.,4th. Edu., pp. 119-131.
Websites visited
http://mp.gov.in/tribal
www.ncert.nic.in
www.socialjustice.nic.in
en.wikipedia.org

Defence Mechanism Styles and Personality Types among Adolescents
Indian Educational Review, Vol. 51, No.1, January 2013 93
Defence Mechanism Styles and Personality
Types among Adolescents
REENA GEORGE*
ABSTRACT
Defence mechanisms are behavioural strategies adopted by an
individual to reduce anxiety and enhance one's sense of well-being.
They establish illusory mastery over perceived threats, when real
mastery is impossible. The defence mechanism style adopted by an
individual may be influenced by one's personality. In the present study,
five defence mechanisms styles viz., Aggressive, Projective,
Intellectualising, Intrapunitive and Repressive, were analysed in relation
to the Personality Types viz., Type-A and Type-B, among adolescents
studying in the secondary and higher secondary schools of Kerala.
The findings revealed that adolescents belonging to different Personality
Types adopt significantly different styles of defence mechanisms.
Adolescents having Type-B Personality were found to adopt
'Intellectualising Style' and 'Repressive Style', whereas adolescents
belonging to Type-A Personality adopted 'Aggressive Style', 'Projective
Style' and 'Intrapunitive Style'.
Introduction
Often when we cannot solve our problems effectively we employ avariety of defence mechanisms toward off intense states of panic ora further build-up of anxiety. These, defence mechanisms allownegative feelings to be lessened without an alteration of the situationthat is producing them, often by distorting the reality of that situationin some way. The primary function of defence mechanisms is to easethe acute discomfort of the emotions associated with frustration andunresolved motivational conflict (Coleman, 1960). Defencemechanisms do not eliminate the causes of strain, but rather theyhelp us to cope up with the emotional pain caused by that strain.
* Associate Professor of Education, Karmela Rani Training College, Kollam, Kerala,
India. This paper is based on a Minor Research Project financed by theUniversity Grants Commission.

Defence Mechanism Styles and Personality Types among Adolescents
Indian Educational Review, Vol. 51, No.1, January 201394
They often leave the underlying causes of strain and theaccompanying emotional reactions untouched. Thus, defencemechanisms are only psychological or behavioural devices adoptedto alleviate or avoid anxiety associated with strain.
Significance of the study
Defence Mechanisms are the means by which we adapt to thestresses of daily living. People are extremely sensitive to threats totheir ego or self-esteem. They erect barriers to protect themselvesfrom external threats, such as failures and disappointments andinternal threats such as guilt-arousing desires or behaviour, personallimitations, and real or imagined feelings of inferiority. Freud (1933)called these barriers as 'defence mechanisms', which areunconscious strategies for avoiding or reducing threatening feelings,such as fear and anxiety. Gleser and Ihilevich (1969) defined defencemechanisms as unconsciously motivated, involuntary reactions thatare activated whenever perceived threats are too painful to confrontconsciously. Often several defence mechanisms operate together toachieve a combination of many different forms of behaviours,attitudes, motives and emotions that characterise a particulardefensive style. The defensive responses to conflict/threats into fivestyles of defence mechanisms viz., Aggressive Style - which involvesthe expression of direct or indirect aggression; Projective Style - whichinvolves the attribution of negative intent or characteristics to otherswithout any evidence; Intellectualising Style - which falsifies realityby reinterpreting it through the use of a variety of general principles;Intrapunitive Style - which includes all intrapunitive attemptsemployed to falsify reality for the purpose of reducing perceived threatsto one's self-esteem and Repressive Style which involves responsesto internal or external threats, usually expressed in exaggeratedlycheerful emotions, and unduly positive behavioural responses. Thestudy of defence mechanisms has been a popular theme for researchabroad. The present study intends to compare the adolescentsbelonging to Type A Personality and Type B Personality with respectto the Defence Mechanism Styles adopted by them.
Procedure
The sample for the study, selected through 'Stratified RandomSampling Technique', giving due representation to age, gender andlocale, comprises of 1000 secondary school students, and 500 Higher

Defence Mechanism Styles and Personality Types among Adolescents
Indian Educational Review, Vol. 51, No.1, January 2013 95
Secondary school students of Kerala. The tools used for data collectionare Defence Mechanism Styles Inventory and Personality Type Inventory.
Analysis and Interpretation
Analysis of data to identify the defence mechanism styles ofadolescents in the Secondary and Higher Secondary Schools of Keralarevealed that adolescents in the age group 13-17 adopt different stylesof defence mechanisms. The defence mechanism styles adopted byadolescents, given in the order of preference, are IntellectualisingStyle (M=25.27; ? =3.09), Repressive Style (M=23.56; ? =5.28),Projective Style (M=19.22; ? =3.48) Intrapunitive Style (M=17.84; ?=2.75), and Aggressive Style (M=15.64; ? =4.77). Investigation of thePersonality Types of adolescents revealed that 21.87 per cent(N1=328) possess Type-A Personality and 78.13 per cent (N2=1172)possess Type-B Personality.
The adolescents belonging to Type-A Personality and Type-BPersonality were compared to find out whether the groups differsignificantly with respect to the five styles of defence mechanismsadopted by them. The two groups were compared by computingCritical Ratios for each style of defence mechanisms. viz., Aggressive,Projective, Intellectualising, Intrapunitive and Repressive. The detailsof the comparison are presented in Table-1.
Personality Types
Type-A (N1=328) Type-B (N
2=1172)
Defence Mechanism Styles M1 1 M2 2 Critical Ratio
Aggressive Style 14.31 4.16 13.07 3.5 4.93**
Projective Style 19.01 3.42 18.23 3.08 3.73**
Intellectualising Style 22.16 3.93 23.01 3.4 3.56**
Intrapunitive Style 18.13 3.03 17.11 2.9 5.44**
Repressive Style 23.32 4.20 24.81 3.66 5.83**
Table 1
Defence Mechanisms Styles of Adolescents with Type-A and Type-B
Personality
** Significant at 0.01 level
The critical ratios reveals significant difference between thesubsamples of adolescents having Type-A Personality and Type-BPersonality with respect to all the five styles of defence mechanismsviz., Aggressive Style (C.R=4.93; P<.01), Projective Style (C.R=3.73;P<.01), Intellectualising Style (C.R=3.56; P<.01), Intrapunitive Style(C.R=5.44; P<.01) and Repressive Style (C.R=5.83; P<.01). Thus there
Defence Mechanism Styles and Personality Types among Adolescents
Indian Educational Review, Vol. 51, No.1, January 201396
is significant difference between adolescents belonging to Type APersonality and Type B Personality with respect to the DefenceMechanism Styles adopted by them. Further adolescents with Type-B Personality is found to have higher mean scores for'Intellectualising Style' (M=23.01) and 'Repressive Style' (M=24.81),than adolescents with Type-A personality. Whereas adolescentshaving Type-A Personality have higher mean scores for 'AggressiveStyle' (M=14.31), 'Projective Style' (M=19.01) and 'Intrapunitive Style'(M=18.13) than adolescents with Type-B personality.
Implications
The findings of the study revealed that there is a significant differencebetween adolescents belonging to Type A and Type B Personalitieswith respect to the Defence Mechanism Styles adopted by them.Adolescents with Type-B Personality adopted Intellectualising andRepressive styles, whereas adolescents with Type-A Personalityadopted Aggressive, Projective and Intrapunitive styles, which areunhealthy. The findings of the study imply the need for conscientisingadolescents regarding the consequences of adopting unhealthydefence mechanisms and educate them to practice healthy styles ofdefence mechanisms. The study also recommends ConflictManagement Programme for adolescents in the Secondary and HigherSecondary Schools of Kerala.
REFERENCES
COLEMAN, JAMES C. 1960. Personality dynamics and effective behaviour. Chicago:
Scott, Foresman and Co.
FREUD, S. 1933. New introductory lectures on psycho analysis. New York:
Norton.
GLESER, G.C., AND IHILEVICH, D. 1969. An objective instrument for measuring
defense mechanisms. Journal of Consulting and Clinical Psychology, 33,
51-60.

Effect of Parental Support on Curiosity of School going Children
Indian Educational Review, Vol. 51, No.1, January 2013 97
Effect of Parental Support on Curiosity of
School going Children
SHABANA* AND KHALIDA BEGUM**
ABSTRACT
The present study examined the impact of parental support on curiosity
of school going children. By adopting the principle of stratified
proportionate random sampling technique, three hundred school going
children(19-14 years) were selected from various higher secondary
schools as sample from Durg district of Chhattisgarh. Standardised
tools used were parental support scale developed and standardised
by Nandwana and Asawa (1971) and children's curiosity scale
developed and standardised by Kumar (1992). For the statistical
analysis of data three way ANOVA was computed. The study revealed
significant main effects of Parental support and gender on children
curiosity but the main effect of type of school was found not to be
significant at 0.05 levels. Interactional analysis indicated significant
first and second order interaction effect of parental support, gender
and type of school which were found to be significant at 0.01 level of
significance.
Introduction
Curiosity can be interpreted as an individual's drive and readinessto seek out and resolve conceptual conflict (Beswick and Tallmadge,1971). Berlyne, 1960, Day et al, 1972 defined curiosity as a state ofincreased arousal response, promoted by a stimulus high inuncertainty and lacking in information, resulting in exploratorybehaviour and the search for information. Voss and Keller (1983)stressed that curiosity and the exploratory behaviour is importantto human development because it assist in the flexible adaptation tochanging environmental conditions and implies a direction ofdevelopment toward differential interaction patterns and more
* Assistant Professor, Education, Kalyan P.G. College, Bhilainagar, Chattisgarh
** Lecturer, Commerce, Bhilai Mahila Mahavidyalaya, Bhilainagar, Chattisgarh

Effect of Parental Support on Curiosity of School going Children
Indian Educational Review, Vol. 51, No.1, January 201398
effective problem solving. Maw and Maw (1961) found that highlycurious children remembered what they learned longer and learnedmore from a given exposure to information than less curious children.Curious youngsters achieve better than students with lower curiositylevels because of their exploration of events and objects for longerperiods of time and their use of many more senses. (Koran andLongino, 1982)
Positive parenting practices such as supporting children'scuriosity and expressing affection for the child are linked to theircapacity to self regulate their behaviours and emotions, as well as totheir cognitive and intellectual development (Deckard and Detrill,2004). Parents have both the opportunity and responsibility tonurture their children. (Hartog and Brosnan, 1994). If children wereallowed to be curious and to use their initiatives in pursuing curiosity,they would be more likely to construct knowledge and go onconstructing it. (Kamii and Daries, 1933). Children's creativity isbased on their natural inclination to look at the world with wonderand curiosity. If curiosity is discourage as child's curiosity withjudgment and criticism, the child eventually learns to mask thistrait. (Lampikouski and Emden, 1996).
Parental reinforcement and modeling foster children's curiosityand exploration (Saxe and Stollak, 1971). Vidler (1977) found thatboys and girls explored novel materials equally often, frequencieswith which the mothers showed exploratory behaviour, curiosityorienting behaviour and question answering were all correlated withchildren's exploration and question about the stimuli. Children whoare thwarted are hesitant to explore novel stimuli. Hunter, Ross andAmes (1982), Dooley (1921) noted negative impact on curiosity ofpoor care giving, parents failure to meet their needs at the criticaltime.
Some factors effect parental support like Weiss et al. (2003)showed how employment can serve as on obstacle to parentalinvolvement in their child's education. Symeou (2007) demonstratedhow socio economic status can facilitate and structure parentalparticipation.
There is difference in public and private schools in terms of subjectavailability, strictness of discipline, quality of facilities, academicachievement and the likely implications for their children's careeropportunities. Private schools generally have better teachers anddeliver a better education, smaller classes and provide moreindividual attention to students. Watts (1997) has revealed that a

Effect of Parental Support on Curiosity of School going Children
Indian Educational Review, Vol. 51, No.1, January 2013 99
teacher centred classroom prevents students from exploringinformation and thinking creatively and reflectively. Research showthat children come to school with many questions, but in time theircuriosity dies and they become silent listeners (Holt, 1982). Curiosityis an active component in learning with understanding. Childrenare curious about the world around them, school environment needto construct personal understanding in a setting that encouragesand nurtures questioning (Harlen, 1992) creating a friendlyenvironment and appreciating students efforts, helped students toovercome their fear of being worn and nurtured their innate curiosity(Biddulph and Carr, 1992). In the present study attempt has beenmade to study the effect of parental support, gender and type of schoolon curiosity of school going children.
Problem and Hypothesis
(1) To study the effect of parental support on the curiosity of schoolgoing children."There will be significant effect of parental support on the curiosityof school going children."
(2) To study the effect of Gender on the curiosity of school goingchildren. "There will be significant effect of gender on the curiosityof school going children."
(3) To study the effect of type of school on the curiosity of schoolgoing children."There will be significant effect of type of school on the curiosityof school going children."
Research Methodology
Survey model was adopted for the present study.
Participants
By adopting the principle of stratified proportionate random samplingtechnique three hundred school going children belonging to the agegroup ranging from 9-14 years were selected as sample from varioushigher secondary schools of Durg district of Chhattisgarh.
Measures
Standardised test adopted for the study were parental support scaledeveloped and standardised by Nandwana and Asawa (1971) and
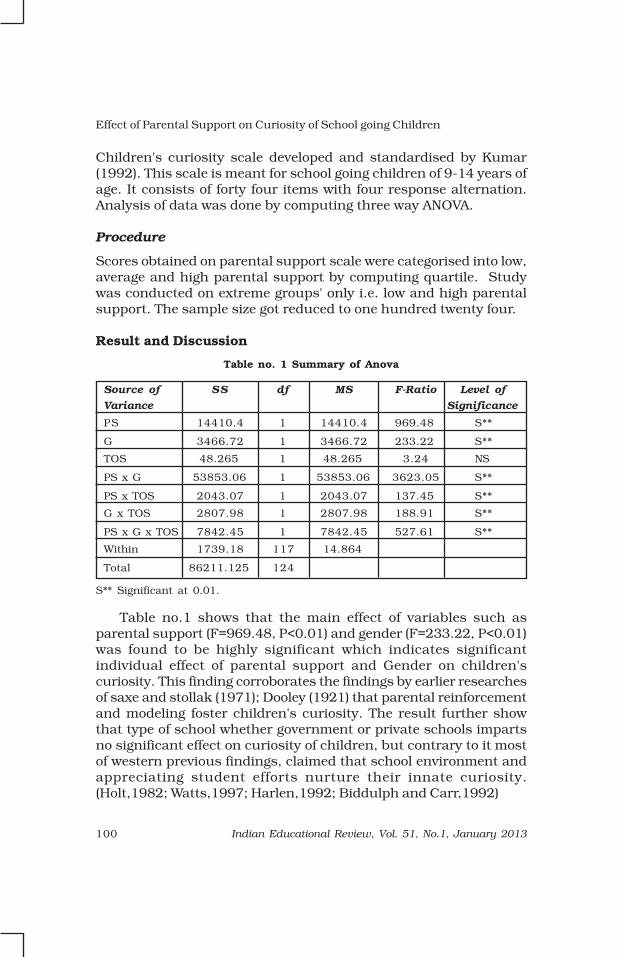
Effect of Parental Support on Curiosity of School going Children
Indian Educational Review, Vol. 51, No.1, January 2013100
Children's curiosity scale developed and standardised by Kumar(1992). This scale is meant for school going children of 9-14 years ofage. It consists of forty four items with four response alternation.Analysis of data was done by computing three way ANOVA.
Procedure
Scores obtained on parental support scale were categorised into low,average and high parental support by computing quartile. Studywas conducted on extreme groups' only i.e. low and high parentalsupport. The sample size got reduced to one hundred twenty four.
Result and Discussion
Table no. 1 Summary of Anova
Source of SS df MS F-Ratio Level of
Variance Significance
PS 14410.4 1 14410.4 969.48 S**
G 3466.72 1 3466.72 233.22 S**
TOS 48.265 1 48.265 3.24 NS
PS x G 53853.06 1 53853.06 3623.05 S**
PS x TOS 2043.07 1 2043.07 137.45 S**
G x TOS 2807.98 1 2807.98 188.91 S**
PS x G x TOS 7842.45 1 7842.45 527.61 S**
Within 1739.18 117 14.864
Total 86211.125 124
S** Significant at 0.01.
Table no.1 shows that the main effect of variables such asparental support (F=969.48, P<0.01) and gender (F=233.22, P<0.01)was found to be highly significant which indicates significantindividual effect of parental support and Gender on children'scuriosity. This finding corroborates the findings by earlier researchesof saxe and stollak (1971); Dooley (1921) that parental reinforcementand modeling foster children's curiosity. The result further showthat type of school whether government or private schools impartsno significant effect on curiosity of children, but contrary to it mostof western previous findings, claimed that school environment andappreciating student efforts nurture their innate curiosity.(Holt,1982; Watts,1997; Harlen,1992; Biddulph and Carr,1992)

Effect of Parental Support on Curiosity of School going Children
Indian Educational Review, Vol. 51, No.1, January 2013 101
Findings of Interactional Analysis
Table no.1 reveals that the interactional effect of parental supportand Gender (F=3623.05,p<0.01) was found to be significant, Findingsindicate significant interactional effect of parental support andGender on children's curiosity.
Graph no.1reveals that the mean curiosity score of male andfemale children with high parental support do differ significantlyfrom their counterparts with low parental support. This finding issupported by the findings of Hunter, Ross and Ames (1982); Vidler(1977). Further on examining mean curiosity score it was found thatfemale students are more curious than male students. In patriarchalform of society, girls are mostly suppressed, with parental supportin the form of resources, advice, social contacts, values etc. theyshow more exploratory behaviour, competences and other skills(Badony, J.2000)
The data in Table No.1 shows that there is significant interactioneffect of parental support and type of schools (F=137.45, p<0.01) onchildren curiosity.
Graph No. 2 reveals that the mean curiosity scores of childrenstudying in government and private schools having high parentalsupport were significantly higher than their counterparts havinglow parental support. The same is reported by Deckard and Detrill(2004), who found positive correlation between parental support andchildren's curiosity. Mean curiosity score further indicates thatgovernment school children with high parental support are more
Parental Support
Graph No 1: Showing Interaction Effect of Parental Support and Gender

Effect of Parental Support on Curiosity of School going Children
Indian Educational Review, Vol. 51, No.1, January 2013102
curious than their counterpart studying in private schools. The resultfurther shows that there is significant interaction effect of Genderand Type of Schools (F=188.91, p<0.01) on children's curiosity.
Mean curiosity scores depicted in Graph No.3 shows that childrenof government schools are more curious than private school children.On further examining the mean curiosity scores it was found thatfemale children are more curious than male children. But contraryto this George and Monsaas (1988) reported that their exist nodifference in curiosity of male and female students.
The data demonstrated in Table No.1furthur indicates significantinteraction effect of parental support, Gender and Type of School
Parental Support
Graph No. 2: Interaction Effect of Parental Support and Type of School
Type of School
Graph No. 3 : Interaction Effect of Gender and Type of School
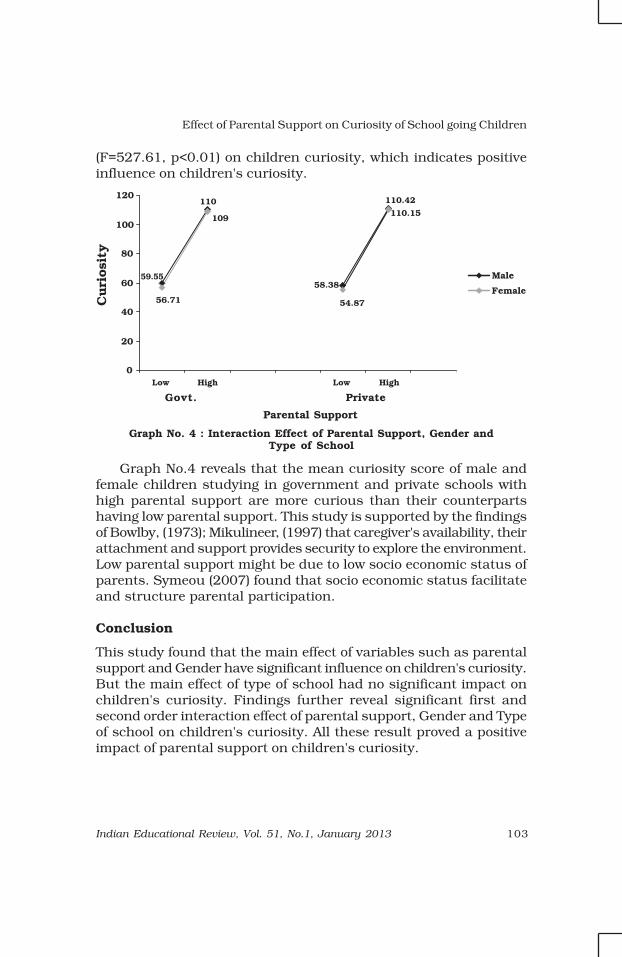
Effect of Parental Support on Curiosity of School going Children
Indian Educational Review, Vol. 51, No.1, January 2013 103
(F=527.61, p<0.01) on children curiosity, which indicates positiveinfluence on children's curiosity.
Govt. Private
Graph No.4 reveals that the mean curiosity score of male andfemale children studying in government and private schools withhigh parental support are more curious than their counterpartshaving low parental support. This study is supported by the findingsof Bowlby, (1973); Mikulineer, (1997) that caregiver's availability, theirattachment and support provides security to explore the environment.Low parental support might be due to low socio economic status ofparents. Symeou (2007) found that socio economic status facilitateand structure parental participation.
Conclusion
This study found that the main effect of variables such as parentalsupport and Gender have significant influence on children's curiosity.But the main effect of type of school had no significant impact onchildren's curiosity. Findings further reveal significant first andsecond order interaction effect of parental support, Gender and Typeof school on children's curiosity. All these result proved a positiveimpact of parental support on children's curiosity.
Parental Support
Graph No. 4 : Interaction Effect of Parental Support, Gender and
Type of School

Effect of Parental Support on Curiosity of School going Children
Indian Educational Review, Vol. 51, No.1, January 2013104
REFERENCES
BADONY, J. 2000. Building Family Strengths, cited in http://www-
extension.umnedu/distribution/family development.
BERLYNE, D.E. 1960. Conflict, Arousal and Curiosity. New York: McGraw Hill.
BESWICK, D.G., AND TALLMADGE, G.K. 1971. “RC examination of two learning
styles studies in light of the cognitive process theory of curiosity”. Journal
of Educational Psychology, 62, 456-462.
BIDDULPH, F., AND CARR , H. 1992 "Development in primary science: A newZealand Perspective" Evaluation and Research in Education, Vol. 6,
No. 2, PP 91-98.
BOWLBY , J. 1973. “Separation and Anxiety”. Attachment and Loss,Volume-II, New York.
DAY, H.I., MAYNES, F., AND SPRING, L. 1972. “Prior knowledge and the desire forinformation”. Canadian Journal of Behavioral Science 4(4),
330-337.
DECKARD, K., AND DETRILL, S.A. 2004. “Parent child dyadic mutuality andchild behaviour problems: An investigation of gene-environment
processes”. Journal of Child Psychology and Psychiatry and Allied
Disciplines, 45, 1171-1179.
DOOLEY, L. 1921. “A psychoanalytic study of manic depressive psychosis”.
Psychoanalytic Review, 8:38.
GEORGE ENGELHARD JR. AND MONSASS ANN JUDITH. 1988. "Grade level, Gender and
school related curiosity in urban elementary schools." The Journal of
Educational Research, Vol. 82, No. 1, pp 22-26, Taylor and Francis
Limited.
HARLEN, W. 1992. The Teaching of Science. London: David Fulton.
HARTOG, M.D., AND BROSNAN, P.A. 1994. “Doing mathematics with your child”.
Retrieved Sep. 20, 2000 on the www:http://www.ed.gov/databases.
HOLT, L. 1982. How Children Fail. Revised Edition, London: Pengain.
HUNTER, M.A., ROSS, H.S. AND AMES, E.W. 1982. “Preferences of familiar or
novel toys: Effect of familiarization time in 1 year olds”. Developmental
Psychology, 18, 519-529.
KAMII , C., AND DARIES, R. 1993. “Physical Knowledge in preschool educationimplications of piuget's theory”. New York: Teacher's College Press.
KORAN, J.J., AND LONGINO, S.J. 1982. “Curiosity and children's science learning”.
Science and Children, 20, 18-19.
KUMAR, R. 1992. Childrens Curiosity Scale. Ankur Psychological Agency, Indira
Nagar, Lucknow.
LAMPIKOUSKI, K., AND EMDEN, J.B. 1996. Igniting innovation: Inspiring organizations
by managing creativity. New York: John Wiley and Sons.
MAW , W.H., AND MAW, E.W. 1961. “Non-homeostatic experiences as stimuliof children with high curiosity”. California Journal of Educational Research,
12(2) 57-61.

Effect of Parental Support on Curiosity of School going Children
Indian Educational Review, Vol. 51, No.1, January 2013 105
MIKULINEER, M. 1997. “Adult attachment style and information processing.
Individual differences in curiosity and cognitive closure”. Journal of
Personality and Social Psychology, 72, 1217-1230.
NANDWANA, S., ASAWA, N. 1971. Parental Support Scale. National PsychologicalCorporation, Kacheri Ghat, Agra.
SAXE, R.M. AND STOLLAK, G.R. 1971. Curiosity and parent-child relationship.
Child Development, 45, 892-902.
SYMEOU, L. 2007. “Cultural capital and family involvement in children's
education: Tales from two primary schools in Cyprus”. British Journal
of Sociology of Education, 28(4), 473-87.
VIDLER, D.C. 1977. “Motivation in Education New York, Academic Press, Voss,
H.G. (1987) Possible distinctions between exploration and play in
curiosity, imagination and play”. London, Lawrence Elboum Associates.
VOSS , HANS-GEORGE, AND KELLER, H. 1983. Curiosity and Exploration Theories
and Results. New York: Academic press.
Watts, M. (1997) "Promoting teachers constructive reflection: Pupils
questions as critical incidents." International Journal of Science Education,
Vol. 9, pp. 1025-37.
WEISS, H.B., MAYER , E., KREIDER, H.J., VAUGHAN, M., DEARING, E., HENCKE, R.,AND PINTO, K. 2003. Making it work: Low-income working mother's
involvement in their children's education 'American Education Research
Journal, 40 (4), 879-901.

How Proficient are Class V Students in Language?
Indian Educational Review, Vol. 51, No.1, January 2013106
How Proficient are Class V Students
in Language?
SANTOSH KUMAR*, MAMTA AGARWAL** AND MANIKA SHARMA***
ABSTRACT
National Council of Educational Research and Training conducted the
National Achievement Survey at Class V in the year 2010 to find out
the achievement level of students in different subjects (Language,
Mathematics and Environmental Studies). In this paper the achievement
of students in language especially in reading comprehension has been
presented. The tests used for measuring the achievement consisted of
three booklets containing different kinds of reading texts with multiple
choice items on each text. The items were spread across the whole
range of cognitive processes involved in reading comprehension. The
responses of students to the various items were analysed using Item
Response Theory.
The paper shows how the Class V students performed on the reading
comprehension items of various different levels and testing various
reading abilities. It was found that Class V students in India are at
different levels of language proficiency and that the teachers need to
work on developing the competence of their students in reading different
varieties of texts.
Introduction
This paper is based on the findings of the National AchievementSurvey (NAS) of Class V students conducted in 2010 by the NationalCouncil of Educational Research and Training (NCERT) through itsDepartment of Educational Measurement and Evaluation (DEME)(Singh, et al., 2012). The final report was published by NCERT andsupported by SSA– Technical Cooperation Fund in 2012. The surveywas conducted through tests and questionnaires administered to a
* Associate Professor, Educational Survey Division, NCERT, New Delhi** Consultant, Sarva Siksha Abhiyan-Technical Co-operation Fund-Technical
Services Agency, NCERT, New Delhi*** Consultant, Educational Survey Division, NCERT, New Delhi

How Proficient are Class V Students in Language?
Indian Educational Review, Vol. 51, No.1, January 2013 107
sample comprising 1,22,543 students in 6,602 schools across 31States and Union Territories (UTs). The subjects covered wereMathematics, Language (including Reading Comprehension) andEnvironmental Studies (EVS). In this paper the achievement ofstudents in Language especially in Reading Comprehension has beenfocused.
Reading Comprehension
The reading comprehension tests given to Class V students consistedof three test booklets, each containing four reading passages withfive multiple-choice items on each passage. The passages were chosento represent a range of text types including informational passages,tables, public notices, and stories (Bhaduri and Singh, 2011). Threereading passages were common across all test forms. These servedas 'anchors' so that the different test booklets could be linked togetherand, hence, all items could be placed on a common scale. In addition,each test form contained an extra, unique passage. Thus, altogetherthe reading comprehension instruments used in the surveycomprised six passages with thirty items based on them.
The items were designed to test a range of relevant cognitiveprocesses or 'reading skills'. These are classified as 'locateinformation', 'grasp ideas and interpret' and 'infer and evaluate' asdefined in the box given below:
Cognitive Processes for Reading Comprehension
Locate information: In items testing this process, students need to find andextract a specific piece of information explicitly stated in the text. 'Locating'
requires students to focus on a specific element of the given piece.
Grasp ideas and interpret: In items testing this process, students need to
demonstrate that they have understood an idea being conveyed in the text
and have interpreted it correctly. For example, students may need to identifythe text's main idea and/or the sequence of events and/or relationships
between ideas, events, or characters across the text. In addition, studentsmay need to draw simple conclusions based on their interpretation of the
text.
Infer and evaluate: In items testing this process, students need to demonstrateunderstanding beyond the information and/or ideas stated explicitly in the
text. They are asked to read between the lines and, for example, makeinferences about the qualities or actions of characters. They may be asked
to identify the text's underlying theme and/or evaluate its title by examining
the text from more than one perspective.
(Source: National Achievement Survey - Class V (2012))

How Proficient are Class V Students in Language?
Indian Educational Review, Vol. 51, No.1, January 2013108
Putting the reading comprehension items on a continuum of
difficulty
The responses of students to the various items were analysed usingItem Response Theory (Hambleton and Swaminathan, 1985). Thethree test forms were linked using the anchor items so that all itemscould be placed on a single reading comprehension scale comprisingscores from 0 to 500. On this scale, the mean score was set at 250with a standard deviation of 50. Calibrating the items according totheir levels of difficulty places them on a continuum with the moredemanding items at the top and the easiest items at the bottom.This continuum gave us a picture as to what students at differentlevels of language proficiency knew and could do.
The continuum for reading comprehension consisted of total thirtyitems. However, for the purpose of this paper only the scale values offifteen anchor items are given. The scale score in the first columnshows the level of difficulty for each item. The table also includes thecognitive process being evaluated and a brief description of whatstudents needed to do to answer the item correctly.
Scale Mental Processes Question Description
Score
285 Grasp ideas/ Identify relationship between an abstract ideainterpret and a concrete phenomenon
279 Grasp ideas/ Use information from a notice to concludeinterpret timing of an event
279 Locate Identify the correct place name from those
given in the notice
274 Locate Use information from a table to determine the
frequency of an event
265 Grasp ideas/ Identify relationship between an object and its
interpret characteristics
264 Grasp ideas/ Determine the sequence of activities in ainterpret process
252 Grasp ideas/ Use information from the notice to derive theinterpret duration of an event
250 Locate Use information from a table to determine the
frequency of an event
246 Grasp ideas/ Use information to draw simple conclusion
interpret about the usefulness of an object
Table 1 Continuum of Reading Comprehension

How Proficient are Class V Students in Language?
Indian Educational Review, Vol. 51, No.1, January 2013 109
244 Grasp ideas/ Use information in the text to identify theinterpret ingredients of an object
244 Locate Use information in a table to identify the mostfrequent event
231 Infer/evaluate Use information from a notice to make a simple
inference about the participation in a sport
217 Grasp ideas/ Recognise the text type as a notice from the
interpret format and the content
213 Locate Use information in a table to identify the time
for a phenomenon
203 Locate Use information in a table to identifyphenomena occurring at a particular time
The table shows that Class V students demonstrate a wide rangeof ability in the domain of Reading Comprehension.
Students at the lower end of the scale i.e. those with scale scoresin the range of, say, 200 to 240 can demonstrate all three cognitiveprocesses–provided that the context is clear and the tasks non-complex. For example, they are able to use information from a table,to locate the time and the occurrence of a phenomenon and alsorecognise the text type.
Students performing in the intermediate range of the scale (say,240 to 275) can do more. In addition to that described above, theycan determine the frequency, duration and sequence of eventsdescribed in a variety of texts. They can also identify relationshipbetween an object and its characteristics, identify the ingredients ofan object and can draw simple conclusions about the usefulness ofan object.
Students performing at higher end of the scale i.e. those withscale scores above, say, 275 can do more. In addition to that describedabove, they can identify the correct place name and timing of anevent from a notice and can also identify relationship between anabstract idea and a concrete phenomenon.
It may be mentioned here that the cognitive processes for readingcomprehension as described above operate at all the three levels oflanguage proficiency e.g. though locating information may be a verybasic ability of reading, but it can also have a higher difficulty leveldepending upon the complexity of the reading text presented to thestudents. Similarly, inference is a higher reading ability but simpleinference works at easy or basic level. Thus all the three cognitive
(Source: National Achievement Survey - Class V (2012))

How Proficient are Class V Students in Language?
Indian Educational Review, Vol. 51, No.1, January 2013110
processes operate at all the three levels of difficulty i.e. basic,proficient and advance. The following table indicates that the itemtesting locating information with the scale value 279 is at a higherlevel of difficulty even though it just requires the students to locatea place name from the text. Similarly, the item testing inferencewith scale value of 231 is at the lower level of difficulty, though itrequires the students to draw a simple inference about theparticipation in a sport.
What majority of students can and cannot do in different States
of India?
It has already been mentioned what the students performing atdifferent levels of the scaled scores of the reading comprehensionitems can do. One of the reading texts in the reading comprehensiontest was a notice which is generally put up in a school on the noticeboard. The purpose of this text was whether the Class V studentswere able to read and understand the information given in the notice.Five questions were asked in the test based on the notice. Thequestions tested various cognitive processes i.e., locating information,grasping ideas/interpreting, and inferring/evaluating. Theperformance of the students across the States/UTs on the fivequestions in terms of per cent correct is given in the following table.
States/UTs Locate Grasp ideas/interpret Infer/
evaluate
Item No. 5 Item No. 1 Item No. 3 Item No. 4 Item No. 2
Andhra Pradesh 46 68 31 49 54
Assam 43 60 36 55 49
Bihar 26 52 32 38 45
Chandigarh 25 63 37 41 58
Chhattisgarh 36 58 39 33 44
Daman & Diu 49 75 29 49 64
Delhi 47 74 50 54 60
Goa 30 57 35 47 62
Gujarat 51 66 33 51 70
Haryana 42 60 38 39 57
Table 2: Percentage of Students doing the items correctly on Reading
Comprehension
(A Notice) across the states/UTs

How Proficient are Class V Students in Language?
Indian Educational Review, Vol. 51, No.1, January 2013 111
Himachal Pradesh 42 60 37 40 55
Jammu & Kashmir 42 62 43 58 60
Jharkhand 39 61 36 42 48
Karnataka 53 65 49 61 67
Kerala 29 87 57 50 66
Maharashtra 54 70 48 61 72
Meghalaya 26 59 33 42 53
Mizoram 29 77 52 42 70
Madhya Pradesh 49 65 40 51 61
Nagaland 36 56 35 52 53
Odisha 44 53 35 60 51
Pudducherry 29 45 17 30 47
Punjab 34 53 43 42 62
Rajasthan 51 64 44 54 65
Sikkim 20 52 23 45 55
Tamil Nadu 62 69 44 65 68
Tripura 44 66 43 54 57
Uttar Pradesh 63 74 61 69 73
Uttarakhand 41 54 34 38 49
West Bengal 52 60 41 56 58
Average (%) 41 63 39 49 58
Locate Information
Locating information from the given text is one of the very basicreading abilities. However, from the data, it can be seen that Class Vstudents found it difficult to locate the name of the town from thenotice as overall only 41 per cent students could do this correctly.The range of per cent correct was from 63 per cent for Uttar Pradeshto 20 per cent in Sikkim. Only in the states of Uttar Pradesh, TamilNadu, Karnataka and Maharashtra more than 50 per cent studentscould locate the correct information. One of the reasons for students'inability to answer this item may be that they didn't know how toread the given address.
Grasp Ideas/ Interpret
The data indicates that under the cognitive process of grasp/interpretoverall 63 per cent students could recognise the text type as a noticefrom the format and the content. As far as the performance across

How Proficient are Class V Students in Language?
Indian Educational Review, Vol. 51, No.1, January 2013112
the states is concerned the range on this item was from 45 per centin Puducherry to 87 per cent in Kerala. Only in Delhi, UP, Damanand Diu, Maharashtra, Kerala and Mizoram more than 70 per centchildren were able to do this item correctly.
In the cognitive process of grasp/interpret, one item was to knowwhether the students could derive the duration of an event from thegiven information. To this item overall 49 per cent students wereable to respond correctly. As far as the states are concerned UttarPradesh had the highest per cent correct (69 per cent) and the lowestwas 30 per cent for Puducherry. In the states of Uttar Pradesh, TamilNadu, Maharashtra, Karnataka and Odisha 60 per cent or morechildren could answer this item correctly.
To conclude, the timing of an event was another item in thecognitive process of grasp/interpret. This item proved to be quitedifficult for Class V students as only 39 per cent students were ableto answer it correctly. In Uttar Pradesh, however, 61 per cent studentswere able to do it. Besides in the states of Kerala, Delhi and Mizorammore than 50 per cent students responded to this correctly.
Infer/Evaluate
Inference is one of the higher reading abilities and there was oneitem in the test for testing simple inference about the participationin a sport. Overall 58 per cent students could infer the idea from theinformation given in the notice. In states like Uttar Pradesh,Maharashtra, Tamil Nadu, Karnataka, Mizoram and Gujarat morethan two third of the students could do this item correctly.
Sum Up
It may be summed up from the above that Class V students in Indiaare at different levels of proficiency in language. Whereas moststudents found it difficult to workout the timing of an event, to locatethe place name from the given notice, more than 50 per cent of themwere able to make simple inference about the participants in a sport.A large number of students (63 per cent) could recognise the texttype as a notice. Overall, it may be concluded that the teachers needto work with their students to develop their competence in readingat different levels. This can be done by presenting the students withunseen texts of different varieties and asking them to read,understand and answer the given questions. The problems in readingoccur due to the fact that most of the language testing in our country

How Proficient are Class V Students in Language?
Indian Educational Review, Vol. 51, No.1, January 2013 113
is textbook based and only tests recall of information from the seentexts. As a result of the students have no opportunity to negotiatethe unseen texts on their own. If they are made to read differentkinds of reading texts often during an academic session, they wouldcertainly been able to perform better on reading comprehension.
REFERENCES
AVTAR S INGH et al. 2012. National Achievement Survey-Class V, NCERT, New
Delhi.(Available online on: http:// www.ssatcfund.org/ LinkClick.aspx?fileticket= TEJBnXMcOiQ%3d&tabid=2508)
BHADURI, I. AND SINGH, A. 2011. “Learning Levels of Grade V Students in
Language”. Paper presented in 37th Annual Conference on Assessment
and the Challenge of Globalisation by IAEA at Manila.
HAMBLETON, R. AND SWAMINATHAN, H 1985. Item Response Theory: Principles and
Applications. Boston: Kluwer-Nijhoff.

Assessing the Effectiveness of Individualised...
Indian Educational Review, Vol. 51, No.1, January 2013114
Assessing the Effectiveness of
Individualised Integrated Intervention
Strategies to Turn Around Slow Learners:
An Experimental Study
DR. S. SUBRAMANIAN *
Executive Summary
Slow learners are those children who are low in achieving academicskills and often ignored by others as dull, lazy or inept in the schoolsetting. Slow learners lag behind other students not only in academicsbut also in social, emotional and psychological well-being. It hasbeen estimated that 5 to 15 per cent of school going children suffer
from scholastic backwardness. The early identification of studentswho are at risk for educational failure is an important process thatdeserves much attention and research.
Although they have no intellectual disability, no identifiableneurological impairments and no learning disorders, slow learnersperform poorly in school and exhibit discrepancy between expectedachievement based on their intellectual ability assessment scoresand actual achievement. As children advance in school, there is acorresponding increase in difficulty of school subjects andassignments. Thus, children's performance depends progressivelymore on their motivation to sustain an active commitment to andefforts towards self-regulated learning
Proportionately these problems affect slow learners more oftenthan children labeled mentally retarded. A general educationteacher's decision on not providing any extra help to a slow learnerhas lifelong consequences. This group constitutes approximately14.1 per cent of the population based on estimates from normaldistribution. This warrants intervention training that can help slowlearners to reach as close to normal development as possible. Keeping
* Principal Investigator, Professor and Head , Department of Psychology, Bharati.

Assessing the Effectiveness of Individualised...
Indian Educational Review, Vol. 51, No.1, January 2013 115
in mind all the above facts, an Integrated Intervention basedexperimental study was proposed to assess the ways in which asignificant gain in academic performance of slow learners can be realised.
A Pretest Posttest Randomised Control Group Experimental GroupResearch Design was followed to assess the effects of the IntegratedInstruction on the academic performance and other psychologicalindices of slow learners.
(i) Experimental Group: The total sample comprised of 60 slowlearners as Experimental Groups studying in 9th standard inGovernment High School who were given an exposure to aspecially designed integrated intervention programme for theduration of six weeks period of time.
(ii) Control Group: Another group of 60 slow learners of 9thstandard drawn from the same school were kept as controlgroup. No such exposure to intervention would be given forthis group.
In order to have the homogeneity in the sample size, they werematched for age, gender, IQ, mother tongue, socio-economic statusetc. The slow learners were selected using the following threescreening methods based on their academic performance, teachers
report and IQ test.(i) Academic Performance: Only those students who scored less
than 50 per cent of marks in all the subjects consistently forthe first monthly and quarterly examination were selected.
(ii) Teachers' Assessment: Teachers' ratings on children's overallperformance in classroom and those who were found to bedull or below average were identified as slow learners.
(iii) Intelligence Tests: The Standard Progressive Matrices (SPM)developed by Raven (1988) was used to assess the level ofintelligence. The students who scored below 25th percentilewere categorised as slow learners.
Nature of Integrated Intervention
A Three Tier Individualised Integrated Intervention Programme
A three-tier mutually supportive Integrated Intervention programmewas administered to the slow learners.
I. Individual Skill Development Programme
The following three types of activities such as graphic organiser,mindfulness meditation and mnemonics which had been designed

Assessing the Effectiveness of Individualised...
Indian Educational Review, Vol. 51, No.1, January 2013116
exclusively to address the specific needs of the slow learners suchas memory improvement, goal setting, and overall study skillsimprovement were administered between 3.30 and 5.00 pm for theperiod of 12 weeks.(a) Graphic Organiser Method: Graphic Organisers were constructed
using 'XMind' and 'Microsoft Smart Art' for Biology and Historybased on the lessons that were taught to them in their regularclasses. Only the slow learning students in experimental groupwere provided these graphic organisers as an additional academicinput. Participants received instruction for a period of 12 weeks.The intervention was given for 40 minutes daily.
(b) Mindfulness Meditation: The meditation programme was given in20 minutes sessions per day for 12 weeks. The interventionprogramme consisted of learning the mindfulness technique andpracticing daily for 20 minutes even on holidays at home. Themindfulness strategy was intended to facilitate emotional controland adjustment.
(c) Mnemonic Strategies: The slow learners were introduced to threemain mnemonic strategies, namely, the method of loci, the lettermethod and the keyword technique to improve their memorisingskills with suitable examples and techniques. These were givenexclusively to the experimental group of slow learners.
II. Mentor Training for Teachers (Conveying positive expectationto slow learners)
This programme was aiming at changing teacher's attitude towardstheir students of slow learners in the areas of (i) acceptance, andsupports to slow learners (ii) rewards or appreciation fordemonstrating acceptable behaviours of slow learners and(iii) conveying positive expectations to slow learners and not biasedby past events. A three day workshop was organised to impart thesebehavioural science inputs to the concerned teachers.
III. Relaxation Training for increasing Concentration
Jacobson's Progressive Muscle Relaxation therapy was administeredto slow learners to improve their concentration in their subjects. Insummary, the overall intervention was aiming at eliciting more effortfrom the slow learners and their mentors to gain required knowledgeand skills to master their subjects.

Assessing the Effectiveness of Individualised...
Indian Educational Review, Vol. 51, No.1, January 2013 117
Measures
The following instruments were used to collect data for the study:• The Ravens Standard Progressive Matrices (SPM) (Raven, 2000 a)• Objective Academic Performance collected from the school records• Academic Self-Efficacy scale developed by Muris (2001)• Harter's Self-Perception Profile (Harter, 1985) to assess Self-
Perception• Child Behaviour Scale developed by Ladd and Profilet (1996) to
assess Socio-emotional adjustment• Malhotra's Temperament Schedule (MTS) developed by Savita
Malhotra and Anil Malhotra (1988).• Intrinsic Motivation Inventory (IMI) developed by Ryan (1982)
Methods of Data Collection
Phase I: Pre-test Data Collection: The Pre-test was carried outduring the months of August/September 2011.
Phase II: Administration of a Three Tier Integrated Intervention
Programme: A three-tier mutually supportive Integrated Interventionprogramme was administered to the Experimental Group of SlowLearners during the period of October 2011 – January 2012 tostudents, parents and their teachers.
Phase III: Post-test Data Collection: Soon after the completion ofIntegrated Intervention programme given exclusively to theexperimental group of slow learners for about 12 weeks period, theacademic performance of both the experimental group and controlgroup in their annual examination was collected along with otherpsychological criteria factors. For this purpose, once again, theconcerned teachers, parents, and the respondents were requestedto furnish data on the same parameters such as academic self-efficacy, self-perception, socio-emotional adjustment, temperament,intrinsic motivation, and academic performance levels using the samequestionnaire/inventory as in phase I.
The data of the gain score acquired by the experimental groupand control group of slow learners were compared using anindependent sample t test to ensure that the effects of the IntegratedIntervention were significant and specific to the experimental groupof slow learners. In addition to the test of significance, effect sizeswere calculated to measure the relative magnitude of the experimental
Assessing the Effectiveness of Individualised...
Indian Educational Review, Vol. 51, No.1, January 2013118
treatment using Cohen's d. Based on the analysis, the followingconclusions were drawn:
(i) Academic Performance: As expected, the IntegratedIntervention strategy in addition to conventional classroomteaching seemed to be very effective in improving the academicperformance scores in Biology (Science) and History (SocialScience) of slow learning students in grade 9.
(ii) Self-Efficacy: The experimental group showed a significantimprovement in Academic Self-efficacy perhaps due to the effectof Integrated Intervention. It can be inferred that the graphicorganiser and memory techniques could have acted as effectivetools which drive the slow learners to summarise their ideasand structure their writing work as a visualiser by convertinga text into an appropriate paragraph which, in turn, furtherfacilitates to retrieve the required information at theappropriate time
(iii) Self-Perception: The two dimensions of the Self PerceptionProfile namely Scholastic Competence and Global Self-worthof the slow learners of the experimental group have increasedto a considerable level in the post-test.
(iv) Socio-emotional Adjustment: There is a substantial level ofreduction in Anxious Fearful Behaviour and increased Pro-Social Behaviour among the experimental group of slowlearners which may alter their cognitive capacities to acquireadditional reading skills helping them to overcome thesuppressed feelings about their inadequacy in academicactivities. Such activities results in putting them at ease intheir interaction with peers and teachers. Similarly, there is aconsiderable level of reduction in Hyper Active-DistractibleBehaviour among the slow learners in the experimental group.
(v) Temperament: The gain scores of the experimental group onSociability and Attentivity dimensions were markedly greaterthan the control group. Due to this Integrated Intervention,their level of attentiveness in the classroom proceedings andresponding to the queries raised by the teachers/peer groupmembers had increased quite significantly.
(vi) Intrinsic Motivation: There had been a significant level ofincrease in Perceived Competence and Effort/Importance whilea significant level of reduction in the Pressure/Tensiondimension among the experimental group of slow learners werefound.

Assessing the Effectiveness of Individualised...
Indian Educational Review, Vol. 51, No.1, January 2013 119
Recommendations
It has been confirmed confidently that the customised IntegratedIntervention targeted at the slow learners are able to enhance theacademic performance and other psychological indices facilitatingthe psychological well-being. The key recommendations based onthose significant psychological aspects are listed under two categoriesas short-term and long term.
Short-term Strategies
• Introduction of Mindfulness Meditation with immediate effect toreduce academic as well as general anxiety and stress.
• Implementing Integrated Intervention Programme such as graphicorganisers, mindfulness meditation, mnemonics training,relaxation techniques etc., periodically addressed to all the slowlearners at the beginning stage.
• Enriching the Self-efficacy and Self-perception of slow learnersthrough selected intervention regularly.
• Spearheading studies to address those limitations and lacunaeof this study.
• Replacing unconditional promotions with comprehensivecontinuous assessment to monitor the progress of the slowlearners.
Long-term Strategies
• Introduction of guidelines for Graphic organisers and Mnemonicsin the appendix of textbooks as learning strategies.
• Periodic scheduling of Teachers' Mentoring Programmes toenhance their awareness, attitude and competence.
• Enhanced involvement of parents through appropriatesensitisation.
• Improving the Teacher-Taught ratio at the national levelespecially at primary level.
• Drafting a National Level Inclusive Policy for slow learners andlearning disabled students enabling Education For All (EFA).

Participatory Learning and Action for Environmental Education
Indian Educational Review, Vol. 51, No.1, January 2013120
Participatory Learning and Action for
Environmental Education
M.A. SUDHIR*
Statement of the Problem
Environmental education is the means to create knowledge,understanding, values, attitudes, skills, abilities and awarenessamong individuals and social group towards the environment andenvironment protection. The school system provides the largestorganised base for environmental education and action. With childrenin their plastic age, school imparts knowledge for imbibing in themthe environmental ethics and consciousness. Teacher is one of theimportant factors for promoting environmental education. Teacherscan become a vital link in the delivery of environmental knowledge,its associated problems and their solutions.
Objectives
1. To design and prepare a learning package on environmentaleducation.
2. To study the environmental programmes and activities conductedin secondary schools.
3. To examine the environmental awareness of the secondary schoolstudents.
4. To provide orientation to teachers on environmental educationand Gandhian approach to environment.
5. To suggest intervention strategies for protection and preservationof environment.
Area of Study
The project was carried out in 30 secondary schools of Dindigul districtof Tamil Nadu.
* Professor , Department of Applied Research Gandhigram Rural Institute,Deemed University, Tamil Nadu.

Participatory Learning and Action for Environmental Education
Indian Educational Review, Vol. 51, No.1, January 2013 121
Sample
The study was conducted on sample of 500 students from 30secondary schools; and 200 secondary school teachers of Dindiguldistrict in Tamil Nadu.
Tools
The data for the study is gathered through environmental surveysusing pre-designed field tested tools.1. Participatory learning and action approach is followed to
analyse and understand the environmental problems and todevelop the intervention strategies.
2. An Environmental Awareness Scale was developed andstandardised for the purpose of investigation.
3. The School Environmental Profile was prepared on the basisof data collected from the schools relating to cleanliness,sanitation, disposal of garbage, drinking water sewage, drainagesystem, tree plantation, classroom and physical plants etc.
4. Focus Group were held with school principals and teachers toelicit the data on environmental conditions and ethics of theschool. The functioning of the national green corps, nature studygroups and eco-clubs in schools was found out during thissession.
5. Also a Students Biodiversity Register was designed andmaintained in all the selected schools.Modules based on environmental issues were prepared and made
available to students through the project.An environment survey has been conducted for the purpose of
the study. The investigator conducted the survey in selected schools.In this environmental survey the researcher collected the datadirectly from a school population at particular point of time. Theenvironmental programmes undertaken in schools were identifiedthrough questionnaires to the teachers. A workshop was organisedfor teacher educators and school teachers for two days. It wasintended to orienting the teachers about the nature, content andstrategies for environmental education. A special session wasarranged on the Gandhian approach to environment followed by theplantation of trees in schools and surrounding areas. The datacollected through environmental school survey were analysed usingStatistical Package for Social Science (SPSS).

Participatory Learning and Action for Environmental Education
Indian Educational Review, Vol. 51, No.1, January 2013122
Major Findings
The results of the environmental surveys conducted on a sample of30 secondary schools revealed the following:• Schools in Dindigul district of Tamil Nadu were not found
environmentally safe.• Participatory intervention programmes like tree plantation,
constructing soak-pits for waste water management, cleanlinessdrive have been taken up very rarely in secondary schools.
• Massive tree plantation programme has been carried out inschools occasionally, but the continuous nurturing of the plantshas not been taken up.
• The study revealed that 96.8 per cent of the students considerenvironment as the surroundings of human beings includingnatural resources.
• According to 55.2 per cent of the respondent's personal hygiene,family hygiene and society's hygiene were the three factorsessential for development of healthy environment.
• Pure air, clean water and hygienic food were necessary for healthyliving according to 89.4 per cent of students.
• 94.2 per cent of students mentioned that tree plantation isessential for environmental protection and 92.8 per cent ofstudents suggested that soil erosion can be prevented by growingtrees.
• Water sanitation on streets causes adverse effects and is a healthhazard according to 70.8 per cent.
• Environment is polluted by plastic and chemical wastes accordingto 88.6 per cent of students.
• Spiting in the public should be made punishable according to85.4 per cent of students.
• 96.0 per cent of students took bath every day and only95.8 per cent of the students brushed their teeth morning and night.
• Avoiding the use of electricity during day time can conserve powershortage in Tamil Nadu according to 65.2 per cent students and81.8 per cent preferred to turn off lights and fans when it’s notneeded.
• 76.4 per cent of the respondents advocated to constructhousehold and community soak-pits to arrest waste water.
• 'Art from waste' should be encouraged in the schools accordingto 52.4 per cent of students.

Participatory Learning and Action for Environmental Education
Indian Educational Review, Vol. 51, No.1, January 2013 123
• Traditional habit of walking to schools should be encouragedamong the students instead using the transports to save fuelaccording to 67.2 per cent.
• Majority of the respondents 78.8 per cent wanted to use organicmanure to grow plants in their gardens and 67.8 per cent ofrespondents wanted to avoid chemical fertilisers as it is toxicand harmful to people.
• Punishment for violating the environmental laws save natureand biodiversity according to 79.6 per cent students and themessage to protect wildlife.
• Dumping the garbage in the school campus and surroundingareas should be stopped. Waste management should beencouraged and students should learn to reduce, recycle andreuse the waste.
• Environmental awareness need not always lead to environmentalaction, but awareness can always ignite action among students.
• Open defecation should be stopped and use of public toiletsshould be encouraged in rural areas.
• Adequate water for toilet purpose and cleaning should be providedto the schools.
• Environmental film shows and debates should be conducted inall schools.
• Computer-assisted models should be used for teaching theenvironmental issues at the secondary level.
Conclusion
The father of the nation, Mahatma Gandhi foresaw as early as 1920sthe need for environmental protection for sustainable developmentin India. His antyodaya approach should become the basis forenvironmental education in schools and his famous quote, "The earthprovides enough to satisfy every man's needs, but not every man'sgreed" should be instilled in the minds of the students. Participatorylearning and action can help the students to understand theenvironmental issues and construct the knowledge to solve itsproblems. Opportunities should be created for students forundertaking the nature and its diversity through activity basedlearning strategies. This can pave way for effective environmentaleducation for preserving the rich environmental heritage in India.

For further enquiries, please visit www.ncert.nic.in or contact the Business
Managers at the addresses of the regional centres given on the copyright page.
SOME REFERENCE BOOKS
FOR TEACHERS
Sl. Title Price
No.
1. Training Handbook in Early Childhood Care 110.00
and Education
2. Teacher's Manual—Environmental Studies Class II 7.00
3. A Handbook for Designing Mathematics Laboratory 60.00
in Schools
4. A Kit of Essential Play Materials 85.00
5. Meeting Special Needs in Schools 45.00
6. Early Childhood Education: An introduction 25.00
7. Source Book on Assessment for Classes I-IV, 115.00
Mathematics
8. Source Book on Assessment for Classes I-V 100.00
(Environmental Studies)
9. Mathematics Teacher Training 150.00
Manual for Classes I and II
10. Teachers' Handbook on Environmental Education 180.00
for Higher Secondary Stage