Adverse selection, volume and transactions around dividend announcements in a continuous auction...
29
Adverse selection, volume and transactions around dividend announcements in a continuous auction system Gonzalo Rubio and Mikel Tapia Deparramento de Fímdllmemos, Facultad de Ciencias Económicas, U,¡il'ersidad del Pais I1ISCO, Avda L. Agui,.re 83,480/5 Bilbao, Spaiu Abstraet We sho", [ha[ liquidity providers do 1I0[ sigllifiealllly respond [O ehanges ill illfomw[ion asymmeu)' risks, al leasl ",hell "'e analyse Iheir lradillg belwviour aroulld dividend allnoulleemenls of a represell/alive sample of sloeks ill a COll/illUOUS auelioll [rading mechanism. The implicil bid-ask spread does no[ seem lO ehange beyolld ",ha[ is 1I0rmally conveyed 'hrough an inereased lIumber of lrallsaelions. We also dOCllmen[ IlwI Ihe informa[ion ill Ihe [rading behaviour of illveslors is primarily eOll/ained in [he number of daily transact;olls. Keywords: adverse seleelion, bid-ask spread, limi' dividend allllouncements. J EL c1assifieation: G 14. 1. lntroduelion Trading meehanisms for equilies presenl allernative eharaeteristies around lhe world. In general, lrading systems can be c1assified inlo batch markets and eontinuous markels. In lhis papel', we are eoncerncd with a continuous market where a lransaetion takes place whenever I\VO orders are matehed. 11 is well kno\Vn lhat this mechanism provides continuous priee informalion throughoul lhe period in whieh lhe markel is open. Moreover, eonlinuous markels are eilher dealer markels 01' auclion markels. Of course, in a dealer markel, lhe trading meehanism is driven by priees \Vith exchange-designaled pecialists providing liquidity lO lhe markel. Ask and bid priees and lhe number of shares available at eaeh quote are offered simultaneously by markel makers. It is also lhe case lhal pecialisls are obliged lo maintain a limil order book eontaining lhe publie's limil orders. On lhe olher hand, in lhe auelion syslem, public lrading orders are direclly malehed against one anolher. These are markets driven by orders. In 1989, the Spanish Stock Exehange became a continuous auetion system by
Transcript of Adverse selection, volume and transactions around dividend announcements in a continuous auction...

Adverse selection, volume andtransactions around dividendannouncements in a continuousauction system
Gonzalo Rubio and Mikel TapiaDeparramento de Fímdllmemos, Facultad de Ciencias Económicas, U,¡il'ersidad del PaisI1ISCO, Avda L. Agui,.re 83,480/5 Bilbao, Spaiu
Abstraet
We sho", [ha[ liquidity providers do 1I0[ sigllifiealllly respond [O ehanges illillfomw[ion asymmeu)' risks, al leasl ",hell "'e analyse Iheir lradillg belwviouraroulld dividend allnoulleemenls of a represell/alive sample of sloeks ill aCOll/illUOUS auelioll [rading mechanism. The implicil bid-ask spread does no[seem lO ehange beyolld ",ha[ is 1I0rmally conveyed 'hrough an inereasedlIumber of lrallsaelions. We also dOCllmen[ IlwI Ihe informa[ion ill Ihe [radingbehaviour of illveslors is primarily eOll/ained in [he number of dailytransact;olls.
Keywords: adverse seleelion, bid-ask spread, limi' order.~, dividendallllouncements.
J EL c1assifieation: G 14.
1. lntroduelion
Trading meehanisms for equilies presenl allernative eharaeteristies around lheworld. In general, lrading systems can be c1assified inlo batch markets andeontinuous markels. In lhis papel', we are eoncerncd with a continuous marketwhere a lransaetion takes place whenever I\VO orders are matehed. 11 is wellkno\Vn lhat this mechanism provides continuous priee informalion throughoullhe period in whieh lhe markel is open. Moreover, eonlinuous markels are eilherdealer markels 01' auclion markels. Of course, in a dealer markel, lhe tradingmeehanism is driven by priees \Vith exchange-designaled pecialists providingliquidity lO lhe markel. Ask and bid priees and lhe number of shares available ateaeh quote are offered simultaneously by markel makers. It is also lhe case lhalpecialisls are obliged lo maintain a limil order book eontaining lhe publie's limil
orders. On lhe olher hand, in lhe auelion syslem, public lrading orders aredireclly malehed against one anolher. These are markets driven by orders. In1989, the Spanish Stock Exehange became a continuous auetion system by
Published in: European Financial Management, 1996, vol. 2, nº 1, p. 39-67.

adopling lhe Compuler assisled lrading syslCm (CATS).' The public·s limilorders are displayed in a compuler file. In this way, execulion against limitorders left on lhe compulerised book is aJ10wed by lhe Irading mechanism. Bymoniloring availabJc bids and offers on Ihe book, slock exchange agcncies(brokers) can exccute upcoming orders against an exisling bid or offer. Allernalively, lhey can inlroduce a new sale or purchase order. Thus, public limil ordcrsreprescnl lhe available bids and offers. In lhis sense, lhe analogue of the bid-askspread on lhe cOlllinuous auction syslem is the spread belween lhe beSl buy andseJ1 limit orders oUlstanding al any given lime. Evcn without a market makerwho cominuously establishes quolcs, il is lhe casc lhat whcn an invcstor tries lOsell any amoulll of slock, he or shc gels a lower pricc lhan lhc price lhal has tobc paid for il. In a conlinuous auclion markel, agenls or speculators lrying lOabsorb tcmporary imbalances of supply and demand lO make a profil wiJ1 requirea premium from buyers and impose an additional compensalion on seJ1ers.
Il is imporlanl \O realisc thal in setting lhe implicit bid-ask spread, we runin\O lhc same reasons Ihal ineluce markel makers lO be compensaleel. Inparticular, lhey necel to be remuncrateel for laking risky posilions, for lhc risk oflrading wilh an insider. and for lhe expenscs necessary lO maintain lheirpresence in lhe markel. In a mcchanism driven by prices, elealers sel Ihe spreadlO protect lhemselves from lrading with better informed indivieluals. Dealersexpect to lose on average lo better informed lraders and gain on avcrage fromlransaclions wilh uninformed lraders. The ame rcasoning applies lO cominuousauclion markets lhroughoul lhe establishmenl of public limil orders.
The objeclive o[ this paper is lO sludy lhe imporlance of Ihe asymmclricinformalion componem of lhe implicit bid-ask spread in a cominuous auctionmarkel. If, givcn asymmelric informal ion among Iraders, lhc adverse selectioncomponent is present, lhc implicil spread should be higher (Iowcr) wheneverlhe probability of informal ion diffcrelllial among traelers has augmcmed(diminishcd).
Surprisingly, cmpirical aelverse seteclion lileralure is cxcIusively coneenlraledon traeling mechanisms where thc markel maker plays an explicil role. Recenlly,Lehmann and Modest (1994) carefuJ1y describe lhc lrading and liquidity characleristics of thc Tokyo Stock Exehange. However, lhey do not analyse lhepOlemial aelverse seleclion componem wilhin lhe diffcrence between lhe beslbuy and seJ1 limit orelers outslanding.
In order lO sludy lhe importance of adverse seieelion on the implicil bid-askspread. wc analyse Ihc effecls of informalion announccmcllls on lhc sprcad.Given thal signaJ1ing theories suggcst Ihal dividends convey information <lbOUlmanagers' expeclalions reg<lrding lhe fUlUre cash nows of lhe finn. lhe spre<ldshoulel be expected \O ch<lnge during perioels of elivielend announcemems. Moreover, Ihe an<llysis c<ln be easily exlended \O Ihe study of markel liquielity byconsidering lhe effeets on eleplhs. 11 shoulel be recaJ1ed lhal liquidily effeC1S areunambiguous only when wc observe a spread increasc (decrease) <lnd <1 simullaneous deplh decrcase (increase).'
When \Ve conduct univariate tests 011 lhe imp,lct of lhe arrival of new information regarding dividends on spread and deplh. Out empiric<ll evidenee seems lOsupport importa nI adverse seleclion effccls on sprcad. However. lhere exisls asignificanl invcrse relation betwecn either volumc or lhe Ilumber of transactionsand spread. Moreover, lhis invcrsc relalion is shown to be elominaled by lhe
number of transactions. This is an interesting result. It should be noled thallenes el al. (1994) argue lhal il is Ihe occurrence of lransaclions, and nol Iheirsize, thal is behind volatility. Our results lend LO suppon lhis cvidence evcn incontinuous auclion markets. In facl, when we relale volalility to average lradesize and lO Ihe number of transaclions. lhe resulls suggesl ralher unambiguouslythal lhere exists only a posilive relalion belween volalilily and the number oflransaclions.
Once lhis inverse relalion is incorporaled into lhe analysis of lhe cffecls ofdividend announcemenls on lhe spread, we are nol able lO find any compensalion for adver e seleclion in the reaction of spread. This reSUll remains lhe samewhelher we observe increased, mail1lained or decreased dividends over lheprevious paymenl. Thus, we may argue lhal inve lors are nol significantlycompensaled for adverse seleclion. al leasl when we infer our conclusions on Ihebasis of limil orders dala around dividend announcemenls. Liquidity providers inconlinuous auction trading mechanisms do nol seem lO be sensilive lO changes ininformalion asymmelry risks.
The paper is organised as follows. Seclion 2 describes our data. In Seclion 3,we presel1l an analysis of the seasonal characlerislics of trading and liquidity onlhe continuous Spanish Stock Exchange markel. Univariale lesls regarding dividend allnouncemellts and liquidity are reported ill Seclion 4. The relalioll, in alime-series framework, belween spreads, volume and Irallsaclions is presented inSeclion 5, and a similar analysis relaled lO volalility is contained ill Seclion 6.Our mullivariale empirical evidence aboul lhe effects of dividend announcemel1ls on lhe implicil bid-ask spread is reponed in Seclioll 7. Finally, wesummarise our resulls alld provide some conclusions ill Seclion 8.
2. Dala
The dala employed in lhis paper are oblained from two dala sources. Thc firstsel consiSls of daily closing lrallsaclion prices for 100 compallies lraded 011 lhecOlllillUOUS Spanish markel from 19 April 1990 lO 18 Oclober 1994.' Conlinuously compoullded daily relurns adjusled for dividends and change of capilalslrUClure are calculaled for each slock ill lhe sample. The relurns 011 all slocksavailable during each day are used lO compule an estimale of lhe daily relurn onlhe equally weighled markel porrfolio. Al lhc same lime, lhis dala sel conlaillsthe lolal numbcr of shares lri.ded in each slock durillg cach day of the amplillgperiodo Fillally, we have lhe number of shares oUlslandillg for each slock al lheend of each year from 1989 lO 1993.
The second dala sel consisls of lhe average of the five besl daily pricesavailable ror bOlh purchases (lhe ask) and sales (lhe bid) for 70 sloeks from 2January 1991 lO 18 OCLOber 19945 As we have already poinled oul, under lheadverse seleclion argument, if lhe probability lhar some traders have insiderinformalion has increased, liquidilY providers may reacl by either increasing lhebid-ask spread or by diminishing lhe number of shares available al each side oflhe markel (deplh). Forlunalely, our dala conlain the number of shares availableal each price, again as Ihe average of the five besl sellillg and buying positiollSill lhe markel. Finally. lhis dala sel inelude lhe number of lrallsaclions for eachof lhe 70 slocks during each day of lhe sampling periodo Several fillers are runon lhe dala in order lO eliminate polenlial dala errors.

AII of lhis informalion is employed lO ealculale lhe following four liquidilyeharaelerislies for eaeh of lhe 70 sloeks:
l. Spread = Ask-Bid.
Ask-Bid2. Relalive Spread = .
(Ask + Bid)/2
3. Deplh = Deplh al Ask + Deplh al Bid.
Number of shares lraded per day4. Turnover =-----------------''---'-------
Number of shares oUlslanding al lhe end of lhe previous year
The 70 sloeks wilh eomplele liquidily and relurn dala are ranked aeeording lOlheir markel value al lhe end of lhe year preeeding lhe daily return ealeulalion.This ranking is mainlained lhroughoul eaeh year from 1991 lO 1994, and fiveequally weighled ponfolios wilh approximately lhe same number of sloeks areoblained. Porlfolio one eonlains lhe smallest firms and porlfolio five lhe larges!.
In lhe Spanish markel, priorily for erossing a lransaelion is delermined bypriee. If priees turn oul lO be equal, lhen priorily is given 10 lhe arrival lime oflhe order. Moreover, during lhe sample period of lhe sludy, lhe 101 markel is lhemosl represenlalive way of lrading in lhe Spanish eonlinuous auelion syslem.LoIS are indivisible seIs of 25,50 or 100 shares depending on whelher lhe c10singpriee of lhe seeurily during lhe previous session is aboye 5,000 pese las, belween1,001 and 5,000 peselas, or below 1.001 peselas. The minimum priee varialion is10, 5 or 1 pesela for 10lS of 25, 50 or 100 shares. The maximum priee varialionis 5% for lhe opening price, and an addilional 10% for lhe regular session.
For lhe lesls reponed in Seelions 4 and 7, lhe dale and magnilude of allannouneemenls of dividend paymenls made by any of lhe 70 sloeks are idenlified by searehing lhe Officia! Journa! of rile Madrid Stock Excllllnge for lhe periodfrom 2 January 1991 10 18 Oelober 1994. The following seleclion crileria areemployed for lhe inclusion of a dividend announeemenl in our sample:1. We reslriel our sample 10 regular cash dividends payable in peselas. Any
final, inilialion, omission, special or non-recurring dividends are excludedfrom lhe sample.
2. If a dislribulion lO sloekholders different from eash is made during lhe periodfrom 10 lrading days before lO 10 lrading days alter lhe announcement of aregular eash dividend, we drop lhe announcemenl from lhe sample. The idea,of eourse, is lO eliminale any eonfounding impael of lock splilS or any kindof non-eash dislribulion.
3. Under lhe same line of reasoning, if any ehange of capilal Slruclure isannounced from 10 lrading days before lo 10 lrading days afler lhe announeemenl of a dividend paymenl, we exclude lhe announcement from our sample.
4. 1n order lo be incorporaled inlo our sample, al leasl 3 lrading days muslelapse belween lhe announeement dale and lhe ex-dividend dale.
There are 157 dividend announeemenls lhal salisfied lhe aboye erileria. Moreover, our sample is divided inlo lhree groups depending on whelher lhe

dividends are higher than, equal 10. or lower than dividends paid al (approximalely) lhe same lime of lhe previous year. Henee, in order lo classify a dividendpaymenl, we do not compare the magnilude of the dividend lO the preeedingpaymem unless the eompany dislributes dividends only once ayear. Spanishfinns tend to pay dividends of differem magnitudes lhroughout lhe year. 11 turnsoul lhal, for mo 1 cases, we eannol compare IwO immediately following dividendpaymenls. These figures lend lO be very differenl, and the eomparison would nolmake any sense. or lhe 157 announeements. 55 are dividend inereases, 26 aredividend deereases, and 76 are unehanged.
3. Seasonality, trading, and Iiquidity on the eontinuous Spanish Stock ExchangeMarket
3.1. Overview
In this seetion, we examine lhe general eharaeterislies of lhe Spanish markelregarding alternalive measures of liquidily. Given lhe well-known evidenee thatsuggesls importanl eross-seelional and time-series differenees among size-sortedportfolios, we ealculate lhe average of our measures of liquidily aeross firmswilhin a size-sorted portfolio.
Deseriptive slalislics for our five porlfolios are eontained in Table 1. Thistable reporls lhe average eslimales of relalive bid-ask spreads. average deplh,average turnover, average volume (lotal daily number of shares lraded), numberof lransaelions, daily portfolio relurns, and average eSlimat.es of markel value (inmillions of pesetas).
11 is clear lhal lhe numbers in Table 1 refleel t.he lrong diversily of firmsemployed in this analysis. 1l is surprising lhal lhe usual size effeel reported inprevious sludies seems to disappear afler 1991 even before risk is adjusted for'The average markeL values range from 4,973 million peselas for lhe smalleslfirms lo 541,684 million peselas for lhe largesl sloeks. The average daily relurnis negalive for lhe firsl group of firms, and beeomes posilive for large firms.Moreover, Lhere exisls a slrong eross-seelional varialion in trading frequency.The average number of lransaetions varies from 53 for Ihe smallesl firms lO 252for lhe largesl sloeks. Similar evidenee is found in lerms of volume. Jt isinleresling, however, Lhal lhe number of shares of small firms traded in lhemarkel is higher lhan the number of shares lraded in portfolios 2 and 3. In lhesame line. lurnover is clearly larger for small firms.' Finally, diversity of firms isalso found in lhe average of relalive spread and deplh. 1l should be noled lhala large deplh indieales thal lhere is a higher probability of exeeuling an orderagainsl a .landing bid or offer. Henee, we would expeel a negalive eonelationbelween spreads and depths. Lee el al. (1993) are the first aulhors to performformal lesls on lhe relalion beLween spreads and depths. For a sample of ewYork Sloek Exehange firms. lhey show how wide spreads lend lO be associaledwilh low deplhs' In our sample, we find a negative correlation belween bolhmeasures of liquidily aeross all firms of 0.27. 11 is surprising, however, lhat smallfirms presenl grealer deplh lhan middle-size stoeks. In any case, we can inferthal on average large companies are more liquid lhan small eompanies.
Table I also contains sorne feature regarding daily and momhly seasonalily ofliquidity measures. 1l is imporlanl lO nOlice the large relalive spread on Mondays

and in January for lhe markel as a whole. Al lhe same lime, deplh and lhenumbcr of lransaclions scems lO decrease on Monday . This would suggest thatliqllidily is lower on Monday lhan dllring lhe resl of lhe week. On the contrary,deplh and lhc numbe!' of IransaClions Icnd lO bc higher during January.
3.2. Seasonalily. lradillg alld liquidily
Given lhe pOlential rcgularities suggestcd in lhe descriplive statlSllCS aboye, ilwa decided lO carry out morc formal lcsls on seasonality, lrading and liquidityin the Spanish conlinuüus allclion markcL.
In o!'dcr lO invesligalc lhis issue across pon folios and lime, wc employ alldaily data available from 2 January 1991 lO 18 Oclober 1994. Thc regressionsbelow are eSlimatcd by stacking all of lhe observalions and using OLSprocedures. In panicular, the general form of lhe regressions is given by:
, <
y~ =~+ ¿ {J¡Dmval¡,+ ¿ D",Dwk,,,+;'Dry, +1:" (1)J"'.! III-.!
where 1.. is lhe cross-sectional mean of characteristic k for assets belonging lOponfolio p during day 1, and Dmvalp, Dwk",,, and Dry, are dummy variables forsize, day of lhe week, and lhe rest of lhe year. The results are reponed for lherelativc bid-ask sprcad.
f
} depth, turnover, volumc, transaclions. rcturns and volatililY (squared relurns). 11 is imponanl lO poinl oul Ihal lhe ponfolio eontaining
Tablc I
Mcasurcs of liquidily.
Slocks are a~signcd lo fi"c portfolios ba...cd 011 lhe markct vaJuc of thcir equily ¡¡¡ Ihe cnd of cachyear. Mvall contains lhe slOck-s wilh lhe smallcsl markcl capil;llba(jon. ;md MV31S contain~ lhei'locks with Ihe Iargcst markcl capilalisalion. Ponfo!io... are:: cqually wcighted. Thc bid-ask sprcad isIhe perccnlage hid-ask ~prcad bascd un Ihe average of the rivc hest bids <lml Ihe Ílvc besl uffcrsuf each Irading d<lY. Thc deplh is Ihe numhcr of shares available al c.lch pricc. agaill a~ the averageof lhe fhe hc~1 selling and buying posilions in Ihe ma.rkct during each trading day. Turnover isdefined as Ihe numbcr of shares lradet! during cach day dividcd by the Ilulllhcr of ~hares
olltslanding. Volumc is lhe Ilumllcr of shares Iradcd per day. Transaclion'\ represen! Ihe llumbcr ofIr<lnsactiuns in cach day. Data arc avaiJ:lhle frnm 2 Janllary 1991 to 10 Octoher 199..L Al! figuresrepresenl llvcrages over lhe full pcri{)(1.
Ponfolios
MVALIMVAL2MVAL3MVAL4MVAL5MarkclJanuaryOlller ll10nthsMondayGlher days
Bid-ask Depth Turnover Volull1c Tr:.II1Silctiolls RClUrn Markelspread" (rf) (CO value
('1-) (millions)
2.221 5332 0.534 69752 53 -0.019 49731.710 3523 0.256 56288 51:'1 - 0.I)lJ8 197011.471 2553 0.214 49855 67 0.020 496870.835 5969 0.1')8 185420 119 0.034 112477O.41H 19472 0.152 401356 25~ 0.047 5416841.340 7370 0.271 151534 I L! 0.0211.537 7698 0.297 163031 132 0.3911.323 7340 0.269 151579 IIU -0.0121.510 6921 0.248 129927 107 0.0581.300 7483 0.277 158230 113 0.012
"(Ask- BidM(Ask+ Bic1)I2I.

lhe smallesl finns, Monday, and January are lhe conlrol variables in lhe regressions. Lehmann and Modest (1994) employ a similar set of regressions, bul inorder 10 avoid linear dependeney among lhe independenl variables, they imposelhe conslrainl thal all wilhin-group dummy variable coefficients sum lO zero. Inlhis paper, given Ihe particular behaviour of small firms and eilher daily ormonthly seasonality, it was decided lO use control variables. AII our results arelherefore presented relalive to lhcse variables. Finally, I-slalislics reponed arebased on Newey- Wesl eonsislent slandard errors.
The empirieal resulls are conlained in Table 2. The evidenee lends lO eonfirmsome of Ihe resulls already suggesled in Table J. Small slOeks lend lO havesignificantly larger percel1lage spreads, and higher lurnover and volatility lhanlarge slocks. Al lhe same time, Ihey have les depth, volume and transaclionslhan lhe largesl slocks in lhe sample. However. we find a J-patlern across sizesorted portfolios for depth and volume. If we measure liquidily bysimullaneously lhe pereentage spread and deplh, we may conelude lhal smallfirms are less liquid lhan firms in Ihe IWO upper size quintilcs of lhe market.
On lhe olher hand, lhe percentage spread is ignificantly higher on Mondaylhan in any of lhe olher days of lhe week. A reversed patlern is found for deplh.[1 seems Ihal Monday presents a signifieantly lower liquidily Ihan during lhe restof lhe week. Moreover, lurnover, volume and Iransaclions are significal1lly lowerOn Mondays Ihan for the resl of lhe week. II should also be noled Ihal volalilityseems lO be higher on Mondays. Finally, relative spreads, lurnover, lransaclions,average relurns and volaliJity are higher in January than in the resl of the year.However. depth is nol significanlly different in January lhan in lhe resl of lheyear. II is diffieull lO reconcile lhe larger relative spread of January with olherintuitive measures of liquidily and lrading.
Four lhree-dimensional graphs eonlain further evidenee relaled lO seasonalityand Jiquidity across our five portfolios. Figure I presenls lhe average relalivebid-ask spread for stoeks in our five size-sorted portfolios over the days of lheweek. As we alreacly know, the relative spread is a monolonie funelion of firmsize with lhe spread largesl for themalleslslocks.llis inlere ling Ihal thispaltern holds over all days of lhe week. Al lhe same lime, we can appreciale lhalthe pereentage spread is also a monolonic funclion of days of lhe week; lhelargesl spread occurs on Mondays, independenlly of the size-sorted portfolio.Figure 2 i a similar Ihree-dimen ional graph, where we inelude deplh ralherlhan relalive spread. 11 is more diffieult to observe a e1ear patlern aeross days oflhe week. Deplh, howe er, seems to be lower for larger eompanies on Mondays.Al Ihe same lime, we observe lhe J-patlern aeross our five size- orled porlfoJiosfor every day of Ihe week. Figures 3 and 4 eonlain a similar Iype of evideneeregarding January and Ihe resl of lhe year. The monotonie funelion of firm sizewilh lhe relative spread is preservecl for January and for lhe rest of lhe year.Moreover, independenlly of lhe portfolio observed, lhe relalive spread is alwayshigher in January. Figure 4 maintains the J-pattern for deplh aeross portfolios,and shows a very similar deplh aeross all monlhs of lhe year.
Intriguing patterns of alternalive measures of liquidity and trading have beenfound in the Spanish conlinuous auetion market. Researeh direeted loward lheexplanalion of lhese patlerns is e1early justified and is lefl for fulure papers.
We are now in a position to investigale potential ehanges in the eompensalionof adverse seleelion and markel liquidily arouncl dividend announeements.

4. Dividend announcements and market liquidity: univariale empirical evidence
II is well known that dividend signalling theories suggcsI that dividends eonveyinformation aboul managers' expeelations regarding the future prospects of thefirm.'" Several papers have reponed signifieant price reactions 10 dividendchangcs." Therefore. it eems reasonable lhat if the bid-ask spread incorporatesan adverse informalion component, we would expect 10 find changes in spreadduring pcriods of dividend announcements. Hence, dividend announcements area panicularly wcll suited strategy for analysing the effecl of changes in information asymmetry.
Tulllc 2
McasLlrcs of liquidity.
Stocks are <lssigncd lO [ive porlfo1ios hascd on lhe markCI Villuc of thcir cquity al Ihe end of cachyear. Mvall contains Ihe slOcks with lbe smallcsl markct capilalisalioll. <lnd MvaJ5 conlllins Iheslocks with Ihe largcs\ m<lrket capilillisation. portrolios are cqually wcightcd. The bid-ask sprcad isIhe pcrccnlagc bid-ask sprcad bascd on lhe average of Ihe five hes! bids aod Ihe tivc besl ofrcrsof each trading day. The dcpth is Ihe numbcr of sharcs availablc al cach priee. c¡gain ,,15 lhe averageof Ihe fivc bcsl sclling alld buying po~ilions in Ihe market during cach lrading day. Turno"cr isdcfincd as lhe numbcr of shares lnldcd during cad day dividcd by Ihe numbcr of sharcsoUlslanding. Volumc is Ihe number of sh<lres traded per day. Transactions represent Ihe numbcr ofIransactions in cach day. Data are uvailablc from 2 January 1991 lo 10 October 1994. AII figuresare estimatcd by slacking 0111 of lhe obscrvations and using OLS rcgrcssisons of the following form:,
)'~ = ~+ L PI Dmval.. + L (i," Dwk"" +¡'Dry, +t:,,,I·~ .... ~
whcrc Y:w is Ihe cross-scclional mean of Ch<lraCleristic k for "SSCI~ bclonging lo ponfolio p duringday l. and DmvalJ" Dwkml • Dry, are dummy variables for size. day of the wcek and rest of Ihe year.Mvall, Monday, and January are Ihe control variilbles. Ncwey-Wesl still1dard errors are cmployed.
Charactcristic
ConStanl
MVAU
MVAL3
MVAL4
MVALS
Tucsday
Wcdncsday
Thursday
Friday
Resl of ycar
Bid-ask Dcpl¡' TUfIlovcr Voll1lllc Transaclions RclLlrn Squarcdspread" (%) (%) rclllrns
(%) (%)
2.586 5213 0.537 57608 69 0.506 0.059(33.28) (9.54) (23.41 ) (6.56) (14.30) (4.18) (10.50)-0.511 -1 0') -0.277 -13465 5.22 0.011 -0.012
( -8.82) (-8.70) ( -14.39) ( -4.Q.1) (2.55) (O. t4) ( -3.51)-0.750 -2779 -0.320 -19897 13.91 0.039 -0.016
( -13.(2) (-16.31) (-17.23) ( -6.49) (6.27) (0.50) ( -4.89)-1.3&" 637 -0.336 115667 77.55 0.053 -0.020
( 27.39) (3.(,3) ( 18.23) (21.31) (28.55) (0.70) ( -6.(3)- 1.757 14140 -0.382 331604 199.01 0.067 -0.023
( -37.89) (30.86) ( -20.97) (35.81) (43.25) (0.91 ) (-8.23)-0.237 524 0.026 21557 5.(,8 -0.073 -0.011
( -5.83) (2.7(,) (3.22) (4.50) (2.75) ( -1.02) ( -3.38)-0.210 (,83 0.034 27108 4.94 -0.243 -0.010
( -4.65) (2.82) (3.28) (5.49) (1.93) ( -3.4(,) ( - 3.(8)-0.177 458 0.029 301169 4.73 -0.082 -0.(107
( -3.77) (2.05) (2.98) (5.9.1) ( l.7R) (-1.12) (- 1.96)-0.225 580 0.027 34085 6.22 0.029 -0.UI5
( -5.42) (2.90) (3.49) (7.14) (2.87) (0.45) ( -4.52)-U.214 -.159 -0.028 -1140 -22.41 -0.492 -0.017
( -3.47) ( -0.(5) ( -1.93) ( - 1.35) ( -4.8R) (-5.34) (-3.92)

Unfortunately, previous studies have mostly concentrated on earningsannouncements, and they have been carried out in the continuous dealer marketcase. In fact, 10 the best of our knowledge, this is lhe first study of changes ininformation asymmelry within the context of a eonlinuous auction Illarket.Moreover, the work of Morse and Ushman (1983), Venkatesh and Chiang(1986), Skinner (1991), Barelay and Dunbar (1991), and Daley el al. (1991) tendsto find comradietory evidence thal is very difficult lO interpret. The mostcomplete and careful analysis regarding the effeet of earnings announcement onmarket liquidity is that published by Lee el al. (J993). They convincingly arguethat spreads widen and depths fall whenever market participam amicipate earnings announcemenls. They also show that Lhese effeels are more pronounced forannouncelllents with the larger subsequent price move. They coneJude thalduring the days prior to earnings announcelllents and during the evenl intervalthere exisls an unambiguous decrease in liquidity.
The reasoning by which they explain their results may be extrapolatecl todividend announcements. It may be argued that the timing throllghout the yearof both earnings and dividends announcements is largely predictable. Thus, in acontinuous auction mechanism, if liquidity providers anticipate a greater probability of trading against informed investors in advance of dividendannouncemenls, the adverse seleelion model would imply a wider bid-askspread. In terms of market liquidity, under similar eireumstances, it seems alsoreasonable to predict a smaller depth. Of eour e, if the timing of dividend
II
II
S5S4Size
o
2,5
Fig. 1. Bid-ask spreads for stocks sOfled by size.

announeemenls is nol predielable, and lhere are no leakages prior to lhe arrivalof new infonnalion, we should nol expeel lO find any impael on spread.
Allhough, given lhe eharaelerislics of dividend paymenls, il may be reasonablelO expeel an inerease in informal ion asymmelry before dividend announeemenls,lhe predielions for lhe announeemenl and even for lhe beginning of lhe pOSlannouneement periods may depend upon how noisy lhe signal lransmilled lO Ihemarket ¡s. Ir a dividend announccmcnt may be rcgarded as a non-noisy signal,given lhal managers are beller informed lhan oUlsiders, lhe informalion eOnlel1lof dividends reduces informalion asymmelries among lraders, and eonsequenlly,we should expeel a lower bid-ask spread.
On lhe olher hand, if dividend announeemenls may be inlerpreled as noisysignals (as earnings are), il should be laken il1lo aeeounl lhal insiders are moreable lO undersland lhe news eonveyed by Ihe announeement. This is lhe poinlraised by Kim and Verreeehia (1994) regarding earnings announcements. Independenlly of lrading volume. lhese atllhors argue lhal noisy signals slimulaleinformed jtldgements. If lhis is lhe case, we may expeel higher informalionasymmelry after lhe announcemel1ls, and eonsequenlly, a wider bid-ask spreadshould be found.
In order lO invesligale lhe impacl of dividend announcemenls on markelliquidily for eaeh of lhe four charaelerislics employed in lhe analysis (spread,defined as lhe differenee belween lhe ask priee and lhe bid priee, deplh, volume
25
;>,
""O"Days o¿
;>, 1
'""O ;>,~
SI~ '"" "O¡:; ·Cu.
y-S5
Siz.
20
15 ~
oCa,10 Q
'5
Fig.2. Deplh for stucks sortcd by sizc.

and number of transactions). we divide every observation in lhe sample periodby the average of its corre ponding day of lhe week. In olher words. if theparticular observation lurns oul lO be for Monday. then this observalion isdivided by lhe average of Ihe analysed charaClerislic for Mondays. The sameprocedure is followed for lhe resl of lhe week. This hould lake inlo accoul1l lheslrong sea onality found in our alternalive measures of liquidily. Moreover. allvariables are expressed as percel1lage devialions from lhe daily seasonal adjusledmean value of lhe characlerislic being slUdied. It i imporlanl lO realise thal lhisprocedure is repealed for each individual firrn with a dividcnd announcclllentduring lhe salllpling periodo
[n particular, we calculate lhe following slatislics for a11 firms in lhe sample:
K,= (~' -I)X 100SVl
(2)
where K, is lhe characlerislic being analysed (spread, deplh, volullle or IransaClions), S, is Ihe aClual liquidily slalislic during day 1 (spread in day 1, deplh inday r, elc.), and SI'l is lhe average of lhe liquidily slalislic for Ihe correspondingday of the week.
Finally, the averagc of K, across all announCClllenls is calculared from day-10 !O day + 10 around rhe evenl. The cros -seclional dislribution of lhis
3
2.5
2
1.5 .I~ 1 j
":: [ IJanuary
Monlhs
I1
¡ ~ r)1I
i
Reslof (Ihe
year
Sizc
IIIj
Fig.3. Bid-ask sprcads for stocks sOrlcd by sizc.

average is used lO sludy Ihe signifieance of lhe evenl." Al lhe end, we have Ihepercelllage changes in spread. deplh. volume and number of lransaclions arounddividend announcements.
The empirieal rcsulls arc conlained in Table 3. The evidence seems slrikinglyconsistent wilh changes in informalion asymmelry during lhe day immcdiatelybefore Ihe evelll, and during lhe day of Ihe announeemcnl. The spread decreasesby 12.4% during event time, and the reduclion is significanlly different fromzero. It seems lhat dividends convey precise informalion aboul Ihe firm. so lhalIhe adverse seleclion component of pread is c1early redueed. Therefore, informal ion asymmelry risks tend lO disappear whenever Ihere is a dividendannouncemenl. 11 should be nOled thal lhe official annOllncemenl of all dividendpayments employed in the anicle is made al some point during evenl day zero.
The second colllmn of Tablc 3 rcports similar slatisties for deplh. Interestingly, lhe rcslllis are not signifieanlly different from zero. There is sorneevidenee, however. Ihal pereenlage changes in deplh tend lO be posilive. In anycase, dividend announcemellls do nol seem 10 imply unambigllous changes inmarkel liqllidily.
The lasl two eolumns in this table suggest Ihal pereentage changes in volllmeand transactions are positivc around lhe event. In particular, thcre exisls asignificanl and posilive reaelion 01' Ihe nllmber of lransactions during days - 1and O. The number of Iransaclions increases by 15.3% on lhese days. This is an
25
20 I
;;;15 Ie
ee::.oC~
"- JO"QI II
5 r
r1 LJ5
4,Size
O r 3
2Reslol'
lhe JanuaryMORths ycar
Fig.4. Dcpth for stocks sortcd hy size.
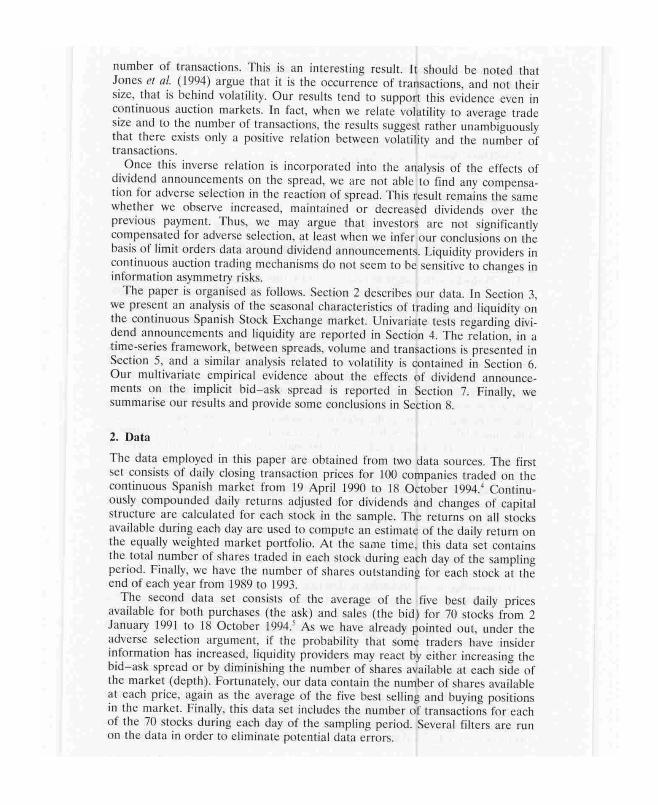
illlportalll poinl and, as we will see later :n lhe paper. il will have seriouseonsequenees for lhe inlerprelation of lhe resulls.
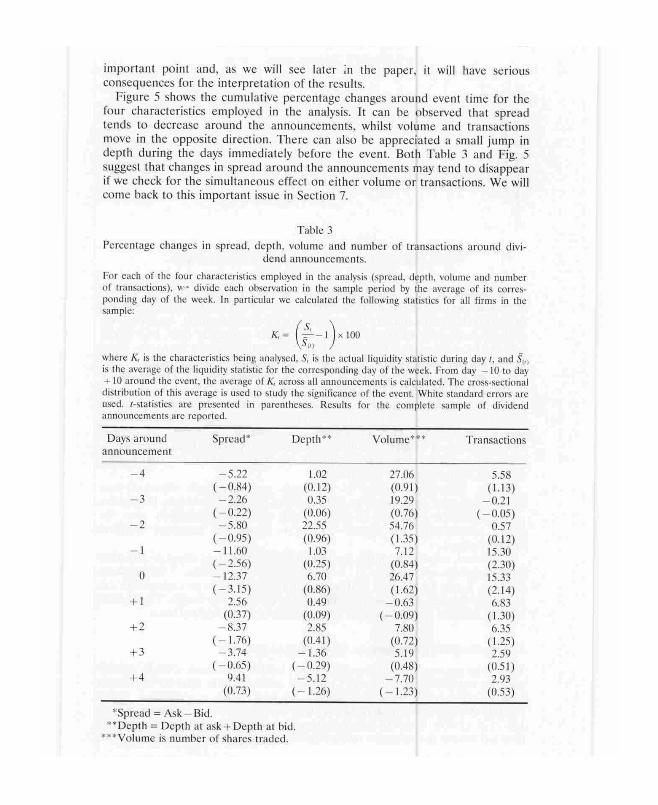
Figure 5 shows lhe eumulalive pereenlage ehanges around evenl lime for lhefour eharaelerislies employed in lhe analysis. 11 can be observed lhal spreadlends lO deerease around lhe announeemenls. whilsl volume and lransaelionsmove in lhe oppo ile direelion. There can also be appreeialed a small jump indeplh during lhe days immedialely before lhe event. BOlh Table 3 and Fig. 5suggesl lhal ehanges in spread around lhe announeements may lend lO disappearif we check for lhe silllullaneous effeel on eilher volume or lransaelions. We willcome baek lO lhis imponant is ue in Seelion 7.
Table 3Pcrcenlagc changcs in spread. depth. volUn1C and number uf transactions around divi-
dcnd annOUl1cemCnLs.
For each of Ihe four churaClcristics employcd in lhe analysis (spread, depth, volume and nurnbcrof lransactions). W" divide cach obscrv.Hion in the sampte pcriod by lbe average oC its corres·ponding day of the weck. In particular \\le calculnted the following sultistics for all firms in thesample:
K,= (~' -I)X 100SlIJ
where ~ is the charactcristks being amtlysed. S, is the actual Jiquidity statistic during day 1, and 5(1)is the average of Ihe liquidity slatistic for lhe corresponding day of lhe weck. From day -1010 day+ 10 around lhe c\'cnt. the average of K. across all announccments is calculated. Thc cross-seclionaldistribution of this average is used lO study Ihe significance of lhe evcnl. Whitc standard errors areused. {-stalislics are presented in parenlhcses. Rcsults for the complete sample of dividendannouncement's are reponed.
Days around Spread' Dcpth·· Volumc··· Transactiolls::.mnounccmcnt
-4 -5.22 1.02 27.06 5.58( -0.84) (0.12) (0.91 ) (1.13)
-3 -2.26 0.35 19.29 -0.21( -0.22) (0.06) (0.76) ( -0.05)
-2 -5.80 22.55 54.76 0.57( -0.95) (0.96) ( 1.35) (0.12)
-1 -11.60 1.03 7.12 15.30( -2.56) (0.25) (0.84) (2.30)
O -12.37 6.70 26.47 15.33(-3.15) (0.86) (1.62) (2.14)
+1 2.56 0.49 -0.63 6.83(0.37) (0.09) ( -0.09) (1.30)
+2 -8.37 2.85 7.80 6.35(- 1.76) (0.41 ) (0.72) (1.25)
+3 -3.74 -1.36 5.19 2.59( -0.65) (-0.29) (0.48) (0.51 )
+4 9.4\ -5.\2 -7.70 2.93(0.73) (- 1.26) (- 1.23) (0.53)
'Sprcad = Ask-Bid."Depth = Deplh at ask+Depth al bid.
"·Volume is numbcr of sharcs tradcd.

".
, ,I o I
+ -+ ti! •
1 ] .. :i 6 1
, ~• • 10
Depth ISp....,d
I Volumc
~nlnsactions
I)¡¡ys
Fig.5. Mcasurcs 01' liquidity aroulld dividcnd annuunCCI1lcnts.
The results in Table 4 are partitioned according to whelher the dividend isincreased, maintained, or decrcascd relative lo lhe previous payment ovcr lhe(approximatcly) same lime of thc ycar befo re lhc announcemenl. As befare, lheevidence is consislent wilh ehange in informalion asymmelry risks, In lerms ofspread, Ihe major impacl OCCllrS for maintained and decreased dividends. Thereare significant reduclions in Ihe sprcad of bOlh groups of stocks during lhe daybefore the event, and on lhe day of Ihe dividend announcemenl. The spread forcompanies announcing less dividends diminishes by almosl 24%. It seems Ihal asignal corroboraling negalive proposals for Ihe companies eliminates polenlialinformal ion asymmelries. This would be rellecled in Ihe significant reduclion ofspread. On lhe othcr hand, lhe enormous increase in volume and Iransaclionsaround decreased dividend announcemenls should be poinled oul. Once again.lhe resulls rcgarding ehangcs in spread may simply rellecl lhe confoundingeffeels of eilher volume or lransaclions.
Finally, perecnlage ehanges in deplh are nol signirieantly dilTerent fromzero during event lime. However. in the case of inereased dividends, lhere seem10 be significant reduetions in deplh during the days immedialely afler theevenl. Intereslingly. Ihe reverse pallern is found for deereased dividendannouncemenls.
In general. our results mighl be inlerpreled in favour of liquidilY providersbeing sensilive lO changes in informalion asymmelry risk. Unfortunalely,however. il may be lhe case lha! spread and eilher volume or lransaclions arenegalively relaled. This m~IY aller lhe interprelalion of lhe resullS. The spccifierelalion bCl\Vccn sprcads, volumc, and transactions is investigated nexl.
5. Tite reJation between sprcads, volume and transactions
Unlikc lhe extcllsivc exisling cross-secliona\ evidence bctwcen spreads, volumeand lhe 11L1l11ber 01' transactions,l.' evidence rclatcd lO lhe time-series rclalionbCI\Vccn these variables is vcry limited. In fae!, wilhin a continuous dealermarkel, the firsl paper dealing c1ircclly wilh lhis issuc was recenlly published byLee el al. (1993). 1I sbould be nOled, however, Ihal Iheir evidence is exclusivelydirecled loward Ihe lemporal rclalion belween spread (and deplh) and volume.

Tablc 4
Percentage changcs in sprcad, dcpth, volumc and number of transaclions around dividend announcemenls c1assificd <lccording lO lhechange in the dividcnd paymcnt.
Far cach of the four charactcri~tio. cmploycd in lhe analysis (sprcad. Jcpth. volumc rlOd numhcr of lran~aclions).wc divide c¡¡eh ob~cr\lalion in lhe 1>arnplc period by lhe llverageof lb corrcsponding doy of Ihe wcck. In particulllr wc (alculalcd lhe following Slali:<llio. for :ill firms in Ihe samplc:
K,= (:' -1)XIOO510
whcrc K, is lhe char:tClcrb.tio bcing annl)'scd. S, i..: lhe ltCltllll [¡quidi'y Mati~lic durillg d:.y ,. ánd ~!l i!> Ihe (lvcrage of lhe liquidilY slati'j:tic fOT lhe corrco;pomling day of lhe wcck.From day ~ 10 lO da)' + Illuround lhe event. lhe average uf K, across all ann()unccmcnts i~ calcutmcd. Tlu:: cross-scctional disuibulion or lhi~ average j~ u:<ocd lO !>ludy lhesignificancc of lhe CVCIlI. Wllilc .slltn(!¡mJ crrors are llM:d. Hlali~liQ; are prcsclllcd in p:lrcnlhe~Cl>. RC"'utl" are reponed separalely ¡Iccording lO Ihe change in Ihe dividcndpaYll1cnl.
Days Incrcascd dividcnd.. M¡¡illlnillcd dividcnds Dccrcuscd dividcml"
Spread· Dcplh·· Volunlc··· Tran..t Sprcad DCplh Volumc Tr:lIl~ Sprcad DCplh Volunle Tmns
4 -5.47 -13.(17 9.98 -LOO 5.71 JO.34 59.11 5.17 -36.63 4.83 11.70 2U.71( -0.66) ( -2.87) ( l.Ió) ( -0.14) (052) (O.62) (0.97) (0.70) ( -6.48) (0.41 ) (058) ( 1.47)
-3 14.99 2.25 51.61 -4.35 -7.29 4.03 1.58 3.81 -24.09 4.89 2.73 19.06(0.57) ( 0.16) (0.76) ( -0.75) ( -0.93) (0.58) (0.10) ( 0.60) ( -3.38) ( 0.72) (0.16) (1.41 )
-2 -8.17 -1.65 37.21 -1.55 - 1.95 44.53 76.39 -2.41 - 11.82 9.50 28.65 13.75( -O."') (-0.15) (0.77) ( 0.24) ( -0.20) (0.94) (1.01 ) ( -0.34) (-1.14) (1.29) ( UMI) (1.01)
-1 -9.09 7.73 -7.68 -1.35 -11.78 ó57 6.43 12.03 -16.40 3.41 40.45 60.11( -1.08) (- 1.21) ( -0.78) (-0.21) (- 1.87) ( 1.03) (0.52) ( 1.42) (-1.71) (0.39) (1.39) (2.25)
O -8.79 -8.42 11.46 3.41 -11.02 -U.84 10.J7 3.32 -23.87 60.75 105.28 55.17( -1.35) (-1.21) (0.45) (0.52) ( - 1.87) ( U.I2) (0.77) (1.11) (-2.88) (1.59) ( 1.49) (1.87)
+1 -7.00 16.61 -11.05 -6.17 11.82 6.Q.l 0.6J 7.20 -4.27 20.44 21.38 33.29( -0.98) ("J.21) ( - 1.24) ( - 1.02) (0.97) (0.74) ( 0.07) (1.01) ( -0.18) (1.14) (0.81 ) (1.73)
+2 -1.58 -9.14 15.51 -8.IJ -9.89 -0.99 -OAO 10.83 -18.32 J9.4J 15.47 23.91( -O.IS) (-1.65) (0.64) ( 1.(9) (-1.44) (-0.17) ( -0.03) (1.51) ( -2.IJ) (1.12) (O.!>ll) (1.58)
+J 2.27 Ift.44 -6.82 - 11.82 -6.53 4.11 J.56 8.20 -8.29 18.8J 56.19 16.69(0.29) ( J.42) ( -0.J7) ( -1.66) ( -0.68) (0.57) ( O.JO) (1.10) ( -0.68) ( 1.46) ( 1.48) (1.11)
+4 J4.46 -15.10 11.95 -10.20 -J.99 -4.59 -5.92 10.15 -4.42 14.45 3.90 9.62(1.06) (-J.21) I 1.19) ( 1.47) (-0.37) ( -U.72) ( -0.70) (1.23) ( -0.34) ( 1.25) ( -0.21) (0.58)
·Sprcad = Ask -Bid. ··Dcplh "" Dcplh al ask+ IRplh al bid. ···Volumc ¡lo numhcr of shurcs Intdcd. tTran~ ilo Ihe numbcr of lransaclions.

They ignore lhe pOlenlial erfeC1S 01' the number 01' lransaclions. \t torns oul. aswe will discuss in lhis seclion. lhal the appare11lly slrong relalion belween spreadand volumc is cancelled out whenever we control for lhe number 01' lransaclions.
From a lheorelical poinl 01' view we have, as discussed by Lee er al., lworelevanl and compeling hYPolheses thal may help us to undersland lhe relalionbetween these variables. Easley and O'Hara (\992) argue lhal the slOchasticprocess of prices dcpends on limc per se and volume. Hence, in lhcir model, itis volume as of a particular timc I lhal influence the distribulion 01' prices overlhe ncxt periodo This implies lhat volumc bccomes a signal for the markelmaker. A large volume is equivale11l lO a grealer probability of facing informedtraders. Therefore lhe specialist widens spread lO compensate for the addilionaladverse seleclion. Thus, lheir model predicls a POSilivc relalion belween spreadand volumc in a time-series framcwork.
On the other hand, Harris and Raviv (1993) suggesl a model in which agenlsreceivc lhc same informalion. However, rhese agcnls differ in lhe way in whichlhey undersland lhis common informalion. Volume shocks are simply a consequence 01' lhe lack of agreemenl among participanls in lhe markel. This contextimplie lhal higher volume should be relaled lO liquidity providers sending limilorders in bOlh sides 01' lhe markel as a result 01' differences on opinion. This maylend to reduce the bid-ask spread."
Given lhese argumenls, il seems lhal lhe time- eries relalion between spreadand volume should be empirically analyscd. This is exaclly whal Lee el al. (1993)do. Intereslingly. one may suggesl lhat lhese models reflect primarily a rclalionbetween lhe numbcr 01' transaclions and lhe spread. This is lhe case given lhat,in both models, lhe size 01' each lransaclion is normalised lO unily. Neverthclcss,whal we really may affirm is lhal lheir models cannol distinguish belweenvolume and lhc number 01' lransaclions. Again, empirically documented evidenceshould be cmployed lO infer whelher lhe lime-series relalion is dominaled byeither volume or lransactions.
\n oreler lO investigale lhis issue, lhe following lime-series regression is run foreach slOck in lhe sample wilh e1aily e1ala from 2 January 1991 to 18 Oclober1994:
Spreael, = ~ + ¡i,NV, + ¡J"NN, +,/,
wherc lhe spread variable is given by:
(3)
(SP, )-_--\ x 100
SP,,,
where SP, is lhe actual spread during day r, and SP", is the average spread forthe corresponeling day 01' lhe week over lhe whole periodo The normaliseelvolume (NV) and normaliseellransaclions (NN) are given by:
JVOL, rN:NV, = VOL(»; NN, = -J~
where VOL, is lhe number 01' shares lraded in each slock during e1ay 1, N,represenls lhe number 01' lransaclions 01' each slOck during day r, and VOL I" anel

Ñ1,) are, as befo re and respectively, lhe average of volume and lransaclions fortheir corresponding day of lhe week. II should bc poinlcd oul lhal lhe distribulions of the explanatory variables are highly skewed. Thus, lhe square rools ofthe variables are employed so thal outliers do not dominate the empiricalevidence. Moreovcr, given lhal the re iduals from OLS regressions are 010 tlysignificantly autocorrelated, the regrcssiolls are repeated with an autoregressivelerm, and using lhe well known procedure suggested by Cochrane-Orcutl. BOlhlypes of adjustments produce identical qualitative results.
Table 5 reports the results. The coefficienls conlained in tlle lable arc lhecross-seclional average of all individual regressions. In parenlhesis, we reporl lheI-statistics under the null hypothcsis lhat the cross-sectional mean of the cocfficient equals zero. While-consislent standard errors are used.
The results show a very strong negalive relation between volume and spreads.In our time-series framework this suggesls Ihat, in the continuous auclionSpanish markel, spreads lend to be smaller during periods of higher volumc.This is exactly conlrary to the evidence reported by Lee el al. for lhe US markel.At the same time, it turns out lhal Ihere exists an even slrongcr negative relationbetween transaclions and spreads. This empirical evidence eems, therefore,consislent with the Harris and Raviv (1993) prediction lhal spreads and eilher(in their model) volume or transaclions are negalively associated.
The most striking rcsult of Table 5 is lhat the significant negalive relationbetween volume and spreads tends lo be cancelled oul when we indude simullaneously volume and the number of transaclions in the regressions. The slrongnegative relation between transaclions and spreads is maintained, bul the negative association between volume and spreads becomes statistically insignificanl.This is an important result, and il to a cenain extcnl juslifies microstrucluretheorelical model in which all trades are normalised to be of unit size. II maybe argued that we should have employed the average lrade size ralher than the10lal number of- shares as an explanatory variable. This would be the mostnatural decomposition of Ihe effects of volume on spreads. Of course, volume isthe average trade size limes lhe number of transaclions. However, it was decidedto keep volume so that we are able lo provide a direct comparison with lheresulls obtained by Lee el al. Morcover. we may havc a multicollincarity problcmin the regressions given by equation (3). The range of the correlation coefficiel1lsbClween the normalised volume and the normalised number of transactions foreach firm in Ihe sample goes from DAD to 0.90. II muSl be pointed OUI thal, inall cases, independently of the correlation coefficicnl. the effecl of volumedisappears when the number of transaclions is taken in lO accounl.
We may condude Ihat spreads lend to decrease during periods of highernumber of transaclions. In the conlexl of the Harris and Raviv (1993) model, wemay argue that lhe increased number of transaclions primarily denoles anincrease in liquidity Irading through public limil orders. In facl. when we regresslhe percenlage change of depth on Ihe normalised number of lransactions, it isfound thal there is a positive, significant relation between depth and lransactions. This dearly suggests thal market liquidity lends to increase Wilh thenumber of transactions."
This result naturally leads towards further invesligalion of lhe number oftransaclions as a key aspecl of lhe process of stock price adjustmenls. This is lhenext issue looked at in Ihis papel.

6. The relalion belween volalilily, volume and lransaclions
One way in which we may juslify lhe imponance of lhe number of lransacljonswilhin an cmpirical contexl of assel pricing is by analysing Ihe relalion belweenlransaclions and volalilily.
80lh Ihe lheorelical models and empirical work relaled lO informalion effeclson assel pricing have generally accepled lhc popular view Ihal 'jI lake volumclo move priccs'. In panicular, microslruclUre theory under asymmctrjc informalion suggests lhal informcd traders send small-sized Irades in order lO avoidlosing Iheir comparalive advantage.'· This view assumes lhal the information
Table 5Thc rchuion bctwccn volul11c. numbcr of Iransaclions and sprcad.
For e;Jch stock in lhe samplc. a limc·serics rcgrcssion is nm wilh sprcad as Ihe dependen! vilriilbleand vollJlne, lile ll11mbcr of Iransaclions or bOLh as Ibe indcpcndclll vari,thles. In panicular. forcach stock lhe following rcgrcssion w¡lh duily data from January 1991 10 OClOber 1994 isperformcd:
Sprcad¡ = 2 + Il,NV, + {1"NN, + '/,whefe ¡he sprcad variable is givcn hy:
(5P, )-_--1 x 100
SP¡,\
whcrc SP, i~ Ihe actual spread during day 1, and Si'vl is lhe average of lhe sprcad for lhecurresponding day of lhe weck. Thc normaliscd volumc (NV) and nnrmalised transactions (NN) aregiven hy:
N,NV,=VOL,
NN,=VOL r" Ñ1n
The reponed cocfficiclIts are (he cross-scctiollal average across al! stock.-; in Ihe sClmplc. In parcn 4
thescs \Ve reporl (he I-Sl<llislics undcr lhe null hYPOlhcsis that Ihe cross-scctional mean of (hecocfficicnls i~ zeft).
Panel A: Rcgrcssiol1s with no corrcclion for serial i.IulOcorrclalions in lhe residlmls
~ /l,
Model 1 (Volume) 33.92 -39.25(10.34) ( -10.77)
Modcl 2 (Transaclions) 60.99( 10.30)
Model 3 (Bolh) 61.21 -4.70(8.99) ( -0.97)
{I,
-65.60(-10.51)
-61.37(-6.01)
Panel B: Rcgrcssiol1s wilh Cochranc-Orcult iterations~ /l, {J,
Model I (Volu",e) 30.48 -35.53( 11.22) (-11.91)
Modcl 2 (Transactions) 63.53 -68.77(12.26) ( -12.(3)
Model3 (l3olh) 64.16 -0.63 -69.89( 11.88) ( - 0.28) ( -10.96)

cOn!ent of lhe trading behaviour of inve tors is directly relaled lO lhe size oftrades. On the other hand, from an empirical poinl of view, il has been amplydocumen!ed that lhere exists a positive relation between volume and volalility.17
In a very importan! paper, however. Jones el al. (1994) show that on averagethe size of trades has virtually no incremenlal information con!en! once lhenumber of transaclion is taken in!o account. In olher words, the well accepledpositive relation between volume and volatility becomes in ignificantly differentfrom zero when volatililY is conditioned on lhe number of transactions.
This finding may explain lhe strong relation lhal we found belween spreadsand lhe number of trllnSaclions wilhin a lime-series framework. The informationcontent in lrading behaviour is captured lhrough the number of lransactions lhaltake place during a particular interval of lime.
Given lhe importan! differences in lhe lrading mechanism belween a eonlinuous dealer markel and our eontinuous auction markel. it was decided toanalyse the relation belween volatility and the number of transaction .
In order ta estimale the conditional standard deviations of daily returns, theprocedure suggested by Schwert (1990), and employed by Jones el al. (1994), isfollowed. lt is an extremely ea y way to estimate condilional volatilities and, atthe same time, the procedure allows for stylised facts concerning stock returnvolatility.
We first cslimale lhe unexpected relurn on day I for all stocks in the samplewilh conlinuous data from 2 January 1991 to 18 Octaber 1994. Thus, a total of60 securilies are available for the exercise. The unexpected retums of lheseslocks are given by the residuals of the following regression model:
5 I!
R" = ¿ 7,P" + ¿ il,R" ,+e.,J"" 1 t= 1
(5)
Given thal lhe expeclation of lhe absolute value of a normal random variableequals (2/,,)!r- limes it standard devialion, the absolute residuals of equation (5)are multiplied by (2/,,)-10 to get lhe volalility of unexpected relurns. l' In lheregression aboye, five day-of-the-week dummies are included lO capture differences in mean returns. Moreover, tock relurns are regressed on 12 laggedreturns lO estimate short-term movements in eonditional expected returns.
The e estimates of conditional volatility are regres ed on lhe number of transaClions and the average lrade size (tolal number of shares divided by the numberof lransaction ) to delermine the relative imporlance of bolh variables. Thisexercise is performed by dividing lhe total number of slocks in!o five size-sortedportfolios, where ranking is obtained according to lhe market value of all 60securilies al lhe end of 1992. This dale corresponds lo lhe midpoinl 01' oursampling periodo In particular, for individual slocks within each of lhe five sizesorted portfolios. we run seemingly unrelated regressions of our estimates ofdaily conditional volatility of returns on a lrading-gap dummy variable. averagetrade ize, number of lransactions. and 12 lagged absolute residuals from equation (5) to correct any persislence of volalilily:l'
l'lío" I = ~,+IJ,,,,DM,+II,, 'A v"+fJ,,,ft,+ ¿ p" It" ,1 +w" (6)
poi

where D", equals 1 for Mondays and Ootherwise, A V" is lhe average trade size01' stock i wilhin a pOrlfolio p. N" represenls the nllmber 01' transaclions al' stocki in portfolio p, and jJ" measllres lhe persislence 01' volalilily in slOck i.
Tbe results are conlained in Table 6. It seems thal volatilily is primarilydetermined by the number 01' transaclions. In all porlfolios, lhere exisls a strongposilive relation between lransactions and volatility. The information conlenl 01'lrading behaviollr is basically conlained in lhe nllmber of transaclions during lheday. It is also the case lhal lhere is a positive relalion belween volatility andaverage lrade size for the smallesl firms. However, it seems evident thal theeconomic significanee of lhis relalion is negligiblc relalive lO the imporlance ofthe nllmber 01' transaclions. It shollld al O be nOled lhal lhe relalion belweenaverage lrade size and volalility beeomes negative for large firms. Neverlheless,the economie relevance 01' lhis relalion seems 10 be ralher smal!. Al lhe sametime, lhere is (almosl) a deereasing monolOnie relalion between lhe relaliveimpacl 01' lransactions on volatility anel firm size wilh lhe effeel largesl for lhesmallesl firms. This sllggesls lhat the information eontent 01' lrading ineorporaled inlo lhe number al' transaclions is parlicularly relevant for small firms.It may be lhe case lhal lhe relalively liule information aboul small firms may belhe reason behind these reslllts. Finally, il is inleresting lo poinl oul thedecreasing monOlonic relation belween the nMgnilllde al' lhe coefficiems associated lo lhe Monday dummy variable and firm size.
Table 6Thc rclalion bctwccn \lolul11c. numbcr 01' lransaclions anu volalilily.
Eslimalcs of sccmingly unrclalcd rcgrc!lo~ions of daily pcrcentag~ VOhtlility of rclurn" on a dailyIrading-gap dummy variahle. ilvcmgc (racle ilizc. numhcr uf d:lily lrilllsilctions ami 12 laggcd;.¡hsotul~ rcsidllul:..:
"[1:,,1 =:J.,+It..JJD\I,+rl,."i~+ll",/Fr:,+ L 'J"I':" ,1 +w".. ,
whcrc 1;:" 1 i~ Ihe absolulC "<tIlle uf Ihe rcturn or stock i in day f cnndilional on il.l'l OWIl 12 1ag~ ilndday-of-Ihc-wcck dummics. Thcsc valucs are Illultipli('d by (2/n) 1:'01" cquals I fOf Mondays and Oothcrwisc.1I v" i~ (he avcragt:: ¡raclc sizc. nnd NI! is Ihe l1umber of ¡rimSilClions for stock i 011 day l.
The stocks in lhe samplc have unhrokcn series of daily closing tranS<lcliun priccs fmm January 1991lo Octobcr 199-t. Thcsc slocks are c1assificd inlO fi"c portfolios according lO Ihcir mmkcl v"lue JIIhe ene! of 1992. Sccmingly unrclated regression!o> are run for individual slOcks within cach sizcsorted portfolio. Eclch portfolio contrlins 12 ::-'UlCks. l-stali~lics in p<lrcnlhcscs.
Portfolios {Jml {J" fim
MVALl 0.4540 0.(1045 0.2285(5.06) (2.10) (25.96)
MVAL2 0.3210 -0.0009 0.1254(4.66) ( -0.49) (22.81 )
MVAL3 0.1872 -0.0056 0.1505(2.80) (-3.04) (22.14)
MVAL4 0.1552 -0.0090 0.0861(1.55) (-6.011) (15.17)
MVALS 00245 -0.0066 0.0769(0.49) ( -5.86) (22.84)

AJI this evidence may indicate lhal the effecls of dividend announcements onspread may change if we control for lhe apparently large information content oftrading contained in the number of transactions. This issue is analysed in thenexl section of lhe paper.
7. Dividend announcements and bid-ask spreads: multivariate empíricalevidence
Given an empirical evidence found in Seclions 5 and 6, it becomes necessary tostudy whether lhe apparent reduclion in information asymmelry risks of Tables3 and 4 documents eithcr a changing compensation of adverse seleclion duringdividends announcements or simply reflects lhe general relalion belween spreadsalld lransactions.
This issue is particularly relevant for the literalure dealing with lhe sensitivityof liquidity providers to the arrival of new informalion which may aller asymmetries of information among agents. It should be noted that the paper by Lee el
al. (1993) conlrols for volume when analysing the impact of earnings announcements on markel liquidity. However, lhey ignore thc potential effects of thenumber of lransaclions, which may be reaJly behind lheir significanl results. Ourplan for lhis seclion is lO sludy the impact of dividend announeements on spreadconlroJling for bOlh volume and transactions in two separate multiple regressiontesis. This would aJlow us lO reach precise conclusions about changing compensalion of adverse selection.
In order 10 carry out these tests, a lime-series regrcssion is ron for each stockin lhe sample lhat had at least one dividend announccment with the percentageseasonaJly adjusted spread as the dependent variable, and event period dummyvariables, and eilher volume or transaclions as the independent variables. Inparticular the foJlowing regression with daily dala from 2 January 1991 lO 18October 1994 is performed for each stock:
(7)r- -4
where. as in equation (3), the spread variable is given by:
(SP, )-.--1 x 100SPV)
and lhe conlrol variable, ev" is eilhcr the normalised volume or thc normalisedtransaclions of equation (3):
NV.= JVOL'. - 1f't _, NN,-VOL I,) Ñ(,)
To capture spread shifts around dividend announeements a dummy variable,D,,, is included which equals I if observalion I is event day r and O olherwise.The coefficients associated wilh these indicator variables represent changes inlhe mean of thc spread during the event period, after controJling for lhe polen-

lial effeels of eilher volume or lransaelions. Finally, Ihe error lerm of equalion(7) is a sumed 10 be, 1), = ti, + ;'11, " where ;' is Ihe AR( 1) paramelers. and ti, is anindependent and identieally distribuled normal variable with mean zero andconstant variance.
The results are eontained in Table 7. The reported coeffieients are lhe crossseelional average of Ihe eSlimaled coefficients oblained wilh Ihe individualregressions given by Ihe expression (7). As before. in parel1lheses we presenl Ihel-stalislics under lhe null hypolhesis thal lhe eross-seelional mean of lhe coeffieienls equals zero. White consislenl slandard errors are used. This table showslhe results ror lhe eomplele sample of 157 dividends announeemenls.
The eonclusions lhal may be drawn from Tablc 7 are clear. Conlrolling for lhenumber of Iransaelions does affeel lhe resulls about lhe impaet of dividendsannouneemenls on the spread a day before Ihe announeement, as well as duringIhe announcement period.'" The signifieant 12'Y reduclion in spread that wereported in Table 3 for the day of lhe announcement decreases lO an insignificant 4% once we control for Ihe number of Iransaclions. It is interesting lO nolelhal lhe deerease also beeomes insignificant when we control for volume. In lhiscase, however, lhe magnilude or lhe reduelion remains around 6% (wilh a 1
slalislie of 1.57). Very similar resulls are round ror Ihe day before lheannouneemen!. In general, eonlrolling for lhe number or lransaelions has largereffeels on the mean shirls of lhe spread over Ihe whole evenl window lhaneontrolling ror volume. This is of course Ihe result we expeeted. given lheevidenee eOl1lained in Tables 5 and 6.
There is anolher sense in whieh eontrolling for the number of Iransaclions inlhis lype of slUdy may be lhe appropriale way 10 perform lhe analysis. Moreover,lhis may be a particularly relevant issue for conlinuous auction markels. In areccnl working paper, Kumar and Seppi (1993) show Ihat when limil orders andmarkel orders are allowed lO eo-exisl, the slruelure of lhe limil book maypresenl a widening spread belween Ihe best buy and . ell orders exclusively duelO élnticipatcd increases in stock rcturn volatility arollnd dividcnd anl10UIlCemel1ls. The poinl which lhey emphasise is lhal lhis may even be the case withouladverse seleelion. In our case, lhe impacl is nol significant so lhal Ihe polenlialdislurhing effeels of anlieipaled volmilily does nol seem lO be relevan!. Ingeneral. however. lhe resulls of Tahle 6 suggesl lhal eonlrolling ror lhe numberof lransaelions would tend 10 avoid eonfounding effeelS between adverse seleclion and antieipaled volalilily. This implies Ihat by including lhe numher oflransaclions in our regressions we may be in fael eliminating Ihese crfeels."
The empirieal evidenee in Table 7 complelely reverses Ihc parlial eonclusionswe drew from Tahle 3. Liquidily providers do nol seem to be sensilive tochanging informalion risks around dividend announeemenls. Henee, lhe bid-askspread does nol seem lo contain any eompensalion ror adverse seleclion. In lheeontinuous Spanish Slock Exehange auelion lrading mechanism. we do nol findany evidence after conlrolling for lhe Ilumbcr of LransacLions thal informatiollasymmelry deereases during dividend announcements. 1I may be argued, oreourse. Ihat an allernalive bul coherenl explanalion of our results may simply bethat dividend announcements are n01 an adcquate proxy for information asyrnmelries among market participants. It may be also possible lhm bOlh spread andIransaetions (or volume) are endogenously delermined. Ir lhis is lhe case. Iheresults rnay suggcSl lha1 our way of cOl1lrolling for Lhe numbcr of transactions

Tablc 7
Changc.s in spread around dividcnd announcemcnts controlling for eithcr volumc ornumber of transactions.
For each stock in lhe samplc that had 31 IcaSI one dividend announcemcnt, a time-seriesrcgression is Tun with sprcad as lhe dependent variable and evcnt period dummy variables. 3nd eithcr volumc or lhe numbcr of transactions as lhe indepcndenl variables. Inparticular the following regression with daily dala from January 1991 \O Oclober 1994 ispcrformcd for each stock:
Spread, ~ • + fJ" ev, + ¿ b,Du + IJ,
where lhe sprcad variable is given by: t_ 4
(SP, )-_--1 x 100
SP¡,j
whcrc sr, is Ihe actual sprc<ld during day l. ¡;Itld SP(I) is Ihe average of Ihe spread for lhecorrcspollding day of Ihe weck. Thc control variable. ev" is cilher Ilúrmalised volumc (NV) andIlormalised Iransaclions (NN). and are givcn by:
NV - JVOL, . - ff:',- _. NN, - -VOL!lj Ñ(,J
D II cquals 1 ir observulion lis evcllI day t ane! o olherwisc. The error lcrm is givcl1 by: ", = 1t¡+}'lJ'_I'
whcrc ¡' is lhe AR(I) pUramc.lcr and IIr is jid normal with mean zem tllld constan! vafiance. Thcreported cocfficienlg ¿lrc lhe cross-sectional average across al! cocfficienls. In parcnlhescs wc reportlhe (·stalistics undcr the null hypolhesis lhar lhe cross-sectional mean oC Ihe eocfficients cqualszero. White standard errors are used. RcsullS for lhe complete sample oC dividend announccmentsare reported.
Coeffs Rcgrcssions with transactions Rcgrcssions with volumc
{la -SO.S7 -42.88( -17.72) (-16.10)
~( -4) -0.422 - 1.628( -O.OS) (-0.31)
b( -3) -0.505 -0.632( -0.05) ( -0.06)
~( -2) -4.740 -0.726( -O.SO) (-0.12)
~(- 1) -3.221 -6. 74( -0.68) (- 1.57)
~(O) -4.159 -6.144(-0.91) (- 1.34)
~(+ 1) 7.472 6.115(1.14) (0.91)
~( +2) -3.947 -5.442( -0.S2) (-1.14)
~( +3) - 1.339 -2.501( -0.24) ( -0.43)
~( +4) II.99S 9.207(0.96) (0.73)

and volume goes lOo far. This is a very conlroversial issue. UnfOrlunalely, we donol know lhe proper way of dealing wilh lhis pOlenlial problem.
Panels A and B of Table 8 conlain similar empirical evidence. In lhese lwOpanels, lhe results are parlilioned by lhe increased, mainlained, or c1ecrcaseddividends relalive lO lhe previous paymcnt al (approximalely) lhe same lime lheyear before lhe announcemenl. For Ihe firsl lwO groups we do nol find anysignificant ehange in lhe bid-ask spread during lhe evenl window from day -4lO day +4. It should be recallecl lhal before we conlrolled for lhe number oflransaclions lhc reduclion of sprcacl on lhc c1ay before lhc announcemenl, aswell as during lhe evcnl day, was larger for eompanies announcing a decrease intheir dividend payments. In olher words, a negative signal seemed lO convey avery slrong reduclion in informalion asymmelry risks. This was a ralhersurprising resull. In fael, we may now conciude Ihat lhe negalive relalionbelween Ihe number of lransaclions and spreads explains lhe significanl changein informalion asymmelry risks found in Table 3. We observe from Panel A ofTable 8 lhal lhe former reduclions of spread even become posilive afler weconlrol for lhe number of transaclions. 11 shoulcl be recognised lhal our lhreegroups of dividend changes exhibit some evidence of differenlial effecls duringthe day before Ihe announcemenl. Increasecl dividencl firms have a .10% reduelion in spreacl (t-slatislics of 1.22), mainlained dividend slOcks more lhan 4% fallin spread, whilsl deereased dividend companies presenl a positive ehange of 15%(t-Slalislics of 1.23). In any case, neilher of lhese pereenlage changes is significantly differenl from zero.
Panel B of Table 8 shows lhal Ihe same resull holds lrue when we conlrol forlhe number of shares Iraded.
In general, we may suggesl lhal lhe arrival of negalive news aboul lhe fulureprospecls of a firm does nol sccm lO incorporale changes in informalion asymmelry risk beyoncl whal is normally eonveyed Ihrough increased number oflransaclions. 11 should be poinled OUI, however, lhal lhere is an exeeplion. Theimpacl on spread remains negalive and significant four days before IheannounCemenl. even after we conlrol for lhe number of lransaclions. Ir lradersanlicipate lhe announcemenl dale for pOlenlially dislres ed companies, Iheremay be an increase in lheir liquidily Ihal may bc renecled somehow in lhereduclion of spread. It should be poinled OUI lhal lhis group of announcemenlsexhibilS high and posilive percenlage changes in lhe number of lransaclions fromday -4 lO day + 2. This suggests lhal informalion arrives lO lhe markel fourdays before lhe announcemenl. We also find some negalive percentage changesin Ihe spread of Ihese companies during lhe days befo re and up lO Ihe evenlwindow employecl in Table 8. As before, il may be an indicalion lhal lhe limingIhroughoUI Ihe year of dividcnd announcemenls is prcdiclable. Howcvcr, negalive percentagc changes Call11ot be attributed to advcrsc selectioll. During theseprc-announcemenl days, sprcad should become wider if adverse seleelion isbehind Ihe observed changes of spread.
Finally, if relalively lillle informalion about small firms reaches lhe markelduring periocls olber lhan c1iviclencl announcements, we might expecl dividendchange annoullcements lO convey more information for smal! firms lhan forlarge firms. In order lO analyse Ihis possibility, we divide our sample in lwOgroups aceorcling lO Ibe size of companies al lhe end of lhe year preeeding lheannouncement. Thcre are 36 dividend annoullcerncnts of smal! firms, and J21

Tablc 8
Changcs in sprcad around dividcnd announcerncnls eontrolling for cither volume ornumber af transactions. Announccrncnts are c1assificd according to lhe changc in Ihe
dividend paymenl.
For each stock in Ihe samplc Ihat had al lc<lst one dividend annOlll1Ceml;:nt, a timc·l)cries rcgrcssiol1is run with spread :'IS lhe depcndcnl variable .md cvcnl pcriod dummy variables. and eilhcr volumeor lhe number of transactions ;:t5 lhe indcpendcnl variables. In particular Ihe following regrcssionWilh daily data (rom January 1991 (O Octobcr 1994 is performed ror each stock:
.'Spread, = x+PnCV;+ L ti.D rr +,,,
,- .whcrc lhe sprcad vl.lril.lble is givcn by:
(SP, )-.--1 x 100
SP(fl
whcre SP, is Ihe actual sprcad duríng day t. and 51'1" is lhe average of Ihe sprcad for ¡hecorresponding day of Ihe wcck. The conlrol variable. ev,. is eilhcr normaliscd volume (NV) andnormalised lransaclions (NN). and are givcn by:
N~ = JVOl.,. MM = r;;I VOLclI' , V~
D", equals I ir obscrvation (is eVCIl( day r and oolhcrwisc. The error terro is given by: I~ = u,+:'tlr l.
whcrc l' is the AR(I) pararncler and /t, is iid normal Wilh mean zero and conslanl variance. Thereponed coefficicnts are Ihe cross-seclional avcnlge across all coefficicnts. In parcnlhescs we reponIhe t-stalistics ullder Ihe null hypolhcsis Ihat lhe cross·scctional mean or lhe cocfficicnls cqualszero. Whitc standard crrors "Ire uscd.
Cocffs Panel A: Rcgressions with Lransactions
Incrcascd dividcnds Maintained dividcnds Dccrcased dividends
p" -88.097 -72.186 -90.984( -10.26) (- 11.62) ( -9.96)
ó( -4) - 1.893 7.126 -19.372(-0.24) (0.85) (-2.58)
ó( -3) 15.318 -7.405 -13.805(0.59) (- 1.00) ( -1.53)
ó( -2) -8.539 -2.438 -3.431( -0.88) ( -0.26) ( -0.33)
ó( -1) -10.147 -4.691 15.730( - 1.22) ( -0.77) (1.23)
Ó(O) -6.089 -7.109 8.546( -0.85) ( -1.17) (0.60)
ó( + 1) -7.138 15.987 13.4 7(- 1.02) (1.39) (0.97)
b( +2) -3.721 -4.715 -2.177(-0.44) ( -0.(8) ( -0.20)
(j( + 3) -1.090 -2.856 2.567(-0.13) ( -0.31) (0.20)
ó( +4) 32.599 0.521 1.972(1.01) (0.05) (0.15)

Tablc 8 - conrinucd
Cocffs Panel B: Rcgrcssions wirh volume
Inc:rcased dividcnds Mainraincd dividcnds Dccrcascd dividcnds
(i" -43.359 -39.372 -52.149( -10.67) (-10.10) (- 7.35)
<l( -4) -3.036 8.044 -26.920( -0.40) (0.89) ( -4.05)
,j(-3) 17.596 -7.075 -20.356(0.65) ( -0.93) ( -2.43)
<l( - 2) -6.329 3.857 -2.270( -0.64) (0.41 ) ( -0.20)
el( - 1) -11.092 -6.441 0.783(- 1.42) (- 1.07) (0.07)
<leO) -7.166 -7.689 0.535(-0.81) (- 1.33) (0.05)
,j( + 1) -6.597 15.28 6.193( -0.96) ( 1.30) (0.40)
<l( + 2) -0.192 - 7.532 -10.442( -0.02) (-1.14) (-1.15)
<l( + 3) 1.046 -5.800 -0.364(0.13) ( -0.62) ( -0.03)
<l(+4) 31.836 -2.997 -2.989(0.99) ( -0.29) ( -0.24)
announcements 01' large firm . It should be ciear lhat lhe ranking of lhesecompanie is cstablished using all the slocks in our sample, and not onlycompanies wilh dividend announcemems. This implies lhal eilher small or largeis defined similarly lO lhc porlfolios used in lhe first part 01' lhis paper.
The empirical results, nol shown in lhis paper, do nol reveal any significamchange in spread during the evelll window. It is inleresting 10 note, however, thatthe decrease in spread is found lO be larger for thc companies wilh lhc largestll1arket value.
A final word 01' caution. Given data availabilily, it is not possible lO employ ameasure 01' the effective (implicil) bid-ask spread. Lec el al. (1993), andPelcrscn and Fialkowski (1994) argue lhal effeclive sprcad rather than quoledspread is lhe relcvanl measure 01' transaclion costs faccd by investors. Effeclivespread measures lhe avcrage spread paid on lhe shares transacted during a givenperiodo In this sense, ollr data seems to be a reasonable approximation.However, cffeclive spread is volull1c-wcighICd. Furthcr rcsearch as well as moreprccise dala may help lO ciarify these unsolved issues.
8. Summary and conclusions
This paper has analysed liquidily changes in response to dividend announcemcnts for a representativc sample of stocks traded in the contilluous SpanishStock Exchangc aucLion systCll1. The prcvious empirical evidence is limilcd tocOlllinuous dealer markels where bOlh lhc spread and depth are eSlablished bymarket makcrs. It is also the case lhat previous research has concenlraled

on the impact of earnings announcements. We argue that similar adverseelection compensation might be pan of the implicit bid-ask spread in
continuous auction trading mechanisms. Moreover, previous statistical de ignhave controlled for contemporaneous volume. Our resuhs indicate thatnumber of Iransactions is the appropriare controlling variable when analysingchanges in information asymmelry risks around either dividend or earningsannouncements.
Interestingly liquidily and lrading regularities have been found in the continuous Spanish market. However. dividend announcements do not seem 10 conveysignificant changes in information asymmetry risks. Neither spread nor ourmeasure of depth changc significantly during Ihe day of the announcemenl orduring the post-announcement period after wc control for the reaction in thenumber of transactions. Hence, adverse selection does not seem to be pan of theimplicit bid-ask spread, at least when we limir our allention to dividendannouncements.
Contrary 10 Ihe evidence reponed for earnings announcemenlS in Ihe USdealer market, we do nol observe any indication that liquidity providers aresensitive to changes in information asymmetry risks. To discover wherher theseresu)rs are due lO the idiosyncratic characteristic of the announcement or,ahernatively, they renect imponant difierences in trading mechanism , requiresfurlher research.
Notes
We are gratcful lo Roberto Blanco rroOl lhe Spanish ecurity Exchange Commis ion andJorge Yzaguirre from the Spanish Stock Exchange for providing the data necessary toperform this study. Versions of this paper were presented al the Fundación BBV IIJornadas de Economía Financiera (Bilbao. Junc 1995). lhe Europea" Financial Managcme"1 Associalion. 41h Annual Meeting (Landa". Junc 1995), Ihe 111 Foro de Finanzas(Bilbao, Novembcr 1995) and the eonferenee on European Finaneial Markets: MicrostrucLure and RcgulaLiol1 (Londol1, Ji:llluary 1996). Wc are grateful for helpful commentsfrom participants ando in particular, frol11 Ignacio Peña, Raf"lcl Salinas, Kaj Hcdvall,Louis Chan, and Yakov Amihud. We would also like to aeknowledge the financialsupport providcd by Ihe Dirección General Intcrministerial Científica y Técnica(DGICYT). projeet no. PB94-1373. The conlents of this paper are the sole responsibilityof the aUlhors.
1. The Toronto Stock Exchangc first adopted Ihis system in 1977. The Tokyo StockExchange and the Paris Boursc are also examples of this rype of tnlding mechanism.Hamao and Hasbrouek (1995) and Biais el al. (1994) prescnt a detailed descriptionof Ihe dynamics of trades and quotes for both markcts. Thcy al50 discuss the generalinstinnional eharaeteristies of these markets. On the other hand. OIosten (1994)provides an analysis of the nature of equilibrium of an idealiscd electronic opcn I¡mitorder book and how it competes against other methods of exchanging securilies.
2. See Lee el al. (1993) for a detailed analysis.3. Of course. spread is underslood as the diffcrence betwcen lhe best ask and lhe best
bid availablc at any particular poinl in time. The cxacl mcasure of the spreadcmployed in the analysis will be dcscribcd ¡mer.
4. This samplc represents more Ihan 90% of total market capitalis3lion at any limeduring the sampling periodo
5. Al! stocks includcd in the second data scl belong lO Ihe firsl data set. Wc have a tOlalof 959 trading days.

6. See Rubio (1988) for delails.7. Due lO tax-induced trading. turnovcr of 5111all firms is Illuch largcr during Dcccmbcr
and January.¡See Basarrale and Rubio (1994)1.See also Ihe work by Brennan and Subrahlllanyalll (1994). They elllploy an alternative mcasurc of dCplh lO Mudy lhe compcn~ation of advcrsc sclcclion in stockrcturns.
9. We employ lhe {crOl rclalivc spread Of pcrccntagc sprcad indistínctly throughoul Ihepaper.
10. See Miller and Roek (1985).11. For the US markel see, alllong others. Asquith and Mullins (1983). Bajaj and Vijh
(1990). and John and Lang (1991). Reeenlly, González (1995) has reponed evideneeconsistell1 witll significant infonnation COI1ICI1I of dividcnd changes in Ihe SpanishStock Exchange.
12. While-consistenl standard crrors are cmploycd. II should be rccaHed Ihm in lhe caseof lhe sprcad, S, is lhe absolulC valuc of lhe sprcad. Of coursc. S, is dividcd by Iheaverage of lhe !<lprcad for Ihe corrcsponding day of lhe wcek. This implic~ tllat OUT
rncasurc is 110t biased by pricc cffects. Our ~latislic b consistenl with a measuredefincd in lerms of lhe rclativc spread.
13. Scc Mclnish and Wood (1992) fur a rcccnt summary of litcraturc. and I1CW evidencewith ¡nlraday data.
14. This argumcnt assumcs a ncgative relatiun between depth and spreads.15. The same positive rclaljon is found betwccn volul11c and sprcads.16. See Kyle (1985), and Adlllati and Pflcidcrer (1988).17. Sec Gallanl el al. (1992).IS. This cSlimator is unbiascd if lhe condilional dislribulion 01' returns is normal.19. Each regrcssiun is performcd with 12 stocks and 959 daily observalions. The average
correlalion bct\Vccn the average lrade sizc and lhe numbcr of transactions across allsccuritics in the samplc is 0.09.
20. In principie. confounding cffccts bCIWCCI1 transactions and changing information risksmay be rclcvant onJy during Ihe announcel11ent and pusHlnnounccment periods.Nole. howcver. thal dividclld i:lnnouncemcnls scem lO cunvcy illformalion aS from. alleasl. Ihe day befare the announccmcnl.
21. Note. of course, thal volul11e represenls the total Ilumbcr 01' shares Irautd. Thisincludes bOlh lhe numbcr of lransaclions and lhc average tr¡jde sizc. In Ihis sense.volumc miglll be sufficiclll as a cOlllrol variilblc. Hawever. lhe average Irade size isfOUlld lO be irrelevanl in cOl1lrolling lhe impacl of dividcnu announcemellls onspread.
Rererenees
Admali. A. <Illd rl1eidcrer, P., 'A lheol)' of inlraday patterns: Volumc and price variability'. T"e Rel'iell' af Fil/al/cia! SIL,,!ies. Vol. 1, 1988. pp. 3-40.
Asquilh. P. and Mullins. D.. 'Thc impact of iniliHlillg dividcnd payments on sharcholders'wealth',Jol/ma! afBl/sil/ess. Vul. 56,1983, pp. 77-95.
Bajaj. M. and Vijh, A.. 'Diviucnd c1icnlclcs nnd the inforl1ltltioll contenl of dividcndehanges', Jal/mal af Fil/ancial Econolllics. Vol. 26. 1990, pp. 193-219.
B¡trclay, M. <lnd Dunhar. C., 'Privalc infarmalion and markcl deplh·. Working Paper.University of Rochcsler.
Basarrate. B. and Ruhio. G.. 'Ul imposición sobre plusvalías y minusvalías y el vulumende contratación en clmcrcCtdo bursálil'. Moneda)' Crédito. Vol. 199. 1994. pp. 97-123.
BiHis. B.. Hillion. P. and Span. c.. 'An cmpirical analysis of the limil arder book and lheordcr 110\11 in lhe Paris Bourse·. Joumlll DI FimUlce. fonhcoming.
BrcllIwn. M. amI Suhrahmanyal1l. A.. 'Markct microSlructurc and asscl pricing: 011 lhe

compcnsalion for advcrse selcclian in slOck returns'. Working Paper, University ofCalifornia, Los Angeles. 1994.
Daley. L.. Hughes. J. and Rayburn. J., 'The impacI of earnings announcemcnts on lheadverse selcction problem of market makers'. Working Paper, University of Mi.nnesola, 1991.
EasJey, D. and O'I-Iar(\. M.. 'Time anu the process of security pricc adjustmcnt', JOIIYlwlof Fillallce, Vol. 47. 1992, pp. 577-605.
Gallant, R.. Rossi. P. and Tauchcn. G.. 'Stock priccs and valume', Tire Review 01 Financial SII/dies. Vol. 5. 1992, pp. 199-242.
Glosten, L.. 'Is lhe electronic open limil arder book inevitable?, JOllmal 01 Finalice, Yol.49,1994, pp. 1127-1161.
González. F.. ·La reacción de los precios de las acciones ante anuncios ele dividendos: Laevidencia empírica en el mercado Espaiiol de valores'. Investigaciones Econ6micas.Vol. 19. 1995, pp. 249-268.
Hamao, Y. and Hasbrouck. J.. 'Securilies trading in the abscncc of dcalers: Tradcs andqootes on the Tokyo Stock Exehange·. Rel'ielV af Fillallcial SII/dies. Vol. 8. 1995. pp.849-878.
Harris, M. and Raviv, A.. 'Differenccs of opinion make a horse race', The Review o[Fillallcial Swdies. Vol. 6, 1993. pp. 473-506.
John. K. and Lang, L., '!nsidcr lrading around dividend announccmcnls: Thcory andevidenee',JallmalafFillallce. Vol. 46.1991, pp. 1361-1389.
Jones, e., KauJ. G. and Lipson, M .. 'Transaclions, valume and valatilily', Tire Rel'ieU' oIFillallcial SII/dies, Vol. 7. 1994, pp. 631-651.
Kim, O. and Verrecchia, R., "Markct liquidity and valume around earnings announccmcnts',Joumlll 01Accollnting and Eco1lomics. Yol. 17, 1994, pp. 41-67.
Kumar, P. and Scppi. D., 'Umil and market crucrs wit"h optimizing traders', WorkingPapeL Carnegie Melloll Universily. 1993.
Kylc, A.. 'Cominuous auclions and insidcr trading'. Economelrü:ll, Yol. 53, 1985, pp.1315-1336.
Lee, C.. Mueklow, B. and Ready, M.. ·Spreads. depths. and lhe impacl of earningsinformalion: An illlraday analysis', Tlle Rel,ielV o[ Fin(Jncial SlUdies, Yol. 6, 1993. pp.345-374.
Lchmanll. B. and Modest, D., 'Trading ami liquidily on lhe Tokyo Stock Exchange: Abird's eye view', JOl/mal af Fillllllce. Vol. 49, 1994, pp. 951-984.
Mclnish. T. and Wood. R.. 'An analysis of inrraday pallerns in bid-ask spreads forYSE stock•. Jal/nllll af Fillllllce. Vol. 47. 1992. pp. 753-764.
Miller. M. and Rack. K., 'Dividcnd policy under asymmetric inform3tion', JOllmal 01Fillallce, Vol. 40, 1985, pp. 1031-1051.
Marse, D. and Ushman, N.. 'The cffcct af informatiol1 announccments on Ihe markctmicrostruclurc', Accollllling RevielV, Yol. 59.1983. pp. 247-258.
Pcterscn. M. and Fialkowski, D., 'Postcd versus cffcClivc sprcaus: Good prices or badqUOlCS?'. JOllnllll 01 Filllllldll¡ Ecollomics, Vol. 35, 1994, pp. 269-292.
Rubio. G.. 'Furthcr inlernational evidence on assct pricing: The case af lhe Spanishcapital market', Jaumal af 8flllkillg "lid Fillallce. Vol. 12. 1988. pp. 221-242.
Schwcrt, W.. 'Stock volatility and lhe crash af ·ST. The Re1'ielV 01 Financial Smdies, Yol.3,1990. pp. 77-102.
Skinner, D., 'Stock relurns, trading voJullle, and bid-ask sprcads around earningsannouncemcnls: Evidence from lile NA5DAQ nalional market system', WorkingPaper, Universily of Michigan, 1991.
Ycnkatcsh. P. and Chiang, R., 'IllformaLion asymmctry and Ihe dcaler's bid-ask spread:A case study of earnings and dividend ¡u1I1ounccmcnts', Jounwl 01 Fillance. Yol. 5,1986. pp. 1089-1 102.