Advent Portfolio Exchange Reports Guide
36
Advent Portfolio Exchange Reports Guide
-
Upload
khangminh22 -
Category
Documents
-
view
5 -
download
0
Transcript of Advent Portfolio Exchange Reports Guide

AdventPortfolio ExchangeReports Guide

Table of ContentsBusiness Intelligence for Business Owners
Account Distribution . . . . . . . . . . . . . . . . . . . . . . . . . . . . . . . . . . . . . . 1
Account Characteristics . . . . . . . . . . . . . . . . . . . . . . . . . . . . . . . . . . . 2
Account Characteristics (By Custodian) . . . . . . . . . . . . . . . . . . . . . . . . 3
Asset Flows . . . . . . . . . . . . . . . . . . . . . . . . . . . . . . . . . . . . . . . . . . . . . 4
Business Summary Dashboard . . . . . . . . . . . . . . . . . . . . . . . . . . . . . . 5
Analytics for Portfolio Managers
Activity Profile . . . . . . . . . . . . . . . . . . . . . . . . . . . . . . . . . . . . . . . . . . . 6
Attribution by Classification . . . . . . . . . . . . . . . . . . . . . . . . . . . . . . . . . 7
Attribution Summary . . . . . . . . . . . . . . . . . . . . . . . . . . . . . . . . . . . . . . 8
Attribution by Selected Groupings . . . . . . . . . . . . . . . . . . . . . . . . . . . 9
Contribution by Classification . . . . . . . . . . . . . . . . . . . . . . . . . . . . . . .10
Contribution Summary . . . . . . . . . . . . . . . . . . . . . . . . . . . . . . . . . . . . .11
Contribution Detail . . . . . . . . . . . . . . . . . . . . . . . . . . . . . . . . . . . . . . .12
Risk Statistics . . . . . . . . . . . . . . . . . . . . . . . . . . . . . . . . . . . . . . . . . . . .13
Client Reporting
Cover Page . . . . . . . . . . . . . . . . . . . . . . . . . . . . . . . . . . . . . . . . . . . . .14
Household Overview . . . . . . . . . . . . . . . . . . . . . . . . . . . . . . . . . . . . . .15
Portfolio Overview . . . . . . . . . . . . . . . . . . . . . . . . . . . . . . . . . . . . . . . .16
Performance Overview . . . . . . . . . . . . . . . . . . . . . . . . . . . . . . . . . . . .17
Risk Overview . . . . . . . . . . . . . . . . . . . . . . . . . . . . . . . . . . . . . . . . . . .18
Policy Overview . . . . . . . . . . . . . . . . . . . . . . . . . . . . . . . . . . . . . . . . . .19
Historical Policy Overview . . . . . . . . . . . . . . . . . . . . . . . . . . . . . . . . . .20
Allocation Summary . . . . . . . . . . . . . . . . . . . . . . . . . . . . . . . . . . . . . . .21
Equity Overview . . . . . . . . . . . . . . . . . . . . . . . . . . . . . . . . . . . . . . . . . .23
Fixed Income Distribution . . . . . . . . . . . . . . . . . . . . . . . . . . . . . . . . . .24
Fixed Income Overview . . . . . . . . . . . . . . . . . . . . . . . . . . . . . . . . . . . .25
Income Projection . . . . . . . . . . . . . . . . . . . . . . . . . . . . . . . . . . . . . . . .26
Portfolio Appraisal . . . . . . . . . . . . . . . . . . . . . . . . . . . . . . . . . . . . . . . .28
Realized Gains and Losses . . . . . . . . . . . . . . . . . . . . . . . . . . . . . . . . . .30
Transaction Summary . . . . . . . . . . . . . . . . . . . . . . . . . . . . . . . . . . . . . .31
Discla imer and Terms . . . . . . . . . . . . . . . . . . . . . . . . . . . . . . . . . . . . . .33
Professional Presentation, Clear CommunicationToday’s investment managers are challenged with strengthening exist-ing infrastructure and attracting new assets. That’s why Advent offers awide array of investment management reports to enable your firm todisseminate information internally and more effectively communicatewith your clients. Professional quality reports from Advent do morethan show clients how their assets are performing. They are a primarypoint of client contact that allow you to demonstrate your value. In atime when the field can seem more crowded than ever, strong report-ing can be a critical competitive differentiator.
Put Performance in the Best LightBuilt on the industry-standard Microsoft SQL Server Reporting Services(SSRS) platform, Advent’s investment management reports are:
Easy to use. Simply access them via the report page in Advent Portfolio Exchange.®
Attractive and clear. Explanatory, color-coded graphs and charts help clients understand the how and why of investments and their performance.
Customized. Reports can be branded with your firm name, logo and graphics.
Comprehensive. Provide a full range of reports to tell your story. Youwork hard for results for your clients. Make them look their best.

Range Count AUM (000s) % Revenue % Eff. Rate
< 500 K 91 $24,554 3.2% $43,908 3.3% 0.179%
500 K - 1 M 50 $36,455 4.7% $63,145 4.7% 0.173%
1 M - 2.5 M 50 $77,723 10.1% $149,214 11.1% 0.192%
2.5 M - 5 M 29 $97,459 12.6% $193,988 14.5% 0.199%
5 M - 10 M 11 $84,542 10.9% $164,845 12.3% 0.195%
10 M - 25 M 5 $76,146 9.9% $150,198 11.2% 0.197%
25 M - 50 M 2 $78,103 10.1% $132,705 9.9% 0.170%
> 50 M 2 $297,860 38.5% $441,455 33.0% 0.148%
Total 240 $772,842 $1,339,458 0.173%
Internal AUM by Client Relationship
Internal AUM by PortfolioRange Count AUM (000s) % Revenue % Eff. Rate
< 500 K 297 $80,138 10.4% $120,026 9.0% 0.150%
500 K - 1 M 99 $70,361 9.1% $111,441 8.3% 0.158%
1 M - 2.5 M 75 $115,653 15.0% $211,697 15.8% 0.183%
2.5 M - 5 M 29 $98,953 12.8% $189,725 14.2% 0.192%
5 M - 10 M 17 $121,678 15.7% $235,343 17.6% 0.193%
10 M - 25 M 6 $93,876 12.1% $180,761 13.5% 0.193%
25 M - 50 M 2 $90,685 11.7% $146,793 11.0% 0.162%
> 50 M 1 $101,496 13.1% $143,420 10.7% 0.141%
Total 526 $772,842 $1,339,206 0.173%
Account Distribution Market Value as of 12/31/2011Revenue for 10/1/2011 Thru 12/31/2011
Account DistributionSegment your business by AUM, revenue contribution and client tenure to get a snapshot of your firm at any point in time.
� Segment the accountsby AUM, Revenue,Client Tenure or Age.
� Drill down to showunderlying clientrelationships orportfolios.
1
Copyright © 2013 Advent Software, Inc.

AUM Distribution Revenue Distribution
Sales Channel Count AUM (000s) % Revenue % Eff. Rate
Platform 279 $293,294 38.0% $426,482 31.8% 0.145%
Institutional 39 $280,217 36.3% $527,907 39.4% 0.188%
HNW 189 $183,817 23.8% $348,236 26.0% 0.189%
RIA 19 $15,514 2.0% $36,582 2.7% 0.236%
Total 526 $772,842 $1,339,206 0.173%
Distribution by Sales Channel Market Value as of 12/31/2011Revenue for 10/1/2011 Thru 12/31/2011
Account Characteristics Segment your account base, providing transparency into your business. Evaluate your business in new ways.
In this example AUM,Revenue Distribution andEffective Rate are shownfor each sales channel.Report can also be viewedby:� Strategy� Product Line� Account Manager,
Salesperson, Consultant� Custodian� Location (office
location, client location,state)
� Tax Status� Or any other way
portfolios are classifiedin APX
Drill down to showunderlying portfolios
2
Copyright © 2013 Advent Software, Inc.

AUM Distribution Revenue Distribution
Custodian Count AUM (000s) % Revenue % Eff. Rate
Charles Schwab & Co Inc. 182 $193,562 25.0% $370,206 27.6% 0.191%
Northern Trust 12 $106,738 13.8% $201,278 15.0% 0.189%
RBC Dexia 1 $101,496 13.1% $143,420 10.7% 0.141%
Credit Suisse First Boston 133 $58,257 7.5% $68,283 5.1% 0.117%
Wells Fargo Bank 2 $58,056 7.5% $97,193 7.3% 0.167%
JP Morgan Chase Bank 3 $36,142 4.7% $76,848 5.7% 0.213%
Stifel, Nicolaus & Co - SMAP 64 $31,463 4.1% $35,770 2.7% 0.114%
M&I Trust Company 4 $31,301 4.1% $56,891 4.2% 0.182%
U.S. Bank 6 $24,320 3.1% $50,473 3.8% 0.208%
Wells Fargo Advisors 15 $19,091 2.5% $33,305 2.5% 0.174%
Other Custodians 104 $112,414 14.5% $205,539 15.3% 0.183%
Total 526 $772,842 $1,339,206 0.173%
Distribution by Custodian Market Value as of 12/31/2011Revenue for 10/1/2011 Thru 12/31/2011
Account Characteristics (By Custodian)Segment your account base, providing transparency into your business. Evaluate your business in new ways.
In this example AUM,Revenue Distribution andEffective Rate are shownby custodian. Slice anddice your book ofbusiness by whateverattributes matter to you.
3
Copyright © 2013 Advent Software, Inc.

Asset Flow Summary Month to DateJanuary 2011
Business SummaryBeginning Market Value $3,089,676
New Business
New Relationships $248,565
New Portfolios $135,343
New Assets $514
Total New Business $384,422
Lost Business
Lost Relationships $4,969
Lost Portfolios $7,946
Lost Assets $500
Total Lost Business $13,415
Net Asset Flows $371,007
Market Impact $36,465
Ending Market Value $3,497,148
New Business Distribution
Lost Business Distribution
Asset FlowsQuickly understand how assets are flowing into or out of your business over a given period of time (new and lost business, as well as market impact).
Drill into new and lostbusiness to showunderlying client orportfolio information.
4
Copyright © 2013 Advent Software, Inc.

Business Summary DashboardConsolidated management view summarizing key business metric including Top Relationships.
� Business Summarytrend—with the abilityto dig deeper if needed
� Flexibility to personalizethe dashboard for theindividual user
5
Copyright © 2013 Advent Software, Inc.

Basic Information7/20/2011 l jTask: Annual Review Meeting Scheduling Information
Activity Type Task Start Date 12/9/2010
Description Annual Review Meeting Due Date 12/9/2010
Category Financial Review Status Not Started
Owned By Administrator Percent Complete 0
Assigned To Administrator Completed Date
Priority Normal Reminder None
Portfolios
Portfolio Code Report Heading Default
bdfund3 John Regan BDFUND3 Pershing 990123673 Yes
Contacts
Name Code Default
Mr. John Regan D0U0100017 Yes
Notes John's company is offering early retirement to several employees as part of a restructuring. Need to get a list of his colleagues that could be interested in using an advisor.
Additional InformationWeb Page
Document Link
Assigned Date 12/8/2010
Assigned By Administrator
Created Date 12/8/2010
Created By Administrator
Activity ProfileTask: Annual Review Meeting
7/20/2011
6
Activity ProfileThe Activity Profile provides an overview of key information pertaining to tasks or meetings.
The Activity Profile allowsfor a clear review of basicinformation and anynotes pertaining to thetasks and meetingsassociated with yoursearch criteria.
Copyright © 2013 Advent Software, Inc.

Attribution by Industry SectorEEvvaann CCaassee GGrroowwtthh PPoorrttffoolliioo vvss.. SS&&PP 550000 TToottaall RReettuurrnn
From 12-31-08 to 12-31-10
UTILITIES 6.80 -8.72 -1.36 4.09 -19.97 -0.83 2.71 11.24 -0.53 0.51 0.70 1.22WINDSTREAM CORP COM 0.00 0.00 0.00 0.05 2.97 0.00 -0.05 -2.97 0.00 0.00 0.00 0.00VERIZON COMMUNICATIONS INC COM 0.00 0.00 0.00 1.00 -14.86 -0.10 -1.00 14.86 0.10 -0.08 0.00 -0.08SPRINT NEXTEL CORP COM SER 1 0.00 0.00 0.00 0.16 -72.12 -0.22 -0.16 72.12 0.22 0.14 0.00 0.14QWEST COMMUNICATIONS INTL INC COM 0.00 0.00 0.00 0.06 -29.05 -0.02 -0.06 29.05 0.02 0.02 0.00 0.02NTT DOCOMO INC 1.61 13.96 0.03 0.00 0.00 0.00 1.61 13.96 0.03 0.08 0.03 0.11METROPCS COMMUNICATIONS INC COM 0.00 0.00 0.00 0.01 -46.49 -0.02 -0.01 46.49 0.02 0.02 0.00 0.02FRONTIER COMMUNICATIONS CORP COM 0.00 0.00 0.00 0.03 -22.40 -0.01 -0.03 22.40 0.01 0.01 0.00 0.01EMBARQ CORP COM 0.00 0.00 0.00 0.05 -5.83 0.00 -0.05 5.83 0.00 -0.01 0.00 -0.01CENTURYTEL INC COM 0.00 0.00 0.00 0.05 2.15 0.01 -0.05 -2.15 -0.01 0.01 0.00 0.01AT&T INC COM 0.00 0.00 0.00 1.86 -24.54 -0.44 -1.86 24.54 0.44 0.01 0.00 0.01AMERICAN TOWER CORP CL A 0.00 0.00 0.00 0.15 1.43 0.01 -0.15 -1.43 -0.01 -0.03 0.00 -0.03
TELECOMMUNICATIONS SERVICES 1.61 13.96 0.03 3.42 -24.28 -0.78 -1.81 38.25 0.81 0.56 -0.08 0.48TECHNOLOGY 26.52 -9.29 0.83 17.04 -8.02 0.09 9.49 -1.27 0.74 1.12 -0.78 0.34FINANCIALS 5.10 -91.81 -7.10 14.34 -47.70 -8.87 -9.24 -44.10 1.77 3.83 -4.55 -0.73HEALTH CARE 7.87 8.53 0.47 13.32 -7.60 -1.14 -5.45 16.14 1.61 -0.68 1.07 0.39CONSUMER STAPLES 17.49 23.66 3.52 11.79 -2.85 -0.46 5.70 26.51 3.98 1.34 4.51 5.85CONSUMER DISCRETIONARY 21.66 17.03 0.95 8.82 -6.58 -0.14 12.84 23.61 1.09 1.40 7.85 9.25INDUSTRIALS 3.66 -39.07 -1.16 10.82 -27.34 -3.51 -7.16 -11.73 2.35 0.65 -0.65 0.00MATERIALS 4.32 -31.65 3.37 3.41 -19.21 -0.65 0.91 -12.44 4.02 0.42 1.93 2.35ENERGY 4.96 -43.97 -1.26 12.95 -26.12 -4.04 -7.98 -17.85 2.78 -0.16 -0.37 -0.53
Total 100.00 -1.71 -1.71 100.00 -20.32 -20.32 0.00 18.62 18.62 8.99 9.63 18.62
Portfolio Benchmark Difference Attribution EffectsIndustry Sector Avg Wgt Return Contrib Avg Wgt Return Contrib Avg Wgt Return Contrib Alloc Select Total
7
Copyright © 2013 Advent Software, Inc.
Attribution by ClassificationThis report highlights the impact of your investment decisions, and compares portfolio performance to that of a benchmark over any period oftime. It lets you see, and explain, the sources of your portfolio’s performance.

Attribution SummaryEEvvaann CCaassee GGrroowwtthh PPoorrttffoolliioo vvss.. SS&&PP 550000 TToottaall RReettuurrnn
From 12-31-08 to 12-31-10
TELECOMMUNICATIONS SERVICES 0.56 -0.08 0.48UTILITIES 0.51 0.70 1.22
CONSUMER STAPLES 1.34 4.51 5.85MATERIALS 0.42 1.93 2.35
CONSUMER DISCRETIONARY 1.40 7.85 9.25
Total 4.23 14.92 19.15
Top Attribution Effects Allocation Selection Total
Allocation Effect 8.99
Total Effect 18.62Selection Effect 9.63
Portfolio Return -1.71Summary
Active Return 18.62Benchmark Return -20.32
Industry Sector
HEALTH CARE -0.68 1.07 0.39TECHNOLOGY 1.12 -0.78 0.34
ENERGY -0.16 -0.37 -0.53INDUSTRIALS 0.65 -0.65 0.00
FINANCIALS 3.83 -4.55 -0.73
Total 4.76 -5.29 -0.53
Bottom Attribution Effects Allocation Selection Total
HEALTH CARE 7.87 8.53 0.47TECHNOLOGY 26.52 -9.29 0.83
MATERIALS 4.32 -31.65 3.37CONSUMER DISCRETIONARY 21.66 17.03 0.95
CONSUMER STAPLES 17.49 23.66 3.52
Total 77.86 9.14 9.14
Top Contributors Avg Wgt Return Contrib
TELECOMMUNICATIONS SERVICES 1.61 13.96 0.03INDUSTRIALS 3.66 -39.07 -1.16
UTILITIES 6.80 -8.72 -1.36ENERGY 4.96 -43.97 -1.26
FINANCIALS 5.10 -91.81 -7.10
Total 22.14 -10.85 -10.85
Bottom Contributors Avg Wgt Return Contrib
Security
NIKE INC CL B 1.55 0.20 1.75BOLD VENTURES INC COM -0.03 1.94 1.91
ARCHER DANIELS MIDLAND CO COM 1.59 0.90 2.49APOLLO GROUP INC CL A 0.97 0.96 1.93
NETFLIX INC COM 2.24 3.27 5.51
Total 6.33 7.27 13.60
Top Attribution Effects Allocation Selection Total
WELLS FARGO & CO NEW -0.37 -0.71 -1.07BERKSHIRE HATHAWAY INC CL A -0.54 -0.68 -1.22
GANNETT INC COM -1.88 0.41 -1.47VMWARE INC CL A COM 0.44 -1.87 -1.43
MERRILL LYNCH & CO INC COM -0.97 -0.63 -1.60
Total -3.32 -3.48 -6.80
Bottom Attribution Effects Allocation Selection Total
NETFLIX INC COM 5.22 91.34 3.81APPLE INC COM 2.12 229.43 3.86Top Contributors Avg Wgt Return Contrib
GANNETT INC COM 0.93 -85.77 -2.58MERRILL LYNCH & CO INC COM 0.86 -99.99 -2.74Bottom Contributors Avg Wgt Return Contrib
WAL MART STORES INC COM 3.91 18.90 0.24INTERNATIONAL BUSINESS MACHS COM 4.07 25.49 0.69
NETFLIX INC COM 5.22 91.34 3.81NIKE INC CL B 5.12 13.64 -0.84
ORACLE CORP COM 3.89 8.79 0.02Total 22.21 3.93 3.93
Largest WeightsSecurity Avg Wgt Return Contrib
UNITED STATES STL CORP NEW COM 1.18 100.65 2.01
ARCHER DANIELS MIDLAND CO COM 2.04 136.27 2.50BOLD VENTURES INC COM -0.04 -105.95 2.13
Total 10.52 14.30 14.30AMERICAN INTL GROUP INC COM 0.73 -92.27 -1.48
BANK OF AMERICA CORP 1.27 -107.03 -2.22VMWARE INC CL A COM 3.24 -68.90 -1.79
Total 7.03 -10.80 -10.80
8
Copyright © 2013 Advent Software, Inc.
Attribution SummaryThis report shows a comprehensive overview of your portfolio’s performance attribution.
Quickly identify top andbottom contributors byboth attribution effectsand returns.

9
Attribution by Selected GroupingsThis report shows the attribution effects for each of your reporting segments. You can expand each segment all the way down to the lowest levelfor which data is available (in many cases, security level).
To drill into any sub-period click in theassociated value.
Attribution by Selected GroupingsEquity Fund vs. Equity Benchmark
12-31-08 – 12-31-10
Portfolio Benchmark Difference Attribution EffectsIndustry Sector Avg Wgt Return Contrib Avg Wgt Return Contrib Avg Wgt Return Contrib Alloc Select Total
+ Energy 4.58 39.06 1.79 9.85 25.35 2.50 -5.27 13.71 -0.71 -0.41 0.63 0.21
+ Materials 5.13 12.36 0.63 2.99 21.75 0.65 2.13 -9.39 -0.02 0.09 -0.48 -0.39
+ Industrials 25.44 14.30 3.64 11.21 14.01 1.57 14.23 0.29 2.07 -0.50 0.07 -0.43
+ Consumer Discretionary 9.23 33.00 3.05 10.56 19.67 2.08 -1.33 13.33 0.97 -0.03 1.23 1.20
+ Consumer Staples 15.93 14.73 2.35 9.48 14.88 1.41 6.45 -0.15 0.94 -0.17 -0.02 -0.19
+ Health Care 8.85 22.16 1.96 12.64 8.81 1.11 -3.79 13.34 0.85 0.33 1.18 1.51
+ Financials 14.92 16.53 2.47 21.61 20.09 4.34 -6.68 -3.56 -1.87 -0.17 -0.53 -0.70
– Information Technology 11.49 19.97 2.29 14.95 12.15 1.82 -3.46 7.81 0.48 0.19 0.90 1.08
Hewlett Packard Co Com 2.42 45.21 1.09 0.81 45.21 0.37 1.60 0.00 0.72 0.44 0.00 0.44
IBM 5.83 19.77 1.15 1.09 19.77 0.22 4.74 0.00 0.94 0.11 0.00 0.11
Intel Corp Com 1.41 -17.18 -0.24 0.99 -17.18 -0.17 0.41 0.00 -0.07 -0.14 0.00 -0.14
Microsoft 1.84 15.83 0.29 1.96 15.83 0.31 -0.12 0.00 -0.02 0.00 0.00 0.00
+ Telecom Services 4.44 43.18 1.92 3.32 39.58 1.32 1.11 3.59 0.60 0.25 0.16 0.41
+ Utilities 0.00 0.00 0.00 3.39 21.29 0.72 -3.39 -21.29 -0.72 -0.13 0.00 -0.13
Total 100.00 20.09 20.09 100.00 17.51 17.51 0.00 2.57 2.57 -0.56 3.13 2.57
Energy
Materials
Industrials
Consumer Discretionary
Consumer Staples
Health Care
Financials
Information Technology
Telecom Services
Utilities
-1 0 1 2 -1 0 1 2 -1 0 1 2
Allocation Effect Selection Effect Total Effect
Copyright © 2013 Advent Software, Inc.

10
Contribution by ClassificationThis report compares your portfolio’s segments’ contributions to each other.
To drill into any sub-period click in theassociated value.
Contribution by Industry SectorEEvvaann CCaassee GGrroowwtthh PPoorrttffoolliioo vvss.. SS&&PP 550000 TToottaall RReettuurrnn
From 12-31-08 to 12-31-10
Portfolio Benchmark
UTILITIES 6.80 -8.72 -1.36 4.09 -19.97 -0.83 2.71 11.24 -0.53TELECOMMUNICATIONS SERVICES 1.61 13.96 0.03 3.42 -24.28 -0.78 -1.81 38.25 0.81TECHNOLOGY 26.52 -9.29 0.83 17.04 -8.02 0.09 9.49 -1.27 0.74FINANCIALS 5.10 -91.81 -7.10 14.34 -47.70 -8.87 -9.24 -44.10 1.77HEALTH CARE 7.87 8.53 0.47 13.32 -7.60 -1.14 -5.45 16.14 1.61CONSUMER STAPLES 17.49 23.66 3.52 11.79 -2.85 -0.46 5.70 26.51 3.98CONSUMER DISCRETIONARY 21.66 17.03 0.95 8.82 -6.58 -0.14 12.84 23.61 1.09INDUSTRIALS 3.66 -39.07 -1.16 10.82 -27.34 -3.51 -7.16 -11.73 2.35MATERIALS 4.32 -31.65 3.37 3.41 -19.21 -0.65 0.91 -12.44 4.02ENERGY 4.96 -43.97 -1.26 12.95 -26.12 -4.04 -7.98 -17.85 2.78
Total 100.00 -1.71 -1.71 100.00 -20.32 -20.32 0.00 18.62 18.62
Portfolio Benchmark DifferenceIndustry Sector Avg Wgt Return Contrib Avg Wgt Return Contrib Avg Wgt Return Contrib
Copyright © 2013 Advent Software, Inc.

Contribution SummaryEEvvaann CCaassee GGrroowwtthh PPoorrttffoolliioo vvss.. SS&&PP 550000 TToottaall RReettuurrnn
From 12-31-08 to 12-31-10
UTILITIES 6.80 -8.72 -1.36HEALTH CARE 7.87 8.53 0.47
CONSUMER DISCRETIONARY 21.66 17.03 0.95TELECOMMUNICATIONS SERVICES 1.61 13.96 0.03
CONSUMER STAPLES 17.49 23.66 3.52
Total 55.43 3.61 3.61
Top Performers Avg Wgt Return Contrib
Benchmark Return -20.32Active Return 18.62
Portfolio Return -1.71Performance Summary
Industry Sector
TECHNOLOGY 26.52 -9.29 0.83MATERIALS 4.32 -31.65 3.37
ENERGY 4.96 -43.97 -1.26INDUSTRIALS 3.66 -39.07 -1.16
FINANCIALS 5.10 -91.81 -7.10
Total 44.57 -5.32 -5.32
Bottom Performers Avg Wgt Return Contrib
HEALTH CARE 7.87 8.53 0.47TECHNOLOGY 26.52 -9.29 0.83
MATERIALS 4.32 -31.65 3.37CONSUMER DISCRETIONARY 21.66 17.03 0.95
CONSUMER STAPLES 17.49 23.66 3.52
Total 77.86 9.14 9.14
Top Contributors Avg Wgt Return Contrib
TELECOMMUNICATIONS SERVICES 1.61 13.96 0.03INDUSTRIALS 3.66 -39.07 -1.16
UTILITIES 6.80 -8.72 -1.36ENERGY 4.96 -43.97 -1.26
FINANCIALS 5.10 -91.81 -7.10
Total 22.14 -10.85 -10.85
Bottom Contributors Avg Wgt Return Contrib
Security
ADVENT SOFTWARE INC COM 1.16 61.75 1.27NETFLIX INC COM 5.22 91.34 3.81
ARCHER DANIELS MIDLAND CO COM 2.04 136.27 2.50UNITED STATES STL CORP NEW COM 1.18 100.65 2.01
APPLE INC COM 2.12 229.43 3.86
Total 11.72 13.45 13.45
Top Performers Avg Wgt Return Contrib
MERRILL LYNCH & CO INC COM 0.86 -99.99 -2.74BOLD VENTURES INC COM -0.04 -105.95 2.13
NORTEL NETWORKS CORP NEW COM NEW 0.53 -138.57 -1.42BANK OF AMERICA CORP 1.27 -107.03 -2.22
GENERAL MTRS CORP COM 0.70 -177.27 -0.21
Total 3.32 -4.46 -4.46
Bottom Performers Avg Wgt Return Contrib
NETFLIX INC COM 5.22 91.34 3.81APPLE INC COM 2.12 229.43 3.86Top Contributors Avg Wgt Return Contrib
GANNETT INC COM 0.93 -85.77 -2.58MERRILL LYNCH & CO INC COM 0.86 -99.99 -2.74Bottom Contributors Avg Wgt Return Contrib
WAL MART STORES INC COM 3.91 18.90 0.24INTERNATIONAL BUSINESS MACHS COM 4.07 25.49 0.69
NETFLIX INC COM 5.22 91.34 3.81NIKE INC CL B 5.12 13.64 -0.84
ORACLE CORP COM 3.89 8.79 0.02
Total 22.21 3.93 3.93
Largest WeightsSecurity Avg Wgt Return Contrib
UNITED STATES STL CORP NEW COM 1.18 100.65 2.01
ARCHER DANIELS MIDLAND CO COM 2.04 136.27 2.50BOLD VENTURES INC COM -0.04 -105.95 2.13
Total 10.52 14.30 14.30AMERICAN INTL GROUP INC COM 0.73 -92.27 -1.48
BANK OF AMERICA CORP 1.27 -107.03 -2.22VMWARE INC CL A COM 3.24 -68.90 -1.79
Total 7.03 -10.80 -10.80
11
Copyright © 2013 Advent Software, Inc.
Contribution SummaryThis report shows how each segment contributed to your portfolio’s overall performance and optionally compares it to a benchmark. Because youcan run this report without a benchmark, you can use it to focus on your portfolio’s absolute performance. For example, you can show a portfolio’stop and bottom five performers and contributors within each of your reporting segments, such as industry sector and security.

12
Contribution DetailThis report shows information broken out to the most detailed level in a “flattened” view as opposed to a nested view. For example, if you groupthe report primarily by industry sector, then by asset class, and then by security, this report shows just the security level.
Contribution DetailEquity Fund vs. Equity Benchmark
12-31-08 – 12-31-10
Portfolio Benchmark DifferenceSecurity Avg Wgt Return Contrib Avg Wgt Return Contrib Avg Wgt Return ContribExxon Mobil 4.58 39.06 1.79 3.34 39.06 1.30 1.24 0.00 0.48
Boeing Co Com 5.60 28.38 1.59 0.54 28.38 0.15 5.06 0.00 1.44
General Mtrs Corp Com 1.89 63.96 1.21 0.13 63.96 0.08 1.77 0.00 1.13
IBM 5.83 19.77 1.15 1.09 19.77 0.22 4.74 0.00 0.94
Merck & Co Inc Com 2.68 42.66 1.14 0.70 42.66 0.30 1.97 0.00 0.84
Hewlett Packard Co Com 2.42 45.21 1.09 0.81 45.21 0.37 1.60 0.00 0.72
AT&T Inc Com 2.05 53.16 1.09 0.96 53.16 0.51 1.09 0.00 0.58
Altria Group Inc Com 5.40 19.87 1.07 1.36 19.87 0.27 4.04 0.00 0.80
Disney Walt Co Com Disney 2.07 44.26 0.92 0.52 44.26 0.23 1.55 0.00 0.69
McDonalds Corp 2.58 34.63 0.89 0.39 34.63 0.13 2.19 0.00 0.76
Verizon Communications Com 2.39 34.61 0.83 0.84 34.61 0.29 1.55 0.00 0.54
JP Morgan Chase & Co Com 3.08 25.60 0.79 1.29 25.60 0.33 1.79 0.00 0.46
American Express Co Com 3.82 19.09 0.73 0.57 19.09 0.11 3.25 0.00 0.62
Coca Cola Co Com 3.08 23.10 0.71 0.76 23.10 0.18 2.32 0.00 0.54
Honeywell Intl Inc Com 2.86 24.14 0.69 0.29 24.14 0.07 2.58 0.00 0.62
Citigroup 3.44 19.55 0.67 2.06 19.55 0.40 1.37 0.00 0.27
United Technologies Corp Com 4.32 13.65 0.59 0.53 13.65 0.07 3.79 0.00 0.52
Du Pont 3.00 18.64 0.56 0.33 18.64 0.06 2.67 0.00 0.50
Procter & Gamble Co Com 4.18 13.36 0.56 1.64 13.36 0.22 2.54 0.00 0.34
Johnson & Johnson Com 4.37 12.44 0.54 1.55 12.44 0.19 2.81 0.00 0.35
Caterpillar Inc Del Com 4.83 7.86 0.38 0.39 7.86 0.03 4.44 0.00 0.35
Microsoft 1.84 15.83 0.29 1.96 15.83 0.31 -0.12 0.00 -0.02
American Intl Group 4.59 6.05 0.28 1.43 6.05 0.09 3.16 0.00 0.19
Pfizer 1.80 15.22 0.27 1.59 15.22 0.24 0.21 0.00 0.03
General Electric 2.41 9.35 0.23 3.03 9.35 0.28 -0.61 0.00 -0.06
3M Co Com 5.41 2.98 0.16 0.49 2.98 0.01 4.92 0.00 0.15
Alcoa Inc Com 2.13 3.49 0.07 0.22 3.49 0.01 1.90 0.00 0.07
Home Depot Inc Com 2.69 1.01 0.03 0.68 1.01 0.01 2.02 0.00 0.02
Wal Mart 3.28 0.13 0.00 0.98 0.13 0.00 2.30 0.00 0.00
Copyright © 2013 Advent Software, Inc.

Advent SoftwareMonthly Risk Statistics
MMiicchhaaeell FFooxx GGrroowwtthh PPoorrttffoolliioo vvss.. SS&&PP 550000 TToottaall RReettuurrnnFrom 12-31-08 to 12-31-10
Modigliani & Modigliani (M-Squared) 1.59 % -8.57 % 10.16 %Monthly Risk-Free Rate 0.04 % 0.04 %
Sortino Ratio -0.17 -0.66 0.49Sharpe Ratio 0.05 -0.39 0.44
Annualized Tracking Error 6.94 %
Annual Risk-Free Rate 0.50 % 0.50 %Risk-Adjusted Performance
Information Ratio 1.46
Annualized Alpha 9.65 %Monthly Alpha 0.77 %
Jensen's Monthly Alpha 0.77 %CAPM Beta 0.90
Treynor Ratio 0.01
Beta 0.90Regression
Jensen's Annualized Alpha 9.59 %
Annualized Standard Deviation 21.73 % 23.01 % -1.28 %
Annual Minimum Acceptable Return 4.50 % 4.50 %Downside Risk
Absolute Risk
Monthly Tracking Error 2.00 %
Monthly Standard Deviation 6.27 % 6.64 % -0.37 %Monthly Range 22.59 % 26.37 % -3.77 %
Monthly Minimum Acceptable Return 0.37 % 0.37 %
Benchmark-Relative Risk
R-Squared 0.91Correlation 0.95
Monthly Expected Downside Value -2.75 % -3.21 % 0.46 %Monthly Downside Probability 45.83 % 50.00 % -4.17 %
Monthly VAR of 1,000.00 at 95% confidence -101.90 -116.41 14.51Monthly Downside Deviation -4.79 % -5.68 % 0.89 %
Portfolio Benchmark Difference
Industry Sector: Not ApplicableExcluded from analysis:
Risk StatisticsThe Ex-Post Risk report shows statistics that measure the volatility and actual realized risk of the portfolio in the past, based on past portfolio returns, benchmark returns and risk-free rates.
� Absolute Risk: The historical volatility
� Downside Risk:The risk of returnsfalling below theminimum acceptablereturn
� Benchmark-RelativeRisk:The volatility of theportfolio relative to thebenchmark
� Risk-Adjusted Return:The return in relation to the amount of risktaken (volatility)
� Regression:The relationshipbetween the portfolioand benchmark returns
13
Copyright © 2013 Advent Software, Inc.

Quarterly Report12/31/2010Account
Investment Management Consulting
Balanced Fund
Account # 12345
14
Copyright © 2013 Advent Software, Inc.
Cover PageDifferentiate your firm with a custom report cover that allows you to stand apart from other firms.
The cover page offersflexibility to display firmspecific branding thatincludes a logo andgraphics.
Display a single accountor all accounts for aspecific client.

F il T t N t f F | US D ll 12/31/2010 l jPortfolio Activity Summary
MonthTo Date
QuarterTo Date
YearTo Date
InceptionTo Date
Beginning Market Value 3,640,617.98 3,479,796.76 3,304,188.16 2,357,214.96
Net Additions 0.00 0.00 0.00 1,000,000.00
Gains/Losses + Fees 140,787.27 301,608.50 477,217.10 424,190.30
Ending Market Value 3,781,405.26 3,781,405.26 3,781,405.26 3,781,405.26
Time Weighted Return 3.87 8.67 14.44 14.74
IndexS&P 500 Total Return 6.68 10.76 15.06 -11.38
S&P 500 75/Barclays Agg. 25 3.75 5.81 12.43 -4.16
Household Performance
PortfolioMarket
ValueMonth
To DateQuarterTo Date
YearTo Date
InceptionTo Date
Family Trust 3,781,405.26 3.87 8.67 14.44 14.74
Wade Garrett Trust 2,205,118.92 3.54 9.39 14.01 18.73
ACCOUNT IRA 1,576,286.34 4.32 7.67 15.05 4.43
Household Allocation by Asset Class
Performance Since Inception (9/30/2007)
Advent Software
Family Trust
Household OverviewNet of Fees | US Dollar
12/31/2010
15
Copyright © 2013 Advent Software, Inc.
Household OverviewThe Household Overview report displays an insightful snapshot of activity and performance.
Run this report by theclassification you choose.Look at performance on ahousehold and individualaccount basis.

E C F il T tE & M il C B k f A i 99012 N t f F | US D ll 12/31/2009 12/31/201 l jActivity Summary
Quarter to DateBeginning Value 28,447,862.22
Accrued Interest 58,187.57
Net Contributions/Withdrawals -150,000.00
Realized Gains 1,713.44
Unrealized Gains 1,806,488.59
Income Received 25,509.55
Change in Accrued Interest 2,690.59
Management Fees -57,055.90
Portfolio Fees -800.00
Ending Value 30,073,717.89
Accrued Interest 60,878.16
Management Fees Paid by Client -10,000.00
Portfolio Fees Paid by Client -1,500.00
Year to Date28,558,666.21
60,710.71
-150,000.00
34,439.49
1,629,246.16
122,704.38
167.45
-120,088.35
-1,250.00
30,073,717.89
60,878.16
-14,573.00
-1,500.00
Change in Portfolio
Portfolio Allocation as of 12/31/2010
Asset Class Market Value % Assets Yield
Equity 16,860,385.43 56.0 2.7
Fixed Income 7,780,440.52 25.8 5.3
Other 2,811,600.00 9.3 0.2
Cash 2,682,170.10 8.9 0.1
Total 30,134,596.05 100.0 2.9
Advent Software
Evan Case Family TrustEvan & Marilyn Case
Portfolio OverviewNet of Fees | US Dollar
12/31/2009 - 12/31/2010
16
Portfolio OverviewThe Portfolio Overview gives your clients insight into the key metrics of their portfolio.
The Activity Summarydisplays the elementsresulting in a portfolio’schange in market value.
The Portfolio Allocationsection uses both a chart(pie, column or bar) andtable format to depictdiversification of theportfolio by industrystandard or customclassification.
The Change in Portfoliographically representscashflows and changesdue to marketappreciation and/ordepreciation.
Any SMA portfolio will bedisplayed in theappropriate individualsegment.
Copyright © 2013 Advent Software, Inc.

December 31, 2010Gross of Fees | US Dollar
Performance OverviewInvestment Management ConsultingBalanced FundAccount # 12345
D b 31 2010 l jPerformance History
Asset Class
AnnualizedMonth
To Date
AnnualizedQuarterTo Date
AnnualizedLatest1 Year
AnnualizedLatest
3 Years
AnnualizedLatest
5 Years
AnnualizedInception
To DateEquity (3.31) 58.12 38.97 8.49 14.14 3.19
Fixed Income (10.47) (1.65) 5.09 (2.37) 0.40 2.97
Cash 0.00 0.00 0.00 0.00 0.32 0.12
Other 0.00 0.00 0.00 0.00 0.00 0.00
Account (3.23) 14.89 11.32 1.76 6.06 1.73
Index
Russell 2000 141.89 79.58 25.31 0.76 3.08 7.39
S&P 500 Index 112.82 47.55 12.88 (5.00) 0.17 2.16S&P 500 75/Barclays Captial Agg. 25 72.53 31.60 12.41 (1.91) 1.75 7.20
Time Weighted Return Inception (December 31, 1994) to Date
Your Company
17
Copyright © 2013 Advent Software, Inc.
Performance OverviewThe Performance Overview report gives you a comprehensive look at the portfolio performance at multiple time periods and compares them torelevant benchmarks.
Choose the PerformanceHistory time period todisplay.
The graph can reflect TimeWeighted Return (TWR) orGrowth of a Dollar.
View a portfolio’s TWRsince inception forportfolios and bench-marks, as well assub-period performance.

E C CASE Fifth Thi d B k 99012347 N t f F | US D ll 12/31/2009 12/31/2010 l jAnnualized Return vs. Standard Deviation
Risk StatisticsSharpe Ratio Annualized Standard Deviation Annualized Return
Evan Case 1.14 13.40 15.44
S&P 500 75/Barclays Agg. 25 1.14 10.84 12.43
S&P 500 Total Return 0.86 18.44 15.06
Barclays Agg. Bond 2.23 4.07 9.37
Advent Software
Evan CaseCASE
Risk OverviewNet of Fees | US Dollar
12/31/2009 - 12/31/2010
18
Copyright © 2013 Advent Software, Inc.
Risk OverviewThe Risk Overview report enables firms to show returns plotted against standard deviation.
Chart shows a graphic of the return versus thestandard deviation.
The table view includes an additional column forSharpe ratio.

E C F il T E & M il C B k f A i 990WMR M d l A t12/31/2010 l j M d lActual Allocations Target Allocations
Asset Class % Assets % Target % Difference Market Value
Equity 40.4 43.2 -2.8 12,149,902.01
Fixed Income 25.7 0.0 25.7 7,719,562.36
Other 9.3 0.0 9.3 2,811,600.00
Cash 10.9 24.4 -13.5 3,276,709.76
International 13.7 32.5 -18.8 4,117,193.76
Total 100.0 100.0 0.0 30,074,967.89
Advent Software
Evan Case Family TrustEvan & Marilyn Case
Policy Overview12/31/2010
Model: WMR Model Account | US Dollar
19
Copyright © 2013 Advent Software, Inc.
Policy OverviewThis report displays a portfolio’s actual and target allocations.
This report can be run forboth held securities or onSMAs.
If run for an SMA portfolioasset classes will bedisplayed in theappropriate individualsegment.

E C F il T E & M il C B k f A i 990EVAN CASE IRA | U 12/31/2010 l j M d lCurrent Asset Allocation vs. Investment Policy
Asset ClassActual Allocation As Of
12/31/2010Target
AllocationDifference
From Target
Equity 40.4 % 12,149,902.01 70.1 % 21,074,373.53 -29.7 % -8,924,471.52
Fixed Income 25.7 % 7,719,562.36 29.9 % 8,978,081.54 -4.2 % -1,258,519.18
Other 9.3 % 2,811,600.00 0.0 % 0.00 9.3 % 2,811,600.00
Cash 10.9 % 3,276,709.76 0.1 % 22,512.82 10.8 % 3,254,196.94
International 13.7 % 4,117,193.76 0.0 % 0.00 13.7 % 4,117,193.76
Total 100.0 % 30,074,967.89 100.0 % 30,074,967.89
Asset Allocation Over Time Inception (9/30/2007) to Date
Advent Software
Evan Case Family TrustEvan & Marilyn Case
Historical Policy Overview12/31/2010
Model: EVAN CASE IRA | US Dollar
20
Present target vs. actualallocation for your chosenclassification such assector or asset class.
Quickly discern whereshifts in allocation haveoccurred.
Any SMA portfolio will beincluded in the appropriateindividual segment.
Historical Policy OverviewThe Historical Policy Overview provides a history of allocation over time.
Copyright © 2013 Advent Software, Inc.

Evan Case Family TrustEvan & Marilyn Case
Allocation SummaryModel: EVAN CASE IRA | US Dollar
12/31/2010
ClassificationMarket
Value%
AssetsTarget %
Allocation%
DifferenceTargetValue
ValueDifference
Equity
ALLIANZ NFJ SMALL VALUE SMA 4,313,915.27 14.3 0.0 14.3 0.00 4,313,915.27
AMERICAN BALANCED FD INC CL C 96,295.48 0.3 6.1 -5.8 1,837,282.60 -1,740,987.12
BB&T EQUITY INCOME SMA 5,335,544.03 17.7 0.0 17.7 0.00 5,335,544.03
DODGE & COX FDS INTL STK FD 392,810.00 1.3 0.0 1.3 0.00 392,810.00
ISHARES TR DJ US INDEX FD 94,327.75 0.3 6.0 -5.7 1,799,739.03 -1,705,411.28
ISHARES TR LRGE CORE INDX 93,242.95 0.3 5.9 -5.6 1,779,041.42 -1,685,798.47
ISHARES TR MSCI EAFE IDX 407,540.00 1.4 0.0 1.4 0.00 407,540.00
ISHARES TR MSCI EMERG MKT 595,525.00 2.0 0.0 2.0 0.00 595,525.00
ISHARES TR NYSE COMP INDX 87,154.17 0.3 5.5 -5.2 1,662,869.76 -1,575,715.59
ISHARES TR RUSSELL 2000 109,158.57 0.4 6.9 -6.6 2,082,705.63 -1,973,547.06
ISHARES TR S&P 500 INDEX 91,591.53 0.3 5.8 -5.5 1,747,532.90 -1,655,941.37
VANGUARD INDEX FDS GROWTH PTFL 98,327.41 0.3 6.2 -5.9 1,876,050.99 -1,777,723.59
VANGUARD INDEX FDS SML CP GRW INV 111,227.51 0.4 7.1 -6.7 2,122,180.24 -2,010,952.74
VANGUARD WHITEHALL FDS INC MID CP GRW INV 103,547.03 0.3 6.6 -6.2 1,975,639.52 -1,872,092.49
VANGUARD/WELLESLEY INCOME FD COM 114,356.96 0.4 7.3 -6.9 2,181,514.25 -2,067,157.29
VANGUARD/WELLINGTON FD INC COM 105,338.35 0.4 6.7 -6.3 2,009,817.18 -1,904,478.84
Equity Total 12,149,902.01 40.4 70.1 -29.7 21,074,373.53 -8,924,471.52
Advent Software
Fixed Income
FIDELITY ADVISOR SER II HI INCM ADV B 228,831.53 0.8 14.5 -13.8 4,366,022.02 -4,137,190.49
ISHARES TR BARCLYS TIPS BD 1,075,200.00 3.6 0.0 3.6 0.00 1,075,200.00
ISHARES TR BARCLYS US AGG B 1,057,500.00 3.5 0.0 3.5 0.00 1,057,500.00
WELLS FARGO FDS TR ADV GOV SC INV 241,726.82 0.8 15.3 -14.5 4,612,059.52 -4,370,332.70
CALIFORNIA ST ECONOMIC RECOVERY 600,000.00 2.0 0.0 2.0 0.00 600,000.00
5.000% Due 07-01-12
TIME WARNER COMPANIES INC 457,433.60 1.5 0.0 1.5 0.00 457,433.60
9.125% Due 01-15-13
GENERAL ELECTRIC CO 320,691.90 1.1 0.0 1.1 0.00 320,691.90
5.000% Due 02-01-13
UNITED STATES TREAS NTS 634,875.70 2.1 0.0 2.1 0.00 634,875.70
1.875% Due 07-15-13
UNITED STATES TREAS NTS 610,670.05 2.0 0.0 2.0 0.00 610,670.05
1.625% Due 01-15-15
UNITED STATES TREAS NTS 599,932.76 2.0 0.0 2.0 0.00 599,932.76
2.000% Due 01-15-16
21
Copyright © 2013 Advent Software, Inc.
This report displaysinformation for standardinvestments, such asstocks, bonds and mutualfunds. In addition,Separately ManagedAccounts (SMAs) displayside by side with thesestandard investments.
Allocation SummaryThe Allocation Summary report reveals the actual and target allocation.

Evan Case Family TrustEvan & Marilyn Case
Allocation SummaryModel: EVAN CASE IRA | US Dollar
12/31/2010
ClassificationMarket
Value%
AssetsTarget %
Allocation%
DifferenceTargetValue
ValueDifference
Cash
Cash Account 196,720.69 0.7 0.0 0.7 1,207.17 195,513.52
Dividend Wash Account 1,098.67 0.0 0.1 -0.1 21,305.66 -20,206.99
MAIRS & POWERS GROWTH SMA 3,078,890.40 10.2 0.0 10.2 0.00 3,078,890.40
Cash Total 3,276,709.76 10.9 0.1 10.8 22,512.82 3,254,196.94
SMA
BLACKROCK SMALL GROWTH SMA 4,117,193.76 13.7 0.0 13.7 0.00 4,117,193.76
SMA Total 4,117,193.76 13.7 0.0 13.7 0.00 4,117,193.76
Total Portfolio 30,074,967.89 100.0 100.0 0.0 30,074,967.89 0.00
Advent Software
Evan Case Family TrustEvan & Marilyn Case
Allocation SummaryModel: EVAN CASE IRA | US Dollar
12/31/2010
ClassificationMarket
Value%
AssetsTarget %
Allocation%
DifferenceTargetValue
ValueDifference
Fixed IncomeSAN FRANCISCO CALIF CITY&CNTY UNI SCHDST 1,277,700.00 4.2 0.0 4.2 0.00 1,277,700.00
5.000% Due 06-15-19
GEORGIA PAC CORP 615,000.00 2.0 0.0 2.0 0.00 615,000.00
8.875% Due 05-15-31
Fixed Income Total 7,719,562.36 25.7 29.9 -4.2 8,978,081.54 -1,258,519.18
Other
ALETHEIA MARKET NEUTRAL LP 792,000.00 2.6 0.0 2.6 0.00 792,000.00
DRAWBRIDGE DISTRESSED DEBT FUND 763,200.00 2.5 0.0 2.5 0.00 763,200.00
GOLDMAN SACHS PRIVATE EQUITY PRTRS LP 585,000.00 1.9 0.0 1.9 0.00 585,000.00
LEUTHOLD FDS INC GRIZZLY SHORT 175,500.00 0.6 0.0 0.6 0.00 175,500.00
POWERSHARES DB CMDTY IDX TRACK UNIT BEN INT 495,900.00 1.6 0.0 1.6 0.00 495,900.00
Other Total 2,811,600.00 9.3 0.0 9.3 0.00 2,811,600.00
22
Copyright © 2013 Advent Software, Inc.
Allocation Summary(Continued)

f h h d k ll l l d dPortfolio Allocation as of 12/31/2010
Industry Sector Market Value % Equity % Assets
INDUSTRIALS 88,252.00 3.1 2.5
CONSUMER DISCRETIONARY 685,307.00 23.8 19.7
CONSUMER STAPLES 973,995.00 33.8 28.0
HEALTH CARE 245,730.00 8.5 7.1
FINANCIALS 158,308.00 5.5 4.6
TECHNOLOGY 288,240.00 10.0 8.3
LARGE CAP MF 484.90 0.0 0.0
SMALL CAP MF 438,200.00 15.2 12.6
Equity Total 2,878,516.90 100.0 82.9
Top 10 HoldingsSymbol Security Market Value % Assets
rost ROSS STORES INC COM 807,070.00 23.2
hrtv.x HEARTLAND VALUE FD COM 438,200.00 12.6
tif TIFFANY & CO NEW COM 398,528.00 11.5
hd HOME DEPOT INC COM 249,802.50 7.2
amgn AMGEN INC COM 208,620.00 6.0
txn TEXAS INSTRS INC COM 130,000.00 3.7
sch SCHWAB CHARLES CORP NEW COM 102,660.00 3.0
hrl HORMEL FOODS CORP 102,520.00 3.0
csco CISCO SYS INC COM 80,920.00 2.3
tyc TYCO INTL LTD BERMUDA SHS 66,304.00 1.9
Top 10 Holdings Total 2,584,624.50 74.4
Equity Allocation by Security Type
Advent Software
Evan Case IRACASEIRA
Equity OverviewUS Dollar
12/31/2010
23
Copyright © 2013 Advent Software, Inc.
The report can be run forfirms needing to displayany custom classification,industry group, or sector.
The report alsographically displaysequity allocations bysecurity type.
Equity OverviewThe Equity Overview shows key information for the equity assets in the portfolio.

I t t M B l d F d A t # 12345 US D ll 12/31/2010 l jDistribution by Moody Rating
Moody Rating Number Market Value% FI
HoldingsAverage
YTMAverageCoupon
AverageDuration
Aaa 3 5,853,868 45.0 % 4.1 3.961 % 8.3
Aa2 1 544,903 4.2 % 4.8 5.000 % 2.7
A1 1 2,802,291 21.5 % 4.9 4.750 % 5.3
Baa1 1 614,928 4.7 % 6.2 7.650 % 5.0
Caa3 1 3,204,650 24.6 % 5.4 5.330 % 6.8
Distribution by Duration
Distribution by S&P Rating
S&P Rating Number Market Value% FI
HoldingsAverage
YTMAverageCoupon
AverageDuration
AAA 3 5,853,868 45.0 % 4.1 3.961 % 8.3
AA+ 1 544,903 4.2 % 4.8 5.000 % 2.7
A+ 1 2,802,291 21.5 % 4.9 4.750 % 5.3
A- 1 614,928 4.7 % 6.2 7.650 % 5.0
CCC 1 3,204,650 24.6 % 5.4 5.330 % 6.8
Distribution by Maturity
Advent Software
Investment Management ConsultingBalanced FundAccount # 12345
Fixed Income DistributionUS Dollar
12/31/2010
24
Copyright © 2013 Advent Software, Inc.
Fixed Income DistributionThe Fixed Income Distribution report includes the option to display the portfolio’s distribution by maturity, coupon, duration, or ratings.
For each of the fourquadrants, firms canchoose to display data intable, pie, or bar chartform.
I t t M B l d F d A t # 12345 US D ll 12/31/2010 l j
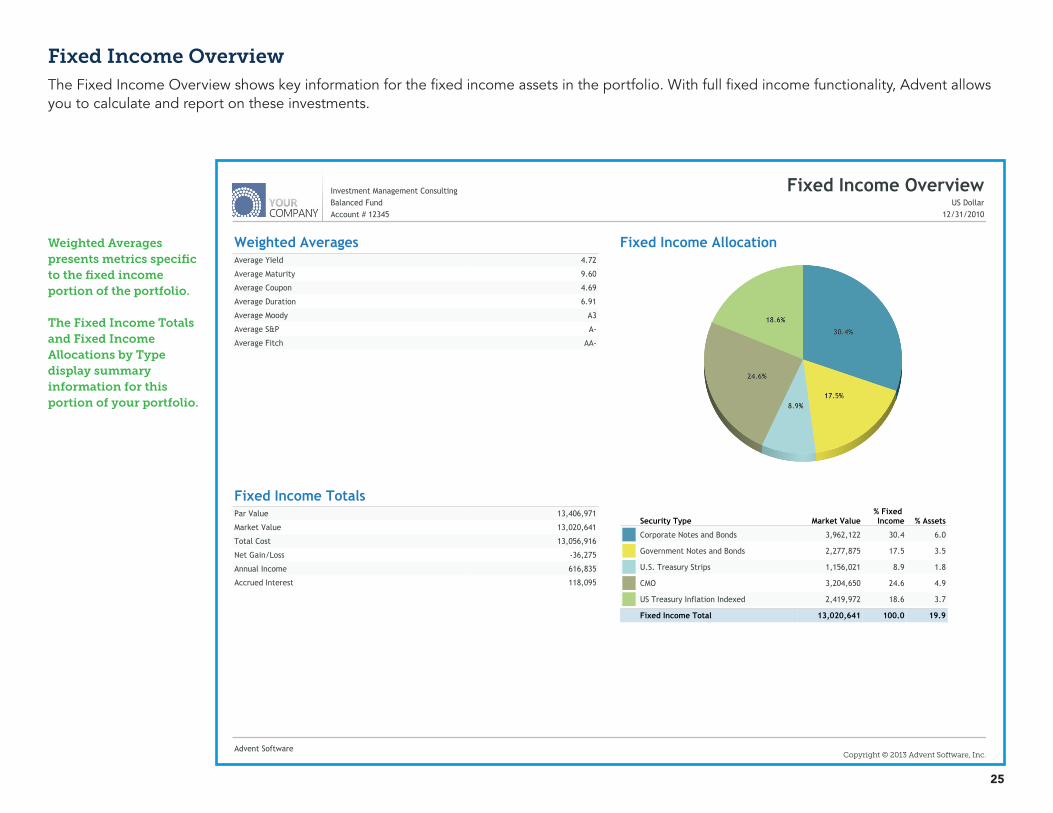
Security Type Market Value% Fixed Income % Assets
Corporate Notes and Bonds 3,962,122 30.4 6.0
Government Notes and Bonds 2,277,875 17.5 3.5
U.S. Treasury Strips 1,156,021 8.9 1.8
CMO 3,204,650 24.6 4.9
US Treasury Inflation Indexed 2,419,972 18.6 3.7
Fixed Income Total 13,020,641 100.0 19.9
Fixed Income TotalsPar Value 13,406,971
Market Value 13,020,641
Total Cost 13,056,916
Net Gain/Loss -36,275
Annual Income 616,835
Accrued Interest 118,095
Weighted AveragesAverage Yield 4.72
Average Maturity 9.60
Average Coupon 4.69
Average Duration 6.91
Average Moody A3
Average S&P A-
Average Fitch AA-
Fixed Income Allocation
Advent Software
Investment Management ConsultingBalanced FundAccount # 12345
Fixed Income OverviewUS Dollar
12/31/2010
25
Copyright © 2013 Advent Software, Inc.
Weighted Averagespresents metrics specificto the fixed incomeportion of the portfolio.
The Fixed Income Totalsand Fixed IncomeAllocations by Typedisplay summaryinformation for thisportion of your portfolio.
Fixed Income OverviewThe Fixed Income Overview shows key information for the fixed income assets in the portfolio. With full fixed income functionality, Advent allowsyou to calculate and report on these investments.

Symbol Security Jan 2010 Feb 2010 Mar 2010 Apr 2010 May 2010 Jun 2010 Jul 2010 Aug 2010 Sep 2010 Oct 2010 Nov 2010 Dec 2010
Equity
Mutual Funds (USD)
fgri.x FIDELITY SECS FD GRWTH & INCM PRT
8.04 0.00 0.00 8.04 0.00 0.00 8.04 0.00 0.00 8.04 0.00 0.00
vfin.x VANGUARD INDEX FDS 500 PORTFOLIO
0.00 0.00 1.23 0.00 0.00 1.23 0.00 0.00 1.23 0.00 0.00 1.23
Mutual Funds (USD) Total 8.04 0.00 1.23 8.04 0.00 1.23 8.04 0.00 1.23 8.04 0.00 1.23
Common Stock
agl ANGELICA CORP COM 1,760.00 0.00 0.00 1,760.00 0.00 0.00 1,760.00 0.00 0.00 1,760.00 0.00 7,040.00
ann ANNTAYLOR STORES CORP COM 0.00 654.00 0.00 0.00 654.00 0.00 0.00 654.00 0.00 0.00 654.00 0.00
adm ARCHER DANIELS MIDLAND CO COM
0.00 0.00 4,215.00 0.00 0.00 4,215.00 0.00 0.00 4,215.00 0.00 0.00 4,215.00
t AT&T INC COM 0.00 4,868.00 0.00 0.00 4,868.00 0.00 0.00 5,268.00 0.00 0.00 10,799.40 0.00
bk BANK OF NEW YORK MELLON CORP COM
0.00 2,896.80 0.00 0.00 2,896.80 0.00 0.00 2,896.80 0.00 0.00 3,983.10 0.00
bks BARNES & NOBLE INC COM 0.00 0.00 2,262.00 0.00 0.00 2,262.00 0.00 0.00 2,262.00 0.00 0.00 6,032.00
Advent Software
1/1/2010 - 12/31/2010US Dollar
Income ProjectionCASEEvan Case
26
Copyright © 2013 Advent Software, Inc.
View income detail bysecurity and month.
This report can alsodisplay summaryinformation at theclassification level.
Income ProjectionThe Income Projection report presents anticipated cash inflows from investments including mutual funds, stocks and bonds.

Symbol Security Jan 2010 Feb 2010 Mar 2010 Apr 2010 May 2010 Jun 2010 Jul 2010 Aug 2010 Sep 2010 Oct 2010 Nov 2010 Dec 2010
bax BAXTER INTL INC COM 2,647.70 0.00 0.00 2,647.70 0.00 0.00 2,647.70 0.00 0.00 2,647.70 0.00 0.00
cvx CHEVRON CORP NEW COM 0.00 0.00 4,055.04 0.00 0.00 4,055.04 0.00 0.00 4,055.04 0.00 0.00 4,055.04
dell DELL INC COM 0.00 0.00 350.00 0.00 0.00 350.00 0.00 0.00 350.00 0.00 0.00 350.00
dow DOW CHEM CO COM 4,940.46 0.00 0.00 4,940.46 0.00 0.00 4,940.46 0.00 0.00 4,940.46 0.00 0.00
duk DUKE ENERGY CORP NEW COM 0.00 0.00 6,043.40 0.00 0.00 6,043.40 0.00 0.00 6,043.40 0.00 0.00 12,773.55
ge GENERAL ELECTRIC CO COM 3,007.00 0.00 0.00 3,007.00 0.00 0.00 3,007.00 0.00 0.00 3,007.00 0.00 0.00
goog GOOGLE INC CL A 0.00 0.00 36.40 0.00 0.00 36.40 0.00 0.00 76.40 0.00 0.00 76.40
se SPECTRA ENERGY CORP COM 0.00 0.00 4,735.70 0.00 0.00 4,735.70 0.00 0.00 4,735.70 0.00 0.00 9,883.20
wag WALGREEN CO COM 0.00 0.00 1,242.00 0.00 0.00 1,242.00 0.00 0.00 1,242.00 0.00 0.00 3,174.00
Common Stock Total 19,696.01 12,279.60 38,236.12 19,696.01 12,279.60 38,236.12 19,696.01 12,679.60 38,276.12 19,696.01 22,346.05 71,681.26
Equity Total 19,704.05 12,279.60 38,237.35 19,704.05 12,279.60 38,237.35 19,704.05 12,679.60 38,277.35 19,704.05 22,346.05 71,682.49
Fixed Income
Government Notes and Bonds
912810dv7 UNITED STATES TREAS BDS 0.00 4,625.00 0.00 0.00 0.00 0.00 0.00 4,625.00 0.00 0.00 0.00 0.00
9.250% Due 02-15-16
Government Notes and Bonds Total 0.00 4,625.00 0.00 0.00 0.00 0.00 0.00 4,625.00 0.00 0.00 0.00 0.00
Mutual Funds (USD)
fahb.x FIDELITY ADVISOR SER II HI INCM ADV B
4.36 4.36 4.36 4.36 4.36 4.36 4.36 4.36 4.36 4.36 4.36 4.36
vsgb.x VANGUARD FIXED INCOME SECS FD SHT TRM FED PT
0.07 0.07 0.07 0.07 0.07 0.07 0.07 0.07 0.07 0.07 0.07 0.07
stvs.x WELLS FARGO FDS TR ADV GOV SC INV
1.56 1.56 1.56 1.56 1.56 1.56 1.56 1.56 1.56 1.56 1.56 1.56
1/1/2010 - 12/31/2010US Dollar
Income ProjectionCASEEvan Case
Mutual Funds (USD) Total 5.99 5.99 5.99 5.99 5.99 5.99 5.99 5.99 5.99 5.99 5.99 5.99
Fixed Income Total 5.99 4,630.99 5.99 5.99 5.99 5.99 5.99 4,630.99 5.99 5.99 5.99 5.99
Cash
Cash Accounts
cash Cash Account 0.00 0.00 4,382.99 0.00 0.00 0.00 0.00 0.00 12,000.00 0.00 0.00 263.96
Cash Accounts Total 0.00 0.00 4,382.99 0.00 0.00 0.00 0.00 0.00 12,000.00 0.00 0.00 263.96
Cash Total 0.00 0.00 4,382.99 0.00 0.00 0.00 0.00 0.00 12,000.00 0.00 0.00 263.96
Total 19,710.04 16,910.59 42,626.33 19,710.04 12,285.59 38,243.34 19,710.04 17,310.59 50,283.34 19,710.04 22,352.04 71,952.44
Grand Total 350,804.39
27
Copyright © 2013 Advent Software, Inc.
Income Projection(Continued)
Investment Management ConsultingBalanced FundAccount # 12345
Portfolio Appraisal12/31/2010
US Dollar
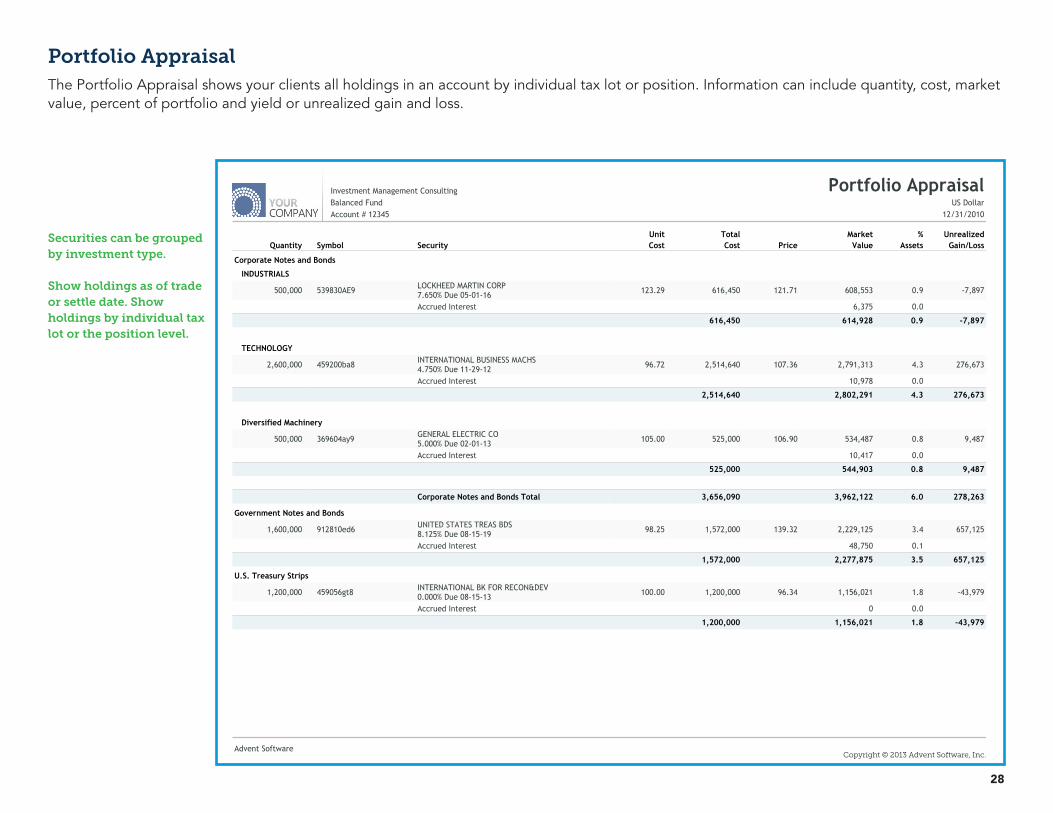
Unit Total Market % UnrealizedQuantity Symbol Security Cost Cost Price Value Assets Gain/Loss
Corporate Notes and Bonds
INDUSTRIALS
500,000 539830AE9 LOCKHEED MARTIN CORP7.650% Due 05-01-16 123.29 616,450 121.71 608,553 0.9 -7,897
Accrued Interest 6,375 0.0
616,450 614,928 0.9 -7,897
TECHNOLOGY
2,600,000 459200ba8 INTERNATIONAL BUSINESS MACHS4.750% Due 11-29-12 96.72 2,514,640 107.36 2,791,313 4.3 276,673
Accrued Interest 10,978 0.0
2,514,640 2,802,291 4.3 276,673
Diversified Machinery
500,000 369604ay9 GENERAL ELECTRIC CO5.000% Due 02-01-13 105.00 525,000 106.90 534,487 0.8 9,487
Accrued Interest 10,417 0.0
525,000 544,903 0.8 9,487
Corporate Notes and Bonds Total 3,656,090 3,962,122 6.0 278,263
Government Notes and Bonds
1,600,000 912810ed6 UNITED STATES TREAS BDS8.125% Due 08-15-19 98.25 1,572,000 139.32 2,229,125 3.4 657,125
Accrued Interest 48,750 0.1
1,572,000 2,277,875 3.5 657,125
U.S. Treasury Strips
1,200,000 459056gt8 INTERNATIONAL BK FOR RECON&DEV0.000% Due 08-15-13 100.00 1,200,000 96.34 1,156,021 1.8 -43,979
Accrued Interest 0 0.0
1,200,000 1,156,021 1.8 -43,979
Advent Software
28
Copyright © 2013 Advent Software, Inc.
Portfolio AppraisalThe Portfolio Appraisal shows your clients all holdings in an account by individual tax lot or position. Information can include quantity, cost, marketvalue, percent of portfolio and yield or unrealized gain and loss.
Securities can be groupedby investment type.
Show holdings as of tradeor settle date. Showholdings by individual taxlot or the position level.

Investment Management ConsultingBalanced FundAccount # 12345
Portfolio Appraisal12/31/2010
US Dollar
Unit Total Market % UnrealizedQuantity Symbol Security Cost Cost Price Value Assets Gain/Loss
TECHNOLOGY
1,500 aapl APPLE INC COM 200.04 300,055 322.56 483,840 0.7 183,785
20,820 glw CORNING INC COM 22.03 458,675 19.32 402,242 0.6 -56,432
1,020 goog GOOGLE INC CL A 522.04 532,481 593.97 605,849 0.9 73,369
22,410 intc INTEL CORP COM 22.08 494,823 21.03 471,282 0.7 -23,541
5,050 ibm INTERNATIONAL BUSINESS MACHS COM 115.50 583,275 146.76 741,138 1.1 157,864
42,460 mu MICRON TECHNOLOGY INC COM 11.03 468,344 8.02 340,529 0.5 -127,815
22,120 nt NORTEL NETWORKS LTD 24.03 531,554 84.50 1,869,140 2.9 1,337,586
26,990 orcl ORACLE CORP COM 17.78 479,892 31.30 844,787 1.3 364,895
3,849,097 5,758,808 8.8 1,909,711
UTILITIES
29,070 duk DUKE ENERGY CORP NEW COM 15.93 463,095 17.81 517,737 0.8 54,642
20,490 se SPECTRA ENERGY CORP COM 23.78 487,262 24.99 512,045 0.8 24,783
950,357 1,029,782 1.6 79,425
Common Stock Total 14,844,766 19,368,854 29.5 4,524,087
Cash Accounts
cash Cash Account 31,412,619 31,412,619 47.9
divacc Dividend Accrual (usd) 15,338 15,338 0.0
31,427,957 31,427,957 47.9
Cash Accounts Total 31,427,957 31,427,957 47.9
Total Portfolio 59,918,709 65,559,193 100.0 5,522,390
Advent Software
29
Copyright © 2013 Advent Software, Inc.
Portfolio Appraisal(Continued)

Investment Management ConsultingBalanced FundAccount # 12345
Realized Gains and Losses1/1/2010 - 12/31/2010
US Dollar
Short Term Long TermOpen Date Close Date Quantity Security Cost Basis Proceeds Gain/Loss Gain/Loss5/1/2007 2/28/2010 800,000 EDUCATION LOANS INC 2004-C-D 800,000 812,000 12,000
5.329% Due 12-21-36
7/2/2007 2/28/2010 819,700 EDUCATION LOANS INC 2004-C-D 860,685 819,700 -40,985
5.329% Due 12-21-36
8/14/2006 8/15/2010 2,000,000 U S TREAS SEC STRIPPED INT PMT 1,940,000 2,000,000 60,000
0.000% Due 08-15-10
Total Gains 0 72,000
Total Losses 0 -40,985
Total 3,600,685 3,631,700 0 31,015
Total Realized Gain/Loss 31,015
No Capital Gains Distributions
Advent Software
30
Realized Gains and LossesRealized Gains and Losses provides a listing of transactions, cost, proceeds, and associated gains or losses categorized by holding period.
Quickly identify thesecurities sold and theassociated short and longterm gains generated.
View a portfolio’s totalgains and losses for anytime frame chosen.
Copyright © 2013 Advent Software, Inc.

Investment Management ConsultingBalanced FundAccount # 12345
Transaction Summary1/1/2010 - 12/31/2010
US Dollar
Purchases
Trade Date Settle Date Quantity SecurityUnitCost Total Cost
2/25/2010 3/2/2010 500,000 LOCKHEED MARTIN CORP 123.29 616,450
7.650% Due 05-01-16
2/25/2010 3/2/2010 600,000 INTERNATIONAL BUSINESS MACHS 106.19 637,140
4.750% Due 11-29-12
2/25/2010 3/2/2010 500,000 GENERAL ELECTRIC CO 105.00 525,000
5.000% Due 02-01-13
Total Purchases 1,778,590
Sales
Trade Date Settle Date Quantity SecurityUnitCost Total Cost
UnitPrice Proceeds Gain/Loss
2/28/2010 3/1/2010 800,000 EDUCATION LOANS INC 2004-C-D 100.00 800,000 101.50 812,000 12,000
5.329% Due 12-21-36
2/28/2010 3/1/2010 819,700 EDUCATION LOANS INC 2004-C-D 105.00 860,685 100.00 819,700 -40,985
5.329% Due 12-21-36
Total Sales 1,660,685 1,631,700 -28,985
Advent Software
31
Copyright © 2013 Advent Software, Inc.
Transaction SummaryThe Transaction Summary Report displays all of the account transactions maintained by Advent giving you an independent record apart from your custodian.
Select which transactiontypes to display from avariety of choices.� Call� Contribution� Dividends� Expenses� Interest� Maturities� Purchase� Puts� Return of Capital� Principal Payments� Sales� Withdrawals
At a glance clients canreview what has beenpurchased and sold withintheir account.

Investment Management ConsultingBalanced FundAccount # 12345
Transaction Summary1/1/2010 - 12/31/2010
US Dollar
InterestTrade Date Settle Date Security Amount
1/15/2010 1/15/2010 UNITED STATES TREAS (TIIPS) due 1/15/16 21,790
2.000% Due 01-15-16
2/15/2010 2/15/2010 UNITED STATES TREAS BDS 65,000
8.125% Due 08-15-19
5/29/2010 5/29/2010 INTERNATIONAL BUSINESS MACHS 47,500
4.750% Due 11-29-12
7/15/2010 7/15/2010 UNITED STATES TREAS (TIIPS) due 1/15/16 21,976
2.000% Due 01-15-16
8/15/2010 8/15/2010 UNITED STATES TREAS BDS 65,000
8.125% Due 08-15-19
11/29/2010 11/29/2010 INTERNATIONAL BUSINESS MACHS 47,500
4.750% Due 11-29-12
Total Interest 268,766
Maturities
Trade Date Settle Date Quantity SecurityUnitCost Total Cost
UnitPrice Proceeds Gain/Loss
8/15/2010 8/15/2010 2,000,000 U S TREAS SEC STRIPPED INT PMT 97.00 1,940,000 100.00 2,000,000 60,000
0.000% Due 08-15-10
Total Maturities 1,940,000 2,000,000 60,000
Advent Software
32
Copyright © 2013 Advent Software, Inc.
Transaction Summary(Continued)

1. Sample 8 Investments claims compliance with the Global Investment Performance Standards (GIPS®) and has prepared and presented this report in compliance with the GIPS standards. Sample 8 Investments has been independently verified for the period from 1 April 1996 through 31 December 2009.
Verification assesses whether (1) the firm has complied with all the composite construction requirements of the GIPS standards on a firm-wide basis and (2) the firm’s policies and procedures are designed to calculate and present performance in compliance with the GIPS standards. The Large-Cap SMA Composite has been examined for the period from 1 January 2006 through 31 December 2009. The verification and performance examination reports are available upon request.
2. Sample 8 Investments is an independent investment adviser registered under the Investment Advisers Act of 1940, was founded in March 1996, and manages global large-cap equity, fixed income, and balanced strategies.
3. Beginning 1 January 2006, the composite includes only wrap fee (SMA) portfolios benchmarked to the XYZ Index. Performance results prior to 2006 are based on the Large-Cap Institutional Composite returns.
4. The Large-Cap SMA Composite is comprised of portfolios invested in U.S. equities which have a market capitalization greater than $5 billion.
5. The composite was created in February 2006. A list of composite descriptions is available upon request.
6. All returns are expressed in U.S. dollars. Policies for valuing portfolios, calculating performance, and preparing compliant presentations are available upon request.
7. The XYZ Index returns are provided to represent the investment environment existing during the time periods shown. For comparison purposes, the index is fully invested and includes the reinvestment of income. The returns for the index do not include any trading costs, management fees, or other costs. Index returns have been taken from published sources.
8. “Pure” gross returns, presented below as supplemental information, from 2006 through 2010 do not reflect the deduction of any trading costs, fees, or expenses and are presented for comparison purposes only. “Pure” gross returns prior to 2006 reflect the deduction of trading costs. The SMA fee includes all charges for trading costs, portfolio management, custody, and other administrative fees. Net returns are calculated by subtracting the highest applicable SMA fee (2.50% on an annual basis, or 0.21% monthly) on a monthly basis from the “pure” gross composite monthly return. The standard fee schedule in effect is as follows: 2.50% on total assets.
9. The dispersion is measured by the equal-weighted standard deviation of annual returns of those portfolios that are included in the composite for the full year.
10. At 31 December 2010, the three-year annualized ex-post standard deviation of the composite and the benchmark are 12.3% and 13.2%, respectively.
11. Past performance is not an indicator of future results.
Your Company
Disclaimer & TermsDecember 31, 2010
Copyright © 2011 Advent Software, Inc.
33
Copyright © 2013 Advent Software, Inc.
Disclaimer and TermsThe disclaimer page offers flexibility to display firm specific disclaimers and supplemental information.
Provide terms anddefinitions to clients.Include supplementalinformation to supportreport detail.

ADVENT SOFTWARE, INC.[HQ]600 Townsend StreetSan Francisco, CA 94103+1 800 7270605
[NY]1114 Avenue of the AmericasNew York, NY 10036+1 212 398 1188
[HK]Suite 3118–3120, Level 31Entertainment Building30 Queen’s RoadCentral, Hong Kong+852 3103 1000
[UK]127–133 Charing Cross RoadLondon WC2H 0EW, UK+44 20 76319240
www.advent.com Copyright © 2013 Advent Software, Inc. All rights reserved.REPAPX1113
Advent is a registered trademark of Advent Software, Inc. Allother products or services mentioned herein are trademarks oftheir respective companies. Information subject to change withoutnotice. Printed on recycled paper.