Volunteer Monitoring of Restoration Work Presentation Outline
Contributed Paper
Advantages of Volunteer-Based BiodiversityMonitoring in EuropeDIRK S. SCHMELLER,a,b,c PIERRE-YVES HENRY,d ROMAIN JULLIARD,d BERND GRUBER,e
JEAN CLOBERT,a FRANK DZIOCK,b,f SZABOLCS LENGYEL,g PIOTR NOWICKI,h
ESZTER DERI,i EDUARDAS BUDRYS,j TIIU KULL,k KADRI TALI,k BIANCA BAUCH,b
JOSEF SETTELE,l CHRIS VAN SWAAY,m ANDREJ KOBLER,n VALERIJA BABIJ,o
EVA PAPASTERGIADOU,p AND KLAUS HENLEb
aStation d’Ecologie Experimentale du CNRS a Moulis, 09200 Saint Girons, FrancebUFZ – Helmholtz-Centre for Environmental Research, Department of Conservation Biology, Permoserstrasse 15, 04318 Leipzig,GermanydUMR 5173 & UMR 7179 MNHN-CNRS-UPMC, Museum National d’Histoire Naturelle, CP 51, 55 rue Buffon, Paris, FranceeUFZ – Helmholtz-Centre for Environmental Research, Department of Computational Landscape Ecology, Permoserstrasse 15,04318 Leipzig, GermanyfTechnische Universitat Berlin, Department of Biodiversity Dynamics, Rothenburgstrasse 12, 12165 Berlin, GermanygDepartment of Ecology, University of Debrecen, 4032 Debrecen, Egyetem ter 1, HungaryhInstitute of Environmental Sciences, Jagiellonian University, Gronostajowa 7, 30-387 Krakow, PolandiDepartment of Evolutionary Zoology, University of Debrecen, 4032 Debrecen, Egyetem ter 1, HungaryjInstitute of Ecology of Vilnius University, Akademijos 2, 08412 Vilnius, LithuaniakEstonian University of Life Sciences, Institute of Agricultural and Environmental Sciences, Riia 181, 51014 Tartu, EstonialUFZ – Helmholtz-Centre for Environmental Research, Department of Community Ecology, Theodor-Lieser-Str. 4, 06120 Halle,GermanymDe Vlinderstichting – Dutch Butterfly Conservation, P.O. Box 506, 6700 AM Wageningen, The NetherlandsnDepartment of Forest Inventory and Spatial Information Systems, Slovenian Forestry Institute, Vecna pot 2, 1000 Ljubljana,SloveniaoScientific Research Centre of Slovenian Academy of Sciences and Arts Jovan Hadzi Institute of Biology, Novi trg 2, 1000Ljubljana, SloveniapDepartment of Biology Plant Ecology & Ecosystems Management, 26500 Patras, Greece
Abstract: Without robust and unbiased systems for monitoring, changes in natural systems will remain
enigmatic for policy makers, leaving them without a clear idea of the consequences of any environmental
policies they might adopt. Generally, biodiversity-monitoring activities are not integrated or evaluated across
any large geographic region. The EuMon project conducted the first large-scale evaluation of monitoring
practices in Europe through an on-line questionnaire and is reporting on the results of this survey. In September
2007 the EuMon project had documented 395 monitoring schemes for species, which represents a total annual
cost of about €4 million, involving more than 46,000 persons devoting over 148,000 person-days/year to
biodiversity-monitoring activities. Here we focused on the analysis of variations of monitoring practices
across a set of taxonomic groups (birds, amphibians and reptiles, mammals, butterflies, plants, and other
insects) and across 5 European countries (France, Germany, Hungary, Lithuania, and Poland). Our results
suggest that the overall sampling effort of a scheme is linked with the proportion of volunteers involved in that
scheme. Because precision is a function of the number of monitored sites and the number of sites is maximized
by volunteer involvement, our results do not support the common belief that volunteer-based schemes are too
noisy to be informative. Just the opposite, we believe volunteer-based schemes provide relatively reliable data,
cAddress correspondence to Dirk S. Schmeller, email [email protected] submitted November 12, 2007; revised manuscript accepted July 28, 2008.
307Conservation Biology, Volume 23, No. 2, 307–316C©2008 Society for Conservation BiologyDOI: 10.1111/j.1523-1739.2008.01125.x
308 Volunteer-Based Biodiversity Monitoring
with state-of-the-art survey designs or data-analysis methods, and consequently can yield unbiased results.
Quality of data collected by volunteers is more likely determined by survey design, analytical methodology,
and communication skills within the schemes rather than by volunteer involvement per se.
Keywords: biodiversity monitoring, costs, data collection, sampling effort, volunteer involvement
Ventajas del Monitoreo de Biodiversidad Basado en Voluntarios en Europa
Resumen: Sin sistemas de monitoreo robustos y objetivos, los cambios en los sistemas naturales seguiran
siendo un enigma para los polıticos, ya que no tendran una idea clara de las consecuencias de las polıticas
ambientales que puedan adoptar. Generalmente, las actividades de monitoreo de la biodiversidad no estan
integradas o evaluadas en ninguna region geografica extensa. El proyecto EuMon llevo a cabo la primera
evaluacion a gran escala de las practicas de monitoreo en Europa por medio de un cuestionario en lınea
y presenta los resultados de este muestreo. En septiembre 2007, el proyecto EuMon habıa documentado
395 esquemas de monitoreo de especies, lo que representa un costo anual total de casi €4 millones, y la
participacion de mas de 46,000 personas que dedican mas de 148,000 personas dıas/ano en actividades
de monitoreo de la biodiversidad. Aquı, nos centramos en el analisis de variaciones en las practicas de
monitoreo de un conjunto de grupos taxonomicos (aves, anfibios y reptiles, mamıferos, mariposas, plantas y
otros insectos) en cinco paıses europeos (Francia, Alemania, Hungrıa, Lituania y Polonia). Nuestros resultados
sugieren que el esfuerzo de muestreo total de un esquema esta vinculado con la proporcion de voluntarios
que participan en el ese esquema. Debido a que la precision es una funcion del numero de sitios monitoreados
y el numero de sitios es maximizado por la participacion de voluntarios, nuestros resultados no soportan la
creencia popular de que los esquemas basados en voluntarios tienen demasiado ruido para ser informativos.
Al contrario, consideramos que los esquemas basados en voluntarios proporcionan datos confiables, con
disenos de muestreo o metodos de analisis de datos de vanguardia, y consecuentemente pueden proporcionar
resultados objetivos. La calidad de los datos recolectados por voluntarios probablemente esta determinada
por el diseno del muestreo, la metodologıa analıtica y las habilidades de comunicacion de los esquemas y no
por la participacion de voluntarios per se.
Palabras Clave: costos, esfuerzo de muestreo, monitoreo de biodiversidad, participacion de voluntarios,recoleccion de datos
Introduction
International conventions, such as the Convention onBiodiversity (CBD) and the European nature directives,compel national governments to implement and identifyexisting biodiversity-monitoring schemes (92/43/EEC,conservation of natural habitats and of wild fauna andflora [Habitats Directive]; 79/409/EEC, conservation ofwild birds [Birds Directive], see also Evans 2005). With-out robust and unbiased systems for monitoring changesin natural systems, policy makers will not realize the ex-tent of change, and they will have no clear way to eval-uate the consequences of environmental policies theymight adopt (Balmford et al. 2003, 2005). A good recentexample of how policy can be informed by biodiversitymonitoring and analysis was shown for European birdspecies (Donald et al. 2007).
Biodiversity monitoring entails 3 activities: collectingmonitoring data, such as occurrence or abundance in-dices in a target area over an appropriate timescale; an-alyzing the spatial and temporal patterns of biodiversitycomponents, including diagnosing the causes of changeas robustly as possible; and deriving results orientedtoward policy makers, such as status and trend assess-ments or management evaluations. Biodiversity monitor-
ing faces at least 2 practical difficulties: the need to main-tain a sustained effort of monitoring across years to en-sure the collection of relevant monitoring time series andthe need to obtain precise monitoring data that allow thedetection of significant changes across space and timein biodiversity. These needs come into conflict with theusually limited amount of available financial and humanresources. A trade-off solution is to involve volunteersin monitoring activities. In Europe and North Americamany monitoring organizations rely on such volunteerprograms (van Swaay et al. 1997; Link & Sauer 1998; Van-denbosch 2003; Thomas 2005; Gregory et al. 2005). Theinvolvement of the public is imperative to reduce the costof biodiversity monitoring and has the added benefit ofenhancing citizen participation in science practices andthus environmental awareness (e.g., Bell et al. 2008). Nev-ertheless, volunteer-based monitoring is often perceivedas simplistic, prone to higher biases than professionalmonitoring schemes (Engel & Voshell 2002; Genet & Sar-gent 2003), and as a trade-off between precision and cost(Brashares & Sam 2005).
Here we report on the results of the first large-scale evaluation of monitoring practices in Europe. Wecompared monitoring practices and potential benefits re-sulting from volunteer involvement in different species
Conservation Biology
Volume 23, No. 2, 2009
Schmeller et al. 309
groups and across several eastern and western Europeancountries.
Methods
The EuMon project (Schmeller et al. 2006) conducteda survey on biodiversity-monitoring practices across Eu-rope from 2005 to 2007. We examined the data gatheredup to September 2007. Information on monitoring pro-grams and practices was and still is collected throughan Internet questionnaire. The questionnaire had 8 ques-tions on basic features of biodiversity monitoring and33 questions specific to species-monitoring methods anddesign (see Supporting Information). For reaching rep-resentatives of stakeholder groups involved in monitor-ing activities (governmental and nongovernmental bod-ies), we distributed announcements of the questionnairethrough emails, letters, and at conferences to over 1600individuals and several national and international mailinglists. We asked respondents to provide data on-line, butalso accepted written responses, which were inputtedto the database by us. Responses were checked for com-pleteness, and missing details were sought from the co-ordinators of monitoring projects. After validation datawere accepted and made publicly available in a database.Complete information was not available for all schemes;hence, the sample sizes and degrees of freedom differslightly among tests and comparisons.
Determination of Biases in Taxonomic and GeographicalCoverage
Despite the fact that the EuMon survey is the first large-scale survey of its kind, it may suffer from biases in taxo-
Table 1. Variables describing biodiversity-monitoring practices in our study.
Variable Abbreviation Description
Annual frequency ann. freq. between-year frequency of monitoring;1, every year; 2, every second year, etc.
Work effort person-days person-days/monitoring schemeWork effort per species divided person-daysspec person-days/monitoring scheme
by the number of species monitoredNo. of professionals Nprof no. professionals in a schemeNo. of samples Nsamples no. samples collected/visitNo. of sites Nsites no. sites visitedNo. of species Nspecies no. species monitored simultaneously in a schemeNo. of visits Nvisits no. visits per yearNo. of volunteers Nvolunteers no. volunteers in a schemePersons Npersons sum of volunteer and professionals in one schemeProportion of volunteers % vol proportion of volunteers in a schemeTotal costs costs sum of costs of equipment and salaries of professionals, as given
by the average salary per country in 2005 (World Bank 2006)Total costs per species costsspec sum of costs of equipment and salaries of professionals, as given
by the average salary per country in 2005 (World Bank 2006)divided by no. of species monitored in one scheme
Year year start year of monitoring scheme
nomic and geographic coverage. We assessed the geo-graphical bias by searching for country-related moni-toring entries in Zoological Records. We used the fol-lowing search string: biodiversity AND monitoring ANDspecies AND country. The taxonomic bias was assessedby searching the Zoological Records for animal speciesonly and Google Scholar for references to monitoring.The search query we used was monitoring AND speciesgroup AND europ. AND biodiversity. We computed thebias as logit(observed) – logit(expected), where the ob-served values were the values from our database and theexpected values the records from Zoological Records orGoogle Scholar that met our search criteria. Neverthe-less, the 2 databases may suffer from the same type ofbiases as our survey—differential inclinations of monitor-ing schemes to publish their results. Therefore, the biasesin our data would not differ much from usual publicationbiases.
Variables and Statistical Analysis
In total we collected data on 14 variables (Table 1), whichcharacterized monitoring practices and resource needsof biodiversity monitoring in Europe. We examined dif-ferences of monitoring schemes among species groupsthat were sufficiently covered by our survey (birds, n =149; amphibians and reptiles, n = 53; mammals, n = 90;plants, n = 58; butterflies n = 37; other insects, n = 31).The bird group comprised all bird-monitoring schemes,regardless of whether they targeted passerines, waterbirds, or any other subgroup. In addition, the mammalgroup comprised species as different as bats, rodents, andlarge carnivores. In plants we considered only monitor-ing schemes of vascular plants. The other-insects groupincluded monitoring schemes of dragonflies, beetles, and
Conservation Biology
Volume 23, No. 2, 2009

310 Volunteer-Based Biodiversity Monitoring
grasshoppers, but not butterflies. Country-specific differ-ences were examined for France (n = 91), Germany (n= 37), Hungary (n = 30), Lithuania (n = 32), and Poland(n = 101).
We used principal component analyses with 14 vari-ables to describe differences in monitoring practices indifferent species groups and countries. For determina-tion of the most discriminating variables among speciesgroups and countries, we used a fully saturated discrim-inate analysis with stepwise exclusion of statistically in-significant variables. We checked visually that all pairwiserelationships between the variables were linear (Support-ing Information). For correlations, we used the nonpara-metric Spearman rank correlation to obtain most robustresults. The statistical analyses were done with the R sta-tistical package (R Development Core Team 2008) andthe package ADE4 (Dray & Dufour 2007).
Results
The EuMon survey compiled descriptive data for 395species-monitoring schemes led by 227 organizationsin 28 European countries (data extracted September2007). The total annual cost of these monitoring schemeswas approximately €4 million, and they engaged morethan 46,000 people, who devoted over 148,000 person-days per year to monitoring activities. Only 13.3%of the participants in the monitoring programs wereprofessionals.
Biases
Despite a large sample we found some biases in oursurvey. Schemes from Hungary, Lithuania, Poland, andSlovenia were overrepresented, whereas schemes fromGreece, the United Kingdom, Italy, and Spain were under-represented (Supporting Information). The taxonomicbias following from Google Scholar and from ZoologicalRecord entries was consistent in a few taxonomic groupsonly (Supporting Information). Whereas amphibian andreptile monitoring schemes were overrepresented in theEuMon database, schemes monitoring fungi were themost underrepresented followed, respectively, by lichensand fishes. Schemes monitoring vascular plants wereslightly overrepresented according to Google Scholar.For the remaining analyzed taxonomic groups, their rela-tive representation in the EuMon database, the ZoologicalRecords, and Google Scholar were similar (Supporting In-formation).
Monitoring in Different Species Groups
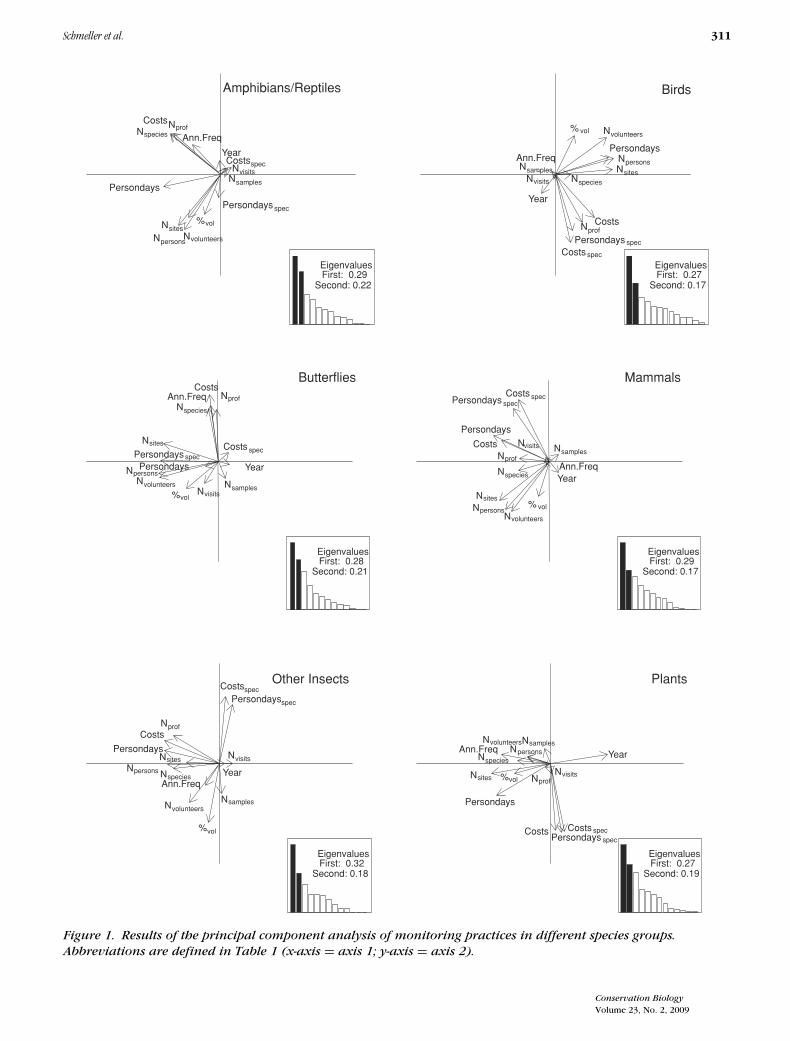
The different variables not only showed some differencesbetween the different species groups analyzed but alsohad some common features (Fig. 1). For plant monitor-
ing only, the starting year was negatively related to thenumber of species and sites and the proportion of vol-unteers, whereas starting year hardly contributed to theprincipal components in the other species groups. Forall species groups, number of sites was positively relatedto variables describing the work effort per scheme, withvarying degrees in the different species groups. Othervariables of sampling effort were related to work-effortvariables, especially to the proportion of volunteers (Fig.1). For monitoring of all species groups, except butter-flies, the proportion of volunteers was positively associ-ated with the number of sites and species. In butterflymonitoring, the proportion of volunteers was positivelyassociated with the number of sites and visits. The pro-portion of volunteers correlated well with the number ofsites in schemes monitoring herpetofauna (R48 = 0.39;p = 0.006), birds (R142 = 0.28; p < 0.001), butterflies(R36 = 0.38; p = 0.024), and mammals (R85 = 0.23; p =0.031).
The variable costs contributed strongly to the princi-pal components in all species groups, but related differ-ently to the other variables (Fig. 1). For birds, costs werenegatively associated with proportion of volunteers. Forherpetofauna, monitoring costs were positively associ-ated with number of species and the between-year fre-quency of sampling, and negatively related to the pro-portion of volunteers. For schemes monitoring mammalsand the group other insects, costs were positively relatedto number of sites and species. For butterflies the annualfrequency and number of species were positively associ-ated with the total costs. For plants costs were positivelyassociated with the per species variables, person-days andcosts per species.
The main differences in monitoring practices in thedifferent species groups resulted from differences in 3variables, the starting year of a scheme, the numberof sites monitored, and the proportion of volunteersper scheme (Fig. 2a). Across different species groups,the variables overlapped largely (Table 2). Nevertheless,costs by species were the highest for mammal, amphib-ian, and reptile species, whereas the overall costs of amonitoring scheme were highest for butterfly monitor-ing. Obviously, bird-monitoring schemes were among thelongest running schemes, but usually only 23 sites weremonitored, whereas most butterfly-monitoring schemessurveyed more than 50 sites (Table 2).
Monitoring in Different Countries
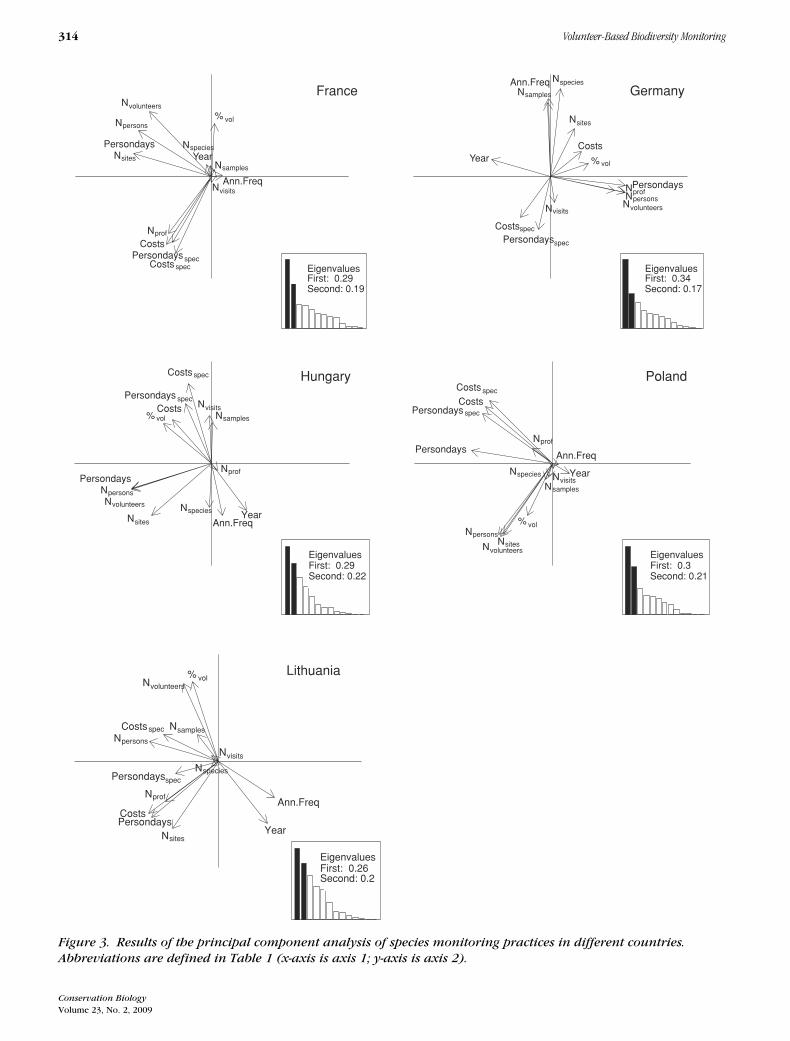
The principal component analysis revealed some differ-ences in monitoring practices in France, Germany, Hun-gary, Poland, and Lithuania (Fig. 3). In France variablesof the sampling effort, except of number of sites, con-tributed weakly to any principal component. In Germanmonitoring schemes, proportion of volunteers was posi-tively associated with several variables of sampling effort
Conservation Biology
Volume 23, No. 2, 2009
Schmeller et al. 311
Amphibians/Reptiles
Year
Nspecies
Nvolunteers
Nprof
Npersons
%vol
Nvisits
Ann.Freq
Nsites
NsamplesPersondays
Costs
Persondays spec
Costsspec
Eigenvalues First: 0.29
Second: 0.22
Birds
Year
Nspecies
Nvolunteers
Nprof
Npersons
% vol
Nvisits
Ann.FreqNsites
Nsamples
Persondays
Costs
Persondays spec
Costs spec
Eigenvalues First: 0.27
Second: 0.17
Other Insects
YearNspecies
Nvolunteers
Nprof
Npersons
%vol
Nvisits
Ann.Freq
Nsites
Nsamples
Persondays
Costs
Persondaysspec
Costsspec
Eigenvalues First: 0.32
Second: 0.18
Plants
YearNspecies
Nvolunteers
Nprof
Npersons
%volNvisits
Ann.Freq
Nsites
Nsamples
Persondays
CostsPersondays spec
Costs spec
Eigenvalues First: 0.27
Second: 0.19
Butterflies
Year
Nspecies
Nvolunteers
Nprof
Npersons
%volNvisits
Ann.Freq
Nsites
Nsamples
Persondays
Costs
Persondays specCosts spec
Eigenvalues First: 0.28
Second: 0.21
Mammals
YearNspecies
Nvolunteers
Nprof
Npersons% vol
Nvisits
Ann.Freq
Nsites
Nsamples
Persondays
Costs
Persondays specCosts spec
Eigenvalues First: 0.29
Second: 0.17
Figure 1. Results of the principal component analysis of monitoring practices in different species groups.
Abbreviations are defined in Table 1 (x-axis = axis 1; y-axis = axis 2).
Conservation Biology
Volume 23, No. 2, 2009
312 Volunteer-Based Biodiversity Monitoring
Countries
Year
N species
N volunteers
N profN persons
% vol
N visitsAnn.Freq
Nsites
Nsamples
Persondays
Costs
Persondaysspec
Costs spec
DE
FR
HU
LT PL
1.0
-1.0
0.5
0.0
-0.5
1.00.50.0-0.5-1.0
Species group
Year
Nspecies
NvolunteersNprof
Npersons
%vol
Nvisits
Ann.Freq
Nsites
Nsamples
Persondays
Costs
spec
Costsspec
Birds
Butterflies
Mammals
Other Insects
Plants
1.0
-1.0
0.5
0.0
-0.5
1.00.50.0-0.5-1.0
visits
spec
Birds
Butterflies
Mammals
Other Insects
Plants
-0.5
species
volunteers
profpersons
N visits NsamplesCosts
spec
DE
FR
HU
LT PL
visits
spec
Birds
Butterflies
Mammals
Other Insects
Plants
visits
Persondaysspec
Amphibians/Reptiles
Birds
Butterflies
Mammals
Other Insects
Plants
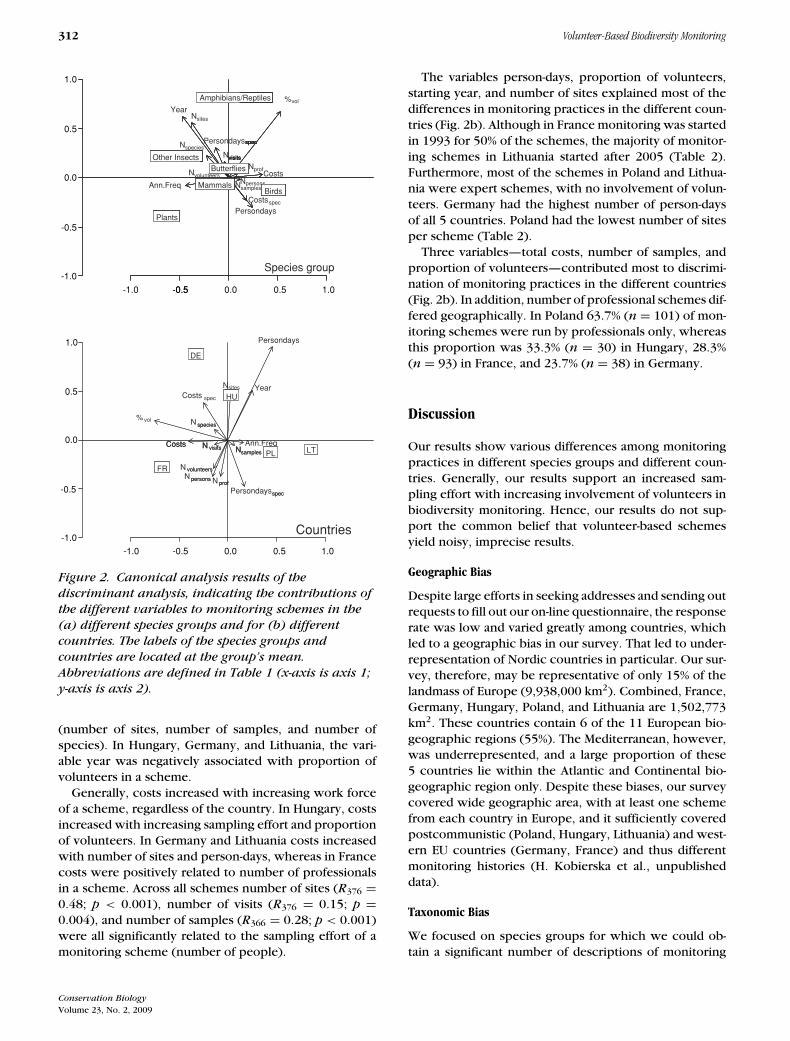
Figure 2. Canonical analysis results of the
discriminant analysis, indicating the contributions of
the different variables to monitoring schemes in the
(a) different species groups and for (b) different
countries. The labels of the species groups and
countries are located at the group’s mean.
Abbreviations are defined in Table 1 (x-axis is axis 1;
y-axis is axis 2).
(number of sites, number of samples, and number ofspecies). In Hungary, Germany, and Lithuania, the vari-able year was negatively associated with proportion ofvolunteers in a scheme.
Generally, costs increased with increasing work forceof a scheme, regardless of the country. In Hungary, costsincreased with increasing sampling effort and proportionof volunteers. In Germany and Lithuania costs increasedwith number of sites and person-days, whereas in Francecosts were positively related to number of professionalsin a scheme. Across all schemes number of sites (R376 =0.48; p < 0.001), number of visits (R376 = 0.15; p =0.004), and number of samples (R366 = 0.28; p < 0.001)were all significantly related to the sampling effort of amonitoring scheme (number of people).
The variables person-days, proportion of volunteers,starting year, and number of sites explained most of thedifferences in monitoring practices in the different coun-tries (Fig. 2b). Although in France monitoring was startedin 1993 for 50% of the schemes, the majority of monitor-ing schemes in Lithuania started after 2005 (Table 2).Furthermore, most of the schemes in Poland and Lithua-nia were expert schemes, with no involvement of volun-teers. Germany had the highest number of person-daysof all 5 countries. Poland had the lowest number of sitesper scheme (Table 2).
Three variables—total costs, number of samples, andproportion of volunteers—contributed most to discrimi-nation of monitoring practices in the different countries(Fig. 2b). In addition, number of professional schemes dif-fered geographically. In Poland 63.7% (n = 101) of mon-itoring schemes were run by professionals only, whereasthis proportion was 33.3% (n = 30) in Hungary, 28.3%(n = 93) in France, and 23.7% (n = 38) in Germany.
Discussion
Our results show various differences among monitoringpractices in different species groups and different coun-tries. Generally, our results support an increased sam-pling effort with increasing involvement of volunteers inbiodiversity monitoring. Hence, our results do not sup-port the common belief that volunteer-based schemesyield noisy, imprecise results.
Geographic Bias
Despite large efforts in seeking addresses and sending outrequests to fill out our on-line questionnaire, the responserate was low and varied greatly among countries, whichled to a geographic bias in our survey. That led to under-representation of Nordic countries in particular. Our sur-vey, therefore, may be representative of only 15% of thelandmass of Europe (9,938,000 km2). Combined, France,Germany, Hungary, Poland, and Lithuania are 1,502,773km2. These countries contain 6 of the 11 European bio-geographic regions (55%). The Mediterranean, however,was underrepresented, and a large proportion of these5 countries lie within the Atlantic and Continental bio-geographic region only. Despite these biases, our surveycovered wide geographic area, with at least one schemefrom each country in Europe, and it sufficiently coveredpostcommunistic (Poland, Hungary, Lithuania) and west-ern EU countries (Germany, France) and thus differentmonitoring histories (H. Kobierska et al., unpublisheddata).
Taxonomic Bias
We focused on species groups for which we could ob-tain a significant number of descriptions of monitoring
Conservation Biology
Volume 23, No. 2, 2009
Schmeller et al. 313
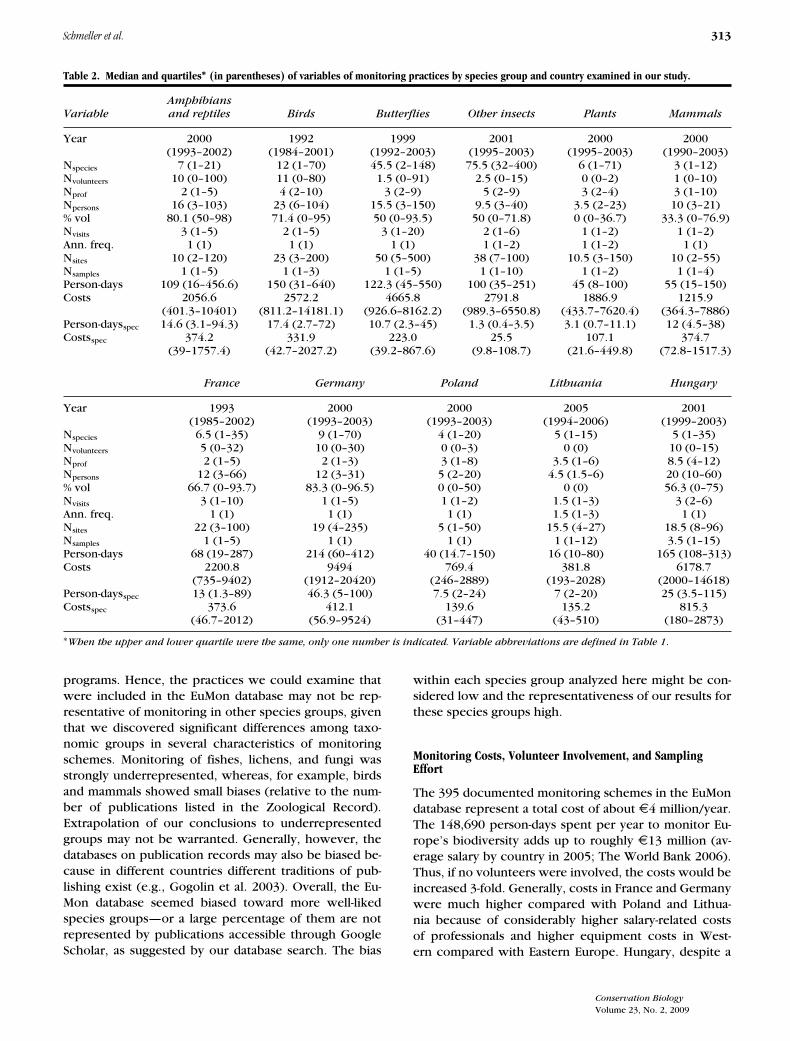
Table 2. Median and quartiles∗ (in parentheses) of variables of monitoring practices by species group and country examined in our study.
AmphibiansVariable and reptiles Birds Butterflies Other insects Plants Mammals
Year 2000 1992 1999 2001 2000 2000(1993–2002) (1984–2001) (1992–2003) (1995–2003) (1995–2003) (1990–2003)
Nspecies 7 (1–21) 12 (1–70) 45.5 (2–148) 75.5 (32–400) 6 (1–71) 3 (1–12)Nvolunteers 10 (0–100) 11 (0–80) 1.5 (0–91) 2.5 (0–15) 0 (0–2) 1 (0–10)Nprof 2 (1–5) 4 (2–10) 3 (2–9) 5 (2–9) 3 (2–4) 3 (1–10)Npersons 16 (3–103) 23 (6–104) 15.5 (3–150) 9.5 (3–40) 3.5 (2–23) 10 (3–21)% vol 80.1 (50–98) 71.4 (0–95) 50 (0–93.5) 50 (0–71.8) 0 (0–36.7) 33.3 (0–76.9)Nvisits 3 (1–5) 2 (1–5) 3 (1–20) 2 (1–6) 1 (1–2) 1 (1–2)Ann. freq. 1 (1) 1 (1) 1 (1) 1 (1–2) 1 (1–2) 1 (1)Nsites 10 (2–120) 23 (3–200) 50 (5–500) 38 (7–100) 10.5 (3–150) 10 (2–55)Nsamples 1 (1–5) 1 (1–3) 1 (1–5) 1 (1–10) 1 (1–2) 1 (1–4)Person-days 109 (16–456.6) 150 (31–640) 122.3 (45–550) 100 (35–251) 45 (8–100) 55 (15–150)Costs 2056.6 2572.2 4665.8 2791.8 1886.9 1215.9
(401.3–10401) (811.2–14181.1) (926.6–8162.2) (989.3–6550.8) (433.7–7620.4) (364.3–7886)Person-daysspec 14.6 (3.1–94.3) 17.4 (2.7–72) 10.7 (2.3–45) 1.3 (0.4–3.5) 3.1 (0.7–11.1) 12 (4.5–38)Costsspec 374.2 331.9 223.0 25.5 107.1 374.7
(39–1757.4) (42.7–2027.2) (39.2–867.6) (9.8–108.7) (21.6–449.8) (72.8–1517.3)
France Germany Poland Lithuania Hungary
Year 1993 2000 2000 2005 2001(1985–2002) (1993–2003) (1993–2003) (1994–2006) (1999–2003)
Nspecies 6.5 (1–35) 9 (1–70) 4 (1–20) 5 (1–15) 5 (1–35)Nvolunteers 5 (0–32) 10 (0–30) 0 (0–3) 0 (0) 10 (0–15)Nprof 2 (1–5) 2 (1–3) 3 (1–8) 3.5 (1–6) 8.5 (4–12)Npersons 12 (3–66) 12 (3–31) 5 (2–20) 4.5 (1.5–6) 20 (10–60)% vol 66.7 (0–93.7) 83.3 (0–96.5) 0 (0–50) 0 (0) 56.3 (0–75)Nvisits 3 (1–10) 1 (1–5) 1 (1–2) 1.5 (1–3) 3 (2–6)Ann. freq. 1 (1) 1 (1) 1 (1) 1.5 (1–3) 1 (1)Nsites 22 (3–100) 19 (4–235) 5 (1–50) 15.5 (4–27) 18.5 (8–96)Nsamples 1 (1–5) 1 (1) 1 (1) 1 (1–12) 3.5 (1–15)Person-days 68 (19–287) 214 (60–412) 40 (14.7–150) 16 (10–80) 165 (108–313)Costs 2200.8 9494 769.4 381.8 6178.7
(735–9402) (1912–20420) (246–2889) (193–2028) (2000–14618)Person-daysspec 13 (1.3–89) 46.3 (5–100) 7.5 (2–24) 7 (2–20) 25 (3.5–115)Costsspec 373.6 412.1 139.6 135.2 815.3
(46.7–2012) (56.9–9524) (31–447) (43–510) (180–2873)
∗When the upper and lower quartile were the same, only one number is indicated. Variable abbreviations are defined in Table 1.
programs. Hence, the practices we could examine thatwere included in the EuMon database may not be rep-resentative of monitoring in other species groups, giventhat we discovered significant differences among taxo-nomic groups in several characteristics of monitoringschemes. Monitoring of fishes, lichens, and fungi wasstrongly underrepresented, whereas, for example, birdsand mammals showed small biases (relative to the num-ber of publications listed in the Zoological Record).Extrapolation of our conclusions to underrepresentedgroups may not be warranted. Generally, however, thedatabases on publication records may also be biased be-cause in different countries different traditions of pub-lishing exist (e.g., Gogolin et al. 2003). Overall, the Eu-Mon database seemed biased toward more well-likedspecies groups—or a large percentage of them are notrepresented by publications accessible through GoogleScholar, as suggested by our database search. The bias
within each species group analyzed here might be con-sidered low and the representativeness of our results forthese species groups high.
Monitoring Costs, Volunteer Involvement, and SamplingEffort
The 395 documented monitoring schemes in the EuMondatabase represent a total cost of about €4 million/year.The 148,690 person-days spent per year to monitor Eu-rope’s biodiversity adds up to roughly €13 million (av-erage salary by country in 2005; The World Bank 2006).Thus, if no volunteers were involved, the costs would beincreased 3-fold. Generally, costs in France and Germanywere much higher compared with Poland and Lithua-nia because of considerably higher salary-related costsof professionals and higher equipment costs in West-ern compared with Eastern Europe. Hungary, despite a
Conservation Biology
Volume 23, No. 2, 2009
314 Volunteer-Based Biodiversity Monitoring
Lithuania
Year
Nspecies
Nvolunteers
Nprof
Npersons
% vol
Nvisits
Ann.Freq
Nsites
Nsamples
PersondaysCosts
Persondaysspec
Costsspec
Eigenvalues First: 0.26 Second: 0.2
Hungary
YearNspecies
Nvolunteers
Nprof
Npersons
% vol
Nvisits
Ann.FreqNsites
Nsamples
Persondays
CostsPersondays spec
Costs spec
Eigenvalues First: 0.29 Second: 0.22
Poland
YearNspecies
Nvolunteers
Nprof
Npersons
% vol
Nvisits
Ann.Freq
Nsites
Nsamples
Persondays
CostsPersondays spec
Costs spec
Eigenvalues First: 0.3 Second: 0.21
France
YearNspecies
Nvolunteers
Nprof
Npersons% vol
NvisitsAnn.Freq
NsitesNsamples
Persondays
CostsPersondays spec
Costs spec Eigenvalues First: 0.29 Second: 0.19
Germany
Year
Nspecies
Nvolunteers
NprofNpersons
% vol
Nvisits
Ann.Freq
Nsites
Nsamples
Persondays
Costs
Persondaysspec
Costsspec
Eigenvalues First: 0.34 Second: 0.17
Figure 3. Results of the principal component analysis of species monitoring practices in different countries.
Abbreviations are defined in Table 1 (x-axis is axis 1; y-axis is axis 2).
Conservation Biology
Volume 23, No. 2, 2009
Schmeller et al. 315
large proportion of volunteers, also had a large numberof professionals per scheme, which explains the consid-erably higher costs in comparison with the other easternEuropean countries Poland and Lithuania. One reasoncould be the high biodiversity in the Pannonian region,which would explain the large average number of speciesmonitored (the highest for the 5 countries assessed).Hence, sampling effort per monitoring scheme in Hun-gary seemed to be especially high, whereas the variableperson-days per species was comparable to France andGermany. The case of Hungary may also give a good indi-cation of costs and resource needs in other biodiversity-rich regions, such as the Mediterranean biogeographicregion, which is so far insufficiently covered in the Eu-Mon database.
Volunteer recruitment and the value of volunteers alsohad a geographic component. For example, in Lithua-nia and Poland, a majority of monitoring schemes wereprofessional, whereas this proportion was much smallerin Hungary, France, and Germany. Our findings suggestthat it may be more difficult to attract volunteers, thatvolunteers are not sought to participate in biodiversitymonitoring, or that the lack of volunteer participationmay be linked to unclear political and economic con-ditions in some countries (H. Kobierska et al., unpub-lished data). Furthermore, our findings may also suggestthat in countries with high salary costs (i.e., France andGermany in our survey) biodiversity-monitoring obliga-tions can only be implemented if volunteer involvementis maintained or increased for some taxonomic groupsthrough targeted recruitment campaigns or if funds areprovided for the coordination of volunteer-based mon-itoring programs. Nongovernmental organizations withsuccessful volunteer involvement could serve as partnersfor such campaigns. For EU countries, the higher costs ofbiodiversity monitoring are related to a high number ofendemic species, as indicated in our analysis for Hungary,and this should be accounted for in the development ofinstruments for fiscal transfers, as they exist, for example,in Brazil (Young 2005; Ring 2008).
Data Quality
By definition the standard error of a species’ status es-timate is negatively related to the total number of sam-pling units monitored per year (i.e., sites, species) andhence the overall sampling effort (e.g., Hochachka et al.2000). We found a strong positive relationship betweennumber of observers and number of sites monitored (anindex for the sampling effort), number of visits per site(an index for measurement precision), and number ofspecies monitored (a measure of the biological cover-age). Hence, number of people (to a large, but varyingdegree volunteers) involved in a monitoring scheme di-rectly affected sampling effort of a scheme. Large vol-unteer sampling efforts should counterbalance hypothe-
sized higher measurement errors in data collected by vol-unteers (Hochachka et al. 2000). Therefore, all else beingequal, a higher sampling effort should yield a more pre-cise estimate of a species’ status and improve the chancesof detecting a statistically verifiable status change (e.g.,a change in species abundance). Hence, we believe thatwith state-of-the-art survey designs or analysis methods,volunteer-based schemes can provide relatively reliabledata and thus yield unbiased results. Quality of volunteer-ing data is more likely determined by survey design, ana-lytical methodology, and communication skills within theschemes rather than by volunteer involvement per se.
Conclusion
Our results show that volunteer involvement is a goodtrade-off solution and extremely important and valuablefor biodiversity monitoring because data from participa-tory monitoring networks are not less informative, andmay be more informative, than those collected in pro-fessional schemes. For effective biodiversity monitoring,however, it is imperative to guarantee intra- as well asinter nation comparability, data coherence, and harmo-nization across large geographic regions, such as Europe(e.g., Henry et al. 2008; Lengyel et al. 2008). Hence, re-searchers should analyze the extent of inaccuracy of dataprovided by volunteers compared with professionals andshould develop methods and protocols that help detectand account for inaccuracies.
Acknowledgments
The EuMon project was funded within the 6th Frame-work of the European Commission. We thank K. Zaun-berger and G. Torta for their input from the political side,A. Schmidt and S. Rattei for their excellent financial ad-ministration, our colleagues for all the discussions, and B.Sinervo and A. Chaine for language revision. We thank allthe contributors to our survey who spent their precioustime answering our questions. The data set we used in thisstudy is still growing as we add new data to the on linedatabase from monitoring coordinators across Europe.Individuals, like you, may also add data. This databaseis publicly available at http://eumon.ckff.si/monitoring/search.php.
Supporting Information
The on line questionnaire of the EuMon survey of biodi-versity monitoring (Appendix S1), pairwise relationshipsbetween all variables describing monitoring practices(Appendix S2), and relative geographic and taxonomicbias of species monitoring schemes (Appendix S3) are
Conservation Biology
Volume 23, No. 2, 2009
316 Volunteer-Based Biodiversity Monitoring
available as part of the on line article. The author isresponsible for the content and functionality of thesematerials. Queries (other than absence of the material)should be directed to the corresponding author.
Literature Cited
Balmford, A., R. Green, and M. Jenkins. 2003. Measuring the changingstate of nature. Trends in Ecology & Evolution 18:326–330.
Balmford, A., P. Crane, A. Dobson, R. E. Green, and G. M. Mace. 2005.The 2010 challenge: data availability, information needs and ex-traterrestrial insights. Philosophical Transactions of the Royal Soci-ety of London Series B Biological Sciences 360:221–228.
Bell, S., M. Marzano, J. Cent, H. Kobierska, D. Podjed, D. Vandzinskaite,H. Reinert, A. Armaitiene, M. Grodzinska-Jurczak, and R. Mursic.2008. What counts? Volunteers and their organisations in the record-ing and monitoring of biodiversity. Biodiversity and Conservation13: in press.
Brashares, J. S., and M. K. Sam. 2005. How much is enough? Estimatingthe minimum sampling required for effective monitoring of Africanreserves. Biodiversity and Conservation 14:2709–2722.
Donald, P. F., F. J. Sanderson, I. J. Burfield, S. M. Bierman, R. D. Gregory,and Z. Waliczky. 2007. International conservation policy deliversbenefits for birds in Europe. Science 317:810.
Dray, S., and A. B. Dufour. 2007. The ADE4 package: implementingthe duality diagram for ecologists. Journal of Statistical Software22:1–20.
Engel, S. R., and J. R. Voshell Jr. 2002. Volunteer biological monitor-ing: can it accurately assess the ecological condition of streams?American Entomologist 48:164–177.
Evans, D. 2005. Natura. 2000 completing the EU’s network of sites toconserve flora and fauna. PlantTalk 39:22–27.
Genet, K. S., and L. G. Sargent. 2003. Evaluation of methods and dataquality from a volunteer-based amphibian call survey. Wildlife Soci-ety Bulletin 31:703–714.
Gogolin, I., P. Smeyers, Garcia Del Dujo, and D. Rusch-Feja. 2003. Eu-ropean Social Science Citation Index: a chance for promoting Euro-pean research? European Educational Research Journal 2:574–593.
Gregory, R. D., A. van Strien, P. Vorisek, A. W. G. Meyling, D. G. Noble,R. P. B. Foppen, and D. W. Gibbons. 2005. Developing indicators
for European birds. Philosophical Transactions of the Royal SocietyB—Biological Sciences 360:269–288.
Henry, P.-Y., S. Lengyel, P. Nowicki, R. Julliard, J. Clobert, T. Celik,B. Gruber, D. S. Schmeller, V. Babij & K. Henle. 2008. Integratingongoing biodiversity monitoring: potential benefits and methods.Biodiversity and Conservation 13: in press.
Hochachka, W. M., K. Martin, F. Doyle, and C. J. Krebs. 2000. Mon-itoring vertebrate populations using observational data. CanadianJournal of Zoology 78:521–529.
Lengyel, S., A. Kobler, L. Kutnar, E. Framstad, P.-Y. Henry, V. Babij, B.Gruber, D. S. Schmeller, and K. Henle. 2008. A review and a frame-work for the integration of biodiversity monitoring at the habitatlevel. Biodiversity and Conservation 13: in press.
Link, W. A., and J. R. Sauer. 1998. Estimating population change fromcount data: application to the North American breeding bird survey.Ecological Applications 8:258–268.
R Development Core Team. 2008. R: a language and environment for sta-tistical computing. R foundation for statistical computing. Vienna.Available from http://www.R-project.org (accessed June 2008).
Ring, I. 2008. Biodiversity governance: adjusting local costs and globalbenefits. Pages 107–126 in press in T. Sikor, editor. Public andprivate natural resource governance: a false dichotomy? Earthscan,London.
Schmeller, D. S., B. Gruber, B. Bauch, and K. Henle. 2006. EuMon–Arten- und Lebensraum-monitoring in Europa. Naturschutz undLandschaftsplanung 39:384–385.
Swaay, C. A. M. v., D. Maes, and D. Plate. 1997. Monitoring butterfliesin the Netherlands and Flanders: the first results. Journal of InsectConservation 1:81–87.
Thomas, J. A. 2005. Monitoring change in the abundance and distribu-tion of insects using butterflies and other indicator groups. Philo-sophical Transactions of the Royal Society of London Series B—Biological Sciences 360:339–357.
Vandenbosch, R. 2003. Fluctuations of Vanessa cardui butterfly abun-dance with El Nino and Pacific Decadal Oscillation climatic vari-ables. Global Change Biology 9:785–790.
World Bank. 2006. Key development data and statistics. Worlddevelopment indicators. World Bank, New York. Availablefrom http://go.worldbank.org/QKRICC4WI0 (accessed December2007).
Young, C. E. F. 2005. Financial mechanisms for conservation in Brazil.Conservation Biology 19:756–761.
Conservation Biology
Volume 23, No. 2, 2009
Copyright © 2022 FDOKUMEN