
Advancing the Agency of Adolescent Girls - Jessica Leight
90
Advancing the Agency of Adolescent Girls Eric Edmonds, Dartmouth College and NBER Ben Feigenberg, University of Illinois, Chicago Jessica Leight, IFPRI * August 5, 2021 Abstract More than 98 million adolescent girls are not in school. Can girls influence their school- ing without changes in their family’s economic environment? In Rajasthan, India, we examine the impact of a school-based life skills program that seeks to address low aspirations, narrow societal roles for girls and women, restricted networks of social support, and limited decision-making power. We find the intervention causes a 25 per- cent decline in school dropout that persists from seventh grade through the transition to high school. Improvements in socio-emotional support among girls exposed to the intervention seem especially important in their decision to stay in school. JEL: J24, I21, J16 * We thank the editor Rema Hanna and three anonymous referees. Funding is pro- vided by the United States Department of Labor under cooperative agreement number IL-26700-14-75-K-25 to Williams College / American University, and supplemental fund- ing was provided by the J-PAL Post-Primary Education Initiative. This study was reg- istered in the AEA RCT Registry ID AEARCTR-0001046. We are grateful to Mohar Dey, Rakesh Pandey, and Amanda Sload for their research assistance, and thank Lauren Damme, Kevin Hong, Stephanie Jones, Matthew Jukes, Ben Ost, Javaeria Qureshi, Eva Roca, Caroline Theoharides and conference participants at 2020 NEUDC, 2020 NBER SI Gender Meetings, 2021 ASSA, IFPRI, and USDOL for feedback. Appendices are available at: https://sites.dartmouth.edu/eedmonds/gep/
-
Upload
khangminh22 -
Category
Documents
-
view
1 -
download
0
Transcript of Advancing the Agency of Adolescent Girls - Jessica Leight

Advancing the Agency of Adolescent Girls
Eric Edmonds, Dartmouth College and NBER
Ben Feigenberg, University of Illinois, Chicago
Jessica Leight, IFPRI∗
August 5, 2021
Abstract
More than 98 million adolescent girls are not in school. Can girls influence their school-
ing without changes in their family’s economic environment? In Rajasthan, India, we
examine the impact of a school-based life skills program that seeks to address low
aspirations, narrow societal roles for girls and women, restricted networks of social
support, and limited decision-making power. We find the intervention causes a 25 per-
cent decline in school dropout that persists from seventh grade through the transition
to high school. Improvements in socio-emotional support among girls exposed to the
intervention seem especially important in their decision to stay in school. JEL: J24,
I21, J16
∗We thank the editor Rema Hanna and three anonymous referees. Funding is pro-
vided by the United States Department of Labor under cooperative agreement number
IL-26700-14-75-K-25 to Williams College / American University, and supplemental fund-
ing was provided by the J-PAL Post-Primary Education Initiative. This study was reg-
istered in the AEA RCT Registry ID AEARCTR-0001046. We are grateful to Mohar
Dey, Rakesh Pandey, and Amanda Sload for their research assistance, and thank Lauren
Damme, Kevin Hong, Stephanie Jones, Matthew Jukes, Ben Ost, Javaeria Qureshi, Eva
Roca, Caroline Theoharides and conference participants at 2020 NEUDC, 2020 NBER SI
Gender Meetings, 2021 ASSA, IFPRI, and USDOL for feedback. Appendices are available
at: https://sites.dartmouth.edu/eedmonds/gep/

1 Introduction
Barriers to gender equity have remained stubbornly persistent in many parts of the world.
This paper explores whether adolescent girls can influence decisions about their continued
school enrollment in a low-income environment with substantial gender disadvantage. In the
setting for this study in Rajasthan, India, over 90 percent of adult women in our respondents’
households state that a wife should always obey her husband, and, at an average age of eleven,
17 percent of our subjects are married. In this context of severe limitations on female agency,
it might be reasonable to hypothesize that there is very little potential for girls to participate
in decisions around their own schooling in early adolescence, and that only interventions that
provide material incentives — such as cash (Baird et al., 2013), bicycles (Muralidharan and
Prakash, 2017), or uniforms (Duflo et al., 2015)— would be effective in reducing dropout.
To test this hypothesis, this study attempts to experimentally influence girls’ motivation
for schooling and their ability to advocate for themselves by providing school based life
skills classes beginning in sixth grade. Building on two recent papers that have analyzed
interventions molding attitudes around gender in the classroom in India (Dhar et al., 2020)
and providing negotiating skills to girls in Zambia (Ashraf et al., 2020), we evaluate a broad
life skills curriculum designed to engage the wide range of gender-based inequities present
in our study context, one of the most gender disadvantaged contexts in India, and seek to
understand if this curriculum can reduce dropout among girls still early in their adolescence.1
For identification, we utilize a randomized controlled trial including 2,459 adolescent girls
1India exhibits substantively lower gender equity than Zambia in the World Economic
Forum Index (ranked 112 compared to 45, World Economic Forum, 2020), and our study
site of Rajasthan is among the most gender disadvantaged states in India, as measured by
the prevalence of crimes against women (Mukherjee et al., 2001) and the skewness of the
sex ratio (Oldenburg, 1992). Rajasthan also has the lowest literacy rate for women in the
country as of 2018 (National Statistical Office, 2020).
1

starting at age 11 in 119 schools in the Ajmer district of Rajasthan, India. The intervention of
interest is the Girls’ Education Program (GEP), a program encompassing twice-monthly life
skills classes conducted in school as well as group mentoring sessions for girls.2 The program
is delivered by social mobilizers, women from the area who have completed secondary school
and who are managed, trained and deployed by our partner non-governmental organization,
Room to Read (RtR). The intervention targets girls beginning in grade six, and was newly
rolled out to 60 randomly selected treatment schools in 2016.
The acute gender disadvantage in our study setting motivates the choice to evaluate a
multifaceted intervention targeting a range of competencies broadly identified in the litera-
ture as life skills or non-cognitive skills. Girls in rural India face a broad set of challenges
— low aspirations, narrow views of appropriate societal roles for girls and women, restricted
networks of social support, and limited decision-making power — that may be more effec-
tively addressed by a broader curriculum as opposed to a very targeted intervention that
may better serve girls in settings where gender disadvantages are more limited. We then
examine the impact of GEP using an intent-to-treat empirical strategy fully specified in a
pre-analysis plan (Edmonds et al., 2016). 96 percent of girls offered treatment attended at
least one life skills class, and 85 percent remained engaged through grade seven. The ma-
jority of our analysis is based on surveys conducted with girls and their household members
following grade seven, after two full years of program exposure; at that point, we have data
on 2,435 girls relative to the original sample of 2,459 randomized into treatment, an attrition
rate of less than one percent.
Our empirical analysis demonstrates that random assignment to GEP generates a sig-
nificant decline in dropout. In the endline survey conducted following seventh grade after
2The program’s definition of mentoring is not what we expect most readers to have in
mind. Mentoring sessions are small group discussions around topics covered in the life skills
classes, principally led by students.
2

two years of the program, we document a 30 percent reduction in dropout (equivalent to
a decline of four percentage points) and a parallel increase in grade progression. We also
utilize administrative records from schools that extend through the initiation of grade nine
and find that the reduction in school dropout continues through the progression into high
school, a frequent dropout point, and is consistently around 25 percent in magnitude.
In addition to a decline in dropout, assignment to the GEP treatment is associated with
an enhancement in girls’ reported life skills six months following their final class in seventh
grade.3 We document improvements in future planning, including reporting concrete goals
for the future and effectively articulating plans to achieve those goals. Girls also report
more empowerment and a broader sense of agency, with a greater ability to participate in
critical life decisions, and enhanced socioemotional support from peers and adults. These
experimental effects are corroborated by assessments by parents and enumerators, suggesting
that the shifts in life skills were observable to adults interacting with girls exposed to GEP.
Moreover, while it is possible that the observed shift in life skills responses could partially
reflect treated girls learning the socially desirable answers (social desirability bias), we do not
observe larger treatment effects on average in girls prone to give socially desirable answers.
There are, however, some areas in which the effects of the intervention seem minimal, and
we cannot reject the null of no effect on self-esteem, freedom of movement, perceived stress,
locus of control, or life satisfaction.
This finding of the feasibility of teaching some life skills in early adolescence in a setting
of gender disadvantage answers an important question raised by Cunha et al. (2006), who
note that IQ is largely stable by age 10 and ask whether the same is true of life skills. While
a large literature in psychology documents the feasibility of teaching a growth mindset about
3We elaborate further on the definition of life skills in Section 2.3; the set of skills we
examine is generally similar to competencies often described as non-cognitive skills in the
existing literature, though arguably somewhat broader.
3

learning (Sisk et al., 2018), our findings document a broader range of malleability. These
results complement the evidence from McKelway (2020), who provides empowerment training
to young, working age women in India and finds that they both learn and use newly taught
life skills. Moreover, the documented improvements in life skills are in areas that her subjects
are able to immediately put into use, a pattern similar to that reported in Adhvaryu et al.
(2018), who analyze a workplace-based non-cognitive skills training program; our clearest
treatment effects are also in areas that girls are able to immediately incorporate into their
lives. This observation is consistent with the evidence from social psychology experiments
in education that utilization is critical for skill take-up (Yeager and Walton, 2011).
In addition, our findings around the malleability of gender attitudes add to the evidence
from Dhar et al. (2020) that classroom discussions around gender can change default assump-
tions of gender roles. Surprisingly, treatment has a negative effect on expectations around
marriage. This contrasts with the impact of classes aimed at discouraging child marriage in
Bandiera et al. (2019), implemented in Sierra Leone. The difference here appears to be that
treatment led to an increase in awareness of the legal age of marriage at 18, effectively elim-
inating responses that marriage should take place below the legal age, as well as responses
of ages above the legal age.4
In contrast to these shifts in gender attitudes and marital expectations, we cannot reject
the null of no treatment effect on education or employment aspirations. The apparent
absence of change in work and schooling aspirations contrast with the evidence presented
in Acevedo et al. (2020), who find that life skills training, delivered in the context of a
job training program in the Dominican Republic, leads women to become more optimistic
4Our results around marriage are driven by attitudinal questions rather than sexual be-
havior in contrast to Bandiera et al. (2019) where reports of sexual activity before marriage
are more common in a significantly older population (their adolescent girls are 18 at baseline
compared to 11 here).
4

about their long-run employment prospects. Again, we hypothesize that context is especially
important here: women in the Dominican Republic could immediately exercise these skills
in the workplace, an opportunity that was largely absent for girls in this sample.
This study makes three important contributions to the literature on understanding girls’
educational decisions in poor countries, in addition to expanding the evidence around strate-
gies to shape education without fundamental shifts in the economic environment. First, it
highlights a role for school content in decisions about whether girls stay in school. Several
studies have attempted to increase school enrollment through improving how teachers teach
with generally little success (Kremer and Holla, 2009), although pedagogical interventions
often improve test scores (Evans and Popova, 2016). The objective of increasing enrollment
by shaping the in-school experience is also consistent with the increased emphasis on voca-
tional education. An advantage of utilizing life skills education to draw in or retain marginal
students at risk of dropout is that life skills are likely complementary inputs to general hu-
man capital accumulation, rather than substitutes as vocational training can be. The use
of school as a delivery mechanism is also consistent with the fact that the observed impact
on dropout is much larger than the impact observed for any of the out of school life skills
related interventions previously examined in the literature (Austrian et al., 2020; Bandiera
et al., 2020; Buchmann et al., 2017; Buehren et al., 2017a,b; Prakash et al., 2019). Even
compared to Ashraf et al. (2020), our treatment effects on dropout are three times greater
in magnitude (30 percent at end of seventh grade versus 8 percent at end of tenth), and
apparent at the time of treatment rather than two-plus years later.
Second, in examining potential channels for the observed decline in dropout, we find evi-
dence of a plausible causal mechanism working through enhanced social-emotional support,
generated by bonding in the life skills classes. This point was made salient in our qualitative
work, and we find statistical evidence consistent with this hypothesis: treatment girls have
more friends to rely on, identify more ways in which they rely on these friends, and spend
25 percent more time socializing. While several studies document peer effects increasing
5

schooling of the non-treated in conditional cash transfer evaluations (Bobonis and Finan,
2009; Lalive and Cattaneo, 2009), our mechanism appears to reflect in part treated girls
forming tighter groups, augmenting a normal part of adolescent development (Fehr et al.,
2013). This resulting desire to stay in school highlights an additional channel through which
peer effects may promote education (Sacerdote, 2011). Bandiera et al. (2020) identify an
analogous mechanism in their exploratory analysis around why their safe spaces interven-
tion prevented teen pregnancies: girls spend time in their safe space because they are closer
friends, and in our setting, accessing that analogous space requires continued enrollment in
school. In contrast, Ashraf et al. (2020) conclude that the channel of social engagement is
generally unimportant in reducing dropout among tenth grade girls in Zambia. It is impos-
sible to identify whether the difference in our findings on mechanisms reflects the relative
social isolation of our subjects absent treatment, our subjects’ younger ages, or differences
in the treatment as our life skills classes are interactive and engage on a broader set of
disadvantages.
Third, this paper contributes to the vast literature on intrahousehold decision-making in
education. While that literature primarily focuses on spousal conflict over investments in
education (Strauss and Thomas, 1995), increasing attention is being placed on the child’s
agency. For example, Berry (2015) highlights the challenge parents face in engaging children
seriously in academic testing, and Bursztyn and Coffman (2012) and Bursztyn et al. (2017)
document that parents in Brazil face challenges in monitoring and incentivizing school at-
tendance. The enrollment / dropout question is typically modeled as outside of the child’s
sphere of control, but our results highlight that girls can influence choices around school en-
rollment even in early adolescence. In addition, our finding of a reduction in dropout without
other measured changes in girls’ broader responsibilities in the household is consistent with
the hypothesis that there is scope for gains in schooling without needing to fundamentally
affect the economic organization of the household.
The paper proceeds as follows. Section 2 describes the setting and Section 3 describes the
6

evaluation design and empirical strategy. Section 4 presents the empirical findings. Section
5 analyzes evidence on causal pathways and Section 6 concludes.
2 Background
2.1 Setting
This evaluation was conducted in Ajmer, Rajasthan in northwest India, a setting charac-
terized by low levels of female educational attainment and very low levels of gender equity.
Data from the baseline survey (see Section 3.1) can be used to characterize the sample.5
Among the mothers of subjects, only 20% reported any post-primary education or engage-
ment in wage employment. A quarter of mothers concurred that boys were naturally better
at studying than girls, and 74% stated that dowry was necessary for daughters. While only
11% report that the ideal age for marriage for their daughters is younger than 18, only 7%
report an ideal age of marriage above 20, suggesting a strong preference for marriage imme-
diately at the legal age. More than 90% reported that their daughters were not allowed to
travel alone to locations other than school or a friend’s house.
Among girls in the study sample, 17% were already married when first surveyed, and
84% of girls reported working for pay at that time. More than 70% of girls answered that
dowry was always necessary for marriage, and 25% agreed that girls should not be sent for
higher education since they have to get married; that boys should be sent to school before
girls when money is scarce; and that boys are naturally better at studying than girls. Thus,
girls in this setting appear to face a number of obstacles to future educational enrollment
and academic achievement.6
5Table A1 in the Appendix compares sample households to the average household in
Rajasthan and India as a whole.
6Additional household and child characteristics, including patterns of income-generating
activities, are presented in Appendix Table A2 through A4. Appendix tables are available
on the project website: https://sites.dartmouth.edu/eedmonds/gep/.
7

2.2 Intervention
2.2.1 GEP during evaluation period
The Girls’ Education Program (GEP) delivered by Room to Read (RtR) is a seven year
program that begins in grade six and continues through secondary school. It has two primary
goals: encouraging girls to successfully complete secondary school and developing life skills.
Since 2007, more than 95,000 girls in nine countries have been enrolled in GEP.
GEP is delivered by social mobilizers (“SMs”), who provide life skills training and men-
toring. GEP life skills training is delivered in twice-a-month sessions conducted by SMs
during school hours, utilizing a curriculum developed by RtR. In each treatment school, 16
life skills classes were conducted in both grades six and seven. The curriculum is grade-based
and emphasizes ten life skills: self-confidence, expressing and managing emotions, empathy,
self-control, critical thinking, decision-making, perseverance, communication, relationship
building, and creative problem solving. The intervention also focuses on applying these
skills to simulations involving time management, education, physical protection and rights,
health, and community involvement. It evolves as girls age and regularly revisits topics,
adapting to stay age appropriate and relevant.
To provide an example of the structure of a typical session, the fifth life skills class in
grade six focuses on assertive communication. It begins with a review of concepts from the
previous life skills class (focused on listening), and continues with a story and an interactive
activity that asks participants to consider how they would respond to a potentially conflictual
interaction with peers. Girls learn about different communication styles, and then work in
small groups to practice assertive communication styles. The session concludes with a self-
reflection in which girls write in their journals. The mix of collective, small group and
individual activities is typical of the classes.
While attending life skills classes (each of which has duration of approximately an hour),
girls may miss some lessons in the primary classroom, though this varies by school. In
some schools, the boys had recess while the girls attended life skills classes; in some schools,
8
instruction continued. Any class time lost to life skills sessions would not be expected to
significantly impact academic performance given the limited number of annual GEP classes,
each of only an hour’s duration, and existing evidence on the low returns to instructional
time in Indian schools (see, for example, Banerjee et al., 2007).
In addition to life skills sessions, the intervention entails twice-a-month small group men-
toring sessions proctored by the SM. Mentoring sessions are student-led discussion sections
for the life skills lessons taught by the SM. SMs were trained for these mentoring sessions to
assist girls in identifying more personal difficulties in their lives related to the life skills lessons
and to help them to develop more personalized strategies to cope with these difficulties.7
40 SMs were employed full-time as a part of this intervention during the two-year evalua-
tion period, with a maximum of 33 employed at any one time.8 The typical SM is responsible
for two schools (mean of 1.95). GEP aims to have 50 girls per SM. All the SMs (33 years
old on average) had completed both secondary and post-secondary education, and all were
from Ajmer district; within the district, 58% were from urban areas. Prior to the launch of
the intervention, SMs received 14 days of training, and an additional eight days of training
are provided at the start of each subsequent school year. Every eight SMs are supervised
by a program assistant, and each SM was observed quarterly to assess the quality of her life
skills session and to provide her with support to improve session delivery.
In general, engagement of girls in GEP is high. Figures A2 and A3 contain histograms
7Earlier GEP descriptions presented these mentoring sessions differently. The description
here is updated based on the authors’ experiences from talking with students and SMs in
Ajmer about their actual experiences in the mentoring sessions. Also note that SMs were
referred to as “female role models” in previous project documents.
8Of the 40 SMs involved in this evaluation, seven left at some point over the two years
and were replaced within three months. One was released for poor performance, and others
left for personal reasons such as marriage or migration.
9

of the number of life skills classes attended by subjects in grade six and seven, respectively.
While there was a growth in children who attended no classes between sixth and seventh
grade, overall attendance patterns are similar across both grades with complete attendance
the mode in both years.
There are two differences between the intervention as analyzed in this evaluation and
GEP as delivered in other contexts. First, the primary data collection for this evaluation
was conducted following only two years of program implementation, when the target sampled
girls had completed grade seven rather than grade twelve. We refer to 2016–2018 as the
evaluation period. Second, the evaluation focuses on a reduced intervention design including
only deployment of social mobilizers who deliver life skills classes and mentoring. The full
program additionally includes material support and parent and community engagement, but
these components were not implemented in Ajmer during the evaluation period.
2.2.2 GEP post-evaluation period
In the original design, our partner only had funding through grade seven, and thus the
endline survey would correspond to the conclusion of the program. However, GEP has
always been designed as a project continuing from sixth to twelfth grade, and our partner
was successful in attaining programmatic funding to continue the GEP in treated schools
beyond the period of study. They did not begin treating the control schools and did not
extend the program to other, non-study cohorts within treated schools.
However, in 2019 after the evaluation period, RtR added financial support to the GEP
in Ajmer. A needs assessment was conducted in fall 2018, and 268 girls began receiving
material support in 2019. Material support consisted of in-kind transfers of school supplies,
valued at an estimated 500 rupees or approximately $7. The addition of material support is
not relevant for our primary outcome measures collected in the endline survey, as the survey
was conducted prior to the rollout of the material support and the delivery of any associated
information (students did not anticipate this future source of material support). However,
this change is relevant for supplementary analysis conducted using administrative data, as
10

we also analyze data available post-endline, for eighth and ninth grade.
2.3 Hypotheses
As previously noted, our primary objective is to analyze the effectiveness of a non-material
intervention — life skills training — in reducing dropout in a setting of acute gender disad-
vantage. The hypotheses of interest were pre-specified in an analysis plan that also included
detailed variable definitions; our two primary hypotheses focus on the treatment’s impact
on dropout and life skills (Edmonds et al., 2019).
Our first hypothesis is that GEP has no effect on school dropout. We consider the
dropout decision to be the result of a negotiation between parent and child where each
individual’s value function depends on their perceived value of continued school attendance
vis-a-vis the opportunity cost of time spent in school. The outcome of the negotiation also
reflects the relative weight on the child’s and parents’ preferences.9 There are a number of
channels through which the life skills treatment could affect dropout: the treatment may
affect the weight on girls’ preferences relative to parents; may shape girls’ or parents’ views
of the long-term returns to schooling; or may change their perceptions of the value of time
in school and the opportunity costs of that time.
More specifically, life skills classes develop girls’ skills in advocating for themselves, and
thus an effect on dropout could be explained by an increased weight being assigned in the
household’s problem to the girl’s preferences. In addition, perceived returns to education
could change through direct messaging provided around future possibilities for the student or
by encouraging her engagement with peers and school. The skills developed in class around
time management and planning could similarly increase perceived returns to schooling by
helping girls to establish and more efficiently achieve educational goals or by reducing the
9In our setting, the modal household reports paying no school fees. Hence, direct costs are
less likely to merit separate consideration, and of course the impact of treatment observed
here might differ from what would be observed in a setting with large direct costs of schooling.
11

opportunity costs of time in school. (The intervention also emphasizes the legal age of mar-
riage, possibly reinforcing the importance of schooling while reducing the perceived return
to an early marriage.) As a third possible channel, additional social support built by the
program could directly increase the value of time in school as school provides an opportunity
for socializing, or indirectly increase its value by allowing girls to more effectively exercise
newly developed skills.
Our second hypothesis is that GEP has no impact on life skills. Yeager and Walton
(2011) survey the largely U.S. based literature showing that psychological interventions can
improve school performance and emphasize that successful interventions involve the type of
active participation and application that GEP provides in the classroom. The intervention
explicitly targets future planning, gender norms, aspirations, empowerment / agency, self-
esteem, freedom of movement, and socio-emotional support as life skills related outcomes,
and we construct normalized indices for these domains.
In conceptualizing life skills, our definition is guided by the usage of the implementing
partner Room to Read. Life skills are closely related to non-cognitive skills as studied in
the educational and labor literatures, and some authors have used these terms (as well as
other terms such as soft skills and socio-emotional skills) interchangeably, e.g. Kautz et
al. (2014). In addition, a number of the specific skills or constructs we measure have been
described and analyzed as non-cognitive skills in other papers.10 Depending on a reader’s
background in this literature, our definition of life skills may feel broad, including constructs
10For example, Macours and Laajaj (2019) analyze locus of control, self-esteem and time
preference as non-cognitive skills in Kenya. Adhvaryu et al. (2018) analyze locus of control,
self-esteem, time preference and mental health in India, as well as measures around extraver-
sion that are related to socio-emotional support. Ashraf et al. (2020) analyze a particular
non-cognitive skill, negotiating skills, that is closely related to our measure of empowerment
and agency. A large literature spearheaded by Heckman and coauthors uses measures of self-
esteem and locus of control as proxies for non-cognitive skills, as in for example Heckman
12

such as gender norms, freedom of movement, and socio-emotional support that are not
universally characterized as non-cognitive skills; alternatively, it may feel narrow, excluding
characteristics such as health knowledge or behavior and financial literacy that are included
in some definitions of life skills. Regardless, our life skills related outcomes were pre-specified
in our analysis plan based on Room to Read’s long history of engagement in this policy space.
3 Empirical Strategy
3.1 Evaluation Design
This evaluation is a clustered randomized trial with a targeted allocation rate of 1:1,
conducted in 119 schools in Ajmer district in Rajasthan between 2015 and 2019. Given that
GEP is delivered at the school level to all girls enrolled in the grades of interest, a cluster
randomization is appropriate. The selection of schools eligible for inclusion in this evaluation
was undertaken between August and November 2015. Randomization was conducted in Stata
by the research team, stratifying schools with respect to school quality.11 In order to identify
the target sample of girls, a team of enumerators visited each school between December 2015
and January 2016 to obtain a roster of all girls enrolled in grade five. All female students
who were currently enrolled in grade five in these schools as of January 2016 (2,543 female
students in total) were eligible for inclusion in the evaluation.
Implementation of GEP was initiated in July 2016 at the beginning of the school year.
At the time of design, RtR committed to running GEP in treated schools through the school
year ending in the spring of 2018, with the goal of continuing GEP in these schools past that
date if possible. Again, for the purposes of this analysis, we define the evaluation period
as 2016 to 2018, corresponding to grades six and seven. Both baseline and endline surveys
involved a household survey administered to the child’s caregiver and a direct interview of
and Mosso (2014).
11Details on stratification are provided in Section A.1 in the Appendix.
13

the girl. Figure A1 in the Appendix summarizes the evaluation timeline.12
As noted above, GEP did continue post-2018, and we also report additional results
with administrative data from schools, including enrollment and reported grades, collected
throughout the evaluation period and post-endline through July 2019. Two points should be
noted about the administrative data collection. First, its availability was not foreseen and
its analysis was not pre-specified. Second, given the post-endline data collection, adminis-
trative data is available beyond the core evaluation period: grades are available through the
conclusion of grade eight, and dropout information is available through early in grade nine.13
3.1.1 Evaluation Sample
At baseline, the survey team visited every one of the 2,543 girls on the enrollment lists
provided by sampled schools; the survey was conducted before students or their families were
informed about the life skills education program. Ultimately, any girl on the enrollment lists
with either a completed household or child survey is considered to be enrolled into the
evaluation. (In some cases, there are multiple sample girls in the same household.) Out of
the 2,543 female students on the grade five enrollment lists, a total of 2,459 girls from 2,382
households were enrolled into the evaluation sample, while 84 were excluded due to failure
12This evaluation draws on a pre-analysis plan registered prior to the baseline survey
(Edmonds et al., 2016). A detailed final evaluation report (Edmonds et al., 2019) fully
populated the pre-analysis plan without deviations, and is publicly available on-line.The
report can be found at https://sites.dartmouth.edu/eedmonds/gep/.Details regarding data
collection and consent processes are provided in Section A.1 in the Appendix.
13In addition, administrative data from RtR report girls’ participation in the intervention,
including life skills sessions and mentoring. The research team also oversaw qualitative data
collection at each phase of the evaluation, including in-depth interviews with girls in a subset
of treatment schools as well as their caregivers.
14

to complete any component of the baseline survey.14
However, not every girl who was part of the evaluation sample was interviewed at baseline;
there were cases in which only the household survey was completed, as well as a smaller
number of cases in which only the girl survey was conducted.15 There were 2,353 household
surveys conducted at baseline, which provide parent-reported data for 2,427 girls, and 2,399
individual girl surveys conducted at baseline. A flow chart summarizing the sample of girls
surveyed can be found in Figure A4.
Summary statistics for the child outcomes mapped out in the evaluation design plan are
provided in Appendix Tables A3 and A4. 3% of the sampled children had already dropped
out of school at baseline. However, conditional on enrollment, 89% attended school in the
past week. While the modal girl in our study is at an appropriate age for grade 5 (age 10-11),
14Of these 84 cases, 34 were from households that had permanently migrated prior to the
date on which the survey team visited the community — a fact reported by neighbors or
other community informants — or simply could not be located. 33 were excluded because
they did not provide consent. The reasons for non-inclusion for the remaining girls varied
but included illness or death of the child (4); parents who were uniformly unavailable during
survey hours and thus could not be surveyed or provide consent for the child to be surveyed
(3); and cases in which the child was away from home and parents declined to participate in
her absence (10).
15In addition, 16 girls living in 14 separate households from one primary school were omit-
ted from the baseline in error. A different set of students enrolled in an alternative, adjacent
primary school that is outside the evaluation sample were surveyed in their place. Given
that these girls were not intended for inclusion in the sample, their data was subsequently
dropped, and the correct set of girls were surveyed from the first tracking survey forward.
These girls are considered to be enrolled in the evaluation, though they were not surveyed
at baseline.
15

approximately a third of the sampled girls were older.
3.1.2 Attrition
The analysis sample includes all sampled girls represented in the endline survey, con-
ducted between July 2018 and December 2018. At endline, 2,387 child surveys and 2,358
household surveys were conducted. There were 48 girls (in 47 households) for whom a house-
hold survey was conducted without a child survey.16 There was also one girl surveyed whose
household did not complete an endline survey. In addition, 24 girls in 23 different house-
holds attrited fully at endline with no data collection completed.17 Attrition patterns are
summarized graphically in Figure A5. Within the sample of 2,459 girls randomized, we have
some endline information for 2,435 girls, generating an attrition rate below 1 percent.
Attrition does not appear to be a source of bias in our intent to treat analysis. Among
the 24 girls who fully attrited, 15 are from the control arm and 9 are from the treatment
arm, corresponding to attrition rates of 0.7% and 1.2% in the treatment and control groups,
respectively; the probability of full attrition is not significantly correlated with treatment,
conditional on strata fixed effects (β=-.004, p=.362). The girls’ survey is used in many of
the life skills indexes, and 72 girls did not complete it. 45 are from the control arm and 27
16In 14 cases, consent was declined for the girl survey. 19 girls had migrated away from
their households permanently; two had migrated temporarily and had not returned by the
point at which the survey concluded. Four child surveys were not completed due to the
death of the child, and nine child surveys were not completed due to child disability. In
these nine cases, the child was similarly not surveyed at baseline, but a household survey
was completed at both baseline and endline.
17In 10 cases, the household had migrated and could not be reached for follow-up. Consent
was declined in 12 cases. In one case, a partial survey was completed but the household
declined to continue due to limited time, and in one case, no information was available
about the household’s whereabouts.
16

are from the treatment arm, corresponding to attrition rates of 3.6% and 2.2%, respectively;
this difference in attrition on the girls’ survey is significant at the 10 percent level (β=-
.014, p=.087). In the Appendix, we conduct a series of bounding exercises to evaluate the
sensitivity of our findings to attrition. Attrition does not substantively affect the empirical
results under reasonable assumptions regarding the distribution of missing values.
3.2 Statistical Model
To identify the impacts of assignment to treatment, we estimate the following pre-
specified regression. Each outcome Yist for child i in school s measured at time t is regressed
on a dummy for treatment assignment Ts and randomization strata fixed effects µs. The
specification also includes a vector of age dummies γi , a vector of dummies λi capturing
the most important type of employment in the household at baseline, the lagged (baseline)
value of the relevant outcome Yis,t−1, and additional controls for baseline variables where
imbalance was detected between the treatment and control households, reported in Tables
A2 through A4 and discussed in more detail below. These baseline variables are denoted
ξis,t−1.18
18For the family of outcomes corresponding to school dropout and other academic out-
comes, age at enrollment and maternal education are additionally included as control vari-
ables in equation (1); this methodology was pre-specified in the analysis plan. If the baseline
control variable is missing because either the household or child survey was not conducted for
a particular girl at baseline, the missing value is coded as zero. Additional dummy variables
equal to one for observations with missing values are included for each baseline covariate.
For life skills measures added at endline (the Rotter locus of control, the perceived stress
index, the Rosenberg self-esteem index), we control for lagged values of overall life skills
indices. For the ASER test scores added at endline, we control for baseline school dropout
status, attendance, grade progression, time spent studying, hours spent on school and grades
in grade five as reported in administrative data. These methodologies for addressing missing
17

Yist = β1Ts + β2Yis,t−1 + β3ξis,t−1 + µs + γi + λi + εist (1)
We also estimate two simpler specifications, similarly pre-specified, to evaluate the ro-
bustness of these results: one specification including only the treatment dummy and strata
fixed effects, and one specification including only the additional control variables γi, λi, and
Yis,t−1. These additional results are reported in the Appendix, but we focus on results from
equation (1) in order to maximize precision (we never reject the null hypothesis of no change
in treatment effects associated with the added controls).
In all specifications, standard errors are clustered at the school level, yielding 119 clusters.
Given that there are a large volume of hypotheses tested regarding life skills, false discoveries
(type 1 errors) are probable; accordingly, we present false discovery rate corrected q-values,
computed across all life skill outcomes using the same specification (Benjamini and Hochberg,
1995). For completeness, we also present false discovery rate corrected q-values computed
separately for dropout and other academic outcomes as well as for ancillary outcomes.
We also evaluate balance with respect to a number of baseline characteristics. These
results are reported in Tables A2 through A4 and discussed in Section A.2 in the Appendix.
4 Findings
4.1 Education
4.1.1 Dropout
The primary purpose of the program evaluated is to advance the education of girls, and
following two years of treatment, the endline survey conducted at the end of seventh grade
documents that GEP is effectively generating a decline in dropout and an increase in grade
progression. This result is captured graphically in Figure 1a, based on estimating equation
baseline values were all pre-specified in the evaluation design plan addendum.
18

(1), and the corresponding regression results are provided in Table 1.19 Treatment girls
are four percentage points less likely to have dropped out at endline (after seventh grade),
corresponding to a 31 percent reduction relative to the control group dropout rate of 13.2
percent. We similarly observe a four percentage point increase in progression to grade seven,
suggesting that treatment girls remain with their same cohort as they progress through
school (Columns (1) and (2) of Table 1).
The impact of treatment on dropout seems persistent. A year after endline, we compiled
school administrative records on dropout and test scores as of the start of grade nine; this
analysis was not pre-specified, as we did not anticipate access to this data, but it allows
us to identify the effect of the treatment on dropout in grades six through eight and at
the transition into high school in grade nine, a frequent point of dropout for girls. The
results suggest that the treatment effect on dropout increases from endline through grade
eight and grade nine, and remains statistically significant (Columns (3) through (6), Table
1).20 Because the grade nine records were collected at the start of the school year in late
July 2019, they differ from other records based on attendance throughout the school year;
data is available only about how many days the child attended school in the last seven days,
and how many days the school was open in that period. Hence, defining dropout based
on this measure will have measurement error given that there is irregularity in attendance.
Accordingly, the findings for grade nine are estimated using a modification of equation (1)
19Additional specifications are reported in Appendix Tables A5 through A6 in the Ap-
pendix.
20In the administrative records, we observe a slightly smaller impact of treatment on
dropout in grade seven compared to the household survey. This discrepancy might reflect
that a girl is in the administrative records for grade seven if she attended school at all during
the grade seven school year, while the endline survey response reflects whether she views
herself as a dropout after the conclusion of grade seven.
19

that also controls directly for the number of days the school was reported open. Without
controlling for this form of measurement error from days open, we find a noisy zero effect of
treatment on dropout in grade nine (not presented).
In addition, we pool the dropout measures into an index in order to address multiple
hypothesis testing concerns; including grade six where there is no treatment effect, we observe
a statistically significant decline in dropout overall in the administrative records (t-statistic
of 2.6, Column (7) of Table 1). While in percentage terms, the largest effect is observed
at the end of grade seven in the endline survey, the magnitude of the treatment effects is
consistent across years (around 25 percent). In interpreting these results, it is important to
note that grades eight and nine correspond to the post-evaluation period during which some
limited material support was rolled out. The data are consistent with our hypothesis that
this program change did not meaningfully change the treatment; less than 20% of treatment
girls receive any in-kind support, and the average such transfer was valued at $7.
Taken together, these findings provide cause for optimism and suggest that a broad life
skills intervention can shift girls’ enrollment in a setting characterized by intense gender
disadvantage. As such, our findings complement those presented in Ashraf et al. (2020)
by indicating that alternative (and more common) life skill curricula that are delivered
in school may prove impactful. That these effects are identified even where stark gender
disadvantages may limit the weight placed on girls’ preferences in household decision-making
further highlight the importance of considering the agency that children have in making
educational enrollment decisions.
4.1.2 Other Academic Outcomes
In our post-endline qualitative work, one head teacher previewed our results by remarking
that the treatment was effective in maintaining girls’ enrollment without improving their
academic performance. That is exactly what we find: there are no apparent increases in
attendance conditional on enrollment, and no positive shifts in test scores or grades. Columns
(1) and (2) in Panel A of Table 2 report the treatment’s impact on attendance conditional
20

on enrollment, coding attendance as missing for girls who are not enrolled. We cannot
reject the null of no effect on the intensive margin of attendance. If we recode attendance
as zero for girls who are not enrolled, the extensive margin dominates and we observe a
negative and significant coefficient that parallels the observed effect on enrollment. Intensive
margin attendance has a mean reported past-week attendance rate for control girls of 92%;
accordingly, there is a limited margin for treatment to improve attendance conditional on
enrollment. To address potential error in self-reported attendance, we also examine effects
on attendance using administrative data reported by the schools, and similarly fail to reject a
null effect. We also do not observe any significant shift in girls’ reported time spent studying,
reported in Columns (3) and (4) in Panel A of Table 2.
In addition, we fail to reject the null of no effect of treatment on test scores. We ad-
ministered ASER tests in the endline survey (at the conclusion of grade seven) and report
estimated treatment effects in Columns (1) through (3), Panel B of Table 2.21 We simi-
larly observe no positive effect on administratively reported test scores in grades six, seven
or eight for enrolled girls, based on records compiled from evaluation schools (Columns (4)
through (6) of the same panel).22 Further exploration of the effects on school test scores,
21In Table 2, controls for baseline outcome values cannot be included for cognitive test
measures since cognitive tests were not conducted at baseline; specification (1) instead in-
cludes controls for baseline school dropout status, attendance, grade progression, time spent
studying, hours spent on school, and grades as reported in grade five.
22Analysis of school administrative records was not pre-specified, but we follow the same
analytical strategy as in the pre-specified analysis. There is heterogeneity within schools
across years and across schools in how year-end exams are scored, and thus for comparability
purposes, we have computed an average GPA across the three tests based on the letter grades
associated with the numerical test scores. One obvious concern might be that negative
selection in students who do not drop out is masking the gain in test scores for higher-
21

including analysis of any potential bias induced by selection into test attendance, is reported
in Appendix Tables A18 and A19.23 While it is certainly possible that the ASER test is an
imperfect instrument to measure learning gains for this population, the consistency of the
null effects observed across multiple measures of test scores suggest that it is plausible to
conclude that there was no effect of the intervention on learning.
These findings are consistent with the hypothesis that treatment is not particularly effec-
tive in dimensions such as academic performance where the perceived returns to associated
improvements may be realized only in the medium and long run (by expanding future edu-
cational opportunities) rather than the short run. In contrast, as we show below and discuss
in more detail in Section 5, treatment appears to increase the immediate perceived value of
remaining in school for girls by promoting social engagement. This strengthening of social
ties likely plays an important role in explaining estimated impacts on dropout, but may also
serve as a distraction from academic work and so limit any further academic gains.
4.2 Life Skills
The GEP program aims to promote the agency of girls by teaching them life skills, and
even in our setting characterized by extreme gender disadvantage, we document substan-
tial and statistically significant enhancements in life skills for girls assigned to treatment,
although not in every measured domain. These findings further indicate that life skills in-
terventions need not be narrowly tailored to be effective; rather, we find that a broad life
achieving students. While dropouts are indeed negatively selected, we similarly do not see
positive effects on test scores among students who were higher-achieving at baseline.
23A negative and significant effect of treatment on grade six grades is in fact observed
in Column (4), Panel B in Table 2. This effect is unlikely to reflect differential selection
in school continuity as treatment is only associated with an eight tenths of one percent
reduction in dropout in this grade; alternatively, this may be an artifact of the volume of
hypothesis tests. The false discovery rate associated with this test is 36 percent.
22

skills intervention simultaneously shifts girls’ life skills across a number of domains.
4.2.1 Direct Responses
At endline, we fielded 259 individual questions related to life skills — many of these
corresponding to constructs also labeled non-cognitive skills in the literature — in addition
to four demonstration tasks. In our analysis plan, we pre-specified how these questions would
be combined into indices of life skills corresponding to our partner’s conceptualization. Figure
1b is based on estimating equation (1), and the corresponding regression results are provided
in Tables 3 and 5.24 We also present some illustrative regression results for individual sub-
component questions of indices when useful, and these results are reported in Tables A13
through A15 in the Appendix.
Girls assigned to treatment show improvements in future planning, as evident in Column
(1) of Panel A in Table 3.25 The future planning index is constructed around a series
of questions that ask girls about concrete goals they have for the future as well as their
motivation for thinking about these goals and developing a plan to achieve them; treatment
leads girls to express these goals and the steps to achieving them more completely. This
finding of the feasibility of teaching planning skills in early adolescents in also documented
in classrooms in Turkey by Alan and Ertac (2018).
We also observe that treatment girls express more positive gender norms (Column (2))
supporting the finding in Dhar et al. (2020) that gender norms can be influenced in the
24Figure 1b presents primarily results from Table 3, in addition to three selected variables
from Tables 4 and 5. Additional specifications are presented for robustness in Tables A9
through A12 in the Appendix.
25For all life skills indices included in the analysis, we normalize each variable based on
the mean and standard deviation observed in the control arm, and then average across
measures, ensuring that the interpretation is consistent (i.e. higher values of future planning
index components all correspond to higher levels of future planning).
23

classroom. This index consists of a series of opinions offered on statements that reflect
differential treatment of boys and girls. Relative to girls in the control group, treatment
girls feel that boys and girls should be treated more similarly. Interestingly, while girls show
improvements in future planning and articulated gender norms, they do not express greater
aspirations about what type of life or career they will have in the future relative to the
control sample (Column (3)). This finding is also similar to Dhar et al. (2020) who do not
observe an impact of their intervention on the aspirations of treatment girls.
More novel here is that treatment has a negative effect on marriage expectations (Column
(4), Panel A of Table 3). The shift in the marital expectations index is driven primarily by
a shift downward in the top of the distribution of desired and expected marriage ages.
The GEP curriculum strongly emphasizes 18 as the appropriate and legal minimum age of
marriage, and treatment girls are then more likely to report 18 as the desired age of marriage
relative to both younger and older desired ages. This finding differs from Bandiera et al.
(2020), although their marriage related measures focus more on sexual behaviors rather than
awareness of marriage laws, an outcome that is more relevant for their 18 year old population
than our 11 to 13 year old population.
Girls assigned to treatment articulate a stronger sense of empowerment / agency (Column
(5), Panel A of Table 3). The empowerment index consists of questions about who makes
decisions in the girl’s life over a variety of different domains, and girls assigned to treatment
feel that they have more say in what happens in their lives. For example, girls exposed to
treatment report a 17 percent increase in the probability they feel they are the sole decision-
maker about whether to attend school, a 29 percent increase in the probability they feel they
are the sole decision-maker about the type of work they will do, and a 32 percent increase
in the probability they feel that they can talk to their parents about marriage.26 These
26These results are reported in Appendix Table A13; the questions are all subcomponents
of the empowerment / agency index.
24

empowerment findings are analogous to Buchmann et al. (2017) who provide empowerment
training to 15 year old girls in Bangladesh around avoiding marriage. However, in our case,
despite this increase in empowerment, treatment girls do not express more self-esteem or
report greater freedom of movement (Column (6), Panel A, and Column (1), Panel B of
Table 3).
Treatment also increases girls’ sense of socio-emotional support (Column (2), Panel B of
Table 3). This index is composed of questions about friends and the support they offer, and
we observe improvements in all the index components. Preferring to be alone (as reported
by parents) declines by 14 percent, meeting friends outside of school increases by 7 percent,
reporting a place to meet friends increases by 13 percent, and reporting a place to stay
if needed increases by 4 percent.27 In addition, the amount of time reported devoted to
socialization (in minutes) increases by 25 percent, reports of phone use double, and total
time on the phone increases by more than 400 percent (for phone use, the mean is near zero
in the control arm). Even our school travel time measures are consistent with increases in
social engagement: conditional on attending school, treatment girls are not more likely to
change schools or report a shift in their physical distance from school. However, it seems to
take them 24 percent more time to travel to school post treatment.28
We measure life satisfaction with Cantril’s ladder and common measures of locus of
control, perceived stress, and self-esteem. Here, we cannot reject the null of no change in
these measures of life satisfaction (Columns (3) through (6), Panel B, Table 3). Confidence
27These results are reported in Columns (1) through (4) of Appendix Table A14. The
parental-reported variable around the preference to be alone is not part of the socio-emotional
support index.
28Results for time use are also reported in Appendix Table A14. The analysis of time
allocated to socialization was not pre-specified, and is not part of the socio-emotional support
index.
25

intervals are large relative to coefficients on all of these measures, and it is not obvious that
a life skills intervention that builds awareness of challenges in adolescent life should improve
life satisfaction.
In sum, we find that treatment leads to significant enhancements in a subset of measured
life skills, while changes on other domains are statistically insignificant and small in magni-
tude. All of the life skills we analyzed were selected in order to match those skills that Room
to Read seeks to develop in their program. In Section 5, we exploit the pattern of findings
described here to narrow down the set of plausible causal pathways that may explain the
dropout effects that we measure.
4.2.2 Third Party Observation
We supplement the self-reported responses around life skills with several additional
sources of data. We ask parents to assess the life skills of their daughters, and cannot
reject the null hypothesis of no treatment effect for parental perceptions of girls’ self-efficacy
and freedom of movement, as well as parental attitudes around gender norms, schooling and
marriage (Columns (2) through (7), Table 4). We observe a decline in parents’ assessment
of girls’ strengths, as reported in Column (1) of the same table; this primarily reflects a
perception by parents that girls are less considerate and less willing to help.29 This finding
is similar to that reported by Ashraf et al. (2020), who document that mothers view their
daughters more negatively following their engagement in a negotiating skills intervention.
We also attempted to assess life skills via four demonstration tasks that we developed, in-
cluding a scavenger hunt that was designed to demonstrate life skills by having girls negotiate
challenges in finding common items. We find no effects of treatment on any of the demon-
stration tasks (Columns (1) through (4), Table 5). Though these demonstration tasks did
well in pre-testing, in fielding substantial implementation challenges arose that complicate
29These results are reported in Columns (1) and (2) of Appendix Table A15.
26

the interpretation of these failures to reject.30 Enhancements in life skills were also appar-
ent to enumerators who are blind to the child’s treatment status. We asked enumerators
to directly assess girls based on their focus in the interview, attentiveness, responsiveness,
and articulateness. Here, we find a statistically significant improvement in enumerator as-
sessment of the girl’s demonstration of these life skills, equal to approximately 0.1 standard
deviation (Column (5), Table 5).
4.2.3 Parroting and Social-Desirability Bias
Dhar et al. (2020) highlights that measures of life skills are vulnerable to parroting back
the lessons taught in life skills classes as well as social desirability bias if the intervention
builds awareness in subjects about the “right” answers. For example, future planning ac-
tivities are a part of the GEP curriculum, and thus we cannot differentiate whether the
enhanced future planning expression comes from in-program activities or broader impacts
on how girls think about their futures. Similarly, questions about equitable gender norms
are closely related to the content of many GEP classes, and thus these responses could reflect
a parroting of class lessons (although these surveys are conducted in private at home, where
if anything social pressure might run against an expression of the more progressive values
implied by class content).
On this parroting concern, our findings that parents and enumerators both report changes
in treatment children are relevant. Also, it is important to bear in mind that the timing of
30Specifically, we observed that girls’ efforts on the mirror drawing task (where they were
asked to use a mirror to draw copies of increasingly complex shapes) varied based on the
particular environment in which they were surveyed. The within-girl correlation between
baseline and endline measures is only 0.06. For the scavenger hunt, variation in the time
between the two required surveyor visits (one to introduce the scavenger hunt and one to
assess scavenger hunt success), in addition to overall delays in the timing of surveyor re-visits,
seems to have limited the signal value of the associated measures.
27

our survey is such that most subjects are interviewed at endline approximately six months
following the final life skills class.31 In our view, the parroting that we might be capturing
after six months reflects a degree of internalization of information that is a goal of the
intervention, and is very different than asking girls questions shortly after a class ends. That
said, we evaluate parroting / social desirability bias using two robustness checks.32
First, to assess parroting, we classify 90 individual life skills questions posed in the
endline survey based on whether they are explicitly addressed in the grade six or grade
seven curriculum or addressed only indirectly. This distinction is based on whether we could
identify an exact curricular match to the question; all of the life skills that we classify as
not explicitly addressed may be indirectly addressed in the program. We then construct
separate indices characterizing responses to explicitly versus indirectly addressed questions,
and estimate the treatment effects for these indices. We find a treatment effect of 0.056
SD for the explicitly addressed questions index (standard error of 0.018) and an effect of
0.016 SD for the indirectly addressed questions index (standard error of 0.019). However, we
know that the marital expectations questions show an effect in the opposite direction of that
hypothesized, and many marital expectations questions are in the indirect questions index.
If we exclude the five questions related to marriage age that are included in the marital
expectations index, the treatment effect for the indirectly addressed questions index rises to
0.040 SD (standard error of 0.020), and we cannot reject the hypothesis that the treatment
effects for indirect and direct questions are equal in magnitude.33
31Our surveys are largely collected in July and August; classes ended in February before
seventh grade exams and eighth grade life skills classes did not resume until October.
32This analysis was not pre-specified.
33Complete regression results for every life skills question posed in the survey, cat-
egorized as directly or indirectly addressed, are available in Table 13 of the fi-
nal evaluation report (Edmonds et al., 2019). The report can be found on-line at
28

Second, to assess social desirability bias, we use the baseline data to gauge the extent
to which a child is inclined to provide socially desirable answers. Specifically, in Appendix
Tables A23 and A24, we employ a social desirability index that is constructed based on three
component responses from the baseline child survey: (1) an indicator for whether the girl
reports that she wants to become a “Teacher/School head/Educator” when she grows up,
(2) an indicator for whether she reports that she is currently living “the best possible life,”
and (3) an indicator for whether the surveyor recorded that the girl paid close attention
“the whole time” when receiving instructions during the survey. We view these three survey
measures as the baseline questions that best capture girls’ proclivity to offer responses or
to engage in behaviors that would be perceived as socially desirable (and most analogous to
how Dhar et al. (2020) execute a similar test). We analyze heterogeneous treatment effects
based on whether a child is above the median value of this social desirability index. Above-
median index values are highly predictive of more positive expression of life skills in both
control and treatment groups. We do not reject the null that treatment effects are the same
regardless of whether the child is above or below the median social desirability index.
In sum, six months after the conclusion of the second year of life skills classes, we see
enhancements in future planning, attitudes towards gender norms, empowerment / agency,
and socio-emotional support. Enumerators similarly document these improvements in girls,
and parents, whose attitudes do not seem to change measurably with daughter’s engagement
in treatment, report treatment girls acting more in their own self interest. We do not see
evidence consistent with these findings being driven by parroting or an attempt by treated
girls to give more socially desirable answers. In addition, in Appendices A.3 and A.4, we
further explore the robustness of the primary results for both educational and life skills
outcomes to alternative assumptions about attrition, and find that the primary effects remain
consistent in magnitude and significance.
https://sites.dartmouth.edu/eedmonds/gep/.
29

5 Discussion
Our principal experimental findings are that school-based life skills classes administered
in Rajasthan reduce dropout and promote the expression of some life skills in adolescent
girls after two years of programming. As noted above in our hypotheses, the treatment is
designed to potentially have effects via multiple channels that could reduce girls’ dropout.
The first hypothesized channel was an increase in girls’ agency; between our partner’s
focus on GEP as an empowerment intervention and the existing emphasis in the academic
literature on intrahousehold conflict over education, it is logical to hypothesize that im-
provements in sense of empowerment and agency in life decisions documented in the pre-
vious section drive the reduction in dropout. However, the data are not consistent with
serious parent-child differences in preferences over education. In the control sample at end-
line, two-thirds of parents report that they expect their daughters will complete at least
senior secondary school, and 71 percent expect their daughters will complete at least five
more years of schooling (beyond grade seven). Moreover, 54 percent of parents think that
being well-educated is an important characteristic for a potential daughter-in-law, and 74
percent believe that girls need to pursue higher education. As such, parents do not seem
less enthusiastic about their daughters’ schooling than the girls themselves; while girls do
seem to be more empowered, and this may be an important broader channel for intervention
effects, they may not be required to deploy this sense of empowerment vis-a-vis their parents
in order to remain in school.34
The second hypothesized channel was shifts in the perceived returns to education. Here,
we cannot reject the null that these perceived returns are unchanged by treatment: we have
already documented above that we did not observe a meaningful change in parental attitudes
34These patterns are also consistent with Bursztyn and Coffman (2012), who find that
parents value their children’s attendance at school, and accordingly value conditionality in
cash transfers as a strategy to manipulate child school attendance.
30

toward girls’ education, and for girls themselves, we do not see any evidence of greater
aspirations, including a shift in the desire to work for wages, a desire to work in an occupation
that requires secondary schooling, or how much education girls hope to complete (as reported
in Columns (3) through (5), Table A15). For this last outcome, 93 percent of girls in the
control arm already report wanting to complete secondary schooling, and the confidence
interval on the treatment effect ranges between -2.5 and 2.6 percentage points. Further, if
we hypothesized that treatment effects on dropout reflected shifts in the return to education,
we might expect to see increases in attendance conditional on enrollment or improvements
in academic outcomes; neither are evident in the data. Similarly, the improvements in future
planning that we document might be expected to influence the perceived returns to schooling
by helping girls to establish and more efficiently achieve educational goals, but we do not
observe changes in child time allocation or academic performance that would be consistent
with this hypothesis.
The third hypothesized channel was a reduction in the opportunity cost of school. Here,
the growth in social-emotional support and social engagement that reduces the cost of school
to girls stands out as the most plausible explanation for the reduction in dropout. As
discussed in the previous section, treatment enhances social engagement. Girls spend more
time socializing and want to be around friends more. Conceptually, we view these shifts as
enhancing the value of time in school to the child as they can socialize with these friends,
including in the life skills classes which require school enrollment to access. There may also be
skills that can be exercised because of these expanded social supports. For example, teasing
is a significant issue in our setting and may contribute to dropout. While girls learn in one
life skills class to ignore teasing, a collective response to teasing may be more effective than
an individual response, and thus strengthened friendship networks can amplify the direct
effects of treatment in addition to influencing dropout propensity directly. In this sense, our
findings correspond almost inversely to the finding in Ashraf et al. (2020) that a negotiating
treatment meaningfully affected girls’ ability to exercise agency vis-a-vis their parents, while
31

the social aspect of the treatment was relatively unimportant; we find evidence of the opposite
pattern in our context where girls are younger and more isolated absent treatment.
To the extent that enhanced social support plays a key role in reducing dropout, it may
also help to explain the null in attendance and academic outcomes. An increase in social
support may make it easier to miss school, as friends can assist to make up any missed
material, offsetting any increased desire to attend. Similarly, for academic performance,
additional social engagement may undo whatever gains might otherwise result from growth
in motivation.
Despite the apparent importance of this channel in explaining dropout effects, the en-
hancements in life skills that we observe are not limited to girls vulnerable to dropping out of
school. In Appendix A.5, we examine heterogeneity in treatment effects by dropout propen-
sity (computed based on the correlation between dropout by seventh grade in the control
sample and baseline characteristics).35 The impact of treatment on dropout is concentrated
among girls with a high probability of dropping out (Table A25); however, the life skills
results described in the previous section do not appear to consistently vary with dropout
propensity (Tables A28 through A30). Hence, in an accounting sense, the improvements in
life skills cannot explain the reduction in dropout. We interpret this pattern as suggestive
evidence that life skills improvements are consistent across girls of varying characteristics
at baseline, but that only a subsample of girls are in fact vulnerable to dropout, and the
positive effects of treatment on dropout are then evident only for this subsample.
The fact that enhanced agency does not appear to be the primary channel for the increase
in dropout in this context, and in fact is associated with increased parental disapproval of
35We also examined heterogeneous effects with respect to six pre-specified covariates
(school quality, baseline child age, maternal education, and exposure of the household to
recent economic shocks, crime shocks, and death/illness shocks), and found no evidence of
meaningful heterogeneity; for concision these results are not reported.
32

girls’ behavior, is also relevant for questions of external validity. For the sample households,
the direct cost of girls’ schooling is zero, and the opportunity cost may also be relatively
moderate. In other contexts where the costs of schooling are high and parents exert more
control over the required inputs, intrahousehold negotiations around schooling decisions may
be more important, and both enhanced girls’ agency and the potential parental backlash to
this agency may have different implications.
6 Conclusion
In this paper, we analyze evidence around an intervention aimed at improving the life
skills of adolescent girls in government schools in Ajmer, Rajasthan, India. Room to Read’s
Girls’ Education Program provided twice-monthly life skills classes during sixth and seventh
grade, taught in school by trained social mobilizers, and the modal treatment girl attended
all the life skill classes offered. This treatment is associated with both improvements in life
skills and a reduction in dropout of around 25 percent that persists through grade nine.
However, while random assignment to life skills classes led to a reduction in dropout
and improved expressions in life skills, there are a host of adolescent life outcomes that
do not seem to have been impacted by treatment: test scores, child labor, and marriage
being among the most important. The finding of a lack of improvement in test scores
is consistent with many other studies in the life skills space (e.g. Holmlund and Silva,
2014). In our context of reduced dropout, this naturally raises the question of whether
continued school enrollment is valuable in itself. It is possible to have financial returns to
education that are not proxied by test scores. Moreover, even if school performance does not
change differentially with treatment, an improvement in school progression will itself build
human capital as girls continue to advance through school. Continued enrollment may also
facilitate delayed fertility, and this may be especially relevant in our setting with pervasive
child marriage. The literature on returns to female education further highlights the value
of remaining in school for the life skills, experiences, and social relationships that education
can help foster. Given that we observe a direct treatment effect on socio-emotional support,
33

treatment can be valuable even it does not promote test-measured learning.
Room to Read’s Girls Education Program usually includes outreach and financial sup-
port that was not delivered in the study area. While we are able to evaluate the impact
of the life skills component of the program in isolation, our study is nonetheless related to
recent research evaluating multifaceted interventions that combine life skills training with
other social services such as Save the Children’s Safe Spaces (Buchmann et al., 2017) and
BRAC’s Empowerment and Livelihood for Adolescents (ELA) program (Bandiera et al.,
2019, 2020). While both Safe Spaces and ELA target older girls than our study, they both
document improvements in schooling. Our finding that life skills training (separate from the
other components of ELA or Safe Spaces) increases education while building social relation-
ships highlights the potential importance of that specific component of these multifaceted
programs. Relatedly, our finding that life skills alone is not sufficient to influence some of the
important life decisions that ELA impacts also highlights the additional value of other com-
ponents of the multifaceted approach, despite the non-experimental evidence in Bandiera et
al. (2020) that emphasizes the contribution of life skills training in particular.
Our study delivery method also highlights the tradeoffs inherent in targeting decisions
related to life skills programs. Both ELA and Safe Spaces use time and space outside of
schools. This allows them to reach more marginalized girls not associated with a school
absent the program. However, they face much lower take-up than our school based inter-
vention. While 85 percent of our subjects are still engaged after two years, Safe Spaces
only induced 56 percent of girls to attend one class, and ELA take-up in Uganda was below
25 percent. In our context, not only is it easy to reach girls within school, but the girls
already have within-school social relationships that can be leveraged. To the extent that
the reinforcement and deepening of those social relationships are important in our dropout
results, such dynamics might not be present in an intervention targeting out of school girls.
Better understanding how social relationships can be leveraged to improve schooling seems
a promising area for future research.
34

7 References
Acevedo, Paloma, Guillermo Cruces, Paul Gertler, and Sebastian Martinez, “How
vocational education made women better off but left men behind,” Labour Economics,
2020, 65, 101824.
Adhvaryu, Achyuta, Namrata Kala, and Anant Nyshadham, “The skills to pay
the bills: Returns to on-the-job soft skills training,” 2018. National Bureau of Economic
Research Working Paper 24313.
Alan, Sule and Seda Ertac, “Fostering patience in the classroom: Results from random-
ized educational intervention,” Journal of Political Economy, 2018, 126 (5), 1865–1911.
Ashraf, Nava, Natalie Bau, Corinne Low, and Kathleen McGinn, “Negotiating
a better future: How interpersonal skills facilitate inter-generational investment,” The
Quarterly Journal of Economics, 2020, 135, 1095–1151.
Austrian, Karen, Erica Soler-Hampejsek, Jere R Behrman, Jean Digitale, Na-
talie Jackson Hachonda, Maximillian Bweupe, and Paul C Hewett, “The impact
of the Adolescent Girls Empowerment Program (AGEP) on short and long term social,
economic, education and fertility outcomes: a cluster randomized controlled trial in Zam-
bia,” BMC Public Health, 2020, 20 (1), 1–15.
Baird, Sarah J, Ephraim Chirwa, Jacobus De Hoop, and Berk Ozler, “Girl power:
cash transfers and adolescent welfare. Evidence from a cluster-randomized experiment in
Malawi,” 2013.
Bandiera, Oriana, Niklas Buehren, Markus P Goldstein, Imran Rasul, and An-
drea Smurra, The Economic Lives of Young Women in the Time of Ebola: Lessons from
an Empowerment Program, The World Bank, 2019.
35
, , Robin Burgess, Markus Goldstein, Selim Gulesci, Imran Rasul, and Mun-
shi Sulaiman, “Women’s empowerment in action: evidence from a randomized control
trial in Africa,” American Economic Journal: Applied Economics, 2020, 12 (1), 210–259.
Banerjee, Abhijit, Shawn Cole, Esther Duflo, and Leigh Linden, “Remedying Ed-
ucation: Evidence from Two Randomized Experiments in India,” Quarterly Journal of
Economics, 2007, 122 (7), 1235–1264.
Benjamini, Yoav and Yosef Hochberg, “Controlling the false discovery rate: A practical
and powerful approach to multiple testing,” Journal of Human Capital, 1995, 57, 289–300.
Berry, James, “Child Control in Education Decisions An Evaluation of Targeted Incentives
to Learn in India,” Journal of Human Resources, 2015, 50 (4), 1051–1080.
Bobonis, Gustavo J and Frederico Finan, “Neighborhood peer effects in secondary
school enrollment decisions,” The Review of Economics and Statistics, 2009, 91 (4), 695–
716.
Buchmann, Nina, Erica Field, Rachel Glennerster, Shahana Nazneen, Svetlana
Pimkina, and Iman Sen, “Power vs money: Alternative approaches to reducing child
marriage in Bangladesh, a randomized control trial,” Unpublished Manuscript, 2017.
Buehren, Niklas, Markus Goldstein, Selim Gulesci, Munshi Sulaiman, and Venus
Yam, Evaluation of an adolescent development program for girls in Tanzania, The World
Bank, 2017.
, Shubha Chakravarty, Markus Goldstein, Vanya Slavchevska, and Munshi
Sulaiman, “Adolescent Girls’ Empowerment in Conflict-Affected Settings: Experimental
Evidence from South Sudan,” 2017.
36

Bursztyn, Leonardo and Lucas C Coffman, “The schooling decision: Family prefer-
ences, intergenerational conflict, and moral hazard in the Brazilian favelas,” Journal of
Political Economy, 2012, 120 (3), 359–397.
, Georgy Egorov, and Robert Jensen, “Cool to be smart or smart to be cool? Un-
derstanding peer pressure in education,” 2017.
Cunha, Flavio, James J Heckman, Lance Lochner, and Dimitriy V Masterov,
“Interpreting the evidence on life cycle skill formation,” Handbook of the Economics of
Education, 2006, 1, 697–812.
Dhar, Diva, Tarun Jain, and Seema Jayachandran, “Reshaping Adolescents’ Gender
Attitudes: Evidence from a School-Based Experiment in India,” July 2020.
Duflo, Esther, Pascaline Dupas, and Michael Kremer, “Education, HIV, and early
fertility: Experimental evidence from Kenya,” American Economic Review, 2015, 105 (9),
2757–97.
Edmonds, Eric, Benjamin Feigenberg, and Jessica Leight, “The impact of mentoring
and life skills on secondary school progression and child labor among girls: A randomized
controlled trial in Rajasthan, India,” AEA RCT Registry. February 2016.
, , and , “The impact of mentoring and life skills training on secondary school
progression and child labor among girls: A randomized controlled trial in Rajasthan,”
2019. Final evaluation report.
Evans, David K and Anna Popova, “What really works to improve learning in developing
countries? An analysis of divergent findings in systematic reviews,” The World Bank
Research Observer, 2016, 31 (2), 242–270.
37

Fehr, Ernst, Daniela Glatzle-Rutzler, and Matthias Sutter, “The development of
egalitarianism, altruism, spite and parochialism in childhood and adolescence,” European
Economic Review, 2013, 64, 369–383.
Heckman, James J and Stefano Mosso, “The economics of human development and
social mobility,” Annu. Rev. Econ., 2014, 6 (1), 689–733.
Holmlund, Helena and Olmo Silva, “Targeting noncognitive skills to improve cognitive
outcomes: evidence from a remedial education intervention,” Journal of Human Capital,
2014, 8 (2), 126–160.
Kautz, Tim, James J. Heckman, Ron Diris, Bas ter Weel, and Lex Borghans,
“Fostering and Measuring Skills: Improving Cognitive and Non-Cognitive Skills to Pro-
mote Lifetime Success,” 2014. NBER Working Paper 20749.
Kremer, Michael and Alaka Holla, “Improving education in the developing world: what
have we learned from randomized evaluations?,” Annu. Rev. Econ., 2009, 1 (1), 513–542.
Lalive, Rafael and M Alejandra Cattaneo, “Social interactions and schooling deci-
sions,” The Review of Economics and Statistics, 2009, 91 (3), 457–477.
Lee, David S., “Training, wages, and sample selection: Estimating sharp bounds on treat-
ment effects,” The Review of Economic Studies, 2009, 76, 1071–1102.
Macours, Karen and Rachid Laajaj, “Measuring skills in developing countries,” 2019.
Forthcoming, Journal of Human Resources.
McKelway, Madeline, “Women’s Agency and Women’s Employment: How Women’s Sense
of Agency Affects Their Labor Supply,” 2020. Unpublished Manuscript.
Mukherjee, Chandan, Preet Rustagi, and N Krishnaji, “Crimes against women in
India: Analysis of official statistics,” Economic and Political Weekly, 2001, pp. 4070–4080.
38

Muralidharan, Karthik and Nishith Prakash, “Cycling to school: Increasing secondary
school enrollment for girls in India,” American Economic Journal: Applied Economics,
2017, 9 (3), 321–350.
National Statistical Office, “Household Social Consumption on Education in India,”
Technical Report 2020. NSS 75th Round, NSS Report No. 585.
Oldenburg, Philip, “Sex ratio, son preference and violence in India: A research note,”
Economic and Political Weekly, 1992, pp. 2657–2662.
Prakash, Ravi, Tara S Beattie, Prakash Javalkar, Parinita Bhattacharjee, Satya-
narayana Ramanaik, Raghavendra Thalinja, Srikanta Murthy, Calum Davey,
Mitzy Gafos, James Blanchard et al., “The Samata intervention to increase sec-
ondary school completion and reduce child marriage among adolescent girls: results from
a cluster-randomised control trial in India,” Journal of Global Health, 2019, 9 (1).
Sacerdote, Bruce, “Peer effects in education: How might they work, how big are they and
how much do we know thus far?,” in “Handbook of the Economics of Education,” Vol. 3,
Elsevier, 2011, pp. 249–277.
Sisk, Victoria F, Alexander P Burgoyne, Jingze Sun, Jennifer L Butler, and
Brooke N Macnamara, “To what extent and under which circumstances are growth
mind-sets important to academic achievement? Two meta-analyses,” Psychological Sci-
ence, 2018, 29 (4), 549–571.
Strauss, John and Duncan Thomas, “Human resources: Empirical modeling of house-
hold and family decisions,” Handbook of Development Economics, 1995, 3, 1883–2023.
World Economic Forum, “The Global Gender Gap Report,” 2020.
Yeager, David S and Gregory M Walton, “Social-psychological interventions in educa-
tion: They’re not magic,” Review of Educational Research, 2011, 81 (2), 267–301.
39

(a)
Tre
atm
ent
Eff
ects
onD
rop
out
by
Gra
de
(b)
Tre
atm
ent
Eff
ects
onL
ife
Skills
Fig
ure
1:P
rim
ary
outc
omes
Not
es:
This
figu
rere
por
tsth
ees
tim
ated
trea
tmen
teff
ects
ondro
pou
t(a
nd
pro
gres
sion
togr
ade
7),
contr
olling
for
stra
tum
,bas
elin
eva
lue,
age
effec
ts,
typ
eof
emplo
ym
ent
inth
ehou
sehol
d,
and
imbal
ance
dva
riab
les.
Bas
elin
ean
den
dline
dat
aar
efr
omth
ere
spec
tive
surv
eys.
The
top
2ro
ws
are
from
the
endline
surv
eyan
dw
ere
pre
-sp
ecifi
ed.
All
other
spec
ifica
tion
sar
ees
tim
ated
usi
ng
school
adm
inis
trat
ive
reco
rds.
Gra
de
nin
edat
aw
asco
llec
ted
atth
est
art
ofth
esc
hool
year
and
ison
lybas
edon
whet
her
the
child
atte
nded
school
inth
ese
ven
day
sb
efor
esu
rvey
ing;
thus
all
grad
enin
ere
sult
sal
soin
clude
contr
ols
for
the
num
ber
ofday
sth
esc
hool
was
open
inth
ese
ven
day
spri
orto
surv
ey.
Dro
pou
tin
dex
isco
nst
ruct
edby
com
bin
ing
all
other
dro
pou
tva
riab
les.
This
figu
rere
por
tsth
ees
tim
ated
trea
tmen
teff
ects
onin
dex
esfo
rlife
skills
,co
ntr
olling
for
stra
tum
,bas
elin
eva
lue,
age
effec
ts,
typ
eof
emplo
ym
ent
inth
ehou
sehol
d,
and
imbal
ance
dva
riab
les.
Bas
elin
ean
den
dline
dat
aar
efr
omth
ere
spec
tive
surv
eys.
95p
erce
nt
confiden
cein
terv
als
are
pic
ture
d.
Sta
ndar
der
rors
are
clust
ered
by
school
.
40

Tab
le1:
Sch
ool
Dro
pou
t
(1)
(2)
(3)
(4)
(5)
(6)
(7)
Surv
eydat
aA
dm
inis
trat
ive
dat
a
Whet
her
child
has
Whet
her
child
pro
gres
sed
Dro
pou
tD
rop
out
Dro
pou
tD
rop
out
Dro
pou
tdro
pp
edou
tto
7th
grad
eG
rade
6G
rade
7G
rade
8G
rade
9In
dex
Tre
atm
ent
-.04
1∗∗
.042
∗∗-.
008
-.03
0-.
051∗
∗∗-.
056∗
∗-.
042∗
∗∗
(.018)
(.019)
(.016)
(.019)
(.020)
(.024)
(.016)
Obs.
2433
2387
2374
2319
2455
2228
2458
Q-s
tati
stic
0.04
10.
041
0.60
00.
138
0.04
10.
041
Con
trol
Mea
n0.
132
0.86
50.
075
0.14
20.
192
0.29
00.
169
Not
es:
Tab
leco
nta
ins
resu
lts
from
regr
essi
ng
the
outc
ome
vari
able
onan
indic
ator
for
trea
tmen
t,st
rata
fixed
effec
ts,
age
fixed
effec
ts,
bas
elin
eou
tcom
eva
lue,
ave
ctor
ofdum
mie
sfo
rth
em
ost
imp
orta
nt
typ
eof
emplo
ym
ent
inth
ehou
sehol
dat
bas
elin
e,
and
contr
ols
for
imbal
ance
dbas
elin
eva
riab
les.
Col
um
n(1
)use
sch
ild
and
hou
sehol
den
dline
surv
eydat
a.C
olum
n(2
)use
s
child
endline
surv
eyon
ly.
Col
um
ns
(3)
thro
ugh
(6)
rely
onad
min
istr
ativ
edat
a.In
Col
um
ns
(3)
thro
ugh
(5),
dro
pou
tis
mea
sure
dbas
edon
whet
her
ach
ild
atte
nded
school
atth
eco
ncl
usi
onof
the
refe
rence
dsc
hool
year
.In
Col
um
n(6
),dro
pou
tis
mea
sure
dbas
edon
whet
her
ach
ild
atte
nded
school
duri
ng
the
pas
tw
eek
(con
dit
ional
onth
esc
hool
bei
ng
open
).T
he
Col
um
n
(7)
dro
pou
tin
dex
isco
nst
ruct
edas
the
aver
age
ofth
eou
tcom
eva
riab
les
incl
uded
inC
olum
ns
(1)
and
(3)–
(6).
Col
um
ns
(6)
thro
ugh
(7)
incl
ude
ase
tof
fixed
effec
tsfo
rth
enum
ber
ofday
sth
atth
esc
hool
was
open
inth
ew
eek
bef
ore
adm
inis
trat
ive
dat
aco
llec
tion
ingr
ade
nin
e.Sta
ndar
der
rors
,cl
ust
ered
by
school
,in
par
enth
esis
.*
sign
ifica
nt
at10
per
cent
leve
l;**
sign
ifica
nt
at5
per
cent
leve
l;**
*si
gnifi
cant
at1
per
cent
leve
l.Q
-sta
tist
ics
are
Fal
seD
isco
very
Rat
eco
rrec
ted
q-v
alues
.
41
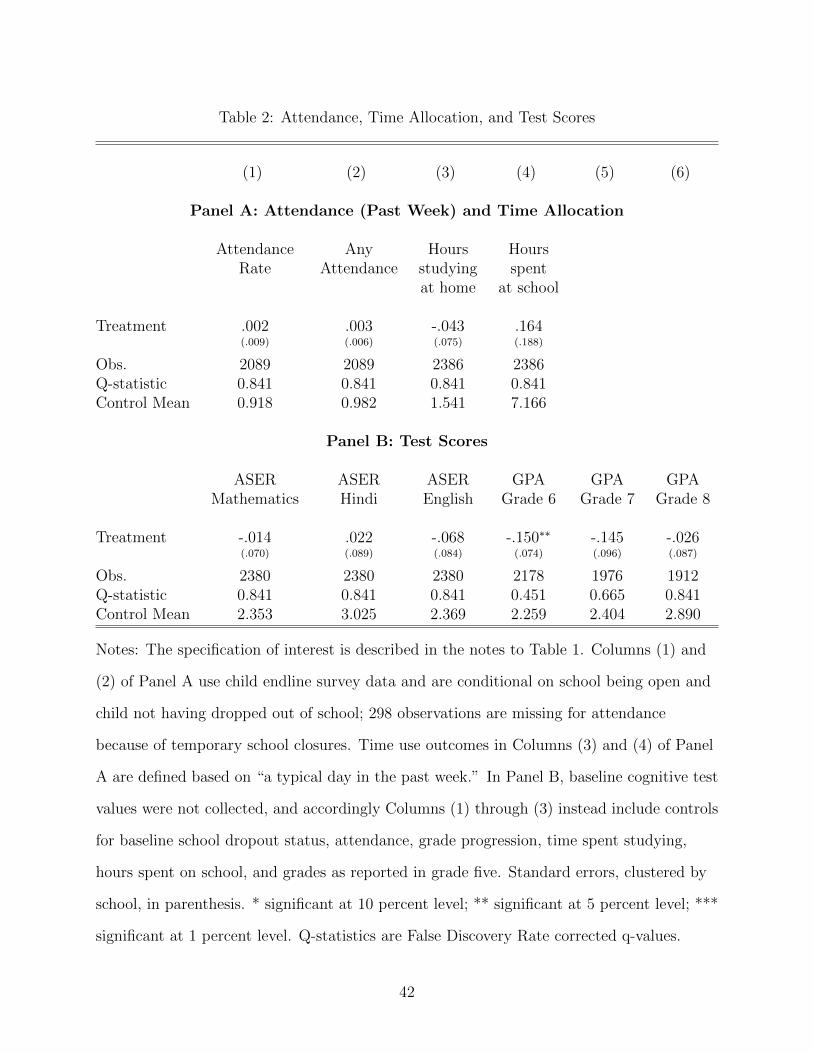
Table 2: Attendance, Time Allocation, and Test Scores
(1) (2) (3) (4) (5) (6)
Panel A: Attendance (Past Week) and Time Allocation
Attendance Any Hours HoursRate Attendance studying spent
at home at school
Treatment .002 .003 -.043 .164(.009) (.006) (.075) (.188)
Obs. 2089 2089 2386 2386Q-statistic 0.841 0.841 0.841 0.841Control Mean 0.918 0.982 1.541 7.166
Panel B: Test Scores
ASER ASER ASER GPA GPA GPAMathematics Hindi English Grade 6 Grade 7 Grade 8
Treatment -.014 .022 -.068 -.150∗∗ -.145 -.026(.070) (.089) (.084) (.074) (.096) (.087)
Obs. 2380 2380 2380 2178 1976 1912Q-statistic 0.841 0.841 0.841 0.451 0.665 0.841Control Mean 2.353 3.025 2.369 2.259 2.404 2.890
Notes: The specification of interest is described in the notes to Table 1. Columns (1) and
(2) of Panel A use child endline survey data and are conditional on school being open and
child not having dropped out of school; 298 observations are missing for attendance
because of temporary school closures. Time use outcomes in Columns (3) and (4) of Panel
A are defined based on “a typical day in the past week.” In Panel B, baseline cognitive test
values were not collected, and accordingly Columns (1) through (3) instead include controls
for baseline school dropout status, attendance, grade progression, time spent studying,
hours spent on school, and grades as reported in grade five. Standard errors, clustered by
school, in parenthesis. * significant at 10 percent level; ** significant at 5 percent level; ***
significant at 1 percent level. Q-statistics are False Discovery Rate corrected q-values.
42

Table 3: Life Skills: Child Survey Measures
(1) (2) (3) (4) (5) (6)
Panel A
Future Gender Educ. / emp. Marital Empowerment / Self-planning norms aspirations expectations agency esteem
index index index index index index
Treatment .072∗∗ .093∗∗∗ .016 -.174∗∗ .102∗∗∗ .037(.030) (.033) (.039) (.082) (.028) (.023)
Obs. 2380 2380 2380 2380 2380 2380Q-statistic 0.103 0.065 0.820 0.122 0.008 0.357
Control Mean -0.016 0.000 0.000 -0.606 -0.002 -0.001
Panel B
Freedom of Socio- Cantril’s Locus of Perceived Rosenbergmovement emotional ladder control stress self-esteem
index index index index index
Treatment .021 .062∗∗∗ .028 -.026 -.025 .021(.023) (.023) (.131) (.046) (.046) (.030)
Obs. 2380 2380 2380 2380 2380 2380Q-statistic 0.707 0.065 0.867 0.795 0.795 0.755Control Mean 0.000 0.000 4.513 0.000 0.000 0.000
Notes: The specification of interest is described in the notes to Table 1. For Columns (4)
through (6) of Panel B reporting measures added at endline, we control for lagged values of
overall life skills indices. Detailed definitions of all referenced indices can be found in the
analysis plan. Standard errors, clustered by school, in parenthesis. * significant at 10
percent level; ** significant at 5 percent level; *** significant at 1 percent level. Q-statistics
are False Discovery Rate corrected q-values, computed by pooling all specifications
included in Tables 3 through 5.
43

Tab
le4:
Lif
eSkills
:P
aren
tal
Rep
orts
(1)
(2)
(3)
(4)
(5)
(6)
(7)
Par
enta
lP
aren
tal
Par
enta
lP
aren
tP
aren
tal
Par
enta
lP
aren
tal
per
cepti
onp
erce
pti
onp
erce
pti
ondau
ghte
rge
nder
school
ing
mar
riag
eof
girl
’sof
girl
’sof
free
dom
com
munic
atio
nat
titu
des
atti
tudes
atti
tudes
stre
ngt
hs
self
-effi
cacy
ofm
ovem
ent
Tre
atm
ent
-.04
0∗∗
.010
.031
-.00
9.0
10.0
43.0
22(.
018)
(.029)
(.028)
(.029)
(.026)
(.037)
(.031)
Obs.
2434
2430
2434
2434
2434
2434
2434
Q-s
tati
stic
0.12
20.
820
0.60
40.
820
0.82
00.
592
0.75
5C
ontr
olM
ean
0.00
0-0
.002
0.00
00.
000
0.00
00.
001
-0.0
04
Not
es:
The
spec
ifica
tion
ofin
tere
stis
des
crib
edin
the
not
esto
Tab
le1.
Det
aile
ddefi
nit
ions
ofal
lre
fere
nce
din
dic
esca
nb
efo
und
inth
ean
alysi
spla
n.
Fou
rob
serv
atio
ns
are
mis
sing
for
par
enta
lp
erce
pti
onof
girl
’sse
lf-e
ffica
cy,
asth
epar
ent
answ
ered
“Don
’tknow
”to
all
ques
tion
s.Sta
ndar
der
rors
,cl
ust
ered
by
school
,in
par
enth
esis
.*
sign
ifica
nt
at10
per
cent
leve
l;**
sign
ifica
nt
at5
per
cent
leve
l;**
*si
gnifi
cant
at1
per
cent
leve
l.Q
-sta
tist
ics
are
Fal
seD
isco
very
Rat
eco
rrec
ted
q-v
alues
,co
mpute
dby
pool
ing
all
spec
ifica
tion
sin
cluded
inT
able
s3
thro
ugh
5.
44

Table 5: Life Skills: Demonstration Tasks and Enumerator Assessment
(1) (2) (3) (4) (5)
Delay Completed Mirror Scavenger Enumeratordiscounting mirror drawings hunt assessment
drawings (seconds) index index
Treatment .003 .072 2.720 -.065 .100∗∗
(.032) (.082) (4.559) (.055) (.047)
Obs. 2380 2387 2317 2380 2380Q-statistic 0.914 0.707 0.795 0.592 0.122Control Mean 0.331 3.269 119.5 0.000 0.000
Notes: The specification of interest is described in the notes to Table 1. Detaileddefinitions of all referenced indices can be found in the analysis plan. Seven observationsare missing from the analysis for both the future discounting and scavenger hunt measures,corresponding to the seven cases in which the respondent responded only to the firstsection of the child survey. 70 observations are missing for time spent on mirror drawing,corresponding to the 70 respondents who did not attempt it. Standard errors, clustered byschool, in parenthesis. * significant at 10 percent level; ** significant at 5 percent level; ***significant at 1 percent level. Q-statistics are False Discovery Rate corrected q-values,computed by pooling all specifications included in Tables 3 through 5.
45

A Appendix
A.1 Data Collection and Validation
A.1.1 School Selection Criteria
In order to select the schools included in the evaluation, a team of enumerators visited
all schools in Ajmer that included girls enrolled in the relevant grades (six through eight)
and collected information about school facilities, staffing, and enrollment. This information
was also linked to administrative records about school facilities and enrollment provided by
state educational authorities.
The evaluation team and RtR then jointly identified a set of minimal criteria that would
determine whether or not a school was eligible for inclusion in the evaluation. These included
the requirements that the schools enrolled girls in grades six through eight, did not have any
other non-governmental organizations providing life skills curricula to students, and had a
classroom in acceptable condition in which a life skills class could take place. The evaluation
team then identified the narrowest possible range of enrollments that would yield a sample
of schools enrolling 2500 girls in total; the objective was to have a relatively homogeneous
sample of schools in terms of size. This yielded the requirement that the school enrolled
between 16 and 32 girls in grade five.
Using information collected in the school survey, the research team created a normalized
school quality index, composed of measures of teacher experience, teachers’ educational
attainment, and classroom and school infrastructure quality. Schools above the median
of the index were included in the “high quality” stratum, with the remaining in the “low
quality” stratum. School assignment to treatment was conducted separately for the two
strata.
Following the initiation of baseline data collection, it was discovered that three of the
schools selected to be in the sample did not enroll girls past grade five; for the upper-
level grades, these were single-sex schools including only boys. During the sample selection
process, these schools were incorrectly designated as including higher-grade girls as well.
46

These three schools (two treatment and one control school) were dropped, and an additional
three schools were selected to replace them, constituting an additional third strata. The
replacement process for these schools entailed identifying 12 schools that met the eligibility
criteria if the enrollment window was slightly lowered to 15. Three schools were randomly
chosen to join the sample among the 12, and of these, two were randomly assigned to the
treatment group.
A.1.2 Piloting of non-cognitive measures
Prior to conducting the baseline survey, the evaluation team engaged in an extensive
period of piloting and questionnaire development. This work focused particularly, though
not exclusively, on the development of instruments tailored to measure the life skills that
Room to Read seeks to enhance through its programming.
The questionnaire development work had three phases: first, a pilot was conducted with
100 households in Phalodi, a district in which Room to Read was already operating, employ-
ing a life skills questionnaire developed under the guidance of Professor Stephanie Jones at
the Harvard School of Education. The objective was to explore the relevance and compre-
hension of life skills questions for girls who had previously been exposed to Room to Read
programming.
Second, an intensive period of questionnaire development and continuous piloting was
undertaken in Ajmer district under the supervision of Eva Roca, a consultant with extensive
experience in measurement of life skills and empowerment among adolescent girls. The
objective was to experiment with various questions as well as objective measures of life
skills working directly with girls in the sample districts. The key points explored were
comprehension, variability, and internal consistency: that is, questions included in the survey
should be easily understood by respondents; should generate varied responses; and should
be designed such that responses to closely related questions are internally consistent.
Third, the complete child and household questionnaires were piloted with 30 respondents
in Ajmer district. In this final phase, the objective was to identify any challenges that had
47

not been addressed and ensure that the questionnaire was of manageable length and flowed
smoothly for respondents. Following the completion of this pilot period, the questionnaire
was scripted for electronic data collection using tablets.
A.1.3 Consent Process
Prior to the start of each survey round, a training process focused on developing enumer-
ator skills was undertaken. Key points included strategies to locate respondents within the
community; the importance of informed consent and how to correctly structure the consent
process; establishing a rapport with respondents as well as with other stakeholders in the
community; maintaining fidelity to the questionnaire; full comprehension of the question-
naires themselves; and correct use of the tablets. (All data collection was implemented using
ODK software on handheld tablets.)
The evaluation team enrolled individual girls and households into the evaluation sample
at baseline using a detailed process of consent administered for both household and child
surveys. Enumerators were trained to explain the purpose of the study, the benefits of par-
ticipating, the study’s duration, and the frequency of the proposed interviews. Interviews
were conducted only after respondents consented to participate and all questions regarding
the study were addressed. Separate consents, both verbal and written, were obtained from
the members who participated in the household survey. For the child survey, parental con-
sent from the primary caregiver was first obtained before interviewing the child. In case the
primary caregiver of the child was not available, consent was obtained from the most senior
member of the household. Informed verbal consent was obtained from all children partici-
pating in the study. The consent process was then repeated for each subsequent survey.
A.1.4 Quantitative Data Collection
The survey teams deployed to the field using household rosters that were constructed
based on the lists of enrolled girls obtained from sampled schools. The information provided
by the schools typically included the name of the head of household and the child herself,
as well as some identifying information about the location of the household. In general,
48
however, it was also necessary for enumerators and field supervisors to work with community
members to locate each household. Field supervisors and field managers would also make
courtesy visits to community stakeholders (including the sarpanch or village leader, school
headmaster, and teachers) when they first arrived in the community in order to introduce
the team and outline the survey’s objectives.
Each survey included a minimum of two visits to the household, as the survey admin-
istered to the girl herself was divided into two parts. This choice was made in order to
maximize attention and avoid fatigue; in addition, the first visit was used to introduce a
scavenger hunt task to the girl, so that she could engage in the scavenger hunt prior to the
second visit. However, many households required more than two visits total to complete the
data collection process, particularly as the household survey included multiple modules to be
answered by different individuals. (For example, introductory modules including household
rosters were administered to the head of household or the individual most knowledgeable
about the household. Modules collecting information about perception of the child’s life
skills were administered to the individual primarily responsible for the child’s care.)
A.1.5 Data Validation
To minimize surveyor error, all survey skip patterns and valid response ranges were pre-
programmed onto tablets prior to the start of survey activities. In addition, the survey was
designed so that surveyors were required to verify that respondent identifiers and names
matched our master file records prior to commencing each round of data collection. To
assess data quality in real time, the project research associate was tasked with downloading
collected data at the end of each day and running a series of data quality checks in Stata
to identify any survey questions generating unexpected response patterns or high rates of
missing values. In addition, these data checks identified whether any surveyors were recording
missing or “Don’t Know” responses with high frequency. When such cases were identified, the
field staff worked with the responsible enumerator to correct surveying practices to minimize
non-response.
49

A.1.6 Tracking Surveys
In addition to the baseline and endline surveys, the sample girls were revisited for tracking
surveys in December 2016 and December 2017. The tracking surveys included only short
modules administered to the girls themselves. Consent was obtained separately for each
subsequent survey.
A.1.7 Qualitative Data Collection
Qualitative data collection was conducted at baseline, midline, and endline. This involved
research activities in six schools served by Room to Read and in the associated communities.
Three schools were selected in which school quality was above average, and two schools were
selected in which it was below average; a sixth school was selected because it was an all girls’
school. The objective of the qualitative data collection is to understand better the chan-
nels through which the GEP changes attitudes, perceptions, and decision-making processes
for girls, teachers, parents and other stakeholders. Qualitative data was collected by staff
members trained in in-depth interview techniques, and collection included the transcription,
translation, and coding of the resulting data.
A.2 Balance
We pre-specified tests for balance from randomization across a wide variety of variables,
and accordingly given 61 individual hypothesis tests, there is ample scope for type 1 errors.
The results are reported in Tables A2 through A4. In the column labeled “Difference”, we
report the coefficients from a simple regression in which the characteristics of interest are
regressed on a treatment indicator and strata dummies, clustering standard errors at the
school. False discovery rate adjusted q-values using the same specification are reported in
the final column (Benjamini and Hochberg, 1995).
Under a true null of no difference between treatment and control, we expect six false
rejections at 10 percent, and observe eight such rejections; similarly, we expect three re-
jections of the null at the five percent level, and observe exactly three. The smallest false
discovery rate is 23 percent, and seven of the eight differences that are significant at the
50
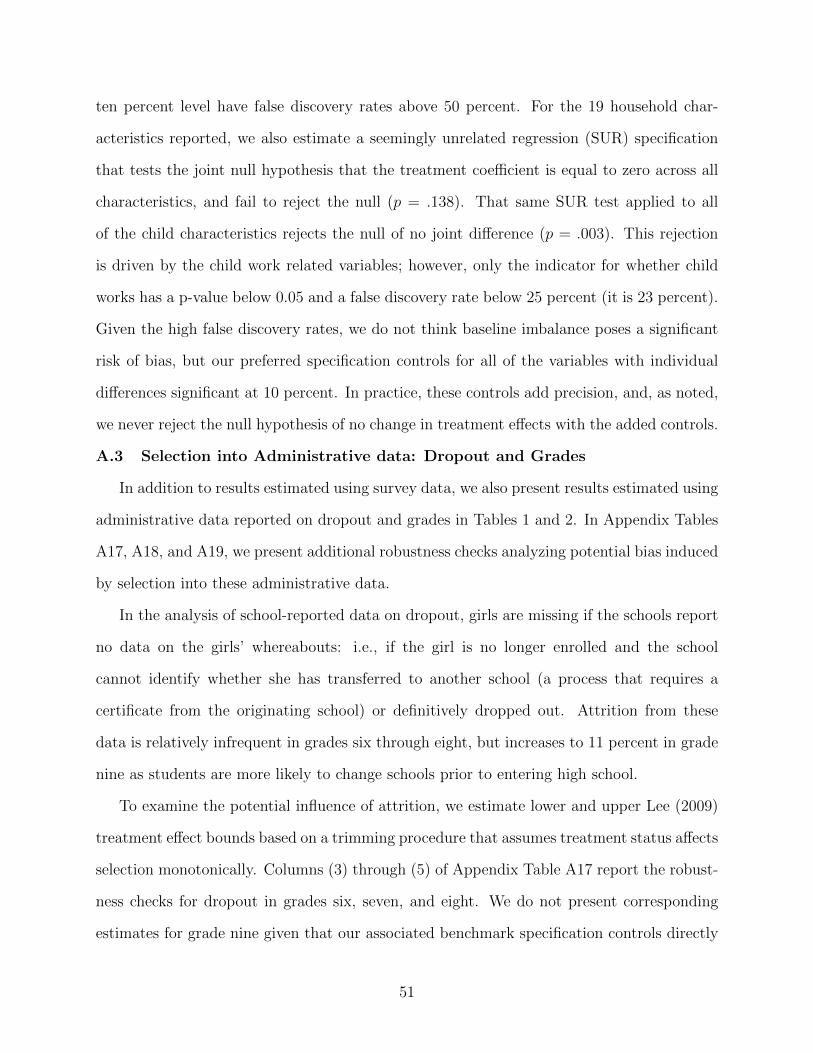
ten percent level have false discovery rates above 50 percent. For the 19 household char-
acteristics reported, we also estimate a seemingly unrelated regression (SUR) specification
that tests the joint null hypothesis that the treatment coefficient is equal to zero across all
characteristics, and fail to reject the null (p = .138). That same SUR test applied to all
of the child characteristics rejects the null of no joint difference (p = .003). This rejection
is driven by the child work related variables; however, only the indicator for whether child
works has a p-value below 0.05 and a false discovery rate below 25 percent (it is 23 percent).
Given the high false discovery rates, we do not think baseline imbalance poses a significant
risk of bias, but our preferred specification controls for all of the variables with individual
differences significant at 10 percent. In practice, these controls add precision, and, as noted,
we never reject the null hypothesis of no change in treatment effects with the added controls.
A.3 Selection into Administrative data: Dropout and Grades
In addition to results estimated using survey data, we also present results estimated using
administrative data reported on dropout and grades in Tables 1 and 2. In Appendix Tables
A17, A18, and A19, we present additional robustness checks analyzing potential bias induced
by selection into these administrative data.
In the analysis of school-reported data on dropout, girls are missing if the schools report
no data on the girls’ whereabouts: i.e., if the girl is no longer enrolled and the school
cannot identify whether she has transferred to another school (a process that requires a
certificate from the originating school) or definitively dropped out. Attrition from these
data is relatively infrequent in grades six through eight, but increases to 11 percent in grade
nine as students are more likely to change schools prior to entering high school.
To examine the potential influence of attrition, we estimate lower and upper Lee (2009)
treatment effect bounds based on a trimming procedure that assumes treatment status affects
selection monotonically. Columns (3) through (5) of Appendix Table A17 report the robust-
ness checks for dropout in grades six, seven, and eight. We do not present corresponding
estimates for grade nine given that our associated benchmark specification controls directly
51

for the number of days each school was open in the past week, which is not feasible to in-
corporate when estimating Lee (2009) bounds given measured rates of cell-specific attrition.
As shown, across specifications, the confidence intervals that we estimate when accounting
for attrition are nearly identical to those estimated from regressions of each outcome on an
indicator for treatment.
For the analysis of school-reported data on test scores, scores are missing for girls who
have dropped out of school as well as for other children whose missing exam scores have
no singular explanation. (This is an advantage of the in-home ASER tests also conducted;
missing data for the ASER scores is minimal, and restricted to those girls who were not
observed in the endline survey.)
In order to analyze the potential impact of missing test scores on our findings, we estimate
lower and upper Lee (2009) treatment effect bounds as above in Columns (4) through (6) of
Panel B of Appendix Table A18. While varying assumptions about the selection into test
scores move our estimates of treatment effects, the resulting confidence interval estimates
remain consistent with our hypothesis that there is no effect of treatment on in-school test
scores.
In Panel A of Appendix Table A19, we examine the relationship between indicators for
available test score data and treatment status. We find that treated students are less likely
to have missing administrative test score data. In Panels B and C, we assess the degree
to which this selection into test data would be expected to bias estimated treatment effects
for administrative test score outcomes by interacting treatment status with the baseline
(grade 5) administrative test score in Panel B and with the baseline attendance rate in
Panel C. Interaction terms are statistically insignificant at conventional levels in all but one
specification and are inconsistent in sign, suggesting that differences in missing rates as a
function of treatment status are not likely to bias estimates in practice.
52

A.4 Bounding
Given evidence from Section 3.1.1 that girls in the control group were more likely to
attrit from the endline girl survey (though not the endline household survey), we assess the
potential importance of missing data in Appendix Tables A17 through A22 for the outcomes
included in Tables 1 through 5 (and Appendix Tables A13 through A15). Specifically, we
estimate lower and upper Lee (2009) treatment effect bounds based on a trimming procedure
that assumes treatment status affects selection monotonically. We present estimates of these
bounds as well as a bounds-based 95% confidence interval for the treatment effect that
captures both uncertainty due to sample attrition and sampling variation. For comparison,
we also present the 95% confidence interval from a specification that regresses the outcome
of interest on treatment. While varying assumptions about selection into the endline survey
do generate some variation in our estimates of treatment effects, selection-adjusted estimates
are generally not statistically distinguishable from the original estimates, and the statistical
significance of estimates (relative to a null hypothesis of zero effect) is largely unchanged for
included outcomes.
A.5 Heterogeneous Effects
We conduct exploratory analyses related to heterogeneity by predicted dropout propen-
sity. To do so, we first predict control group dropout as measured in the endline survey
using four baseline measures: child age (measured in the baseline survey), attendance rate
(measured in the baseline survey), time spent socializing (measured in the baseline sur-
vey) and fifth grade GPA (measured using administrative records). Since predicted dropout
propensity for girls assigned to treatment is determined by the dropout propensity calculated
within the subset of control group girls with matching covariate values, a binning procedure
is necessary to maximize common support. The precise binning procedure employed is as
follows.
For child age, we construct an indicator for whether the girl was older than 11, the
median age for girls in our sample, and we include a separate indicator for missing baseline
53

age (32.7% of the sample is above the median age, 65.6% is below the median age, and
baseline age is missing for 1.6% of the sample). For child attendance, we construct three
bins to categorize attendance among girls who were enrolled in school at the time of the
baseline survey: (1) no attendance in the past week, (2) attendance in the past week but
with one or more absence, and (3) full attendance during the past week. These bins include
9.2%, 23.3%, and 50.0% of girls, respectively. We also include a separate indicator variable
for girls for whom baseline school attendance data are not available (this includes girls who
had already dropped out by the time that the baseline survey was conducted and accounts
for 17.6% of the study sample). For time spent socializing as reported in the baseline survey,
we assign girls to one of three bins: baseline data missing (4.9% of sample), zero reported
time spent socializing at baseline (14.4% of sample), and greater than zero reported time
spent socializing at baseline (80.7% of sample). Lastly, for baseline (fifth grade) GPA, we
assign girls to one of three bins: baseline data missing (4.2% of sample), baseline GPA at
or below median value (3) conditional on non-missingness (54.3% of sample), and baseline
GPA above median value (3) conditional on non-missingness (41.5% of sample).
After constructing these binned measures, within the sample of girls assigned to the
control group, we regress an indicator for endline dropout on the full set of interactions
between the indicator variables described in the prior paragraph. We use the regression
results to construct predicted dropout propensity for girls in the control group; we are able
to construct a predicted dropout measure for 1,222 out of 1,245 girls in the control group
(predicted dropout is missing for girls with missing endline dropout data and for singletons).
We then assign predicted dropout values to girls in the treatment group based on the value
assigned to girls in the control group with the same binned measures of baseline child age,
attendance rate, time spent socializing, and fifth grade GPA (we are able to construct a
predicted dropout measure for 1,178 out of 1,214 girls in the treatment group).
We proceed to conduct heterogeneity analyses by regressing outcome variables of interest
on an indicator for treatment, an indicator for whether a girl is at or above the median
54

predicted dropout propensity (0.143), and the interaction of the two measures (as well as
all of the additional controls included in our benchmark model). The results are reported in
Tables A25 through A30 and are discussed in Section 4.
55

Appendix Figures
Figure A1: Intervention and Data Collection Timeline
56

Figure A2: Number of Life Skills Classes Attended by Treatment Group Subjects in Grade6 (out of 16 Classes)
Figure A3: Number of Life Skills Classes Attended by Treatment Group Subjects in Grade7 (out of 16 Classes)
57

Figure A4: Flow Chart of Participants
58

Figure A5: Attrition by Data Collection Round and Survey Type
Notes: Completed endline surveys refers to the completion of both the child and householdsurveys.
59

Appendix Tables
Table A1: Summary Statistics for Sampled Households
(1) (2) (3)
Sample Mean Rajasthan Mean India Mean
Number of household members 6.838 5.091 4.692Number of boys in household (under 18) 1.379 1.005 0.834Number of girls in household (under 18) 2.438 0.898 0.775Enrollment: girls 10-11 97.8 92.8 95.5Enrollment: boys 10-11 97.5 95.9 95.6Enrollment: girls 12-14 91.1 84.0 90.2Enrollment: boys 12-14 91.6 92.8 91.4Marriage rate: girls 13-14 0.165 0.0166 0.0162Muslim 0.215 0.080 0.125Other Backward Class 0.674 0.459 0.442Scheduled Caste/Scheduled Tribe 0.258 0.337 0.312Land owned (bighas) 6.283 23.924 10.664
Notes: Column (1) presents mean values averaged over all households in the study sample.Households with multiple study subjects occur as multiple observations. 16 study subjectscompleted a baseline child survey but no baseline household survey and thus are notrepresented in these summary statistics. Columns (2) and (3) present household-level meanvalues for respondents to the 2015-2016 Indian Demographic and Health Survey.Enrollment measures take on values from 0 to 100. Marriage rate takes on values from 0 to1, and Muslim, Other Backward Class, and Scheduled Caste/Scheduled Tribe are allindicator variables.
60

Tab
leA
2:B
alan
ceT
ests
for
Hou
sehol
dV
aria
ble
s
Contr
ol
Tre
atm
ent
Diff
eren
ceM
ean
Std
.M
ean
Std
.C
oef
.S
td.
Q-
dev
.d
ev.
erro
rst
at
(1)
(2)
(3)
(4)
(5)
(6)
(7)
Nu
mb
erof
sam
ple
dgir
lsin
hou
seh
old
1.0
57
0.2
41
1.0
67
0.2
51
0.0
10
(0.0
15)
0.8
34
Nu
mb
erof
hou
seh
old
mem
ber
s6.8
93
2.7
63
6.7
81
2.8
60
-0.1
06
(0.1
40)
0.8
29
Nu
mb
erof
boys
inh
ou
seh
old
(un
der
18)
1.3
58
1.0
47
1.4
02
1.0
03
0.0
46
(0.0
50)
0.7
45
Nu
mb
erof
gir
lsin
hou
seh
old
(un
der
18)
2.4
56
1.3
40
2.4
19
1.3
80
-0.0
37
(0.0
63)
0.8
34
Oth
erb
ack
ward
cast
esh
ou
seh
old
0.6
31
0.4
83
0.7
20
0.4
49
0.0
88∗∗
(0.0
38)
0.5
79
Pri
mary
emp
loym
ent
=w
age
/sa
lary
earn
ing
0.5
36
0.4
99
0.5
27
0.4
99
-0.0
12
(0.0
31)
0.9
10
Pri
mary
emp
loym
ent
=S
elf-
emp
.(a
g.)
0.2
10
0.4
07
0.2
20
0.4
15
0.0
11
(0.0
32)
0.9
30
Pri
mary
emp
loym
ent
=S
elf-
emp
.(n
on
-ag.)
0.0
72
0.2
58
0.0
89
0.2
85
0.0
18
(0.0
15)
0.6
55
Pri
mary
emp
loym
ent
=C
asu
al
lab
or
(ag).
0.0
15
0.1
20
0.0
12
0.1
08
-0.0
03
(0.0
05)
0.8
34
Pri
mary
emp
loym
ent
=C
asu
al
lab
or
(non
-ag.)
0.1
62
0.3
69
0.1
51
0.3
58
-0.0
10
(0.0
18)
0.8
34
Non
-food
exp
end
itu
res
inR
up
ees
(last
30
days)
1.0
e+04
5.4
e+04
9453.6
17
1.8
e+04
-879.7
16
(1678.9
69)
0.8
34
Food
exp
end
itu
res
inR
up
ees
(last
30
days)
2.2
e+04
2.9
e+05
1.0
e+04
1.1
e+04
-1.2
e+04
(7903.0
35)
0.6
55
Du
rab
les
exp
end
itu
res
inR
up
ees
(last
yea
r)1.1
e+05
5.5
e+05
1.4
e+05
1.3
e+06
3.3
e+04
(4.0
e+04)
0.7
84
Lan
dow
ned
(big
has)
5.6
53
11.8
28
6.9
01
19.1
53
1.2
46
(1.1
04)
0.6
55
Lan
dcu
ltiv
ate
d(b
igh
as)
2.0
69
8.2
85
2.5
40
15.7
38
0.4
55
(0.7
43)
0.8
34
Hou
seh
old
hold
sN
RE
GA
card
0.7
12
0.4
53
0.8
02
0.3
99
0.0
90
(0.0
63)
0.6
55
Eco
nom
icsh
ock
0.5
93
0.4
91
0.6
20
0.4
86
0.0
27
(0.0
24)
0.6
55
Cri
me
shock
0.1
26
0.3
32
0.1
38
0.3
45
0.0
11
(0.0
17)
0.8
34
Dea
th/
illn
ess
shock
0.3
96
0.4
89
0.4
17
0.4
93
0.0
23
(0.0
21)
0.6
55
Note
s:H
ou
seh
old
sw
ith
mu
ltip
lest
ud
ysu
bje
cts
occ
ur
as
mu
ltip
leob
serv
ati
on
s.16
stu
dy
sub
ject
sco
mp
lete
da
base
lin
ech
ild
surv
eyb
ut
no
base
lin
eh
ou
seh
old
surv
eyan
dth
us
are
not
rep
rese
nte
dh
ere.
182
hou
seh
old
sre
port
that
they
do
not
ow
nla
nd
bu
tacc
ess
collec
tivel
yow
ned
lan
d;
315
can
not
esti
mate
the
am
ou
nt
ow
ned
.206
hou
seh
old
sd
on
ot
rep
ort
lan
dcu
ltiv
ate
db
ecau
seit
iscu
ltiv
ate
dco
llec
tivel
y;
588
can
not
esti
mate
the
am
ou
nt
cult
ivate
d.
Eco
nom
icsh
ock
isan
ind
icato
rfo
rlo
ssof
emp
loym
ent
or
low
ered
inco
me
of
any
hou
seh
old
mem
ber
or
ban
kru
ptc
yof
fam
ily
bu
sin
ess
inla
st12
month
s.C
rim
esh
ock
isan
ind
icato
rfo
rh
avin
gex
per
ien
ced
rob
ber
y,ass
au
lt,
physi
cal
aggre
ssio
n,
ala
nd
dis
pu
te,
or
ad
isp
ute
inla
st12
month
s.D
eath
/illn
ess
shock
isan
ind
icato
rfo
rd
eath
,se
riou
silln
ess,
or
acc
iden
tof
ah
ou
seh
old
mem
ber
inla
st12
month
s.T
he
colu
mn
su
nd
erth
eh
ead
er“D
iffer
ence
”re
port
the
resu
ltof
the
regre
ssio
nof
the
row
vari
ab
leon
an
ind
icato
rfo
rtr
eatm
ent
an
dst
rati
fica
tion
fixed
effec
ts,
clu
ster
ing
stan
dard
erro
rsby
sch
ool.
*si
gn
ifica
nt
at
10
per
cent
level
;**
sign
ifica
nt
at
5p
erce
nt
level
;***
sign
ifica
nt
at
1p
erce
nt
level
.Q
-sta
tist
ics
are
Fals
eD
isco
ver
yR
ate
corr
ecte
dq-v
alu
es,
com
pu
ted
by
poolin
gall
spec
ifica
tion
sin
clu
ded
inT
ab
les
A2
thro
ugh
A4.
61

Tab
leA
3:B
alan
ceT
ests
for
Child
Var
iable
s
Contr
ol
Tre
atm
ent
Diff
eren
ceM
ean
Std
.M
ean
Std
.C
oef
.S
td.
Q-
dev
.d
ev.
erro
rst
at
(1)
(2)
(3)
(4)
(5)
(6)
(7)
Str
ati
ficati
on
(Base
lin
esc
hool
ch
aracte
ris
tics)
:B
elow
med
ian
sch
ool
qu
ality
0.5
15
0.5
00
0.5
02
0.5
00
0.0
00
(—)
Ab
ove
med
ian
sch
ool
qu
ality
0.4
85
0.5
00
0.4
98
0.5
00
0.0
00
(—)
Su
bje
ct
ch
aracte
ris
tics:
Age
10.9
60
1.4
11
11.0
19
1.4
40
0.0
58
(0.0
81)
0.8
29
Mate
rnal
edu
cati
on
(1=
com
ple
ted
pri
mary
or
ab
ove)
0.1
87
0.3
90
0.1
56
0.3
63
-0.0
30
(0.0
23)
0.6
55
Gir
l’s
mari
tal
statu
s(1
=m
arr
ied
)0.1
41
0.3
48
0.1
94
0.3
96
0.0
53∗
(0.0
28)
0.5
79
Ch
ild
has
dro
pp
edou
tof
sch
ool
0.0
24
0.1
54
0.0
26
0.1
59
0.0
01
(0.0
10)
0.9
67
Ch
ild
isin
gra
de
five
0.9
75
0.1
55
0.9
74
0.1
58
-0.0
00
(0.0
10)
0.9
81
Any
att
end
an
cein
last
wee
k0.8
70
0.3
36
0.9
08
0.2
90
0.0
40
(0.0
25)
0.6
55
Att
end
an
cera
tein
last
wee
k0.7
68
0.3
53
0.8
08
0.3
19
0.0
44
(0.0
28)
0.6
55
Del
ay
dis
cou
nti
ng
0.1
71
0.3
76
0.1
86
0.3
90
0.0
13
(0.0
26)
0.8
34
Com
ple
ted
mir
ror
dra
win
gs
2.4
89
1.2
28
2.3
31
1.2
42
-0.1
49
(0.1
17)
0.6
55
Mir
ror
dra
win
gs
(sec
on
ds)
69.4
52
65.8
75
67.3
18
74.5
78
-1.8
33
(6.0
43)
0.9
37
Sca
ven
ger
hu
nt
ind
ex-0
.000
0.9
65
-0.0
48
0.9
73
-0.0
45
(0.0
76)
0.8
34
Soci
o-e
moti
on
al
ind
ex-0
.000
0.4
80
0.0
35
0.4
47
0.0
34
(0.0
30)
0.6
55
Fre
edom
of
movem
ent
ind
ex0.0
00
0.5
77
-0.0
02
0.6
28
-0.0
04
(0.0
46)
0.9
72
Em
pow
erm
ent
ind
ex-0
.000
0.4
06
-0.0
08
0.4
26
-0.0
07
(0.0
29)
0.9
55
Sel
f-es
teem
ind
ex0.0
00
0.5
03
0.0
27
0.4
72
0.0
27
(0.0
30)
0.7
46
Fu
ture
pla
nn
ing
ind
ex0.0
20
0.6
10
0.0
84
0.5
89
0.0
62∗
(0.0
33)
0.5
79
Mari
tal
exp
ecta
tion
sin
dex
-0.4
01
1.3
48
-0.5
95
1.5
14
-0.1
92∗
(0.1
04)
0.5
79
Ed
uca
tion
/em
plo
ym
ent
asp
irati
on
sin
dex
-0.0
02
0.7
88
-0.0
33
0.8
01
-0.0
29
(0.0
53)
0.8
34
Gen
der
norm
sin
dex
-0.0
00
0.4
98
-0.0
05
0.5
21
-0.0
05
(0.0
34)
0.9
67
Cantr
il’s
lad
der
8.0
29
2.3
95
7.8
77
2.4
40
-0.1
54
(0.1
52)
0.6
85
Enu
mer
ato
rass
essm
ent
ind
ex-0
.000
0.8
59
-0.0
56
0.9
22
-0.0
55
(0.0
52)
0.6
55
Note
s:O
ne
hou
seh
old
did
not
com
ple
tea
rost
eran
dth
us
isn
ot
rep
rese
nte
din
thes
eb
ase
lin
esu
mm
ary
stati
stic
s.A
ny
att
end
an
cein
last
wee
kis
mis
sin
gif
child
has
dro
pp
edou
tor
her
sch
ool
was
not
op
enin
past
wee
k.
Att
endan
cera
tein
last
wee
kis
mis
sin
gif
child
has
dro
pp
edou
t,h
ersc
hool
was
not
op
enin
past
wee
k,
or
she
did
not
att
end
sch
ool
inp
ast
wee
k.
Mate
rnal
edu
cati
on
ism
easu
red
at
end
lin
ean
dis
mis
sin
gif
child
isn
ot
pre
sent
insu
rvey
.D
etails
regard
ing
the
rem
ain
ing
vari
ab
les
an
din
dic
esca
nb
efo
un
din
the
an
aly
sis
pla
n.
Th
eco
lum
ns
un
der
the
hea
der
“D
iffer
ence
”re
port
the
resu
ltof
the
regre
ssio
nof
the
row
vari
ab
leon
an
ind
icato
rfo
rtr
eatm
ent
an
dst
rati
fica
tion
fixed
effec
ts.
Sta
nd
ard
erro
rsare
clu
ster
edby
sch
ool.
*si
gn
ifica
nt
at
10
per
cent
level
;**
sign
ifica
nt
at
5p
erce
nt
level
;***
sign
ifica
nt
at
1p
erce
nt
level
.Q
-sta
tist
ics
are
Fals
eD
isco
ver
yR
ate
corr
ecte
dq-v
alu
es,
com
pu
ted
by
poolin
gall
spec
ifica
tion
sin
clu
ded
inT
ab
les
A2
thro
ugh
A4.
62

Tab
leA
4:B
alan
ceT
ests
for
Child
Var
iable
s,co
nt.
Contr
ol
Tre
atm
ent
Diff
eren
ceM
ean
Std
.M
ean
Std
.C
oef
.S
td.
Q-
dev
.d
ev.
erro
rst
at
(1)
(2)
(3)
(4)
(5)
(6)
(7)
Pare
nta
lp
erce
pti
on
of
gir
l’s
stre
ngth
s-0
.000
0.3
74
0.0
07
0.3
57
0.0
08
(0.0
33)
0.9
55
Pare
nta
lp
erce
pti
on
of
gir
l’s
self
-effi
cacy
0.0
00
0.6
11
0.0
48
0.6
36
0.0
47
(0.0
38)
0.6
55
Pare
nta
lp
erce
pti
on
free
dom
of
movem
ent
-0.0
00
0.5
32
-0.0
43
0.6
43
-0.0
44
(0.0
35)
0.6
55
Pare
nt-
dau
ghte
rco
mm
un
icati
on
0.0
01
0.4
15
0.0
02
0.4
29
0.0
02
(0.0
28)
0.9
72
Pare
nta
lgen
der
att
itu
des
-0.0
00
0.4
24
0.0
03
0.4
39
0.0
03
(0.0
25)
0.9
67
Pare
nta
lsc
hoolin
gatt
itu
des
0.0
03
0.6
82
0.0
12
0.7
09
0.0
10
(0.0
50)
0.9
55
Pare
nta
lm
arr
iage
att
itu
des
-0.0
05
0.5
03
-0.0
05
0.5
30
0.0
00
(0.0
33)
0.9
99
Ch
ild
work
s0.8
84
0.3
20
0.9
45
0.2
27
0.0
60∗∗
∗(0
.020)
0.2
34
Ch
ild
work
sfo
rp
ay
0.8
29
0.3
76
0.8
59
0.3
49
0.0
29
(0.0
26)
0.6
55
Ch
ild
work
sou
tsid
eof
fam
ily
act
ivit
y0.6
74
0.4
69
0.7
21
0.4
49
0.0
46
(0.0
35)
0.6
55
Ch
ild
lab
or
0.8
55
0.3
52
0.8
93
0.3
10
0.0
35
(0.0
23)
0.6
55
Haza
rdou
sch
ild
lab
or
0.6
20
0.4
86
0.6
65
0.4
72
0.0
42
(0.0
37)
0.6
55
Oth
erw
ors
tfo
rms
of
child
lab
or
0.2
19
0.4
14
0.2
31
0.4
22
0.0
10
(0.0
26)
0.9
10
Hou
rsec
on
om
ically
act
ive
ina
day
0.9
45
1.6
36
1.1
64
1.7
41
0.2
17∗
(0.1
25)
0.6
32
Hou
rsin
un
paid
hou
seh
old
serv
ices
ina
day
1.4
15
1.4
54
1.4
80
1.4
41
0.0
65
(0.0
68)
0.7
21
Tota
lh
ours
act
ive
2.3
60
2.2
43
2.6
44
2.3
67
0.2
82∗
(0.1
52)
0.5
79
Hou
rsact
ive
ou
tsid
eh
ou
se0.7
19
1.3
87
0.9
35
1.5
13
0.2
15∗∗
(0.0
98)
0.5
79
Hou
rsst
ud
yin
gat
hom
e0.7
13
0.9
66
0.6
94
0.9
44
-0.0
13
(0.0
61)
0.9
55
Tota
lh
ours
spen
ton
sch
ool
6.0
14
2.8
45
6.1
99
2.7
99
0.1
92
(0.2
70)
0.8
29
Note
s:O
ne
hou
seh
old
did
not
com
ple
tea
rost
eran
dth
us
isn
ot
rep
rese
nte
din
thes
eb
ase
lin
esu
mm
ary
stati
stic
s.D
etails
regard
ing
the
incl
ud
edvari
ab
les
an
din
dic
esca
nb
efo
un
din
the
an
aly
sis
pla
np
ost
edon
-lin
e.T
he
colu
mn
su
nd
erth
eh
ead
er“D
iffer
ence
”re
port
the
resu
ltof
the
regre
ssio
nof
the
row
vari
ab
leon
an
ind
icato
rfo
rtr
eatm
ent
an
dst
rati
fica
tion
fixed
effec
ts.
Sta
nd
ard
erro
rsare
clu
ster
edby
sch
ool.
*si
gn
ifica
nt
at
10
per
cent
level
;**
sign
ifica
nt
at
5p
erce
nt
level
;***
sign
ifica
nt
at
1p
erce
nt
level
.Q
-sta
tist
ics
are
Fals
eD
isco
ver
yR
ate
corr
ecte
dq-v
alu
es,
com
pu
ted
by
poolin
gall
spec
ifica
tion
sin
clu
ded
inT
ab
les
A2
thro
ugh
A4.
63

Tab
leA
5:Sch
ool
Dro
pou
t(S
trat
ifica
tion
Con
trol
s)
(1)
(2)
(3)
(4)
(5)
(6)
(7)
Surv
eydat
aA
dm
inis
trat
ive
dat
a
Whet
her
child
has
Whet
her
child
pro
gres
sed
Dro
pou
tD
rop
out
Dro
pou
tD
rop
out
Dro
pou
tdro
pp
edou
tto
7th
grad
eG
rade
6G
rade
7G
rade
8G
rade
9In
dex
Tre
atm
ent
-.03
3∗.0
37∗
-.00
7-.
025
-.04
3∗∗
-.05
1∗-.
035∗
∗
(.020)
(.020)
(.017)
(.020)
(.021)
(.026)
(.017)
Obs.
2433
2387
2374
2319
2455
2228
2458
Con
trol
Mea
n0.
132
0.86
50.
075
0.14
20.
192
0.29
00.
169
Not
es:
Tab
leco
nta
ins
resu
lts
from
regr
essi
ng
the
outc
ome
vari
able
indic
ated
by
the
colu
mn
hea
der
onan
indic
ator
for
trea
tmen
t(r
epor
ted)
and
stra
tifica
tion
fixed
effec
ts.
Col
um
n(1
)use
sch
ild
and
hou
sehol
den
dline
surv
eydat
a.C
olum
n(2
)use
sch
ild
endline
surv
eyon
ly.
Col
um
ns
(3)
thro
ugh
(6)
rely
onad
min
istr
ativ
edat
a.In
Col
um
ns
(3)
thro
ugh
(5),
dro
pou
tis
mea
sure
dbas
edon
whet
her
ach
ild
atte
nded
school
atth
eco
ncl
usi
onof
the
refe
rence
dsc
hool
year
.In
Col
um
n(6
),dro
pou
tis
mea
sure
dbas
edon
whet
her
ach
ild
atte
nded
school
duri
ng
the
pas
tw
eek
(con
dit
ional
onth
esc
hool
bei
ng
open
).T
he
Col
um
n(7
)dro
pou
tin
dex
isco
nst
ruct
edas
the
aver
age
ofth
eou
tcom
eva
riab
les
incl
uded
inC
olum
ns
(1),
(3),
(4),
(5),
and
(6).
Col
um
ns
(6)
thro
ugh
(7)
incl
ude
ase
tof
fixed
effec
tsfo
rth
enum
ber
ofday
sth
atth
esc
hool
was
open
inth
ew
eek
bef
ore
adm
inis
trat
ive
dat
aco
llec
tion
ingr
ade
nin
e.Sta
ndar
der
rors
,cl
ust
ered
by
school
,in
par
enth
esis
.*
sign
ifica
nt
at10
per
cent
leve
l;**
sign
ifica
nt
at5
per
cent
leve
l;**
*si
gnifi
cant
at1
per
cent
leve
l.
64

Tab
leA
6:Sch
ool
Dro
pou
t(S
trat
ifica
tion
+A
ge,
Bas
elin
eO
utc
omes
,an
dE
conom
icSta
tus
Con
trol
s)
(1)
(2)
(3)
(4)
(5)
(6)
(7)
Surv
eydat
aA
dm
inis
trat
ive
dat
a
Whet
her
child
has
Whet
her
child
pro
gres
sed
Dro
pou
tD
rop
out
Dro
pou
tD
rop
out
Dro
pou
tdro
pp
edou
tto
7th
grad
eG
rade
6G
rade
7G
rade
8G
rade
9In
dex
Tre
atm
ent
-.03
5∗.0
38∗∗
-.00
9-.
025
-.04
4∗∗
-.05
3∗∗
-.03
6∗∗
(.018)
(.018)
(.016)
(.019)
(.020)
(.024)
(.016)
Obs.
2433
2387
2374
2319
2455
2228
2458
Con
trol
Mea
n0.
132
0.86
50.
075
0.14
20.
192
0.29
00.
169
Not
es:
Tab
leco
nta
ins
resu
lts
from
regr
essi
ng
the
outc
ome
vari
able
indic
ated
by
the
colu
mn
hea
der
onan
indic
ator
for
trea
tmen
t(r
epor
ted),
stra
tifica
tion
fixed
effec
ts,
age
fixed
effec
ts,
bas
elin
eva
lue
ofth
eou
tcom
e,an
da
vect
orof
dum
mie
sfo
rth
em
ost
imp
orta
nt
typ
eof
emplo
ym
ent
inth
ehou
sehol
dat
bas
elin
e.C
olum
n(1
)use
sch
ild
and
hou
sehol
den
dline
surv
eydat
a.C
olum
n(2
)use
sch
ild
endline
surv
eyon
ly.
Col
um
ns
(3)
thro
ugh
(6)
rely
onad
min
istr
ativ
edat
a.In
Col
um
ns
(3)
thro
ugh
(5),
dro
pou
tis
mea
sure
dbas
edon
whet
her
ach
ild
atte
nded
school
atth
eco
ncl
usi
onof
the
refe
rence
dsc
hool
year
.In
Col
um
n(6
),dro
pou
tis
mea
sure
dbas
edon
whet
her
ach
ild
atte
nded
school
duri
ng
the
pas
tw
eek
(con
dit
ional
onth
esc
hool
bei
ng
open
).T
he
Col
um
n(7
)dro
pou
tin
dex
isco
nst
ruct
edas
the
aver
age
ofth
eou
tcom
eva
riab
les
incl
uded
inC
olum
ns
(1),
(3),
(4),
(5),
and
(6).
Col
um
ns
(6)
thro
ugh
(7)
incl
ude
ase
tof
fixed
effec
tsfo
rth
enum
ber
ofday
sth
atth
esc
hool
was
open
inth
ew
eek
bef
ore
adm
inis
trat
ive
dat
aco
llec
tion
ingr
ade
nin
e.Sta
ndar
der
rors
,cl
ust
ered
by
school
,in
par
enth
esis
.*
sign
ifica
nt
at10
per
cent
leve
l;**
sign
ifica
nt
at5
per
cent
leve
l;**
*si
gnifi
cant
at1
per
cent
leve
l.
65

Table A7: Attendance, Time Allocation, and Test Scores (Stratification Controls)
(1) (2) (3) (4) (5) (6)
Panel A: Attendance (Past Week) and Time Allocation
Attendance Attendance Hours Hoursrate dummy studying spent
at home at school
Treatment .006 .003 -.062 .183(.010) (.005) (.077) (.189)
Obs. 2089 2089 2386 2386Control Mean 0.918 0.982 1.541 7.166
Panel B: Test Scores
ASER ASER ASER GPA GPA GPAMathematics Hindi English Grade 6 Grade 7 Grade 8
Treatment -.021 .032 -.074 -.119 -.121 -.033(.077) (.093) (.090) (.074) (.092) (.083)
Obs. 2380 2380 2380 2178 1976 1912Control Mean 2.353 3.025 2.369 2.259 2.404 2.890
Notes: Table contains results from regressing the outcome variable indicated by the columnheader on an indicator for treatment (reported) and stratification fixed effects. Columns(1) and (2) of Panel A use child endline survey data and are conditional on school beingopen and child not having dropped out of school. Attendance rate in Column (1) is thefraction of school days attended in the week prior to being surveyed and the Attendancedummy in Column (2) is an indicator for having attended any days in the past week. 298observations are missing for these measures because of temporary school closures. Time useoutcomes in Columns (3) and (4) of Panel A are defined based on time use patternsrecorded for “a typical day in the past week.” Standard errors, clustered by school, inparenthesis. * significant at 10 percent level; ** significant at 5 percent level; ***significant at 1 percent level.
66

Table A8: Attendance, Time Allocation and Test Scores (Stratification + Age, BaselineOutcomes, and Economic Status Controls)
(1) (2) (3) (4) (5) (6)
Panel A: Attendance (Past Week) and Time Allocation
Attendance Attendance Hours Hoursrate dummy studying spent
at home at school
Treatment .004 .003 -.067 .132(.009) (.006) (.076) (.187)
Obs. 2089 2089 2386 2386Control Mean 0.918 0.982 1.541 7.166
Panel B: Test Scores
ASER ASER ASER GPA GPA GPAMathematics Hindi English Grade 6 Grade 7 Grade 8
Treatment -.032 .008 -.089 -.159∗∗ -.145 -.028(.070) (.089) (.084) (.073) (.095) (.086)
Obs. 2380 2380 2380 2178 1976 1912Control Mean 2.353 3.025 2.369 2.259 2.404 2.890
Notes: Table contains results from regressing the outcome variable indicated by the columnheader on an indicator for treatment (reported), stratification fixed effects, age fixedeffects, baseline value of the outcome, and a vector of dummies for the most importanttype of employment in the household at baseline. Columns (1) and (2) of Panel A use childendline survey data and are conditional on school being open and child not having droppedout of school. Attendance rate in Column (1) is the fraction of school days attended in theweek prior to being surveyed and the Attendance dummy in Column (2) is an indicator forhaving attended any days in the past week. 298 observations are missing for thesemeasures because of temporary school closures. Time use outcomes in Columns (3) and (4)of Panel A are defined based on time use patterns recorded for “a typical day in the pastweek.” In Panel B, baseline cognitive test values were not collected, and accordinglyColumns (1) through (3) instead include controls for baseline school dropout status,attendance, grade progression, time spent studying, hours spent on school, and grades asreported in grade five. Standard errors, clustered by school, in parenthesis. * significant at10 percent level; ** significant at 5 percent level; *** significant at 1 percent level.
67

Table A9: Life Skills: Child Survey Measures (Stratification Controls)
Panel A
Future Gender Educ. / emp. Marital Empowerment / Self-planning norms aspirations expectations agency esteem
index index index index index index(1) (2) (3) (4) (5) (6)
Treatment .070∗∗ .089∗∗∗ -.011 -.315∗∗ .094∗∗∗ .041∗
(.030) (.034) (.054) (.123) (.027) (.024)
Obs. 2380 2380 2380 2380 2380 2380
Control Mean -0.016 0.000 0.000 -0.606 -0.002 -0.001
Panel B
Freedom of Socio- Cantril’s Locus of Perceived Rosenbergmovement emotional ladder control stress self-esteem
index index index index index(1) (2) (3) (4) (5) (6)
Treatment .020 .070∗∗∗ -.026 -.015 -.025 .016(.022) (.023) (.133) (.046) (.047) (.030)
Obs. 2380 2380 2380 2380 2380 2380Control Mean 0.000 0.000 4.513 0.000 0.000 0.000
Notes: Table contains results from regressing the outcome variable indicated by the columnheader on an indicator for treatment (reported) and stratification fixed effects. Detaileddefinitions of all referenced indices can be found in the analysis plan. Standard errors,clustered by school, in parenthesis. * significant at 10 percent level; ** significant at 5percent level; *** significant at 1 percent level.
68

Table A10: Life Skills: Child Survey (Stratification + Baseline Controls)
(1) (2) (3) (4) (5) (6)
Panel A
Future Gender Educ. / emp. Marital Empowerment / Self-planning norms aspirations expectations agency esteem
index index index index index index
Treatment .065∗∗ .088∗∗∗ -.0002 -.198∗∗ .097∗∗∗ .037(.031) (.034) (.039) (.081) (.027) (.023)
Obs. 2380 2380 2380 2380 2380 2380
Control Mean -0.016 0.000 0.000 -0.606 -0.002 -0.001
Panel B
Freedom of Socio- Cantril’s Locus of Perceived Rosenbergmovement emotional ladder control stress self-esteem
index index index index index
Treatment .022 .063∗∗∗ .0007 -.020 -.024 .024(.023) (.023) (.131) (.046) (.047) (.030)
Obs. 2380 2380 2380 2380 2380 2380Control Mean 0.000 0.000 4.513 0.000 0.000 0.000
Notes: Table contains results from regressing the outcome variable indicated by the columnheader on an indicator for treatment (reported), stratification fixed effects, age fixedeffects, the baseline value of the outcome, and a vector of dummies for the most importanttype of employment in the household at baseline. For Columns (4) through (6) of Panel Breporting measures added at endline, we control for lagged values of overall life skillsindices. Detailed definitions of all referenced indices can be found in the analysis plan.Standard errors, clustered by school, in parenthesis. * significant at 10 percent level; **significant at 5 percent level; *** significant at 1 percent level.
69

Tab
leA
11:
Lif
eSkills
:P
aren
tal
Rep
orts
,D
emon
stra
tion
Tas
ks,
and
Enum
erat
orA
sses
smen
t(S
trat
ifica
tion
Con
trol
s)
(1)
(2)
(3)
(4)
(5)
(6)
(7)
Pan
el
A:
Parenta
lR
ep
orts
Pare
nta
lP
are
nta
lP
are
nta
lP
are
nt
Pare
nta
lP
are
nta
lP
are
nta
lp
erce
pti
on
per
cep
tion
per
cep
tion
dau
ghte
rgen
der
sch
oolin
gm
arr
iage
of
gir
l’s
of
gir
l’s
of
free
dom
com
mu
nic
ati
on
att
itu
des
att
itu
des
att
itu
des
stre
ngth
sse
lf-e
ffica
cyof
movem
ent
Tre
atm
ent
-.042∗∗
.004
.021
-.014
.0004
.032
.022
(.018)
(.029)
(.029)
(.029)
(.026)
(.042)
(.031)
Ob
s.2434
2430
2434
2434
2434
2434
2434
Contr
ol
Mea
n0.0
00
-0.0
02
0.0
00
0.0
00
0.0
00
0.0
01
-0.0
04
Pan
el
B:
Dem
on
strati
on
Task
san
dE
nu
merato
rA
ssess
ment
Del
ay
Com
ple
ted
Mir
ror
Sca
ven
ger
Enu
mer
ato
rd
isco
unti
ng
mir
ror
dra
win
gs
hu
nt
ass
essm
ent
dra
win
gs
(sec
on
ds)
ind
exin
dex
Tre
atm
ent
-.0004
.056
2.1
72
-.079
.073
(.032)
(.085)
(4.4
72)
(.057)
(.050)
Ob
s.2380
2387
2317
2380
2380
Contr
ol
Mea
n0.3
31
3.2
69
119.5
0.0
00
0.0
00
Note
s:T
ab
leco
nta
ins
resu
lts
from
regre
ssin
gth
eou
tcom
evari
ab
lein
dic
ate
dby
the
colu
mn
hea
der
on
an
ind
icato
rfo
rtr
eatm
ent
(rep
ort
ed)
an
dst
rati
fica
tion
fixed
effec
ts.
Det
ailed
defi
nit
ion
sof
all
refe
ren
ced
ind
ices
can
be
fou
nd
inth
ean
aly
sis
pla
np
ost
edon
-lin
e.F
ou
rob
serv
ati
on
sare
mis
sing
for
pare
nta
lp
erce
pti
on
of
gir
l’s
self
-effi
cacy
,as
the
pare
nt
an
swer
ed“D
on
’tkn
ow
”to
all
the
rele
vant
qu
esti
on
s.In
tota
l,se
ven
ob
serv
ati
on
sare
mis
sin
gfr
om
the
an
aly
sis
for
both
the
futu
red
isco
unti
ng
an
dsc
aven
ger
hu
nt
mea
sure
s,co
rres
pon
din
gto
the
seven
case
sin
wh
ich
the
resp
on
den
tel
ecte
don
lyto
resp
on
dto
the
firs
tse
ctio
nof
the
child
surv
ey.
70
ob
serv
ati
on
sare
mis
sin
gfo
rti
me
spen
ton
mir
ror
dra
win
gm
easu
re,
corr
esp
on
din
gto
the
70
resp
on
den
tsw
ho
did
not
att
emp
tany
mir
ror
dra
win
gs.
Sta
nd
ard
erro
rs,
clu
ster
edby
sch
ool,
inp
are
nth
esis
.*
sign
ifica
nt
at
10
per
cent
level
;**
sign
ifica
nt
at
5p
erce
nt
level
;***
sign
ifica
nt
at
1p
erce
nt
level
.
70

Tab
leA
12:
Lif
eSkills
:O
ther
(Str
atifi
cati
on+
Age
,B
asel
ine
Outc
omes
,an
dE
conom
icSta
tus
Con
trol
s)
(1)
(2)
(3)
(4)
(5)
(6)
(7)
Pan
el
A:
Parenta
lR
ep
orts
Pare
nta
lP
are
nta
lP
are
nta
lP
are
nt
Pare
nta
lP
are
nta
lP
are
nta
lp
erce
pti
on
per
cep
tion
per
cep
tion
dau
ghte
rgen
der
sch
oolin
gm
arr
iage
of
gir
l’s
of
gir
l’s
of
free
dom
com
mu
nic
ati
on
att
itu
des
att
itu
des
att
itu
des
stre
ngth
sse
lf-e
ffica
cyof
movem
ent
Tre
atm
ent
-.043∗∗
-.0007
.025
-.009
.003
.027
.023
(.018)
(.030)
(.028)
(.028)
(.026)
(.038)
(.031)
Ob
s.2434
2430
2434
2434
2434
2434
2434
Contr
ol
Mea
n0.0
00
-0.0
02
0.0
00
0.0
00
0.0
00
0.0
01
-0.0
04
Pan
el
B:
Dem
on
strati
on
Task
san
dE
nu
merato
rA
ssess
ment
Del
ay
Com
ple
ted
Mir
ror
Sca
ven
ger
Enu
mer
ato
rd
isco
unti
ng
mir
ror
dra
win
gs
hu
nt
ass
essm
ent
dra
win
gs
(sec
on
ds)
ind
exin
dex
Tre
atm
ent
-.003
.070
2.6
10
-.072
.092∗
(.032)
(.085)
(4.5
35)
(.055)
(.047)
Ob
s.2380
2387
2317
2380
2380
Contr
ol
Mea
n0.3
31
3.2
69
119.5
0.0
00
0.0
00
Note
s:T
ab
leco
nta
ins
resu
lts
from
regre
ssin
gth
eou
tcom
evari
ab
lein
dic
ate
dby
the
colu
mn
hea
der
on
an
ind
icato
rfo
rtr
eatm
ent
(rep
ort
ed),
stra
tifi
cati
on
fixed
effec
ts,
age
fixed
effec
ts,
base
line
valu
eof
the
ou
tcom
e,an
da
vec
tor
of
du
mm
ies
for
the
most
imp
ort
ant
typ
eof
emp
loym
ent
inth
eh
ou
seh
old
at
base
lin
e.D
etail
edd
efin
itio
ns
of
all
refe
ren
ced
ind
ices
can
be
fou
nd
inth
ean
aly
sis
pla
n.
Fou
rob
serv
ati
on
sare
mis
sin
gfo
rp
are
nta
lp
erce
pti
on
of
gir
l’s
self
-effi
cacy
,as
the
pare
nt
an
swer
ed“D
on
’tkn
ow
”to
all
the
rele
vant
qu
esti
on
s.In
tota
l,se
ven
ob
serv
ati
on
sare
mis
sin
gfr
om
the
an
aly
sis
for
both
the
futu
red
isco
unti
ng
an
dsc
aven
ger
hu
nt
mea
sure
s,co
rres
pon
din
gto
the
seven
case
sin
wh
ich
the
resp
on
den
tel
ecte
don
lyto
resp
on
dto
the
firs
tse
ctio
nof
the
child
surv
ey.
70
ob
serv
ati
on
sare
mis
sin
gfo
rti
me
spen
ton
mir
ror
dra
win
gm
easu
re,
corr
esp
on
din
gto
the
70
resp
on
den
tsw
ho
did
not
att
emp
tany
mir
ror
dra
win
gs.
Sta
nd
ard
erro
rs,
clu
ster
edby
sch
ool,
inp
are
nth
esis
.*
signifi
cant
at
10
per
cent
level
;**
sign
ifica
nt
at
5p
erce
nt
level
;***
sign
ifica
nt
at
1p
erce
nt
level
.
71

Table A13: Child Empowerment/Agency Index Subcomponents
(1) (2) (3)Sole decision: Sole decision: Talks to parentsAttend school Work about marriage
Panel A: Benchmark Specification
Treatment .072∗∗∗ .107∗∗∗ .087∗∗∗
(.024) (.026) (.023)
Obs. 2380 2380 1976
Panel B: Stratification Controls Only
Treatment .068∗∗∗ .099∗∗∗ .080∗∗∗
(.024) (.025) (.023)
Obs. 2380 2380 1976
Panel C: Stratification Controls + Age, Economic Status, and Baseline Values
Treatment .070∗∗∗ .105∗∗∗ .080∗∗∗
(.025) (.025) (.023)
Control Mean .413 .375 .270Obs. 2380 2380 1976
Notes: Specifications of interest are defined in the notes to Table A5 and A6. Soledecision-maker: Attend school and Sole decision-maker: Work are indicators for whetherthe girl responds “I do/I will” when asked who mostly makes decisions about whether ornot the girl will go to school and what type of work the girl will do after she finishes herstudies, respectively. Talks to parents about marriage is an indicator for whether the girlresponds that she can talk to her parents about her preferences regarding who she willmarry. This measure is missing for girls who are already married. Standard errors,clustered by school, in parenthesis. * significant at 10 percent level; ** significant at 5percent level; *** significant at 1 percent level.
72

Table A14: Child Socio-emotional Support Index Subcomponents and Additional Measures
(1) (2) (3) (4) (5) (6) (7) (8)Prefers Meets Has place Has place Total Reports Time on Timeto be friends to meet to stay social time on mobile travelingalone outside friends if needed time mobile to school
Panel A: Benchmark Specification
Treatment -.055∗∗ .035 .060∗∗ .029 9.610∗∗∗ .006∗∗ .379∗ 8.734∗∗
(.024) (.022) (.029) (.018) (3.695) (.003) (.229) (3.669)
Obs. 2434 2380 2380 2380 2387 2387 2387 2387
Panel B: Stratification Controls Only
Treatment -.053∗∗ .042∗ .065∗∗ .034∗ 9.956∗∗∗ .006∗∗ .346 9.066∗∗
(.023) (.023) (.028) (.017) (3.659) (.003) (.217) (3.675)
Obs. 2434 2380 2380 2380 2387 2387 2387 2387
Panel C: Stratification Controls + Age, Economic Status, and Baseline Values
Treatment -.057∗∗ .039∗ .063∗∗ .029 10.126∗∗∗ .006∗ .372 9.188∗∗
(.023) (.022) (.028) (.018) (3.720) (.003) (.241) (3.717)
Control Mean .391 .635 .47 .759 39.077 .003 .092 37.146Obs. 2434 2380 2380 2380 2387 2387 2387 2387
Notes: Specifications of interest are defined in the notes to Table A5 and A6. Prefers to bealone is an indicator for whether the caregiver responds that it is “Certainly true” that thegirl would rather be alone than with other youth. Meets friends outside school is anindicator for whether the girl responds that she has met with her friends outside of schoolin the last week. Has place to meet friends is an indicator for whether the girl respondsthat she has a place to meet her female friends at least once a week. Has place to stay ifneeded is an indicator for whether the girl responds that she has someone in thecommunity who would take her in for the night if her parents were out of town and sheneeded a place to stay. Time allocation measures are constructed based on girls’ responsesregarding time spent in minutes on particular activities during a typical day in the lastweek. In Column (6), Reports time on mobile is an indicator for whether the girl reportsspending any time using a mobile phone during a typical day in the last week. Standarderrors, clustered by school, in parenthesis. * significant at 10 percent level; ** significant at5 percent level; *** significant at 1 percent level.
73

Table A15: Parental Perceptions of Girls’ Strengths Index and Child Educa-tional/Employment Aspirations Index Subcomponents
(1) (2) (3) (4) (5)Willing to help Considerate Wants educ. Wants work Wants to complete
job for pay secondary
Panel A: Benchmark Specification
Treatment -.037∗ -.051∗∗ .037∗ .025 .003(.021) (.022) (.022) (.021) (.011)
Obs. 2434 2434 2387 2380 2380
Panel B: Stratification Controls Only
Treatment -.040∗∗ -.053∗∗ .032 .013 .0008(.020) (.021) (.023) (.023) (.013)
Obs. 2434 2434 2387 2380 2380
Panel C: Stratification Controls + Age, Economic Status, and Baseline Values
Treatment -.042∗∗ -.054∗∗ .033 .016 -.0008(.021) (.022) (.022) (.021) (.011)
Control Mean .813 .692 .698 .759 .932Obs. 2434 2434 2387 2380 2380
Notes: Specifications of interest are defined in the notes to Table A5 and A6. Willing tohelp is an indicator for whether the caregiver responds that it is “Certainly true” that thegirl often offers to help others. Considerate is an indicator for whether the caregiverresponds that it is “Certainly true” that the girl is considerate of other people’s feelings.Wants educated job is an indicator for whether the girl responds that when she grows upshe would like to work in a profession that requires completed higher secondary schooling.Wants work for pay is an indicator for whether the girl responds that she hopes to work forpay in the future. Wants to complete secondary is an indicator for whether the girlresponds that she wants to complete at least secondary schooling. Standard errors,clustered by school, in parenthesis. * significant at 10 percent level; ** significant at 5percent level; *** significant at 1 percent level.
74
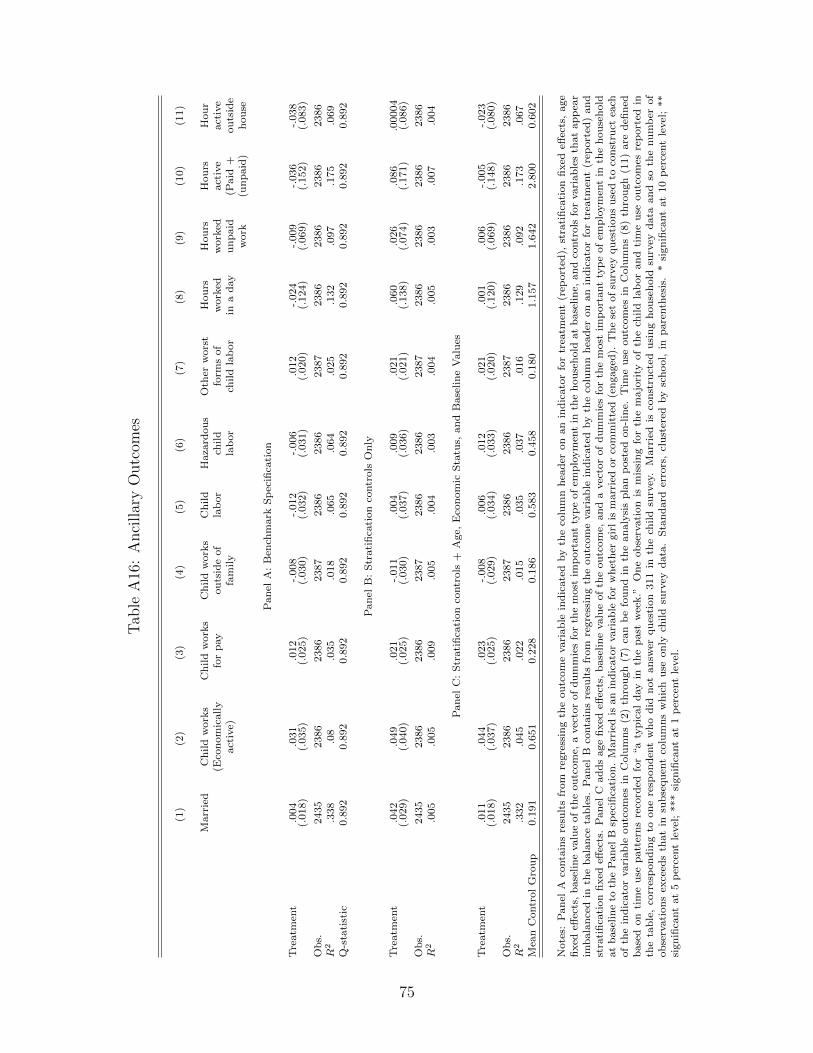
Tab
leA
16:
Anci
llar
yO
utc
omes
(1)
(2)
(3)
(4)
(5)
(6)
(7)
(8)
(9)
(10)
(11)
Marr
ied
Ch
ild
work
sC
hild
work
sC
hild
work
sC
hild
Haza
rdou
sO
ther
wors
tH
ou
rsH
ou
rsH
ou
rsH
ou
r(E
con
om
ically
for
pay
ou
tsid
eof
lab
or
child
form
sof
work
edw
ork
edact
ive
act
ive
act
ive)
fam
ily
lab
or
child
lab
or
ina
day
un
paid
(Paid
+ou
tsid
ew
ork
(un
paid
)h
ou
se
Pan
elA
:B
ench
mark
Sp
ecifi
cati
on
Tre
atm
ent
.004
.031
.012
-.008
-.012
-.006
.012
-.024
-.009
-.036
-.038
(.018)
(.035)
(.025)
(.030)
(.032)
(.031)
(.020)
(.124)
(.069)
(.152)
(.083)
Ob
s.2435
2386
2386
2387
2386
2386
2387
2386
2386
2386
2386
R2
.338
.08
.035
.018
.065
.064
.025
.132
.097
.175
.069
Q-s
tati
stic
0.8
92
0.8
92
0.8
92
0.8
92
0.8
92
0.8
92
0.8
92
0.8
92
0.8
92
0.8
92
0.8
92
Pan
elB
:S
trati
fica
tion
contr
ols
On
ly
Tre
atm
ent
.042
.049
.021
-.011
.004
.009
.021
.060
.026
.086
.00004
(.029)
(.040)
(.025)
(.030)
(.037)
(.036)
(.021)
(.138)
(.074)
(.171)
(.086)
Ob
s.2435
2386
2386
2387
2386
2386
2387
2386
2386
2386
2386
R2
.005
.005
.009
.005
.004
.003
.004
.005
.003
.007
.004
Pan
elC
:S
trati
fica
tion
contr
ols
+A
ge,
Eco
nom
icS
tatu
s,an
dB
ase
lin
eV
alu
es
Tre
atm
ent
.011
.044
.023
-.008
.006
.012
.021
.001
.006
-.005
-.023
(.018)
(.037)
(.025)
(.029)
(.034)
(.033)
(.020)
(.120)
(.069)
(.148)
(.080)
Ob
s.2435
2386
2386
2387
2386
2386
2387
2386
2386
2386
2386
R2
.332
.045
.022
.015
.035
.037
.016
.129
.092
.173
.067
Mea
nC
ontr
ol
Gro
up
0.1
91
0.6
51
0.2
28
0.1
86
0.5
83
0.4
58
0.1
80
1.1
57
1.6
42
2.8
00
0.6
02
Note
s:P
an
elA
conta
ins
resu
lts
from
regre
ssin
gth
eou
tcom
evari
ab
lein
dic
ate
dby
the
colu
mn
hea
der
on
an
ind
icato
rfo
rtr
eatm
ent
(rep
ort
ed),
stra
tifi
cati
on
fixed
effec
ts,
age
fixed
effec
ts,
base
lin
evalu
eof
the
ou
tcom
e,a
vec
tor
of
du
mm
ies
for
the
most
imp
ort
ant
typ
eof
emp
loym
ent
inth
eh
ou
seh
old
at
base
lin
e,an
dco
ntr
ols
for
vari
ab
les
that
ap
pea
rim
bala
nce
din
the
bala
nce
tab
les.
Pan
elB
conta
ins
resu
lts
from
regre
ssin
gth
eou
tcom
evari
ab
lein
dic
ate
dby
the
colu
mn
hea
der
on
an
ind
icato
rfo
rtr
eatm
ent
(rep
ort
ed)
an
dst
rati
fica
tion
fixed
effec
ts.
Pan
elC
ad
ds
age
fixed
effec
ts,
base
lin
evalu
eof
the
ou
tcom
e,an
da
vec
tor
of
du
mm
ies
for
the
most
imp
ort
ant
typ
eof
emp
loym
ent
inth
eh
ou
seh
old
at
base
lin
eto
the
Pan
elB
spec
ifica
tion
.M
arr
ied
isan
ind
icato
rvari
ab
lefo
rw
het
her
gir
lis
marr
ied
or
com
mit
ted
(en
gaged
).T
he
set
of
surv
eyqu
esti
on
su
sed
toco
nst
ruct
each
of
the
ind
icato
rvari
ab
leou
tcom
esin
Colu
mn
s(2
)th
rou
gh
(7)
can
be
fou
nd
inth
ean
aly
sis
pla
np
ost
edon
-lin
e.T
ime
use
ou
tcom
esin
Colu
mn
s(8
)th
rou
gh
(11)
are
defi
ned
base
don
tim
eu
sep
att
ern
sre
cord
edfo
r“a
typ
ical
day
inth
ep
ast
wee
k.”
On
eob
serv
ati
on
ism
issi
ng
for
the
ma
jori
tyof
the
child
lab
or
an
dti
me
use
ou
tcom
esre
port
edin
the
tab
le,
corr
esp
on
din
gto
on
ere
spon
den
tw
ho
did
not
an
swer
qu
esti
on
311
inth
ech
ild
surv
ey.
Marr
ied
isco
nst
ruct
edu
sin
gh
ou
seh
old
surv
eyd
ata
an
dso
the
nu
mb
erof
ob
serv
ati
on
sex
ceed
sth
at
insu
bse
qu
ent
colu
mn
sw
hic
hu
seon
lych
ild
surv
eyd
ata
.S
tan
dard
erro
rs,
clu
ster
edby
sch
ool,
inp
are
nth
esis
.*
signifi
cant
at
10
per
cent
level
;**
sign
ifica
nt
at
5p
erce
nt
level
;***
sign
ifica
nt
at
1p
erce
nt
level
.
75

Tab
leA
17:
Sch
ool
Dro
pou
t(L
eeB
ounds)
(1)
(2)
(3)
(4)
(5)
Surv
eydat
aA
dm
inis
trat
ive
dat
a
Whet
her
child
has
Whet
her
child
pro
gres
sed
Dro
pou
tD
rop
out
Dro
pou
tdro
pp
edou
tto
7th
grad
eG
rade
6G
rade
7G
rade
8
Tre
atm
ent
-.03
7∗.0
35∗
-.01
8-.
046∗
-.04
4∗∗
(low
erb
ound)
(.019)
(.020)
(.019)
(.024)
(.021)
Tre
atm
ent
-.03
3∗.0
49∗∗
-.00
6-.
023
-.04
2∗∗
(upp
erb
ound)
(.019)
(.021)
(.017)
(.021)
(.021)
Bou
nds-
Bas
ed95
%C
I[-
0.0
73,0
.002]
[0.0
01,0
.086]
[-0.0
51,0
.025]
[-0.0
86,0
.013]
[-0.0
85,-
0.0
01]
Ben
chm
ark
95%
CI
[-0.0
72,0
.006]
[-0.0
04,0
.077]
[-0.0
41,0
.028]
[-0.0
68,0
.017]
[-0.0
85,0
.0003]
Obs.
2433
2387
2374
2319
2455
Con
trol
Mea
n0.
132
0.86
50.
075
0.14
20.
192
Not
es:
Tab
lepre
sents
low
eran
dupp
erL
ee(2
009)
trea
tmen
teff
ect
bou
nds
bas
edon
atr
imm
ing
pro
cedure
that
assu
mes
trea
tmen
tst
atus
affec
tsse
lect
ion
mon
oton
ical
ly.
Inad
dit
ion,
we
pre
sent
ab
ounds-
bas
ed95
%co
nfiden
cein
terv
alfo
rth
etr
eatm
ent
effec
tth
atca
ptu
res
bot
hunce
rtai
nty
due
tosa
mple
attr
itio
nan
dsa
mpling
vari
atio
n,
and
we
pre
sent
the
95%
confiden
cein
terv
alfr
oma
spec
ifica
tion
that
regr
esse
sth
eou
tcom
eof
inte
rest
ontr
eatm
ent
(for
com
par
ison
).C
olum
n(1
)use
sch
ild
and
hou
sehol
den
dline
surv
eydat
a.C
olum
n(2
)use
sch
ild
endline
surv
eyon
ly.
Col
um
ns
(3)
thro
ugh
(5)
rely
onad
min
istr
ativ
edat
a.In
Col
um
ns
(3)
thro
ugh
(5),
dro
pou
tis
mea
sure
dbas
edon
whet
her
ach
ild
atte
nded
school
atth
eco
ncl
usi
onof
the
refe
rence
dsc
hool
year
.Sta
ndar
der
rors
,cl
ust
ered
by
school
,in
par
enth
esis
.*
sign
ifica
nt
at10
per
cent
leve
l;**
sign
ifica
nt
at5
per
cent
leve
l;**
*si
gnifi
cant
at1
per
cent
leve
l.
76

Table A18: Attendance, Time Allocation, and Test Scores (Lee Bounds)
(1) (2) (3) (4) (5) (6)
Panel A: Attendance (Past Week) and Time Allocation
Attendance Any Hours HoursRate Attendance studying spent
at home at school
Treatment .002 .003 -.135∗ .091(lower bound) (.011) (.006) (.081) (.187)
Treatment .039∗∗∗ .018∗∗∗ -.045 .284(upper bound) (.014) (.004) (.078) (.195)
Bounds-Based 95% CI [-0.016,0.061] [-0.007,0.026] [-0.270,0.086] [-0.223,0.612]
Benchmark 95% CI [-0.014,0.025] [-0.008,0.014] [-0.220,0.086] [-0.204,0.549]
Obs. 2089 2089 2386 2386Control Mean 0.918 0.982 1.541 7.166
Panel B: Test Scores
ASER ASER ASER GPA GPA GPAMathematics Hindi English Grade 6 Grade 7 Grade 8
Treatment -.041 .022 -.095 -.209∗∗∗ -.286∗∗ -.137(lower bound) (.083) (.095) (.094) (.080) (.113) (.130)
Treatment .006 .070 -.047 -.063 .002 .135(upper bound) (.083) (.093) (.092) (.074) (.092) (.095)
Bounds-Based 95% CI [-0.186,0.151] [-0.145,0.234] [-0.261,0.115] [-0.341,0.059] [-0.471,0.153] [-0.351,0.290]
Benchmark 95% CI [-0.175,0.132] [-0.155,0.222] [-0.255,0.106] [-0.268,0.029] [-0.303,0.061] [-0.196,0.133]
Obs. 2380 2380 2380 2178 1976 1912Control Mean 2.353 3.025 2.369 2.259 2.404 2.890
Notes: Table presents lower and upper Lee (2009) treatment effect bounds based on a trimming procedure that assumestreatment status affects selection monotonically. In addition, we present a bounds-based 95% confidence interval for thetreatment effect that captures both uncertainty due to sample attrition and sampling variation, and we present the 95%confidence interval from a specification that regresses the outcome of interest on treatment (for comparison). Columns (1) and(2) of Panel A use child endline survey data and are conditional on school being open and child not having dropped out ofschool. Attendance rate in Column (1) is the fraction of school days attended in the week prior to being surveyed and theAttendance dummy in Column (2) is an indicator for having attended any days in the past week. 298 observations are missingfor these measures because of temporary school closures. Time use outcomes in Columns (3) and (4) of Panel A are definedbased on time use patterns recorded for “a typical day in the past week.” Standard errors, clustered by school, in parenthesis.* significant at 10 percent level; ** significant at 5 percent level; *** significant at 1 percent level.
77

Table A19: Selection into Survey-Based and Administrative Test Data
(1) (2) (3) (4)ASER GPA 6 GPA 7 GPA 8
Available Available Available Available
Panel A: Selection into Test Data (Stratification controls)
Treatment 0.011 0.032 0.053∗∗ 0.069∗∗∗
(0.008) (0.022) (0.024) (0.026)
Obs. 2459 2459 2459 2459
Panel B: Selection into Test Data by Grade 5 GPA (Stratification controls)
Treatment 0.048 -0.143∗ -0.087 0.068(0.032) (0.073) (0.098) (0.111)
Treatment * Grade 5 GPA -0.011 0.053∗∗ 0.042 -0.003(0.010) (0.023) (0.031) (0.033)
Grade 5 GPA 0.011 -0.007 0.036 0.086∗∗∗
(0.008) (0.017) (0.023) (0.025)
Obs. 2356 2356 2356 2356
Panel C: Selection into Test Data by Grade 5 Attendance (Stratification controls)
Treatment 0.036 0.053 0.054 0.148∗∗
(0.022) (0.056) (0.063) (0.070)
Treatment * Grade 5 Attendance -0.031 -0.020 0.010 -0.099(0.025) (0.060) (0.072) (0.077)
Grade 5 Attendance 0.036∗ 0.134∗∗∗ 0.168∗∗∗ 0.266∗∗∗
(0.019) (0.048) (0.054) (0.058)
Obs. 2026 2026 2026 2026
Control Mean .962 .870 .778 .744
Notes: Panel A contains results from regressing the outcome variable on an indicator fortreatment and stratification fixed effects. Panels B and C contain results from regressingthe outcome variable indicated by the column header on an indicator for treatment, theinteraction of treatment with the specified characteristics, the characteristics, andstratification fixed effects. Missing observations in Panels B and C correspond to missingbaseline values of the specified characteristic. The dependent variable in Column 1 is anindicator for whether ASER test score data is available. The dependent variables inColumns 2-4 are indicators for whether administrative test scores from the specified gradeis available. Standard errors, clustered by school, in parenthesis. * significant at 10 percentlevel; ** significant at 5 percent level; *** significant at 1 percent level.
78

Table A20: Life Skills: Child Survey Measures (Lee Bounds)
(1) (2) (3) (4) (5) (6)
Panel A
Future Gender Educ. / emp. Marital Empowerment / Self-planning norms aspirations expectations agency esteem
index index index index index index
Treatment .061∗ .082∗∗ -.024 -.345∗∗∗ .082∗∗∗ .034(lower bound) (.032) (.036) (.055) (.127) (.029) (.025)
Treatment .094∗∗∗ .107∗∗∗ -.013 -.277∗∗ .106∗∗∗ .061∗∗
(upper bound) (.031) (.037) (.054) (.127) (.028) (.026)
Bounds-Based 95% CI [0.007,0.146] [0.019,0.171] [-0.127,0.088] [-0.569,-0.053] [0.033,0.153] [-0.007,0.104]
Benchmark 95% CI [0.011,0.131] [0.019,0.156] [-0.121,0.095] [-0.561,-0.072] [0.040,0.146] [-0.007,0.087]
Obs. 2380 2380 2380 2380 2380 2380
Control Mean -0.016 0.000 0.000 -0.606 -0.002 -0.001
Panel B
Freedom of Socio- Cantril’s Locus of Perceived Rosenbergmovement emotional ladder control stress self-esteem
index index index index index
Treatment .018 .060∗∗ -.094 -.101∗ -.053 -.008(lower bound) (.023) (.023) (.138) (.054) (.049) (.032)
Treatment .059∗∗ .087∗∗∗ .013 .013 .025 .028(upper bound) (.027) (.025) (.127) (.069) (.056) (.029)
Bounds-Based 95% CI [-0.027,0.110] [0.021,0.129] [-0.330,0.231] [-0.190,0.126] [-0.135,0.117] [-0.061,0.077]
Benchmark 95% CI [-0.025,0.063] [0.024,0.117] [-0.293,0.235] [-0.106,0.078] [-0.116,0.069] [-0.044,0.074]
Obs. 2380 2380 2380 2380 2380 2380Control Mean 0.000 0.000 4.513 0.000 0.000 0.000
Notes: Table presents lower and upper Lee (2009) treatment effect bounds based on a trimming procedure that assumestreatment status affects selection monotonically. In addition, we present a bounds-based 95% confidence interval for thetreatment effect that captures both uncertainty due to sample attrition and sampling variation, and we present the 95%confidence interval from a specification that regresses the outcome of interest on treatment (for comparison). Maritalexpectations index is not mean 0 because married girls are assigned the minimum value calculated for non-married girls.Detailed definitions of all referenced indices can be found in the analysis plan. Standard errors, clustered by school, inparenthesis. * significant at 10 percent level; ** significant at 5 percent level; *** significant at 1 percent level.
79

Tab
leA
21:
Lif
eSkills
:P
aren
tal
Rep
orts
,D
emon
stra
tion
Tas
ks,
and
Enum
erat
orA
sses
smen
t(L
eeB
ounds)
(1)
(2)
(3)
(4)
(5)
(6)
(7)
Pan
el
A:
Parenta
lR
ep
orts
Pare
nta
lP
are
nta
lP
are
nta
lP
are
nt
Pare
nta
lP
are
nta
lP
are
nta
lp
erce
pti
on
per
cep
tion
per
cep
tion
dau
ghte
rgen
der
sch
oolin
gm
arr
iage
of
gir
l’s
of
gir
l’s
of
free
dom
com
mu
nic
ati
on
att
itu
des
att
itu
des
att
itu
des
stre
ngth
sse
lf-e
ffica
cyof
movem
ent
Tre
atm
ent
-.047∗∗
.004
.019
-.022
-.006
.027
.013
(low
erb
ou
nd
)(.
019)
(.030)
(.030)
(.030)
(.030)
(.065)
(.032)
Tre
atm
ent
-.036∗∗
.013
.039
-.008
.007
.078∗
.030
(up
per
bou
nd
)(.
018)
(.031)
(.029)
(.028)
(.028)
(.041)
(.032)
Bou
nd
s-B
ase
d95%
CI
[-0.0
80,-
0.0
05]
[-0.0
52,0
.069]
[-0.0
33,0
.090]
[-0.0
75,0
.042]
[-0.0
60,0
.057]
[-0.0
85,0
.147]
[-0.0
42,0
.086]
Ben
chm
ark
95%
CI
[-0.0
79,-
0.0
058]
[-0.0
54,0
.062]
[-0.0
37,0
.077]
[-0.0
72,0
.042]
[-0.0
56,0
.054]
[-0.0
53,0
.115]
[-0.0
40,0
.085]
Ob
s.2434
2430
2434
2434
2434
2434
2434
Contr
ol
Mea
n0.0
00
-0.0
02
0.0
00
0.0
00
0.0
00
0.0
01
-0.0
04
Pan
el
B:
Dem
on
strati
on
Task
san
dE
nu
merato
rA
ssess
ment
Del
ay
Com
ple
ted
Mir
ror
Sca
ven
ger
Enu
mer
ato
rd
isco
unti
ng
mir
ror
dra
win
gs
hu
nt
ass
essm
ent
dra
win
gs
(sec
on
ds)
ind
exin
dex
Tre
atm
ent
-.006
.049
-4.0
06
-.177∗∗
∗.0
66
(low
erb
ou
nd
)(.
032)
(.086)
(5.6
27)
(.063)
(.053)
Tre
atm
ent
.006
.107
4.2
83
-.081
.107∗
(up
per
bou
nd
)(.
033)
(.093)
(5.1
57)
(.063)
(.058)
Bou
nd
s-B
ase
d95%
CI
[-0.0
64,0
.066]
[-0.1
00,0
.269]
[-13.3
11,1
2.8
12]
[-0.2
80,0
.023]
[-0.0
25,0
.206]
Ben
chm
ark
95%
CI
[-0.0
62,0
.065]
[-0.1
11,0
.228]
[-6.5
27,1
1.2
31]
[-0.1
95,0
.033]
[-0.0
27,0
.172]
Ob
s.2380
2387
2317
2380
2380
Contr
ol
Mea
n0.3
31
3.2
69
119.5
0.0
00
0.0
00
Note
s:T
ab
lep
rese
nts
low
eran
du
pp
erL
ee(2
009)
trea
tmen
teff
ect
bou
nd
sb
ase
don
atr
imm
ing
pro
ced
ure
that
ass
um
estr
eatm
ent
statu
saff
ects
sele
ctio
nm
on
oto
nic
ally.
Inad
dit
ion
,w
ep
rese
nt
ab
ou
nd
s-b
ase
d95%
con
fid
ence
inte
rval
for
the
trea
tmen
teff
ect
that
cap
ture
sb
oth
un
cert
ain
tyd
ue
tosa
mple
att
riti
on
an
dsa
mp
lin
gvari
ati
on
,an
dw
ep
rese
nt
the
95%
con
fid
ence
inte
rval
from
asp
ecifi
cati
on
that
regre
sses
the
ou
tcom
eof
inte
rest
on
trea
tmen
t(f
or
com
pari
son
).D
etailed
defi
nit
ions
of
all
refe
ren
ced
ind
ices
can
be
fou
nd
inth
ean
aly
sis
pla
n.
Del
ay
dis
cou
nti
ng
isan
ind
icato
rfo
rw
het
her
the
resp
on
den
tw
ou
ldp
refe
r60
Rs.
inon
ew
eek
over
30
Rs.
now
.C
om
ple
ted
mir
ror
dra
win
gs
takes
on
valu
esfr
om
zero
tofo
ur
an
dM
irro
rd
raw
ings
(sec
on
ds)
mea
sure
sth
eto
tal
nu
mb
erof
seco
nd
ssp
ent
on
mir
ror
dra
win
gs,
con
dit
ion
al
on
havin
gatt
emp
ted
at
least
on
ed
raw
ing.
Sta
nd
ard
erro
rs,
clu
ster
edby
sch
ool,
inp
are
nth
esis
.*
sign
ifica
nt
at
10
per
cent
level
;**
sign
ifica
nt
at
5p
erce
nt
level
;***
sign
ifica
nt
at
1p
erce
nt
level
.
80
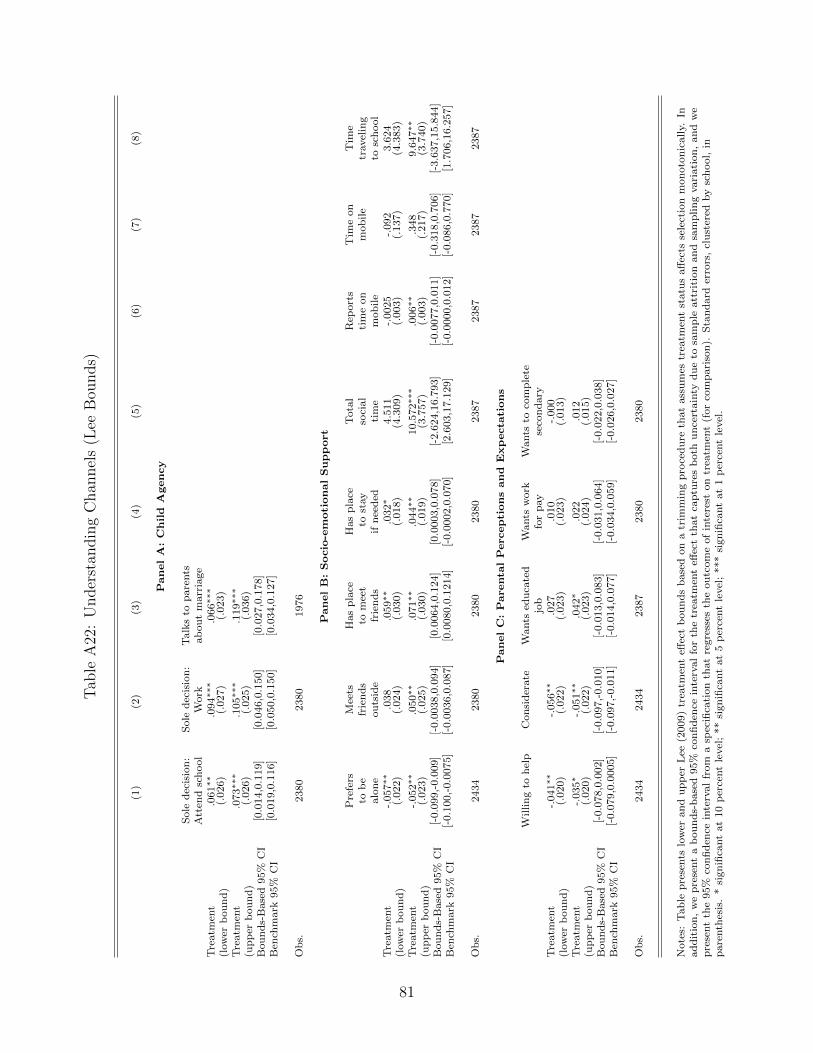
Tab
leA
22:
Under
stan
din
gC
han
nel
s(L
eeB
ounds)
(1)
(2)
(3)
(4)
(5)
(6)
(7)
(8)
Pan
el
A:
Ch
ild
Agen
cy
Sole
dec
isio
n:
Sole
dec
isio
n:
Talk
sto
pare
nts
Att
end
sch
ool
Work
ab
ou
tm
arr
iage
Tre
atm
ent
.061∗∗
.094∗∗
∗.0
66∗∗
∗
(low
erb
ou
nd
)(.
026)
(.027)
(.023)
Tre
atm
ent
.073∗∗
∗.1
05∗∗
∗.1
19∗∗
∗
(up
per
bou
nd
)(.
026)
(.025)
(.036)
Bou
nd
s-B
ase
d95%
CI
[0.0
14,0
.119]
[0.0
46,0
.150]
[0.0
27,0
.178]
Ben
chm
ark
95%
CI
[0.0
19,0
.116]
[0.0
50,0
.150]
[0.0
34,0
.127]
Ob
s.2380
2380
1976
Pan
el
B:
Socio
-em
oti
on
al
Su
pp
ort
Pre
fers
Mee
tsH
as
pla
ceH
as
pla
ceT
ota
lR
eport
sT
ime
on
Tim
eto
be
frie
nd
sto
mee
tto
stay
soci
al
tim
eon
mob
ile
travel
ing
alo
ne
ou
tsid
efr
ien
ds
ifn
eed
edti
me
mob
ile
tosc
hool
Tre
atm
ent
-.057∗∗
.038
.059∗∗
.032∗
4.5
11
-.0025
-.092
3.6
24
(low
erb
ou
nd
)(.
022)
(.024)
(.030)
(.018)
(4.3
09)
(.003)
(.137)
(4.3
83)
Tre
atm
ent
-.052∗∗
.050∗∗
.071∗∗
.044∗∗
10.5
72∗∗
∗.0
06∗∗
.348
9.6
47∗∗
(up
per
bou
nd
)(.
023)
(.025)
(.030)
(.019)
(3.7
57)
(.003)
(.217)
(3.7
40)
Bou
nd
s-B
ase
d95%
CI
[-0.0
99,-
0.0
09]
[-0.0
038,0
.094]
[0.0
064,0
.124]
[0.0
003,0
.078]
[-2.6
24,1
6.7
93]
[-0.0
077,0
.011]
[-0.3
18,0
.706]
[-3.6
37,1
5.8
44]
Ben
chm
ark
95%
CI
[-0.1
00,-
0.0
075]
[-0.0
036,0
.087]
[0.0
080,0
.1214]
[-0.0
002,0
.070]
[2.6
03,1
7.1
29]
[-0.0
000,0
.012]
[-0.0
86,0
.770]
[1.7
06,1
6.2
57]
Ob
s.2434
2380
2380
2380
2387
2387
2387
2387
Pan
el
C:
Parenta
lP
ercep
tion
san
dE
xp
ecta
tion
s
Willin
gto
hel
pC
on
sid
erate
Wants
edu
cate
dW
ants
work
Wants
toco
mp
lete
job
for
pay
seco
nd
ary
Tre
atm
ent
-.041∗∗
-.056∗∗
.027
.010
-.000
(low
erb
ou
nd
)(.
020)
(.022)
(.023)
(.023)
(.013)
Tre
atm
ent
-.035∗
-.051∗∗
.042∗
.022
.012
(up
per
bou
nd
)(.
020)
(.022)
(.023)
(.024)
(.015)
Bou
nd
s-B
ase
d95%
CI
[-0.0
78,0
.002]
[-0.0
97,-
0.0
10]
[-0.0
13,0
.083]
[-0.0
31,0
.064]
[-0.0
22,0
.038]
Ben
chm
ark
95%
CI
[-0.0
79,0
.0005]
[-0.0
97,-
0.0
11]
[-0.0
14,0
.077]
[-0.0
34,0
.059]
[-0.0
26,0
.027]
Ob
s.2434
2434
2387
2380
2380
Note
s:T
ab
lep
rese
nts
low
eran
du
pp
erL
ee(2
009)
trea
tmen
teff
ect
bou
nd
sb
ase
don
atr
imm
ing
pro
ced
ure
that
ass
um
estr
eatm
ent
statu
saff
ects
sele
ctio
nm
on
oto
nic
ally.
Inad
dit
ion
,w
ep
rese
nt
ab
ou
nd
s-b
ase
d95%
con
fid
ence
inte
rval
for
the
trea
tmen
teff
ect
that
cap
ture
sb
oth
un
cert
ain
tyd
ue
tosa
mple
att
riti
on
an
dsa
mp
lin
gvari
ati
on
,an
dw
ep
rese
nt
the
95%
con
fid
ence
inte
rval
from
asp
ecifi
cati
on
that
regre
sses
the
ou
tcom
eof
inte
rest
on
trea
tmen
t(f
or
com
pari
son
).S
tan
dard
erro
rs,
clu
ster
edby
sch
ool,
inp
are
nth
esis
.*
sign
ifica
nt
at
10
per
cent
level
;**
sign
ifica
nt
at
5p
erce
nt
level
;***
sign
ifica
nt
at
1p
erce
nt
level
.
81

Table A23: Life Skills (Child Survey): Heterogeneous Effects by Social Desirability
(1) (2) (3) (4) (5) (6)
Panel A
Future Gender Educ. / emp. Marital Empowerment / Self-planning norms aspirations expectations agency esteem
index index index index index index
Treatment .076 .094∗∗ .021 -.138 .059 .025(.047) (.044) (.061) (.118) (.037) (.044)
Treatment·Above Median -.011 -.003 .0002 -.070 .061 .014(.053) (.042) (.065) (.123) (.038) (.046)
Above Median .166∗∗∗ .105∗∗∗ .192∗∗∗ .325∗∗∗ .020 .080∗∗∗(.040) (.032) (.049) (.075) (.029) (.029)
Obs. 2333 2333 2333 2333 2333 2333
Panel B
Freedom of Socio- Cantril’s Locus of Perceived Rosenbergmovement emotional ladder control stress self-esteem
index index index index index
Treatment -.024 .080∗∗∗ -.012 -.020 -.011 .032(.039) (.030) (.174) (.071) (.070) (.037)
Treatment·Above Median .070∗ -.023 .055 .001 -.017 -.016(.039) (.037) (.187) (.083) (.085) (.039)
Above Median .007 .099∗∗∗ .107 .010 -.055 .013(.026) (.024) (.127) (.066) (.075) (.032)
Obs. 2333 2333 2333 2333 2333 2333
Notes: Table contains results from regressing the outcome variable indicated by the column header on an indicator fortreatment (reported), the interaction of treatment with an indicator for at or above-median social desirability index responses(reported), an indicator for at or above-median social desirability index responses (reported), stratification fixed effects, agefixed effects, baseline value of the outcome, a vector of dummies for the most important type of employment in the householdat baseline, and controls for variables that appear imbalanced in the balance tables. For Columns (4) through (6) of Panel Breporting measures added at endline, we control for lagged values of overall life skills indices. The social desirability index isconstructed from three baseline variables: (1) an indicator for whether the girl reports that she wants to become a“Teacher/School head/Educator” when she grows up, (2) an indicator for whether she reports that she is currently living “thebest possible life”, and (3) an indicator for whether the surveyor recorded that the girl paid close attention “the whole time”when receiving instructions. Detailed definitions of all referenced indices can be found in the analysis plan. Standard errors,clustered by school, in parenthesis. * significant at 10 percent level; ** significant at 5 percent level; *** significant at 1percent level.
82

Tab
leA
24:
Lif
eSkills
(Oth
er):
Het
erog
eneo
us
Eff
ects
by
Soci
alD
esir
abilit
y
Pan
el
A:
Parenta
lR
ep
orts
Pare
nta
lP
are
nta
lP
are
nta
lP
are
nt
Pare
nta
lP
are
nta
lP
are
nta
lp
erce
pti
on
per
cep
tion
per
cep
tion
dau
ghte
rgen
der
sch
ooli
ng
marr
iage
of
gir
l’s
of
gir
l’s
of
free
dom
com
mu
nic
ati
on
att
itu
des
att
itu
des
att
itu
des
stre
ngth
sse
lf-e
ffica
cyof
movem
ent
(1)
(2)
(3)
(4)
(5)
(6)
(7)
Tre
atm
ent
-.063∗∗
-.023
.002
.010
.040
.041
.038
(.030)
(.045)
(.047)
(.042)
(.031)
(.054)
(.045)
Tre
atm
ent·
Ab
ove
Med
ian
.036
.045
.043
-.028
-.047
-.0005
-.025
(.033)
(.047)
(.044)
(.042)
(.033)
(.057)
(.049)
Ab
ove
Med
ian
.003
.044
.058∗
.067∗∗
.071∗∗
∗.1
24∗∗
∗.0
65∗∗
(.022)
(.037)
(.030)
(.033)
(.023)
(.039)
(.029)
Ob
s.2376
2374
2376
2376
2376
2376
2376
Pan
el
B:
Dem
on
strati
on
Task
san
dE
nu
merato
rA
ssess
ment
Del
ay
Com
ple
ted
Mir
ror
Sca
ven
ger
Enu
mer
ato
rd
isco
unti
ng
mir
ror
dra
win
gs
hu
nt
ass
essm
ent
dra
win
gs
(sec
on
ds)
ind
exin
dex
(1)
(2)
(3)
(4)
(5)
Tre
atm
ent
-.040
.018
-.488
-.092
.094
(.036)
(.109)
(6.2
98)
(.080)
(.081)
Tre
atm
ent·
Ab
ove
Med
ian
.064∗
.071
5.0
12
.031
.000
(.038)
(.119)
(7.1
96)
(.083)
(.084)
Ab
ove
Med
ian
.004
.082
8.0
55∗
.103∗
.098
(.024)
(.088)
(4.7
41)
(.058)
(.067)
Ob
s.2333
2340
2273
2333
2333
Note
s:T
ab
leco
nta
ins
resu
lts
from
regre
ssin
gth
eou
tcom
evari
ab
lein
dic
ate
dby
the
colu
mn
hea
der
on
an
ind
icato
rfo
rtr
eatm
ent
(rep
ort
ed),
the
inte
ract
ion
of
trea
tmen
tw
ith
an
ind
icato
rfo
rat
or
ab
ove-
med
ian
soci
al
des
irab
ilit
yin
dex
resp
on
ses
(rep
ort
ed),
an
ind
icato
rfo
rat
or
ab
ove-
med
ian
soci
al
des
irab
ilit
yin
dex
resp
on
ses
(rep
ort
ed),
an
dco
ntr
ols
as
des
crib
edin
the
spec
ifica
tion
inT
ab
le1.
Th
eso
cial
des
irab
ilit
yin
dex
isco
nst
ruct
edfr
om
thre
eb
ase
lin
evari
ab
les:
(1)
an
ind
icato
rfo
rw
het
her
the
gir
lre
port
sth
at
she
wants
tob
ecom
ea
“T
each
er/S
chool
hea
d/E
du
cato
r”w
hen
she
gro
ws
up
,(2
)an
ind
icato
rfo
rw
het
her
she
rep
ort
sth
at
she
iscu
rren
tly
livin
g“th
eb
est
poss
ible
life
”,
an
d(3
)an
ind
icato
rfo
rw
het
her
the
surv
eyor
reco
rded
that
the
gir
lp
aid
close
att
enti
on
“th
ew
hole
tim
e”w
hen
rece
ivin
gin
stru
ctio
ns.
Det
ailed
defi
nit
ion
sof
all
refe
ren
ced
ind
ices
can
be
fou
nd
inth
ean
aly
sis
pla
np
ost
edon
-lin
e.Sta
nd
ard
erro
rs,
clu
ster
edby
sch
ool,
inp
are
nth
esis
.*
sign
ifica
nt
at
10
per
cent
level
;**
sign
ifica
nt
at
5p
erce
nt
level
;***
sign
ifica
nt
at
1p
erce
nt
level
.
83

Tab
leA
25:
Sch
ool
Dro
pou
t:H
eter
ogen
eous
Eff
ects
by
Dro
pou
tP
rop
ensi
ty
(1)
(2)
(3)
(4)
(5)
(6)
(7)
Su
rvey
data
Ad
min
istr
ati
ve
data
Wh
eth
erch
ild
has
Wh
eth
erch
ild
pro
gre
ssed
Dro
pou
tD
rop
ou
tD
rop
ou
tD
rop
ou
tD
rop
ou
td
rop
ped
out
to7th
gra
de
Gra
de
6G
rad
e7
Gra
de
8G
rad
e9
Ind
ex
Tre
atm
ent
.004
-.003
.001
-.016
-.020
-.027
-.015
(.012)
(.013)
(.013)
(.016)
(.017)
(.025)
(.012)
Tre
atm
ent·
Ab
ove
Med
ian
-.086∗∗
∗.0
82∗∗
∗-.
016
-.021
-.053∗
-.044
-.044∗∗
(.028)
(.030)
(.022)
(.028)
(.028)
(.035)
(.022)
Ab
ove
Med
ian
.134∗∗
∗-.
143∗∗
∗.0
44∗∗
.102∗∗
∗.1
37∗∗
∗.1
20∗∗
∗.1
12∗∗
∗(.
027)
(.029)
(.019)
(.028)
(.027)
(.030)
(.022)
Ob
s.2391
2359
2318
2262
2398
2174
2399
Note
s:T
ab
leco
nta
ins
resu
lts
from
regre
ssin
gth
eou
tcom
evari
ab
lein
dic
ate
dby
the
colu
mn
hea
der
on
an
ind
icato
rfo
rtr
eatm
ent
(rep
ort
ed),
the
inte
ract
ion
of
trea
tmen
tw
ith
an
ind
icato
rfo
rat
or
ab
ove-
med
ian
dro
pou
tp
rop
ensi
ty(r
eport
ed),
an
ind
icato
rfo
rat
or
ab
ove-
med
ian
dro
pou
tp
rop
ensi
ty(r
eport
ed),
Tab
leco
nta
ins
resu
lts
from
regre
ssin
gth
eou
tcom
evari
ab
lein
dic
ate
dby
the
colu
mn
hea
der
on
an
ind
icato
rfo
rtr
eatm
ent
(rep
ort
ed),
the
inte
ract
ion
of
trea
tmen
tw
ith
an
ind
icato
rfo
rat
or
ab
ove-
med
ian
soci
al
des
irab
ilit
yin
dex
resp
on
ses
(rep
ort
ed),
an
ind
icato
rfo
rat
or
ab
ove-
med
ian
soci
al
des
irab
ilit
yin
dex
resp
on
ses
(rep
ort
ed),
an
dco
ntr
ols
as
des
crib
edin
the
spec
ifica
tion
inT
ab
le1.
Colu
mn
(1)
use
sch
ild
an
dh
ou
seh
old
end
lin
esu
rvey
data
.T
hes
ed
ata
wer
eco
llec
ted
at
the
start
of
eighth
gra
de
for
gir
lsw
ho
pro
gre
ssed
on
egra
de
level
each
yea
r.C
olu
mn
s(2
)u
ses
child
end
lin
esu
rvey
on
ly.
Colu
mn
s(3
)th
rou
gh
(6)
rely
on
ad
min
istr
ati
ve
data
.In
Colu
mn
s(3
)th
rou
gh
(5),
dro
pou
tis
mea
sure
db
ase
don
wh
eth
era
child
att
end
edsc
hool
at
the
con
clu
sion
of
the
refe
ren
ced
sch
ool
yea
r.In
Colu
mn
(6),
dro
pou
tis
mea
sure
db
ase
don
wh
eth
era
child
att
end
edsc
hool
du
rin
gth
ep
ast
wee
k(c
on
dit
ion
al
on
the
sch
ool
bei
ng
op
en).
Th
eC
olu
mn
(7)
dro
pou
tin
dex
isco
nst
ruct
edas
the
aver
age
of
the
ou
tcom
evari
ab
les
incl
ud
edin
Colu
mn
s(1
),(3
),(4
),(5
),an
d(6
).C
olu
mn
s(6
)th
rou
gh
(7)
incl
ud
ea
set
of
fixed
effec
tsfo
rth
enu
mb
erof
days
that
the
sch
ool
was
op
enin
the
wee
kb
efore
ad
min
istr
ati
ve
data
collec
tion
ingra
de
nin
e.D
rop
ou
tp
rop
ensi
tyis
con
stru
cted
by
pre
dic
tin
gen
dlin
esu
rvey
dro
pou
tin
the
contr
ol
gro
up
as
afl
exib
lefu
nct
ion
of
base
lin
eage,
base
lin
e(fi
fth
gra
de)
GP
A,
base
lin
eatt
end
an
cera
te,
an
db
ase
lin
eti
me
spen
tso
cializi
ng.
Pre
dic
ted
dro
pou
tp
rop
ensi
tyfo
rgir
lsass
ign
edto
trea
tmen
tis
det
erm
ined
by
the
dro
pou
tp
rop
ensi
tyca
lcu
late
dw
ith
inth
esu
bse
tof
contr
ol
gro
up
gir
lsw
ith
matc
hin
gco
vari
ate
valu
es.
Ad
dit
ion
al
det
ails
are
pro
vid
edin
Ap
pen
dix
Sec
tion
A.5
.S
tan
dard
erro
rs,
clu
ster
edby
sch
ool,
inp
are
nth
esis
.*
sign
ifica
nt
at
10
per
cent
level
;**
sign
ifica
nt
at
5p
erce
nt
level
;***
sign
ifica
nt
at
1p
erce
nt
level
.
84

Table A26: Attendance (Last Week) and Time Allocation: Heterogeneous Effects by DropoutPropensity
(1) (2) (3) (4)Attendance Attendance Hours studying Total hours spent
rate dummy at home at school
Treatment .0005 -.0005 -.056 -.096(.010) (.006) (.106) (.199)
Treatment·Above Median .002 .005 .015 .485∗(.016) (.012) (.113) (.291)
Above Median .0002 -.007 -.207∗∗ -.984∗∗∗(.013) (.009) (.104) (.270)
Obs. 2062 2062 2358 2358
Notes: Table contains results from regressing the outcome variable indicated by the column header on an indicator fortreatment (reported), the interaction of treatment with an indicator for at or above-median dropout propensity (reported), anindicator for at or above-median dropout propensity (reported), and controls as described in the specification in Table 1. Timeuse outcomes in Columns (3) and (4) are defined based on time use patterns recorded for “a typical day in the past week.”Dropout propensity is constructed by predicting endline survey dropout in the control group as a flexible function of baselineage, baseline (fifth grade) GPA, baseline attendance rate, and baseline time spent socializing. Predicted dropout propensityfor girls assigned to treatment is determined by the dropout propensity calculated within the subset of control group girlswith matching covariate values. Additional details are provided in Appendix Section A.5. Standard errors, clustered byschool, in parenthesis. * significant at 10 percent level; ** significant at 5 percent level; *** significant at 1 percent level.
85

Tab
leA
27:
Cog
nit
ive
Skills
:H
eter
ogen
eous
Eff
ects
by
Dro
pou
tP
rop
ensi
ty
(1)
(2)
(3)
(4)
(5)
(6)
Su
rvey
data
Ad
min
istr
ati
ve
data
AS
ER
AS
ER
AS
ER
GP
AG
PA
GP
AM
ath
emati
csH
ind
iE
nglish
Gra
de
6G
rad
e7
Gra
de
8
Tre
atm
ent
-.067
-.014
-.079
-.152∗
-.138
-.002
(.087)
(.094)
(.097)
(.083)
(.122)
(.102)
Tre
atm
ent·
Ab
ove
Med
ian
.114
.086
.039
-.010
-.026
-.056
(.098)
(.111)
(.109)
(.063)
(.081)
(.075)
Ab
ove
Med
ian
-.513∗∗
∗-.
699∗∗
∗-.
631∗∗
∗-.
071
.004
-.097
(.080)
(.107)
(.102)
(.053)
(.057)
(.065)
Ob
s.2352
2352
2352
2134
1941
1879
Note
s:T
ab
leco
nta
ins
resu
lts
from
regre
ssin
gth
eou
tcom
evari
ab
lein
dic
ate
dby
the
colu
mn
hea
der
on
an
ind
icato
rfo
rtr
eatm
ent
(rep
ort
ed),
the
inte
ract
ion
of
trea
tmen
tw
ith
an
ind
icato
rfo
rat
or
ab
ove-
med
ian
dro
pou
tp
rop
ensi
ty(r
eport
ed),
an
ind
icato
rfo
rat
or
ab
ove-
med
ian
dro
pou
tp
rop
ensi
ty(r
eport
ed),
an
dco
ntr
ols
as
des
crib
edin
the
spec
ifica
tion
inT
ab
le1.
InC
olu
mn
s1-3
,co
ntr
ols
for
base
lin
eou
tcom
evalu
esca
nn
ot
be
incl
ud
edsi
nce
cogn
itiv
ete
sts
wer
en
ot
con
du
cted
at
base
lin
e;w
ein
stea
din
clu
de
contr
ols
for
base
lin
esc
hool
dro
pou
tst
atu
s,att
end
an
ce,
gra
de
pro
gre
ssio
n,
tim
esp
ent
stu
dyin
g,
hou
rssp
ent
on
sch
ool,
an
dgra
des
as
rep
ort
edin
gra
de
five.
AS
ER
test
score
ou
tcom
esin
Colu
mn
s(1
)th
rou
gh
(3)
an
dG
PA
ou
tcom
esin
Colu
mn
s(4
)th
rou
gh
(6)
take
on
valu
esb
etw
een
zero
an
dfo
ur.
Dro
pou
tp
rop
ensi
tyis
con
stru
cted
by
pre
dic
tin
gen
dlin
esu
rvey
dro
pou
tin
the
contr
ol
gro
up
as
afl
exib
lefu
nct
ion
of
base
lin
eage,
base
lin
e(fi
fth
gra
de)
GP
A,
base
lin
eatt
end
an
cera
te,
an
db
ase
lin
eti
me
spen
tso
cializi
ng.
Pre
dic
ted
dro
pou
tp
rop
ensi
tyfo
rgir
lsass
ign
edto
trea
tmen
tis
det
erm
ined
by
the
dro
pou
tp
rop
ensi
tyca
lcu
late
dw
ith
inth
esu
bse
tof
contr
ol
gro
up
gir
lsw
ith
matc
hin
gco
vari
ate
valu
es.
Ad
dit
ion
al
det
ails
are
pro
vid
edin
Ap
pen
dix
Sec
tion
A.5
.S
tan
dard
erro
rs,
clu
ster
edby
sch
ool,
inp
are
nth
esis
.*
sign
ifica
nt
at
10
per
cent
level
;**
sign
ifica
nt
at
5p
erce
nt
level
;***
sign
ifica
nt
at
1p
erce
nt
level
.
86

Table A28: Life Skills (Child Survey): Heterogeneous Effects by Dropout Propensity
(1) (2) (3) (4) (5) (6)
Panel A
Future Gender Educ. / emp. Marital Empowerment / Self-planning norms aspirations expectations agency esteem
index index index index index index
Treatment .060∗ .073∗ -.047 -.269∗∗∗ .114∗∗∗ -.018(.036) (.041) (.048) (.097) (.034) (.028)
Treatment·Above Median .016 .039 .116 .172 -.025 .102∗∗∗(.052) (.047) (.074) (.114) (.038) (.037)
Above Median -.172∗∗∗ -.125∗∗∗ -.264∗∗∗ -.219∗∗ .001 -.132∗∗∗(.045) (.040) (.057) (.092) (.031) (.033)
Obs. 2352 2352 2352 2352 2352 2352
Panel B
Freedom of Socio- Cantril’s Locus of Perceived Rosenbergmovement emotional ladder control stress self-esteem
index index index index index
Treatment .017 .056∗ .062 .042 -.012 .006(.023) (.032) (.171) (.064) (.066) (.037)
Treatment·Above Median .006 .011 -.074 -.119 -.037 .028(.039) (.038) (.173) (.075) (.084) (.042)
Above Median -.034 -.044 -.078 .181∗∗∗ -.034 -.047(.031) (.029) (.148) (.063) (.068) (.036)
Obs. 2352 2352 2352 2352 2352 2352
Notes: Table contains results from regressing the outcome variable indicated by the column header on an indicator fortreatment (reported), the interaction of treatment with an indicator for at or above-median dropout propensity (reported), anindicator for at or above-median dropout propensity (reported), and controls as described in the specification in Table 1. ForColumns (4) through (6) of Panel B reporting measures added at endline, we control for lagged values of overall life skillsindices. Dropout propensity is constructed by predicting endline survey dropout in the control group as a flexible function ofbaseline age, baseline (fifth grade) GPA, baseline attendance rate, and baseline time spent socializing. Predicted dropoutpropensity for girls assigned to treatment is determined by the dropout propensity calculated within the subset of controlgroup girls with matching covariate values. Additional details are provided in Appendix Section A.5. Detailed definitions ofall referenced indices can be found in the analysis plan. Standard errors, clustered by school, in parenthesis. * significant at 10percent level; ** significant at 5 percent level; *** significant at 1 percent level.
87

Tab
leA
29:
Lif
eSkills
(Oth
er):
Het
erog
eneo
us
Eff
ects
by
Dro
pou
tP
rop
ensi
ty
Pan
el
A:
Parenta
lR
ep
orts
Pare
nta
lP
are
nta
lP
are
nta
lP
are
nt
Pare
nta
lP
are
nta
lP
are
nta
lp
erce
pti
on
per
cep
tion
per
cep
tion
dau
ghte
rgen
der
sch
ooli
ng
marr
iage
of
gir
l’s
of
gir
l’s
of
free
dom
com
mu
nic
ati
on
att
itu
des
att
itu
des
att
itu
des
stre
ngth
sse
lf-e
ffica
cyof
movem
ent
(1)
(2)
(3)
(4)
(5)
(6)
(7)
Tre
atm
ent
-.056∗∗
.011
.066∗
-.022
-.003
-.022
-.001
(.026)
(.038)
(.038)
(.035)
(.034)
(.043)
(.037)
Tre
atm
ent·
Ab
ove
Med
ian
.030
-.001
-.060
.022
.024
.121∗∗
.044
(.028)
(.044)
(.042)
(.038)
(.037)
(.060)
(.042)
Ab
ove
Med
ian
-.043∗
-.041
.014
-.030
-.059∗∗
-.264∗∗
∗-.
072∗∗
(.022)
(.038)
(.031)
(.031)
(.028)
(.048)
(.036)
Ob
s.2391
2387
2391
2391
2391
2391
2391
Pan
el
B:
Dem
on
strati
on
Task
san
dE
nu
merato
rA
ssess
ment
Del
ay
Com
ple
ted
Mir
ror
Sca
ven
ger
Enu
mer
ato
rd
isco
unti
ng
mir
ror
dra
win
gs
hu
nt
ass
essm
ent
dra
win
gs
(sec
on
ds)
ind
exin
dex
(1)
(2)
(3)
(4)
(5)
Tre
atm
ent
-.004
.058
1.1
71
-.134∗∗
.041
(.041)
(.117)
(6.8
93)
(.067)
(.064)
Tre
atm
ent·
Ab
ove
Med
ian
.015
.021
2.1
19
.123
.113
(.045)
(.125)
(7.8
08)
(.080)
(.073)
Ab
ove
Med
ian
-.057
-.094
-11.0
55∗∗
-.245∗∗
∗-.
229∗∗
∗(.
036)
(.106)
(4.6
37)
(.067)
(.057)
Ob
s.2352
2359
2289
2352
2352
Note
s:T
ab
leco
nta
ins
resu
lts
from
regre
ssin
gth
eou
tcom
evari
ab
lein
dic
ate
dby
the
colu
mn
hea
der
on
an
ind
icato
rfo
rtr
eatm
ent
(rep
ort
ed),
the
inte
ract
ion
of
trea
tmen
tw
ith
an
ind
icato
rfo
rat
or
ab
ove-
med
ian
dro
pou
tp
rop
ensi
ty(r
eport
ed),
an
ind
icato
rfo
rat
or
ab
ove-
med
ian
dro
pou
tp
rop
ensi
ty(r
eport
ed),
an
dco
ntr
ols
as
des
crib
edin
the
spec
ifica
tion
inT
ab
le1.
Dro
pou
tp
rop
ensi
tyis
con
stru
cted
by
pre
dic
tin
gen
dlin
esu
rvey
dro
pou
tin
the
contr
ol
gro
up
as
afl
exib
lefu
nct
ion
of
base
lin
eage,
base
lin
e(fi
fth
gra
de)
GP
A,
base
lin
eatt
end
an
cera
te,
an
db
ase
lin
eti
me
spen
tso
cializi
ng.
Pre
dic
ted
dro
pou
tp
rop
ensi
tyfo
rgir
lsass
ign
edto
trea
tmen
tis
det
erm
ined
by
the
dro
pou
tp
rop
ensi
tyca
lcu
late
dw
ith
inth
esu
bse
tof
contr
ol
gro
up
gir
lsw
ith
matc
hin
gco
vari
ate
valu
es.
Ad
dit
ion
al
det
ails
are
pro
vid
edin
Ap
pen
dix
Sec
tion
A.5
.F
or
all
incl
ud
edin
dic
es,
we
firs
tta
ke
the
diff
eren
ceb
etw
een
each
com
pon
ent
surv
eyre
spon
sevalu
ean
dth
em
ean
wit
hin
the
contr
ol
gro
up
and
then
div
ide
by
the
contr
ol
gro
up
stan
dard
dev
iati
on
.W
eth
enaver
age
over
all
ind
exco
mp
on
ents
,en
suri
ng
that
valu
esfo
rea
chco
mp
on
ent
are
con
stru
cted
soth
at
the
ind
exin
terp
reta
tion
isco
nsi
sten
t.D
etailed
defi
nit
ion
sof
all
refe
ren
ced
ind
ices
can
be
fou
nd
inth
ean
aly
sis
pla
np
ost
edon
-lin
e.S
tan
dard
erro
rs,
clu
ster
edby
sch
ool,
inp
are
nth
esis
.*
sign
ifica
nt
at
10
per
cent
level
;**
sign
ifica
nt
at
5p
erce
nt
level
;***
sign
ifica
nt
at
1p
erce
nt
level
.
88

Tab
leA
30:
Under
stan
din
gC
han
nel
s:H
eter
ogen
eous
Eff
ects
by
Dro
pou
tP
rop
ensi
ty
(1)
(2)
(3)
(4)
(5)
(6)
(7)
(8)
Pan
el
A:
Ch
ild
Agen
cy
Sole
dec
isio
n:
Sole
dec
isio
n:
Talk
sto
pare
nts
Att
end
sch
ool
Work
ab
ou
tm
arr
iage
Tre
atm
ent
.086∗∗
∗.0
75∗∗
.085∗∗
(.032)
(.034)
(.033)
Tre
atm
ent·
Ab
ove
Med
ian
-.027
.063
.002
(.043)
(.041)
(.040)
Ab
ove
Med
ian
.011
-.059∗
-.049∗
(.034)
(.032)
(.027)
Ob
s.2352
2352
1951
Pan
el
B:
Socio
-em
oti
on
al
Su
pp
ort
Pre
fers
Mee
tsH
as
pla
ceH
as
pla
ceT
ota
lR
eport
sT
ime
on
Tim
eto
be
frie
nd
sto
mee
tto
stay
soci
al
tim
eon
mob
ile
travel
ing
alo
ne
ou
tsid
efr
ien
ds
ifn
eed
edti
me
mob
ile
tosc
hool
Tre
atm
ent
-.034
.069∗∗
.067∗
.030
11.6
78∗∗
.008
.636
10.8
06∗∗
(.032)
(.028)
(.035)
(.024)
(5.0
25)
(.005)
(.464)
(4.9
37)
Tre
atm
ent·
Ab
ove
Med
ian
-.040
-.069∗
-.013
-.006
-4.2
41
-.002
-.487
-4.2
17
(.041)
(.036)
(.037)
(.035)
(4.7
47)
(.007)
(.499)
(4.6
57)
Ab
ove
Med
ian
-.022
.052∗
.055∗
-.039
-11.7
46∗∗
∗.0
03
.172
-11.7
49∗∗
∗(.
035)
(.030)
(.029)
(.031)
(3.4
00)
(.004)
(.172)
(3.2
55)
Ob
s.2391
2352
2352
2352
2359
2359
2359
2359
Pan
el
C:
Parenta
lP
ercep
tion
san
dE
xp
ecta
tion
s
Willin
gto
hel
pC
on
sid
erate
Wants
edu
cate
dW
ants
work
Wants
toco
mp
lete
job
for
pay
seco
nd
ary
Tre
atm
ent
-.081∗∗
∗-.
053∗
.027
.004
-.003
(.026)
(.031)
(.027)
(.026)
(.011)
Tre
atm
ent·
Ab
ove
Med
ian
.083∗∗
∗.0
06
.018
.038
.009
(.030)
(.038)
(.033)
(.039)
(.023)
Ab
ove
Med
ian
-.054∗∗
-.001
-.080∗∗
∗-.
105∗∗
∗-.
051∗∗
∗(.
026)
(.036)
(.025)
(.029)
(.019)
Ob
s.2391
2391
2359
2352
2352
Note
s:T
ab
leco
nta
ins
resu
lts
from
regre
ssin
gth
eou
tcom
evari
ab
lein
dic
ate
dby
the
colu
mn
hea
der
on
an
ind
icato
rfo
rtr
eatm
ent
(rep
ort
ed),
the
inte
ract
ion
of
trea
tmen
tw
ith
an
ind
icato
rfo
rat
or
ab
ove-
med
ian
dro
pou
tp
rop
ensi
ty(r
eport
ed),
an
ind
icato
rfo
rat
or
ab
ove-
med
ian
dro
pou
tp
rop
ensi
ty(r
eport
ed),
an
dco
ntr
ols
as
des
crib
edin
the
spec
ifica
tion
inT
ab
le1.
Sta
nd
ard
erro
rs,
clu
ster
edby
sch
ool,
inp
are
nth
esis
.*
sign
ifica
nt
at
10
per
cent
level
;**
sign
ifica
nt
at
5p
erce
nt
level
;***
sign
ifica
nt
at
1p
erce
nt
level
.
89