Advancing Employee Productivity An invaluable Guide for
81
Advancing Employee Productivity An invaluable Guide for Business Managers to get the pulse of productivity improvement and work measurement. WORK MEASUREMENT AND PRODUCTIVITY IMPROVEMENT Dr. Subhash Naik Head-Asset Optimization & Industrial Engineering, SGL, Goa. And Mr Micheal Sony Industrial Engineering Practitioner, GEB, Goa
-
Upload
goauniversity -
Category
Documents
-
view
4 -
download
0
Transcript of Advancing Employee Productivity An invaluable Guide for

Advancing Employee
Productivity
An invaluable Guide for
Business Managers to
get the pulse of
productivity
improvement and work
measurement.
WORK MEASUREMENT
AND
PRODUCTIVITY IMPROVEMENT
Dr. Subhash Naik
Head-Asset Optimization
& Industrial Engineering,
SGL, Goa.
And
Mr Micheal Sony
Industrial Engineering
Practitioner, GEB, Goa

© 2011-2012 ijmst.com. All rights reserved.
This publication is provided for you in portable document format (PDF) and sold to you under license and may be
used or copied only in accordance with the terms of the license.
Printing and Photocopying The Personal Edition License allows you to make a reasonable number of print outs of the PDF and photocop
ies thereof for your personal use. The Personal Edition License expressly forbids the making of copies, either
by printing or photocopying, and the distribution of such copies for the use, of others, whatsoever that use
may be.
Republication You shall not republish the content in any publication including, but not limited to, print, Web, and CD-ROM. You
shall not republish the content and/or offer it for sale or subscription. You shall not make available this PDF on any
internal or external organizational network and/ or shared network system, for use/ access by others, other than
yourself, the named purchaser.
Modification Prohibited You shall have no right to modify or change in any manner the content delivered to you hereunder or create any
derivative works therefrom. You shall not append to the content any other text or images.
Warranty Content is licensed "as is."www.ijmst.com makes no representations or warranties of any kind with respect to the
content or your use of the content. ijmst.com shall bear no liability during or after the term of this agreement with
respect thereto.

Contents Introduction ... ................................................................................................................................................ ... 5
The aim of this guide ... ......................................................................................................................... ... 5
Who this guide is for ... ............................................................................................................................ . 5
How to use this guide ... ......................................................................................................................... . 5
1. What is productivity? ... ........................................................................................................................... ... 9
Production ... ............................................................................................................................................ .. 9
Service Operations ... .......................................................................................................................... .. 10
Productivity ... ....................................................................................................................................... ... 11
Improving Productivity ... .................................................................................................................... .. 12
Section Review ... ................................................................................................................................. . 13
Agenda for Action ... ............................................................................................................................. . 13
2. How productivity is measured ... ........................................................................................................... .15
Single Resource Productivity (SRP) ... ............................................................................................. . 15
Standards ... .......................................................................................................................................... .. 17
Productivity Index ... ............................................................................................................................. . 17
Total Resource Productivity (TRP) ... ............................................................................................. ... 19
Section Review ... ................................................................................................................................. . 20
Agenda for Action ... ............................................................................................................................. . 20
3. What influences productivity? ... ........................................................................................................... .21
Utilization ... ............................................................................................................................................ . 21
Efficiency ... ........................................................................................................................................... .. 25
Psychological Influences ... ................................................................................................................. . 26
Section Review ... ................................................................................................................................. . 27
Agenda for Action ... ............................................................................................................................. . 28
4. How to measure work utilization and efficiency ... .......................................................................... ..29
Activity Sampling ... ............................................................................................................................. .. 29
Work Sampling ... ................................................................................................................................ .. 31
Time Study ... ........................................................................................................................................ .. 32
Work Rating ... ..................................................................................................................................... ... 33
Basic Time ... ......................................................................................................................................... . 33
Relaxation Allowances ... .................................................................................................................. ... 34
Process and Special Allowances ... ................................................................................................ ... 35
Standard Time ... ................................................................................................................................ ... 35
Section Review ... ................................................................................................................................. . 36
Agenda for Action ... ............................................................................................................................. . 37
5. Ways to improve productivity ... ........................................................................................................... ..39
Method Study ... .................................................................................................................................... . 39
Value analysis ... .................................................................................................................................. .. 43
Loss control ... ...................................................................................................................................... ... 44
Motivation ... .......................................................................................................................................... .. 44
Economic feasibility ... ........................................................................................................................ ... 45
Redundancy ... ...................................................................................................................................... . 45
Section review ... ................................................................................................................................. ... 46
Agenda for action ... ............................................................................................................................. . 46

6. How to measure and improve clerical work productivity ... ...................................................... ...47
Defining tasks ............................................................................................................................... . 47
Measuring clerical utilization ... .................................................................................................... . 48
Measuring clerical efficiency ... ..................................................................................................... 49
Putting the measurements to work ... ...................................................................................... ... 50
Improving clerical productivity ... ................................................................................................... 51
Keeping it going ... ........................................................................................................................ . 53
Section review ............................................................................................................................. ... 54
Agenda for action ... ..................................................................................................................... . 54
7. Measuring the utilization and efficiency of cash ... .................................................................... ...57
Measurement of input ... ............................................................................................................. ... 57
Fixed assets ... .............................................................................................................................. . 58
Current assets .............................................................................................................................. . 58
Return on assets managed (ROAM) ... ....................................................................................... 59
Measuring stock turnover ... .......................................................................................................... 60
Measuring debtor levels ... ............................................................................................................ 60
Measuring cash utilization ... ....................................................................................................... . 61
Improving the productivity of assets ... ......................................................................................... 61
The Bottom line ... ........................................................................................................................ ... 63
Section review ............................................................................................................................. ... 63
Agenda for action ... ..................................................................................................................... . 64
8. Setting up a productivity programme ... ........................................................................................ .65
Gaining commitment ... .................................................................................................................. 66
Choosing the projects ... .............................................................................................................. . 68
Maintaining progress ... ............................................................................................................... ... 68
The bottom line ... ........................................................................................................................ ... 68
Section review ............................................................................................................................. ... 68
Agenda for action ... ..................................................................................................................... . 69
Quick cost reduction checklist ... ....................................................................................................... ..72
The fundamentals ... .................................................................................................................... . 72
In connection with Materials ... .................................................................................................... . 72
In connection with Labor Costs .................................................................................................. . 73
In connection with Expenses ... ................................................................................................. ... 73
In connection with Delivery Costs .............................................................................................. . 73
Examine Sales Costs ... ............................................................................................................. ... 74
Examine Office Expenses ... ...................................................................................................... ... 74
Causes of poor productivity ... ............................................................................................................ .75
Waste of Time ... ........................................................................................................................... . 75
Waste of Ideas ... .......................................................................................................................... . 75
Waste of Methods and Supplies ... ........................................................................................... ... 75
Waste of Machinery and Equipment ... ....................................................................................... 76
Waste of Manpower ... ................................................................................................................... 77
Waste of Accidents ... .................................................................................................................... 77
Waste of Non-cooperation ... ........................................................................................................ 78
Waste of Space ... .......................................................................................................................... 78
Ergonomics ... .................................................................................................................................... ...79
Indicators of the Need for Human Factors Evaluation ... ......................................................... . 79
Need for Task Design ... .............................................................................................................. . 79
Need for Workplace Redesign ... ................................................................................................. 79
Special Considerations in the Working Environment ... .......................................................... ... 80

Introduction
The aim of this guide
My aim in producing this guide is to provide a basic understanding of how to improve
productivity & measure work in any business organization. I wanted to give it a provocative
"In search of work measurement & productivity Improvement", but you don’t need to
search for opportunities for productivity improvement—they exist in every workplace
situation.
I have tried to keep it simple, practical and effective. It is not intended to turn
you into a Work Study expert but if it arouses your interest in the subject there are
several excellent textbooks you can turn to if you want to hone your skills. Improving
productivity and work measurement is not only necessary to the economic survival of an
organization, but also to national prosperity. It also provides a new and absorbing dimension
to your job— a constant challenge to do it better.
Who this guide is for
Managers, Engineers, supervisors, trainers and employees at any level who wish to develop
their understanding of work measurement & productivity and their ability to improve the
efficiency and utilization of resources in their organisations.
How to use this guide Each of the eight sections has the same structure. Every section:
• takes a theme (listed in the contents)
• outlines the key issues
• gives examples of how those issues affect work
• suggests ways of handling the issues, in some cases with examples of what
happened when other people used the approach.
Each section is self contained and can be read by itself, though they do of course relate
to one another. Throughout the text you’ll features, all of which are designed to help
make your learning as effective - and enjoyable - as possible. The features are as follows:
At the beginning of each section
Indicates a list of objectives - key activities that you should be able to carry
out when you have completed the section. You’ll find a reminder in the Section
Review at the end of each section to check back over this list.
At the end of each section
It suggests a personal agenda for action - a set of resolutions to put what you have
learnt into practice. This is a reminder that the guide is about practical, attainable
changes in working habits. One way of recording your agenda is as an ‘action plan’
- a list of targets with a date for the attainment of each. Here are some typical
entries from one such plan:
• Determine the inputs, process and outputs of my job.
• Improve the understanding and the importance of productivity of subordinates /
colleagues by publishing my weekly indices (graphs and tables) 15/11
• Complete indices for all jobs and processes in my department by 25/7
There is also a summary of objectives for the whole of the guide on the next page.

1: What is productivity?
After completing this section you will be able to:
• Understand the concept of the production process
• Understand the concept of productivity
• Know the five ways to improve productivity
2: How productivity is measured
After completing this section you will be able to:
• Understand the importance of measurement;
• Calculate Single Productivity Ratios (SRP)
• Set standards of performance
• Calculate and maintain productivity indices (PIs)
• Calculate Total Resource Productivity (TRP)
3: What influences productivity
After completing this section you will be able to:
• Understand the term utilization and relate it to resources
• Understand the term efficiency
• Understand and recognize some of the factors that affect efficiency
4: How to measure work utilization and efficiency
After completing this section you will be able to:
• Be able to apply the activity sampling technique to measure utilization
• Be able to apply the work sampling technique to measure efficiency
• Be aware of the technique of time study
• Understand the concept of work rating
• Understand the concept of standard time
5: Ways to improve productivity
After completing this section you will be able to:
• Look at work critically to look for productivity improvement potential
• Select and critically examine work
• Develop an alternative improved method
• Apply and measure the improved method
6: How to measure and improve clerical productivity
After completing this section you will be able to:
• Be able to measure clerical utilization
• Be able to measure clerical efficiency
• Identify the causes of low clerical productivity and take appropriate action
• Explain the advantages of improving productivity in-house
7: Profit from productivity
After completing this section you will be able to:
• Look at your organization, its inputs, processes and outputs in financial terms
• Understand that the lifeblood of any organization is money
• Understand key financial ratios
8: Setting up a productivity programme
After completing this section you will be able to:
• Understand the importance of gaining commitment at all levels when introducing
a productivity improvement program.
• Carefully select and train suitable employees and form teams
• Select projects in consultation with others and maintain momentum

If you decide that you have not achieved what you set out to do:
• Discuss the objectives with someone - preferably your adviser. Have you
interpreted these correctly? Have you set out to do too much too soon?
• Work through the relevant section of text again, taking particular note of the
practical steps we recommend
• Above all, persist, if the objective is one you value the effort you put into achieving
it, will be well worthwhile.
Productivity | 7

8 | Productivity

1. What is productivity? After completing this section you will be able to:
• Understand the concept of the production process
• Understand the concept of productivity
• Know the five ways to improve productivity
So what is productivity? Well, for a start, productivity isn’t half the things that people (who
should know better) say it is. It does not mean
• working harder—unless people are loafing on the job;
• cutting costs—unless this can be done without affecting quality;
• reducing staff and workers unless your market is shrinking;
• extra work for managers—it’s part of their job;
• employing specialists—it’s a job for everyone.
There is nothing new about productivity. Early writings on the subject go as far back as 400
BC and by AD 1400 an efficient assembly line was working in Venice. By the 1800’s the role
of the worker in productivity had been recognized but it was not until the early 1900’s that
the modern approach to the productivity of industrial processes really came into being.
Since then the word "productivity" has become the best-used (and abused) word
in the manager’s and politician‘s vocabulary. Many people confuse production and
productivity. Whilst both are important to any business they are really quite different in
meaning. So let’s clear up this misunderstanding before we go any further.
Production
Production is the process of converting resources into products or services. It is usually
measured in terms of output per time period (e.g. boxes per hour, tones per day, bookings per
month) or cost per unit of output (e.g. $10 per box, $20 per ton, etc). The objective of
production operations is to meet the forecasted needs of the market in which they perform at
the lowest possible cost.
Resources Conversion Output
Manpower Agriculture Products
Machinery Mining Services
Materials �Industry � Money Services
The output of a production process can be improved by increasing the input of resources
or by changing the process or both.
Resources Process Output
1 Man Carrying bricks by hand 500 bricks per day
(Normal day)
� � 1 Man Carrying bricks by hand 550 bricks per day (Working overtime)
If we increase the resources by making a worker work overtime we will increase the out-
put of the process and so meet our market needs. However we may not have improved
Productivity | 9

our costs in doing so.
Resources Cost Input Output Cost of output
1 man x 8 hours @ $2.00 $16.00 $16.00 500 bricks 3.2 cents per brick
/ hour
1 man x 8 hours @ $2.00
/ hour, plus
2 hours OT @ $2.50 /
hour
$16.00
$21.00 550 bricks $5.00
3.8 cents per brick (a
19% increase)
If we can modify the process to enable the man to produce more without working
harder or longer we may be able to meet our target and reduce the cost of output as well.
Resources Cost Input Output Cost of output
1 man x 8 hours @ $2.00
/ hour
1 wheelbarrow x 8 hours
@ $1.00 / hour
$16.00
$24.00 800 bricks 3.0 cents per brick $8.00
60% increase 6% reduction
By adding to the resources and changing the process we have increased production by 60%
and reduced the unit costs by 6%. That’s what productivity is all about.
Service Operations
In our examples so far we have tended to concentrate on the more traditional conver-
sion processes which occur in agriculture, mining or manufacturing industry and
which, until recently, formed the major part of business revenue.
Today they have been overtaken by the service industry which, in some Western
countries, forms as much as 80% of all industry. Service operations make use of
resources to create products just the same as does manufacturing industry although
frequently the product is hard to visualize. Airlines, hotels, markets, chemist shops
and garages are all examples of service operations which use manpower, machinery,
materials and money to create a product or products which meet the needs of their
customers.
When you arrive safely and comfortably at your destination your flight has been the
product of a process which buys airplanes, maintains them, trains people to fly them
and provide in-flight service, uses millions of units of fuel, food and toilet paper, and
handles millions of items of baggage. The production of an airline can be measured
in "Passenger / miles" and the cost and contribution of each resource can be similarly
measured.
Exactly the same principles apply to the service divisions of a company such as personnel,
finance and marketing. The product they produce must be defined and the resources involved
must be used effectively. It is no more difficult to measure the output of an accounts clerk than
a machine operator as we will show you later. Both have a contribution to make to the
productivity of the company.
10 | Productivity
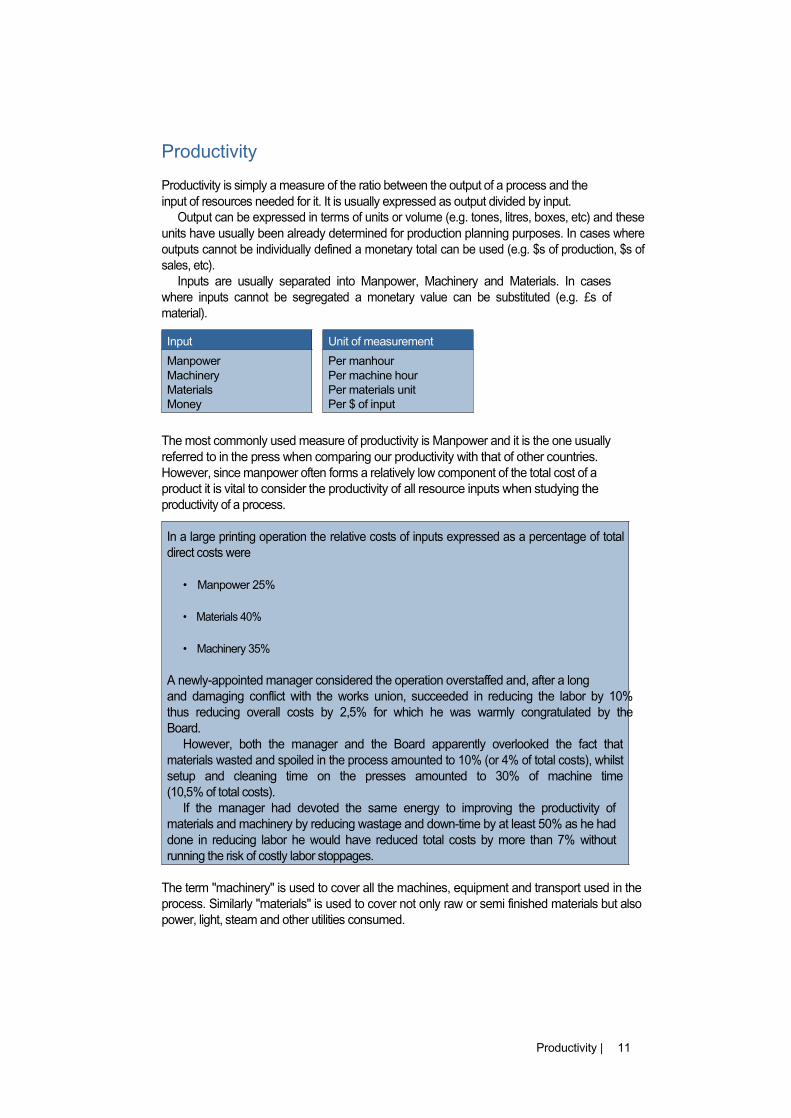
Productivity Productivity is simply a measure of the ratio between the output of a process and the
input of resources needed for it. It is usually expressed as output divided by input.
Output can be expressed in terms of units or volume (e.g. tones, litres, boxes, etc) and these
units have usually been already determined for production planning purposes. In cases where
outputs cannot be individually defined a monetary total can be used (e.g. $s of production, $s of
sales, etc).
Inputs are usually separated into Manpower, Machinery and Materials. In cases
where inputs cannot be segregated a monetary value can be substituted (e.g. £s of
material).
Input Unit of measurement
Manpower Per manhour
Machinery Per machine hour
Materials Per materials unit
Money Per $ of input
The most commonly used measure of productivity is Manpower and it is the one usually
referred to in the press when comparing our productivity with that of other countries.
However, since manpower often forms a relatively low component of the total cost of a
product it is vital to consider the productivity of all resource inputs when studying the
productivity of a process.
In a large printing operation the relative costs of inputs expressed as a percentage of total
direct costs were
• Manpower 25%
• Materials 40%
• Machinery 35%
A newly-appointed manager considered the operation overstaffed and, after a long
and damaging conflict with the works union, succeeded in reducing the labor by 10%
thus reducing overall costs by 2,5% for which he was warmly congratulated by the
Board.
However, both the manager and the Board apparently overlooked the fact that
materials wasted and spoiled in the process amounted to 10% (or 4% of total costs), whilst
setup and cleaning time on the presses amounted to 30% of machine time
(10,5% of total costs).
If the manager had devoted the same energy to improving the productivity of
materials and machinery by reducing wastage and down-time by at least 50% as he had
done in reducing labor he would have reduced total costs by more than 7% without
running the risk of costly labor stoppages.
The term "machinery" is used to cover all the machines, equipment and transport used in the
process. Similarly "materials" is used to cover not only raw or semi finished materials but also
power, light, steam and other utilities consumed.
Productivity | 11

Improving Productivity The cost of any product or service is the sum of the costs of the resources used in
producing it. The more productive each of those resources can be made the lower the
final cost of the product. In a free market the lower the cost of a product, the greater the
demand it generates and the more profitable the enterprise, with ultimately a beneficial effect
on the living standards of everyone.
Five Ways to Improve Productivity
• Increase input but get a greater increase in output.
• Maintain input but increase output.
• Decrease input with a smaller decrease in output.
• Decrease input but maintain output.
• Decrease input but increase output.
In a factory making domestic appliances the assembly operation for household fans
comprised three workers. One attached the rotating mechanism to the base; one at-
tached the motor and threaded the flex through the base; one fitted the fan blades and
guard assembly. The complete fan then went off to the inspection department. The
work was monotonous, labor turnover high and the number of rejects which had to
be reworked was also high.
The factory manager attended a course on improving the content of work and, when he
returned, decided to try out some of the things he had learned. He selected two workers and
made each responsible for all the assembly operations—each turning out complete fan
assemblies. He also made them inspect their own work and sign the guarantee label which
was attached to the fan.
After a brief learning period they began to compete with each other and to take a
pride in the quality of the work they turned out. The daily productivity figures changed
dramatically.
System Output Rejects % Net Output Manhours Productivity
Old 60 10 16 50 24 2.1 / hour
New 48 2 6 45 16 2.8 / hour
So by decreasing the manpower by 33% and decreasing output by only 10% produc-
tivity increased by 33%. A similar decrease resulted in the cost of labor and materials
per item thus making the product more profitable and/or more competitive. The
spare worker could either be used full time or part-time to increase production (if
the lower price increased demand) or could be employed in some other productive
capacity.
Today, as ever, no organization, public or private, can afford to ignore the constant need to
improve productivity nor can any employee evade his / her responsibility for playing their
part in the work of productivity improvement. It’s not difficult to do once you know the
basics involved in measurement, standard setting and method improvement. The two most
difficult parts of the operation are, firstly, starting it and secondly, keeping it going. We’ll start to
tackle the first one in our next chapter.
12 | Productivity

Section Review • Productivity improvement is not a job for specialists only—it should be a part of
every job in the organization.
• Although related, productivity and production are not the same thing. Production
is the process of converting resources into products and is measured as the
quantity produced in a given time.
• Productivity is the ratio between the output of a process and its inputs and is
measured as output divided by input.
• Productivity improvement requires the optimal use of all resources —manpower,
machinery, materials and money—not simply manpower alone.
Agenda for Action What else do you intend to do now?
• Will you discuss with your boss your role in the search for productivity
improvements and your possible contribution in this vital area to your
organization?
• Have you identified all the inputs i.e. manpower, materials, machinery, in your
job?
• Can you quantify all these inputs in terms of money?
• Can you identify the key outputs of your job?
Productivity | 13

14 | Productivity

2. How productivity is measured After completing this section you will be able to:
• Understand the importance of measurement
• Calculate Single Resource Productivity ratios (SRPs)
• Set standards of performance (PIs)
• Calculate and maintain productivity indices
• Calculate Total Resource Productivity (TRPs)
One of the fundamental principles of productivity improvement is that the productivity of
the existing process should be measured in as much detail as possible before any attempt to
improve it is made.
At first sight this may appear to be an unnecessary restriction which cuts across many
traditional ways of improving productivity, such as employee suggestion plans, think-
tanks and the manager’s or supervisor’s own initiative in changing methods. Almost
anyone who is observant can visit an operation and pick up a number of things that
could be improved—people standing around, machines idle and so
All of these efforts may improve productivity of a particular operation or resource
but these may not be the areas where the greatest improvement is needed and can
be made. We saw an example of this in the last chapter when the manager picked
on manpower for improvement when materials and machinery would both have
contributed a greater improvement with less effort.
Alternatively, random efforts to improve may adversely affect the productivity of other
resources leaving the company no better off than it was before.
A purchasing manager found a new material which, being easier to work, substan-
tially reduced the manhours in a process. The works manager was delighted with the change
because it improved his labor productivity, which management had been pressuring him to
increase.
However, the new material cost more than the old so that the decrease in labor
costs was offset by the increase in material costs. Whilst the purchasing manager had
used his initiative to improve productivity, in fact the gain had been passed directly to
the supplier of the new material and the company had not benefited from it at all.
The only sure way to prevent this happening is to establish accurate measurements of
existing productivity so that possible changes can be fully evaluated against them before being
introduced.
Single Resource Productivity (SRP)
The first basic measurement is Single Resource Productivity (SRP) which measures the
productivity ratio of each individual resource broken down into as much detail as pos-
sible. To obtain Single Resource Productivity the output of a process (in either units or
value) is divided by each resource input. The result is then expressed as a productivity
ratio.
Productivity | 15

Output
300 boxes
Input = SRP Ratio
Manpower 20 manhours 15 boxes / manhour
The same method is used to measure all the other inputs of resources into the process.
Output
300 boxes
Input = SRP Ratio
Manpower 20 manhours 15 boxes / manhour
Machinery 10 machine hours 30 boxes / machine hour
Materials 450 metres card 0.6 boxes / metre
2 litres glue 150 boxes / litre
But we said that we should break the various resources into as much detail as possible. For
example, what types of labor are employed?
Output
300 boxes
Input = SRP Ratio
Manpower Artisan - 8 manhours 37.5 boxes / manhour
Assistant - 8 manhours 37.5 boxes / manhour
Stacker - 4 hours 75 boxes / manhour
But what about the "stacker" who only does half a job anyway? He collects the finished
boxes and places them on a pallet for periodic removal by a forklift truck. He serves
two work stations so his time is split between them. Suppose it were possible to rear-
range the work station so that, as the helper took a finished box off the machine, he was
able to stack it on a suitably placed pallet. The stacker would no longer be required. The
productivity of the artisan and helper would not change but the overall productivity of
manpower would increase.
Output
300 boxes
Input = SRP Ratio
Old Method 20 manhours 15 boxes / manhour
New Method 16 manhours 18.75 boxes / manhour
(25% improvement)
So it is only by measuring Single Resource Productivity in as much detail as possible
that you can begin to see where productivity can be improved. Careful measurement
also protects you from allowing productivity results to be masked by other factors such
as profitability.
16 | Productivity

The company Chairman concluded his report by saying, "This has been a very difficult
year for your company. Like many other employers we have had to meet demands for
substantial wage increases and reduced working hours from our workforce. Due to
the increase in transport charges our raw material costs have also risen.
However, because of the recession in the building industry, our efforts to increase
sales volumes have been restricted and have ended up somewhat lower than last year.
Luckily we were able to negotiate compensating increases in our selling prices. As a
result I am glad to be able to report that our profits this year are on a par with those
of last year and dividends will not be affected. I would like to extend the usual vote
of thanks to our Managing Director and his able staff for maintaining the company’s
productivity during this difficult period."
The Chairman is not unique in confusing profitability and productivity. Profit can al-
ways be enhanced by improving productivity but it can also be increased by raising selling
prices. In fact, increased selling prices often mask the results of decreased productivity as is
obviously the case here. Without SRP ratios to guide you it is not possible to say whether
productivity has been gained or lost.
However the SRP ratios alone will not help you much unless you have something
to measure them against. Although, in the previous example, an increase of 25% in
manpower productivity looks good on paper, 18,75 boxes per manhour may still be less
than they achieve in the factory across the street or even in a factory in a developing
country.
Only by comparing your results with a reliable norm can you check whether you are
winning or losing the war on productivity.
Standards
In productivity improvement programmes the norm usually used is a productivity
standard. This standard can be determined in several ways.
Setting productivity standards
• Use the results of a previous period - last 6 months, last 12 months etc.
• Use an outstanding result from a previous period
• Use an industry standard - most industries have developed performance norms
• Establish a standard by using work measurement and / or work sampling
The standard gives you something to aim for and something to measure against but it
is not static. In fact, it must be changed whenever you change the inputs or the process
otherwise its power to motivate will be lost and the results it throws out will be mean-
ingless.
Productivity Index
Normal company reporting systems are a mixture of positive and negative figures; some
indicate good results, some bad. For example when costs go down, that’s good but if pro-
duction goes down, that’s bad. Interpreting positive and negative variances in such reports
is tricky and time-consuming. Many managers don’t even attempt it, relying on their
accountants to tell them when things have gone wrong —by which time, of course, it’s too
late to do much about it. Since measuring productivity would be a waste of time and effort
unless results were constantly reviewed and correctly interpreted, productivity results are
Productivity | 17

always expressed as a percentage of a standard —results above 100% are positive and results below
clearly negative. This measure is known as the Productivity Index (PI).
Productivity Index
Result being measured (actual) x 100 = PI
Standard
The result being measured is multiplied by 100 so that the PI will be expressed as a per-
centage of the standard (100). Let’s see how it works in practice. First you must find the
Single Resource Productivity ratios of the process—in this case a gang making concrete
with a small mixer.
Output 24 cubic metres (m3) of concrete
Input SRP
5 men x 8 hours = 40 manhours 24 / 40 0.6 m3 per manhour
1 mixer x 8 hours = 8 machine hours 24 / 8 3 m3 per machine hour
120 bags cement = 120 material units 24 / 120 0.2 m3 per material
unit
At this stage you don’t know whether these results are good or bad until you can compare
them with some standard, in this case industry norms, and calculate Productivity Indices for
each ratio.
Input SRP Standard PI
Manpower 0.6 0.75 (0.6 x 100) / 0.75 = 80%
Machinery 3.0 3.0 (3.0 x 100) / 3.0 = 100%
Material 0.2 0.25 (0.2 x 100) / 0.25 = 80%
Now you can see at a glance that you are running 20% below standard in manpower and
materials. In each case you are getting less output from your resources than you should
and therefore the finished product is costing more than it should. Obviously something
must be done.
So you ask the foreman to reduce his gang by two men and to give them a proper
measure for the cement so that they can only mix the correct amount. What happens to
the SRP?
Output 20 cubic metres (m3) of concrete
Input SRP
3 men x 8 hrs = 24 manhours
1 mixer x 8 = 8 machine hours
hours
80 bags of ce- = 80 material units
ment
18 | Productivity
Standard PI
20 / 24 0.83 m3 per manhour
20 / 8 2.5 m3 per machine hour
20 / 80 0.25 m3 per material unit

The smaller gang wasn’t able to keep up the same rate of production as the larger gang but
productivity of manpower and materials seems to have improved. Let’s check the
Productivity Indices of the new method.
Input SRP Standard PI
Manpower 0.83 0.75 (0.83 x 100) / 0.75 = 111%
Machinery 2.85 3.0 (2.85 x 100) / 3.0 = 83%
Material 0.25 0.25 (0.25 x 100) / 0.25 = 100%
Apart from the fact that overall production is down (which may or may not be criti-
cal depending on the production plan) the foreman seems to have got well above the
standard productivity from his gang and to have corrected the cement problem. But
he dropped back 17% on machine productivity. Has the overall result been positive or
negative? To find this out you need to use the second basic measure of productivity.
Total Resource Productivity (TRP)
So far we have been concentrating on the productivity of the individual inputs into a
process, and we have seen how changes in input and output can affect productivity.
However, sometimes an improvement in the productivity of one resource input will
cause a deterioration in another (as in the last example). In these cases you need to be able to
check and compare the overall productivity of the process. For this purpose we use Total
Resource Productivity (TRP).
Old Method
Input Output
40 manhours @ $1.5 $60
8 machine hours @ $15 $120 $900 = 24 m3 concrete 120 material units @ $6 $720
Total Resource Productivity = 24 / 900 0.026 m3 per $ input
In order to find the TRP all inputs are converted into monetary values, added together and
divided into the output to establish the output per $ of input. Let’s apply it first to the old
method of making concrete.
Using the same input values you can calculate the TRP of the new method.
New Method
Input
24 manhours @ $1.5
8 machine hours @ $15
80 material units @ $6
Total Resource Productivity
Output
$36
$120 $636 = 20 m3 concrete
$480
= 20 / 636 = 0.031 m3 per $ input
Checking the Productivity Indices of old and new methods you can see whether or not
the changes made by the foreman have in fact increased overall productivity.
(actual x 100) / standard = (0.03 x 100) / 0.026 = 115%
So you have improved by 15% which seems very good but is it the best you can get?
Using the previous standards as a guide the standard TRP for the process works out at
0.030 m3 per $ input. You can now measure your new performance against the standard.
(actual x 100) / standard = (0.03 x 100) / 0.032 = 94%
Productivity | 19

So, although you have done well to improve productivity you still need to improve some
more which will probably mean bringing back another man to get the production up
and keep the machine operating at 100% capacity. And of course you don’t have to be
satisfied with reaching the standard—you can and should always try to beat it.
One last point—always use the same base costs when calculating the Total Resource
Productivity of more than one process or the same process at different times (e.g. last
year versus this year). Obviously changes in costs will throw out the validity of the
comparison.
Section Review • Single Resource Productivity measures the productivity of each individual input as
a ratio of output to input. The more detailed the breakdown of inputs the greater
your ability to spot areas needing action.
• Standards of productivity must be set so that results can be compared with a
standard to provide meaningful variances for investigation.
• Productivity Index is a method of uniformly reporting results as a percentage of
standard performance.
• Total Resource Productivity is used to compare the overall productivity of all
resource inputs with other results or standards. It is found by converting all the
inputs into monetary values, adding them together and dividing them into the
output to give the output per £ of total input. • It is a fundamental principle of productivity improvement that productivity
should be measured before any attempt is made to improve it. Equally important
is to ensure it is re measured after every change in the process or resource inputs.
• Reporting productivity results as indices of standards should form a part of the
regular reporting system of any company that seriously wants to improve its
productivity.
Agenda for Action What else do you intend to do now?
• Can you suggest how, in your work situation, the reporting of productivity can be
improved? For single resources and total resources?
• Can you now produce a productivity index or indices for your work that would
improve the measurement and reporting of productivity?
• How will you go about producing and reporting these ratios and indices? Will
you use a computer generated graphs enabling trends to be picked up over time?
Would it be advantageous to use moving averages or curve fitting techniques to
the underlying data?
20 | Productivity
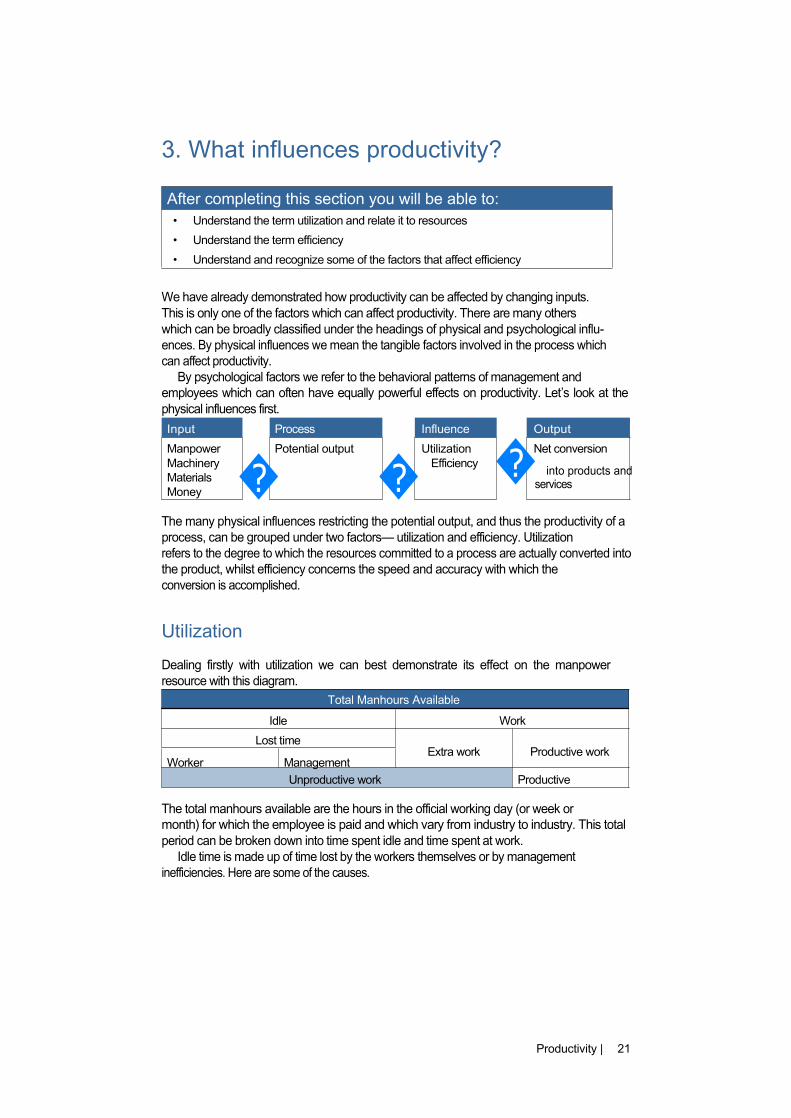
3. What influences productivity? After completing this section you will be able to:
• Understand the term utilization and relate it to resources
• Understand the term efficiency
• Understand and recognize some of the factors that affect efficiency
We have already demonstrated how productivity can be affected by changing inputs.
This is only one of the factors which can affect productivity. There are many others
which can be broadly classified under the headings of physical and psychological influ-
ences. By physical influences we mean the tangible factors involved in the process which
can affect productivity.
By psychological factors we refer to the behavioral patterns of management and
employees which can often have equally powerful effects on productivity. Let’s look at the
physical influences first.
Input Process
Manpower Potential output
Influence Output
Utilization Net conversion
Machinery
Materials
Money � �
Efficiency � into products and services
The many physical influences restricting the potential output, and thus the productivity of a
process, can be grouped under two factors— utilization and efficiency. Utilization
refers to the degree to which the resources committed to a process are actually converted into
the product, whilst efficiency concerns the speed and accuracy with which the
conversion is accomplished.
Utilization
Dealing firstly with utilization we can best demonstrate its effect on the manpower
resource with this diagram.
Total Manhours Available
Idle Work
Lost time Extra work Productive work
Worker Management
Unproductive work Productive
The total manhours available are the hours in the official working day (or week or
month) for which the employee is paid and which vary from industry to industry. This total
period can be broken down into time spent idle and time spent at work.
Idle time is made up of time lost by the workers themselves or by management
inefficiencies. Here are some of the causes.
Productivity | 21

Some causes of idle time
Time lost by workers Time lost by management
Absenteeism Poor work planning
Tardiness Delays in material supply
Exceeding agreed rest periods Poor working conditions
Unnecessary stoppages Unnecessary down-time
Extra work is the unnecessary work done by the worker when actually working and can be
caused by a number of conditions.
Causes of extra work
Inefficient work methods (lack of training)
Badly designed layout of the job
Incorrect or poorly adjusted tools
Difficult work process
Reworking rejects
The balance of the available time is used for productive work. Although the diagram on the
previous page may seem to be drawn out of proportion it is unfortunately true that, in many
operations which have not studied productivity improvement, effective manpower utilization
seldom exceeds 50 percent.
A large refinery always employed outside contractors to carry out its annual shut-
down overhaul. The work was put out to tender, the contractor tendering to com-
plete the work in accordance with plans and detailed specifications supplied by the
engineering department of the refinery who maintained a controlling function on
the contract.
Casual observation by the supervising engineers indicated that a lot of time was
being wasted by the artisan and unskilled staff employed by the contractor. Since this
would affect the productivity of manpower and hence the costs of the contractor,
they decided to monitor the situation carefully the following year. Accordingly they
employed a consultant to measure the utilization of the labor force employed by
the contractor. At the end of his study he produced the following summary of his
findings: Time lost due to management inefficiencies
Poor planning 8.1%
Materials delays 2.7%
Maintenance 3.1%
Sub-total 13.9%
Time lost by workers
Idle 34.7%
Extra work
Unnecessary walking 5.6%
Total unproductive time 54.2% Productive time 45,8%
22 | Productivity

Using these figures they suggested to the contractors that they improve their
management and supervision in future contracts and were able to negotiate a keener
price the following year as a result. This is yet another example of the real money saving
value of measuring productivity.
The utilization of machinery follows a similar pattern to that of manpower, being closely linked
to the behavior of its operators.
Total Machine Hours Available
Idle Operating
Lost capacity Rejects Products
Operator Management
Unproductive Productive
Strictly speaking the machine should be available for 24 hours per day less time needed
for routine maintenance. However, machine utilization is normally measured against
the working day of the operation (i.e. one, two or three shifts). The causes of lost capac-
ity are essentially the same as for manpower utilization, i.e. split between worker and
management, but usually with more emphasis on poor work planning or scheduling and
excessive downtime.
Rejects represent an unproductive use of all the resources, and therefore an
unnecessary increase in costs, which should be avoided. The call today is for "Zero
defects" or "Get it right first time" and certainly many successful companies make
it their policy. However there is another school of thought which believes it is more
costly to ensure perfection than it is to correct a few errors and that a strictly controlled
percentage of rejects is therefore acceptable. Perhaps in the end it will be the increasingly
discerning consumer who will dictate the policy.
Causes of rejects
Machines badly maintained and set
Machines incorrectly operated
Defective material used
Quality standard set too high
Machines can vary in cost from less than $100 to several millions and their standing
costs (i.e. cost of capital or lease, space, operators) can vary in proportion. As these costs
increase the need to maximise utilization becomes paramount.
Productivity | 23

A packaging company operated two large bag-forming machines. These machines
took in rolls of paper which they then cut, folded, printed and glued, finally producing
completed bags at the rate of 8-10 000 per hour. The machines had to be shut down
periodically for cleaning up the surplus glue and ink which accumulated and soiled
the finished bags causing them to be rejected. Whenever the type of bag or printing
required had to be changed, the machines were shut down whilst a fitter and his mate
carried out the necessary changes. This process took about 5 hours plus another hour
during which minor running adjustments had to be made. During this latter period
the reject rate was high.
The machines, which cost about £1.25 million each when purchased some
years ago, were designed to handle long runs of the same product and performed
exceptionally well on this type of work. However, in recent years, as the price of the
product increased, customers reduced their stocks and started to order on a just in
time basis. Changeovers became more frequent and downtime increased.
One day a visitor from Head Office happened to visit the plant when both
machines were being changed and their operators standing idle. He asked the factory
manager what the percentage downtime was on the machines. The factory manager, who
hadn’t checked on his productivity for some time, because he was so preoccupied with
production only, sent for the records and was horrified to see that downtime had reached
46% of available time.
He immediately blamed the sales department for the small orders they were ask-
ing him to make up. His visitor pointed out that, at the moment, the downtime was
costing the company in the region of £2 000 per hour for loss of output, in addition to labor
and standing costs of nearly £100 per hour. Multiply that by 46% of a 16-hour day and
downtime was costing over £15 000 per day.
The visitor added that, at that rate, there was a great deal that could be done to
improve utilization and productivity—such as making for stock, increasing the size
of the changeover teams, modifying the cleaning procedures and so on—which could
result in the downtime being brought down to an acceptable level.
The factory manager now checks the utilization of all his machines daily and will
never forget his lesson that it is no good keeping productivity records unless you
monitor them constantly and take action to correct the problems they show up.
Because of its high contribution to total costs in most manufacturing processes the
utilization of material plays a major role in productivity. The pattern is similar to that for
manpower and machinery.
Total Material Purchased
Not processed Processed
Wasted Spoilt Products
Operator Management
Unproductive Productive
Out of the total material purchased a proportion does not reach the process at all, being
wasted either by the actions of workers or by the inefficiencies of management.
24 | Productivity

Causes of waste
Worker Management
Spillage Bad storage conditions
Damage in handling Poor quality material
Shrinkage (theft) Incorrect material
Waste Defective product design
Often material is spoilt in the actual process as we saw in the case of the bags which were
soiled by glue and ink. There are many causes of spoilage in a process. Here are some of
them.
Causes of spoilt material
Machine wrongly set Untrained operators
Contamination Difficult operations
Incorrect applications Poor design of process
Utilization measures what you productively use out of the resources you put into a process
(industry or service). The better your utilization the better your productivity and vice versa. If
you haven’t measured the utilization of your resources it would certainly pay you to do so—
you might be in for a shock.
Some time ago I had breakfast in a country hotel. The waiter came from the kitchen to
show me to a table and then returned to fetch a menu. He took my order and disap-
peared into the kitchen. After a short time he brought me orange juice, returning to
the kitchen. In due course he returned with toast and butter, and then, after a short
delay, brought eggs and bacon. I asked him to bring the coffee I had ordered, which he
did. When I had finished the eggs, I asked him for marmalade for which he returned
to the kitchen. Finally, I asked for the bill which he brought from the same source to
which he took my credit card, eventually returning it with the docket for my signa-
ture.
Before I left I paced out the distance from my table to the kitchen. It was about 12
metres and he had made a total of 15 trips, walking nearly 200 metres in the process.
He richly deserved the tip I left him ! I subsequently read that waitresses in fast-food
restaurants in the USA regularly "cover" up to 10 tables each whilst in this country 4
to 5 is the maximum. I’m not surprised. - distance is time and time is money.
Measuring utilization will tell you to what degree your resources are being productively
employed but it won’t tell you how well they are being used. To learn this you need to measure
efficiency.
Efficiency
Efficiency, as we have said, is the measure of the speed and accuracy with which work is
completed. Speed is obviously important because the faster the piece of work can be
completed the greater the productivity of manpower and machinery. However, if the work is
not done accurately it will be rejected and productivity will suffer. It is therefore necessary to
maintain a balance between speed and accuracy.
The speed with which work is completed can be measured roughly by "work
sampling" or, more accurately, by "time study", both of which will be explained in the
next chapter. The accuracy of a process is measured by "quality control" which involves
Productivity | 25

checking the products against preset criteria, either individually or by sampling. The
quality of a service operation can be similarly checked by inspecting the ongoing
operation or by polling customers —hence the many questionnaires you are asked to fill in by
hotels, airlines and garages, etc. The physical factors affecting efficiency also stem from both
worker and management action or omission.
Factors affecting efficiency
Workers aptitude and skill (training)
Layout of the work (eliminating wasted effort)
Simplicity of the work method
Provision of correct tools and aids
Working conditions (atmosphere, light, noise, etc.)
Failure by management to provide for any of these factors will have an adverse effect on
efficiency and, hence, on productivity. However, it is possible to provide all the above
and still not reach the required standards of efficiency. The reason lies in the second
series of factors influencing productivity, namely the psychological influences.
Psychological Influences
The psychological influences are the things which affect the behavior of the worker and
determine whether he will be a dedicated achiever or a confirmed loafer and fall roughly into
two classifications:
Demotivators
Demotivators are the conditions in the work environment which tend to frustrate the
worker and create conditions which are not conducive to wholehearted effort on his part.
Demotivators
Untrained or inexperienced supervisors
Absence of agreed grievance and disciplinary procedures
Substandard remuneration
Lack of consultation
Poor interpersonal relationships with supervisor / colleagues
Unnecessary restrictions, procedures and red-tape
The ultimate measure of demotivation is when workers go slow or eventually strike. An
analysis of strike patterns over the last few years seems to indicate that, eliminating obviously
political or ideological causes, a majority of the remaining problems stem from one or all of the
demotivators listed above.
It is important to remember that the demotivators are based on the perceptions of the
worker—not of management. Management may consider it perfectly justifiable to expect the
worker to change into his work clothes in his own time whereas the worker may
perceive it as an unnecessary restriction. How many managements ever ask the workers to
appraise their supervisors? Or check the relationship in the work group? And yet
inefficient supervisors cause many thousands of lost manhours of productivity, all too often
without the knowledge of management.
We have dealt here with the demotivators over which management has direct control. There
are other, off-the-job factors which some times have a greater influence on
motivation and productivity.
26 | Productivity

Mr Keshav Bhujle stretched out to quieten the alarm clock which was threatening to
jump off the box beside the camp bed. It was four-thirty and as cold as the welcome
he got from the timekeeper yesterday when he was late clocking in.
He felt as if he had hardly slept at all. It was nearly eight last night before he got
home. He’d had to work overtime because some fool had broken the line-feeder in
the middle of making up a rush order and it wasn’t repaired until four o’clock. By the
time he’d had a drink at Polly’s place and had something to eat it was nearly ten.
He lit the candle stub and tried to find his trousers in the crowded room. They
were on the floor where he had dropped them. Going outside into the frost-covered
yard he drew water and washed briefly. There was no time for food—nor any if he
had wanted it.
By five o’clock he left the shack and became one of the unrecognizable, hunched figures
shuffling towards the bus stop. There was already a queue and he had to wait for the next
bus. It was still dark when he reached the station and fought his way over the bridge to the
platform.
The train was already quite full and he had to stand. By the time he got to the city it was
six-thirty and he joined the group of workers walking towards the factory. A big man
caught his arm and said he had watched him working on the rush order yesterday. He was
working too quickly. If the study man saw him he would change the rate for the job and a lot
of people would lose their jobs. Jonas wouldn’t want that to happen, would he, he said,
giving his arm a brutal twist.
By seven, when it was just getting light, Jonas had clocked in, changed into his
coveralls and taken his place at his work station. When the buzzer went he yawned and
started another dreary day.
Motivators
The motivators are the conditions management can create to help each worker obtain
satisfaction from his work and produce of his best.
Motivators
Participation in decisions which affect them
Responsibility within defined limits
Feedback of results and recognition for good work
Interesting work—multiple tasks and self-control
Monetary rewards In line with achievement
There’s nothing startlingly new about those five points—they’ve been around a long time
and what they really boil down to is simply treating people like people and not as dis-
posable chattels. What is startling is that so few companies practice them when they can
have such a marked effect on productivity. Standard time study procedures show that
the difference between the output of an unmotivated worker as opposed to a motivated
one can be as much as 60%. The cost involved in making this improvement is a little
managerial time and effort.
Section Review • Productivity can be influenced by both physical and psychological factors. The
most important physical influences are utilization and efficiency.
• Utilization is the degree to which resources are converted into product whilst
efficiency measures the speed and accuracy with which they are converted.
• Manpower and machinery utilization is reduced by the time lost by the workers or
operators and by management inefficiencies.
Productivity | 27

• Manpower utilization is further reduced by the extra, unnecessary work done.
Similarly, machine utilization is further reduced by the rejects produced which
have to be scrapped or reworked.
• Material utilization is reduced by what is wasted before getting into the process
either by the users or by management inefficiencies. It is further reduced by
material spoilt in the actual process and scrapped.
• Both the speed and accuracy with which work is done can be accurately measured
to establish the efficiency of a worker and any physical barriers to standard output
can be corrected.
• Although the physical conditions of the work environment may be ideal,
psychological influences may still prevent the worker achieving standard output.
These influences may be expressed as motivators and demotivators.
• Demotivators are the conditions in the work environment which frustrate the
worker whilst motivators are conditions which help the worker obtain satisfaction from
the work and so help to increase his / her output.
• Eliminating demotivators and optimizing motivators is the cheapest and quickest
way to improve the productivity of any operation.
Agenda for Action What else do you intend to do now?
• Can you further develop your understanding of utilization in terms of manpower,
machines and materials appropriate to your work situation? If so, how will you go
about it?
• Can you identify the factors that cause extra work, cause rejects, or cause waste in
your organization? What will you do about these factors.
• Can you identify the physical factors at work that reduce efficiency in your
organization? What can you do about them?
• Can you reduce the effects or eliminate the demotivators at work? How will you
go about this?
• Are there some motivators that could be introduced into your workplace? Are
there some that could be further emphasized?
28 | Productivity

4. How to measure utilization and efficiency After completing this section you will be able to:
• Be able to apply the activity sampling technique to measure utilization
• Be able to apply the work sampling technique to measure efficiency
• Be aware of the technique of time study
• Understand the concept of work rating
• Understand the concept of standard time
So far we have been talking about how valuable it is to measure productivity but we
haven’t said much about how it can be measured. Let’s rectify that now.
Most manufacturing operations employ specialists to measure productivity and
set work standards. Larger service operators bring in consultants to help them when
necessary. Thus managers generally regard the measurement process as being a
complication which it is not
This is a pity, because there is nothing to match it as a means of really seeing what is
happening in the workplace, which is so necessary for innovative management. Hence
the recent stress laid on "managing by walking around" if you are searching for excellent
performance. We don’t expect to see CEOs clutching stopwatches but there is no reason
why supervisors, junior managers and even workers themselves can’t become involved.
It is really quite simple and can be done during the normal working routine. There are
three basic techniques involved, activity sampling, work sampling and time study. The
first measures utilization and the last two efficiency. Here’s how they work.
Activity Sampling
If you want to find out how much of their time workers are spending on the productive
activities which make up their jobs and how much on other non-productive activities, the
most accurate way is to watch an individual for a full day several times in a month and then
average the results.
However, this is not only time consuming and costly for you, it is also most
disturbing for the worker who will probably not behave normally when watched.
Activity sampling is a method which will overcome both of these problems provided you
can accept slightly less than a guaranteed 100% accuracy.
In our last chapter we talked about sampling in terms of quality control. Instead of
subjecting every item produced to a test, samples are taken at intervals for testing and
the results applied statistically to the whole production run. If 5% of the samples fail to
pass the tests then it is assumed that the reject rate for the whole run will be about the
same.
The same principle can be applied to work. First of all the work can be broken down
into its component activities or "elements" as they are called. Then, at random intervals,
the worker can be observed and the precise element being performed recorded. In its
simplest form, the elements of a job can be described as "work" and "no work" and can
be measured like this.
Productivity | 29

Taking 22 random observations of a worker during the day, it appears that 15 of them or
68% occurred when work was being done and 7 or 32% when no work was being done. If you
were to measure the shaded and unshaded areas of the diagram you would find that this is
approximately the actual division between them.
Note we say "approximately" because a sample can never give absolute accuracy. Obvi-
ously the more samples taken, the more accurate the results are likely to be. Also, the
greater the proportion of time taken up by an element the lower the number of samples
required to get a reasonably accurate result. Conversely, the smaller it is the more
samples you will have to take to be sure of "catching" it in your sample net.
To be precise you can calculate the number of observations needed to give you a
reasonable accuracy (95%) with formula "A". Alternatively you can use formula "B" to
tell you how accurate your result will be for any given number of observations.
A.
No. of observa-
tions for 5%
deviation
Where
B. � � � ��� � � �
� � Accuracy of n num- ��� �
� � ber of observations
n = number of observations
p = approximate time of element studied
L = accuracy as a percentage
In the detailed study of an oil refinery we quoted in the previous chapter the consultant
had to make several hundred observations because the elements were each a small part
of the total. However, if you wanted to check out a normal service or production opera-
tion (such as laborers digging a ditch) 50-100 observations would be sufficient to give
you a reasonable result.
Although making 100 observations may sound like a lot of extra work for a
supervisor or junior manager it can be done very easily if combined with routine visits
to the work site. For example, simply walking through an office, store or factory area five
times a day will provide 25 observations a week and 100 in a month. Preferably the visits
should be made at different random times each day if you want to cover the normal
working pattern.
Following a course in productivity awareness, the supervisor of a warehouse decided
to take an activity sample of the work done by his two forklift trucks. He decided to
take 100 samples by observing what they were doing every time he walked through
the warehouse, which was usually several times a day. The elements he wanted to
check were travelling, stacking, loading (standing with a pallet while it was being
loaded with cartons), idle and maintenance. At the end of a month he had these
results:
30 | Productivity

Machine 1 Machine 2 Using 1 truck
Travelling 32 30 62
Stacking 15 12 27
Loading 20 18
Idle 25 29 11
Maintenance 8 11
100 100 100
He saw from the figures that if he could eliminate the wasteful practice of having the
forklift stand while a pallet was loaded, and arrange for the maintenance to be done
outside normal hours, he could get by with only one forklift truck and still allow the
operator sufficient time to rest. This would double the productivity of his machine
resource and reduce his costs considerably, even allowing for maintenance being
done out of normal working hours. Doing the study didn’t add to his workload but it
did bring home to him how productive time was being lost through poor work plan-
ning and enabled him to manage his operation more efficiently.
Before starting a study like this you have to do two things—decide what elements you want to
check, and draw up a form to record your observations. When deciding what elements to
check remember that they must be visually distinct, i.e. you must be able to identify them at a
glance (it would be difficult to identify an employee thinking!). The form should be kept as
simple as possible.
Activity sampling, then, gives you a relatively easy way to check the utilization of
manpower and machinery, and provides an excellent base from which to move into
productivity improvement studies. However, we have agreed on the necessity for
measuring existing productivity before we select areas for improvement and this means we
need standards to measure against. Two of the methods of setting standards that we
mentioned in Chapter 2 were Work Sampling and Time Study.
Work Sampling
If you want to find out how long it takes to complete a piece of work you can do so quite
easily by recording how much has been done during the time you sample activities.
Time of 1st observation 0910 Pallets stacked 2
Time of last observation 1122 Pallets stacked 35
Time elapsed 132 mins Pallets stacked 33
Time per pallet = 132 / 33 = 4 minutes
This is the total time spent per pallet and includes all the unproductive time you recorded in
your activity sampling. Therefore to find the correct time it should take per pallet, you must
eliminate the unproductive time.
Observed time per pallet 4.0 mins
Observed unproductive time = 55 % 2.2 mins
Corrected time per pallet 1.8 mins
You can use this result to set a standard for the productivity of the forklift trucks and
can measure the present operation against the standard to find the present Productivity
Index.
Productivity | 31

Pallets per machine hour (observed) 60/4.0 =15
Observed unproductive time (standard) = 55 % 60/1.8 = 33
PI = observed / standard x 100 = 15 / 33 x 100 = 45%
So Work Sampling is a very quick and simple method of arriving at a standard for measuring
productivity. However, it doesn’t take into account the efficiency of the operator—it is based
on what is done rather than on what should be done. If you need a more accurate standard
you will have carry out a Time Study.
Time Study The purpose of time study is to establish a standard time for a piece of work—"stan-
dard time" being the time it should take an average, motivated worker (taking adequate
care and without undue stress or fatigue) to complete the work. It represents a pace of
working which can be maintained all day and should be a fair assessment of what can be
expected from a worker given the type of job and the environment in which it is per-
formed.
Standard time is a fundamental input to both production planning and productivity
measurement. It is commonly employed in manufacturing operations but is less
common (although equally necessary) in service operations. As we have said, time study
is usually carried out by specialist personnel; however, any manager with some time at
his disposal can apply the technique. In any event he should understand how it is done
and thus be able to accept (or reject if necessary) the standards to which his employees
are asked to work.
As in activity sampling, the first step in time study is to break the job down into
visually distinct elements. This is usually done by observing the job through several
cycles before starting the study. Next you need to obtain a stopwatch (preferably a
digital one that measures in decimals of a minute because decimals are easier to add and
subtract than seconds) and to design a form. Here is a simple one:
Element
No Description Watch Observed Rating Basic
Reading Time Time
These are only the headings—the form would probably extend downwards for 30 or so
lines. The first step is to enter the elements in order, describing each one and then num-
bering them. As soon as you are ready to start timing you wait for the beginning of the
first element and start the watch running, leaving it running until you have completed
your study.
As soon as the first element has been completed you record the time and continue
recording the time of completion for each of the elements in the same way. The time taken for
each element is found by subtracting the time of completion of the first
element from the time of completion of the next element, and so on through the study. This
time is called the "observed time" and is entered in the column provided on your form. You’ll
find the subtraction much easier if you start at the bottom of the form and work upwards as
we have done on the next page.
Adding up the times for all the elements will give you the total for the job. This is the time
taken by the person observed. But not all people are equally skilful at pouring beer. Some pour
it more slowly, others pour it too quickly and have to wait for the froth to subside. So an
individual performance like this is likely to be misleading unless you can relate it to a standard
performance.
The standard performance in this case is the efficiency of an average, well-trained
and motivated worker working at 100% of his / her ability. Since such employees are not
typical in most operations, how do you find such a standard performance?
32 | Productivity
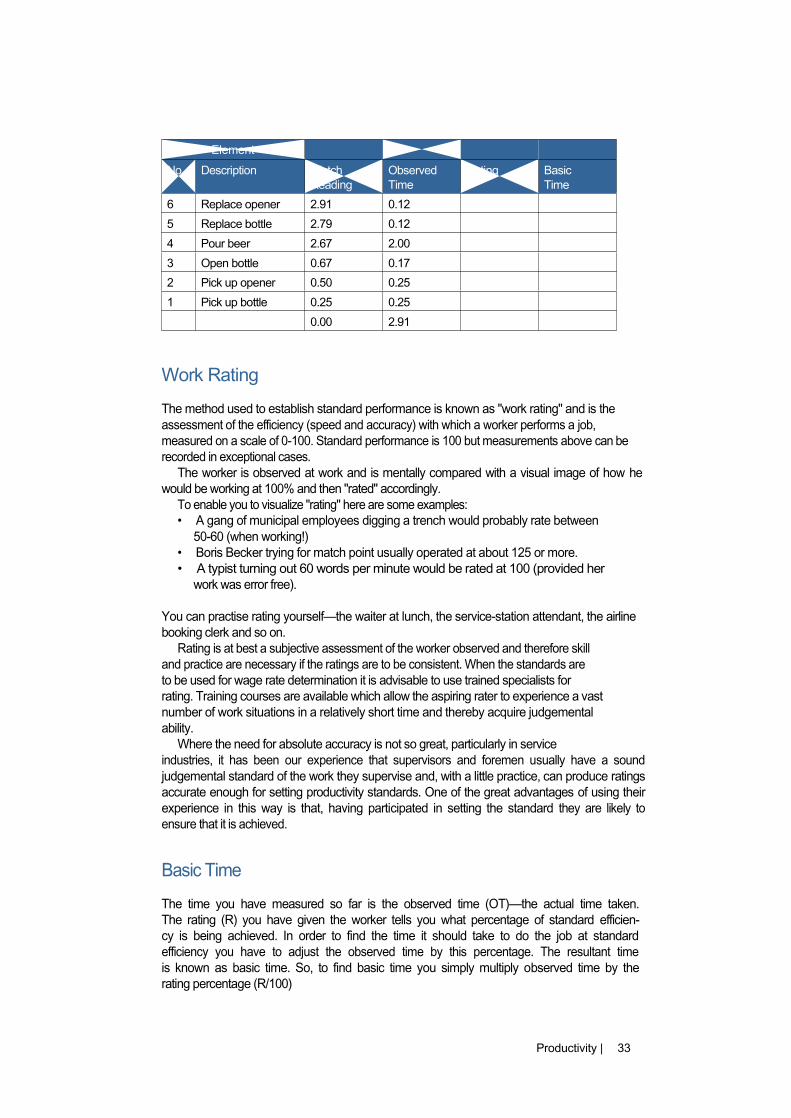
Element
No Description Watch Observed Rating Basic
Reading Time Time
6 Replace opener 2.91 0.12
5 Replace bottle 2.79 0.12
4 Pour beer 2.67 2.00
3 Open bottle 0.67 0.17
2 Pick up opener 0.50 0.25
1 Pick up bottle 0.25 0.25
0.00 2.91
Work Rating
The method used to establish standard performance is known as "work rating" and is the
assessment of the efficiency (speed and accuracy) with which a worker performs a job,
measured on a scale of 0-100. Standard performance is 100 but measurements above can be
recorded in exceptional cases.
The worker is observed at work and is mentally compared with a visual image of how he
would be working at 100% and then "rated" accordingly.
To enable you to visualize "rating" here are some examples:
• A gang of municipal employees digging a trench would probably rate between
50-60 (when working!)
• Boris Becker trying for match point usually operated at about 125 or more.
• A typist turning out 60 words per minute would be rated at 100 (provided her
work was error free).
You can practise rating yourself—the waiter at lunch, the service-station attendant, the airline
booking clerk and so on.
Rating is at best a subjective assessment of the worker observed and therefore skill
and practice are necessary if the ratings are to be consistent. When the standards are
to be used for wage rate determination it is advisable to use trained specialists for
rating. Training courses are available which allow the aspiring rater to experience a vast
number of work situations in a relatively short time and thereby acquire judgemental
ability.
Where the need for absolute accuracy is not so great, particularly in service
industries, it has been our experience that supervisors and foremen usually have a sound
judgemental standard of the work they supervise and, with a little practice, can produce ratings
accurate enough for setting productivity standards. One of the great advantages of using their
experience in this way is that, having participated in setting the standard they are likely to
ensure that it is achieved.
Basic Time
The time you have measured so far is the observed time (OT)—the actual time taken.
The rating (R) you have given the worker tells you what percentage of standard efficien-
cy is being achieved. In order to find the time it should take to do the job at standard
efficiency you have to adjust the observed time by this percentage. The resultant time
is known as basic time. So, to find basic time you simply multiply observed time by the
rating percentage (R/100)
Productivity | 33

Basic Time =
Observed Time x Rating
100
In the example overleaf we have rated each element but, in practice, since the total
operation is less than 1.5 minutes in duration, you could rate the total operation and use this
average to determine basic times. We have only shown one cycle of six elements in our
example but, in practice, you would need to take several cycles and average them to arrive at
an accurate basic time for the job.
Element
No Description Watch Observed Rating Basic
Reading Time Time
6 Replace opener 2.91 0.12 100 0.12
5 Replace bottle 2.79 0.12 80 0.10
4 Pour beer 2.67 2.00 75 1.50
3 Open bottle 0.67 0.17 60 0.10
2 Pick up opener 0.50 0.25 80 0.20
1 Pick up bottle 0.25 0.25 75 0.19
0.00 2.91 1.76
As a rough guide, if the principal element of the cycle is longer than 1 minute, and the
variation between times is not more than 0.3 minutes, averaging 15 observations will give
you an accuracy within 10%. If your variation is greater than 30% you will have to take more
times but it will seldom be necessary to take more than 30.
Relaxation Allowances
Basic time tells you how long it should take a motivated worker to do the job working without
stopping, but not even a highly motivated worker can work all day without rest. So some time
has to be allowed for rest and personal needs. This time is calculated at a percentage of basic
time and the usual standard allowances are those agreed by the International Labor Office (ILO).
Here are some of them:
Rest and Personal Allowance
Men Women
A: Always given
Basic Allowance 9 11*
B: Given where necessary
Standing 2 4*
Awkward position 2 3
Use of force 2.5 Kg 0 1
10 Kg 3 4
20 Kg 10 15
Monotony 2 1*
So a barmaid, pouring beer, would be allowed 11* + 4* + 1* or 16% of 1.76 minutes
which is 0.28 minutes. This added to her basic time of 1.76 would give a total of 2.04
34 | Productivity

minutes per bottle. At this rate she would be expected to open 29 bottles per hour
(60/2.04 ) and be able to chat to you for 10 minutes per hour. This would certainly not be
fast enough for the rush hour in any bar and you would have to find ways of making the job
easier so that she could produce more without expending greater effort or upsetting the
customers!
Process and Special Allowances
An operator working with a machine will often have to wait for the machine to com-
plete an element before being able to commence the next element of his / her work.
Operator Machine warms Operator loads Machine pro- Operator un-
switches on up machine duces widgets loads widgets machine
This enforced idleness is treated as a process allowance and the actual time involved in
waiting for the machine is added to the basic time. Special allowances cover items which do
not occur on each cycle such as start-up, shutdown, cleanup, etc. These are prorated
across the working day and added as a percentage to basic time:
Start-up 10 minutes
Shut-down 05 minutes
� �� �� ���
Total 15 minutes
Work day 480 minutes
Special Allowance 15/480 = 3%
Standard Time
Finally we arrive at the "standard time" for the job by adding all the allowances to the basic
time:
Basic time + Personal allowance = = Standard time
+ Process allowance
+ Special allowance
Standard time, if correctly calculated will give you an accurate tool for comparing with results
to measure productivity indices and for estimating and planning production; dividing the time
per item into the minutes per hour will tell you how many can reasonably be expected per
hour. It has other uses:
Productivity | 35

Stevedore labor loading cases of fruit into refrigerator ships had traditionally worked in
gangs of four men, three gangs to a dock side crane. The crane landed a metal pallet of
cases in the hatch and the men then removed them, carried and stacked them manually. It
was very hard work.
A couple of years ago the shippers changed the method of shipment to pre packed
pallets which were dropped three at a time into the hold and then positioned by
a forklift truck. The work of the men was now restricted to releasing the slinging
mechanism when the pallets landed in the hold.
The shippers wanted not only to reduce the number of gangs to one, but also the size of
the gang to two men. The men’s union objected strongly to the breaking up of the
traditional gang. However, after some discussion, it was agreed that a time study would be
carried out jointly by the union and the shippers.
Once the study had been completed and the results tabled, it was clear to both
parties that not only could two men easily perform the work but that, due to the long
process time whilst the crane swung from ship to shore and back, they could service two
cranes and still only have to work for 30% of available time.
The union accepted the study but asked for the provision of a third man as standby
to relieve the other two when they went to "relieve" themselves. The shippers were
happy to make this concession and the men got an easier and more productive job.
Dealings with unions involving manning levels, rates, times and so on, are often made
easier by a thorough knowledge of the job seen through the dial of a stopwatch
As you can see, assessing a standard time requires a fair amount of appreciation and,
as we said at the beginning of the chapter, we don’t expect to see all managers rushing
around with stop watches. However, we have found over many years of experience that
simply exposing managers to the technique of time study greatly enhances their un-
derstanding of the job and the problems of productivity improvement. As such it’s well
worth the time involved.
Section Review • Even if not able to carry out work studies themselves, all managers and
supervisors should understand the basic technique of activity sampling, work
sampling and time study because it will assist them in applying the work standards
required of their employees.
• Activity sampling is a method of analyzing the utilization of manpower and
machinery by making observations during the work period and recording what is
happening at the precise moment of observation. These observations can then be
summarized and expressed as a percentage of the total time.
• Work sampling is an extension of activity sampling in which the work produced
during the period of observation is counted and a rate per unit of time calculated.
• The purpose of time study is to establish a standard time for a piece of work. The
standard represents the time it should take an average, trained and motivated
worker to do the work.
• The average time to complete an element or a complete job is known as observed
time (OT). The rate at which the observed employee is working is compared to a
performance standard (100) and allocated a rating (R) as a percentage of standard
performance.
• Observed time is then corrected by multiplying it by the rating percentage, the
result being the basic time for the job. Allowances for personal rest and relaxation,
process time, and non-cyclic occurrences are added to basic time to arrive at a standard
time for the job.
36 | Productivity

Agenda for Action What else do you intend to do now?
• Do you and other members of your organization, know how much productive
time is being spent on the job by members? Do you / others know how much
unproductive time there is?
• Do you and other members of your organization, know how long it takes to do
certain jobs / tasks?
• If you or others knew how much productive / unproductive time there was and
how long it took to do certain jobs, what action could be taken.
• Who would be affected?
• How would output be affected?
• What would happen to costs?
• What would be the potential benefits to the customer?
Productivity | 37

38 | Productivity

5. Ways to improve productivity After completing this section you will be able to:
• Look at work critically to look for productivity improvement potential
• Select and critically examine work
• Develop an alternative improved method
• Apply and measure the improved method
We have spent some time discussing how productivity can be measured as a necessary
prelude to its improvement and we have seen that often the process of measurement
alone will indicate what must be done to correct or improve a position. However there
will be many occasions when the fault and its remedy may not be so apparent.
It has been said of productivity improvement (as of many other exercises) that it is 10%
inspiration and 90% perspiration. Inspiration certainly has its place in productivity
improvement but, unfortunately, there is no way of escaping the perspiration involved in a
methodical approach to the problem—so that is where we will start.
Method Study
The first, and most common, approach to improving productivity is known as method study.
It comprises a series of six steps which lead to the development of new and improved ways of
doing a job.
• Challenge
• Record
• Question
• Develop
• Apply
• Measure
Challenge
The first step in the method is to "Challenge the necessity of the operation"—is it really
necessary for it to be done?
This may sound a bit presumptuous but you would be surprised how often asking such
questions as "Why is it done? "Is it really necessary?" and getting honest answers will uncover
situations which perhaps were once necessary but are no longer.
It was a long standing instruction in the maintenance workshop of a large process
plant that the bearings of every electric motor repaired in the shop would be renewed. This
instruction was applied no matter how long the motor had been running since its installation
or previous overhaul.
The annual cost of replacement ran well into six figures. After attending a
productivity awareness course run by the company, the workshop manager decided to
question the necessity of this automatic replacement. On investigation it appeared that the
instruction had been issued several years before when the plant was operating to its full
capacity and few of the operations had standby motors.
Today the position had changed considerably. Not only was the plant working well
below capacity but also almost every key motor in the plant had a standby in case of
failure and therefore stoppage through bearing failure would not affect the process. He
obtained approval to cancel the instruction and today only bearings which fail to pass
a running test are changed. The cost of bearing replacement has been reduced by 75%.
Productivity | 39

Record
If the job is necessary and cannot be eliminated or combined with another then the next step is
to analyze it.
First the job must be broken down into its elements and their sequence recorded.
This can be done in several ways depending on the complexity of the job. Usually a
simple listing of the elements will suffice but if the operation comprises several jobs,
such as the making and assembly of a number of components, it will be necessary to
draw a diagram showing the path followed by each component, the complete assembly
or the person being studied. To help you identify just what is being done in each element
a simple code is used:
����� The more operations there are in a job the longer it will take. The further the operator or
material moves the more effort and time is required. Checking an item may be necessary to
ensure quality but every inspection takes time. Delays are obvious time wasters whilst storage
of finished or semi finished products costs money.
Every element takes time to complete so a clear picture of the elements involved in any
operation is a prerequisite to any attempt to change it. A detailed study will supply the
evidence as to where utilization and efficiency can be improved.
Making tea
Symbol Description Distance Time
Take kettle to tap 2 metres 5 seconds
Fill kettle 10 seconds
Return kettle 2 metres 5 seconds
Switch on 2 seconds
Lay tray 25 seconds
Fetch milk 4 Metres 8 seconds
Put tea into pot 8 seconds
Wait for kettle to boil 45 seconds
Fill tea pot 9 seonds
Wait for tea to infuse 45 seconds
Check before serving 12 seconds
8 metres 174 seconds
40 | Productivity

A total of 5 operations, 8 metres of transportation, 2 long delays and an inspection—if you
drank black tea instead you would eliminate at least 4 elements!
Question
Children tend to drive their parents to near-insanity by continually asking, "Why?" on
every topic and issue raised. The parent’s reaction to this irritant often leads the child to adopt
an unquestioning acceptance of the status quo in later life, which may make a good citizen
but makes a bad method study person.
In order to improve productivity you need to cultivate an inquiring and sceptical
mind which refuses to accept that there can’t be a better way of doing things. To help
you we suggest the use of a simple questioning routine based on Kipling’s "—six honest
serving men who taught me all I knew; their names are what and why and when, and
how and where and who."
Question every element
What is achieved? Why is it necessary?
When is it done? Why at that time?
Where is it done? Why at that place?
Who does it? Why that person?
How is it done? Why that way?
Frank answers to these challenging questions will lead you to consider ways of eliminat-
ing or combining elements, changing the sequence or timing of elements, changing the
workplace or facilities, changing the person concerned or retraining them. The final
question opens the door to improving and simplifying the method by reducing effort,
movement and time.
Develop
There is one place where inspiration will help considerably and that is in the develop-
ment of a new method or way of doing things which will be an improvement in terms
of utilization, efficiency and overall productivity. This is also the place where "two heads
are better than one", in fact the more "heads" you can involve in your search for im-
proved methods, the more likely you are to come up with some original and effective
solutions.
Over-familiarity with a situation can often prevent you from seeing it objectively,
whilst "ego involvement" (being responsible for the present position) will act as a
deterrent to thinking creatively about change. For these good and common reasons it
is often helpful to use a brainstorming technique to develop new ways of doing things.
The technique is well known but works well only if some simple but important rules are
followed:
Brain-storming
• Choose participants
• State objectives clearly and restate frequently
• Record all suggestions
• Do not allow judgement or criticism
• Go for quantity
Productivity | 41

Once you have sufficient suggestions (at least 20) you can start to eliminate those that won’t
pass through all of the 4Rs filters
4 R Filters
• Do you have the RESOURCES called for?
• Are there RESTRAINTS that apply
• What will be the employees REACTION?
• What would be the RESULT of the suggestion?
The suggestions which pass this filtering process can then be evaluated in terms of lowest
cost, least amount of change, greatest improvement and so on, to arrive at the preferred
new method.
Apply
Now comes the real test of your ability when you apply the new method for the first
time. Usually this is only done after the new method has been tried out and any snags
eliminated. This can take quite a while, particularly if production is not to be affected.
If those concerned in the operation have participated in the development of the new
method you should not have too much trouble in introducing it, provided you have
dealt honestly with any objections or fears they have expressed. If the new method is
to succeed it must benefit employees as well as the organization as a whole. Employee
benefits can include:
Some employee benefits
• Reduced effort
• Reduced stress
• Increased interest in job
• Increased job satisfaction
• Improved financial remuneration
• Increased responsibility
• Improved status
• Improved promotion prospects
• Improved opportunities for socializing
• Improved job security
If the employees have not participated in the development of the new method, no matter
how small the change, it is vital that it be discussed in depth with them or their representa-
tives before it is introduced. You should anticipate their fears that the change will make the
job more demanding or that it will threaten their security in any way and be fully prepared
to take whatever action is necessary to make the change acceptable to them.
Failure to gain their confidence at this stage can severely affect the improvement potential of
the new method and can even, in bad cases, lead to an overall drop in
productivity through non-cooperation by the employees. Even if you have their
cooperation don’t expect an immediate improvement—it takes time for people to learn new
skills and to settle down. It is usually desirable to provide increased supervision and guidance
during this period to speed up the settling down process. 42 | Productivity

Measure
Assuming that you have safely overcome the application hurdle, the final step in method study
is to measure the productivity of the new method and compare it with the old. Did we say "the
final step"? Of course, in productivity improvement there never is a "final step" because as
soon as you have made an improvement you will want to start looking for other ways to improve.
It’s a never ending process.
Value analysis
We have been talking about changing methods. There is a very similar technique for looking
critically at the product itself—be it a physical item or a service. This is known as value
analysis or value engineering. Its objective is to reduce the cost of a product without affecting
its quality, i.e. its ability to perform its designated task.
In exactly the same way as a job is broken down into elements so a product is broken down
into its components. The function and cost of each component is then analyzed and items
which show a potential for economy are selected for further study. Each
component is subjected to a series of questions. Here are some of them:
Value analysis questions
• What function does it perform?
• Is its capacity greater than needed?
• Can it be made from another material?
• Can material wastage be reduced?
• Could a standard component be used?
• Can manufacturing tolerance be used?
• How vital is the finish?
• Could manpower and or machinery content be reduced?
The next step is to create methods or designs which will achieve the desired economy.
Finally the new product is tested to ensure that its function and value have not been
impaired by the change.
A large company which had imported all its machinery was in the habit of automati-
cally ordering spare parts from overseas through the manufacturers. As a productivity
project one of its engineers studied a sample of eighteen components and was able
to source two-thirds of them locally at greatly reduced prices, leading to a saving in
excess of £20 000 per annum. One item in particular graphically illustrated the worth
of value analysis. This was an igniter for an oil-fired furnace which cost in the region
of £200 ex Europe. Careful examination of its function showed that it could be per-
formed equally well by a standard motorcycle spark plug costing £1.50 locally.
In the global market economy such exercises become increasingly important if costs are to be
contained. Reducing costs by lowering standards is relatively easy and, in some cases,
economically justifiable. Reducing costs without lowering standards is much more difficult but a
necessary and important part of productivity improvement. Productivity | 43

Loss control One of the questions raised in value analysis is whether wastage of material can be
reduced. That question referred to a particular component under study. But of course,
as we have seen in some earlier examples, since materials make up a major cost item in
most products, the reduction or elimination of wastage will improve productivity.
Material is wasted in many ways as we saw in Chapter 3. Constant attention to the
causes listed will ensure such losses are minimized.
One cause of loss not previously listed is that resulting from accidents. An accident causes
damage to manpower, machinery and materials which has to be repaired or
replaced at a cost in time and money—expenditure which is completely nonproductive.
Therefore any steps taken to avoid accidents by eliminating potential hazards can be
justified in productivity terms.
Instituting a "safe working" programme alone may not do a great deal unless you have the
wholehearted cooperation of both supervisors and employees, both of whom have important
roles to play. Workers are always tempted to short cut safety practices— safety helmets are hot
and uncomfortable, monkey belts take time to put on and take off, machine guards slow down
work cycles, and so on. This means that supervisors must always, and without exception,
correct breaches of safety regulations. And workers must participate in drawing them up and in
administering them.
Finally the CEO must be seen to be a safety fanatic. Whenever he walks around his
operation he should be on the lookout for breaches of safe working practices and draw these
immediately to the attention of whoever is in charge. That way all the staff will know that the
programme is for real.
Motivation
As we saw in Chapter 3, the inexpensive way to increase productivity is to improve motivation.
However, whilst it is inexpensive, it certainly isn’t easy. Some supervisors are taught how to
build and maintain good human relations with their workers, and are shown how eliminating
the demotivators and supplying them with the motivators they needed can increase their job
satisfaction and productivity.
Others corporate culture emphasise how to apply disciplinary and grievance
procedures, and how to protect themselves when accused of unfair labor practices. This
change of emphasis has caused many supervisors to alter their perception of the labor force
from co-workers to adversaries.
The presence of an active union does not preclude the participation of workers
in decisions which affect them (worker participation does not mean management
abdication). Nor does it hinder the setting of clear responsibilities and the essential
feedback of progress towards objectives. It does not prevent the restructuring of jobs to
make them more interesting and rewarding. Neither does it prohibit any organization
from allowing workers to share in the monetary benefits of increased productivity.
Any or all of the above will improve employee motivation (at any level). Motivated
employees are generally less likely to take industrial action than unmotivated,
dissatisfied employees. Given the tremendous difference in output between motivated and
unmotivated employees perhaps it is time we considered the advantages of a
proactive attitude towards motivation as opposed to the potential productivity losses
stemming from a reactive attitude towards workers’ demands.
44 | Productivity

Economic feasibility
Cost is the usual basis for the selection of operations, sections, or departments likely to benefit
from a productivity investigation. It should nevertheless be remembered that it is not
necessarily the work with the obvious faults that offers the most valuable improvements. The
following symptoms in an organization indicate where investigations are
likely to bring worthwhile savings:
Areas with potential benefits
• Poor use of manpower, materials or machine capacity, resulting in high scrap or
re-processing costs
• Bad layout or operation planning, resulting in unnecessary movement of materials
• Inconsistencies in quality
• Highly fatiguing work
• Excessive overtime
• Employees complain about their work without logical reasons
The economic feasibility of any method study investigation should be ascertained before
commencement. If the study is likely to achieve the following results sufficiently to make the
study worth while, then do it.
Project feasibility potential results
• Increase production and reduce costs
• Maintain it with less manpower, materials or machinery
• Improve quality without additional manpower or equipment
• Improve safety conditions
• Improve standards of cleanliness and housekeeping
• Reduce scrap
Redundancy
In the minds of many workers productivity and redundancy are synonymous. Unfortunately
their belief is often reinforced by the ill-considered utterances of management who link the
two in public statements and private behavior which the unions are quick to exploit.
It would help if the use of the word "redundancy" were restricted to the side effects of a
reduction in production for whatever cause— shrinking or lost markets, recessions,
downturns and so on. When these occur it is necessary to reduce the work force
proportionately so that the organization may retain its profitability and thus protect the jobs of
the survivors (layoffs in the motor industry are a typical example of redundancy at work).
Increased productivity seldom results since the potential capacity of the
organization is no longer being fully utilized.
On the other hand the objective of productivity improvement is to increase
production and/or reduce costs (of which only one element is labor). Improving
a product’s ability to compete in the market will usually increase demand thus
increasing its sales and creating more job opportunities. In the few cases where method
Productivity | 45

improvement creates surplus staff these can usually be retrained and employed in the
additional work thus created. If they do have to be separated there should be adequate
funds stemming from the improved contributions to ensure they are generously treated.
One thing is certain and that is that mixing a redundancy programme and a
productivity improvement programme is fatal to the latter. The advice of those who have tried it
and suffered is clear—get rid of your surplus staff before trying to improve the productivity of
those who are left.
Section review • Any steps which improve utilization and efficiency of resources will improve
productivity. • The most common approach to productivity improvement is method study. This
comprises six steps which first challenge the necessity of the operation and then
analyze its elements in detail as a necessary preliminary to developing and applying a new
method.
• The objective of value analysis is to reduce the cost of a product without affecting its
quality. It follows a similar questioning routine to method study concentrating on
specific components of the product.
• Safeguarding materials from loss or damage can make an important contribution to
productivity as can the elimination of loss or damage to all resources due to accidents
by means of a "safe working" programme.
• Greater emphasis on the motivation of employees by their supervisors will pay big
dividends in increased productivity.
• Care should be taken not to confuse or integrate redundancy programmes with
productivity improvement programmes.
Agenda for action What else do you intend to do now?
• Do you now feel you have a systematic approach to the continuous search for
productivity improvement? What will you do with this new tool?
• Are there tasks, jobs, processes that you wish to investigate? How will you go about
it?
• Who do you need to involve and consult? Is any specialist help required? How will
you go about getting it?
46 | Productivity

6. How to measure and improve
clerical productivity After completing this section you will be able to:
• Be able to measure clerical utilization
• Be able to measure clerical efficiency
• Identify the causes of low clerical productivity and take appropriate action
• Explain the advantages of improving productivity in-house
Our overview of productivity measurement has so far concentrated on the operational
activities involved in manufacturing and service industries—the physical activities which
produce products and which can be determined and measured relatively easily. We have
deliberately avoided the area of clerical activity which supports such operations.
In most Western countries the number of people employed in the so-called "white collar
jobs" far exceeds those in traditional "blue collar" jobs. Really only major
companies tend to measure, monitor and improve the productivity of the clerical work
undertaken. Those organizations that have attempted the task, like their industrial
colleagues, have either employed specialist study personnel or have brought in
consultants. In doing so they have run into the same distrust of standards and resistance to
change which seem to beset such interventions.
It is not necessary to bring in specialists to measure clerical productivity or to
improve it. It can be, and should be, made a part of every supervisor’s job—just as we
have shown can be done in any operational situation . The key to the whole programme
is to encourage the participation of the staff themselves in both measurement and
improvement. The method we are about to describe involves the department manager,
the section supervisors and staff members. We will look at the role of each separately
starting with the most important people in any productivity programme—the staff who
are going to be affected.
Obviously before starting on a program of this nature it would be necessary to inform
the staff and also to train them in what they are expected to do. We will be dealing with
both of these aspects in a later chapter. In the meantime let’s assume they are all ready to
start.
Defining tasks
You have learned so far that the first step in any measurement process is to define what
is being measured. In the case of activity sampling and time study you reduced all jobs
to elements for measurement purposes. You have to do the same thing in clerical pro-
ductivity measurement except that elements of clerical work are usually referred to as
tasks.
So the first step is to get all staff members to draw up a list of the tasks which
comprise their jobs. Preferably this should be done in conjunction with their section
supervisors who must ensure that all tasks in the section are covered by one or more
employees’ lists. Generally the staffer will have a job-description or a work list covering
his or her job and this should describe the tasks. If, as is likely, the job description is out
of date, now is the time to update it. If a job description doesn’t exist this would be a
good time to draw one up, preferably in conjunction with the staffer concerned.
Productivity | 47

Measuring clerical utilization
The same factors affecting manpower and machinery which we discussed in Chapter 3 are
equally applicable to clerical work. Thus in any programme for increasing productivity your first
job is to measure the utilization of your staff and machines.
Provided the tasks can be visually determined it is possible to do this by activity
sampling using the technique we explained in Chapter 4. However, in many clerical
operations it is difficult to see precisely what is being done ("thinking" can’t be seen nor its
objective determined by an observer). For this reason it has been found preferable to
encourage the staff members to measure their own work.
This method, although not as accurate as professional activity sampling, has many
advantages. It allows the staffer to participate in the programme at an early stage. It
creates an awareness of time wasting activities. It highlights areas where productivity can be
improved and develops an understanding of why measurement is so valuable.
Utilization can be measured very easily by having the employees keep a daily diary or
log of how their time is spent. The basis of the log is a matrix with the hours of the day running
across the top and the minutes per hour down the side like this:
0800 0900 1000 1100 1200 1300 1400 1500 1600
02 P
04 P
06 P
08 A
10 A
Etc
58
The employee and supervisor then devise a simple code to cover both productive time
(agreed tasks) and nonproductive time, such as waiting for work, interruptions, phone,
walking, rest and so on. To complete the log the employee blocks in the time spent on each
activity during the day as it is completed and identifies it with a code letter. In the example
above the employee spent from 0800 to 0805 using the telephone (code "P") and then went
on to task "A" (whatever that might be).
At the end of the day the time blocks are added by codes and then separated into
productive and nonproductive time. The total of the two should equal the official
working hours, whilst the productive time expressed as a percentage of working hours will
indicate the utilization being achieved.
Observed Time x Rating = Utilization
100
The number of days needed to give an accurate picture of the job will depend on
its nature. If the job is cyclical (i.e. if the work varies from day to day or week to week) it will be
necessary to log sufficient days to capture all the normal cycles. If the job
involves roughly the same work each day, four or five days will be sufficient. Analysis of these
simple logs can provide a great deal of valuable information which can help the employee to
avoid lost time and extra work.
Causes of lost time
• Poor work planning • Information search
• Inadequate facilities • Nonproductive interruptions
• Productive interruptions
48 | Productivity

Nonproductive interruptions include telephone calls (not work connected) and socializing.
Productive interruptions include meetings (and more meetings!) both formal and informal—
particularly the latter.
A senior executive was once asked by a consultant how much of his time was taken up by
meetings. He said he didn’t know but thought it was about 30%. The consultant suggested
he get his secretary to keep a log for him for a few days.
At the end of three days his secretary gave him this breakdown:
Formal meetings with colleagues 5%
Formal meetings with subordinates 7%
Formal meetings with clients, etc. 6%
Informal meetings with colleagues 9%
Informal meetings with subordinates 23%
Informal meetings with clients, etc. 5%
55%
The consultant suggested that he investigate why it was necessary for his subordinates
to take up so much of his time (30%). It could be lack of delegation or training or
both. If he could reduce this time he would not only increase their productive time
but also be able to spend more of his own time with clients or on other more produc-
tive responsibilities, such as planning or controlling. The executive was so shaken by
the result that he cancelled all his meetings for that day and spent the time planning
how he could improve his delegation to reduce time-wasting informal meetings.
The final step in measuring utilization is for the staff member to draw up a task list record-
ing the tasks in order of importance together with the percentage each forms of the total
work load, the factor which influences the volume of work and the monthly work volume.
Task list
Name:
Position:
Department:
No Task % of Total Control Monthly
Work Load Factor Volume
1. Check invoices 30 Purchase Orders +3000
2. Prepare payments slips 5 Invoices +500
The "percentage of total work load" can be estimated from the time logs already prepared by
the staff members. The "control factor" is whatever influences the work load (e.g. the more
purchase orders issued, the more invoices received) and is helpful when planning and
balancing work loads, as is the "monthly volume" figure. The completed task lists are
collected by the supervisor who needs them for the analysis of the total
work load he will carry out later.
Measuring clerical efficiency
Clerical efficiency (i.e. the time taken to complete a given task accurately) can be mea-
sured by time study in just the same way as other work. However it can be disturbing for
Productivity | 49

the employees who also may not accept the time standards resulting from it. Here too it is
preferable to let them participate by timing themselves.
It has been found in practice that employees will generally try to give an accurate
assessment and, in any case, any attempt to "cook the books" can be spotted fairly easily by
comparing one staffer’s time with another’s.
The first step is for the employee to agree with the supervisor on the task to be
studied and how many items are to be timed. The staffer then selects a batch of items
representing between 10 and 30 minutes of work and proceeds to work through
them recording the time started and time finished for each item. Tasks taking longer
than 30 minutes should, if possible, be broken down into several, shorter segments.
Interruptions must be excluded from these times as these have already been measured
by the "time-log" procedure.
Work Sheet
Name: Task:
Position: Checking supplier invoices
Department:
No. Reference Started Finished Taken
1. ABC company 3399 0900 0906 6
2. XYZ company 3400 0907 0912 5
Etc.
It is essential that the staffers fill in the worksheet as they go along so that the times
are factual and not "guesstimated". After a little practice they will be able to do this
without unduly affecting their normal work. As and when they have a few minutes of
spare time they can summarize the forms and pass them on to their supervisor.
No of items 10 Total time taken 65
Av time per item 6.5
Signed add Allowance (16.7%) 1.1
Checked Standard Time 7.6
The allowance of 16.7% (or 10 minutes per hour) is an accepted allowance to cover rest and
relaxation for clerical workers and is added to the average time per item to arrive at a standard
time per item for that task .
You will probably find that their first lists will contain some items which took an
exceptionally long time. Rather than increase the number of studies in an attempt to reduce
the deviation to 30%, the easiest way to handle them is to treat them as separate tasks (e.g. long
invoices and short invoices). As the staff members complete their studies they will start to
compare their actual times with the standards they have given to their supervisors and will
work out for themselves what their daily targets should be. They will start to think about ways
to improve productivity.
Putting the measurements to work
It will take several weeks to collect standard times for all the clerical jobs in a section but once
these have been completed you have the raw material for a powerful productivity
measurement tool which will enable you to measure the productivity index of a section, a
department or the whole administration function of an organisation. The first step is to group
tasks by activities (e.g. all the tasks which make up the payroll activity) and calculate the
monthly total time required for each task.
50 | Productivity

Monthly Volume x Standard Time = Monthly total (hours)
60
Adding the monthly totals for each task making up an activity will give you the total time
(standard time) that should be spent on that activity per month. Similarly, adding up all
the activity times will give you the total workload for the section, department or organiza-
tion expressed in hours of work or "manhours" as we prefer to call them. You can find the
number of hours actually worked by simply multiplying the number of staff employed by
the hours they should work per month. Comparing this with the standard manhours that
should have been worked will give you a productivity index for the operation.
Total standard manhours x 100 = Clerical productivity index
Manhours actually worked
If you want to translate this result into numbers of people all you have to do is divide the
total standard manhours by the number of hours in a working month to find how many
people you should have (A) and compare this with the number you actually do have
(B). If "A" is bigger than "B", show the figures to your boss and suggest that it is time you
were suitably rewarded. If, as is more likely, "B" is bigger than "A" on no account let your
boss see the figures until you have a plan to improve them, so that, like all successful
managers, you can present him with the problem and the solution at the same time.
Improving clerical productivity The basic methods of work study and improvement discussed in the previous chapter
apply equally well to clerical work, i.e. breaking work down, challenging each step, elim-
inating or combining work and developing new methods. The major difference is that in
this area we believe the employees should be trained and encouraged to carry out their
own studies and suggest improved methods. The reasoning behind this is threefold.
• Firstly, they are closest to the actual work and therefore often know of bottlenecks
and problems which are hidden from the supervisor—file drawer which jams, a
temperamental photostat machine, slow printers, etc.
• Secondly, if their ideas are accepted they will want to see them successful and
will work towards that end, thus probably ensuring their success and the ensuing
saving.
• Thirdly, analyzing their work and developing new methods gives them a new
interest in their jobs, improving their overall motivation.
One day the management of a large laundry introduced an employee suggestion
scheme with cash prizes for the most productive suggestions. It was well supported and a
number of worthwhile entries were received.
In due course the managing director presented the prizes in the staff canteen. First prize
went to an elderly woman who had been with the company for many years and who had
suggested a novel and efficient way of sorting colored and white garments during reception
which would save the company many thousands of £s.
When the managing director presented her with her prize he remarked, "l suppose this
idea of yours is a result of the many years of experience you have had in your job?". "Oh, no
sir!" she replied, "l got this idea ten years ago when l first joined the company but no one has
ever asked me before".
Earlier on we gave you five causes of lost time. Here are some remedies:
Productivity | 51

Cause Remedy
Poor work planning • Eliminate bottlenecks
• Balance workload (measure first)
• Eliminate cyclical peaks
In most offices the end of the calendar month is a good time to go off sick! Invariably the staff is
expected to handle 30-40% of the monthly work load over 3 or 4 days. Mistakes are made,
tempers fray, machines break down. Productivity suffers.
There are many ways of eliminating these peaks such as staggering returns and
deadlines. One highly successful method is to work a 13 month year—each "month"
exactly four weeks long. This moves the heat off the calendar month end and, as a side
effect, provides exactly comparable periods for productivity and performance statistics.
In fact all it needs is for the problem to be identified and many solutions will be
suggested.
Cause Remedy
Inadequate facilities • Reschedule work
• Reallocate equipment
• Increase capacity
In many offices today the problem is often to fully utilise the equipment provided
rather than the inadequacy of facilities. Where such a problem does exist it can often be
overcome be rescheduling work so that everyone doesn’t need the computer terminal or
adding machine at the same time. Reallocating facilities such as space may often be nec-
essary and, as a last resort, increasing capacities may be justified if it results in a greater
increase in productivity.
Cause Remedy
Information search • Reallocate information source
• Improve information storage systems
Studies indicate that much time is wasted searching for information needed to process work. A
careful study of time lost in this manner may indicate the value of updating the information
filing and retrieval processes.
Cause Remedy
Non-productive interruptions • Keep phone calls brief
• Discourage excessive socializing
Once you start to measure clerical time in a time log you will become painfully aware
of the vast amounts of time lost in phone calls. First of all it interrupts the work flow
and this takes time to get moving again Then there is the time wasted in saying "Hello"
and "Goodbye" and the endless repetitions of questions and answers. If you want a rude
shock, attach a tape recorder to your phone for a day and play it back at the end of the
day. It is possible to be brief and to the point without being rude and it’s a style that
should be cultivated.
Some degree of socializing or office networking should be cultivated, it is good for
morale and communications. Gossiping or whatever it’s called in your office should not
be. Every office has its share of gossips but the trouble is they waste two people’s time,
theirs and that of the people they trap. This can add up to quite a few manhours by the
end of the day.
52 | Productivity

Cause Remedy
Productive interruptions • Avoid unplanned meetings
• Keep meetings short
Calling an unplanned meeting on the spur of the moment means that, apart from you, the
other participants will be unprepared and therefore unable to give their best contribution. It
also means that those attending will not have had time to reschedule their work and are
therefore probably holding up the work flow of others. The effect cascades down through the
organization.
Allowing subordinates to call on you at any time (the once popular "ever open door") will
wreck your own work scheduling.
A busy and successful executive developed an effective method of reducing the length and
frequency of time-wasting interruptions by both colleagues and subordinates
without keeping his door shut. If anyone came to see him without a prior appoint-
ment he would stand up to greet him and remain standing until the visitor left. Since the
visitor could scarcely sit whilst he was standing the interviews were usually brief and their
frequency reduced, their place being taken by pre planned meetings which fitted the work
schedule of both parties.
There are many videos and books about the time wasting capability of planned meetings.
They all emphasise four basic rules:
Rules for meetings
Always • Draw up written objectives (i.e. results to be achieved)
• Set a start and finish time and stick to them.
• Distribute an agenda ahead of the meeting.
• Keep a written record of results achieved.
Writing out the meeting objectives will force you to describe accurately the results you
expect to achieve and setting time goals will at least limit the amount of time you will have
wasted if you don’t achieve them.
The agenda not only sets the priorities for discussion, it also gives all those attending the
responsibility of preparing thoroughly. A written record of results will provide
sombre evidence of your success or failure in running a productive meeting.
Keeping it going
The novelty of a productivity measurement and improvement programme conducted by the
employees themselves will ensure a flow of productivity improvement suggestions for some
time but, unless artificially stimulated, this flow will dry up and they will slowly return to the
bad old habits. Some ways to keep it going are:
• Group projects
• Job restructuring
• Client / supplier relationship
• Brainstorming problems
• Regular reviews
• Incentives
• Publishing PIs showing trends (moving averages, curve fitting)
Productivity | 53

Giving a small group of employees a problem to investigate and solve helps to keep their
creative juices flowing and renews their interest in productivity—it also takes a load off
the supervisor. Some thought can be given to restructuring jobs to increase responsibil-
ity and interest.
Allowing people to check their own work is one way of achieving this which leads
to the establishment of client /supplier relationships—the staff member supplies output
mate rial to another staff member (client) in another section or department, instead
of pooling the output and supplying it to an unidentified client section or department.
Personalizing the relationship in this way increases the feeling of responsibility and job
interest.
Often asking the staff (agenda) to participate in a planned (timed) brainstorming
meeting to resolve a section or department problem (objective) will provide an excellent
opportunity to rekindle their enthusiasm for productivity improvement.
Finally, a regular review of workloads by re measuring tasks will provide a constant
incentive towards productivity improvement.
Section review • The measurement and improvement of clerical productivity should be a part of
every supervisor’s job and should involve the staff members doing the work.
• Before starting to measure clerical productivity it is necessary to break all the
work done in the department or section into tasks.
• Utilization of the clerical work force can be measured by having each staff
member keep a time log for a number of days. Analyzing the time log will
highlight where time is being wasted.
• The easiest way to establish the workload in a section, department or organization
is to have each staff member measure the time taken to complete a number of
batches of work, item by item.
• These times can be averaged to give an average per item to which is added an
allowance of 16.7% for rest and relaxation. The resultant figure is the Standard
Time per item.
• Multiplying the standard time by the number of items handled per month will
give the total time allowed on each task per month.
• Adding the results for all tasks and dividing this figure by the official working
hours per month will indicate how many employees are required to handle the
work load. This figure can be compared with the actual numbers employed and
will highlight areas where improvement is needed. • The best source of ideas for improving work methods is the staff members
themselves who should follow the basic techniques for method improvement
already given.
Agenda for action What else do you intend to do now?
• Are you now able to break the clerical duties in your area into tasks? Can they
be measured by activity sampling or by self assessment? How will you go about
measuring them and who will be involved?
• What are the areas of unproductive time do you think would be revealed by an
investigation? How would you go about reducing this time? What would be the
affect on motivation?
• Does your organization measure clerical efficiency and publish the results? What
would be the affect of having such data published?
54 | Productivity

• Are clerical tasks in your organization strictly the domain of certain individuals?
What would be the affect of rotating clerical tasks amongst others.
• If you have access to job descriptions, would a survey of them reveal areas for
productivity improvement. Productivity | 55

56 | Productivity

7. Measuring the utilization and efficiency of
cash After completing this section you will be able to:
• Look at inputs, processes and outputs in financial terms
• Understand that the lifeblood of any organization is cash
• Understand key financial ratios
Although we have discussed in some details the measurement and improvement of
productivity in three of the four principal resources, we have deliberately left to last the
most important resource of all without which nothing happens, namely "money".
Obviously, when productivity of the other three resources is improved, costs are
reduced or production increased, or both. This will increase their contribution to the
organization’s finances.
But whether the increased contribution will result in increased profit will ultimately
depend on whether the organization’s finances are fully utilized and efficiently managed.
Indeed, improved utilization and efficiency of the money resource may often show even
greater potential for productivity improvement than the other resources. But before
those of you not presently working within the finance or accounting division of your
firm decide that all this stuff about money doesn’t apply to you, let’s be quite clear about
something—the money resource is managed every single day by every single employee in the
firm. How can we justify such a claim?
Well, the organization’s funds are ploughed either into the production process in
order to make products to sell, or into the supplies and expenses incurred in keeping the
process going. Only when the products (or services) have been finally paid for by the
customers does any of the money come back into the firm’s hands in the form of profit.
The longer it takes for the money resource to work its way through the system to
become available for reinvestment, the harder it is for the firm to be profitable. As
we will show, everyone in the organization directly or indirectly affects the overall
productivity of the money resource at the end of the day and all these employees can
thus help to improve that productivity. At every level managers should be aware that all
the facilities under their control are a part of the total money resource.
How well they manage them individually will ultimately add up to how profitable
the whole organization becomes. Now that we have reassured you that this chapter is
certainly not for the accounting boffins only, let’s discuss how we go about measuring
the utilization and efficiency of the money resource.
Measurement of input The money resource consists of those things in the organization in which capital has
been invested in order to make money—commonly termed assets. They are usually
categorized into fixed assets and current assets, and some managers may be more involved with
one type of asset than another.
What is important is that they are recognized as investments which require an
adequate return on them to justify their existence. If they are not earning an attractive
enough return, or worse still if they are actually losing money, the firm may as well wind
itself up and the shareholders put their money in a bank or building society where they
will receive a safe and steady return on their investment without having to lose sleep at
night worrying about it.
Productivity | 57

Fixed assets
Fixed assets in most organizations comprise those items which are bought with a view
to holding and using them for a relatively long period of time. They include buildings,
plant and machinery, furniture and fittings and motor vehicles. The firm acquires them
because it needs them in order to produce the goods or services it wants to sell.
There are two vital factors which will affect how productive the funds invested in fixed
assets will turn out:
Productivity of fixed assets
How often they are used • Utilization
How well they are used • Efficiency
It is easy to see that a heavy truck working 18 hours a day will produce a better return on its
original investment than one that works only 10 hours per day provided they are both efficiently
operated. It is perhaps less easy to see that installing a mezzanine floor in a warehouse could
materially increase its return on investment also.
To calculate the input figure for the measurement of fixed asset productivity you need first
to total the value of the assets under your personal management. Although there are many
ways in which fixed assets can be valued depending on the end use of the figures, for
productivity measurement it is usual to use the original cost of each item as a basis and this
figure should be readily available.
Current assets In addition to the money invested in fixed assets there is the money which is used to
keep the production and marketing process running from day to day, usually known as
current assets.
This includes money tied up in stocks of raw materials, work still in progress,
stocks of finished products, customer credit, and the cash you keep on hand to meet
the innumerable expenses of administering a business concern—wages and salaries,
electricity, rent, water, postage, stationery and so on. In many service operations and
smaller firms, where heavy capital equipment is not necessary, the current assets can be far
larger than the fixed assets.
The bad news is that an adequate return must also be earned from this portion of
the money resource which is not even generally recognized as an asset by those using it. Once
money is poured into current assets, it is in fact "dead money" since no interest or return will
result until the goods or services are sold for a profit.
The keys to higher productivity of current assets are:
Productivity of fixed assets
• keep investment as low as possible
• turn investment over as quickly as possible
The longer it takes for the money resource to work its way through the system the more has to
be pumped into the system before sales pop out at the other end.
58 | Productivity

Two small businesses are making the same article and have the same basic costs per week:
Raw materials £1000
Labor £500
Overheads £500
Total £2000 and sell the article for £3 000.
Business ‘A’ takes one week to produce the article which it sells for cash the following week.
Its production / sales cycle is two weeks long and therefore it has to invest £4 000 in order to
sell 3 000 worth of goods at a profit of £1 000, a return of 25% on its investment every week.
Business ‘B’ takes 2 weeks to produce the article which it sells on credit 6 weeks later. Its
production / sales cycle is 8 weeks and so it has to invest £16 000 in order to sell the same 3 000
worth of goods at a profit of 1 000, a return of only 6,25% on its investment every week—which
isn’t to be sneezed at but is not as good as Company ‘A’.
Return on assets managed (ROAM)
There are many ways in which the profitability of an organisation can be measured. The one
which best demonstrates the productivity of a section, department or total operation is the
Return on Assets Managed.
Contribution (Sales - Cost of sales) = ROAM (productivity of assets)
Total Assets (Fixed + Current)
ROAM simply measures the output in monetary terms as a percentage of the total assets
employed in the department, branch or organisation being measured. Most commonly, the
output figure is the contribution of the division, etc.., calculated by subtracting the cost of
goods sold from the gross sales income.
The percentage return can then be compared to a standard set by management and a
Productivity Index for the money resource can be calculated. This will indicate the need for
action.
Analyzing substandard PIs
If your ROAM PI is less than 100 there are a number of other measures which will help
you pinpoint which specific portion of the assets is being least productively managed.
Fixed Assets Stocks
• Check utilization • Check stock turnover
• ABC analysis
Debtors Cash Work in progress
• Check days sales out- • Return on cash balance • Check production cycle
standing time
• Check debtors ageing
schedule
Generally a regular review of the utilization of fixed assets will reveal those that are not
being used to capacity and action to correct the position can be initiated.
As far as current assets are concerned, you will need to use measures which will tell
you how long the money resource is taking to move through the production / selling
cycle. The longer it is taking, when measured against your own historic figures or against
an industry norm, the lower your return on assets will be, as we have seen.
Productivity | 59

Measuring stock turnover
In a number of industries, the bulk of working capital is invested in stock, be it in raw
materials, work in progress or finished goods. The most useful ratio for measuring your stock
management is the stock turnover ratio or stock turnover as it is known:
Cost of goods sold = Stock turnover
Average inventory
Average inventory is calculated by averaging the opening and closing stock figures for
the period you are measuring. The ideal stock turn figures will differ substantially from
industry to industry. In an industry such as a supermarket where profit margins are low, stock
is expected to turn over very rapidly during the year (10-12 times). On the other hand, one
would expect a far lower stock turn in an antique shop where profit margins would be
correspondingly higher.
The value of stock turn as an indicator is less in operations carrying a wide range of
stock since it is an average figure. One way of improving its usefulness is to calculate it
separately for different categories of goods by using an ABC analysis of your stocks.
A. B. C.
Items generating highest Less important than A Minimal money spinners
proportion of sales or profit. items. held to provide a full
range.
Generally category A items will account for about 70% of turnover whilst B and C
together bring in the other 30%. For this reason more attention must be paid to regular
turnover analysis and measurements in A items than in the other two.
Measuring debtor levels
Credit facilities can certainly play a part in boosting sales. But what you need to keep a tight
control over is whether the extra sales are in fact contributing to a better return on assets, or
whether they are diluting it because the extra customers take too long to pay up (or end up not
paying at all).
You need to know on a frequent and regular basis how long your debtors take to settle
their accounts. An analysis of "Days sales outstanding" will tell you:
Total debtors x Selling days in month = Monthly credit sales
Days sales outstanding
The standard you set will depend on the type of business you operate. Generally busi-
nesses which offer 30 days terms try to keep their average outstanding below 45 days,
and use a simple ageing schedule to pinpoint the accounts that require attention.
These days all business will try to extend the period of payment because it is a
cheap way to borrow money. Only constant monitoring of debtors’ records will tell you
whether their delays are within acceptable limits or whether they are diluting your own
resource productivity.
60 | Productivity

Measuring cash utilization
In days of high inflation, any idle cash sitting around in a till or in a low interest account
is actually losing money for the company. Measuring the interest you receive on your
annual average cash balance and comparing it with the best the money market can offer
will tell you whether or not your cash management is dragging down your overall return
on assets managed.
A consultant, reviewing the monthly accounts of a large service operation with
branches in all the major centres, noted that the cash-on-hand figure exceeded £1
million.
He remarked on the size of this figure to the Managing Director who admitted
that it was high but said that it had improved since the previous year. He said that his
accountant had assured him it was not a problem and was only a side-effect of the
branches’ efforts to increase collections at the month end to show a better figure for ‘days
sales outstanding’ which he had been hammering recently. This resulted in a large inflow of
cash which was held to meet salaries and other month-end expenses, the surplus being
transferred to Head Office a week later.
The consultant demonstrated that £1 million at only 15% interest could earn
£400 per day which was at present being lost to the company. He suggested a revised
method of cash flow forecasting for the branches and overnight transmissions of funds into
selected accounts.
Within three months the average cash-on-hand total had dropped to £50 000 and
interest on cash invested was steadily building up.
Improving the productivity of assets
You will have noticed that in our approach to the productivity of assets we have followed the
same path as we used in the case of the other resources, namely, to measure before attempting
to improve. Some of the measurements themselves indicated where and how improvements
could be made. In addition there are a number of well-tried methods which you can use.
Fixed assets
The approach here is to ensure you acquire the correct assets in the first place and then
ensure they are fully utilized thereafter.
Acquisition
Assess alternatives using
financial decision making
techniques such as discount-
ed cash flow.
Biggest is not always best
- buy the most suitable asset
for the job.
Consider alternatives to
purchase like leasing, to
conserve capital and obso-
lescence.
Always consider cost of
repairing before replacing.
Utilization
Use to full capacity. If you
cannot use them fully
consider letting out to other
companies.
Train employees to use as-
sets efficiently and maintain
them correctly.
With high technology assets
plan ahead so that systems
are compatible and fully
integrate.
Productivity | 61

Acquisition decisions are made by senior management but using the assets is everybody’s
job. They should be aware of the contribution they can make to improved productivity.
Current assets
In the case of current assets all employees are involved and need to know how they can
help.
Improving stock management
• Use a technique like "economic order quantity" to ensure that initial purchases of
goods are kept to a minimum quantity.
• Try to reduce lead time involved in ordering goods to reduce stock
• Try to reduce or eliminate safety stock by changing to reliable suppliers.
• Avoid obsolete stock by keeping your finger on market trends.
• Use discounting to move dead stock.
• Fully utilise creditor financing—buy for cash only when discounts obviously pay.
• Ensure that sales, production, buying and despatch work together to get goods to the customer as fast as possible.
• Keep tight control on stocks lost by shrinkage (by staff as well as customers).
The job of tightening up on the amount of money tied up in debtors is not purely that of the
credit department or the credit controller. Rather it involves a broad policy approach which
gives firm guidance to all the employees concerned as to what the allowable terms are and how
they should be enforced.
The newly appointed financial director of a large service company was horrified to
see the extent of funds tied up in debtors, particularly in their main branch operation.
This branch handled over 50% of their business but its debtors averaged 67 days’ sales
outstanding.
He called the branch managers together and demonstrated to them how the
excessive sums required to service debtors was affecting their profitability as well as
exposing them to bad debt losses. He set as a target 45 days’ sales outstanding and together
they drew up a plan to achieve it.
First of all each branch manager would appoint a smart and presentable member
of the staff as credit controller. He would then visit each client, introduce the creditor
controller and explain diplomatically that economic conditions had forced them
to apply a more rigid credit policy. He would also explain that the credit controller
would be in constant touch with the client to ensure there were no queries or
problems which might hold up payment beyond the thirty days allowed.
The credit controller would ensure that invoices were issued immediately a job
had been completed and that statements were mailed on the last day of the month.
He would then follow up from the 15th of the month to ensure they had arrived,
were free of error and ultimately to ask for payment. If this failed to produce payment
within 40 days the branch manager and the credit controller would call on the client
and request payment.
Within five months of installing the procedure the days’ sales outstanding for the
company was within target and the main branch was running at a phenomenal 39
days. More than £3 million was released for other, more profitable investment.
62 | Productivity

Ultimately, cash management is about making your spare cash work as hard as possible
for you all the time, and the first part of that process is speeding up the collection of cash
owed to you. The second side to efficient cash management involves earning the best
possible interest on temporarily idle amounts which inevitably accumulate. As we have
seen this demands accurate cash flow forecasts so that you can anticipate when surplus
funds will be available for investment and when they will be needed again for business
operations.
Once you know how much you have to invest at any one time, you should investigate what
is the most attractive investment that will match your needs, i.e. match the greatest accessibility
with the best interest. Your bank manager will have plenty of advice on
such investments, and a small computer programme can make cash fore casting and
management much more efficient.
Finally, as we have seen, a poorly planned production process can tie up large
amounts of cash in "work in progress" (WIP). Speeding up the process through the
application of work study and reducing line stocks of raw material and semi finished
components will have a marked effect on the cash tied up in WIP.
In service industries the costs involved from the time a job starts until it is invoiced is in
fact work in progress although it is seldom recorded as such. Delay in completing a job and
delay in invoicing after completion can both increase WIP and action to reduce such delays
will release more cash into the business.
The Bottom line
It is no good being interested in productivity improvement without ultimately being
able to measure its impact on the bottom line—net profit. For improving productiv-
ity is not about working harder, it’s about working smarter. And the only way you will
know whether it is paying off or not is to look at the return on the money resource of the
company. ROAM really is the bottom line measurement as to whether your productivity
programme is working or not.
Section review • The management of the money resource is not purely the concern of the financial
division—it concerns every employee.
• The money resource is ploughed into fixed and current assets, which must be
productively used to produce an adequate return. • The measurement of money productivity is the "return on assets managed".
• If the return is inadequate there are other measurements which focus on the
productivity of each type of asset. These include utilization of fixed assets, stock turn
ratio, days’ sales outstanding, and the return on cash balances.
• The utilization and efficiency with which fixed assets are used determines their
productivity.
• The productivity of current assets depends on how fast the money resource can be
moved through the production and selling process, thus limiting the amount of
"dead money" in the system.
• Productivity improvement must be measurable in terms of its effect on the
profitability of the company. This is done by constantly measuring the return
earned on the money resource employed as Return on Assets Managed.
Productivity | 63

Agenda for action What else do you intend to do now?
• Now that you are aware of looking at things in your organization in financial
terms will this change your approach to work?
• Have you go all the relevant information to be able to control the monetary
aspects of your job? If not, where and how will you get it?
• Do you need further assistance in setting up your own system to determine how
well cash is being managed in your area? Who would be able and willing to help?
• Is it worthwhile display key ratios in your area graphically? What do you think
this form of display would reveal? What if you summarized the ratios over say the last
12 or 24 months, what would they show?
64 | Productivity

8. Setting up a productivity programme After completing this section you will be able to:
• Understand the importance of gaining commitment at all levels when introducing
a productivity improvement program.
• Carefully select and train suitable employees and form teams
• Select projects in consultation with others and maintain momentum
Where should we start? At the top? In the middle? At the bottom? There are many
theories as to the best place to focus the programme and there’s a grain of truth in each
of them.
Top Management
Some maintain that the programme must be imposed on the organization by top
management who are the only people who know the organization’s strategic objectives and
can therefore channel the effort where it will have the greatest effect.
Middle Management
Others believe that only middle management has the authority to get things done combined
with sufficient knowledge of the workforce to know where to look.
Supervision
Since the supervisors are in closest touch with the job and, in any case, will have to
implement the changes, the programme should be focused on them.
Workers
The workers actually do the work and there fore they are in the best position to suggest
improvements.
All these approaches have been tried with varying degrees of success. The two extremes have
been found to be the most difficult to implement. Programmes handed down by top
management tend to arouse resistance in middle and lower management leading to a less
than 100% commitment.
Although success has been achieved with worker controlled programmes such as the
American "Quality of work life" and the Japanese "Quality circles", they generally require
a dedication and common interest which are lacking in many organizations here. In
addition the individual worker’s view of resource utilization and efficiency is severely
restricted to his /her own workplace and thus the projects produced seldom tap the real
potential.
Long experience in the introduction of productivity improvement programmes
indicates that the best and fastest results come from those focused on middle
management with active support from top management and a planned filtering down to the
supervision level once the programme has been established. The introduction should follow
these steps:
• Gain management commitment
• Select and train team leaders
Productivity | 65

• Form and train teams
• Choose the projects
• Maintain progress
Gaining commitment
Some time back we said that the most important person in any attempt to improve pro-
ductivity was the employee or operator involved in the process. We would like to change
our minds on that one, or at least add another name, and that is the Chief Executive of
the organization.
It has been our unhappy experience that unless the CEO is both enthusiastic and
committed to the need for an ongoing productivity programme you are going to waste
an awful lot of time and energy trying to get one going. It isn’t necessary for him to take
a direct part in the programme but it is vital that he keeps a fatherly eye on his divisional
managers’ efforts, and that he is seen by the staff generally to be wholly behind the
programme.
A large manufacturing plant split its management into operations, engineering, technical
and administrative divisions under a CEO who reported to a Board of Direc-
tors. The managers of the divisions were strong, well-qualified individuals who each
sincerely believed that the success of the operation rested on his shoulders alone. This
attitude permeated down through the divisions creating relationship problems in the
various departments of the plant.
After attending a symposium on productivity improvement the manager of the
engineering division, having obtained the CEO’s reluctant approval, asked consultants to set
up a productivity improvement programme. This they did by selecting a
small group of engineers and exposing them to the basic principles of measurement
and improvement in a training course. After the course the participants formed
themselves into a small committee and worked on a number of productivity projects.
These proved highly successful so that further courses were arranged until a total
of 50 engineers and foremen had been trained and formed into departmental teams
with projects totalling more than 2 million.
At this point, the operations manager, who had played no part in the programme,
decided to introduce a system of progress reporting by which each department would
be treated as a separate cost centre and would be responsible for setting itself cost-
cutting objectives. Although it was pointed out to the CEO that this exercise would
divert effort from the productivity programme, he declined to interfere.
Within six months the number of productivity teams shrank to four and the
projected savings by 75%; the cost centre exercise failed to take its place.
How do you get commitment from the CEO and his management team? The a possible
way is to give them copies of your course material and make sure they read it. Failing
that you will have to prepare a presentation (based on this guide) stressing the need for
measurement and improvement in your organization. If you want it to be really effec-
tive, take the time to work out a couple of productivity measures and show the monetary
effect of a possible 5 or 10% improvement compared with the cost of introducing the
programme. Since the figures involved are likely to be substantial this should arouse some
interest and make gaining commitment easier.
You should also take the opportunity to outline the roles of the CEO and his team, and
gain their full acceptance of the parts they must play:
66 | Productivity

Management role
• Announce the programme to the staff
• Decide on incentives (if any)
• Monitor overall progress
• Recognize outstanding achievements
Selecting Team Leaders
Bearing in mind that the team members are going to be drawn from middle and lower
management, team leaders should be chosen from senior management. If your organi-
zation is large enough to justify departmental teams then it would be natural for depart-
ment managers to act as team leaders thereby ensuring their full participation. However
in smaller companies, where several departments could be represented in the team, the
leader should be chosen for his knowledge of the subject and ability to hold the respect
of the team. Very often a training manager will fill this function well. Team leaders
should agree on their responsibilities and should be given an overall target to aim for:
Team leader responsibilities
• Approve projects against agreed criteria
• Hold regular meetings with team to ensure progress of projects
• Coordinate outside assistance if required
• Obtain necessary authority for projects
• Encourage development of lower level teams
• Adequately resource team i.e. training, resources, facilities, time etc.
The criteria with which approved projects must comply will include such items as
ensuring that the project is worthwhile in time and effort; that it addresses a recognized
problem; that it is tabled in an acceptable form; that it includes progress deadlines which
must be met.
It is important that productivity team meetings are kept separate from other meetings
otherwise the recurrent crises of normal business will cause productivity to be shunted
aside as less important. The meetings provide an opportunity for brainstorming of
solutions to difficult problems and generally help to keep enthusiasm at a high level.
Sometimes a team member may need technical or specialist help in researching a
project. The team leader ensures it is available. He also obtains approval from higher
authority for projects which are beyond his limits. As the team gains confidence it’s
the leader’s job to encourage the secondments of supervisors and lower level managers
onto the team so that there is as much participation as possible. In order to do the
job properly the team leaders should be exposed to a modified version of the training
given to team members so that they can reinforce the vital points of measurement and
improvement.
Forming and Training Teams
The composition of the productivity teams will depend on how big you are. If you are
big enough to form departmental teams (from four to ten members per team) you will
do better than if you have to select individuals from each department and make them
into a team. But don’t let this stop you—you’ll still gain tremendous benefit from indi-
viduals.
Productivity | 67

Choosing the projects During the course the students are encouraged to apply their new knowledge to their
own situations and to start to develop projects. On completion of the course the stu-
dents join their teams and get their team leader’s approval of the project developed. They then
continue to work on it to finality and then have to develop a new project to replace it. The
process is continuous.
Quite often their initial projects will reflect some idea or problem they have had for
some time awaiting some spur to develop it. As such it may not have as much potential
as the leader would prefer to see. We have found it is better for the team leader to let the
team member complete his / her pet project, no matter how trivial, and then switch to
a more valuable project rather than arbitrarily impose a new project, which may, at that
stage, be resented.
Maintaining progress
The real key to keeping up momentum in a productivity improvement project lies in one
word—recognition.
In the popular management best seller, "The One-Minute Manager", the authors
recommend that every manager actively seeks opportunities to praise his staff. The
principle applies equally well to productivity teams.
If everyone, from the CEO down, takes a positive interest in the ongoing projects,
and congratulates teams and members who complete worthwhile projects, the
programme will maintain momentum. Some companies have gone further and arranged
formal gatherings at which praise and rewards are given for successful projects. The
rewards need not be substantial; the fact that the individual or team effort has been
recognized is much more important.
The bottom line
Training and running the productivity teams costs money so what sort of payout can
you expect in return? One way of determining productivity savings is to set a target per
team member based on a percentage of their average salary. Another might be to use
benchmarking against other organizations in your sector, at home and overseas.
Of course the figures will depend on how much scope there is for improvement. If you
already have what you believe to be an efficient organization and are monitoring productivity
carefully you may not achieve such high results, inside the 6 to 12 months. On the other hand
you might just be surprised!
What we are really saying is that the possible benefits so heavily outweigh the small costs
involved that the only sensible decision that has to be made is not, "Should we introduce the
programme?" but rather, "What is the earliest date that we can make a start?" Why not make
it tomorrow?
Section review • Experience has shown that the best place to start a productivity improvement
programme is with middle managers.
• Without the full and visible commitment of top management a productivity
programme will fail.
68 | Productivity

• Team leaders should be selected from department managers and their
responsibilities agreed on prior to commencement of the programme.
• The teams themselves can be any size from 4 to 10 members. Larger teams are
difficult to coordinate.
• Team members will develop projects as a part of their training.
• Recognition of results is a key to keeping the programme alive and producing.
• Target payback for each team / team member should be calculated up front.
Agenda for action What else do you intend to do now?
• Are you now committed to productivity improvement? Do you understand why it
is so important to your organization. Whose responsibility is productivity?
• Can you identify possible team members for a productivity improvement team?
What skills do you think will be required. Do you require a mentor, someone to
guide your efforts and thinking?
• Is any additional training required to get your program up and running? Where
will you get it from?
• How will projects be chosen? Have you any ideas as a result of reading this
resource that you could propose for investigation?
• How will success be measured and how will it be communicated?
Productivity | 69

70 | Productivity

Productivity | 71

Quick cost reduction checklist
Waste within organizations costs millions every year. Most of it can be stopped. A
concerted effort at all levels, management and supervision lead will produce results.
Positive, active cooperation by lower levels is the surest method of producing results.
Sometimes, particularly with (though not confined to) small organizations, splendid results
can be obtained by concentrating effort on one section of the personnel, and often the most
logical is supervision, By careful planning, assisting and policing the causes of waste which
supervision and operatives can prevent can form the basis of an effective and vital productivity
improvement campaign.
The fundamentals
In any approach to cost reduction, there are a number of fundamental aspects which
should be borne in mind. These are:
• No organization is too small or too large to rule out the attractive possibilities of
savings through cost reduction.
• Cost reduction is a state of mind and should be promoted as such.
• Involve as many employees as possible in cost reduction. Psychologically it is
sound to spread the degree of participation so that as many as possible feel that, to some
extent, the success of the program rests with them.
• It should be a continuing program, for it is never finished. A product line that is
competitive today needs analysis to remain competitive tomorrow. Cost reduction
should therefore be a permanent, alive and part of the organization at all levels.
• Concentration should be made on controlling the controllable. Unless care is
exercised, much time and money can be wasted in endeavouring to control the
uncontrollable. Much of the success in cost reduction comes from judgement
exercised in relation to categories in which various expenses lie and the respective
opportunities offered. Although the day - to - day approach is that every cost
reduction tool should be used wherever practicable, over the years, cost reduction
has come from better methods and better equipment.
• Costs are not reduced by raising voices against people. Often there is too much
talk about cost reduction and too little planning and concentrated effort.
• Cost reduction is the real key to national prosperity under a rising standard of
living.
• No concern can afford to ignore cost reduction. The competition will not do so.
• Money must often be spent in one place to save in another.
• Cost reduction requires resourcefulness, imagination, and enthusiasm. Success in
affecting savings today merely presages extra effort tomorrow.
• Cost reduction leadership flows from the top down. It rarely seeps up from the
bottom.
In connection with Materials • Check the amount of waste and scrap.
• Be ruthless about inventory losses, and investigate whether better or cheaper
materials can be used in the product.
• Reduce inventories. Goods cost much more than money to keep in store than
most people realize.
72 | Productivity

• Get rid of slow moving items.
• Examine store keeping costs.
• Decide whether savings can be made by increasing or decreasing orders.
• If standard costs are in operation, examine closely all material price and materials
usage variations.
In connection with Labor Costs • Improve cycle times for operations.
• Reduce the time spent between operations
• Reduce setup times.
• Reduce idleness by finding out whether it is due to:
• Available work not scheduled.
• Lack of materials.
• Lack of instructions.
• Lack of tooling.
• Lack of power.
• Waiting for repairs or other causes of delays.
• Reduce times by combining operations or change the sequence of operations.
• Examine indirect labor — can it be changed to direct labor?
• Note the efficiency of operators.
• Decide if further operator training will help.
• Decide if it would pay to use subcontractors.
• Examine extra mechanisation and the possibilities of the development of better
tools and better tool and machine design or, perhaps, special performance
machines.
• Try redesigning the product to make it easier and less expensive to produce.
In connection with Expenses • Institute a critical audit of every item of expense that appears in the classification
of accounts, and when this is being done, be sanely ruthless about every account. • See if fixed costs can be changed to variables.
• Improve the quality of supervision as this will reduce cost.
Within this category also some items upon which nearly everyone can save money: wasted
time and materials in repairs and maintenance, power and steam wastes, and costly materials
handling. In many cases, more savings can be made in these items than anywhere else in the
organization.
In connection with Delivery Costs • Ascertain if delivery services can be streamlined so as to avoid waste running
unnecessary deliveries.
• Give a thought to better utilisation of delivery services by better balanced and
larger loads. • Go over every item of delivery expense and critically analyze each.
• Have a look at which trucks are costing money through excessive repairs or
running costs.
• Examine afresh the costs by road, rail, air and by ship. Perhaps things have
changed since they were last looked at.
• Examine packing and crating costs.
• Develop comparative costs per ton mile or hour of operation.
Productivity | 73

Examine Sales Costs • Because sales are either hard (or easy) to get, it does not mean that sales expenses
cannot be reduced.
• Critically examine the cost of selling to see if every unit of money is pulling its
weight.
• Compare the costs of various sales areas, and ascertain if some areas are justifiably
costing more than others. • Compare the costs of various representatives.
• Investigate advertising and promotional costs in the light of sales pulling power.
• If sales servicing operates, make sure the expenditure is wisely incurred.
• Have a look at distribution channels. Perhaps the method in operation is more
expensive than another type which will do the job equally well.
• Examine territory costs. Is it worthwhile holding on to the heavy-cost territory?
• Have a careful look at classes of customers. Many an organization has considerably
reduced costs by eliminating unprofitable customers.
• Critically examine the cost of small orders, as this is the most beneficial method of
reducing sales costs.
Examine Office Expenses • Audit all forms prepared in the office and decide to scrap every one which cannot
be fully justified. • Prepare process charts to determine if there is wasted effort.
• Have a look at further mechanisation / computerisation.
• Examine ordering procedures.
• Critically examine every item of office expense.
It should not be thought that attractive savings are confined to larger organizations. Indeed,
it is frequently easier to obtain greater proportions cost reductions in smaller businesses
than in large ones.
74 | Productivity

Causes of poor productivity IMMEDIATE ACTION FOR QUICK GAINS
Waste of Time • Lack of proper planning, keeping workers waiting between jobs or waiting for
material.
• Failure on the foreman’s part to thoroughly understand orders and instructions
received. • Lack of knowledge of what constitutes a full day’s work.
• Failure to make orders and instructions clear to workers.
• Failure to insist that tools supplies, and portable equipment be kept in proper
places.
• Ordering overtime work that could be avoided.
• Not seeing that employees are supplied with proper tools and equipment for every
job.
• Allowing employees intentionally to do less work than they can.
• Failure to inform HR department when more labor is required.
• Keeping too many employees.
• Failure to write records and requisitions intelligibly.
• Failure to question and correct workers who lay off.
• Allowing workers to get habit of talking, visiting, killing time.
• Failure to get workers to start on time, slack supervision.
• Delay in making decisions.
• Unnecessary absenteeism or tardiness on the foreman’s part.
• Being late with reports.
• Not investigating immediately when repairs are needed.
• Unnecessary visiting and conversation on the job.
• Failure on the foreman’s part to organise his time and work.
Waste of Ideas • Failure to listen and comment when workers offer suggestions.
• Failure to encourage workers to offer suggestions.
• Not asking worker’s advice on problems.
• Failure read and study about the work and about business methods.
• Failure to get from new employees helpful ideas which they may bring from
previous employment.
• Not consulting enough with other departments, such as engineering, etc.
• Failure to consider or refer to the proper person all usable suggestions no matter
where they come from.
• Failure to take proper interest in foreman’s meetings.
Waste of Methods and Supplies • Inadequate supervision resulting in spoilage of material.
• New employees not instructed properly
• Employees not instructed on new work
• Paperwork, diagrams etc. torn or illegible
• Machines out of order or not adjusted
Productivity | 75

• Failure to follow each job through
• Failure to explain money value of materials and supplies to employees.
• Failure to give clear instructions and orders.
• Permitting improper or rough handling of material and supplies.
• Not paying attention to workers’ eyesight and health as possible cause of spoiled
work.
• Lack of discipline among workers, thereby encouraging carelessness and sub
standard work.
• Allowing employees to use supplies unsuited to work; too good or not good
enough.
• Inability to trace defective work to the person who did it so that it can be
corrected.
• Taking employee’s ability for granted; not making sure employee’s are qualified for
the work they are doing, especially new ones.
• Not knowing the right kind of supplies to order.
• Ordering more materials and supplies than necessary and not returning excess
stock.
• Failure to see materials are stored appropriately.
• Failure to investigate all bare wires, leaky valves, pipes, fittings on steam, water,
gas, electric, and compressed air lines, etc.
• Allowing workers to use oil, compressed air, small tools, chemicals, etc,. for
personal use.
• Letting defective material go through as standard.
• Lack of system to controll outgoing supplies to prevent loss / theft.
• Scrapping material that could be salvaged.
• Permitting the waste or abuse of such supplies as brooms, stationary, oilers, light
bulbs, shovels, rubber hose etc.
Waste of Machinery and Equipment • Failure to plan work so that effective and efficient is made of all available
machinery.
• Failure to inspect machinery to keep it in good condition and to prevent
breakdown. • Foreman’s lack of knowledge on possible use and capacity of machines.
• Failure to make regular examination of wire ropes, belts, chain drives, gear drives,
conveyors, lubrication systems, valves etc.
• Using unnecessary large and powerful machine for small work.
• Lake of cooperation with maintenance department; upkeep, repairs, painting etc.
• Not protecting idle machinery from weather, dust, dirt, rust, fumes etc.
• Allowing machinery to stay dirty by lack of periodic cleaning.
• Failure to inspect for proper lubrication of all moving parts.
• Failure to make needed repairs promptly.
• Lack of instruction to employees on the proper operation of machinery.
• Lack of proper discipline to prevent abuse of machinery and equipment.
• Allowing employees to make "shoestring" repairs.
• Failure by the foreman to keep informed on the latest technology.
• Failure to pay attention to workers’ opinions on value and condition of machinery.
• Abusing small machines on large work.
• Repairing machinery that should be scrapped; may cost more than replacing. 76 | Productivity

Waste of Manpower Failure to Control Turnover of Capable Workers because of:
• Not appreciating the direct and indirect costs of labor turnover.
• Too much "bossing" and not enough intelligent direction.
• Too strict or too lax enforcement of discipline.
• Not keeping promises which could have been fulfilled.
• Making promises which cannot be fulfilled in regard to wages, promotion, etc.
• Discharging employees without sufficient cause; improper use of the discharge
procedure as a penalty.
• Keeping an employee on a job for which he may have a strong dislike.
• Favouritism; treating one person better than other.
• Taking sides in employees arguments.
• Criticising a worker in front of the group.
• Failure to conduct an exit interview.
• Failure to correctly interpret management’s real aims and policies to workers.
• Failure of the foreman to do all he can to fairly adjust wage and work conditions.
• Failure to get full production as quickly as possible from new employees
• Not inducting new employees appropriately; policies, procedures, pay, terms and
conditions of employment, facilities, etc.
• Incomplete job instruction for new employees.
• Failure to impress on new employees what is expected in terms of quality and
quantity of work.
• Failure to select suitably qualified and experienced employees.
• Impatience with new employees who learn slowly.
• Failure to get other workers to show a friendly, helpful attitude to new employees.
• Failure to establish sound relationship and regular contact with new employees.
• Failure to instruct new employees in all aspects of safety.
• Failure to get the best efforts of which employees are capable
• Failure to commend exceptional performance.
• Failure to explain as much about the work so as to make it interesting.
• Lack of interest in employees’ progress and affairs.
• Failure to admit mistakes.
• Lack of attention to employees’ ability and temperament in assigning work.
• Failure to view employees’ as individuals in order to motivate them.
• Countenancing the formation of cliques.
• Rating employees on any grounds but competence; racial, religious, fraternal, etc.
• Keeping an employee in a job for which he is not mentally of physically suitable.
• Permitting employees’ at work when they are sick.
• Not giving employees’ the support and help they need.
• Failure to promote an employee when it is possible and appropriate.
• Lack of due consideration of problems affecting wages and working conditions.
• Failure to train an understudy.
Waste of Accidents • Failure to recognise accident prevention as part of production.
• Failure to give all employees thorough instruction in safe practise.
• Failure to install and maintain safeguards.
• Allowing employees to work with guards out of place.
• Failure to display safety signs and keep them legible.
• Failure to thoroughly understand accident costs.
Productivity | 77

• Poor housekeeping.
• Lack of understanding of what constitutes an accident hazard.
• Failure to keep accident records, to analyze them, and to use the information.
• Not setting a good example in safe practise.
• Lack of regular and conscientious safety inspections.
• Failure to enforce consistently all safety rules and regulations.
• Allowing employees to work without the necessary safety apparel.
• Failure to recognise personal responsibilities for accidents.
• Failure to stimulate and maintain interest of employees in accident prevention.
• Lack of cooperation with statutory regulations.
Waste of Non-cooperation Failure to cooperate;
• With other others at the same level in other departments.
• With clerical, engineering, sales, personnel departments, etc.
• Lack of a thorough understanding of company policies and failure to explain them
to employees.
• Failure to deal with gossip and rumours.
• Passing the buck; up, across or down the organization.
• Not adequately representing the employees.
• Permitting disgruntled employees to agitate and unsettle other employees.
• Failure to give support to unpopular company policies.
• Failure to promote friendliness and cooperation among employees.
• Thoughtless criticism by the foreman himself of any company policy or of any
individual in the organization.
• Not cooperating whole heartily with management in its educational activities
such as apprentice training, bulletin boards, employee’s magazines, suggestions
schemes, safety meetings.
Waste of Space • Improper stacking and storing of materials.
• Not enough attention to routing of materials through processes.
• Wrong placement of machines and other permanent equipment.
• Allowing employees to leave portable tools, ladders, etc., in the way of other
employees; failure to keep passage ways clear.
• Keeping materials which should be scrapped.
• Lockers, oil tanks, stock supplies, etc., in inconvenient places.
• Letting unused machinery and equipment take up valuable space.
• Leaving needed space unused for want of needed repairs to roof floor, etc.
• Allowing dark spots in plant; ineffective lighting.
• Failure to maintain order and good housekeeping.
• Keeping unnecessary materials at the workplace.
78 | Productivity

Ergonomics
Indicators of the Need for Human Factors Evaluation • Is absenteeism on this task too high?
• Is turnover on this task too high.?
• Is production efficiency on this task too low?
• Do employees complain frequently about this task?
• Is personnel assignment on this task limited by age, sex, or body size?
• Is the training for this task too long?
• Is product quality too low?
• Have there been too many accidents on this job?
• Have there been too many medical visits?
• Does the worker frequently make mistakes?
• Is there excessive equipment damage on this job?
• Does this task result in too much material waste?
• Is the operative frequently away from the workplace?
• Is this work place utilized on more than one shift per day?
Need for Task Design • Is the worker required to lift and carry too much weight?
• Is the worker required to push or pull carts, boxes, rolls of material, etc., that
involve large break-away forces to get started?
• Is the worker required to push or pull carts and hand trucks up or down ramps
and inclines?
• Does the task require the worker to apply pushing, pulling, lifting, or lowering
forces while the body is bent, twisted or stretched out?
• Is the work pace rapid and not under the operators control.
• Does the worker’s heart rate exceed 120 beats per minute during task
performance/
• Do workers complain that their fatigue allowance is insufficient?
• Does the task require that one motion pattern be frequently performed at a high
frequency?
• Does the task require the frequent use or manipulation of hand tools?
• Does the task require both hands and feet to continually operate controls or
manipulate the work unit?
• Is the worker required to adopt the same posture, either sitting or standing, all the
time?
• Is the worker required to mentally keep track of a changing work situation,
particularly as it concerns the status of several machines?
• Is the rate at which workers process information likely to exceed their capacity?
• Does the worker have insufficient time to sense and respond to information
signals that occur simultaneously from different machines?
Need for Workplace Redesign • Does the work surface appear too high or too low for many workers?
• Do workers frequently sit on the front edge of the chairs?
• Must the worker assume an unnatural or stretched position in order to see dials,
gauges or parts of the work unit and in order to reach controls,materials or parts
Productivity | 79

of the work unit.
• Is the worker required to operate foot pedals while standing?
• Does the operation of foot pedals or knee switches prevent the worker from
assuming a natural comfortable position.
• Are foot pedals too shallow to allow foot position changes?
• Is a foot rest required?
• Do workers frequently attempt to modify their work chair by adding cushions or
pads?
• Are workers required to hold up their arms or hands without assistance or
armrests.
• Are dials and controls difficult to operate or poorly labelled?
• Is the design and layout of equipment a hinderance to cleaning and maintenance
activities?
• Does the workplace seem unnecessarily cluttered?
• Is the worker required to use a non adjustable chair?
• Can the worker be relieved of static holding work by providing clamps or supports
for the work units?
Special Considerations in the Working Environment • Does process noise interfere with the reception of speech or auditory signals?
• Is the process noise of an irritating nature so that it interferes with works attention
to the task?
• Is process noise loud enough to cause hearing loss?
• Do the work tasks contain significant visual components, thus necessitating
careful attention to lighting.
• Does the workers eye periodically move from dark to light areas?
• Are the direct or reflected light sources in the work area?
• Do lights shine on moving machinery in such a manor as to produce stroboscopic
effects or distracting flashes?
• Does the background colouration interfere with the colour codes on knobs,
handles or displays?
• Is the air temperature too high to too low?
• Is the relative humidity uncomfortably too high or too low?
• Are radiant heat sources located near an operator’s work place?
• Is the worker exposed to rapid thermal or visual environmental changes?
• Do hand tools or process equipment vibrate the worker’s hands, arms, or whole
body?
• Does process dust settle on displays, making them difficult to see?
80 | Productivity

Productivity | 81