ADRC-Consumer-Satisfaction-Survey-Results.pdf - Oregon.gov
78
Consumer Satisfaction with Aging & Disability Resource Connection: Round 2 Submitted to Oregon State Unit on Aging, Department of Human Services By Diana L. White, Ph.D. Sheryl Elliott, M.U.S. Final Report 2013
-
Upload
khangminh22 -
Category
Documents
-
view
2 -
download
0
Transcript of ADRC-Consumer-Satisfaction-Survey-Results.pdf - Oregon.gov

Consumer Satisfaction
with Aging & Disability
Resource Connection: Round 2
Submitted to
Oregon State Unit on Aging, Department of Human Services
By
Diana L. White, Ph.D. Sheryl Elliott, M.U.S.
Final Report
2013

1
Consumer Satisfaction with Aging & Disability Resource Connection (ADRC) Services: Round 2
Diana White & Sheryl Elliott Portland State University Institute on Aging
May 2013
Executive Summary
Aging and Disabilities Resource Centers (ADRC) are a program of the Administration for Community Living (ACL), the Centers for Medicare and Medicaid (CMS), and the Veterans Health Administration. They serve as a single entry point into the long-term services and supports systems for older adults and those with disabilities. The goal is to provide a coordinated system of information and access to those seeking long-term services and support, thereby minimizing confusion, enhancing individual choice, and supporting informed decision-making.
Aging and Disabilities Resource Connections (the ADRC in Oregon) was established in
2008. The program was developed through a pilot program with three Area Agencies on Aging serving 9 contiguous counties and 31% of Oregon’s population. The program is expanding statewide. Options Counseling (OC) is a core service of ADRCs and involves an interactive process between an options counselor and consumers, family members, caregivers and significant others to support informed decision making consistent with the consumer’s preferences, strengths, needed services, values and unique circumstances. In 2010-2011 professional standards were developed for OCs in Oregon. The following year, Oregon’s ADRC Advisory Council approved ADRC standards based on consumer expectations related to core functions of the ADRC, including use of the Call Center and options counseling services. These standards were used by Portland State University Institute on Aging to develop the consumer satisfaction survey, which was first administered between October 2011 and February 2012. Results were used to established metrics against which to measure program success.
Round 2 Survey Participants. A stratified random sample was drawn from all users of
OC (n=635) and Call Center services (n=9877) between July and September 2012. It was composed of 180 options counseling consumers and 826 information and assistance (I&A), or Call Center, consumers. Interviews were conducted by the Portland State University Survey Research Lab over a 13-day period in November 2012; length of interviews averaged about 19 ½ minutes. Interviews were completed with 303 individuals, a 42% response rate for all eligible phone numbers. Survey participants were comprised of 232 (28%) of users of the ADRC Call Centers (i.e., Information and Assistance services) and 71 (39%) of all those who had received options counseling services. Of those interviewed, 240 were consumers and 63 were family members.

2
Results
Need More than half (54%) of the participants were in contact with the ADRC because of physical health needs. Many consumers needed help around the house (37%). Financial issues were common, with 35% of participants needing help getting food stamps or assistance with Medicaid or medical expenses. One third needed help with transportation, and 26% needed help with medications. A quarter (25%) reported difficulties related to confusion or memory loss. Other areas of need included help with energy bills, dental care, shopping and errands, and assistance related to housing (e.g., home modification, subsidized house, and residential care).
Access Awareness. About 20% of Round 1 and Round 2 participants learned about the ADRC through the media, followed by information from a friend. Referrals from another agency or from the medical profession accounted for about 17% of the pathways in Round 2, less than the percentage (24%) reported in Round 1. As in Round 1, consumers in Round 2 were more likely to learn about the ADRC from friends than family members were, and family members were more likely to learn about it through the medical profession and the Internet. Contact. First contact with the ADRC was mostly by telephone, although Round 2 participants were somewhat less likely to contact the ADRC this way. Round 2 participants were more likely to go to the ADRC office or receive a call from the ADRC than the Round 1 participants. Once people made contact with the ADRC, additional contact followed, especially for Round 2 participants; 43% (compared to 30% for Round 1) reported more than three additional contacts. Telephone. In Round 2, two-thirds of participants reached person rather than automated system or message machine when they called, slightly higher than in Round 1 (63%). For those leaving a message, the standard is that 85% will receive a call back within 24 hours based on a normal work week. The timing of calls is unknown, but only 57% reported they had received a return call on the same or next day. Therefore, this benchmark was not met. Similarly, 21% reported waiting much too long for the return call, failing to meet the benchmark that no more than 15% of consumers would give this rating. Website. Although the majority of participants reported having access to a computer (74% Round 1, 68% Round 2), only 15% in both rounds rated their computer skills as excellent. The majority in both samples reported their computer skills were poor (36 or 37%) or fair (26%). It is not surprising, therefore, that few participants are using the ADRC website (13% of Round 1 and 10% of Round 2 participants). Those who do, however, tend to use it more than once, with the amount of use increasing from Round 1 to Round 2. The benchmark that fewer than 15% would report the website as hard to navigate was met in both rounds. The percentage of participants finding the website difficult to use in Round 2 was half that reported in Round 1. ADRC building. Approximately 40% of participants in both rounds had their first contact at the ADRC building and many more have visited the ADRC. The benchmark that 90% would report that the building was somewhat or very easy to find was met in Round 1 (92%), and nearly met in Round 2 (87%). Improvements in building access occurred; 88% of Round 2 participants who
3
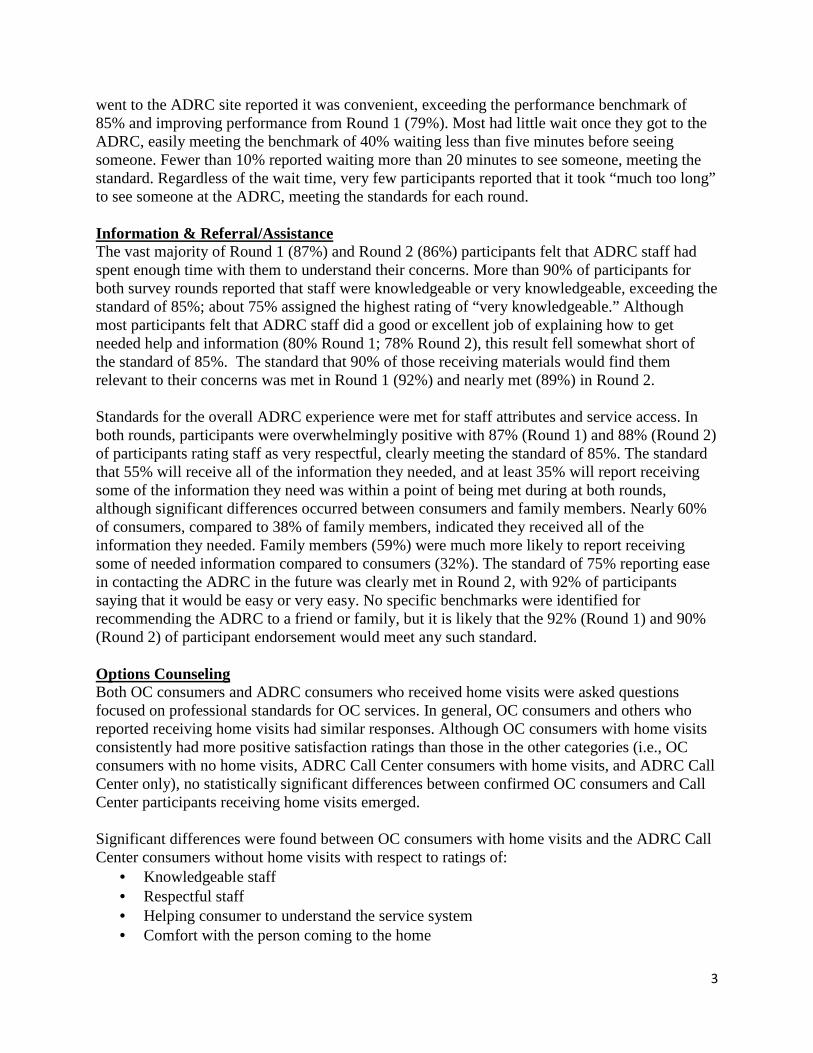
went to the ADRC site reported it was convenient, exceeding the performance benchmark of 85% and improving performance from Round 1 (79%). Most had little wait once they got to the ADRC, easily meeting the benchmark of 40% waiting less than five minutes before seeing someone. Fewer than 10% reported waiting more than 20 minutes to see someone, meeting the standard. Regardless of the wait time, very few participants reported that it took “much too long” to see someone at the ADRC, meeting the standards for each round. Information & Referral/Assistance The vast majority of Round 1 (87%) and Round 2 (86%) participants felt that ADRC staff had spent enough time with them to understand their concerns. More than 90% of participants for both survey rounds reported that staff were knowledgeable or very knowledgeable, exceeding the standard of 85%; about 75% assigned the highest rating of “very knowledgeable.” Although most participants felt that ADRC staff did a good or excellent job of explaining how to get needed help and information (80% Round 1; 78% Round 2), this result fell somewhat short of the standard of 85%. The standard that 90% of those receiving materials would find them relevant to their concerns was met in Round 1 (92%) and nearly met (89%) in Round 2. Standards for the overall ADRC experience were met for staff attributes and service access. In both rounds, participants were overwhelmingly positive with 87% (Round 1) and 88% (Round 2) of participants rating staff as very respectful, clearly meeting the standard of 85%. The standard that 55% will receive all of the information they needed, and at least 35% will report receiving some of the information they need was within a point of being met during at both rounds, although significant differences occurred between consumers and family members. Nearly 60% of consumers, compared to 38% of family members, indicated they received all of the information they needed. Family members (59%) were much more likely to report receiving some of needed information compared to consumers (32%). The standard of 75% reporting ease in contacting the ADRC in the future was clearly met in Round 2, with 92% of participants saying that it would be easy or very easy. No specific benchmarks were identified for recommending the ADRC to a friend or family, but it is likely that the 92% (Round 1) and 90% (Round 2) of participant endorsement would meet any such standard. Options Counseling Both OC consumers and ADRC consumers who received home visits were asked questions focused on professional standards for OC services. In general, OC consumers and others who reported receiving home visits had similar responses. Although OC consumers with home visits consistently had more positive satisfaction ratings than those in the other categories (i.e., OC consumers with no home visits, ADRC Call Center consumers with home visits, and ADRC Call Center only), no statistically significant differences between confirmed OC consumers and Call Center participants receiving home visits emerged. Significant differences were found between OC consumers with home visits and the ADRC Call Center consumers without home visits with respect to ratings of:
• Knowledgeable staff • Respectful staff • Helping consumer to understand the service system • Comfort with the person coming to the home

4
• Overall helpfulness of the ADRC Home visits. The majority of those receiving home visits found them to be very helpful, with Round 2 participants giving higher ratings (71% compared to 64%). Approximately 20% of participants in each year rated these visits as somewhat helpful. Almost all participants indicated they felt very comfortable with the person who came to their home. Furthermore, the staff person who visited them in their homes typically identified additional types of services that might be needed and participants usually agreed. Family members of service recipients often participated in the home visit, although less so during Round 2. When present, participants reported general agreement between the consumer and family members about circumstances, concerns, and help needed. The majority of participants found family meetings to be very helpful, with significantly more people reporting the joint meetings as very helpful and fewer reporting them as not at all helpful in Round 2. Decision support. The ability to make informed decisions is contingent on understanding the service system and the available choices. The standard of 80% of participants indicating staff were good or excellent in helping them understand the service system was met. Nearly half of participants in Round 1 gave the highest rating of excellent; however, this declined to 43% in Round 2. However, nearly 20% indicated that the staff were poor or fair in their ability to help the consumer understand. In spite of difficulties or uncertainties related to understanding the service system, most participants reported a better understanding about available options after receiving options counseling and/or home visits. However, the standard of 75% reporting better understanding was met in Round 1, but not in Round 2. Importantly, majorities of participants in both years gave highest ratings for staff in terms of helping them to explore available choices, meeting the standard of 80%. Participants generally gave high ratings for staff in considering their opinions. At 88%, however, these results did not quite meet the standard of 90%, although ratings improved between Round 1 and Round 2. More than 80% in both rounds indicated that OCs and others were supportive of their decisions. The percentage of ratings of fair or poor declined from Round 1 to Round 2. Similarly, 6% or less reported the person they worked with was trying to talk them into things they did not want. Consistent with these findings is that the majority reported that the consumers were in total control of the decisions; an additional 20% (Round 1) and 27% (Round 2) reporting they had most of the control.
Action Plans and Follow Up. Assisting consumers in developing actions plans is one of the professional standards for OCs. Fewer than half of the participants in Round 1 and just over half in Round 2 reported working with ADRC staff to develop an action plan. Since not all consumers want actions plans, more information is needed to determine whether those who desire the service and could benefit from it are receiving an action plan. OC standards require routine follow up calls. The ADRC standards set by the Advisory Committee included a requirement that 90% of consumers identified as needing follow up by the ADRC, receive a follow up. We do not know who was identified by the Call Center as needing follow up by the call center, so success in meeting this standard is unknown. Follow up calls however, increased from 46% to 62% from Round 1 to Round 2.

5
Outcomes. Participants were asked to rate agreement with seven statements regarding their perceptions of outcomes emerging from involvement with the ADRC (strongly agree=4, strongly disagree=1). Only OC consumers and those reporting home visits were asked these questions. The standard for agreement, where identified, is in parenthesis by the statement.
1. The services or information have allowed me to live in the place I most desire (70%) Round 1: 80%; Round 2: 83%. About 35% strongly agreed. Standard exceeded.
2. I am receiving enough support to meet my needs & preferences (80%). Round 1: 75%; Round 2: 76%. About 25% strongly agreed. Standard not met.
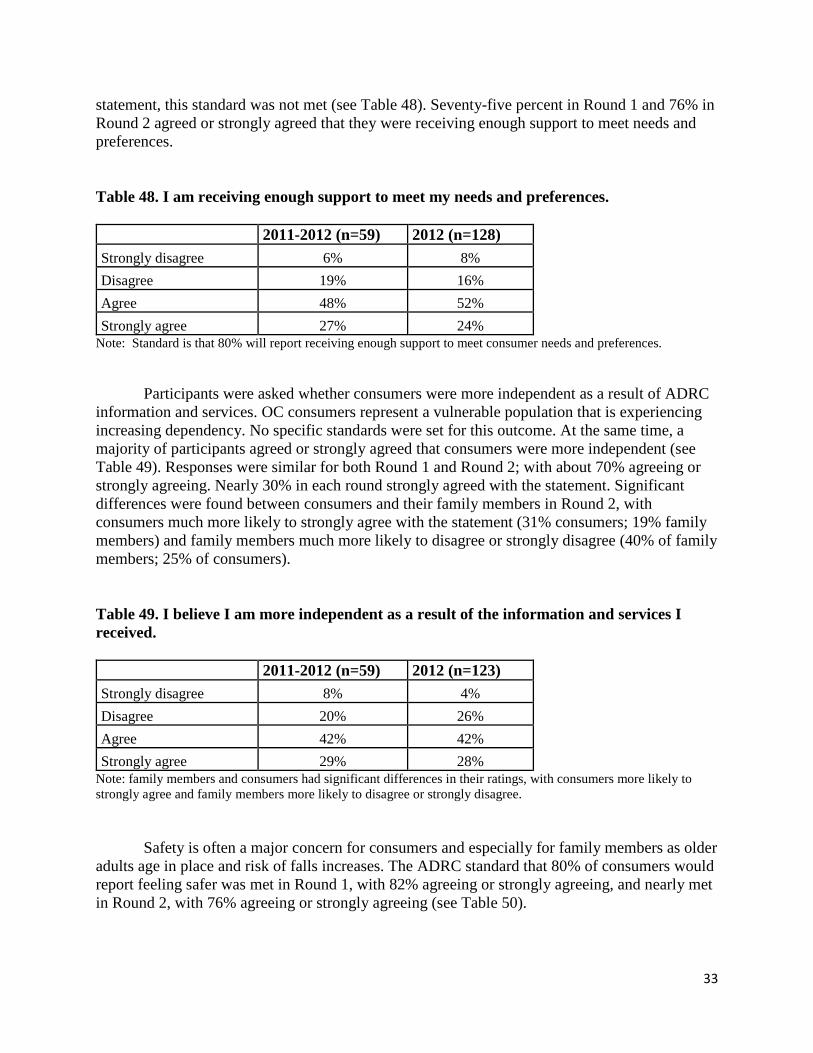
3. I believe I am more independent as a result of the information and services I received (no standard set). Round 1: 71%; Round 2: 70%. About 28% strongly agreed. Families and consumers had different responses, with consumers much more likely to agree with the statement than family members.
4. I believe I am safer in my home (80%). Round 1: 82%; Round 2: 76%. About 30% strongly agreed. Standard not met for Round 2,
5. The services or information received have allowed me to expand or maintain activities outside of my home (no standard set). Round 1: 46%; Round 2: 56%. About 15% strongly agreed. Family members and consumers differed in their ratings, with consumers more likely to strongly agree with the statement than family members and family members more likely to disagree.
6. The services or information received have helped make the most of personal money and resources (70%). Round 1: 65%; Round 2: 61%. About 17% strongly agreed. Standard not met.
7. I was eventually able to find help I could afford (no standard set). Round 1: question not asked; Round 2: 65%; 17% strongly agreed.
Participants also were asked what their circumstances would have been without the ADRC. About 25% of Round 1 and 30% of Round 2 participants indicated that their circumstances would not be any different. Many had contacted the ADRC for information which they did not need to act on at the present time. Their comments generally reflected positive or neutral attitudes toward the ADRC. Most participants, however, indicated that they would have been worse off without the ADRC. For some, this reflected minor differences in their situations. Most, however, felt their circumstances would have been much worse in areas of emotional health, daily functioning, finances, housing, and caregiving. A very few participants indicated they would have been better off without the ADRC, but the percentage declined from Round 1 to Round 2. Public Programs and Assistance All participants (Call Center and OC consumers) were asked what decisions they had made as a result of their contact with the ADRC and OC, and whether these contacts resulted in services. In Round 2, 46% had made a decision to seek services. Of those, 9 were waiting to see if they were

6
eligible and 18 had been denied services. The remaining 111 had received services. Nearly 75% of those reported they had received assistance with the paperwork needed to get services and benefits, a higher level of assistance than was reported in Round 1 (59%). Participants were asked if they had received specific categories of services (9 services in Round 1, 10 in Round 2). For each service received, participants were asked whether services had been delivered in a timely way and how helpful they had been. The most frequently used service for both rounds of data collection involved financial assistance, with 64% (Round 1) and 58% (Round 2) (e.g., applying for Medicaid, heat assistance). Other frequently used services were meals, transportation, help managing health, and housekeeping. Services used less often included personal care (including with bathing), accessing additional information, home modification, legal assistance, and help with managing money and assets.
In general, services began in a timely way, especially in Round 2. In both rounds, the shortest waits were for meals services and the longest for financial assistance. Ratings of helpfulness of services were quite high for both rounds of data collection. The highest ratings in Round 1 were for personal care assistance, and legal assistance, and in Round 2, for help managing assets and transportation. However, ratings of helpfulness of services declined in six of the nine categories measured from Round 1 to Round 2. Exceptions were for transportation, bathing, and home modification, where ratings of helpfulness increased.
Participants often received more than one service. Between a quarter and a third of respondents received two services in both rounds, and about 18% received three. About 10% received four services and between 7% (Round 1) and 12% (Round 2) received five or more. Remaining concerns. About 25% of participants in both rounds reported concerns that the ADRC had not addressed. Frequently, individuals were waiting for services. Some had not met eligibility requirements or could not find services they needed or could afford. Many participants talked about the need for home modification, yard work, and home maintenance. Very few individuals actually received this type of service, which suggests lack of resources due either to eligibility criteria or lack of available services. Eligibility issues and unmet need for services frequently were associated with frustration about responsiveness of agencies and caseworkers. Some expressed dissatisfaction with the services, including rude or nonresponsive staff.
Recommendations and Conclusions The ADRCs and OC services are making positive differences in the lives of consumers. Overall, satisfaction ratings are high. For the most part, stringent standards established by the ADRC Advisory Committee are being met or nearly met. Staff consistently are seen as respectful, knowledgeable, and spending sufficient time with consumers to learn about their needs and preferences. Over the two rounds of surveys, ratings have improved in many areas including access and awareness, decision support, service delivery, and follow up. The majority of survey participants found the ADRC to be very helpful and 90% would recommend ADRCs to friends and families. At the same time, 25% of participants in both rounds of the survey reported having concerns that had not been addressed, and some metrics are not being met.

7
Below we highlight specific conclusions and recommendations based on findings including those related to awareness and access, services, and outcomes. Awareness & Access
• Because many paths lead to the ADRC, outreach should continue on all fronts including media campaigns and partnering with other organizations (e.g., social service agencies, clinics and hospitals, professional associations, community organizations).
• Although most consumers talk to a person when they call the ADRC and most of those who did not received a return call in a reasonable time, too many consumers reported waiting much too long. Continuing effort is needed to make enough staff available to answer calls and respond to messages. This needs to be done without sacrificing time spent with people on the phone to learn about their individual needs.
• The number of people who did not reach a person and, as a result, failed to connect with the ADRC is unknown. Additionally, how weekend calls are a factor in participants’ assessments of waiting too long and whether more access outside of normal business hours would increase ratings of prompt or timely services cannot be determined from these data. We encourage ADRCs to monitor lost calls and response time for returning calls and to consider extending hours of Call Center services.
• At present the website is a rarely used as a direct pathway to the ADRC. However, the website is an important tool and is likely to become an increasingly important way to access services in the future. Continued efforts should be made to make the website easy to navigate and to promote the website to the general public and service providers.
• The ADRC building is an effective way for consumers to connect with the ADRC. Services
• Consumers are generally getting the information they need, including relevant written materials. Staff should continue their good work in listening to needs, developing knowledge about resources, and assisting consumers with paperwork.
• Timeliness of services has improved. Those arranged most quickly included meals, transportation, managing health, housekeeping, legal services, and personal care. Such services are related to physical health needs of consumers, the need identified most often by consumers.
• Consumers wait longest for financial assistance, also a high area of need. Not quite 10% reported waiting much too long for these services. Continued efforts are needed to streamline access and reduce wait times.
• A few participants reported waiting much too long for home modification and receiving a home visit. Most participants, however, reported all of these waits were reasonable.
Staff
• Overall, staff are perceived as very respectful, very knowledgeable, and good at explaining services, helping consumers explore choices, considering consumer opinions, and supporting their decisions. Thus, it appears that the ADRC is supporting self determination and providing decision support according to professional standards.
• Some areas bear watching. Ratings of excellence declined between Round 1 and Round 2 with respect to the ability of ADRC staff to help participants understand the service system (48% to 43%) or to improve understanding about available options (78% to 69%).

8
Ratings of the staff excellence in explaining how to get information and help needed remained at about 50%.
• Enhanced training is needed for staff to develop skills in clearly conveying information about services and options to a lay population with no prior experience in social and health services and who are confronting significant life changes.
• Although improvements have been made, development of action plans and follow up with consumers are falling short. Based on open-ended responses to questions, a major concern voiced by many participants was a failure to hear back from the ADRC or to get phone calls returned. Follow up is a vital OC service, so agencies should be encouraged to plan and staff appropriately to support this vital function.
Outcomes • A challenge for ADRCs is to continue to support and grow positive outcomes. A goal for
the future is to help consumers get sufficient services and supports that will move more ratings from the “agree” into the “strongly agree” column.
• As described above, 25% of consumers indicated that they had concerns that had not been addressed, reflecting unmet need. The information contained in the open-ended comments can be used to strengthen staff training, identify potential partners, and fill gaps in services.
The overwhelming majority of survey participants indicated that they would recommend the ADRC to friends or others in need of help. Even if all needs are not being met, the ADRC is making a positive difference for consumers and their families. Positive correlations between key variables suggest the importance of a knowledgeable and courteous staff skilled in providing decision support. Staff with these traits are associated with higher ratings of ADRC helpfulness, and positive outcomes. Cause cannot be attributed through correlations, but data do suggest that continued development of a strong and capable workforce, along with filling service gaps will be important strategies to strengthen the ADRC program and address the needs of growing numbers of ADRC consumers.

9
Consumer Satisfaction with
Aging & Disability Resource Connection
(ADRC) Services: Round 2
Diana White & Sheryl Elliott Portland State University Institute on Aging
May 2013
Aging and Disabilities Resource Centers (ADRC) are a program of the Administration for Community Living (ACL), the Centers for Medicare and Medicaid (CMS), and, most recently, the Veterans Health Administration. ADRCs exist in all 50 states and in 4 Territories; they serve as a single entry point into the long-term services and supports systems for older adults and those with disabilities. The goal of the program is to provide a coordinated system of information and access to those seeking long-term services and support, thereby minimizing confusion, enhancing individual choice, and supporting informed decision-making. ADRCs are also designed to assist State and local governments to manage resources and monitor program quality through a centralized data system (http://acl.gov/Programs/Integrated_Programs/ADRCs/Index.aspx; downloaded 4/16/13).
Aging and Disability Resource Connections (the ADRC in Oregon) was established in
2008. The program was developed through a pilot program with three Area Agencies on Aging serving 9 contiguous counties and 31% of Oregon’s population. The program is now expanding statewide. Options Counseling (OC) is a core service of ADRCs and involves an interactive process between an options counselor and consumers, family members, caregivers and significant others to support informed decision making consistent with the consumer’s preferences, strengths, needed services, values and unique circumstances. In 2010-2011 professional standards were developed for options counselors in Oregon. The standards focused on six areas of competency, or job clusters, which had been defined previously by the Administration on Aging (now Administration for Community Living). These were:
• Determine the need for Options Counseling • Assess needs, values, and preferences • Understanding and educating about public and private sector resources • Facilitating self determination • Encourage a future orientation • Follow-up
Specific job tasks required for satisfactory job performance were identified and include making home visits when indicated; learning directly from consumers about the issues they face, their strengths, resources, and preferences for services; identifying public and private resources; presenting information about options in support of informed decision making; and following up with consumers. Proficiency in person-centered care practices, ability to communicate clearly, and knowledge about resources were among multiple competencies identified in the development of standards (White, Foucek Tressider, Carder, Truxillo, & Barrios, 2012).

10
In 2012, Oregon’s ADRC Advisory Council approved ADRC standards based on consumer expectations related to core functions of the ADRC, including use of the Call Center and options counseling services. Furthermore, they established metrics against which to measure program success (ADRC, 2013). This report describes results of the Oregon consumer satisfaction survey conducted in November 2012. This was the second round of data collection using the consumer satisfaction survey developed as part of the evaluation of the ADRC (White, Elliott, Carder, & Luhr, 2012). The consumer satisfaction survey focused on three of the core ADRC functions: 1) information, referral, and awareness; 2) options counseling; and 3) streamlined eligibility determination for public programs.
Results from the Round 2 survey are compared to Round 1 (2011-2012) results. It should
be noted that the usefulness of the comparisons may be somewhat limited. In Round 1, only those ADRC and Options Counseling (OC) served by the three pilot sites (Northwest Senior & Disability Services, Oregon Cascades West Council of Governments, Lane Council of Governments) were included. As described below, the Round 2 survey included ADRC and OC consumers throughout Oregon. Therefore, the two surveys may not be comparable and caution is needed in interpreting results.
Participants
The sample was drawn from all users of Options Counseling (OC) (n=635) and Call
Center ADRC services (n=9877) between July and September 2012; OC consumers represented 6% of those served during this time. After eliminating duplicate numbers and cases with incomplete data, a stratified random sample of 1,006 was drawn, oversampling OC users. Based on the previous survey, we determined this sample size was needed to reach a goal of 300 completed interviews.
The stratified random sample was composed of 180 options counseling consumers (18%
of the total sample) and 826 (82%) information and assistance (I&A), or call center, consumers. Interviews were conducted by the Portland State University Survey Research Lab over a 13-day period in November 2012; length of interviews averaged about 19 ½ minutes. Of the 1,006 random numbers, 713 (71%) were deemed eligible numbers (ineligible numbers included fax numbers, disconnected phones, non-residential or group home phones, not reaching someone knowledgeable about the service, social service agency). Of the 713 eligible numbers, 303 interviews were completed, a 42% response rate over all; 168 (24%) refused to participate. Calls were unsuccessful for 190 (27%) because interviewers reached an answering machine or voice mail only, a busy signal, or no answer. The remaining 52 (7%) included a language or disability barrier or an interview that was not completed.
The 303 survey participants were comprised of 232 (28%) of all users of the ADRC Call
Centers (i.e., Information and Assistance (I&A) services) and 71 (39%) of all those who had received options counseling services. The distribution of consumers around three geographical regions were as follows: a) 113 consumers came from the three original ADRC pilot sites, b) 155 were located in counties serving the Portland-Metropolitan area (Multnomah, Washington, Columbia, and Clackamas Counties), and c) 35 consumers lived in regions with emerging

11
ADRCs (e.g., Rogue Council of Governments, Central Oregon Council on Aging). More information is presented in Table 1.
Of the 303 participants surveyed, 240 were consumers and 63 were family members. The
demographic characteristics of each group are presented in Table 2. Responses were similar for most survey items; therefore most of the data presented in this report combine consumers and family members. Where significant differences occurred between the two groups, they are noted in the text and tables. Family and consumer data from the Round 1 survey were also combined to ease comparisons between Round 1 and Round 2 findings.
Table 1. Round 2 sample distribution (November 2012)
Pilot Sites
Multnomah Washington Columbia
Clackamas Emerging ADRCs Total
Total Sub-
sample Completed
N % Total sub-
sample Completed
N % Total sub-
sample Completed
N % Sample N %
Completed N %
Options Counseling
44 15 (34%) 130 53 (41%) 6 3 (50%) 180 71 (39%)
Call Center (I&A)
353 98 (28%) 353 102 (29%) 120 32 (27%) 826 232 (28%)
Total 397 113 (28%) 483 155 (32%) 126 35 (28%) 1006 303 (30%)
Table 2. Sample Characteristics for Round 2
Participants Total Sample (N=303)
Consumer Family # % # %
Number 240 80 63 20
Women 176 72 50 86 Mean Age 67 years 61 years Age Range 31-93 26-100
Median Education H.S graduate 21 Some College 26 Median Income $10-20,000 41 $30-40,000 20 Race/ethnicity 202 80 55 90
Options Counseling Consumers. In Round 1, because the service and database were new,
only 11 consumers who had received OC services completed the survey, limiting our ability to learn about the experiences of OC consumers. With Round 2, therefore, we are able to more fully assess the impact of options counseling services.

12
Although 37% of the total sample came from one of the three pilot sites, only 15 OC consumers (21% of the 71 OC consumers interviewed) were served by these agencies. The majority of OC consumers (53; 75% of the OC sample) were served through the Metropolitan counties although these counties accounted for 51% of the total sample (both OC and Call Center consumers). Three consumers (4%) were served through the emerging ADRCs. Thus, in this report, OC consumers served in the metropolitan communities were over represented in comparison to pilot and emerging ADRCs. Refusal rates were similar across agency types. As in Round 1, participants were asked if they had received a home visit. Although home visits are associated with OC services, 64 (22%) call center consumers who were not identified in the database as receiving OC services indicated they had received a home visit (see Table 3). It may be that these individuals had not yet been identified as OC consumers when the sample was drawn, but had received OC services when interviewed 2-3 months later. Or, they might have received a home visit from another agency.
Table 3. Round 2 sample by Options Counseling and Home Visit Categories (2012)
N=297 Percent
Options Counseling, home visit 57 19% Options Counseling, no home visit 14 5% Call Center consumer, home visit 64 22% Call Center consumer, no home visit 162 55%
Note: Status of home visits for 6 call center consumers is unknown
Measures
The survey instrument used was developed to evaluate consumer satisfaction with specific aspects of the ADRC and OC Services. This process is described in a previous report (White, Elliott, Carder, & Luhr, 2012). It involved open-ended telephone interviews with OC clients focused on OC competencies, review of existing tools, participation in AoA (which is now a part of ACL) efforts to develop core questions, and consultation with the ADRC Advisory Committee. The survey was pilot tested with ADRC Call Center and OC consumers. The pilot test revealed that many of the questions developed for consumers of OC services were not relevant for consumers who received only I&R/A services. As a result, we developed both a long form and short form of the survey; the long form was used with OC consumers and ADRC Call Center consumers who reported receiving a home visit. Following analysis of Round 1 results, and in consultation with the Advisory Committee, minor modifications were made for Round 2. These changes are noted in the presentation of results. The survey used for Round 2 is presented in Appendix A.

13
Results
This report includes comparisons of consumer satisfaction reported in Round 1 of data collection (October 2011 to February 2012) with consumer satisfaction reported in Round 2 (November 2012). The longer length of time for Round 1 data collection reflects the time needed to obtain a sufficient sample size due to program start up, including the developmental stage of the data base. In both rounds of data collection, participants who had received ADRC services within the past two months were interviewed. The results are organized according to the ADRC of Oregon Core Standards for Fully Functioning ADRCs in Oregon (January 2013). Three of the five core functions of the ADRC were addressed in this survey. The first is information, referral and awareness. Specific issues addressed include pathways to the ADRC, Call Center customer service, access to the ADRC building, overall ADRC experience, and information and assistance. The second function focuses on options counseling and explores the extent to which options counselors are meeting professional standards. Outcomes attributed to ADRC services were also identified. The third core function is streamlined eligibility determination for public programs. This function was examined by asking consumers about accessing services, the services ultimately received, and unmet needs and concerns.
In the tables that follow, percentages may not add to 100% due to rounding error. Sample
size for responses to each question are included. Differences in number of responses for each question are related to whether participants received the long or short form of the survey and whether participants answered the question they were asked. Generally, “don’t know” and “refused to answer” responses were counted as missing data and are not reflected in the tables.
Information, Referral, and Awareness Pathways to the ADRC
Need. People seek support from the ADRC because of multiple needs. In Round 1, we asked the open-ended question: Can you tell me a little about why you were in contact with the ADRC? Responses were coded into categories of health, help in the home, financial assistance, and housing; 13 subcategories were identified. Participants often identified more than one reason. In Round 2, we asked participants about each of those service categories (see Table 4); once again participants frequently identified more than one type of need. In addition, the same open-ended question was posed at the beginning of the Round 2 survey and representative responses are also presented in Table 4.
About 75% percent of participants indicated they had called for general information and advice. For some, this was all that was needed at the time as represented with these comments:
• I just wanted to check them out. • I am 80 years old. My husband and I never needed any help. I have no family here. I
needed to know if there was an emergency where I could go for help.
14
• I read an article about them in the newspaper, and my daughter was here at the time. We decided to go down there to learn about it. It sounded interesting to me, it seems like this is something that might help my partner and me in the future.
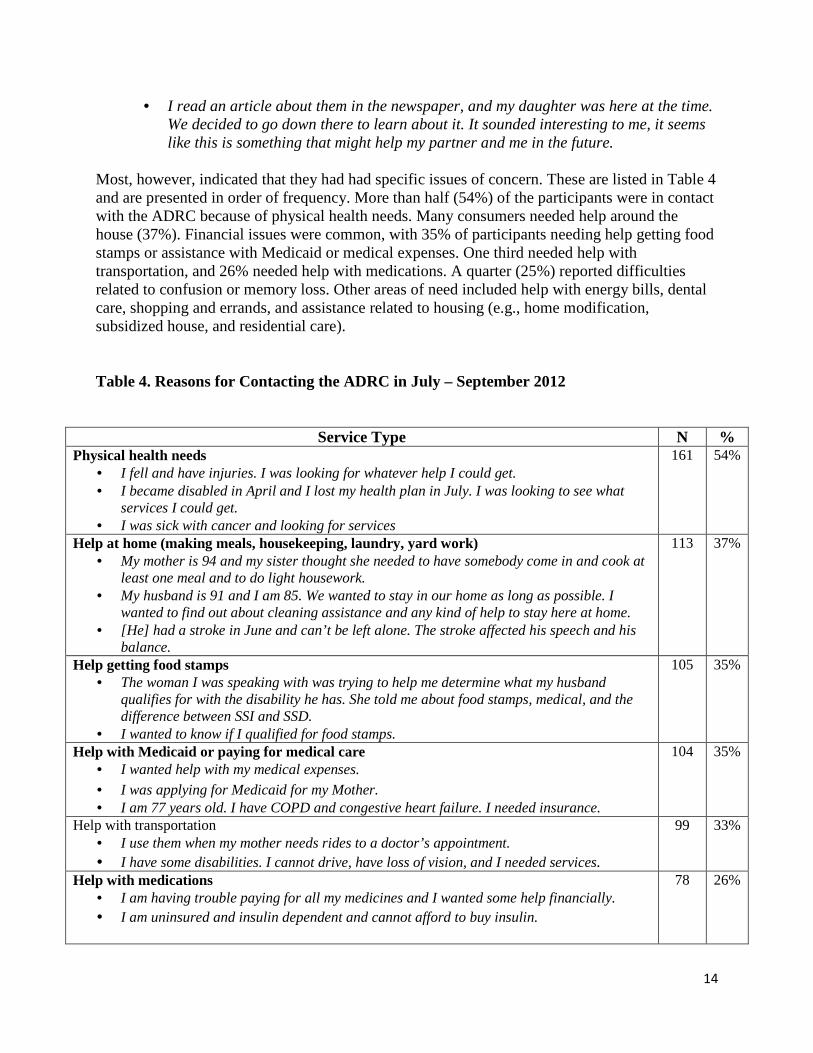
Most, however, indicated that they had had specific issues of concern. These are listed in Table 4 and are presented in order of frequency. More than half (54%) of the participants were in contact with the ADRC because of physical health needs. Many consumers needed help around the house (37%). Financial issues were common, with 35% of participants needing help getting food stamps or assistance with Medicaid or medical expenses. One third needed help with transportation, and 26% needed help with medications. A quarter (25%) reported difficulties related to confusion or memory loss. Other areas of need included help with energy bills, dental care, shopping and errands, and assistance related to housing (e.g., home modification, subsidized house, and residential care).
Table 4. Reasons for Contacting the ADRC in July – September 2012
Service Type N % Physical health needs
• I fell and have injuries. I was looking for whatever help I could get. • I became disabled in April and I lost my health plan in July. I was looking to see what
services I could get. • I was sick with cancer and looking for services
161 54%
Help at home (making meals, housekeeping, laundry, yard work) • My mother is 94 and my sister thought she needed to have somebody come in and cook at
least one meal and to do light housework. • My husband is 91 and I am 85. We wanted to stay in our home as long as possible. I
wanted to find out about cleaning assistance and any kind of help to stay here at home. • [He] had a stroke in June and can’t be left alone. The stroke affected his speech and his
balance.
113 37%
Help getting food stamps • The woman I was speaking with was trying to help me determine what my husband
qualifies for with the disability he has. She told me about food stamps, medical, and the difference between SSI and SSD.
• I wanted to know if I qualified for food stamps.
105 35%
Help with Medicaid or paying for medical care • I wanted help with my medical expenses.
• I was applying for Medicaid for my Mother. • I am 77 years old. I have COPD and congestive heart failure. I needed insurance.
104 35%
Help with transportation • I use them when my mother needs rides to a doctor’s appointment. • I have some disabilities. I cannot drive, have loss of vision, and I needed services.
99 33%
Help with medications • I am having trouble paying for all my medicines and I wanted some help financially. • I am uninsured and insulin dependent and cannot afford to buy insulin.
78 26%

15
Service Type N % Confusion or memory loss
• My husband has a head injury and he needs 24-hour care. • My Mother . . . was diagnosed with a disease like Parkinson’s. Her mental state and
physical state has declined. We were looking for help taking care of her. • My husband has Lewy Body Disease. I suffer from bipolar. I am trying to care for him,
and we have really been struggling.
74 25%
Help paying for energy bills • They put me on the list for the oil assistance. • To see if I had the right information for power bill assistance.
64 21%
Help getting caregiver respite? • I am the caregiver for my husband, who has Alzheimer’s. I was interested in what is
available for Veterans and this aging process. Help as far as Respite, care, and help for me.
• My husband is 78 and he was facing knee replacement surgery. I called them to see if they could be of some help to me in this period.
• I’m taking care of my mother and I needed help. I desperately needed respite care. • I want to find information about how to reduce the buden on my family members.
62 21%
Dental care • Assistance with broken dentures. • Dental work.
58 19%
Did you contact ADRC to get help with anything else that we did not already cover • I wanted to talk to them about a legal concern. • Bedbug problem. • Someone else was caring for my Mom. They were not taking care of her like they should
have and ADRC got involved. • I was having personal problems. • I did my taxes there. • I am in a wheelchair and my son has to live with me as caregiver. I wanted to be able to
pay him.
57 19%
Help getting shopping and errands done • I was looking for help grocery shopping and doing laundry. • My husband has dementia and I cannot leave him. I need somebody to stay with him when
I go shopping.
53 18%
Help with housing: Finding housing, home modification • They are turning my apartments into condominiums and I am being pushed out. • I wanted to get my bathroom remodeled and made handicap accessible.
50 17%
Help moving into an assisted living residence, adult foster home, or nursing home • I have to move my elderly father from Oklahoma and needed to find a place for him. • My Mom wanted to go into an assisted living program and we needed to know what help
is available for her.
36 12%
Note: This list was generated from the Round 1 open-ended question, Can you tell me a little about why you were in contact with the ADRC? The quotes in this table come from the Round 2 participants who were asked the same question.

16
Learning about the ADRC. Consumers find their way to the ADRC in many different ways (Table 5). For both survey rounds, about 20% learned about the program through the media, followed by information from a friend. Combined referrals from another agency or from the medical profession accounted for about 17% of the pathways to the ADRC in 2012, which is less than the percentage (24%) reported in 2011-2012. As in Round 1, consumers in Round 2 were more likely to learn about the ADRC from friends than family members were, and family members were more likely to learn about it through the medical profession (i.e., hospital, clinic, doctor, or nurse) and through the Internet. The percentage of consumers and family members reporting learning about the ADRC from another agency or the medical profession declined somewhat. Table 5. How did you first learn about the ADRC?
Round 1 (n=247 ) Round 2 (n=303)
Referral from another agency 11% 8% Friend 15% 13% Hospital/clinic/doctor/nurse 13% 9% Family 1% 1% Nursing home/assisted living 4% 2% Phone book 7% 6% Recommendation/word of mouth 4% 5% Brochure/flyer 6% 2% Media/newspaper/TV/radio 20% 21% Internet 4% 6% Other (please specify) 15% 20% Don’t know 9% 9%
Table 6. How did you first come in contact with the ADRC?
Round 1 (n=230 ) Round 2 (n= 287) By telephone 66% 59% Went to the office, in person 17% 21% They called me 6% 12% email <1% - Through the website 1% 1% Other (please specify) 9% 8%
Contact. Most people first came into contact with the ADRC by telephone, although Round 2 participants were somewhat less likely to contact the ADRC this way. Round 2 participants were more likely to go to the ADRC office or receive a call from the ADRC than the

17
Round 1 participants. Only 1% made first contact through the ADRC website in both time periods. (See Table 6 for more information) Once people make contact with the ADRC, they tend to have additional contact. This is especially true for Round 2 participants; 43% (compared to 30% for Round 1) reported having more than three additional contacts (see Table 7).
Website. Although the majority of participants reported having access to a computer (74% Round 1, 68% Round 2), only 15% in both rounds rated their skills as excellent. Ratings were virtually the same for both rounds, with the majority reporting their computer skills were poor (36 or 37%) or fair (26%). It is not surprising, therefore, that few participants are using the ADRC website (13% of Round 1 and 10% of Round 2 participants). Those who do, however, tend to use it again, with the amount of use increasing from Round 1 to Round 2. For example, 37% of Round 2 participants used the Website more than three times compared to 16% of Round 1 users. The benchmark established by the ADRC advisory committee was that fewer than 15% would report the website is hard to navigate. This metric was met for both Round 1 and Round 2 consumers. Furthermore, as shown in Table 9, the percentage of those finding it difficult to use in Round 2 was half that of participants in Round 1. Table 7. Since that time, would you say you've had contact with the ADRC:
2011-2012 (n=241) 2012 (n=300) No contact - 9% 1 time 32% 16% 2 to 3 times 38% 32% More than 3 times 30% 43%
Table 8. Have you used the ADRC website?
2011-2012 (n=243) 2012 (n=296) Yes N=31; 13% n=31; 10% If yes, how many times have you used the website?
(n=31 )
(n=30)
1 time 29% 20% 2 to 3 times 55% 43% More than 3 times 16% 37%
Table 9. How easy was the website to use?
2011-2012 (n=28) 2012 (n=27) A little difficult 14% 7% Somewhat easy 32% 48% Very easy 54% 44%
18
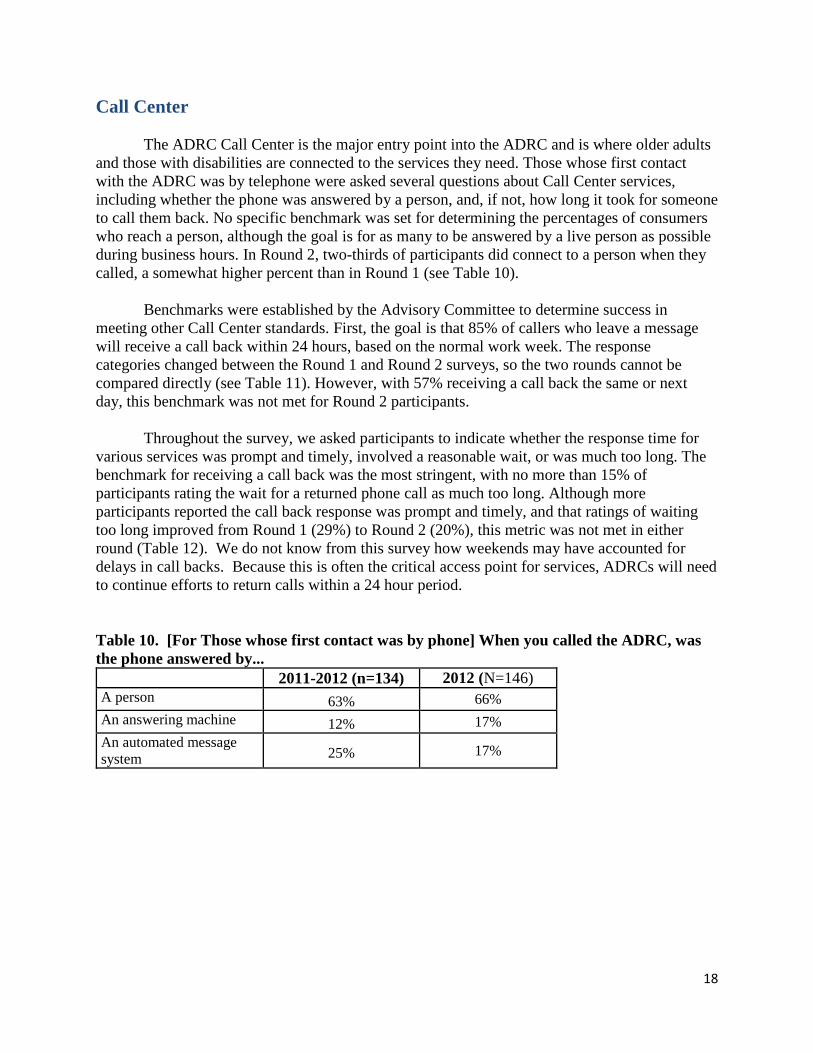
Call Center The ADRC Call Center is the major entry point into the ADRC and is where older adults and those with disabilities are connected to the services they need. Those whose first contact with the ADRC was by telephone were asked several questions about Call Center services, including whether the phone was answered by a person, and, if not, how long it took for someone to call them back. No specific benchmark was set for determining the percentages of consumers who reach a person, although the goal is for as many to be answered by a live person as possible during business hours. In Round 2, two-thirds of participants did connect to a person when they called, a somewhat higher percent than in Round 1 (see Table 10).
Benchmarks were established by the Advisory Committee to determine success in meeting other Call Center standards. First, the goal is that 85% of callers who leave a message will receive a call back within 24 hours, based on the normal work week. The response categories changed between the Round 1 and Round 2 surveys, so the two rounds cannot be compared directly (see Table 11). However, with 57% receiving a call back the same or next day, this benchmark was not met for Round 2 participants.
Throughout the survey, we asked participants to indicate whether the response time for
various services was prompt and timely, involved a reasonable wait, or was much too long. The benchmark for receiving a call back was the most stringent, with no more than 15% of participants rating the wait for a returned phone call as much too long. Although more participants reported the call back response was prompt and timely, and that ratings of waiting too long improved from Round 1 (29%) to Round 2 (20%), this metric was not met in either round (Table 12). We do not know from this survey how weekends may have accounted for delays in call backs. Because this is often the critical access point for services, ADRCs will need to continue efforts to return calls within a 24 hour period.
Table 10. [For Those whose first contact was by phone] When you called the ADRC, was the phone answered by...
2011-2012 (n=134) 2012 (N=146) A person 63% 66% An answering machine 12% 17% An automated message system 25% 17%

19
Table 11. When did someone from the ADRC get back to you?
2011-2012 (n=44) 2012(n=48) Response categories in 2011-2012
On the same day 20%
In the same week 68%
More than a week 11%
Response categories in 2012 On the same day 15% The next day 42% 2 to 4 days 29% 5 or more days 15%
Table 12. Do you think that the ADRC's response time was...
2011-2012 (n= 48) 2012(n=49) Prompt and timely 23% 35% Some wait, but was reasonable 48% 45% Much too long 29% 21%
Note: The standard is that no more than 15% will report the wait is much too long.
Access to the ADRC Building Access to the ADRC building is important to many and is another means of meeting the needs of consumers and their families. Approximately 40% of participants in both rounds had their first contact with the ADRC at the ADRC building. The benchmark established by the Advisory Council was that 90% would report that the building was somewhat or very easy to find. As shown in Table 13, this was met in Round 1 (92%), but fell somewhat short in Round 2 (87%). Improvements in access to the ADRC were made in other areas. Eighty-eight percent (88%) of Round 2 participants who went to the ADRC reported it was convenient, exceeding the performance benchmark of 85% and improving performance from Round 1 (79%; Table 14). Most participants had little wait once they got to the ADRC, meeting the benchmark of 40% waiting less than five minutes before seeing someone in Round 2. Similarly, fewer people reported waiting more than 20 minutes to see someone, meeting the goal of no more than 10% in Round 2. Regardless of the wait time, very few participants reported that it took “much too long” to see someone at the ADRC, meeting the standards for each round.

20
Table 13. Did you ever go to the ADRC building?
2011-2012 (n=207) 2012(n=245) Yes 39% 41% If yes, how easy was it to find? N=118 N=150 Very difficult 1% 2% A little difficult 8% 11% Somewhat easy 20% 16% Very easy 72% 71%
Note: Standard is 90% will report the ADRC is somewhat or very easy to find.
Table 14. How convenient was it for you to go to the ADRC?
2011-2012 (n=120) 2012 (n=155)
Not at all convenient 7% 4% Not that convenient 14% 8% Somewhat convenient 24% 27% Very convenient 55% 61%
Note: Standard is 85% report that it was somewhat or very convenient to go to the ADRC. Table 15. When you first went to the ADRC, how long did you have to wait to see someone?
2011-2012 (n=121) 2012 (n=152) Less than 5 minutes 34% 42% Between 5 and 20 minutes 46% 43% Longer than 20 minutes 11% 7% I had to arrange another time to come back 3% 3%
I did not see anyone 34% 5% Note: Standards are that 40% report that they waited less than 5 minutes to see someone and no more than 10% report waiting more than 20 minutes to see someone. Table 16. Do you think that your wait time to see someone was...
2011-2012 (n=114) 2012 (n=142) Short and timely 43% 50% Some wait, but was reasonable 53% 46% Much too long 4% 4%
Note: Standard is fewer than 10% report it took “much too long” to see someone.

21
Information and Referral/Assistance Good information and referral and assistance (I&R/A) requires knowledgeable staff who communicate clearly with callers. This involves helping callers to understand the service system and providing clear explanations about how to get the help needed. Good service involves providing relevant materials about resources available. Such assistance will result in timely access to needed services. Standards established for I&R/A services through the ADRC included that 85% of participants would report staff to be knowledgeable and good or excellent at explaining how to get help and information needed, 90% who received written materials would find them relevant, and 80% would describe the staff as good or excellent in helping them understand the service system. Finally, no more than 20% of participants would report waiting “much too long” to receive services. We were interested in how well ADRC staff provide person-centered services and the extent to which services are based on the unique circumstances of the caller. One indicator is whether participants feel listened to and understood. To tap this, we asked whether the staff at the ADRC spent enough time with them to understand their concerns. As shown in Table 17, the overwhelming majority of both Round 1 (87%) and Round 2 (86%) participants felt that the staff person had spent enough time with them. Table 17. Do you think that the person at the ADRC spent enough time with you to understand your concerns?
2011-2012 (n=243 ) 2012 (n=292) Yes 87% 86%
Table 18. How knowledgeable was this person about helpful resources and services?
2011-2012 (n=237) 2012 (n=286)
Not at all knowledgeable 3% 3% Not that knowledgeable 5% 4% Somewhat knowledgeable 18% 20% Very knowledgeable 74% 73%
Note: Standard is 85% will report that the ADRC staff person was somewhat or very knowledgeable.
The standard for knowledgeable staff was exceeded, with 92% of Round 1 and 93% of Round 2 participants describing staff as somewhat or very knowledgeable (see Table 18). In fact, about three-quarters of participants assigned staff the highest rating of “very knowledgeable.” Similarly, participants felt that ADRC staff did a good or excellent job of explaining how to get needed help and information (80% Round 1; 78% Round 2), with about half assigning the highest rating of “excellent” at both time periods. Nearly three-quarters of participants (72%)

22
during Round 1 and two-thirds (66%) during Round 2 received written materials after their contact with I&R/A services. The standard for of those receiving materials was that 90% would find those materials relevant to their concerns; this was met in Round 1 (92%) and nearly met (89%) in Round 2 (Tables 20 & 21). Table 19. How would you rate this person on explaining how to get the help or information you needed?
2011-2012 (n=243) 2012 (n=296) Poor 10% 8% Fair 9% 10% Good 31% 29% Excellent 49% 49% Not Applicable 2% 3%
Note: Standard is 85% will report that ADRC staff were good or excellent at explaining how to get the help and information needed.
Table 20. Did you receive written materials?
2011-2012 (n=235) 2012 (n=288) Yes 72% 66%
Table 21. Were the materials relevant to your concerns?
2011-2012 (n=162) 2012 (n=178) Yes 92% 89%
Note: Standard is that of those receiving written materials, 90% will report they are relevant to their concerns.
Receiving services in a timely way is important to vulnerable populations. Throughout the survey participants were asked to rate the responsiveness of the service system from their own perspectives. As described before, responses ranged from “prompt and timely” to “much too long.” The standard set by the Advisory Committee was that no more than 20% of participants would report waiting much too long to receive services. This standard was easily met for Round 2 participants, although as noted previously the more stringent standard of 15% was not met for receiving a call back from the agency (see Table 22).
Improvements in timeliness also occurred in waits for housekeeping services, where assessments of waiting too long declined from 25% to 4%. In Round 1, waits that were too long were also indicated for seeing someone at the ADRC building (4%), receiving a home visit (9%), and for “other” services not specified (16%). For Round 2, between 4 and 7% reported waiting much too long to receive a home visit, obtain personal care services, housekeeping services, managing health, and waiting to see someone at the ADRC building. No one reported waiting

23
much too long for home modification, meals services, transportation, legal services, or other benefits. For both rounds, obtaining meal services, transportation, and help with managing health were the services most likely to be arranged in a prompt and timely way. Table 22. Timeliness of Services
2011-2012 2012 Prompt Reasonable Too long Prompt Reasonable Too long Receiving a call backa
23% 48% 29% 35% 35% 20% Seeing someone at the ADRC buildingb 43% 53% 4% 50% 46% 4%
Receive a home visitb 45% 45% 9% 36% 57% 7%
Housekeeping servicesb 33% 42% 25% 59% 37% 4%
Home modificationb 43% 57% 0 50% 50% 0
Personal careb 77% 23% 0 50% 43% 7%
Meals servicesb 83% 17% 0 88% 12% 0
Managing healthb 68% 32% 0 74% 22% 4%
Benefits, financial assistanceb 36% 64% 0 48% 42% 9%
Managing money, assetsb Not asked in Round 1 100% 0% 0
Transportationb 78% 22% 0 78% 19% 0 Legal servicesb
33% 67% 0 70% 30% 0 Other benefitsb 52% 32% 16% 68% 32% 0
Note: a Standard is that no more than 15% will report waiting too long for a returned phone call. bStandard is that no more than 20% of participants will report waiting too long for services.
The Advisory Committee established a standard that 90% of Call Center consumers identified by I&R/A staff as needing follow up by the ADRC would receive that follow up. Determining whether this standard was met is not possible through the consumer satisfaction data. Evaluating success in meeting this standard will require review of the ADRC database.
At the same time, 46% of Call Center and Options Counseling consumers reported receiving a follow up call from ADRC during Round 1. This increased to 62% of consumers receiving a follow up call during Round 2. We do not have any information regarding ADRC staff perceptions of the importance of follow up for these individuals.
Overall ADRC Experience Standards for the overall ADRC experience include having staff that are courteous, respectful, and responsive, and services that are easily accessible. The performance benchmarks are that 85% of participants will report that ADRC staff are very respectful, 55% will report

24
receiving all of the information they needed, and at least 35% will report receiving some of the information they need. Finally, the expectation is that 75% will report that it would be easy or very easy to contact the ADRC again. In both rounds, participants were overwhelming in their ratings of respect with 87% and 88% of participants rating staff as very respectful in Round 1 and Round 2 respectively (Table 23), clearly meeting the standard. Standards regarding receiving information were within a point of meeting standards at both rounds (Table 24). Significant differences occurred between consumers and family members. Nearly 60% of consumers compared to 38% of family members indicated they received all of the information they needed. Family members (59%) were much more likely to report receiving some of needed information compared to 32% of consumers. Although the standards regarding the ease of contacting the ADRC in the future was not met in Round 1 (71%), it was clearly met in Round 2, with 92% of participants saying that it would be easy or very easy (Table 25). Another indicator of quality involves participant willingness to recommend the ADRC to others. No specific benchmarks were identified for recommending the ADRC to a friend or family, but it is likely that the 92% (Round 1) and 90% (Round 2) of participant endorsement would meet any such standard (Table 26). Table 23. How respectful was the person with whom you worked the most?
2011-2012 (n=242) 2012 (n=291) Not at all respectful <1%% 1% Not that respectful 3% 2% Somewhat respectful 10% 9% Very respectful 87% 88%
Note: Standard is 85% will report that ADRC staff are very respectful Table 24. When you first contacted the ADRC, did you receive none, some, or all of the information you needed?
2011-2012 (n=241) 2012 (n=283) None 10% 7% Some 34% 37% All 55% 54% No Information Needed 1% 1%
Note: Standard is that at least 55% of consumers report receiving “all” of the information they needed; at least 35% of consumers report that they received “some” of the information they needed. Significant differences in responses are noted for consumers and family members, with consumers more likely to report receiving all of the needed information.

25
Table 25. If you needed to contact ADRC, how easy would that be?
2011-2012 (n=241) 2012 (n=291) Very difficult 12% 6% Somewhat difficult 17% 12% Somewhat easy 22% 15% Very easy 49% 67%
Note: Standard is that 75% of consumers report that it would be easy or very easy to contact the ADRC again. Table 26. Would you recommend the ADRC to a friend or family member?
2011-2012 (n=241) 2012 (n=295)
Yes 92% 90%
Options Counseling
As described earlier in this report, Round 1 participants included only 11 OC consumers. Fifty-eight others reported receiving a home visit. In Round 2, 71 survey participants were consumers (or family members of consumers) of Options Counseling services and an additional 64 in the ADRC Call Center database reported receiving a home visit (see Table 27). Both OC consumers and ADRC consumers who received home visits were asked additional questions focused on professional standards for options counseling services. Both the OC professional standards and ADRC Core Standards established by the ADRC Advisory Council guided development of these questions. To determine the quality of decision support, consumers were asked if they received the information they needed, understood the service system and explored choices available to them, and were supported in their decisions. They were asked if action plans were developed and whether they received follow up calls through the ADRC. Finally, a series of questions were posed to determine the outcomes of the service on consumer quality of life and living situation.
In general, OC consumers and others who reported receiving home visits had similar
responses. Although OC consumers with home visits consistently had more positive satisfaction ratings than those in the other categories (i.e., OC consumers with no home visits, ADRC Call Center consumers with home visits, and ADRC Call Center only), there were no statistically significant differences between confirmed OC consumers and Call Center participants receiving home visits. Therefore, data from these two groups were combined for analysis. This makes it possible to compare Round 1 and Round 2 samples. The specific benchmarks and responses to questions are presented below.
Before proceeding, however, it is important to note that differences were statistically
significant between OC consumers with home visits and the ADRC Call Center only group (no home visits), with respect to ratings of:

26
• Knowledgeable staff • Respectful staff • Helping consumer to understand the service system • Comfort with the person coming to the home • Overall helpfulness of the ADRC
Home Visits
No benchmarks specific to the home visits were established. However, participants who received home visits were asked to describe the timeliness of the visit. Nearly 25% during both Round 1 and Round 2 reported receiving a home visit within two days of their contact with the ADRC (see Table 28). During Round 1, over a third of participants reported waiting more than a week. Fewer waited this long during Round 2, where participants were more likely to wait for a home visit between three and seven days. Those reporting that their wait was short and timely declined between Round 1 and Round 2 (see Table 29). However, most reported that the wait was reasonable. Fewer than 10% during both years reported their wait being much too long.
Table 27. Did someone from the ADRC come to your home?
2011-2012 (n=244) 2012 (n=297) Yes 27% 41%
Note: In Round 1, 73% of OC consumers and 24% of other ADRC consumers received home visits. For Round 2, 80% of OC consumers and 28% of other ADRC consumers reported receiving a home visit. Table 28. How long did it take from the time you talked to someone from the ADRC to the time someone visited your home?
2011-2012 (n=62) 2012 (n=109) 2 days or less 24% 23% 3 to 7 days 40% 50% More than a week 35% 27%
Table 29. Considering the time you had to wait for the appointment to occur, do you think that the wait time was...
2011-2012 (n=64) 2012 (n=113) Short and timely 45% 36% Some wait, but reasonable 45% 57% Much too long 9% 7%

27
The majority of those receiving home visits indicated that these visits were very helpful, with the rating higher for Round 2 participants. Approximately 20% of participants in each year rated these visits as somewhat helpful (see Table 30). Fewer than 10% reported that the visits were not at all helpful. Similarly, the vast majority of participants indicated they felt very comfortable with the person who came to their home (Table 31). Furthermore, in most cases, the staff person who visited them in their homes identified additional types of services that might be needed and the vast majority of those reporting agreed with the staff assessment (Tables 32 & 33).
Table 30. How helpful was the visit to your home in addressing your concerns?
2011-2012 (n=66) 2012 (n=119)
Not at all helpful 9% 6% Not too helpful 6% 4% Somewhat helpful 21% 19% Very helpful 64% 71%
Table 31. How comfortable did you feel with the person who came to your home?
2011-2012 (n=66) 2012 (n=121)
Very uncomfortable 4% 1% A little uncomfortable 2% 3% Somewhat comfortable 12% 10% Very comfortable 82% 86%
Table 32. Did the person identify any other types of help that might be needed?
2011-2012 (n=61) 2012 (n=115) Yes 56% 61%
Table 33. Did you agree with them that you had additional needs?
2011-2012 (n=33) 2012 (n=67) Yes 91% 91%
Family members of service recipients were present and participating in the discussion during the home visit, although this was somewhat less likely during Round 2 (Table 34). When they were

28
present, participants reported general agreement between the consumer and family members about circumstances, concerns and help needed (Table 35). The majority of participants found these joint meetings to be very helpful, with significantly more people reporting the joint meetings in consumer homes as very helpful and fewer reporting them as not at all helpful in Round 2 (Table 36). Table 34. Were family members or others involved with the discussion when the person from the ADRC came to your home?
2011-2012 (n=64) 2012 (n=121) Yes 58% 53%
Table 35. How closely did everyone involved agree about your circumstances, such as having the same concerns and looking for the same kinds of help?
2011-2012 (n=37) 2012 (n=67) We agreed on almost everything 78% 84% We agreed more than we disagreed 11% 14% We disagreed more than we agreed 5% 2%
Table 36. How helpful was meeting together with the person from the ADRC?
2011-2012 (n=36) 2012 (n=63)
Not at all helpful 14% 3% Not too helpful 3% -- Somewhat helpful 25% 22% Very helpful 58% 75%
Decision Support The ability to make informed decisions is contingent on understanding the service system and the available choices. Furthermore, decision support includes assistance in exploring those choices, and receiving support for the choices made once the options have been considered. As indicated in Table 37, participants were generally positive about assistance received in understanding the service system, though nearly 20% reported the staff person was only poor or fair in this regard. Nearly half of participants in Round 1 gave the highest rating of excellent; however, this declined to 43% in Round 2. It is important to note that we do not know whether participants were referring to options counselors or to some other staff person with whom they

29
interacted. Overall, the standard of 80% of participants reporting staff as good or excellent in helping them understand the service system was met.
In spite of difficulties or uncertainties related to understanding the service system,
understanding about available options was higher after receiving options counseling and/or home visits (Table 38). Over three quarters in Round 1, declining slightly to two thirds in Round 2, reported they had better understanding after their involvement with the ADRC. Thus, the standard of 75% reporting better understanding was met in Round 1, but not in Round 2. Table 37. How would you rate this person on helping you understand the service system?
2011-2012 (n= 67) 2012 (n=129)
Poor 10% 8% Fair 9% 9% Good 33% 40% Excellent 48% 43%
Note: Standard is 80% will report that the ADRC staff was good or excellent in helping to understand the service system. Standard met.
Table 38. Compared to your understanding about available options before you contacted the ADRC, what is your understanding now?
2011-2012 (n=68) 2012 (n=134) More confused and understand less 6% 9% Understanding is about the same 16% 22% Better understanding 78% 69%
Note: Standard is 75% of consumers report they have better understanding about their options after working with the options counselor.
Importantly, majorities of participants in both years gave highest ratings for staff in terms of helping them to explore available choices (Table 39). Ratings increased between Round 1 and Round 2. The standard of 80% of participants reporting that the options counselor was good or excellent in exploring choices was met. Participants generally gave options counselors or others from the ADRC with whom they worked high ratings for considering their opinions. At 88%, however, these results did not quite meet the standard of 90% of participants giving ratings of good or excellent (Table 40). At the same time, ratings improved from Round 1 to Round 2.
More than 80% of participants in both Round 1 and Round 2 indicated that options counselors and others they worked with were supportive of their decisions (Table 41). The percentage of those giving ratings of fair or poor declined from Round 1 to Round 2. Similarly,

30
6% or less reported they felt the person they worked with was trying to talk them into things they did not want (Table 42). Consistent with these findings is that the majority of participants reported that the consumers were in total control of their decisions, with an additional 20%-27% reporting they had most of the control (Table 43). Table 39. How would you rate this person in helping you explore choices available to you?
2011-2012 (n=68) 2012 (n=135) Poor 9% 6% Fair 7% 10% Good 25% 23% Excellent 56% 61%
Note: Standard is 80% of consumers report the options counselor helped them explore the choice available to them and their family members.
Table 40. How good of a job did this person do considering your opinions, likes and dislikes before recommending services?
2011-2012 (n=65) 2012 (n=133) Poor 11% 6% Fair 6% 6% Good 29% 32% Excellent 54% 56%
Note: Standard is 90% report that the Options Counselor listened to their opinions and understood their specific circumstances
Table 41. How would you rate this person in supporting your decisions?
2011-2012 (n=68) 2012 (n=130) Poor 6% 6% Fair 13% 8% Good 31% 30% Excellent 50% 56%
Note: Standard is 80% of consumers rate the options counselor as good or excellent in supporting them in their decisions.

31
Table 42. Did you ever feel that this person was trying to talk you into things you did not want?
2011-2012 (n=69) 2012 (n=133) No 94% 95% Yes 6% 5%
Table 43. How much control did you have in making decisions about what you would do next?
2011-2012 (n=63) 2012 (n=133) No control 5% 7% A little control 10% 15% Most of the control 27% 20% Total control 59% 58%
Action Plans & Follow Up Assisting consumers in developing actions plans is among the professional standards for options counselors. Fewer than half of the participants in Round 1 and just over half in Round 2 reported working with ADRC staff to develop an action plan (Table 44). More information is needed to determine whether action plans are being developed for all of those who could benefit from or desire to have this service. Not all options counseling consumers or consumers who received home visits were ready or interested in developing these plans. Another professional OC standard is that OCs routinely make follow up calls to the consumer. The ADRC standards set by the Advisory Committee include a requirement that 90% of consumers identified as needing follow up by the ADRC, receive a follow up. This encompasses options counseling as well as call center consumers. It is beyond the scope of this project to determine the extent to which these ADRC standards were met; we do not know who was identified as needing follow up through the call center. Those reporting receiving a follow up call however, increased from 46% to 62% from Round 1 to Round 2 (Table 45). Consumers in Round 2 appear to have stronger connections to the ADRC as reflected by a greater percentage of participants who indicated they had initiated subsequent contact with the ADRC (Table 46).
Table 44. Did this person work with you to develop a plan listing your goals and next steps?
2011-2012 (n=68) 2012 (n=129) No 53% 46% Yes 47% 54%

32
Table 45. Has the person you worked with at the ADRC called you to see how you are doing?
2011-2012 (n=67) 2012 (n= ) No 54% 38% Yes 46% 62%
Note: Standard is that 90% of all consumers identified by ADRC staff as needing follow up by the ADRC received a follow up by ADRC staff. The number and persons identified by ADRC staff as needing follow up is unknown. The OC professional standard is that all OC consumers receive a follow up.
Table 46. Since your first contact with the ADRC, have you contacted them again?
2011-2012 (n=68) 2012 (n=134) No 52% 40%
Yes 48% 60%
Outcomes (OC consumers & those with Home Visits) ADRCs generally, and OC services specifically, have been designed to assist older adults and people with disabilities to access services that will enable them to age in place, or in their most desired setting, as well as to save resources for individuals, families, and the long term services and supports systems. Seven questions focused on participant perceptions of outcomes related to involvement with the ADRC. Only OC consumers and those reporting home visits were asked these questions. First, participants were asked whether services had allowed consumers to live where they wanted. The majority indicated agreement, with similar responses in both Round 1 (80%) and Round 2 (83%), exceeding the standard that 70% of consumers agree with the statement (see Table 47). Approximately 35% strongly agreed with the statement. Table 47. The services or information have allowed me to live in the place I most desire
2011-2012 (n=59) 2012 (n=118) Strongly disagree 5% 3% Disagree 14% 14% Agree 46% 47% Strongly agree 34% 36%
Note: Standard is that 70% of consumers will report living in a place they most desire.
Second, consumers were asked whether they agreed or disagreed that they were receiving enough support to meet their needs and preferences. The standard is that 80% of ADRC and OC consumers would agree that they were. Although a majority of participants agreed with the
33
statement, this standard was not met (see Table 48). Seventy-five percent in Round 1 and 76% in Round 2 agreed or strongly agreed that they were receiving enough support to meet needs and preferences. Table 48. I am receiving enough support to meet my needs and preferences.
2011-2012 (n=59) 2012 (n=128) Strongly disagree 6% 8%
Disagree 19% 16%
Agree 48% 52%
Strongly agree 27% 24% Note: Standard is that 80% will report receiving enough support to meet consumer needs and preferences.
Participants were asked whether consumers were more independent as a result of ADRC information and services. OC consumers represent a vulnerable population that is experiencing increasing dependency. No specific standards were set for this outcome. At the same time, a majority of participants agreed or strongly agreed that consumers were more independent (see Table 49). Responses were similar for both Round 1 and Round 2; with about 70% agreeing or strongly agreeing. Nearly 30% in each round strongly agreed with the statement. Significant differences were found between consumers and their family members in Round 2, with consumers much more likely to strongly agree with the statement (31% consumers; 19% family members) and family members much more likely to disagree or strongly disagree (40% of family members; 25% of consumers). Table 49. I believe I am more independent as a result of the information and services I received.
2011-2012 (n=59) 2012 (n=123) Strongly disagree 8% 4%
Disagree 20% 26%
Agree 42% 42%
Strongly agree 29% 28% Note: family members and consumers had significant differences in their ratings, with consumers more likely to strongly agree and family members more likely to disagree or strongly disagree.
Safety is often a major concern for consumers and especially for family members as older adults age in place and risk of falls increases. The ADRC standard that 80% of consumers would report feeling safer was met in Round 1, with 82% agreeing or strongly agreeing, and nearly met in Round 2, with 76% agreeing or strongly agreeing (see Table 50).

34
Those with disabilities often become isolated in their homes. We were interested in determining whether ADRC and OC services could positively influence activities and slow isolation. This measure may be an important indicator of quality of life. No specific standards were established. Not surprisingly, when compared to other outcome measures, fewer participants agreed or strongly agreed with statements about expanding or maintaining activities outside of the consumer’s home (see Table 51). At the same time, the percentages of respondents answering affirmatively increased from 46% in Round 1 to 56% in Round 2. Family members and consumers differed in their ratings, with consumers (16%) once again significantly more likely to strongly agree with the statement than family members (8%), and family members (55%) more likely to disagree or strongly disagree than consumers (39%).
Table 50. I believe I am safer in my home as a result of the information and services I received.
2011-2012 (n=51) 2012 (n=116) Strongly disagree 4% 2% Disagree 14% 22% Agree 51% 48% Strongly agree 31% 28%
Note: Standard is that 80% will report that they are safer.
Table 51. The services or information received have allowed me to expand or maintain activities outside of my home.
2011-2012 (n=50) 2012 (n=118)
Strongly disagree 10% 8% Disagree 44% 36% Agree 28% 42% Strongly agree 18% 14%
Note: family members and consumers disagreed in their responses with family members much more likely to disagree or strongly disagree with this statement.
A major driver of the development of ADRCs is to help consumers preserve funds and
avoid or delay entry into the Medicaid system. The standard that 70% of participants would agree or strongly agree that ADRC and OC services had helped them maintain personal money and resources was not met, although a majority did agree or strongly agree with the statement; 65% in Round 1 and 61% in Round 2 (see Table 52). Responses were similar when participants were asked, in Round 2, whether they eventually found help consumers could afford (see Table 53); 65% agreed or strongly agreed with this statement. This is consistent with participant statements when asked about concerns and recommendations for the ADRC program.

35
Table 52. The services or information received have helped make the most of personal money and resources
2011-2012 (n=51) 2012 (n=123) Strongly disagree 18% 7% Disagree 18% 32% Agree 47% 44% Strongly agree 18% 17%
Note: Standard is that 70% of participants report making the most of their personal money and resources.
Table 53. I was eventually able to find help that I could afford.
2012 (n=113)
Strongly disagree 4% Disagree 31% Agree 48% Strongly agree 17%
Note: not asked in 2011
In addition to the closed-ended questions regarding outcomes described above, we also asked participants what their circumstances would have been without the ADRC. The responses were compelling. First, however, about 25% of Round 1 and 30% of Round 2 participants indicated that their circumstances would not be any different. Many of these individuals indicated they had contacted the ADRC for information which they did not need to act on at the present time. Their comments generally reflected a positive or neutral attitude toward the ADRC.
Most participants indicated that they would have been worse off without the ADRC. For
some, this reflected minor differences in their situations, such as Not a great deal of difference, but it is so convenient to get meals ready to eat. Even more felt their circumstances would have been much worse. These included general statements and issues related to emotional health, daily functioning, finances, housing, and caregiving. The responses in Table 54 illustrate these issues as reported from the Round 2 data (Round 1 responses were similar).

36
Table 54 What do you think your circumstances would be now if you had not received information or services through the ADRC? A little Worse (n=22)
• I would be confused. • Almost the same, but I have more clarity on things now. The healthcare provider we wanted was
assigned and things fell together as they should. • They would not have been any worse at this point, but they may have been worse later on.
Worse emotionally (n=16) • I think I would be concerned about how to get help or what my options would be since I do not
fit into the low-income bracket. I feel comfortable that I know where to go if my circumstances change.
• They gave me an ease of mind knowing what is out there and the Meals on Wheels gave me a meal everyday, which was very nice. It is hard to ask for help.
More difficulty with basic needs (n=31), worse physically (n=13)
• I would be starving to death • We would be very hungry. • I would have a harder time eating. The food stamps really help. • I would not have any food in the house and If I did not have the help I would be living in a tent.
It has been a big help. • I would not be eating as well. It was critical for me to gain weight after surgery. I would be
isolated in my home after surgery and I would not be as happy. • I would be wondering about how to keep warm this winter. • I would be living in a cold house with very poor locks and everything on the doors, things like
that. • We would be devastated. The services we get, we really appreciate. • I do not think she would be as healthy as she is now because it is hard for me to do it all. She is
looking good and gaining weight. We really like the people they send out. • I would not have the transportation that I got. I would not have the personal home needs met.
She has nurses come out and clip my toenails for me. • I do not think she would be as healthy as she is now because it is hard for me to do it all. She is
looking good and gaining weight. We really like the people they send out. • I would not have the transportation that I got. I would not have the personal home needs met.
She has nurses come out and clip my toenails for me.
Worse financially (n=46) • I would not have had my Medicare premium covered. The information they provided on how the
system works was very helpful. I did not understand anything about it before I spoke with them. • I would be struggling with medical care and struggling a lot more financially. She helped me
achieved my goal of accountability with the VA. • I would be pulling my hair out. This is a valuable service. I have a problem with bill paying. I
live alone and I need the help. It is an important service. • I would not be able to afford my medicine • I could have chosen the wrong Medicare plan and then been stuck with it and regretted my
decision, spent more than I should have. • The stress would have been overwhelming being without healthcare, on a limited income. I do
not think the outcome would have been as positive.

37
A lot worse: general (n=35), would be homeless (n=12)
• We would be devastated. The services we get, we really appreciate. • He would have died. • I would be dead. • Mother would be in a facility somewhere very unhappy or dead. • I could be out on the street. • I would probably be pushing a basket around town, sleeping in the park, or have gotten in my
car and head for the mountains.
Public Programs and Assistance – Services Used (Streamlined Eligibility Determination for Public Programs)
All participants (both Call Center and OC consumers) were asked what decisions they had made after their contact with the ADRC and whether these contacts resulted in services. In Round 2, 46% had made a decision to seek services. Of those, 9 were waiting to see if they were eligible and 18 had been denied services because they did not meet eligibility criteria. The remaining 111 had received services. Nearly 75% of those reported they had received assistance with the paperwork needed to get services and benefits (see Table 55). This was a higher level of assistance than was reported in Round 1. Table 55. Did the person from the ADRC help you complete paperwork needed to get services or benefits?
2011-2012 (n=81 ) 2012 (n=109) Yes 59% 74%
Participants were asked if they had received specific categories of services (9 services in Round 1 and 10 in Round 2). These services are listed in table 56. For each of those services received, participants were asked whether services had been delivered in a timely way and how helpful they had been. The most frequent service for both rounds of data collection involved getting financial assistance, with 64% of participants in Round 1 and 58% in Round 2 receiving this service. This included applications for services targeting low income participants (e.g., applying for Medicaid, heat assistance). Other services obtained included receiving meals, transportation, help managing health, and housekeeping. Services received somewhat less frequently included personal care (including with bathing), accessing additional information, home modification, legal assistance, and help with managing money and assets.
In general, services began in a timely way, especially in Round 2. In both rounds, the
shortest waits were for meals services and the longest for financial assistance. Ratings of helpfulness of services were quite high for both rounds of data collection. The highest ratings in

38
Round 1 were for personal care assistance, and legal assistance, and in Round 2, for help managing assets and transportation. However, ratings of helpfulness of services declined in six of the nine categories measured from Round 1 to Round 2. Exceptions were for transportation, bathing, and home modification, where ratings of helpfulness increased.
Although quite high for both Round 1 and Round 2 participants, ratings of helpfulness of
services declined in six of the nine categories measured from Round 1 to Round 2. Exceptions were for transportation, bathing, and home modification, where ratings of helpfulness increased. More analysis is needed to determine reasons for the decline. It may be that participants in Round 2 had greater need, as indicated by the percentage of those using more than one service. It may be that those with greater need had needs that had not been met. However, ratings of helpfulness of services for Round 2 was positively and significantly correlated with ratings of improved understanding of the service system, perceptions of positive outcomes, and with two measures of staff attributes (see Table 60 and further discussion at the end of this section).
Table 56. Services received by ADRC consumers
Services Received
Number & % Timelinessa
Mean (SD) Helpfulnessb
M (SD)
2011-12 N/%
2012
N/%
2011-12 2012
2011-12 2012
Help getting benefits or financial assistance
54 (64%)
64 (58%)
1.69 (.643)
1.61 (.657)
3.85 (.81)
3.63 (.752)
Meals delivered to the home or to a meal site
15 (17%)
35 (31%)
1.13 (.352)
1.12 (.327)
3.86 (.35)
3.74 (.505)
Transportation 19
(22%) 32
(29%) 1.37
(.597) 1.41
(1.266) 3.74 (.62)
3.88 (4.21)
Information about or help managing your health
27 (32%)
28 (26%)
1.42 (.584)
1.30 (.542)
3.70 (1.07)
3.65 (.562)
Housekeeping 13
(15%) 27
(24%) 1.92
(.793) 1.44
(.577) 3.85 (.81)
3.78 (.506)
Personal care such as bathing 13
(15%) 14
(12%) 1.23
(.439) 1.57
(.646) 3.94 (.24)
4.00 (0)
Access to information or other benefits 29
13 (12%)
1.64 (.757)
1.33 (.474)
3.80 (1.62)
3.54 (.886)
Home modification services 8 (10%) 10
(9%) 1.57
(.535) 1.50
(.527) 3.82 (.40)
3.90 (.316)
Legal assistance or advice 3 (4%) 10
(9%) 1.67
(.597) 1.30 (.48)
4.00 (00)
3.80 (.422)
help managing your money or assetsc -- 3 (3%)
-- 1 (0)
-- 4.00 (0)
Note: 81 (33%) participants received services in 2011-21 and 112 (37%) reported receiving services in 2012; numbers add up to more each round because some people received multiple services. a Timliness:1=right away, 2=had to wait, but it was reasonable, 3=much too long b Helpfulness: 1=not at all helpful, 2=a little helpful, 3=somewhat helpful, 4=very helpful c Question added in 2012

39
Participants frequently received more than one service (Table 57). In Round 1, 59% of those receiving services indicated they had received two or more services from the list of nine services. Between a quarter and a third of respondents received two services in both Rounds, and about 18% received three. About 10% received 4 services and between 7% (Round 1) and 12% (Round 2) received 5 or more services, indicating very high levels of need and vulnerability.
Table 57. Total Number of services received
Total number 2011-2012 (n=81)
(based on list of 6 services) 2012 (n=105)
(based on list of 7 services) 1 41% 28% 2 24% 32% 3 17% 18% 4 11% 10% 5 5% 6% 6 2% 5% 7 1%
Average 2.5 services Note: These numbers resulted from a list of services read to participants. The list in 2012 included one more service than in 2011-12, help managing your money or assets. Participants who reported receiving services not on this list are not included in these counts.
Although most participants were quite positive about the ADRC, 26% of participants in both Round 1 and Round 2 indicated that they had concerns that had not been addressed (Table 58). For the most part these individuals appear to be falling through the cracks. Their initial concerns were not addressed, often because they did not qualify for services and could not afford them. For example,
All the things I called about: homecare, personal care, meals, and housecleaning. They told me I was ineligible. I would still like those services if I were eligible. I need housekeeping help. My problems are strictly financial. After rent, premiums on healthcare, prescription co-pays, food, I am out of money. In order to get my caregiver, I have to get her paid or I will not get her. I would still love to know if there is a way to make it so my mom does not run out of money. They have not found free housekeeping. The concerns that I have, they cannot address. They have to have a grant written for help with dentures and eyeglasses, and expanding food stamps for diabetics.

40
Table 58. Do you have concerns that the ADRC has not addressed?
2011-2012 (n=241) 2012 (n=294)
Yes 26% 26%
Many individuals talked about the need for home modification, yard work, and home maintenance. Very few individuals actually received this type of service (see Table 56), which suggests lack of resources due either to eligibility criteria or lack of available services. Eligibility issues and unmet need for services frequently was associated with frustration about response from agencies and caseworkers, coupled with a lack of participant understanding about the system. Many times these situations reflected lack of l response or follow up by staff.
I do not understand how things get determined. I do not understand how they can say he does not need any assistance. I need help with my housing, my huge electric bills, and all these other things. I explained how difficult it was to keep calling all the numbers they gave to me. I was in a situation that should have never have happened. I was renting a house and the house was in foreclosure, and it had no heat in the winter. The electric bill was like a thousand dollars. It is frustrating. You do not know who to talk to. I need help with all of my concerns. We never really focused on an issue, found a resolution for it, and then moved on to another one. I met with her three or four times and we chatted. I had a couple of questions where she wrote down a phone number on a Post-It and gave it to me. I did ask a couple of times about the Stars Program, and what it was supposed to accomplish. I did not know if it was for me, as a caretaker, or for my husband. It was confusing to me and I do not feel we got off the ground with that. Maybe I was not asking the right questions, but I absolutely do not know much about anything. I have not been able to talk to them. They never call me back. I have been leaving messages and they do not call back. . . I do not understand the paperwork they sent me and I need help to understand it . . . I have almost given up on this program because I ask for help and do not get it. They did not answer my question. She had no information for me, could not direct me anywhere and took two to four days to call back. I cannot get a hold of my caseworker. Do they know I exist? I have dealt with three people. . . . I have left multiple messages for my caseworker, but she has never called me back.

41
Several comments indicated poor quality of service. This included not matching the needs of an individual to specific services.
The two facilities recommended were not locked-down facilities. It took my wife five minutes to unlock the doors and try to come home. I feel there is not enough of a screening process for caregivers. . . . I was looking for more guidance on how to proceed with memory care issues and mental health issues.
A handful of participants indicated staff they encountered were rude or uncaring. Participants also found some staff failed to listen and learn about their individual needs and circumstances. Similarly, for a few, staff failed to be flexible or creative in seeking solutions. Others felt staff simply lacked knowledge about services.
The entry point person was not very helpful. They did not seem to be interested. I think they should take more time to try to understand what someone is trying to say to them. They need someone that can see beyond the list and are broader. I felt brushed off because of my age. They kept mentioning that I was only 36 and asking if I really needed these services. I think they need to focus on the disability and not the age. They should be more in-tune with the different programs they have out there, such as legality [sic], benefits, and waiting period.
Overall Satisfaction In spite of the concerns described above, the majority of participants reported that, overall, the ADRC was very helpful (see Table 59). Nearly a quarter of Round 2 participants reported that the ADRC had at least been somewhat helpful. Only 7%, in Round 2, reported that the ADRC had not been at all helpful.
To learn more about how the various elements addressed by the survey contributed to
understanding satisfaction with the ADRC services, we examined correlations between many of the Round 2 variables described throughout this report. These are presented in Table 60. The variables included a single question asking how helpful the ADRC was overall (Table 59), the total number of needs identified by participants (Table 4), the total number of services used (Table 57), the amount of contact participants had had with the ADRC (Table 7), and whether

42
the participants’ understanding of the service system increased after using the Call Center and/or OC services (Table 38). Two variables were computed focusing on staff attributes. All participants were asked about staff in terms of being knowledgeable, explaining how to get help, and being respectful (Tables 18, 19, 23). The responses to these questions were summed and labeled “staffADRC.” Those receiving OC and home visits were asked additional questions about staff attributes, including helpfulness in understanding the service system, exploring choices available, and how well they considered consumers opinions, likes and dislikes (Tables 37, 38, 40). The responses to all six staff attribute questions were summed and called “staffOC.” Finally, all of the outcome variables (Tables 47-53) were added together for an overall outcomes variable for Round 2.
Table 59. Overall, how helpful was the ADRC?
2011-2012 (n=239) 2012 (n=300)
Not at all helpful 10% 7% Only a little helpful 10% 10% Somewhat helpful 19% 23% Very helpful 62% 60%
Assessment of overall helpfulness of the ADRC was strongly correlated with increased
understanding of the service system, staff attributes, and outcomes. Although the association was low, the amount of contact with the ADRC was also significantly correlated with overall helpfulness of the ADRC. The number of needs identified was moderately and significantly correlated with the number of services participants reported they received, indicating that greater need was associated with more services. The amount of contact with the ADRC was significantly, but not highly correlated with amount of need. The number of services received was positively associated with outcomes. Positive outcomes were also related to both staff attributes variables and to increased understanding of the service system. These findings emphasize the importance of a skilled and knowledgeable workforce in helping consumers understand the service system, matching needs and services, and doing so in a way that supports consumer direction.

43
Table 60. Round 2 Correlations
Helpful # needs
# service Contact
Under-standing
Staff --ADRC
Staff--OC
R2 Outcome
How helpful was the ADRC?
Pearson Correlation
1
N 300 Count of needs Pearson
Correlation -.041 1
N (293) (296) Count of Services
Pearson Correlation
.182 .546** 1
N (105) (103) (105) Amount of ADRC Contact
Pearson Correlation
.177** .281** .179 1
N (297) (293) (104) (300) Understanding Pearson
Correlation .484** -.099 -.005 .118 1
N 133 131 59 133 (134) Staff attributes (ADRC/Call Center)
Pearson Correlation
.603** -.139* .074 .055 .419** 1
N (279) (273) (104) (277) (129) (280) Staff attributes (OC)
Pearson Correlation
.715** -.174 .199 .049 .441** .928** 1
N (119) (117) (56) (119) (119) (120) (120) R2 Outcomes Pearson
Correlation .553** .115 .388** .059 .343** .213* .391** 1
N (133) (130) (59) (133) (132) (128) (118) (133) Note: *p < .05, ** p < .01
Conclusions and Recommendations
As new programs, the ADRCs and Options Counseling services are making a positive difference in the lives of consumers. Overall, satisfaction ratings are high. For the most part, stringent standards established by the ADRC Advisory Committee are being met. Staff consistently are seen as respectful, knowledgeable, and spending sufficient time with consumers to learn about their needs and preferences. Over the two rounds of surveys, ratings have improved in many areas including access and awareness, decision support, service delivery, and follow up. The majority of survey participants found the ADRC to be very helpful and 90% would recommend ADRCs to friends and families. At the same time, 25% of participants in both rounds of the survey reported having concerns that had not been addressed and some metrics are not being met. Below we highlight specific conclusions and recommendations based on findings including those related to awareness and access, , services (ADRC generally and OC specifically), and outcomes.

44
Awareness & Access Many pathways lead to the ADRC. Outreach should continue on all fronts, including through Media campaigns and strengthening partnerships with other organizations such as other social service agencies, clinics and hospitals, professional associations, and others.
Telephone first contact. The majority of consumers make their first contacts by telephone. Progress has been made in having the phone answered by a person. Approximately 2/3 of survey participants reach a person at the time they first called. Most of those who reached an automated system or answering machine received a call back in a prompt or reasonable amount of time, as defined by the participant. Although the timeliness of the return call improved, however, not enough people received a call back within 24 hours to meet the established standard. Furthermore, too many participants reported waiting much too long for call backs. Continuing effort is needed to make enough staff available to answer calls and respond to messages. This needs to be done without sacrificing time spent with people on the phone to learn about their individual needs. From this survey, we do not know how many people, who failing to reach a person, ultimately were not connected to the service system. Additionally, we do not know how weekend calls may have been a factor in participants’ assessments in waiting too long and whether more access outside of normal business hours would increase ratings of prompt or timely services. We encourage ADRCs to monitor lost calls and response time for returning calls and to consider extending hours of Call Center services. Website. At this time, the website is a rarely used as a direct pathway to the ADRC. Although most participants have access to a computer, relatively few report they are skilled computer users. However, the website is an important source for information and is likely to become an increasingly important way to access services in the future. Continued efforts should be made to make the website easy to navigate and to promote the website to the general public and service providers. ADRC building. In Round 2, more participants made their first contact with the ADRC by going to the physical location of the service. In addition, more people reported going to the ADRC building. Those who did so indicated easy access and convenience. Ratings of seeing someone promptly at the ADRC building was quite high, easily meeting the agency standard. Self selection is likely associated with going to the building. Those who have transportation and already are knowledge about the ADRC location are likely those who elect to go. Still, the ADRC building appears to be an effective way of connecting with the ADRC. Continuing access. It appears that once consumers make contact with the ADRC, they are becoming integrated into that system. It appears that this integration improved over time. About half of those in Round 1 compared to two-thirds in Round 2 reported that it would be easy to contact the ADRC if they needed to. Indeed, 60% of the OC and home visit consumers had contacted the ADRC again and about the same percentage reported ADRC staff (including OC) had contacted them again.

45
Services Consumers are generally getting the information they need, including relevant written materials, following contact with the ADRC. This suggests that staff are listening to needs and are knowledgeable about resources. During this second year, many more participants, about 75%, reported getting help completing paperwork to get needed services, a critical facilitator of access. During Round 2, more people reported receiving services. The numbers, relative to the needs identified, however, are low with about one-third receiving services during Round 1, and 37% receiving services at Round 2. Those who did receive services were likely to receive more than one kind of assistance. One-third of participants received between three and five services.
Timeliness of those services generally improved. By Round 2, services offered through the Older Americans Act and Oregon Project Independence funds were generally up and running pretty quickly according to ratings of timeliness of services. This included arranging meals, transportation, managing health, housekeeping, legal services, and personal care. Such services are related to physical health needs of consumers, the need identified most often by consumers.
By Round 2, the biggest wait for participants was in obtaining financial assistance, also a high area of need identified by a substantial number of consumers. Not quite 10% reported waiting much too long for these services. In addition to the wait, this rating may also reflect those who did not meet eligibility requirements for services, which then were not arranged. Other areas where a few participants reported waiting much too long included home modification and receiving a home visit. Most participants, however, reported all of these waits were reasonable. Staff Overall, staff are perceived as very respectful and very knowledgeable. Those who received home visits were very comfortable with the staff who came to their homes. Staff helped identify other needs and facilitated conversations with families. They are perceived as doing good jobs in explaining services, helping consumers explore choices, considering consumer opinions, and supporting their decisions. Most consumers reported having total control in decisions made, with only 5% indicating the staff person tried to talk them into things they did not want. Thus, it appears that staff, including options counselors, are supporting self-determination and providing decision support according to professional standards.
A few areas do bear watching, however. Ratings of excellence declined between Round 1 and Round 2 with respect to the ability of ADRC staff to help participants understand the service system (48% to 43%) and their understanding about available options (78% to 69%). Ratings of the staff excellence in explaining how to get information and help needed remained at about 50%. Helping vulnerable consumers understand various options and how to access services is quite complex. The ADRC staff, including OCs, need to continue developing skills in clearly conveying information about services and options to a lay population with no prior experience in social and health services who are confronting significant life changes.

46
OC Standards require development of action plans and follow up with consumers. Although improvements have been made, these efforts are falling short. Just over half of OC consumers indicated they had developed a plan, a report similar to the proportion of non OC consumers who received a home visit who had an action plan. Additionally, although there was a substantial increase in those reporting a follow-up call from ADRC staff (46% to 62%), many people do not receive a call. Based on open-ended responses to questions, a major concern voiced by many participants was a failure to hear back from the ADRC or to get phone calls returned. Follow up is a vital OC service, so agencies should be encouraged to plan and staff appropriately to support meeting this standard. Outcomes According to survey participants, the ADRC is making a difference in all the outcome measures used. By Round 2, more than four in five (83%) agreed or strongly agreed that the services and information received had helped them live in the place they most desired. About 75% reported they had enough support to meet their needs and preferences. Although fewer Round 2 participants agreed with statements that they were safer in their homes, 75% still indicated that they were. About 70% agreed that they were more independent, 65% that they found help they could afford, 61% had information that helped them make the most of their money and resources. Just over half (56%) reported agreement with the statement that services through the ADRC had enabled them to expand or maintain activities outside of the home. These outcome indicators suggest that the ADRC is making a difference in the quality of life and financial well being of consumers. However, substantial numbers of consumers still need assistance with issues related to quality of life (e.g., maintaining activities) and access (e.g., maintaining finances and finding affordable help). These statistics are supported by the qualitative data that illustrate the dire situations many people would be facing without the ADRC, from being homeless to being overwhelmed with caregiving responsibilities. A challenge for ADRCs, will be to continue to support and grow these positive outcomes. More participants “agreed” than “strongly agreed” with the statements. A goal for the future is to help consumers get sufficient services and supports that will move more ratings into the “strongly agree” column. Although the program has demonstrated success from the perspectives of the majority of participants, 25% of consumers indicated that they had concerns that had not been addressed, reflecting unmet need. They described instances of not being eligible for needed services and being unable to pay for them. In some cases, services received were not adequately addressing the need and in other situations consumers reported instances where customer service had been poor, including staff who were rude or uncaring, or unresponsive to calls. These issues should not be over stated, given high ratings for the staff and the program as a whole, but neither should they be ignored. The information in unhappy consumer comments can be used to strengthen staff training, identify potential partners, and fill gaps in services. Summary
The overwhelming majority of survey participants indicated that they would recommend the ADRC to friends or others in need of help. Even if all needs are not being met, the ADRC is making a positive difference for consumers. Associations between key variables suggest the

47
importance of knowledgeable and courteous staff who provide decision support. Staff with these traits are associated with higher ratings of ADRC helpfulness, and positive outcomes. Cause cannot be attributed through correlations, but data do suggest that continued development of a strong and capable workforce, along with filling service gaps will be important strategies in addressing the needs of growing numbers of consumers through ADRC services.

48
Appendix A
Round 2 Consumer Satisfaction Survey – Fall 2012
Note: Not all directions for interviewers and codes for those not participating in survey are included in this appendix. SAMPLE Imported Sample Type
Choices Options Counseling - Long Form 1
No Options Counseling - Short Form 2
AGENCYNM
Choices Pilot Sites 1
Multnomah Washington Columbia Clackamas 2
Emerging ADRCs 3
NTRO1 Hello, my name is ___ and I'm calling from Portland State University. May I please speak to
<FNAME> <LNAME>?
Choices Yes, that would be me 01 D
Not good time now - schedule CB w/specific time 02 ==> INT50
Not interested/Not now - automatic CB in 3 days 03 ==> INT55
****** $
Can not reach someone knowledgeable about services 05 ==> INT13
Language/Disability Barrier 06 ==> INT09
Non-residential number 07 ==> INT08
Hung up w/out saying anything - automatic CB in 3 days
08 ==> INT95
Refused to start 09 ==> INT91
NTRO2 I'm calling because you or a family member contacted the Aging & Disability Services, also known as
the ADRC, during the past 2 months. We're conducting a brief survey about your experiences and
opinions with the program. It is very important for us to understand what is working well and how
to improve the ADRC. Would now be a good time to talk?
Call Date: <CALLDATE> ADRC Staff Member: <AGENT> Local ADRC Agency Name: <AGENCY> If R is unfamiliar with the "ADRC", try referring to it as "Aging & Disability Resource Connections," "Senior
Services," "Aging Services," or "Disability Services" instead to explain what it is. IWR Note: The ADRC helps connect people to various services including: housekeeping services, transportation

49
services, home modification services, personal care help, delivered meals, health management, or help applying for financial assistance (i.e., insurance, food stamps, Medicaid, heating bill assistance).
Yes, now is a good time 01 D
Not good time now - schedule CB w/specific time 02 ==> INT50
Not interested/Not now - automatic CB in 3 days 03 ==> INT55
****** $
Language/Disability Barrier 06 ==> INT09
Non-residential number 07 ==> INT08
Hung up w/out saying anything - automatic CB in 3
days 08 ==> INT95
Refused to start 09 ==> INT91
SECTION1 Great, this survey will take about 15 to 20 minutes to complete. Your answers will be kept
completely confidential. Your participation is voluntary and will not affect your services or your
relationship with the ADRC. You can stop at any time and skip any item you don't want to answer. I
would like to begin by asking about your first experience with the ADRC.
Call Date: <CALLDATE> ADRC Staff Member: <AGENT> Local ADRC Agency Name: <AGENCY>
If R is unfamiliar with the "ADRC", try referring to it as "Aging & Disability Resource Connections," "Senior Services," "Aging Services," or "Disability Services" instead to explain what it is.
IWR Note: The ADRC helps connect people to various services including: housekeeping services, transportation services, home modification services, personal care help, delivered meals, health management, or help applying for financial assistance (i.e., insurance, food stamps, Medicaid, heating bill assistance).
Press Enter to Continue 0 D
Q1 DO NOT READ OPTIONS
How did you first learn about the ADRC?
Choices Family 01
Friend 02
Hospital/clinic/doctor/nurse 03
Nursing home/assisted living 04
Phone book 05
Recommendation/word of mouth 06
Brochure/flyer 07
Media/newspaper/TV/radio 08
Referral from another agency 09
Internet 10
Other (please specify) 11 O
Don't Know 88
Refused 99

50
Q2 DO NOT READ OPTIONS
How did you first come in contact with the ADRC?
Choices By telephone 01
Went to the office, in person 02
They called me 03
Email 04
Through the website 05
Other (please specify) 06 O
Don't Know 88
Refused 99
Q3 Since that time, would you say you've had contact with the ADRC one time, 2 to 3 times, or more
than 3 times?
Choices 1 time 1
2 to 3 times 2
More than 3 times 3
No contact 7
Don't Know 8
Refused 9
Q4 Can you tell me a little about why you were in contact with the ADRC?
IWR Note: Use the 'Original Q Text' if the R has contacted the agency on their own behalf or because they need assistance with caregiving support. Use the 'Family Text' of the survey if the R contacted the ADRC to address the needs of a family member.
Choices Enter open-ended response 0 DO
Don't Know 8
Refused 9
Q14 When you first contacted the ADRC, did you receive none, some, or all of the information you
needed?
Choices None 0
Some 1
All 2
No Information Needed 7
Don't Know 8
Refused 9
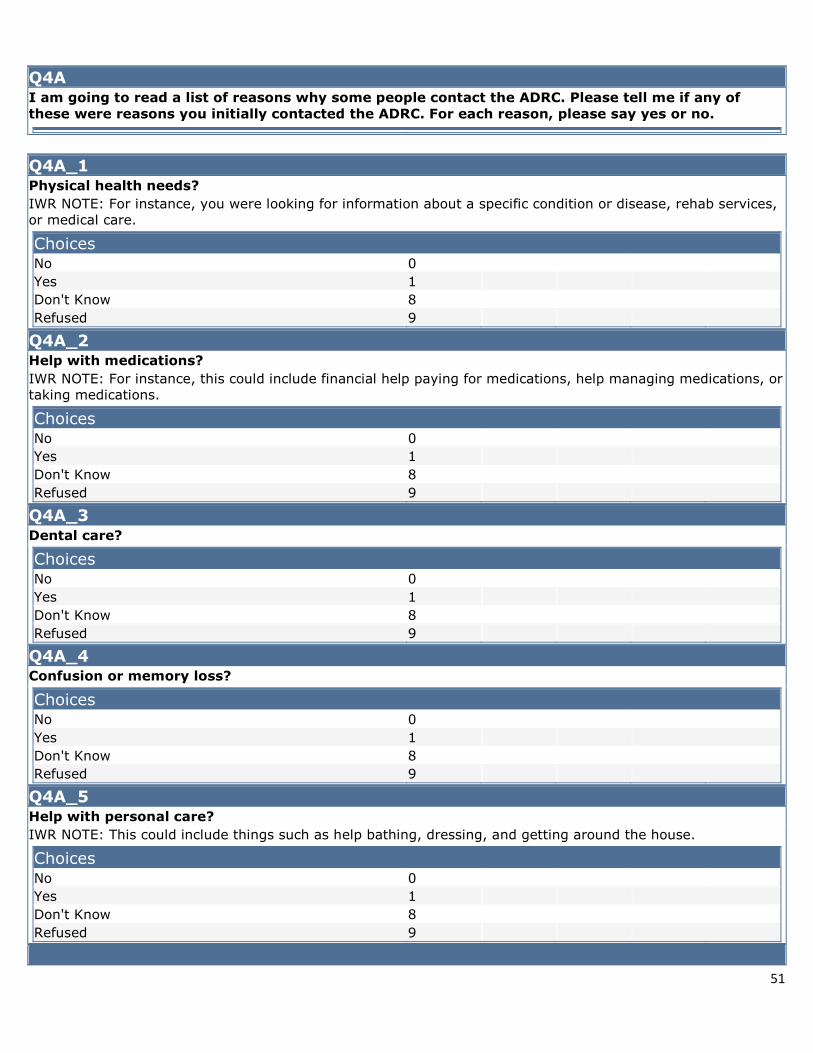
51
Q4A I am going to read a list of reasons why some people contact the ADRC. Please tell me if any of
these were reasons you initially contacted the ADRC. For each reason, please say yes or no.
Q4A_1 Physical health needs?
IWR NOTE: For instance, you were looking for information about a specific condition or disease, rehab services, or medical care.
Choices No 0
Yes 1
Don't Know 8
Refused 9
Q4A_2 Help with medications?
IWR NOTE: For instance, this could include financial help paying for medications, help managing medications, or taking medications.
Choices No 0
Yes 1
Don't Know 8
Refused 9
Q4A_3 Dental care?
Choices No 0
Yes 1
Don't Know 8
Refused 9
Q4A_4 Confusion or memory loss?
Choices No 0
Yes 1
Don't Know 8
Refused 9
Q4A_5 Help with personal care?
IWR NOTE: This could include things such as help bathing, dressing, and getting around the house.
Choices No 0
Yes 1
Don't Know 8
Refused 9

52
Q4A_6 Help with transportation?
IWR NOTE: This could include things like help going to the doctor, going shopping, or to social activities.
Choices No 0
Yes 1
Don't Know 8
Refused 9
Q4A_7 Help at home, such as help making meals, doing housekeeping and yard work?
Choices No 0
Yes 1
Don't Know 8
Refused 9
Q4A_8 Help getting shopping and errands done?
IWR NOTE: Please do not include help with transportation to go shopping or run errands. This question is referring to someone else going shopping for you, or going with you to shop.
Choices No 0
Yes 1
Don't Know 8
Refused 9
Q4A_9 Help modifying a home or apartment?
IWR NOTE: This could include modifications like installing ramps, or grab bars in the bathroom, or having kitchen counters lowered, or doorways expanded.
Choices No 0
Yes 1
Don't Know 8
Refused 9
Q4A_10 Help moving into an assisted living residence, adult foster home, or nursing home?
IWR NOTE: Please do not include help finding subsidized housing (this will be asked next).
Choices No 0
Yes 1
Don't Know 8
Refused 9
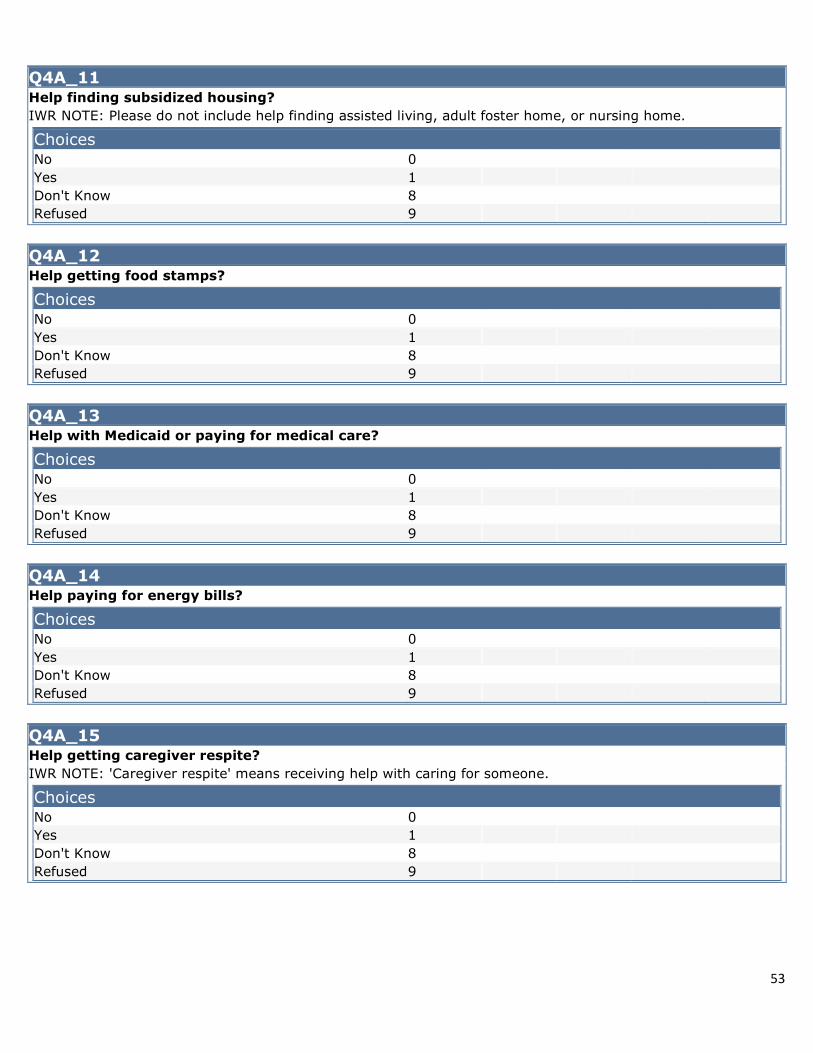
53
Q4A_11 Help finding subsidized housing?
IWR NOTE: Please do not include help finding assisted living, adult foster home, or nursing home.
Choices No 0
Yes 1
Don't Know 8
Refused 9
Q4A_12 Help getting food stamps?
Choices No 0
Yes 1
Don't Know 8
Refused 9
Q4A_13 Help with Medicaid or paying for medical care?
Choices No 0
Yes 1
Don't Know 8
Refused 9
Q4A_14 Help paying for energy bills?
Choices No 0
Yes 1
Don't Know 8
Refused 9
Q4A_15 Help getting caregiver respite?
IWR NOTE: 'Caregiver respite' means receiving help with caring for someone.
Choices No 0
Yes 1
Don't Know 8
Refused 9

54
Q4A_16 Help getting general information or advice?
Choices No 0
Yes 1
Don't Know 8
Refused 9
Q4A_17 Did you contact ADRC to get help with anything else that we did not already cover?
Choices No 0 ==> Q5
Yes 1
Don't Know 8 ==> Q5
Refused 9 ==> Q5
Q4A_17A What else did you contact ADRC for?
Choices Please Specify 0 DO
Don't Know 8
Refused 9
When you called the ADRC, was the phone answered by...
Choices A person 1
An answering machine 2
An automated message system 3
Don't Know 8
Refused 9
Q6
When did someone from the ADRC get back to you?
Choices On the same day 1
The next day 2
2 to 4 days 3
5 or more days 4
Don't Know 8
Refused 9

55
Q7
Do you think that the ADRC's response time was...
Choices Prompt and timely 1
Some wait, but was reasonable 2
Much too long 3
Don't Know 8
Refused 9
Q8
How easy was it to find information on the website? Would you say it was...
Choices very difficult 1
a little difficult 2
somewhat easy 3
very easy 4
Don't Know 8
Refused 9
Q8A What made it <Q8>?
Choices Enter open-ended response 0 DO
Don't Know 8
Refused 9
Q9 Did you ever go to the ADRC building? [Family Text: Did you ever go to the ADRC building with your
family member?]
Choices No 0
Yes 1
Don't Know 8
Refused 9
Q10
How easy was it to find the ADRC building?
Choices Very difficult 1
A little difficult 2
Somewhat easy 3
Very easy 4
Don't Know 8
Refused 9

56
Q11
How convenient was it for you to go to the ADRC?
Choices not at all convenient 1
not that convenient 2
somewhat convenient 3
very convenient 4
Don't Know 8
Refused 9
Q11A What made it convenient?
Choices Enter open-ended response 0 DO
Don't Know 8
Refused 9
Q12
When you first went to the ADRC, how long did you have to wait to see someone?
Choices Less than 5 minutes 01
Between 5 and 20 minutes 02
Longer than 20 minutes 03
I had to arrange another time to come back 04
I did not see anyone 05
Do not remember/unsure 88
Refused 99
Do you think that your wait time to see someone was...
Choices Short and timely 1
Some wait, but was reasonable 2
Much too long 3
Don't Know 8
Refused 9
Q15
Do you think that the person at the ADRC spent enough time with you to understand your concerns?
Choices No 0
Yes (Somewhat) 1
Don't Know 8
Refused 9

57
Q17A Did you receive written materials?
Choices No 0
Yes 1
Don't Know 8
Refused 9
Q17B Were the materials relevant to your concerns?
Choices No 0
Yes 1
Don't Know 8
Refused 9
Q18 Did someone from the ADRC come to your home? [Family Text:] Did someone from the ADRC go to
your family member's home?
No 0
Yes 1
Don't Know 8
Refused 9
Q19
How long did it take from the time you talked to someone from the ADRC to the time someone
visited your home? [Family Text:] How long did it take from the time you talked to someone from
the ADRC to the time someone visited your family member's home?
Choices 2 days or less 1
3 to 7 days 2
More than a week 3
Don't Know 8
Refused 9
Considering the time you had to wait for the appointment to occur, do you think that the wait time
was...
Choices Short and timely 1
Some wait, but reasonable 2
Much too long 3
Don't Know 8
Refused 9

58
Q21
How helpful was the visit to your home in addressing your concerns? [Family Text:] How helpful was
the visit to your family member's home in addressing concerns?
Choices Not at all helpful 1
Not too helpful 2
Somewhat helpful 3
Very helpful 4
Don't Know 8
Refused 9
Q22
How comfortable did you feel with the person who came to your home? [Family Text:] How
comfortable did you feel with the person who went to your family member's home?
Very uncomfortable 1
A little uncomfortable 2
Somewhat comfortable 3
Very comfortable 4
Don't Know 8
Refused 9
Q23 Did the person identify any other types of help that might be needed?
IWR Note: This is asking about the person who came to their home.
Choices No 0
Yes 1
Don't Know 8
Refused 9
Q23A What types of help were identified?
Choices Enter open-ended response 0 DO
Don't Know 8
Refused 9
Q24 Did you agree with them that you had additional needs? [Family Text:] Did you agree with them that
your family member had additional needs?
Choices No 0
Yes 1
Don't Know 8
Refused 9

59
Q25 Were family members or others involved with the discussion when the person from the ADRC came
to your home? [Family Text:] Were you or others involved with the discussion when the person from
the ADRC went to your family member's home?
Choices No 0
Yes 1
Don't Know 8
Refused 9
Q26
How closely did everyone involved agree about your circumstances, such as having the same
concerns and looking for the same kinds of help? [Family Text:] How closely did you and others
agree with your family member about their circumstances, such as having the same concerns and
looking for the same kinds of help?
IWR Note: "Everyone" means all people that participated in the family meeting.
Choices We agreed on almost everything 1
We agreed more than we disagreed 2
We disagreed more than we agreed 3
We disagreed on almost everything 4
Don't Know 8
Refused 9
Q27 Did the person from the ADRC help you resolve these differences?
Choices No 0
Yes (Somewhat) 1
Don't Know 8
Refused 9
Q28
How helpful was meeting together with the person from the ADRC?
Choices Not at all helpful 1
Not too helpful 2
Somewhat helpful 3
Very helpful 4
Don't Know 8
Refused 9

60
SECTION2 You may have worked with more than one person at the ADRC. For the next questions I would like
you to think about the person from the ADRC that you worked with the most.
[Family Text:] You may have worked with more than one person at the ADRC. For the next questions
I would like you to think about the person from the ADRC that you or your family member worked
with the most.
IWR NOTE: If family member and consumer talked to two different people from ADRC, focus on the person from
ADRC that the R worked with.
Choices
Q29
How respectful was the person with whom you worked the most?
IWR NOTE: This question is asking about the person they worked with the most from the ADRC.
Choices Not at all respectful 1
Not that respectful 2
Somewhat respectful 3
Very respectful 4
Don't Know 8
Refused 9
Q30
How knowledgeable was this person about helpful resources and services?
IWR NOTE: This question is asking about the person they worked with the most from the ADRC.
Choices Not at all knowledgeable 1
Not that knowledgeable 2
Somewhat knowledgeable 3
Very knowledgeable 4
Don't Know 8
Refused 9
Q31
How would you rate this person in helping you explore choices available to you? [Family Text:] How
would you rate this person in helping your family member explore the choices available to them?
IWR NOTE: This question is asking about the person they worked with the most from the ADRC.
Choices Poor 1
Fair 2
Good 3
Excellent 4
Not Applicable 7
Don't Know 8
Refused 9

61
Q32
How good of a job did this person do considering your opinions, likes and dislikes before
recommending services? [Family Text:] How good of a job did this person do considering your family
member's opinions, likes and dislikes before recommending services?
IWR NOTE: This question is asking about the person they worked with the most from the ADRC.
Choices Poor 1
Fair 2
Good 3
Excellent 4
Don't Know 8
Refused 9
Q34
Did this person work with you to develop a plan listing your goals and next steps? [Family Text:] Did
this person work with your family member to develop a plan listing their goals and next steps?
IWR NOTE: This question is asking about the person they worked with the most from the ADRC.
Choices No 0
Yes (Some) 1
Don't Know 8
Refused 9
Q35
How would you rate this person in supporting your decisions? [Family Text:] How would you rate
this person in supporting your family member's decisions?
IWR NOTE: This question is asking about the person they worked with the most from the ADRC.
Choices Poor 1
Fair 2
Good 3
Excellent 4
Don't Know 8
Refused 9
Q36 Did you ever feel that this person was trying to talk you into things you did not want?
[Family Text:] Did you ever feel that this person was trying to talk your family member into things
they did not want?
IWR NOTE: This question is asking about the person they worked with the most from the ADRC.
Choices No 0
Yes (Some) 1
Don't Know 8
Refused 9

62
Q37
How would you rate this person on explaining how to get the help or information you needed?
[Family Text:] How would you rate this person on explaining how to get the help or information your
family member needed?
IWR NOTE: This question is asking about the person they worked with the most from the ADRC.
Choices Poor 1
Fair 2
Good 3
Excellent 4
Not Applicable 7
Don't Know 8
Refused 9
Q38
How would you rate this person on helping you understand the service system?
[Family Text:] How would you rate this person on helping your family member understand the
service system?
IWR NOTE: This question is asking about the person they worked with the most from the ADRC.
Choices Poor 1
Fair 2
Good 3
Excellent 4
Don't Know 8
Refused 9
Q33 Compared to your understanding about available options before you contacted the ADRC, what is
your understanding now? Would you say you have a better understanding, your understanding is
about the same, or you are more confused and understand less?
IWR NOTE: This would be comparing your level of understanding before and then after talking with the person from the ADRC.
Choices Better understanding 1
Understanding is about the same 2
More confused and understand less 3
Don't Know 8
Refused 9

63
Q39 What decisions did you make as a result of your involvement with the ADRC? [Family Text:] What
decisions did your family member make as a result of their involvement with the ADRC?
IWR NOTE: This could include a decision to follow the recommendations made by others, including the person
from the ADRC.
Choices Enter open-ended response 0 DO
No decisions 7 ==>
SECTION3
Don't Know 8 ==>
SECTION3
Refused 9 ==>
SECTION3
Q40 Did these decisions result in you receiving services or benefits? [Family Text:] Did these decisions
result in your family member receiving services or benefits?
Choices No 0
Yes 1
Don't Know 8
Refused 9
Q41 Did the person from the ADRC help you complete paperwork needed to get services or benefits?
[Family Text:] Did the person from the ADRC help your family member complete paperwork needed
to get services or benefits?
Choices No 0
Yes (A little) 1
Don't Know 8
Refused 9
Q42SECT I'm going to read a list of services that are available. First, I would like to know if you (or your
family member) actually used this service and then for each service used, I will then ask about how
timely it occurred and how helpful it was.
Q42A Did you use housekeeping services or receive help around the house? [Family Text:] Did your family
member use housekeeping services or receive help around the house?
Choices No 0
Yes 1
Don't Know 8
Refused 9

64
Q42ATIME
How quickly did the service begin?
Choices Right away 1
Had to wait, but it was reasonable 2
Had to wait much too long 3
Don't Know 8
Refused 9
Q42AHELP
How helpful has this service been?
Choices Not at all helpful 1
A little helpful 2
Somewhat helpful 3
Very helpful 4
Don't Know 8
Refused 9
Q42B Did you receive home modification services? [Family Text:] Did your family member use home
modification services?
No 0
Yes 1
Don't Know 8
Refused 9
Q42BTIME
How quickly did the service begin?
Choices Right away 1
Had to wait, but it was reasonable 2
Had to wait much too long 3
Don't Know 8
Refused 9
Q42BHELP READ OPTIONS 1-4
How helpful has this service been?
Choices Not at all helpful 1
A little helpful 2
Somewhat helpful 3
Very helpful 4
Don't Know 8
Refused 9

65
Q42C Did you receive help with personal care such as bathing? [Family Text:] Did your family member
receive help with personal care such as bathing?
Choices No 0
Yes 1
Don't Know 8
Refused 9
Q42CTIME
How quickly did the service begin?
Choices Right away 1
Had to wait, but it was reasonable 2
Had to wait much too long 3
Don't Know 8
Refused 9
Q42CHELP
How helpful has this service been?
Choices Not at all helpful 1
A little helpful 2
Somewhat helpful 3
Very helpful 4
Don't Know 8
Refused 9
Q42D Did you receive meals delivered to the home or to a meal site? [Family Text:] Did your family
member receive meals delivered to the home or to a meal site?
Choices No 0
Yes 1
Don't Know 8
Refused 9
Q42DTIME
How quickly did the service begin?
Choices Right away 1
Had to wait, but it was reasonable 2
Had to wait much too long 3
Don't Know 8
Refused 9
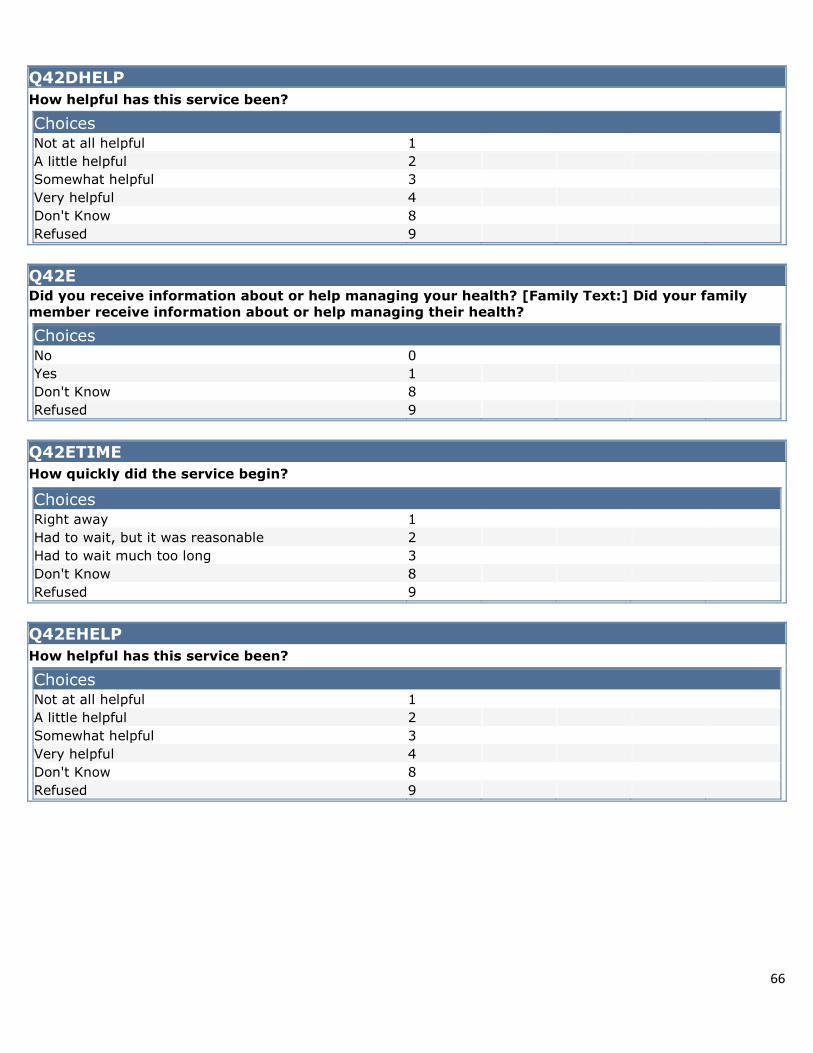
66
Q42DHELP
How helpful has this service been?
Choices Not at all helpful 1
A little helpful 2
Somewhat helpful 3
Very helpful 4
Don't Know 8
Refused 9
Q42E Did you receive information about or help managing your health? [Family Text:] Did your family
member receive information about or help managing their health?
Choices No 0
Yes 1
Don't Know 8
Refused 9
Q42ETIME
How quickly did the service begin?
Choices Right away 1
Had to wait, but it was reasonable 2
Had to wait much too long 3
Don't Know 8
Refused 9
Q42EHELP
How helpful has this service been?
Choices Not at all helpful 1
A little helpful 2
Somewhat helpful 3
Very helpful 4
Don't Know 8
Refused 9

67
Q42F Did you receive help getting benefits or financial assistance, such as health insurance, food stamps,
Medicaid, or help with heating bills? [Family Text:] Did your family member receive help getting
benefits or financial assistance, such as health insurance, food stamps, Medicaid, or help with
heating bills?
Choices No 0
Yes 1
Don't Know 8
Refused 9
Q42FTIME
How quickly did the service begin?
Choices Right away 1
Had to wait, but it was reasonable 2
Had to wait much too long 3
Don't Know 8
Refused 9
Q42FHELP
How helpful has this service been?
Choices Not at all helpful 1
A little helpful 2
Somewhat helpful 3
Very helpful 4
Don't Know 8
Refused 9
Q42_NEW Did you receive help managing your money or assets? [Family Text:] Did your family member
receive help managing money or assets?
IWR NOTE: For instance, this could include help with financial planning, reverse mortgages, long-term care insurance, or wills.
Choices No 0
Yes 1
Don't Know 8
Refused 9

68
Q42TIMEN
How quickly did the service begin?
Choices Right away 1
Had to wait, but it was reasonable 2
Had to wait much too long 3
Don't Know 8
Refused 9
Q42HELPN
How helpful has this service been?
Choices Not at all helpful 1
A little helpful 2
Somewhat helpful 3
Very helpful 4
Don't Know 8
Refused 9
Q42G Did you use transportation services? [Family Text:] Did your family member use transportation
services?
Choices No 0
Yes 1
Don't Know 8
Refused 9
Q42GTIME
How quickly did the service begin?
Choices Right away 1
Had to wait, but it was reasonable 2
Had to wait much too long 3
Don't Know 8
Refused 9
Q42GHELP
How helpful has this service been?
Choices Not at all helpful 1
A little helpful 2
Somewhat helpful 3
Very helpful 4
Don't Know 8
Refused 9

69
Q42H Did you receive legal assistance or advice? [Family Text:] Did your family member receive legal
assistance or advice?
Choices No 0
Yes 1
Don't Know 8
Refused 9
Q42HTIME
How quickly did the service begin?
Choices Right away 1
Had to wait, but it was reasonable 2
Had to wait much too long 3
Don't Know 8
Refused 9
Q42HHELP
How helpful has this service been?
Choices Not at all helpful 1
A little helpful 2
Somewhat helpful 3
Very helpful 4
Don't Know 8
Refused 9
Q42J Did you receive access to other benefits or information about other benefits? [Family Text:] Did your
family member receive access to other benefits or information about other benefits?
Choices No 0
Yes 1
Don't Know 8
Refused 9
Q42JTIME
How quickly did the service begin? (How quickly did you receive information?)
Choices Right away 1
Had to wait, but it was reasonable 2
Had to wait much too long 3
Don't Know 8
Refused 9

70
Q42JHELP
How helpful has this service been? (How helpful has the information been?)
Choices Not at all helpful 1
A little helpful 2
Somewhat helpful 3
Very helpful 4
Don't Know 8
Refused 9
Q42K Did you receive any other services? [Family Text:] Did your family member receive any other
services?
Choices No 0
Yes (What services were received?) 1 O
Don't Know 8
Refused 9
SECTION3 Thinking about the information and any services received from the ADRC, please tell me how much
you agree or disagree with the following statements.
Q45
The services or information have allowed me to live in the place I most desire. Do you... [Family
Text:] The services or information have allowed my family member to live in the place they most
desire. Do you…
Choices Strongly disagree 1
Disagree 2
Agree 3
Strongly agree 4
Don't Know 8
Refused 9
Q46
I am receiving enough support to meet my needs and preferences. [Family Text:] My family member
is receiving enough support to meet their needs and preferences.
IWR Note: "Support" could be services such as meals, housekeeping, personal care, assistance with paperwork, assistance obtaining medical insurance, or transportation services. Support could also be the presence of family
members or neighbors to make sure things are going all right.
Choices Strongly disagree 1
Disagree 2
Agree 3
Strongly agree 4
Don't Know 8
Refused 9

71
Q47
I believe I am safer in my home as a result of the information and services I received. [Family Text:]
I believe my family member is safer in their home as a result of the information and services they
received.
Choices Strongly disagree 1
Disagree 2
Agree 3
Strongly agree 4
Don't Know 8
Refused 9
Q48
I believe I am more independent as a result of the information and services I received. [Family
Text:] I believe my family member is more independent as a result of the information and services
they received.
Choices Strongly disagree 1
Disagree 2
Agree 3
Strongly agree 4
Don't Know 8
Refused 9
Q49
The services or information received have allowed me to expand or maintain activities outside of my
home. [Family Text:] The services or information received have allowed my family member to
expand or maintain activities outside of their home.
Choices Strongly disagree 1
Disagree 2
Agree 3
Strongly agree 4
Don't Know 8
Refused 9
Q50A
One of the goals of the ADRC program is to help people avoid running out of money or avoid needing
to use Medicaid. How much do you agree with the following statement: "The services or information
received have helped make the most of personal money and resources?"
Choices Strongly disagree 1
Disagree 2
Agree 3
Strongly agree 4
Don't Know 8
Refused 9

72
Q50B
How much do you agree with the following statement: "I was eventually able to find help that I
could afford." [Family Text:] How much do you agree with the following statement: "My family
member was eventually able to find help that they could afford."
Choices Strongly disagree 1
Disagree 2
Agree 3
Strongly agree 4
Don't Know 8
Refused 9
Q51 What do you think your circumstances would be now if you had not received information or services
through the ADRC? [Family Text:] What do you think your family member's circumstances would be
now if they had not received information or services through the ADRC?
IWR NOTE: Use following probes if R is having difficulty answering. PROBES: How well would [you/they] be able
to manage [your/their] personal needs? Where do you think [you/they] would be living? What about in a nursing home or assisted living facility?
Choices Enter open-ended response 0 DO
Don't Know 8
Refused 9
Q56
How much control did you have in making decisions about what you would do next? [Family Text:]
How much control did your family member have in making decisions about what they would do
next?
Choices No control 1
A little control 2
Most of the control 3
Total control 4
Don't Know 8
Refused 9
Q52 Has the person you worked with at the ADRC called you to see how you are doing? [Family Text:]
Has the ADRC called to see how your family member is doing?
Choices No 0
Yes 1
Don't Know 8
Refused 9

73
Q53 Since your first contact with the ADRC, have you contacted them again?
Choices No 0
Yes 1
Don't Know 8
Refused 9
Q54
If you needed to contact the ADRC tomorrow, how easy would that be?
Choices Very difficult 1
Somewhat difficult 2
Somewhat easy 3
Very easy 4
Don't Know 8
Refused 9
Q57
Overall, how helpful was the ADRC?
Choices Not at all helpful 1
Only a little helpful 2
Somewhat helpful 3
Very helpful 4
Don't Know 8
Refused 9
Q58 Do you have concerns that the ADRC has not addressed?
Choices No 0
Yes (Could you briefly describe those concerns?) 1 O
Don't Know 8
Refused 9
Q59 Would you recommend the ADRC to a friend or family member?
Choices No 0
Yes (Maybe) 1
Don't Know 8
Refused 9

74
Q60 What recommendations do you have for improving the services of the ADRC?
Choices Enter open-ended response 0 DO
No Recommendations 7
Don't Know 8
Refused 9
Q61A Have you used the ADRC website?
Choices No 0
Yes 1
Don't Know 8
Refused 9
Q61B DO NOT READ OPTIONS
How many times have you used the website?
Choices 1 time 1
2 to 3 times 2
More than 3 times 3
Don't Know 8
Refused 9
Q61C READ OPTIONS 1-4
How easy was it to use?
Choices Very difficult 1
A little difficult 2
Somewhat easy 3
Very easy 4
Don't Know 8
Refused 9
DEMO We are almost done; the next few questions are for demographic purposes only.
IWR NOTE: If you are speaking to a friend or family member, please tell them: "The following questions are about you."

75
Q62 Do you own or have easy access to a computer?
Choices No 0
Yes 1
Don't Know 8
Refused 9
Q63
How would you rate your computer skills?
Choices Poor 1
Fair 2
Good 3
Excellent 4
Don't Know 8
Refused 9
RACE SELECT ALL THAT APPLY
Which of the following groups best identifies you?
IWR Note: Asian or Asian American includes Chinese, Filipino, Japanese, Asian Indian, Korean, and Vietnamese.
IWR Note: Please only use the "Other" code if R refuses to choose a race/ethnicity category listed above.
Choices White or Caucasian 0
Black or African-American 1
Asian or Asian-American 2
American-Indian or Alaskan Native 3
Native Hawaiian or other Pacific Islander 4
Spanish, Hispanic, or Latino 5
Other (Please Specify) 7 O
Don't Know 8 X
Refused 9 X
YEAR
What year were you born? $E 1900 2011
Choices Don't Know 8888
Refused 9999
ZIP What is your home zip code?
99999
Choices Don't Know 88888
Refused 99999

76
EDUC
What is the highest level of education you have completed?
Choices Less than 12th Grade (not a high school graduate) 01
High School Graduate or GED 02
Some College or Other Post-Secondary Education 03
Associates Degree or Technical Degree (AA or AS) 04
Bachelor's Degree (BA, AB, BS) 05
Some Post-Graduate 06
Master's Degree 07
Other professional or doctoral degree 08
Don't Know 88
Refused 99
INCOME
Please stop me when I reach the category that best describes your yearly total household income
from all sources before taxes in 2011.
IF NEEDED: Your best estimate is fine.
Choices Less than $10,000 0
$10,000 to less than $20,000 1
$20,000 to less than $30,000 2
$30,000 to less than $40,000 3
$40,000 to less than $50,000 4
$50,000 to less than $60,000 5
$60,000 to less than $70,000 6
$70,000 or more 7
Don't Know 8
Refused 9
GENDER
Choices Male 0
Female 1
Don't know 8
Refused 9
THEND Thank you very much for your time. Do you have any questions or comments about the survey?
Choices No 0
Yes (Type in Comments) 1 O

77
Do you have any comments, for the CLIENT, about how the interview went? Please make a note about who you
conducted the interview with (i.e., Care Recipient, Family Member, Social Service Employee).
Choices No Comments 0
Yes (Please Specify) 1 O
I1 Overall, how much difficulty did R have in understanding the questions?
Choices No Difficulty 1
A Little Difficulty 2
Moderate Difficulty 3
A Great Deal of Difficulty 4
I2 How engaged was the R?
Choices Not at All 1
A Little 2
Moderately 3
Very 4
I3 How distracted did R seem by other people or things (e.g. television) during the interview?
Choices Not at All 1
A Little 2
Moderately 3
Very 4
I4 Who did you conduct the interview with?
Choices Care Recipient 1 ==> /END
Family Member 2 ==> /END
Social Service Employee 3 ==> /END
Dont Know 8 ==> /END