Adoption of no-till and conservation farming practices in Australian grain growing regions: current...
32
GRDC Adoption of no-till cropping practices in Australian grain growing regions RICK S. LLEWELLYN AND F. H. D’EMDEN
Transcript of Adoption of no-till and conservation farming practices in Australian grain growing regions: current...
GRDC
Adoption of no-till cropping practices in
Australian grain growing regionsRICK S. LLEWELLYN AND F. H. D’EMDEN

GRDC | 2 | ADOPTION OF NO-TILL CROPPING PRACTICES IN AUSTRALIAN GRAIN GROWING REGIONS
Title: Adoption of no-till cropping practices in Australian grain growing regions
Report for SA No-till Farmers Association and CAAANZ.
This report supersedes the earlier January 2009 preliminary report: Adoption of no-till and
conservation farming practices in Australian grain growing regions: current status and trends.
To cite this report state:
Llewellyn, R.S., D’Emden, F.H. 2010. Adoption of No-tillage Cropping Practices in Australian Grain
Growing Regions. Grains Research and Development Corporation, Kingston, ACT, pp. 1–31.
www.grdc.com.au/notill_adoption
or
Llewellyn, R.S., D’Emden, F.H., Kuehne, G. 2012. Extensive use of no-tillage in grain growing regions
of Australia. Field Crops Research http://dx.doi.org/10.1016/j.fcr.2012.03.013
GRDC Project Code: SAN00013
The funding for this report by the SA No-till Farmers Association/Conservation Agriculture Alliance
of Australia and New Zealand was provided by the Grains Research and Development Corporation,
CSIRO, Department of Agriculture, Fisheries and Forestry, SA No-till Farmers Association and the WA
No-Till Farmers Association.
Authors: Dr Rick Llewellyn and F. H. D’Emden
Dr Rick S Llewellyn
CSIRO Sustainable Ecosystems
PMB 2 Glen Osmond SA 5064
P: 08 8303 8502 E: [email protected]
F. H. D’Emden
Department of Agriculture & Food Western Australia
© 2009 Grains Research and Development Corporation and CSIRO.
All rights reserved.
Published February 2010.
ISBN No. 978-1-875477-47-0
In submitting this report, the researchers have agreed to the GRDC publishing
this material in its edited form.
For copies please contact:
Ms Maureen Cribb
GRDC Publications Manager
PO Box 5367
KINGSTON ACT 2604
Phone: 02 6166 4500
Email: [email protected]
Design and production:
Coretext, www.coretext.com.au
Disclaimer
Any recommendations, suggestions or opinions contained in this publication do not
necessarily represent the policy or views of the Grains Research and Development
Corporation and CSIRO. No person should act on the basis of the contents of this publication
without irst obtaining speciic, independent professional advice.
The Grains Research and Development Corporation and CSIRO will not be liable for any loss,
damage, cost or expense incurred or arising by reason of any person using or relying on the
information in this publication.

ADOPTION OF NO-TILL CROPPING PRACTICES IN AUSTRALIAN GRAIN GROWING REGIONS | 3 | GRDC
CONTENTS
EXECUTIVE SUMMARY ..................................................................................................... 5
1. BACKGROUND ............................................................................................................. 6
2. AIMS .............................................................................................................................. 6
3. METHODS ..................................................................................................................... 7
3.1 Regions .................................................................................................................. 7
3.2 Data collection ....................................................................................................... 7
3.3 Definition of no-till .................................................................................................. 7
3.4 Statistical analysis .................................................................................................. 8
4. RESULTS & DISCUSSION ........................................................................................... 10
4.1 Adoption of no-till................................................................................................. 10
4.1.1 Peak no-till adoption and disadoption .............................................................. 12
4.2 Extent of use ........................................................................................................ 13
4.3 Extrapolated regional extent of tillage methods .................................................. 14
4.3.1 Glyphosate price and extent of use .................................................................. 14
4.4 Cereal stubble management ................................................................................ 14
4.5 Farm and farmer characteristics .......................................................................... 15
4.5.1 Farm characteristics .......................................................................................... 15
4.5.2 Farm management characteristics.................................................................... 16
4.6 Stated reasons for no-till adoption and non-adoption ........................................ 18
4.7 Perceived effects of no-till and stubble retention ................................................ 19
4.8 Profiling adopters and non-adopters ................................................................... 21
4.9 Identifying significant drivers of adoption and extensive use .............................. 27
5. SUMMARY ................................................................................................................... 29
5.1 Current use and trends ........................................................................................ 29
5.2 Farm and farmer characteristics associated with no-till adoption status ........... 29
6. REFERENCES ............................................................................................................. 31
7. ACKNOWLEDGEMENTS ............................................................................................. 31

GRDC | 4 | ADOPTION OF NO-TILL CROPPING PRACTICES IN AUSTRALIAN GRAIN GROWING REGIONS
LIST OF TABLESTable 1 Sample Regions, respondent numbers and Statistical Local Areas. ..........................................................................................9
Table 2 Proportion (%) of respondents who have used, currently use and are planning to use no-till. ...............................................10
Table 3 Proportion (%) of no-till users using disc openers, points and both disc openers and points in 2008. ..................................10
Table 4 Proportion (%) of all respondents and current (2008) users of no-till who state they do (and do not) expect to be using no-till in 5 years’ time (2013). .................................................................................................................................12
Table 5 Proportion (%) of growers who have used some no-till who have reduced the proportion of crop sown using no-till (Reduced NT) and the proportion of growers who have used some no-till who have ceased using no-till (Ceased NT). ..............................................................................................................................................................................12
Table 6 Average proportion (%) of crop area sown using no-till in 2008 by growers using no-till; proportion of no-till users sowing entire crop area with no-till in 2008; and proportion of expected future no-till users (2013) who expect to sow entire crop area. .........................................................................................................................................13
Table 7 Proportion (%) of respondents using seeding methods other than no-till in 2008. ..................................................................13
Table 8 Extrapolated area cropping land sown using no-till, no-till seeding equipment with prior cultivation and full-cut seeding in 2008. .............................................................................................................................................................14
Table 9 Effect of recent glyphosate price increases on use of tillage as reported by growers (% of all growers). ..............................15
Table 10 Proportion (%) of respondents who burn cereal stubble, average (and median) proportion burned by those burning cereal stubble and proportion of all respondents burning greater than 10% of cereal stubbles. .............................15
Table 11 Mean farm size; mean arable area currently managed and ten years ago and % increase in median arable area managed 1998 to 2008. ..................................................................................................................................................16
Table 12 Cropping intensity by region. Data shown is the mean proportion of land cropped as a percentage of arable land managed currently (as an average of most recent three seasons); 10 years ago and expected cropping intensity in 5 years time. ........................................................................................................................ 16
Table 13 Growers with livestock; the proportion of those with sheep typically having >1000 adult sheep typically run in winter and; the proportion of growers with an acknowledged herbicide resistant weed population on their farm. ..............17
Table 14 Education and information-related characteristics. .................................................................................................................17
Table 15 Farmer orientation to crop Vs livestock; influence of no-till and stubble retention on land valuation an assessment of erosion risk. ................................................................................................................................................18
Table 16 Age of seeding machinery and adoption of other practices. ..................................................................................................18
Table 17 Reasons cited for adopting no-till (% of cited reasons). .........................................................................................................19
Table 18 Reasons cited for adopting no-till (% of cited reasons) (continued). ......................................................................................19
Table 19 Reasons for non-adoption cited by those who have not used no-till (% of cited reasons). ..................................................20
Table 20 Perceived influence of long-term no-till with stubble retention relative to multiple cultivations and no stubble retention on crop disease, moisture retention and soil erosion. ..............................................................................................20
Table 21 Perceived influence of long-term no-till with stubble retention relative to multiple cultivations and no stubble retention on fuel costs, long-term wheat yields, reliability of wheat yields, fertiliser costs. .................................20
Table 22 Perceived influence of long-term no-till with stubble retention relative to multiple cultivations and no stubble retention on days needed to sow crop, rain needed for reliable seeding and weed emergence. ..........................................21
Table 23 Perceived influence of long-term no-till with stubble retention relative to multiple cultivations and no stubble retention on herbicide resistance, effectiveness of pre-emergent herbicide like trifluralin and herbicide costs. ....................21
Table 24 NSW all respondents – differences between current no-till users and non-users. .................................................................22
Table 25 NSW regions – differences between current no-till users and non-users. ..............................................................................22
Table 26 QLD region – differences between current no-till users and non-users. ................................................................................23
Table 27 SA all respondents – differences between current no-till users and non-users. .................................................................. 23
Table 28 SA Mallee – differences between current no-till users and non-users. ..................................................................................24
Table 29 SA Central and Western EP regions – differences between current no-till users and non-users. .........................................24
Table 30 SA Upper and Lower EP regions – differences between current no-till users and non-users. ..............................................25
Table 31 Victorian all respondents – differences between current no-till users and non-users. ...........................................................25
Table 32 Victorian Mallee region – differences between current no-till users and non-users. ..............................................................25
Table 33 Victorian Loddon and Wimmera regions - differences between current no-till users and non-users. ...................................26
Table 34 WA regions all respondents – differences between current no-till users and non-users. ......................................................26
Table 35 Variables shown to be significantly a associated with no-till adoption, extensive use of no-till and stated expectation of use in 5 years time based on logit regression analyses using all respondents and respondents from lower adopting regions. ...................................................................................................................................................28
LIST OF FIGURESFigure 1 Location of target regions based on ABS Statistical Local Areas. ............................................................................................8
Figure 2 Distribution of respondents based on ABS Statistical Local Areas. .........................................................................................9
Figure 3 Cumulative adoption of no-till across Victorian study areas. ..................................................................................................11
Figure 4 Cumulative adoption of no-till across NSW and Queensland study areas. ............................................................................11
Figure 5 Cumulative adoption of no-till across SA study areas. ............................................................................................................11
Figure 6 Cumulative adoption of no-till across WA study areas. ...........................................................................................................11
Figure 7 Cumulative adoption of no-till by respondents classified by state. ........................................................................................11
Figure 8 Cumulative adoption of no-till across all study areas. .............................................................................................................11
ADOPTION OF NO-TILL CROPPING PRACTICES IN AUSTRALIAN GRAIN GROWING REGIONS | 5 | GRDC
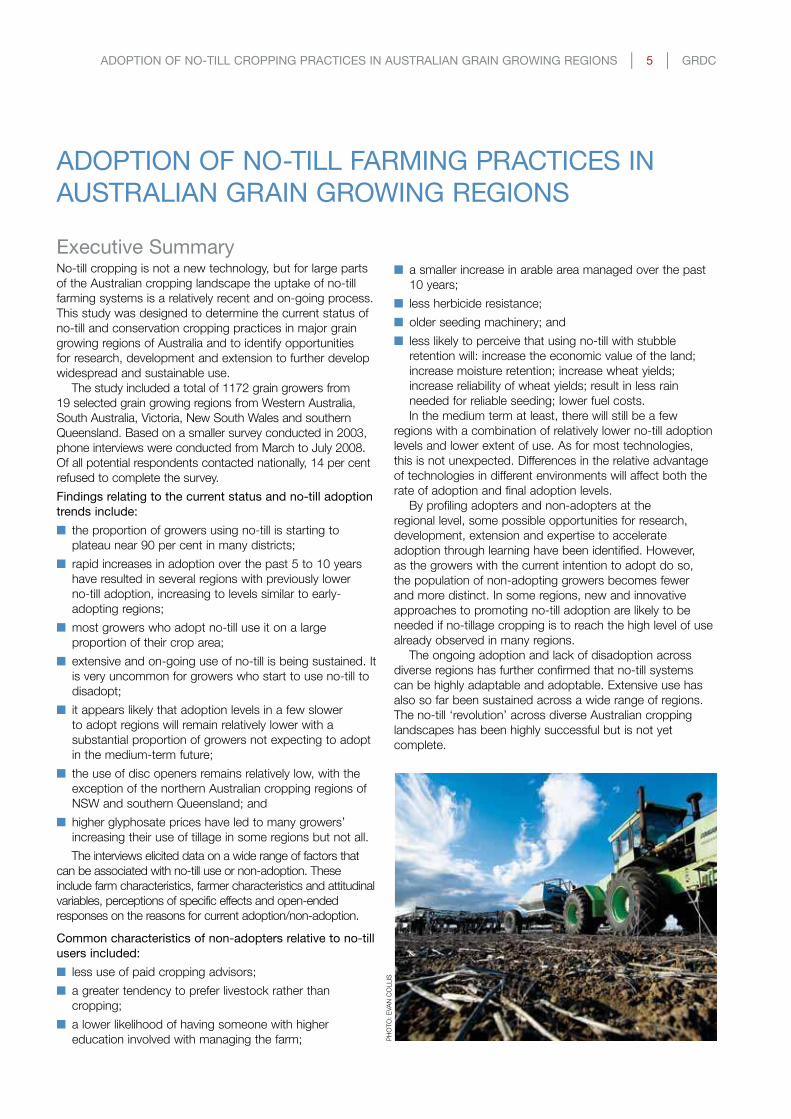
Executive SummaryNo-till cropping is not a new technology, but for large parts of the Australian cropping landscape the uptake of no-till farming systems is a relatively recent and on-going process. This study was designed to determine the current status of no-till and conservation cropping practices in major grain growing regions of Australia and to identify opportunities for research, development and extension to further develop widespread and sustainable use.
The study included a total of 1172 grain growers from 19 selected grain growing regions from Western Australia, South Australia, Victoria, New South Wales and southern Queensland. Based on a smaller survey conducted in 2003, phone interviews were conducted from March to July 2008. Of all potential respondents contacted nationally, 14 per cent refused to complete the survey.
Findings relating to the current status and no-till adoption
trends include:
n the proportion of growers using no-till is starting to plateau near 90 per cent in many districts;
n rapid increases in adoption over the past 5 to 10 years have resulted in several regions with previously lower no-till adoption, increasing to levels similar to early-adopting regions;
n most growers who adopt no-till use it on a large proportion of their crop area;
n extensive and on-going use of no-till is being sustained. It is very uncommon for growers who start to use no-till to disadopt;
n it appears likely that adoption levels in a few slower to adopt regions will remain relatively lower with a substantial proportion of growers not expecting to adopt in the medium-term future;
n the use of disc openers remains relatively low, with the exception of the northern Australian cropping regions of NSW and southern Queensland; and
n higher glyphosate prices have led to many growers’ increasing their use of tillage in some regions but not all.
The interviews elicited data on a wide range of factors that can be associated with no-till use or non-adoption. These include farm characteristics, farmer characteristics and attitudinal variables, perceptions of specific effects and open-ended responses on the reasons for current adoption/non-adoption.
Common characteristics of non-adopters relative to no-till
users included:
n less use of paid cropping advisors;
n a greater tendency to prefer livestock rather than cropping;
n a lower likelihood of having someone with higher education involved with managing the farm;
ADOPTION OF NO-TILL FARMING PRACTICES IN
AUSTRALIAN GRAIN GROWING REGIONS
n a smaller increase in arable area managed over the past 10 years;
n less herbicide resistance;
n older seeding machinery; and
n less likely to perceive that using no-till with stubble retention will: increase the economic value of the land; increase moisture retention; increase wheat yields; increase reliability of wheat yields; result in less rain needed for reliable seeding; lower fuel costs.In the medium term at least, there will still be a few
regions with a combination of relatively lower no-till adoption levels and lower extent of use. As for most technologies, this is not unexpected. Differences in the relative advantage of technologies in different environments will affect both the rate of adoption and final adoption levels.
By profiling adopters and non-adopters at the regional level, some possible opportunities for research, development, extension and expertise to accelerate adoption through learning have been identified. However, as the growers with the current intention to adopt do so, the population of non-adopting growers becomes fewer and more distinct. In some regions, new and innovative approaches to promoting no-till adoption are likely to be needed if no-tillage cropping is to reach the high level of use already observed in many regions.
The ongoing adoption and lack of disadoption across diverse regions has further confirmed that no-till systems can be highly adaptable and adoptable. Extensive use has also so far been sustained across a wide range of regions. The no-till ‘revolution’ across diverse Australian cropping landscapes has been highly successful but is not yet complete.
PH
OTO
: EVA
N C
Oll
IS

GRDC | 6 | ADOPTION OF NO-TILL CROPPING PRACTICES IN AUSTRALIAN GRAIN GROWING REGIONS
The overall aims of the study are:n to utilise practice use and socio-economic data collected
from Australian grain growers to identify levels and trends in adoption of no-till and conservation farming practices across cropping regions;
n to identify factors influencing decisions to adopt, not adopt or disadopt no-till and conservation farming practices; and
n to provide recommendations for research, development and extension (R, D & E) and policy.
Reduced soil disturbance through no-till and conservation farming methods is seen as a key practice change that has led to greater profitability, sustainability and reduced environmental impact in the Australian cropping belt. As well as the private economic gains to grain growers, the reduction in wind erosion can have significant public benefits (for example, Williams and Young 1999). Previous national studies have shown that adoption of these soil-conserving practices has been recognised as very high in many regions but remained relatively low in others, including regions particularly susceptible to wind erosion.
This study expands on a socio-economic study of no-till adoption conducted in 2003 (see D’Emden & llewellyn 2006; D’Emden et al 2008) which focused largely on South Australian and Western Australian cropping districts. This 2008–09 study has been expanded to include selected cropping regions across WA, SA, Victoria, NSW and southern Queensland.
The main objectives are to identify no-till adoption trends across cropping regions and identify opportunities for research, extension and policy to facilitate farming systems change for both private and public good. In this report, summary statistics and trends are presented together with analyses of farm and farmer characteristics of adopters and non-adopters across states and regions. Implications for research, extension and policy aimed at no-till adoption and soil conservation are discussed.
The study identifies region-specific factors influencing the current and future extent of the use of conservation farming practices and the potential to specifically target research, development and extension activities to achieve more rapid adoption.
2. AIMS1. BACKGROUND
ADOPTION OF NO-TILL CROPPING PRACTICES IN AUSTRALIAN GRAIN GROWING REGIONS | 7 | GRDC
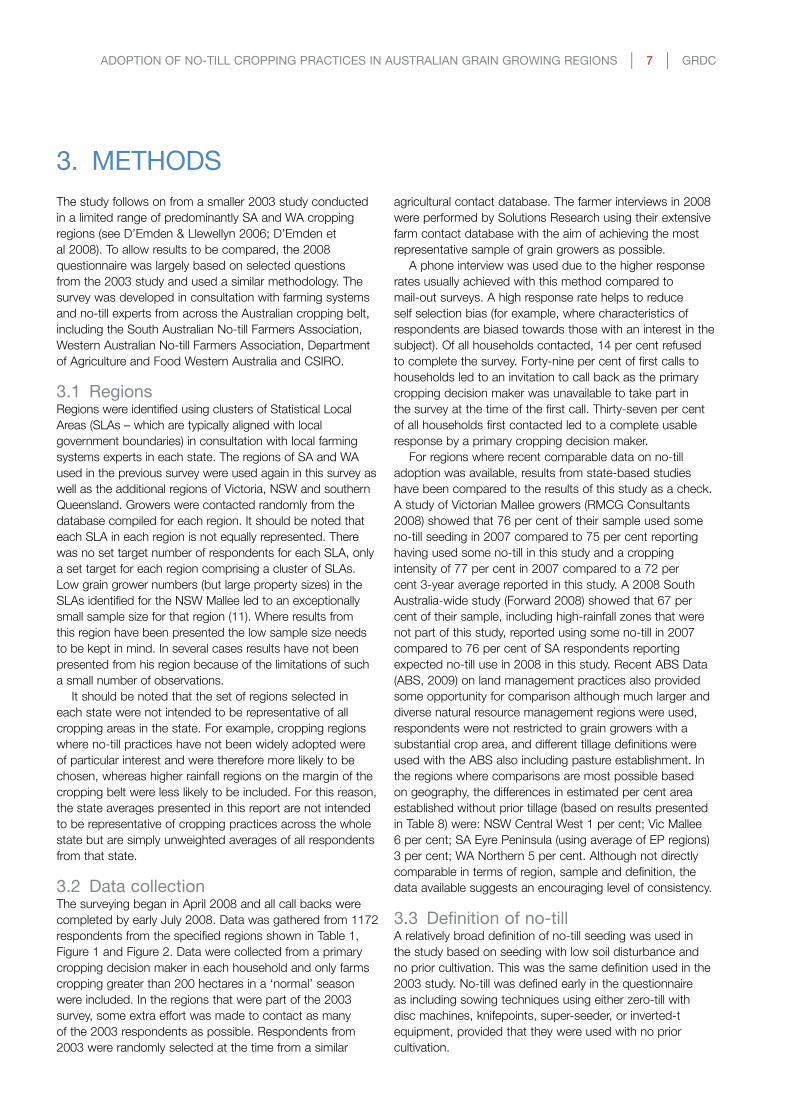
The study follows on from a smaller 2003 study conducted in a limited range of predominantly SA and WA cropping regions (see D’Emden & llewellyn 2006; D’Emden et al 2008). To allow results to be compared, the 2008 questionnaire was largely based on selected questions from the 2003 study and used a similar methodology. The survey was developed in consultation with farming systems and no-till experts from across the Australian cropping belt, including the South Australian No-till Farmers Association, Western Australian No-till Farmers Association, Department of Agriculture and Food Western Australia and CSIRO.
3.1 RegionsRegions were identified using clusters of Statistical local Areas (SlAs – which are typically aligned with local government boundaries) in consultation with local farming systems experts in each state. The regions of SA and WA used in the previous survey were used again in this survey as well as the additional regions of Victoria, NSW and southern Queensland. Growers were contacted randomly from the database compiled for each region. It should be noted that each SlA in each region is not equally represented. There was no set target number of respondents for each SlA, only a set target for each region comprising a cluster of SlAs. low grain grower numbers (but large property sizes) in the SlAs identified for the NSW Mallee led to an exceptionally small sample size for that region (11). Where results from this region have been presented the low sample size needs to be kept in mind. In several cases results have not been presented from his region because of the limitations of such a small number of observations.
It should be noted that the set of regions selected in each state were not intended to be representative of all cropping areas in the state. For example, cropping regions where no-till practices have not been widely adopted were of particular interest and were therefore more likely to be chosen, whereas higher rainfall regions on the margin of the cropping belt were less likely to be included. For this reason, the state averages presented in this report are not intended to be representative of cropping practices across the whole state but are simply unweighted averages of all respondents from that state.
3.2 Data collectionThe surveying began in April 2008 and all call backs were completed by early July 2008. Data was gathered from 1172 respondents from the specified regions shown in Table 1, Figure 1 and Figure 2. Data were collected from a primary cropping decision maker in each household and only farms cropping greater than 200 hectares in a ‘normal’ season were included. In the regions that were part of the 2003 survey, some extra effort was made to contact as many of the 2003 respondents as possible. Respondents from 2003 were randomly selected at the time from a similar
3. METHODS
agricultural contact database. The farmer interviews in 2008 were performed by Solutions Research using their extensive farm contact database with the aim of achieving the most representative sample of grain growers as possible.
A phone interview was used due to the higher response rates usually achieved with this method compared to mail-out surveys. A high response rate helps to reduce self selection bias (for example, where characteristics of respondents are biased towards those with an interest in the subject). Of all households contacted, 14 per cent refused to complete the survey. Forty-nine per cent of first calls to households led to an invitation to call back as the primary cropping decision maker was unavailable to take part in the survey at the time of the first call. Thirty-seven per cent of all households first contacted led to a complete usable response by a primary cropping decision maker.
For regions where recent comparable data on no-till adoption was available, results from state-based studies have been compared to the results of this study as a check. A study of Victorian Mallee growers (RMCG Consultants 2008) showed that 76 per cent of their sample used some no-till seeding in 2007 compared to 75 per cent reporting having used some no-till in this study and a cropping intensity of 77 per cent in 2007 compared to a 72 per cent 3-year average reported in this study. A 2008 South Australia-wide study (Forward 2008) showed that 67 per cent of their sample, including high-rainfall zones that were not part of this study, reported using some no-till in 2007 compared to 76 per cent of SA respondents reporting expected no-till use in 2008 in this study. Recent ABS Data (ABS, 2009) on land management practices also provided some opportunity for comparison although much larger and diverse natural resource management regions were used, respondents were not restricted to grain growers with a substantial crop area, and different tillage definitions were used with the ABS also including pasture establishment. In the regions where comparisons are most possible based on geography, the differences in estimated per cent area established without prior tillage (based on results presented in Table 8) were: NSW Central West 1 per cent; Vic Mallee 6 per cent; SA Eyre Peninsula (using average of EP regions) 3 per cent; WA Northern 5 per cent. Although not directly comparable in terms of region, sample and definition, the data available suggests an encouraging level of consistency.
3.3 Definition of no-tillA relatively broad definition of no-till seeding was used in the study based on seeding with low soil disturbance and no prior cultivation. This was the same definition used in the 2003 study. No-till was defined early in the questionnaire as including sowing techniques using either zero-till with disc machines, knifepoints, super-seeder, or inverted-t equipment, provided that they were used with no prior cultivation.

GRDC | 8 | ADOPTION OF NO-TILL CROPPING PRACTICES IN AUSTRALIAN GRAIN GROWING REGIONS
3.4 Statistical analysisStatistical tests were used to compare differences between no-till users and non-users based on their use of no-till in 2008 (Section 4.8). The questionnaire involved a range of data types including continuous, binary, categorical and ordinal variables. This required a range of statistical tests including non-parametric methods.
Where possible t-tests were used, however much of the continuous data did not meet criteria for normal distribution. Where possible, transformations were made to allow t-tests. In other cases non-parametric tests were employed such as Kolgmorov-smirnov tests for equality of distributions and K-sample median tests.
Pearson chi-square tests were used for most binary and categorical data. For analysis of some regional data, some merging of response sets was performed (for example, more and a lot more) to allow adequate observation numbers per category.
Where differences between adopters and non-adopters at the regional level were statistically significant, this is reported in the text indicated by * P<0.1; **P<0.05 and ***P<0.01.
To allow data to be presented consistently and succinctly for ease of interpretation, means have generally been presented. Therefore, in some cases, means are presented where the statistical test used a median-based method. For binary and other categorical data, not all categorical response proportions are always shown.
low observation numbers in the NSW Mallee meant that statistical tests could not be performed on that region. WA regions were clustered into three main regions (Table 1) to increase observation numbers. This allowed WA Central to be included in the statistical analyses but not WA Northern or Southwest due to the low number of non-users. Because of the relatively low proportion of growers who have not
adopted use of at least some no-till and therefore the low number of ‘non-adopter’ observations in most regions, most results are presented by state. Those using some no-till in 2008 (see Table 2) have been classified as a no-till user. The number of no-till users and non-users based on this classification are:
State Users Non-users
NSW all 255 73
(NSW Northern) 120* 26*
QLD (Southern) 88 35
SA 225 71
VIC 162 54
WA 184 24
All respondents 914 257
* These igures are also included in NSW all.
In many cases the ability to statistically test differences at the regional level was limited by the low number of non-users and some care should be taken in interpreting results. A low number of observations in a region may be the reason why a difference was not found to be significant and therefore not presented in the tables.
logistic regressions of selected variables to explain no-till adoption and extensive use have been conducted. The extensive use measure was designed to capture growers using no-till to establish practically their entire cropping program (>90 per cent of the 2008 crop). Due to the generally high proportion of adopters across the sample, the analyses are largely focused on explaining extensive use of no-till and factors influencing adoption in the lower-adopting regions.
FIGURE 1 Location of target regions based on ABS Statistical Local Areas (NB: not all SLAs labelled).
Chapman Valley (S)
Mingenew (S)
Dandaragan (S)
Merredin (S)
Quairading (S)
Cuballing (S)
Dumbleyung (S)
Broomehill (S)
Ceduna (DC)
Mildura (RC) - Pt A
Mildura (RC) - Pt B
Hindmarsh (S)
Narrabri (A)
Walgett (A) Gwydir (A)
Murilla (S)
Swan Hill (RC) - Central
Tamworth Regional (A) - Pt A
Warwick (S) - NorthGoondiwindi (T)
Toowoomba (C) - North
Horsham (RC) - Central
Kimba (DC)
Cleve (DC) Wentworth (A)
Coolamon (A)
Forbes (A)
Lachlan (A)
Bland (A)
Parkes
Lower Eyre Peninsula (DC)Broomehill (S)

ADOPTION OF NO-TILL CROPPING PRACTICES IN AUSTRALIAN GRAIN GROWING REGIONS | 9 | GRDC
Table 1 Sample Regions, respondent numbers and Statistical Local Areas. Alternative classification of WA regions into NorthernN, CentralC and SouthwestSW as indicated.
State Regions Respondents Statistical Local Areas
NSW
NSW Central West 81Lachlan; Forbes; Weddin; Bland
NSW Mallee 11 Wentworth; Balranald
NSW Northern 146
Moree Plains; Gwydir; Narrabri; Walgett; Coonamble; Tamworth; Liverpool Plains;
NSW Southern 90Urana; Lockhart, Wagga; Junee; Coolamon; Narrandera; Temora;
All NSW 328
QLD Southern 123
Waggamba, Tara, Murilla, Wambo, Dalby, Toowoomba, Cambooya, Clifton, Warwick N. Goondiwindi
SA
SA Central 60
Clare and Gilbert Valleys; Yorke Peninsula N-Wakeield-Burunga West; Pt Pirie Districts
SA Lower EP 50Lower Eyre Peninsula DC; Tumby Bay DC;
SA Mallee 90Loxton-Waikerie West and East; Karoonda East-Murray, Southern Mallee, Coorong
SA Upper EP 56Kimba DC; Cleve DC; Le Hunte DC;
SA Western EP 40Elliston DC; Streaky Bay DC; Ceduna DC;
All SA 296
VIC
VIC Loddon 66Loddon, Ganawarra, Campaspe, Greater Bendigo
VIC Mallee 80Mildura, Swan Hill(s), Buloke N,Yarriambiack N
VIC Wimmera 70West Wimmera; Horsham, Hindmarsh, Yarriambiack S, Buloke S
All Vic 216
WA
WA NorthernN 25Mingenew, Morawa, Mullewa and Chapman Valley
WA Midlands (NE)N 34Wongan-Ballidu, Dalwallinu, Dandaragan, Koorda, Moora
WA Central / EasternC 44Quairading, Kellerberrin, Merredin and Bruce Rock
WA SE CentralC 34Kent, Dumbleyung and Lake Grace
WA Upper Great SouthernSW 37
Tambellup, Katanning, Broomehill; Woodanilling; Kojonup
WA Western CentralSW 29Wagin, Williams, Wandering, Narrogin and Cuballing
All WA 209*
TOTAL 1172
* This igure includes six WA growers located in regions not listed
FIGURE 2 Distribution of respondents based on ABS Statistical Local Areas (SLA)
Number of responses per SLA1-45-910-1314-1718-2122-2627-34
GRDC | 10 | ADOPTION OF NO-TILL CROPPING PRACTICES IN AUSTRALIAN GRAIN GROWING REGIONS
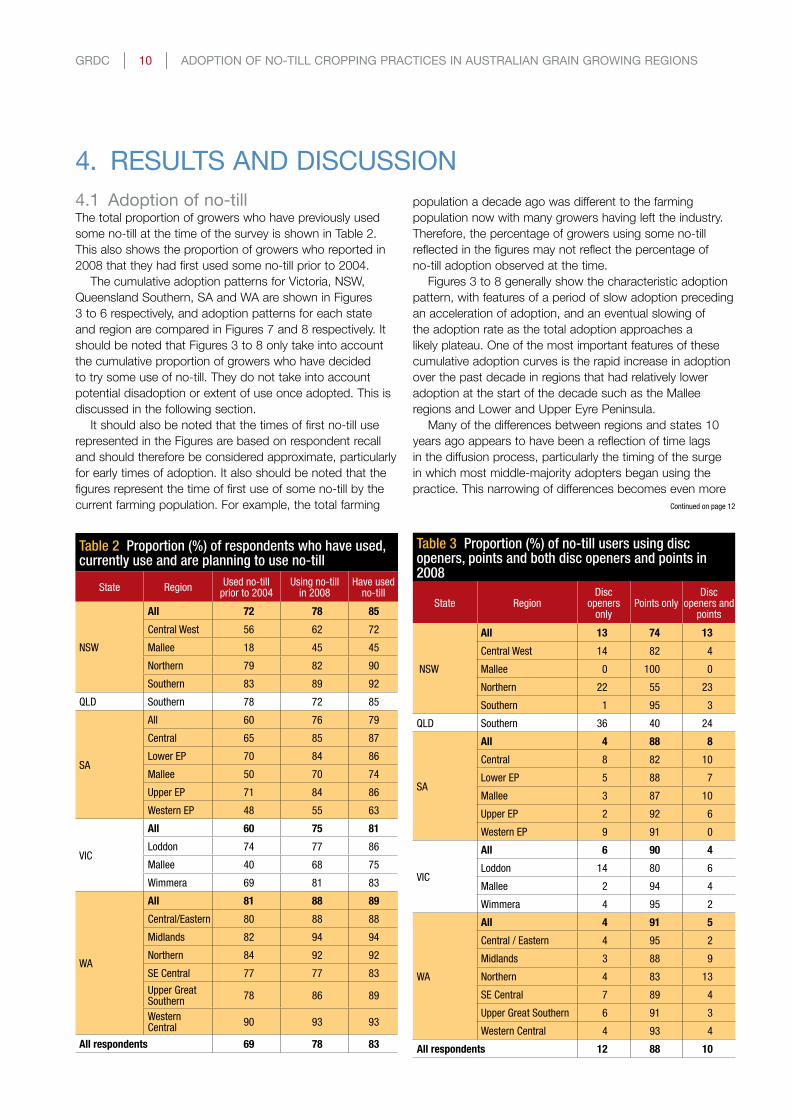
population a decade ago was different to the farming population now with many growers having left the industry. Therefore, the percentage of growers using some no-till reflected in the figures may not reflect the percentage of no-till adoption observed at the time.
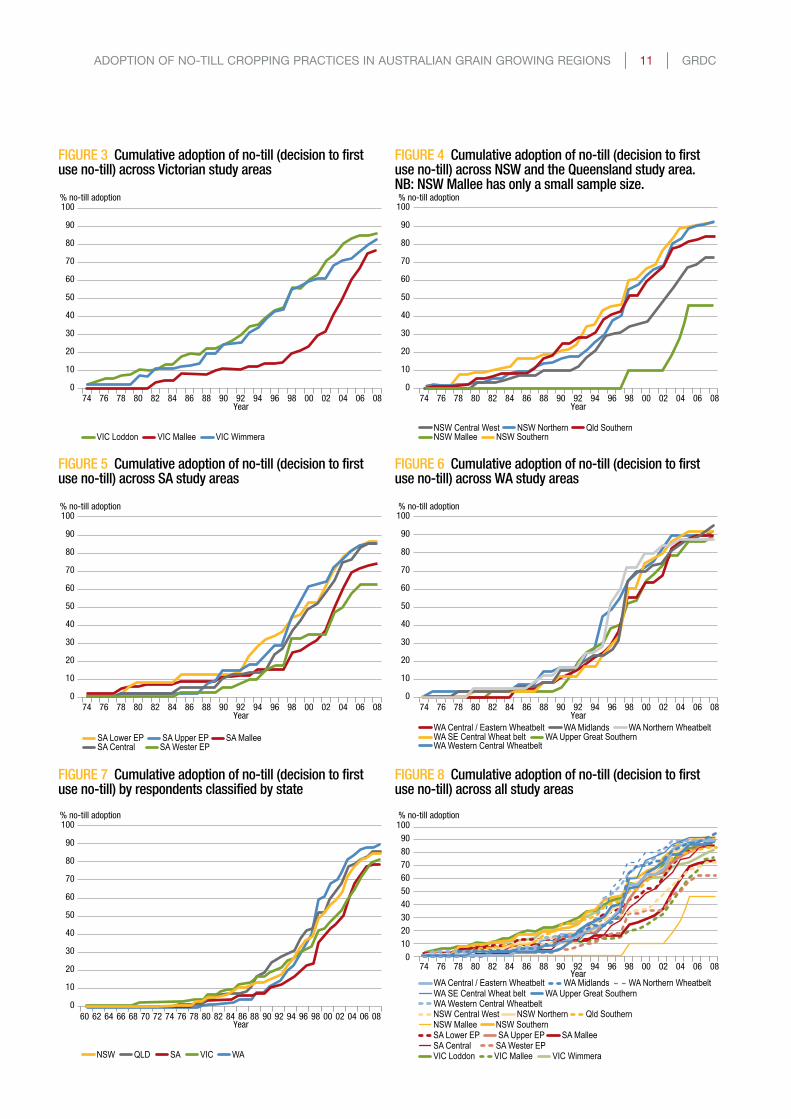
Figures 3 to 8 generally show the characteristic adoption pattern, with features of a period of slow adoption preceding an acceleration of adoption, and an eventual slowing of the adoption rate as the total adoption approaches a likely plateau. One of the most important features of these cumulative adoption curves is the rapid increase in adoption over the past decade in regions that had relatively lower adoption at the start of the decade such as the Mallee regions and lower and Upper Eyre Peninsula.
Many of the differences between regions and states 10 years ago appears to have been a reflection of time lags in the diffusion process, particularly the timing of the surge in which most middle-majority adopters began using the practice. This narrowing of differences becomes even more
4.1 Adoption of no-till The total proportion of growers who have previously used some no-till at the time of the survey is shown in Table 2. This also shows the proportion of growers who reported in 2008 that they had first used some no-till prior to 2004.
The cumulative adoption patterns for Victoria, NSW, Queensland Southern, SA and WA are shown in Figures 3 to 6 respectively, and adoption patterns for each state and region are compared in Figures 7 and 8 respectively. It should be noted that Figures 3 to 8 only take into account the cumulative proportion of growers who have decided to try some use of no-till. They do not take into account potential disadoption or extent of use once adopted. This is discussed in the following section.
It should also be noted that the times of first no-till use represented in the Figures are based on respondent recall and should therefore be considered approximate, particularly for early times of adoption. It also should be noted that the figures represent the time of first use of some no-till by the current farming population. For example, the total farming
4. RESULTS AND DISCUSSION
Table 2 Proportion (%) of respondents who have used, currently use and are planning to use no-till
State RegionUsed no-till
prior to 2004Using no-till
in 2008Have used
no-till
NSW
All 72 78 85
Central West 56 62 72
Mallee 18 45 45
Northern 79 82 90
Southern 83 89 92
QLD Southern 78 72 85
SA
All 60 76 79
Central 65 85 87
Lower EP 70 84 86
Mallee 50 70 74
Upper EP 71 84 86
Western EP 48 55 63
VIC
All 60 75 81
Loddon 74 77 86
Mallee 40 68 75
Wimmera 69 81 83
WA
All 81 88 89
Central/Eastern 80 88 88
Midlands 82 94 94
Northern 84 92 92
SE Central 77 77 83
Upper Great Southern
78 86 89
Western Central
90 93 93
All respondents 69 78 83
Table 3 Proportion (%) of no-till users using disc openers, points and both disc openers and points in 2008
State RegionDisc
openers only
Points onlyDisc
openers and points
NSW
All 13 74 13
Central West 14 82 4
Mallee 0 100 0
Northern 22 55 23
Southern 1 95 3
QLD Southern 36 40 24
SA
All 4 88 8
Central 8 82 10
Lower EP 5 88 7
Mallee 3 87 10
Upper EP 2 92 6
Western EP 9 91 0
VIC
All 6 90 4
Loddon 14 80 6
Mallee 2 94 4
Wimmera 4 95 2
WA
All 4 91 5
Central / Eastern 4 95 2
Midlands 3 88 9
Northern 4 83 13
SE Central 7 89 4
Upper Great Southern 6 91 3
Western Central 4 93 4
All respondents 12 88 10
Continued on page 12
ADOPTION OF NO-TILL CROPPING PRACTICES IN AUSTRALIAN GRAIN GROWING REGIONS | 11 | GRDC
% no-till adoption % no-till adoption100
90
80
70
60
50
40
30
20
10
0
100
90
80
70
60
50
40
30
20
10
0
74 76 78 80 82 84 86 88 90 92 94 96 98 00 02 04 06 08Year
74 76 78 80 82 84 86 88 90 92 94 96 98 00 02 04 06 08Year
VIC Loddon VIC Mallee VIC Wimmera
VIC Loddon VIC Mallee VIC Wimmera
NSW Mallee NSW SouthernNSW Central West NSW Northern Qld Southern
SA Central SA Wester EPSA Lower EP SA Upper EP SA Mallee
% no-till adoption % no-till adoption100
90
80
70
60
50
40
30
20
10
0
100
90
80
70
60
50
40
30
20
10
0
74 76 78 80 82 84 86 88 90 92 94 96 98 00 02 04 06 08Year
74 76 78 80 82 84 86 88 90 92 94 96 98 00 02 04 06 08Year
WA Western Central WheatbeltWA SE Central Wheat belt WA Upper Great SouthernWA Central / Eastern Wheatbelt WA Midlands WA Northern Wheatbelt
WA Western Central WheatbeltWA SE Central Wheat belt WA Upper Great SouthernWA Central / Eastern Wheatbelt WA Midlands WA Northern Wheatbelt
% no-till adoption % no-till adoption100
90
80
70
60
50
40
30
20
10
0
100
90
80
70
60
50
40
30
20
10
0
60 62 64 66 68 70 72 74 76 78 8880 82 84 86 90 92 94 96 98 00 02 04 06 08Year
74 76 78 80 82 84 86 88 90 92 94 96 98 00 02 04 06 08Year
NSW QLD SA VIC WA
NSW Mallee NSW SouthernNSW Central West NSW Northern Qld Southern
SA Central SA Wester EPSA Lower EP SA Upper EP SA Mallee
FIGURE 3 Cumulative adoption of no-till (decision to first use no-till) across Victorian study areas
FIGURE 4 Cumulative adoption of no-till (decision to first use no-till) across NSW and the Queensland study area. NB: NSW Mallee has only a small sample size.
FIGURE 5 Cumulative adoption of no-till (decision to first use no-till) across SA study areas
FIGURE 6 Cumulative adoption of no-till (decision to first use no-till) across WA study areas
FIGURE 7 Cumulative adoption of no-till (decision to first use no-till) by respondents classified by state
FIGURE 8 Cumulative adoption of no-till (decision to first use no-till) across all study areas
GRDC | 12 | ADOPTION OF NO-TILL CROPPING PRACTICES IN AUSTRALIAN GRAIN GROWING REGIONS
evident when comparing expected adoption rates in 2013 (Table 4). For example, the dramatic differences between no-till adoption in the selected WA and SA regions in the late 1990s where WA adoption rates were almost double the adoption rates in SA was largely a result of the major surge in no-till adoption occurring earlier in WA and later in SA. However, it is clear that some significant differences between peak regional adoption rates are likely to remain (see Tables 2 and 4).
Another important feature of the curves is that following the adoption of no-till by the innovators and early adopters, adoption has increased substantially in all districts. The results provide evidence that the experience and observation of the first adopters in all of these diverse districts has led, or will lead, to the majority of growers trying no-till.
In terms of the equipment used by the respondents, the vast majority of no-till is performed using narrow points with the exception of the northern (summer) cropping regions (northern NSW and southern Queensland) where disc seeding is common (Table 3).
4.1.1 Peak no-till adoption and disadoption
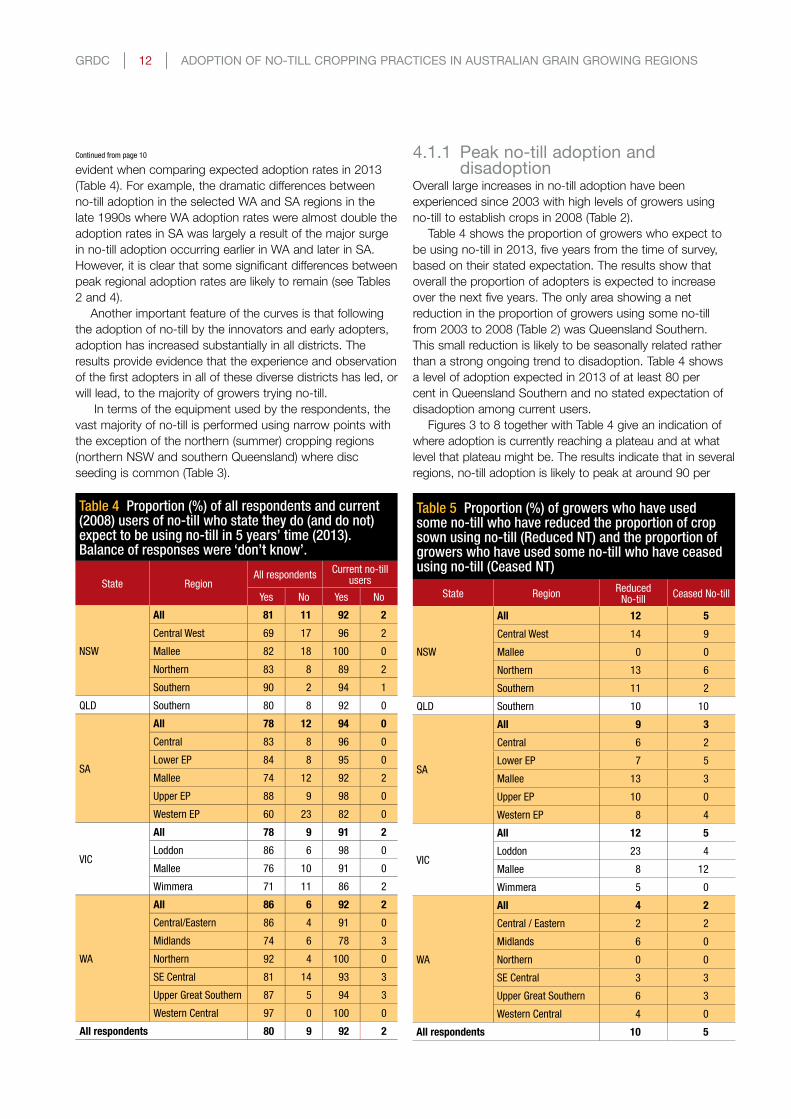
Overall large increases in no-till adoption have been experienced since 2003 with high levels of growers using no-till to establish crops in 2008 (Table 2).
Table 4 shows the proportion of growers who expect to be using no-till in 2013, five years from the time of survey, based on their stated expectation. The results show that overall the proportion of adopters is expected to increase over the next five years. The only area showing a net reduction in the proportion of growers using some no-till from 2003 to 2008 (Table 2) was Queensland Southern. This small reduction is likely to be seasonally related rather than a strong ongoing trend to disadoption. Table 4 shows a level of adoption expected in 2013 of at least 80 per cent in Queensland Southern and no stated expectation of disadoption among current users.
Figures 3 to 8 together with Table 4 give an indication of where adoption is currently reaching a plateau and at what level that plateau might be. The results indicate that in several regions, no-till adoption is likely to peak at around 90 per
Table 4 Proportion (%) of all respondents and current (2008) users of no-till who state they do (and do not) expect to be using no-till in 5 years’ time (2013). Balance of responses were ‘don’t know’.
State RegionAll respondents
Current no-till users
Yes No Yes No
NSW
All 81 11 92 2
Central West 69 17 96 2
Mallee 82 18 100 0
Northern 83 8 89 2
Southern 90 2 94 1
QLD Southern 80 8 92 0
SA
All 78 12 94 0
Central 83 8 96 0
Lower EP 84 8 95 0
Mallee 74 12 92 2
Upper EP 88 9 98 0
Western EP 60 23 82 0
VIC
All 78 9 91 2
Loddon 86 6 98 0
Mallee 76 10 91 0
Wimmera 71 11 86 2
WA
All 86 6 92 2
Central/Eastern 86 4 91 0
Midlands 74 6 78 3
Northern 92 4 100 0
SE Central 81 14 93 3
Upper Great Southern 87 5 94 3
Western Central 97 0 100 0
All respondents 80 9 92 2
Continued from page 10
Table 5 Proportion (%) of growers who have used some no-till who have reduced the proportion of crop sown using no-till (Reduced NT) and the proportion of growers who have used some no-till who have ceased using no-till (Ceased NT)
State RegionReduced
No-tillCeased No-till
NSW
All 12 5
Central West 14 9
Mallee 0 0
Northern 13 6
Southern 11 2
QLD Southern 10 10
SA
All 9 3
Central 6 2
Lower EP 7 5
Mallee 13 3
Upper EP 10 0
Western EP 8 4
VIC
All 12 5
Loddon 23 4
Mallee 8 12
Wimmera 5 0
WA
All 4 2
Central / Eastern 2 2
Midlands 6 0
Northern 0 0
SE Central 3 3
Upper Great Southern 6 3
Western Central 4 0
All respondents 10 5
ADOPTION OF NO-TILL CROPPING PRACTICES IN AUSTRALIAN GRAIN GROWING REGIONS | 13 | GRDC
The no-till adoption results clearly indicate that in most regions there are relatively few growers who have made the decision not to adopt no-till. In general, the vast majority of growers have either already adopted or have the intention to adopt over the next five years. However, there are several regions such as SA Western EP and NSW Central West with a notably higher proportion of growers stating that no-till is not expected to be used on their farm in the next five years (Table 4). This suggests that there are some regions where relying on current ongoing diffusion processes is not likely to result in the 85 to 90 per cent adoption levels that have already been achieved or are expected to be reached in other regions.
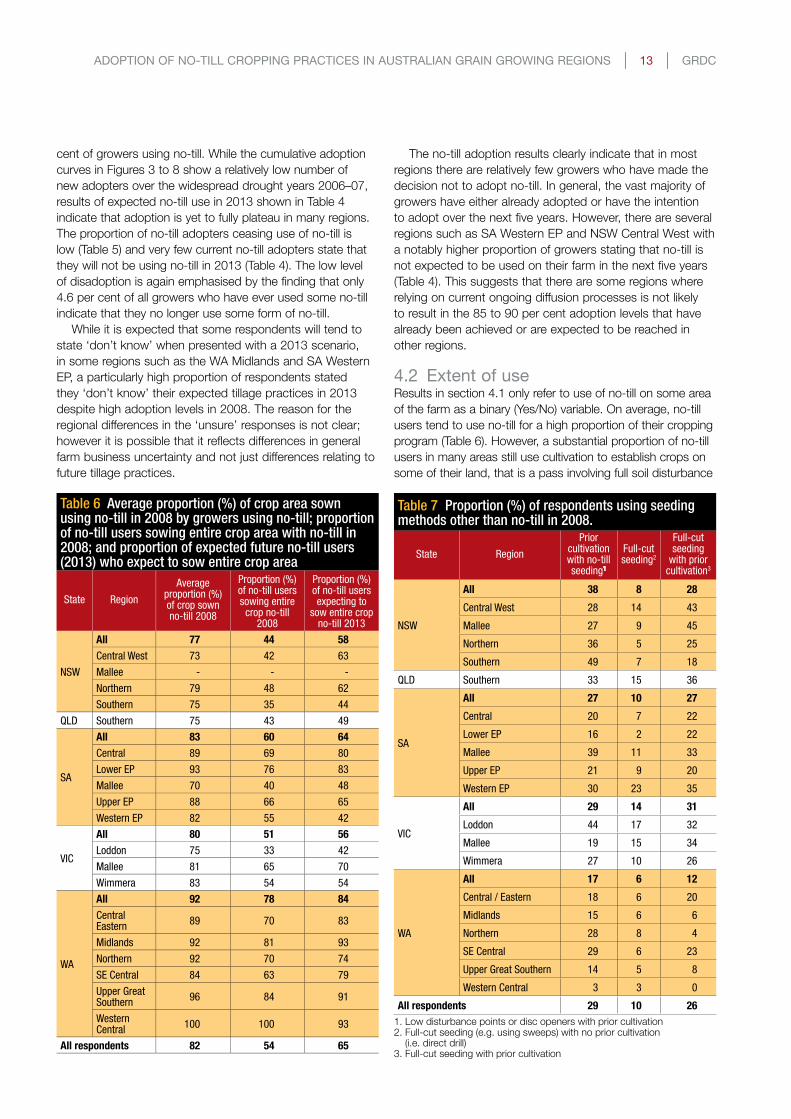
4.2 Extent of useResults in section 4.1 only refer to use of no-till on some area of the farm as a binary (Yes/No) variable. On average, no-till users tend to use no-till for a high proportion of their cropping program (Table 6). However, a substantial proportion of no-till users in many areas still use cultivation to establish crops on some of their land, that is a pass involving full soil disturbance
cent of growers using no-till. While the cumulative adoption curves in Figures 3 to 8 show a relatively low number of new adopters over the widespread drought years 2006–07, results of expected no-till use in 2013 shown in Table 4 indicate that adoption is yet to fully plateau in many regions. The proportion of no-till adopters ceasing use of no-till is low (Table 5) and very few current no-till adopters state that they will not be using no-till in 2013 (Table 4). The low level of disadoption is again emphasised by the finding that only 4.6 per cent of all growers who have ever used some no-till indicate that they no longer use some form of no-till.
While it is expected that some respondents will tend to state ‘don’t know’ when presented with a 2013 scenario, in some regions such as the WA Midlands and SA Western EP, a particularly high proportion of respondents stated they ‘don’t know’ their expected tillage practices in 2013 despite high adoption levels in 2008. The reason for the regional differences in the ‘unsure’ responses is not clear; however it is possible that it reflects differences in general farm business uncertainty and not just differences relating to future tillage practices.
Table 6 Average proportion (%) of crop area sown using no-till in 2008 by growers using no-till; proportion of no-till users sowing entire crop area with no-till in 2008; and proportion of expected future no-till users (2013) who expect to sow entire crop area
State Region
Average proportion (%) of crop sown no-till 2008
Proportion (%) of no-till users sowing entire
crop no-till 2008
Proportion (%) of no-till users expecting to
sow entire crop no-till 2013
NSW
All 77 44 58
Central West 73 42 63
Mallee - - -
Northern 79 48 62
Southern 75 35 44
QLD Southern 75 43 49
SA
All 83 60 64
Central 89 69 80
Lower EP 93 76 83
Mallee 70 40 48
Upper EP 88 66 65
Western EP 82 55 42
VIC
All 80 51 56
Loddon 75 33 42
Mallee 81 65 70
Wimmera 83 54 54
WA
All 92 78 84
Central Eastern
89 70 83
Midlands 92 81 93
Northern 92 70 74
SE Central 84 63 79
Upper Great Southern
96 84 91
Western Central
100 100 93
All respondents 82 54 65
Table 7 Proportion (%) of respondents using seeding methods other than no-till in 2008.
State Region
Prior cultivation with no-till seeding1
Full-cut seeding2
Full-cut seeding
with prior cultivation3
NSW
All 38 8 28
Central West 28 14 43
Mallee 27 9 45
Northern 36 5 25
Southern 49 7 18
QLD Southern 33 15 36
SA
All 27 10 27
Central 20 7 22
Lower EP 16 2 22
Mallee 39 11 33
Upper EP 21 9 20
Western EP 30 23 35
VIC
All 29 14 31
Loddon 44 17 32
Mallee 19 15 34
Wimmera 27 10 26
WA
All 17 6 12
Central / Eastern 18 6 20
Midlands 15 6 6
Northern 28 8 4
SE Central 29 6 23
Upper Great Southern 14 5 8
Western Central 3 3 0
All respondents 29 10 26
1. low disturbance points or disc openers with prior cultivation2. Full-cut seeding (e.g. using sweeps) with no prior cultivation
(i.e. direct drill) 3. Full-cut seeding with prior cultivation

GRDC | 14 | ADOPTION OF NO-TILL CROPPING PRACTICES IN AUSTRALIAN GRAIN GROWING REGIONS
(Table 7). In WA, where adoption is currently highest, the extent of no-till use by adopters is also highest. In five years time, it is expected that a majority of no-till users will still be using some cultivation in several regions (Table 6).
No-till users were asked if they had generally reduced the proportion of crop sown using no-till, seasonal variation aside. Table 5 shows that relatively few growers have chosen to generally reduce their extent of use. In WA, where no-till has been extensively practiced over the longest period, there was the smallest proportion of growers indicating that they have reduced their use of no-till. The relatively high proportion of growers stating reduced use in Vic. loddon needs further local investigation.
4.3 Extrapolated regional extent of tillage methods
A relatively crude indicator of the extent of tillage use at a regional scale is presented in Table 8 and should only be used as a guide to the extent of use at the landscape scale. The farm-level data on the extent of tillage methods used in each region was extrapolated using the Australian Bureau of Statistics (ABS) Agricultural Commodities Small Area Data on land use. State-based averages are not shown due to not all regions within each state being sampled.
The estimates for each region were calculated by simply multiplying the sum of all individual areas of a particular tillage method within a region by the inverse of the sampling proportion for that region, as represented by the following formula:
Where:
1/s x �(tixai)
s = sample % of ABS-estimated total regional cropping area4
ti = individual proportion of crop sown using tillage method
ai = total individual cropping area
Regions within Western Australia generally had the highest estimated proportions of no-till.
4.3.1 Glyphosate price and extent of usePrevious studies identified that the falling price of the predominant pre-seeding knockdown herbicide, glyphosate (relative to diesel price) had a significant positive effect on no-till adoption rates in southern Australian cropping areas (D’Emden et al 2006). In 2007–08, the downward price trend rapidly reversed and glyphosate prices increased substantially. Growers were asked in this survey whether the increase in glyphosate price had caused them to use more tillage, less tillage, or caused no change. Results are shown for all growers in Table 9.
Overall, 21 per cent of no-till users reported increased use of tillage as a result of increased glyphosate prices (72 per cent reporting no change and 7 per cent reporting less tillage), compared to 32 per cent of non-users reporting increased use of tillage as a result of increased glyphosate prices (61 per cent reporting no change and 7 per cent reporting less tillage).
The overall results indicate that increasing glyphosate prices have increased growers’ use of tillage, but there is large variation between regions. Increases have occurred to a greater extent among non no-till users (who are likely to have used more tillage passes), but a substantial proportion of no-till users have also reported increased tillage use as a direct result of glyphosate price increases. In WA regions, where no-till adoption and extent of use is generally highest and long-established, glyphosate price increases had relatively little or no effect on reported tillage use.
4.4 Cereal stubble managementTable 10 shows the proportion of all growers in the study burning a proportion of their cereal stubbles. Across all regions, on average, those burning some stubble burnt 29 per cent of their stubble area.
Southern NSW had both a high proportion of growers using some burning (47%) and a high median proportion of cereal stubble area burnt by those growers (50%) (Table 10). WA Western Central also had an exceptionally higher
Table 8 Extrapolated area cropping land (‘000 ha) sown using no-till, no-till seeding equipment with prior cultivation and full-cut seeding in 2008. Shown in parentheses as an estimated proportion (%) of ABS-estimated total 2006/-07 crop area.
State Region No-tillFull-cut seeding5
Prior cultivation with no-till seeding6
Full cut seeding
with prior cultivation7
NSW
Central West 326 (49) 45 (7) 81 (12) 201 (30)
Mallee 61 (53) 3 (2) 15 (13) 36 (31)
Northern 1404 (74) 21 (1) 308 (16) 141 (7)
Southern 536 (66) 59 (7) 127 (16) 85 (10)
QLD Southern 407 (59) 49 (7) 115 (17) 97 (14)
SA
Central 647 (83) 28 (4) 45 (6) 63 (8)
Lower EP 247 (81) 1 (0) 26 (9) 29 (9)
Mallee 371 (54) 58 (8) 104 (15) 142 (21)
Upper EP 397 (80) 16 (3) 44 (9) 37 (8)
Western EP 216 (50) 57 (13) 58 (13) 95 (22)
VIC
Loddon 208 (65) 6 (2) 33 (10) 65 (20)
Mallee 475 (63) 45 (6) 67 (9) 185 (24)
Wimmera 644 (74) 36 (4) 67 (8) 111 (13)
WA
Central / Eastern
440 (86) 25 (5) 31 (6) 64 (13)
Midlands 444 (82) 17 (3) 42 (8) 8 (1)
Northern 534 (84) 11 (2) 90 (14) 1 (0)
SE Central 541 (80) 15 (2) 77 (11) 84 (12)
Upper Great Southern
173 (84) 17 (8) 4 (2) 11 (5)
Western Central
199 (98) 2 (1) 3 (2) 0 (0)
All respondents 8270 (71) 510 (4) 1338 (12) 1848 (16)
5. Full-cut seeding (e.g. using sweeps) with no prior cultivation (i.e. direct drill)
6. low disturbance points or disc openers with prior cultivation
7. Full-cut seeding with prior cultivation4. Cat no. 7125.0 - Agricultural Commodities: Small Area Data, Australia, 2006-07. For explanatory notes see: www.abs.gov.au/ausstats/[email protected]/exnote/7125.0

ADOPTION OF NO-TILL CROPPING PRACTICES IN AUSTRALIAN GRAIN GROWING REGIONS | 15 | GRDC
proportion of all growers burning greater than 10 per cent of their cereal stubble area (45%).
Across all regions, 20 per cent of no-till users burnt some stubble and 28 per cent of non-users burnt some stubble.
4.5 Farm and farmer characteristics A wide range of information was collected relating to farm and farmer characteristics including attitudinal and perception measures. This is presented here to provide background and context for the no-till adoption data presented for each region. Further analyses aimed at defining adopter and non-adopter characteristics by state and region are presented in later sections.
4.5.1 Farm characteristicsMean total property size and arable area managed for each region is shown in Table 11, together with mean arable area managed 10 years ago. Using medians, the percentage increase in arable area managed since 1998 is also shown.
Changes and expectations in cropping intensity are shown in Table 12. Growers were asked to provide average cropping land proportions over the most recent three-year period, however, the figures may still be influenced by drought experienced in some of the regions such as those in WA.
Overall, growers in most regions expect to maintain similar levels of cropping intensity over the next five years. Exceptions include an expected decline in NSW Central West and what appears to be an expected return to typical cropping intensities in some Western Australian regions (Table 12).
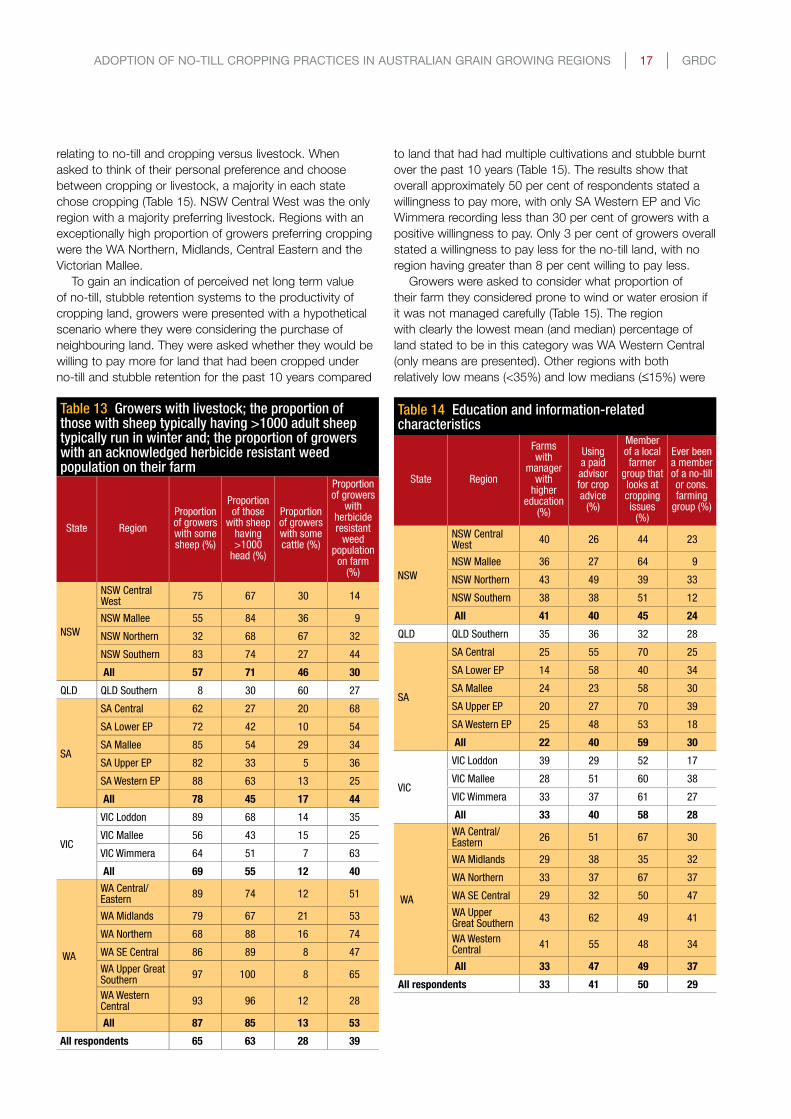
The majority of farms in the study run some livestock (Table 13) including those in regions with very extensive no-till use. The Victorian Mallee and SA Central regions have a combination of smaller proportions of growers with some sheep and fewer farmers with sheep running more than 1000 head. Cattle are the most common livestock in the northern cropping regions of northern NSW and southern Queensland.
Table 9 Effect of recent glyphosate price increases on use of tillage as reported by growers (% of all growers)
State RegionMore tillage
No changeLess
tillage
NSW
All 36 57 7
Central West 38 52 10
Mallee 55 36 9
Northern 39 58 3
Southern 28 63 9
QLD Southern 37 57 5
SA
All 16 75 9
Central 10 85 5
Lower EP 6 78 16
Mallee 29 64 7
Upper EP 11 77 12
Western EP 18 75 8
VIC
All 25 67 8
Loddon 30 64 6
Mallee 31 59 10
Wimmera 13 80 7
WA
All 6 91 3
Central / Eastern 4 94 2
Midlands 12 88 0
Northern 4 88 8
SE Central 5 92 3
Upper Great Southern 11 86 3
Western Central 0 97 3
All respondents 24 69 7
Table 10 Proportion (%) of respondents who burn cereal stubble, average (and median) proportion burned by those burning cereal stubble and proportion of all respondents burning greater than 10% of cereal stubbles
State Region
Growers burning
some cereal stubble (%)
Median area of cereal stubble
burned (%)
Proportion of all
respondents burning ≥ 10%
NSW
All 25 42 23
Central West 33 40 30
Mallee 0 - -
Northern 10 30 8
Southern 47 50 46
QLD Southern 7 9 3
SA
All 7 10 9
Central 23 10 17
Lower EP 38 10 20
Mallee 9 10 8
Upper EP 2 - -
Western EP 3 - -
VIC
All 23 20 19
Loddon 30 23 27
Mallee 9 10 6
Wimmera 33 15 24
WA
All 33 10 23
Central / Eastern
33 10 25
Midlands 35 6 15
Northern 24 10 12
SE Central 23 10 16
Upper Great Southern
32 10 22
Western Central
55 18 45
All respondents 22 20 12

GRDC | 16 | ADOPTION OF NO-TILL CROPPING PRACTICES IN AUSTRALIAN GRAIN GROWING REGIONS
The proportion of farms reporting herbicide resistance varies greatly across regions, reaching as high as 74 per cent in the WA Northern and remaining relatively low in the lower rainfall regions of the central west NSW, SA Western EP and the Mallee regions (Table 13). Defined as where a herbicide that once worked is no longer effective enough on a weed to be worth using for its control, an overall majority of farms in this study have not reported a herbicide resistance problem of this severity.
4.5.2 Farm management characteristicsThe proportion of farms with someone involved with managing the farm having completed a university degree or diploma is shown in Table 14. NSW was shown to have an overall higher proportion of farm managers with higher
education compared to SA. The SA Mallee is shown to have the lowest proportion
of growers (23%) using a directly paid consultant for advice regarding cropping (Table 14). This is in contrast to the neighbouring Victorian Mallee which has one of the higher rates of crop consultant use (51%). Across all respondents in all states, 41 per cent were using a paid consultant for cropping advice.
The proportion of growers who have ever been a member of a no-tillage or conservation farming association is shown in Table 14. Queensland Southern is shown to have a substantially lower proportion of growers stating membership of a local farmer group looking at cropping issues in their district.
Table 15 shows the responses to hypothetical scenarios
Table 11 Mean farm size; mean arable area currently managed and 10 years ago and % increase in median arable area managed 1998 to 2008
State RegionProperty area (ha)
Arable area currently managed
(ha)
Arable area managed 10 years ago (ha)
Increase in median
arable area
managed 1998-
2008 (%)
NSW
NSW Central West
2921 2428 2327 11
NSW Mallee 13035 6308 6723 25
NSW Northern 4555 3275 2808 49
NSW Southern 2031 1836 1480 28
All 3743 2773 2456 27
QLD QLD Southern 4424 1747 1346 24
SA
SA Central 1691 1456 1137 36
SA Lower EP 2466 1680 1389 20
SA Mallee 2806 2549 2062 12
SA Upper EP 3274 2866 2309 21
SA Western EP 5744 3860 3001 21
All 3008 2418 1934 25
VIC
VIC Loddon 2075 1907 1401 38
VIC Mallee 3660 3090 2372 34
VIC Wimmera 1790 1663 1366 18
All 2570 2272 1743 26
WA
WA Central/Eastern
4070 3557 2894 3
WA Midlands 3766 3173 2999 5
WA Northern 7277 5633 4617 37
WA SE Central 3448 3099 2608 19
WA Upper Great Southern
2686 2267 1810 36
WA Western Central
2650 2112 1860 20
All 3858 3262 2746 20
All respondents 3434 2570 2128 27
Table 12 Cropping intensity by region. Data shown is the mean proportion of land cropped as a percentage of arable land managed currently (as an average of most recent 3 seasons); 10 years ago and expected cropping intensity in 5 years time.
State Region
Arable land cropped (3 year
average) (%)
Arable land cropped 10 years ago
(%)
Expected arable area cropped in
5 years time (%)
NSW
NSW Central West
62 47 49
NSW Mallee 53 43 61
NSW Northern 71 68 73
NSW Southern 62 52 62
All 66 57 63
QLD Southern 74 73 77
SA
SA Central 80 72 77
SA Lower EP 83 71 84
SA Mallee 57 51 63
SA Upper EP 73 60 74
SA Western EP 66 54 63
All 70 60 69
VIC
VIC Loddon 59 53 59
VIC Mallee 72 59 76
VIC Wimmera 73 65 71
All 68 59 69
WA
WA Central/Eastern
66 59 73
WA Midlands 61 52 74
WA Northern 67 67 79
WA SE Central 61 49 63
WA Upper Great Southern
51 47 53
WA Western Central
53 36 73
All 60 52 68
All respondents 67 59 67
ADOPTION OF NO-TILL CROPPING PRACTICES IN AUSTRALIAN GRAIN GROWING REGIONS | 17 | GRDC
relating to no-till and cropping versus livestock. When asked to think of their personal preference and choose between cropping or livestock, a majority in each state chose cropping (Table 15). NSW Central West was the only region with a majority preferring livestock. Regions with an exceptionally high proportion of growers preferring cropping were the WA Northern, Midlands, Central Eastern and the Victorian Mallee.
To gain an indication of perceived net long term value of no-till, stubble retention systems to the productivity of cropping land, growers were presented with a hypothetical scenario where they were considering the purchase of neighbouring land. They were asked whether they would be willing to pay more for land that had been cropped under no-till and stubble retention for the past 10 years compared
to land that had had multiple cultivations and stubble burnt over the past 10 years (Table 15). The results show that overall approximately 50 per cent of respondents stated a willingness to pay more, with only SA Western EP and Vic Wimmera recording less than 30 per cent of growers with a positive willingness to pay. Only 3 per cent of growers overall stated a willingness to pay less for the no-till land, with no region having greater than 8 per cent willing to pay less.
Growers were asked to consider what proportion of their farm they considered prone to wind or water erosion if it was not managed carefully (Table 15). The region with clearly the lowest mean (and median) percentage of land stated to be in this category was WA Western Central (only means are presented). Other regions with both relatively low means (<35%) and low medians ( 15%) were
Table 13 Growers with livestock; the proportion of those with sheep typically having >1000 adult sheep typically run in winter and; the proportion of growers with an acknowledged herbicide resistant weed population on their farm
State Region
Proportion of growers with some sheep (%)
Proportion of those
with sheep having >1000
head (%)
Proportion of growers with some cattle (%)
Proportion of growers
with herbicide resistant
weed population
on farm (%)
NSW
NSW Central West
75 67 30 14
NSW Mallee 55 84 36 9
NSW Northern 32 68 67 32
NSW Southern 83 74 27 44
All 57 71 46 30
QLD QLD Southern 8 30 60 27
SA
SA Central 62 27 20 68
SA Lower EP 72 42 10 54
SA Mallee 85 54 29 34
SA Upper EP 82 33 5 36
SA Western EP 88 63 13 25
All 78 45 17 44
VIC
VIC Loddon 89 68 14 35
VIC Mallee 56 43 15 25
VIC Wimmera 64 51 7 63
All 69 55 12 40
WA
WA Central/ Eastern
89 74 12 51
WA Midlands 79 67 21 53
WA Northern 68 88 16 74
WA SE Central 86 89 8 47
WA Upper Great Southern
97 100 8 65
WA Western Central
93 96 12 28
All 87 85 13 53
All respondents 65 63 28 39
Table 14 Education and information-related characteristics
State Region
Farms with
manager with
higher education
(%)
Using a paid advisor for crop advice
(%)
Member of a local farmer
group that looks at cropping issues
(%)
Ever been a member of a no-till or cons. farming
group (%)
NSW
NSW Central West
40 26 44 23
NSW Mallee 36 27 64 9
NSW Northern 43 49 39 33
NSW Southern 38 38 51 12
All 41 40 45 24
QLD QLD Southern 35 36 32 28
SA
SA Central 25 55 70 25
SA Lower EP 14 58 40 34
SA Mallee 24 23 58 30
SA Upper EP 20 27 70 39
SA Western EP 25 48 53 18
All 22 40 59 30
VIC
VIC Loddon 39 29 52 17
VIC Mallee 28 51 60 38
VIC Wimmera 33 37 61 27
All 33 40 58 28
WA
WA Central/Eastern
26 51 67 30
WA Midlands 29 38 35 32
WA Northern 33 37 67 37
WA SE Central 29 32 50 47
WA Upper Great Southern
43 62 49 41
WA Western Central
41 55 48 34
All 33 47 49 37
All respondents 33 41 50 29
GRDC | 18 | ADOPTION OF NO-TILL CROPPING PRACTICES IN AUSTRALIAN GRAIN GROWING REGIONS
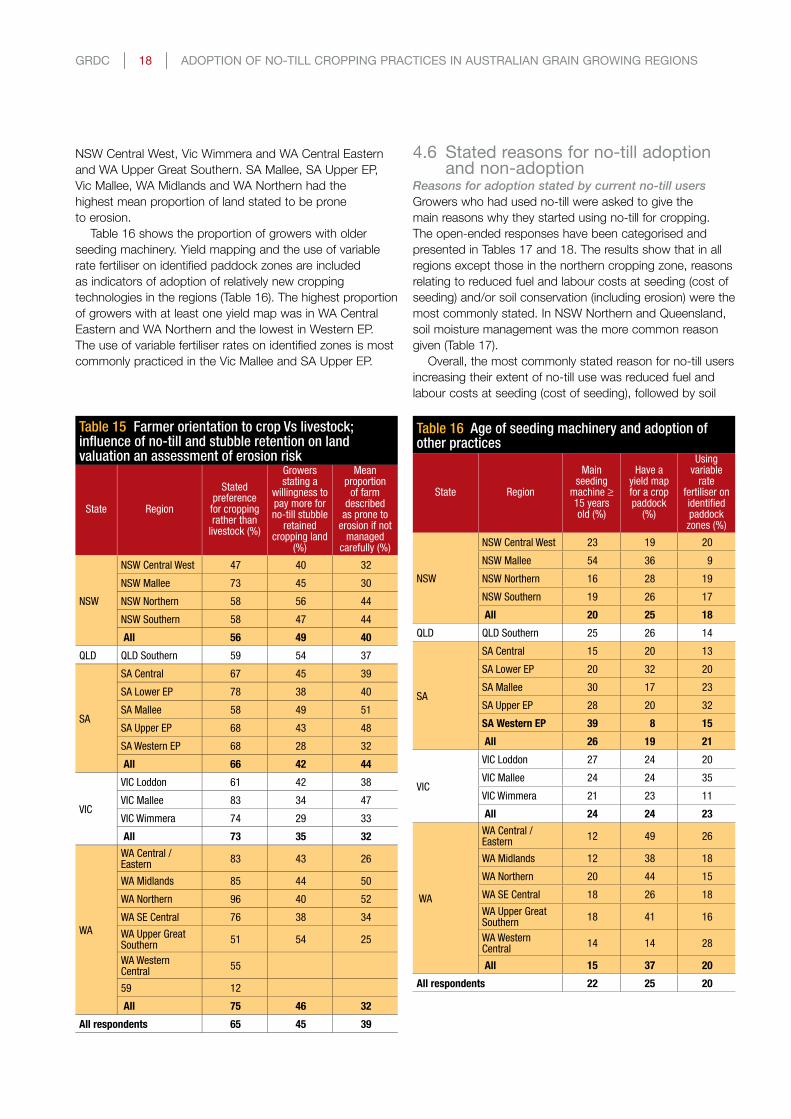
NSW Central West, Vic Wimmera and WA Central Eastern and WA Upper Great Southern. SA Mallee, SA Upper EP, Vic Mallee, WA Midlands and WA Northern had the highest mean proportion of land stated to be prone to erosion.
Table 16 shows the proportion of growers with older seeding machinery. Yield mapping and the use of variable rate fertiliser on identified paddock zones are included as indicators of adoption of relatively new cropping technologies in the regions (Table 16). The highest proportion of growers with at least one yield map was in WA Central Eastern and WA Northern and the lowest in Western EP. The use of variable fertiliser rates on identified zones is most commonly practiced in the Vic Mallee and SA Upper EP.
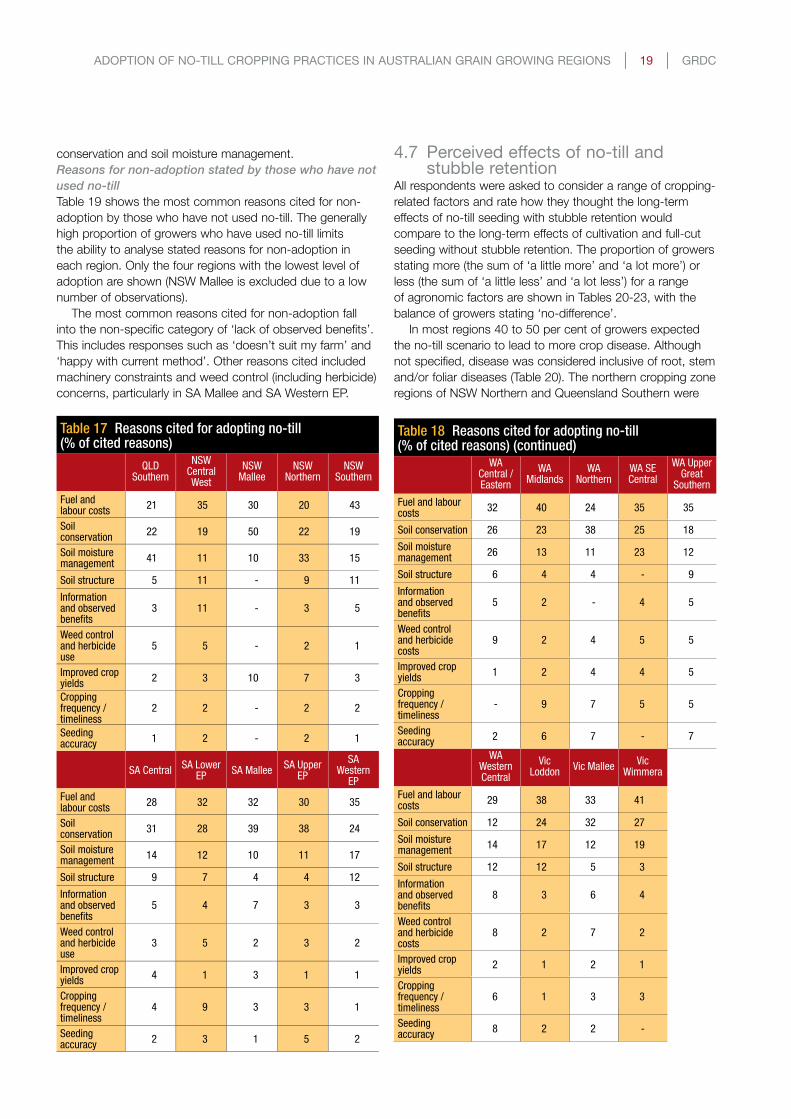
4.6 Stated reasons for no-till adoption and non-adoption
Reasons for adoption stated by current no-till users
Growers who had used no-till were asked to give the main reasons why they started using no-till for cropping. The open-ended responses have been categorised and presented in Tables 17 and 18. The results show that in all regions except those in the northern cropping zone, reasons relating to reduced fuel and labour costs at seeding (cost of seeding) and/or soil conservation (including erosion) were the most commonly stated. In NSW Northern and Queensland, soil moisture management was the more common reason given (Table 17).
Overall, the most commonly stated reason for no-till users increasing their extent of no-till use was reduced fuel and labour costs at seeding (cost of seeding), followed by soil
Table 15 Farmer orientation to crop Vs livestock; influence of no-till and stubble retention on land valuation an assessment of erosion risk
State Region
Stated preference
for cropping rather than
livestock (%)
Growers stating a
willingness to pay more for no-till stubble
retained cropping land
(%)
Mean proportion
of farm described
as prone to erosion if not
managed carefully (%)
NSW
NSW Central West 47 40 32
NSW Mallee 73 45 30
NSW Northern 58 56 44
NSW Southern 58 47 44
All 56 49 40
QLD QLD Southern 59 54 37
SA
SA Central 67 45 39
SA Lower EP 78 38 40
SA Mallee 58 49 51
SA Upper EP 68 43 48
SA Western EP 68 28 32
All 66 42 44
VIC
VIC Loddon 61 42 38
VIC Mallee 83 34 47
VIC Wimmera 74 29 33
All 73 35 32
WA
WA Central / Eastern
83 43 26
WA Midlands 85 44 50
WA Northern 96 40 52
WA SE Central 76 38 34
WA Upper Great Southern
51 54 25
WA Western Central
55
59 12
All 75 46 32
All respondents 65 45 39
Table 16 Age of seeding machinery and adoption of other practices
State Region
Main seeding
machine ≥ 15 years old (%)
Have a yield map for a crop paddock
(%)
Using variable
rate fertiliser on identiied paddock
zones (%)
NSW
NSW Central West 23 19 20
NSW Mallee 54 36 9
NSW Northern 16 28 19
NSW Southern 19 26 17
All 20 25 18
QLD QLD Southern 25 26 14
SA
SA Central 15 20 13
SA Lower EP 20 32 20
SA Mallee 30 17 23
SA Upper EP 28 20 32
SA Western EP 39 8 15
All 26 19 21
VIC
VIC Loddon 27 24 20
VIC Mallee 24 24 35
VIC Wimmera 21 23 11
All 24 24 23
WA
WA Central / Eastern
12 49 26
WA Midlands 12 38 18
WA Northern 20 44 15
WA SE Central 18 26 18
WA Upper Great Southern
18 41 16
WA Western Central
14 14 28
All 15 37 20
All respondents 22 25 20
ADOPTION OF NO-TILL CROPPING PRACTICES IN AUSTRALIAN GRAIN GROWING REGIONS | 19 | GRDC
conservation and soil moisture management.Reasons for non-adoption stated by those who have not
used no-till
Table 19 shows the most common reasons cited for non-adoption by those who have not used no-till. The generally high proportion of growers who have used no-till limits the ability to analyse stated reasons for non-adoption in each region. Only the four regions with the lowest level of adoption are shown (NSW Mallee is excluded due to a low number of observations).
The most common reasons cited for non-adoption fall into the non-specific category of ‘lack of observed benefits’. This includes responses such as ‘doesn’t suit my farm’ and ‘happy with current method’. Other reasons cited included machinery constraints and weed control (including herbicide) concerns, particularly in SA Mallee and SA Western EP.
4.7 Perceived effects of no-till and stubble retention
All respondents were asked to consider a range of cropping-related factors and rate how they thought the long-term effects of no-till seeding with stubble retention would compare to the long-term effects of cultivation and full-cut seeding without stubble retention. The proportion of growers stating more (the sum of ‘a little more’ and ‘a lot more’) or less (the sum of ‘a little less’ and ‘a lot less’) for a range of agronomic factors are shown in Tables 20-23, with the balance of growers stating ‘no-difference’.
In most regions 40 to 50 per cent of growers expected the no-till scenario to lead to more crop disease. Although not specified, disease was considered inclusive of root, stem and/or foliar diseases (Table 20). The northern cropping zone regions of NSW Northern and Queensland Southern were
Table 17 Reasons cited for adopting no-till (% of cited reasons)
QLD Southern
NSW Central West
NSW Mallee
NSW Northern
NSW Southern
Fuel and labour costs
21 35 30 20 43
Soil conservation
22 19 50 22 19
Soil moisture management
41 11 10 33 15
Soil structure 5 11 - 9 11
Information and observed beneits
3 11 - 3 5
Weed control and herbicide use
5 5 - 2 1
Improved crop yields
2 3 10 7 3
Cropping frequency / timeliness
2 2 - 2 2
Seeding accuracy
1 2 - 2 1
SA CentralSA Lower
EPSA Mallee
SA Upper EP
SA Western
EP
Fuel and labour costs
28 32 32 30 35
Soil conservation
31 28 39 38 24
Soil moisture management
14 12 10 11 17
Soil structure 9 7 4 4 12
Information and observed beneits
5 4 7 3 3
Weed control and herbicide use
3 5 2 3 2
Improved crop yields
4 1 3 1 1
Cropping frequency / timeliness
4 9 3 3 1
Seeding accuracy
2 3 1 5 2
Table 18 Reasons cited for adopting no-till (% of cited reasons) (continued)
WACentral / Eastern
WA Midlands
WA Northern
WA SE Central
WA Upper Great
Southern
Fuel and labour costs
32 40 24 35 35
Soil conservation 26 23 38 25 18
Soil moisture management
26 13 11 23 12
Soil structure 6 4 4 - 9
Information and observed beneits
5 2 - 4 5
Weed control and herbicide costs
9 2 4 5 5
Improved crop yields
1 2 4 4 5
Cropping frequency / timeliness
- 9 7 5 5
Seeding accuracy
2 6 7 - 7
WA Western Central
Vic Loddon
Vic MalleeVic
Wimmera
Fuel and labour costs
29 38 33 41
Soil conservation 12 24 32 27
Soil moisture management
14 17 12 19
Soil structure 12 12 5 3
Information and observed beneits
8 3 6 4
Weed control and herbicide costs
8 2 7 2
Improved crop yields
2 1 2 1
Cropping frequency / timeliness
6 1 3 3
Seeding accuracy
8 2 2 -

GRDC | 20 | ADOPTION OF NO-TILL CROPPING PRACTICES IN AUSTRALIAN GRAIN GROWING REGIONS
higher, with greater than 60 per cent of growers expecting more disease.
A high proportion of all growers expected the no-till scenario to result in greater soil moisture retention, though NSW Central West and Vic Mallee had notably lower proportions than other regions (Table 20). Overall, a vast majority of growers also expected the no-till systems to result in less soil erosion. The proportion was below 70 per cent in NSW Central West, SA Upper EP, SA Western EP and WA Upper Great Southern.
The proportion of growers expecting the no-till with stubble retention scenario to lead to higher average wheat yields over the longer term varied greatly between regions (Table 21). In Queensland Southern and WA Western Central, 72 per cent of growers expected higher yields. In the lower rainfall regions of NSW Central West, SA Mallee, SA Upper EP and SA Western EP, less than 40 per cent expected higher yields.
A minority of growers expected fertiliser costs to be higher under the no-till and stubble retention system,
Table 19 Reasons for non-adoption cited by those who have not used no-till (% of cited reasons). Only regions with ≤75% having used no-till included. NSW Mallee also excluded due to low observations.
NSW Central West
SA MalleeSA Western
EPVic Mallee
Lack of observed beneits
56 39 43 47
Machinery constraints
16 18 14 18
Weed control 6 27 19 6
Fuel and labour costs
6 6 14 9
Soil moisture management
6 3 - 12
Soil structure 6 - 5 3
Soil conservation
3 3 - -
Diseases - 3 5 3
Table 20 Perceived influence of long-term no-till with stubble retention relative to multiple cultivations and no stubble retention on crop disease, moisture retention and soil erosion
Crop diseaseMoisture retention
Soil erosion
Less More Less More Less More
NSW Central West 21 58 17 67 63 10
NSW Mallee 18 55 18 55 55 0
NSW Northern 10 68 4 86 76 10
NSW Southern 12 47 7 82 82 7
NSW All 14 59 9 79 74 9
QLD Southern 7 63 3 86 74 7
SA Central 20 52 2 90 72 10
SA Lower EP 24 30 8 84 78 10
SA Mallee 22 41 2 77 80 4
SA Upper EP 21 41 9 75 66 14
SA Western EP 25 43 10 68 68 15
SA All 22 42 5 79 74 10
VIC Loddon 12 45 6 80 65 14
VIC Mallee 15 51 9 66 91 4
VIC Wimmera 11 43 9 76 70 4
VIC All 13 47 8 74 76 7
WA Central Eastern 11 45 0 89 80 4
WA Midlands 12 41 6 82 74 9
WA Northern 11 44 0 89 92 0
WA SE Central 9 50 6 76 77 3
WA Upper Great Sthn 14 49 8 84 65 19
WA Western Central 10 45 0 100 90 3
WA All 11 46 3 87 78 7
Table 21 Perceived influence of long-term no-till with stubble retention relative to multiple cultivations and no stubble retention on fuel costs, long-term wheat yields, reliability of wheat yields, fertiliser costs
Fuel costsLong-term
wheat yieldsReliability of wheat yields
Fertiliser costs
Less More Less More Less More Less More
NSW Central West
78 7 19 38 15 33 28 22
NSW Mallee 73 9 9 55 18 36 27 18
NSW Northern 80 16 5 64 7 66 16 33
NSW Southern 87 8 4 54 4 43 23 18
NSW All 81 12 9 55 9 51 22 26
QLD Southern 78 10 5 72 6 75 9 38
SA Central 83 7 2 62 2 50 18 25
SA Lower EP 76 16 6 62 2 62 20 32
SA Mallee 80 7 11 36 10 33 13 43
SA Upper EP 71 11 7 36 9 34 5 30
SA Western EP 70 13 10 38 13 40 10 22
SA All 77 10 7 46 7 43 14 32
VIC Loddon 70 18 3 53 11 38 18 32
VIC Mallee 83 10 6 45 10 36 15 31
VIC Wimmera 84 7 3 41 10 30 19 27
VIC All 79 12 4 46 10 35 17 30
WA Central Eastern
74 6 0 47 9 47 12 27
WA Midlands 74 6 3 62 6 65 12 24
WA Northern 85 4 4 44 4 44 8 24
WA SE Central 76 6 15 50 3 53 5 36
WA Upper Great Sthn
73 5 5 51 11 46 16 32
WA Western Central
76 10 0 72 0 72 28 14
WA All 76 7 4 54 6 54 15 25
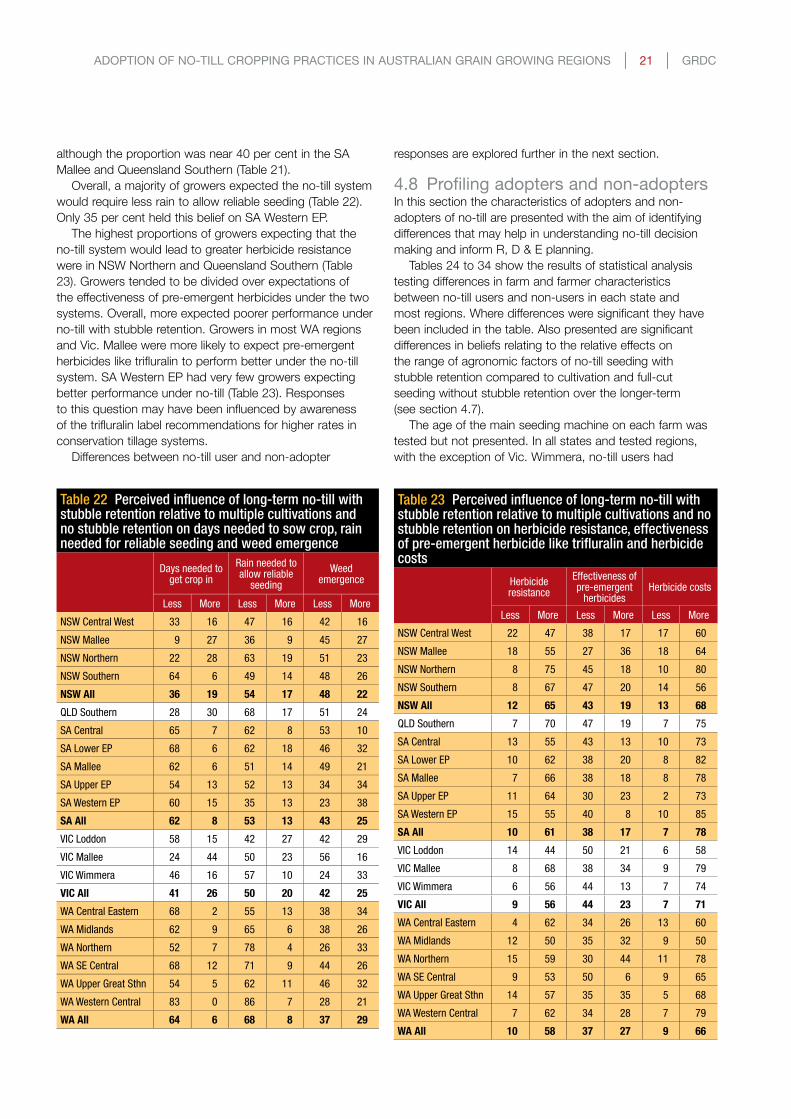
ADOPTION OF NO-TILL CROPPING PRACTICES IN AUSTRALIAN GRAIN GROWING REGIONS | 21 | GRDC
although the proportion was near 40 per cent in the SA Mallee and Queensland Southern (Table 21).
Overall, a majority of growers expected the no-till system would require less rain to allow reliable seeding (Table 22). Only 35 per cent held this belief on SA Western EP.
The highest proportions of growers expecting that the no-till system would lead to greater herbicide resistance were in NSW Northern and Queensland Southern (Table 23). Growers tended to be divided over expectations of the effectiveness of pre-emergent herbicides under the two systems. Overall, more expected poorer performance under no-till with stubble retention. Growers in most WA regions and Vic. Mallee were more likely to expect pre-emergent herbicides like trifluralin to perform better under the no-till system. SA Western EP had very few growers expecting better performance under no-till (Table 23). Responses to this question may have been influenced by awareness of the trifluralin label recommendations for higher rates in conservation tillage systems.
Differences between no-till user and non-adopter
responses are explored further in the next section.
4.8 Profiling adopters and non-adoptersIn this section the characteristics of adopters and non-adopters of no-till are presented with the aim of identifying differences that may help in understanding no-till decision making and inform R, D & E planning.
Tables 24 to 34 show the results of statistical analysis testing differences in farm and farmer characteristics between no-till users and non-users in each state and most regions. Where differences were significant they have been included in the table. Also presented are significant differences in beliefs relating to the relative effects on the range of agronomic factors of no-till seeding with stubble retention compared to cultivation and full-cut seeding without stubble retention over the longer-term (see section 4.7).
The age of the main seeding machine on each farm was tested but not presented. In all states and tested regions, with the exception of Vic. Wimmera, no-till users had
Table 22 Perceived influence of long-term no-till with stubble retention relative to multiple cultivations and no stubble retention on days needed to sow crop, rain needed for reliable seeding and weed emergence
Days needed to get crop in
Rain needed to allow reliable
seeding
Weed emergence
Less More Less More Less More
NSW Central West 33 16 47 16 42 16
NSW Mallee 9 27 36 9 45 27
NSW Northern 22 28 63 19 51 23
NSW Southern 64 6 49 14 48 26
NSW All 36 19 54 17 48 22
QLD Southern 28 30 68 17 51 24
SA Central 65 7 62 8 53 10
SA Lower EP 68 6 62 18 46 32
SA Mallee 62 6 51 14 49 21
SA Upper EP 54 13 52 13 34 34
SA Western EP 60 15 35 13 23 38
SA All 62 8 53 13 43 25
VIC Loddon 58 15 42 27 42 29
VIC Mallee 24 44 50 23 56 16
VIC Wimmera 46 16 57 10 24 33
VIC All 41 26 50 20 42 25
WA Central Eastern 68 2 55 13 38 34
WA Midlands 62 9 65 6 38 26
WA Northern 52 7 78 4 26 33
WA SE Central 68 12 71 9 44 26
WA Upper Great Sthn 54 5 62 11 46 32
WA Western Central 83 0 86 7 28 21
WA All 64 6 68 8 37 29
Table 23 Perceived influence of long-term no-till with stubble retention relative to multiple cultivations and no stubble retention on herbicide resistance, effectiveness of pre-emergent herbicide like trifluralin and herbicide costs
Herbicide resistance
Effectiveness of pre-emergent
herbicidesHerbicide costs
Less More Less More Less More
NSW Central West 22 47 38 17 17 60
NSW Mallee 18 55 27 36 18 64
NSW Northern 8 75 45 18 10 80
NSW Southern 8 67 47 20 14 56
NSW All 12 65 43 19 13 68
QLD Southern 7 70 47 19 7 75
SA Central 13 55 43 13 10 73
SA Lower EP 10 62 38 20 8 82
SA Mallee 7 66 38 18 8 78
SA Upper EP 11 64 30 23 2 73
SA Western EP 15 55 40 8 10 85
SA All 10 61 38 17 7 78
VIC Loddon 14 44 50 21 6 58
VIC Mallee 8 68 38 34 9 79
VIC Wimmera 6 56 44 13 7 74
VIC All 9 56 44 23 7 71
WA Central Eastern 4 62 34 26 13 60
WA Midlands 12 50 35 32 9 50
WA Northern 15 59 30 44 11 78
WA SE Central 9 53 50 6 9 65
WA Upper Great Sthn 14 57 35 35 5 68
WA Western Central 7 62 34 28 7 79
WA All 10 58 37 27 9 66
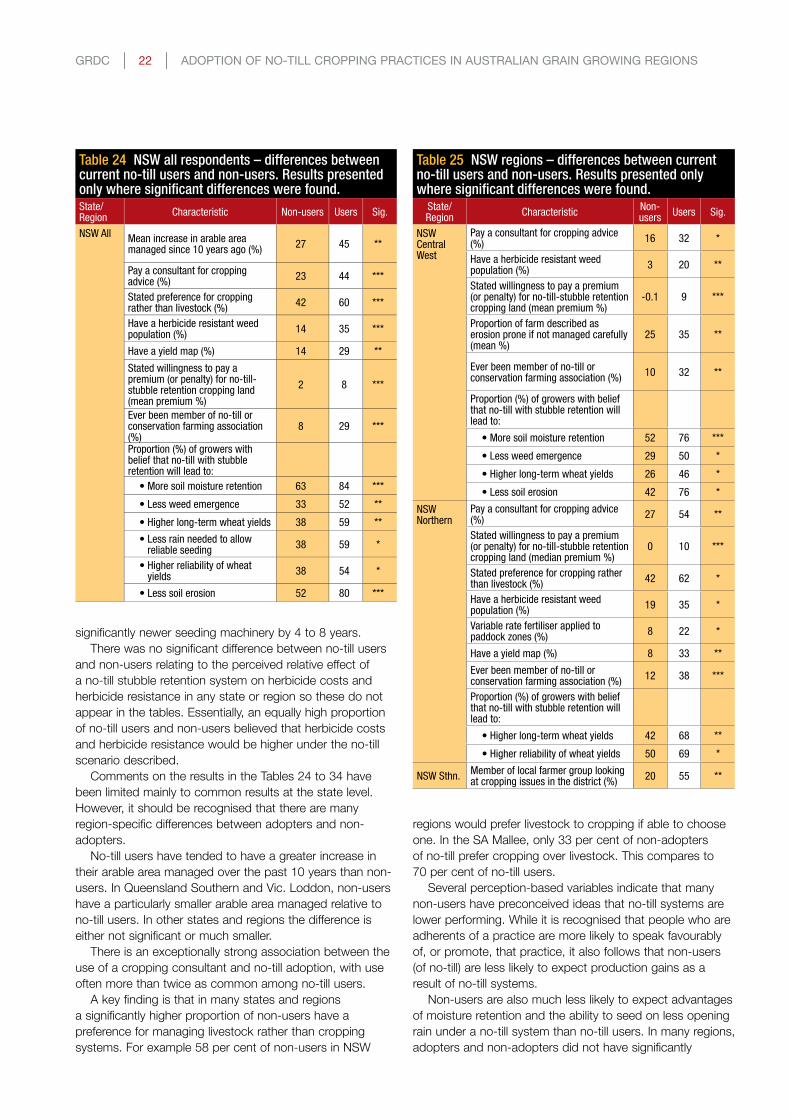
GRDC | 22 | ADOPTION OF NO-TILL CROPPING PRACTICES IN AUSTRALIAN GRAIN GROWING REGIONS
significantly newer seeding machinery by 4 to 8 years. There was no significant difference between no-till users
and non-users relating to the perceived relative effect of a no-till stubble retention system on herbicide costs and herbicide resistance in any state or region so these do not appear in the tables. Essentially, an equally high proportion of no-till users and non-users believed that herbicide costs and herbicide resistance would be higher under the no-till scenario described.
Comments on the results in the Tables 24 to 34 have been limited mainly to common results at the state level. However, it should be recognised that there are many region-specific differences between adopters and non-adopters.
No-till users have tended to have a greater increase in their arable area managed over the past 10 years than non-users. In Queensland Southern and Vic. loddon, non-users have a particularly smaller arable area managed relative to no-till users. In other states and regions the difference is either not significant or much smaller.
There is an exceptionally strong association between the use of a cropping consultant and no-till adoption, with use often more than twice as common among no-till users.
A key finding is that in many states and regions a significantly higher proportion of non-users have a preference for managing livestock rather than cropping systems. For example 58 per cent of non-users in NSW
regions would prefer livestock to cropping if able to choose one. In the SA Mallee, only 33 per cent of non-adopters of no-till prefer cropping over livestock. This compares to 70 per cent of no-till users.
Several perception-based variables indicate that many non-users have preconceived ideas that no-till systems are lower performing. While it is recognised that people who are adherents of a practice are more likely to speak favourably of, or promote, that practice, it also follows that non-users (of no-till) are less likely to expect production gains as a result of no-till systems.
Non-users are also much less likely to expect advantages of moisture retention and the ability to seed on less opening rain under a no-till system than no-till users. In many regions, adopters and non-adopters did not have significantly
Table 24 NSW all respondents – differences between current no-till users and non-users. Results presented only where significant differences were found.State/ Region
Characteristic Non-users Users Sig.
NSW AllMean increase in arable area managed since 10 years ago (%)
27 45 **
Pay a consultant for cropping advice (%)
23 44 ***
Stated preference for cropping rather than livestock (%)
42 60 ***
Have a herbicide resistant weed population (%)
14 35 ***
Have a yield map (%) 14 29 **
Stated willingness to pay a premium (or penalty) for no-till-stubble retention cropping land (mean premium %)
2 8 ***
Ever been member of no-till or conservation farming association (%)
8 29 ***
Proportion (%) of growers with belief that no-till with stubble retention will lead to:
•Moresoilmoistureretention 63 84 ***
•Lessweedemergence 33 52 **
•Higherlong-termwheatyields 38 59 **
•Lessrainneededtoallowreliable seeding
38 59 *
•Higherreliabilityofwheatyields
38 54 *
•Lesssoilerosion 52 80 ***
Table 25 NSW regions – differences between current no-till users and non-users. Results presented only where significant differences were found.
State/ Region
CharacteristicNon-users
Users Sig.
NSW Central West
Pay a consultant for cropping advice (%)
16 32 *
Have a herbicide resistant weed population (%)
3 20 **
Stated willingness to pay a premium (or penalty) for no-till-stubble retention cropping land (mean premium %)
-0.1 9 ***
Proportion of farm described as erosion prone if not managed carefully (mean %)
25 35 **
Ever been member of no-till or conservation farming association (%)
10 32 **
Proportion (%) of growers with belief that no-till with stubble retention will lead to:
•Moresoilmoistureretention 52 76 ***
•Lessweedemergence 29 50 *
•Higherlong-termwheatyields 26 46 *
•Lesssoilerosion 42 76 *
NSW Northern
Pay a consultant for cropping advice (%)
27 54 **
Stated willingness to pay a premium (or penalty) for no-till-stubble retention cropping land (median premium %)
0 10 ***
Stated preference for cropping rather than livestock (%)
42 62 *
Have a herbicide resistant weed population (%)
19 35 *
Variable rate fertiliser applied to paddock zones (%)
8 22 *
Have a yield map (%) 8 33 **
Ever been member of no-till or conservation farming association (%)
12 38 ***
Proportion (%) of growers with belief that no-till with stubble retention will lead to:
•Higherlong-termwheatyields 42 68 **
•Higherreliabilityofwheatyields 50 69 *
NSW Sthn.Member of local farmer group looking at cropping issues in the district (%)
20 55 **

ADOPTION OF NO-TILL CROPPING PRACTICES IN AUSTRALIAN GRAIN GROWING REGIONS | 23 | GRDC
different perceptions of the ability of the no-till with stubble retention system to reduce soil erosion. However, in NSW Central West, SA Mallee and VIC Wimmera, a substantial proportion of non-users expressed the belief that no-till with stubble retention would not lead to less erosion than a system with multiple cultivations and stubble burnt over the longer term.
While users and non-users generally did not have differences in beliefs about the likelihood of herbicide resistance or higher herbicide costs, overall, it was more common for no-till users to expect less weed emergence under no-till with stubble retention systems. SA Western EP was the only region where non-users were much more likely than users to expect pre-emergent herbicides to be less effective under no-till and stubble retention.
As expected, joining a no-till or conservation farming group is widely and very strongly associated with no-till adoption.
Table 26 QLD region – differences between current no-till users and non-users. Results presented only where significant differences were found.
State/Region
CharacteristicNon-users
Users Sig.
QLD (Southern)
Arable area managed (ha) 1047 2025 ***
Pay a consultant for cropping advice (%)
23 41 **
Stated willingness to pay a premium for no-till-stubble retention cropping land (mean %)
3 11 ***
Proportion of farm described as erosion prone if not managed carefully (mean %)
22 41 **
Proportion (%) of growers with belief that no-till with stubble retention will lead to:
•Moresoilmoistureretention 74 91 ***
•Lessweedemergence 29 60 ***
•Higherlong-termwheatyields 49 81 ***
•Lessrainneededtoallowreliableseeding
51 75 **
•Higherreliabilityofwheatyields 54 83 ***
•Lowerfuelcosts 63 84 **
Table 27 SA all respondents – differences between current no-till users and non-users. Results presented only where significant differences were found.
State/ Region
CharacteristicNon-users
Users Sig.
SA All Mean increase in arable area managed since 10 years ago (%)
21 43 ***
Member of local farmer group looking at cropping issues in the district (%)
45 63 ***
Pay a consultant for cropping advice (%)
20 46 ***
Higher education (%) 7 26 ***
Stated preference for cropping rather than livestock (%)
49 72 ***
Average proportion of arable land cropped over past 3 years (%)
61 73 ***
Have a herbicide resistant weed population (%)
25 49 ***
Stated willingness to pay a premium (or penalty) for no-till-stubble retention cropping land (median premium %)
2 7 **
Proportion of farm described as erosion prone if not managed carefully (mean %)
31 47 ***
Number of sheep (mean) 1406 999 *
Ever been member of no-till or conservation farming association (%)
6 37 ***
Proportion (%) of growers with belief that no-till with stubble retention will lead to:
•Moresoilmoistureretention 56 86 ***
•Lessweedemergence 29 60 ***
•Higherlong-termwheatyields 25 52 ***
•Lessrainneededtoallowreliableseeding
32 60 ***
•Higherreliabilityofwheatyields 21 49 ***
•Lessdaystogetthecropin 42 68 ***
•Lowerfuelcosts 58 83 ***
•Higherfertilisercosts 42 29 *
•Lesssoilerosion 55 80 ***

GRDC | 24 | ADOPTION OF NO-TILL CROPPING PRACTICES IN AUSTRALIAN GRAIN GROWING REGIONS
Table 28 SA Mallee – differences between current no-till users and non-users. Results presented only where significant differences were found.
State/ Region
CharacteristicNon-users
Users Sig.
SA Mallee
Mean increase in arable area managed since 10 years ago (%)
22 41 *
Member of local farmer group looking at cropping issues in the district (%)
37 67 ***
Pay a consultant for cropping advice (%)
4 32 ***
Higher education (%) 11 29 *
Stated preference for cropping rather than livestock (%)
33 70 ***
Average proportion of arable land cropped over past 3 years (%)
50 60 **
Have a yield map (%) 4 23 *
Stated willingness to pay a premium (or penalty) for no-till-stubble retention cropping land (mean premium %)
1 9 ***
Ever been member of no-till or conservation farming association (%)
11 38 ***
Proportion (%) of growers with belief that no-till with stubble retention will lead to:
•Moresoilmoistureretention 56 86 ***
•Lowerfuelcosts 59 89 ***
•Lessrainneededtoallowreliableseeding
33 59 *
•Higherreliabilityofwheatyields 7 44 ***
•Lessdaystogetthecropin 37 73 ***
•Lesssoilerosion 59 94 ***
Table 29 SA Central and Western EP regions – differences between current no-till users and non-users. Results presented only where significant differences were found.
State/ Region
CharacteristicNon-users
Users Sig.
SA Central Arable area managed (ha) 1100 1519 *
Pay a consultant for cropping advice (%)
22 61 **
Higher education (%) 0 30 *
Stated preference for cropping rather than livestock (%)
33 73 **
Have a herbicide resistant weed population (%)
22 76 ***
Ever been member of no-till or conservation farming association (%)
0 29 *
Proportion (%) of growers with belief that no-till with stubble retention will lead to:
•Moresoilmoistureretention 67 94 **
•Higherlongtermwheatyields 22 69 **
•Higherreliabilityofwheatyields 22 55 *
•Lessrainneededtoallowreliableseeding
33 67 *
SA Western EP
Higher education (%) 6 41 **
Average proportion of arable land cropped over past 3 years (%)
57 73 **
Stated willingness to pay a premium (or penalty) for no-till-stubble retention cropping land (mean premium %)
0 4 **
Number of sheep (mean) 2372 1342 **
Ever been member of no-till or conservation farming association (%)
0 32 ***
Proportion (%) of growers with belief that no-till with stubble retention will lead to:
•Lowereffectivenessofpre-emergent herbicides
56 27 *
•Lessrainneededtoallowreliableseeding
17 50 **
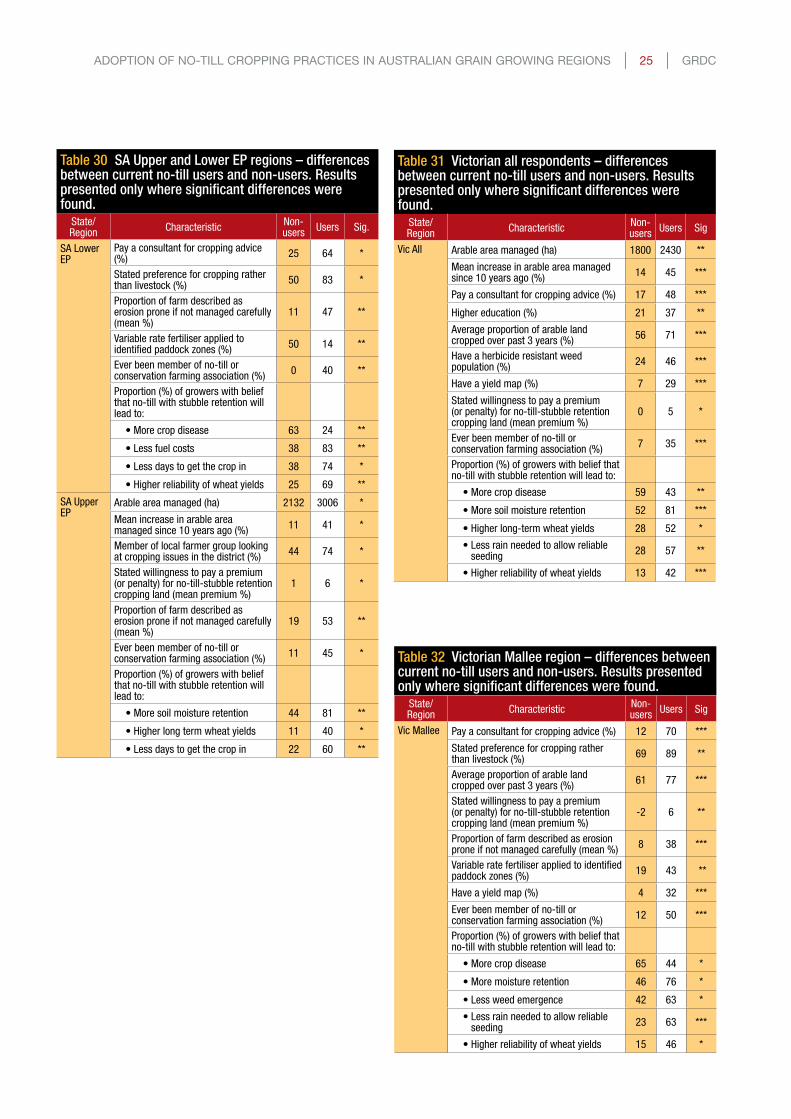
ADOPTION OF NO-TILL CROPPING PRACTICES IN AUSTRALIAN GRAIN GROWING REGIONS | 25 | GRDC
Table 30 SA Upper and Lower EP regions – differences between current no-till users and non-users. Results presented only where significant differences were found.
State/ Region
CharacteristicNon-users
Users Sig.
SA Lower EP
Pay a consultant for cropping advice (%)
25 64 *
Stated preference for cropping rather than livestock (%)
50 83 *
Proportion of farm described as erosion prone if not managed carefully (mean %)
11 47 **
Variable rate fertiliser applied to identiied paddock zones (%)
50 14 **
Ever been member of no-till or conservation farming association (%)
0 40 **
Proportion (%) of growers with belief that no-till with stubble retention will lead to:
•Morecropdisease 63 24 **
•Lessfuelcosts 38 83 **
•Lessdaystogetthecropin 38 74 *
•Higherreliabilityofwheatyields 25 69 **
SA Upper EP
Arable area managed (ha) 2132 3006 *
Mean increase in arable area managed since 10 years ago (%)
11 41 *
Member of local farmer group looking at cropping issues in the district (%)
44 74 *
Stated willingness to pay a premium (or penalty) for no-till-stubble retention cropping land (mean premium %)
1 6 *
Proportion of farm described as erosion prone if not managed carefully (mean %)
19 53 **
Ever been member of no-till or conservation farming association (%)
11 45 *
Proportion (%) of growers with belief that no-till with stubble retention will lead to:
•Moresoilmoistureretention 44 81 **
•Higherlongtermwheatyields 11 40 *
•Lessdaystogetthecropin 22 60 **
Table 31 Victorian all respondents – differences between current no-till users and non-users. Results presented only where significant differences were found.
State/ Region
CharacteristicNon-users
Users Sig
Vic All Arable area managed (ha) 1800 2430 **
Mean increase in arable area managed since 10 years ago (%)
14 45 ***
Pay a consultant for cropping advice (%) 17 48 ***
Higher education (%) 21 37 **
Average proportion of arable land cropped over past 3 years (%)
56 71 ***
Have a herbicide resistant weed population (%)
24 46 ***
Have a yield map (%) 7 29 ***
Stated willingness to pay a premium (or penalty) for no-till-stubble retention cropping land (mean premium %)
0 5 *
Ever been member of no-till or conservation farming association (%)
7 35 ***
Proportion (%) of growers with belief that no-till with stubble retention will lead to:
•Morecropdisease 59 43 **
•Moresoilmoistureretention 52 81 ***
•Higherlong-termwheatyields 28 52 *
•Lessrainneededtoallowreliableseeding
28 57 **
•Higherreliabilityofwheatyields 13 42 ***
Table 32 Victorian Mallee region – differences between current no-till users and non-users. Results presented only where significant differences were found.
State/ Region
CharacteristicNon-users
Users Sig
Vic Mallee Pay a consultant for cropping advice (%) 12 70 ***
Stated preference for cropping rather than livestock (%)
69 89 **
Average proportion of arable land cropped over past 3 years (%)
61 77 ***
Stated willingness to pay a premium (or penalty) for no-till-stubble retention cropping land (mean premium %)
-2 6 **
Proportion of farm described as erosion prone if not managed carefully (mean %)
8 38 ***
Variable rate fertiliser applied to identiied paddock zones (%)
19 43 **
Have a yield map (%) 4 32 ***
Ever been member of no-till or conservation farming association (%)
12 50 ***
Proportion (%) of growers with belief that no-till with stubble retention will lead to:
•Morecropdisease 65 44 *
•Moremoistureretention 46 76 *
•Lessweedemergence 42 63 *
•Lessrainneededtoallowreliableseeding
23 63 ***
•Higherreliabilityofwheatyields 15 46 *

GRDC | 26 | ADOPTION OF NO-TILL CROPPING PRACTICES IN AUSTRALIAN GRAIN GROWING REGIONS
Table 34 WA regions all respondents – differences between current no-till users and non-users. Results presented only where significant differences were found.
State/ Region
CharacteristicNon-users
Users Sig
WA All Pay a consultant for cropping advice (%) 29 49 *
Higher education (%) 17 36 **
Stated preference for cropping rather than livestock (%)
50 78 ***
Average proportion of arable land cropped over past 3 years (%)
50 61 ***
Number of sheep (mean) 5025 3142 *
Ever been member of no-till or conservation farming association (%)
4 41 ***
Proportion (%) of growers with belief that no-till with stubble retention will lead to:
•Moremoistureretention 54 91 ***
•Moreweedemergence 17 31 *
•Lowerfuelcosts 46 80 **
•Higherlong-termwheatyields 17 59 ***
•Lessrainneededtoallowreliableseeding
42 71 *
•Higherreliabilityofwheatyields 13 59 ***
WA Central Pay a consultant for cropping advice (%) 8 50 ***
Higher education (%) 8 31 *
Stated preference for cropping rather than livestock (%)
54 85 **
Stated willingness to pay a premium (or penalty) for no-till-stubble retention cropping land (mean premium %)
1 6 *
Ever been member of no-till or conservation farming association (%)
8 43 **
Proportion (%) of growers with belief that no-till with stubble retention will lead to:
•Moremoistureretention 46 91 ***
•Lessfuelcosts 46 81 **
•Higherlong-termwheatyields 8 56 ***
•Lessrainneededtoallowreliableseeding
38 66 *
•Higherreliabilityofwheatyields 8 57 ***
Table 33 Victorian Loddon and Wimmera regions – differences between current no-till users and non-users. Results presented only where significant differences were found.
State/ Region
CharacteristicNon-users
Users Sig
Vic Loddon Arable area managed (ha) 1117 2167 **
Mean increase in arable area managed since 10 years ago (%)
9 58 *
Pay a consultant for cropping advice (%) 7 35 **
Have a herbicide resistant weed population (%)
13 41 **
Proportion (%) of growers with belief that no-till with stubble retention will lead to:
•Morecropdisease 67 39 *
•Higherreliabilityofwheatyields 20 43 *
Vic Wimmera
Mean increase in arable area managed since 10 years ago (%)
4 33 ***
Member of local farmer group looking at cropping issues in the district (%)
38 67 *
Higher education (%) 8 39 **
Ave. proportion of arable land cropped past 3yrs (%)
44 77 ***
Ever been member of no-till or conservation farming association (%)
0 33 **
Belief that no-till with stubble retention will lead to:
•Lessfuelcosts 62 89 **
•Lowereffectivenessofpre-emergentherbicides
23 49 *
•Higherlong-termwheatyields 8 49 ***
•Lessrainneededtoallowreliableseeding
23 65 ***
•Higherreliabilityofwheatyields 0 37 ***
•Lesssoilerosion 31 79 **

ADOPTION OF NO-TILL CROPPING PRACTICES IN AUSTRALIAN GRAIN GROWING REGIONS | 27 | GRDC
4.9 Identifying significant drivers of adoptionIn the previous section differences between adopters and non-adopters were presented as a number of variables. In this section a range of variables are used together in regression-based analyses to identify the variables that most significantly explain no-till adoption and extent of use. This process is aimed at better understanding the drivers of changes in adoption and extensive no-till use.
The results of these regression analyses help to identify the perceptions and other variables that may have a significant influence on adoption if they were to change. Also, variables identified as not being significantly associated with adoption may be less important when targeting extension activity. For example, in the previous section a number of differences in perceptions about no-till between adopters and non-adopters have been identified. Some of these perceptions may be both more influential in the adoption decision and more able to be influenced through learning than others. Therefore, they may be more effective targets for extension activities.
The results in Table 35 show the factors significantly explaining whether growers in lower-adopting regions (where less than 75 per cent of respondents are using no-till, that is SA Mallee, SA Western EP, Vic. Mallee, NSW Central West) are using at least some no till (some crop area sown to no-till in 2008) and the factors significantly explaining whether growers are using no-till extensively on their farm (using no-till to establish at least 90 per cent of the 2008 crop area). As a vast majority of respondents across all regions have already adopted at least some no-till, only an analysis of extensive no-till use has been conducted across all regions. It should be noted that the factors that led to the decision to first try no-till are not always expected to be the same as the factors associated with the subsequent decision to extensively use no-till. A range of regression methods have been used. Only logit results are presented in this report.
Factors significantly associated with use
Predictable factors consistently associated with no-till use in the lower-adopting regions and extensive use regions include newer seeding machinery and higher proportion of land cropped (Table 35). Use of a consultant is highly significant in each case. In lower adopting regions, higher education is significantly associated with no-till use and extensive use (it is also significantly associated with the decision to use some no-till across all regions (data not presented)).
Perceptions of most consistent influence are perceptions of greater soil moisture retention under no-till with stubble retention compared to a cultivation-based system with no stubble retention (Table 35). The results suggest that positive shifts in this perception are associated with more extensive no-till use. Negative perceptions of crop disease and long-term reliability of wheat yields under a no-till system are also
shown to be significantly associated with less extensive no-till use. Perceptions of reduced pre-emergent herbicide effectiveness and a perceived lack of reduction in the amount of rainfall needed to allow for reliable seeding were shown to be influential constraints to extensive no-till use across the full sample.
Although not shown in Table 35, it is worth noting that with the other variables considered, WA growers still have a significantly (P<0.001) higher likelihood of extensive use than growers in the other states. This indicates that there are other positive factors leading to higher extensive use in WA that are not being captured by the included variables.
Factors not associated with use
Factors shown to have no influence included the proportion of the farm deemed to be erosion-prone if not carefully managed. The perception that a no-till system with stubble retention will reduce soil erosion risk compared to a cultivation-based system with no stubble retention was also not significant. Extension targeting these perceptions is unlikely to be able to significantly influence no-till use. However, it is worth noting that there is evidence that the relatively small subset of growers who do not expect to be using any no-till in five-years time are much more likely to perceive that a no-till system does not offer erosion benefits and this is significantly associated with no expected use in five-years time (data not presented).
Membership of a no-till farming association could not be included in the models for statistical reasons because almost all no-till association members are no-till users. Membership of local farming groups looking at cropping issues was not significant. The greater amount of time a farmer observes no-till being used in their district positively influences the decision to first try no-till but has no significant effect on the decision to use no-till extensively on the farm.

GRDC | 28 | ADOPTION OF NO-TILL CROPPING PRACTICES IN AUSTRALIAN GRAIN GROWING REGIONS
Table 35 Variables shown to be significantlya associated with no-till adoption, extensive use of no-till (≥90% cropped using no-till) and stated expectation of use in 5 years time based on logit regression analyses using all respondents (n=1020) and respondents from lower adopting regions (n= 258)b
Variable All regions Lower-adopting regions
Extensive use Extensive use Use
Arable area managed +* ns ns
Average annual rainfall ns ns +*
Average proportion cropped +*** +** +*
Age of current seeding machine -*** -*** -***
Proportion of soil on farm described as prone to erosion
ns ns ns
Pay a consultant for cropping advice +*** +** +***
Higher education ns +** +**
Member of local farmer group ns ns ns
Years since aware of local no-till use ns ns +**
Belief that no-till system will:
•Increasemoistureretention +*** +*** +*
•Reducepre-emergentherbicideeffectiveness
-*** ns ns
•Reducefuelcosts ns ns ns
•Reducelong-termwheatyieldreliability
-*** -** ns
•Reducerainneededforreliableseeding
+** ns ns
•Increasecropdisease -*** -** ns
•Reducedaysneededtogetcropin ns ns ns
•Reducesoilerosion ns ns ns
Correct classiications (%):
All 74 80 80
Adopters/Non-adopters 72/75 66/87 91/51
NB: Not all variables discussed in previous sections were included in regression analyses. a * P<0.1; **P<0.05; ***P<0.01; ns: not signiicant. All models are signiicant P<0.001. b SA Mallee, SA Western EP, Vic. Mallee, NSW Central West+/- symbols indicate the direction of inluence.

ADOPTION OF NO-TILL CROPPING PRACTICES IN AUSTRALIAN GRAIN GROWING REGIONS | 29 | GRDC
5.1 Current use and trendsThe current status and trends relating to adoption of no-till seeding systems across Australian broadacre grain growing regions have been analysed using data from a survey of 1172 grain growers.
The results show that no-till seeding practices have now been adopted by the majority of grain growers across all regions. The proportion of growers using at least some no-till is now peaking at levels around 90 per cent in many regions. In regions with relatively low adoption five years ago, there have been very rapid increases in adoption, particularly in the period 2003–06. This result is consistent with the surge in adoption forecast in the 2003 survey (D’Emden and llewellyn 2006).
Many of the very large relative differences in adoption between states and regions that were clearly evident in 1998 have now closed substantially and are expected to close further over the next five years. Although some key regions appear likely to peak at a lower level of adoption, it is now clear that for most regions the large differences in adoption 10 years ago were reflecting time lags in the extension of no-till more so than major differences in the likely final proportion of growers using no-till.
In general, relatively few growers appear to have made the decision to crop without adopting no-till in the near future. The proportion of growers using no-till is expected to exceed 80 per cent in a majority of regions by 2013. However it should be noted that there are key regions where peak adoption and extent of use by adopters is likely to remain considerably lower than average.
The use of disc openers remains relatively low, with the exception of the northern cropping region of NSW and Queensland.
Importantly, there has been very little evidence of disadoption of no-till over the past five years. That is, very few growers who have used at least some no-till have decided to no longer use no-till. This includes regions where no-till has been an extensive practice over a longer-term, for example several WA regions. Substantial net gains in no-till adoption have been observed and further net increases are expected in the future, except where no-till adoption is already reaching a plateau as it approaches full potential adoption. It needs to be noted however that the severe drought conditions appears to have affected the certainty of responses about future plans in several regions.
Because a majority of growers in most districts still use some tillage, it should be expected that economic and agri-environmental factors may cause seasonal shifts in extent of tillage use. Just as glyphosate price falls led to increased no-till adoption (D’Emden et al 2006), growers in this study have indicated that recent glyphosate price rises have led to increased use of tillage in many regions. In regions such as those in WA where it is more common that 100 per cent of crop area is sown no-till, the glyphosate price rise has had
little or no reported influence on tillage use. For no-till practices to be widespread in the landscape,
there needs to be both high adoption rates and extensive use by adopters. The results show that it remains common for no-till adopters in most regions to still use some cultivation. However, the extent of no-till use by no-till adopters is typically high. The average percentage of crop sown using no-till by no-till adopters exceeds 70 per cent in all regions.
It should be noted that relatively low adoption rates together with relatively low extent of use mean that substantial crop areas are still being cultivated in some key erosion-prone regions. The results indicate that substantial areas will still be cultivated in five years’ time in these regions. While the proportion of growers using some no-till will generally be high, very large differences in the proportion of growers using only no-till will exist between regions.
5.2 Farm and farmer characteristics associated with no-till adoption statusThis study has elicited a wide range of factors that can be associated with no-till use or non-adoption. These include attitudinal variables, perceptions of specific effects, other responses to hypothetical scenarios and open-ended responses on the reasons for current adoption/non-adoption. Profiling adopter and non-adopters in this way is aimed at better understanding sub-groups so that ways to target R, D & E can be considered.
By eliciting perceptions relating to the impact of no-till with stubble retention systems relative to a system with multiple cultivations and no stubble retention it is possible to gain an understanding of the perceived costs and benefits of no-till at a regional level. Only around 40 to 60 per cent of growers in each region expected higher wheat yields over the longer term under the no-till system, with the exception of Queensland Southern where a higher percentage expected greater yields. This is supported by the fact that yield advantages were not commonly cited as a reason for no-till adoption by adopters with cost-related factors being more important (see below).
A majority of growers in all regions expected the no-till system with stubble retention to lead to:n less fuel costs;n less erosion; n more moisture retention;n more herbicide costs; and n more herbicide resistance.
Some factors had a greater tendency to divide growers as to whether the impact would be positive, negative or the same. These included:n fertiliser costs; n weed emergence; n effectiveness of pre-emergent herbicides; andn crop disease.
5. SUMMARY

GRDC | 30 | ADOPTION OF NO-TILL CROPPING PRACTICES IN AUSTRALIAN GRAIN GROWING REGIONS
Characterising non-adopters
The most commonly stated reasons for adoption stated by adopters were associated with reduced fuel and time-related costs at seeding followed by improved soil conservation and moisture retention. These reasons were consistent across all regions. A challenge for increasing adoption is that the most common stated reasons for non-adoption in the regions with lowest adoption relate to the broad and potentially complex ‘lack of observed benefits’ relative to their existing system. Given that most non-adopters are likely to have observed no-till being practiced and extended in their local district over many years, the result suggests that further simple observation and information is not going to address this for remaining non-adopters.
Differences between adopters and non-adopters are often region-specific and should usually be considered at the regional level. In the summary below we list differences that were more commonly identified. Note that there may be some regional exceptions to these general statements.
Relative to adopters of no-till, non-adopters are generally more likely to:n expect more crop disease under a no-till stubble retention
system;n not use paid cropping advisors;n prefer livestock enterprises rather than cropping;n be less likely to have someone with higher education
involved with managing the farm;n had a smaller increase in arable area managed over past
10 years;n have less herbicide resistance;n have older seeding machinery;n be less willing to pay a premium for land that has been
under long-term no-till stubble retention compared to land under a system of multiple cultivations and stubble burning; and
n perceive that no-till with stubble retention is less likely to lead to:increased moisture retention;higher wheat yields;greater reliability of wheat yields;less rain needed for reliable seeding; andlower fuel costs.It is also useful to look at variables that do not differ
greatly between adopters and non-adopters. These are less likely to be factors that can be targeted by extension in a way that will influence adoption. Note that there are regional exceptions to some of these general statements.
Variables generally not shown to be associated with whether a grower is no-till user or non-user include:n age; andn use of variable rate fertiliser.
Perceived relative effect of no-till with stubble retention on:n herbicide costs; n herbicide resistance; andn fertiliser costs.
The no-till adoption trends over time have shown distinct regional differences. While the adoption and extent of use in many regions is now appearing to reach a high plateau, other regions appear set to peak at lower levels of adoption and extent of use. local experience and information has been shown to be very important to understanding no-till adoption (see D’Emden et al 2006).
Understanding the current reasons for adoption and non-adoption and the characteristics of non-adopters will be most effective if it is done at a regional level. For some of the low-adopting regions, potentially useful differences in perceptions of non-adopters have been identified that may allow improved targeting of extension to increase learning of some of the specific effects of no-till systems that have been experienced.
Regression analyses show that for some perceptions, not only are there differences in between adopters and non-adopters but they are significantly associated with the adoption and extent of use decision when a range of explanatory factors are considered. Examples include increased soil moisture retention, long-term wheat yield reliability, crop disease and the effectiveness of pre-emergent herbicides. Together with these potential opportunities goes the consistently strong association between no-till adoption and extensive no-till use with the use of agronomic advisory support.
The study has also identified characteristics of non-adopters that are expected to be more complex, entrenched, and less likely to be influenced by simple information and learning. These relate to the lack of overall perceived short and long-term advantages of no-till to the individual’s farming system and personal preferences. As current non-adopters with plans to shift to no-till in the near future do so, it is likely that the remaining non-adopting growers will increasingly have characteristics very different to the majority of the grain growing population that have been part of the remarkable shift to no-till systems becoming the conventional cropping system across Australia.
Finally, the results of this study show the remarkable diffusion of no-till across Australian cropping regions, confirming that no-till is highly adoptable and that extensive use has so far been sustained across a wide range of agro-ecosystems. The last five years have seen many regions with previously lower no-till adoption rapidly increase adoption to levels similar to early-adopting regions. However, it needs to be recognised that based on current indicators, over the next five years, and possibly at peak adoption, there will still be several regions with a combination of a relatively lower no-till adoption levels and lower extent of use. Achieving the same reductions in cultivation use and erosion risk in these regions will most likely require new and innovative approaches to encourage adoption through R, D & E of soil conservation practices.
Further analysis of the data from this study and the related 2003 study is being conducted.
ADOPTION OF NO-TILL CROPPING PRACTICES IN AUSTRALIAN GRAIN GROWING REGIONS | 31 | GRDC
ABS. 2009. land Management and Farming in Australia- 2007-08. Catalogue Number 4627.0.
D’Emden, F.H., llewellyn, R.S. and Burton, M.P. 2008. Factors influencing adoption of conservation tillage in Australian cropping regions. Australian Journal of Agriculture and Resource Economics 52:169-182
D’Emden, F.H., llewellyn, R.S. and Burton, M.P. 2006. Adoption of conservation tillage in Australian cropping regions: an application of duration analysis. Technological Forecasting and Social Change. 73 (6) 630-647. doi:10.1016/j.techfore.2005.07.003
D’Emden, F. H. and llewellyn, R. S. 2006. No-till adoption decisions in southern Australian cropping and the role of weed management. Australian Journal of Experimental Agriculture 46 (4) 563-569. www.publish.csiro.au/nid/72/paper/EA05025.htm
Forward, G. 2008. Key results of DWlBC land manager surveys 2000-2008. Forum paper, Waite 26 November. Department of Water, land and Biodiversity Conservation.
llewellyn, R.S. 2007. Information quality and effectiveness for more rapid adoption decisions by farmers. Field Crops Research 104:148-156
RMCG Consultants. 2008. Social Research on Dryland Cropping Practices. Report for Mallee Catchment Management Authority. July 2008.
Williams, P and Young, M. (1999). Costing Dust – how much does wind erosion cost the people of South Australia. CSIRO land and Water, Policy and Economic Research Unit. (www.clw.csiro.au/publications/consultancy/1999/costing_dust.pdf)
Funding for the SA No-till Farmers Association/Conservation Agriculture Alliance of Australia and New Zealand initiative that has supported this study has come from the Grains Research and Development Corporation, CSIRO, Department Agriculture, Fisheries and Forestry, SA No-till Farmers Association and the WA No-till Farmers Association. Gratefully acknowledged is the input from Greg Butler (SANTFA), Rohan Rainbow (GRDC) and most importantly the time offered by the farmer participants.
6. REFERENCES 7. ACKNOWLEDGEMENTS

GRDC, PO Box 5367, Kingston ACT 2604 T 02 6166 4500 F 02 6166 4599