Admission criteria for post graduate MBL students. - CiteSeerX
109
Admission criteria for post graduate MBL students. FINAL REPORT FOR MBL3 Presented to the Graduate school for business leadership University of South Africa In partial fulfilment of the requirements for the MASTERS DEGREE IN BUSINESS LEADERSHIP, UNIVERSITY OF SOUTH AFRICA Submitted by: W.A. van Niekerk Student number 7050 584 5 Study leader: Prof PJ Rall November 2006
-
Upload
khangminh22 -
Category
Documents
-
view
0 -
download
0
Transcript of Admission criteria for post graduate MBL students. - CiteSeerX
Admission criteria for post graduate MBL
students.
FINAL REPORT FOR MBL3
Presented to the
Graduate school for business leadership
University of South Africa
In partial fulfilment of the requirements for the
MASTERS DEGREE IN BUSINESS LEADERSHIP,
UNIVERSITY OF SOUTH AFRICA
Submitted by:
W.A. van Niekerk
Student number 7050 584 5
Study leader:
Prof PJ Rall
November 2006

ii
DECLARATION I, WA van Niekerk, declare that “Admission criteria for post graduate MBL
students” is my original work and that all the sources I have used or quoted
have been indicated and acknowledged as complete references, and have not
been submitted for degree purposes previously.
------------------------------- -----------------------------------
Signature Date
ACKNOWLEDGEMENT My wife Michele, thank you for all your patience and assistance.

iii
EXECUTIVE SUMMARY There is a great need for qualified MBL and MBA graduates in South Africa to
support and maintain the current growth rate that the economy is experiencing.
Diligent effort is required to ensure that the locally acquired MBA/MBL
qualifications remain on par with international qualifications. As an initial step to
ensure high standards, the Council for Higher Education (CHE) did accreditation
evaluations and only 18 MBA courses are now accredited. Admission criteria for
the MBA/MBL is one of the minimum standards being assessed as part of the
accreditation process conducted by the CHE.
To be effective some of the aims of the admissions process at the UNISA SBL
should be to:
• Determine as accurately as possible, which students are capable to
complete the MBL qualification successfully; (this has two implications, not
denying any students who could have completed the course, and not
admitting students who will not be able to complete the course).
• Ensure that a culturally diverse and representative student body is
admitted.
• Do the above mentioned by using a practical process that is as financially
and time efficient as possible.
This research study focuses on the admissions criteria for MBL students at
UNISA. The objectives of the study are:
• Understanding the admissions criteria in use at universities globally and
locally in South Africa.
• Understanding the success rate of the GMAT as admissions predictor for
MBA completion (globally).
• Determining the success rate of the current admissions criteria as
admissions predictor for the UNISA MBL completion.
• Determine what data or combinations of data on the MBL application
registration form can be used as a more successful predictor.
iv
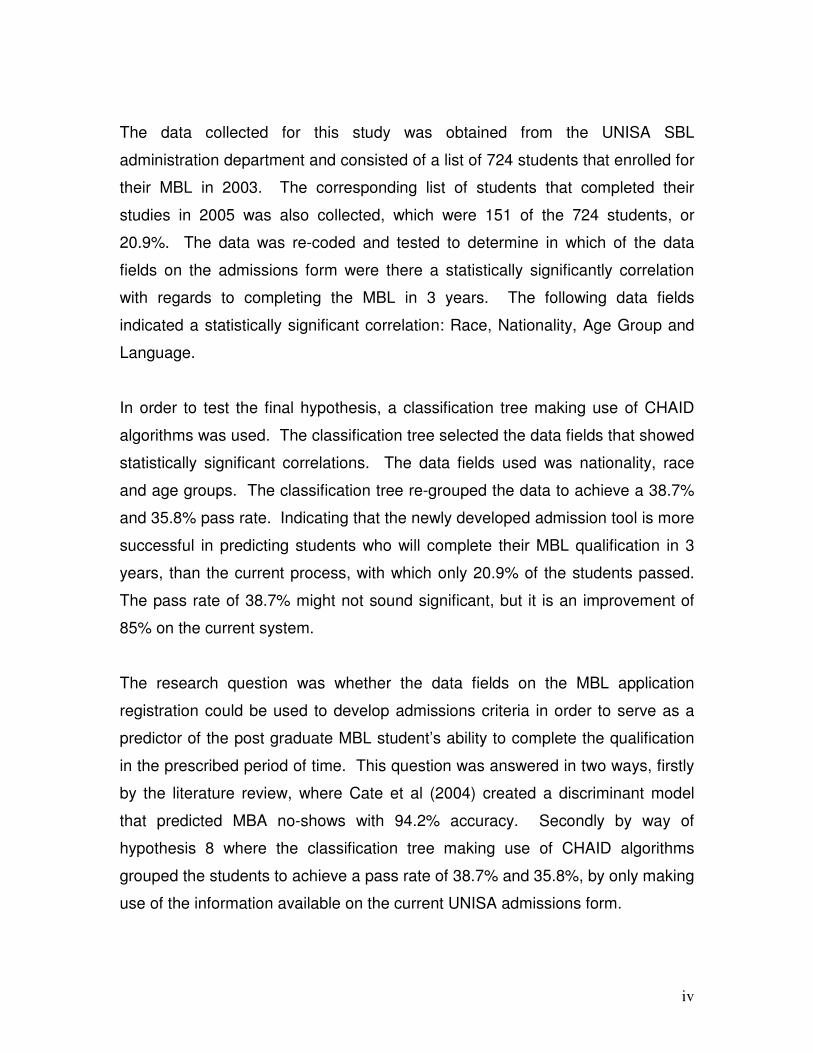
The data collected for this study was obtained from the UNISA SBL
administration department and consisted of a list of 724 students that enrolled for
their MBL in 2003. The corresponding list of students that completed their
studies in 2005 was also collected, which were 151 of the 724 students, or
20.9%. The data was re-coded and tested to determine in which of the data
fields on the admissions form were there a statistically significantly correlation
with regards to completing the MBL in 3 years. The following data fields
indicated a statistically significant correlation: Race, Nationality, Age Group and
Language.
In order to test the final hypothesis, a classification tree making use of CHAID
algorithms was used. The classification tree selected the data fields that showed
statistically significant correlations. The data fields used was nationality, race
and age groups. The classification tree re-grouped the data to achieve a 38.7%
and 35.8% pass rate. Indicating that the newly developed admission tool is more
successful in predicting students who will complete their MBL qualification in 3
years, than the current process, with which only 20.9% of the students passed.
The pass rate of 38.7% might not sound significant, but it is an improvement of
85% on the current system.
The research question was whether the data fields on the MBL application
registration could be used to develop admissions criteria in order to serve as a
predictor of the post graduate MBL student’s ability to complete the qualification
in the prescribed period of time. This question was answered in two ways, firstly
by the literature review, where Cate et al (2004) created a discriminant model
that predicted MBA no-shows with 94.2% accuracy. Secondly by way of
hypothesis 8 where the classification tree making use of CHAID algorithms
grouped the students to achieve a pass rate of 38.7% and 35.8%, by only making
use of the information available on the current UNISA admissions form.
v
All the objectives of the study were met, and the following recommendations
were made:
� Modify the admissions form to include some fields that may prove to be
better predictors.
� Do not show away students, who according to the model will not pass,
rather give them additional tutoring or require the students to complete a
preparatory programme such as the Programme in Business Leadership
(PBL), prior to starting with their MBL.
� Refine the admissions prediction model up to a point where the model is
able to predict 80% to 90% of the cases correctly, prior to it being
implemented, by using more than one MBL group that will give a more
representative sample, and do not limit the study to only students that
finished in the minimum period, but to all students that finished within 5
years.
This study therefore concludes that the data fields on the MBL application
registration form can be used to develop admissions criteria in order to serve as
a predictor of the post graduate MBL student’s ability to complete the
qualification in the prescribed period of time.
vi
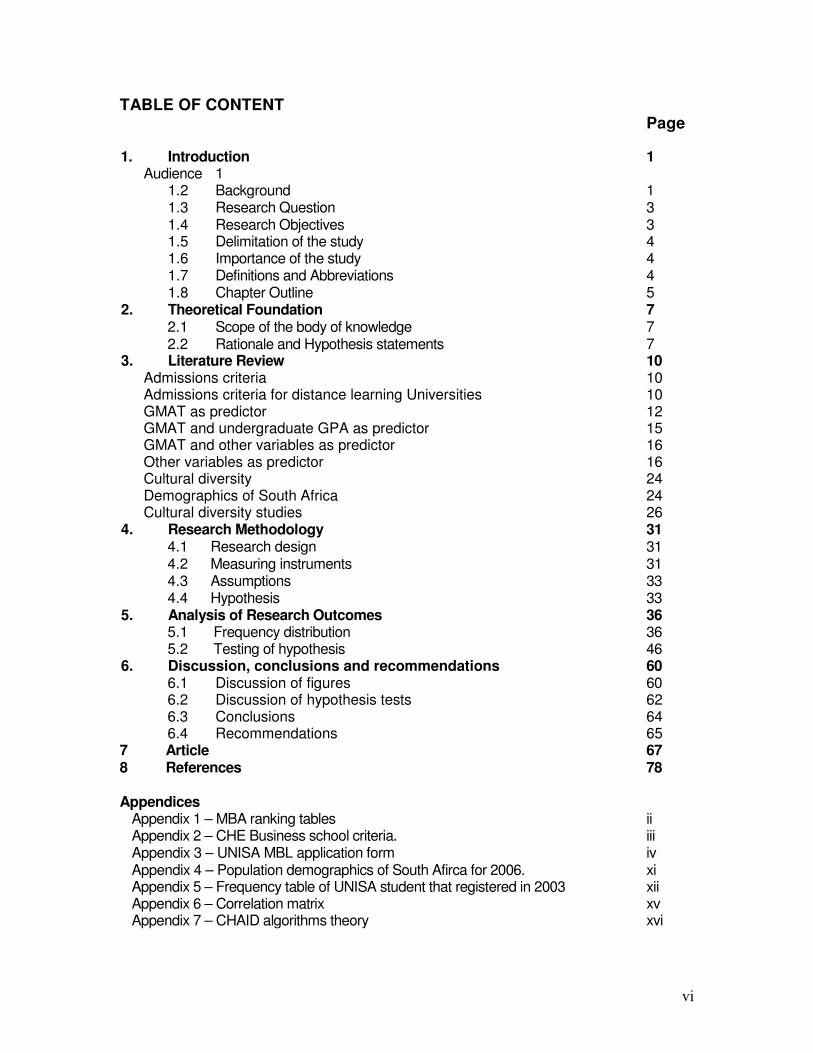
TABLE OF CONTENT Page
1. Introduction 1 Audience 1
1.2 Background 1 1.3 Research Question 3 1.4 Research Objectives 3 1.5 Delimitation of the study 4 1.6 Importance of the study 4 1.7 Definitions and Abbreviations 4 1.8 Chapter Outline 5
2. Theoretical Foundation 7 2.1 Scope of the body of knowledge 7 2.2 Rationale and Hypothesis statements 7
3. Literature Review 10 Admissions criteria 10
Admissions criteria for distance learning Universities 10 GMAT as predictor 12 GMAT and undergraduate GPA as predictor 15 GMAT and other variables as predictor 16 Other variables as predictor 16
Cultural diversity 24 Demographics of South Africa 24 Cultural diversity studies 26 4. Research Methodology 31
4.1 Research design 31 4.2 Measuring instruments 31 4.3 Assumptions 33 4.4 Hypothesis 33
5. Analysis of Research Outcomes 36 5.1 Frequency distribution 36 5.2 Testing of hypothesis 46
6. Discussion, conclusions and recommendations 60 6.1 Discussion of figures 60 6.2 Discussion of hypothesis tests 62 6.3 Conclusions 64 6.4 Recommendations 65
7 Article 67 8 References 78 Appendices
Appendix 1 – MBA ranking tables ii Appendix 2 – CHE Business school criteria. iii Appendix 3 – UNISA MBL application form iv Appendix 4 – Population demographics of South Afirca for 2006. xi Appendix 5 – Frequency table of UNISA student that registered in 2003 xii Appendix 6 – Correlation matrix xv Appendix 7 – CHAID algorithms theory xvi
vii
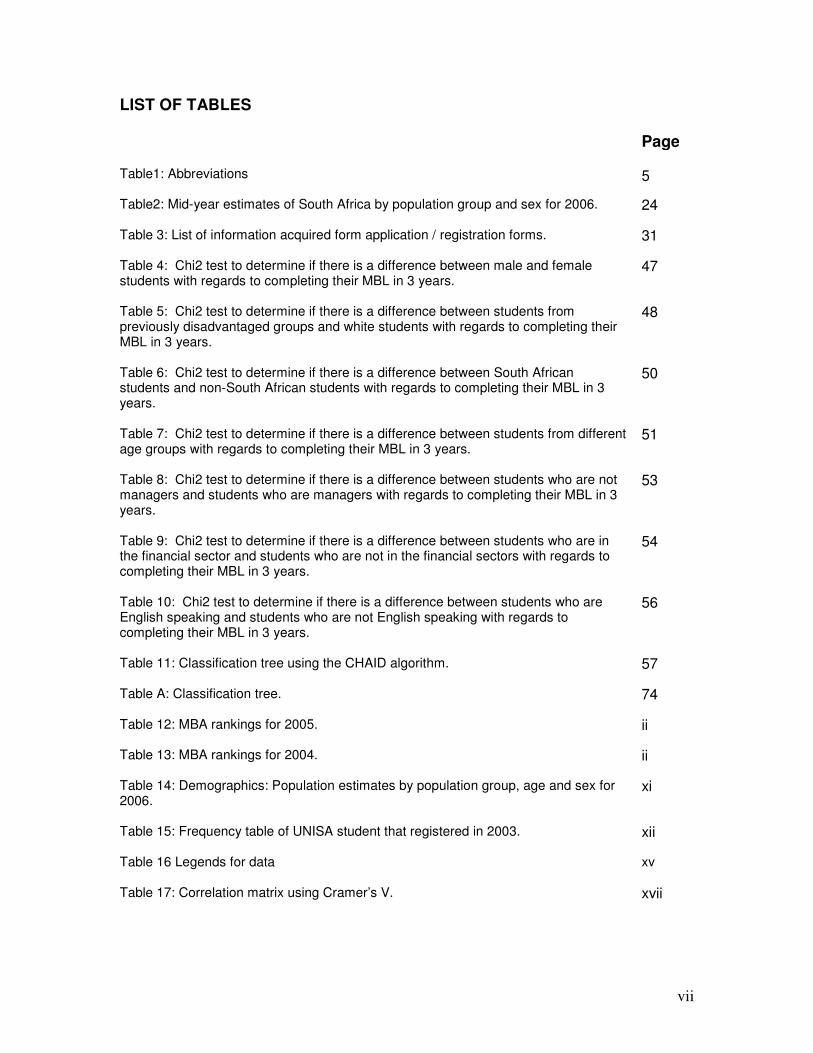
LIST OF TABLES Page Table1: Abbreviations
5
Table2: Mid-year estimates of South Africa by population group and sex for 2006.
24
Table 3: List of information acquired form application / registration forms.
31
Table 4: Chi2 test to determine if there is a difference between male and female students with regards to completing their MBL in 3 years.
47
Table 5: Chi2 test to determine if there is a difference between students from previously disadvantaged groups and white students with regards to completing their MBL in 3 years.
48
Table 6: Chi2 test to determine if there is a difference between South African students and non-South African students with regards to completing their MBL in 3 years.
50
Table 7: Chi2 test to determine if there is a difference between students from different age groups with regards to completing their MBL in 3 years.
51
Table 8: Chi2 test to determine if there is a difference between students who are not managers and students who are managers with regards to completing their MBL in 3 years.
53
Table 9: Chi2 test to determine if there is a difference between students who are in the financial sector and students who are not in the financial sectors with regards to completing their MBL in 3 years.
54
Table 10: Chi2 test to determine if there is a difference between students who are English speaking and students who are not English speaking with regards to completing their MBL in 3 years.
56
Table 11: Classification tree using the CHAID algorithm.
57
Table A: Classification tree.
74
Table 12: MBA rankings for 2005.
ii
Table 13: MBA rankings for 2004.
ii
Table 14: Demographics: Population estimates by population group, age and sex for 2006.
xi
Table 15: Frequency table of UNISA student that registered in 2003.
xii
Table 16 Legends for data
xv
Table 17: Correlation matrix using Cramer’s V. xvii
viii
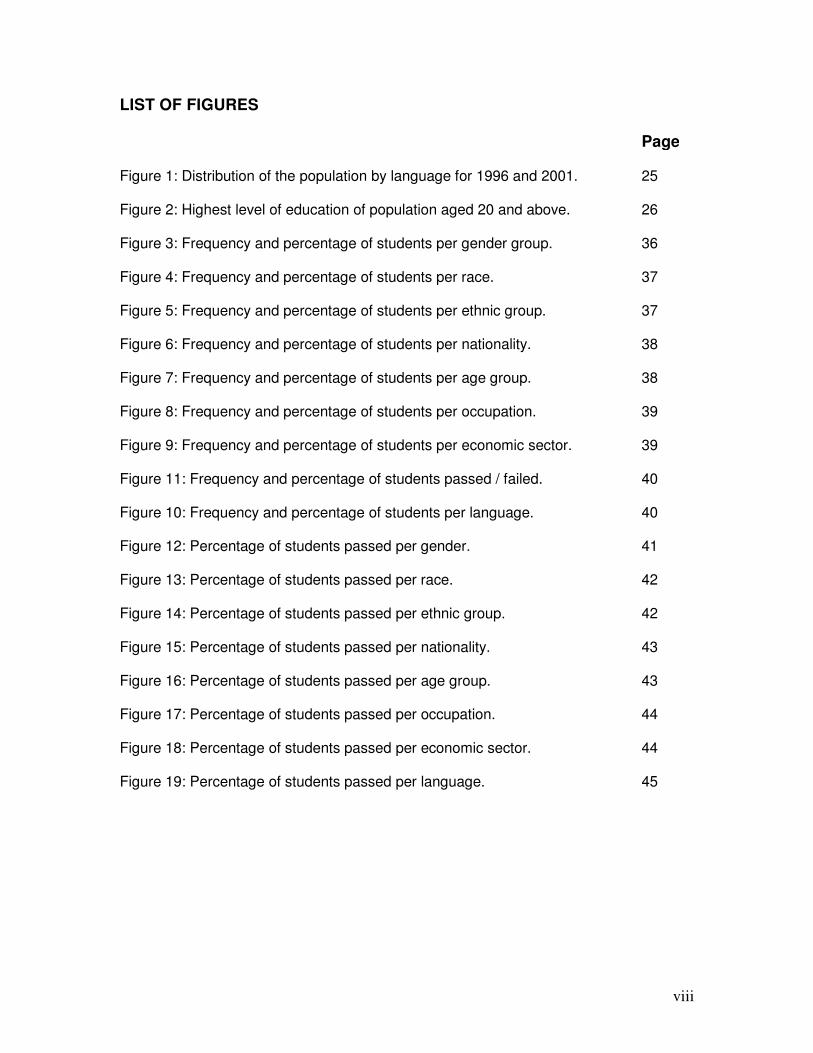
LIST OF FIGURES Page Figure 1: Distribution of the population by language for 1996 and 2001.
25
Figure 2: Highest level of education of population aged 20 and above.
26
Figure 3: Frequency and percentage of students per gender group.
36
Figure 4: Frequency and percentage of students per race.
37
Figure 5: Frequency and percentage of students per ethnic group.
37
Figure 6: Frequency and percentage of students per nationality.
38
Figure 7: Frequency and percentage of students per age group.
38
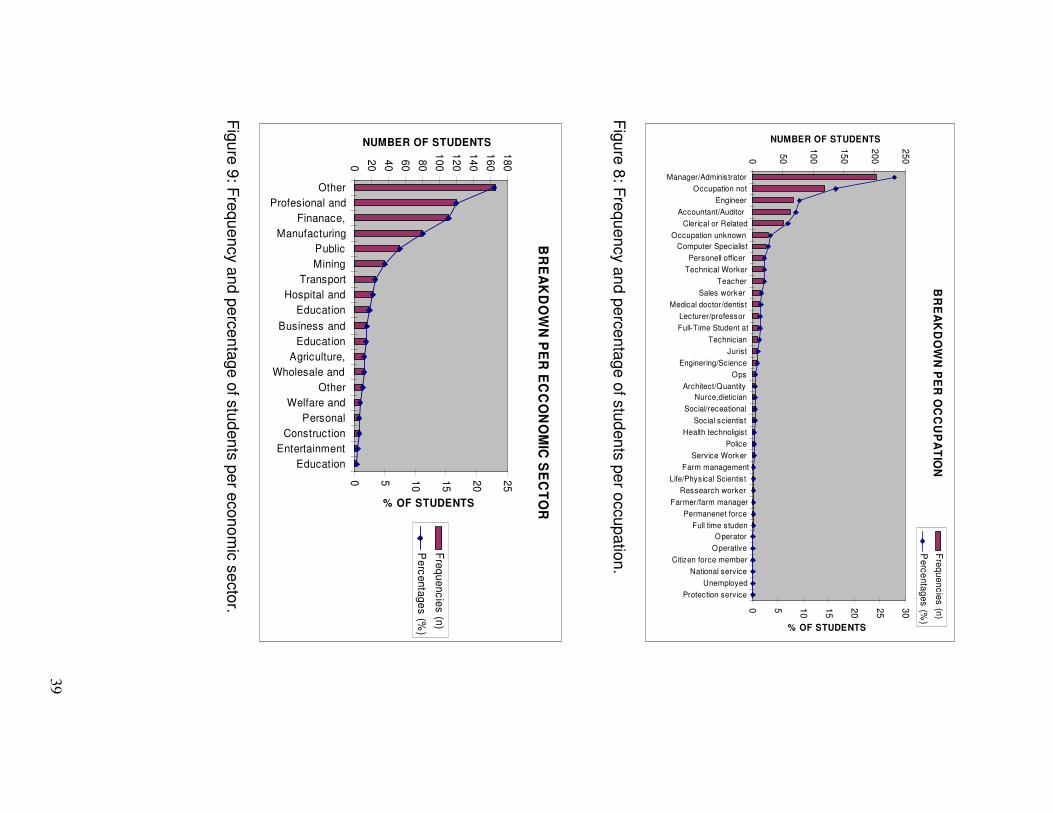
Figure 8: Frequency and percentage of students per occupation.
39
Figure 9: Frequency and percentage of students per economic sector.
39
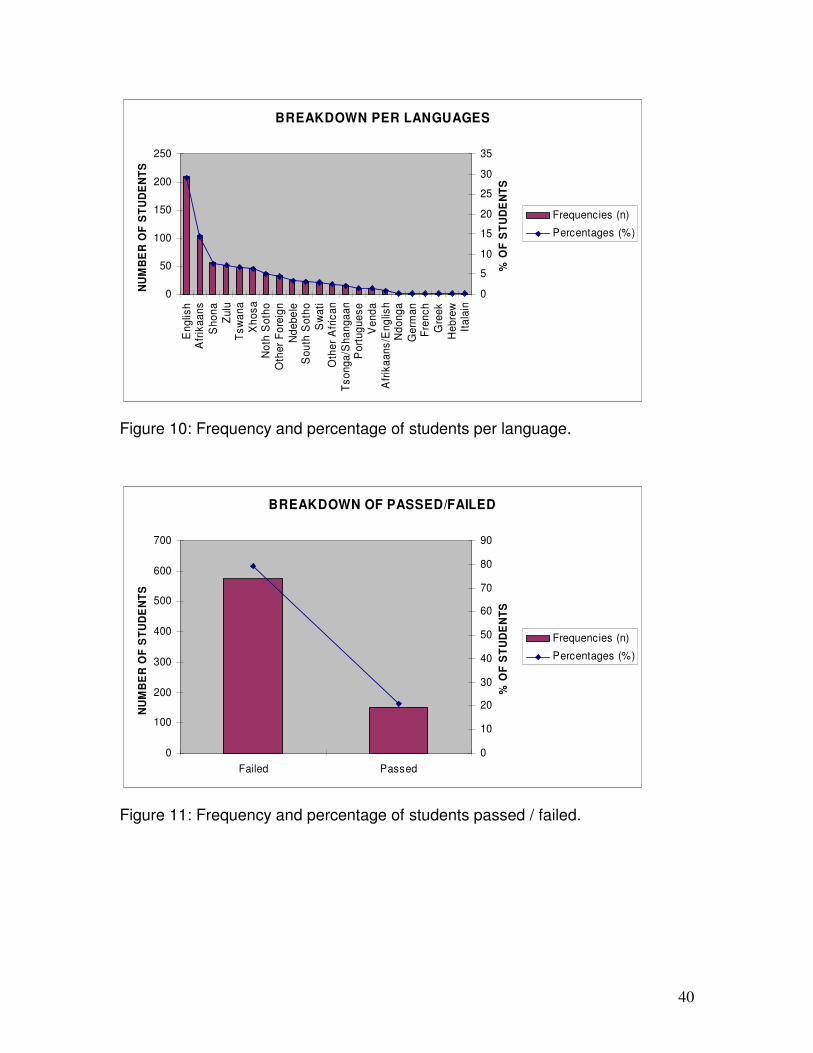
Figure 11: Frequency and percentage of students passed / failed.
40
Figure 10: Frequency and percentage of students per language.
40
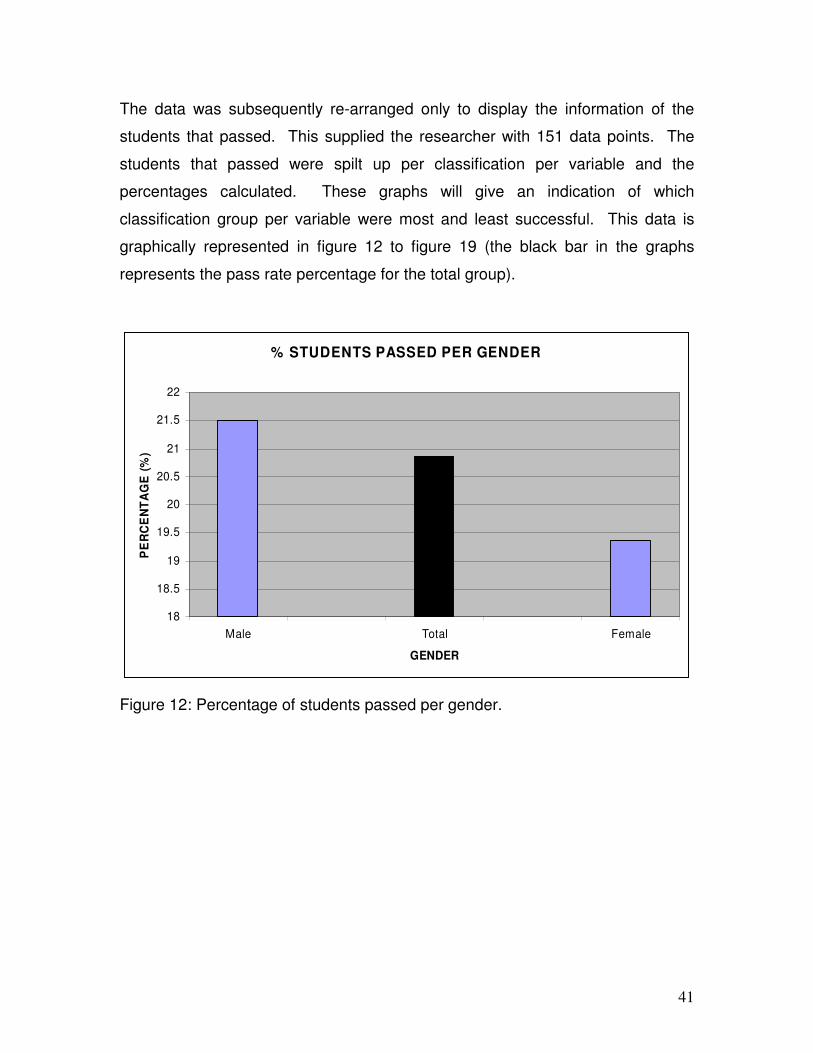
Figure 12: Percentage of students passed per gender.
41
Figure 13: Percentage of students passed per race.
42
Figure 14: Percentage of students passed per ethnic group.
42
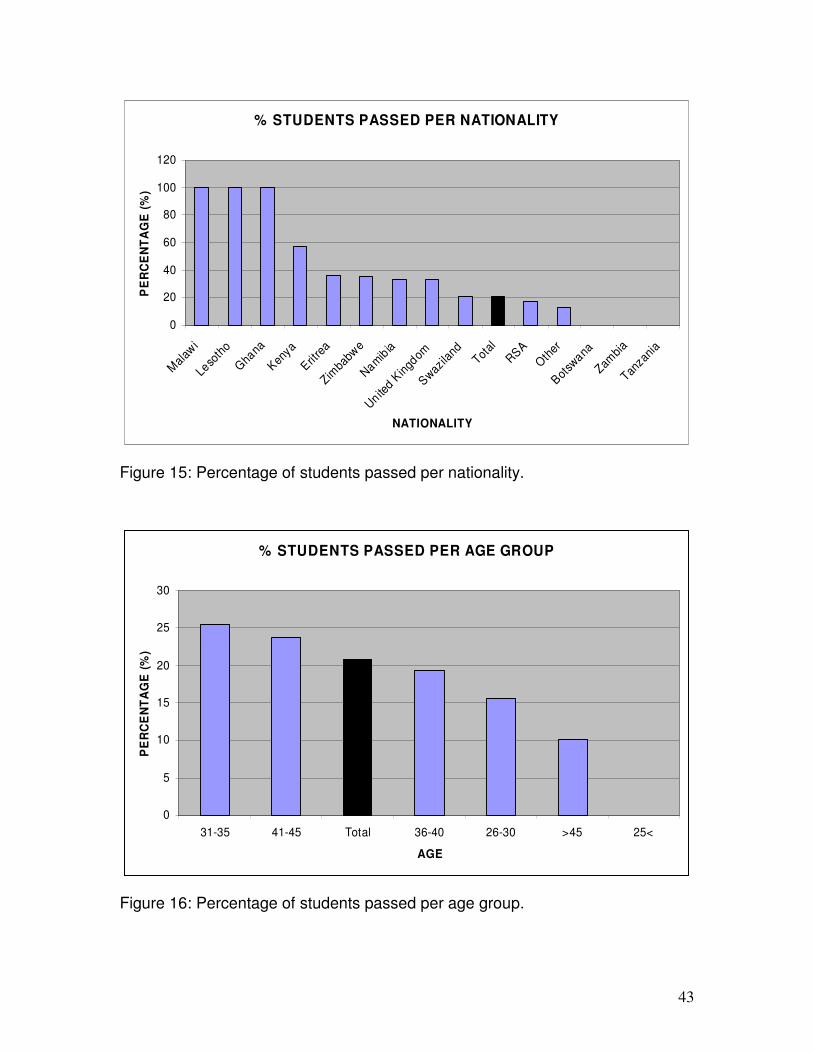
Figure 15: Percentage of students passed per nationality.
43
Figure 16: Percentage of students passed per age group.
43
Figure 17: Percentage of students passed per occupation.
44
Figure 18: Percentage of students passed per economic sector.
44
Figure 19: Percentage of students passed per language.
45
1
1. Introduction
This chapter will be used as an introduction to the whole study and give some
background on the topic. The research question will be stated together with the
research objectives. This chapter will also include the importance of the study,
delimitations and definitions.
1.1. Audience
The research project is aimed at two groups of readers, namely:
• The School for Business Leadership at the University of South Africa, and
• Other academic institutions or scholars, with interest in admissions criteria
for similar post graduate MBA courses.
1.2. Background
Reasons for acquiring a Master of Business Administration degree (MBA) are
plentiful, but the most common reason is that it is seen as one of the key routes
towards career advancement. It is believed that a MBA degree is a ticket to
acquiring good employment and earning a sizable remuneration package (Chiu,
1999).
As a result of abovementioned reasons, the demand for tertiary institutions to
provide MBA programs has increased dramatically. Especially the need for
programs that supply part time or distance learning, due to the flexibility,
convenience and affordability of such programs (Chiu, 1999). In 2003 the
number of institutions offering MBA courses in South Africa totalled 28
(Furlonger, 2005).
The rapid growth in the number of students wanting to acquire MBA qualifications
and the number of institutions offering the qualification has to be monitored and
controlled to ensure a consistent high level of quality qualifications. The function
of evaluating the MBA courses offered by institutions, is carried out by the
2
Council for Higher Education (CHE), while the evaluation of the students are
done by the tertiary educational institutions themselves.
In 2003 a MBA reaccreditation process was launched as the first step in bringing
the overall level of SA MBAs up to international standards. The results of this
process was that of the 28 MBA courses offered by business schools, only six
received full accreditation and 12 institutions were given one year to achieve full
accreditation on their MBA courses (Furlonger, 2004).
The CHE set 13 criteria for business schools wanting to offer MBA courses
(Refer to Appendix 3). Of these 13 criteria, two has direct influence on the
selection and admissions criteria of the tertiary institutions (Furlonger, 2004).
These are:
• Student recruitment: Among minimum standards for acceptance, 90% of
each group must have a bachelor's degree or equivalent.
• Diversity: Schools must set target rates for black students and staff, and
offer support systems to help them.
“A fundamental means of marketing an MBA program is to produce a high quality
product. This long-term strategy entails keeping the admission standards high,
providing comprehensive and rigorous delivery and on-going evaluations of the
total program” (Chiu, 1999).
Taking the CHE admissions criteria and the abovementioned quote into account
it is clear that the selection and admissions process of a MBA institution is critical
for future acceptance and success of such an institution. The majority of
institutions internationally that offer MBA courses use the Graduate Management
Admissions Test (GMAT) as part of their admissions criteria. Studies have
however shown that the GMAT alone is not a very good predictor and can
typically only be attributed with 14% to 18% of the variance on MBA student
Grade point average (GPA) performance (Koys, 2005).
3
Due to logistical, time and financial considerations, the University of South Africa
(UNISA) does not use the GMAT as part of the admissions process. The
admissions process described in the MBL brochure (2006) is as follows:
“In order to be considered for admission to the first year of MBL study,
participants must:
• Hold a three year Bachelors degree (360 SAQA credits) from a recognised
university.
• Have at least three years’ work experience, to ensure that they can
contribute meaningfully in group discussions, assignments and study
schools.
• Have access to a computer and the Internet.
An evaluation of the applicant’s academic record and a personal letter providing
reasons for wishing to enrol for the MBL will be used for selection purposes. The
SBL may introduce additional selection criteria.”
This research study will focus on the admissions criteria and attempt to improve
the predictability of the admissions process.
1.3. Research Question
Can the data fields on the MBL application registration be used to develop
admissions criteria in order to serve as a predictor of the post graduate MBL
student’s ability to complete the qualification in the prescribed period of time?
1.4. Research objectives
Currently a substantial percentage of the MBL students fail to complete the
qualification in the minimum period of time. This can be attributed to a number of
reasons, of which admission criteria are one (Strasheim, 1998). The objectives
of the study are:
• Understanding the admissions criteria in use at universities globally and
locally in South Africa.
4
• Understanding the success rate of the GMAT as admissions predictor for
MBA completion (globally).
• Determining the success rate of the current admissions criteria as
admissions predictor for the UNISA MBL completion.
• Determining what data or combinations of data on the MBL application
registration form can be used as more successful predictor.
1.5. Delimitations of the study
The study will spend time to understand the different admission criteria available
and used globally. The study will however not attempt to develop better
admissions criteria for other post graduate MBA institutions. The study will only
attempt to develop an alternate admissions criterion for the SBL at UNISA.
Only historical data of MBL students who registered in 2003 at the SBL will be
used to develop the new admissions model. Thus, students at other universities
and other year groups, are excluded.
1.6. Importance of the study
Taking the target audience into account, the study will have the following
importance:
• It will allow the SBL of UNISA to make a more accurate assessment of the
likelihood of students to be successful in their post gradate MBL studies.
• A higher admissions success rate will invariantly lead to better pass rates.
• Less disruption of MBL study groups due to loss of members.
• Lastly, if successful, the study will show that less costly and less time
consuming methods can be used effectively as successful admissions
criteria.
1.7. Definitions and abbreviations
Postgraduate - A person with a degree who is studying for a more advanced
qualification (Collins Dictionary & Thesaurus, 2005: 12).
5
Admissions – 1 permission to enter. 2 permission to join (an organisation).
(Collins Dictionary & Thesaurus, 2005: 12).
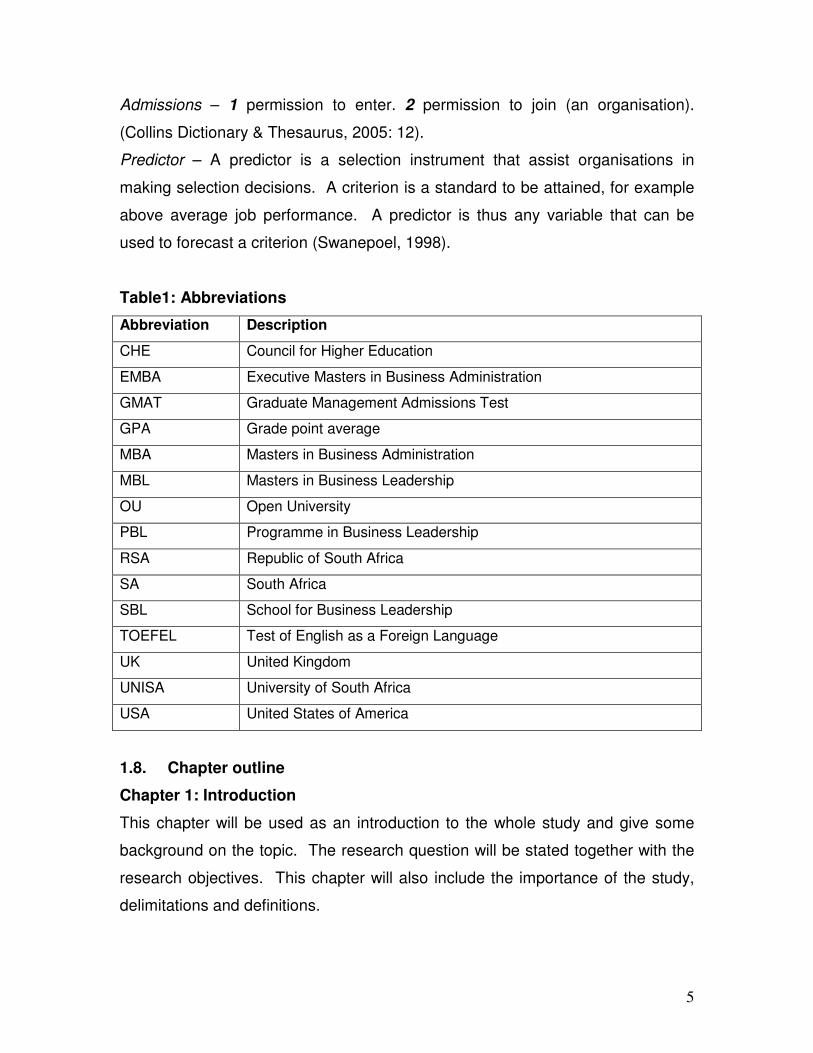
Predictor – A predictor is a selection instrument that assist organisations in
making selection decisions. A criterion is a standard to be attained, for example
above average job performance. A predictor is thus any variable that can be
used to forecast a criterion (Swanepoel, 1998).
Table1: Abbreviations
Abbreviation Description
CHE Council for Higher Education
EMBA Executive Masters in Business Administration
GMAT Graduate Management Admissions Test
GPA Grade point average
MBA Masters in Business Administration
MBL Masters in Business Leadership
OU Open University
PBL Programme in Business Leadership
RSA Republic of South Africa
SA South Africa
SBL School for Business Leadership
TOEFEL Test of English as a Foreign Language
UK United Kingdom
UNISA University of South Africa
USA United States of America
1.8. Chapter outline
Chapter 1: Introduction
This chapter will be used as an introduction to the whole study and give some
background on the topic. The research question will be stated together with the
research objectives. This chapter will also include the importance of the study,
delimitations and definitions.

6
Chapter 2: Theoretical foundation
In this chapter the theoretical foundation will be set by outlining the applicable
body of knowledge.
Chapter 3: Literature review
The literature pertaining to the study will be reviewed and discussed in chapter 3.
Chapter 4: Research methodology
This chapter will clarify the research methodology that was used, the data
collection method as well as the limitations of the study.
Chapter 5: Analysis of research results
The results of the study will be displayed in this chapter.
Chapter 6: Discussion, conclusion and recommendations
The results achieved in chapter 5 will be discussed in detail and conclusions and
recommendations made.
Chapter 7: Article for publication
The research study will be summarised into an article format for possible
publication.
7
2. Theoretical Foundation
In this chapter the theoretical foundation will be set by outlining the applicable
body of knowledge.
2.1. Scope of the body of knowledge
The relevant body of knowledge for this study can be listed as:
• Admissions criteria for tertiary institutions, and
• Cultural diversity
The review of the information available on admissions criteria will be focussed on
the admissions criteria and tests set out by tertiary institutions for MBA
qualifications. Material on the relevance of admissions tests such as the GMAT
will also be investigated.
The theory on cultural diversity will be discussed, especially with relation to
university admissions.
2.2. Rationale and Hypothesis statements
Rationale 1
The classification data available on the application forms of the MBL applicants
will be tested for correlation to the student’s success with regards to completing
their MBL in 3 years.
Hypothesis statement 1
HO: There is no difference between male and female students with regards to
completing their MBL in 3 years.
HA: There is a difference between male and female students with regards to
completing their MBL in 3 years.
Hypothesis statement 2

8
HO: There is no difference between students from previously disadvantaged
groups and white students with regards to completing their MBL in 3 years.
HA: There is a difference between students from previously disadvantaged
groups and white students with regards to completing their MBL in 3 years.
Hypothesis statement 3
HO: There is no difference between South African students and non-South
African students with regards to completing their MBL in 3 years.
HA: There is a difference between South African students and non-South African
students with regards to completing their MBL in 3 years.
Hypothesis statement 4
HO: There is no difference between students from different age groups with
regards to completing their MBL in 3 years.
HA: There is a difference between students from different age groups with
regards to completing their MBL in 3 years.
Hypothesis statement 5
HO: There is no difference between students who are not managers and students
who are managers with regards to completing their MBL in 3 years.
HA: There is a difference between students who are not managers and students
who are managers with regards to completing their MBL in 3 years.
Hypothesis statement 6
HO: There is no difference between students who are in the financial sector and
students who are not in the financial sectors with regards to completing their MBL
in 3 years.
HA: There is a difference between students who are in the financial sector and
students who are not in the financial sectors with regards to completing their MBL
in 3 years.
9
Hypothesis statement 7
HO: There is no difference between students who are English speaking and
students who are not English speaking with regards to completing their MBL in 3
years.
HA: There is a difference between students who are English speaking and
students who are not English speaking with regards to completing their MBL in 3
years..
Rationale 2
The combined use of general registration information that proved to have a
positive correlation to MBL success will prove to be a better admissions tool to
predict successful MBL completion than the current admissions process.
Hypothesis statement 8
HO: The newly developed admission tool is less successful in predicting students
who will complete their MBL qualification in 3 years, than the current process.
HA: The newly developed admission tool is more successful in predicting
students who will complete their MBL qualification in 3 years, than the current
process.
10
3. Literature Review
The literature under review will be comprised of the following two bodies of
knowledge: admissions criteria and cultural diversity.
3.1. Admissions criteria
In this section the different admissions criteria in use internationally will be
discussed.
3.1.1. Admissions criteria of distance learning Universities
The admissions criteria of distance learning universities will first be discussed.
The two universities that will be discussed are the Open University in the United
Kingdom that services the UK as well as parts of Europe, and the University of
South Africa that services the greater Southern Africa region.
3.1.1.1 Open University (OU)
The OU is Europe’s largest university and is ranked amongst the top UK
universities. There are currently about 200 000 students enrolled at the OU,
making use of their distant learning programmes to further their careers, without
sacrificing work or family commitments (www.open.ac.uk, 2006).
The admissions criteria at the OU does not require testing, but is largely based
on prior experience and qualifications. The admissions criteria for a MBA
qualification are:
� All applicants are expected to have organisational experience, with some
of it in management level.
� The applicant must be at least 25 years old when starting their first course
of study.
� The maximum allowed period of time to complete the MBA is ten years,
passing a minimum of one course every two years. Students are only
allowed to repeat any subject once.
11
The MBA qualification is completed in two stages, and stage 1 has to be
completed before enrolment into stage 2 is accepted. Stage 1 can be completed
via three routes:
� Route 1: The applicant must be in possession of a recognised bachelor’s
level qualification. The applicant can complete stage 1 by taking either the
Certificate in Business Administration course or, if the applicant’s
qualification is in the business studies area, taking the Professional
Diploma in Management course. Both these courses will take at least 12
months to complete.
� Route 2: The applicant is already in possession of a professional diploma
in management, or a post graduate qualification in management or
business administration or a Masters degree in a related area. Then that
qualification will count as stage 1.
� Route 3: The applicant is experienced in managerial work, but does not
have the required qualifications. The applicant can then complete the
Professional Diploma in Management course, which will take two years to
complete.
Upon completing stage 1, the applicant can move on to stage 2, which entails
completing the subjects in a pre-determined order until the required 180 points
are accumulated to be awarded a MBA qualification (www.open.ac.uk, 2006).
3.1.1.2 University of South Africa (UNISA)
The admissions criteria for UNISA are mainly based on experience and
qualifications. (Refer to appendix 3 for the complete MBL brochure for 2006). “In
order to be considered for admission to the first year of MBL study, participants
must:
• Hold a three year Bachelors degree (360 SAQA credits) from a recognised
university.
• Have at least three years’ work experience, to ensure that they can
contribute meaningfully in group discussions, assignments and study
schools.
12
• Have access to a computer and the Internet.
An evaluation of the applicant’s academic record and a personal letter providing
reasons for wishing to enrol for the MBL will be used for selection purposes. The
SBL may introduce additional selection criteria” (MBL brochure 2006).
3.1.2. GMAT as predictor
The GMAT is designed to measure the ability and knowledge of the student. The
test is all multiple-choice questions covering two sections, verbal and
quantitative. The score is then used to base admission decisions on (Ahmadi et
al, 1997). The GMAT is most commonly used in the US, but has been found to
be a valid predictor of academic performance in a MBA program for non-U.S.
students as well (Koys, 2005).
Several studies found a statistically significant correlation between GMAT scores
and the MBA GPA. The square of the correlation coefficient was used to see the
degree of changes in one variable to explain changes in another variable. The
GMAT score was found to explain between 14% and 18% of the GPA variance
(Koys, 2004).
“Standardized testing has been utilized for over a century. Providing many
functions, testing can be used to sort people into groups, classify and rank
employees, or admit students into educational programs. Tests can be designed
to measure aptitude, personality, achievement, or even competency. There are
many advantages to standardized testing; however, standardized testing does
have drawbacks” (Ahmadi et al, 1997). Since the GMAT consists of multiple-
choice type questions, it does not accurately measure an individual's ability,
critical thinking skills, or competency (Ahmadi et al, 1997).
13
3.1.2.1 The Validity of the GMAT for Non-U.S. Students
Previous studies have show that the GMAT is a valid predictor of academic
performance for US students undertaking their MBA qualification. There are
however very little evidence that the GMAT predicts performance for non-US
students. The study examined the validity of the GMAT on non–US students
through a predictive validation procedure in which the students (from Bahrain,
Czech Republic and Hong Kong) were given the GMAT, but the test results were
not used to admit the students. The students were admitted based on their
previous qualifications and verbal skills to three overseas MBA programs and
their academic performance was correlated with their GMAT scores (Koys,
2005).
In the majority of previous validation studies of the GMAT on the MBA, a
concurrent validation approach was used. The author felt that a predictive
approach would provide a more accurate estimation of the validity of the GMAT,
as the predictive approach does not suffer from a restriction of range on the
predictor score. More specific, this means that in the concurrent technique, only
students who were admitted with good GMAT results were evaluated for
correlation upon completion of their qualifications. Thus a portion of the aspirant
students with poor GMAT results were not part of the study. In the predictive
validation process the students were allowed to study their MBA regardless of
their GMAT scores. Thus an evaluation after completion of their qualifications
would give a correlation on a wider range of GMAT results (Koys, 2005).
The findings showed that 41% of the variance in the MBA academic performance
was explained by the GMAT. The correlation was higher than similar US
students. The findings of the study indicated that the GMAT was a valid predictor
of academic performance in an MBA program for non-US students (Koys, 2005).

14
3.1.2.2 Sample selection in models of academic performance
A study was conducted at the University of Nebraska-Lincoln about their MBA
program, and provided a formal model of how the admission and enrolment
process affects the interpretation of simple validation studies. It was theoretically
found that the admission and acceptance process systematically reduces the
correlation between test scores and performance relative to the relationship in
the population of potential students. Traditional validation studies may mislead
institutions into ignoring useful information about the potential productivity of
prospective students (Cushing, 2004).
The assumption was made that institutions seek to predict performance using
undergraduate performance in addition to test scores. Admissions committees
usually examine a host of qualitative information like recommendation letters and
undergraduate course-work, whereas validation studies typically use a small
number of easily quantifiable variables. Another assumption was that institutions
operate in a competitive environment and applicants base their enrolment
decisions solely on the ranking of institutions (Cushing, 2004).
The Rationale was tested on a sample of students and applicants to the MBA
program at the University of Nebraska-Lincoln. The coefficient was calculated
from a regression of undergraduate GPA on GMAT scores from currently
enrolled students and was compared to the regression coefficient using the pool
of applicants as the population of potential students (Cushing, 2004).
According to Cushing (2004) the study indicated that the correlation between
undergraduate GPAs and GMAT scores was almost twice as high in the
applicant pool as in the pool of matriculating students. Standard validation
studies will therefore understate the importance of GMAT scores in predicting
performance of potential students to the MBA program.
15
3.1.2.3 Sidestepping the GMAT
This author indicated that thirteen top ranked MBA programs in the US have
abandoned the GMAT as a requirement for their EMBA programs, some waive
the test on a case by case basis, while others have cut it from their admissions
criteria altogether. The author however eludes that the waiving of the GMAT is
motivated by profit, since fulltime MBA offerings, which require the GMAT, are
struggling to attract students (Gloeckler, 2005).
The arguments discussed by Gloeckler that supports the waiving of the GMAT
were:
� Business experience is more important than test scores for EMBA
programs,
� The GMAT is unfair to applicants who have been out of school for ten or
more years,
� Rejecting for low test scores would reduce the diversity of backgrounds in
the student body.
Arguments against the waiving of the GMAT were:
� Students may lack analytical skills needed in first year if they were not
assessed on the GMAT,
� Exam is the only way to compare applicants of different backgrounds,
� An EMBA is still an MBA, and the requirements should be the same.
3.1.3. GMAT and undergraduate GPA as predictor
Many business schools use both the GMAT and undergraduate GPA to make
admissions decisions. Some researchers have used multiple regression analysis
to test the combined relationship of these two predictors with the criterion of MBA
GPA. The results showed that the GMAT and undergraduate GPA together
explained between 15% and 22% of the variance in MBA GPA (Koys, 2004).
16
3.1.4. GMAT and other variables as predictor
Other variables have been used together with the GMAT score and the
undergraduate GPA. However, when GMAT and GPA were combined with other
variables, such as involvement in campus activities, work experience, letters of
recommendation, and personal goals (Ahmadi et al, 1997), these models
explained only 19 to 21 % of the variation and were not as useful as predictors of
success (Koys, 2005). One other popular test for non-US students is the
TOEFEL, which has shown that 5% of the variance in first year MBA’s GPA could
be explained by the TOEFEL (Koys, 2005).
3.1.5. Other variables as predictors
Carver (1994) stated that the correlation between GMAT and success in a MBA
program are not particularly high, and that exploration of more qualitative
variables, such as quality of work experience, may prove more fruitful than
focusing exclusively on quantitative measures.
Another study by Ahmadi et al (1997) suggests that other additional criteria may
need to be used in selecting prospective students. Due to their low predictive
ability of the GMAT alone, other forms of assessment such as writing samples,
interviews, work experience, or other non-quantitative measures or assessments
would be useful.
Naik et al (2004) did a study where the GMAT score together with all other
information on the students were evaluated by a neural network to predict
student performance, and achieved an accuracy of 89.13%.
17
3.1.5.1 Predicting MBA No-Shows and Graduation Success with
Discriminate Analysis
The study done by Cate et al (2004), investigates the possibility to determine
whether information, only available at the time of admission to the MBA program,
can be used to correctly categorize applicants into two groups, namely: no-shows
and those who successfully graduate. The intent is that the factors identified in
the study will assist the admissions committee of the Northern Kentucky
University in predicting successful MBA students. The analysed data should
indicate which of the current data being collected during the admissions process,
is useful (Cate et al, 2004).
The data used in the study was obtained from the data available to the MBA
admissions committee of Northern Kentucky University at the time of admission,
namely the information on the graduate application form, the information on the
GMAT and the information on the undergraduate GPA. The variables used in the
analysis were:
� Age when admitted,
� Undergraduate GPA,
� GMAT scores,
� Years the applicant was with the current employer,
� Years that elapsed between the completion of the undergraduate degree
and admission to the MBA program,
� Number of pre-MBA classes required for admission,
� Number of courses transferred to the University,
� Sex,
� Full time or part time,
� Race,
� Under graduate college,
� Tuition status.

18
Descriptive statistics for these variables indicated that the no-shows were
marginally older when admitted; planned to let less time elapse between the
completion of the undergraduate and the start of the MBA program; had higher
GPAs; had marginally lower GMAT scores, were required to take almost twice as
many pre-MBA courses; and had fewer graduate courses transferred to the
university (Cate et al, 2004).
Discriminate analysis was selected above all other multivariate analysis
techniques, due to its powerful classification capabilities. Specifically,
discriminant analysis is a statistical tool that allows the researcher to identify
variables or attributes that best discriminate members into two or more groups
(Cate et al, 2004). SPSS for Windows, version 11.5. was used for the analysis.
The analysis correctly separated the no-shows with a 94.2% classification rate
based entirely on the use of dummy variables. Unlike other studies,
undergraduate GPAs, GMAT scores, and other numeric variables played no role
in the final classification. Cate (2004), suggests that more attention be given to
the use of dummy variables when it comes to predicting the success of MBA
program graduates. It was cautioned that the specific results may not be
transferable to other MBA programs, but that the methodology used is indeed
transferable and should yield similar classification results.
3.1.5.2 Using neural networks to predict MBA student success
This study attempts to predict MBA student performance for admissions
purposes. Contrary to traditional studies that made use of statistical models like
discriminant analysis, multiple regression or stepwise regression, this study will
attempt to predict MBA performance by making use of three different models,
namely neural networks, logit (logistic regression ) and probit (Naik et al, 2004).
The limitations associated with traditional statistical methods, as stated by Naik,
are that they usually assume multivariate normality and homoscedastic

19
variances. Actual data seldom comply with this (like the use of skewed GPA
data as a result of admissions criteria) and therefore diminish the predictive
ability. An additional problem with multiple regression and stepwise regression
studies is the low value of R2 with some studies as low as 0.18%.
The data used in the study was gathered from results of recently graduated
students from medium sized accredited mid-western Universities. The students
was grouped into a successful pool and a marginal pool based on their results.
The variables used in the study was: campus location, citizen status, gender,
ethnic status, undergraduate GPA, junior year GPA, GMAT, age of student,
undergraduate institution, and undergraduate major (Naik et al, 2004).
Neural networks entail the use of modern computer technology and information
science to build information systems that can make decisions based on available
historical data. These systems are also called learning systems and are usually
used for prediction and classification purposes in various fields (Naik et al, 2004).
The neural network classified 93.38% of the successful students correctly and
80.9% of the marginal students correctly. The overall prediction accuracy for the
neural network model was 89.13%. The neural network was then compared to
two statistical models, namely logit and probit. The results obtained from the
logit model classified 86.78% of the successful students and 46.03% of the
marginal students correctly. The overall rate of prediction accuracy for the logit
model was 72.83%. The results obtained from the probit model classify 87.6% of
the successful students and 46.03% of the marginal students correctly. The
overall rate of prediction accuracy for the probit model was 73.37%. The results
indicated that the neural network performed at least as good as the statistical
models (Naik et al, 2004).
The following limitations were highlighted with regards to the neural network
models. The size of the sample was too small to enable the generalisation of the
20
results. There are several theories that can guide the design of network
topology, thus meaning that the neural network used could have been sub-
optimal. The training of the neural network can be computational intensive and
the learning rate subject to the researcher’s preferences. Neural networks does
not explain its decision and should thus not be used alone, but in conjunction
with admissions boards (Naik et al, 2004).
3.1.5.3 An examination of the admission criteria for the MBA programs: A
case study
This study evaluates the adequacy of the GMAT as a measure of potential
success of students during the admissions process for MBA programs. The
study will determine if GMAT results and MBA success are correlated. Additional
factors that may affect the success of students were also discussed (Ahmadi et
al, 1997).
The data used for the study was obtained from accredited business schools in
the South East of the US, one of which was the University of Tennessee.
Students can be admitted via two routes. The first entails that the aspirant
students undergraduate GPA is multiplied by a factor of 200 and added to the
applicants GMAT score. If the total exceeds the required total of 950 the student
is admitted. Secondly if the aspirant students total score is less than 950 the
GPA of the most resent studies are used and multiplied with 200 and added to
the GMAT score. If the total is more than 1000 the student is admitted (Ahmadi
et al, 1997).
A bi-variant linear regression was used to verify the correlation between the
dependant MBA graduate GPA and the following independent predictor
variables: GMAT score, age of the student, gender, marital status, race of the
student, undergraduate GPA and undergraduate major. The descriptive statistics
gave the following results:

21
� The average age of the MBA students was 29.8 Years (61.3% fell within
the 25 to 35 age group),
� 55.9% of the students were male,
� 85% of the students were Caucasian, 2.5% African American and 12.2%
other,
� 60.2% had GPAs under 3.0,
� The average undergraduate GPA was 2.77,
� 71.9% of the students hold a qualification in business administration,
� 86% had GMAT scores of over 400, with the average at 483.
A bi-variant linear regression model was developed for each of the of the
independent predictor variables to determine the correlation to the graduate
GPA. An analysis was done on each of the independent variables and the
findings were:
� Undergraduate is a significant predictor with a correlation of 27.1%,
� GMAT score is a significant predictor with a correlation of 18.75%,
� Index score is a significant predictor with a correlation of 12.67%,
� Age is a significant predictor with a correlation of 7.62%,
� Race is not a significant predictor,
� Graduate major is not a significant predictor,
� Gender is not a significant predictor.
The study suggest that even though undergraduate GPA and GMAT scores are
significant variables in predicting success, their low predictive ability necessitate
the use of additional criteria for the selection of prospective students (Ahmadi et
al, 1997).

22
3.1.5.4 An empirical investigation of the MBA admission criteria for non-
traditional programs
This study investigated the validity of the GMAT when taken under non-standard
conditions such as persons with disabilities or persons whose native language is
not English or students who study their MBA on a non-full time basis. The study
make note that the degree of validity of the GMAT may be a function of the
particular institution and the types of students who are attracted to that
institution's MBA program. "The GMAT serves to exclude otherwise worthy and
motivated prospective M.B.A. students as much or more than it does to preclude
such students who would not or could not succeed to graduate management
education" (Carver et al, 1994).
The study states that a number of Universities has started to add additional
admissions criteria such as: undergraduate major, GPA in major courses,
recommendation letter, work experience and undergraduate institution. The
purpose is to find the best combination to predict success in the MBA and to
identify students who might require remedial courses prior to enrolling. “Part-time
students would be operating in an entirely different environment from full-time
students, that is, first priority is often job rather than school" (Carver et al, 1994).
The study was mostly based on part time, distance learning students of a
suburban University. The data used was of 467 students who completed their
MBA between 1983 and 1988. Regression analysis was done with the aid of a
Statistical Package for the Social Sciences (for PCs). Each variable was tested
for correlation to the MBA GPA scores. The following results were obtained:
� No single variable was an excellent predictor of MBA success,
� The variable with the greatest predictive value was the students GMAT
score, which explained 12.5% of the variance,
� The second best predictor was the student’s undergraduate GPA score
explained 7.4% of the variation
23
Various combinations of variables were also used for a multiple regression
analysis. The results indicted that:
� The model with the best results was the model using the variables GMAT,
Under graduate GPA, and WORK, which explained 20.6% of the variance
on MBA GPA (Carver et al, 1994).
The conclusion of the study is that the GMAT and undergraduate GPA are the
best predictors of MBA success regardless of whether the program is full time or
distance learning. Other observations made were that the age of the students
did not appear to play a role in the student’s success. According to the
calculations, the following variables also had little impact on student
performance: time lapsed since last studies, undergraduate institution, major and
months work experience. When the study was repeated on students who did not
get admission based on their GMAT scores, the results were comparable to the
initial study. The study concludes by stating that “exploration of more qualitative
variables, such as quality of work experience, may prove more fruitful than
focusing exclusively on quantitative measures” (Carver et al, 1994).
3.1.5.5 Relationships between motivators and criteria in the selection of a
distance learning MBA programme in Hong Kong
This study explores why Hong Kong managers decide to pursue a distance
learning MBA degree and the criteria they use in selecting a desirable program.
The survey indicated that most of the respondents were concerned about the
reputation of the University, its programme curriculum, mode of delivery,
supporting facilities, and placement opportunities. This information should be
used in the marketing of MBA programs. “A fundamental means of marketing an
MBA programme is to produce a high quality product. This long-term strategy
entails keeping the admission standards high, providing comprehensive and
rigorous delivery and on-going evaluations of the total programme” (Chui, 1999).
24
3.2. Cultural diversity
In this section the demographics of South Africa will firstly be discussed.
Secondly, international studies on cultural diversity relating to University
admissions will be studied to find the relevancy to the research study.
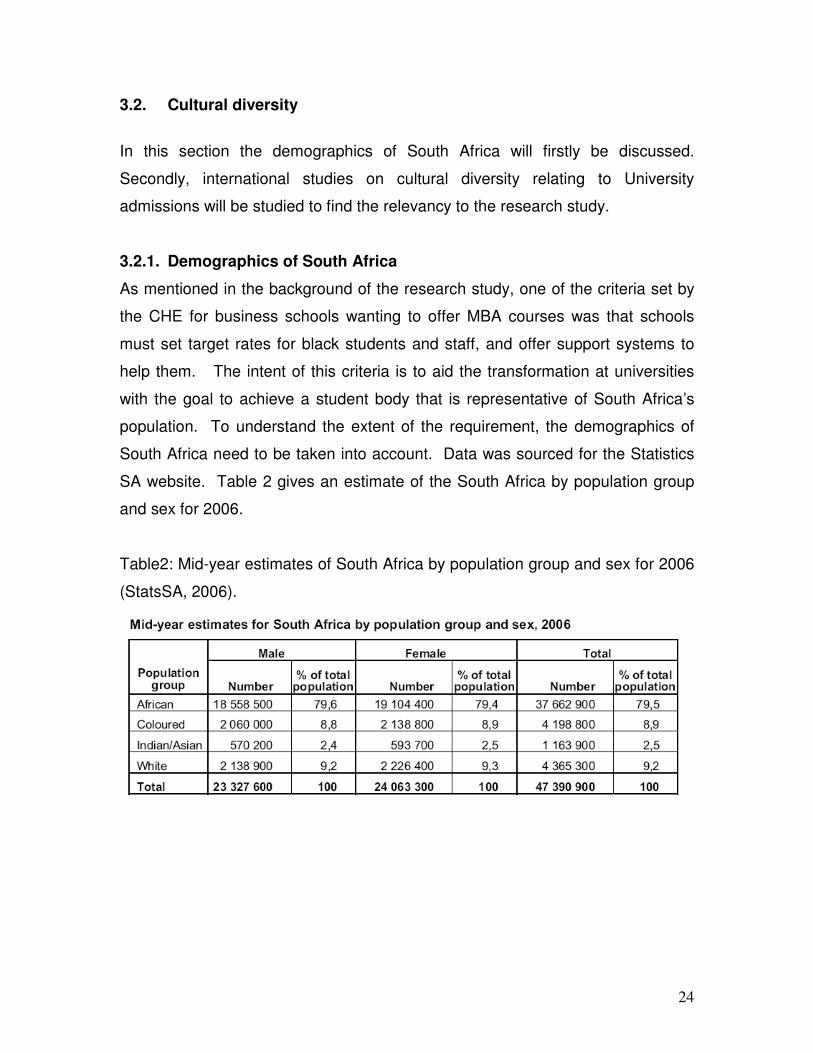
3.2.1. Demographics of South Africa
As mentioned in the background of the research study, one of the criteria set by
the CHE for business schools wanting to offer MBA courses was that schools
must set target rates for black students and staff, and offer support systems to
help them. The intent of this criteria is to aid the transformation at universities
with the goal to achieve a student body that is representative of South Africa’s
population. To understand the extent of the requirement, the demographics of
South Africa need to be taken into account. Data was sourced for the Statistics
SA website. Table 2 gives an estimate of the South Africa by population group
and sex for 2006.
Table2: Mid-year estimates of South Africa by population group and sex for 2006
(StatsSA, 2006).
25
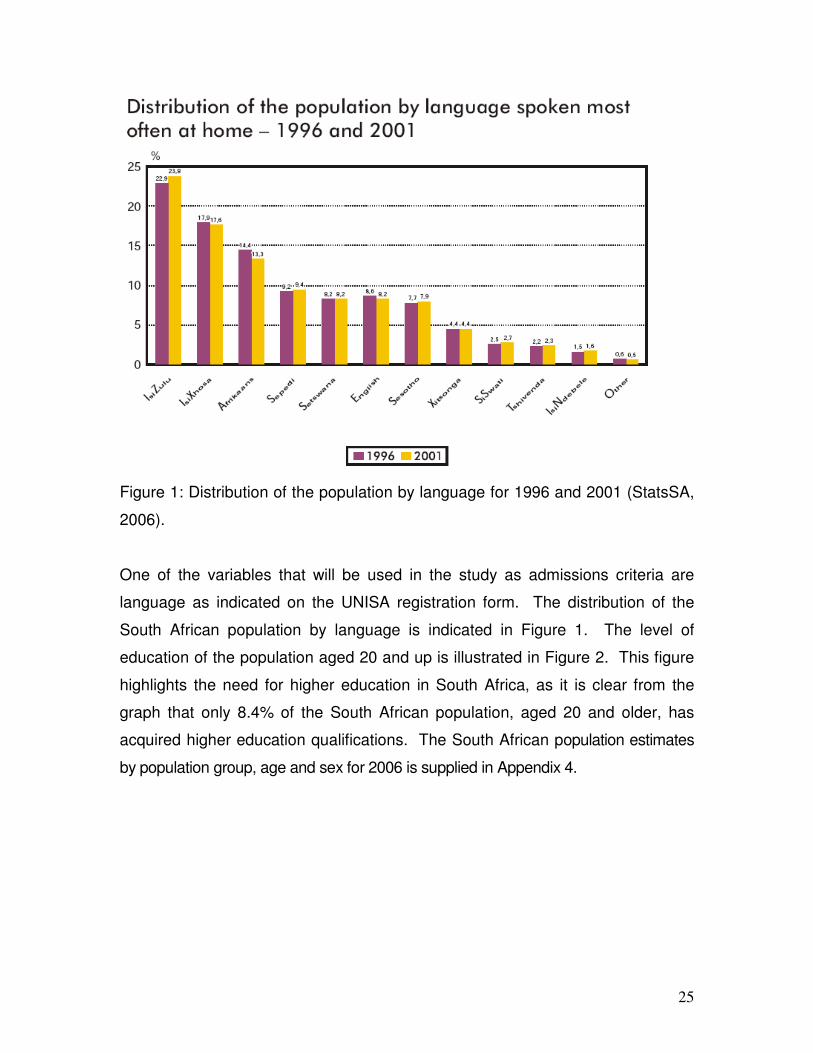
Figure 1: Distribution of the population by language for 1996 and 2001 (StatsSA,
2006).
One of the variables that will be used in the study as admissions criteria are
language as indicated on the UNISA registration form. The distribution of the
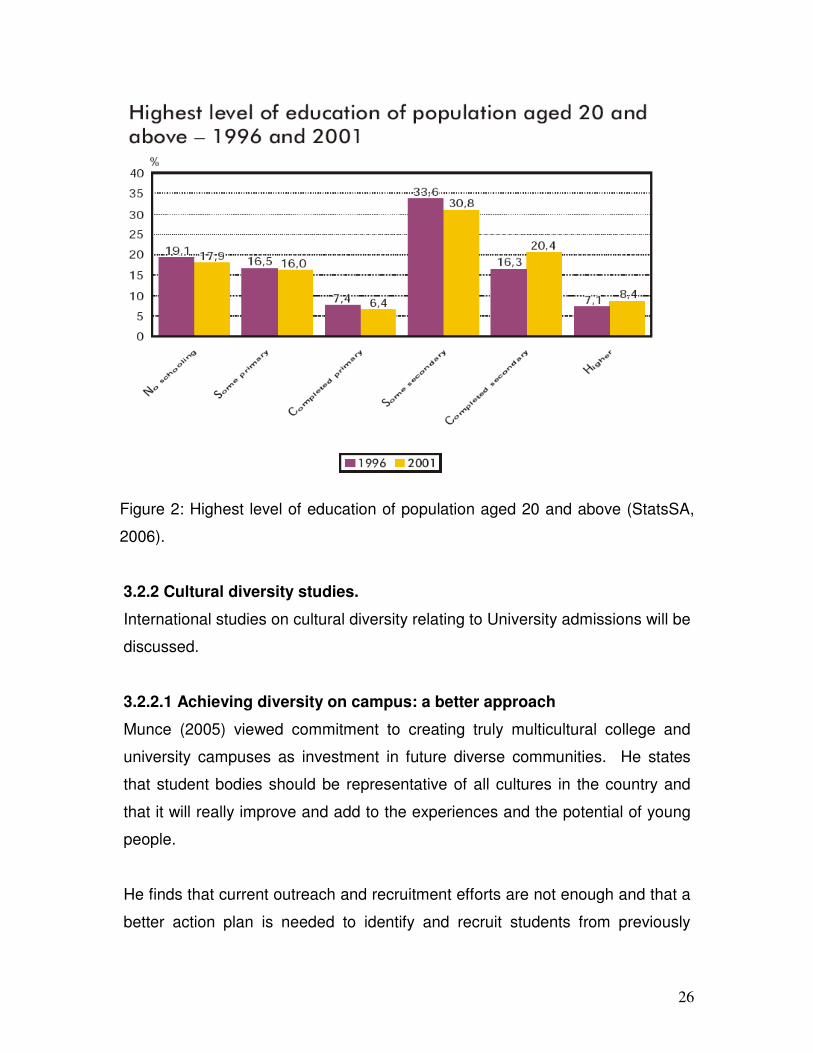
South African population by language is indicated in Figure 1. The level of
education of the population aged 20 and up is illustrated in Figure 2. This figure
highlights the need for higher education in South Africa, as it is clear from the
graph that only 8.4% of the South African population, aged 20 and older, has
acquired higher education qualifications. The South African population estimates
by population group, age and sex for 2006 is supplied in Appendix 4.
26
Figure 2: Highest level of education of population aged 20 and above (StatsSA,
2006).
3.2.2 Cultural diversity studies.
International studies on cultural diversity relating to University admissions will be
discussed.
3.2.2.1 Achieving diversity on campus: a better approach
Munce (2005) viewed commitment to creating truly multicultural college and
university campuses as investment in future diverse communities. He states
that student bodies should be representative of all cultures in the country and
that it will really improve and add to the experiences and the potential of young
people.
He finds that current outreach and recruitment efforts are not enough and that a
better action plan is needed to identify and recruit students from previously
27
disadvantaged backgrounds. Colleges and universities firstly need to be made
aware, and then acknowledge the fact that their current efforts result in the
under-representation of certain groups of students; and secondly they need to
equip themselves with the correct tools so that greater cultural diversity is
brought into these establishments.
Munce reminds these establishments that they must take into account the fact
that the process of developing a campus’s student body begins long before
possible candidates hand in their applications. Persons involved in creating the
criteria needed for enrolment influence the composition of classes two to three
years in advance. Therefore admissions criteria can be seen as a vital factor
and must be drawn up very carefully. In his own words admissions criteria
“open doors to some young people, and close them for others; often those who
already have too few viable options” (Munce, 2005).
The author further refers to research which shows that colleges and universities
have a tendency to select more candidates from groups which are already well
represented on campus and fewer candidates from underrepresented groups
causing unbalanced numbers. It also suggests that colleges and universities
mainly concentrate on students with excellent GPA scores in high school.
Munce says that this is not an unfair approach, as high school GPA’s “is among
the most reliable predictors of college performance”. But he then continues to
say that if colleges and universities build their admissions criteria solely on GPA
scores and take nothing else into account, diversity on campus will suffer and
certain capable students will not have been given an opportunity to represent
their minority group.
Munce recognises that colleges and universities have a lot of challenges
besides their admission criteria to deal with, but he makes it clear that
universities and colleges must turn away from a one-dimensional approach to

28
admittance and that they must look at different recruitment strategies in order to
make sure that diversity on campus becomes a reality.
3.2.2.2 A preliminary analysis of African American college students’
perceptions of racial preferences and affirmative action in making
admissions decisions at a predominantly white university
Antwi-Boasiako & Asagba (2005) points out that predominantly white
universities do not know how to regulate the use ‘race-based preferences’ for
the selection of students during admissions. They state that many colleges and
universities take in blacks as well as other ethnic group students using race as
their main admittance criteria. They found that many white students felt that by
using race as part of the admittance criteria with affirmative action in mind,
reverse discrimination was taking place which led to many white students taking
universities and colleges to court. On the other hand, as the author points out,
many black students felt offended by the fact that other (white) students
assumed that they were only admitted because of affirmative action, therefore
their skin colour, and not because of their intellectual abilities and
achievements.
According to Antwi-Boasiako et al, certain educators and political leaders made
it clear that they feel that all public colleges should use affirmative action
willingly and out of own accord. They feel that if colleges and universities do not
look at race as one of their considering factors during admissions decisions
doors will be closed and opportunities will be taken away from minority students.
The authors refers to American colleges where defenders for minority students
expect there to be less black students attending colleges every year until these
dwindling numbers become a huge concern for higher education institutions. In
fact, they mention that the number of black students enrolling for higher
education has already been steadily declining in the past years. The
consequence of these diminishing numbers of black students attending white
29
campuses will make it problematic for black communities to reach their goals for
“equality, greater opportunity, and progressive social change in American
Society” (Antwi-Boasiako et al, 2005).
Antwi-Boasiako et al states that “the educational gap between black and white
in college attainment will likely increase”. They foresee that equality in the
working environment will be even more difficult to reach, specifically at
management levels, if the number of blacks enrolling in colleges continues to
dwindle.
The research done by the authors of this article shows that there are black
students who can understand why affirmative action is needed, but at the same
time they do not wish to be associated with the stigma it is associated with. This
is because there are those who argue that black students enrolled on a campus
with an affirmative action policy are not qualified to be there. Most of the
respondents who took part in the study felt however that even though there is a
stigma associated with affirmative action, it is still very much needed and should
definitely be regarded as part of the selection criteria for higher education
institutions (Antwi-Boasiako et al, 2005).
Antwi-Boasiako et al refers to affirmative action as “a means of providing access
to opportunities, which are denied to minority groups” as well as “a means of
actions to eliminate discrimination”. However, they also mention that affirmative
action plans must be carefully planned and put into place without doing injustice
to others.
The authors concludes in saying that to prevent a ‘White America’ where most
of the managerial positions are filled with white people, one must start at college
level and more minorities need to be admitted. Antwi-Boasiako & Asagba finish
by saying: “Unless universities use their unique ways and means of opening
their doors to minorities without blocking qualified white applicants into a

30
predominantly white university, the controversy over affirmative action will
continue to be an academic debate without any practical solution”.
31
4. Research Methodology
This chapter will clarify the research methodology that was used, the data
collection method as well as the limitations of the study.
4.1 Research design
The research question will be answered by making use of quantitative statistical
techniques. The data used was collected from an existing database available at
the SBL administration department. The target population for the study are the
whole student population who started their MBL degree at UNISA in 2003. By
linking the registration data for 2003 with the information of students who
acquired their MBL qualification in 2005, the students who completed the
qualification in the minimum period of three years, were identified.
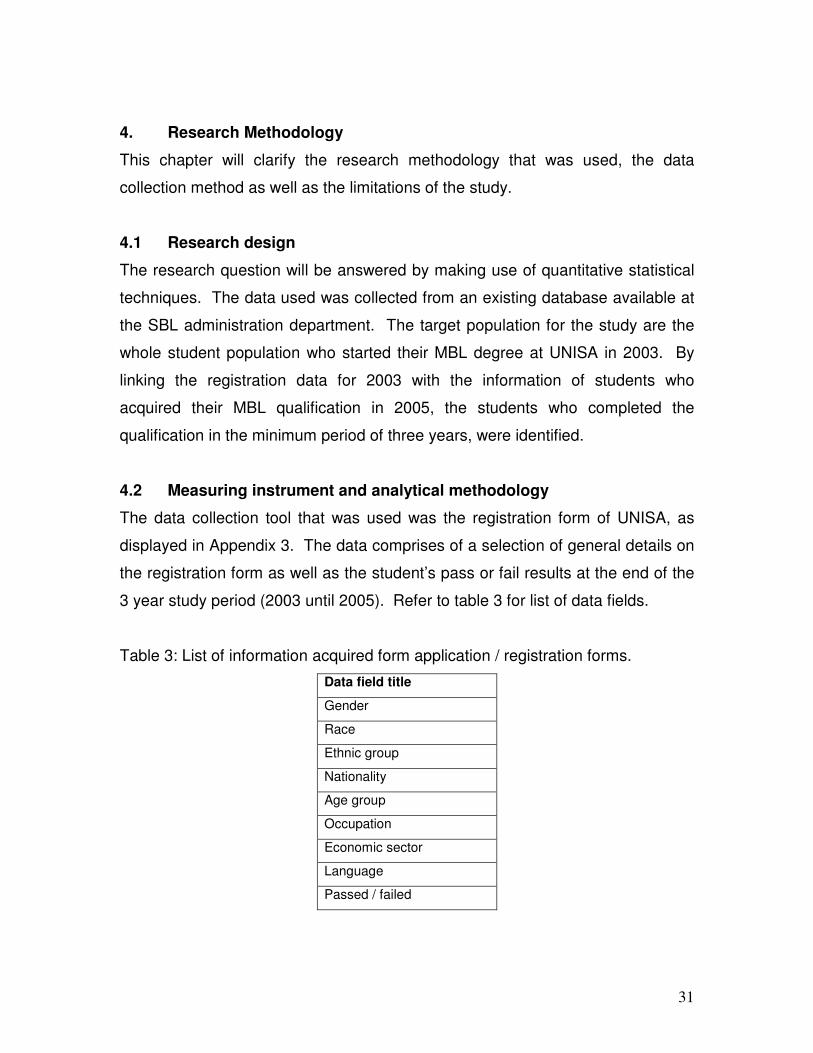
4.2 Measuring instrument and analytical methodology
The data collection tool that was used was the registration form of UNISA, as
displayed in Appendix 3. The data comprises of a selection of general details on
the registration form as well as the student’s pass or fail results at the end of the
3 year study period (2003 until 2005). Refer to table 3 for list of data fields.
Table 3: List of information acquired form application / registration forms.
Data field title
Gender
Race
Ethnic group
Nationality
Age group
Occupation
Economic sector
Language
Passed / failed
32
The data fields as set out in table 3, together with the corresponding pass / fail
results were received from the SBL in Excel format. The data was rearranged to
be in a user-friendly format. During this process the data was examined to
ensure that there were no data missing or wrongly recoded. Incomplete data
fields were excluded from the data set.
The collected data is all nominal of type, except for the age groups that is interval
of nature. This means that the data has classification but not order, distance or
origin (Cooper, 2003). This fact will determine what quantitative techniques can
be used to further analyse the data. A further consideration is that there are 724
fields of data, but each variable per field has a different number of classification
groups, this further complicates the calculations. Simple descriptive statistics will
be generated from the collected data. This will aid in getting a feel for the data.
Due to the fact that the data is nominal of nature, the descriptive statistics will not
contain values such as averages, maximums, minimums, means or standard
deviations.
In previous studies to determine success rates of MBA students, the following
three research methods were employed: regression analysis, multiple
discriminant analysis, and neural networks (Naik et al, 2004). For this study
classification trees, making use of CHAID algorithms will be employed.
The CHAID algorithm was originally proposed by Kass (1980) and the
Exhaustive CHAID by Biggs et al (1991). The CHAID algorithm only accepts
nominal or ordinal categorical predictors, and when predictors are continuous,
they are transformed into ordinal predictors. This method suits the study
perfectly as the data is mostly nominal. For a detailed description of the CHAID
algorithm method, refer to Appendix 7.
All the calculations done in the study was done on computer with the aid of SPSS
15.0 for Windows and MoonStats for Windows. The statistical methods used to
33
determine relatedness was Cramer’s V coefficients, while the Chi2 was used for
the hypothesis testing.
4.3 Assumptions
The following assumptions were made that could influence the outcome of the
study:
• That the students completed the applications forms honestly and accurately.
• That the data on the application forms were coded correctly by the staff at
UNISA.
• That the data supplied by UNISA was the correct data as per request.
• That the researcher transferred the data correctly to the statistical programs
used in the research.
• That the 2003 group is a good average and can be generalized for drawing
conclusions and making recommendation for other years.
4.4 Hypothesis
The steps in hypothesis testing are the following (Cooper, 2003):
• Establish a null hypothesis as well as the alternative hypothesis,
• Choose the statistical test,
• Select the desired level of confidence,
• Compute the actual test value of the data,
• Obtain the critical test values,
• Interpret the results.
The hypotheses that were tested in the study are listed below:
Rationale 1

34
The classification data available on the application forms of the MBL applicants
will be tested for correlation to the student’s success with regards to completing
their MBL in 3 years.
Hypothesis statement 1
HO: There is no difference between male and female students with regards to
completing their MBL in 3 years.
HA: There is a difference between male and female students with regards to
completing their MBL in 3 years.
Hypothesis statement 2
HO: There is no difference between students from previously disadvantaged
groups and white students with regards to completing their MBL in 3 years.
HA: There is a difference between students from previously disadvantaged
groups and white students with regards to completing their MBL in 3 years.
Hypothesis statement 3
HO: There is no difference between South African students and non-South
African students with regards to completing their MBL in 3 years.
HA: There is a difference between South African students and non-South African
students with regards to completing their MBL in 3 years.
Hypothesis statement 4
HO: There is no difference between students from different age groups with
regards to completing their MBL in 3 years.
HA: There is a difference between students from different age groups with
regards to completing their MBL in 3 years.
Hypothesis statement 5
HO: There is no difference between students who are not managers and students
who are managers with regards to completing their MBL in 3 years.
35
HA: There is a difference between students who are not managers and students
who are managers with regards to completing their MBL in 3 years.
Hypothesis statement 6
HO: There is no difference between students who are in the financial sector and
students who are not in the financial sectors with regards to completing their MBL
in 3 years.
HA: There is a difference between students who are in the financial sector and
students who are not in the financial sectors with regards to completing their MBL
in 3 years.
Hypothesis statement 7
HO: There is no difference between students who are English speaking and
students who are not English speaking with regards to completing their MBL in 3
years.
HA: There is a difference between students who are English speaking and
students who are not English speaking with regards to completing their MBL in 3
years..
Rationale 2
The combined use of general registration information that proved to have a
positive correlation to MBL success, will prove to be a better admissions tool to
predict successful MBL completion than the current admissions process.
Hypothesis statement 8
HO: The newly developed admission tool is less successful in predicting students
who will complete their MBL qualification in 3 years, than the current process.
HA: The newly developed admission tool is more successful in predicting
students who will complete their MBL qualification in 3 years, than the current
process.
36
5. Analysis of research outcomes
Once data processing has been completed, the analysis of this data should
follow. Data analysis is the statistical design and tests applied to the obtained
data to test the various hypotheses (Cooper, 2003).
Frequency distribution refers to the need to organise randomly collected data.
The purpose of grouping data is to reduce the number of figures or scores
presented in a distribution so as to enable the reader to grasp the main features
of the data and to present the information more effectively (Cooper, 2003).
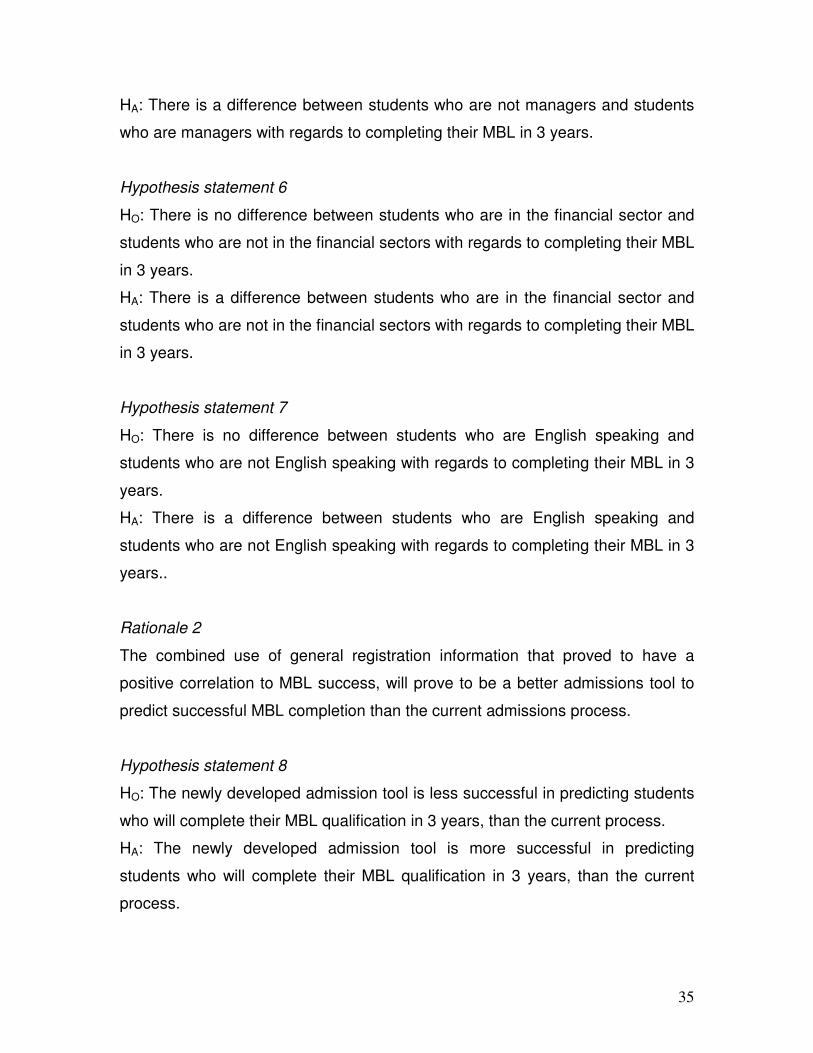
5.1. Frequency Distribution
The frequency table for the data can be seen in Appendix 5. There were 724
students that enrolled in 2003. The data from the frequency tables were
arranged from big to small and percentages were calculated, this data are
graphically displayed in figure 3 to figure 11.
STUDENT BREAKDOWN PER GENDER
0
100
200
300
400
500
600
700
800
Total Male Female
GENDER
NU
MB
ER
OF
ST
UD
EN
TS
0
20
40
60
80
100
120
% O
F S
TU
DE
NT
S
Frequencies (n)
Percentages (%)
Figure 3: Frequency and percentage of students per gender group.
37
BREAKDOWN PER RACE
0
50
100
150
200
250
300
350
400
450
500
Black White Asian Coloured
NU
MB
ER
OF
ST
UD
EN
TS
0
10
20
30
40
50
60
70
% O
F S
TU
DE
NT
S
Frequencies (n)
Percentages (%)
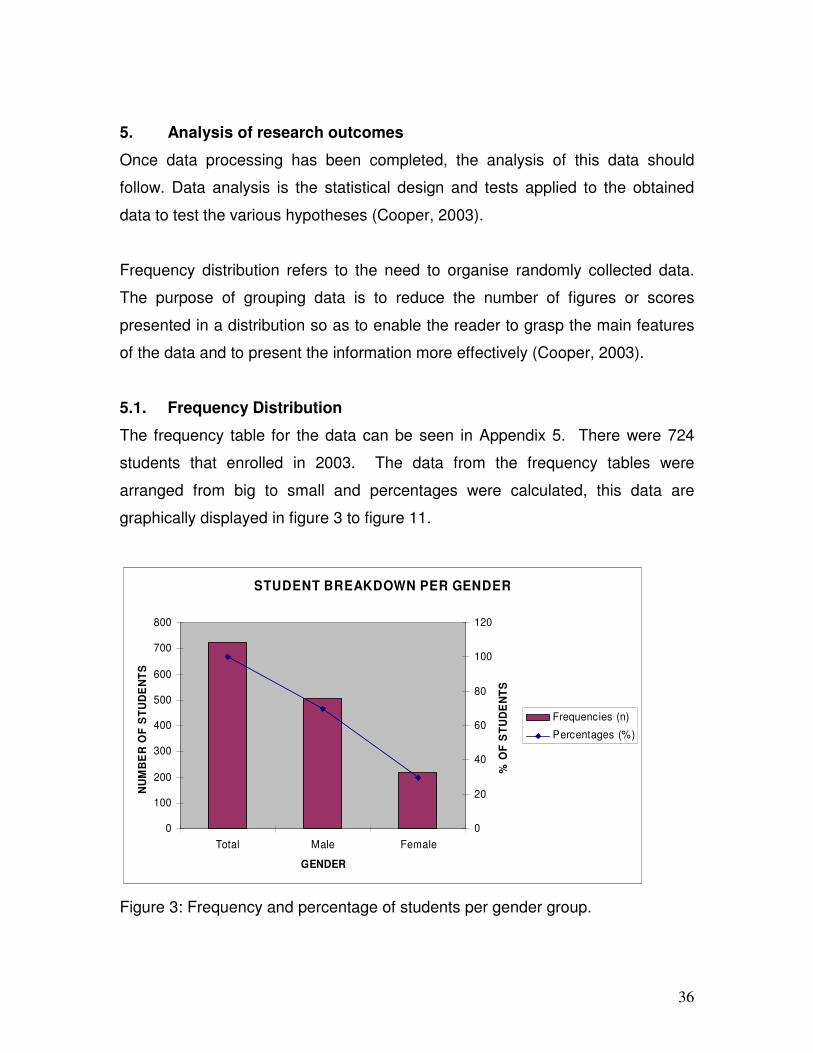
Figure 4: Frequency and percentage of students per race.
BREAKDOWN PER ETHNIC GROUP
0
50
100
150
200
250
300
Bla
ck U
ncla
ssified
White
Asia
n
Tswan
aZul
u
North
Sot
ho
Xho
sa (T
ransk
ei)
Colo
ured
Ndeb
ele
Swaz
i
Sou
th S
otho
Sts
onga/
Sha
ngaa
n
Ven
da
NU
MB
ER
OF
ST
UD
EN
TS
0
5
10
15
20
25
30
35
% O
F S
TU
DE
NT
S
Frequencies (n)
Percentages (%)
Figure 5: Frequency and percentage of students per ethnic group.
38
BREAKDOWN PER NATIONALITY
0
100
200
300
400
500
600
RSA
Zimba
bwe
Erit
rea
Swaz
iland
Oth
er
Unknow
n
Botsw
ana
Ken
ya
Nam
ibia
Zambi
a
Unite
d Kin
gdom
Leso
tho
Mal
awi
Tanza
nia
Gha
na
NU
MB
ER
OF
ST
UD
EN
TS
0
10
20
30
40
50
60
70
80
% O
F S
TU
DE
NT
S
Frequencies (n)
Percentages (%)
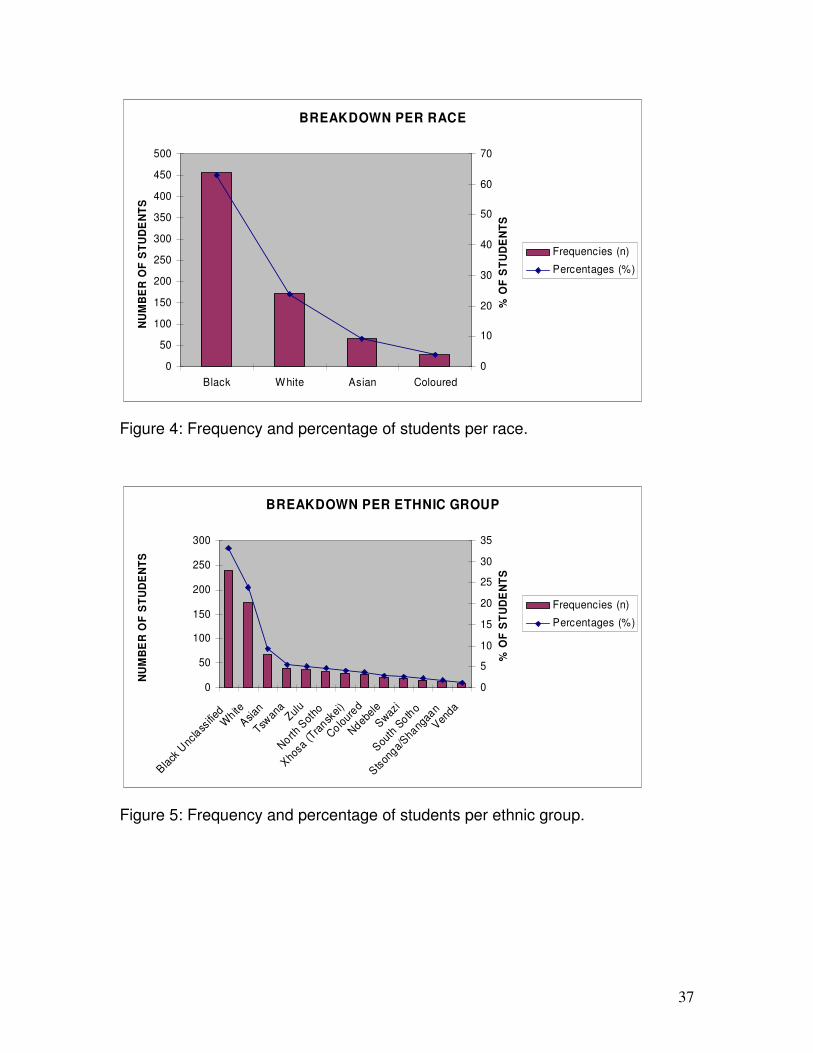
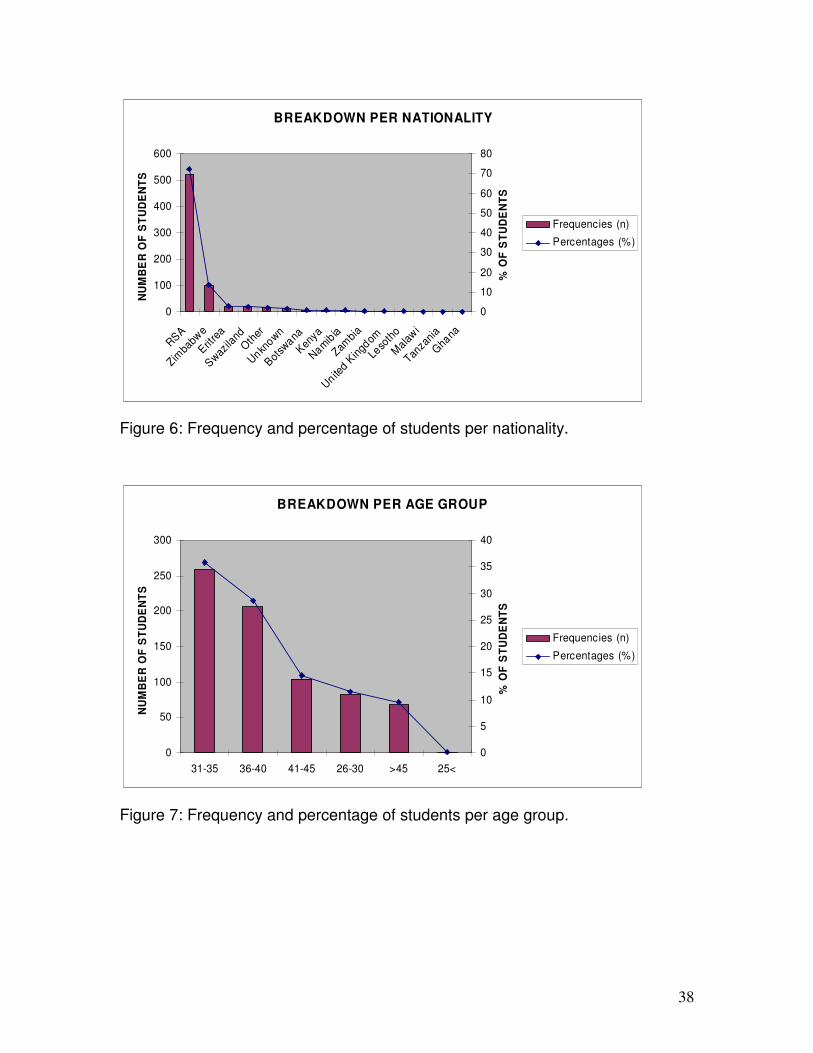
Figure 6: Frequency and percentage of students per nationality.
BREAKDOWN PER AGE GROUP
0
50
100
150
200
250
300
31-35 36-40 41-45 26-30 >45 25<
NU
MB
ER
OF
ST
UD
EN
TS
0
5
10
15
20
25
30
35
40
% O
F S
TU
DE
NT
S
Frequencies (n)
Percentages (%)
Figure 7: Frequency and percentage of students per age group.
39
BR
EA
KD
OW
N P
ER
OC
CU
PA
TIO
N
0
50
10
0
15
0
20
0
25
0
Manager/Administrator
Occupation not
Engineer
Accountant/Auditor
Clerical or Related
Occupation unknown
Computer Specialist
Personell officer
Technical Worker
Teacher
Sales worker
Medical doctor/dentist
Lecturer/professor
Full-Time Student at
Technician
Jurist
Enginering/Science
Ops
Architect/Quantity
Nurce,dietician
Social/receational
Social scientist
Health technoligist
Police
Service Worker
Farm management
Life/Physical Scientist
Ressearch worker
Farmer/farm manager
Permanenet force
Full time studen
Operator
Operative
Citizen force member
National service
Unemployed
Protection service
NUMBER OF STUDENTS
0 5 10
15
20
25
30
% OF STUDENTS
Fre
qu
en
cie
s (n
)
Pe
rce
nta
ge
s (%
)
Fig
ure
8: F
requ
en
cy a
nd
pe
rce
nta
ge
of s
tud
en
ts p
er o
ccup
atio
n.
BR
EA
KD
OW
N P
ER
EC
CO
NO
MIC
SE
CT
OR
0
20
40
60
80
10
0
12
0
14
0
16
0
18
0
Other
Profesional and
Finanace,
Manufacturing
Public
Mining
Transport
Hospital and
Education
Business and
Education
Agriculture,
Wholesale and
Other
Welfare and
Personal
Construction
Entertainment
Education
NUMBER OF STUDENTS
0 5 10
15
20
25
% OF STUDENTS
Fre
qu
en
cie
s (n
)
Pe
rce
nta
ge
s (%
)
Fig
ure
9: F
requ
en
cy a
nd
pe
rce
nta
ge
of s
tud
en
ts p
er e
con
om
ic s
ecto
r.
40
BREAKDOWN PER LANGUAGES
0
50
100
150
200
250
En
glis
hA
frik
aa
ns
Sh
on
a
Zu
luT
sw
an
a
Xh
os
aN
oth
So
tho
Oth
er
Fo
reig
n
Nd
eb
ele
So
uth
So
tho
Sw
ati
Oth
er
Afr
ica
n
Ts
on
ga
/Sh
an
ga
an
Po
rtu
gu
es
e
Ve
nd
a
Afr
ika
an
s/E
ng
lish
Nd
on
ga
Ge
rma
nF
ren
ch
Gre
ek
He
bre
wIt
ala
in
NU
MB
ER
OF
ST
UD
EN
TS
0
5
10
15
20
25
30
35
% O
F S
TU
DE
NT
S
Frequencies (n)
Percentages (%)
Figure 10: Frequency and percentage of students per language.
BREAKDOWN OF PASSED/FAILED
0
100
200
300
400
500
600
700
Failed Passed
NU
MB
ER
OF
ST
UD
EN
TS
0
10
20
30
40
50
60
70
80
90
% O
F S
TU
DE
NT
S
Frequencies (n)
Percentages (%)
Figure 11: Frequency and percentage of students passed / failed.
41
The data was subsequently re-arranged only to display the information of the
students that passed. This supplied the researcher with 151 data points. The
students that passed were spilt up per classification per variable and the
percentages calculated. These graphs will give an indication of which
classification group per variable were most and least successful. This data is
graphically represented in figure 12 to figure 19 (the black bar in the graphs
represents the pass rate percentage for the total group).
% STUDENTS PASSED PER GENDER
18
18.5
19
19.5
20
20.5
21
21.5
22
Male Total Female
GENDER
PE
RC
EN
TA
GE
(%
)
Figure 12: Percentage of students passed per gender.

42
% OF STUDENTS PASSED PER RACE
0
5
10
15
20
25
30
White Asian Total Black Coloured
RACE
PE
RC
EN
TA
GE
(%
)
Figure 13: Percentage of students passed per race.
% OF STUDENTS PASSED PER ETHNIC GROUP
0
5
10
15
20
25
30
35
Ven
da
White
Bla
ck U
ncla
ssified
Asian
Sou
th S
otho
Total
Ndeb
ele
Colo
ured
Zulu
Sts
onga/
Sha
ngaa
n
Xho
sa (T
ransk
ei)
North
Sot
ho
Swaz
i
Tswan
a
LANGUAGE
PE
RC
EN
TA
GE
(%
)
Figure 14: Percentage of students passed per ethnic group.
43
% STUDENTS PASSED PER NATIONALITY
0
20
40
60
80
100
120
Mal
awi
Leso
tho
Gha
na
Ken
ya
Erit
rea
Zimba
bwe
Nam
ibia
Unite
d Kin
gdom
Swaz
iland
Total
RSA
Oth
er
Bot
swana
Zambi
a
Tanza
nia
NATIONALITY
PE
RC
EN
TA
GE
(%
)
Figure 15: Percentage of students passed per nationality.
% STUDENTS PASSED PER AGE GROUP
0
5
10
15
20
25
30
31-35 41-45 Total 36-40 26-30 >45 25<
AGE
PE
RC
EN
TA
GE
(%
)
Figure 16: Percentage of students passed per age group.

44
% STUDENTS PASSED PER OCCUPATION
0
20
40
60
80
100
120F
arm
ma
nag
em
en
t ad
vis
or
Perm
an
enet
forc
e m
em
ber
Op
s R
es
earc
h/S
yste
m...
Te
chn
icia
nP
ers
one
ll off
ice
rH
eal t
h t
ech
no
ligis
tS
erv
ice W
ork
er
(Oth
er)
Com
pu
ter
Sp
ec
ialis
tE
ng
iner i
ng
/Sc
ien
ce
Te
chE
ng
ineer
Tech
nic
al W
ork
er
(Oth
er)
Full-
Tim
e S
tud
ent a
t U
NIS
AO
ccup
atio
n u
nk
no
wn
Ac
cou
nta
nt/A
ud
itor
Arc
hite
ct/Q
ua
ntit
y s
ur...
Soc
ial s
cie
ntis
tS
ale
s w
ork
er
To
tal
Le
ctu
rer/
pro
fess
or
Occ
up
atio
n n
ot C
lass
ified
Med
ica
l docto
r/d
en
tist
Ma
na
ger/
Adm
inis
tra
tor
Cle
rica
l or
Rela
ted
Work
er
Teach
er
Juri
stN
urc
e,d
ietici
an
Soc
ial/r
ece
atio
nal w
ork
er
Po
lice
Offic
er/
dete
ctiv
eL
ife
/Ph
ysi
cal
Sc
ienti
stR
es
sea
rch
work
er
Farm
er /
farm
ma
na
ge
rF
ull
t ime
stu
de
n (
ele
se..
.O
pera
tor
Op
era
tive
Citi
zen f
orc
e m
em
be
rN
ation
al s
erv
ice
tra
inee
Une
mp
loy
ed
Pro
tectio
n s
erv
ice
OCCUPATION
PE
RC
EN
TA
GE
(%
)
Figure 17: Percentage of students passed per occupation.
% STUDENTS PASSED PER ECCONOMIC SECTOR
0
10
20
30
40
50
60
Wh
ole
sale
and
reta
il tr
ade
Con
stru
ctio
n
Oth
er T
echn
icia
ns
Bus
ines
s and
rep
air
serv
ice
Fin
anace
, In
sura
nce a
nd r
e..
Pro
fesi
onal
and
rela
ted
se...
Manu
fact
urin
g
Oth
er
Tota
l
Agri
cultu
re, F
ore
stry
and
...
Edu
catio
n (s
econd
ary)
We
lfare
and
non
-pro
f it m
...
Hos
pita
l and
heal
th s
ervi
ces
Pub
lic a
dmin
istr
atio
n
Tra
nsp
ort c
omm
uni
catio
n...
Edu
catio
n (t
ertia
ry)
Min
ing
Pers
onal
ser
vice
, in
cludi
n...
Ente
rtain
men
t and
rec
reat
...
Edu
catio
n (P
rim
ary)
ECCONOMIC SECTOR
PE
RC
EN
TA
GE
(%
)
Figure 18: Percentage of students passed per economic sector.
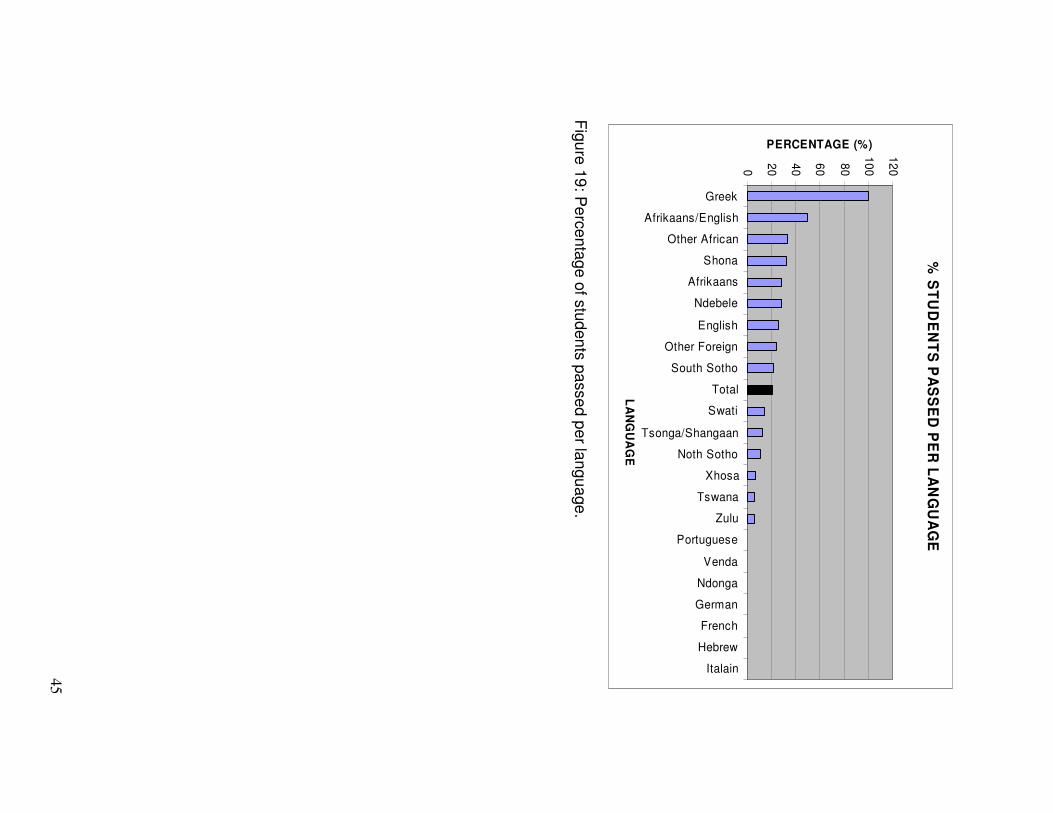
45
% S
TU
DE
NT
S P
AS
SE
D P
ER
LA
NG
UA
GE
0
20
40
60
80
10
0
12
0
Greek
Afrikaans/English
Other African
Shona
Afrikaans
Ndebele
English
Other Foreign
South Sotho
Total
Swati
Tsonga/Shangaan
Noth Sotho
Xhosa
Tswana
Zulu
Portuguese
Venda
Ndonga
German
French
Hebrew
Italain
LA
NG
UA
GE
PERCENTAGE (%)
Fig
ure
19
: Pe
rce
nta
ge
of s
tud
en
ts p
asse
d p
er la
ngu
age
.
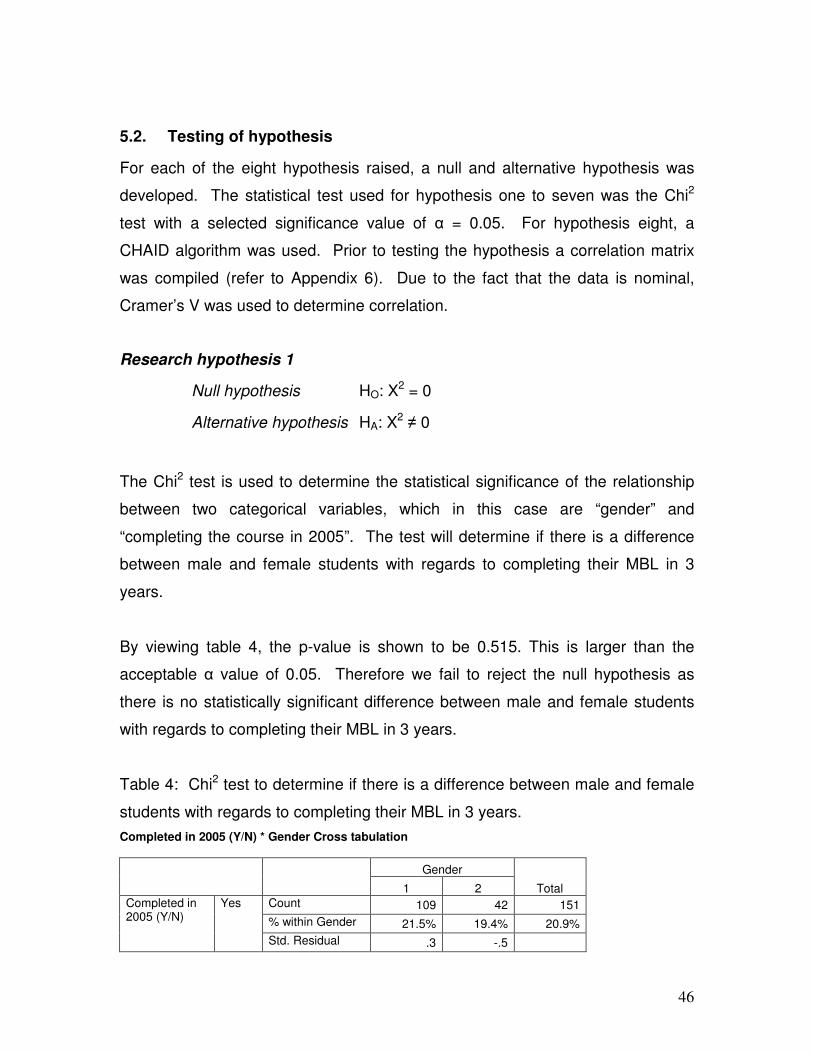
46
5.2. Testing of hypothesis
For each of the eight hypothesis raised, a null and alternative hypothesis was
developed. The statistical test used for hypothesis one to seven was the Chi2
test with a selected significance value of α = 0.05. For hypothesis eight, a
CHAID algorithm was used. Prior to testing the hypothesis a correlation matrix
was compiled (refer to Appendix 6). Due to the fact that the data is nominal,
Cramer’s V was used to determine correlation.
Research hypothesis 1
Null hypothesis HO: X2 = 0
Alternative hypothesis HA: X2 ≠ 0
The Chi2 test is used to determine the statistical significance of the relationship
between two categorical variables, which in this case are “gender” and
“completing the course in 2005”. The test will determine if there is a difference
between male and female students with regards to completing their MBL in 3
years.
By viewing table 4, the p-value is shown to be 0.515. This is larger than the
acceptable α value of 0.05. Therefore we fail to reject the null hypothesis as
there is no statistically significant difference between male and female students
with regards to completing their MBL in 3 years.
Table 4: Chi2 test to determine if there is a difference between male and female
students with regards to completing their MBL in 3 years.
Completed in 2005 (Y/N) * Gender Cross tabulation
Gender
Total 1 2
Completed in 2005 (Y/N)
Yes Count 109 42 151
% within Gender 21.5% 19.4% 20.9%
Std. Residual .3 -.5
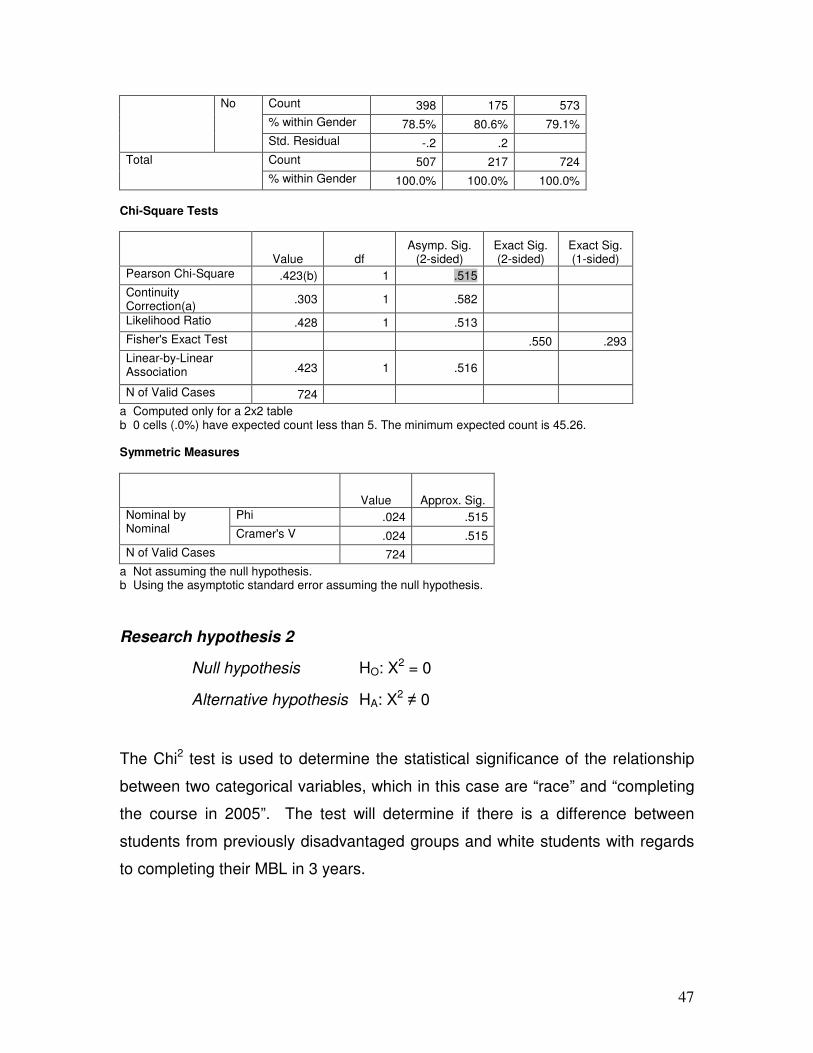
47
No Count 398 175 573
% within Gender 78.5% 80.6% 79.1%
Std. Residual -.2 .2
Total Count 507 217 724
% within Gender 100.0% 100.0% 100.0%
Chi-Square Tests
Value df Asymp. Sig.
(2-sided) Exact Sig. (2-sided)
Exact Sig. (1-sided)
Pearson Chi-Square .423(b) 1 .515
Continuity Correction(a)
.303 1 .582
Likelihood Ratio .428 1 .513
Fisher's Exact Test .550 .293
Linear-by-Linear Association .423 1 .516
N of Valid Cases 724
a Computed only for a 2x2 table b 0 cells (.0%) have expected count less than 5. The minimum expected count is 45.26. Symmetric Measures
Value Approx. Sig.
Nominal by Nominal
Phi .024 .515
Cramer's V .024 .515
N of Valid Cases 724
a Not assuming the null hypothesis. b Using the asymptotic standard error assuming the null hypothesis.
Research hypothesis 2
Null hypothesis HO: X2 = 0
Alternative hypothesis HA: X2 ≠ 0
The Chi2 test is used to determine the statistical significance of the relationship
between two categorical variables, which in this case are “race” and “completing
the course in 2005”. The test will determine if there is a difference between
students from previously disadvantaged groups and white students with regards
to completing their MBL in 3 years.

48
By viewing table 5, the p-value is shown to be 0.006. This is smaller than the
acceptable α value of 0.05. Therefore we reject the null hypothesis as there is a
statistically significant difference between the white and previously
disadvantaged students with regards to completing their MBL in 3 years.
Table 5: Chi2 test to determine if there is a difference between students from
previously disadvantaged groups and white students with regards to completing
their MBL in 3 years.
Completed in 2005 (Y/N) * Race Cross tabulation
Race
Total White Other
Completed in 2005 (Y/N)
Yes Count 49 102 151
% within Race 28.3% 18.5% 20.9%
Std. Residual 2.2 -1.2
No Count 124 449 573
% within Race 71.7% 81.5% 79.1%
Std. Residual -1.1 .6
Total Count 173 551 724
% within Race 100.0% 100.0% 100.0%
Chi-Square Tests
Value df Asymp. Sig.
(2-sided) Exact Sig. (2-sided)
Exact Sig. (1-sided)
Pearson Chi-Square 7.679(b) 1 .006
Continuity Correction(a)
7.096 1 .008
Likelihood Ratio 7.303 1 .007
Fisher's Exact Test .007 .005
Linear-by-Linear Association 7.669 1 .006
N of Valid Cases 724
a Computed only for a 2x2 table b 0 cells (.0%) have expected count less than 5. The minimum expected count is 36.08. Symmetric Measures
Value Approx. Sig.
Nominal by Nominal
Phi .103 .006
Cramer's V .103 .006
N of Valid Cases 724
a Not assuming the null hypothesis. b Using the asymptotic standard error assuming the null hypothesis.

49
Research hypothesis 3
Null hypothesis HO: X2 = 0
Alternative hypothesis HA: X2 ≠ 0
The Chi2 test is used to determine the statistical significance of the relationship
between two categorical variables, which in this case are “nationality” and
“completing the course in 2005”. The test will determine if there is a difference
between South African students and non-South African students with regards to
completing their MBL in 3 years.
By viewing table 6, the p-value is shown to be 0.000. This is smaller than the
acceptable α value of 0.05. Therefore we reject the null hypothesis as there is a
statistically significant difference between the South African and non-South
African students with regards to completing their MBL in 3 years.
Table 6: Chi2 test to determine if there is a difference between South African
students and non-South African students with regards to completing their MBL in
3 years.
Completed in 2005 (Y/N) * Nationality Cross tabulation
Nationality Total
RSA Other
Completed in 2005 (Y/N)
Yes Count 90 61 151
% within Nationality 17.2% 30.3% 20.9%
Std. Residual -1.8 2.9
No Count 433 140 573
% within Nationality 82.8% 69.7% 79.1%
Std. Residual .9 -1.5
Total Count 523 201 724
% within Nationality 100.0% 100.0% 100.0%
Chi-Square Tests
Value df Asymp. Sig.
(2-sided) Exact Sig. (2-sided)
Exact Sig. (1-sided)

50
Pearson Chi-Square 15.187(b) 1 .000
Continuity Correction(a)
14.402 1 .000
Likelihood Ratio 14.405 1 .000
Fisher's Exact Test .000 .000
Linear-by-Linear Association 15.166 1 .000
N of Valid Cases 724
a Computed only for a 2x2 table b 0 cells (.0%) have expected count less than 5. The minimum expected count is 41.92. Symmetric Measures
Value Approx. Sig.
Nominal by Nominal
Phi -.145 .000
Cramer's V .145 .000
N of Valid Cases 724
a Not assuming the null hypothesis. b Using the asymptotic standard error assuming the null hypothesis.
Research hypothesis 4
Null hypothesis HO: X2 = 0
Alternative hypothesis HA: X2 ≠ 0
The Chi2 test is used to determine the statistical significance of the relationship
between two categorical variables, which in this case are “age” and “completing
the course in 2005”. The test will determine if there is a difference between
students from different age groups with regards to completing their MBL in 3
years.
By viewing table 7, the p-value is shown to be 0.035. This is smaller than the
acceptable α value of 0.05. Therefore we reject the null hypothesis as there is a
statistically significant difference between students from different age groups with
regards to completing their MBL in 3 years.
Table 7: Chi2 test to determine if there is a difference between students from
different age groups with regards to completing their MBL in 3 years.
Completed in 2005 (Y/N) * Date of Birth Cross tabulation

51
Date of Birth Total
1 2 3 4 5
Completed in 2005 (Y/N)
Yes Count 7 25 40 66 13 151
% within Date of Birth 10.1% 23.8% 19.3% 25.5% 15.7% 20.9%
Std. Residual -2.0 .7 -.5 1.6 -1.0
No Count 62 80 167 193 70 572
% within Date of Birth 89.9% 76.2% 80.7% 74.5% 84.3% 79.1%
Std. Residual 1.0 -.3 .3 -.8 .5
Total Count 69 105 207 259 83 723
% within Date of Birth 100.0% 100.0% 100.0% 100.0% 100.0% 100.0%
Chi-Square Tests
Value df Asymp. Sig.
(2-sided)
Pearson Chi-Square 10.349(a) 4 .035
Likelihood Ratio 11.134 4 .025
Linear-by-Linear Association
1.466 1 .226
N of Valid Cases 723
a 0 cells (.0%) have expected count less than 5. The minimum expected count is 14.41. Symmetric Measures
Value Approx. Sig.
Nominal by Nominal
Phi .120 .035
Cramer's V .120 .035
N of Valid Cases 723
a Not assuming the null hypothesis. b Using the asymptotic standard error assuming the null hypothesis.
Research hypothesis 5
Null hypothesis HO: X2 = 0
Alternative hypothesis HA: X2 ≠ 0
The Chi2 test is used to determine the statistical significance of the relationship
between two categorical variables, which in this case are “occupation” and
“completing the course in 2005”. The test will determine if there is a difference
between students who are not managers and students who are managers with
regards to completing their MBL in 3 years.
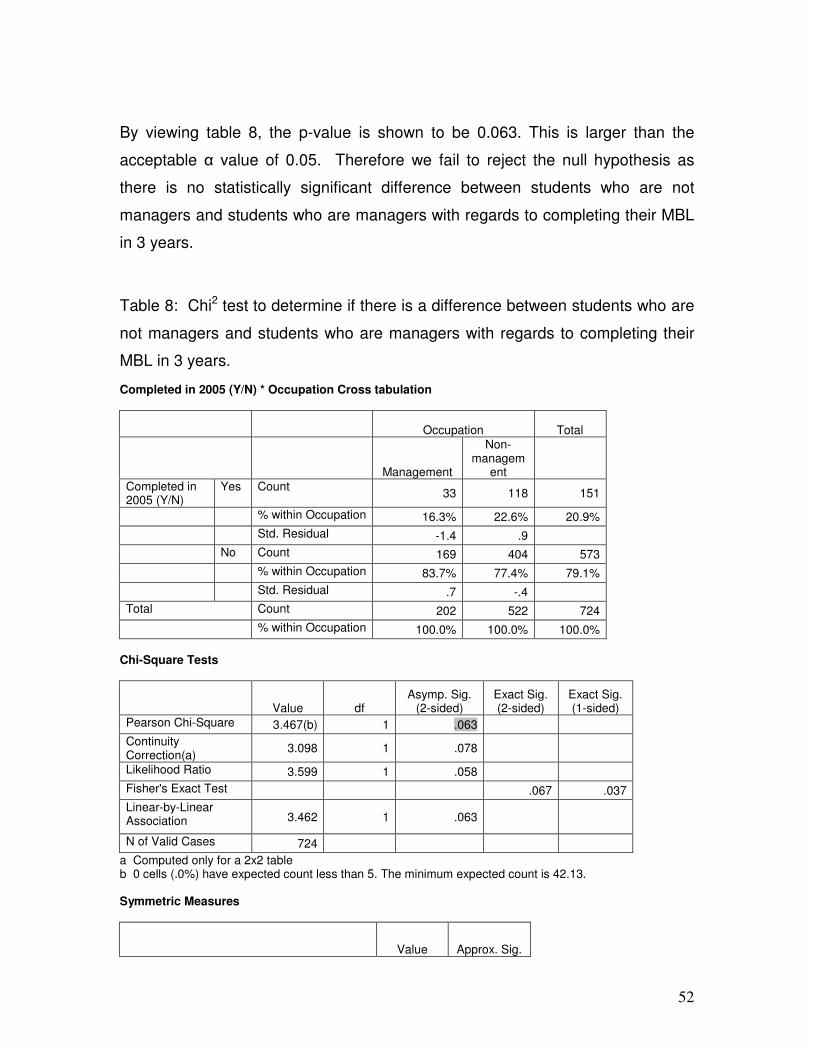
52
By viewing table 8, the p-value is shown to be 0.063. This is larger than the
acceptable α value of 0.05. Therefore we fail to reject the null hypothesis as
there is no statistically significant difference between students who are not
managers and students who are managers with regards to completing their MBL
in 3 years.
Table 8: Chi2 test to determine if there is a difference between students who are
not managers and students who are managers with regards to completing their
MBL in 3 years.
Completed in 2005 (Y/N) * Occupation Cross tabulation
Occupation Total
Management
Non-managem
ent
Completed in 2005 (Y/N)
Yes Count 33 118 151
% within Occupation 16.3% 22.6% 20.9%
Std. Residual -1.4 .9
No Count 169 404 573
% within Occupation 83.7% 77.4% 79.1%
Std. Residual .7 -.4
Total Count 202 522 724
% within Occupation 100.0% 100.0% 100.0%
Chi-Square Tests
Value df Asymp. Sig.
(2-sided) Exact Sig. (2-sided)
Exact Sig. (1-sided)
Pearson Chi-Square 3.467(b) 1 .063
Continuity Correction(a)
3.098 1 .078
Likelihood Ratio 3.599 1 .058
Fisher's Exact Test .067 .037
Linear-by-Linear Association 3.462 1 .063
N of Valid Cases 724
a Computed only for a 2x2 table b 0 cells (.0%) have expected count less than 5. The minimum expected count is 42.13. Symmetric Measures
Value Approx. Sig.

53
Nominal by Nominal
Phi -.069 .063
Cramer's V .069 .063
Contingency Coefficient .069 .063
N of Valid Cases 724
a Not assuming the null hypothesis. b Using the asymptotic standard error assuming the null hypothesis.
Research hypothesis 6
Null hypothesis HO: X2 = 0
Alternative hypothesis HA: X2 ≠ 0
The Chi2 test is used to determine the statistical significance of the relationship
between two categorical variables, which in this case are “economic sector” and
“completing the course in 2005”. The test will determine if there is a difference
between students who are in the financial sector and students who are not in the
financial sectors with regards to completing their MBL in 3 years.
By viewing table 9, the p-value is shown to be 0.328. This is larger than the
acceptable α value of 0.05. Therefore we fail to reject the null hypothesis as
there is no statistically significant difference between students in the financial
sector and students who are not in the financial sector with regards to completing
their MBL in 3 years.
Table 9: Chi2 test to determine if there is a difference between students who are
in the financial sector and students who are not in the financial sectors with
regards to completing their MBL in 3 years.
Completed in 2005 (Y/N) * Economic sector Cross tabulation
Economic sector
Total Financial
sector Other sectors
Completed in 2005 (Y/N)
Yes Count 27 124 151
% within Economic sector
24.3% 20.2% 20.9%
Std. Residual .8 -.3
No Count 84 489 573
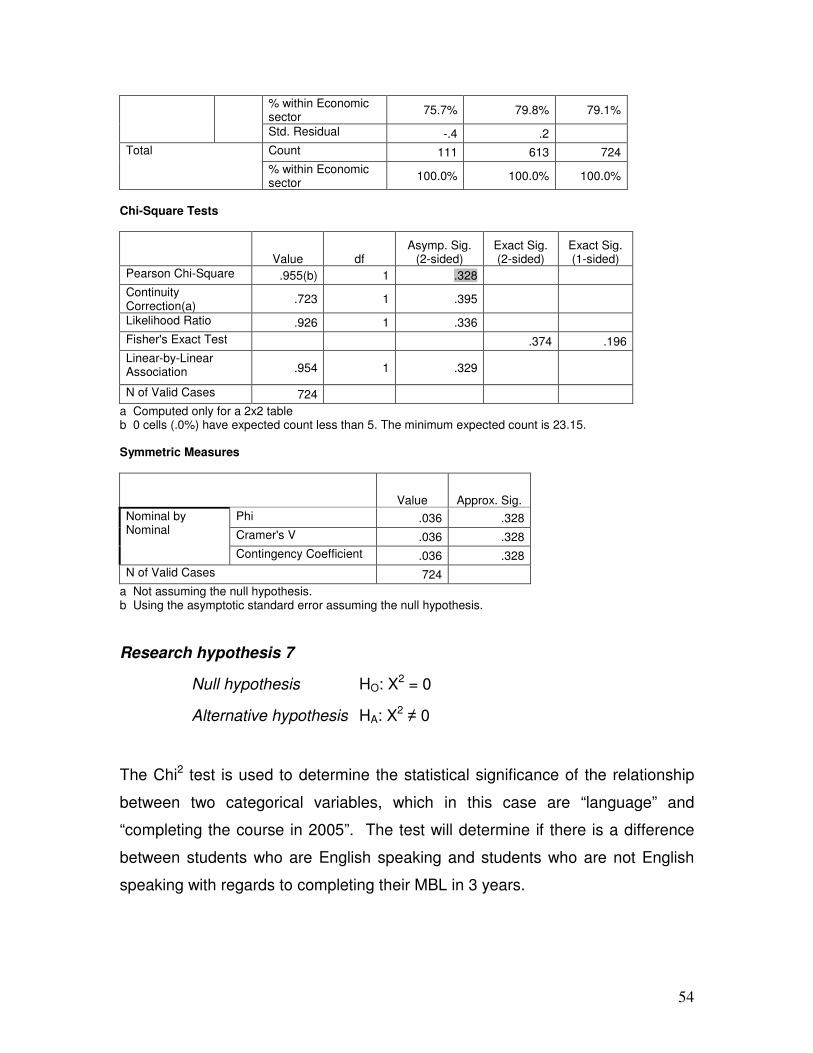
54
% within Economic sector
75.7% 79.8% 79.1%
Std. Residual -.4 .2
Total Count 111 613 724
% within Economic sector
100.0% 100.0% 100.0%
Chi-Square Tests
Value df Asymp. Sig.
(2-sided) Exact Sig. (2-sided)
Exact Sig. (1-sided)
Pearson Chi-Square .955(b) 1 .328
Continuity Correction(a)
.723 1 .395
Likelihood Ratio .926 1 .336
Fisher's Exact Test .374 .196
Linear-by-Linear Association .954 1 .329
N of Valid Cases 724
a Computed only for a 2x2 table b 0 cells (.0%) have expected count less than 5. The minimum expected count is 23.15. Symmetric Measures
Value Approx. Sig.
Nominal by Nominal
Phi .036 .328
Cramer's V .036 .328
Contingency Coefficient .036 .328
N of Valid Cases 724
a Not assuming the null hypothesis. b Using the asymptotic standard error assuming the null hypothesis.
Research hypothesis 7
Null hypothesis HO: X2 = 0
Alternative hypothesis HA: X2 ≠ 0
The Chi2 test is used to determine the statistical significance of the relationship
between two categorical variables, which in this case are “language” and
“completing the course in 2005”. The test will determine if there is a difference
between students who are English speaking and students who are not English
speaking with regards to completing their MBL in 3 years.
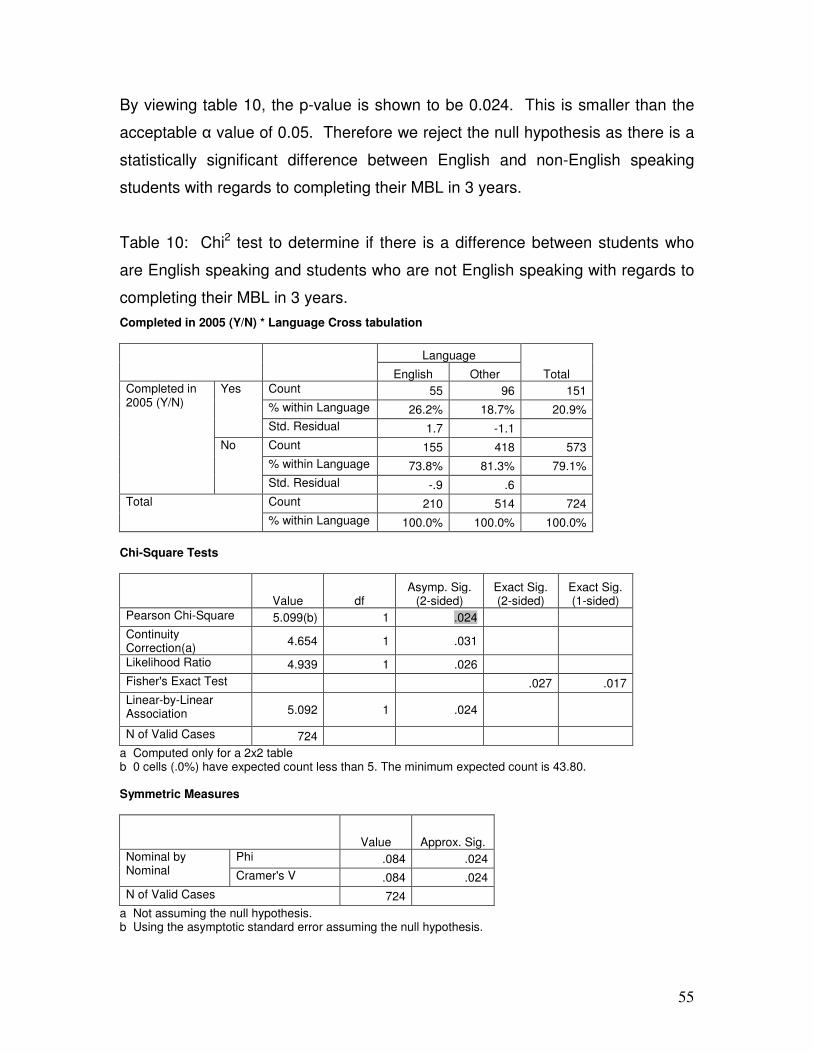
55
By viewing table 10, the p-value is shown to be 0.024. This is smaller than the
acceptable α value of 0.05. Therefore we reject the null hypothesis as there is a
statistically significant difference between English and non-English speaking
students with regards to completing their MBL in 3 years.
Table 10: Chi2 test to determine if there is a difference between students who
are English speaking and students who are not English speaking with regards to
completing their MBL in 3 years.
Completed in 2005 (Y/N) * Language Cross tabulation
Language
Total English Other
Completed in 2005 (Y/N)
Yes Count 55 96 151
% within Language 26.2% 18.7% 20.9%
Std. Residual 1.7 -1.1
No Count 155 418 573
% within Language 73.8% 81.3% 79.1%
Std. Residual -.9 .6
Total Count 210 514 724
% within Language 100.0% 100.0% 100.0%
Chi-Square Tests
Value df Asymp. Sig.
(2-sided) Exact Sig. (2-sided)
Exact Sig. (1-sided)
Pearson Chi-Square 5.099(b) 1 .024
Continuity Correction(a)
4.654 1 .031
Likelihood Ratio 4.939 1 .026
Fisher's Exact Test .027 .017
Linear-by-Linear Association 5.092 1 .024
N of Valid Cases 724
a Computed only for a 2x2 table b 0 cells (.0%) have expected count less than 5. The minimum expected count is 43.80. Symmetric Measures
Value Approx. Sig.
Nominal by Nominal
Phi .084 .024
Cramer's V .084 .024
N of Valid Cases 724
a Not assuming the null hypothesis. b Using the asymptotic standard error assuming the null hypothesis.

56
Rationale 2
The combined use of general registration information that proved to have a
positive correlation to MBL success will prove to be a better admissions tool to
predict successful MBL completion than the current admissions process.
Hypothesis statement 8
HO: The newly developed admission tool is less successful in predicting students
who will complete their MBL qualification in 3 years, than the current process.
HA: The newly developed admission tool is more successful in predicting
students who will complete their MBL qualification in 3 years, than the current
process.
In order to test Rationale 2 and hypothesis 8, a CHAID algorithm was used.
CHAID algorithms are used to classify the relationship between one dependant
and multiple independent variables. In this sample the dependent variable is the
“Passed” variable and all the other variables are independent. In short what the
CHAID classification tree does is to pick the data group that shows the strongest
correlation and then group the variables in the data group to form the sub groups
that are most likely and least like to pass. Once this is done the process is
repeated.
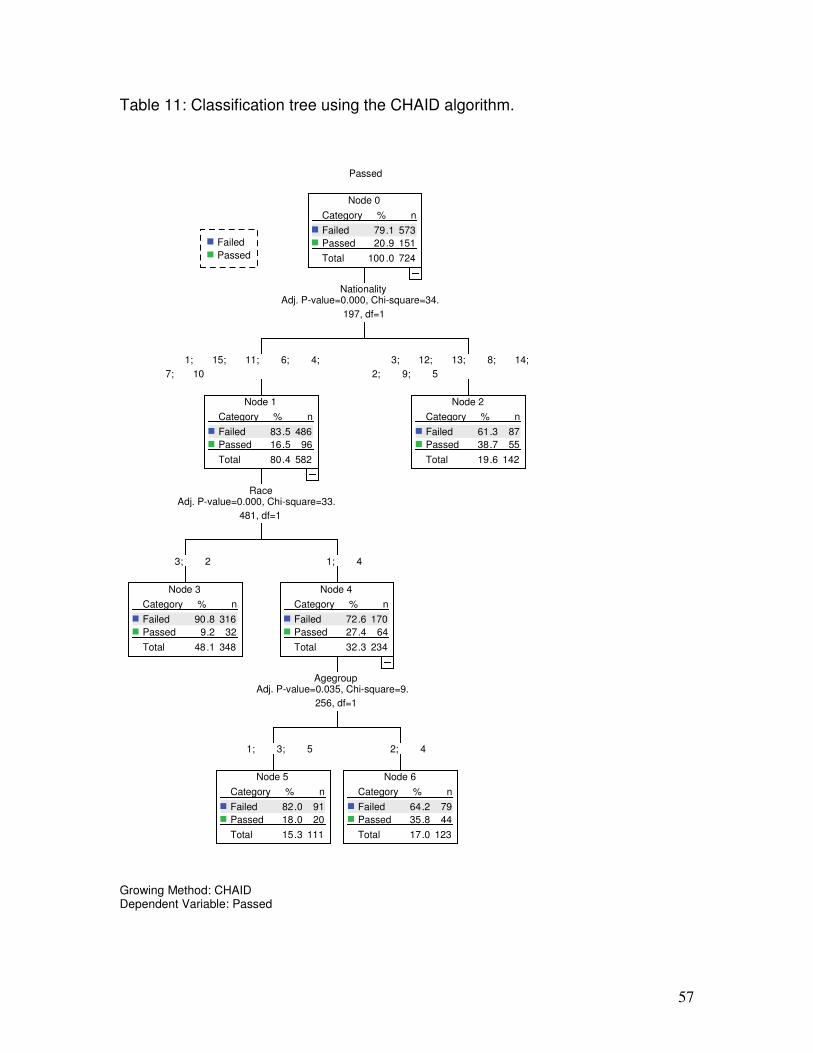
57
Table 11: Classification tree using the CHAID algorithm.
Node 0
Category % n
79.1 573Failed
20.9 151Passed
Total 100 .0 724
NationalityAdj. P-value=0.000, Chi-square=34.
197, df=1
Passed
Node 1
Category % n
83.5 486Failed
16.5 96Passed
Total 80.4 582
RaceAdj. P-value=0.000, Chi-square=33.
481, df=1
1; 15; 11; 6; 4;
7; 10
Node 2
Category % n
61.3 87Failed
38.7 55Passed
Total 19.6 142
3; 12; 13; 8; 14;
2; 9; 5
Node 3
Category % n
90.8 316Failed
9.2 32Passed
Total 48.1 348
3; 2
Node 4
Category % n
72.6 170Failed
27.4 64Passed
Total 32.3 234
AgegroupAdj. P-value=0.035, Chi-square=9.
256, df=1
1; 4
Node 5
Category % n
82.0 91Failed
18.0 20Passed
Total 15.3 111
1; 3; 5
Node 6
Category % n
64.2 79Failed
35.8 44Passed
Total 17.0 123
2; 4
Failed
Passed
Growing Method: CHAID Dependent Variable: Passed
58
According to table 11, in the first level of the CHAID tree, nationality was used to
classify the students between passed and failed. In node 1 the students who are
least likely to pass were grouped together. This group consist of nationality
groups 1, 15, 11, 6, 4, 7 and 10 (RSA, Other, Unknown, Swaziland, Botswana,
Zambia and Tanzania) and a pass rate of 16.5% was achieved. In node 2 the
students who are most likely to pass were grouped together. This group consist
of nationality groups 3, 12, 13, 8, 14, 2, 9 and 5 (Namibia, Eritrea, Ghana,
Zimbabwe, United Kingdom, Malawi, Kenya and Lesotho) and a pass rate of
38.7% was achieved.
In the second level of the CHAID tree, Node 1 was classified further by making
use of race to classify the students between passed and failed. In node 3 the
students who are least likely to pass were grouped together. This group consist
of race groups 3 and 2 (black and coloured) and a pass rate of 9.2% was
achieved. In node 4 the students who are most likely to pass were grouped
together. This group consist of race groups 1 and 4 (white and Asian) and a
pass rate of 27.4% was achieved.
In the third level of the CHAID tree, Node 4 was classified further by making use
of age groups to classify the students between passed and failed. In node 5 the
students who are least likely to pass were grouped together. This group consist
of age groups 1, 3 and 5 (>45, 36-40 and 26-30 years old) and a pass rate of
18.0% was achieved. In node 6 the students who are most likely to pass were
grouped together. This group consist of age groups 2 and 4 (41-45 and 31-35
years old) and a pass rate of 35.8% was achieved.
If it is assumed that the success of the current admissions process at UNISA can
be measured by the percentage of students that passed the course in the
minimum period, then, according to the frequency tale in Appendix 5 and figure
11, the current UNISA admissions tool only classified 20.9% of the students
correctly. If the filter criteria of node 2 or the combination of nodes 1, 4 and 6 is

59
used, then pass rates of 38.7% and 35.8% respectively, was achieved (based on
the data used). The null hypothesis is thus rejected, as the newly developed
admission tool (filter criteria according to node 2 or the combination of nodes 1, 4
and 6) is more successful in predicting students who will complete their MBL
qualification in 3 years, than the current process.
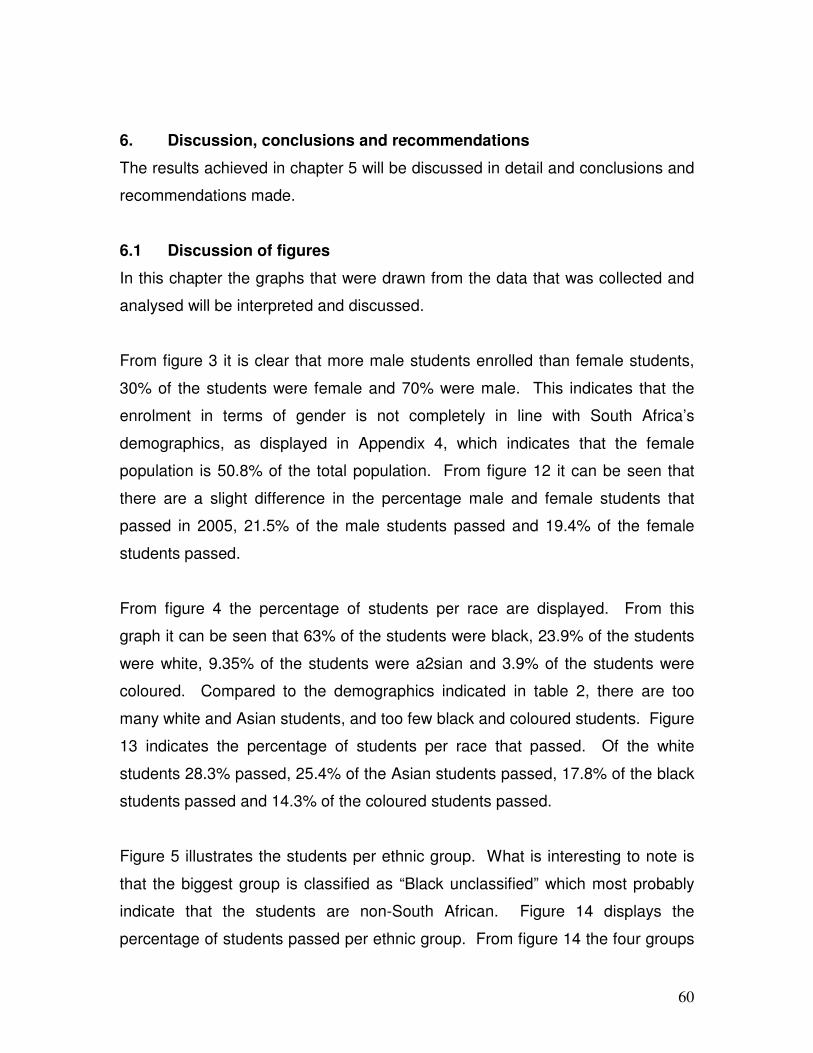
60
6. Discussion, conclusions and recommendations
The results achieved in chapter 5 will be discussed in detail and conclusions and
recommendations made.
6.1 Discussion of figures
In this chapter the graphs that were drawn from the data that was collected and
analysed will be interpreted and discussed.
From figure 3 it is clear that more male students enrolled than female students,
30% of the students were female and 70% were male. This indicates that the
enrolment in terms of gender is not completely in line with South Africa’s
demographics, as displayed in Appendix 4, which indicates that the female
population is 50.8% of the total population. From figure 12 it can be seen that
there are a slight difference in the percentage male and female students that
passed in 2005, 21.5% of the male students passed and 19.4% of the female
students passed.
From figure 4 the percentage of students per race are displayed. From this
graph it can be seen that 63% of the students were black, 23.9% of the students
were white, 9.35% of the students were a2sian and 3.9% of the students were
coloured. Compared to the demographics indicated in table 2, there are too
many white and Asian students, and too few black and coloured students. Figure
13 indicates the percentage of students per race that passed. Of the white
students 28.3% passed, 25.4% of the Asian students passed, 17.8% of the black
students passed and 14.3% of the coloured students passed.
Figure 5 illustrates the students per ethnic group. What is interesting to note is
that the biggest group is classified as “Black unclassified” which most probably
indicate that the students are non-South African. Figure 14 displays the
percentage of students passed per ethnic group. From figure 14 the four groups

61
that had the highest percentage pass rate was: Venda, White, Black unclassified
and Asian.
Figure 6 displays the breakdown of the students per nationality, with South Africa
and Zimbabwe being the highest. Figure 15 displays the percentage of students
that passed per nationality group and what is interesting to note is that South
Africans performed worse than average.
Figure 7 displays the breakdown of the students per age group. The majority of
the students were between 31 and 40 years of age. Figure 16 displays the
percentage of students passed per age group. What is worth mentioning is the
students that fell either in the youngest or oldest of the six groups, faired the
worst.
Figure 8 displays the breakdown of students per occupation. The majority of the
students classified themselves as Manager/Administrators. Figure 17 displays
the percentage of students that passed per occupation. It is interesting to note
that the students in manager/administrator occupations, faired well below
average.
Figure 9 displays the breakdown of students per economic sector. From this
graph it can be seen that the majority of students are grouped in the “other”
group, thus not all economic sectors were available as options. Figure 18
displays the percentage of students per economic sector that passed.
Figure 10 displays the students per home language. From this graph it is clear
that the majority of students are English speaking. Figure 19 displays the
percentage of students that passed per language. It is interesting to note that
English speaking students fair only slightly better than average.
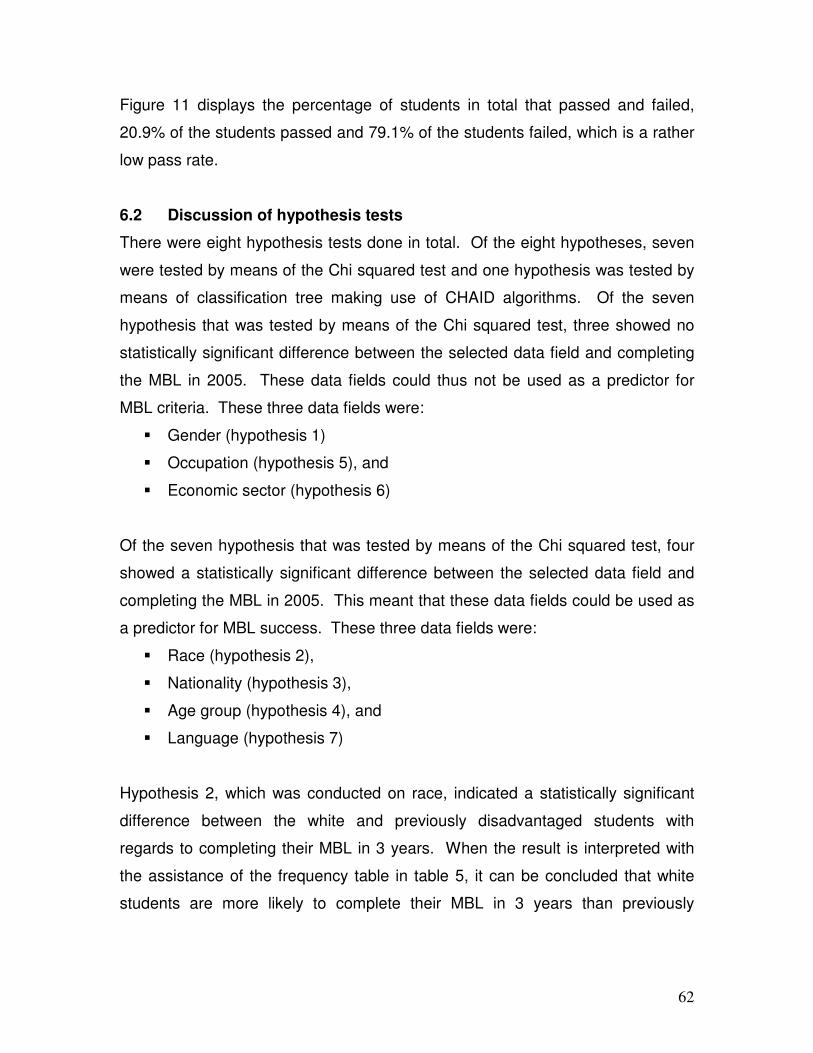
62
Figure 11 displays the percentage of students in total that passed and failed,
20.9% of the students passed and 79.1% of the students failed, which is a rather
low pass rate.
6.2 Discussion of hypothesis tests
There were eight hypothesis tests done in total. Of the eight hypotheses, seven
were tested by means of the Chi squared test and one hypothesis was tested by
means of classification tree making use of CHAID algorithms. Of the seven
hypothesis that was tested by means of the Chi squared test, three showed no
statistically significant difference between the selected data field and completing
the MBL in 2005. These data fields could thus not be used as a predictor for
MBL criteria. These three data fields were:
� Gender (hypothesis 1)
� Occupation (hypothesis 5), and
� Economic sector (hypothesis 6)
Of the seven hypothesis that was tested by means of the Chi squared test, four
showed a statistically significant difference between the selected data field and
completing the MBL in 2005. This meant that these data fields could be used as
a predictor for MBL success. These three data fields were:
� Race (hypothesis 2),
� Nationality (hypothesis 3),
� Age group (hypothesis 4), and
� Language (hypothesis 7)
Hypothesis 2, which was conducted on race, indicated a statistically significant
difference between the white and previously disadvantaged students with
regards to completing their MBL in 3 years. When the result is interpreted with
the assistance of the frequency table in table 5, it can be concluded that white
students are more likely to complete their MBL in 3 years than previously
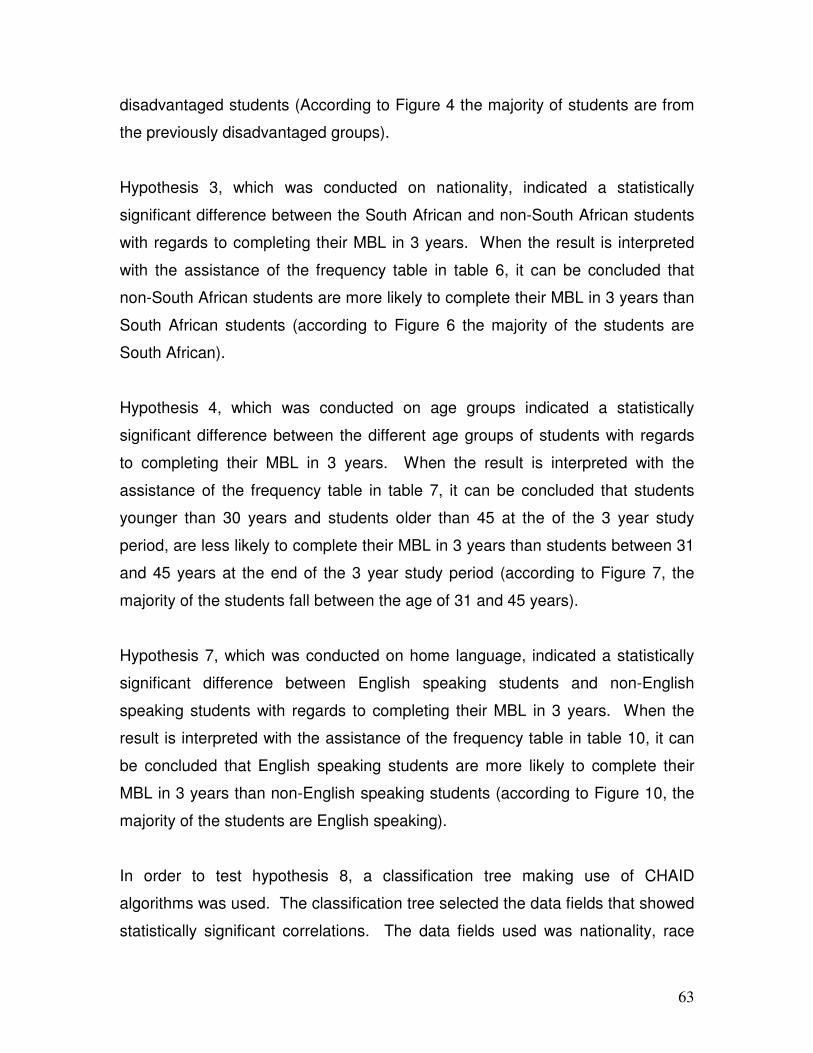
63
disadvantaged students (According to Figure 4 the majority of students are from
the previously disadvantaged groups).
Hypothesis 3, which was conducted on nationality, indicated a statistically
significant difference between the South African and non-South African students
with regards to completing their MBL in 3 years. When the result is interpreted
with the assistance of the frequency table in table 6, it can be concluded that
non-South African students are more likely to complete their MBL in 3 years than
South African students (according to Figure 6 the majority of the students are
South African).
Hypothesis 4, which was conducted on age groups indicated a statistically
significant difference between the different age groups of students with regards
to completing their MBL in 3 years. When the result is interpreted with the
assistance of the frequency table in table 7, it can be concluded that students
younger than 30 years and students older than 45 at the of the 3 year study
period, are less likely to complete their MBL in 3 years than students between 31
and 45 years at the end of the 3 year study period (according to Figure 7, the
majority of the students fall between the age of 31 and 45 years).
Hypothesis 7, which was conducted on home language, indicated a statistically
significant difference between English speaking students and non-English
speaking students with regards to completing their MBL in 3 years. When the
result is interpreted with the assistance of the frequency table in table 10, it can
be concluded that English speaking students are more likely to complete their
MBL in 3 years than non-English speaking students (according to Figure 10, the
majority of the students are English speaking).
In order to test hypothesis 8, a classification tree making use of CHAID
algorithms was used. The classification tree selected the data fields that showed
statistically significant correlations. The data fields used was nationality, race
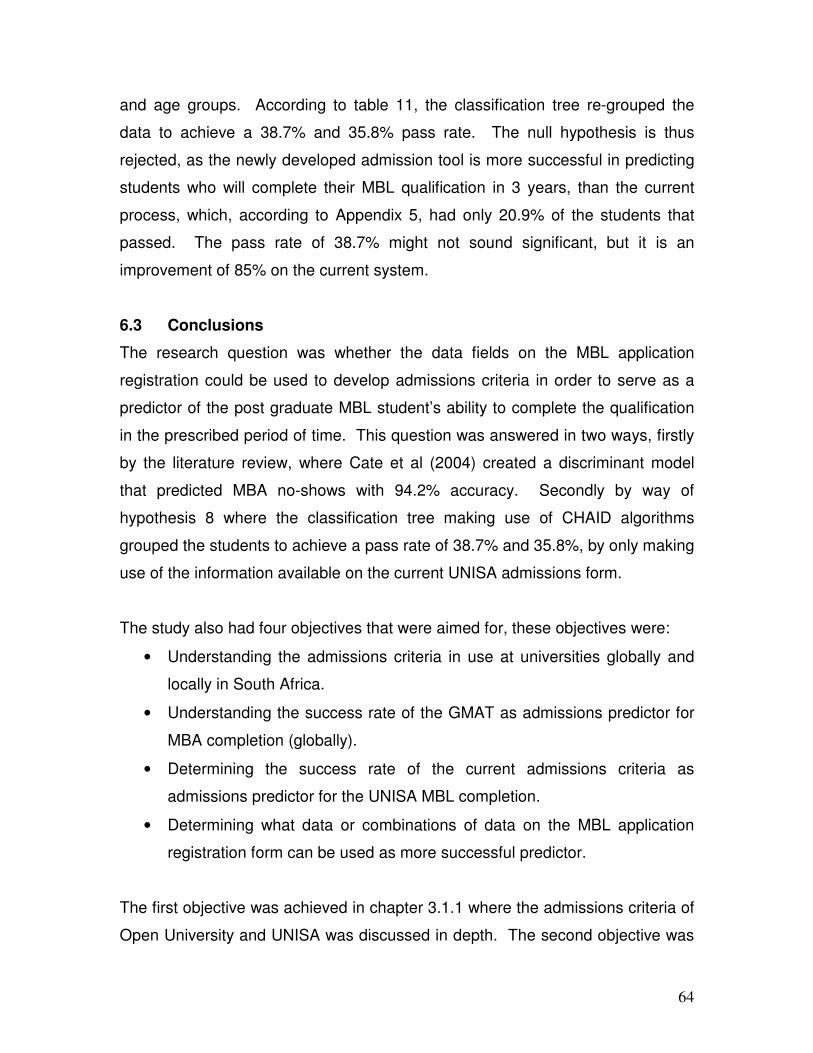
64
and age groups. According to table 11, the classification tree re-grouped the
data to achieve a 38.7% and 35.8% pass rate. The null hypothesis is thus
rejected, as the newly developed admission tool is more successful in predicting
students who will complete their MBL qualification in 3 years, than the current
process, which, according to Appendix 5, had only 20.9% of the students that
passed. The pass rate of 38.7% might not sound significant, but it is an
improvement of 85% on the current system.
6.3 Conclusions
The research question was whether the data fields on the MBL application
registration could be used to develop admissions criteria in order to serve as a
predictor of the post graduate MBL student’s ability to complete the qualification
in the prescribed period of time. This question was answered in two ways, firstly
by the literature review, where Cate et al (2004) created a discriminant model
that predicted MBA no-shows with 94.2% accuracy. Secondly by way of
hypothesis 8 where the classification tree making use of CHAID algorithms
grouped the students to achieve a pass rate of 38.7% and 35.8%, by only making
use of the information available on the current UNISA admissions form.
The study also had four objectives that were aimed for, these objectives were:
• Understanding the admissions criteria in use at universities globally and
locally in South Africa.
• Understanding the success rate of the GMAT as admissions predictor for
MBA completion (globally).
• Determining the success rate of the current admissions criteria as
admissions predictor for the UNISA MBL completion.
• Determining what data or combinations of data on the MBL application
registration form can be used as more successful predictor.
The first objective was achieved in chapter 3.1.1 where the admissions criteria of
Open University and UNISA was discussed in depth. The second objective was
65
achieved through the discussion of literature in chapter 3.1.2 to 3.1.4, where the
use and success of the GMAT as predictor for successful MBA student was
discussed. The third objective was obtained by compiling the frequency table for
the data in Appendix 5, which indicated the success rate to be 20.9%, based on
the percentage of students that completed the MBL in three years in 2005. The
fourth objective was achieved by the hypothesis testing, which indicated that
race, nationality, age and language can be used as predictors. This was tested
in hypothesis 8, which indicated that the data could be used to predict 38.7% and
35.8% of the successful candidates correctly.
6.4 Recommendations
There are a number of general recommendations for UNISA’s SBL. These are:
� Modify the admissions form to include some fields that may prove to be
better predictors than the current fields, such as:
o Will the student be paying for his/her own studies, or will the study
fees be covered by the institution that he/she is working for. The
reason for including this is that students who are paying for
themselves might have more motivation to complete on time.
o What prior qualifications do the student have (be specific in terms
of BA, B.Com, B.Eng ….). The reason for including this is that the
MBL degree includes a large number of mathematical and financial
subjects, which might make it easier to grasp for students with
B.com or B.Eng degrees.
o Ask for the student’s academic results, in terms of average
percentage, of their last qualification (similar to the GPA used
overseas). The reason for including this is that previous studies
has indicated that student GPA can be successfully used as
predictor.
� Do not show away students who according to the model will not pass,
rather do one of the following:
o Give additional tutoring for the borderline students.
66
o Require the students who are shown to be unlikely to pass, to
complete a preparatory programme such as the Programme in
Business Leadership (PBL), prior to starting with their MBL, similar
to the process used by Open University.
The following recommendations are focussed on future studies in this field:
� It is recommended that the admissions prediction model be refined up to a
point where the model is able to predict 80% to 90% of the cases
correctly, before it is implemented. The recommendations that follow will
highlight some of the methods that can be used to improve the accuracy
of the model:
o When considering the sample size, it is recommended that more
than one MBL group is used, thus use student groups from at least
3 admission years; this will most likely give a more representative
sample and thus improve the accuracy of the prediction model.
o Do not limit the study to only students that finished in the minimum
period of 3 years, but to all students that finished within 5 years.
These students can still be seen as successful even though they
did not complete the degree in the minimum time frame.
In conclusion it was shown that the data fields on the MBL application registration
form can be used to develop an admissions criteria in order to serve as a
predictor of the post graduate MBL student’s ability to complete the qualification
in the prescribed period of time.
67
7. Article
Admission criteria for post graduate MBL students
Willem A. van Niekerk
Abstract
This paper uses a classification tree making use of CHAID algorithms to examine
one year of admissions records in order to separate the successful and
unsuccessful students in the University of South Africa’s (UNISA) Masters in
Business Leadership (MBL) program. The study used normal data fields on the
admissions form such as gender, race, ethnic group, nationality, age group,
occupation, economic sector and language. The classification tree was able to
group the students to achieve a 38.7% pass rate, compared to the 20.9% of the
current system, based solely on the use of the following variables: nationality,
race and age group. This study suggests that more attention should be given in
using normal data fields on the admissions form when making admissions
decisions.
Introduction
Reasons for acquiring a Master of Business Administration degree (MBA) are
plentiful, but the most common reason is that it is seen as one of the key routes
towards career advancement. It is believed that a MBA degree is a ticket to
acquiring a good employment and earning a sizable remuneration package
(Chiu, 1999). As a result of abovementioned reasons, the demand for tertiary
institutions to provide MBA programs has increased dramatically. Especially the
need for programs that supply part time or distance learning, due to the
flexibility, convenience and affordability of such programs (Chiu, 1999). In 2003
the number of institutions offering MBA courses in South Africa totalled 28
(Furlonger, 2005).
68
In 2003 a MBA reaccreditation process was launched by the Council for Higher
Education (CHE) as the first step in bringing the overall level of South Africa’s
MBAs up to international standards (Furlonger, 2004). The CHE set 13 criteria
for business schools wanting to offer MBA courses. Of these 13 criteria, two has
direct influence on the selection and admissions criteria of the tertiary
institutions. These are:
o Student recruitment: Among minimum standards for acceptance, 90% of
each group must have a bachelor's degree or equivalent.
o Diversity: Schools must set target rates for black students and staff, and
offer support systems to help them (Furlonger, 2004).
“A fundamental means of marketing an MBA program is to produce a high
quality product. This long-term strategy entails keeping the admission standards
high, providing comprehensive and rigorous delivery and on-going evaluations of
the total program (Chiu, 1999).” Taking the CHE admissions criteria and the
abovementioned quote into account, it is clear that the selection and admissions
process of a MBA institution is critical for future acceptance and success of such
an institution. The majority of institutions internationally that offer MBA courses
use the Graduate Management Admissions Test (GMAT) as part of their
admissions criteria. Studies have however shown that the GMAT alone is not a
very good predictor and can typically only be attributed with 14% to 18% of the
variance on MBA student Grade point average (GPA) performance (Koys, 2005).
This research study will focus on the admissions criteria and attempt to improve
the predictability of the admissions process. The objectives of the study are:
o Understanding the admissions criteria in use at universities globally and
locally in South Africa.
o Understanding the success rate of the GMAT as admissions predictor for
MBA completion (globally).
o Determining the success rate of the current admissions criteria as admissions
predictor for the UNISA MBL completion.
69
o Determining what data or combinations of data on the MBL application
registration form can be used as more successful predictor.
The research project is aimed at two groups of readers, namely:
o The School for Business Leadership at the University of South Africa, and
o Other academic institutions or scholars, with interest in admissions criteria for
similar post graduate MBA courses.
Literature review
The literature under review will be comprised of the following two bodies of
knowledge: admissions criteria and cultural diversity.
The admissions criteria of distance learning universities will first be discussed.
The two universities that will be discussed are the Open University (OU) in the
United Kingdom (UK) that services the UK as well as parts of Europe, and the
University of South Africa that services the greater Southern Africa region.
The admissions criteria at the OU does not require testing, but is largely based
on prior experience and qualifications. The admissions criteria for a MBA
qualification are:
o All applicants are expected to have organisational experience, with some of it
in management level.
o The applicant must be at least 25 years old when starting their first course of
study.
o The maximum allowed period of time to complete the MBA is ten years,
passing a minimum of one course every two years. Students are only
allowed to repeat any subject once.
The admissions criteria for UNISA are mainly based on experience and
qualifications. “In order to be considered for admission to the first year of MBL
study, participants must:
70
o Hold a three year Bachelors degree (360 SAQA credits) from a recognised
university.
o Have at least three years’ work experience, to ensure that they can contribute
meaningfully in group discussions, assignments and study schools.
o Have access to a computer and the Internet.
o An evaluation of the applicant’s academic record and a personal letter
providing reasons for wishing to enrol for the MBL will be used for selection
purposes. The SBL may introduce additional selection criteria” (MBL
brochure 2006).
GMAT as predictor
The GMAT is designed to measure the ability and knowledge of the student. The
test is all multiple-choice questions covering two sections, verbal and
quantitative. The score is then used to base admission decisions on (Ahmadi et
al, 1997). The GMAT is most commonly used in the US, but has been found to
be a valid predictor of academic performance in a MBA program for non-U.S.
students as well (Koys, 2005).
Several studies found a statistically significant correlation between GMAT scores
and the MBA GPA. The square of the correlation coefficient was used to see the
degree of changes in one variable to explain changes in another variable. The
GMAT score was found to explain between 14% and 18% of the GPA variance
(Koys, 2004). Standardised test such as the GMAT has its problems as well.
Since it is multiple-choice type questions, it does not accurately measure an
individual's ability, critical thinking skills, or competency (Ahmadi et al, 1997).
The study indicated that the correlation between undergraduate GPAs and
GMAT scores was almost twice as high in the applicant pool as in the pool of
matriculating students. Standard validation studies will therefore understate the
importance of GMAT scores in predicting performance of potential students to
the MBA program (Cushing, 2004).
71
GMAT and undergraduate GPA as predictor
Many business schools use both the GMAT and undergraduate GPA to make
admissions decisions. Some researchers have used multiple regression analysis
to test the combined relationship of these two predictors with the criterion of MBA
GPA. The results showed that the GMAT and undergraduate GPA together
explained between 15% and 22% of the variance in MBA (Koys, 2004).
GMAT and other variables as predictor
Other variables have been used together with the GMAT score and the
undergraduate GPA. However, when GMAT and GPA were combined with other
variables, such as involvement in campus activities, work experience, letters of
recommendation, and personal goals (Ahmadi et al, 1997), these models
explained only 19 to 21 % of the variation and were not as useful as predictors of
success (Koys, 2005). One other popular test for non-US students is the Test of
English as a Foreign Language (TOEFEL), which has shown that 5% of the
variance in first year MBA’s GPA could be explained by the TOEFEL (Koys,
2005).
Other variables as predictors
Carver (1994) stated that the correlation between GMAT and success in a MBA
program are not particularly high, and that exploration of more qualitative
variables, such as quality of work experience, may prove more fruitful than
focusing exclusively on quantitative measures. Another study by Ahmadi et al
(1997) suggests that other additional criteria may need to be used in selecting
prospective students. Due to their low predictive ability of the GMAT alone, other
forms of assessment such as writing samples, interviews, work experience, or
other non-quantitative measures or assessments would be useful. Naik et al
(2004) did a study where the GMAT score together with all other information on
the students were evaluated by a neural network to predict student performance,
and achieved a accuracy of 89.13%.

72
Cultural diversity studies
Munce (2005) makes it clear that universities and colleges must turn away from
a one-dimensional approach to admittance and that they must look at different
recruitment strategies in order to make sure that diversity on campus becomes a
reality. Antwi-Boasiako & Asagba’s (2005) article concludes in saying that to
prevent a ‘White America’ where most of the managerial positions are filled with
White people, one must start at college level and more minorities need to be
admitted. Antwi-Boasiako & Asagba (2005) finish by saying: “Unless universities
use their unique ways and means of opening their doors to minorities without
blocking qualified white applicants into a predominantly White university, the
controversy over Affirmative Action will continue to be an academic debate
without any practical solution”.
The data
The target population for the study is the whole of the student population who
started their MBL degree at UNISA in 2003. The data comprises of a selection of
the general details on the registration form, and their corresponding pass or fail
results of the students that were achieved at the end of the 3 years (2003 until
2005). These data fields are: Gender, Race, Ethnic group, Nationality, Age
group, Occupation, Economic sector and Language.
The data were received from the SBL in Excel format. The data was rearranged
to be in a user-friendly format. During this process the data was examined to
ensure that there were no data missing or wrongly recoded. Incomplete data
fields were excluded from the data set.
The data type of the data collected is all nominal, except for the age groups that
is interval of nature. This means that the data has classification but not order,
distance or origin. This fact will determine what quantitative techniques can be
used to further analyse the data. A further consideration is that there are 724
fields of data, but each variable per field has a different number of classification
73
groups, this further complicates the calculations. All the calculations done in the
study was done on computer with the aid of SPSS 15.0 for Windows and
MoonStats for Windows. The statistical methods used to determine relatedness
was Cramer’s V coefficients, while the Chi2 was used for the hypothesis testing.
Hypothesis
The final hypothesis in the study was to determine whether the combined use of
general registration information that proved to have a positive correlation to MBL
success, would prove to be a better admissions tool to predict successful MBL
completion than the current admissions process.
Hypothesis statement
HO: The newly developed admission tool is less successful in predicting students
who will complete their MBL qualification in 3 years than the current process.
HA: The newly developed admission tool is more successful in predicting
students who will complete their MBL qualification in 3 years than the current
process.
In order to test the hypothesis, a CHAID algorithm was used. CHAID algorithms
are used to classify the relationship between one dependant and multiple
independent variables. In this sample the dependent variable is the “Passed”
variable and all the other variables are independent. In short what the CHAID
classification tree does is to pick the data group that shows the strongest
correlation and then group the variables in the data group to form the sub groups
that are most likely and least like to pass. Once this is done the process is
repeated.
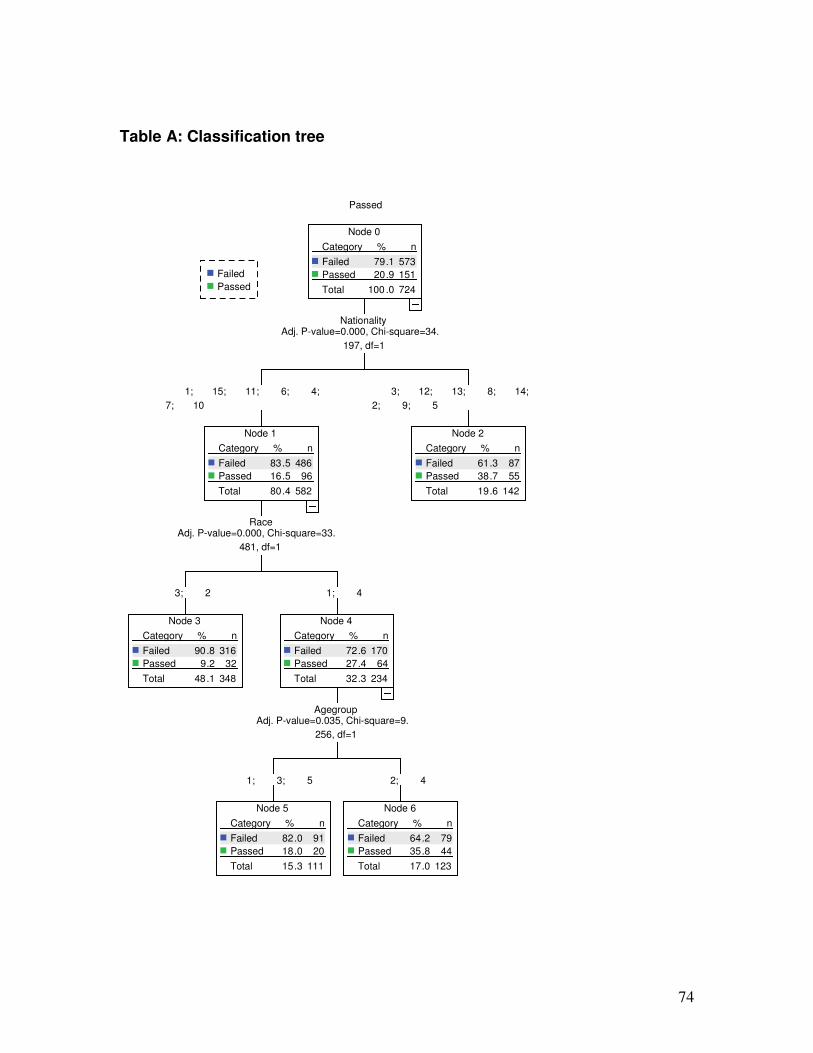
74
Table A: Classification tree
Node 0
Category % n
79.1 573Failed
20.9 151Passed
Total 100 .0 724
NationalityAdj. P-value=0.000, Chi-square=34.
197, df=1
Passed
Node 1
Category % n
83.5 486Failed
16.5 96Passed
Total 80.4 582
RaceAdj. P-value=0.000, Chi-square=33.
481, df=1
1; 15; 11; 6; 4;
7; 10
Node 2
Category % n
61.3 87Failed
38.7 55Passed
Total 19.6 142
3; 12; 13; 8; 14;
2; 9; 5
Node 3
Category % n
90.8 316Failed
9.2 32Passed
Total 48.1 348
3; 2
Node 4
Category % n
72.6 170Failed
27.4 64Passed
Total 32.3 234
AgegroupAdj. P-value=0.035, Chi-square=9.
256, df=1
1; 4
Node 5
Category % n
82.0 91Failed
18.0 20Passed
Total 15.3 111
1; 3; 5
Node 6
Category % n
64.2 79Failed
35.8 44Passed
Total 17.0 123
2; 4
Failed
Passed
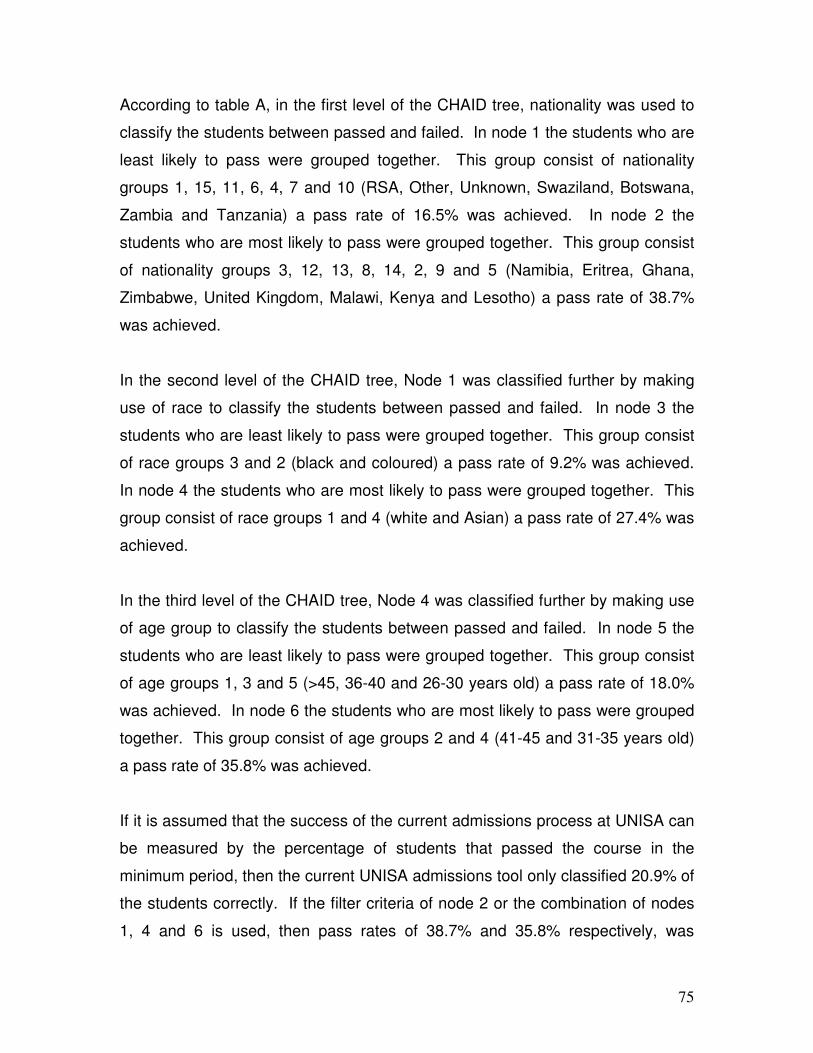
75
According to table A, in the first level of the CHAID tree, nationality was used to
classify the students between passed and failed. In node 1 the students who are
least likely to pass were grouped together. This group consist of nationality
groups 1, 15, 11, 6, 4, 7 and 10 (RSA, Other, Unknown, Swaziland, Botswana,
Zambia and Tanzania) a pass rate of 16.5% was achieved. In node 2 the
students who are most likely to pass were grouped together. This group consist
of nationality groups 3, 12, 13, 8, 14, 2, 9 and 5 (Namibia, Eritrea, Ghana,
Zimbabwe, United Kingdom, Malawi, Kenya and Lesotho) a pass rate of 38.7%
was achieved.
In the second level of the CHAID tree, Node 1 was classified further by making
use of race to classify the students between passed and failed. In node 3 the
students who are least likely to pass were grouped together. This group consist
of race groups 3 and 2 (black and coloured) a pass rate of 9.2% was achieved.
In node 4 the students who are most likely to pass were grouped together. This
group consist of race groups 1 and 4 (white and Asian) a pass rate of 27.4% was
achieved.
In the third level of the CHAID tree, Node 4 was classified further by making use
of age group to classify the students between passed and failed. In node 5 the
students who are least likely to pass were grouped together. This group consist
of age groups 1, 3 and 5 (>45, 36-40 and 26-30 years old) a pass rate of 18.0%
was achieved. In node 6 the students who are most likely to pass were grouped
together. This group consist of age groups 2 and 4 (41-45 and 31-35 years old)
a pass rate of 35.8% was achieved.
If it is assumed that the success of the current admissions process at UNISA can
be measured by the percentage of students that passed the course in the
minimum period, then the current UNISA admissions tool only classified 20.9% of
the students correctly. If the filter criteria of node 2 or the combination of nodes
1, 4 and 6 is used, then pass rates of 38.7% and 35.8% respectively, was
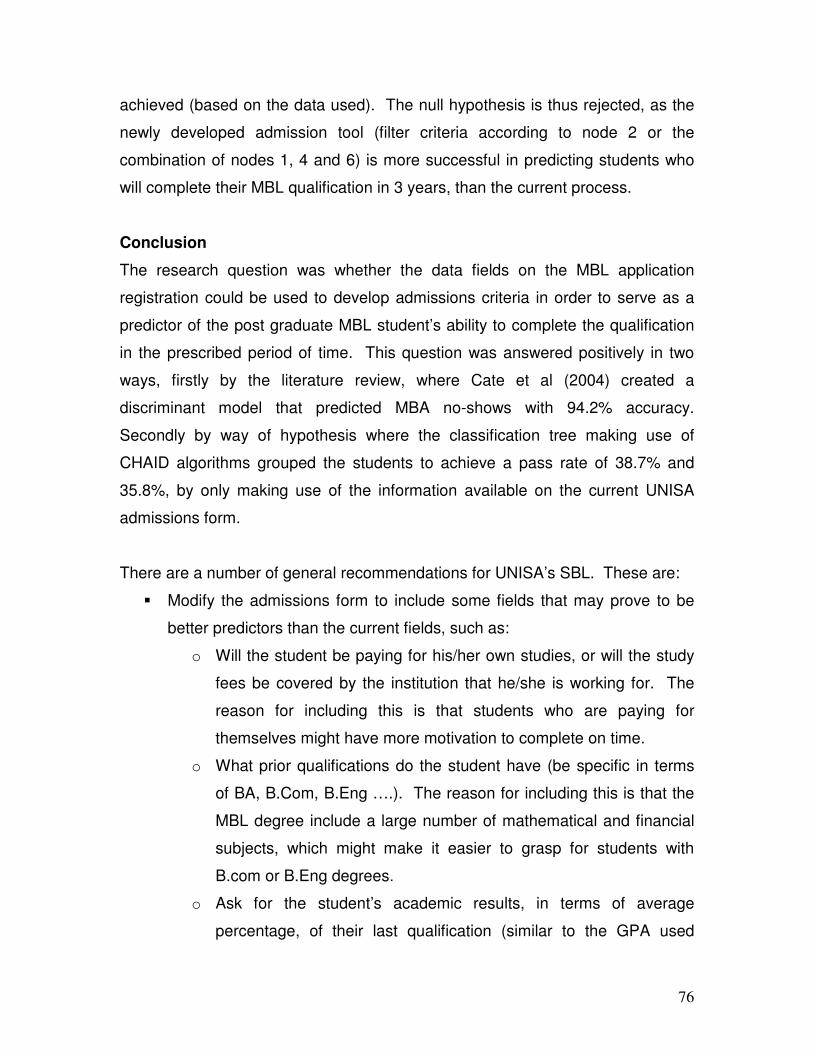
76
achieved (based on the data used). The null hypothesis is thus rejected, as the
newly developed admission tool (filter criteria according to node 2 or the
combination of nodes 1, 4 and 6) is more successful in predicting students who
will complete their MBL qualification in 3 years, than the current process.
Conclusion
The research question was whether the data fields on the MBL application
registration could be used to develop admissions criteria in order to serve as a
predictor of the post graduate MBL student’s ability to complete the qualification
in the prescribed period of time. This question was answered positively in two
ways, firstly by the literature review, where Cate et al (2004) created a
discriminant model that predicted MBA no-shows with 94.2% accuracy.
Secondly by way of hypothesis where the classification tree making use of
CHAID algorithms grouped the students to achieve a pass rate of 38.7% and
35.8%, by only making use of the information available on the current UNISA
admissions form.
There are a number of general recommendations for UNISA’s SBL. These are:
� Modify the admissions form to include some fields that may prove to be
better predictors than the current fields, such as:
o Will the student be paying for his/her own studies, or will the study
fees be covered by the institution that he/she is working for. The
reason for including this is that students who are paying for
themselves might have more motivation to complete on time.
o What prior qualifications do the student have (be specific in terms
of BA, B.Com, B.Eng ….). The reason for including this is that the
MBL degree include a large number of mathematical and financial
subjects, which might make it easier to grasp for students with
B.com or B.Eng degrees.
o Ask for the student’s academic results, in terms of average
percentage, of their last qualification (similar to the GPA used

77
overseas). The reason for including this is that previous studies
has indicated that student GPA can be successfully used as
predictor.
� Do not show away students who according to the model will not pass,
rather do one of the following:
o Give additional tutoring for the borderline students.
o Require the students who are shown to be unlikely to pass, to
complete a preparatory programme such as the Programme in
Business Leadership (PBL), prior to starting with their MBL, similar
to the process used by Open University.
The following recommendations are focussed on future studies in this field:
� It is recommended that the admissions prediction model be refined up to a
point where the model is able to predict 80% to 90% of the cases
correctly, before it is implemented. The recommendations that follow will
highlight some of the methods that can be used to improve the accuracy
of the model:
o When considering the sample size, it is recommended that more
than one MBL group is used, thus use student groups from at least
3 admission years; this will most likely give a more representative
sample and thus improve the accuracy of the prediction model.
o Do not limit the study to only students that finished in the minimum
period of 3 years, but to all students that finished within 5 years.
These students can still be seen as successful even though they
did not complete the degree in the minimum time frame.
In conclusion it was shown that the data fields on the MBL application registration
form can be used to develop admissions criteria in order to serve as a predictor
of the post graduate MBL student’s ability to complete the qualification in the
prescribed period of time.
78
8. References
Ahmadi M, Helms M & Raiszadeh F. 1997: An examination of the admission
criteria for the MBA programs: A case study. Education 117(4).
http://www.proquest.umi.com/
Accessed on 2006/03/06.
Antwi-Boasiako KB & Asagba JO. 2005: A preliminary analysis of African
American college students’ perceptions of racial preferences and affirmative
action in making admissions decisions at a predominantly white university.
College Student Journal, 39(4):734-748.
Avdeyeva TV, Church AT, Emerson AM, Flores JJV, Katigbak MS, Ortiz FA &
Reyes JI. 2003: Measuring individual and cultural differences in implicit trait
theories. Journal of Personality and Social Psychology, 85(2):332-347.
Barrick MR, Mount MK & Parks L. 2005: Self-monitoring as a moderator of the
relationships between personality traits and performance. Personnel Psychology,
58(3):745-767.
Beauregerd R, Steele JR & Tett RP. 2003: Broad and narrow measures on both
sides of the personality-job performance relationship. Journal of Organizational
Behavior (24)3.
http://www.proquest.umi.com/
Accessed on 2006/03/06.
Biggs D, de Ville B & Suen E. 1991: A method of choosing multiway partitions for
classification and decision trees. Journal of Applied Statistics, 18, 49-62.
Bogomolny L. 2005: Get ready. Canadian Business 78(21).
79
http://www.proquest.umi.com/
Accessed on 2006/03/06
Bosch JK, Louw L & Venter DJL. 2001: Quality perceptions of MBA courses and
required management competencies. Quality Assurance in Education, 9(2):72-
79.
Bratton J, Grint K & Nelson DL. 2005: Organizational Leadership. Ohio: Thomson
South-Western.
Carver MR Jr & King TE. 1994: An empirical investigation of the MBA admission
criteria for nontraditional programs. Journal of Education for Business 70(2).
http://www.proquest.umi.com/
Accessed on 2006/03/06.
Cate T & Clayton GE. 2004: Predicting MBA no-shows and graduation success
with discriminate analysis. International Advances in Economic Research,
10(3):235-243.
Chatman JA, Flynn FJ & Spataro SE. 2001: Getting to know you: The influence
of personality on impressions and performance of demographically different
people in organisations. Administrative Science Quarterly, 46(3):414-445.
Chiu R. 1999: Relationships between motivators and criteria in the selection of a
distance learning MBA programme in Hong Kong. Career Development
International 4(1).
http://www.proquest.umi.com/
Accessed on 10/04/2006
Cooper DR & Schindler PS. 2003: Business Research Methods International
Edition, 8th edition. New York: McGraw-Hill.
80
Craik KH, Kamp J, O’Reilly C, Staw B, Ware AP & Zedeck S. 2002: Explorations
of construct validity in a combined managerial and personality assessment
programme. Journal of Occupational Psychology, 75:171-193.
Cushing MJ & McGarvey MG. 2004: Sample selection in models of academic
performance. Economic Inquiry, 42(2):319-322.
Erasmus B, Schenk H, Swanepoel B & van Wyk M. 2003: South African Human
Resource Management: Theory and Practice, 3rd edition. Lansdowne: Juta & Co
Ltd.
Furlonger D. 2004: Live by the exam, die by the exam. Financial Mail 10
September 2004.
http://www.financialmail.co.za
Accessed on 2006/04/20
Furlonger D. 2005: All over the same bar – but some are higher. Financial Mail
16 September 2005.
http://www.financialmail.co.za
Accessed on 2006/04/20
Gloeckler G. 2005: Sidestepping the GMAT. Business Week 3946.
http://www.proquest.umi.com/
Accessed on 2006/03/06.
Gui Q & Thompson ER. 2000: Hong Kong executive business students’
motivations for pursuing an MBA. Journal of Education for business, 75(4):236-
240.

81
Kass G. 1980: An exploratory technique for investigating large quantities of
categorical data. Applied Statistics, 29:2, 119-127.
Koys DJ. 2005: The validity of the graduate management admissions test for
non-U.S. students. Journal of Education for Business, 80(4):236-239.
McCarthy EJ & Perreault Jr WD. 2002: Basic Marketing: A Global Managerial
Approach, 14th edition. New York: McGraw-Hill.
Munce D. 2005: Achieving diversity on Campus: A better approach. Diverse
Issues in Higher Education, 22(23):43.
Naik B & Ragothaman S. 2004: Using neural networks to predict MBA student
success. College Student Journal, 38(1):143-149.
Open University: Study at the OU
http://www.open.ac.uk/
Accessed on 2006/06/20
Statistics SA. 2001: Cencus 2001 – Key results
http://www.statssa.gov.za/
Accessed on 2006/09/23
Statistics SA. 2006: Mid-year population estimates, South Africa 2006
http://www.statssa.gov.za/
Accessed on 2006/09/23

Appendices

ii
Appendix 1 – MBA ranking table
Table 12: MBA rankings for 2005 (Source: http://www.financialmail.co.za)
Table 13: MBA rankings for 2004 (Source: http://www.financialmail.co.za)
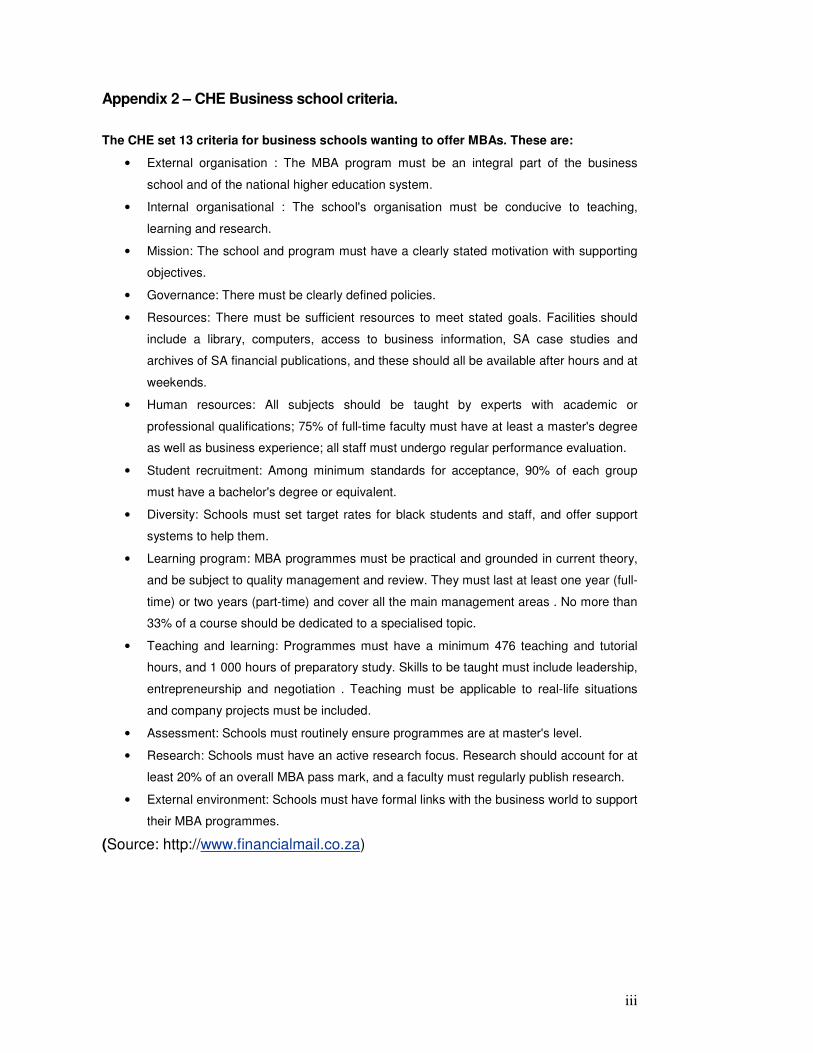
iii
Appendix 2 – CHE Business school criteria.
The CHE set 13 criteria for business schools wanting to offer MBAs. These are:
• External organisation : The MBA program must be an integral part of the business
school and of the national higher education system.
• Internal organisational : The school's organisation must be conducive to teaching,
learning and research.
• Mission: The school and program must have a clearly stated motivation with supporting
objectives.
• Governance: There must be clearly defined policies.
• Resources: There must be sufficient resources to meet stated goals. Facilities should
include a library, computers, access to business information, SA case studies and
archives of SA financial publications, and these should all be available after hours and at
weekends.
• Human resources: All subjects should be taught by experts with academic or
professional qualifications; 75% of full-time faculty must have at least a master's degree
as well as business experience; all staff must undergo regular performance evaluation.
• Student recruitment: Among minimum standards for acceptance, 90% of each group
must have a bachelor's degree or equivalent.
• Diversity: Schools must set target rates for black students and staff, and offer support
systems to help them.
• Learning program: MBA programmes must be practical and grounded in current theory,
and be subject to quality management and review. They must last at least one year (full-
time) or two years (part-time) and cover all the main management areas . No more than
33% of a course should be dedicated to a specialised topic.
• Teaching and learning: Programmes must have a minimum 476 teaching and tutorial
hours, and 1 000 hours of preparatory study. Skills to be taught must include leadership,
entrepreneurship and negotiation . Teaching must be applicable to real-life situations
and company projects must be included.
• Assessment: Schools must routinely ensure programmes are at master's level.
• Research: Schools must have an active research focus. Research should account for at
least 20% of an overall MBA pass mark, and a faculty must regularly publish research.
• External environment: Schools must have formal links with the business world to support
their MBA programmes.
(Source: http://www.financialmail.co.za)
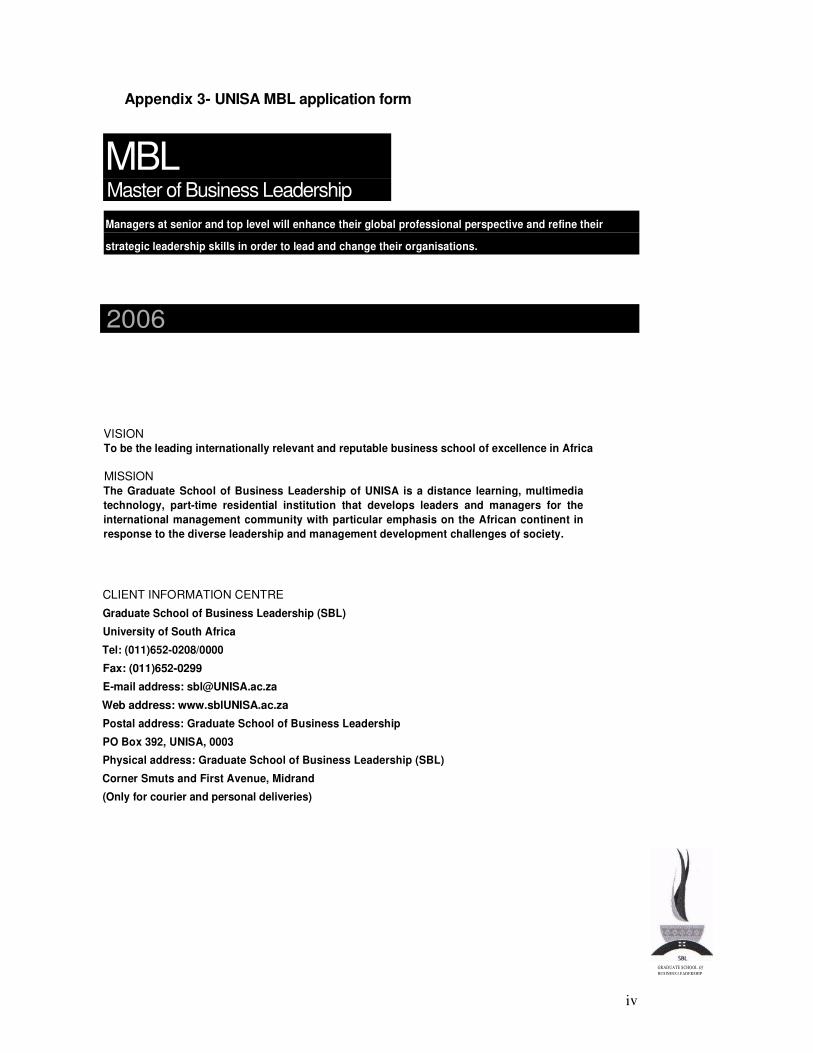
iv
Appendix 3- UNISA MBL application form
MBL
Master of Business Leadership
Managers at senior and top level will enhance their global professional perspective and refine their
strategic leadership skills in order to lead and change their organisations.
2006
VISION To be the leading internationally relevant and reputable business school of excellence in Africa
MISSION The Graduate School of Business Leadership of UNISA is a distance learning, multimedia
technology, part-time residential institution that develops leaders and managers for the
international management community with particular emphasis on the African continent in
response to the diverse leadership and management development challenges of society.
CLIENT INFORMATION CENTRE
Graduate School of Business Leadership (SBL)
University of South Africa
Tel: (011)652-0208/0000
Fax: (011)652-0299
E-mail address: [email protected]
Web address: www.sblUNISA.ac.za
Postal address: Graduate School of Business Leadership
PO Box 392, UNISA, 0003
Physical address: Graduate School of Business Leadership (SBL)
Corner Smuts and First Avenue, Midrand
(Only for courier and personal deliveries)
GRADUATE SCHOOL Of
BUSINESS LEADERSHIP

v
The MBL provides highly professional management development at postgraduate level with particular emphasis on the theory as well as the practice of management. It also offers an opportunity for the development of leadership qualities.
WHAT IS THE MBL?
The Master of Business Leadership (MBL) is a highly professional, three-year, postgraduate management development programme which is offered on a largely distance learning platform. This distributed learning model offers a special learning opportunity and a unique self-development programme to graduates who want to follow a management career in business and public sectors.
Its unique structure incorporates lecturer contact, group and individual work, and
multimedia interaction (through an electronic delivery system) enhancing the learning
experience.
The economic environment of the organisation, the functions of the organisation and the integrated concepts of strategy, and leadership are the main fields of study which are integrated into the MBL. The first two years of study deliver a broad spectrum of both theory and practice which covers aspects of management from the operational level through general management and culminates in strategic management and leadership.
During the final year the participant will have the opportunity to integrate the learning experience through a compulsory executive project management, a field study module and a research report. In addition, during the final year, advanced studies in certain subjects are presented as electives.
On completion of the programme the successful participant will have developed strong leadership skills through the combination of theory and practice. During the programme the participants will have had the opportunity to apply learning experiences both personally and within their work environment.
The resulting Master's degree equips the participant for a meaningful top management
role in business, public and private sectors and other organisations.
GRADUATE SCHOOL Of
BUSINESS LEADERSHIP
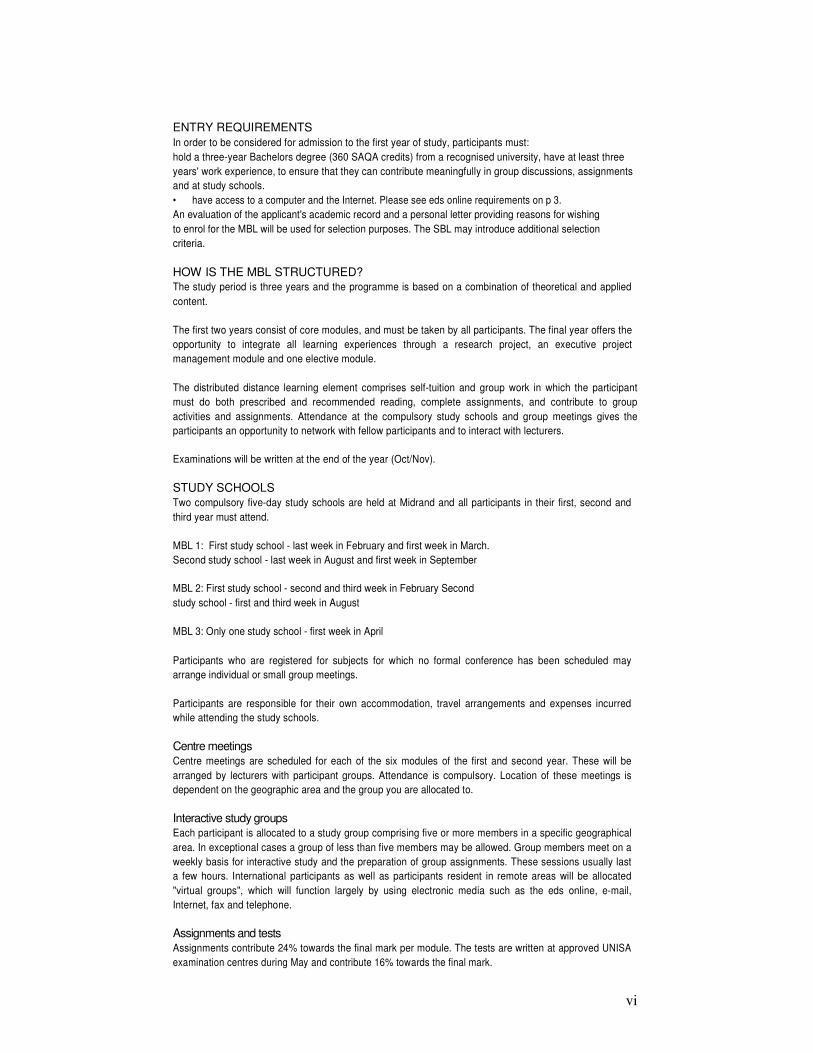
vi
ENTRY REQUIREMENTS In order to be considered for admission to the first year of study, participants must: hold a three-year Bachelors degree (360 SAQA credits) from a recognised university, have at least three
years' work experience, to ensure that they can contribute meaningfully in group discussions, assignments
and at study schools. • have access to a computer and the Internet. Please see eds online requirements on p 3. An evaluation of the applicant's academic record and a personal letter providing reasons for wishing to enrol for the MBL will be used for selection purposes. The SBL may introduce additional selection criteria.
HOW IS THE MBL STRUCTURED? The study period is three years and the programme is based on a combination of theoretical and applied
content.
The first two years consist of core modules, and must be taken by all participants. The final year offers the
opportunity to integrate all learning experiences through a research project, an executive project
management module and one elective module.
The distributed distance learning element comprises self-tuition and group work in which the participant
must do both prescribed and recommended reading, complete assignments, and contribute to group
activities and assignments. Attendance at the compulsory study schools and group meetings gives the
participants an opportunity to network with fellow participants and to interact with lecturers.
Examinations will be written at the end of the year (Oct/Nov).
STUDY SCHOOLS Two compulsory five-day study schools are held at Midrand and all participants in their first, second and
third year must attend.
MBL 1: First study school - last week in February and first week in March. Second study school - last week in August and first week in September
MBL 2: First study school - second and third week in February Second
study school - first and third week in August
MBL 3: Only one study school - first week in April
Participants who are registered for subjects for which no formal conference has been scheduled may
arrange individual or small group meetings.
Participants are responsible for their own accommodation, travel arrangements and expenses incurred
while attending the study schools.
Centre meetings Centre meetings are scheduled for each of the six modules of the first and second year. These will be
arranged by lecturers with participant groups. Attendance is compulsory. Location of these meetings is
dependent on the geographic area and the group you are allocated to.
Interactive study groups Each participant is allocated to a study group comprising five or more members in a specific geographical
area. In exceptional cases a group of less than five members may be allowed. Group members meet on a
weekly basis for interactive study and the preparation of group assignments. These sessions usually last
a few hours. International participants as well as participants resident in remote areas will be allocated
"virtual groups", which will function largely by using electronic media such as the eds online, e-mail,
Internet, fax and telephone.
Assignments and tests Assignments contribute 24% towards the final mark per module. The tests are written at approved UNISA
examination centres during May and contribute 16% towards the final mark.

vii
Examinations The programme ends in October with one four-hour open-book examination per module. It contributes
60% per module towards the final mark. Examinations will be held at centres designated by UNISA.
Examination eligibility will be according to the rules and procedures applicable to the MBL.
ELECTRONIC DELIVERY SYSTEM (eds online) The programme delivery will be by eds online, accessed on our website www.sblUNISA.ac.za or on
www.sbleds.ac.za.
Study material and contact with the SBL, lecturers and fellow participants are provided through eds online.
The eds online is available 24 hours a day and connects participants and staff through the Internet. All
study guides and other material supplied by the SBL are available through eds online.
Assignments are submitted electronically. Participants will work on common projects, share ideas,
information and understanding, and create new ideas or solutions. They can use eds online to interact with
their own groups and also with other participants, groups and lecturers. Using eds online means that
distance between participants, members of their group and the SBL becomes irrelevant.
Advantages of eds online over conventional printed materials: • It improves access to the Programme. • It teaches participants more about business in conjunction with the latest computer technology. • Participants acquire knowledge about technology and how to utilise it in business. • The electronic delivery makes communication efficient.
Requirements: eds online Participants will be required to have access to a computer and the Internet. The minimum hardware
requirements are as follows: Pentium III (50-OMhz); SVGA monitor (1026x728); CD-ROM (32 x speed);
128MB RAM; Windows XP or Windows 98; 500MB hard disk space; mouse, keyboard, etc. Other
requirements are Microsoft Office, Adobe Reader, Internet Explorer 6 or higher and the Internet
connectivity should at least be 56Kbps.
In the interest of speed of contact, quality of delivery, and of developing a truly computer literate manager,
all participants are strongly encouraged to make use of eds online.
Language medium Prescribed material is available in English. Participants may submit assignments and do examinations in
English or Afrikaans. The language medium for study schools is English.
APPLICATION FOR ADMISSION Application for admission must be made from 1 September each year. The closing date for applications is
4 November. No late applications will be considered. Successful candidates will be notified by e-mail not
later than 30 November.
NB: The application for admission form can be found at the back of this brochure. The form must be
completed, signed and accompanied by the required documents as set out in sections A-E. All
correspondence will be done via e-mail. Please ensure all details are correctly recorded on the application
form.
Once admission is accepted participants must register immediately.
In terms of the admission requirements, participants must register simultaneously for all the prescribed
modules of the particular year. A student may only register for the modules of the following year if no more than one module of any previous year still has to be passed and the outstanding module is taken
concurrently with the present year's modules.
Fees (No VAT payable) The prescribed fees for MBL 1 for the 2006 academic year are set out below. The initial payment must
accompany the application for selection. A full refund will be made if the application is not accepted.
Tuition fees: R19 140
Prescribed study material: ± R4 285* (compulsory)
Total cost: R23 425
Foreign students pay an additional levy. Please contact the Client Information Centre at +27 (0)11 652 0208 for details.
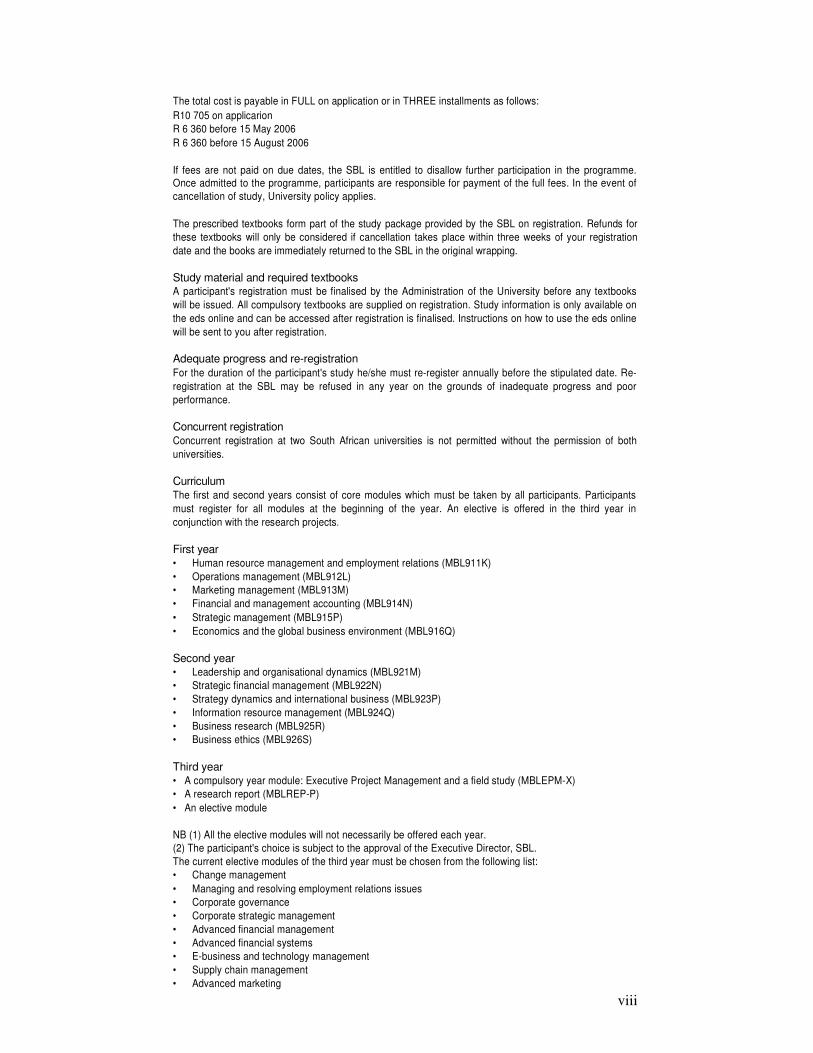
viii
The total cost is payable in FULL on application or in THREE installments as follows: R10 705 on applicarion R 6 360 before 15 May 2006 R 6 360 before 15 August 2006
If fees are not paid on due dates, the SBL is entitled to disallow further participation in the programme.
Once admitted to the programme, participants are responsible for payment of the full fees. In the event of
cancellation of study, University policy applies.
The prescribed textbooks form part of the study package provided by the SBL on registration. Refunds for
these textbooks will only be considered if cancellation takes place within three weeks of your registration
date and the books are immediately returned to the SBL in the original wrapping.
Study material and required textbooks A participant's registration must be finalised by the Administration of the University before any textbooks
will be issued. All compulsory textbooks are supplied on registration. Study information is only available on
the eds online and can be accessed after registration is finalised. Instructions on how to use the eds online
will be sent to you after registration.
Adequate progress and re-registration For the duration of the participant's study he/she must re-register annually before the stipulated date. Re-
registration at the SBL may be refused in any year on the grounds of inadequate progress and poor
performance.
Concurrent registration Concurrent registration at two South African universities is not permitted without the permission of both
universities.
Curriculum The first and second years consist of core modules which must be taken by all participants. Participants
must register for all modules at the beginning of the year. An elective is offered in the third year in
conjunction with the research projects.
First year • Human resource management and employment relations (MBL911K) • Operations management (MBL912L) • Marketing management (MBL913M) • Financial and management accounting (MBL914N) • Strategic management (MBL915P) • Economics and the global business environment (MBL916Q)
Second year • Leadership and organisational dynamics (MBL921M) • Strategic financial management (MBL922N) • Strategy dynamics and international business (MBL923P) • Information resource management (MBL924Q) • Business research (MBL925R) • Business ethics (MBL926S)
Third year • A compulsory year module: Executive Project Management and a field study (MBLEPM-X) • A research report (MBLREP-P) • An elective module
NB (1) All the elective modules will not necessarily be offered each year. (2) The participant's choice is subject to the approval of the Executive Director, SBL.
The current elective modules of the third year must be chosen from the following list: • Change management • Managing and resolving employment relations issues • Corporate governance • Corporate strategic management • Advanced financial management • Advanced financial systems • E-business and technology management • Supply chain management • Advanced marketing
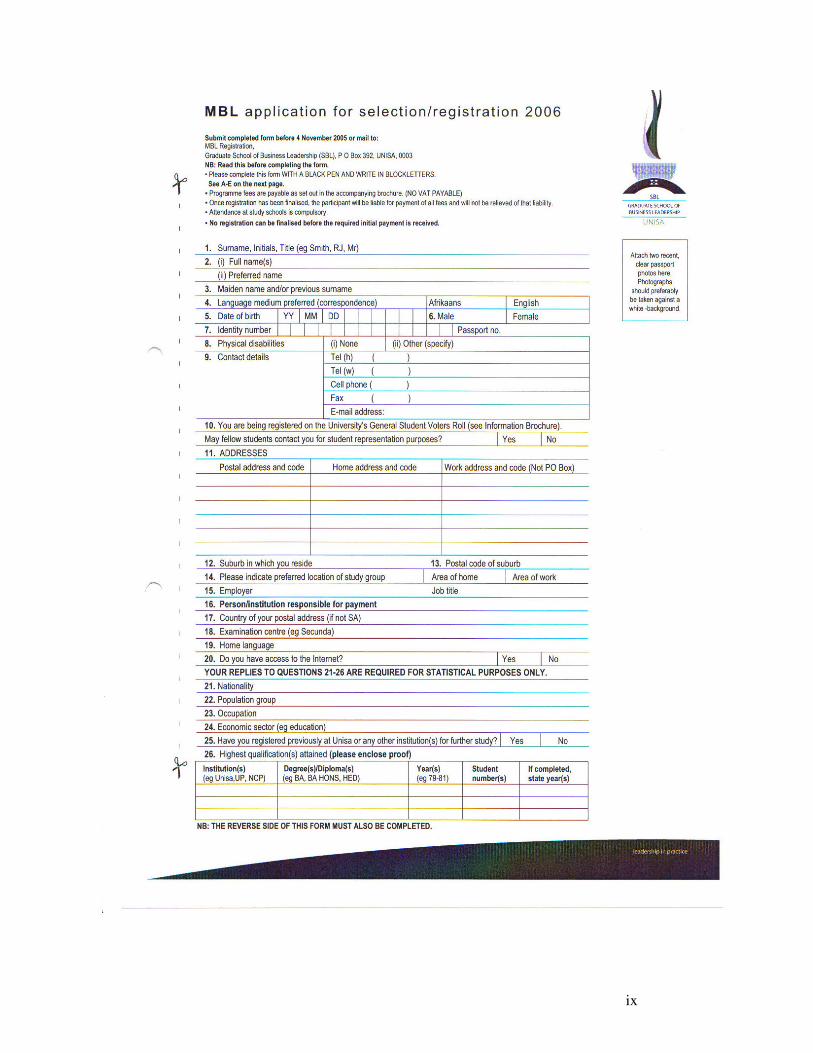
ix

x
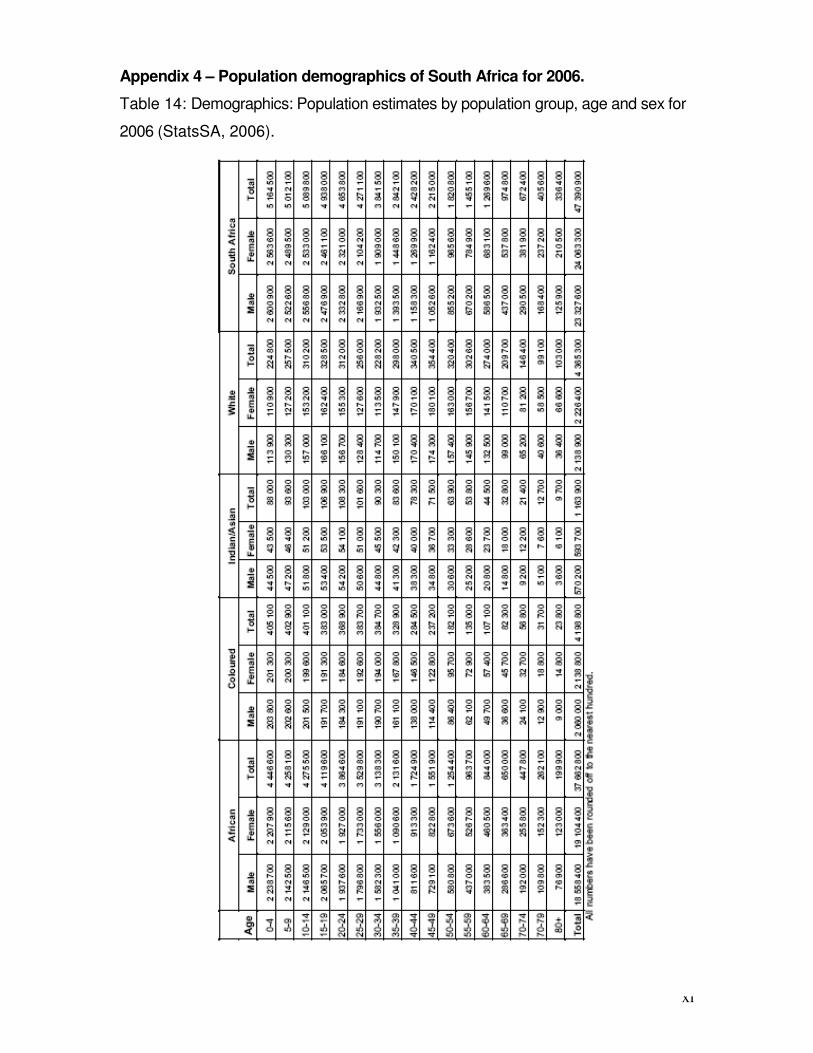
xi
Appendix 4 – Population demographics of South Africa for 2006.
Table 14: Demographics: Population estimates by population group, age and sex for
2006 (StatsSA, 2006).
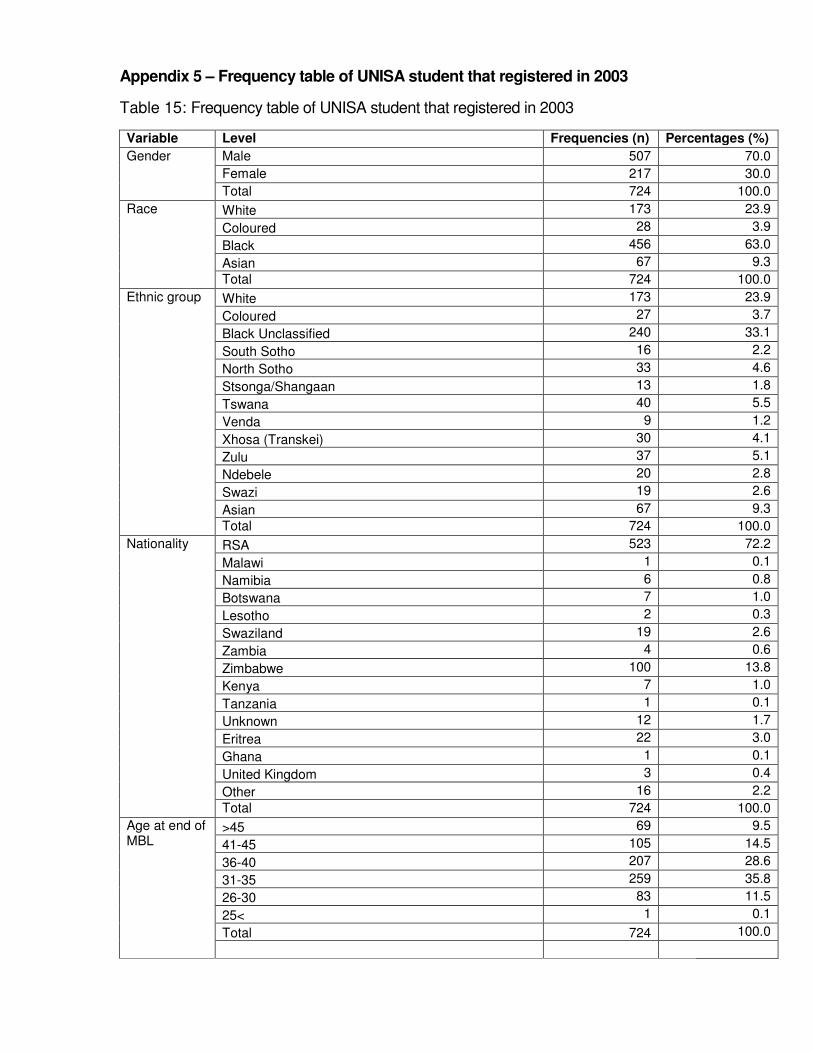
xii
Appendix 5 – Frequency table of UNISA student that registered in 2003
Table 15: Frequency table of UNISA student that registered in 2003
Variable Level Frequencies (n) Percentages (%)
Gender Male 507 70.0
Female 217 30.0
Total 724 100.0
Race White 173 23.9
Coloured 28 3.9
Black 456 63.0
Asian 67 9.3
Total 724 100.0
Ethnic group White 173 23.9
Coloured 27 3.7
Black Unclassified 240 33.1
South Sotho 16 2.2
North Sotho 33 4.6
Stsonga/Shangaan 13 1.8
Tswana 40 5.5
Venda 9 1.2
Xhosa (Transkei) 30 4.1
Zulu 37 5.1
Ndebele 20 2.8
Swazi 19 2.6
Asian 67 9.3
Total 724 100.0
Nationality RSA 523 72.2
Malawi 1 0.1
Namibia 6 0.8
Botswana 7 1.0
Lesotho 2 0.3
Swaziland 19 2.6
Zambia 4 0.6
Zimbabwe 100 13.8
Kenya 7 1.0
Tanzania 1 0.1
Unknown 12 1.7
Eritrea 22 3.0
Ghana 1 0.1
United Kingdom 3 0.4
Other 16 2.2
Total 724 100.0
Age at end of MBL
>45 69 9.5
41-45 105 14.5
36-40 207 28.6
31-35 259 35.8
26-30 83 11.5
25< 1 0.1
Total 724 100.0
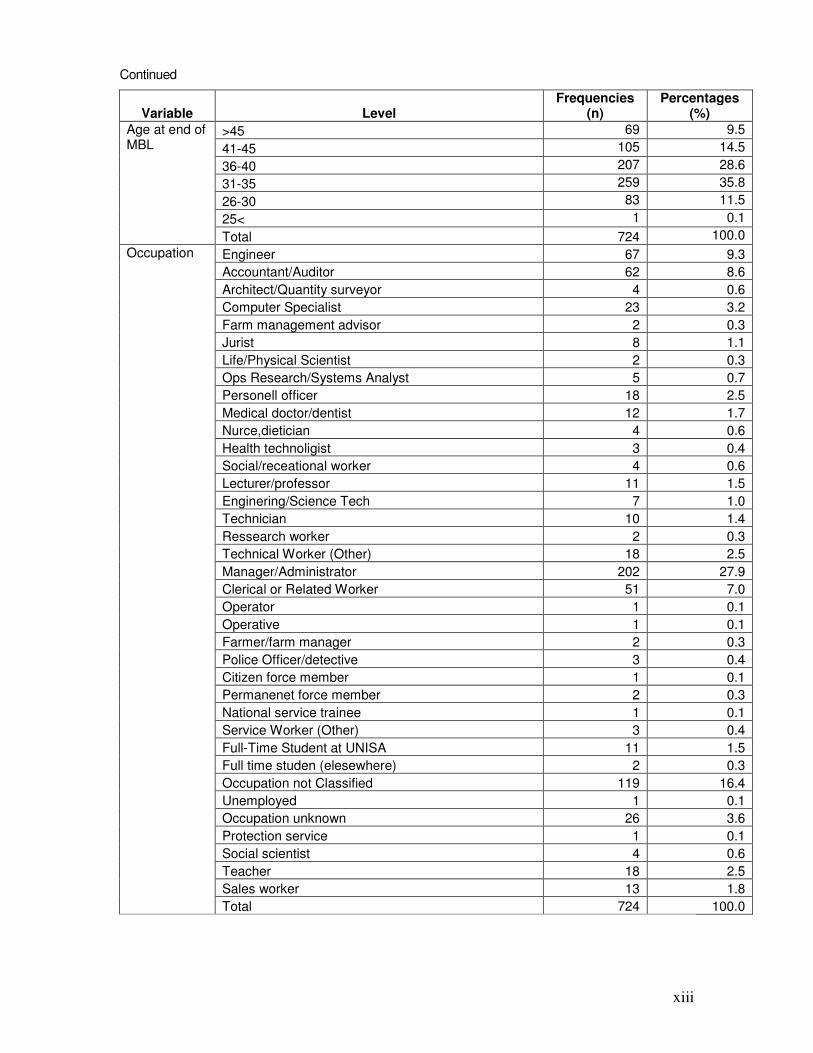
xiii
Continued
Variable Level
Frequencies (n)
Percentages (%)
Age at end of MBL
>45 69 9.5
41-45 105 14.5
36-40 207 28.6
31-35 259 35.8
26-30 83 11.5
25< 1 0.1
Total 724 100.0
Occupation Engineer 67 9.3
Accountant/Auditor 62 8.6
Architect/Quantity surveyor 4 0.6
Computer Specialist 23 3.2
Farm management advisor 2 0.3
Jurist 8 1.1
Life/Physical Scientist 2 0.3
Ops Research/Systems Analyst 5 0.7
Personell officer 18 2.5
Medical doctor/dentist 12 1.7
Nurce,dietician 4 0.6
Health technoligist 3 0.4
Social/receational worker 4 0.6
Lecturer/professor 11 1.5
Enginering/Science Tech 7 1.0
Technician 10 1.4
Ressearch worker 2 0.3
Technical Worker (Other) 18 2.5
Manager/Administrator 202 27.9
Clerical or Related Worker 51 7.0
Operator 1 0.1
Operative 1 0.1
Farmer/farm manager 2 0.3
Police Officer/detective 3 0.4
Citizen force member 1 0.1
Permanenet force member 2 0.3
National service trainee 1 0.1
Service Worker (Other) 3 0.4
Full-Time Student at UNISA 11 1.5
Full time studen (elesewhere) 2 0.3
Occupation not Classified 119 16.4
Unemployed 1 0.1
Occupation unknown 26 3.6
Protection service 1 0.1
Social scientist 4 0.6
Teacher 18 2.5
Sales worker 13 1.8
Total 724 100.0
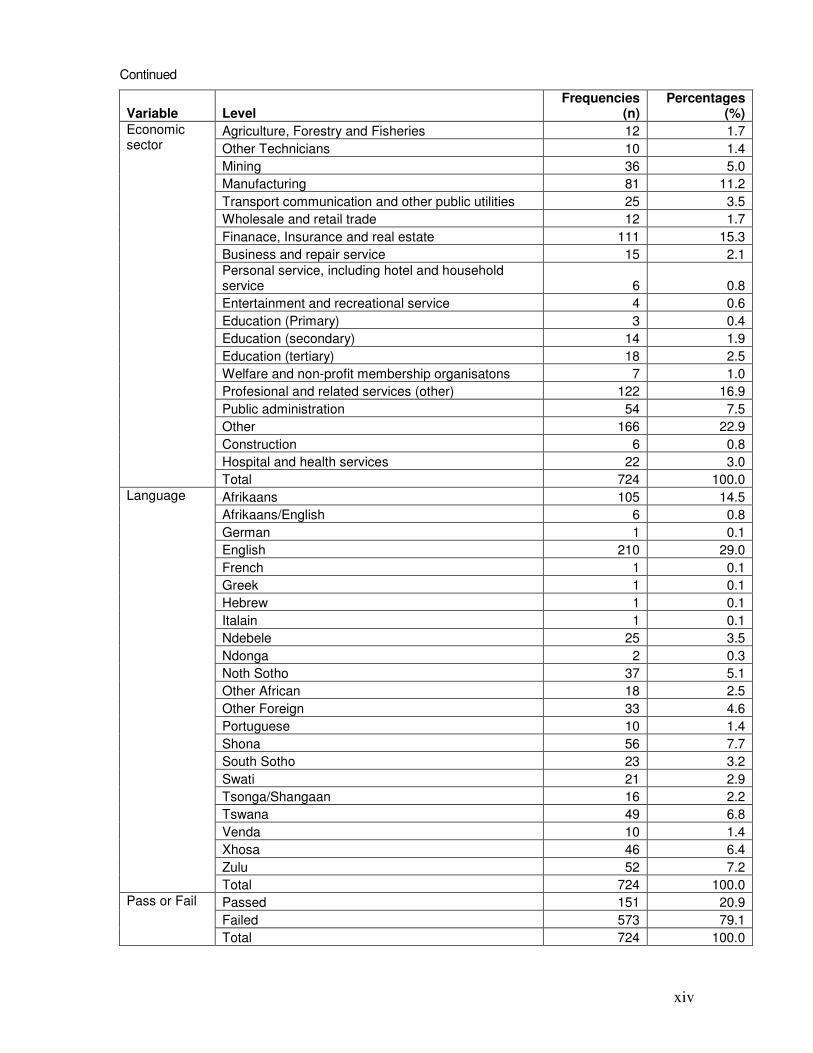
xiv
Continued
Variable Level
Frequencies (n)
Percentages (%)
Economic sector
Agriculture, Forestry and Fisheries 12 1.7
Other Technicians 10 1.4
Mining 36 5.0
Manufacturing 81 11.2
Transport communication and other public utilities 25 3.5
Wholesale and retail trade 12 1.7
Finanace, Insurance and real estate 111 15.3
Business and repair service 15 2.1
Personal service, including hotel and household service 6 0.8
Entertainment and recreational service 4 0.6
Education (Primary) 3 0.4
Education (secondary) 14 1.9
Education (tertiary) 18 2.5
Welfare and non-profit membership organisatons 7 1.0
Profesional and related services (other) 122 16.9
Public administration 54 7.5
Other 166 22.9
Construction 6 0.8
Hospital and health services 22 3.0
Total 724 100.0
Language Afrikaans 105 14.5
Afrikaans/English 6 0.8
German 1 0.1
English 210 29.0
French 1 0.1
Greek 1 0.1
Hebrew 1 0.1
Italain 1 0.1
Ndebele 25 3.5
Ndonga 2 0.3
Noth Sotho 37 5.1
Other African 18 2.5
Other Foreign 33 4.6
Portuguese 10 1.4
Shona 56 7.7
South Sotho 23 3.2
Swati 21 2.9
Tsonga/Shangaan 16 2.2
Tswana 49 6.8
Venda 10 1.4
Xhosa 46 6.4
Zulu 52 7.2
Total 724 100.0
Pass or Fail Passed 151 20.9
Failed 573 79.1
Total 724 100.0
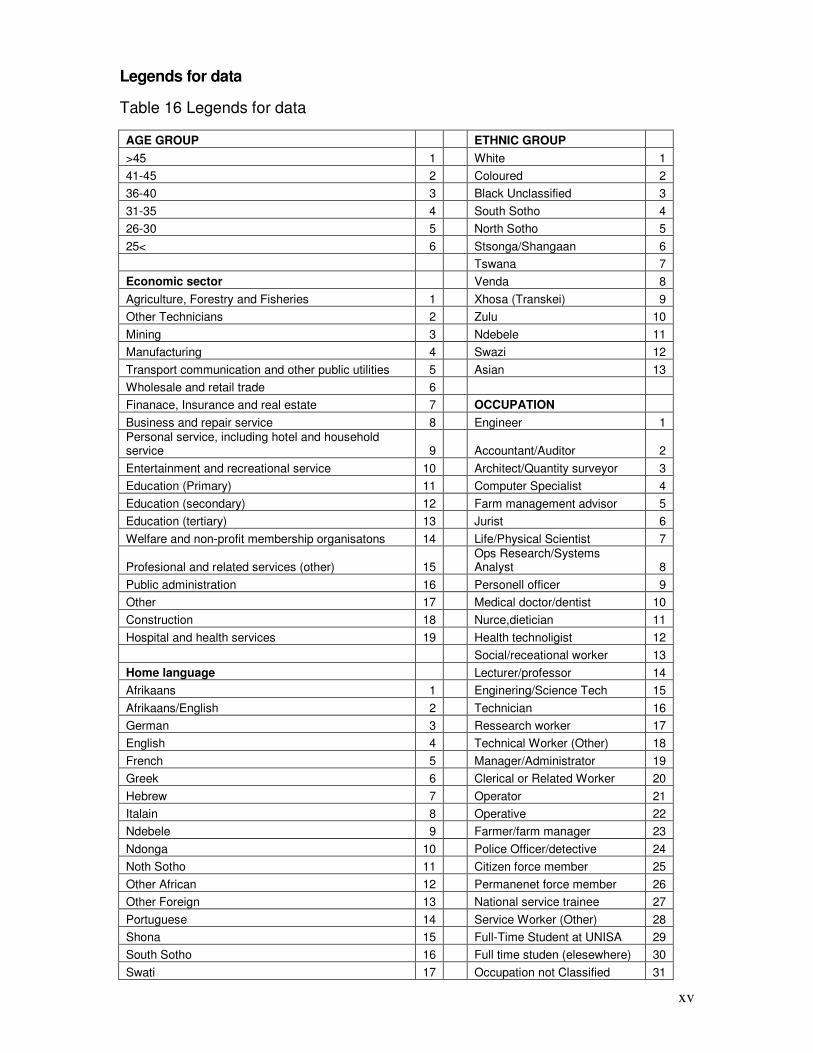
xv
Legends for data
Table 16 Legends for data
AGE GROUP ETHNIC GROUP
>45 1 White 1
41-45 2 Coloured 2
36-40 3 Black Unclassified 3
31-35 4 South Sotho 4
26-30 5 North Sotho 5
25< 6 Stsonga/Shangaan 6
Tswana 7
Economic sector Venda 8
Agriculture, Forestry and Fisheries 1 Xhosa (Transkei) 9
Other Technicians 2 Zulu 10
Mining 3 Ndebele 11
Manufacturing 4 Swazi 12
Transport communication and other public utilities 5 Asian 13
Wholesale and retail trade 6
Finanace, Insurance and real estate 7 OCCUPATION
Business and repair service 8 Engineer 1
Personal service, including hotel and household service 9 Accountant/Auditor 2
Entertainment and recreational service 10 Architect/Quantity surveyor 3
Education (Primary) 11 Computer Specialist 4
Education (secondary) 12 Farm management advisor 5
Education (tertiary) 13 Jurist 6
Welfare and non-profit membership organisatons 14 Life/Physical Scientist 7
Profesional and related services (other) 15 Ops Research/Systems Analyst 8
Public administration 16 Personell officer 9
Other 17 Medical doctor/dentist 10
Construction 18 Nurce,dietician 11
Hospital and health services 19 Health technoligist 12
Social/receational worker 13
Home language Lecturer/professor 14
Afrikaans 1 Enginering/Science Tech 15
Afrikaans/English 2 Technician 16
German 3 Ressearch worker 17
English 4 Technical Worker (Other) 18
French 5 Manager/Administrator 19
Greek 6 Clerical or Related Worker 20
Hebrew 7 Operator 21
Italain 8 Operative 22
Ndebele 9 Farmer/farm manager 23
Ndonga 10 Police Officer/detective 24
Noth Sotho 11 Citizen force member 25
Other African 12 Permanenet force member 26
Other Foreign 13 National service trainee 27
Portuguese 14 Service Worker (Other) 28
Shona 15 Full-Time Student at UNISA 29
South Sotho 16 Full time studen (elesewhere) 30
Swati 17 Occupation not Classified 31
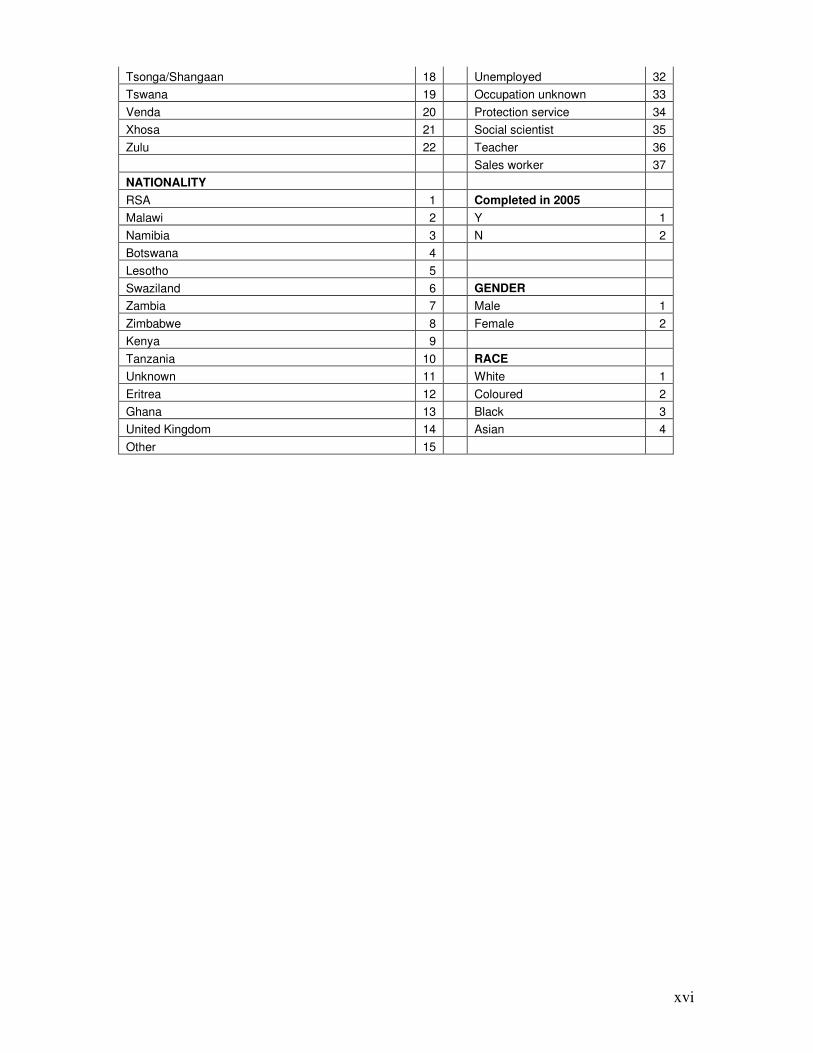
xvi
Tsonga/Shangaan 18 Unemployed 32
Tswana 19 Occupation unknown 33
Venda 20 Protection service 34
Xhosa 21 Social scientist 35
Zulu 22 Teacher 36
Sales worker 37
NATIONALITY
RSA 1 Completed in 2005
Malawi 2 Y 1
Namibia 3 N 2
Botswana 4
Lesotho 5
Swaziland 6 GENDER
Zambia 7 Male 1
Zimbabwe 8 Female 2
Kenya 9
Tanzania 10 RACE
Unknown 11 White 1
Eritrea 12 Coloured 2
Ghana 13 Black 3
United Kingdom 14 Asian 4
Other 15
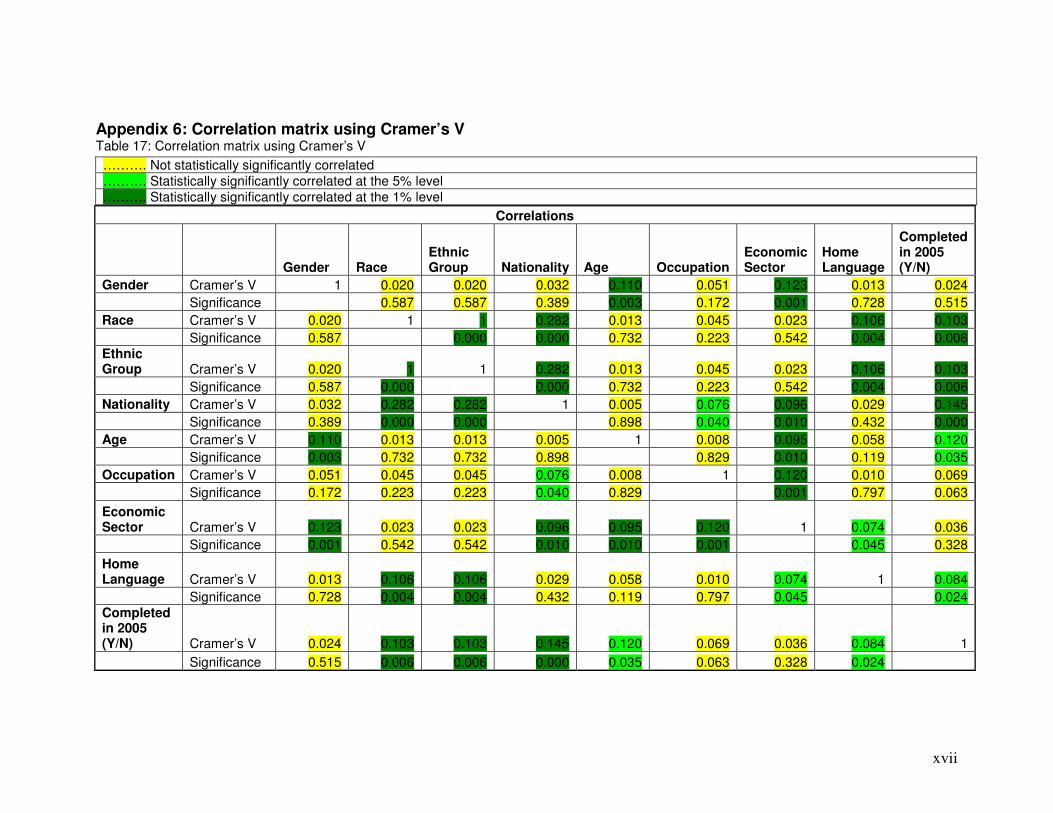
xvii
Appendix 6: Correlation matrix using Cramer’s V
Table 17: Correlation matrix using Cramer’s V
Correlations
Gender Race Ethnic Group Nationality Age Occupation
Economic Sector
Home Language
Completed in 2005 (Y/N)
Gender Cramer’s V 1 0.020 0.020 0.032 0.110 0.051 0.123 0.013 0.024
Significance 0.587 0.587 0.389 0.003 0.172 0.001 0.728 0.515
Race Cramer’s V 0.020 1 1 0.282 0.013 0.045 0.023 0.106 0.103
Significance 0.587 0.000 0.000 0.732 0.223 0.542 0.004 0.006 Ethnic Group Cramer’s V 0.020 1 1 0.282 0.013 0.045 0.023 0.106 0.103
Significance 0.587 0.000 0.000 0.732 0.223 0.542 0.004 0.006
Nationality Cramer’s V 0.032 0.282 0.282 1 0.005 0.076 0.096 0.029 0.145
Significance 0.389 0.000 0.000 0.898 0.040 0.010 0.432 0.000
Age Cramer’s V 0.110 0.013 0.013 0.005 1 0.008 0.095 0.058 0.120
Significance 0.003 0.732 0.732 0.898 0.829 0.010 0.119 0.035
Occupation Cramer’s V 0.051 0.045 0.045 0.076 0.008 1 0.120 0.010 0.069
Significance 0.172 0.223 0.223 0.040 0.829 0.001 0.797 0.063
Economic Sector Cramer’s V 0.123 0.023 0.023 0.096 0.095 0.120 1 0.074 0.036
Significance 0.001 0.542 0.542 0.010 0.010 0.001 0.045 0.328
Home Language Cramer’s V 0.013 0.106 0.106 0.029 0.058 0.010 0.074 1 0.084
Significance 0.728 0.004 0.004 0.432 0.119 0.797 0.045 0.024 Completed in 2005 (Y/N) Cramer’s V 0.024 0.103 0.103 0.145 0.120 0.069 0.036 0.084 1
Significance 0.515 0.006 0.006 0.000 0.035 0.063 0.328 0.024
………. Not statistically significantly correlated
………. Statistically significantly correlated at the 5% level
………. Statistically significantly correlated at the 1% level
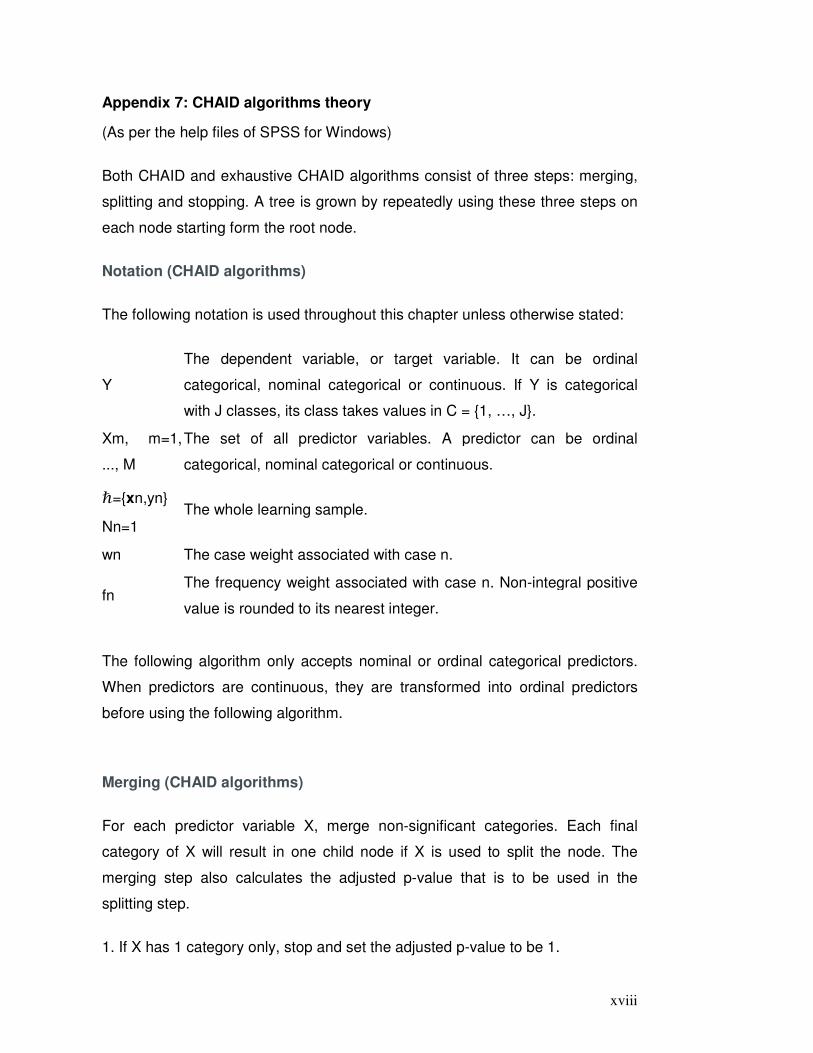
xviii
Appendix 7: CHAID algorithms theory
(As per the help files of SPSS for Windows)
Both CHAID and exhaustive CHAID algorithms consist of three steps: merging,
splitting and stopping. A tree is grown by repeatedly using these three steps on
each node starting form the root node.
Notation (CHAID algorithms)
The following notation is used throughout this chapter unless otherwise stated:
Y
The dependent variable, or target variable. It can be ordinal
categorical, nominal categorical or continuous. If Y is categorical
with J classes, its class takes values in C = {1, …, J}.
Xm, m=1,
..., M
The set of all predictor variables. A predictor can be ordinal
categorical, nominal categorical or continuous.
�={xn,yn}
Nn=1 The whole learning sample.
wn The case weight associated with case n.
fn The frequency weight associated with case n. Non-integral positive
value is rounded to its nearest integer.
The following algorithm only accepts nominal or ordinal categorical predictors.
When predictors are continuous, they are transformed into ordinal predictors
before using the following algorithm.
Merging (CHAID algorithms)
For each predictor variable X, merge non-significant categories. Each final
category of X will result in one child node if X is used to split the node. The
merging step also calculates the adjusted p-value that is to be used in the
splitting step.
1. If X has 1 category only, stop and set the adjusted p-value to be 1.

xix
2. If X has 2 categories, go to step 8.
3. Else, find the allowable pair of categories of X (an allowable pair of categories
for ordinal predictor is two adjacent categories, and for nominal predictor is any
two categories) that is least significantly different (i.e., most similar). The most
similar pair is the pair whose test statistic gives the largest p-value with respect
to the dependent variable Y. How to calculate p-value under various situations
will be described in later sections.
4. For the pair having the largest p-value, check if its p-value is larger than a
user-specified alpha-level α merge . If it does, this pair is merged into a single
compound category. Then a new set of categories of X is formed. If it does not,
then go to step 7.
5. (Optional) If the newly formed compound category consists of three or more
original categories, then find the best binary split within the compound category
which p-value is the smallest. Perform this binary split if its p-value is not larger
than an alpha-level α split-merge .
6. Go to step 2.
7. (Optional) Any category having too few observations (as compared with a
user-specified minimum segment size) is merged with the most similar other
category as measured by the largest of the p-values.
8. The adjusted p-value is computed for the merged categories by applying
Bonferroni adjustments that are to be discussed later.
Splitting (CHAID algorithms)
The “best” split for each predictor is found in the merging step. The splitting step
selects which predictor to be used to best split the node. Selection is
accomplished by comparing the adjusted p-value associated with each
predictor. The adjusted p-value is obtained in the merging step.
1. Select the predictor that has the smallest adjusted p-value (i.e., most
significant).
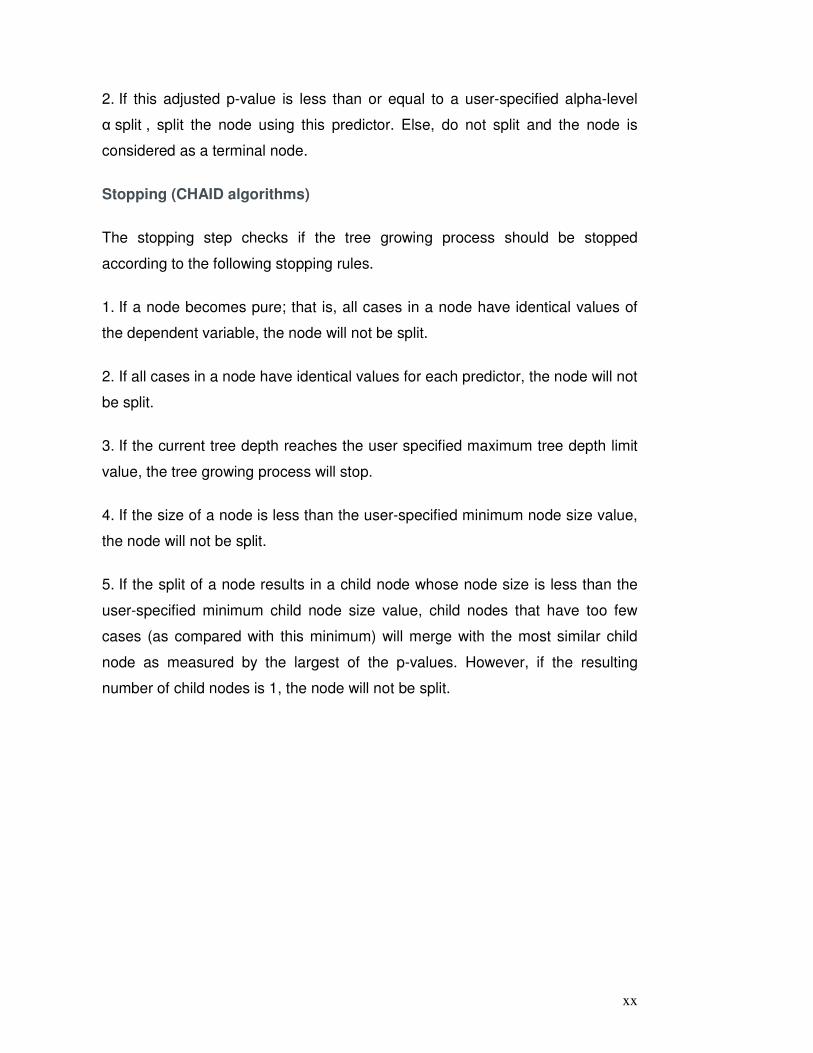
xx
2. If this adjusted p-value is less than or equal to a user-specified alpha-level
α split , split the node using this predictor. Else, do not split and the node is
considered as a terminal node.
Stopping (CHAID algorithms)
The stopping step checks if the tree growing process should be stopped
according to the following stopping rules.
1. If a node becomes pure; that is, all cases in a node have identical values of
the dependent variable, the node will not be split.
2. If all cases in a node have identical values for each predictor, the node will not
be split.
3. If the current tree depth reaches the user specified maximum tree depth limit
value, the tree growing process will stop.
4. If the size of a node is less than the user-specified minimum node size value,
the node will not be split.
5. If the split of a node results in a child node whose node size is less than the
user-specified minimum child node size value, child nodes that have too few
cases (as compared with this minimum) will merge with the most similar child
node as measured by the largest of the p-values. However, if the resulting
number of child nodes is 1, the node will not be split.