Adjusting the Vibratory Response of a Micro Mirror via Position and Velocity Feedback
12
http://jvc.sagepub.com/ Journal of Vibration and Control http://jvc.sagepub.com/content/early/2010/07/20/1077546309349430 The online version of this article can be found at: DOI: 10.1177/1077546309349430 published online 23 July 2010 Journal of Vibration and Control Ilgar Veryeri and Ipek Basdogan Adjusting the Vibratory Response of a Micro Mirror via Position and Velocity Feedback - Jan 10, 2011 version of this article was published on more recent A Published by: http://www.sagepublications.com can be found at: Journal of Vibration and Control Additional services and information for http://jvc.sagepub.com/cgi/alerts Email Alerts: http://jvc.sagepub.com/subscriptions Subscriptions: http://www.sagepub.com/journalsReprints.nav Reprints: http://www.sagepub.com/journalsPermissions.nav Permissions: What is This? - Jul 23, 2010 Proof >> - Jan 10, 2011 Version of Record at Koc University on November 25, 2011 jvc.sagepub.com Downloaded from
-
Upload
independent -
Category
Documents
-
view
1 -
download
0
Transcript of Adjusting the Vibratory Response of a Micro Mirror via Position and Velocity Feedback

http://jvc.sagepub.com/Journal of Vibration and Control
http://jvc.sagepub.com/content/early/2010/07/20/1077546309349430The online version of this article can be found at:
DOI: 10.1177/1077546309349430
published online 23 July 2010Journal of Vibration and ControlIlgar Veryeri and Ipek Basdogan
Adjusting the Vibratory Response of a Micro Mirror via Position and Velocity Feedback
- Jan 10, 2011version of this article was published on more recent A
Published by:
http://www.sagepublications.com
can be found at:Journal of Vibration and ControlAdditional services and information for
http://jvc.sagepub.com/cgi/alertsEmail Alerts:
http://jvc.sagepub.com/subscriptionsSubscriptions:
http://www.sagepub.com/journalsReprints.navReprints:
http://www.sagepub.com/journalsPermissions.navPermissions:
What is This?
- Jul 23, 2010Proof >>
- Jan 10, 2011Version of Record
at Koc University on November 25, 2011jvc.sagepub.comDownloaded from

Adjusting the Vibratory Response of aMicro Mirror via Position and VelocityFeedback
Ilgar Veryeri and Ipek Basdogan
AbstractWe changed the vibratory (dynamic) response of a micro mirror experimentally using a feedback circuit. For this purpose,we first measured the vibrational velocity of the mirror using a Laser Doppler Vibrometer and then multiplied it with again and fed the signal back to the mirror to change its effective damping. We also investigate the influence of velocity andposition feedback on the dynamic response of the same mirror through numerical simulations. For this purpose, first, atransfer function of the mirror was obtained based on the experimental frequency sweep data of the first two vibrationmodes. Then, the dynamic response of the mirror was investigated for different feedback gains via simulations. The resultsof our study show that the vibration amplitude or settling time of the mirror can be adjusted by altering the velocityfeedback gain and the coupled vibration modes of the mirror can be separated from each other by adjusting theposition feedback gain.
KeywordsDynamic properties of micro systems, feedback control
Received 17 September 2008; accepted 3 August 2009
1. Introduction
Many compact visual displays or scanning devices utilize
micro mirrors rotating about one or two axes. Also, for sev-
eral applications utilizing optical switches, projectors,
head-up and head-worn displays, barcode readers, endo-
scopic cameras, the dynamical characteristics of micro mir-
rors play a crucial role in the output performance of these
systems (Urey, 2003; Changho et al., 2006; Yalcinkaya
et al., 2007). The dynamical response of a micro mirror is
related to its energy storage (i.e. stiffness) and dissipation
capacity (i.e. damping), which in turn may effect the scan-
ning range and resolution, the transient response and signal
to noise ratio.
In today’s practice, a micro mirror is specifically
designed and manufactured based on the requirements of
an application. However, achieving an optimum design that
satisfies both the space constraints and the dynamical
requirements of the application is not trivial and still the
subject of current research. Even if this is achieved, the
same mirror may not be easily used in another application
having different dynamical requirements.
In this study, a velocity and position feedback system is
introduced in order to change the effective damping and the
stiffness characteristics of a micro mirror. The mirror used
in this study is actuated by Lorentz’s forces created by an
external magnetic field and an alternating current (see
Figure 1). The mirror is used as a scanner to deflect a modu-
lated light beam on an image plane to create a display. The
scanning angle, operation frequency and quality factor are
among the design parameters of the micro scanners that
should be highly taken into consideration.
If the micro mirror is modeled as a simple spring-
mass-damper system, its equation of motion can be written as
I€yþ b _yþ ky ¼ To cosðoRtÞ
on ¼ffiffiffik
I
r ð1Þ
Department of Mechanical Engineering, College of Engineering, Koc
University, Istanbul, 34450, Turkey
Corresponding Author:
Ipek Basdogan, Department of Mechanical Engineering, College of
Engineering, Koc University, Istanbul, 34450, Turkey
Email: [email protected]
Journal of Vibration and Control000(00) 1–11ª The Author(s) 2010Reprints and permission:sagepub.co.uk/journalsPermissions.navDOI: 10.1177/1077546309349430jvc.sagepub.com
Journal of Vibration and Control OnlineFirst, published on July 23, 2010 as doi:10.1177/1077546309349430
at Koc University on November 25, 2011jvc.sagepub.comDownloaded from
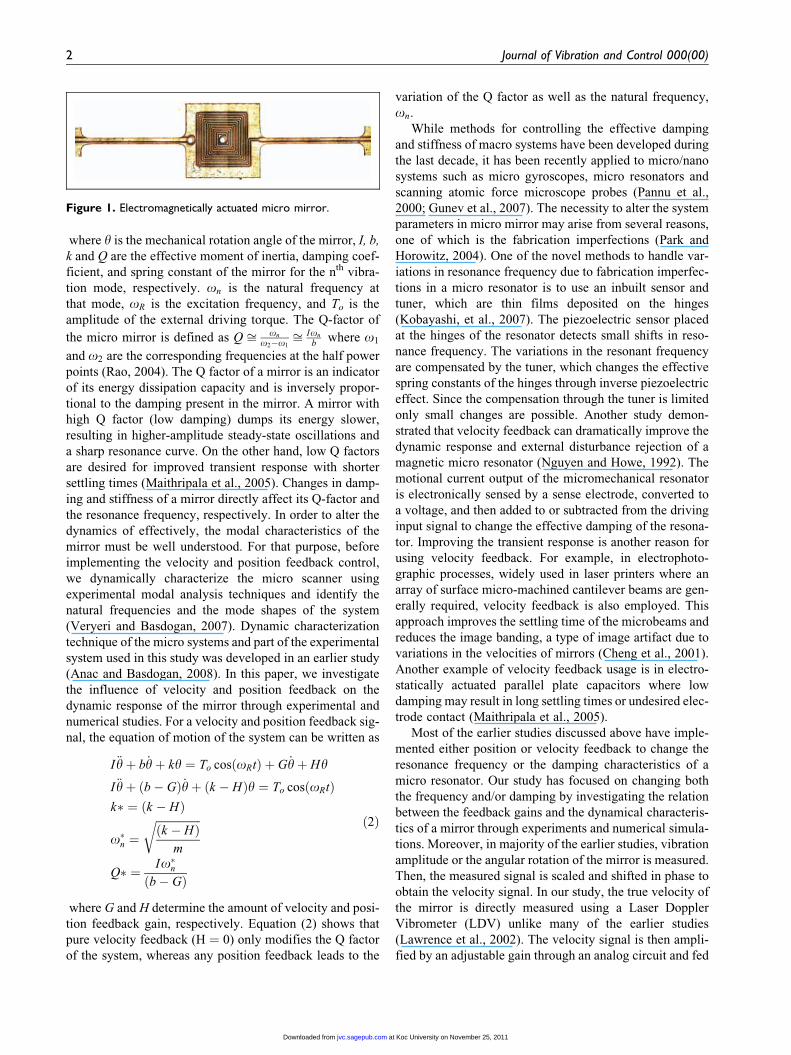
where y is the mechanical rotation angle of the mirror, I, b,
k and Q are the effective moment of inertia, damping coef-
ficient, and spring constant of the mirror for the nth vibra-
tion mode, respectively. on is the natural frequency at
that mode, oR is the excitation frequency, and To is the
amplitude of the external driving torque. The Q-factor of
the micro mirror is defined as Q ffi on
o2�o1ffi Ion
bwhere o1
and o2 are the corresponding frequencies at the half power
points (Rao, 2004). The Q factor of a mirror is an indicator
of its energy dissipation capacity and is inversely propor-
tional to the damping present in the mirror. A mirror with
high Q factor (low damping) dumps its energy slower,
resulting in higher-amplitude steady-state oscillations and
a sharp resonance curve. On the other hand, low Q factors
are desired for improved transient response with shorter
settling times (Maithripala et al., 2005). Changes in damp-
ing and stiffness of a mirror directly affect its Q-factor and
the resonance frequency, respectively. In order to alter the
dynamics of effectively, the modal characteristics of the
mirror must be well understood. For that purpose, before
implementing the velocity and position feedback control,
we dynamically characterize the micro scanner using
experimental modal analysis techniques and identify the
natural frequencies and the mode shapes of the system
(Veryeri and Basdogan, 2007). Dynamic characterization
technique of the micro systems and part of the experimental
system used in this study was developed in an earlier study
(Anac and Basdogan, 2008). In this paper, we investigate
the influence of velocity and position feedback on the
dynamic response of the mirror through experimental and
numerical studies. For a velocity and position feedback sig-
nal, the equation of motion of the system can be written as
I€yþ b _yþ ky ¼ To cosðoRtÞ þ G _yþ Hy
I€yþ ðb� GÞ _yþ ðk � HÞy ¼ To cosðoRtÞk� ¼ ðk � HÞ
o�n ¼ffiffiffiffiffiffiffiffiffiffiffiffiffiffiffiffiðk � HÞ
m
r
Q� ¼ Io�nðb� GÞ
ð2Þ
where G and H determine the amount of velocity and posi-
tion feedback gain, respectively. Equation (2) shows that
pure velocity feedback (H ¼ 0) only modifies the Q factor
of the system, whereas any position feedback leads to the
variation of the Q factor as well as the natural frequency,
on.
While methods for controlling the effective damping
and stiffness of macro systems have been developed during
the last decade, it has been recently applied to micro/nano
systems such as micro gyroscopes, micro resonators and
scanning atomic force microscope probes (Pannu et al.,
2000; Gunev et al., 2007). The necessity to alter the system
parameters in micro mirror may arise from several reasons,
one of which is the fabrication imperfections (Park and
Horowitz, 2004). One of the novel methods to handle var-
iations in resonance frequency due to fabrication imperfec-
tions in a micro resonator is to use an inbuilt sensor and
tuner, which are thin films deposited on the hinges
(Kobayashi, et al., 2007). The piezoelectric sensor placed
at the hinges of the resonator detects small shifts in reso-
nance frequency. The variations in the resonant frequency
are compensated by the tuner, which changes the effective
spring constants of the hinges through inverse piezoelectric
effect. Since the compensation through the tuner is limited
only small changes are possible. Another study demon-
strated that velocity feedback can dramatically improve the
dynamic response and external disturbance rejection of a
magnetic micro resonator (Nguyen and Howe, 1992). The
motional current output of the micromechanical resonator
is electronically sensed by a sense electrode, converted to
a voltage, and then added to or subtracted from the driving
input signal to change the effective damping of the resona-
tor. Improving the transient response is another reason for
using velocity feedback. For example, in electrophoto-
graphic processes, widely used in laser printers where an
array of surface micro-machined cantilever beams are gen-
erally required, velocity feedback is also employed. This
approach improves the settling time of the microbeams and
reduces the image banding, a type of image artifact due to
variations in the velocities of mirrors (Cheng et al., 2001).
Another example of velocity feedback usage is in electro-
statically actuated parallel plate capacitors where low
damping may result in long settling times or undesired elec-
trode contact (Maithripala et al., 2005).
Most of the earlier studies discussed above have imple-
mented either position or velocity feedback to change the
resonance frequency or the damping characteristics of a
micro resonator. Our study has focused on changing both
the frequency and/or damping by investigating the relation
between the feedback gains and the dynamical characteris-
tics of a mirror through experiments and numerical simula-
tions. Moreover, in majority of the earlier studies, vibration
amplitude or the angular rotation of the mirror is measured.
Then, the measured signal is scaled and shifted in phase to
obtain the velocity signal. In our study, the true velocity of
the mirror is directly measured using a Laser Doppler
Vibrometer (LDV) unlike many of the earlier studies
(Lawrence et al., 2002). The velocity signal is then ampli-
fied by an adjustable gain through an analog circuit and fed
Figure 1. Electromagnetically actuated micro mirror.
2 Journal of Vibration and Control 000(00)
at Koc University on November 25, 2011jvc.sagepub.comDownloaded from

back to the system to change the effective damping of the
mirror. This approach is more robust especially if the non-
linear effects due to friction or external forces significantly
influence the output response of the mirror. Under these
circumstances, phase shifting and simply scaling the posi-
tion signal to obtain the velocity signal is not a reliable
approach.
Finally, only a few studies in the literature investigated
the dynamic response a micro mirror under simple position
and velocity feedback through numerical simulations sup-
ported by experiments (Zhu et al., 2007). Most of the earlier
studies have focused on the development of a control law to
achieve the desired response. To better understand the
influence of velocity and position feedback gains on the
vibratory response of the mirror, we performed numerical
simulations in SIMULINK1. A transfer function of the
mirror is developed based on the experimental frequency
sweep data of the first two resonant frequencies. Then, the
effect of changing the feedback gains on the dynamic
response of the mirror is investigated. The numerical simu-
lations enabled us to investigate the system behavior under
ideal conditions (free of environmental disturbances) and
also determine the range of gain values that are used in the
actual experiments.
In the next section, the details of the experimental set-
up, feedback mechanism, and the results of our experi-
ments are presented. Development of the mirror model and
the results of the numerical simulations for different feed-
back gains are given in Section 3. Finally, we discuss the
results of both experiments and simulations in Section 4.
2. Experimental Set-up
The experimental set-up consists of a LDV (Polytec
GmbH. Germany) is used for measuring the vertical vibra-
tions of the mirror, an optical microscope, a charge coupled
device (CCD) camera, and a X-Y stage are used for exact
positioning of the laser beam (see Figure 2). A data
acquisition system and an analog circuit are used for velo-
city feedback. The LDV having a bandwidth of 1.5 GHz
measures the out of plane velocity of a point on the probe
by collecting and processing the backscattered laser light.
It is composed of a controller (OFV–5000) and a fiber
interferometer (OFV–551). The sensor head of OFV–551
delivers a laser beam to a measurement point on the mirror
and collects the reflected light. Using the optical micro-
scope, the laser beam is focused. The controller OFV–
5000 processes the data collected from OFV–551 using a
wide bandwidth velocity decoder (VD–02) having a resolu-
tion of 0.15 mm/s. The sinusoidal input signal (generated by
a signal generator) and the velocity signal acquired by LDV
are sent to the computer for further analysis via the acqui-
sition system.
The mirror is actuated using a velocity feedback circuit
as shown in Figure 2. The main components of the feed-
back circuit are the phase shifter and the gain amplifier.
The analog phase shifter is integrated into the signal pro-
cessing circuit to adjust the phase deviations in velocity
measurements at different frequencies due to the intrinsic
time delay in the LDV. Although the delay observed in
LDV is constant and small at the operating frequency. it
increases proportionally with increasing frequency, result-
ing in an undesired positional signal in the feedback loop.
This shift can be tuned by adjusting the capacitance or
the resistance in the phase shifter circuit (see Figure 3).
To observe the behavior of this circuit for varying resis-
tance and capacitance values. a pSpice model of the phase
shifter is developed. As shown in Figure 4, increasing the
resistance or the capacitance by the same amount has the
same effect on the phase shift (e.g. if the resistance is
increased and the capacitance is decreased by a factor of ten
simultaneously. then there is no change in the phase).
Hence, after selecting a value for the capacitance, the resis-
tance is fine tuned in its allowable range to obtain a desired
shift in phase. A single adjustment is adequate when the
system is only fed back with velocity gain. In position
Actuationsignal
Velocity
Gain
Inputsignal
Vibrometer Phase Shifter
CCD Camera
5X Lens
1D MirrorX-Y Stage
Microscope Adaptor
Gain Amplifier
Power Supply
Signal Generator
Figure 2. (a)The schematic of the experimental set-up. (b) A photograph of the experimental set-up.
Veryeri and Basdogan 3
at Koc University on November 25, 2011jvc.sagepub.comDownloaded from

feedback, adjusting the resistance for the new resonant fre-
quency is necessary.
The gain amplifier (AD633JN, Analog Devices, Nor-
wood, MA) is used to multiply the phase shifter output sig-
nal by a predefined constant. The amplified signal is then
added to the input signal to generate the final actuation sig-
nal. The frequency sweep curves for three different gain
values are shown in Figure 5. The quality factors corre-
sponding to the curves are Q ¼ 62.7, 96.1 and 169.6 for the
velocity feedback gains of G ¼ 0, 0.01 and 0.02,
respectively.
It is observed that the vibration amplitude does not
increase for gain values greater than G ¼ 0.02. To better
understand the limitations of the velocity feedback
approach, the feedback gain is set to zero and the mirror
velocity is measured at increasing voltages (see Figure
6). Up to a certain input voltage (*140 mV), the velocity
of the mirror is linearly proportional with the voltage. After
that point, the increase in velocity is small and the output
amplitude tends to saturate at a limiting value of 150
mm/s (6V X 25 mm/s).
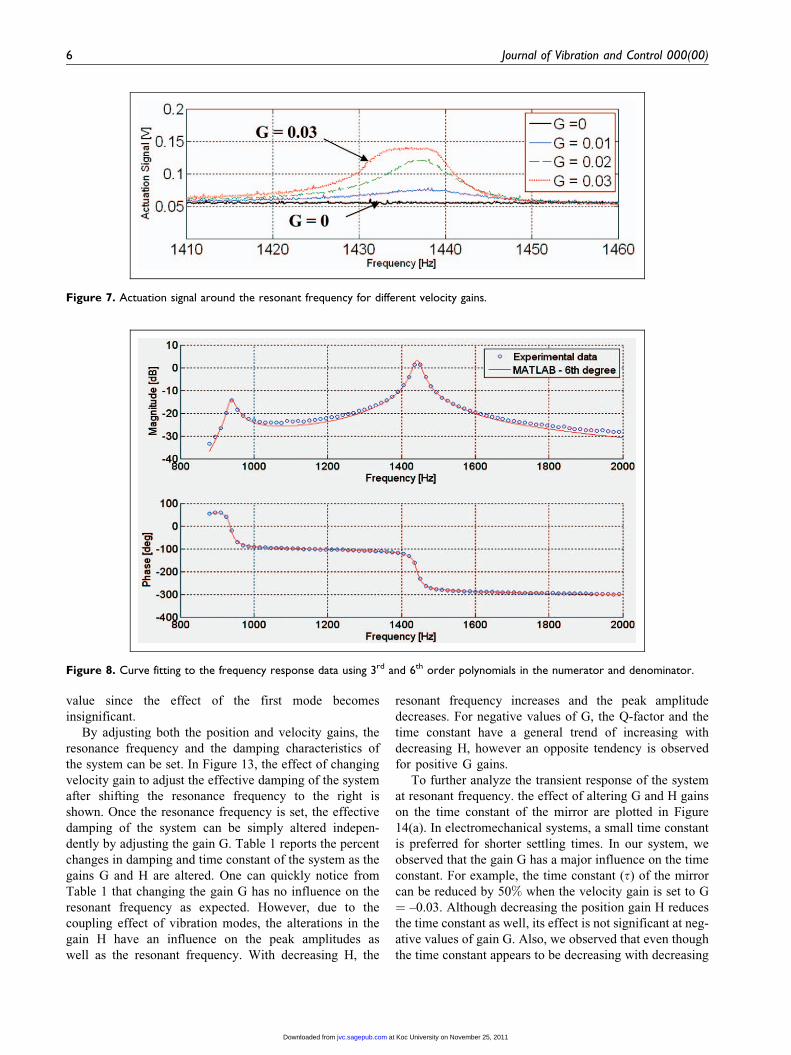
Similarly, to see the behavior under increasing gain, the
actuation signal amplitude around the resonant frequency is
plotted in Figure 7. For G ¼ 0.02, the amplitude of the
actuation signal increases with the velocity feedback near
the resonant frequency as expected, but the curve for G
¼ 0.03 flattens when the magnitude of the actuation signal
is reached to approximately 140 mV. As we have shown in
Figure 6, the changes in mirror velocity are small after this
value. Hence, the gains values greater than G¼ 0.02 are not
very effective. Even with the addition of an extra opera-
tional amplifier to the circuit, we could not amplify the gain
any further. This result may occur due to the very low resis-
tance of the scanner (1–10 ohms) and suggests that rate
feedback is applicable up to a certain saturation point,
which may vary from mirror to mirror depending on the
resistance of the mirror.
3. The SIMULINK Model
A SIMULINK1 model of the mirror and the feedback loop
are developed to justify the experimental measurements
and to further investigate the effect of velocity and position
feedback on the dynamical behavior of the mirror. First, we
Figure 3. The components of the velocity feedback circuit.
"Rvar" VS "phase shift" for different C values
180200220240260280300320340360
1,E+01 1,E+02 1,E+03 1,E+04 1,E+05 1,E+06 1,E+07
R Variable [ohm]
Pha
se S
hift
[de
g]
100pF
1nF
10nF
100nF
1uF
10uF
10uF
100pF
Figure 4. Phase shift in degrees for various values of resistanceand capacitance.
4 Journal of Vibration and Control 000(00)
at Koc University on November 25, 2011jvc.sagepub.comDownloaded from

obtained the transfer function of the mirror using the ampli-
tude and phase data collected experimentally over a range
of frequencies. This is achieved using the ‘‘invfreqs’’ func-
tion in MATLAB. A transfer function, between the input
voltage signal and output velocity of the mirror, having
3rd and 6th order polynomials in the numerator and denomi-
nator respectively yields satisfactory results, as shown in
Figure 8. However, in order to analyze the dynamical char-
acteristics of the mirror more easily, we prefer to use a sec-
ond order polynomial for each resonance frequency of the
mirror and a delay function. For this purpose, the resonance
frequencies of the mirror (o1 ¼ 939 Hz and
o2 ¼ 1442 Hz) are determined from the amplitude plot
first. Then, the corresponding quality factors are calculated
using the half-power method around the resonant peaks.
Finally, these two transfer functions are combined and con-
nected in series to form the new transfer function, which
also gives satisfactory results as shown in Figure 9.
After obtaining the transfer function of the mirror, the
next step is to change the velocity gain, G in the SIMU-
LINK1 model to test if the numerical simulations are con-
sistent with the experimental measurements. As shown in
Figure 10, the response of the numerical model is very
close to experimental data for different gain values.
As a further step in simulation, position feedback is
introduced into the feedback loop in the SIMULINK1
model to investigate its effect on the dynamical response
of the mirror (see Figure 11). By applying negative or pos-
itive position gains (H), the resonance frequency of the mir-
ror is shifted towards to the right or left, respectively (see
Figure 12). Observe that two resonance curves are
approaching to each other as the gain H is increased due
to the coupling of the resonance modes. For the positive
H gains, the curves are superimposed to each other. result-
ing in an increase in the peak amplitude. Note that the
opposite effect (i.e. decrease in peak amplitude) is also
observed for the negative H gains where the peaks are sepa-
rated from each other. As the gain H decreases further, the
peak amplitude of the second peak converges to a certain
Figure 5. Experimental frequency sweep curves for different velocity gains.
Signal Generator [mV] VS Velocity Amplitude [V]
0,00
1,00
2,00
3,00
4,00
5,00
6,00
7,00
8,00
0 50 100 150 200 250 300
Input Voltage [mV]
Vel
ocit
y A
mpl
itud
e [V
] (
1V=
25m
m/s
)
Input signal VS Velocity signalSIMULINK
Figure 6. Amplitude of mirror velocity for increasing inputvoltages.
Veryeri and Basdogan 5
at Koc University on November 25, 2011jvc.sagepub.comDownloaded from
value since the effect of the first mode becomes
insignificant.
By adjusting both the position and velocity gains, the
resonance frequency and the damping characteristics of
the system can be set. In Figure 13, the effect of changing
velocity gain to adjust the effective damping of the system
after shifting the resonance frequency to the right is
shown. Once the resonance frequency is set, the effective
damping of the system can be simply altered indepen-
dently by adjusting the gain G. Table 1 reports the percent
changes in damping and time constant of the system as the
gains G and H are altered. One can quickly notice from
Table 1 that changing the gain G has no influence on the
resonant frequency as expected. However, due to the
coupling effect of vibration modes, the alterations in the
gain H have an influence on the peak amplitudes as
well as the resonant frequency. With decreasing H, the
resonant frequency increases and the peak amplitude
decreases. For negative values of G, the Q-factor and the
time constant have a general trend of increasing with
decreasing H, however an opposite tendency is observed
for positive G gains.
To further analyze the transient response of the system
at resonant frequency. the effect of altering G and H gains
on the time constant of the mirror are plotted in Figure
14(a). In electromechanical systems, a small time constant
is preferred for shorter settling times. In our system, we
observed that the gain G has a major influence on the time
constant. For example, the time constant (t) of the mirror
can be reduced by 50% when the velocity gain is set to G
¼ –0.03. Although decreasing the position gain H reduces
the time constant as well, its effect is not significant at neg-
ative values of gain G. Also, we observed that even though
the time constant appears to be decreasing with decreasing
Figure 8. Curve fitting to the frequency response data using 3rd and 6th order polynomials in the numerator and denominator.
Figure 7. Actuation signal around the resonant frequency for different velocity gains.
6 Journal of Vibration and Control 000(00)
at Koc University on November 25, 2011jvc.sagepub.comDownloaded from

H for positive values of G, there is also a simultaneous
decrease in the peak amplitudes.
Most of these behaviors are again the result of the cou-
pling effect of the first two vibration modes. Recall that
we consider both resonance frequencies in our model of the
mirror for better representation of the mirror dynamics. To
investigate the isolated behavior of the mirror without the
influence of the first resonance mode, only the transfer func-
tion corresponding to the second resonance frequency is con-
sidered and the percent change in time constant of the mirror
Figure 9. Curve fitting to the frequency response data using ‘‘two’’ 2nd order models.
Figure 10. Simulink vs experimental results for different velocity gains.
Veryeri and Basdogan 7
at Koc University on November 25, 2011jvc.sagepub.comDownloaded from

is plotted in Figure 14(b). As shown in the Figure, the time
constant decreases as gain G is reduced, but the value is inde-
pendent of the position gain H as expected. These results
clearly show that the dynamics of the mirror is influenced
by the coupling effect of the vibration modes. To isolate
these modes, position feedback can be used (see Figure 12).
4. Conclusions
We showed how the effective damping of a micro mirror can
be adjusted experimentally using a feedback circuit. In our
implementation, the dynamical response of the mirror can
be altered in real-time, which is beneficial in mirror applica-
tions requiring quick changes in scan angles or amplitudes.
In our approach, the velocity of the mirror is measured
directly using a LDV. Obtaining the velocity signal from
the measured position signal through differentiation is not
preferred since the noise in the position signal is amplified
through differentiation. Typically, the position signal is
scaled and phase shifted to obtain the velocity signal. How-
ever, this approach could also be problematic if there are
time-varying disturbance forces or frictional forces affect-
ing the dynamics of the mirror as it operates. Under these
circumstances, the time-shifted position signal will not be
the ‘‘true’’ velocity of the mirror and the velocity feedback
approach may lead to errors.
Using a SIMULINK1 model, we investigated the influ-
ence of both position and velocity feedback on the effective
Signal GeneratorSine Wave
Vel m/s mm/s/V
Vibrometer
G
Velocity Gain
Velocity
position
input velocity
H
Position Gain
A
Integrator Gain
1s
Integrator
Input
Transfer Function1 Transfer Function 2
Figure 11. The Simulink model of the mirror with the feedback circuit.
Figure 12. The frequency response of the mirror for different position gains.
8 Journal of Vibration and Control 000(00)
at Koc University on November 25, 2011jvc.sagepub.comDownloaded from

damping, resonance frequency, and the settling time of the
mirror. In experimental settings, it is difficult to repeat an
experiment under the same environmental conditions due
to variations in humidity, electrical noise, ground vibra-
tions, temperature, etc. Moreover, even if the experimental
conditions are fixed, the material and surface properties of
the mirror (e.g. friction at the hinges) may change in time,
affecting the results of experiments adversely. All these
factors make it difficult to quantitatively compare the
results of the similar experiments under different settings.
The nonlinearities must be also taken into consideration
when building more comprehensive models of the micro
systems. For example, the actuation force of the micro sys-
tem was modeled as a nonlinear function of angular
Figure 13. Adjustment of resonance frequency and damping by changing position and velocity gains incrementally.
Table 1. Percent changes in peak amplitudes, damping ratio, and time constant for positive and negative values of G & H gains.
H ¼ 3(1288 Hz)
H ¼ 1.5(1371 Hz)
H ¼ 0(1442 Hz)
H ¼ –1.5(1507 Hz)
H ¼ –3(1567 Hz)
H ¼ –4.5(1624 Hz)
G ¼ 0.02 Vmax [ V ] : 10.80 6.48 4.86 4.17 3.79 3.59x : 0.103 0.197 0.235 0.266 0.278 0.265Dt 790.1 338.0 249.2 194.9 171.5 174.8
G ¼ 0.01 Vmax [ V ] : 3.19 2.47 2.19 2.04 1.94 1.88x : 0.483 0.511 0.520 0.514 0.511 0.496Dt 90.0 68.8 57.5 52.5 47.7 46.9
G ¼ 0 Vmax [ V ] : 1.77 1.53 1.42 1.35 1.31 1.28x : 0.862 0.832 0.820 0.776 0.760 0.735Dt 6.5 3.6 0.0 –0.2 –0.7 –1.0
G ¼ –0.01 Vmax [ V ] : 1.23 1.11 1.05 1.01 0.99 0.97x : 1.235 1.147 1.094 1.035 0.990 0.960Dt –25.7 –24.8 –25.1 –24.2 –23.8 –24.2
G ¼ –0.02 Vmax [ V ] : 0.94 0.87 0.83 0.81 0.79 0.78x : 1.613 1.462 1.370 1.295 1.232 1.199Dt –43.1 –41.0 –40.2 –39.5 –38.8 –39.3
G ¼ –0.03 Vmax [ V ] : 0.76 0.71 0.69 0.67 0.66 0.65x : 2.008 1.786 1.645 1.553 1.488 1.429Dt –54.3 –51.7 –50.2 –49.5 –49.3 –49.1
Veryeri and Basdogan 9
at Koc University on November 25, 2011jvc.sagepub.comDownloaded from

displacement and time, in earlier studies (Juneau et al.,
2003; Ataman and Urey, 2004; Zhu et al., 2006). As a
result, the governing differential equation in the simulation
model becomes nonlinear with time-varying coefficients.
Our model does not include these nonlinearities. However,
we believe that the linear assumption for our micro system
is valid since it shows a linear behavior in the operating
range that we currently use, as it can be observed from Fig-
ure 6. However, the effect of the nonlinearities for similar
systems can be addressed in a future study.
We easily altered the resonance frequency and the effec-
tive damping of the mirror to investigate its dynamical
response of the micro mirror using numerical simulations.
In our approach, the transfer function of the mirror was
developed based on the experimental data. We considered
the first two vibration modes of the mirror to construct its
transfer function. For each mode, we used a second order
transfer function, which helped us to understand and analyze
the influence of each vibration mode on the dynamical
response of the mirror more effectively. Our study shows
that coupling effects can significantly influence the response
of the mirror as the feedback gain H is increased. We also
investigated the effect of feedback gains G and H on damp-
ing and time constant of the system. In general, the velocity
gain G has more influence on the time constant of the
system. There is a trade-off between the Q-factor and the
settling time. The negative values of G reduce the time con-
stant of the system, which is desirable, but it also reduces the
Q-factor and hence the amplitude of oscillations, which is
not desirable. At positive values of G, the time constant of
the system can be also reduced by increasing the position
gain H. However, we observed that the Q-factor of the sys-
tem changes more rapidly than its resonant frequency as the
position feedback gain H is altered. Changing the position
gain H has less influence on the time constant, however, it
can be used to shift the resonance frequency of the system
to reduce the coupling effect of the vibration modes. For
example, in our system, shifting the resonance frequency
to the right reduces the coupling effect of the vibration
modes, leading to more separated resonance frequencies.
Hence, the resonance frequency of the mirror can be
adjusted prior to adjusting the effective damping.
Acknowledgements
We acknowledge the technical discussions made with Cagatay
Basdogan and his research group during the course of this project.
We are also grateful to Hakan Urey for providing us the micro
mirrors that are used in this study.
References
Anac, O. and Basdogan, I., 2008, ‘‘Model validation and perfor-
mance prediction in the design of micro systems,’’ Journal
of Vibration and Control 14(11), 1711–1728.
Ataman, C. and Urey, H., 2004, ‘‘Nonlinear frequency response of
comb-driven microscanners,’’ in Proceedings of SPIE,
MOEMS Display and Imaging Systems II, San Jose, CA,
January 24, vol. 5348.
Changho, C., Keiji, I., and Hiroshi, T., 2006, ‘‘Optically modu-
lated MEMS scanning endoscope,’’ IEEE Photonics Technol-
ogy Letters 18(1–4), 133–135.
Cheng, H.-M., Ewe, M. T. S., Chiu, G. T-C., and Bashir, R., 2001,
‘‘Modeling and control of piezoelectric cantilever beam
micro-mirror and micro-laser arrays to reduce image banding
in electrophotographic processes,’’ Journal of Micromecha-
nics and Microengineering 11, 487–498.
Gunev, I., Varol, A., Karaman, S., and Basdogan, C., 2007,
‘‘Adaptive Q control for tapping-mode nanoscanning using a
piezoactuated bimorph probe,’’ Review of Scientific Instru-
ments 78(4), 043707.
Juneau, T., Unterkofler, K., Seliverstov, T., Zhang, S., and Judy,
M., 2003, ‘‘Dual-axis optical mirror positioning using a non-
linear closed-loop controller,’’ in Proceedings of TRANSDU-
CERS, Solid-State Sensors, Actuators and Microsystems,
–100
0
100
200
300
400
500
600
700
800
–4,5–3–1,501,53H values
Per
cent
cha
nge
in t
ime
cons
tant
(%
)
–100
–50
0
50
100
150
200
250
300
–4,5–3–1,501,53H Values
Per
cent
cha
nge
in t
ime
cons
tant
(%
)
G = −0.03
G = −0.02
G = −0.01
G = 0
G = 0.01
G = 0.02
Figure 14. Percent change in time constant of the mirror as the feedback gains H and G are altered: (a) when the first two resonancemodes of the mirror are considered in the model.(b) when only a single resonance mode is considered in the model.
10 Journal of Vibration and Control 000(00)
at Koc University on November 25, 2011jvc.sagepub.comDownloaded from

12th International Conference, Boston, MA, June 8–12, vol. 1,
pp. 560–563.
Kobayashi, Y., Itoh, T., Sawada, R., and Maeda, R., 2007, ‘‘Smart
optical microscanner with piezoelectric resonator. sensor. and
tuner using Pb(Zr.Ti)O3 thin film,’’ Applied Physics Letters
90, 183514.
Lawrence, E. M., Speller, K., and Yu, D., 2002, ‘‘Laser Doppler
vibrometry for optical MEMS,’’ in Proceedings of SPIE Fifth
International Conference on Vibration Measurements by
Laser Techniques: Advances and Applications, Ancona, Italy,
June 18–21, vol. 4827, pp. 80–87.
Maithripala, D. H. S., Berg, J. M., and Dayawansa, W. P., 2005,
‘‘Control of an electrostatic microelectromechanical system
using static and dynamic output feedback,’’ ASME Journal
of Dynamical Systems, Measurement, and Control 127(3),
443–450.
Nguyen, C. T.-C., and Howe, R. T., 1992, ‘‘Quality factor control
for micromechanical resonators,’’ in Technical Digest of IEEE
International Electron Devices Meeting, San Francisco, CA,
December 13–16, pp. 505–508.
Pannu, S., Chang, Muller, R. S., and Pisano, A. P., 2000, ‘‘Closed-
loop feedback control system for improved tracking in magne-
tically actuated micromirrors,’’ in Proceedings of IEEE/LEOS
International Conference on Optical MEMS, Kauai, HI,
August 21-24, pp. 107–108.
Park, S. and Horowitz, R., 2004, ‘‘New adaptive mode of opera-
tion for MEMS gyroscopes,’’ ASME Journal of Dynamical
Systems, Measurement, and Control 126(4), 800–810.
Rao S. S., 2004, Mechanical Vibrations, Pearson Education,
Upper Saddle River, NJ.
Urey, H., 2003, ‘‘Retinal scanning displays,’’ in Driggers, R., ed.,
Encyclopedia of Optical Engineering, Marcel-Dekker, New
York, pp. 2445–2457.
Veryeri, I. and Basdogan, I., 2007, ‘‘Dynamic characterization
and damping control of a MEMS structure,’’ in Proceed-
ings of ISOT 2007, SPIE International Symposium on Opto-
mechatronic Technologies, Lausanne, Switzerland, October
8–10.
Yalcinkaya, A. D., Ergeneman, O., and Urey, H., 2007, ‘‘Polymer
magnetic scanners for bar code applications,’’ Sensors and
Actuators A135, 236–243.
Zhu, G., Packirisamy, M., Hosseini, M., and Peter, Y.-A., 2006,
‘‘Modelling and control of an electrostatically actuated tor-
sional micromirror,’’ Journal of Micromechanics and Micro-
engineering 16, 2044–2052.
Zhu, G., Penet, J., and Saydy, L., 2007, ‘‘Modeling and control
of electrostatically actuated MEMS in the presence of
parasitics and parametric uncertainties,’’ ASME Journal
of Dynamical Systems, Measurement, and Control 129(6),
786–794.
Veryeri and Basdogan 11
at Koc University on November 25, 2011jvc.sagepub.comDownloaded from