Evaluating Patient Outcomes When Adding Licensed Practical ...
Adding the third dimension on adaptive optics retina imager thanks to full-field optical coherence tomography
Marie Blavierab, Leonardo Blancoab, Marie Glancad, Florence Pouplardb, Sarah Tickb, Ivan Maksimovicab, Laurent Mugniercd, Guillaume Chènegrosc, Gérard Roussetad,, François Lacombee, Michel Pâquesb,
Jean-François Le Gargassonb, José-Alain Sahelb
aLESIA, Observatoire de Paris, CNRS, UPMC, Université Paris Diderot, 5 Place Jules Janssen, 92190 Meudon, France bCentre d’Investigations Cliniques du CHNO des Quinze-Vingts, Université Paris VI, 28 rue de Charenton,
75571 Paris cedex 12, France cDOTA ONERA, BP 72, 29 avenue de la Division Leclerc, 92322 Châtillon cedex, France
dGroupement d’Intérêt Scientifique PHASE (Partenariat Haute résolution Angulaire Sol Espace) between ONERA, Observatoire de Paris, CNRS and Université Paris Diderot
eMauna Kea Technologies, 9 rue d’Enghien, 75010 Paris, France
ABSTRACT Retinal pathologies, like ARMD or glaucoma, need to be early detected, requiring imaging instruments with resolution at a cellular scale. However, in vivo retinal cells studies and early diagnoses are severely limited by the lack of resolution on eye-fundus images from classical ophthalmologic instruments. We built a 2D retina imager using Adaptive Optics to improve lateral resolution. This imager is currently used in clinical environment. We are currently developing a time domain full-field optical coherence tomograph. The first step was to conceive the images reconstruction algorithms and validation was realized on non-biological samples. Ex vivo retina are currently being imaged. The final step will consist in coupling both setups to acquire high resolution retina cross-sections.
1 INTRODUCTION Adaptive Optics (AO) has been used for more than a decade to compensate for ocular aberrations1, allowing new kinds of retinal imaging instruments with a high lateral resolution2,3,4. A few years ago, we developed an AO setup for 2D high lateral resolution imaging of the human retina5. It is now installed at the Quinze-Vingts Hospital and regularly used to image and obtain quantitative data on healthy and pathological eyes. However, axial resolution in depth is not sufficient to reconstruct retina in 3D. Optical Coherence Tomography (OCT) is an interferometric technique allowing the non invasive extraction of sectional images in the sample. We are developing a time-domain full-field OCT setup, our final aim being to combine both methods, AO and OCT, in order to build a 3D high resolution imager for ophthalmic diagnoses.
2 2D RETINAL IMAGER REPORT
2.1. Setup description
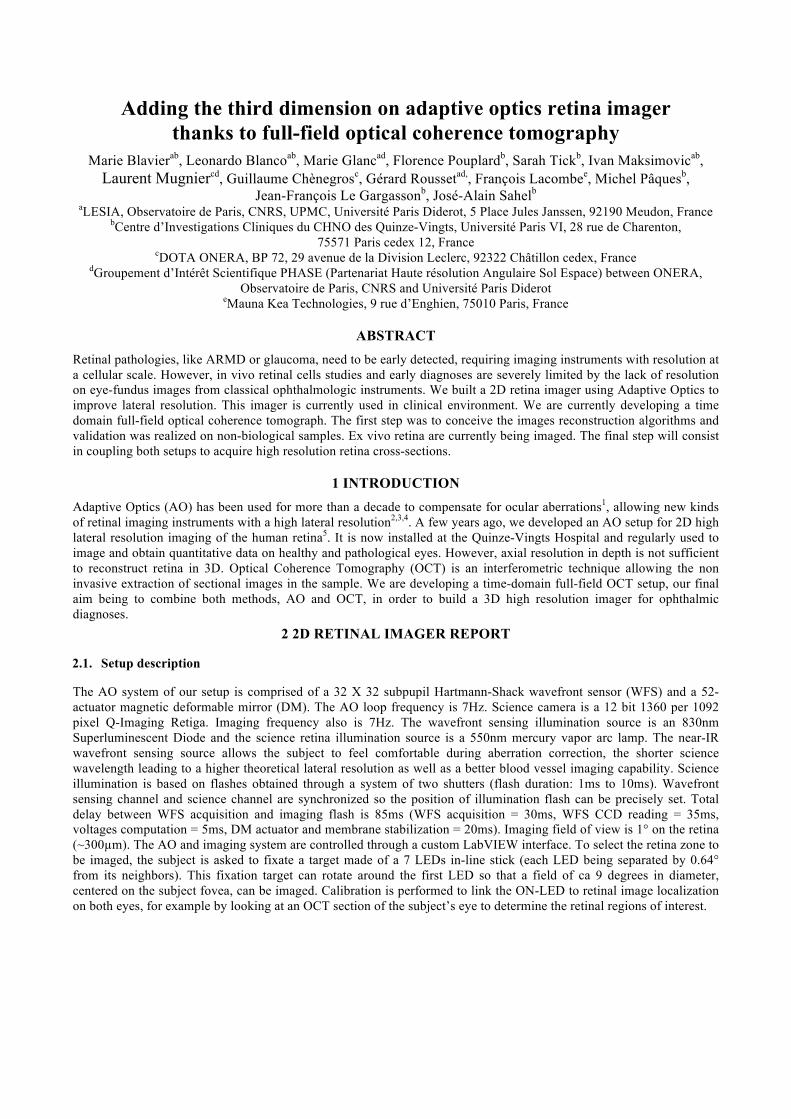
The AO system of our setup is comprised of a 32 X 32 subpupil Hartmann-Shack wavefront sensor (WFS) and a 52-actuator magnetic deformable mirror (DM). The AO loop frequency is 7Hz. Science camera is a 12 bit 1360 per 1092 pixel Q-Imaging Retiga. Imaging frequency also is 7Hz. The wavefront sensing illumination source is an 830nm Superluminescent Diode and the science retina illumination source is a 550nm mercury vapor arc lamp. The near-IR wavefront sensing source allows the subject to feel comfortable during aberration correction, the shorter science wavelength leading to a higher theoretical lateral resolution as well as a better blood vessel imaging capability. Science illumination is based on flashes obtained through a system of two shutters (flash duration: 1ms to 10ms). Wavefront sensing channel and science channel are synchronized so the position of illumination flash can be precisely set. Total delay between WFS acquisition and imaging flash is 85ms (WFS acquisition = 30ms, WFS CCD reading = 35ms, voltages computation = 5ms, DM actuator and membrane stabilization = 20ms). Imaging field of view is 1° on the retina (~300µm). The AO and imaging system are controlled through a custom LabVIEW interface. To select the retina zone to be imaged, the subject is asked to fixate a target made of a 7 LEDs in-line stick (each LED being separated by 0.64° from its neighbors). This fixation target can rotate around the first LED so that a field of ca 9 degrees in diameter, centered on the subject fovea, can be imaged. Calibration is performed to link the ON-LED to retinal image localization on both eyes, for example by looking at an OCT section of the subject’s eye to determine the retinal regions of interest.
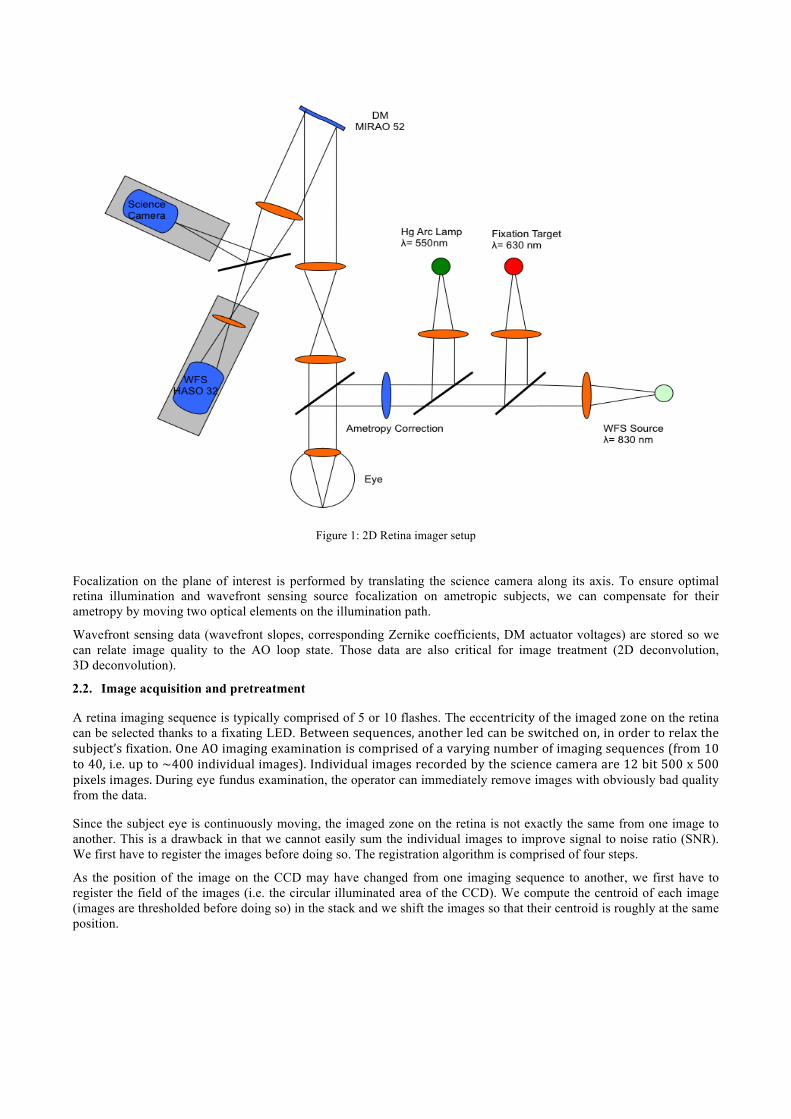
Figure 1: 2D Retina imager setup
Focalization on the plane of interest is performed by translating the science camera along its axis. To ensure optimal retina illumination and wavefront sensing source focalization on ametropic subjects, we can compensate for their ametropy by moving two optical elements on the illumination path.
Wavefront sensing data (wavefront slopes, corresponding Zernike coefficients, DM actuator voltages) are stored so we can relate image quality to the AO loop state. Those data are also critical for image treatment (2D deconvolution, 3D deconvolution).
2.2. Image acquisition and pretreatment
A retina imaging sequence is typically comprised of 5 or 10 flashes. The eccentricityoftheimagedzoneonthe retina can be selected thanks to a fixating LED. Betweensequences,anotherledcanbeswitchedon,inordertorelaxthesubject’sfixation.OneAOimagingexaminationiscomprisedofavaryingnumberofimagingsequences(from10to40,i.e.upto~400individualimages).Individualimagesrecordedbythesciencecameraare12bit500x500pixelsimages.During eye fundus examination, the operator can immediately remove images with obviously bad quality from the data.
Since the subject eye is continuously moving, the imaged zone on the retina is not exactly the same from one image to another. This is a drawback in that we cannot easily sum the individual images to improve signal to noise ratio (SNR). We first have to register the images before doing so. The registration algorithm is comprised of four steps.
As the position of the image on the CCD may have changed from one imaging sequence to another, we first have to register the field of the images (i.e. the circular illuminated area of the CCD). We compute the centroid of each image (images are thresholded before doing so) in the stack and we shift the images so that their centroid is roughly at the same position.
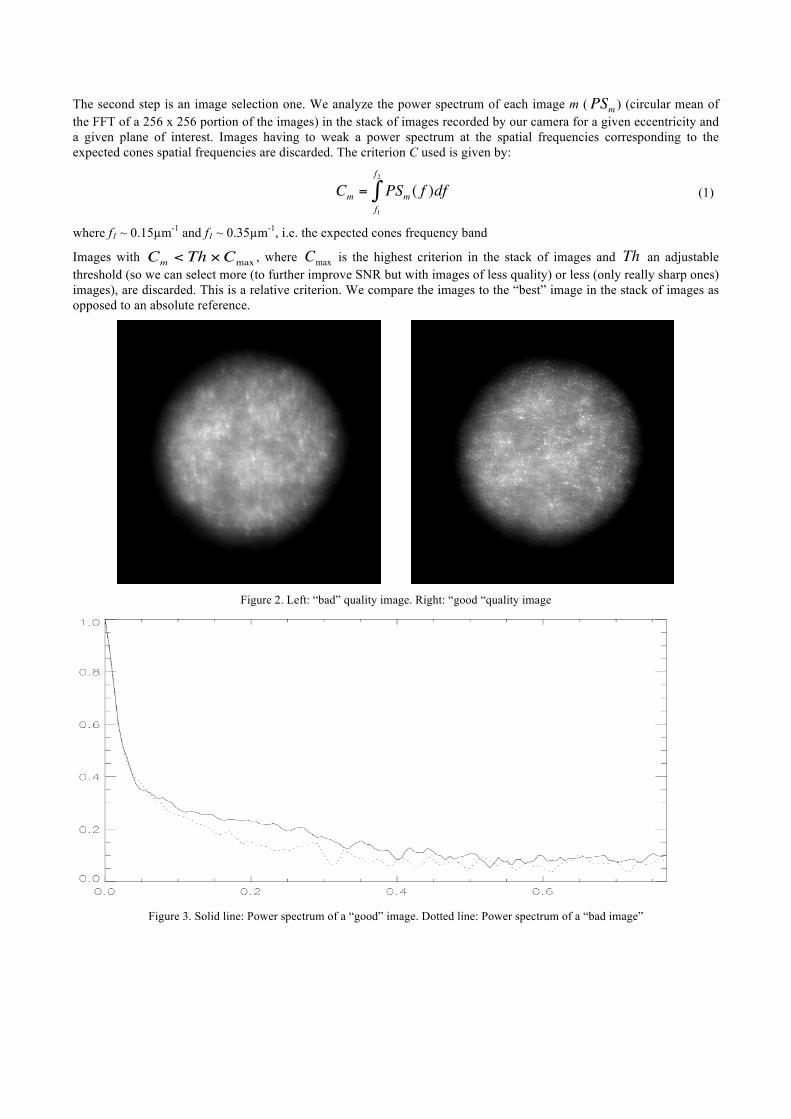
The second step is an image selection one. We analyze the power spectrum of each image m (
€
PSm ) (circular mean of the FFT of a 256 x 256 portion of the images) in the stack of images recorded by our camera for a given eccentricity and a given plane of interest. Images having to weak a power spectrum at the spatial frequencies corresponding to the expected cones spatial frequencies are discarded. The criterion C used is given by:
€
Cm = PSm ( f )dff1
f2
∫ (1)
where f1 ~ 0.15µm-1 and f1 ~ 0.35µm-1, i.e. the expected cones frequency band
Images with
€
Cm < Th ×Cmax , where
€
Cmax is the highest criterion in the stack of images and
€
Th an adjustable threshold (so we can select more (to further improve SNR but with images of less quality) or less (only really sharp ones) images), are discarded. This is a relative criterion. We compare the images to the “best” image in the stack of images as opposed to an absolute reference.
Figure 2. Left: “bad” quality image. Right: “good “quality image
Figure 3. Solid line: Power spectrum of a “good” image. Dotted line: Power spectrum of a “bad image”
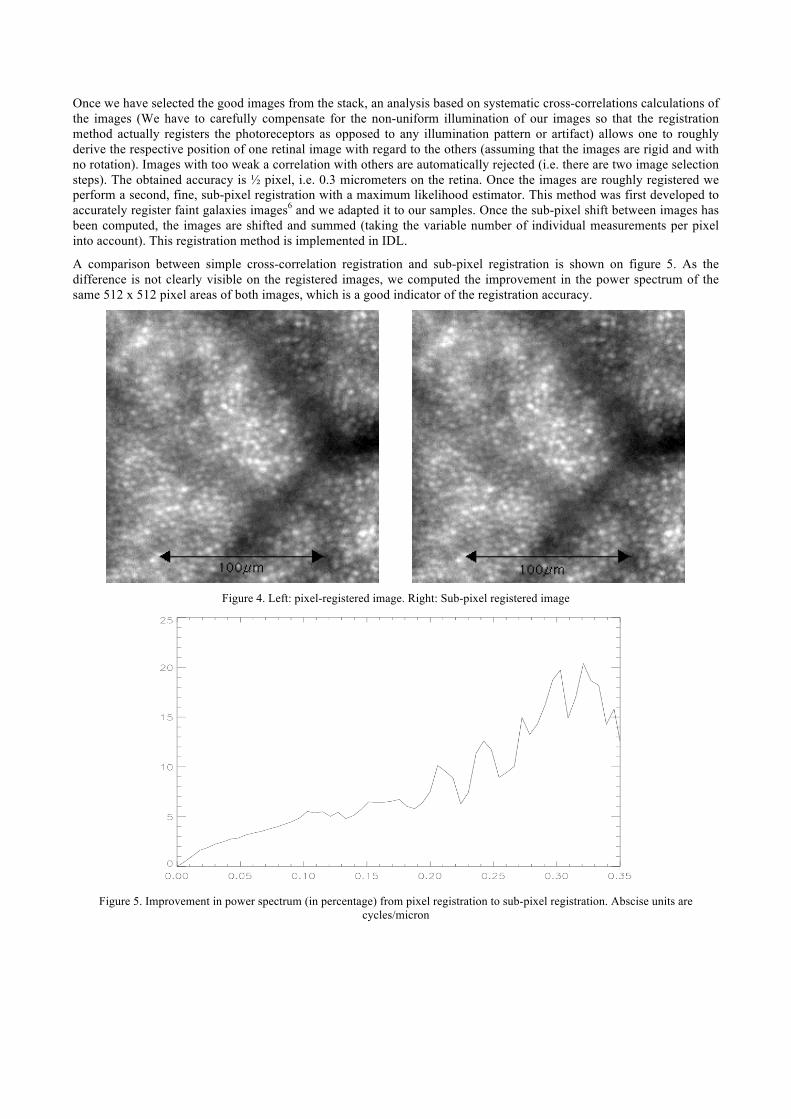
Once we have selected the good images from the stack, an analysis based on systematic cross-correlations calculations of the images (We have to carefully compensate for the non-uniform illumination of our images so that the registration method actually registers the photoreceptors as opposed to any illumination pattern or artifact) allows one to roughly derive the respective position of one retinal image with regard to the others (assuming that the images are rigid and with no rotation). Images with too weak a correlation with others are automatically rejected (i.e. there are two image selection steps). The obtained accuracy is ½ pixel, i.e. 0.3 micrometers on the retina. Once the images are roughly registered we perform a second, fine, sub-pixel registration with a maximum likelihood estimator. This method was first developed to accurately register faint galaxies images6 and we adapted it to our samples. Once the sub-pixel shift between images has been computed, the images are shifted and summed (taking the variable number of individual measurements per pixel into account). This registration method is implemented in IDL.
A comparison between simple cross-correlation registration and sub-pixel registration is shown on figure 5. As the difference is not clearly visible on the registered images, we computed the improvement in the power spectrum of the same 512 x 512 pixel areas of both images, which is a good indicator of the registration accuracy.
Figure 4. Left: pixel-registered image. Right: Sub-pixel registered image
Figure 5. Improvement in power spectrum (in percentage) from pixel registration to sub-pixel registration. Abscise units are
cycles/micron
2.3. Photoreceptor detection and density computation
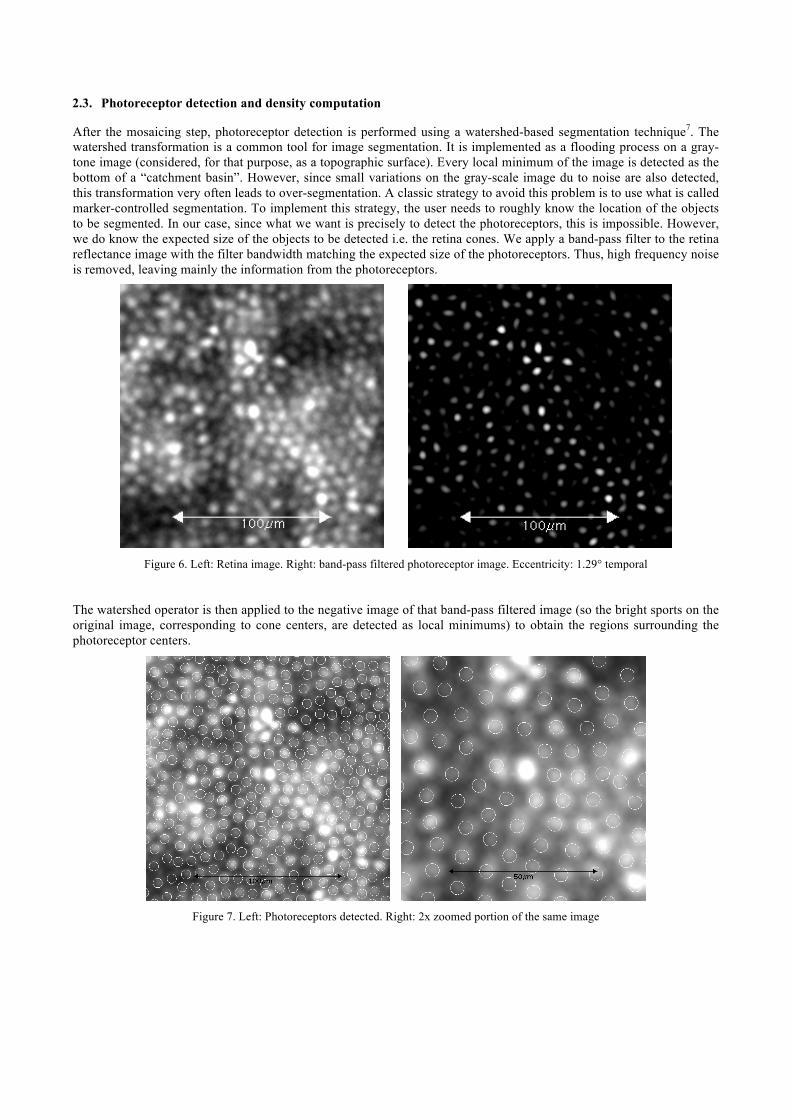
After the mosaicing step, photoreceptor detection is performed using a watershed-based segmentation technique7. The watershed transformation is a common tool for image segmentation. It is implemented as a flooding process on a gray-tone image (considered, for that purpose, as a topographic surface). Every local minimum of the image is detected as the bottom of a “catchment basin”. However, since small variations on the gray-scale image du to noise are also detected, this transformation very often leads to over-segmentation. A classic strategy to avoid this problem is to use what is called marker-controlled segmentation. To implement this strategy, the user needs to roughly know the location of the objects to be segmented. In our case, since what we want is precisely to detect the photoreceptors, this is impossible. However, we do know the expected size of the objects to be detected i.e. the retina cones. We apply a band-pass filter to the retina reflectance image with the filter bandwidth matching the expected size of the photoreceptors. Thus, high frequency noise is removed, leaving mainly the information from the photoreceptors.
Figure 6. Left: Retina image. Right: band-pass filtered photoreceptor image. Eccentricity: 1.29° temporal
The watershed operator is then applied to the negative image of that band-pass filtered image (so the bright sports on the original image, corresponding to cone centers, are detected as local minimums) to obtain the regions surrounding the photoreceptor centers.
Figure 7. Left: Photoreceptors detected. Right: 2x zoomed portion of the same image
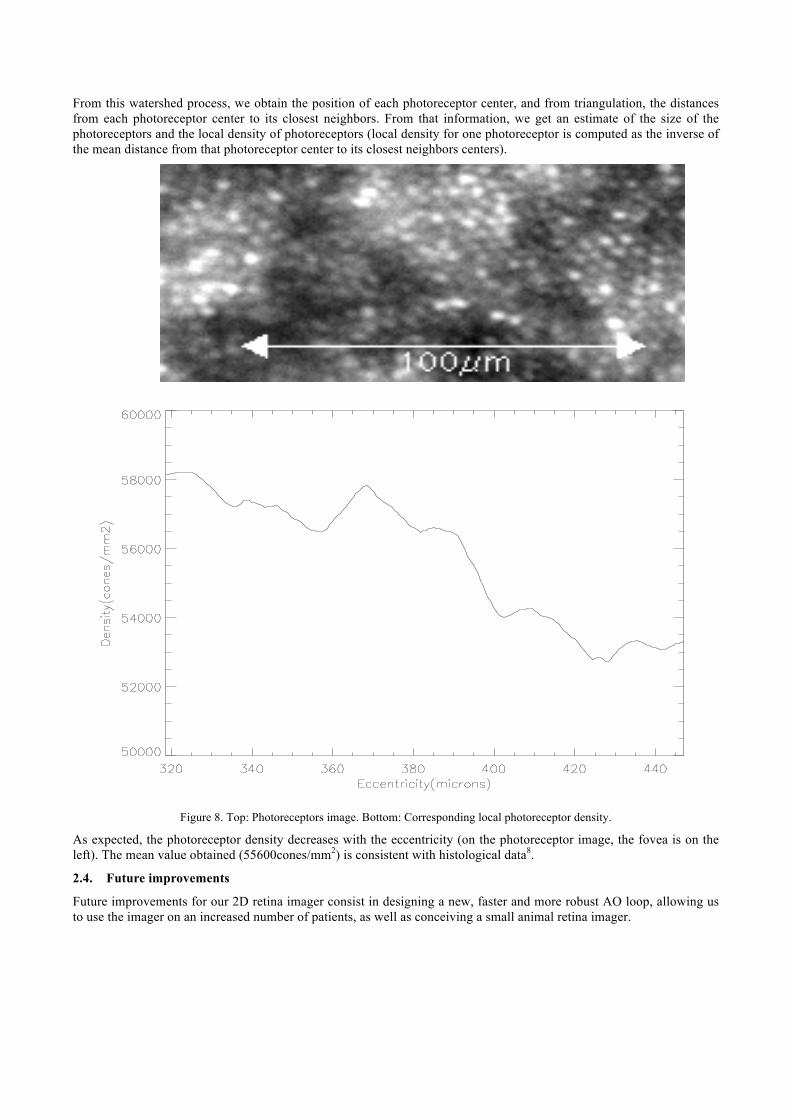
From this watershed process, we obtain the position of each photoreceptor center, and from triangulation, the distances from each photoreceptor center to its closest neighbors. From that information, we get an estimate of the size of the photoreceptors and the local density of photoreceptors (local density for one photoreceptor is computed as the inverse of the mean distance from that photoreceptor center to its closest neighbors centers).
Figure 8. Top: Photoreceptors image. Bottom: Corresponding local photoreceptor density.
As expected, the photoreceptor density decreases with the eccentricity (on the photoreceptor image, the fovea is on the left). The mean value obtained (55600cones/mm2) is consistent with histological data8.
2.4. Future improvements
Future improvements for our 2D retina imager consist in designing a new, faster and more robust AO loop, allowing us to use the imager on an increased number of patients, as well as conceiving a small animal retina imager.
3. TOWARD A 3D RETINAL IMAGER Our 2D adaptive optics (AO) imager is fully available at the Quinze-Vingts hospital and is currently used for clinical studies with the participation of ophthalmologists. First biological results have been obtained from the analysis of images, whose transverse resolution is about 1.5 µm. Our objective is to develop a 3D high resolution retinal imager with the same micrometer resolution in the three directions. In order to improve the current axial resolution in depth, we will combine adaptive optics with optical coherence tomography (OCT). The first step consists in the study of OCT alone with the development of a setup dedicated to eye imaging, before coupling AO and OCT.
3.1 Description of the full-field optical coherence tomography setup
Optical coherence tomography is a low-coherence interferometric method to optically select a slice in a scattering sample, without cutting it. The axial resolution, i.e. the depth of the imaged section, is linked to the light source features and especially is inversely proportional to the spectral bandwidth. There are different approaches to OCT, some of them suppressing scan in one or two directions, principally to save time. Our choice was to investigate time-domain full-field OCT (FFOCT) that produces en-face images, the only remaining scan being the axial one9. In this configuration, interferometric images, showing interferences between the sample and a reference, are acquired by a CCD camera. 2D cross-sections are reconstructed by combining interferometric images in order to extract interferences envelope and suppress incoherent light.
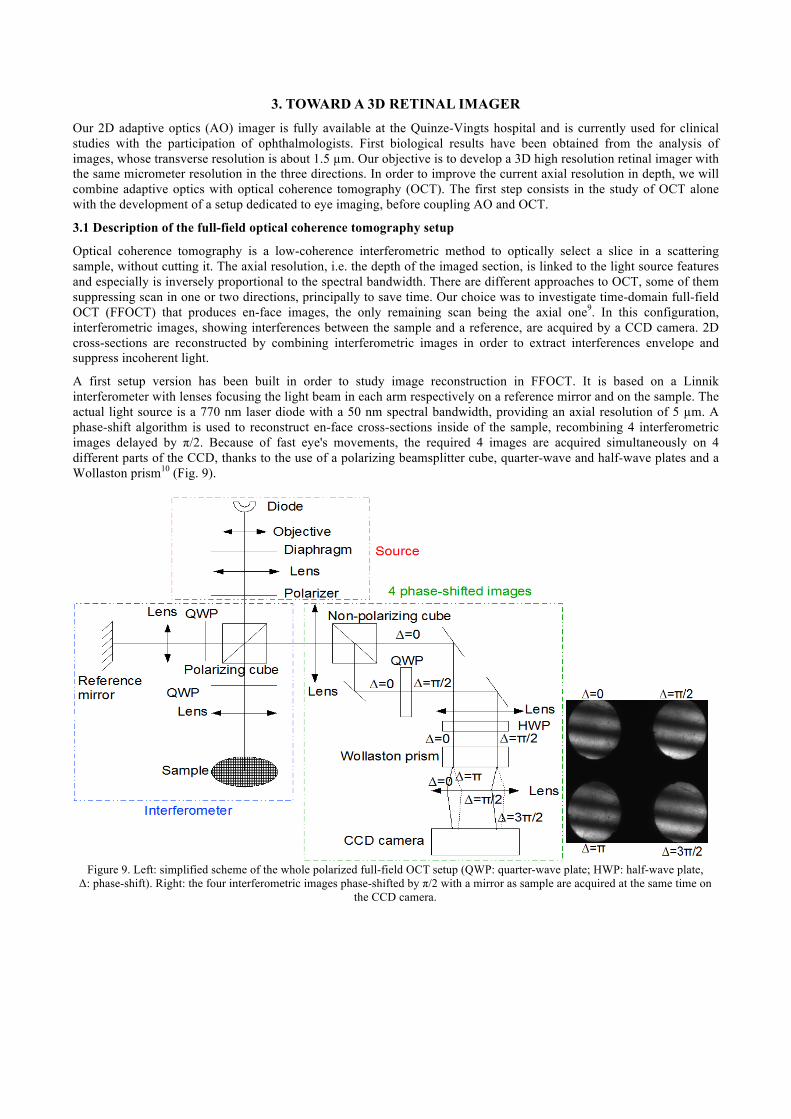
A first setup version has been built in order to study image reconstruction in FFOCT. It is based on a Linnik interferometer with lenses focusing the light beam in each arm respectively on a reference mirror and on the sample. The actual light source is a 770 nm laser diode with a 50 nm spectral bandwidth, providing an axial resolution of 5 µm. A phase-shift algorithm is used to reconstruct en-face cross-sections inside of the sample, recombining 4 interferometric images delayed by π/2. Because of fast eye's movements, the required 4 images are acquired simultaneously on 4 different parts of the CCD, thanks to the use of a polarizing beamsplitter cube, quarter-wave and half-wave plates and a Wollaston prism10 (Fig. 9).
Figure 9. Left: simplified scheme of the whole polarized full-field OCT setup (QWP: quarter-wave plate; HWP: half-wave plate, Δ: phase-shift). Right: the four interferometric images phase-shifted by π/2 with a mirror as sample are acquired at the same time on
the CCD camera.
First, the beamsplitter cube inside the interferometer part is polarizing. Thus there are no interferences at the interferometer output, because light reflected by reference and light backscattered by sample have orthogonal polarizations. The light beam is then divided in two by a non-polarizing beamsplitter cube. One of the resulting beams travels through a quarter-wave plate whose neutral axes are parallel to polarizing cube axes: each component of the beam, reference and sample, is then π/2 phase-shifted. Both beams, which are horizontally separated, go through the half-wave plate with axes at 22.5°. Polarizations are then rotated by 45°. The beams then travel through the Wollaston prism, which has its axes parallel to the polarizing cube ones. From an input beam with any polarization, a Wollaston prism creates two beams vertically separated and orthogonally polarized according to the Wollaston axes. In our configuration, both beams are composed of light from reference and from sample orthogonally polarized. Since the reference field and the sample field are projected on Wollaston axes, there are interferences after the Wollaston prism. If we consider one of the input beams, on one axis we obtain the sum of fields from the reference and the sample, giving interference without phase-shift (Δ=0). On the other axis, we have the subtraction between both fields, which is equivalent to add π on the phase of the interferogram (Δ=0). The same thing happens on the other beam already π/2-shifted, resulting in two beams with Δ= π/2 and Δ=3π/2. Therefore with this setup, four π/2-shifted interferograms spatially separated are acquired simultaneously on the CCD camera, without need of any path difference modulation.
3.2 Image reconstruction
A classical phase-shift algorithm gives tomographic cross-sections by calculating I=(I0-Iπ)²+( Iπ/2-I3π/2)²=16IrefIcoh, where Iref is the intensity reflected by the reference and Icoh is the coherent intensity retro-reflected by the coherence volume within the sample. Reconstructed images are directly proportional to the signal of interest Icoh, representing sample reflectivity at the depth defined by the zero optical path difference. Thus, full-field OCT performs directly optical slices, whose width is linked to the source coherence length.
As the interferometric images are subtracted from and added to each other, this phase-shift system presents specific difficulties in comparison with classical temporal path modulation. Indeed, the calculations must be realized between corresponding pixels from each image. First interferometric images must be registered one another with sub-pixel resolution and with normalized intensity. Moreover this method requires calibration of the CCD camera and a homogeneous flux to avoid reconstruction artifacts. Intensity normalization between each interferometric image is required in order to suppress differential offset. Otherwise fringes contrast is hidden, signal is lost and artifacts are created. Finally there are also differential deformations between the images. They have to be minimized by a good alignment. Nevertheless, as optical components are not ideal, there always will be small differences between the 4 images. These differential aberrations involve that rigid registration is not precise enough to match pixels between the four images. It is the most complicated point to take into account. These deformations must be measured and corrected with a morphing treatment. We use a test pattern with a grid of spots regularly spaced in order to quantify differential deformations and a morphing algorithm is applied. A complex calibration procedure, comprising image registration, intensity normalization and morphing is thus required to reconstruct tomographic cross-sections.
3.3 First FFOCT results
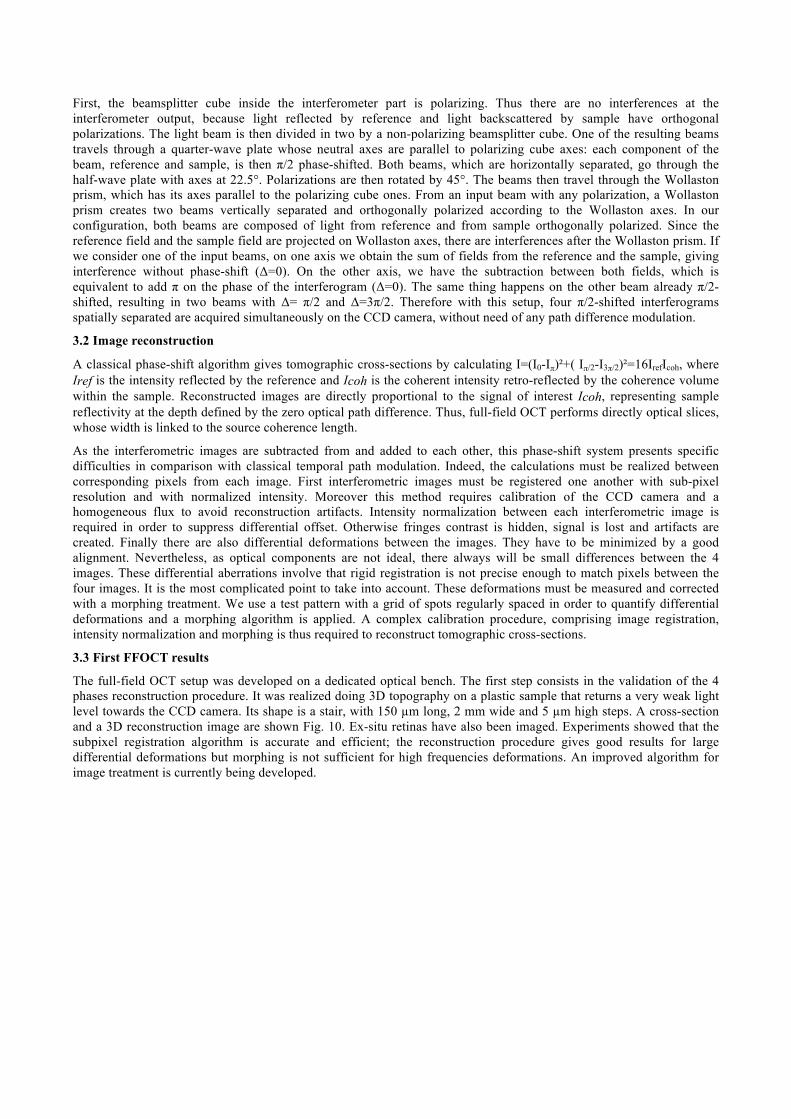
The full-field OCT setup was developed on a dedicated optical bench. The first step consists in the validation of the 4 phases reconstruction procedure. It was realized doing 3D topography on a plastic sample that returns a very weak light level towards the CCD camera. Its shape is a stair, with 150 µm long, 2 mm wide and 5 µm high steps. A cross-section and a 3D reconstruction image are shown Fig. 10. Ex-situ retinas have also been imaged. Experiments showed that the subpixel registration algorithm is accurate and efficient; the reconstruction procedure gives good results for large differential deformations but morphing is not sufficient for high frequencies deformations. An improved algorithm for image treatment is currently being developed.
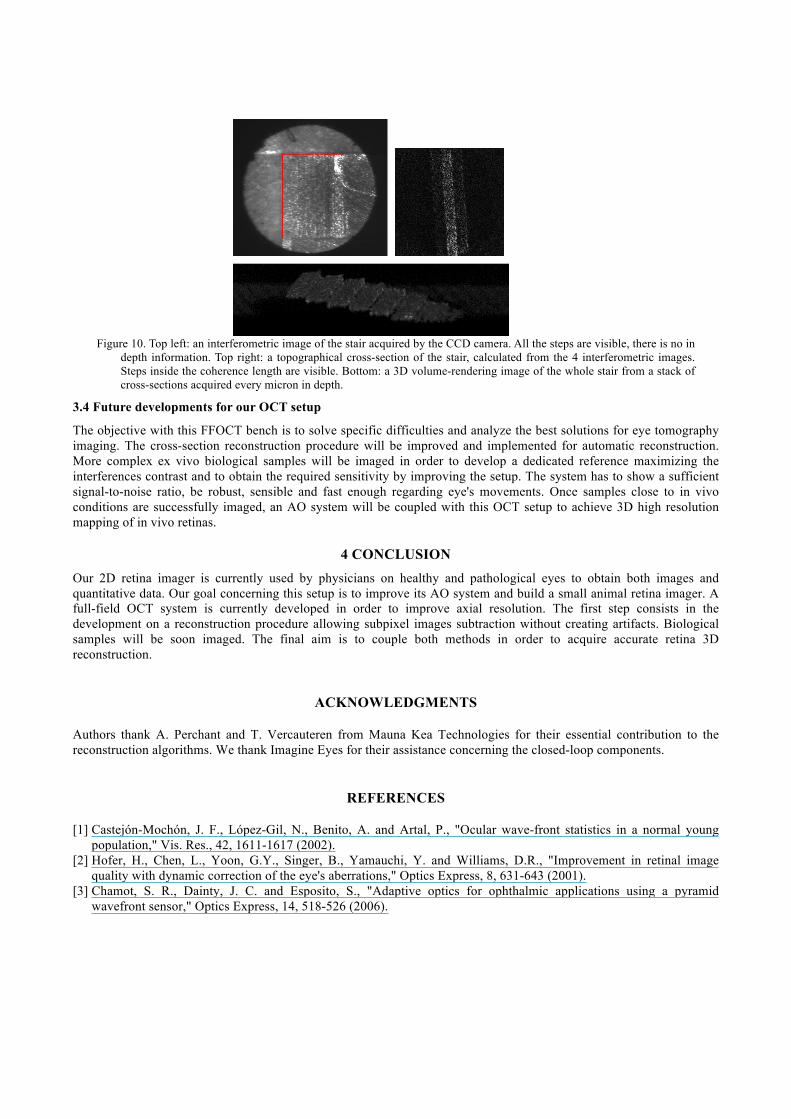
Figure 10. Top left: an interferometric image of the stair acquired by the CCD camera. All the steps are visible, there is no in depth information. Top right: a topographical cross-section of the stair, calculated from the 4 interferometric images. Steps inside the coherence length are visible. Bottom: a 3D volume-rendering image of the whole stair from a stack of cross-sections acquired every micron in depth.
3.4 Future developments for our OCT setup
The objective with this FFOCT bench is to solve specific difficulties and analyze the best solutions for eye tomography imaging. The cross-section reconstruction procedure will be improved and implemented for automatic reconstruction. More complex ex vivo biological samples will be imaged in order to develop a dedicated reference maximizing the interferences contrast and to obtain the required sensitivity by improving the setup. The system has to show a sufficient signal-to-noise ratio, be robust, sensible and fast enough regarding eye's movements. Once samples close to in vivo conditions are successfully imaged, an AO system will be coupled with this OCT setup to achieve 3D high resolution mapping of in vivo retinas.
4 CONCLUSION Our 2D retina imager is currently used by physicians on healthy and pathological eyes to obtain both images and quantitative data. Our goal concerning this setup is to improve its AO system and build a small animal retina imager. A full-field OCT system is currently developed in order to improve axial resolution. The first step consists in the development on a reconstruction procedure allowing subpixel images subtraction without creating artifacts. Biological samples will be soon imaged. The final aim is to couple both methods in order to acquire accurate retina 3D reconstruction.
ACKNOWLEDGMENTS
Authors thank A. Perchant and T. Vercauteren from Mauna Kea Technologies for their essential contribution to the reconstruction algorithms. We thank Imagine Eyes for their assistance concerning the closed-loop components.
REFERENCES
[1] Castejón-Mochón, J. F., López-Gil, N., Benito, A. and Artal, P., "Ocular wave-front statistics in a normal young population," Vis. Res., 42, 1611-1617 (2002).
[2] Hofer, H., Chen, L., Yoon, G.Y., Singer, B., Yamauchi, Y. and Williams, D.R., "Improvement in retinal image quality with dynamic correction of the eye's aberrations," Optics Express, 8, 631-643 (2001).
[3] Chamot, S. R., Dainty, J. C. and Esposito, S., "Adaptive optics for ophthalmic applications using a pyramid wavefront sensor," Optics Express, 14, 518-526 (2006).

[4] Zhang, Y., Poonja, S. and Roorda, A., "MEMS-based adaptive optics scanning laser ophthalmoscopy," Optics Letters, 31, 1268-1270 (2006).
[5] Glanc, M., Gendron, E., Lacombe, F., Lafaille, D., Le Gargasson, J. F. and Léna, P., "Towards wide-field retinal imaging with adaptive optics," Opt. Comm., 230, 225-238 (2004).
[6] Gratadour, D., Mugnier, L. and Rouan, D., "Sub-pixel image registration with a maximum likelihood estimator,” Astronomy and Astrophysics, 443, 357-365 (November 2005).
[7] Beucher S., “The watershed transformation applied to image segmentation, ” 1Oth Pfefferkorn Conf. on Signal and Image Processing in Microscopy and Microanalysis, 16-19 sept. 1991, Cambridge, UK, Scanning Microscopy International, suppl. 6. 1992, pp. 299-314.
[8] Curcio, C.A., K.R. Sloan, R.E. Kalina and A.E. Hendrickson 1990 Human photoreceptor topography. J. Comp. Neurol. 292:497-523.
[9] Dubois, A., Grieve, K., Moneron, G., Lecaque, R., Vabre, L. and Boccara, A., C., "Ultrahigh resolution full-field optical coherence tomography," Applied Optics, 43(14), 2874-2883 (May 2004).
[10] Glanc, M., Lafaille, D., Lacombe, F., Vabre, L., Lévecq, X. and Chateau, N., "Full-Field AO-assisted OCT for high- resolution tomographic imaging of the retina," Photonics West (SPIE) 2006.
Copyright © 2022 FDOKUMEN