ADC measurements at low and high b values: insight into normal brain structure with clinical DWI
10
ADC measurements at low and high b values: insight into normal brain structure with clinical DWI Jose ´ Marı ´a Garcı ´a Santos 4 , Cristina Ordo ´n ˜ez, Silvia Torres del Rı ´o A ´ rea de Neurorradiologı ´a, Cabeza y Cuello, Servicio de Radiodiagno ´stico, Hospital General Universitario Morales Meseguer, Murcia, Spain Received 18 January 2007; revised 5 April 2007; accepted 21 April 2007 Abstract Purpose: To demonstrate drop in brain ADC measurements from low to high b values; to evaluate the structural information provided based on those changes; and to discuss the anatomical reasons for ADC differences. Methods: Four cerebral ROI (precuneus-PRC, hippocampus-HIP, and the genu-GCC and splenium-SCC of the corpus callosum-CC) were drawn for ADC measurements with low (1000) and high (3000) b -value DWI in 50 normal subjects. ANOVA and Bonferroni correction tested ADC differences between areas, between both hemispheres, between GCC and SCC, and between b -value related ADC drop within areas. Pearson test evaluated dependence of interhemispheric and intercallosum ADC measurements obtained with the same b -value, dependence between areas of intrazonal drop, and the interhemispheric and intercallosum dependence of intrazonal drop. Results: ADCs differed between areas ( P b.0001). Interhemispheric ADC only differed in PRC with low b -value ( P b.027). No HIP asymmetries occurred regardless the b -value. ADC drop within PRC and HIP was similar but differed ( P b.0001) from ADC drop within both CC ROI. ADC drop was also different between GCC and SCC ( P b.0001). In PRC and HIP, ADC showed a significant interhemispheric and intrazonal dependence ( P b.0001). There was no GCC to SCC ADC dependence. Intrazonal dependence in the CC was only significant in the SCC ( P b.001). Interhemispheric dependence of intrazonal drop was significant (PRC P = .007; HIP P b.0001) but failed to reach significance in the CC. Conclusion: Low and high b -value measurements show different diffusion behaviours within different tissues, especially in a highly anisotropic structure as the corpus callosum. This fact can provide valuable information about brain structure and different diffusion compartments in clinical DWI. D 2008 Elsevier Inc. All rights reserved. Keywords: b value; Diffusion-weighted imaging; Brain; White matter; Gray matter; Corpus callosum 1. Introduction Diffusion-weighted imaging (DWI) is a magnetic reso- nance imaging (MRI) technique in which contrast between tissues depends mainly on the random motion of water molecules [1]. However, the final determinants of diffusion are not well understood [2–6]. The degree of diffusion weight in DWI determines MRI signal and depends on b value [1,7,8]. The relationship between the motion of water molecules, the MRI signal and the b value is described by the Stejskal–Tanner equation [9], which assesses diffusion by calculating the apparent diffusion coefficient (ADC). The standard b value used in conventional DWI is ~1000 s/mm 2 , and b values of z 3000 s/mm 2 are considered high [2,8,10]. As the b value increases, a progressive change in visual contrast between brain regions and an overall drop in ADC are noticed [2,7,8,10,11]. The drop in ADC cannot be adequately interpreted by monoexponential diffusion in tissues and is better explained by a biexponential model [2,8,11–16]. Supporting this model, the results of Niendorf et al. [14] and subsequently of others [2,7,8,10] demon- strated that there are fast and slow components of diffusion in the random motion of water molecules in brain tissues. On the basis of their results, Niendorf et al. [14] suggested that, using a low b value, DWI signal is dominated by the fast component, and using a higher b value, the DWI signal is dominated by the slow component. According to them [14], the fast and slow components corresponded to the extracellular and intracellular compartments, respectively. However, other studies have questioned whether the two components of diffusion are specifically related to those 0730-725X/$ – see front matter D 2008 Elsevier Inc. All rights reserved. doi:10.1016/j.mri.2007.04.004 4 Corresponding author. Hospital General Universitario Morales, Meseguer, C/ Marque ´s de los Ve ´lez s/n, 30008 Murcia, Spain. E-mail address: [email protected] (J.M. Garcı ´a Santos). Magnetic Resonance Imaging 26 (2008) 35 – 44
Transcript of ADC measurements at low and high b values: insight into normal brain structure with clinical DWI
Magnetic Resonance
ADC measurements at low and high b values: insight into normal brain
structure with clinical DWI
Jose Marıa Garcıa Santos4, Cristina Ordonez, Silvia Torres del RıoArea de Neurorradiologıa, Cabeza y Cuello, Servicio de Radiodiagnostico, Hospital General Universitario Morales Meseguer, Murcia, Spain
Received 18 January 2007; revised 5 April 2007; accepted 21 April 2007
Abstract
Purpose: To demonstrate drop in brain ADC measurements from low to high b values; to evaluate the structural information provided based
on those changes; and to discuss the anatomical reasons for ADC differences.
Methods: Four cerebral ROI (precuneus-PRC, hippocampus-HIP, and the genu-GCC and splenium-SCC of the corpus callosum-CC) were
drawn for ADC measurements with low (1000) and high (3000) b-value DWI in 50 normal subjects. ANOVA and Bonferroni correction
tested ADC differences between areas, between both hemispheres, between GCC and SCC, and between b-value related ADC drop within
areas. Pearson test evaluated dependence of interhemispheric and intercallosum ADC measurements obtained with the same b-value,
dependence between areas of intrazonal drop, and the interhemispheric and intercallosum dependence of intrazonal drop.
Results: ADCs differed between areas (Pb.0001). Interhemispheric ADC only differed in PRC with low b-value (Pb.027). No HIP
asymmetries occurred regardless the b-value. ADC drop within PRC and HIP was similar but differed (Pb.0001) from ADC drop within
both CC ROI. ADC drop was also different between GCC and SCC (Pb.0001). In PRC and HIP, ADC showed a significant interhemispheric
and intrazonal dependence (Pb.0001). There was no GCC to SCC ADC dependence. Intrazonal dependence in the CC was only significant
in the SCC (Pb.001). Interhemispheric dependence of intrazonal drop was significant (PRC P=.007; HIP Pb.0001) but failed to reach
significance in the CC.
Conclusion: Low and high b-value measurements show different diffusion behaviours within different tissues, especially in a highly
anisotropic structure as the corpus callosum. This fact can provide valuable information about brain structure and different diffusion
compartments in clinical DWI.
D 2008 Elsevier Inc. All rights reserved.
Keywords: b value; Diffusion-weighted imaging; Brain; White matter; Gray matter; Corpus callosum
1. Introduction
Diffusion-weighted imaging (DWI) is a magnetic reso-
nance imaging (MRI) technique in which contrast between
tissues depends mainly on the random motion of water
molecules [1]. However, the final determinants of diffusion
are not well understood [2–6]. The degree of diffusion
weight in DWI determines MRI signal and depends on b
value [1,7,8]. The relationship between the motion of water
molecules, the MRI signal and the b value is described by
the Stejskal–Tanner equation [9], which assesses diffusion
by calculating the apparent diffusion coefficient (ADC). The
standard b value used in conventional DWI is ~1000 s/mm2,
and b values of z3000 s/mm2 are considered high [2,8,10].
0730-725X/$ – see front matter D 2008 Elsevier Inc. All rights reserved.
doi:10.1016/j.mri.2007.04.004
4 Corresponding author. Hospital General Universitario Morales,
Meseguer, C/ Marques de los Velez s/n, 30008 Murcia, Spain.
E-mail address: [email protected] (J.M. Garcıa Santos).
As the b value increases, a progressive change in visual
contrast between brain regions and an overall drop in ADC
are noticed [2,7,8,10,11]. The drop in ADC cannot be
adequately interpreted by monoexponential diffusion in
tissues and is better explained by a biexponential model
[2,8,11–16]. Supporting this model, the results of Niendorf
et al. [14] and subsequently of others [2,7,8,10] demon-
strated that there are fast and slow components of diffusion
in the random motion of water molecules in brain tissues.
On the basis of their results, Niendorf et al. [14] suggested
that, using a low b value, DWI signal is dominated by the
fast component, and using a higher b value, the DWI signal
is dominated by the slow component. According to them
[14], the fast and slow components corresponded to the
extracellular and intracellular compartments, respectively.
However, other studies have questioned whether the two
components of diffusion are specifically related to those
Imaging 26 (2008) 35–44
J.M. Garcıa Santos et al. / Magnetic Resonance Imaging 26 (2008) 35–4436
compartments [15,16]. Furthermore, they suggest that there
are fast and slow components of diffusion in both
intracellular and extracellular spaces that are determined
by the distance between membranes and membrane perme-
ability [17,18]. Despite this controversy, it seems that the
use of different b values in DWI can provide valuable
microstructural information [2,12–16].
Many studies on the subject have been performed in
animals or small samples of patients. In the present study,
we used conventional clinical DWI and different b values to
obtain microstructural information from a large group of
patients. Our objectives were to: (a) demonstrate quantita-
tive differences in brain ADCs obtained with high and low
b values; (b) evaluate the structural information provided by
DWI based on those ADC differences; and (c) discuss the
anatomical reasons for ADC differences.
2. Materials and methods
2.1. Subjects
This retrospective study was conducted on a group of
700 consecutive patients who underwent conventional brain
MRI and DWI between 2003 and 2005. The same imaging
parameters were used for all patients. All patients provided
informed consent for the procedure. A sample of 50 subjects
with normal study was obtained by simple randomization.
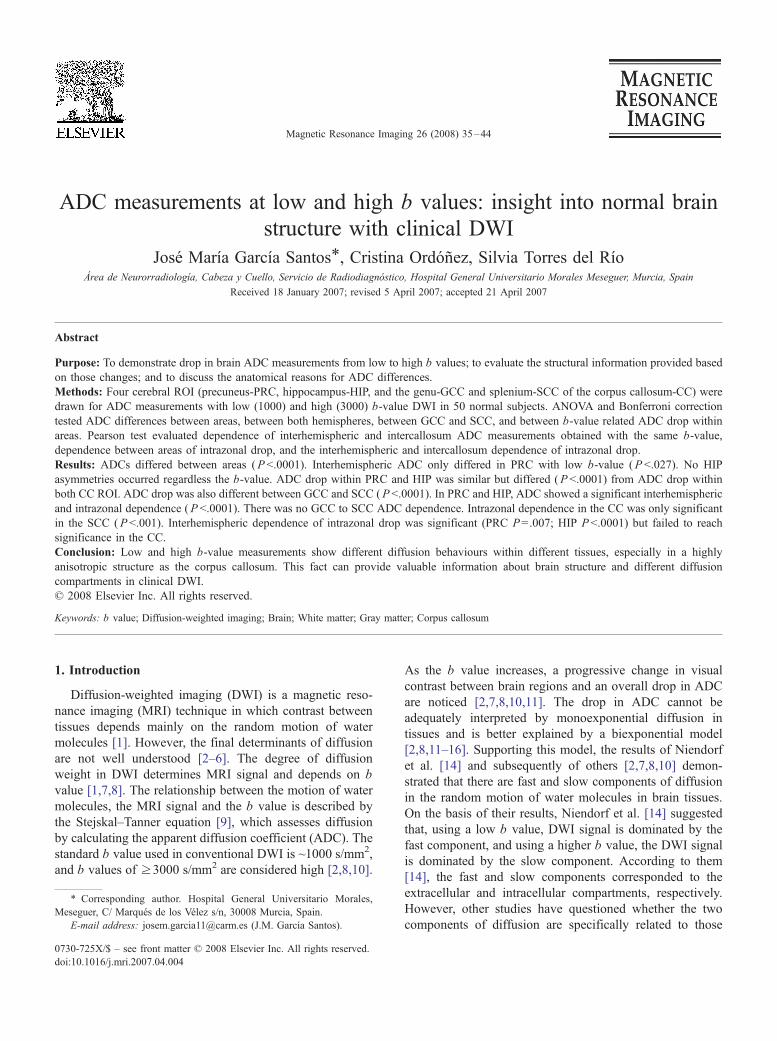
Fig. 1. The images on the right are ADC maps upon which the ROI were drawn, u
information, see Garcıa Santos et al. [22].
The criterion for normal study was the absence of
morphological and signal abnormalities in all imaging
sequences. For patients older than 50 years, a maximum
of three supratentorial hyperintense T2 foci with a maximum
diameter of b3 mm (negligible in both T1-weighted and
DWI images) were considered normal. The demographic
variables analyzed were age, gender, presence of vascular
risk factors (VRFs) and relevant medical history.
The study group consisted of 26 men and 24 women with
a mean age of 41.9F17 years (men, 45.3F17.9; women,
38.3F15.5). None of the patients was cognitively impaired,
according to the criteria of Petersen et al. [19]. Fourteen
subjects had one or more VRFs. Eight of those had
medically controlled hypertension. Of those, two had
associated dyslipidemia, one had coexistent type 2 diabetes
mellitus and one had a history of chemotherapy. Of the
remaining six patients with VRF, one had type 2 diabetes
mellitus and dyslipidemia, four had dyslipidemia or
hypercholesterolemia and one was diagnosed with systemic
lupus erythematosus and antiphospholipid syndrome. Since
VRF could bias ADC assessment, a statistical comparison of
the ADCs of non-VRF patients and VRF patients was
performed prior to a full analysis of the data.
2.2. Imaging protocol
All patientswere studiedwith a high-fieldMRI system1.5T
(Signa MRi LX, Milwaukee, WI) using a double protocol.
sing the corresponding T2-weighted images for reference. For more detailed
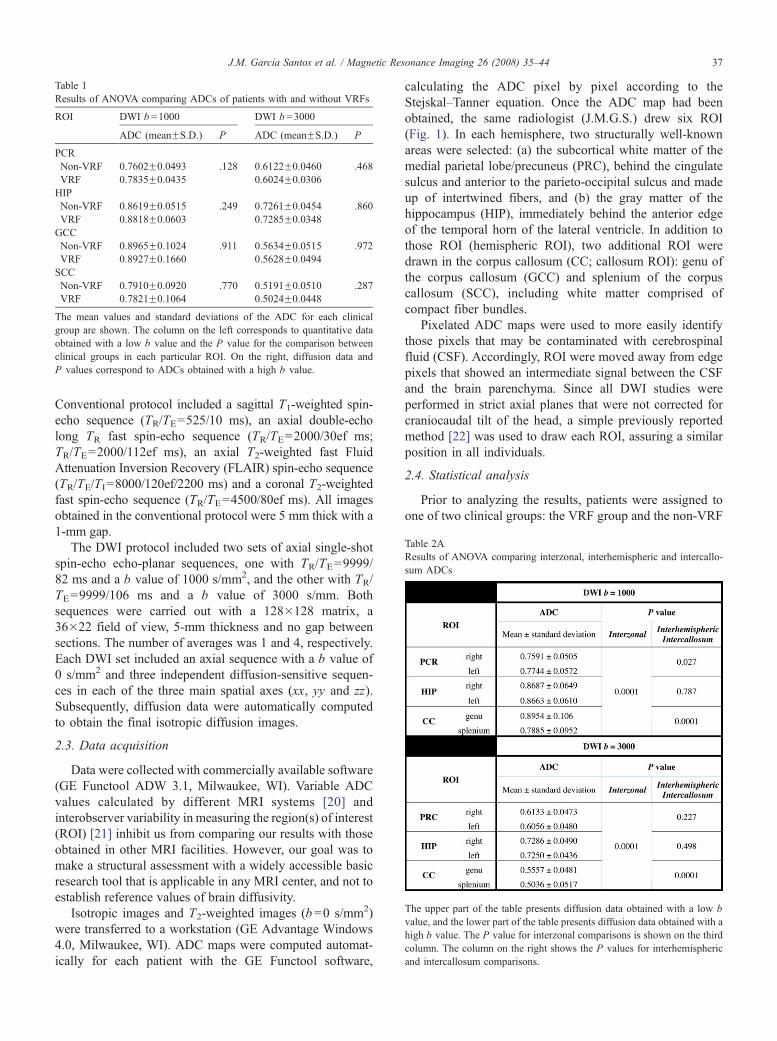
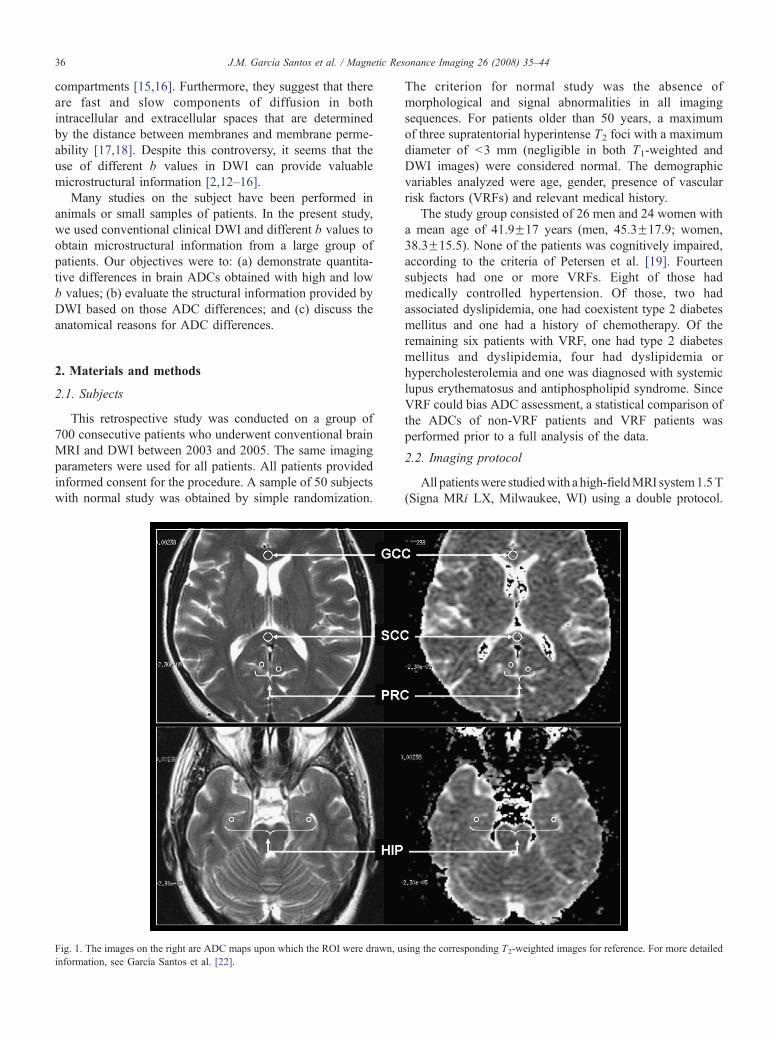
Table 1
Results of ANOVA comparing ADCs of patients with and without VRFs
ROI DWI b =1000 DWI b =3000
ADC (meanFS.D.) P ADC (meanFS.D.) P
PCR
Non-VRF 0.7602F0.0493 .128 0.6122F0.0460 .468
VRF 0.7835F0.0435 0.6024F0.0306
HIP
Non-VRF 0.8619F0.0515 .249 0.7261F0.0454 .860
VRF 0.8818F0.0603 0.7285F0.0348
GCC
Non-VRF 0.8965F0.1024 .911 0.5634F0.0515 .972
VRF 0.8927F0.1660 0.5628F0.0494
SCC
Non-VRF 0.7910F0.0920 .770 0.5191F0.0510 .287
VRF 0.7821F0.1064 0.5024F0.0448
The mean values and standard deviations of the ADC for each clinical
group are shown. The column on the left corresponds to quantitative data
obtained with a low b value and the P value for the comparison between
clinical groups in each particular ROI. On the right, diffusion data and
P values correspond to ADCs obtained with a high b value.
Table 2A
Results of ANOVA comparing interzonal, interhemispheric and intercallo-
sum ADCs
The upper part of the table presents diffusion data obtained with a low b
value, and the lower part of the table presents diffusion data obtained with a
high b value. The P value for interzonal comparisons is shown on the third
column. The column on the right shows the P values for interhemispheric
and intercallosum comparisons.
J.M. Garcıa Santos et al. / Magnetic Resonance Imaging 26 (2008) 35–44 37
Conventional protocol included a sagittal T1-weighted spin-
echo sequence (TR/TE=525/10 ms), an axial double-echo
long TR fast spin-echo sequence (TR/TE=2000/30ef ms;
TR/TE=2000/112ef ms), an axial T2-weighted fast Fluid
Attenuation Inversion Recovery (FLAIR) spin-echo sequence
(TR/TE/TI=8000/120ef/2200 ms) and a coronal T2-weighted
fast spin-echo sequence (TR/TE=4500/80ef ms). All images
obtained in the conventional protocol were 5 mm thick with a
1-mm gap.
The DWI protocol included two sets of axial single-shot
spin-echo echo-planar sequences, one with TR/TE=9999/
82 ms and a b value of 1000 s/mm2, and the other with TR/
TE=9999/106 ms and a b value of 3000 s/mm. Both
sequences were carried out with a 128�128 matrix, a
36�22 field of view, 5-mm thickness and no gap between
sections. The number of averages was 1 and 4, respectively.
Each DWI set included an axial sequence with a b value of
0 s/mm2 and three independent diffusion-sensitive sequen-
ces in each of the three main spatial axes (xx, yy and zz).
Subsequently, diffusion data were automatically computed
to obtain the final isotropic diffusion images.
2.3. Data acquisition
Data were collected with commercially available software
(GE Functool ADW 3.1, Milwaukee, WI). Variable ADC
values calculated by different MRI systems [20] and
interobserver variability in measuring the region(s) of interest
(ROI) [21] inhibit us from comparing our results with those
obtained in other MRI facilities. However, our goal was to
make a structural assessment with a widely accessible basic
research tool that is applicable in any MRI center, and not to
establish reference values of brain diffusivity.
Isotropic images and T2-weighted images (b=0 s/mm2)
were transferred to a workstation (GE Advantage Windows
4.0, Milwaukee, WI). ADC maps were computed automat-
ically for each patient with the GE Functool software,
calculating the ADC pixel by pixel according to the
Stejskal–Tanner equation. Once the ADC map had been
obtained, the same radiologist (J.M.G.S.) drew six ROI
(Fig. 1). In each hemisphere, two structurally well-known
areas were selected: (a) the subcortical white matter of the
medial parietal lobe/precuneus (PRC), behind the cingulate
sulcus and anterior to the parieto-occipital sulcus and made
up of intertwined fibers, and (b) the gray matter of the
hippocampus (HIP), immediately behind the anterior edge
of the temporal horn of the lateral ventricle. In addition to
those ROI (hemispheric ROI), two additional ROI were
drawn in the corpus callosum (CC; callosum ROI): genu of
the corpus callosum (GCC) and splenium of the corpus
callosum (SCC), including white matter comprised of
compact fiber bundles.
Pixelated ADC maps were used to more easily identify
those pixels that may be contaminated with cerebrospinal
fluid (CSF). Accordingly, ROI were moved away from edge
pixels that showed an intermediate signal between the CSF
and the brain parenchyma. Since all DWI studies were
performed in strict axial planes that were not corrected for
craniocaudal tilt of the head, a simple previously reported
method [22] was used to draw each ROI, assuring a similar
position in all individuals.
2.4. Statistical analysis
Prior to analyzing the results, patients were assigned to
one of two clinical groups: the VRF group and the non-VRF

J.M. Garcıa Santos et al. / Magnetic Resonance Imaging 26 (2008) 35–4438
group. Since VRF could bias the final results, after verifying
the homogeneity of variances through the Levene test, the
mean ADCs of the VRF and non-VRF groups were
compared with one-factor analysis of variance (ANOVA).
Quantitative variables were expressed as means and
standard deviations. They were first evaluated with Kolmo-
gorov–Smirnov normality test. After verifying normality, we
assessed the structure of the three selected areas by taking
advantage of the expected nonmonoexponential behavior of
diffusion. To that end, we analyzed diffusion behavior with
two b factors in each of the tissues, in two steps:
(a) Quantitative variables, considered dependent data,
were compared with one-factor ANOVA. Statistical
significance was set at Pb.05. Following ANOVA,
multiple comparisons of all ADC ROI were carried
out with Bonferroni correction. We assessed the
diffusion differences between PRC, HIP and CC
(interzonal comparisons) and between the ROI of
symmetrical areas, including right versus left PRC,
right versus left HIP, and GCC versus SCC
(interhemispheric and intercallosum comparisons).
Subsequently, the relationships between diffusion
trends in both hemispheres and CC were assessed
with parametric Pearson regression test. For this
purpose, the interhemispheric dependence of ADC
values and the correlation of GCC and SCC ADCs
(interhemispheric and intercallosum correlation)
Table 2B
Bonferroni corrections for interhemispheric, intercallosum and interzonal compar
The column on the left and the row on top correspond to analyzed ROI. Each of the
mean difference of ADC means (in parentheses) and the P value for the particula
represent high-b-value comparisons.
were analyzed for the same b values (right PRC
ADC b1000 vs. left PRC b1000; right PRC ADC
b3000 vs. left PRC b3000; right HIP ADC b1000 vs.
left HIP ADC b1000; right HIP ADC b3000 vs. left
HIP ADC b3000; GCC ADC b1000 vs. SCC ADC
b1000; GCC ADC b3000 vs. SCC ADC b3000). Next,
the relationships between diffusion trends within
each ROI (intra-ROI correlations: right PRC ADC
b1000 vs. ADC b3000; left PRC ADC b1000 vs. ADC
b3000; right HIP ADC b1000 vs. ADC b3000; left HIP
ADC b1000 vs. ADC b3000; GCC ADC b1000 vs.
ADC b3000; SCC ADC b1000 vs. ADC b3000) were
analyzed with the same statistical test.
(b) Because data were obtained with two different b
values and a drop in ADC was expected when DWI
was carried out with a high b value, we first assessed
the significance of ADC drop within each ROI
(intrazonal changes) by means of Student’s paired
t test. Furthermore, intrazonal changes in different
brain areas were compared with each other (PRC vs.
HIP vs. GCC vs. SCC). For that purpose, in each
anatomical area, low-b-value and high-b-value ADC
means were subtracted, and the results were com-
pared with one-factor ANOVA and Bonferroni
correction in order to assess differences in the ADC
drop between areas. Finally, the trend of intrazonal
diffusion change within an ROI was compared with
its corresponding ROI with Pearson parametric
isons
boxes represents one of the multiple comparisons performed and shows the
r comparison. White boxes represent low-b-value comparisons. Gray boxes
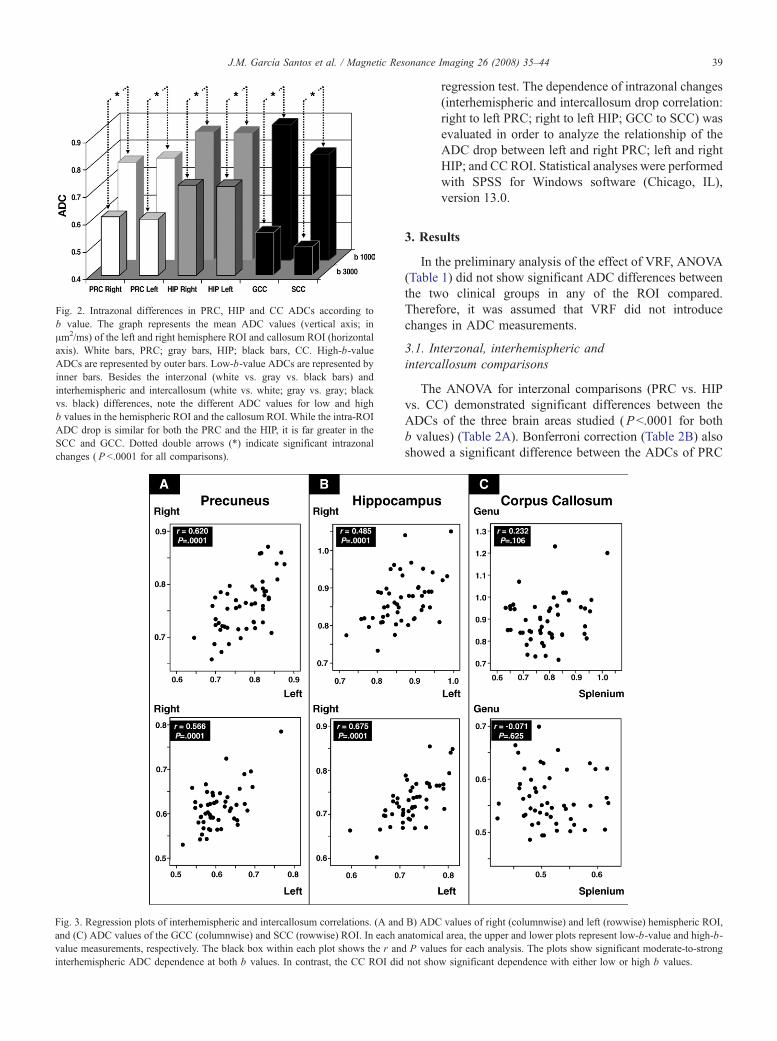
ig. 2. Intrazonal differences in PRC, HIP and CC ADCs according to
value. The graph represents the mean ADC values (vertical axis; in
m2/ms) of the left and right hemisphere ROI and callosum ROI (horizontal
xis). White bars, PRC; gray bars, HIP; black bars, CC. High-b-value
DCs are represented by outer bars. Low-b-value ADCs are represented by
ner bars. Besides the interzonal (white vs. gray vs. black bars) and
terhemispheric and intercallosum (white vs. white; gray vs. gray; black
s. black) differences, note the different ADC values for low and high
values in the hemispheric ROI and the callosum ROI. While the intra-ROI
DC drop is similar for both the PRC and the HIP, it is far greater in the
CC and GCC. Dotted double arrows (*) indicate significant intrazonal
hanges ( P b.0001 for all comparisons).
J.M. Garcıa Santos et al. / Magnetic Resonance Imaging 26 (2008) 35–44 39
F
b
Aa
A
in
in
v
b
A
S
c
Fig. 3. Regression plots of interhemispheric and intercallosum correlations. (A and
and (C) ADC values of the GCC (columnwise) and SCC (rowwise) ROI. In each a
value measurements, respectively. The black box within each plot shows the r and
interhemispheric ADC dependence at both b values. In contrast, the CC ROI did
regression test. The dependence of intrazonal changes
(interhemispheric and intercallosum drop correlation:
right to left PRC; right to left HIP; GCC to SCC) was
evaluated in order to analyze the relationship of the
ADC drop between left and right PRC; left and right
HIP; and CC ROI. Statistical analyses were performed
with SPSS for Windows software (Chicago, IL),
version 13.0.
3. Results
In the preliminary analysis of the effect of VRF, ANOVA
(Table 1) did not show significant ADC differences between
the two clinical groups in any of the ROI compared.
Therefore, it was assumed that VRF did not introduce
changes in ADC measurements.
3.1. Interzonal, interhemispheric and
intercallosum comparisons
The ANOVA for interzonal comparisons (PRC vs. HIP
vs. CC) demonstrated significant differences between the
ADCs of the three brain areas studied (Pb.0001 for both
b values) (Table 2A). Bonferroni correction (Table 2B) also
showed a significant difference between the ADCs of PRC
B) ADC values of right (columnwise) and left (rowwise) hemispheric ROI,
natomical area, the upper and lower plots represent low-b-value and high-b-
P values for each analysis. The plots show significant moderate-to-strong
not show significant dependence with either low or high b values.
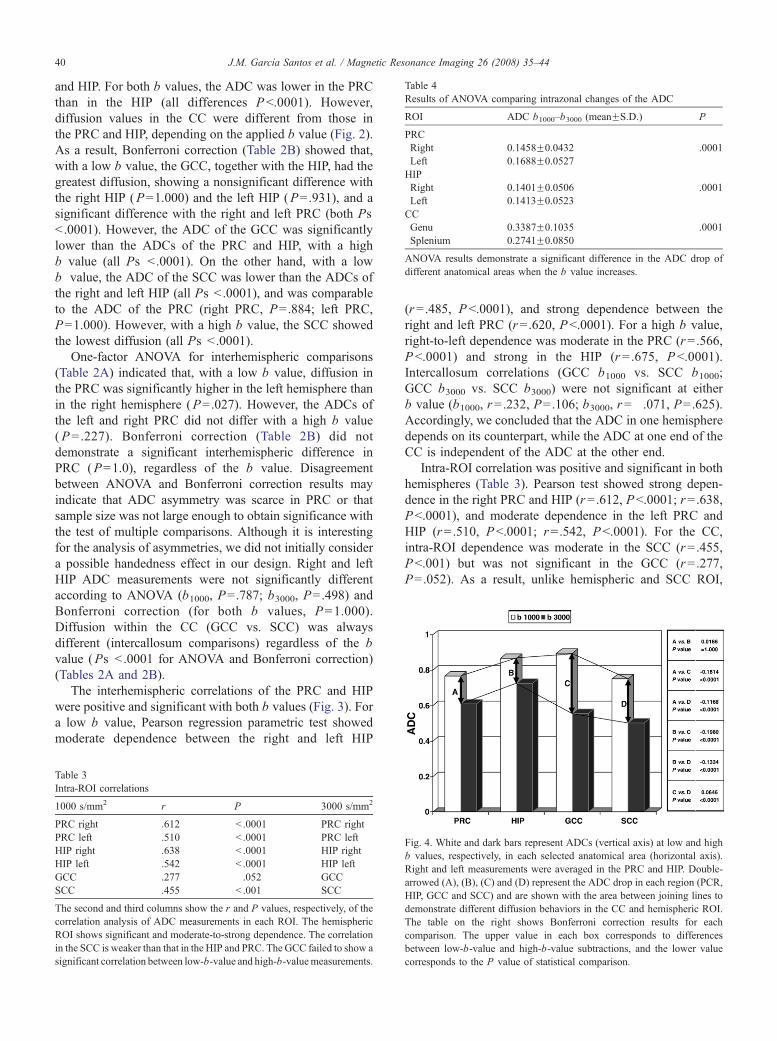
Table 4
Results of ANOVA comparing intrazonal changes of the ADC
ROI ADC b1000–b3000 (meanFS.D.) P
PRC
Right 0.1458F0.0432 .0001
Left 0.1688F0.0527
HIP
Right 0.1401F0.0506 .0001
Left 0.1413F0.0523
CC
Genu 0.3387F0.1035 .0001
Splenium 0.2741F0.0850
ANOVA results demonstrate a significant difference in the ADC drop of
different anatomical areas when the b value increases.
J.M. Garcıa Santos et al. / Magnetic Resonance Imaging 26 (2008) 35–4440
and HIP. For both b values, the ADC was lower in the PRC
than in the HIP (all differences Pb.0001). However,
diffusion values in the CC were different from those in
the PRC and HIP, depending on the applied b value (Fig. 2).
As a result, Bonferroni correction (Table 2B) showed that,
with a low b value, the GCC, together with the HIP, had the
greatest diffusion, showing a nonsignificant difference with
the right HIP (P=1.000) and the left HIP (P=.931), and a
significant difference with the right and left PRC (both Ps
b .0001). However, the ADC of the GCC was significantly
lower than the ADCs of the PRC and HIP, with a high
b value (all Ps b .0001). On the other hand, with a low
b value, the ADC of the SCC was lower than the ADCs of
the right and left HIP (all Ps b .0001), and was comparable
to the ADC of the PRC (right PRC, P=.884; left PRC,
P=1.000). However, with a high b value, the SCC showed
the lowest diffusion (all Ps b .0001).
One-factor ANOVA for interhemispheric comparisons
(Table 2A) indicated that, with a low b value, diffusion in
the PRC was significantly higher in the left hemisphere than
in the right hemisphere (P=.027). However, the ADCs of
the left and right PRC did not differ with a high b value
(P=.227). Bonferroni correction (Table 2B) did not
demonstrate a significant interhemispheric difference in
PRC (P=1.0), regardless of the b value. Disagreement
between ANOVA and Bonferroni correction results may
indicate that ADC asymmetry was scarce in PRC or that
sample size was not large enough to obtain significance with
the test of multiple comparisons. Although it is interesting
for the analysis of asymmetries, we did not initially consider
a possible handedness effect in our design. Right and left
HIP ADC measurements were not significantly different
according to ANOVA (b1000, P=.787; b3000, P=.498) and
Bonferroni correction (for both b values, P=1.000).
Diffusion within the CC (GCC vs. SCC) was always
different (intercallosum comparisons) regardless of the b
value (Ps b .0001 for ANOVA and Bonferroni correction)
(Tables 2A and 2B).
The interhemispheric correlations of the PRC and HIP
were positive and significant with both b values (Fig. 3). For
a low b value, Pearson regression parametric test showed
moderate dependence between the right and left HIP
Table 3
Intra-ROI correlations
1000 s/mm2 r P 3000 s/mm2
PRC right .612 b .0001 PRC right
PRC left .510 b .0001 PRC left
HIP right .638 b .0001 HIP right
HIP left .542 b .0001 HIP left
GCC .277 .052 GCC
SCC .455 b .001 SCC
The second and third columns show the r and P values, respectively, of the
correlation analysis of ADC measurements in each ROI. The hemispheric
ROI shows significant and moderate-to-strong dependence. The correlation
in the SCC is weaker than that in the HIP and PRC. The GCC failed to show a
significant correlation between low-b-value and high-b-valuemeasurements.
(r=.485, Pb.0001), and strong dependence between the
right and left PRC (r=.620, Pb.0001). For a high b value,
right-to-left dependence was moderate in the PRC (r=.566,
Pb.0001) and strong in the HIP (r=.675, Pb.0001).
Intercallosum correlations (GCC b1000 vs. SCC b1000;
GCC b3000 vs. SCC b3000) were not significant at either
b value (b1000, r=.232, P=.106; b3000, r=�.071, P=.625).Accordingly, we concluded that the ADC in one hemisphere
depends on its counterpart, while the ADC at one end of the
CC is independent of the ADC at the other end.
Intra-ROI correlation was positive and significant in both
hemispheres (Table 3). Pearson test showed strong depen-
dence in the right PRC and HIP (r=.612, Pb.0001; r=.638,
Pb.0001), and moderate dependence in the left PRC and
HIP (r=.510, Pb.0001; r=.542, Pb.0001). For the CC,
intra-ROI dependence was moderate in the SCC (r=.455,
Pb.001) but was not significant in the GCC (r=.277,
P=.052). As a result, unlike hemispheric and SCC ROI,
Fig. 4. White and dark bars represent ADCs (vertical axis) at low and high
b values, respectively, in each selected anatomical area (horizontal axis).
Right and left measurements were averaged in the PRC and HIP. Double-
arrowed (A), (B), (C) and (D) represent the ADC drop in each region (PCR,
HIP, GCC and SCC) and are shown with the area between joining lines to
demonstrate different diffusion behaviors in the CC and hemispheric ROI.
The table on the right shows Bonferroni correction results for each
comparison. The upper value in each box corresponds to differences
between low-b-value and high-b-value subtractions, and the lower value
corresponds to the P value of statistical comparison.
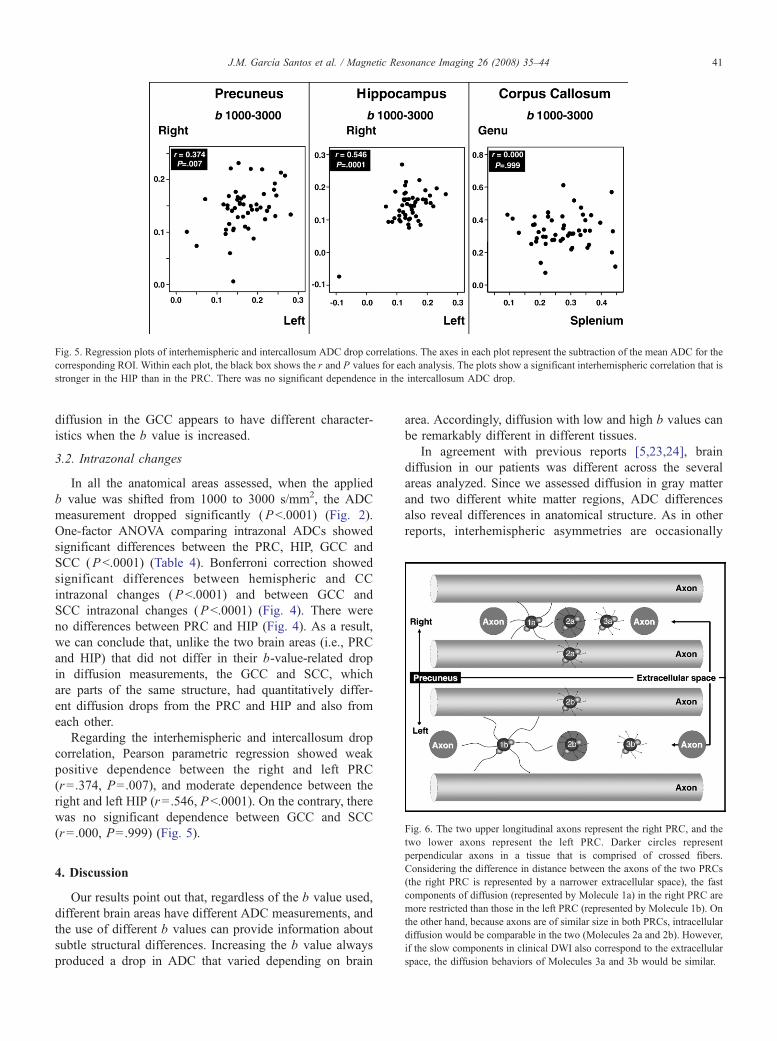
Fig. 6. The two upper longitudinal axons represent the right PRC, and the
Fig. 5. Regression plots of interhemispheric and intercallosum ADC drop correlations. The axes in each plot represent the subtraction of the mean ADC for the
corresponding ROI. Within each plot, the black box shows the r and P values for each analysis. The plots show a significant interhemispheric correlation that is
stronger in the HIP than in the PRC. There was no significant dependence in the intercallosum ADC drop.
J.M. Garcıa Santos et al. / Magnetic Resonance Imaging 26 (2008) 35–44 41
diffusion in the GCC appears to have different character-
istics when the b value is increased.
3.2. Intrazonal changes
In all the anatomical areas assessed, when the applied
b value was shifted from 1000 to 3000 s/mm2, the ADC
measurement dropped significantly (Pb.0001) (Fig. 2).
One-factor ANOVA comparing intrazonal ADCs showed
significant differences between the PRC, HIP, GCC and
SCC (Pb.0001) (Table 4). Bonferroni correction showed
significant differences between hemispheric and CC
intrazonal changes (Pb.0001) and between GCC and
SCC intrazonal changes (Pb.0001) (Fig. 4). There were
no differences between PRC and HIP (Fig. 4). As a result,
we can conclude that, unlike the two brain areas (i.e., PRC
and HIP) that did not differ in their b-value-related drop
in diffusion measurements, the GCC and SCC, which
are parts of the same structure, had quantitatively differ-
ent diffusion drops from the PRC and HIP and also from
each other.
Regarding the interhemispheric and intercallosum drop
correlation, Pearson parametric regression showed weak
positive dependence between the right and left PRC
(r=.374, P=.007), and moderate dependence between the
right and left HIP (r=.546, Pb.0001). On the contrary, there
was no significant dependence between GCC and SCC
(r=.000, P=.999) (Fig. 5).
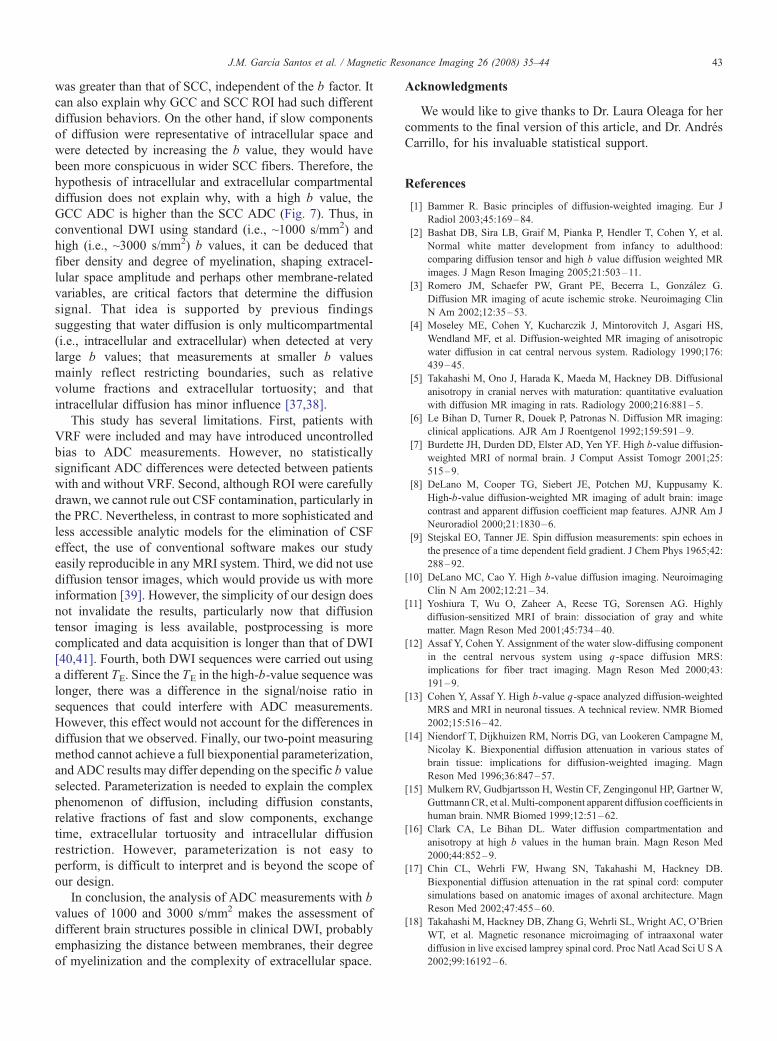
two lower axons represent the left PRC. Darker circles representperpendicular axons in a tissue that is comprised of crossed fibers.
Considering the difference in distance between the axons of the two PRCs
(the right PRC is represented by a narrower extracellular space), the fast
components of diffusion (represented by Molecule 1a) in the right PRC are
more restricted than those in the left PRC (represented by Molecule 1b). On
the other hand, because axons are of similar size in both PRCs, intracellular
diffusion would be comparable in the two (Molecules 2a and 2b). However,
if the slow components in clinical DWI also correspond to the extracellular
space, the diffusion behaviors of Molecules 3a and 3b would be similar.
4. Discussion
Our results point out that, regardless of the b value used,
different brain areas have different ADC measurements, and
the use of different b values can provide information about
subtle structural differences. Increasing the b value always
produced a drop in ADC that varied depending on brain
area. Accordingly, diffusion with low and high b values can
be remarkably different in different tissues.
In agreement with previous reports [5,23,24], brain
diffusion in our patients was different across the several
areas analyzed. Since we assessed diffusion in gray matter
and two different white matter regions, ADC differences
also reveal differences in anatomical structure. As in other
reports, interhemispheric asymmetries are occasionally
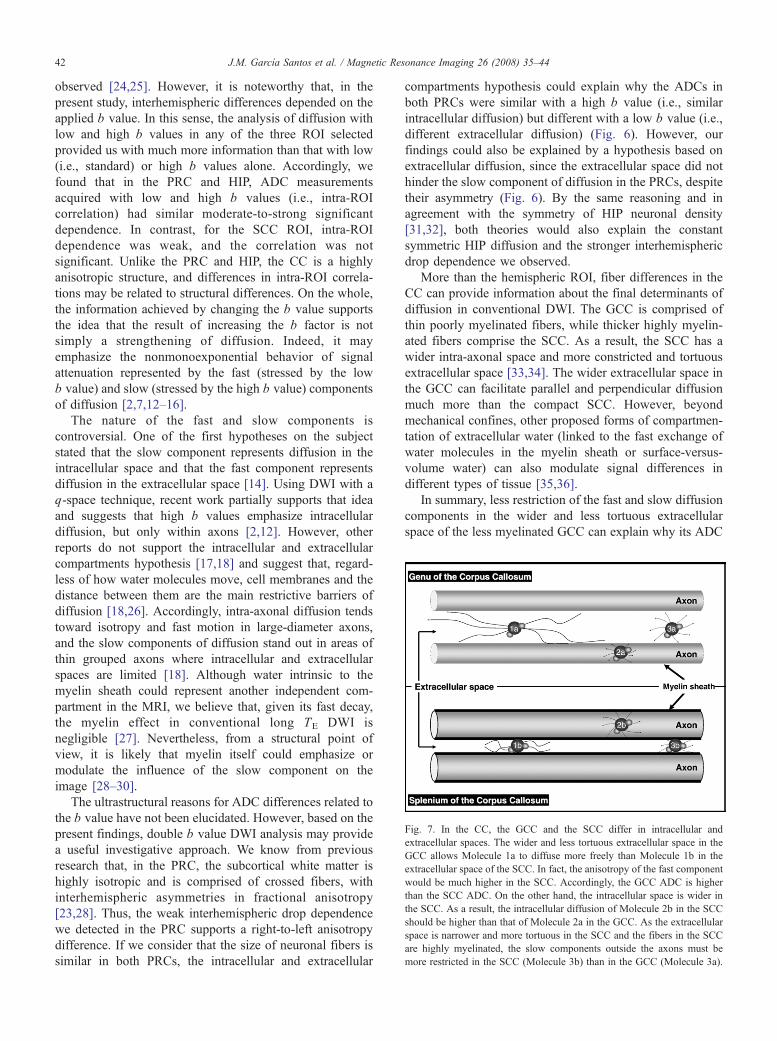
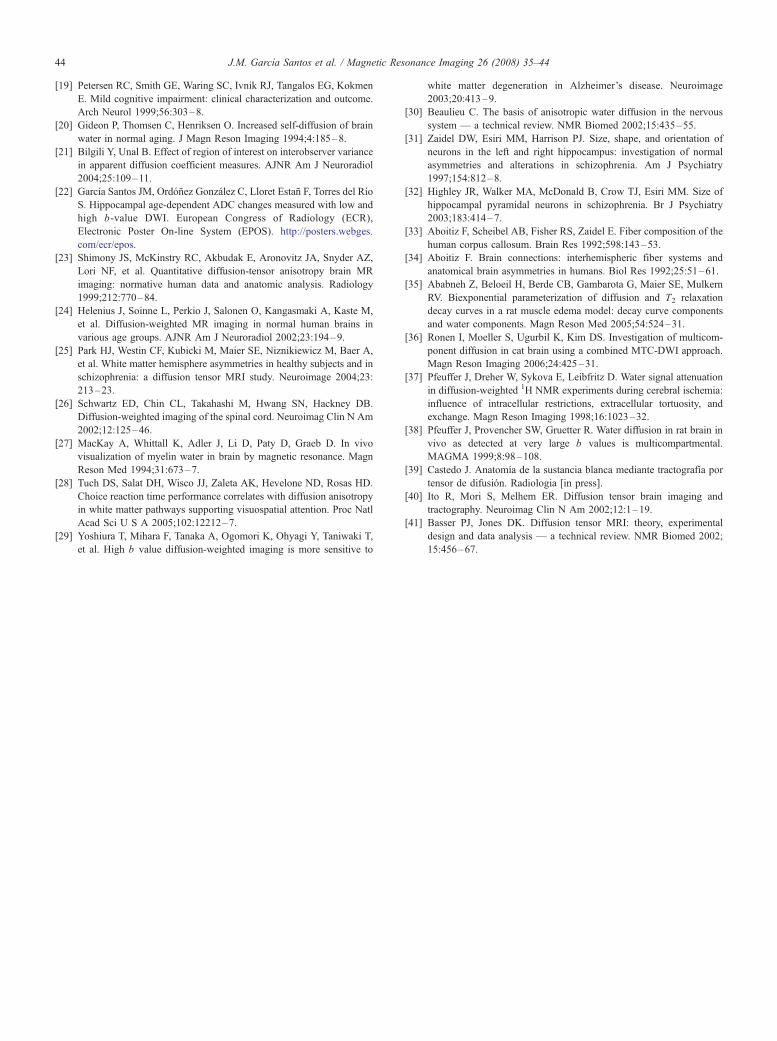
Fig. 7. In the CC, the GCC and the SCC differ in intracellular and
extracellular spaces. The wider and less tortuous extracellular space in the
GCC allows Molecule 1a to diffuse more freely than Molecule 1b in the
extracellular space of the SCC. In fact, the anisotropy of the fast component
would be much higher in the SCC. Accordingly, the GCC ADC is higher
than the SCC ADC. On the other hand, the intracellular space is wider in
the SCC. As a result, the intracellular diffusion of Molecule 2b in the SCC
should be higher than that of Molecule 2a in the GCC. As the extracellular
space is narrower and more tortuous in the SCC and the fibers in the SCC
are highly myelinated, the slow components outside the axons must be
more restricted in the SCC (Molecule 3b) than in the GCC (Molecule 3a).
J.M. Garcıa Santos et al. / Magnetic Resonance Imaging 26 (2008) 35–4442
observed [24,25]. However, it is noteworthy that, in the
present study, interhemispheric differences depended on the
applied b value. In this sense, the analysis of diffusion with
low and high b values in any of the three ROI selected
provided us with much more information than that with low
(i.e., standard) or high b values alone. Accordingly, we
found that in the PRC and HIP, ADC measurements
acquired with low and high b values (i.e., intra-ROI
correlation) had similar moderate-to-strong significant
dependence. In contrast, for the SCC ROI, intra-ROI
dependence was weak, and the correlation was not
significant. Unlike the PRC and HIP, the CC is a highly
anisotropic structure, and differences in intra-ROI correla-
tions may be related to structural differences. On the whole,
the information achieved by changing the b value supports
the idea that the result of increasing the b factor is not
simply a strengthening of diffusion. Indeed, it may
emphasize the nonmonoexponential behavior of signal
attenuation represented by the fast (stressed by the low
b value) and slow (stressed by the high b value) components
of diffusion [2,7,12–16].
The nature of the fast and slow components is
controversial. One of the first hypotheses on the subject
stated that the slow component represents diffusion in the
intracellular space and that the fast component represents
diffusion in the extracellular space [14]. Using DWI with a
q-space technique, recent work partially supports that idea
and suggests that high b values emphasize intracellular
diffusion, but only within axons [2,12]. However, other
reports do not support the intracellular and extracellular
compartments hypothesis [17,18] and suggest that, regard-
less of how water molecules move, cell membranes and the
distance between them are the main restrictive barriers of
diffusion [18,26]. Accordingly, intra-axonal diffusion tends
toward isotropy and fast motion in large-diameter axons,
and the slow components of diffusion stand out in areas of
thin grouped axons where intracellular and extracellular
spaces are limited [18]. Although water intrinsic to the
myelin sheath could represent another independent com-
partment in the MRI, we believe that, given its fast decay,
the myelin effect in conventional long TE DWI is
negligible [27]. Nevertheless, from a structural point of
view, it is likely that myelin itself could emphasize or
modulate the influence of the slow component on the
image [28–30].
The ultrastructural reasons for ADC differences related to
the b value have not been elucidated. However, based on the
present findings, double b value DWI analysis may provide
a useful investigative approach. We know from previous
research that, in the PRC, the subcortical white matter is
highly isotropic and is comprised of crossed fibers, with
interhemispheric asymmetries in fractional anisotropy
[23,28]. Thus, the weak interhemispheric drop dependence
we detected in the PRC supports a right-to-left anisotropy
difference. If we consider that the size of neuronal fibers is
similar in both PRCs, the intracellular and extracellular
compartments hypothesis could explain why the ADCs in
both PRCs were similar with a high b value (i.e., similar
intracellular diffusion) but different with a low b value (i.e.,
different extracellular diffusion) (Fig. 6). However, our
findings could also be explained by a hypothesis based on
extracellular diffusion, since the extracellular space did not
hinder the slow component of diffusion in the PRCs, despite
their asymmetry (Fig. 6). By the same reasoning and in
agreement with the symmetry of HIP neuronal density
[31,32], both theories would also explain the constant
symmetric HIP diffusion and the stronger interhemispheric
drop dependence we observed.
More than the hemispheric ROI, fiber differences in the
CC can provide information about the final determinants of
diffusion in conventional DWI. The GCC is comprised of
thin poorly myelinated fibers, while thicker highly myelin-
ated fibers comprise the SCC. As a result, the SCC has a
wider intra-axonal space and more constricted and tortuous
extracellular space [33,34]. The wider extracellular space in
the GCC can facilitate parallel and perpendicular diffusion
much more than the compact SCC. However, beyond
mechanical confines, other proposed forms of compartmen-
tation of extracellular water (linked to the fast exchange of
water molecules in the myelin sheath or surface-versus-
volume water) can also modulate signal differences in
different types of tissue [35,36].
In summary, less restriction of the fast and slow diffusion
components in the wider and less tortuous extracellular
space of the less myelinated GCC can explain why its ADC
J.M. Garcıa Santos et al. / Magnetic Resonance Imaging 26 (2008) 35–44 43
was greater than that of SCC, independent of the b factor. It
can also explain why GCC and SCC ROI had such different
diffusion behaviors. On the other hand, if slow components
of diffusion were representative of intracellular space and
were detected by increasing the b value, they would have
been more conspicuous in wider SCC fibers. Therefore, the
hypothesis of intracellular and extracellular compartmental
diffusion does not explain why, with a high b value, the
GCC ADC is higher than the SCC ADC (Fig. 7). Thus, in
conventional DWI using standard (i.e., ~1000 s/mm2) and
high (i.e., ~3000 s/mm2) b values, it can be deduced that
fiber density and degree of myelination, shaping extracel-
lular space amplitude and perhaps other membrane-related
variables, are critical factors that determine the diffusion
signal. That idea is supported by previous findings
suggesting that water diffusion is only multicompartmental
(i.e., intracellular and extracellular) when detected at very
large b values; that measurements at smaller b values
mainly reflect restricting boundaries, such as relative
volume fractions and extracellular tortuosity; and that
intracellular diffusion has minor influence [37,38].
This study has several limitations. First, patients with
VRF were included and may have introduced uncontrolled
bias to ADC measurements. However, no statistically
significant ADC differences were detected between patients
with and without VRF. Second, although ROI were carefully
drawn, we cannot rule out CSF contamination, particularly in
the PRC. Nevertheless, in contrast to more sophisticated and
less accessible analytic models for the elimination of CSF
effect, the use of conventional software makes our study
easily reproducible in any MRI system. Third, we did not use
diffusion tensor images, which would provide us with more
information [39]. However, the simplicity of our design does
not invalidate the results, particularly now that diffusion
tensor imaging is less available, postprocessing is more
complicated and data acquisition is longer than that of DWI
[40,41]. Fourth, both DWI sequences were carried out using
a different TE. Since the TE in the high-b-value sequence was
longer, there was a difference in the signal/noise ratio in
sequences that could interfere with ADC measurements.
However, this effect would not account for the differences in
diffusion that we observed. Finally, our two-point measuring
method cannot achieve a full biexponential parameterization,
and ADC results may differ depending on the specific b value
selected. Parameterization is needed to explain the complex
phenomenon of diffusion, including diffusion constants,
relative fractions of fast and slow components, exchange
time, extracellular tortuosity and intracellular diffusion
restriction. However, parameterization is not easy to
perform, is difficult to interpret and is beyond the scope of
our design.
In conclusion, the analysis of ADC measurements with b
values of 1000 and 3000 s/mm2 makes the assessment of
different brain structures possible in clinical DWI, probably
emphasizing the distance between membranes, their degree
of myelinization and the complexity of extracellular space.
Acknowledgments
We would like to give thanks to Dr. Laura Oleaga for her
comments to the final version of this article, and Dr. Andres
Carrillo, for his invaluable statistical support.
References
[1] Bammer R. Basic principles of diffusion-weighted imaging. Eur J
Radiol 2003;45:169–84.
[2] Bashat DB, Sira LB, Graif M, Pianka P, Hendler T, Cohen Y, et al.
Normal white matter development from infancy to adulthood:
comparing diffusion tensor and high b value diffusion weighted MR
images. J Magn Reson Imaging 2005;21:503–11.
[3] Romero JM, Schaefer PW, Grant PE, Becerra L, Gonzalez G.
Diffusion MR imaging of acute ischemic stroke. Neuroimaging Clin
N Am 2002;12:35–53.
[4] Moseley ME, Cohen Y, Kucharczik J, Mintorovitch J, Asgari HS,
Wendland MF, et al. Diffusion-weighted MR imaging of anisotropic
water diffusion in cat central nervous system. Radiology 1990;176:
439–45.
[5] Takahashi M, Ono J, Harada K, Maeda M, Hackney DB. Diffusional
anisotropy in cranial nerves with maturation: quantitative evaluation
with diffusion MR imaging in rats. Radiology 2000;216:881–5.
[6] Le Bihan D, Turner R, Douek P, Patronas N. Diffusion MR imaging:
clinical applications. AJR Am J Roentgenol 1992;159:591–9.
[7] Burdette JH, Durden DD, Elster AD, Yen YF. High b-value diffusion-
weighted MRI of normal brain. J Comput Assist Tomogr 2001;25:
515–9.
[8] DeLano M, Cooper TG, Siebert JE, Potchen MJ, Kuppusamy K.
High-b-value diffusion-weighted MR imaging of adult brain: image
contrast and apparent diffusion coefficient map features. AJNR Am J
Neuroradiol 2000;21:1830–6.
[9] Stejskal EO, Tanner JE. Spin diffusion measurements: spin echoes in
the presence of a time dependent field gradient. J Chem Phys 1965;42:
288–92.
[10] DeLano MC, Cao Y. High b-value diffusion imaging. Neuroimaging
Clin N Am 2002;12:21–34.
[11] Yoshiura T, Wu O, Zaheer A, Reese TG, Sorensen AG. Highly
diffusion-sensitized MRI of brain: dissociation of gray and white
matter. Magn Reson Med 2001;45:734–40.
[12] Assaf Y, Cohen Y. Assignment of the water slow-diffusing component
in the central nervous system using q-space diffusion MRS:
implications for fiber tract imaging. Magn Reson Med 2000;43:
191–9.
[13] Cohen Y, Assaf Y. High b-value q-space analyzed diffusion-weighted
MRS and MRI in neuronal tissues. A technical review. NMR Biomed
2002;15:516–42.
[14] Niendorf T, Dijkhuizen RM, Norris DG, van Lookeren Campagne M,
Nicolay K. Biexponential diffusion attenuation in various states of
brain tissue: implications for diffusion-weighted imaging. Magn
Reson Med 1996;36:847–57.
[15] Mulkern RV, Gudbjartsson H, Westin CF, Zengingonul HP, Gartner W,
GuttmannCR, et al. Multi-component apparent diffusion coefficients in
human brain. NMR Biomed 1999;12:51–62.
[16] Clark CA, Le Bihan DL. Water diffusion compartmentation and
anisotropy at high b values in the human brain. Magn Reson Med
2000;44:852–9.
[17] Chin CL, Wehrli FW, Hwang SN, Takahashi M, Hackney DB.
Biexponential diffusion attenuation in the rat spinal cord: computer
simulations based on anatomic images of axonal architecture. Magn
Reson Med 2002;47:455–60.
[18] Takahashi M, Hackney DB, Zhang G, Wehrli SL, Wright AC, O’Brien
WT, et al. Magnetic resonance microimaging of intraaxonal water
diffusion in live excised lamprey spinal cord. Proc Natl Acad Sci U S A
2002;99:16192–6.
J.M. Garcıa Santos et al. / Magnetic Resonance Imaging 26 (2008) 35–4444
[19] Petersen RC, Smith GE, Waring SC, Ivnik RJ, Tangalos EG, Kokmen
E. Mild cognitive impairment: clinical characterization and outcome.
Arch Neurol 1999;56:303–8.
[20] Gideon P, Thomsen C, Henriksen O. Increased self-diffusion of brain
water in normal aging. J Magn Reson Imaging 1994;4:185–8.
[21] Bilgili Y, Unal B. Effect of region of interest on interobserver variance
in apparent diffusion coefficient measures. AJNR Am J Neuroradiol
2004;25:109–11.
[22] Garcıa Santos JM, Ordonez Gonzalez C, Lloret Estan F, Torres del Rıo
S. Hippocampal age-dependent ADC changes measured with low and
high b-value DWI. European Congress of Radiology (ECR),
Electronic Poster On-line System (EPOS). http://posters.webges.
com/ecr/epos.
[23] Shimony JS, McKinstry RC, Akbudak E, Aronovitz JA, Snyder AZ,
Lori NF, et al. Quantitative diffusion-tensor anisotropy brain MR
imaging: normative human data and anatomic analysis. Radiology
1999;212:770–84.
[24] Helenius J, Soinne L, Perkio J, Salonen O, Kangasmaki A, Kaste M,
et al. Diffusion-weighted MR imaging in normal human brains in
various age groups. AJNR Am J Neuroradiol 2002;23:194–9.
[25] Park HJ, Westin CF, Kubicki M, Maier SE, Niznikiewicz M, Baer A,
et al. White matter hemisphere asymmetries in healthy subjects and in
schizophrenia: a diffusion tensor MRI study. Neuroimage 2004;23:
213–23.
[26] Schwartz ED, Chin CL, Takahashi M, Hwang SN, Hackney DB.
Diffusion-weighted imaging of the spinal cord. Neuroimag Clin N Am
2002;12:125–46.
[27] MacKay A, Whittall K, Adler J, Li D, Paty D, Graeb D. In vivo
visualization of myelin water in brain by magnetic resonance. Magn
Reson Med 1994;31:673–7.
[28] Tuch DS, Salat DH, Wisco JJ, Zaleta AK, Hevelone ND, Rosas HD.
Choice reaction time performance correlates with diffusion anisotropy
in white matter pathways supporting visuospatial attention. Proc Natl
Acad Sci U S A 2005;102:12212–7.
[29] Yoshiura T, Mihara F, Tanaka A, Ogomori K, Ohyagi Y, Taniwaki T,
et al. High b value diffusion-weighted imaging is more sensitive to
white matter degeneration in Alzheimer’s disease. Neuroimage
2003;20:413–9.
[30] Beaulieu C. The basis of anisotropic water diffusion in the nervous
system — a technical review. NMR Biomed 2002;15:435–55.
[31] Zaidel DW, Esiri MM, Harrison PJ. Size, shape, and orientation of
neurons in the left and right hippocampus: investigation of normal
asymmetries and alterations in schizophrenia. Am J Psychiatry
1997;154:812–8.
[32] Highley JR, Walker MA, McDonald B, Crow TJ, Esiri MM. Size of
hippocampal pyramidal neurons in schizophrenia. Br J Psychiatry
2003;183:414–7.
[33] Aboitiz F, Scheibel AB, Fisher RS, Zaidel E. Fiber composition of the
human corpus callosum. Brain Res 1992;598:143–53.
[34] Aboitiz F. Brain connections: interhemispheric fiber systems and
anatomical brain asymmetries in humans. Biol Res 1992;25:51–61.
[35] Ababneh Z, Beloeil H, Berde CB, Gambarota G, Maier SE, Mulkern
RV. Biexponential parameterization of diffusion and T2 relaxation
decay curves in a rat muscle edema model: decay curve components
and water components. Magn Reson Med 2005;54:524–31.
[36] Ronen I, Moeller S, Ugurbil K, Kim DS. Investigation of multicom-
ponent diffusion in cat brain using a combined MTC-DWI approach.
Magn Reson Imaging 2006;24:425–31.
[37] Pfeuffer J, Dreher W, Sykova E, Leibfritz D. Water signal attenuation
in diffusion-weighted 1H NMR experiments during cerebral ischemia:
influence of intracellular restrictions, extracellular tortuosity, and
exchange. Magn Reson Imaging 1998;16:1023–32.
[38] Pfeuffer J, Provencher SW, Gruetter R. Water diffusion in rat brain in
vivo as detected at very large b values is multicompartmental.
MAGMA 1999;8:98–108.
[39] Castedo J. Anatomıa de la sustancia blanca mediante tractografıa por
tensor de difusion. Radiologia [in press].
[40] Ito R, Mori S, Melhem ER. Diffusion tensor brain imaging and
tractography. Neuroimag Clin N Am 2002;12:1–19.
[41] Basser PJ, Jones DK. Diffusion tensor MRI: theory, experimental
design and data analysis — a technical review. NMR Biomed 2002;
15:456–67.