Adam Hilger revisited: a museum instrument as a modern teaching tool
13
* [email protected]; phone +351 220402301; fax +351 220402437 Adam Hilger revisited: a museum instrument as a modern teaching tool M. João Carvalhal a , Manuel B. Marques* b a Museu de Ciência da Universidade do Porto, Reitoria da Universidade, Pr. Gomes Teixeira 4099- 002 Porto; Portugal; b Faculdade de Ciências da Universidade do Porto - DFA and INESC TEC, Rua do Campo Alegre 687, 4169-007 Porto, Portugal ABSTRACT Spectroscopy can be historically traced down to the study of the dispersion of light by a glass prism. In the early 19th century, inspired by Newton’s experiment, Fraunhofer creates a device where an illuminated slit and a lens are placed before the prism; such a device is later transformed, by Kirchoff and Bunsen, into a much handier and more precise observation and measurement instrument, the spectroscope. In the 1930’s, the Physics Laboratory of the Faculty of Science of the University of Porto would buy, from Adam Hilger, Ltd., London, a constant deviation spectrometer. The ultimate purpose was to set up a spectroscopy laboratory for teaching and research. This model’s robust construction (the telescope and the collimator are rigidly fixed) makes it adequate for student’s practice. To sweep across the spectrum, all it takes is to rotate the high quality, constant deviation prism – known as Pellin‐Broca prism. Spectra in the 390‐900 nm interval are observed, either directly, or through photographic recording, or even by using a thermopile and associated galvanometer, when working in the infra‐red range. The wavelength of the line under observation is read straight on a drum, which is fixed to the prism’s rotation mechanism. Details of the construction and operation of this spectrometer are explored, against the background of present day spectrometers, automatic and computerized, thereby offering a deeper understanding of spectroscopic analysis: for instance, the use of the raies ultimes powder, a mixture of 50 chemical elements whose emission spectra provide a way of calibrating the instrument. Keywords: Museum, Teaching Optics, Spectroscopy, Spectrometer, Adam Hilger, emission spectrum, absorption spectrum. 1. INTRODUCTION The practice of spectroscopy goes as far back as the 17th century, when Isaac Newton investigated the spectrum produced by the dispersion of sunlight by an optical prism and concluded that visible light is nothing more than the non- uniform mixture of different, more or less refrangible, radiations (fig. 1). The term “spectrum” was coined by Newton himself. In 1802, the British physicist Thomas Young evaluated, for the first time, the wavelength and frequency of each color of the solar spectrum, by applying his wave theory of light to the phenomenon of interference in thin films 1 : 424 and 675 nm (originally in inches) were then yielded as the lower and upper wavelength boundaries for visible light. In the same year, William Hyde Wollaston, a British chemist, also observed for the first time some of the dark lines that cross the whole of the visible spectrum of sunlight, which he considered to be the limits of the different colours 2 . Twelve years later, the optician Joseph Fraunhofer created a device to observe the dark (absorption) lines in the Sun's spectrum (today known as “Fraunhofer lines”), where an illuminated slit and a lens were placed before the prism 3 (fig. 2a). His device was later transformed by two German scientists, the physicist Gustav Kirchhoff and the chemist Robert Bunsen, into a much handier and more precise observation and measurement instrument, the spectroscope 4 (fig. 2b). Working together, they demonstrated that each chemical element has a unique spectrum, and established spectroscopy as a powerful method of analysis. Therefore, they are regarded as the founders of modern spectroscopy.
-
Upload
independent -
Category
Documents
-
view
3 -
download
0
Transcript of Adam Hilger revisited: a museum instrument as a modern teaching tool
* [email protected]; phone +351 220402301; fax +351 220402437
Adam Hilger revisited: a museum instrument as a modern teaching
tool M. João Carvalhal
a, Manuel B. Marques*
b
aMuseu de Ciência da Universidade do Porto, Reitoria da Universidade, Pr. Gomes Teixeira 4099-
002 Porto; Portugal; bFaculdade de Ciências da Universidade do Porto - DFA and INESC TEC, Rua
do Campo Alegre 687, 4169-007 Porto, Portugal
ABSTRACT
Spectroscopy can be historically traced down to the study of the dispersion of light by a glass prism. In the early 19th
century, inspired by Newton’s experiment, Fraunhofer creates a device where an illuminated slit and a lens are placed
before the prism; such a device is later transformed, by Kirchoff and Bunsen, into a much handier and more precise
observation and measurement instrument, the spectroscope.
In the 1930’s, the Physics Laboratory of the Faculty of Science of the University of Porto would buy, from Adam Hilger,
Ltd., London, a constant deviation spectrometer. The ultimate purpose was to set up a spectroscopy laboratory for
teaching and research. This model’s robust construction (the telescope and the collimator are rigidly fixed) makes it
adequate for student’s practice.
To sweep across the spectrum, all it takes is to rotate the high quality, constant deviation prism – known as Pellin‐Broca
prism. Spectra in the 390‐900 nm interval are observed, either directly, or through photographic recording, or even by
using a thermopile and associated galvanometer, when working in the infra‐red range. The wavelength of the line under
observation is read straight on a drum, which is fixed to the prism’s rotation mechanism.
Details of the construction and operation of this spectrometer are explored, against the background of present day
spectrometers, automatic and computerized, thereby offering a deeper understanding of spectroscopic analysis: for
instance, the use of the raies ultimes powder, a mixture of 50 chemical elements whose emission spectra provide a way
of calibrating the instrument.
Keywords: Museum, Teaching Optics, Spectroscopy, Spectrometer, Adam Hilger, emission spectrum, absorption
spectrum.
1. INTRODUCTION
The practice of spectroscopy goes as far back as the 17th century, when Isaac Newton investigated the spectrum
produced by the dispersion of sunlight by an optical prism and concluded that visible light is nothing more than the non-
uniform mixture of different, more or less refrangible, radiations (fig. 1). The term “spectrum” was coined by Newton
himself. In 1802, the British physicist Thomas Young evaluated, for the first time, the wavelength and frequency of each
color of the solar spectrum, by applying his wave theory of light to the phenomenon of interference in thin films1: 424
and 675 nm (originally in inches) were then yielded as the lower and upper wavelength boundaries for visible light. In
the same year, William Hyde Wollaston, a British chemist, also observed for the first time some of the dark lines that
cross the whole of the visible spectrum of sunlight, which he considered to be the limits of the different colours2.
Twelve years later, the optician Joseph Fraunhofer created a device to observe the dark (absorption) lines in the Sun's
spectrum (today known as “Fraunhofer lines”), where an illuminated slit and a lens were placed before the prism3
(fig. 2a). His device was later transformed by two German scientists, the physicist Gustav Kirchhoff and the chemist
Robert Bunsen, into a much handier and more precise observation and measurement instrument, the spectroscope4
(fig. 2b). Working together, they demonstrated that each chemical element has a unique spectrum, and established
spectroscopy as a powerful method of analysis. Therefore, they are regarded as the founders of modern spectroscopy.
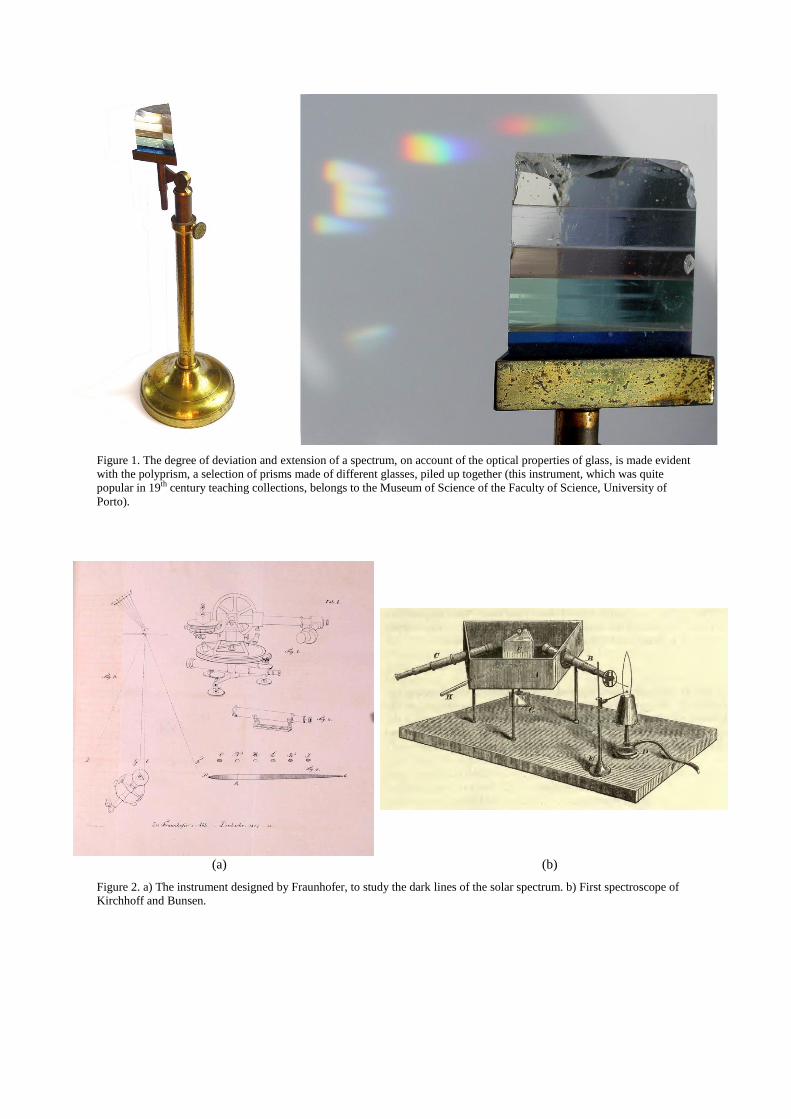
Figure 1. The degree of deviation and extension of a spectrum, on account of the optical properties of glass, is made evident
with the polyprism, a selection of prisms made of different glasses, piled up together (this instrument, which was quite
popular in 19th century teaching collections, belongs to the Museum of Science of the Faculty of Science, University of
Porto).
(a) (b)
Figure 2. a) The instrument designed by Fraunhofer, to study the dark lines of the solar spectrum. b) First spectroscope of
Kirchhoff and Bunsen.

As a result of these contributions, the science of spectroscopy evolved rapidly: the leading optical instrument
manufacturers of the 19th century rushed to produce new and diverse spectroscopes, put on display in the 1862
International Exhibition, held in London5.
Meanwhile, the appearance of photography offered the possibility of recording the observations permanently (the first
photograph of a spectrum can be traced down to 1842, when the French physicist Alexandre-Edmond Becquerel placed a
daguerreotype plate in front of a solar spectrum to record its image6): spectrographs came forward, where spectra can be
recorded and studied at a later time, as well as spectrometers, for accurate measurement of the wavelength.
The first decades of the 20th
century saw the increasing development of spectroscopy, which became very important, not
only in chemical analysis but also in the understanding of the atomic structure. Existent experimental procedures were
refined, new methods and techniques were created; the acknowledgement of spectroscopy as a fundamental resource in
the metallurgical industry led to the manufacture of high standard instruments in response to market demands. Prisms
were replaced by diffraction gratings, for linearity. The improvements in grating fabrication, mechanical stability,
elimination of stray light and temperature control led to today’s large spectrometers that can achieve wavelength
resolution below 0.1 picometer. For spectral details, the Scanning Fabry-Pérot Interferometer can reach resolutions
below 1 femtometer.
2. THE HILGER CONSTANT DEVIATION WAVELENGTH SPECTROMETER
In the early 1930’s, the Physics Laboratory of the Faculty of Science of the University of Porto would buy, from Adam
Hilger, Ltd., London, a constant deviation wavelength spectrometer (though the precise date of this acquisition is still
unknown, it has been found that the spectrometer’s accessories are marked down in an Adam Hilger, Ltd. catalogue
published in 1930). Spectrometer and accessories are presently in the collection of scientific instruments of the Museum
of Science of the Faculty of Science, with a range of accessories which, according to the trade catalogue7, were adequate
for general spectrum analysis. The firm’s logotype, as well as a reference number, is engraved both in the spectrometer
and in all its accessories. Many components – such as screws, hollow tubes, etc. – are made of brass and finished by a
distinct dark red varnish.
Adam Hilger was a company founded by two German precision optical instrument makers technicians, Adam e Otto
Hilger. In 1902, Frank Twyman was appointed General Manager; he was an engineer, who had been working with Otto
Hilger since 1898, on the development of spectroscopic instruments. Twyman would spend the next ten years developing
methods for spectrochemical analysis and designing new devices, thereby becoming an authority in the industrial
application of spectrochemistry8.
In academic laboratories, spectroscopy was chiefly used as a means of teaching optics, and associated instruments were
deliberately made with as much room for adjustment as possible so that the students might learn the working principle of
the instrument rather than use it as a research tool9. For this reason, and given that this spectrometer is intended to work
in the visible and near UV - when most spectral lines lie in the UV range - we believe that teaching may have been the
main purpose of this acquisition, though the intention of initiating research in spectroscopy should not be excluded.
However, as far as we know, no scientific work has been done in this period, in connection with spectroscopy.
The assembly was installed in a small room dedicated to spectroscopy in the 4th
floor of the Physics Laboratory10
(fig. 3).
The constant deviation spectrometer was first designed, in 1904, by Frank Twyman, using the so-called Pellin-Broca
prism. This is a visual instrument, in which the telescope and the collimator are rigidly fixed; all it takes to sweep
through the spectrum is to rotate the prism, which makes it adequate for student’s practice11
(fig. 4a).
According to the catalogue, the 1926 design results from several improvements, following the identification of a few
faults in earlier models. It is worth mentioning the cover that completely envelops the prism table and the sweeping gear,
and fully adjusts to the collimator and telescope, protecting all optical elements from dust and fumes generated during
operation. It also reduces any unwanted light and spurious reflections, creating a field background with extreme
blackness, so that the faintest lines can be observed. The prism is stabilized by a process that resulted from research
carried out by the British Scientific Instrument Research Association, whereby both tarnishing and clouding of the
surfaces are very greatly retarded, enabling its use for many years without the need for cleaning12
.

Figure 3. Small room set up for work in spectroscopy: the Hilger spectrometer and the Gramont electric arc are easily
identified on the table, amid various accessories.
Either the telescope or the collimator comprise a tube rigidly screwed to the spectrometer’s body, in whose interior
another tube slides back and forth and can be drawn out altogether; the alignment of these tubes is guaranteed by
construction with the highest precision. An objective glass inside the telescope can be focused by a side screw attached
to a scale seen through a small window, to enable repetition. The telescope and the collimator, at right angles to each
other, are aligned with the two solid and heavy feet of the base, which makes the spectrometer stable and space saving.
The instrument owned by the Museum of Science of the Faculty of Science (fig. 4b), with the catalogue reference D78,
shows signs of wear, keeping however most of the accessories bought at the time; the optical prism is in excellent
condition. The full set may have cost a little more than 100 sterling pounds (an estimation has been made using the costs
listed in the 1930 catalogue, given that no invoice has been found).
(a) (b)
Figure 4. a) The Hilger Wavelength Spectrometer, as illustrated in the 1930’s catalogue. b) The Wavelength Spectrometer
from the Faculty of Science of the University of Porto, presently in the collection of the Museum of Science.

The constant deviation prism
The dispersive element of the spectrometer is a constant deviation prism (or Pellin-Broca prism), with a refractive index
of 1.74 for the D-line (fig. 5). This prism was first introduced in 1899, by André Broca and Ph. Pellin13
: its configuration
equals the combination of two 30° and one 45° prisms, for which the sought minimum deviation condition occurs at 90°
for radiation of any wavelength. To pass through the spectrum, all it takes is to rotate the table sustaining the prism by
means of a micrometric screw. A duralumin drum (fig. 6) is fixed to this screw, bearing a helical scale, from 390 to 900
nm (the unit that has been used through the entire catalogue is the angström).The wavelength of the line under
observation is directly read off the scale, without the observer having to quit the eyepiece; the wavelength scale is over 1
meter long, which enables high precision readings, particularly when small wavelengths are concerned. The smallest
division is 1 nm, however, it is possible, in the blue and violet ranges, to read an extra figure through estimation.
Figure 5. The Pellin‐Broca constant deviation prism on the sustaining table (after the prism casing has been removed), with
the path of light through the prism illustrated by a diagram: the prism is rotated around an axis O, which is the line of
intersection of the BAD bisecting plane with the reflecting face BC.
Figure 6. The duralumin drum with scale, where the wavelength of the line under observation is indicated by an index
running in a helical slot.
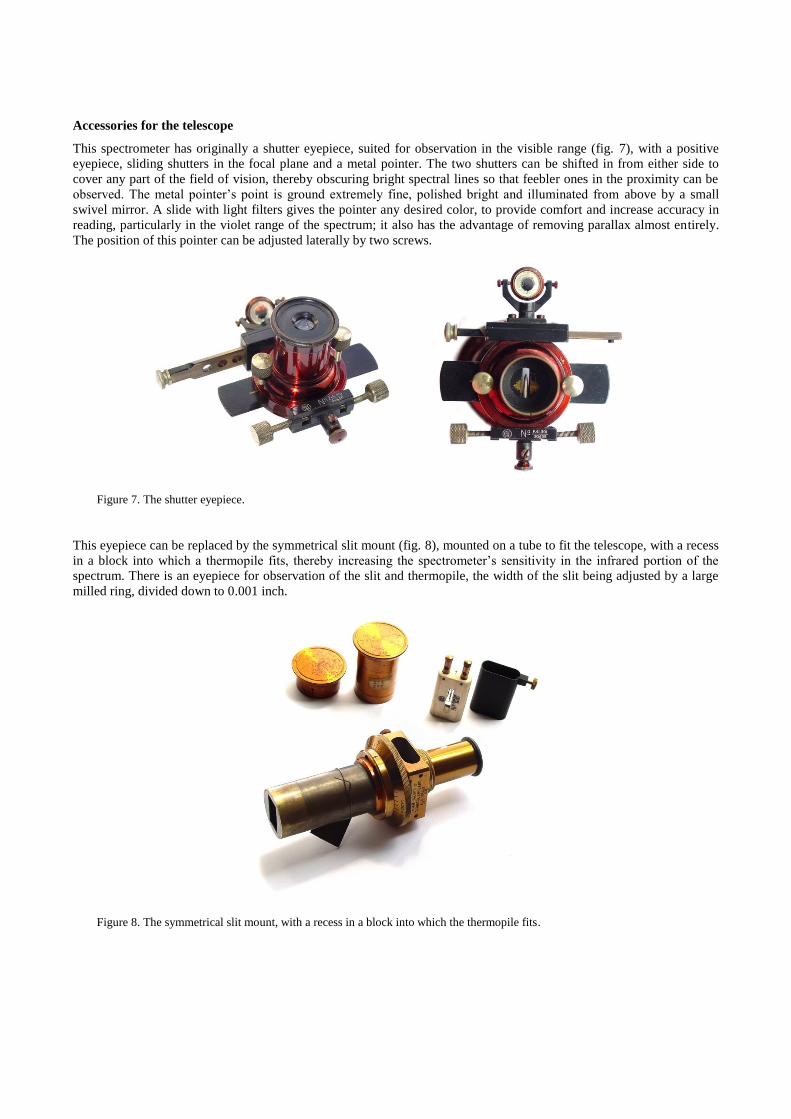
Accessories for the telescope
This spectrometer has originally a shutter eyepiece, suited for observation in the visible range (fig. 7), with a positive
eyepiece, sliding shutters in the focal plane and a metal pointer. The two shutters can be shifted in from either side to
cover any part of the field of vision, thereby obscuring bright spectral lines so that feebler ones in the proximity can be
observed. The metal pointer’s point is ground extremely fine, polished bright and illuminated from above by a small
swivel mirror. A slide with light filters gives the pointer any desired color, to provide comfort and increase accuracy in
reading, particularly in the violet range of the spectrum; it also has the advantage of removing parallax almost entirely.
The position of this pointer can be adjusted laterally by two screws.
Figure 7. The shutter eyepiece.
This eyepiece can be replaced by the symmetrical slit mount (fig. 8), mounted on a tube to fit the telescope, with a recess
in a block into which a thermopile fits, thereby increasing the spectrometer’s sensitivity in the infrared portion of the
spectrum. There is an eyepiece for observation of the slit and thermopile, the width of the slit being adjusted by a large
milled ring, divided down to 0.001 inch.
Figure 8. The symmetrical slit mount, with a recess in a block into which the thermopile fits.
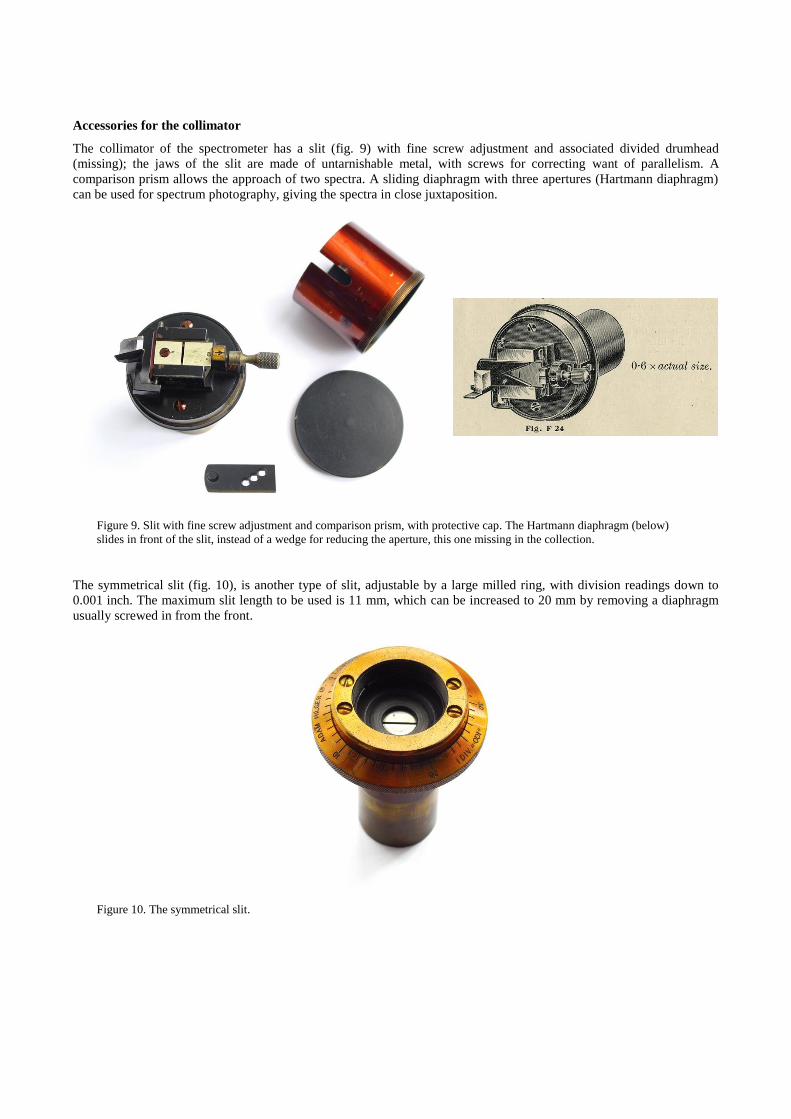
Accessories for the collimator
The collimator of the spectrometer has a slit (fig. 9) with fine screw adjustment and associated divided drumhead
(missing); the jaws of the slit are made of untarnishable metal, with screws for correcting want of parallelism. A
comparison prism allows the approach of two spectra. A sliding diaphragm with three apertures (Hartmann diaphragm)
can be used for spectrum photography, giving the spectra in close juxtaposition.
Figure 9. Slit with fine screw adjustment and comparison prism, with protective cap. The Hartmann diaphragm (below)
slides in front of the slit, instead of a wedge for reducing the aperture, this one missing in the collection.
The symmetrical slit (fig. 10), is another type of slit, adjustable by a large milled ring, with division readings down to
0.001 inch. The maximum slit length to be used is 11 mm, which can be increased to 20 mm by removing a diaphragm
usually screwed in from the front.
Figure 10. The symmetrical slit.

Photographic camera
If the telescope is replaced by a photographic camera, the spectrometer turns into a spectrograph. The 1930’s acquisition
included such a camera (Fig. 11). Made entirely of metal, it records the whole of the visible spectrum across the larger
dimension of a “quarter plate”. The camera is designed to work in conjunction with the object glass of the telescope,
with which it forms an optical system based on the telephoto principle, showing an equivalent focal length of 21 inch
(53.3 cm). It can be set in position very quickly by removing the telescope draw tube: accuracy of alignment is assured
by the geometric fitting. Focusing is achieved by the object glass of the telescope, and readings repeated by means of the
scale and index mentioned above. Though the focal length is 21 inch, the front edge of the camera extends only 3 inches
(7.6 cm) beyond the position normally occupied by the eyepiece. By means of a rack and pinion adjustment, one plate
can take several exposures.
Figure 11. The photographic camera and a metal dark slide, which takes 3¼ × 4¼ inch plates (known as “quarter plates”).
Emission spectra
The procedure by which a substance is led to emit radiation, suitable for its spectroscopic analysis, falls into four classes:
flame, electric arc discharge, spark discharge and vacuum tube discharge. The flame spectrum can be obtained from
some metals or their salts, by placing a small amount of a substance or of its strong solution in a Bunsen flame. This
method is mainly adequate for alkaline or alkaline-earth metals. The electric arc came to be one of the preferred methods
when direct current with voltage from 150 to 220 V became available; however, with alternate current or lower voltages,
spectra can be created by using carbon electrodes. It is thus possible to obtain spectra from metals, metallic alloys,
powders, precipitates, dry residues from solutions, etc. To produce spectra from spark discharge, a small transformer
with a 15,000 V output on open circuit is needed.
The Physics Laboratory of the Faculty of Science also bought from Adam Hilger, Ltd., a Gramont Arc and Spark Stand
(fig. 12), an electrode holder designed by Arnaud de Gramont14
, with all exposed metal parts made of stainless steel and
insulation in non-inflammable zylonite (a trade name for cellulose acetate), safe enough for tensions up to 20,000 V.
This design allows any desired position of the arc or spark to be attained. With this electrode holder, metal or carbon
electrodes with section diameter from 4 to 10 mm can be used, as well as small specimens of metal or other conductive
materials, held by spring clips, and non-conductive powders (slags, glasses, precipitates, residues from solutions, etc.)
held in small platinum cups. An adjustable pointer on a swinging arm can be fitted to the stand and is of assistance in
setting the height of the arc or spark gap: this becomes important when two or more sets of electrodes have to be
interchanged in one series of exposures.
The spark is excited by a transformer, which includes an autotransformer running on A.C.: high voltages are obtained by
suitable tappings on the auto-transformer. For sparking between electrodes, a 0.006 µF condenser is connected in parallel
with the spark gap (fig. 13). These devices were supplied by Adam Hilger, Ltd., though manufactured by other firms,
under their specifications (the condenser, for instance, shows the logotype Dubilier).

Figure 12. Gramont arc and spark stand, with metal electrodes or with spring clips (inset).
Figure 13. Electric power supply to the arc and spark setup.
The Physics Laboratory also owned a Hitchen apparatus (meanwhile gone missing), to enable the observation of spectra
produced by sparks from liquids and solutions, with the accuracy already achieved for metallic alloys. It was a sparking
vessel for liquids (fig. 14), designed to work with the Gramont arc and spark stand, showing advantage over other
existing vessels for the same purpose (by Hartley, Pollok and Leonard)15
. We favour the hypothesis that it may also have
been supplied by Adam Hilger, Ltd., given that one of its inventors, Frank Twyman, was considered to be at the time one
of the leading experts in spectroscopy and, as said previously, was the firm’s General Manager.
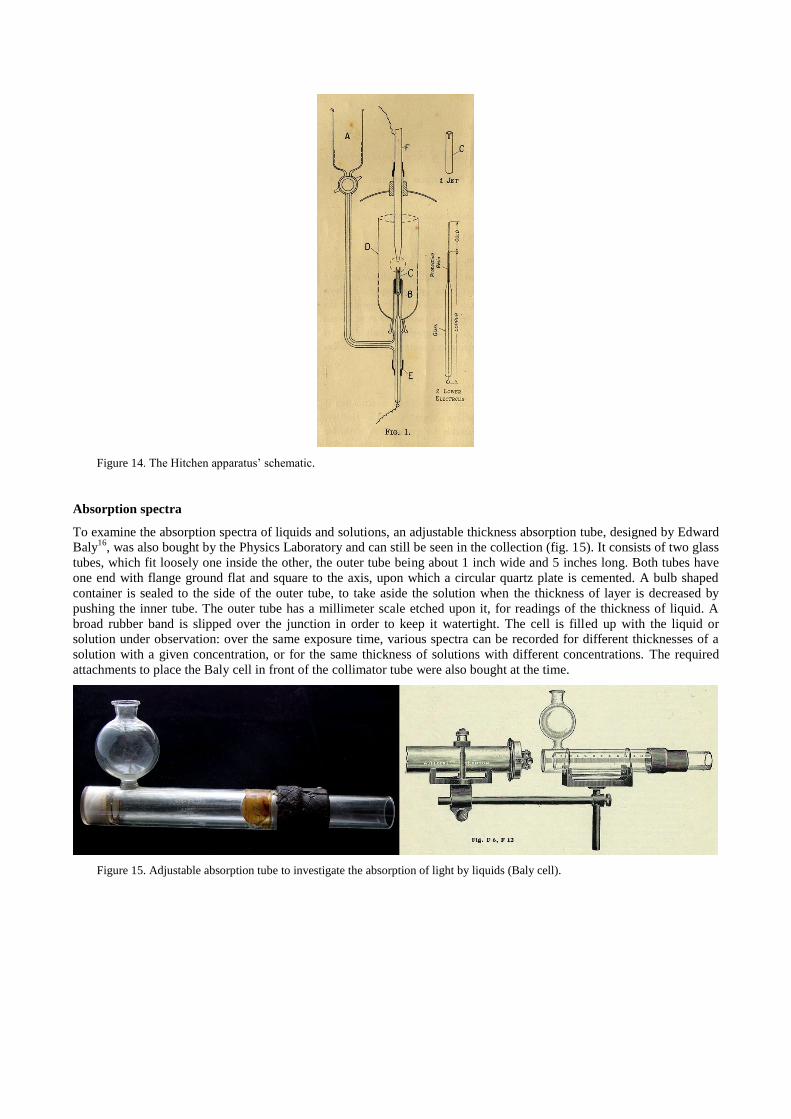
Figure 14. The Hitchen apparatus’ schematic.
Absorption spectra
To examine the absorption spectra of liquids and solutions, an adjustable thickness absorption tube, designed by Edward
Baly16
, was also bought by the Physics Laboratory and can still be seen in the collection (fig. 15). It consists of two glass
tubes, which fit loosely one inside the other, the outer tube being about 1 inch wide and 5 inches long. Both tubes have
one end with flange ground flat and square to the axis, upon which a circular quartz plate is cemented. A bulb shaped
container is sealed to the side of the outer tube, to take aside the solution when the thickness of layer is decreased by
pushing the inner tube. The outer tube has a millimeter scale etched upon it, for readings of the thickness of liquid. A
broad rubber band is slipped over the junction in order to keep it watertight. The cell is filled up with the liquid or
solution under observation: over the same exposure time, various spectra can be recorded for different thicknesses of a
solution with a given concentration, or for the same thickness of solutions with different concentrations. The required
attachments to place the Baly cell in front of the collimator tube were also bought at the time.
Figure 15. Adjustable absorption tube to investigate the absorption of light by liquids (Baly cell).

R.U. Powder
Two chemists reputedly made major contributions to spectral analysis: Walter Hartley e Arnaud de Gramont. Hartley, an
English scientist and pioneer in the field, had, by 1882, investigated the proportions of certain metals whose presence in
a compound was made evident by the appearance of their lines in the spectrum. His work was continued by Pollok and
Leonard. They distinguished the lines of each particular metal by Greek letters, which denoted the persistence of the
spectrum line as the amount of metal in presence was reduced17
:
Table 1. Pollok’s nomenclature for the sensitive spectrum lines of metals in solution.
Lines Meanings
τ Seen with the metal, but not with strong solutions
σ Seen with strong solutions, but not with 1% solutions
φ Seen with 1% solutions, but not with 0.1% solutions
χ Seen with 0.1% solutions, but not with 0.01% solutions
ψ Seen with 0.01% solutions, but not with 0.001% solutions
ω Seen with 0.001% solutions
This way, W. Hartley and his co-workers laid the foundations for quantitative spectral analysis, dealing essentially with
solutions. De Gramont (Arnaud de Gramont published in 1923, together with F. Lecoq De Boisbaudran, Analyse
Spectral Appliquée aux Recherches de Chimie Minérale, in two text volumes and one atlas of drawings, to be found in
the Library of the current Department of Physics and Astronomy) followed the same line of thought, working chiefly
with metals in solid state. Hartley and co-worker’s sensitive lines were named by him as “les raies sensibles”; lines that
persisted even with the smallest amounts of metals in solution he called “les raies ultimes”. This expression may have
first been used by de Gramont in 190718
. He established a limit for the appearance of the whole spectrum (“limite
d’apparition total”), above which all the lines of an element would be present, and below which the lines would be
vanishing. The lines to persist the last make up the “raies ultimes”, to be identified in order to quantify small amounts of
an element. In the 1907 publication, de Gramont listed the wavelengths of the “raies ultimes” for various metals. These
lines are not necessarily the strongest lines in the spark spectrum of the element, but show in its arc spectrum, where they
are generally of great intensity; they are generally also present in the spectra of very hot flames.
Figure 16. Small flask with 2 g of R.U. powder, and protective case, from the collection of the Museum of Science.
Adam Hilger, Ltd. also supplied spectroscopically standardized substances, such as R.U. powder (after “Raies ultimes”),
of which he was the sole supplier (fig. 16); this powder had been developed by J. W. Ryde e H. G. Jenkins at the
Research Laboratories of the General Electric Company, Ltd., Wembley, UK19
, consisting of traces of fifty elements
incorporated in a suitable base material (zinc, magnesium and calcium oxides). The quantity of each element had been
carefully adjusted so that the arc spectrum showed, on the average, about seven lines per element. In making a
spectroscopic analysis, the arc spectrum of ten to twenty milligrams of the R.U. powder was overlapped to the spectrum
of the material to be examined, as a comparison spectrum. All the elements present as impurities in the substance under
examination would produce lines coincident with the corresponding lines in the R.U. spectrum. Therefore, the
identification of the elements present in the material could be made promptly, without wavelength determinations.
3. CONCLUSION
Along the 1930’s, in order to make the use of the Hilger spectrometer more versatile, a few accessories would be
manufactured locally: a Zeiss-type optical bench with fitting carriages, an electric arc with electrodes at a right angle, a
Gramont arc and spark stand and a magnesium lamp with clockwork.
In 1964, framed by strong nationwide investment in teaching equipments for High Schools and Universities, the Physics
Laboratory bought another constant deviation wavelength spectrometer from Hilger & Watts (Adam Hilger, Ltd. had
amalgamated with E. R. Watts in 1948)20
, together with a grooved iron bar for mounting accessories, a photographic
camera with slides taking “quarter plates”, and a Ramsden eyepiece.
Nowadays most laboratories have computer controlled spectrometers, and most students never get the possibility to look
directly at a line spectrum, to appreciate the color hues and relative brightness of the lines. We consider that, in
laboratory practices, a direct view spectrometer, or a spectroscope, in parallel with a computer controlled one, is a must.
Students can better grasp the limitations of the instrument with a simpler version close at hand. The teaching practice
along the years has convinced us that this approach is important (as a side remark, it should be said that the direct view
spectrometer allowed a university student to discover, a few years ago, that he had a lesser form of color blindness).
Following suit with this belief, the spectrometer supplied by Hilger & Watts in 1964 is still used in spectrometry
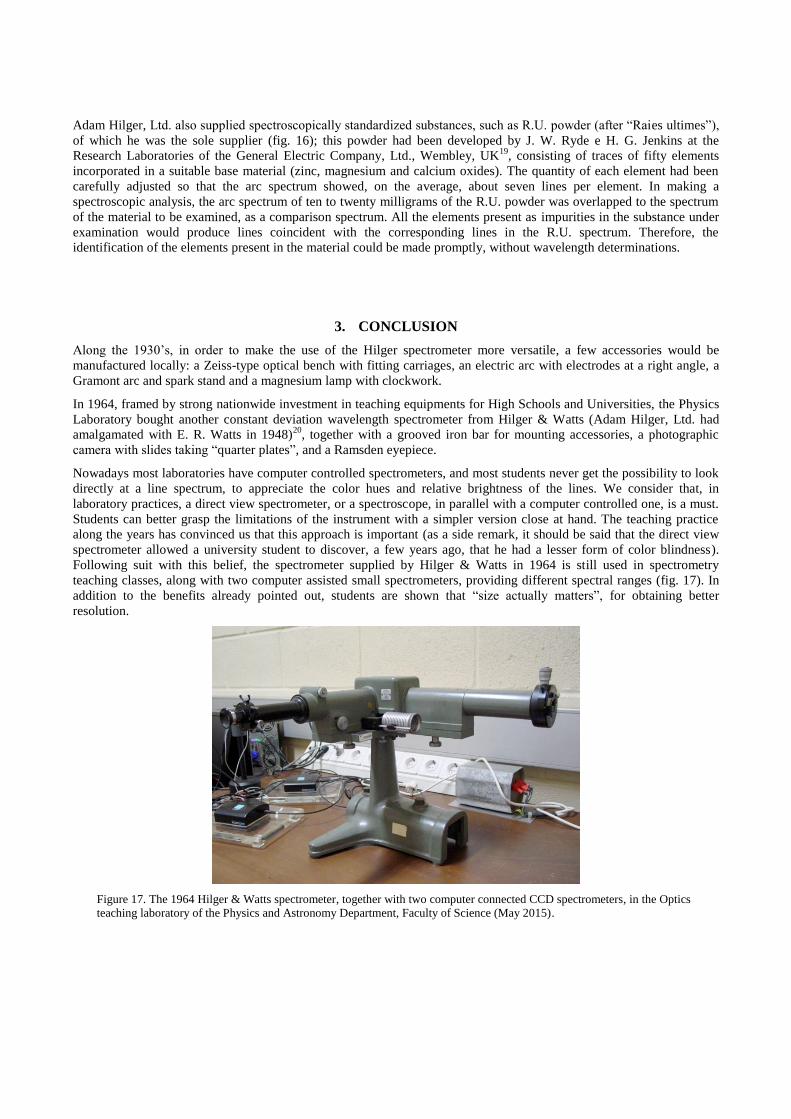
teaching classes, along with two computer assisted small spectrometers, providing different spectral ranges (fig. 17). In
addition to the benefits already pointed out, students are shown that “size actually matters”, for obtaining better
resolution.
Figure 17. The 1964 Hilger & Watts spectrometer, together with two computer connected CCD spectrometers, in the Optics
teaching laboratory of the Physics and Astronomy Department, Faculty of Science (May 2015).
REFERENCES
[1] Young, T., "The Bakerian Lecture: On the Theory of Light and Colours", Phil. Trans. R. Soc. Lond., 92, 12-48
(1802).
[2] Wollaston, W.H., "A Method of Examining Refractive and Dispersive Powers, by Prismatic Reflection", Phil.
Trans. R. Soc. Lond., 92, 365-380 (1802).
[3] Fraunhofer, J., Denkschriften der Königlichen Akademie der Wissenschaften zu München (Memoirs of the Royal
Academy of Sciences in Munich), 5, plate following page 226 (1817).
[4] Kirchhoff, G., Bunsen, R., "Chemical Analysis by Spectrum-observations", Philosophical Magazine and Journal of
Science, 4th series, 20, 89-109 (1860).
[5] Bennett, J.A., "The Spectroscope’s First Decade", Bulletin of the Scientific Instrument Society, 4, 3 (1984).
[6] Twyman, F., [Two Lectures On the Development and Present Position Of Chemical Analysis by Emission Spectra],
Adam Hilger, Ltd., 10 (1925).
[7] [A General Catalogue of The Manufactures of Adam Hilger, Ltd. ], January, D2 (1930).
[8] "Hilger History ... So Far! ", Hilger Crystals (6 April 2015). http://www.hilger-crystals.co.uk/about-us/about-us.html
[9] Twyman, T., [Two Lectures On The Development and Present Position of Chemical Analysis By Emission Spectra],
Adam Hilger, Ltd., 13 (1925).
[10] Machado, A.R., [Evolução do Estudo da Física Experimental na Escola Superior do Porto], Porto, 80 (1941).
[11] [A General Catalogue of The Manufactures of Adam Hilger, Ltd. ], January, D1 (1930).
[12] [A General Catalogue of The Manufactures of Adam Hilger, Ltd. ], January, D5 (1930).
[13] Pellin, P., Broca, A., "A spectroscope of fixed deviation", Astrophysical Journal, 10, 337-342 (1889).
[14] Gramont, M.A., "Spectroscopie – Recherches sur le spectre de lignes du titane et ses applications", Comptes rendus
de l'Académie des Sciences, 166, 93-99 (1918).
[15] Twyman, F., Hitchen, C., “Estimation of Metals in Solution by Means of their Spark Spectra”, Proceedings of the
Royal Society of London, Series A, 73 (1931).
[16] Baly, E.C.C., [Spectroscopy], 2nd
ed., Longmans, Green, and Co., London, 475 (1912).
[17] Twyman, T., [Two Lectures On The Development and Present Position of Chemical Analysis By Emission Spectra],
Adam Hilger, Ltd., 16 (1925).
[18] Gramont, M.A., "Spectroscopie – Sur les raies ultimes ou de grand sensibilité des métaux, dans les spectres de
dissociation", Comptes rendus de l'Académie des Sciences, 144, 1101-1104 (1907).
[19] Ryde, J.W., Jenkins, H.G., [Sensitive Arc Lines of 50 Elements], Adam Hilger, Ltd., pg 1 (1935).
[20] "Hilger History ... So Far! ", Hilger Crystals (6 April 2015). http://www.hilger-crystals.co.uk/about-us/about-us.html