Acoustomicrofluidic assembly of oriented and simultaneously ...
9
ARTICLE Acoustomicrofluidic assembly of oriented and simultaneously activated metal–organic frameworks Heba Ahmed 1 , Amgad R. Rezk 1 , Joseph J. Richardson 2,3 , Lauren K. Macreadie 4 , Ravichandar Babarao 4,5 , Edwin L.H. Mayes 5 , Lillian Lee 1 & Leslie Y. Yeo 1 The high surface area and porosity, and limitless compound and network combinations between the metal ions and organic ligands making up metal–organic frameworks (MOFs) offer tremendous opportunities for their use in many applications. While numerous methods have been proposed for the synthesis of MOF powders, it is often difficult to obtain oriented crystals with these techniques. Further, the need for additional post-synthesis steps to activate the crystals and release them from the substrate presents a considerable production challenge. Here, we report an acoustically-driven microcentrifugation platform that facilitates fast convective solutal transport, allowing the synthesis of MOF crystals in as short as five minutes. The crystals are not only oriented due to long-range out-of-plane superlattice ordering aided by molecular dipole polarization under the acoustoelectric coupling, but also simultaneously activated during the synthesis process. https://doi.org/10.1038/s41467-019-10173-5 OPEN 1 Micro/Nanophysics Research Laboratory, School of Engineering, RMIT University, Melbourne, VIC 3000, Australia. 2 ARC Centre of Excellence in Convergent Bio-Nano Science & Technology, The University of Melbourne, Parkville, VIC 3010, Australia. 3 Department of Chemical & Biomolecular Engineering, The University of Melbourne, Parkville, VIC 3010, Australia. 4 Commonwealth Scientific and Industrial Research Organisation (CSIRO), Normanby Road, Clayton, VIC 3168, Australia. 5 School of Science, RMIT University, Melbourne, VIC 3000, Australia. Correspondence and requests for materials should be addressed to L.Y.Y. (email: [email protected]) NATURE COMMUNICATIONS | (2019)10:2282 | https://doi.org/10.1038/s41467-019-10173-5 | www.nature.com/naturecommunications 1 1234567890():,;
-
Upload
khangminh22 -
Category
Documents
-
view
4 -
download
0
Transcript of Acoustomicrofluidic assembly of oriented and simultaneously ...
ARTICLE
Acoustomicrofluidic assembly of orientedand simultaneously activated metal–organicframeworksHeba Ahmed1, Amgad R. Rezk1, Joseph J. Richardson 2,3, Lauren K. Macreadie4, Ravichandar Babarao4,5,
Edwin L.H. Mayes 5, Lillian Lee 1 & Leslie Y. Yeo 1
The high surface area and porosity, and limitless compound and network combinations
between the metal ions and organic ligands making up metal–organic frameworks (MOFs)
offer tremendous opportunities for their use in many applications. While numerous methods
have been proposed for the synthesis of MOF powders, it is often difficult to obtain oriented
crystals with these techniques. Further, the need for additional post-synthesis steps to
activate the crystals and release them from the substrate presents a considerable production
challenge. Here, we report an acoustically-driven microcentrifugation platform that facilitates
fast convective solutal transport, allowing the synthesis of MOF crystals in as short as five
minutes. The crystals are not only oriented due to long-range out-of-plane superlattice
ordering aided by molecular dipole polarization under the acoustoelectric coupling, but also
simultaneously activated during the synthesis process.
https://doi.org/10.1038/s41467-019-10173-5 OPEN
1Micro/Nanophysics Research Laboratory, School of Engineering, RMIT University, Melbourne, VIC 3000, Australia. 2 ARC Centre of Excellence inConvergent Bio-Nano Science & Technology, The University of Melbourne, Parkville, VIC 3010, Australia. 3 Department of Chemical & BiomolecularEngineering, The University of Melbourne, Parkville, VIC 3010, Australia. 4 Commonwealth Scientific and Industrial Research Organisation (CSIRO),Normanby Road, Clayton, VIC 3168, Australia. 5 School of Science, RMIT University, Melbourne, VIC 3000, Australia. Correspondence and requests formaterials should be addressed to L.Y.Y. (email: [email protected])
NATURE COMMUNICATIONS | (2019) 10:2282 | https://doi.org/10.1038/s41467-019-10173-5 | www.nature.com/naturecommunications 1
1234
5678
90():,;
Metal–organic frameworks (MOFs)—highly orderedthree-dimensional coordination networks comprisinginorganic nodal units interconnected by polytopic
organic ligands—have recently garnered significant attentionbecause of their exceptionally high Brunauer–Emmett–Teller(BET) surface areas (~104 m2/g) and porosities (up to 90% of itsfree volume)1,2. Moreover, their structural diversity, arising fromthe vast number of possible combinations between the metalnodes and organic linkers, facilitates the tailoring of materialswith widely different physical, chemical, and geometrical prop-erties for applications that span catalysis, gas separation andsensing, charge transport and storage, and drug delivery, amongstothers2–8.
While MOFs have conventionally been synthesized through avariety of techniques, including hydrothermal, solvothermal,microwave, sonochemical, and electrochemical synthesis9, draw-backs associated with these routes include the random orienta-tion, polycrystallinity and defect-rich nature of the MOFsproduced due to inhomogeneities in the diffusion process10,11.Moreover, a significant practical limitation in the large-scaleproduction of these MOF powders is the requirement for sub-sequent post-synthesis chemical or thermal activation to removethe unreacted solvents trapped within the pores12–14. Further-more, in some instances, thermal and chemical activation viasolvent exchange hinder the use of MOFs as green materials, andhas often failed to yield the expected internal surface area.
In this work, we report an acoustomicrofluidic platform thatfacilitates one-step synthesis and activation of MOF powderswith high degree of orientation and surface area. The facile,
room-temperature operation is rapid—MOFs are produced in aslittle as 5 min, and are found to already be activated during theirsynthesis, therefore removing the need for further post-processingactivation steps. In particular, we demonstrate the synthesis ofHKUST-1 (Cu3(1,3,5-benzenetricarboxylate)n; Cu–BTC) since itis a particularly well-characterized MOF15,16 that facilitatescomparison of its geometrical properties. In addition, we showthat the technique can also be extended with similar results forthe synthesis of Fe-MIL-88B [Fe3O(1,4-benzenedicarbox-ylate)3Cl]. That the HKUST-1 and Fe-MIL-88B crystals aresimultaneous activated during their synthesis in the currentprocess is significant, not just from the standpoint of reducingprocessing time, complexity and failure, but also from an eco-nomic and environmental cost perspective since conventionalactivation methods under vacuum or via liquid solvent exchangeare either energy-intensive or results in waste organic solventsthat necessitate facilities for their treatment or disposal, particu-larly in large-scale manufacture.
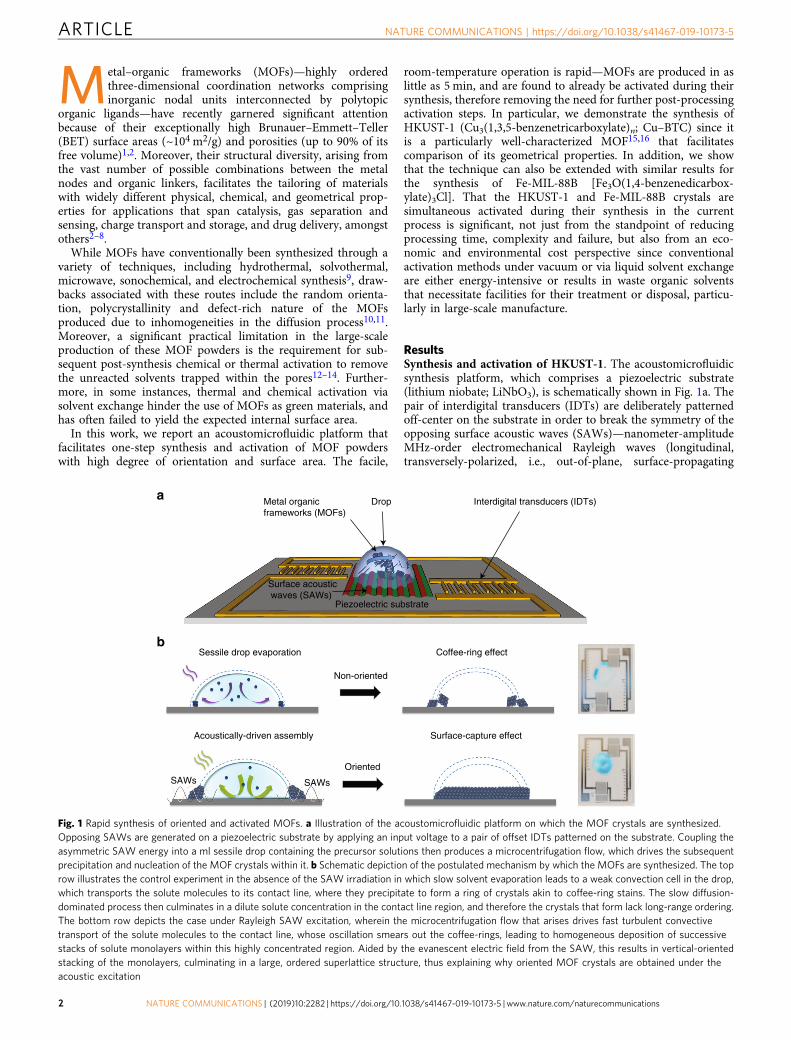
ResultsSynthesis and activation of HKUST-1. The acoustomicrofluidicsynthesis platform, which comprises a piezoelectric substrate(lithium niobate; LiNbO3), is schematically shown in Fig. 1a. Thepair of interdigital transducers (IDTs) are deliberately patternedoff-center on the substrate in order to break the symmetry of theopposing surface acoustic waves (SAWs)—nanometer-amplitudeMHz-order electromechanical Rayleigh waves (longitudinal,transversely-polarized, i.e., out-of-plane, surface-propagating
a DropMetal organicframeworks (MOFs)
Interdigital transducers (IDTs)
Surface acoustic waves (SAWs)
Piezoelectric substrate
bSessile drop evaporation Coffee-ring effect
Acoustically-driven assembly Surface-capture effect
SAWs SAWs
Non-oriented
Oriented
Fig. 1 Rapid synthesis of oriented and activated MOFs. a Illustration of the acoustomicrofluidic platform on which the MOF crystals are synthesized.Opposing SAWs are generated on a piezoelectric substrate by applying an input voltage to a pair of offset IDTs patterned on the substrate. Coupling theasymmetric SAW energy into a ml sessile drop containing the precursor solutions then produces a microcentrifugation flow, which drives the subsequentprecipitation and nucleation of the MOF crystals within it. b Schematic depiction of the postulated mechanism by which the MOFs are synthesized. The toprow illustrates the control experiment in the absence of the SAW irradiation in which slow solvent evaporation leads to a weak convection cell in the drop,which transports the solute molecules to its contact line, where they precipitate to form a ring of crystals akin to coffee-ring stains. The slow diffusion-dominated process then culminates in a dilute solute concentration in the contact line region, and therefore the crystals that form lack long-range ordering.The bottom row depicts the case under Rayleigh SAW excitation, wherein the microcentrifugation flow that arises drives fast turbulent convectivetransport of the solute molecules to the contact line, whose oscillation smears out the coffee-rings, leading to homogeneous deposition of successivestacks of solute monolayers within this highly concentrated region. Aided by the evanescent electric field from the SAW, this results in vertical-orientedstacking of the monolayers, culminating in a large, ordered superlattice structure, thus explaining why oriented MOF crystals are obtained under theacoustic excitation
ARTICLE NATURE COMMUNICATIONS | https://doi.org/10.1038/s41467-019-10173-5
2 NATURE COMMUNICATIONS | (2019) 10:2282 | https://doi.org/10.1038/s41467-019-10173-5 | www.nature.com/naturecommunications

compressional waves)—they generate upon application of anoscillating electric field at resonance. The transmission ofthese asymmetrically opposing waves into a 10 μl sessile liquiddrop placed atop the substrate then results in an internalmicrocentrifugal flow17–21 that has been previously demonstratedfor driving extremely efficient micromixing and particleconcentration22. Subjecting a drop containing 5 μl of a copperprecursor, i.e., copper(II) nitrate hemi(pentahydrate) (Cu(NO3)2⋅ 2.5H2O), and 5 μl of trimesic acid (benzene-1,3,5-tricarboxylicacid; H3BTC), both in 1:1 (vol/vol) ethanol–water solutions, tosuch acoustically-driven microcentrifugation at varying acousticintensities (1.5, 4.5, 7.5, and 9 Vrms) for 5 min can be seen toinduce nucleation and subsequent crystallization of HKUST-1(Fig. 2), which is amongst the foremost and most commonof MOFs reported in the literature given its excellent thermalstability, and superior adsorption and catalytic properties23,24.
Confirmation of the production of stable HKUST-1 MOFs isprovided by the Fourier Transform Infrared (FTIR) spectrain Supplementary Fig. 1 in which we verify the asymmetricstretching of the carboxylate groups in the H3BTC molecules at1508–1623 cm−1 and the symmetric stretching of the COO–Cu2carboxylate groups at 1384 and 1405 cm−1. Several bandsover wavenumbers 1300–600 cm−1 are observed, which can beattributed to the out-of-plane vibration of the H3BTCmolecules25,26. Noting the thermal stability of solid HKUST-1to exceed 300 °C, thermal gravimetric analysis (TGA) of one ofthe samples (9 Vrms), on the other hand, reveals two majorstages in the weight loss behavior of the HKUST-1 crystals,consistent with that observed for bulk HKUST-1 (SupplementaryFig. 2)27. The first weight loss stage occurs at temperaturesbelow 200 °C, which can be attributed to the removal of waterand solvent molecules from the surfaces of the HKUST-1precursors. For octahedral HKUST-1 crystals, the second weightloss stage starts at around 270 °C and ends around 340 °C. Therelative weight loss (weight loss/residual weight × 100%) ofthe HKUST-1 crystals at this stage is approximately 36.618%,roughly corresponding to the theoretical weight loss caused bythe combustion of the organic ligands in HKUST-1 in air. Withincreasing temperature, we observe a slight weight decrease ofapproximately 8.866% in the temperature range between 330 °Cand 450 °C, which can be attributed to the oxidation of Cu2O inair (Cu2O+ 1/2O2→ 2CuO).
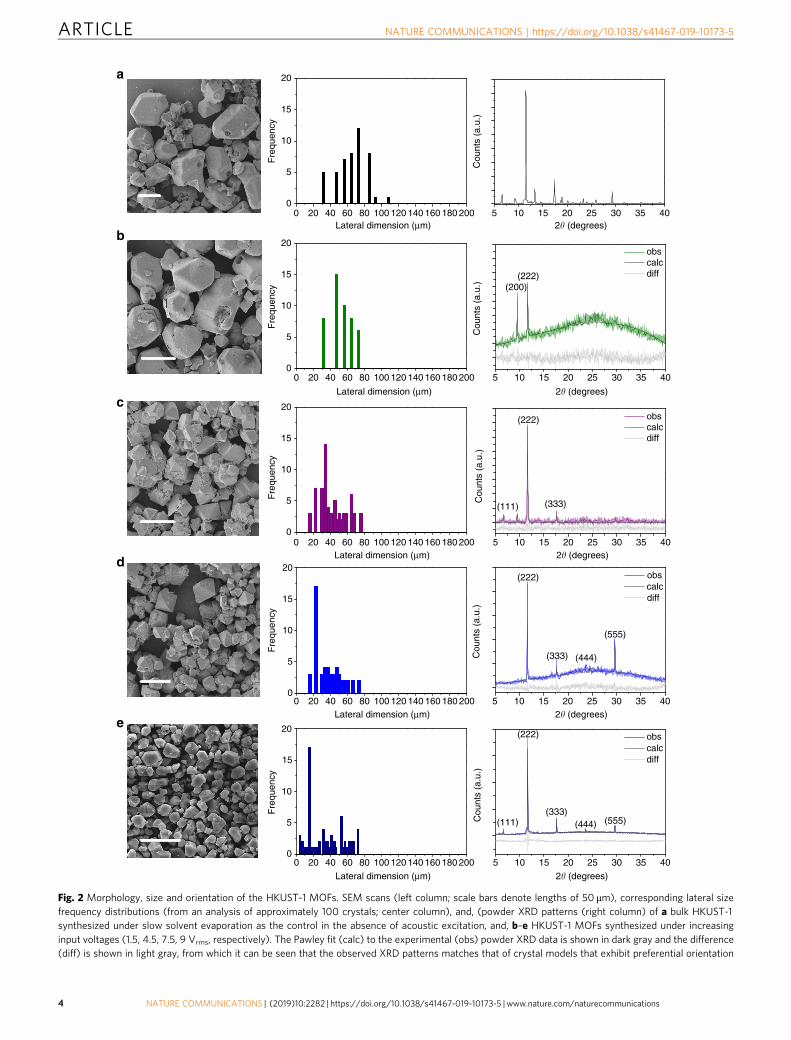
Further inspection of the orientation of the resultantcrystals reveals its strong dependence on the magnitude of theacoustic energy coupled into the drop, which is accompanied byan intensification of the convective microcentrifugation flow (-Fig. 2). We first observe from the scanning electron micro-scopy (SEM) images and size distributions in Fig. 2 (left andcenter columns) that increasing the flow intensity results inoctahedral crystals typical of HKUST-1 that are progressivelysmaller and more homogeneous in size, decreasing from amean characteristic dimension of 53.49 ± 4.04 μm at 1.5 Vrms to34.19 ± 4.95 μm at 4.5 Vrms, 25.83 ± 1.37 μm at 7.5 Vrmsand 15.09 ± 1.78 μm at 9 Vrms, as compared to that of bulkHKUST-1 with a mean diameter of 73.15 ± 5.85 μm (Supplemen-tary Table 1). This dimensional reduction is a consequence ofthe turbulence generated in the drop due to the leakage of theSAW energy into it, given streaming Reynolds numbers28 Res �uL=ν � 103 well above the 102 critical value reported forthe classical transition to subharmonic turbulence in acousticalflows29,30; here, ν denotes the kinematic viscosity of the fluid, u itsLagrangian velocity and L the characteristic drop dimension.The turbulent mixing eddies generated in the flow then resultsin enhanced convective transport, which is known to leadto the formation of smaller crystals31,32, given that the eddy
size imposes an upper limitation to the crystal dimensionduring its growth. This is confirmed not only by the orderof magnitude agreement between the Kolmogorov length scale33
η ¼ ðν3L=U3Þ1=4 � Oð10 μmÞ, characteristic of the eddy sizewith the crystal dimension observed, but also the U�3=4 velocityscaling that the crystal dimension obeys, as seen in Supplemen-tary Fig. 3.
More significantly, we note from the powder X-ray diffraction(XRD) spectra in the right column of Fig. 2b–e that the HKUST-1crystals synthesized from the present technique exhibit a highdegree of orientation parallel to the {222} plane, especially at highinput voltages. This is in stark contrast to the control experimentin which the crystals that form under slow solvent evaporation ofthe same drop on identical substrates in the absence of theacoustic forcing show no apparent orientational preference(Fig. 2a, right column). Interestingly, we observe that the increasein the input voltage leads to more prominent vertical, out-of-plane orientation, as can be seen by the appearance of additionalpeaks parallel to the {222} plane, such as the {333}, {444}and {555} planes at 2θ= 11.7°, 17.7°, 23.7°, and 29.7°, respectively(Fig. 2(b–e), right column).
We note in the XRD spectra a slight shift in the peaks(≈+ 0.4°), which can be attributed to the effect of compressivestresses on the crystal lattice structure arising from the acousticforcing; a similar observation was recently reported for sodiumchloride crystals34. To obtain different deformed models ofCu–BTC, density functional theory (DFT) simulations werecarried out using a volume-conserving strain tensor applied to thelattice parameters with strain magnitudes ranging from −0.008to 0.008 in 0.002 increments. A comparison of the theoreticaland experimental powder XRD data using the Pawley fittingmethod35 then yielded refined cell parameters which accuratelyresemble that expected for HKUST-1. Matching of the data forthe crystals acquired under input voltages of 1.5 and 4.5 Vrms wasobtained when a strain of −0.002 that led to slight compressionalong the c-plane was applied, resulting in cell parameters a= b= 26.30597 Å and c= 26.62462 Å with α= β= 90° and γ=89.65623°. For the crystals acquired when the input voltage wasincreased to 7.5 Vrms, matching was obtained with a slightincrease in the applied tensor strain of −0.006 that led to morecompression along the c-plane to yield cell parameters a= b=26.30597 Å and c= 26.62483 Å at α= β= 90° and γ= 89.88541°,whereas further compression by applying a strain of −0.008 alongthe c-plane was required for the crystals obtained when the inputvoltage was ramped to 9 Vrms, yielding cell parameters of a= b=26.30597 Å and c= 26.62502 Å at α= β= γ= 90°.
Additionally, we note the full-width at half maximum(FWHM) value of the peak at 2θ= 11.7° was seen to decreasewith increasing acoustic intensity, from 0.14° at the lowest inputvoltage (1.5 Vrms), corresponding to a crystallite size of 59.7 nm,to 0.49° at 9 Vrms, corresponding to a crystallite size of 167.17 nm.This increase in crystallite dimension with increasing electro-acoustic coupling into the fluid provides further confirmation ofthe increasing degree of orientation of the crystals. We also notethat the crystallite size at 9 Vrms is larger than the typical 100 nmsizes observed for HKUST-1 surface anchored MOFs (SUR-MOFs) synthesized using the layer-by-layer technique after 80cycles—a much longer process requiring several hours36,37.
A possible mechanism by which the out-of-plane crystalorientation arises can be postulated from the solutal dynamicsassociated with the acoustically-driven microcentrifugation flow.In the absence of the acoustic excitation, the weak convective flowthat arises in a sessile drop left to slowly evaporate transportssolute molecules to its contact line where the locally singularevaporation rate drives their precipitation to form a particulate
NATURE COMMUNICATIONS | https://doi.org/10.1038/s41467-019-10173-5 ARTICLE
NATURE COMMUNICATIONS | (2019) 10:2282 | https://doi.org/10.1038/s41467-019-10173-5 | www.nature.com/naturecommunications 3
a
b
c
d
e
20
15
10
5
00 20 40 60 80 100 120 140 160 180 200 5 10 15 20 25 30 35 40
Lateral dimension (µm)
0 20 40 60 80 100 120 140 160 180 200
Lateral dimension (µm)
0 20 40 60 80 100 120 140 160 180 200Lateral dimension (µm)
0 20 40 60 80 100 120 140 160 180 200Lateral dimension (µm)
0 20 40 60 80 100 120 140 160 180 200
Lateral dimension (µm)
2� (degrees)
5 10 15 20 25 30 35 40
2� (degrees)
(111) (333)
(333) (444)
(555)
5 10 15 20 25 30 35 402� (degrees)
5 10 15 20 25 30 35 402� (degrees)
5 10 15 20 25 30 35 40
2� (degrees)
Fre
quen
cy
20
15 (222)
(222)
(222)
(222)
(111)(333)
(444) (555)
obscalcdiff
obscalcdiff
obscalcdiff
obscalcdiff
(200)
10
5
0
Fre
quen
cy
20
15
10
5
0
Fre
quen
cy
20
15
10
5
0
Fre
quen
cy
20
15
10
5
0
Fre
quen
cy
Cou
nts
(a.u
.)C
ount
s (a
.u.)
Cou
nts
(a.u
.)C
ount
s (a
.u.)
Cou
nts
(a.u
.)
Fig. 2 Morphology, size and orientation of the HKUST-1 MOFs. SEM scans (left column; scale bars denote lengths of 50 μm), corresponding lateral sizefrequency distributions (from an analysis of approximately 100 crystals; center column), and, (powder XRD patterns (right column) of a bulk HKUST-1synthesized under slow solvent evaporation as the control in the absence of acoustic excitation, and, b–e HKUST-1 MOFs synthesized under increasinginput voltages (1.5, 4.5, 7.5, 9 Vrms, respectively). The Pawley fit (calc) to the experimental (obs) powder XRD data is shown in dark gray and the difference(diff) is shown in light gray, from which it can be seen that the observed XRD patterns matches that of crystal models that exhibit preferential orientation
ARTICLE NATURE COMMUNICATIONS | https://doi.org/10.1038/s41467-019-10173-5
4 NATURE COMMUNICATIONS | (2019) 10:2282 | https://doi.org/10.1038/s41467-019-10173-5 | www.nature.com/naturecommunications

ring—the well-known coffee-ring stain effect38–41, as illustratedin the top row of Fig. 1b. More importantly, the diffusion-dominated transport, with a timescale on the orderL2=D � O 103 sð Þ, wherein D is the molecular diffusion coeffi-cient, is too slow to enhance the local solutal concentrationimmediately behind the drying front, i.e., the contact line region,such that the weak intermolecular interactions that arise betweenthe solute molecules are insufficient to result in large long-rangevertical ordering of the crystal.
On the other hand, the oscillation of the contact line underthe MHz-order SAW vibration42 as it recedes in a stick–slipmanner (a consequence of pinning effects in the presence ofsurface heterogeneities39) is observed to smear out the rings43,44,leading to the successive deposition of monolayers across the entirefootprint of the drop (Fig. 1b, bottom row). The turbulentconvective flow driven by the acoustics is also sufficiently fast—with time scales on the order L=U � O 1 sð Þ—in transporting thesolute to a large region behind the drying front. Together with thelocally singular evaporation rate at the contact line, this results inan exponential enrichment of the local solutal concentration in thatvicinity, which provides ripe conditions that are known to promotethe formation of large, ordered three-dimensional superlatticestructures45. The out-of-plane assembly of successive monolayerstacks is further aided by the leakage of the electric field associatedwith the SAW on the piezoelectric substrate46,47; the ability of aninduced electric field in controlling the crystal orientation havingbeen previously reported48. As illustrated in the left and centercolumns of Fig. 3a, this evanescent electric field in the liquidinduces dipoles in the solute molecules, whose polarization resultsin their vertical stacking along the field gradient orthogonal to thesubstrate surface, similar to that in ref. 48.
The increase of out-of-plane crystal orientation with theinput voltage as seen in the right column of Fig. 2b–e is consistentwith such a theory. To test this hypothesis, we repeated theexperiments using shear-horizontal SAWs (SH-SAWs), i.e.,longitudinal, horizontally-polarized, i.e., in-plane, surface propa-gating shear waves, generated on a lithium tantalate (LiTaO3)substrate, whose native electric field polarization occurs in theplane of the substrate (Fig. 3b, left and center columns), incontrast to that of the Rayleigh SAW, whose native electric fieldpolarization occurs out of the plane of the substrate (Fig. 3a, left
and center columns). Under the same conditions, we observe thecrystals produced to possess an in-plane orientation, i.e., parallelto the {200} plane, as shown in the right column of Fig. 3b. Wealso note the negligible temperature change (from 27.8 to 28.6 °C)in the drop over the acoustic excitation period, even for thehighest input voltage, thus eliminating the possibility of heatingeffects due to either Rayleigh SAW and SH-SAW irradiation onthe evaporation dynamics (see Supplementary Fig. 4).
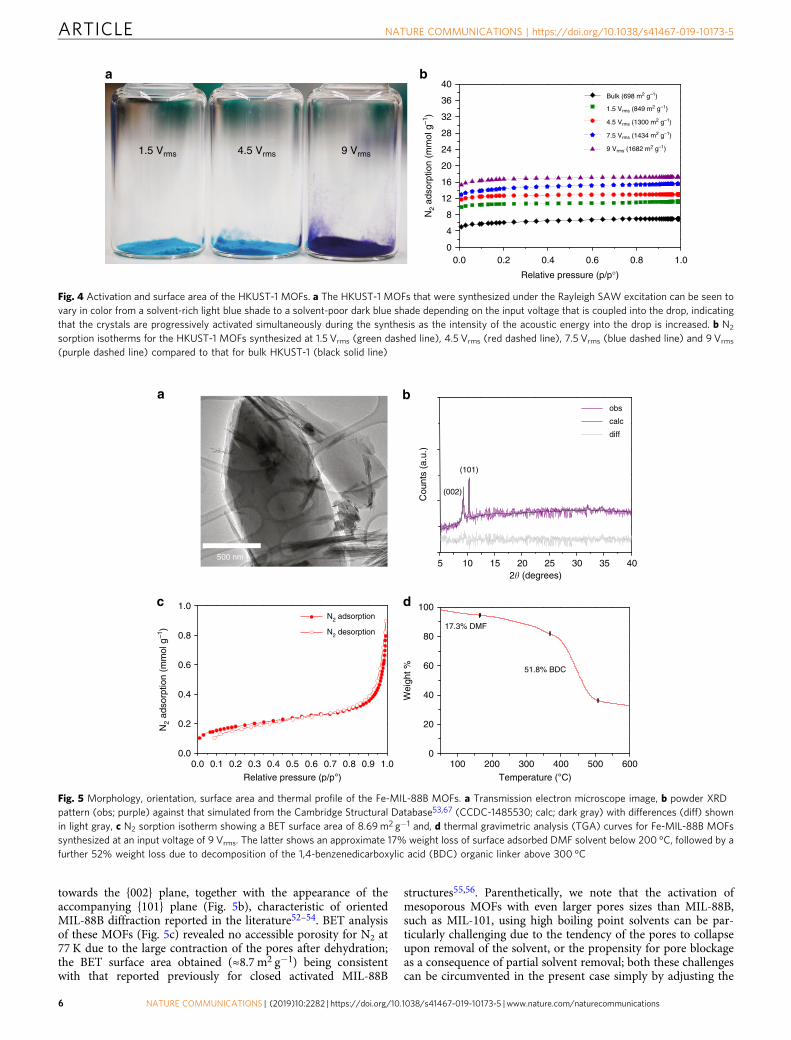
Additionally, the SAW excitation along the substrate resultsin oscillations in the MOF crystalline structure, which, in turn,squeezes the solvents out of the pores, leading to theirsimultaneous activation, as observed by the color change in thecrystals from a light (solvent-rich) to deep (solvent-poor) purpleshade under increasing acoustic field intensities (Fig. 4a). Thesurface area of the synthesized MOFs are reported in Fig. 4b, inwhich the N2 adsorption isotherm at 77 K for input voltages of 1.5,4.5, 7.5 and 9 Vrms yields BET surface areas of approximately 849,1300, 1434, and 1682m2 g−1, respectively. The latter values arecomparable to that reported in the literature for commercially-available activated HKUST-1 crystals15 (1500–2100m2 g−1) andmore than double the surface area (≈700m2 g−1) associated withthe HKUST-1 crystals produced in the absence of SAW excitation,which matches closely with that reported for the same crystalsprior to their activation49.
Synthesis and activation of Fe-MIL-88B. Similar oriented andsimultaneously-activated structures were also observed for thesynthesis of Fe-MIL-88B crystals—which comprises a three-dimensional hexagonal structure built up from trimers ofFeO6 octahedra linked to benzenedicarboxylate anions formingwater-filled tunnels along the c-axis connected by bipyramidalcages, and thus having relatively small pore dimensions. MIL-88B is especially useful particularly for selective adsorptionof gases and solvents because its unit cell is able to shrink andswell reversibly under external stimuli or upon solvent removalduring activation50–52. We, however, note that the orientedand simultaneously-activated structures were only obtained forexposure to the acoustic irradiation at the highest input voltage of9 Vrms over the same five minute period. The rod-shaped crystalswith average lengths of 2–3 μm (Fig. 5a) were seen to be oriented
a
+ + + + + + + + +– – – – – – – – –––––––
+++++
b
IDTs
LiTaO3
IDTs
IDTs IDTs
LiNbO3
Y
X
Z
X
Y
X
Z
X
x x x x x x x x
x x x x x x x x
5 10
(222)
(333)(111)
(200)
(400)
15 20 25 302� (degrees)
35 40
5 10 15 20 25 302� (degrees)
35 40
Cou
nts
(a.u
.)C
ount
s (a
.u.)
Fig. 3 Orientation of the HKUST-1 MOFs under acoustoelectric excitation. Top (left column) and side (center column) view schematics (not to scale)illustrating the mechanism by which the HKUST-1 crystals are oriented (or not), as evidenced by the powder XRD spectra (right column) for the case ofa Rayleigh SAW and b SH-SAW excitation at 4.5 Vrms
NATURE COMMUNICATIONS | https://doi.org/10.1038/s41467-019-10173-5 ARTICLE
NATURE COMMUNICATIONS | (2019) 10:2282 | https://doi.org/10.1038/s41467-019-10173-5 | www.nature.com/naturecommunications 5
towards the {002} plane, together with the appearance of theaccompanying {101} plane (Fig. 5b), characteristic of orientedMIL-88B diffraction reported in the literature52–54. BET analysisof these MOFs (Fig. 5c) revealed no accessible porosity for N2 at77 K due to the large contraction of the pores after dehydration;the BET surface area obtained (≈8.7 m2 g−1) being consistentwith that reported previously for closed activated MIL-88B
structures55,56. Parenthetically, we note that the activation ofmesoporous MOFs with even larger pores sizes than MIL-88B,such as MIL-101, using high boiling point solvents can be par-ticularly challenging due to the tendency of the pores to collapseupon removal of the solvent, or the propensity for pore blockageas a consequence of partial solvent removal; both these challengescan be circumvented in the present case simply by adjusting the
ba40
36
32
28
24
20
16
12
8
4
00.0 0.2 0.4 0.6 0.8 1.0
Bulk (698 m2 g–1)
1.5 Vrms (849 m2 g–1)
4.5 Vrms (1300 m2 g–1)
7.5 Vrms (1434 m2 g–1)
9 Vrms (1682 m2 g–1)
Relative pressure (p/p°)
N2
adso
rptio
n (m
mol
g–1
)
1.5 Vrms 4.5 Vrms 9 Vrms
Fig. 4 Activation and surface area of the HKUST-1 MOFs. a The HKUST-1 MOFs that were synthesized under the Rayleigh SAW excitation can be seen tovary in color from a solvent-rich light blue shade to a solvent-poor dark blue shade depending on the input voltage that is coupled into the drop, indicatingthat the crystals are progressively activated simultaneously during the synthesis as the intensity of the acoustic energy into the drop is increased. b N2
sorption isotherms for the HKUST-1 MOFs synthesized at 1.5 Vrms (green dashed line), 4.5 Vrms (red dashed line), 7.5 Vrms (blue dashed line) and 9 Vrms
(purple dashed line) compared to that for bulk HKUST-1 (black solid line)
ba
dc
500 nm
100
5
Cou
nts
(a.u
.)
10 15 20 25 30 35 402� (degrees)
(101)
diff
calc
obs
(002)
100
51.8% BDC
17.3% DMF
0.00.0
0.1 0.2
0.2
0.3 0.4
0.4
0.5 0.6
0.6
0.7 0.8
0.8
0.9 1.0
1.0
N2
adso
rptio
n (m
mol
g–1
)
N2 adsorption
N2 desorption
Relative pressure (p/p°)200 300 400 500 600
Temperature (°C)
80
60
40
20
0
Wei
ght %
Fig. 5 Morphology, orientation, surface area and thermal profile of the Fe-MIL-88B MOFs. a Transmission electron microscope image, b powder XRDpattern (obs; purple) against that simulated from the Cambridge Structural Database53,67 (CCDC-1485530; calc; dark gray) with differences (diff) shownin light gray, c N2 sorption isotherm showing a BET surface area of 8.69m2 g−1 and, d thermal gravimetric analysis (TGA) curves for Fe-MIL-88B MOFssynthesized at an input voltage of 9 Vrms. The latter shows an approximate 17% weight loss of surface adsorbed DMF solvent below 200 °C, followed by afurther 52% weight loss due to decomposition of the 1,4-benzenedicarboxylic acid (BDC) organic linker above 300 °C
ARTICLE NATURE COMMUNICATIONS | https://doi.org/10.1038/s41467-019-10173-5
6 NATURE COMMUNICATIONS | (2019) 10:2282 | https://doi.org/10.1038/s41467-019-10173-5 | www.nature.com/naturecommunications
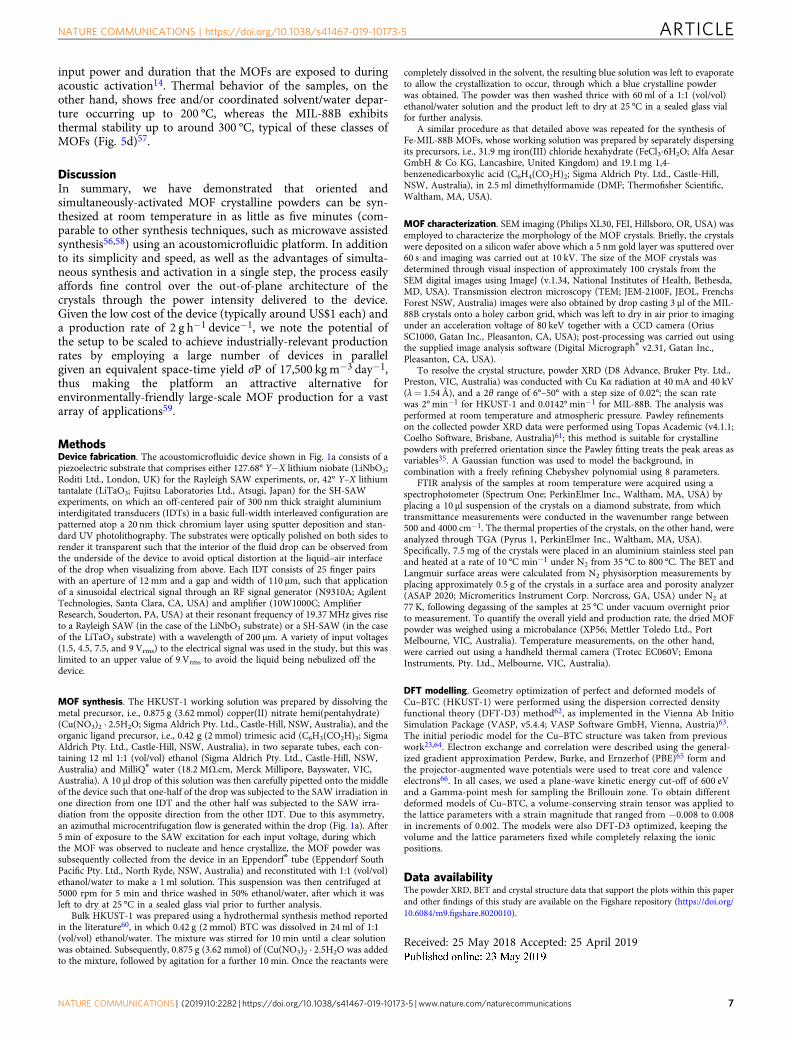
input power and duration that the MOFs are exposed to duringacoustic activation14. Thermal behavior of the samples, on theother hand, shows free and/or coordinated solvent/water depar-ture occurring up to 200 °C, whereas the MIL-88B exhibitsthermal stability up to around 300 °C, typical of these classes ofMOFs (Fig. 5d)57.
DiscussionIn summary, we have demonstrated that oriented andsimultaneously-activated MOF crystalline powders can be syn-thesized at room temperature in as little as five minutes (com-parable to other synthesis techniques, such as microwave assistedsynthesis56,58) using an acoustomicrofluidic platform. In additionto its simplicity and speed, as well as the advantages of simulta-neous synthesis and activation in a single step, the process easilyaffords fine control over the out-of-plane architecture of thecrystals through the power intensity delivered to the device.Given the low cost of the device (typically around US$1 each) anda production rate of 2 g h−1 device−1, we note the potential ofthe setup to be scaled to achieve industrially-relevant productionrates by employing a large number of devices in parallelgiven an equivalent space-time yield σP of 17,500 kg m−3 day−1,thus making the platform an attractive alternative forenvironmentally-friendly large-scale MOF production for a vastarray of applications59.
MethodsDevice fabrication. The acoustomicrofluidic device shown in Fig. 1a consists of apiezoelectric substrate that comprises either 127.68° Y−X lithium niobate (LiNbO3;Roditi Ltd., London, UK) for the Rayleigh SAW experiments, or, 42° Y–X lithiumtantalate (LiTaO3; Fujitsu Laboratories Ltd., Atsugi, Japan) for the SH-SAWexperiments, on which an off-centered pair of 300 nm thick straight aluminiuminterdigitated transducers (IDTs) in a basic full-width interleaved configuration arepatterned atop a 20 nm thick chromium layer using sputter deposition and stan-dard UV photolithography. The substrates were optically polished on both sides torender it transparent such that the interior of the fluid drop can be observed fromthe underside of the device to avoid optical distortion at the liquid–air interfaceof the drop when visualizing from above. Each IDT consists of 25 finger pairswith an aperture of 12 mm and a gap and width of 110 μm, such that applicationof a sinusoidal electrical signal through an RF signal generator (N9310A; AgilentTechnologies, Santa Clara, CA, USA) and amplifier (10W1000C; AmplifierResearch, Souderton, PA, USA) at their resonant frequency of 19.37 MHz gives riseto a Rayleigh SAW (in the case of the LiNbO3 substrate) or a SH-SAW (in the caseof the LiTaO3 substrate) with a wavelength of 200 μm. A variety of input voltages(1.5, 4.5, 7.5, and 9 Vrms) to the electrical signal was used in the study, but this waslimited to an upper value of 9 Vrms to avoid the liquid being nebulized off thedevice.
MOF synthesis. The HKUST-1 working solution was prepared by dissolving themetal precursor, i.e., 0.875 g (3.62 mmol) copper(II) nitrate hemi(pentahydrate)(Cu(NO3)2 ⋅ 2.5H2O; Sigma Aldrich Pty. Ltd., Castle-Hill, NSW, Australia), and theorganic ligand precursor, i.e., 0.42 g (2 mmol) trimesic acid (C6H3(CO2H)3; SigmaAldrich Pty. Ltd., Castle-Hill, NSW, Australia), in two separate tubes, each con-taining 12 ml 1:1 (vol/vol) ethanol (Sigma Aldrich Pty. Ltd., Castle-Hill, NSW,Australia) and MilliQ® water (18.2 MΩ.cm, Merck Millipore, Bayswater, VIC,Australia). A 10 μl drop of this solution was then carefully pipetted onto the middleof the device such that one-half of the drop was subjected to the SAW irradiation inone direction from one IDT and the other half was subjected to the SAW irra-diation from the opposite direction from the other IDT. Due to this asymmetry,an azimuthal microcentrifugation flow is generated within the drop (Fig. 1a). After5 min of exposure to the SAW excitation for each input voltage, during whichthe MOF was observed to nucleate and hence crystallize, the MOF powder wassubsequently collected from the device in an Eppendorf® tube (Eppendorf SouthPacific Pty. Ltd., North Ryde, NSW, Australia) and reconstituted with 1:1 (vol/vol)ethanol/water to make a 1 ml solution. This suspension was then centrifuged at5000 rpm for 5 min and thrice washed in 50% ethanol/water, after which it wasleft to dry at 25 °C in a sealed glass vial prior to further analysis.
Bulk HKUST-1 was prepared using a hydrothermal synthesis method reportedin the literature60, in which 0.42 g (2 mmol) BTC was dissolved in 24 ml of 1:1(vol/vol) ethanol/water. The mixture was stirred for 10 min until a clear solutionwas obtained. Subsequently, 0.875 g (3.62 mmol) of (Cu(NO3)2 ⋅ 2.5H2O was addedto the mixture, followed by agitation for a further 10 min. Once the reactants were
completely dissolved in the solvent, the resulting blue solution was left to evaporateto allow the crystallization to occur, through which a blue crystalline powderwas obtained. The powder was then washed thrice with 60 ml of a 1:1 (vol/vol)ethanol/water solution and the product left to dry at 25 °C in a sealed glass vialfor further analysis.
A similar procedure as that detailed above was repeated for the synthesis ofFe-MIL-88B MOFs, whose working solution was prepared by separately dispersingits precursors, i.e., 31.9 mg iron(III) chloride hexahydrate (FeCl3⋅6H2O; Alfa AesarGmbH & Co KG, Lancashire, United Kingdom) and 19.1 mg 1,4-benzenedicarboxylic acid (C6H4(CO2H)2; Sigma Aldrich Pty. Ltd., Castle-Hill,NSW, Australia), in 2.5 ml dimethylformamide (DMF; Thermofisher Scientific,Waltham, MA, USA).
MOF characterization. SEM imaging (Philips XL30, FEI, Hillsboro, OR, USA) wasemployed to characterize the morphology of the MOF crystals. Briefly, the crystalswere deposited on a silicon wafer above which a 5 nm gold layer was sputtered over60 s and imaging was carried out at 10 kV. The size of the MOF crystals wasdetermined through visual inspection of approximately 100 crystals from theSEM digital images using ImageJ (v.1.34, National Institutes of Health, Bethesda,MD, USA). Transmission electron microscopy (TEM; JEM-2100F, JEOL, FrenchsForest NSW, Australia) images were also obtained by drop casting 3 μl of the MIL-88B crystals onto a holey carbon grid, which was left to dry in air prior to imagingunder an acceleration voltage of 80 keV together with a CCD camera (OriusSC1000, Gatan Inc., Pleasanton, CA, USA); post-processing was carried out usingthe supplied image analysis software (Digital Micrograph® v2.31, Gatan Inc.,Pleasanton, CA, USA).
To resolve the crystal structure, powder XRD (D8 Advance, Bruker Pty. Ltd.,Preston, VIC, Australia) was conducted with Cu Kα radiation at 40 mA and 40 kV(λ= 1.54 Å), and a 2θ range of 6°–50° with a step size of 0.02°; the scan ratewas 2° min−1 for HKUST-1 and 0.0142° min−1 for MIL-88B. The analysis wasperformed at room temperature and atmospheric pressure. Pawley refinementson the collected powder XRD data were performed using Topas Academic (v4.1.1;Coelho Software, Brisbane, Australia)61; this method is suitable for crystallinepowders with preferred orientation since the Pawley fitting treats the peak areas asvariables35. A Gaussian function was used to model the background, incombination with a freely refining Chebyshev polynomial using 8 parameters.
FTIR analysis of the samples at room temperature were acquired using aspectrophotometer (Spectrum One; PerkinElmer Inc., Waltham, MA, USA) byplacing a 10 μl suspension of the crystals on a diamond substrate, from whichtransmittance measurements were conducted in the wavenumber range between500 and 4000 cm−1. The thermal properties of the crystals, on the other hand, wereanalyzed through TGA (Pyrus 1, PerkinElmer Inc., Waltham, MA, USA).Specifically, 7.5 mg of the crystals were placed in an aluminium stainless steel panand heated at a rate of 10 °C min−1 under N2 from 35 °C to 800 °C. The BET andLangmuir surface areas were calculated from N2 physisorption measurements byplacing approximately 0.5 g of the crystals in a surface area and porosity analyzer(ASAP 2020; Micromeritics Instrument Corp. Norcross, GA, USA) under N2 at77 K, following degassing of the samples at 25 °C under vacuum overnight priorto measurement. To quantify the overall yield and production rate, the dried MOFpowder was weighed using a microbalance (XP56; Mettler Toledo Ltd., PortMelbourne, VIC, Australia). Temperature measurements, on the other hand,were carried out using a handheld thermal camera (Trotec EC060V; EmonaInstruments, Pty. Ltd., Melbourne, VIC, Australia).
DFT modelling. Geometry optimization of perfect and deformed models ofCu–BTC (HKUST-1) were performed using the dispersion corrected densityfunctional theory (DFT-D3) method62, as implemented in the Vienna Ab InitioSimulation Package (VASP, v5.4.4; VASP Software GmbH, Vienna, Austria)63.The initial periodic model for the Cu–BTC structure was taken from previouswork23,64. Electron exchange and correlation were described using the general-ized gradient approximation Perdew, Burke, and Ernzerhof (PBE)65 form andthe projector-augmented wave potentials were used to treat core and valenceelectrons66. In all cases, we used a plane-wave kinetic energy cut-off of 600 eVand a Gamma-point mesh for sampling the Brillouin zone. To obtain differentdeformed models of Cu–BTC, a volume-conserving strain tensor was applied tothe lattice parameters with a strain magnitude that ranged from −0.008 to 0.008in increments of 0.002. The models were also DFT-D3 optimized, keeping thevolume and the lattice parameters fixed while completely relaxing the ionicpositions.
Data availabilityThe powder XRD, BET and crystal structure data that support the plots within this paperand other findings of this study are available on the Figshare repository (https://doi.org/10.6084/m9.figshare.8020010).
Received: 25 May 2018 Accepted: 25 April 2019
NATURE COMMUNICATIONS | https://doi.org/10.1038/s41467-019-10173-5 ARTICLE
NATURE COMMUNICATIONS | (2019) 10:2282 | https://doi.org/10.1038/s41467-019-10173-5 | www.nature.com/naturecommunications 7
References1. Zhou, H.-C., Long, J. R. & Yaghi, O. M. Introduction to metal–organic
frameworks. Chem. Rev. 112, 673–674 (2012).2. Furukawa, H., Cordova, K. E., O’Keeffe, M. & Yaghi, O. M. The chemistry
and applications of metal-organic frameworks. Science 341, 1230444(2013).
3. Rosi, N. L. et al. Hydrogen storage in microporous metal-organic frameworks.Science 300, 1127–1129 (2003).
4. Yaghi, O. M. et al. Reticular synthesis and the design of new materials.Nature 423, 705–714 (2003).
5. Chaikittisilp, W. et al. Nanoporous carbons through direct carbonizationof a zeolitic imidazolate framework for supercapacitor electrodes. Chem.Commun. 48, 7259–7261 (2012).
6. Li, J. et al. Metal-organic frameworks as micromotors with tunable enginesand brakes. J. Am. Chem. Soc. 139, 611–614 (2017).
7. Stassen, I. et al. An updated roadmap for the integration of metal-organicframeworks with electronic devices and chemical sensors. Chem. Soc. Rev. 46,3185–3241 (2017).
8. Wu, M.-X. & Yang, Y.-W. Metal-organic framework (MOF)-based drug/cargodelivery and cancer therapy. Adv. Mater. 29, 1606134 (2017).
9. Stock, N. & Biswas, S. Synthesis of metal-organic frameworks (MOFs): Routesto various MOF topologies, morphologies, and composites. Chem. Rev. 112,933–969 (2012).
10. Cliffe, M. J. et al. Correlated defect nanoregions in a metal–organicframework. Nat. Commun. 5, 4176 (2014).
11. Sholl, D. S. & Lively, R. P. Defects in metal–organic frameworks: Challenge oropportunity? J. Phys. Chem. Lett. 6, 3437–3444 (2015).
12. Qiu, S., Xue, M. & Zhu, G. Metal-organic framework membranes: fromsynthesis to separation application. Chem. Soc. Rev. 43, 6116–6140(2014).
13. Zacher, D., Schmid, R., Wöll, C. & Fischer, R. A. Surface chemistry ofmetal–organic frameworks at the liquid–solid interface. Angew. Chem. Int. Ed.50, 176–199 (2011).
14. Farha, O. K. & Hupp, J. T. Rational design, synthesis, purification, andactivation of metal–organic framework materials. Acc. Chem. Res. 43,1166–1175 (2010).
15. Huo, J., Brightwell, M., El Hankari, S., Garai, A. & Bradshaw, D. Aversatile, industrially relevant, aqueous room temperature synthesis ofHKUST-1 with high space-time yield. J. Mater. Chem. A 1, 15220–15223(2013).
16. Majano, G. & Pérez-Ramrez, J. Scalable room-temperature conversion ofcopper(II) hydroxide into HKUST-1 (Cu3(btc)2. Adv. Mater. 25, 1052–1057(2013).
17. Li, H., Friend, J. R. & Yeo, L. Y. Surface acoustic wave concentrationof particle and bioparticle suspensions. Biomed. Microdev. 9, 647–656(2007).
18. Shilton, R., Tan, M. K., Yeo, L. Y. & Friend, J. R. Particle concentration andmixing in microdrops driven by focused surface acoustic waves. J. Appl. Phys.104, 014910 (2008).
19. Raghavan, R. V., Friend, J. R. & Yeo, L. Y. Particle concentrationvia acoustically driven microcentrifugation: microPIV flow visualizationand numerical modelling studies. Microfluid. Nanofluidics 8, 73 (2009).
20. Glass, N. R., Shilton, R. J., Chan, P. P. Y., Friend, J. R. & Yeo, L. Y.Miniaturized lab-on-a-disc (miniLOAD). Small 8, 1881–1888 (2012).
21. Tan, M. K., Siddiqi, A. & Yeo, L. Y. A facile and flexible method for on-demand directional speed tunability in the miniaturised lab-on-a-disc. Sci.Rep. 7, 6652 (2017).
22. Shilton, R. J., Yeo, L. Y. & Friend, J. R. Quantification of surface acoustic waveinduced chaotic mixing-flows in microfluidic wells. Sens. Actuators B: Chem.160, 1565–1572 (2011).
23. Chui, S. S.-Y., Lo, S. M.-F., Charmant, J. P. H., Orpen, A. G. & Williams, I. D.A chemically functionalizable nanoporous material [Cu3(TMA)2(H2O)3]n.Science 283, 1148–1150 (1999).
24. Chen, B. et al. A luminescent metal–organic framework with Lewis basicpyridyl sites for the sensing of metal ions. Angew. Chem. Int. Ed. 48, 500–503(2006).
25. Prestipino, C. et al. Local structure of framework Cu(II) in HKUST-1metallorganic framework: Spectroscopic characterization upon activation andinteraction with adsorbates. Chem. Mater. 18, 1337–1346 (2006).
26. Toyao, T. et al. Positioning of the HKUST-1 metal-organic framework(Cu3(BTC)2) through conversion from insoluble Cu-based precursors. Inorg.Chem. Front. 2, 434–441 (2015).
27. Gascon, J., Aguado, S. & Kapteijn, F. Manufacture of dense coatings ofCu3(BTC)2 (HKUST-1) on α-alumina. Microporous Mesoporous Mater. 113,132–138 (2008).
28. Blamey, J., Yeo, L. Y. & Friend, J. R. Microscale capillary waveturbulence excited by high frequency vibration. Langmuir 29, 3835–3845(2013).
29. Lighthill, S. J. Acoustic streaming. J. Sound Vib. 61, 391–418 (1978).30. Thompson, C., Mulpur, A., Mehta, V. & Chandra, K. Transition to chaos
in acoustically driven flows. J. Acoust. Soc. Am. 90, 2097–2108 (1991).31. Pohorecki, R. & Bałdyga, J. The use of a new model of micromixing for
determination of crystal size in precipitation. Chem. Eng. Sci. 38, 79–83(1983).
32. Richardson, J. J. et al. Controlling the growth of metal–organic frameworksusing different gravitational forces. Eur. J. Inorg. Chem. 2016, 4499–4504(2016).
33. Kolmogorov, A. N. Dissipation of energy in locally isotropicturbulence. Dokl. Akad. Nauk SSSR 32, 16–18 (1941).
34. Ahmed, H., Lee, L., Darmanin, C. & Yeo, L. Y. A novel acoustomicrofluidicnebulization technique yielding new crystallization morphologies. Adv. Mater.30, 1602040 (2018).
35. Pawley, G. S. Unit-cell refinement from powder diffraction scans. J. Appl.Crystallogr. 14, 357–361 (1981).
36. Nijem, N. et al. HKUST-1 thin film layer-by-layer liquid phase epitaxialgrowth: Film properties and stability dependence on layer number. Cryst.Growth Des. 15, 2948–2957 (2015).
37. Summerfield, A., Cebula, I., Schrder, M. & Beton, P. H. Nucleation and earlystages of layer-by-layer growth of metal organic frameworks on surfaces.J. Phys. Chem. C. 119, 23544–23551 (2015).
38. Deegan, R. D. et al. Capillary flow as the cause of ring stains from dried liquiddrops. Nature 389, 827–829 (1997).
39. de Gennes, P. The dynamics of reactive wetting on solid surfaces. PhysicaA Stat. Mech. Appl. 249, 196–205 (1998).
40. Hu, H. & Larson, R. G. Marangoni effect reverses coffee-ring depositions.J. Phys. Chem. B 110, 7090–7094 (2006).
41. Ristenpart, W. D., Kim, P. G., Domingues, C., Wan, J. & Stone, H. A.Influence of substrate conductivity on circulation reversal in evaporatingdrops. Phys. Rev. Lett. 99, 234502 (2007).
42. Noblin, X., Buguin, A. & Brochard-Wyart, F. Vibrated sessile drops:Transition between pinned and mobile contact line oscillations. Eur. Phys. J. E14, 395–404 (2004).
43. Mampallil, D. et al. Acoustic suppression of the coffee-ring effect. Soft Matter11, 7207–7213 (2015).
44. Mhatre, S., Zigelman, A., Abezgauz, L. & Manor, O. Influence of apropagating megahertz surface acoustic wave on the pattern depositionof solute mass off an evaporating solution. Langmuir 32, 9611–9618(2016).
45. Josten, E. et al. Superlattice growth and rearrangement duringevaporation-induced nanoparticle self-assembly. Sci. Rep. 7, 2802 (2017).
46. Auld, B. A. Acoustic Fields and Waves in Solids. Vol. 1&2 (Wiley, New York,1973).
47. Miansari, M., Qi, A., Yeo, L. Y. & Friend, J. R. Vibration-induceddeagglomeration and shear-induced alignment of carbon nanotubes in air.Adv. Funct. Mater. 25, 1014–1023 (2014).
48. Kotsuki, K., Obata, S. & Saiki, K. Electric-field-assisted position andorientation control of organic single crystals. Langmuir 30, 14286–14291(2014).
49. Klimakow, M., Klobes, P., Rademann, K. & Emmerling, F. Characterizationof mechanochemically synthesized MOFs. Microporous Mesoporous Mater.154, 113–118 (2012).
50. Surblé, S., Serre, C., Mellot-Draznieks, C., Millange, F. & Férey, G. A newisoreticular class of metal-organic-frameworks with the MIL-88 topology.Chem. Commun.3, 284–286 (2006).
51. Serre, C. et al. Role of solvent-host interactions that lead to very large swellingof hybrid frameworks. Science 315, 1828–1831 (2007).
52. Scherb, C., Koehn, R. & Bein, T. Sorption behavior of an oriented surface-grown MOF-film studied by in situ x-ray diffraction. J. Mater. Chem. 20,3046–3051 (2010).
53. Scherb, C., Schdel, A. & Bein, T. Directing the structure of metal-organicframeworks by oriented surface growth on an organic monolayer. Angew.Chem. Int. Ed. 120, 5861–5863 (2008).
54. Kim, D., Lee, G., Oh, S. & Oh, M. Unbalanced MOF-on-MOF growth for theproduction of a lopsided core-shell of MIL-88B@MIL-88A with mismatchedcell parameters. Chem. Commun. 55, 43–46 (2019).
55. Serre, C. et al. Very large breathing effect in the first nanoporouschromium(III)-based`solids: MIL-53 or CrIII(OH)·{O2C–C6H4–CO2}·{HO2C–C6H4–CO2H}x·H2Oy. J. Am. Chem. Soc. 124, 13519–13526(2002).
56. Ma, M. et al. Iron-based metal–organic frameworks MIL-88B and NH2-MIL-88B: High quality microwave synthesis and solvent-induced lattice“breathing”. Cryst. Growth Des. 13, 2286–2291 (2013).
57. Horcajada, P. et al. How linker’s modification controls swelling propertiesof highly flexible iron(III) dicarboxylates MIL-88. J. Am. Chem. Soc. 133,17839–17847 (2011).
ARTICLE NATURE COMMUNICATIONS | https://doi.org/10.1038/s41467-019-10173-5
8 NATURE COMMUNICATIONS | (2019) 10:2282 | https://doi.org/10.1038/s41467-019-10173-5 | www.nature.com/naturecommunications
58. Ni, Z. & Masel, R. I. Rapid production of metal–organic frameworks viamicrowave-assisted solvothermal synthesis. J. Am. Chem. Soc. 128,12394–12395 (2006).
59. Rubio-Martinez, M. et al. New synthetic routes towards MOF productionat scale. Chem. Soc. Rev. 46, 3453–3480 (2017).
60. Schlichte, K., Kratzke, T. & Kaskel, S. Improved synthesis, thermal stabilityand catalytic properties of the metal-organic framework compoundCu3(BTC)2. Microporous Mesoporous Mater. 73, 81–88 (2004).
61. Coelho, A. TOPAS and TOPAS-Academic: an optimization programintegrating computer algebra and crystallographic objects written in C++. J.Appl. Crystallogr. 51, 210–218 (2018).
62. Grimme, S., Ehrlich, S. & Goerigk, L. Effect of the damping function indispersion corrected density functional theory. J. Comput. Chem. 32,1456–1465 (2011).
63. Kresse, G. & Hafner, J. Ab initio molecular dynamics for open-shell transitionmetals. Phys. Rev. B 48, 13115–13118 (1993).
64. Babarao, R., Jiang, J. & Sandler, S. I. Molecular simulations for adsorptiveseparation of CO2/CH4 mixture in metal-exposed, catenated, and chargedmetal–organic frameworks. Langmuir 25, 5239–5247 (2009).
65. Perdew, J. P., Burke, K. & Ernzerhof, M. Generalized gradient approximationmade simple. Phys. Rev. Lett. 77, 3865–3868 (1996).
66. Kresse, G. & Joubert, D. From ultrasoft pseudopotentials to the projectoraugmented-wave method. Phys. Rev. B 59, 1758–1775 (1999).
67. Groom, C. R., Bruno, I. J., Lightfoot, M. P. & Ward, S. C. The CambridgeStructural Database. Acta Crystallogr. B72, 171–179 (2016).
AcknowledgementsThe authors acknowledge access to the facilities at the RMIT Microscopy & Micro-analysis Research Facility (RMMF), the RMIT Integrated Victorian X-Ray StructuralDetermination & Materials Characterisation Facility and the helium ion microscope atthe Materials Characterisation and Fabrication platform at the University of Melbourne.They also thank Mr. Frank Antolasic and Ms. Nadia Zakhartchouk for technical assis-tance. A.R.R. and L.L. are grateful for support through RMIT Vice-Chancellor Post-doctoral Research Fellowships. R.B. acknowledges use of the National ComputingInfrastructure (NCI) and the Pawsey supercomputing facilities and funding from theAustralian Research Council (ARC) for a DECRA fellowship (DE160100987). LYY isfunded through an ARC Future Fellowship (FT130100672) and an ARC DiscoveryProject (DP170101061).
Author contributionsH.A., A.R.R., J.J.R., and L.Y.Y. conceived the original research idea. H.A. carried out thedevice development, sample synthesis and characterization with assistance in data ana-lysis from A.R.R., J.J.R., L.L., and L.Y.Y. J.J.R., and E.L.H.M. conducted the microscopy.R.B. performed the DFT simulations, while L.K.M. carried out Pawley refinement of thedata. All authors contributed, discussed, and wrote the manuscript.
Additional informationSupplementary Information accompanies this paper at https://doi.org/10.1038/s41467-019-10173-5.
Competing interests: The authors declare no competing interests.
Reprints and permission information is available online at http://npg.nature.com/reprintsandpermissions/
Journal peer review information: Nature Communications thanks the anonymousreviewers for their contribution to the peer review of this work. Peer reviewer reports areavailable.
Publisher’s note: Springer Nature remains neutral with regard to jurisdictional claims inpublished maps and institutional affiliations.
Open Access This article is licensed under a Creative CommonsAttribution 4.0 International License, which permits use, sharing,
adaptation, distribution and reproduction in any medium or format, as long as you giveappropriate credit to the original author(s) and the source, provide a link to the CreativeCommons license, and indicate if changes were made. The images or other third partymaterial in this article are included in the article’s Creative Commons license, unlessindicated otherwise in a credit line to the material. If material is not included in thearticle’s Creative Commons license and your intended use is not permitted by statutoryregulation or exceeds the permitted use, you will need to obtain permission directly fromthe copyright holder. To view a copy of this license, visit http://creativecommons.org/licenses/by/4.0/.
© The Author(s) 2019
NATURE COMMUNICATIONS | https://doi.org/10.1038/s41467-019-10173-5 ARTICLE
NATURE COMMUNICATIONS | (2019) 10:2282 | https://doi.org/10.1038/s41467-019-10173-5 | www.nature.com/naturecommunications 9