Acoustic tracking and aerial surveys of juvenile white sharks in the Hunter-Central Rivers Catchment...
50
L Acou B ustic tracking and aerial sur white sharks in the Hunter Catchment Management A Final Report Projects H B. D. Bruce 1 , R. W. Bradford 1 , B. Hu Gallen, C. 3 , Harasti, D 1 CSIRO Wealth from Oceans Flagship 2 Hunter-Central Rivers Catchment Management Auth 3 NSW Department of Primary Industries 4 University of Technology Sydney rveys of juvenile r-Central Rivers Authority region HCR11_422 + 423 ughes 2 , R. Carraro 2 , D. 3 & W. Gladstone 4 June 2013 hority
Transcript of Acoustic tracking and aerial surveys of juvenile white sharks in the Hunter-Central Rivers Catchment...
L
Acoustic tracking and aerial surveys of juve
B.
Acoustic tracking and aerial surveys of juvewhite sharks in the HunterCatchment Management Authority region
Final Report Projects HCR11_422 + 423
B. D. Bruce1, R. W. Bradford1, B. HughesGallen, C.3, Harasti, D.
1 CSIRO Wealth from Oceans Flagship 2Hunter-Central Rivers Catchment Management Authority3NSW Department of Primary Industries 4University of Technology Sydney
Acoustic tracking and aerial surveys of juvenile white sharks in the Hunter-Central Rivers Catchment Management Authority region
Projects HCR11_422 + 423
B. Hughes2, R. Carraro2, , Harasti, D.3 & W. Gladstone4
June 2013
Central Rivers Catchment Management Authority

Acoustic tracking and aerial surveys of juvenile white sharks in the Hunter-Central Rivers Catchment Management Authority
region
Final Report Projects HCR11_422 + 423
B. D. Bruce, R. W. Bradford, B. Hughes, R. Carraro,
Gallen, C., Harasti, D. & W. Gladstone
June 2013
Contents Summary ................................................................................................................................................. 1
Introduction ............................................................................................................................................. 2
Objectives ............................................................................................................................................... 4
Acoustic tracking project .................................................................................................................... 4
Aerial survey project ........................................................................................................................... 4
Methods .................................................................................................................................................. 5
Study area............................................................................................................................................ 5
Field methods ...................................................................................................................................... 6
Acoustic tagging and tracking......................................................................................................... 6
Aerial surveys ................................................................................................................................. 7
Data analysis ....................................................................................................................................... 9
Acoustic data ................................................................................................................................... 9
Aerial surveys ............................................................................................................................... 10
Estimates of shark abundance ....................................................................................................... 11
Results ................................................................................................................................................... 11
Acoustic and satellite tracking .......................................................................................................... 11
Size of sharks sighted .................................................................................................................... 12
Satellite tracking results ................................................................................................................ 12
Shark 12.1 ..................................................................................................................................... 13
Shark 12.2 ..................................................................................................................................... 14
Shark 12.3 ..................................................................................................................................... 14
Shark 12.4 ..................................................................................................................................... 14
Shark 12.5 ..................................................................................................................................... 14
Acoustic detection summary ......................................................................................................... 16
Time detected inside Port Stephens estuary .................................................................................. 18
Aerial surveys ............................................................................................................................... 23
Corrected abundance estimates ..................................................................................................... 29
Discussion ......................................................................................................................................... 32
Acoustic and satellite tagging ........................................................................................................... 32
Aerial surveys ................................................................................................................................... 33
Acknowledgements ............................................................................................................................... 35
References ............................................................................................................................................. 35
Appendix 1: Aerial survey fieldwork procedures ................................................................................. 38
Introduction ........................................................................................................................................... 39
Definitions used in the survey ............................................................................................................... 39
Survey staff and main responsibilities .................................................................................................. 40
Survey design ........................................................................................................................................ 40
Altitude and speed ............................................................................................................................. 41
Survey area and spatial coverage ...................................................................................................... 41
Daily start time .................................................................................................................................. 41
Survey Path ....................................................................................................................................... 41
Helicopter-based surveys .............................................................................................................. 41
Minimum survey conditions ............................................................................................................. 42
Survey procedures ................................................................................................................................. 42
Search recording procedure - aerial survey data sheet ...................................................................... 42
Survey data sheet .......................................................................................................................... 42
Environmental observations .......................................................................................................... 43
Details of survey duties of pilot ............................................................................................................ 43
Details of survey duties of data recorder(s) .......................................................................................... 44
Following survey procedures ............................................................................................................ 44
Recording procedures ....................................................................................................................... 44
Quality of data recorded .................................................................................................................... 44
Data entry and delivery ..................................................................................................................... 44
Providing survey information to SLSA ............................................................................................ 44
Species codes for the aerial survey ................................................................................................... 44
Useful websites for environmental data ............................................................................................ 45
1
Summary White sharks are a listed threatened species in several regions of the world including the United States, South Africa, Malta, Namibia, New Zealand and Australia, as well as being listed on Appendix II of the Convention for International Trade in Endangered Species (CITES) and under the Convention on Migratory Species (CMS). In Australian waters, white sharks have been protected since 1996 and a National Recovery Plan was established in 2002 and reviewed in 2009. The primary objective of this Plan is to recover white shark numbers in Australian waters to a level that will see the species removed from the threatened species schedules under Australian legislation. However, there are no currently reliable estimates of population size or trend and thus no measure of whether recovery actions to date have been effective. A lack of scientifically credible information on population status is one of the key issues limiting the efficacy of conservation efforts for the species in Australian waters because the impacts of current recovery efforts cannot be adequately assessed. In addition, there are regular statements about increasing or decreasing shark numbers that cannot be confirmed or refuted due to a lack of useful data. These statements are popularised by the media, serve to confuse the public and policy makers, and risk actions by Government that may be ill-advised as to the true status of the species. CSIRO has carried out a tagging program on juvenile white sharks in the region each year since 2007. The purpose of the program is to establish the patterns of residency and habitat use by juvenile white sharks when they are present in the region and contribute information on the overall movement and population dynamics of juvenile white sharks along the east coast of Australia. Strategic objectives are to determine the survival rate of juveniles, the survival rate of adults and, in conjunction with aerial surveys, provide estimates of abundance of juveniles – all of which will contribute to a population model and an analysis of population status for the species in eastern Australia. This report details the outcomes of the 2012 juvenile white shark survey program as part of this strategic objective under combined funding from the Hunter-Central Rivers Catchment Management Authority (HCRCMA), CSIRO Marine and Atmospheric Research (CMAR) and the University of Technology – Sydney (UTS). This report combines the results of HCRCMA projects HCR11-422 (Acoustic tracking of juvenile white sharks in the HCRCMA region) and HCR11-423 (Aerial surveys of juvenile white sharks in the HCRCMA region). The patterns of movement and residency of satellite and acoustic tagged juvenile white sharks in the Port Stephens area during 2012–2013 was consistent to that observed during previous years. The mean estimated residency period to the nursery area was approximately 70 days. During this period of residency, sharks occupied various habitats including deeper areas out to mid-shelf depths, island habitats, periods inside the Port Stephens estuary and residency near to the surf zone. On average, sharks recorded approximately 20% of their nursery area residency time near to the surf zone of Bennett’s Beach. This near surf zone residency during 2012–2013 was lower than previously estimated for the same beach in 2010–2011 (36.5 %) and may indicate a degree of interannual variability in this parameter or an interannual variability in individual beach use. The latter is also indicated by both aerial survey data and vessel-based observations which suggest a difference between the abundance of sharks between years on individual beaches. Several tagged sharks spent relatively short but significant periods inside Port Stephens estuary (the bay) and sharks were detected at all bay receivers including off Corlette, approximately 7.5 km inside the heads. Sharks were most frequently detected on the northern side of the bay in the vicinity of Jimmy’s Beach. This indicates that habitat use within the bay is significant albeit at a much lower level to habitat outside the bay. The aerial surveys indicated that although there is a seasonal signal to the presence of juvenile white sharks in the Port Stephens nursery area, sharks may occur in the area at any time of the year.

2
Corrected estimates indicate that up to approximately 250 juvenile white sharks may have been present in the nursery area on survey days with peak abundances occurring in October-November as has been previously observed for the region. This study provides further confirmation that the Port Stephens region is a key nursery area for juvenile white sharks in eastern Australia. Continuing an integrated tagging and aerial survey program as well as further refinement of the correction factors applied to aerial survey data is recommended so that juvenile abundance and survival rates can be estimated. These data can then be incorporated into population models to effectively monitor the status of the species.
Introduction White sharks are a listed threatened species in several regions of the world including the United States, South Africa, Malta, Namibia, New Zealand and Australia, as well as being listed on Appendix II of the Convention for International Trade in Endangered Species (CITES) and under the Convention on Migratory Species (CMS) (reviewed in Bruce 2008). In Australian waters, white sharks have been protected since 1996 (Malcolm et al. 2001) and a National Recovery Plan was established in 2002 and reviewed in 2009. The primary objective of this Plan is to recover white shark numbers in Australian waters to a level that will see the species removed from the threatened species schedules under Australian legislation. However, there are no currently reliable estimates of population size or trend and thus no measure of whether recovery actions to date have been effective (Bruce and Leedman 2009). A lack of scientifically credible information on population status is one of the key issues limiting the efficacy of conservation efforts for the species in Australian waters because the impacts of current recovery efforts cannot be adequately assessed. In addition, there are regular statements about increasing or decreasing shark numbers that cannot be confirmed or refuted due to a lack of useful data. These statements are popularised by the media, serve to confuse the public and policy makers, and risk actions by Government that may be ill-advised as to the true status of the species. Historically, most research on white sharks in Australian waters has focussed on sub-adult and adults of sizes greater than 3.0 m in length (Bruce 1992, Strong et al. 1992, Malcolm et al. 2001, Bruce et al. 2006, Robbins 2007, Robbins and Booth 2012, Bruce and Bradford 2013a, Semmens et al. 2013, Huveneers et al. 2013). However, available data across their global range suggest that juveniles (≤ 3.0 m, sensu stricto Bruce and Bradford 2012) may be encountered close to shore in areas that make them vulnerable to bycatch in commercial and recreational fisheries (Casey and Pratt 1985, Klimley 1985, Weng et al. 2007, Lowe et al. 2012) and increase the risk of encounter with beach users (Bruce and Bradford 2008). Recent research has identified evidence for eastern and western populations of white sharks in Australian waters divided longitudinally by Bass Strait (Blower et al. 2012). Electronic tagging studies have located two nursery areas for juvenile white sharks in eastern Australia; the Port Stephens region of New South Wales (NSW) and the 90 Mile Beach–Corner Inlet region of eastern Victoria (Bruce and Bradford 2008, 2011). The more accessible of these two sites is a 50–60 km stretch of coastline centred on the Port Stephens area where sharks occupy habitat between the near-shore out to approximately the 120 m depth contour when seasonally resident (Bruce and Bradford 2012). However, in this area they also spend a significant amount of time in the surf zone in water depths of 1–5 m where they are readily observable and frequently encountered by the public. The predictable aggregation of juvenile white sharks in the Port Stephens region and their occupancy of the surf zone environment provide an unprecedented opportunity to monitor their abundance using aerial surveys. The connectivity between this area, the Victorian nursery area and movements spanning the east coast range of the species suggest that monitoring the Port Stephens nursery area may provide useful insights into the status of white sharks in eastern Australia.
3
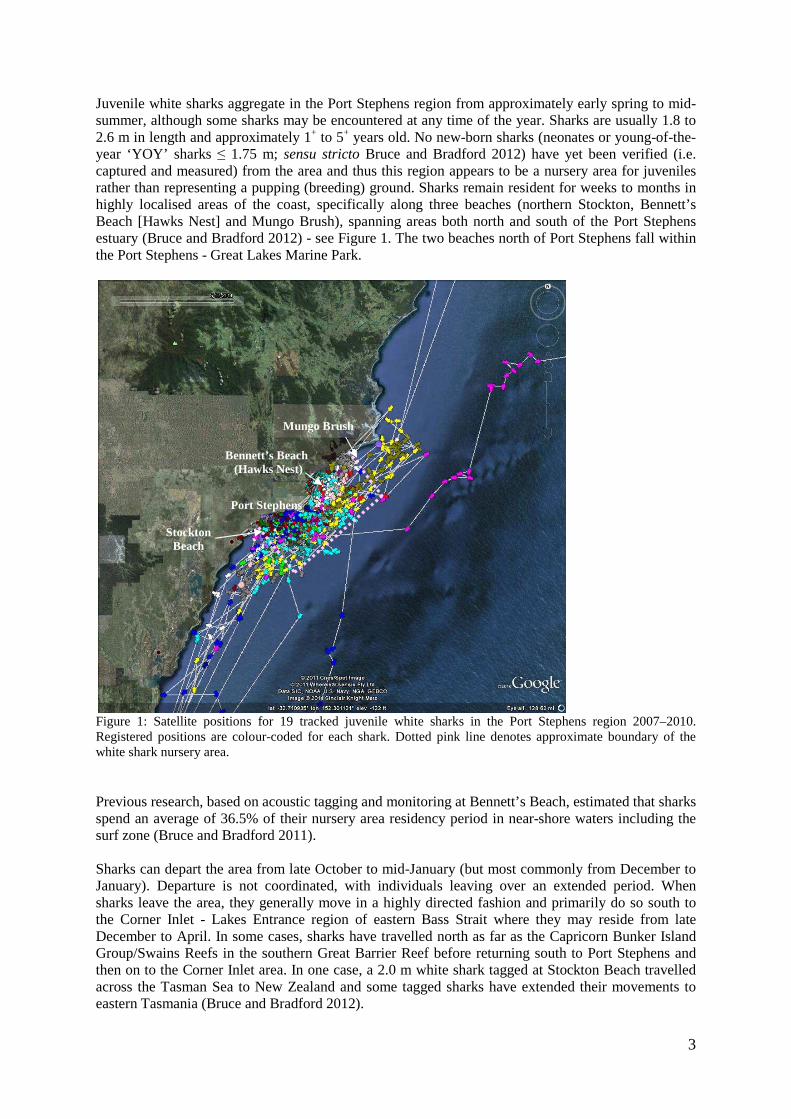
Juvenile white sharks aggregate in the Port Stephens region from approximately early spring to mid-summer, although some sharks may be encountered at any time of the year. Sharks are usually 1.8 to 2.6 m in length and approximately 1+ to 5+ years old. No new-born sharks (neonates or young-of-the-year ‘YOY’ sharks ≤ 1.75 m; sensu stricto Bruce and Bradford 2012) have yet been verified (i.e. captured and measured) from the area and thus this region appears to be a nursery area for juveniles rather than representing a pupping (breeding) ground. Sharks remain resident for weeks to months in highly localised areas of the coast, specifically along three beaches (northern Stockton, Bennett’s Beach [Hawks Nest] and Mungo Brush), spanning areas both north and south of the Port Stephens estuary (Bruce and Bradford 2012) - see Figure 1. The two beaches north of Port Stephens fall within the Port Stephens - Great Lakes Marine Park.
Figure 1: Satellite positions for 19 tracked juvenile white sharks in the Port Stephens region 2007–2010. Registered positions are colour-coded for each shark. Dotted pink line denotes approximate boundary of the white shark nursery area. Previous research, based on acoustic tagging and monitoring at Bennett’s Beach, estimated that sharks spend an average of 36.5% of their nursery area residency period in near-shore waters including the surf zone (Bruce and Bradford 2011). Sharks can depart the area from late October to mid-January (but most commonly from December to January). Departure is not coordinated, with individuals leaving over an extended period. When sharks leave the area, they generally move in a highly directed fashion and primarily do so south to the Corner Inlet - Lakes Entrance region of eastern Bass Strait where they may reside from late December to April. In some cases, sharks have travelled north as far as the Capricorn Bunker Island Group/Swains Reefs in the southern Great Barrier Reef before returning south to Port Stephens and then on to the Corner Inlet area. In one case, a 2.0 m white shark tagged at Stockton Beach travelled across the Tasman Sea to New Zealand and some tagged sharks have extended their movements to eastern Tasmania (Bruce and Bradford 2012).
Port Stephens
Bennett’s Beach (Hawks Nest)
Mungo Brush
Stockton Beach
4
CSIRO has carried out a tagging program on juvenile white sharks in the region each year since 2007 (see Bradford et al. 2012, Bruce and Bradford 2012, 2011, 2008). The purpose of the program is to establish the patterns of residency and habitat use by juvenile white sharks when they are present in the region and contribute information on the overall movement and population dynamics of juvenile white sharks along the east coast of Australia. Strategic objectives are to determine the survival rate of juveniles, the survival rate of adults and, in parallel with aerial surveys, provide estimates of abundance of juveniles – all of which will contribute to a population model and an analysis of population status for the species in eastern Australia. This report details the outcomes of the 2012 juvenile white shark survey program as part of this strategic objective under combined funding from the Hunter-Central Rivers Catchment Management Authority (HRCMA), CSIRO Marine and Atmospheric Research (CMAR) and the University of Technology – Sydney (UTS). This report combines the results of HCRCMA projects HCR11-422 (Acoustic tracking of juvenile white sharks in the HCRCMA region) and HCR11-423 (Aerial surveys of juvenile white sharks in the HCRCMA region).
Objectives The objectives of the 2012 program were to:
Acoustic tracking project
Undertake the first year of an increased tagging effort to increase the likelihood that the population trend and species recovery can be assessed. Continue to combine acoustic data with aerial survey data to help build a more accurate estimate of white shark numbers by revising and applying correction factors initially estimated by Bruce and Bradford (2011). Examine residency patterns for all tagged sharks that are detected and compare data to previous years to examine their frequency of return to the Port Stephens area and their broader Australian movement patterns.
Aerial survey project
Undertake a full 12-month aerial survey program with a higher frequency of surveys in the summer months to confirm the peak period of occupancy by juvenile white sharks in the Port Stephens region. Collect baseline information that will assist in assessing whether the white shark population is recovering. Compare data collected in this project with results from the 2010/11 aerial survey project, where possible, and identify any significant changes in white shark numbers observed and changes in the specific locations used by juvenile white sharks. Generate data that can be combined with the acoustic tracking data to help build a more accurate estimate of juvenile white shark numbers with overlaps in aerial and acoustic survey times allowing correction factors to be calculated for both.
5
Methods
Study area
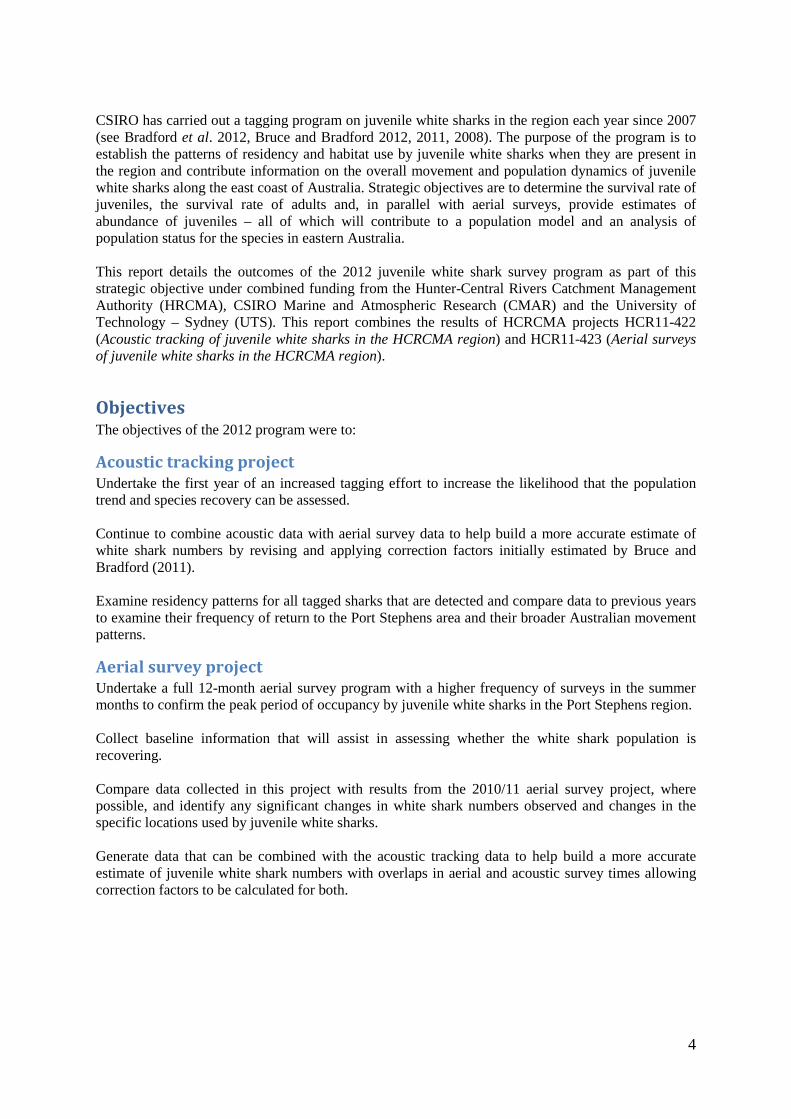
The Port Stephens region of central New South Wales (32.71o S 152.19o E) is characterised by prominent rocky headlands separated by long sandy beaches. The area contains the largest drowned river valley in NSW (Port Stephens estuary) and a series of islands and outcrops including Broughton Island which is the largest island on the NSW coast (Figure 2). The 30 km-long Stockton Beach immediately to the south of Port Stephens is backed by one of the largest mobile sand dune systems in eastern Australia (Figure 3). Hawks Nest, immediately north of the Port Stephens estuary, is part of a 44 km beach (including Mungo Beach) running north from Yacaaba Head to Sugarloaf Point/Seal Rocks, broken only by a small headland (Little Gibba) inshore of Broughton Island and the northern headlands of Yagon Gibba and Treachery Head. Sugarloaf Point represents a significant change in trajectory of this section of the NSW coast from a south-easterly aspect to north-south and is the general location for where the East Australian Current (EAC) separates from the coast into the Tasman Sea (Tranter et al. 1986). The combination of this separation and architecture of the coast produces significant upwelling events in the area under favourable conditions, the productive waters of which may be retained over the shelf and inshore areas of the Stockton Bight off Newcastle to the south of the Port Stephens estuary (Oke and Middleton 2001). The study area for tagging and acoustic tracking was focussed along a 13.5 km section of beach off Bennett’s Beach (Hawks Nest) immediately north of the Port Stephens estuary between Yacaaba Head and Little Gibba. Unless otherwise stated, all references to ‘the beach’ in the context of the tagging and acoustic tracking study refer to this area.
Figure 2: The study area in the vicinity of the Port Stephens estuary in central New South Wales. Bennett’s Beach lines Providence Bay between Yacaaba Head (YH) and Little Gibba.
YH
6
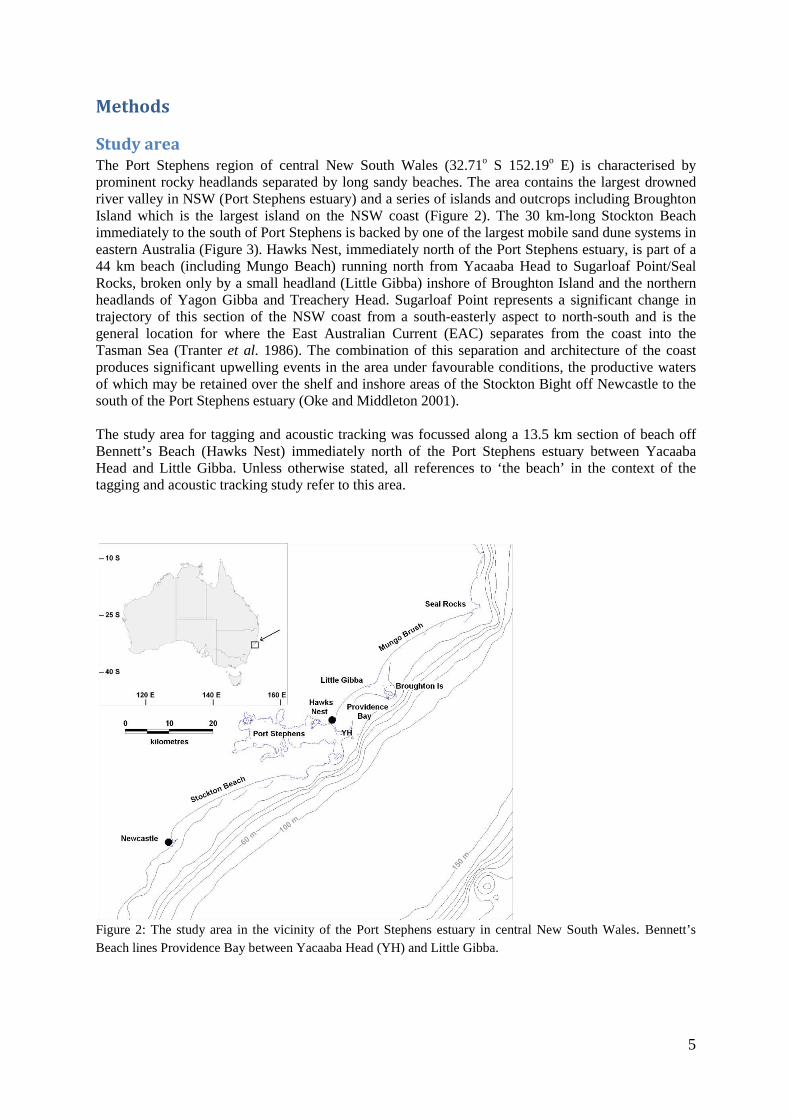
Figure 3: Stockton Beach, looking north towards the Port Stephens estuary (seen in the distance).
Field methods
Acoustic tagging and tracking
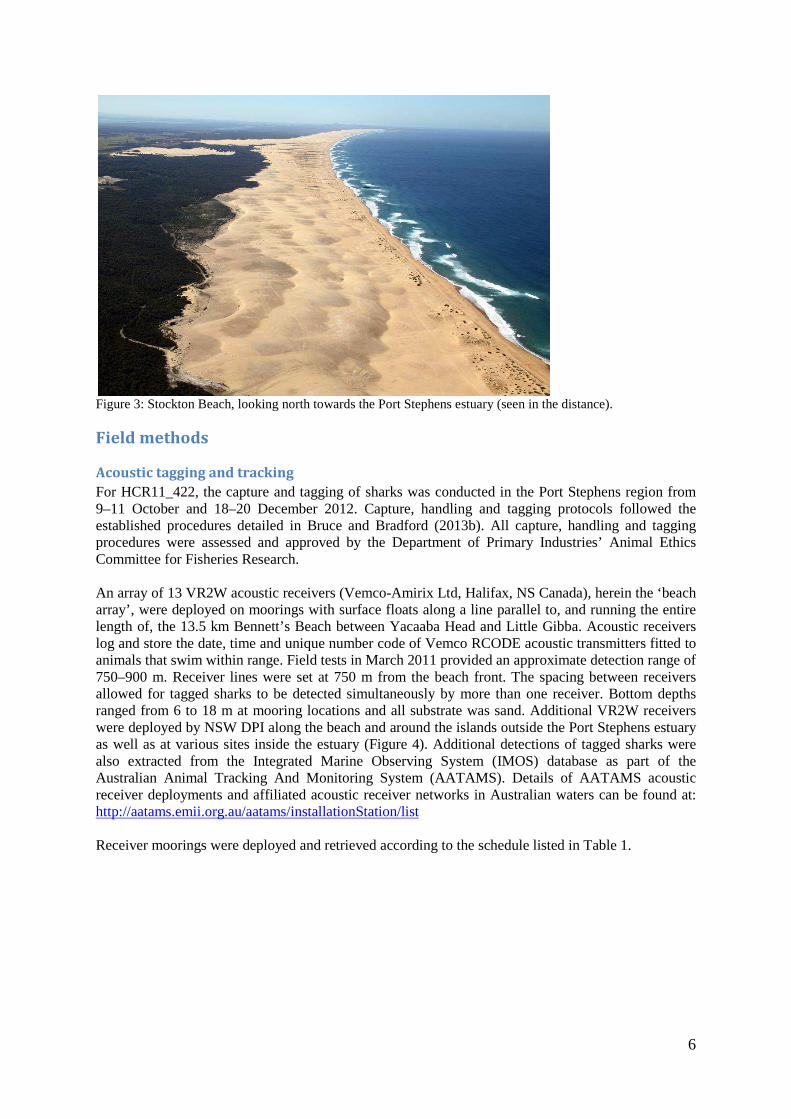
For HCR11_422, the capture and tagging of sharks was conducted in the Port Stephens region from 9–11 October and 18–20 December 2012. Capture, handling and tagging protocols followed the established procedures detailed in Bruce and Bradford (2013b). All capture, handling and tagging procedures were assessed and approved by the Department of Primary Industries’ Animal Ethics Committee for Fisheries Research. An array of 13 VR2W acoustic receivers (Vemco-Amirix Ltd, Halifax, NS Canada), herein the ‘beach array’, were deployed on moorings with surface floats along a line parallel to, and running the entire length of, the 13.5 km Bennett’s Beach between Yacaaba Head and Little Gibba. Acoustic receivers log and store the date, time and unique number code of Vemco RCODE acoustic transmitters fitted to animals that swim within range. Field tests in March 2011 provided an approximate detection range of 750–900 m. Receiver lines were set at 750 m from the beach front. The spacing between receivers allowed for tagged sharks to be detected simultaneously by more than one receiver. Bottom depths ranged from 6 to 18 m at mooring locations and all substrate was sand. Additional VR2W receivers were deployed by NSW DPI along the beach and around the islands outside the Port Stephens estuary as well as at various sites inside the estuary (Figure 4). Additional detections of tagged sharks were also extracted from the Integrated Marine Observing System (IMOS) database as part of the Australian Animal Tracking And Monitoring System (AATAMS). Details of AATAMS acoustic receiver deployments and affiliated acoustic receiver networks in Australian waters can be found at: http://aatams.emii.org.au/aatams/installationStation/list Receiver moorings were deployed and retrieved according to the schedule listed in Table 1.
7
Figure 4: Location of acoustic receiver moorings in the Port Stephens area. Orange squares = (Bennett’s) Beach receivers; green squares = Bay receivers; light blue squares = Island receivers; dark blue squares = Deep receivers; orange triangle = Stockton Beach receiver (Birubi Pt). Depths in metres.
Aerial surveys
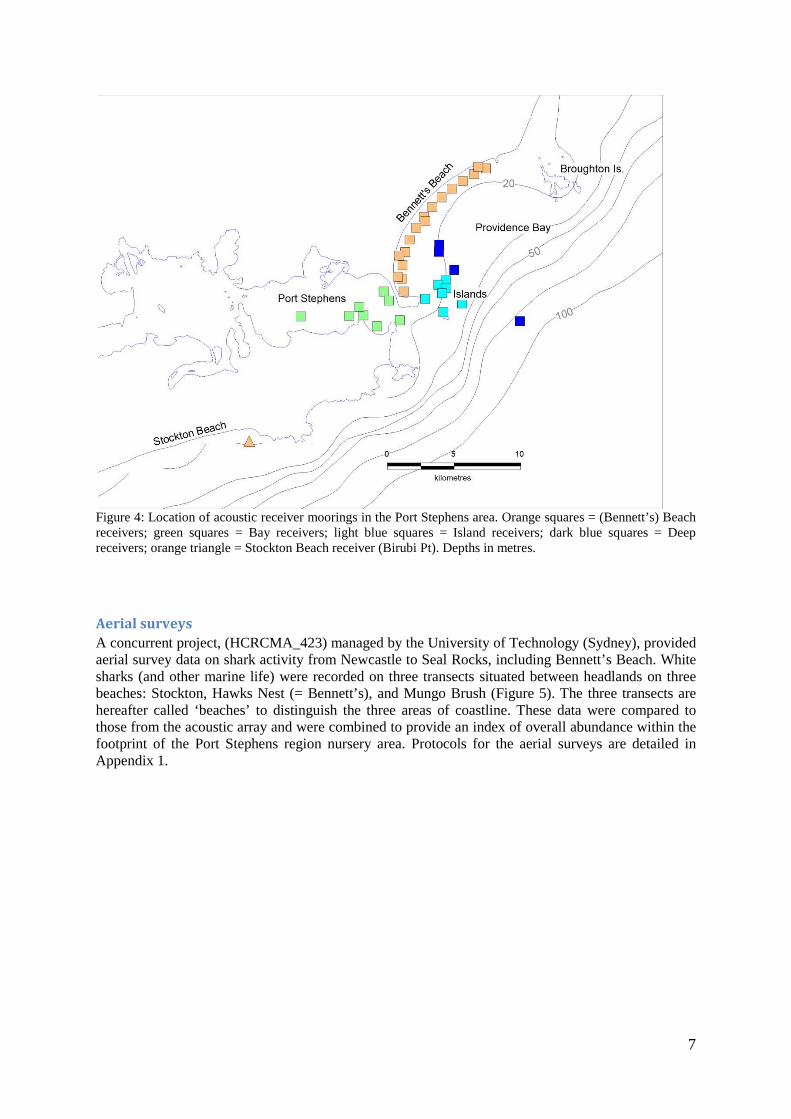
A concurrent project, (HCRCMA_423) managed by the University of Technology (Sydney), provided aerial survey data on shark activity from Newcastle to Seal Rocks, including Bennett’s Beach. White sharks (and other marine life) were recorded on three transects situated between headlands on three beaches: Stockton, Hawks Nest (= Bennett’s), and Mungo Brush (Figure 5). The three transects are hereafter called ‘beaches’ to distinguish the three areas of coastline. These data were compared to those from the acoustic array and were combined to provide an index of overall abundance within the footprint of the Port Stephens region nursery area. Protocols for the aerial surveys are detailed in Appendix 1.
8
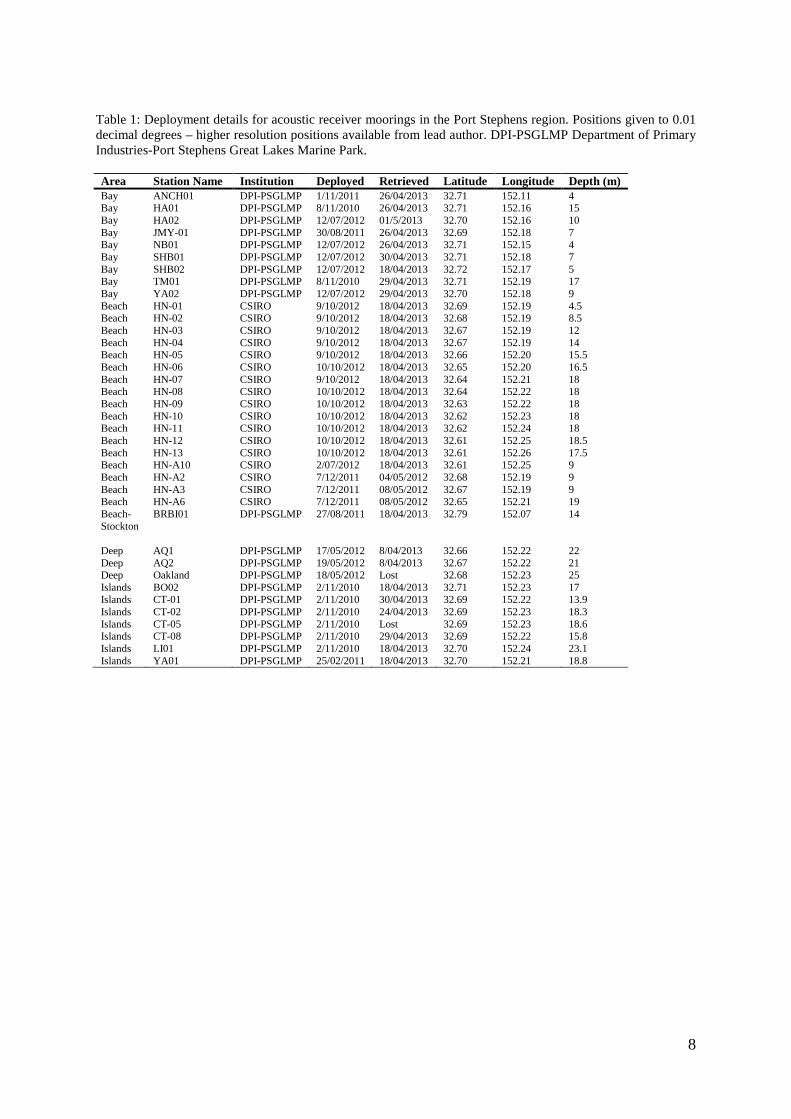
Table 1: Deployment details for acoustic receiver moorings in the Port Stephens region. Positions given to 0.01 decimal degrees – higher resolution positions available from lead author. DPI-PSGLMP Department of Primary Industries-Port Stephens Great Lakes Marine Park. Area Station Name Institution Deployed Retrieved Latitude Longitude Depth (m) Bay ANCH01 DPI-PSGLMP 1/11/2011 26/04/2013 32.71 152.11 4 Bay HA01 DPI-PSGLMP 8/11/2010 26/04/2013 32.71 152.16 15 Bay HA02 DPI-PSGLMP 12/07/2012 01/5/2013 32.70 152.16 10 Bay JMY-01 DPI-PSGLMP 30/08/2011 26/04/2013 32.69 152.18 7 Bay NB01 DPI-PSGLMP 12/07/2012 26/04/2013 32.71 152.15 4 Bay SHB01 DPI-PSGLMP 12/07/2012 30/04/2013 32.71 152.18 7 Bay SHB02 DPI-PSGLMP 12/07/2012 18/04/2013 32.72 152.17 5 Bay TM01 DPI-PSGLMP 8/11/2010 29/04/2013 32.71 152.19 17 Bay YA02 DPI-PSGLMP 12/07/2012 29/04/2013 32.70 152.18 9 Beach HN-01 CSIRO 9/10/2012 18/04/2013 32.69 152.19 4.5 Beach HN-02 CSIRO 9/10/2012 18/04/2013 32.68 152.19 8.5 Beach HN-03 CSIRO 9/10/2012 18/04/2013 32.67 152.19 12 Beach HN-04 CSIRO 9/10/2012 18/04/2013 32.67 152.19 14 Beach HN-05 CSIRO 9/10/2012 18/04/2013 32.66 152.20 15.5 Beach HN-06 CSIRO 10/10/2012 18/04/2013 32.65 152.20 16.5 Beach HN-07 CSIRO 9/10/2012 18/04/2013 32.64 152.21 18 Beach HN-08 CSIRO 10/10/2012 18/04/2013 32.64 152.22 18 Beach HN-09 CSIRO 10/10/2012 18/04/2013 32.63 152.22 18 Beach HN-10 CSIRO 10/10/2012 18/04/2013 32.62 152.23 18 Beach HN-11 CSIRO 10/10/2012 18/04/2013 32.62 152.24 18 Beach HN-12 CSIRO 10/10/2012 18/04/2013 32.61 152.25 18.5 Beach HN-13 CSIRO 10/10/2012 18/04/2013 32.61 152.26 17.5 Beach HN-A10 CSIRO 2/07/2012 18/04/2013 32.61 152.25 9 Beach HN-A2 CSIRO 7/12/2011 04/05/2012 32.68 152.19 9 Beach HN-A3 CSIRO 7/12/2011 08/05/2012 32.67 152.19 9 Beach HN-A6 CSIRO 7/12/2011 08/05/2012 32.65 152.21 19 Beach- Stockton
BRBI01 DPI-PSGLMP 27/08/2011 18/04/2013 32.79 152.07 14
Deep AQ1 DPI-PSGLMP 17/05/2012 8/04/2013 32.66 152.22 22 Deep AQ2 DPI-PSGLMP 19/05/2012 8/04/2013 32.67 152.22 21 Deep Oakland DPI-PSGLMP 18/05/2012 Lost 32.68 152.23 25 Islands BO02 DPI-PSGLMP 2/11/2010 18/04/2013 32.71 152.23 17 Islands CT-01 DPI-PSGLMP 2/11/2010 30/04/2013 32.69 152.22 13.9 Islands CT-02 DPI-PSGLMP 2/11/2010 24/04/2013 32.69 152.23 18.3 Islands CT-05 DPI-PSGLMP 2/11/2010 Lost 32.69 152.23 18.6 Islands CT-08 DPI-PSGLMP 2/11/2010 29/04/2013 32.69 152.22 15.8 Islands LI01 DPI-PSGLMP 2/11/2010 18/04/2013 32.70 152.24 23.1 Islands YA01 DPI-PSGLMP 25/02/2011 18/04/2013 32.70 152.21 18.8
9
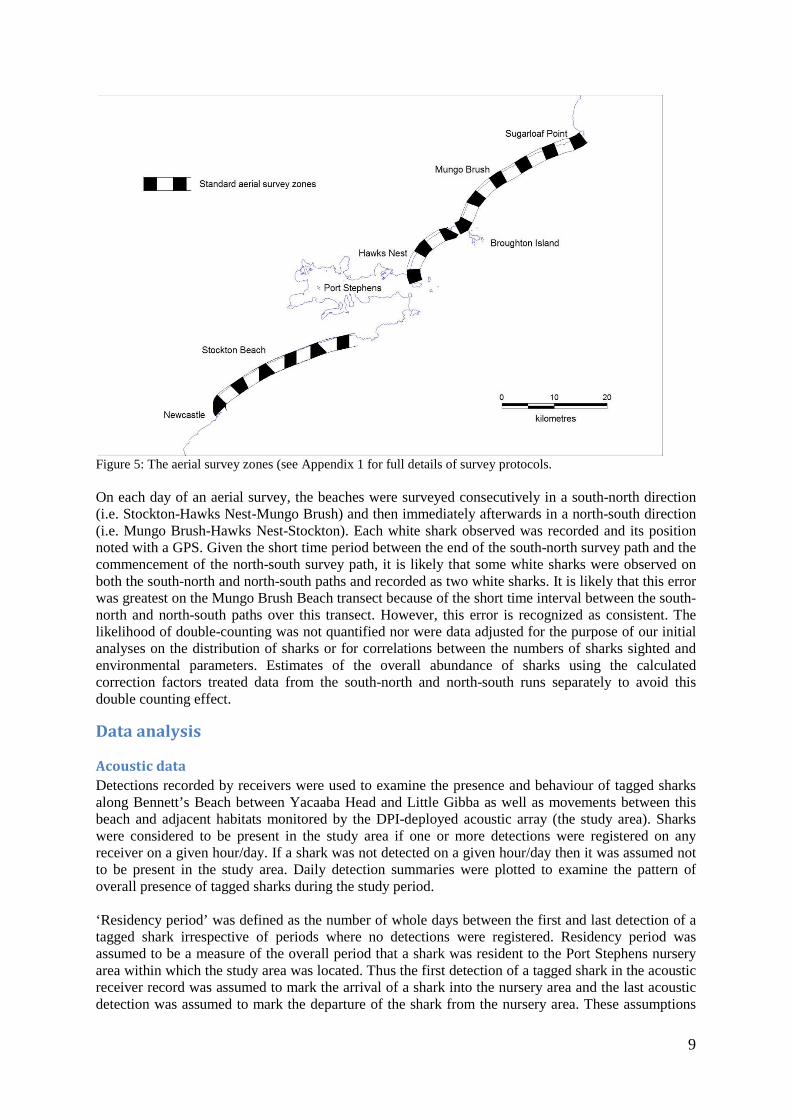
Figure 5: The aerial survey zones (see Appendix 1 for full details of survey protocols. On each day of an aerial survey, the beaches were surveyed consecutively in a south-north direction (i.e. Stockton-Hawks Nest-Mungo Brush) and then immediately afterwards in a north-south direction (i.e. Mungo Brush-Hawks Nest-Stockton). Each white shark observed was recorded and its position noted with a GPS. Given the short time period between the end of the south-north survey path and the commencement of the north-south survey path, it is likely that some white sharks were observed on both the south-north and north-south paths and recorded as two white sharks. It is likely that this error was greatest on the Mungo Brush Beach transect because of the short time interval between the south-north and north-south paths over this transect. However, this error is recognized as consistent. The likelihood of double-counting was not quantified nor were data adjusted for the purpose of our initial analyses on the distribution of sharks or for correlations between the numbers of sharks sighted and environmental parameters. Estimates of the overall abundance of sharks using the calculated correction factors treated data from the south-north and north-south runs separately to avoid this double counting effect.
Data analysis
Acoustic data
Detections recorded by receivers were used to examine the presence and behaviour of tagged sharks along Bennett’s Beach between Yacaaba Head and Little Gibba as well as movements between this beach and adjacent habitats monitored by the DPI-deployed acoustic array (the study area). Sharks were considered to be present in the study area if one or more detections were registered on any receiver on a given hour/day. If a shark was not detected on a given hour/day then it was assumed not to be present in the study area. Daily detection summaries were plotted to examine the pattern of overall presence of tagged sharks during the study period. ‘Residency period’ was defined as the number of whole days between the first and last detection of a tagged shark irrespective of periods where no detections were registered. Residency period was assumed to be a measure of the overall period that a shark was resident to the Port Stephens nursery area within which the study area was located. Thus the first detection of a tagged shark in the acoustic receiver record was assumed to mark the arrival of a shark into the nursery area and the last acoustic detection was assumed to mark the departure of the shark from the nursery area. These assumptions
10
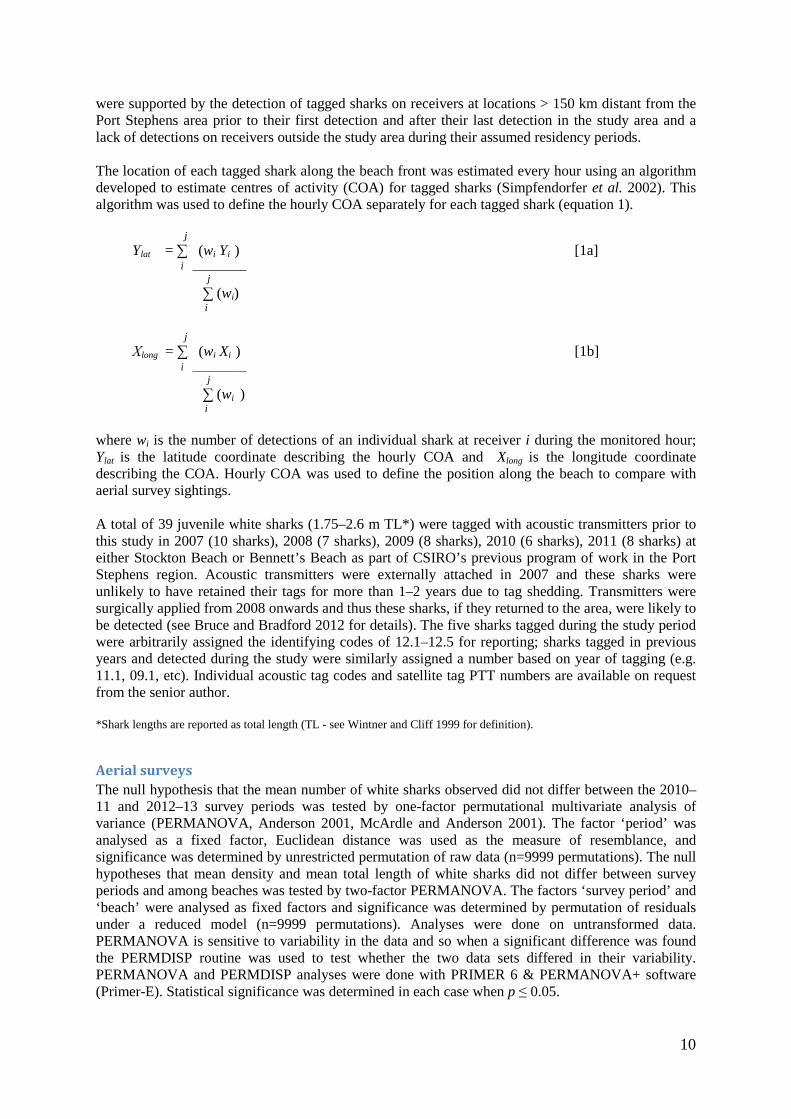
were supported by the detection of tagged sharks on receivers at locations > 150 km distant from the Port Stephens area prior to their first detection and after their last detection in the study area and a lack of detections on receivers outside the study area during their assumed residency periods. The location of each tagged shark along the beach front was estimated every hour using an algorithm developed to estimate centres of activity (COA) for tagged sharks (Simpfendorfer et al. 2002). This algorithm was used to define the hourly COA separately for each tagged shark (equation 1). j Ylat = ∑ (wi Yi ) [1a] i _________ j
∑ (wi) i
j Χlong = ∑ (wi Xi ) [1b] i _________ j
∑ (wi ) i
where wi is the number of detections of an individual shark at receiver i during the monitored hour; Ylat is the latitude coordinate describing the hourly COA and Xlong is the longitude coordinate describing the COA. Hourly COA was used to define the position along the beach to compare with aerial survey sightings. A total of 39 juvenile white sharks (1.75–2.6 m TL*) were tagged with acoustic transmitters prior to this study in 2007 (10 sharks), 2008 (7 sharks), 2009 (8 sharks), 2010 (6 sharks), 2011 (8 sharks) at either Stockton Beach or Bennett’s Beach as part of CSIRO’s previous program of work in the Port Stephens region. Acoustic transmitters were externally attached in 2007 and these sharks were unlikely to have retained their tags for more than 1–2 years due to tag shedding. Transmitters were surgically applied from 2008 onwards and thus these sharks, if they returned to the area, were likely to be detected (see Bruce and Bradford 2012 for details). The five sharks tagged during the study period were arbitrarily assigned the identifying codes of 12.1–12.5 for reporting; sharks tagged in previous years and detected during the study were similarly assigned a number based on year of tagging (e.g. 11.1, 09.1, etc). Individual acoustic tag codes and satellite tag PTT numbers are available on request from the senior author. *Shark lengths are reported as total length (TL - see Wintner and Cliff 1999 for definition).
Aerial surveys
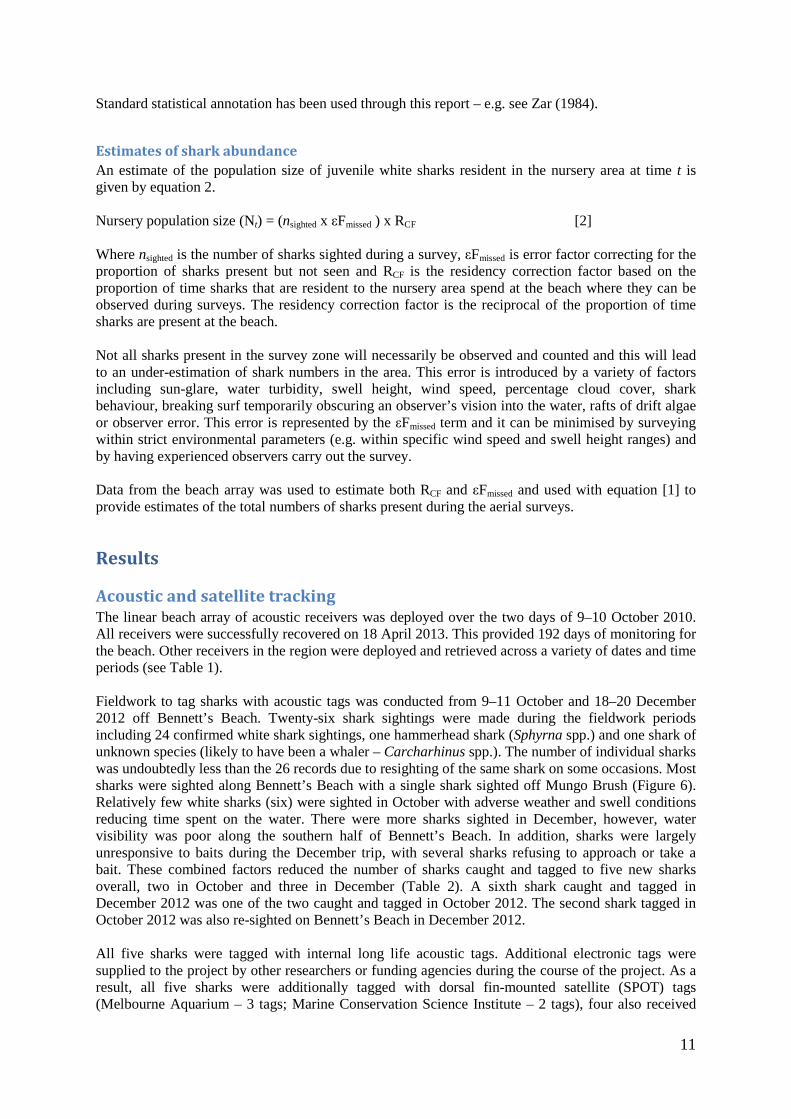
The null hypothesis that the mean number of white sharks observed did not differ between the 2010–11 and 2012–13 survey periods was tested by one-factor permutational multivariate analysis of variance (PERMANOVA, Anderson 2001, McArdle and Anderson 2001). The factor ‘period’ was analysed as a fixed factor, Euclidean distance was used as the measure of resemblance, and significance was determined by unrestricted permutation of raw data (n=9999 permutations). The null hypotheses that mean density and mean total length of white sharks did not differ between survey periods and among beaches was tested by two-factor PERMANOVA. The factors ‘survey period’ and ‘beach’ were analysed as fixed factors and significance was determined by permutation of residuals under a reduced model (n=9999 permutations). Analyses were done on untransformed data. PERMANOVA is sensitive to variability in the data and so when a significant difference was found the PERMDISP routine was used to test whether the two data sets differed in their variability. PERMANOVA and PERMDISP analyses were done with PRIMER 6 & PERMANOVA+ software (Primer-E). Statistical significance was determined in each case when p ≤ 0.05.
11
Standard statistical annotation has been used through this report – e.g. see Zar (1984).
Estimates of shark abundance
An estimate of the population size of juvenile white sharks resident in the nursery area at time t is given by equation 2. Nursery population size (Nt) = (nsighted x εFmissed ) x RCF [2] Where nsighted is the number of sharks sighted during a survey, εFmissed is error factor correcting for the proportion of sharks present but not seen and RCF is the residency correction factor based on the proportion of time sharks that are resident to the nursery area spend at the beach where they can be observed during surveys. The residency correction factor is the reciprocal of the proportion of time sharks are present at the beach. Not all sharks present in the survey zone will necessarily be observed and counted and this will lead to an under-estimation of shark numbers in the area. This error is introduced by a variety of factors including sun-glare, water turbidity, swell height, wind speed, percentage cloud cover, shark behaviour, breaking surf temporarily obscuring an observer’s vision into the water, rafts of drift algae or observer error. This error is represented by the εFmissed term and it can be minimised by surveying within strict environmental parameters (e.g. within specific wind speed and swell height ranges) and by having experienced observers carry out the survey. Data from the beach array was used to estimate both RCF and εFmissed and used with equation [1] to provide estimates of the total numbers of sharks present during the aerial surveys.
Results
Acoustic and satellite tracking
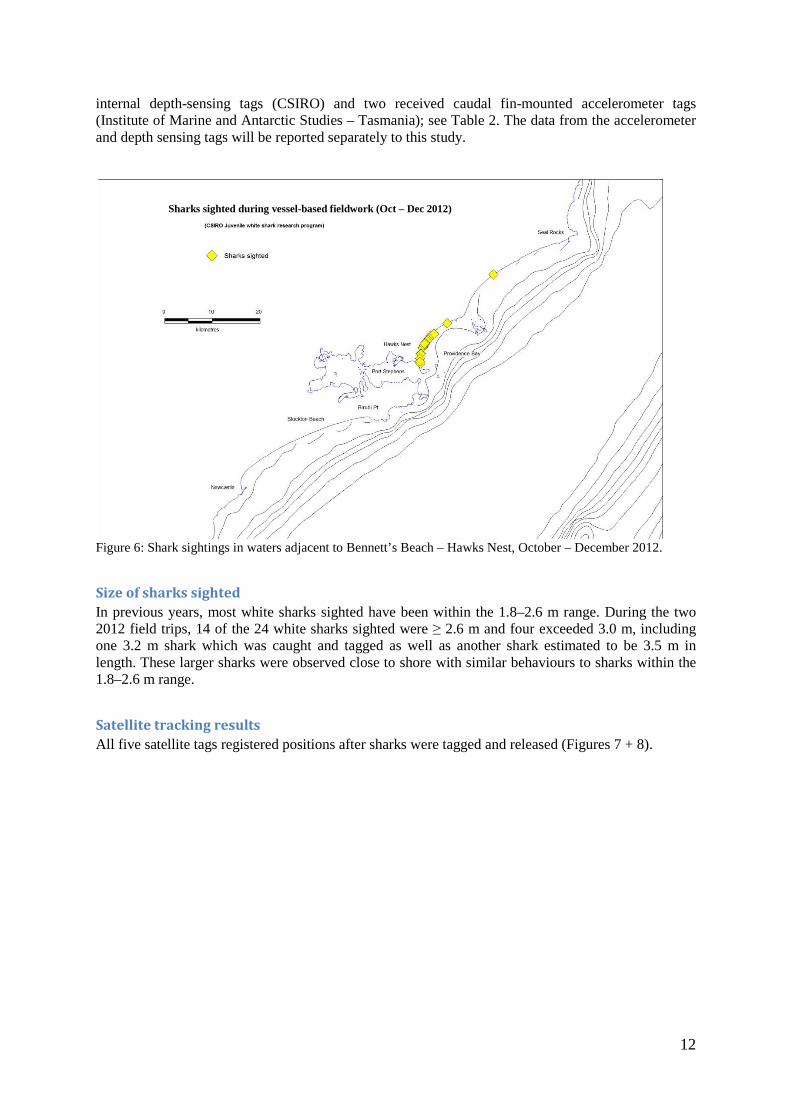
The linear beach array of acoustic receivers was deployed over the two days of 9–10 October 2010. All receivers were successfully recovered on 18 April 2013. This provided 192 days of monitoring for the beach. Other receivers in the region were deployed and retrieved across a variety of dates and time periods (see Table 1). Fieldwork to tag sharks with acoustic tags was conducted from 9–11 October and 18–20 December 2012 off Bennett’s Beach. Twenty-six shark sightings were made during the fieldwork periods including 24 confirmed white shark sightings, one hammerhead shark (Sphyrna spp.) and one shark of unknown species (likely to have been a whaler – Carcharhinus spp.). The number of individual sharks was undoubtedly less than the 26 records due to resighting of the same shark on some occasions. Most sharks were sighted along Bennett’s Beach with a single shark sighted off Mungo Brush (Figure 6). Relatively few white sharks (six) were sighted in October with adverse weather and swell conditions reducing time spent on the water. There were more sharks sighted in December, however, water visibility was poor along the southern half of Bennett’s Beach. In addition, sharks were largely unresponsive to baits during the December trip, with several sharks refusing to approach or take a bait. These combined factors reduced the number of sharks caught and tagged to five new sharks overall, two in October and three in December (Table 2). A sixth shark caught and tagged in December 2012 was one of the two caught and tagged in October 2012. The second shark tagged in October 2012 was also re-sighted on Bennett’s Beach in December 2012. All five sharks were tagged with internal long life acoustic tags. Additional electronic tags were supplied to the project by other researchers or funding agencies during the course of the project. As a result, all five sharks were additionally tagged with dorsal fin-mounted satellite (SPOT) tags (Melbourne Aquarium – 3 tags; Marine Conservation Science Institute – 2 tags), four also received
12
internal depth-sensing tags (CSIRO) and two received caudal fin-mounted accelerometer tags (Institute of Marine and Antarctic Studies – Tasmania); see Table 2. The data from the accelerometer and depth sensing tags will be reported separately to this study.
Figure 6: Shark sightings in waters adjacent to Bennett’s Beach – Hawks Nest, October – December 2012.
Size of sharks sighted
In previous years, most white sharks sighted have been within the 1.8–2.6 m range. During the two 2012 field trips, 14 of the 24 white sharks sighted were ≥ 2.6 m and four exceeded 3.0 m, including one 3.2 m shark which was caught and tagged as well as another shark estimated to be 3.5 m in length. These larger sharks were observed close to shore with similar behaviours to sharks within the 1.8–2.6 m range.
Satellite tracking results
All five satellite tags registered positions after sharks were tagged and released (Figures 7 + 8).
Sharks sighted during vessel-based fieldwork (Oct – Dec 2012)
13
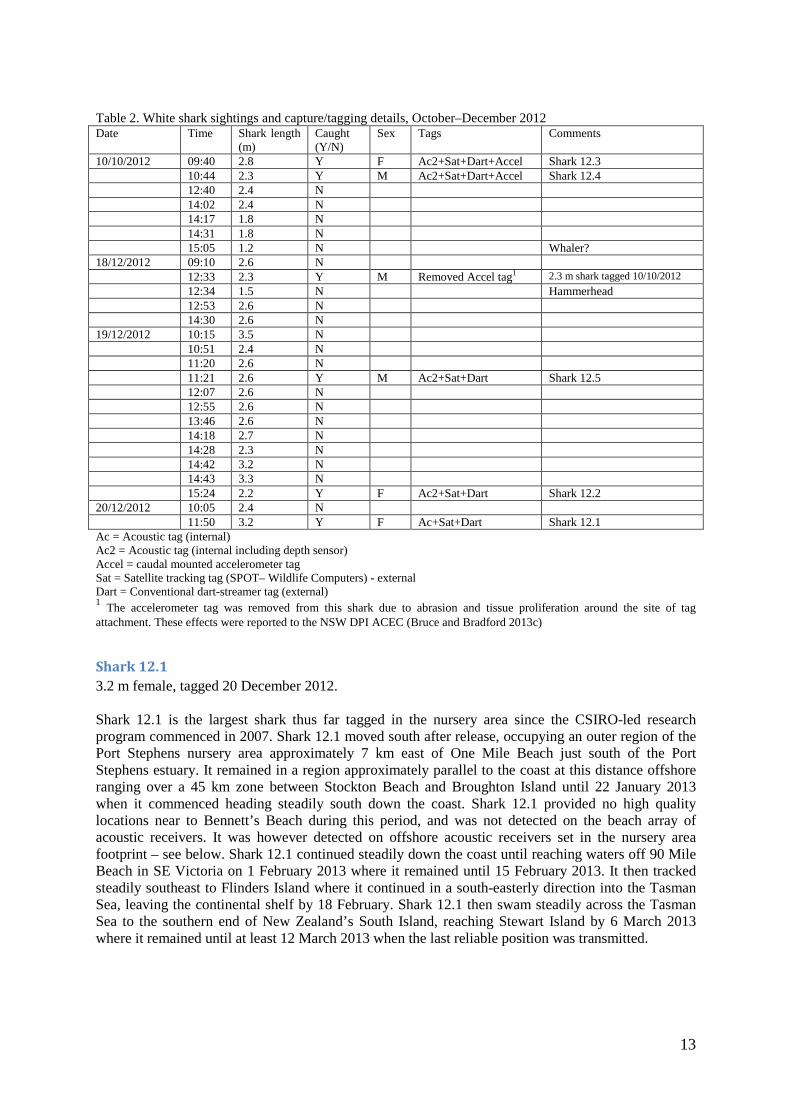
Table 2. White shark sightings and capture/tagging details, October–December 2012 Date Time Shark length
(m) Caught (Y/N)
Sex Tags Comments
10/10/2012 09:40 2.8 Y F Ac2+Sat+Dart+Accel Shark 12.3 10:44 2.3 Y M Ac2+Sat+Dart+Accel Shark 12.4 12:40 2.4 N 14:02 2.4 N 14:17 1.8 N 14:31 1.8 N 15:05 1.2 N Whaler? 18/12/2012 09:10 2.6 N 12:33 2.3 Y M Removed Accel tag1 2.3 m shark tagged 10/10/2012
12:34 1.5 N Hammerhead 12:53 2.6 N 14:30 2.6 N 19/12/2012 10:15 3.5 N 10:51 2.4 N 11:20 2.6 N 11:21 2.6 Y M Ac2+Sat+Dart Shark 12.5 12:07 2.6 N 12:55 2.6 N 13:46 2.6 N 14:18 2.7 N 14:28 2.3 N 14:42 3.2 N 14:43 3.3 N 15:24 2.2 Y F Ac2+Sat+Dart Shark 12.2 20/12/2012 10:05 2.4 N 11:50 3.2 Y F Ac+Sat+Dart Shark 12.1 Ac = Acoustic tag (internal) Ac2 = Acoustic tag (internal including depth sensor) Accel = caudal mounted accelerometer tag Sat = Satellite tracking tag (SPOT– Wildlife Computers) - external Dart = Conventional dart-streamer tag (external) 1 The accelerometer tag was removed from this shark due to abrasion and tissue proliferation around the site of tag attachment. These effects were reported to the NSW DPI ACEC (Bruce and Bradford 2013c)
Shark 12.1
3.2 m female, tagged 20 December 2012. Shark 12.1 is the largest shark thus far tagged in the nursery area since the CSIRO-led research program commenced in 2007. Shark 12.1 moved south after release, occupying an outer region of the Port Stephens nursery area approximately 7 km east of One Mile Beach just south of the Port Stephens estuary. It remained in a region approximately parallel to the coast at this distance offshore ranging over a 45 km zone between Stockton Beach and Broughton Island until 22 January 2013 when it commenced heading steadily south down the coast. Shark 12.1 provided no high quality locations near to Bennett’s Beach during this period, and was not detected on the beach array of acoustic receivers. It was however detected on offshore acoustic receivers set in the nursery area footprint – see below. Shark 12.1 continued steadily down the coast until reaching waters off 90 Mile Beach in SE Victoria on 1 February 2013 where it remained until 15 February 2013. It then tracked steadily southeast to Flinders Island where it continued in a south-easterly direction into the Tasman Sea, leaving the continental shelf by 18 February. Shark 12.1 then swam steadily across the Tasman Sea to the southern end of New Zealand’s South Island, reaching Stewart Island by 6 March 2013 where it remained until at least 12 March 2013 when the last reliable position was transmitted.
14
Shark 12.2
2.2 m female, tagged 19 December 2012 Shark 12.2 moved offshore briefly after tagging to an area approximately 6 km east of the Port Stephens estuary before returning to Bennett’s Beach on 22 December where it registered positions along the southern half of the beach until 14 January 2013. It then proceeded to an area approximately 6 km east of Stockton Beach by 16 January where it remained until 9 February (showing no sign of moving into near-shore waters of Stockton Beach). Shark 12.2 tracked steadily north out of the nursery area on 11 February 2013, travelling to waters offshore from Forster before returning briefly to the nursery area for 25–28 February. It then tracked steadily north (420 km) to shelf waters off Evans Head where the last reliable position was registered on 15 March 2013.
Shark 12.3
2.8 m female, tagged 10 October 2012. Shark 12.3 moved offshore briefly after tagging heading slowly north before rounding Broughton Island and entering near-shore waters off Mungo Brush by 16 October 2012 where it remained until 30 October. The shark then moved to deeper waters 14–24 km east of Bennett’s Beach and Mungo Brush where it resided until 10 November. The shark then moved briefly to Bennett’s Beach on 12 November before returning to Mungo Brush on 15 November. Shark 12.3 returned to Bennett’s Beach by 25 November where it remained until at least 28 November. There was a hiatus in reliable positions until 4 May 2013 when several positions indicated the shark was moving south away from the nursery area close to the shelf-edge. The last reliable position for the shark was off Jervis Bay, 310 km south of the nursery area, on 20 May 2013.
Shark 12.4
2.3 m male, tagged 10 October 2012. Shark 12.4 moved offshore to an area 20 km northeast of Broughton Island after tagging before moving back into Providence Bay by 16 October where it initially resided in deeper waters immediately south of Broughton Island. The shark returned to near-shore waters of Bennett’s Beach by 21 October and remained in Providence Bay until 11 November after which it tracked south occupying an area approximately 15–20 km offshore ranging from off northern Stockton Beach to Lake Macquarie until 18 November. The shark then returned to near-shore waters off Bennett’s Beach by 21 November, residing in Providence Bay until 12 December. Shark 12.4 then moved between waters immediately north of Broughton Island and near-shore waters of Bennett’s Beach until 29 December. The shark left Providence bay on 29 December, briefly visiting near-shore waters at the northern end of Stockton Beach on 2 January 2013 before returning to the same offshore zone previously occupied approximately 15–20 km east off the coast between Stockton Beach and Lake Macquarie where it resided until 14 January. The shark returned to near-shore waters of Bennett’s Beach by 17 January. The shark departed Providence Bay on 29 January 2013 heading south, down the coast to at least Wollongong (230 km) by 14 February. The shark then returned to Providence Bay and Mungo brush where the last recorded position was on 16 March 2013.
Shark 12.5
2.6 m female, tagged 19 December 2012 Shark 12.5 moved offshore shortly after tagging and continued to occupy a region approximately 7–25 km offshore between Broughton Island and Stockton Beach with few near-shore excursions until 29 January 2013. The shark then briefly headed north out of the nursery area to shelf waters off Crowdy Head (100 km), returning to the same region offshore from Providence Bay to Stockton Beach by 5 February, spending some time in shelf waters off Lake Macquarie similar to shark 12.4 from 14–18 February. The shark returned to and continued to remain in the offshore zone between Providence Bay and Stockton Beach with no clear evidence of moving into near-shore waters until 15
15
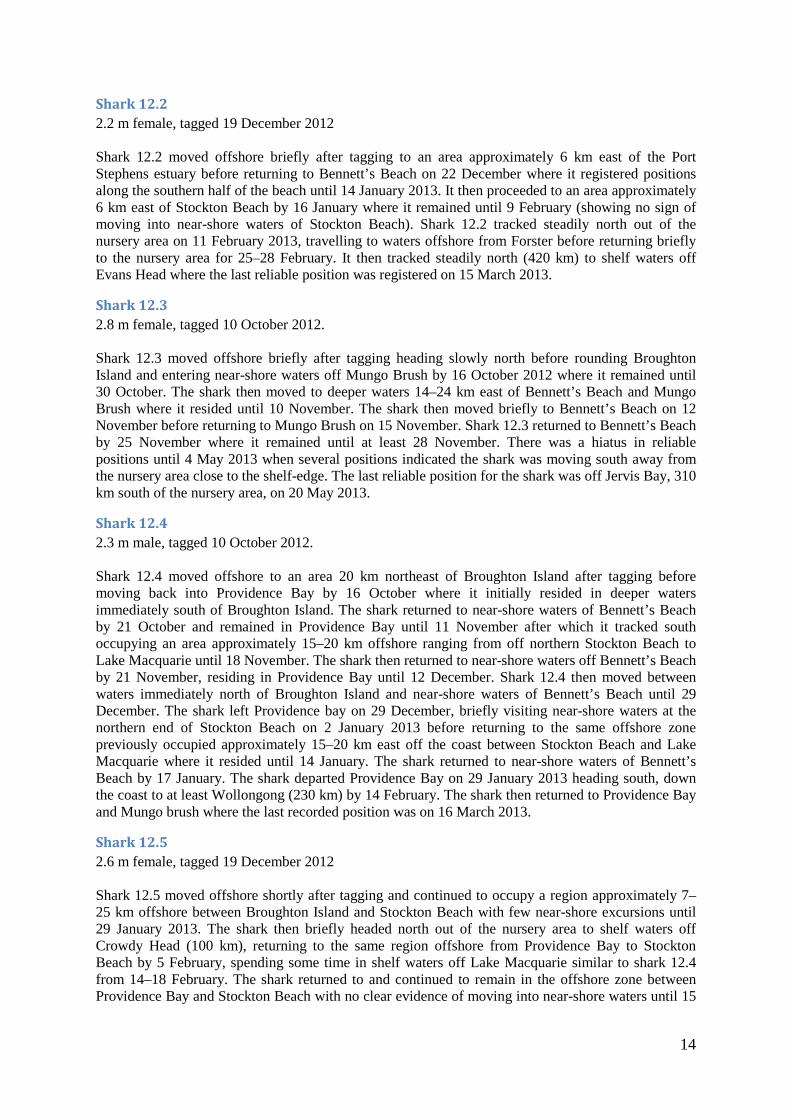
June after which it travelled south to near-shore waters off Lake Macquarie by 19 June where its last recorded position was 27 June 2013.
Figure 7: Satellite registered positions for five juvenile white sharks tagged in the Port Stephens area in 2012.

16
Figure 8: Broad-scale movements of sharks 12.1 (pink) and 12.2 (orange) along the east Australian coast and into the Tasman Sea December 2012 to March 2013.
Acoustic detection summary
A total of 25,733 detections were recorded from 11 individual white sharks across 32 receivers during the monitoring period (defined as the date of the first detection of a tagged shark in the nursery area, 25 September 2012, to the retrieval of the beach array on 18 April 2013). The last detection of a tagged shark during the monitoring period was on 12 April 2013. All five sharks tagged in 2012 were detected; four sharks out of the eight tagged in 2011 were detected; two sharks out of eight tagged in 2009 were detected; no sharks tagged in either 2008 or 2010 were detected. Ten sharks were detected on the Beach array; the 3.2 m female tagged on 20 December 2012 (Shark 12.1) did not return to the beach after tagging and was only detected on an offshore station on the same day it was tagged. Satellite tracking, however, indicated that the shark remained in offshore regions of the nursery area until 22 January 2012. This shark was omitted from analyses, based on acoustic data, of beach and study area residency. Shark 12.1 was detected crossing the Bondi Line of acoustic receivers off Sydney late on 23 January and subsequently crossed a line of receivers off Narooma on the NSW south coast on 27 January, matching the timing and track provided by the satellite tracking data. Sharks detected on the beach array followed similar patterns to those previously observed with most showing periods of extended consecutive days at the beach punctuated by forays offshore, to island areas or into the Bay (Figure 9).
17
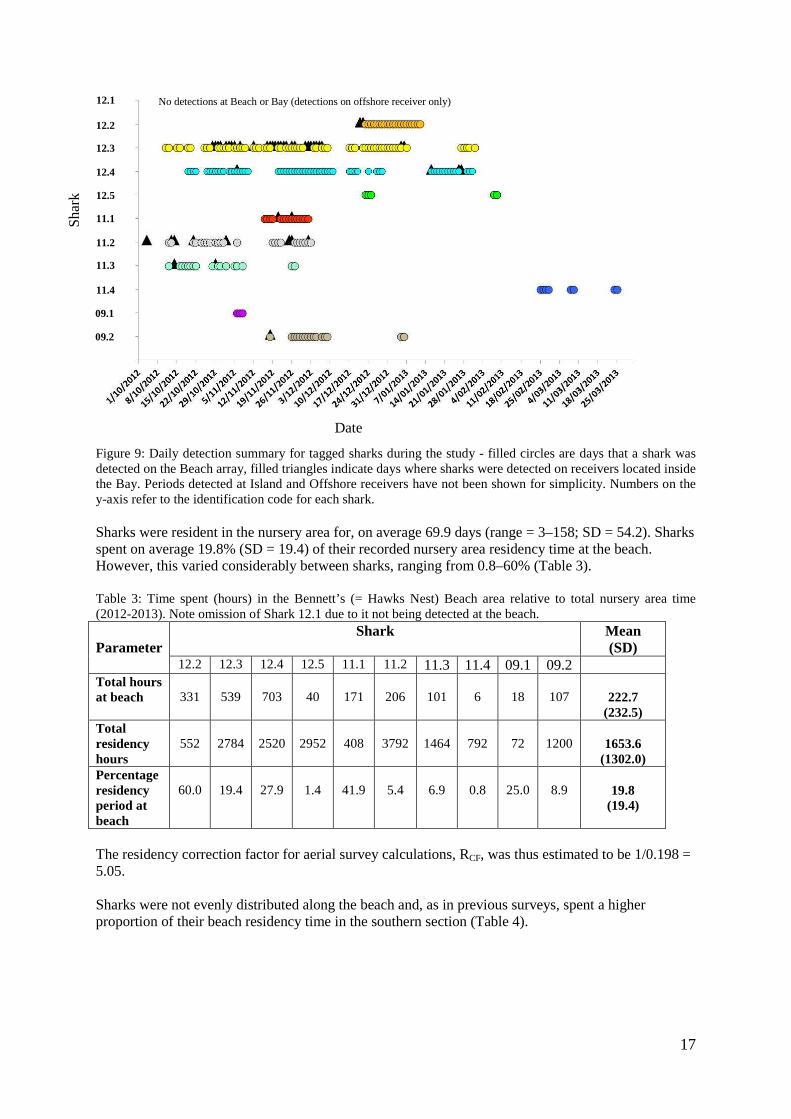
Figure 9: Daily detection summary for tagged sharks during the study - filled circles are days that a shark was detected on the Beach array, filled triangles indicate days where sharks were detected on receivers located inside the Bay. Periods detected at Island and Offshore receivers have not been shown for simplicity. Numbers on the y-axis refer to the identification code for each shark. Sharks were resident in the nursery area for, on average 69.9 days (range = 3–158; SD = 54.2). Sharks spent on average 19.8% (SD = 19.4) of their recorded nursery area residency time at the beach. However, this varied considerably between sharks, ranging from 0.8–60% (Table 3). Table 3: Time spent (hours) in the Bennett’s (= Hawks Nest) Beach area relative to total nursery area time (2012-2013). Note omission of Shark 12.1 due to it not being detected at the beach. Parameter
Shark Mean (SD)
12.2 12.3 12.4 12.5 11.1 11.2 11.3 11.4 09.1 09.2 Total hours at beach
331
539
703
40
171
206
101
6
18
107
222.7
(232.5) Total residency hours
552
2784
2520
2952
408
3792
1464
792
72
1200
1653.6
(1302.0) Percentage residency period at beach
60.0
19.4
27.9
1.4
41.9
5.4
6.9
0.8
25.0
8.9
19.8
(19.4)
The residency correction factor for aerial survey calculations, RCF, was thus estimated to be 1/0.198 = 5.05. Sharks were not evenly distributed along the beach and, as in previous surveys, spent a higher proportion of their beach residency time in the southern section (Table 4).
12.1
12.2
12.3
12.4
12.5
11.1
11.2
11.3
11.4
09.1
09.2
Sha
rk
No detections at Beach or Bay (detections on offshore receiver only)
Date
18
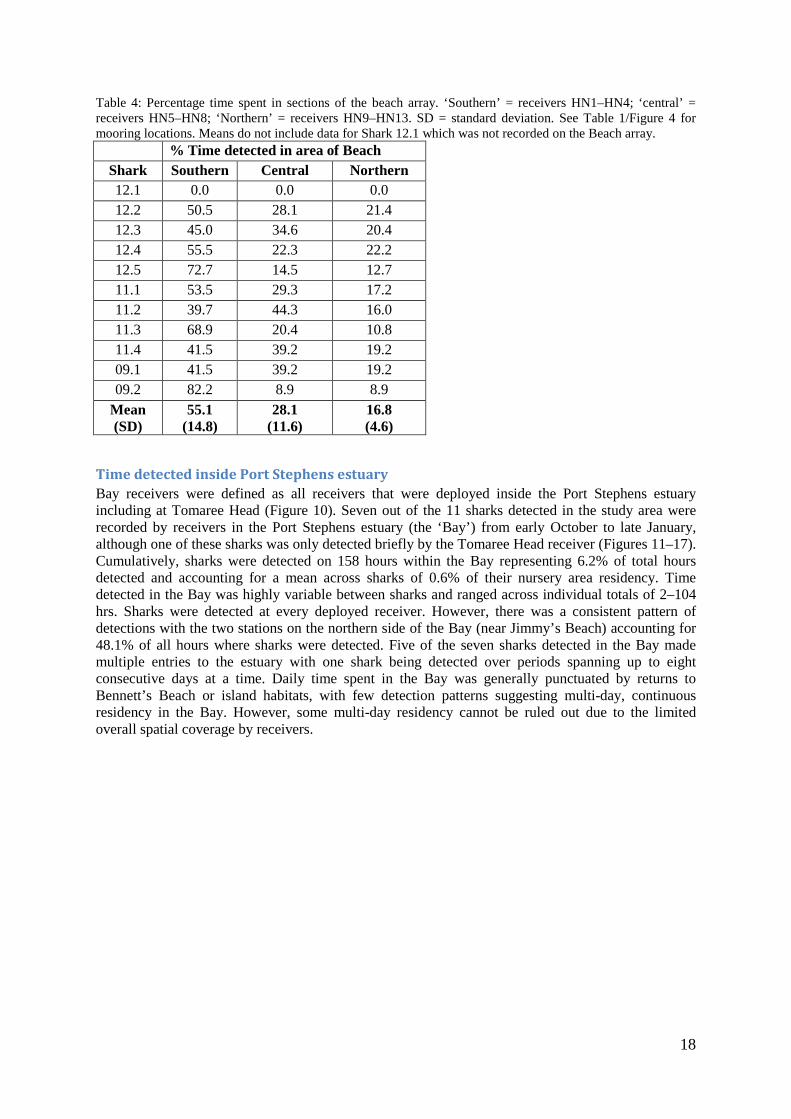
Table 4: Percentage time spent in sections of the beach array. ‘Southern’ = receivers HN1–HN4; ‘central’ = receivers HN5–HN8; ‘Northern’ = receivers HN9–HN13. SD = standard deviation. See Table 1/Figure 4 for mooring locations. Means do not include data for Shark 12.1 which was not recorded on the Beach array.
% Time detected in area of Beach Shark Southern Central Northern 12.1 0.0 0.0 0.0 12.2 50.5 28.1 21.4 12.3 45.0 34.6 20.4 12.4 55.5 22.3 22.2 12.5 72.7 14.5 12.7 11.1 53.5 29.3 17.2 11.2 39.7 44.3 16.0 11.3 68.9 20.4 10.8 11.4 41.5 39.2 19.2 09.1 41.5 39.2 19.2 09.2 82.2 8.9 8.9
Mean (SD)
55.1 (14.8)
28.1 (11.6)
16.8 (4.6)
Time detected inside Port Stephens estuary
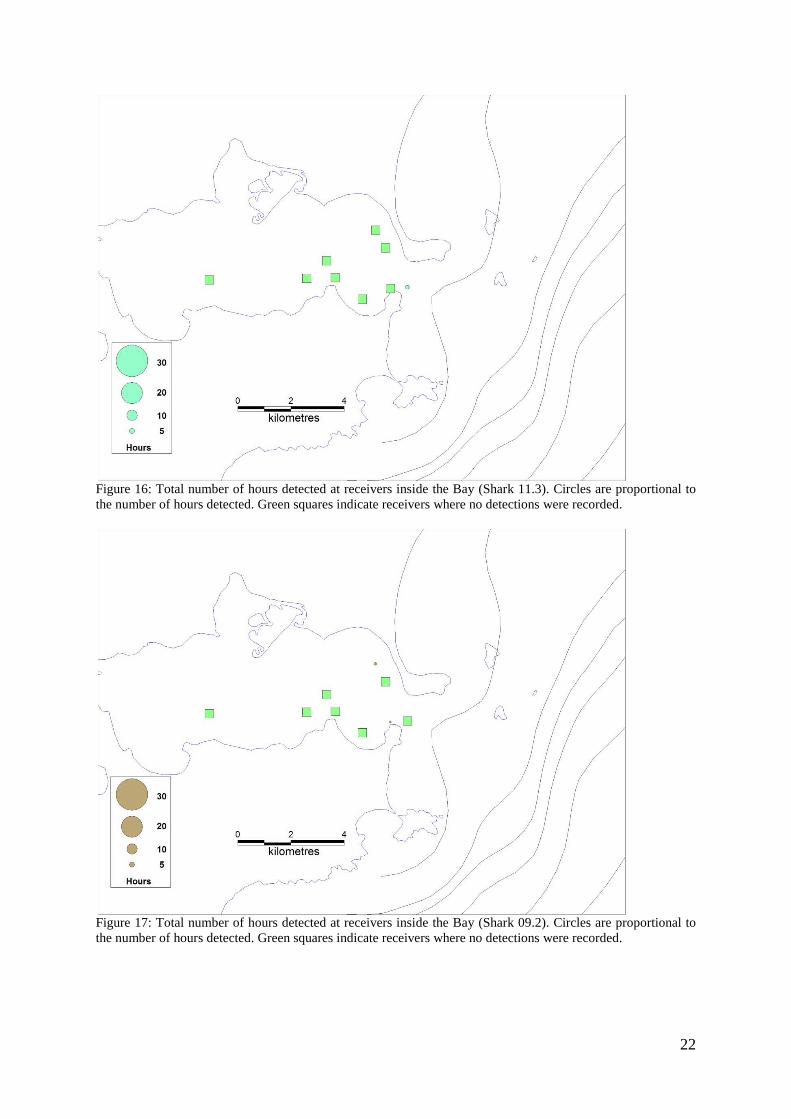
Bay receivers were defined as all receivers that were deployed inside the Port Stephens estuary including at Tomaree Head (Figure 10). Seven out of the 11 sharks detected in the study area were recorded by receivers in the Port Stephens estuary (the ‘Bay’) from early October to late January, although one of these sharks was only detected briefly by the Tomaree Head receiver (Figures 11–17). Cumulatively, sharks were detected on 158 hours within the Bay representing 6.2% of total hours detected and accounting for a mean across sharks of 0.6% of their nursery area residency. Time detected in the Bay was highly variable between sharks and ranged across individual totals of 2–104 hrs. Sharks were detected at every deployed receiver. However, there was a consistent pattern of detections with the two stations on the northern side of the Bay (near Jimmy’s Beach) accounting for 48.1% of all hours where sharks were detected. Five of the seven sharks detected in the Bay made multiple entries to the estuary with one shark being detected over periods spanning up to eight consecutive days at a time. Daily time spent in the Bay was generally punctuated by returns to Bennett’s Beach or island habitats, with few detection patterns suggesting multi-day, continuous residency in the Bay. However, some multi-day residency cannot be ruled out due to the limited overall spatial coverage by receivers.
19
Figure 10: Locations of ‘Bay’ receivers within Port Stephens. Green squares mark the location of receiver moorings.
Figure 11: Total number of hours detected at receivers inside the Bay (Shark 12.2). Circles are proportional to the number of hours detected. Green squares indicate receivers where no detections were recorded.

20
Figure 12: Total number of hours detected at receivers inside the Bay (Shark 12.3). Circles are proportional to the number of hours detected. Green square indicates receiver where no detections were recorded.
Figure 13: Total number of hours detected at receivers inside the Bay (Shark 12.4). Circles are proportional to the number of hours detected. Green squares indicate receivers where no detections were recorded.
21
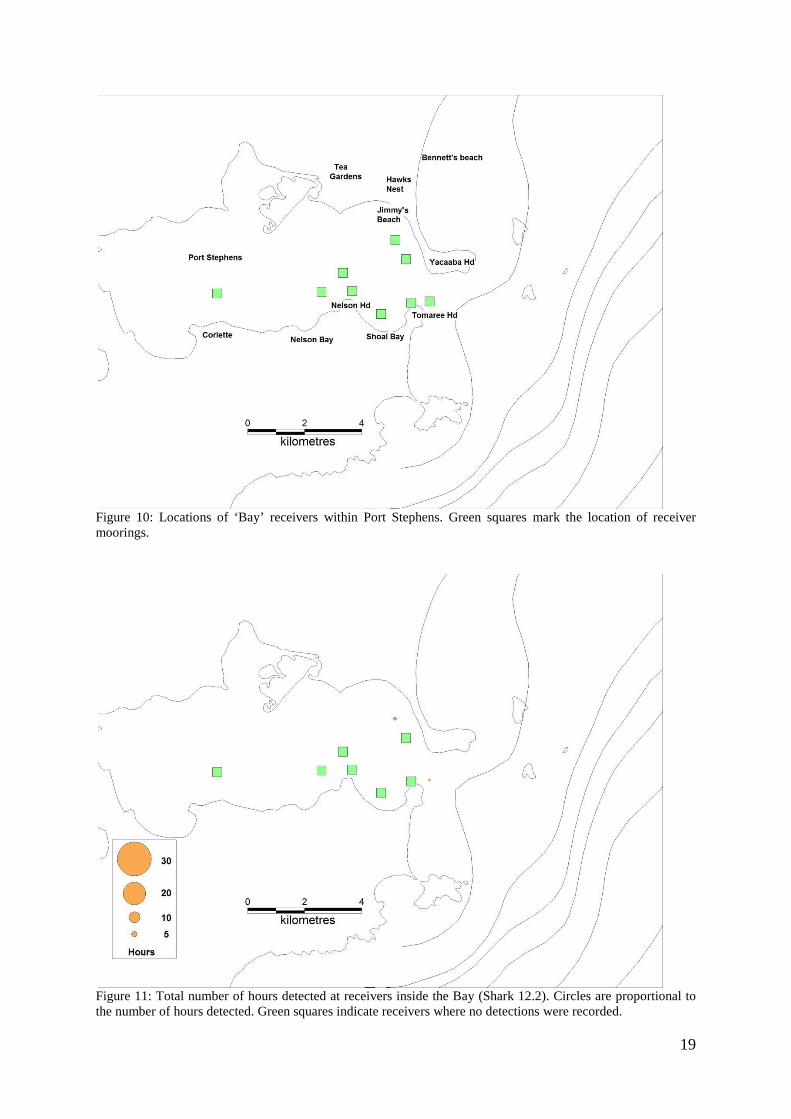
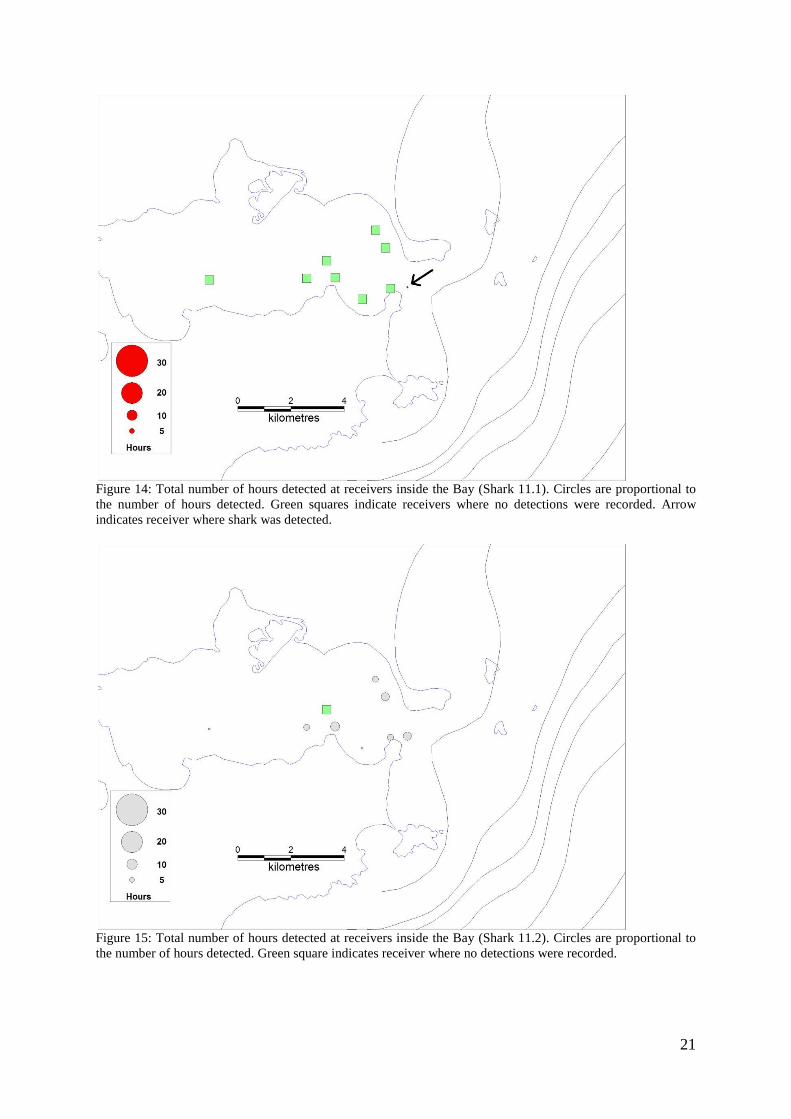
Figure 14: Total number of hours detected at receivers inside the Bay (Shark 11.1). Circles are proportional to the number of hours detected. Green squares indicate receivers where no detections were recorded. Arrow indicates receiver where shark was detected.
Figure 15: Total number of hours detected at receivers inside the Bay (Shark 11.2). Circles are proportional to the number of hours detected. Green square indicates receiver where no detections were recorded.
22
Figure 16: Total number of hours detected at receivers inside the Bay (Shark 11.3). Circles are proportional to the number of hours detected. Green squares indicate receivers where no detections were recorded.
Figure 17: Total number of hours detected at receivers inside the Bay (Shark 09.2). Circles are proportional to the number of hours detected. Green squares indicate receivers where no detections were recorded.
23
Aerial surveys
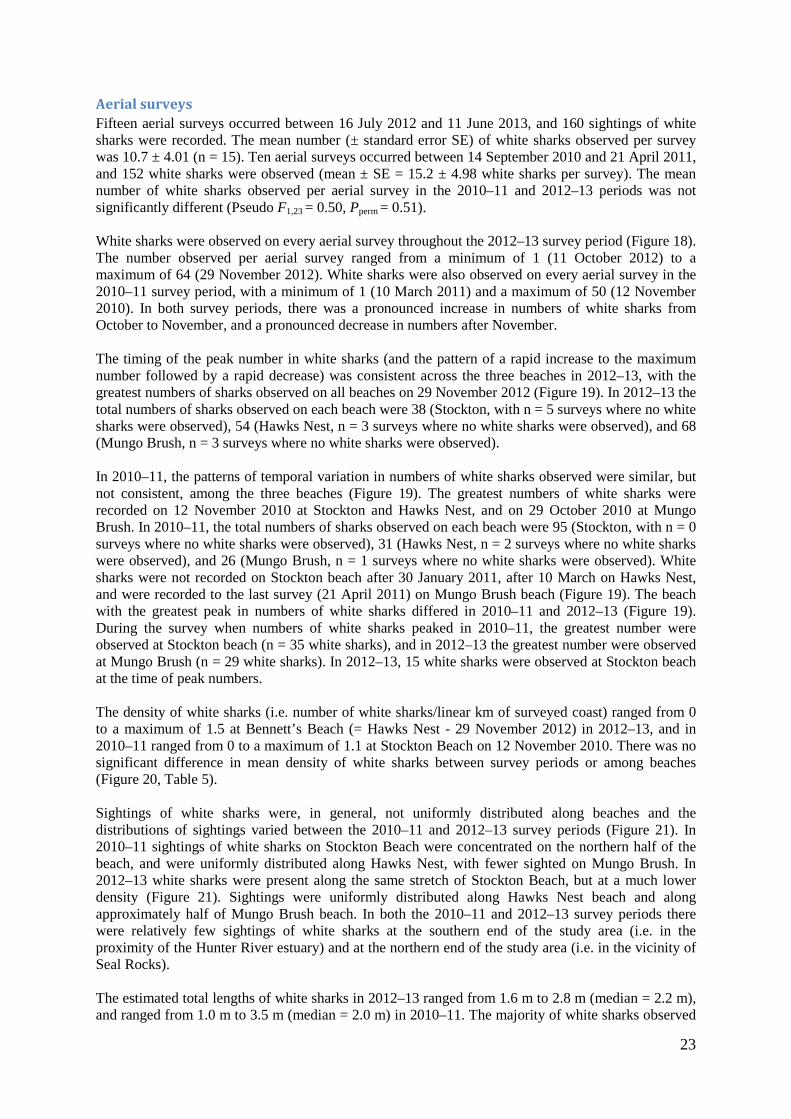
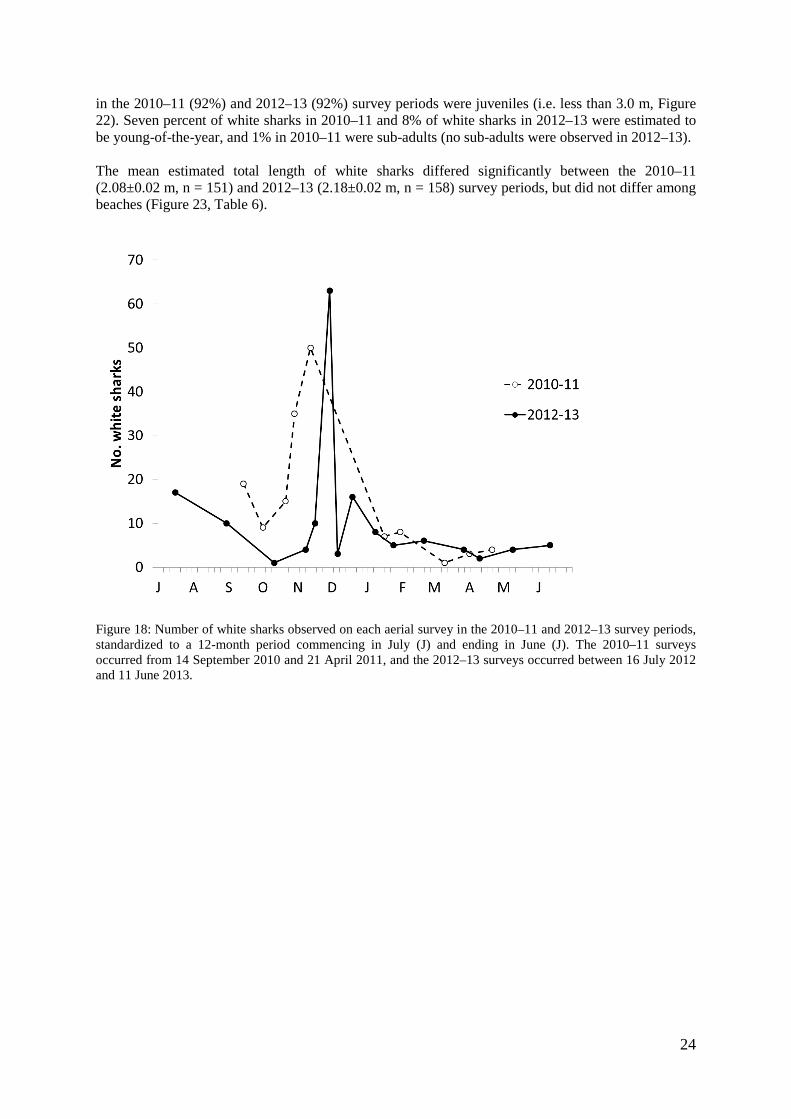
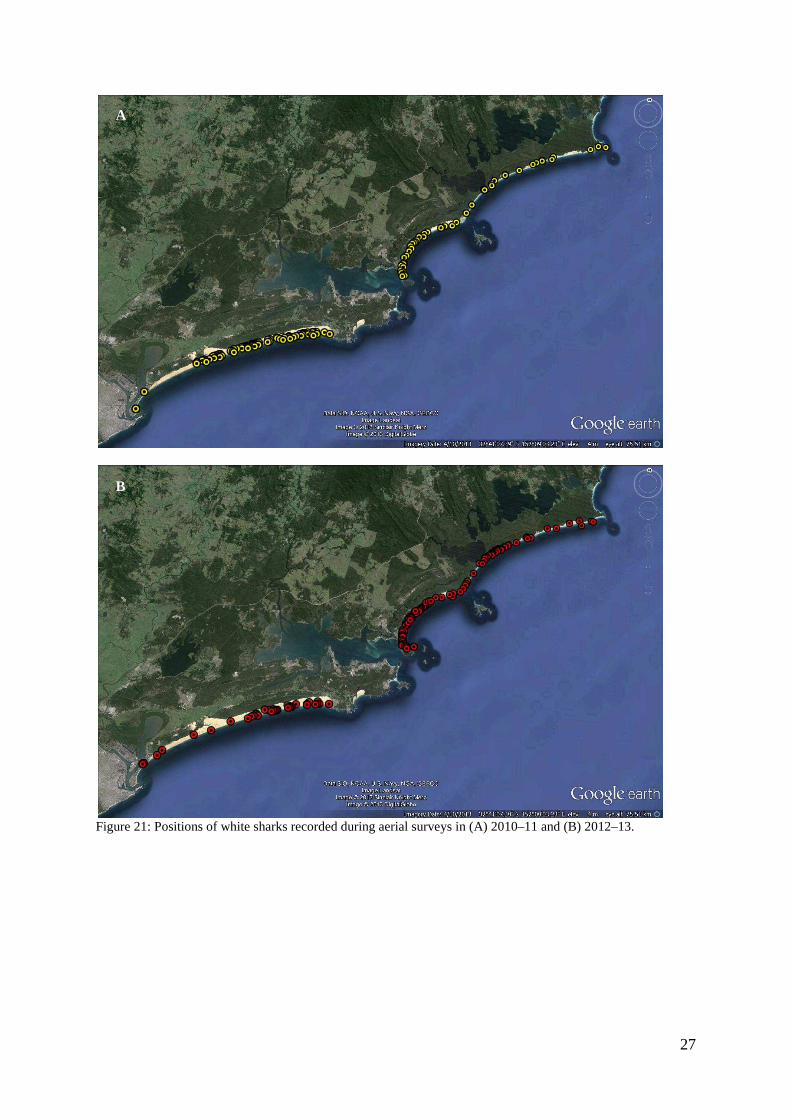
Fifteen aerial surveys occurred between 16 July 2012 and 11 June 2013, and 160 sightings of white sharks were recorded. The mean number (± standard error SE) of white sharks observed per survey was 10.7 ± 4.01 (n = 15). Ten aerial surveys occurred between 14 September 2010 and 21 April 2011, and 152 white sharks were observed (mean ± SE = 15.2 ± 4.98 white sharks per survey). The mean number of white sharks observed per aerial survey in the 2010–11 and 2012–13 periods was not significantly different (Pseudo F1,23 = 0.50, Pperm = 0.51). White sharks were observed on every aerial survey throughout the 2012–13 survey period (Figure 18). The number observed per aerial survey ranged from a minimum of 1 (11 October 2012) to a maximum of 64 (29 November 2012). White sharks were also observed on every aerial survey in the 2010–11 survey period, with a minimum of 1 (10 March 2011) and a maximum of 50 (12 November 2010). In both survey periods, there was a pronounced increase in numbers of white sharks from October to November, and a pronounced decrease in numbers after November. The timing of the peak number in white sharks (and the pattern of a rapid increase to the maximum number followed by a rapid decrease) was consistent across the three beaches in 2012–13, with the greatest numbers of sharks observed on all beaches on 29 November 2012 (Figure 19). In 2012–13 the total numbers of sharks observed on each beach were 38 (Stockton, with n = 5 surveys where no white sharks were observed), 54 (Hawks Nest, n = 3 surveys where no white sharks were observed), and 68 (Mungo Brush, n = 3 surveys where no white sharks were observed). In 2010–11, the patterns of temporal variation in numbers of white sharks observed were similar, but not consistent, among the three beaches (Figure 19). The greatest numbers of white sharks were recorded on 12 November 2010 at Stockton and Hawks Nest, and on 29 October 2010 at Mungo Brush. In 2010–11, the total numbers of sharks observed on each beach were 95 (Stockton, with n = 0 surveys where no white sharks were observed), 31 (Hawks Nest, n = 2 surveys where no white sharks were observed), and 26 (Mungo Brush, n = 1 surveys where no white sharks were observed). White sharks were not recorded on Stockton beach after 30 January 2011, after 10 March on Hawks Nest, and were recorded to the last survey (21 April 2011) on Mungo Brush beach (Figure 19). The beach with the greatest peak in numbers of white sharks differed in 2010–11 and 2012–13 (Figure 19). During the survey when numbers of white sharks peaked in 2010–11, the greatest number were observed at Stockton beach (n = 35 white sharks), and in 2012–13 the greatest number were observed at Mungo Brush (n = 29 white sharks). In 2012–13, 15 white sharks were observed at Stockton beach at the time of peak numbers. The density of white sharks (i.e. number of white sharks/linear km of surveyed coast) ranged from 0 to a maximum of 1.5 at Bennett’s Beach (= Hawks Nest - 29 November 2012) in 2012–13, and in 2010–11 ranged from 0 to a maximum of 1.1 at Stockton Beach on 12 November 2010. There was no significant difference in mean density of white sharks between survey periods or among beaches (Figure 20, Table 5). Sightings of white sharks were, in general, not uniformly distributed along beaches and the distributions of sightings varied between the 2010–11 and 2012–13 survey periods (Figure 21). In 2010–11 sightings of white sharks on Stockton Beach were concentrated on the northern half of the beach, and were uniformly distributed along Hawks Nest, with fewer sighted on Mungo Brush. In 2012–13 white sharks were present along the same stretch of Stockton Beach, but at a much lower density (Figure 21). Sightings were uniformly distributed along Hawks Nest beach and along approximately half of Mungo Brush beach. In both the 2010–11 and 2012–13 survey periods there were relatively few sightings of white sharks at the southern end of the study area (i.e. in the proximity of the Hunter River estuary) and at the northern end of the study area (i.e. in the vicinity of Seal Rocks). The estimated total lengths of white sharks in 2012–13 ranged from 1.6 m to 2.8 m (median = 2.2 m), and ranged from 1.0 m to 3.5 m (median = 2.0 m) in 2010–11. The majority of white sharks observed
in the 2010–11 (92%) and 2012–22). Seven percent of white sharks in 2010be young-of-the-year, and 1% in 2010 The mean estimated total length of white sharks differed significantly between the 2010(2.08±0.02 m, n = 151) and 2012beaches (Figure 23, Table 6).
Figure 18: Number of white sharks observed on each aerial survey in the 2010standardized to a 12-month period commencing in July (J) and ending in June (J). The 2010occurred from 14 September 2010 aand 11 June 2013.
–13 (92%) survey periods were juveniles (i.e. less than 3.0 m, ). Seven percent of white sharks in 2010–11 and 8% of white sharks in 2012–
year, and 1% in 2010–11 were sub-adults (no sub-adults were observed in 2012
total length of white sharks differed significantly between the 2010151) and 2012–13 (2.18±0.02 m, n = 158) survey periods, but did not differ among
Number of white sharks observed on each aerial survey in the 2010–11 and 2012month period commencing in July (J) and ending in June (J). The 2010
14 September 2010 and 21 April 2011, and the 2012–13 surveys occurred between 16 July 2012
24
i.e. less than 3.0 m, Figure –13 were estimated to
adults were observed in 2012–13).
total length of white sharks differed significantly between the 2010–11 158) survey periods, but did not differ among
11 and 2012–13 survey periods,
month period commencing in July (J) and ending in June (J). The 2010–11 surveys 13 surveys occurred between 16 July 2012
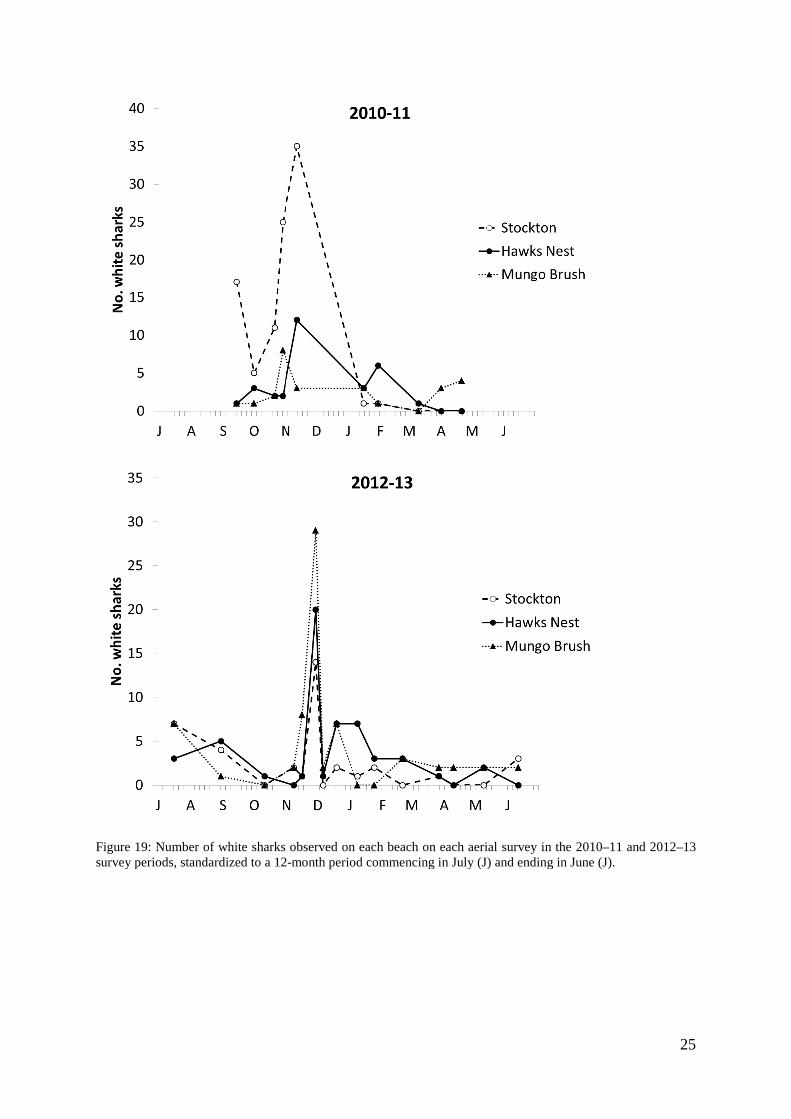
Figure 19: Number of white sharks observed on each beach on each aerial survey in the 2010survey periods, standardized to a 12
Number of white sharks observed on each beach on each aerial survey in the 2010survey periods, standardized to a 12-month period commencing in July (J) and ending in June (J).
25
Number of white sharks observed on each beach on each aerial survey in the 2010–11 and 2012–13
commencing in July (J) and ending in June (J).
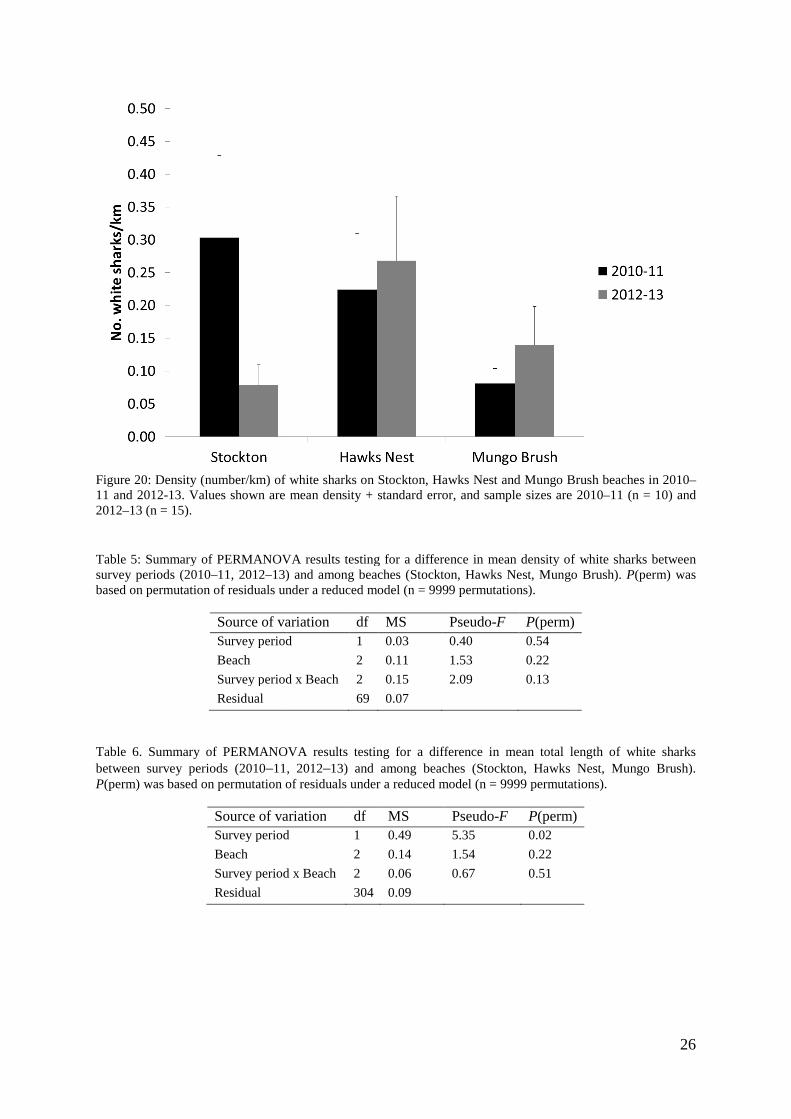
Figure 20: Density (number/km) of white sharks on Stockton, Hawks Nest and Mungo Brush beaches in 201011 and 2012-13. Values shown are mean density2012–13 (n = 15). Table 5: Summary of PERMANOVA results testing for a difference in mean density of white sharks between survey periods (2010–11, 2012–13) and among beaches (Stockton, Hawks Nest, Mungo Brush). based on permutation of residuals under a reduced model (n
Source of variationSurvey period
Beach
Survey period
Residual
Table 6. Summary of PERMANOVA results between survey periods (2010–11, 2012P(perm) was based on permutation of residuals under a reduced model (n
Source of variationSurvey period
Beach
Survey period x
Residual
Density (number/km) of white sharks on Stockton, Hawks Nest and Mungo Brush beaches in 201013. Values shown are mean density + standard error, and sample sizes are 2010
Summary of PERMANOVA results testing for a difference in mean density of white sharks between 13) and among beaches (Stockton, Hawks Nest, Mungo Brush).
duals under a reduced model (n = 9999 permutations).
Source of variation df MS Pseudo-F P(perm)Survey period 1 0.03 0.40 0.54
2 0.11 1.53 0.22
Survey period x Beach 2 0.15 2.09 0.13
69 0.07
. Summary of PERMANOVA results testing for a difference in mean total length of white sharks 11, 2012–13) and among beaches (Stockton, Hawks Nest, Mungo Brush).
(perm) was based on permutation of residuals under a reduced model (n = 9999 permutations).
rce of variation df MS Pseudo-F P(perm)Survey period 1 0.49 5.35 0.02
2 0.14 1.54 0.22
period x Beach 2 0.06 0.67 0.51
304 0.09
26
Density (number/km) of white sharks on Stockton, Hawks Nest and Mungo Brush beaches in 2010–
standard error, and sample sizes are 2010–11 (n = 10) and
Summary of PERMANOVA results testing for a difference in mean density of white sharks between 13) and among beaches (Stockton, Hawks Nest, Mungo Brush). P(perm) was
(perm)
testing for a difference in mean total length of white sharks 13) and among beaches (Stockton, Hawks Nest, Mungo Brush).
9999 permutations).
(perm)
27
Figure 21: Positions of white sharks recorded during aerial surveys in (A) 2010–11 and (B) 2012–13.
A
B
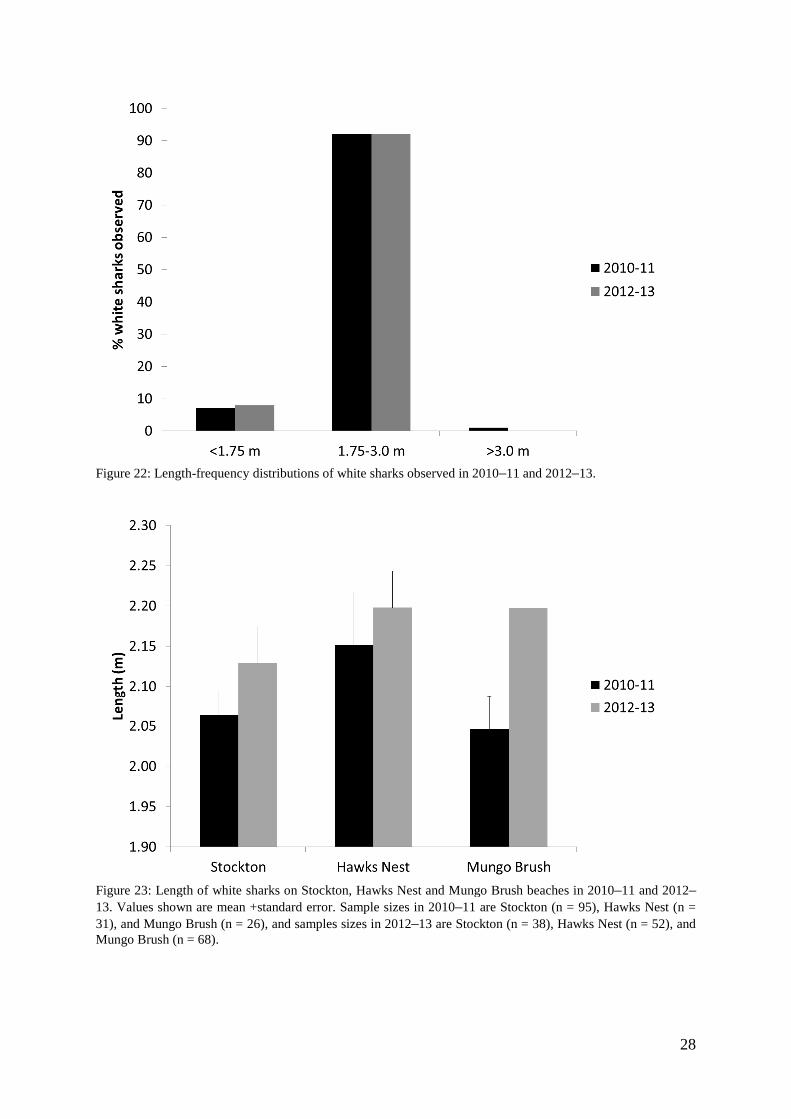
Figure 22: Length-frequency distributions of white sharks observed in 2010
Figure 23: Length of white sharks on Stockton, Hawks Nest and Mungo Brush beaches in 201013. Values shown are mean +standard error. Sample sizes in 201031), and Mungo Brush (n = 26), and samples sizes in 2012Mungo Brush (n = 68).
frequency distributions of white sharks observed in 2010–11 and 2012–
Length of white sharks on Stockton, Hawks Nest and Mungo Brush beaches in 2010+standard error. Sample sizes in 2010–11 are Stockton (n =26), and samples sizes in 2012–13 are Stockton (n = 38), Hawks Nest (n
28
–13.
Length of white sharks on Stockton, Hawks Nest and Mungo Brush beaches in 2010–11 and 2012–
= 95), Hawks Nest (n = 38), Hawks Nest (n = 52), and
29
Corrected abundance estimates
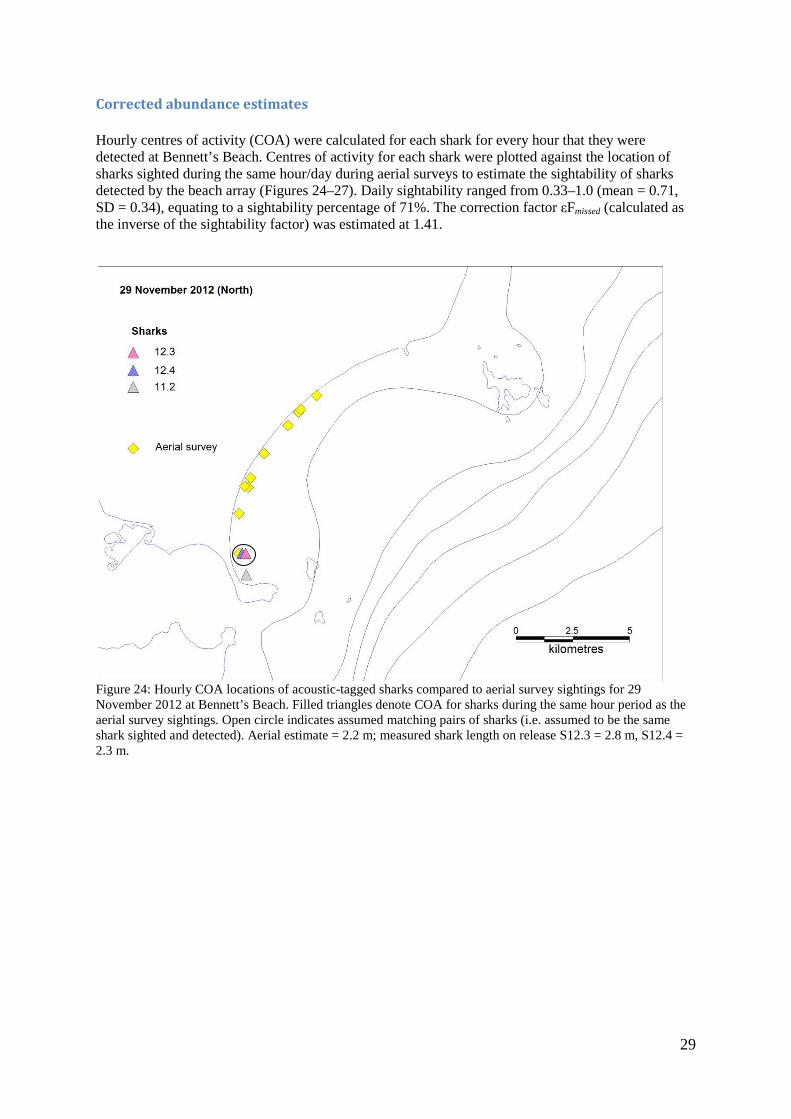
Hourly centres of activity (COA) were calculated for each shark for every hour that they were detected at Bennett’s Beach. Centres of activity for each shark were plotted against the location of sharks sighted during the same hour/day during aerial surveys to estimate the sightability of sharks detected by the beach array (Figures 24–27). Daily sightability ranged from 0.33–1.0 (mean = 0.71, SD = 0.34), equating to a sightability percentage of 71%. The correction factor εFmissed (calculated as the inverse of the sightability factor) was estimated at 1.41.
Figure 24: Hourly COA locations of acoustic-tagged sharks compared to aerial survey sightings for 29 November 2012 at Bennett’s Beach. Filled triangles denote COA for sharks during the same hour period as the aerial survey sightings. Open circle indicates assumed matching pairs of sharks (i.e. assumed to be the same shark sighted and detected). Aerial estimate = 2.2 m; measured shark length on release S12.3 = 2.8 m, S12.4 = 2.3 m.

30
Figure 25: Hourly COA locations of acoustic-tagged sharks compared to aerial survey sightings for 19 December 2012 at Bennett’s Beach. Filled triangles denote COA for sharks during the same hour period as the aerial survey sightings. Open circle indicates assumed matching pairs of sharks (i.e. assumed to be the same shark sighted and detected). Aerial estimate = 2.2 m; measured shark length on release S12.3 = 2.8 m.
Figure 26: Hourly COA locations of acoustic-tagged sharks compared to aerial survey sightings for 8 January 2013 at Bennett’s Beach. Filled triangles denote COA for sharks during the same hour period as the aerial survey sightings. Open circle indicates assumed matching pairs of sharks (i.e. assumed to be the same shark sighted and detected). Aerial estimate = 1.6 m; measured shark length on release S12.2 = 2.2 m.
31
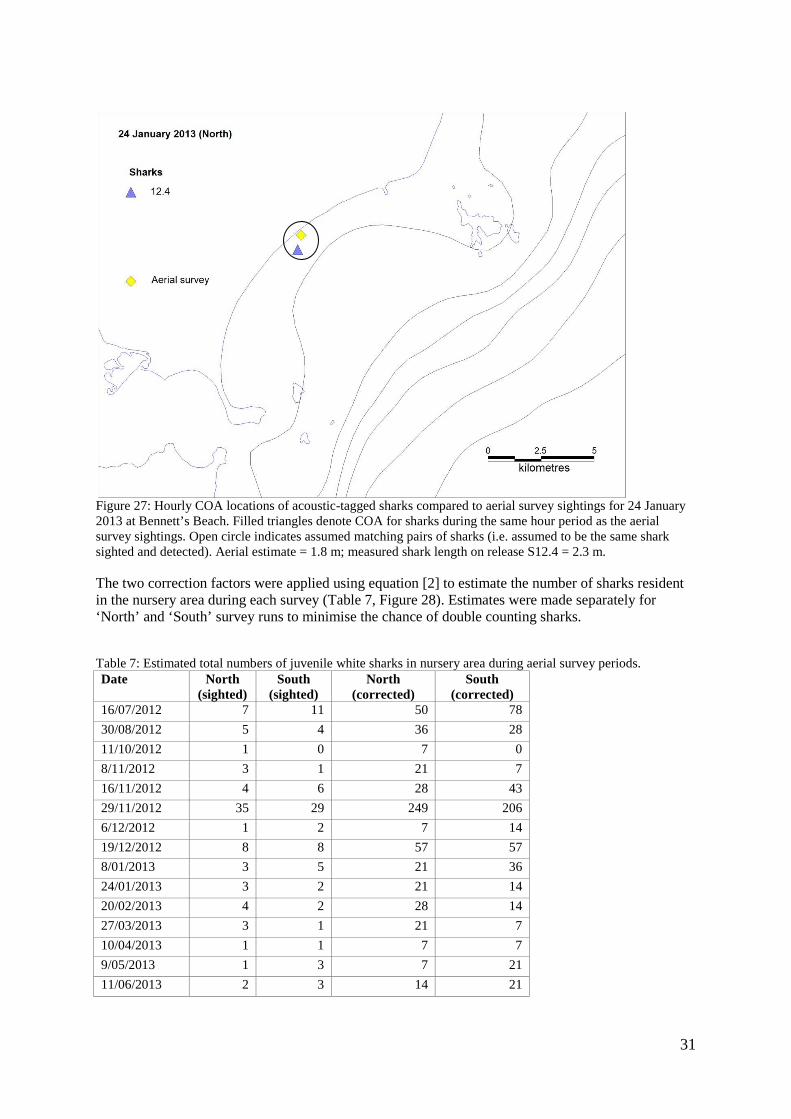
Figure 27: Hourly COA locations of acoustic-tagged sharks compared to aerial survey sightings for 24 January 2013 at Bennett’s Beach. Filled triangles denote COA for sharks during the same hour period as the aerial survey sightings. Open circle indicates assumed matching pairs of sharks (i.e. assumed to be the same shark sighted and detected). Aerial estimate = 1.8 m; measured shark length on release S12.4 = 2.3 m. The two correction factors were applied using equation [2] to estimate the number of sharks resident in the nursery area during each survey (Table 7, Figure 28). Estimates were made separately for ‘North’ and ‘South’ survey runs to minimise the chance of double counting sharks. Table 7: Estimated total numbers of juvenile white sharks in nursery area during aerial survey periods. Date North
(sighted) South
(sighted) North
(corrected) South
(corrected) 16/07/2012 7 11 50 78
30/08/2012 5 4 36 28
11/10/2012 1 0 7 0
8/11/2012 3 1 21 7
16/11/2012 4 6 28 43
29/11/2012 35 29 249 206
6/12/2012 1 2 7 14
19/12/2012 8 8 57 57
8/01/2013 3 5 21 36
24/01/2013 3 2 21 14
20/02/2013 4 2 28 14
27/03/2013 3 1 21 7
10/04/2013 1 1 7 7
9/05/2013 1 3 7 21
11/06/2013 2 3 14 21
32
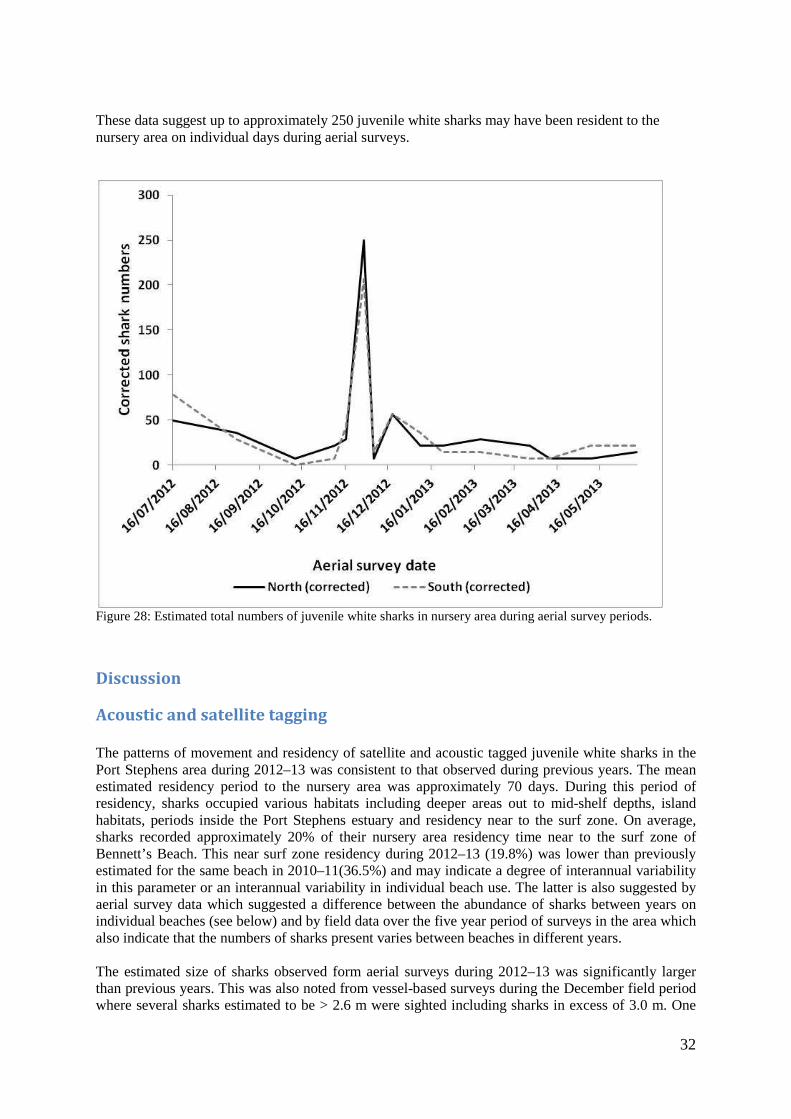
These data suggest up to approximately 250 juvenile white sharks may have been resident to the nursery area on individual days during aerial surveys.
Figure 28: Estimated total numbers of juvenile white sharks in nursery area during aerial survey periods.
Discussion
Acoustic and satellite tagging
The patterns of movement and residency of satellite and acoustic tagged juvenile white sharks in the Port Stephens area during 2012–13 was consistent to that observed during previous years. The mean estimated residency period to the nursery area was approximately 70 days. During this period of residency, sharks occupied various habitats including deeper areas out to mid-shelf depths, island habitats, periods inside the Port Stephens estuary and residency near to the surf zone. On average, sharks recorded approximately 20% of their nursery area residency time near to the surf zone of Bennett’s Beach. This near surf zone residency during 2012–13 (19.8%) was lower than previously estimated for the same beach in 2010–11(36.5%) and may indicate a degree of interannual variability in this parameter or an interannual variability in individual beach use. The latter is also suggested by aerial survey data which suggested a difference between the abundance of sharks between years on individual beaches (see below) and by field data over the five year period of surveys in the area which also indicate that the numbers of sharks present varies between beaches in different years. The estimated size of sharks observed form aerial surveys during 2012–13 was significantly larger than previous years. This was also noted from vessel-based surveys during the December field period where several sharks estimated to be > 2.6 m were sighted including sharks in excess of 3.0 m. One
33
shark captured and tagged was 3.2 m (measured length). These sharks showed similar behaviour in the surf zone area that has previously been recorded for smaller sharks. However, the tagged 3.2 m shark was not recorded by acoustic receivers at the beach after tagging and occupied deeper waters of the mid-shelf region of the nursery area for its remaining period of residency. This may represent the more common behaviour of larger juveniles when residing in the nursery area; however, further tagging of sharks of this size would be required to test this. Some discrepancy was noted between the size of juvenile white sharks estimated from vessel surveys to the concurrent size estimates from aerial surveys, with the vessel-based surveys indicating a larger size of shark. The veracity of size estimates from both the vessel and the air will require further testing to improve their accuracy and the experimental methodology to undertake this testing is the subject of on-going development. Only one of the five sharks tagged with satellite tracking tags followed the expected pattern of movement between the Port Stephens and Corner Inlet-90 Mile Beach nursery areas as evidenced by sharks tagged in previous years. Interestingly, the only shark to do so was Shark 12.1, the 3.2 m female which subsequently moved into and across the Tasman Sea before residing (at least temporarily) off Stewart Island, New Zealand. Stewart Island has an established shark cage-dive industry focussed on a known aggregation of white sharks in that area (Duffy et al. 2012). Shark 12.1 was detected on an acoustic receiver array maintained by the National Institute of water and Atmospheric Research, New Zealand (NIWA) in the Stewart Island area on 9 March 2013 (M. Francis, pers. com.). A 2.0 m juvenile white shark similarly travelled from the Port Stephens nursery area to New Zealand in 2007 (Bruce and Bradford 2012) and continues to support a link between east coast Australian and New Zealand residency areas. The remaining sharks showed either some evidence of movement away from the Port Stephens nursery area either south (as expected) or to the north before transmissions ceased. However, two sharks showed evidence of remaining in or near to the nursery area for periods extending across the summer, autumn and into winter. This pattern has not been reflected in previous years’ data. One shark in particular (Shark 12.5) appears to have had a continuous presence in or adjacent to the Port Stephens nursery area from October 2012 to June 2013. All five sharks tagged in 2012 were detected on a range of acoustic receivers during the study period. Sharks acoustically-tagged in 2009 and 2011 were also detected. The lack of detection of 2007-tagged sharks was expected due to the likely shedding of their externally applied tags. Sharks tagged in 2008 may have exceeded the size/age where common residency in nursery areas occurs. Tagging in 2010 occurred at Stockton Beach, south of Port Stephens and the lack of detection of these sharks supports the pattern of beach-specific nursery area use reported by Bruce and Bradford (2012). Indeed, sharks tagged during the 2012 study period at Bennett’s Beach, spent very little time in or near to the surf zone of other beaches (including Stockton) based on satellite tracking (with the exception of Shark 12.3 which spent some time at Mungo Brush), despite ranging broadly throughout the recognised Port Stephens nursery area. This suggests that additional acoustic monitoring of Stockton Beach and Mungo Brush will be important if tagging occurs at these beaches in future and to adequately assess the multi-year residency and survival of sharks previously tagged in that area. Several sharks spent relatively short but significant periods inside the bay and sharks were detected at all bay receivers including off Corlette, approximately 7.5 km inside the heads. Sharks were most frequently detected on the northern side of the bay in the vicinity of Jimmy’s Beach. It is of note that the only two attacks on people by white sharks in the region have occurred in this area.
Aerial surveys
The 2012–13 surveys showed that juvenile white sharks were present in the study area throughout the year. This extends previous findings from the 2010–11 aerial surveys and acoustic tracking (Bruce and Bradford 2011) that juvenile white sharks use the area between September and April and continues to support that the Port Stephens region is a nursery area for the species (Bruce and Bradford 2008, 2012). Surveys in both 2010–2011 and 2012–2013 recorded low numbers of sharks,
34
estimated based on their size, to be young-of-the year sharks suggesting that at some sharks may have periods of residency within the Port Stephens nursery area during their first year of life. However, there was some evidence of underestimating shark length during aerial surveys (see below), thus the presence of young of the year juveniles is yet to be confirmed and thus there still remains no significant evidence to support that white sharks use the Port Stephens area as a pupping ground. Tagging studies suggest that juvenile white sharks exhibit residency and travelling behaviours (Bruce and Bradford 2012), and the change in numbers of white sharks through time in the Stockton-Mungo Brush study area (in both the 2010–11 and 2012–13 survey periods) supports this hypothesis. Overlaying the year-round occurrence of juvenile white sharks in the study area was a pronounced peak in abundance in November, which was observed in both 2010 and 2012. Four aerial surveys between 8 November 2012 and 6 December 2012, confirmed that this peak abundance was transitory and possibly lasted for less than 14 days. Poor survey conditions on 6 December (due to turbid water) may have led to an under-estimate of the number of white sharks present in the area; however, the low number of white sharks observed in the next aerial survey suggests that the major decline in numbers by early December was likely to be real. The observed changes in numbers after the November 2010 peak suggest a slower reduction in abundance, however this may be due to the long time interval to the next survey (from 12 November 2010 to 16 January 2011) resulting from poor weather and unsuitable survey conditions. Acoustic detection data also indicated a drop in the number of sharks detected after mid-December 2012 with some sharks persisting in the area until March 2013. More frequent aerial surveys during late October-mid December will reveal the duration of the period of peak abundance, and provide some evidence for explanatory hypotheses. The abundance of sharks at specific beaches in the nursery area varied between aerial survey periods with the highest number of sharks being observed along Stockton beach in 2010–11 whereas Mungo Brush recorded the highest number of sharks in 2012–13. The aerial surveys also noted (not reported here) that survey conditions along Stockton Beach were typically less favourable for observing sharks than either Hawks Nest or Mungo Brush, due to its greater exposure to prevailing south-easterly winds and increased turbidity due to a greater influence of flood plumes extending north from the Hunter River and more frequent algal blooms. Although it has been noted in population studies of other marine fauna based on aerial surveys that counts were affected by sea and weather conditions (e.g. Bayliss 1986), it is likely that the shift from Stockton to Mungo Brush was a real phenomenon (and unrelated to differing survey conditions), as similar year-to-year variations have been observed previously during vessel-based field surveys within the nursery area. The 2012–13 aerial surveys provide no evidence of any change in numbers of white sharks since the 2010–11 aerial surveys. The total numbers of white sharks sighted was similar in the 2010–11 (n=152) and 2012–13 (n=160) survey periods, and the mean density of white sharks, did not differ between the survey periods. Correction factors estimated between aerial survey periods were similar with respect to the mean nursery area residency period (2010–11 = 65.0 d; 2012–13 = 69.9 d) as were the estimates of the number of sharks present that were not observed by the aerial survey (2010–11 εFmissed = 1.29; 2012–2013 εFmissed = 1.41). However, the mean period of residency at Bennett’s Beach for sharks during 2012–13 (19.8% of nursery area residency time) was less than previously recorded (2010–11 = 36.5 %). Whether this difference represents interannual variability or is thus far a result of relatively low sample sizes will require additional data to determine. The total lengths of white sharks observed in 2012–13 were estimated during aerial surveys and during the tagging operations from the boat, and were also measured for white sharks that were captured and tagged. Aerial and boat surveys both occurred on 19 December 2012 and allow estimates of total length from the two sources to be compared. The maximum total length recorded from the aerial surveys was 2.4 m and the maximum total length recorded from the boat was 3.5 m. The boat observers also estimated the total lengths of two other white sharks on that day as 3.2 and 3.3 m. On 20 December a 3.2 m white shark was captured and tagged. The largest total length
35
recorded during the aerial surveys was therefore substantially less than the largest total length estimated from the boat surveys. There are several possible reasons for this discrepancy. Assuming the same sample of white sharks was observed by both sources, the aerial survey observers may have under-estimated the total length of white sharks and/or the boat survey observers may have over-estimated the total length. Excluding the white sharks observed on Stockton (the tagging boat did not work at Stockton on 19 December), the aerial survey observed 12 sharks, seven of which were estimated to be less than 2.0 m total length. By comparison, none of the boat-based observations of total length on 19 December were less than 2.0 m. Additionally, the two white sharks captured and tagged on 19 December were within the range of the estimated lengths (2.2 and 2.6 m), and were towards the upper end of the distribution of total lengths estimated from the aerial surveys. Estimated length of sharks sighted from aerial surveys compared to the measured length of sharks assumed to be the same individual based on their location determined from the acoustic array suggests a consistent under-estimate of shark length by the aerial survey team. An alternative explanation is that the two survey teams observed different samples of the white shark population, due to the difference in timing and total durations of the two surveys. The times when white sharks were observed by the boat survey spanned the time period 1015-1443 h, whereas the times when white sharks were observed by aerial survey spanned the time period 0919-1023 h. However, the largest white shark observed by the boat survey (3.5 m at 1015 h) overlapped with the time of the aerial surveys in the same area. It is therefore likely that total lengths estimated from the aerial surveys were under-estimated actual total length. Developing procedures to improve the accuracy of length estimates from aerial surveys are part of an on-going program to improve knowledge of the species in the area.
Acknowledgements This project was made possible as a result of funding assistance from the Hunter-Central Rivers Catchment Management Authority (via Catchment Action NSW and the Australian Government Caring for Our Country program). Logistic support for field work including vessels and personnel was provided by NSW Department of Primary Industries (DPI) and the Tag-for-Life Foundation. Satellite tracking tags were provided by the Melbourne Aquarium, and the Marine Conservation Science Institute. Some data for this study were sourced from the Integrated Marine Observing System (IMOS) via the Australian Animal Tracking and Monitoring System – IMOS is supported by the Australian Government through the National Collaborative Research Infrastructure Strategy and the Super Science Initiative. The project could not have been completed without the assistance of Brian Hughes (Hunter-Central Rivers Catchment Management Authority, Kent Stannard (Tag-for-Life), Deb Carling (Slattery Helicopter Charters), Glenn Smith (Eyre & Smith Re-Build Welding and Tracks Pty Ltd), Paul Hamilton (Melbourne Aquarium) and Michael Domeier (Marine Conservation Science Institute, Hawaii). This work was carried out under NSW Department of Primary Industries Animal Ethics permit: ACEC 12/07 – (CSIRO), ACEC 2010-431A – (University of Technology) and NSW DPI Scientific Research Permit: P07/0099–4.0
References Anderson, M. J. (2001). A new method for non-parametric multivariate analysis of variance. Austral Ecology 26: 32–46. Bayliss, P. (1986). Factors affecting aerial surveys of marine fauna, and their relationship to a census of dugongs in the coastal waters of the Northern-Territory. Australian Wildlife Research 13: 27–37.
36
Blower, D. C., Gomez-Cabrera, M. C., Bruce, B. D., Pandolfi, J. M. and Ovenden, J. R. (2012). Population genetics of Australian white shark (Carcharodon carcharias) reveals a far more complicated breeding and dispersal biology than simple female-mediated philopatry. Marine Ecology Progress Series. 455: 229–244. Bradford, R. W., Bruce, B. D. and Hobday, A. (2012). Identifying juvenile white shark behaviour from electronic tag data. In Domeier, M. (ed) Global Perspectives on the Biology and Life History of the Great White Shark. CRC Press, Boca Raton, FL. pp 255–270. Bruce, B. D. (1992). Preliminary observations on the biology of the white shark, Carcharodon carcharias, in South Australian waters. In Pepperell, J. G. (ed) Sharks: Biology and Fisheries. Australian Journal of Marine and Freshwater Research 43: 1–11. Bruce, B. D. (2008). White sharks: the biology and ecology of Carcharodon carcharias. In Pikitch, E. and Camhi, M. (eds) Sharks of the Open Ocean. Blackwell Scientific. pp 69–81. Bruce, B. D., Stevens, J. D. and Malcolm, H. (2006). Movements and swimming behaviour of white sharks (Carcharodon carcharias) in Australian waters. Marine Biology 150: 161–172. Bruce, B. D. and Bradford, R. W. (2008). Spatial dynamics and habitat preferences of juvenile white sharks – identifying critical habitat and options for monitoring recruitment. Final Report to The Department of Water, Heritage and the Arts. CSIRO Marine & Atmospheric Research, Hobart. 75 pp. Bruce, B. D. and Leedman, A. (2009). White shark issues paper. Report to The Department of Environment, Water, Heritage and the Arts. CSIRO Marine & Atmospheric Research, Hobart. 37 pp. Bruce, B. D. and Bradford, R. W. (2011). Near-shore habitat use by juvenile white sharks in coastal waters off Port Stephens. Final Report to Hunter Central Rivers Catchment Management Authority – June 2011. CSIRO Marine & Atmospheric Research, Hobart. 38 pp. Bruce, B. D. and Bradford, R. W. (2012). Spatial dynamics and habitat preferences of juvenile white sharks in eastern Australia. In Domeier, M. (ed) Global Perspectives on the Biology and Life History of the Great White Shark. CRC Press, Boca Raton, FL. pp 225–253. Bruce, B. D. and Bradford, R. W. (2013a). The effects of shark cage-diving operations on the behaviour and movements of white sharks, Carcharodon carcharias, at the Neptune Islands, South Australia. Marine Biology 160: 889–907. doi:10.1007/s00227-012-2124-z Bruce, B. D. and Bradford, R. W. (2013b). Protocols for capturing and tagging juvenile white sharks in near-shore waters. CSIRO Marine and Atmospheric Research Hobart, Australia. 20 pp. Bruce, B. D. and Bradford, R. W. (2013c). Incident report to the NSW DPI and the DPIPWE Animal Care and Ethics Committees, January 2013: Juvenile white shark tagging program. CSIRO Marine & Atmospheric Research, Hobart. 5 pp. Casey, J. G. and Pratt, Jr. H. L. (1985). Distribution of the white shark, Carcharodon carcharias, in the western North Atlantic. Memoirs of the Southern Californian Academy of Sciences 9: 2–14. Duffy, C. A., Francis, M. P., Manning, M. and Bonfil, R. (2012). Regional population connectivity, oceanic habitat and return migration revealed by satellite tagging of white sharks, Carcharodon carcharias, at New Zealand aggregation sites. In Domeier, M. (ed) Global Perspectives on the Biology and Life History of the Great White Shark. Boca Raton, FL. CRC Press. pp 301–318.
37
Huveneers, C., Rogers, P., Beckmann, C., Semmens, J., Bruce, B. and Seront, L. (2013). The effects of cage-diving activities on the fine-scale swimming behaviour and space use of white sharks. Marine Biology. doi:10.1007/s00227-013-2277-6 Klimley, A. P. (1985). The aerial distribution and autoecology of the white shark (Carcharodon carcharias), off the west coast of North America. Memoirs of the Southern Californian Academy of Sciences 9: 15–40. Lowe, C. G., Blasius, M. E., Jarvis, E. T., Mason, T. J., Goodmanlowe, G. D. and O’Sullivan, J. B. (2012). Historic interactions with white sharks in the Southern Californian Bight. In Domeier, M. (ed) Global Perspectives on the Biology and Life History of the Great White Shark. Boca Raton, FL. CRC Press. pp 169–185. Malcolm, H., Bruce, B. D. and Stevens, J. D. S. (2001). A review of the biology and status of white sharks in Australian waters. Final report to Environment Australia, Marine Species Protection Program. CSIRO Hobart. 114 pp. McArdle, B. H. and Anderson, M. J. (2001). Fitting multivariate models to community data: a comment on distance-based redundancy analysis. Ecology 82: 290–297. Oke, P. R. and Middleton, J. H. (2001). Nutrient enrichment off Port Stephens: the role of the East Australian Current. Continental Shelf Research 21: 587–606. Robbins, R. L. (2007). Environmental variables affecting the sexual segregation of great white sharks Carcharodon carcharias at the Neptune Islands South Australia. Journal of Fish Biology 70: 1350–1364. Robbins, R. L. and Booth, D. J. (2012). Seasonal sexual and size segregation of white sharks, Carcharodon carcharias, at the Neptune Islands, South Australia. In Domeier, M. (ed) Global Perspectives on the Biology and Life History of the Great White Shark. Boca Raton, FL. CRC Press. pp. 287–299. Semmens, J. M., Payne, N. L., Huveneers, C., Sims, D.W. and Bruce, B. D. (2013). Feeding requirements of white sharks may be higher than originally thought. Nature - Scientific Reports 3:1471. doi: 10.1038/srep01471 Strong Jr, W. R.; Murphy, R. C.; Bruce, B. D. and Nelson, D. R. (1992). Movements and associated observations of bait attracted white sharks, Carcharodon carcharias: a preliminary report. In Pepperell, J. G. (ed) Sharks: Biology and Fisheries. Australian Journal of Marine and Freshwater Research 43: 13–20. Tranter, D. J., Carpenter, D. J. and Leech, G. S. (1986). The coastal enrichment effect of the East Australian Current eddy field. Deep Sea Research 33: 1705–1728. Weng, K. C., O'Sullivan, J. B., Lowe, C. G., Winkler, C. E., Dewar, H. and Block, B. A. (2007). Movements, behavior and habitat preferences of juvenile white sharks Carcharodon carcharias in the eastern Pacific. Marine Ecology Progress Series 338: 211–224. Wintner, S. P. and Cliff, G. (1999). Age and growth determination of the white shark, Carcharodon carcharias, from the east coast of South Africa. Fishery Bulletin 97: 153–169. Zar, J. H. (1984). Biostatistical analysis. 2nd edn. Prentice Hall, Englewood Cliffs, New Jersey.
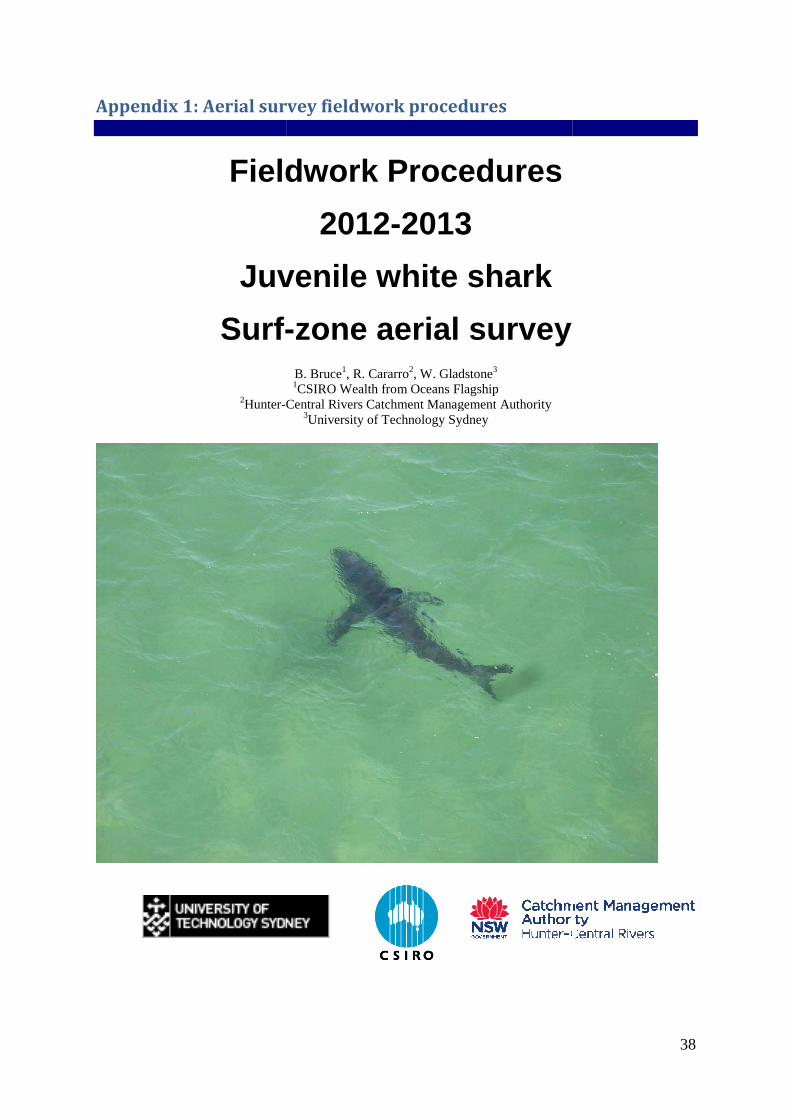
Appendix 1: Aerial survey
Fieldwork Procedures
Juvenile white shark
Surf-
2Hunter-Central Rivers Catchment Management
: Aerial survey fieldwork procedures
Fieldwork Procedures
2012-2013
Juvenile white shark
-zone aerial survey
B. Bruce1, R. Cararro2, W. Gladstone3 1CSIRO Wealth from Oceans Flagship
Central Rivers Catchment Management Authority 3University of Technology Sydney
38
39
Introduction Juvenile white sharks, JWS, (Carcharodon carcharias) are seasonally abundant along a restricted section of coastal waters in the Port Stephens region from approximately September to January each year. This section of coast serves as a nursery area for the species during that period. When present, sharks are commonly visible in the surf zone within a few hundred metres from shore. This behaviour renders them easily visible from the air and thus easily counted during aerial surveys.
The objective of this project is to undertake regular surveys of juvenile white sharks in surf zone waters between Seal Rocks and Newcastle. This is part of a larger program to estimate the abundance of juvenile white sharks, juvenile survival rates as well as overall movements and habitat use on the east coast of Australia. This larger program is coordinated by CSIRO and involves partner organisations (eg University of Technology) and with the logistic support of local agencies (eg NSW Department of Primary Industries).
When present in the Port Stephens region, satellite tracking of juvenile white sharks has revealed that individuals move in and out of the surf zone and occupy coastal waters from the shore to the 120 m bathymetric contour. Thus, the numbers of white sharks observed in the surf zone on any one survey are only a proportion of those present in the nursery area. The factors that determine the percentage of time an individual white shark spends within the surf zone where they can be counted are unknown. This project will also collect concurrent data on environmental parameters in order to elucidate relationships between these factors and surf zone habitat use.
A concurrent ongoing project led by CSIRO is examining the residency patterns of white sharks within the nursery area and specifically into and out of the surf zone environment by tagging sharks with acoustic tags and monitoring their movements using listening stations. These data will then be used to model surf zone behaviour and provide a method to scale aerial counts into estimates of juvenile white sharks within the nursery area.
CSIRO has maintained contact with Surf life Saving Australia (NSW) over previous years of tagging and satellite tracking research in the Port Stephens region since the inception of the program in 2007, providing weekly updates of shark movements. These data have been used by the Birubi and Hawks Nest Surf Life Saving Clubs in decisions on the allocation of local assets and in decisions on Club activities. It is intended that data collected from this project will similarly be provided to SLS-NSW to continue this association.
Definitions used in the survey Survey section – The three survey sections match the beaches to be surveyed. 1 = Stockton beach (Newcastle to Birubi); 2 = Hawks Nest Beach (Yacaaba Head to Little Gibba); 3 = Little Gibba to Seal Rocks [Sugarloaf Point]). Survey direction – Survey directions are classified as flying ‘North’ or flying ‘South’ along the coast. Survey run – A single directional path flying either north or south along the coast that covers one or more survey sections Waypoint – A location reference number as recorded/stored in a GPS. The corresponding Latitude and Longitude should be filled in at the end of the survey flight. Sighting – one or more marine animals detected from the plane. Event – The start or completion point of a survey; noted change in weather conditions or change in water characteristics that might influence the detection of sharks (eg large area of drift weed or dirty water). Flight – A day’s flying. AEST - Australian Eastern Standard time (GMT + 10 h) AEDT - Australian Eastern Daylight (summer) Time (GMT + 11 h) Beaufort scale – Scale of seas conditions (0-12) see Figure 1 below
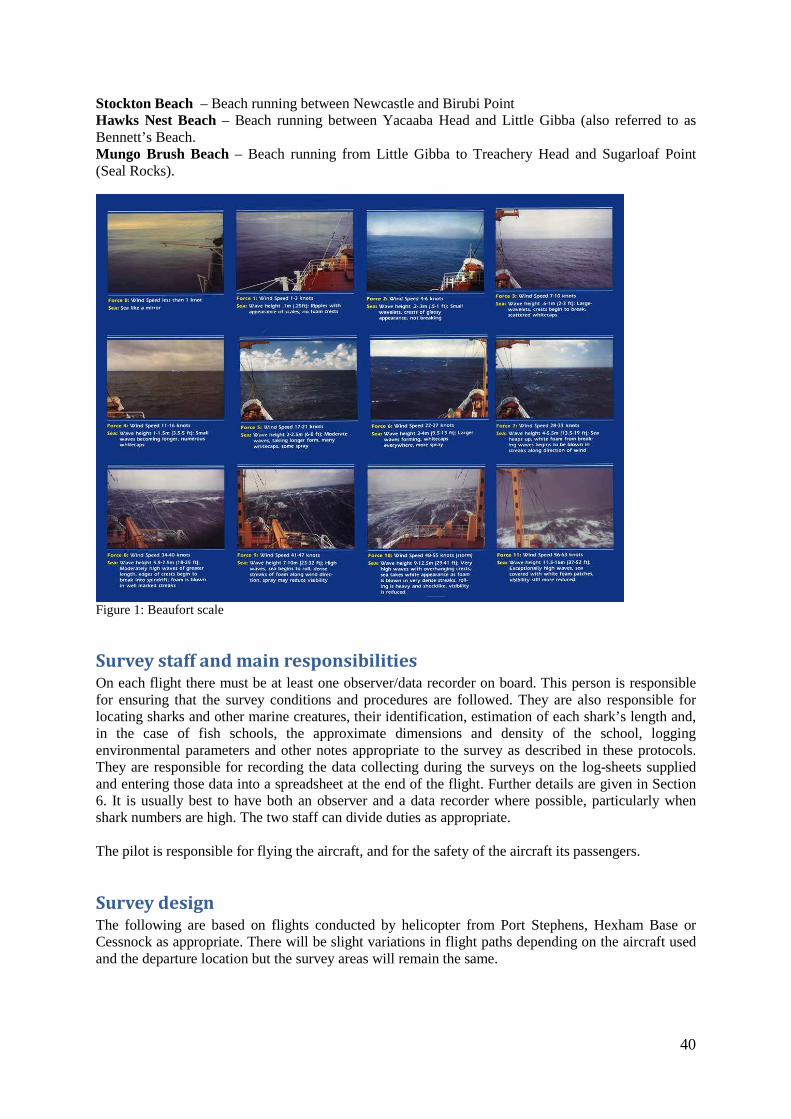
40
Stockton Beach – Beach running between Newcastle and Birubi Point Hawks Nest Beach – Beach running between Yacaaba Head and Little Gibba (also referred to as Bennett’s Beach. Mungo Brush Beach – Beach running from Little Gibba to Treachery Head and Sugarloaf Point (Seal Rocks).
Figure 1: Beaufort scale
Survey staff and main responsibilities On each flight there must be at least one observer/data recorder on board. This person is responsible for ensuring that the survey conditions and procedures are followed. They are also responsible for locating sharks and other marine creatures, their identification, estimation of each shark’s length and, in the case of fish schools, the approximate dimensions and density of the school, logging environmental parameters and other notes appropriate to the survey as described in these protocols. They are responsible for recording the data collecting during the surveys on the log-sheets supplied and entering those data into a spreadsheet at the end of the flight. Further details are given in Section 6. It is usually best to have both an observer and a data recorder where possible, particularly when shark numbers are high. The two staff can divide duties as appropriate. The pilot is responsible for flying the aircraft, and for the safety of the aircraft its passengers.
Survey design The following are based on flights conducted by helicopter from Port Stephens, Hexham Base or Cessnock as appropriate. There will be slight variations in flight paths depending on the aircraft used and the departure location but the survey areas will remain the same.
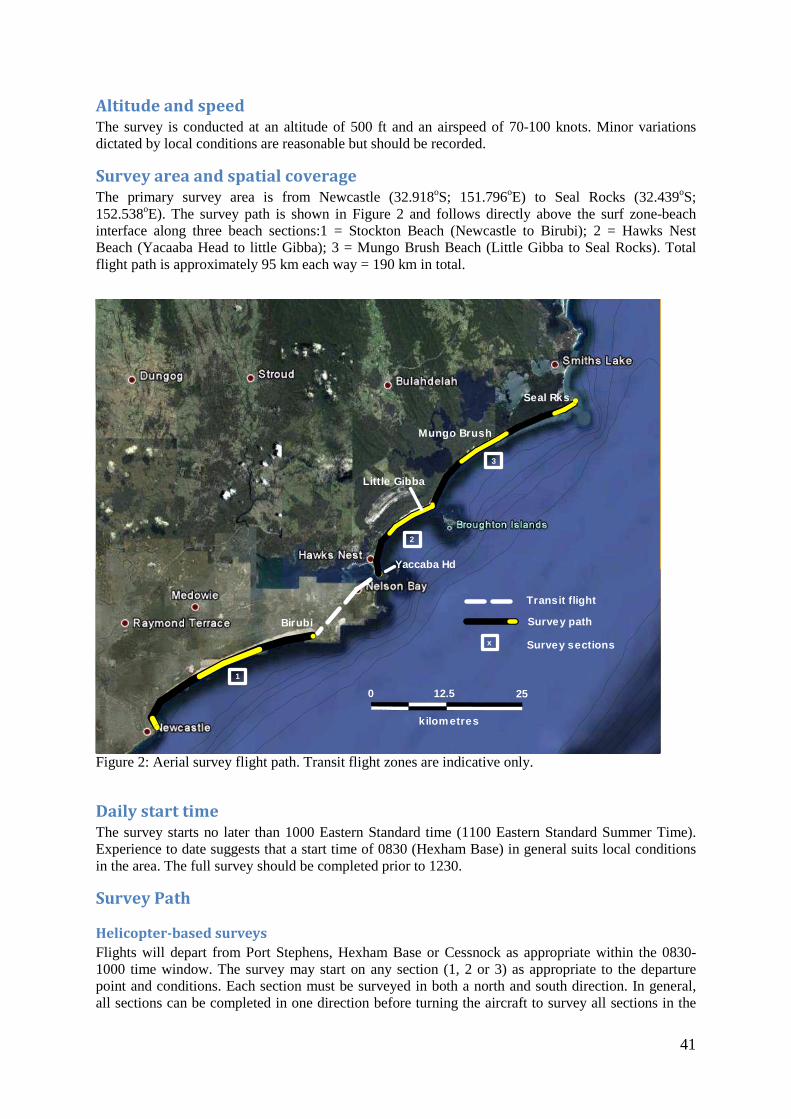
41
Altitude and speed
The survey is conducted at an altitude of 500 ft and an airspeed of 70-100 knots. Minor variations dictated by local conditions are reasonable but should be recorded.
Survey area and spatial coverage
The primary survey area is from Newcastle (32.918oS; 151.796oE) to Seal Rocks (32.439oS; 152.538oE). The survey path is shown in Figure 2 and follows directly above the surf zone-beach interface along three beach sections:1 = Stockton Beach (Newcastle to Birubi); 2 = Hawks Nest Beach (Yacaaba Head to little Gibba); 3 = Mungo Brush Beach (Little Gibba to Seal Rocks). Total flight path is approximately 95 km each way = 190 km in total.
Figure 2: Aerial survey flight path. Transit flight zones are indicative only.
Daily start time
The survey starts no later than 1000 Eastern Standard time (1100 Eastern Standard Summer Time). Experience to date suggests that a start time of 0830 (Hexham Base) in general suits local conditions in the area. The full survey should be completed prior to 1230.
Survey Path
Helicopter-based surveys
Flights will depart from Port Stephens, Hexham Base or Cessnock as appropriate within the 0830-1000 time window. The survey may start on any section (1, 2 or 3) as appropriate to the departure point and conditions. Each section must be surveyed in both a north and south direction. In general, all sections can be completed in one direction before turning the aircraft to survey all sections in the
1
2
3
x
Birubi
0
Yaccaba Hd
Little Gibba
Seal Rks
Mungo Brush
Survey path
12.5 25
Survey sections
kilom etres
Transit flight
42
reverse direction. However, this depends on the point of departure. As a result of the observers being on the left hand side of the aircraft, experience suggests that when undertaking a northward survey, the aircraft is best follows a path 50-75 m seaward of the surf zone. When travelling south the aircraft best follows a path 20-50 m seaward of the surf zone. The aircraft may deviate from the survey path (eg circle or hover) to confirm the identity of sightings or for the purpose of photography where required. However, the survey should be resumed at the same point as quickly as possible.
Minimum survey conditions
The aerial survey only operates when environmental conditions are suitable for: Sharks to be seen in or near to the surf zone above a visible sand substrate. The ability to see sharks depends on sun angle and glare, water clarity, swell/direction, cloud cover, rain and wind speed/direction. We therefore aim to place the following limits to ensure consistency. These limits should only be varied after consultation with the project leaders. The aerial survey should begin prior to 1000 and conclude by 1200 (local time) and only if all of the following weather conditions are met: Cloud ceiling must be above 1500 ft with no rain. The visibility at 1000 ft must be greater than 5 kilometres. The wind speed at the sea surface must be 15 knots or less (Beaufort Scale 4). However, once the survey has started, it may continue as long as the wind speed does not exceed 20 knots (Beaufort scale 5). Predicted swell height must not exceed 1.2 metres or four feet. If the weather conditions deteriorate so that these minimum conditions are no longer met, the flight should be terminated at the end of the section currently under survey.
Survey procedures
Search recording procedure - aerial survey data sheet
A separate aerial survey data sheet must be completed in for each north and south survey run, and additional sheets are to be completed if one is filled during each survey. Multiple sheets for the same survey are to be labelled ‘1 of x’; 2 of x’ etc. Three sheet sets are to be completed if using a helicopter out of Port Stephens. For example - Sheet set one, Birubi Pt south to Stockton Breakwater; Sheet set 2, Stockton Breakwater north to Seal Rocks; Sheet set 3, Seal Rocks south to Yacaaba Head.
Survey data sheet
Date: Date of the survey Start time: Time at take off (helicopter) End Time: Time of landing (helicopter) Survey direction: The direction (north or south) of the survey along the coast. Pilot: The initials of the pilot’s name Recorder: The initials of the data recorder’s name(s) Time zone: Ensure the time zone is identified as either AEST or AEDT (summer time). Daylight Saving Time begins at 2am (AEST) on the first Sunday in October (7 October 2012) and ends at 2am
43
(AEST) (which is 3am Australian Eastern Daylight Time) on the first Sunday in April (7 April 2013). AEST is GMT +10; AEDT is GMT + 11. GPS: Record make and model of GPS used. Mark the commencement of each north/south survey with a GPS waypoint and record the GPS waypoint number, the local Time, Beach - using the assigned beach codes. If additional beaches are surveyed at any time, note the full name of the beach. For each shark or other marine creature (including a school of fish) that is sighted, mark a GPS waypoint and record the GPS waypoint number, record the Time, record the Beach using the codes provided and assign a Species code. If more than one animal (eg shark or dolphin) is sighted together then record the Number of animals. If a fish school (only) is sighted, estimate the size (dimensions of the school (eg ‘10 m dia’ - if circular or record length and breadth if not - eg ‘25 m x 5 m’) and record in the Number of animals cell. Estimate the Length of each shark sighted in metres (length estimates are only required for sharks). Estimate the Distance from beach to the location of the sighted animal(s). Identify the Swim direction of the shark, dolphin or fish school (the latter if possible) is travelling according to the supplied codes. If shark(s) and a fish school are sighted together, fill in the sharks’ details under Species and Number of animals, mark the Fish school cell as ‘Y’ and fill in any details of the fish school (species and size of school) in the Comments. Continue to fill in sightings on each row as animals are located until the end of the Survey run. Use a new sheet if the number of sightings exceeds the available space and mark each survey data sheet accordingly as ‘Page x of y’. When the survey run is completed, mark and record a GPS waypoint at the end position, record the Time and the Beach.
Environmental observations
Date: Date of the survey Pilot: The initials of the pilot’s name Recorder: The initials of the data recorder’s name(s) The first GPS waypoint on this sheet will be the same as that noted on the Survey data sheet when commencing a north or south survey. Also record the local Time that observations were made, the Beach, identify the Event code from the options provided, the Wind speed, Wind direction , Sea State (using the Beaufort scale), Air temperature , Water clarity (using a scale of 1 to 3), estimate total cloud cover (in 10ths). Water temperature, Tide height swell and Swell direction can be accessed and recorded from the websites provided on the data sheets after the completion of the flight using the data closest to the time of each recording. Record all environmental parameters at the end of each Survey run and also if there is any change in environmental conditions (eg a change in wind speed/direction or significant change in cloud cover). Note and record the location (start and end points of any area of water where sightings are compromised due to the presence of weed or turbid/dirty water. It is important to note the start and end points of areas of the beach front affected. If the area is small and does not warrant a start and end point, note this as one line of environmental observations using the appropriate code (eg DWS1 or WS) and estimate the area affected (in m) by recording this in the Comments. Continue to fill in rows as appropriate until the end of the Survey run. Use a new sheet if the number of observations exceeds the available space and mark each environmental data sheet accordingly as ‘Page x of y’. At the end of each Survey run, record a new set of observations as above.
1Codes are defined on the survey log sheets
Details of survey duties of pilot The pilot is responsible for:
• the plane, its safety, and that of the crew.
44
• following the directions of the data recorder(s) concerning the survey operation. • ensuring that the survey starts within the stated time window. • records the start and end of flying times each day and the data recorder verifies that
the times have been accurately recorded.
Details of survey duties of data recorder(s) The data recorder is responsible for
• ensuring that the survey is conducted according to its design, and that the survey procedures and conditions are followed.
• operating the GPS to record the waypoints associated with each sighting, and downloading this information at the end of each survey day.
• the identification of marine life detected from the aircraft as described in Section 5. • observing and recording the environmental conditions during the survey. • recording the data consistently ensuring the high quality of the data. • input of the data into a spreadsheet and providing data to the project leaders.
Following survey procedures
Ensure that the plane is flown along the survey path specified in the flight plan. Monitor the weather conditions and ensure that the survey stops if conditions deteriorate.
Recording procedures
Record all data on the prepared data sheets, using new data sheets for each flight. See Section 6.
Quality of data recorded
Ensure that the recorded data is as complete and accurate as possible. Ask the pilot for environmental data at the beginning and end of each north/south survey run (i.e. at the commencement of each survey and each time the aircraft turns to return along a south or northerly path) and if you think there has been a change in any environmental variable. Ask the pilot for any information you require. In field surveys it is not always possible to collect all the required information. If for some reason a data field cannot be completed, leave it blank and note the reason in the comments column.
Data entry and delivery
Complete additional information on return (latitude and longitude of waypoints; data on tide and swell from the recommended websites). Enter the aerial survey data into the EXCEL templates supplied. At the end of each replicate, provide all data to Bill Gladstone (UTS) and Barry Bruce (CSIRO).
Providing survey information to SLSA
CSIRO will email a plot of shark sightings to Surf life Saving Australia for distribution to the Hawks Nest and Birubi Surf Life Saving Clubs after each survey flight.
Species codes for the aerial survey
GWS White shark
HHS Hammerhead shark OTS Other shark species (identify if possible)
RAY Ray
45
BAIT Unidentified baitfish school
SAL Australian salmon
MUL Mullet
DOL Dolphin
OTHER Other marine species (eg turtle, whale - identify if possible)
Useful websites for environmental data www.swellnet.com.au www.seabreeze.com.au www.bom.gov.au www.willyweather.com.au