Trigonometric Ratios and Functions - Commack School District

ACTA ACUSTICA UNITED WITH ACUSTICA
Vol 88 (2002) 526 ndash 535
Acoustic Signal Expansion in MultipleTrigonometric Bases
P KleczkowskiDepartment of Mechanics and Vibroacoustics Academy of Mining and Metallurgy Krakow Poland
SummaryA method of time-frequency analysis of the acoustic signals is presented It is conceptually and computationallysimple and its parameters are easily adjustable By an appropriate adjustment of its time-frequency parameters itis possible to achieve characteristics approximating those of the auditory system This is a very desirable featurewhen signals received by the ear are analysed The method proposed also approximates an orthogonal expansionsystem with easy near-perfect invertibility as a main advantage It involves bandpass filtering of the signal andthen performing independent analyses of bandpass signals in orthogonal trigonometric expansion bases Theresults can be combined into one consistent data-base An efficient two-dimensional graphic presentation of theresults revealing details relevant to the ear has been achieved with this method Several examples of analyses formusic and speech signals are presented
PACS no 4358Kr 4366Yw 4375Yy 4360Lp 4360Qv
1 Introduction
When acoustic signals are analysed especially those re-ceived by the ear it is often required that the time-frequency characteristics of the analysis should be closeto those of the auditory system The main idea behindthis concept is that the result of an analysis should showthe properties of the signal which are resolved by the earThe most often used constant-bandwidth analysis whenapplied for acoustic signals usually requires a compro-mise between poor frequency resolution in low parts ofthe spectrum and too fine resolution in its high regionOn the other hand very efficient constant-bandwidth time-frequency analysis techniques related to the Fourier Trans-form have been developed with the Modified Discrete Co-sine Transform [1 2 3 4 5] being an example of an el-egant orthogonal signal-expansion system An alternativeis to use a constant relative bandwidth (constant Q) typeof analysis Numerous techniques of such an analysis areknown [6 7 8 9 10 11 12 13] but most of them lack theadvantages of orthogonal signal expansion or have insuf-ficient spectral resolution Only the recent developmentsin wavelet-packet analysis [14 15] provide possibilities toconstruct orthogonal expansion systems having the prop-erties appropriate for signals received by the ear This ishowever achieved at the cost of difficult design and theneed for a very careful choice of parameters
A method of orthogonal expansion providing both vari-able timefrequency resolution along the frequency axis
Received 15 February 2000accepted 12 February 2002
and frequency resolution adequate for analysis of audiosignals has been proposed by Brandenburg and Johnston[16] and partly used in the ATRAC audio coding system[17] It involved pre-filtering the signal into four frequencybands and performing separate transforms within themThese algorithms use critically sampled bandpass filterswith fixed widths of bands following the dyadic schemeand thus with very limited potential for adjustment Thispaper follows a similar concept but proposes a generalflexible procedure while maintaining the conceptual sim-plicity and computational efficiency
2 Tiling of the time-frequency plane
A key attribute of any time-frequency signal analysis isits ability to localise signal features in the time-frequencyplane The uncertainty principle and parameters of a gi-ven expansion system lead to the division of this planewhich is characteristic of a given expansion system Theconstant-bandwidth signal expansions divide the time-frequency plane into rectangles (symbolic as their edgescan not be sharp) of the same size Non-uniform expan-sions divide this plane into rectangles of varying sizes
The localisation in time of a complex trigonometric(Fourier) expansion system is easily obtained by window-ing the time signal before expanding it albeit at the costof losing orthogonality This is true for the most com-monly used Short-Time Fourier Transform (STFT) wherethe Balian-Low theorem [11] excludes orthogonality un-less the localisation either in time or in frequency is lostThe lapped orthogonal transforms [2] achieve time local-isation without losing orthogonality by keeping the over-
526 c S Hirzel Verlag EAA
Kleczkowski Acoustic signal expansion in multiple trigonometric bases ACTA ACUSTICA UNITED WITH ACUSTICA
Vol 88 (2002)
t t
t
f
(a) (d)
(b) (e)
(c)
f
f f
f
t
t
Figure 1 The comparison of the tilings of the time-frequencyplane obtained by (a) local trigonometric bases (b) waveletpackets (c) Discrete Wavelet Transform (d) generalized tiling[19] (e) proposed in this work
lapping regions of the signal mutually orthogonal A typi-cal example of this is the Modified Discrete-Cosine Trans-form (MDCT) also called Time-Domain Alias Cancel-lation (TDAC) or Modulated Lapped Transform (MLT)Within the class of constant-bandwidth filters the MDCTis considered most appropriate for applications related tothe ear [16] In the extension of this rule called ldquolocaltrigonometric basesrdquo [5 18] the analysed signal can bedivided into segments of arbitrary length The length ofeach segment determines the frequency resolution withinit (Figure 1a)
By building an appropriate filter tree in a wavelet-packetanalysis arbitrary division of the frequency axis can beobtained In this case it is the time resolution inside a fre-quency band that depends on its width (Figure 1b) Dis-crete Wavelet Transform [5 11] leads to an octave-widedivision of the frequency axis with an according dyadic(binary) time resolution pattern (Figure 1c) This is theconstant-Q scheme However the octave resolution is in-adequate for the analysis approximating the functioning ofthe ear Given the sampling frequency filtering parametersdepend on the wavelet used while the tiling is fixed Her-ley et al [19] proposed a generalized tiling which can beadapted along both time and frequency axes (Figure 1d)by varying the wavelet packet tree structure in time Thisrequires the use of special boundary and transition fil-ters and is limited to binary tilings The tiling methodsshown in Figures 1ab and 1d are to be used within thesignal-adaptive system The method presented in this pa-per firstly divides the frequency axis in a fully arbitrary
way Then in each of the frequency bands localisation intime is achieved based on local trigonometric bases (Fig-ure 1e) As there are no constraints to this localisation thisscheme offers high flexibility in tiling the time-frequencyplane
3 Signal expansion method
The basic idea behind the method proposed is to obtainorthogonality of the expansion basis in an indirect wayHowever the orthogonality practically achieved is onlyapproximate By taking an orthogonal basis with desiredproperties as a starting point a lapped basis in partic-ular one might postulate using transforms of differentlength (ie time-frequency resolution) for different fre-quency bands of the time signal as a primary means ofadaptation By a transform one will understand the timesequence of lapped transforms eg the MDCT Such anassumption will simplify the further discussion and is nat-ural for it as individual blocks (frames) of the MDCT areincomplete expansions and are thus not invertible The re-lated bases can be defined as
Bi Bi Bi BiLi
(1a)
Li TNi (1b)
where i is the number of a frequency band analysed and anindex of the respective transform B T is the length of thesignal analysed (in samples)Ni is the length of an individ-ual block of the i-th transformLi is the number of lappedblock transforms needed to represent the signal The valueof Li need not be an integer thus placing no constraintson T and Ni as when it is fractional in practical compu-tations it can be rounded up to the nearest integer and thesamples missing to compute the last block transform in asequence are filled with zeroes
If a signal sn is projected onto M bases by transformsSi of different block length it can be presented as
sn
SSM
MXi
Si (2)
where n is the number of a time signal sample Si is a timesequence of lapped block transforms number i
Si Si Si SiL
(3)
It must be noted that if a signal resynthesis is performed bysumming the outputs from all (inverse) transforms S
i itresults in M sn The expansion procedure in (2) is pre-sented schematically in Figure 2
AllBi bases defined as in (1a) have the same dimensionand hence the expansion in (2) contains M times morecoefficients than the dimension in Bi Another problemfaced in any attempt to construct a common basis from thebasesBi is that the basis functions in one of the transformsare not orthogonal to those in another transform
bik bjl
for i j (4)
527
ACTA ACUSTICA UNITED WITH ACUSTICA Kleczkowski Acoustic signal expansion in multiple trigonometric basesVol 88 (2002)
S0 S1 S2 S3
L=30 L=20 L=15 L=5
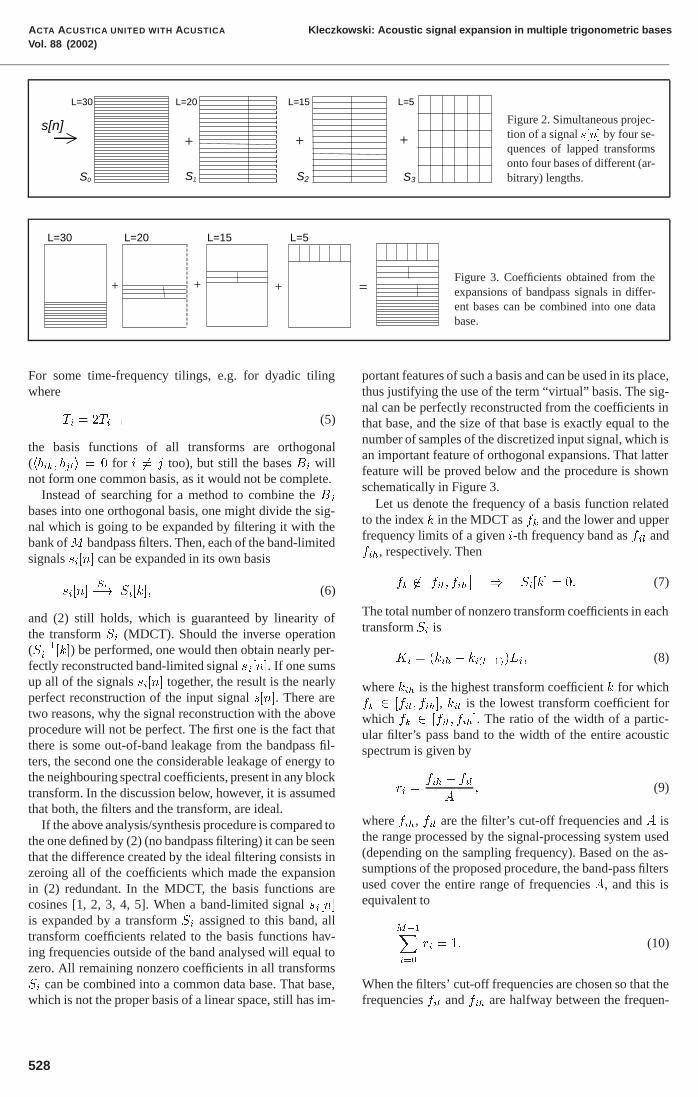
+++s[n] Figure 2 Simultaneous projec-
tion of a signal sn by four se-quences of lapped transformsonto four bases of different (ar-bitrary) lengths
L=30 L=20 L=15 L=5
=+ + +Figure 3 Coefficients obtained from theexpansions of bandpass signals in differ-ent bases can be combined into one database
For some time-frequency tilings eg for dyadic tilingwhere
Ti Ti (5)
the basis functions of all transforms are orthogonal(hbik bjli for i j too) but still the bases Bi willnot form one common basis as it would not be complete
Instead of searching for a method to combine the Bi
bases into one orthogonal basis one might divide the sig-nal which is going to be expanded by filtering it with thebank ofM bandpass filters Then each of the band-limitedsignals sin can be expanded in its own basis
sinSi Sik (6)
and (2) still holds which is guaranteed by linearity ofthe transform Si (MDCT) Should the inverse operation(Si k) be performed one would then obtain nearly per-fectly reconstructed band-limited signal sin If one sumsup all of the signals sin together the result is the nearlyperfect reconstruction of the input signal sn There aretwo reasons why the signal reconstruction with the aboveprocedure will not be perfect The first one is the fact thatthere is some out-of-band leakage from the bandpass fil-ters the second one the considerable leakage of energy tothe neighbouring spectral coefficients present in any blocktransform In the discussion below however it is assumedthat both the filters and the transform are ideal
If the above analysissynthesis procedure is compared tothe one defined by (2) (no bandpass filtering) it can be seenthat the difference created by the ideal filtering consists inzeroing all of the coefficients which made the expansionin (2) redundant In the MDCT the basis functions arecosines [1 2 3 4 5] When a band-limited signal sinis expanded by a transform Si assigned to this band alltransform coefficients related to the basis functions hav-ing frequencies outside of the band analysed will equal tozero All remaining nonzero coefficients in all transformsSi can be combined into a common data base That basewhich is not the proper basis of a linear space still has im-
portant features of such a basis and can be used in its placethus justifying the use of the term ldquovirtualrdquo basis The sig-nal can be perfectly reconstructed from the coefficients inthat base and the size of that base is exactly equal to thenumber of samples of the discretized input signal which isan important feature of orthogonal expansions That latterfeature will be proved below and the procedure is shownschematically in Figure 3
Let us denote the frequency of a basis function relatedto the index k in the MDCT as fk and the lower and upperfrequency limits of a given i-th frequency band as fil andfih respectively Then
fk fil fih
Sik (7)
The total number of nonzero transform coefficients in eachtransform Si is
Ki kih kilLi (8)
where kih is the highest transform coefficient k for whichfk fil fih kil is the lowest transform coefficient forwhich fk fil fih The ratio of the width of a partic-ular filterrsquos pass band to the width of the entire acousticspectrum is given by
ri fih fil
A (9)
where fih fil are the filterrsquos cut-off frequencies and A isthe range processed by the signal-processing system used(depending on the sampling frequency) Based on the as-sumptions of the proposed procedure the band-pass filtersused cover the entire range of frequencies A and this isequivalent to
MXi
ri (10)
When the filtersrsquo cut-off frequencies are chosen so that thefrequencies fil and fih are halfway between the frequen-
528
Kleczkowski Acoustic signal expansion in multiple trigonometric bases ACTA ACUSTICA UNITED WITH ACUSTICA
Vol 88 (2002)
cies of the neighbouring basis functions (fk fk)the following proportion holds true
ri fih fil
Akih kil
Ni
(11)
ie
kih kil riNi (12)
from (8)
Ki kih kilLi riNiLi (13)
Now the sum of all nonzero coefficients over all trans-forms Si is
K
MXi
riNiLi
MXi
riT (14)
since the product NiLi for each transform is equal to thesignal length according to (1b) Taking (10) we obtain
K T (15)
which proves that the number of nonzero coefficients isequal to the number of samples in the input signal
In the following sections the entire procedure will bereferred to as EMTB (Expansion in Multiple Trigonomet-ric Basis)
4 Implementation
The signal expansion procedure consists of two stages thefiltering of the input signal by a bank of bandpass filtersfollowed by the MDCT performed independently in eachof the bands (Figure 4) In most applications an additionalstage grouping all ldquoin-bandrdquo coefficients into one database is required The term ldquoin-bandrdquo replaces ldquononzerordquo inpractical implementations as no coefficient will be strictlyzeroed
In order to follow the concept of the EMTB procedurethe filters should closely approximate the characteristicsof the ideal filter This is not difficult if signals of con-siderable length T will be analysed Then very long FIRfilters achieving excellent parameters can be used As thatlength will in practice considerably exceed the lengths oftransform blocks (ie transform filters) one can assumewithout quantitative analysis that imperfections in relationto the assumptions in (7)ndash(15) will be mostly generatedby spectral leakage from transform coefficients and not bythe bandpass filters An essential advantage of using thenon-decimated FIR bandpass filters over decimated onesis high flexibility in choosing the cut-off frequencies Inthe study a bank of very simple bandpass FIR filters wasused based on the Fourier Series method with the vonHann window [20] Increasing the filter length above 8192samples had negligible effects on the obtained results The
Filter no 0
input Filter no 1
Filter noM-1
MDCT no 0length = L0
MDCT no 1length = L1
MDCT noM-1
length = LM-1
Formingcommon
database
Figure 4 Block diagram of the analysis in multiple trigonometricbases
MDCT is based on the DCT-IV type of the DCT and isgiven by [4]
Sk
NXn
sncnk for k N (16)
where N is the block length (as in equations 1b 11ndash14)and
cnk hn
r
Ncos
nN k
N
(17)
where hn is a lowpass-filter impulse responseIf fast algorithms were to be used in the computation
of the MDCT blocks the flexibility in arbitrarily choosingtheir lengths would be limited resulting in limitations intiling of the time-frequency plane Therefore the only op-timisation of computations used by the author was basedon the symmetry of the MDCT basis functions and it re-duced the computation time by a factor of two (approxi-mately)
The function hn must satisfy two conditions it mustbe symmetrical and power complementary ie
hN n hn (18)
hn hnN (19)
in order for the transform to be orthogonal [2]An often used function satisfying (18) and (19) is
hn sin
n
N
(20)
but this window function has poor spectral characteristics(high leakage) The optimisation of the window hn wasshown in [21 22]
The author examined yet another approach to this prob-lem By choosing a window which has the appropriate
529
ACTA ACUSTICA UNITED WITH ACUSTICA Kleczkowski Acoustic signal expansion in multiple trigonometric basesVol 88 (2002)
- 20 dB
- 40 dB
- 60 dB
- 80 dB
0 dB
relative frequency0- 16π π16
Figure 5 The spectral characteristics of the optimized time win-dow hn
spectral characteristics but does not satisfy the power-complement condition (19) it is possible to satisfy thiscondition in a different manner When (19) is not met wecan express the reconstructed signal rn as
rn snmn (21)
where mn is a modulation function depending on hnWhen (19) is satisfied mn The function mn isperiodic with period N It can always be found either an-alytically or by tabulating the mn obtained from the leftside of (19) Then the compensation is straightforward
sn rn
mn (22)
There is an admissibility condition on hn for this methodto be used namely
hn for N
n
N
(23)
resulting from the overlapping factor of successive blocktransforms which is equal to 50 in the MDCT whichguarantees that mn In order to avoid the increasein quantization noise the computations must be performedin the floating-point number format
A special window function hn was chosen It is amodification of the Blackman window [20] given by
hn cos
N 13 cos
Nn
n N
N
(24)
and was designed in order that its spectral characteristicsshown in Figure 5 may have some analogy to the audi-
- 120
- 80
- 40
0
dBfrequency
band
0 coefficient number 511
Figure 6 The absolute value of the DCT of the bandpass fil-tered unit impulse showing the spectral leakage from the anal-ysed band of frequencies The time window defined in (24) wasused
tory filters [23 24 25] The sidelobes fall off rapidly inthe vicinity of the mainlobe which resembles the audi-tory filter and then stay at a nearly constant level closeto dB This latter piece of the characteristics is anunavoidable feature of this window but frequency com-ponents distant from the mainlobe belong to other bandsand will have strong additional attenuation by the band-pass filter The mn for this window function was com-puted based on (19)
5 Errors and their reduction
As it has been mentioned in Section 4 spectral leakageis the dominating reason why the model in (7)ndash(15) couldnot be implemented The implication (7) is not true as co-efficients related to frequencies outside the range fil fihare not equal to zero and the ones closest to this rangemay have meaningful values depending on the choice ofthe function hn In the reconstruction process when allof the coefficients mentioned above are assumed to equalzero the effect similar to the Gibbsrsquo phenomenon occursThis effect is known in the context of the Fourier Series[26] In that context methods for smoothing this effectdeveloped by Lanczos and Fejer are known A trivial anda less efficient method is to gradually taper off the coeffi-cients to be truncated
In the EMTB procedure it is easier to control this effectSignals which are to be reconstructed are band-pass typeand the energy represented by coefficients related to fre-quencies outside the range fil fih falls off rapidly Thisis illustrated by Figure 6 in which the absolute value ofthe DCT of the bandpass-filtered unit impulse is shownSubstantial reduction of the Gibbs effect is obtained by in-cluding in the reconstruction several coefficients related to
530
Kleczkowski Acoustic signal expansion in multiple trigonometric bases ACTA ACUSTICA UNITED WITH ACUSTICA
Vol 88 (2002)
002
-300 300
-002(a)
(b)
002
-002
300-300
Figure 7 The reconstruction of the unit impulse showing theGibbs effect (a) from the raw data base (b) from the data baseextended by 6 coefficients on both sides of each band
Table I The number of out-of-band coefficients at one side usedand their effect on the increase of data base and the attenuationof distortion in the reconstruction of a signal
Out-of-band Increase db [] Attenuation od [dB]
1 27 452 55 983 83 1126 166 164
20 555 320
the frequencies just neighbouring with the fil fih bandkil kil kih kih
Figures 7a and 7b show the Gibbs effect generated inthe reconstruction of the unit impulse The impulse signalhas been processed with the EMTB procedure accordingto Figure 4 with the parameters described in the next sec-tion Figure 7a presents the reconstruction of the impulsewhen all out-of-band coefficients are neglected Figure 7bpresents the reconstruction in which six out-of-band coef-ficients on either side of the band are included In the scaleused to plot Figures 7a and 7b there is not room enoughfor the entire impulse Its height in that scale is equal to50 This corresponds to the impulse to the peak of distor-tion ratio of about 43 dB for the case with all out-of-bandcoefficients neglected (Figure 7a) The total number of theextra coefficients used in Figure 7b when compared withthe critically sampled case (according to (15) Figure 7a)is increased by 5 The comparison of energies of distor-tion signals in Figures 7a and 7b gives an improvementof 166 dB in Figure 7b Table I shows several results inother cases Some experiments suggested that for a given
number of out-of-band coefficients their specific allocationleads to an optimal reduction of the error
This ldquoGibbs noiserdquo is concentrated only in spectral re-gions close to the filtersrsquo cut-off frequencies When prac-tical audio signals of different kinds are reconstructed nodisturbances of any kind can be heard even with all out-of-band coefficients neglected (Figure 7a)
6 Time-frequency tiling for the analysis ofacoustic signals
The EMTB procedure in its most general form allows fora very flexible tiling (Figure 1e) There are no limita-tions on the assignment of frequency bands apart fromslight adjustments needed for any partition of the fre-quency axis This adjustment ensures the optimal place-ment of the boundary between two EMTB bands depend-ing on the frequencies of two neighbouring spectral lines(coefficients) belonging to adjacent transforms
For each frequency band the length Ni of the transformassigned to it is constant The value of Ni can in principlebe arbitrary in each transform In order to obtain simplestructures of time frames in the entire procedure the ratiosof lengths Ni of all transforms should consist of simplerational or integer numbers The simplest structure is ob-tained when all ratios are powers of 2 Then one has thedyadic division of the time axis combined with the arbi-trary division of the frequency axis This differs from theDiscrete Wavelet Transform or the methods of Branden-burg and Johnston [16] and Tsutsui et al [17] where bothdivisions are dyadic
In this work two implementations are presented Thefirst one is most straightforward with a dyadic division ofthe time axis Based on this assumption the number M offrequency bands and their widths and the lengthN of thetransform associated with the lowest frequency band canbe chosen For a number M of bands the length N mustbe divisible by NM and Ni N
iAssuming critical bands (CB) as the model of auditory
bandpass filters the number M of bands should be de-termined on the basis of the scale of widths of those fil-ters According to the most often used table of criticalbands [27] that scale is about 40 (widest CB) to 1 (nar-rowest CB) In the first approximation the ratio of timeresponses of the corresponding filters should be similarWithin the limitations of the dyadic scheme one then hasto choose from the ratios of 32 to 1 or 64 to 1 The initialtests have shown that the graphical results of the analysisare more readable with the lower ratio Hence we arriveat M log bands One then may eitherhave 24 CBs and a uniform distribution of CBs betweenthe EMTB bands ie four CBs in each band or 25 CBswith five CBs in one of the bands Since the width of thelowest five CBs according to the CB table is nearly con-stant (although this is a crude approximation according to[25]) it seems to be very appropriate to include all five ofthe lowest CBs (up to 510 Hz) within the lowest EMTBband The approximation of the auditory system is best in
531
ACTA ACUSTICA UNITED WITH ACUSTICA Kleczkowski Acoustic signal expansion in multiple trigonometric basesVol 88 (2002)
frequency [Hz]B0
84
76663704
B 446
2003Band 340
1077Band 2no of spectral lines 43
511Band 1no of spectral lines 53
Band 00 no of spectral lines 95
0 time [ms] 85
Figure 8 The time-frequencytiling obtained with the 6-bandEMTB procedure dyadic divi-sion of time axis
Table II Parameters of the 6-band implementation of the EMTB procedure
Band No Frequency range [Hz] MDCT spectral lines used MDCT size in bandlowest highest number used
0 0-511 0 94 95 40961 511-1076 47 99 53 20482 1076-2002 50 92 43 10243 2002-3703 46 85 40 5124 3703-7665 43 88 46 2565 7665-22050 44 127 84 128
Table III Parameters of the 10-band implementation of the EMTB procedure
Band No Number of CBs Frequency range [Hz] MDCT spectral lines used MDCT size in bandlowest highest number used
0 2 0-2075 0 26 27 28801 3 2075-505 18 43 26 19202 2 505-781 33 50 18 14403 2 781-1077 34 46 13 9604 3 1077-1691 35 54 20 7205 3 1691-2701 36 58 23 4806 3 2701-4410 44 71 28 3607 3 4410-7717 48 83 36 2408 2 7717-12127 63 98 36 1809 2 12127-22050 66 119 54 120
this lowest band as the earrsquos characteristics are close to theconstant-bandwidth type in this frequency range contraryto the rest of the acoustic range
Figure 8 presents the time-frequency tiling for the aboveparameters of the EMTB analysis The boundaries be-tween the EMTB bands approximately coincide with theappropriate edges of the CBs Table II gives the detailedspecification of the EMTB with these parameters in termsof numbers of spectral lines of the individual MDCTs usedin particular EMTB bands The correction discussed inSection 5 was not used but the adjustment of the fre-quency bands mentioned in the first paragraph of this Sec-tion was This is why the cut-off frequencies of bandsgiven in Tables II and III are not those of critical-bandboundaries of the ear found in the literature
The second implementation was based on a 10-bandanalysis This results in more gradual transitions betweenthe lengths Ni of transforms in particular bands In effectthe characteristics are closer to the constant-Q analysis
The sequence of lengths Ni of transform blocks was cho-sen so that the Ni values were proportional to the follow-ing integers 48 32 24 16 12 8 6 4 3 2 Thus the ra-tio of corresponding time responses of filters was 241 Itwas found that although the analogy to the characteristicsof the ear is weaker the plots are more readable The as-signment of numbers of critical bands to particular EMTBbands cut-off frequencies and MDCT parameters for thiscase are given in Table III
Arbitrary Ni values can also be used resulting in a lessregular data structure This may be perfectly acceptablewhile allowing for yet higher flexibility
7 Results of analysis of audio signals
The DCT which is the basis for the MDCT used in theEMTB procedure is not optimal for spectral analysis assome spectral components of the signal may have phases
532
Kleczkowski Acoustic signal expansion in multiple trigonometric bases ACTA ACUSTICA UNITED WITH ACUSTICA
Vol 88 (2002)
frequency [kHz]
511
1077
2003
3704
7666
22050
0 0371 0742 1113 1484time [ms]
Figure 9 The results of the 6-band EMTB analysis of an excerptof orchestral music
resulting in very low values of DCT coefficients [2]Therefore additional processing was used in order to ob-tain results appropriate for displaying the results of time-frequency analysis of acoustic signals In parallel to theMDCT transform its appropriate sine counterpart (basedon the Discrete Sine Transform-DST) has been computedleading to pairs of coefficients (MDCT and MDST) In thenext step a joint measure of amplitude spectrum was ob-tained by computing
dnk qcnk snk (25)
where snk is the MDST coefficient appropriately com-plementing the cnk of (17)
It is worth noting that if such a spectral analysis is com-pared with the Discrete Fourier Transform it offers twiceas high spectral resolution as for a signal of lengthN thereare N different spectral amplitude coefficients The DFTyields only N spectral amplitudes
Several short fragments of musical material have beenanalysed by the EMTB procedure with the extension pre-sented above Due to this procedurersquos characteristics thetwo-dimensional diagram was found to be most appropri-ate The plots presented in this work display all values ofspectral coefficients dnk obtained according to Tables IIand III The mapping of the values dnk to the grey-scalewas logarithmic in the range of about 40 dB from the high-est coefficient values For the rest of the range (lowest val-ues) a correction to the logarithmic mapping has been in-troduced in order to obtain most readable results This cor-rection consisted in compressing the range of lowest val-ues In order to reveal more details in the high frequencyrange the pre-emphasis in the two highest bands was usedwith the gain of dB at the highest frequency
In the highest frequency band each coefficient is repre-sented by one dot In the lower bands the coefficients arerepresented as short horizontal lines with the lines in thelowest band consisting of respectively 32 and 24 dots eachIn the band no 8 of Table III the length is 15 dots and anappropriate averaging has been used
frequency [kHz]20
16
12
8
4
00 0371 0742 1113 1484
time [ms]
Figure 10 The Discrete SineCosine Transform modulus of thesignal analysed in Figure 9 the lenght of the analysis frame isthe same as in band no 3 of Figure 9
frequency [kHz]
207505
16911077
27014410
7717
12127
22050
0 0261 0522 0783 1045 1306 1567 [s]time
781
Figure 11 The results of the 10-band EMTB analysis of an ex-cerpt of orchestral music
Figure 9 shows the results of the 6-band EMTB analysisof an 18 s excerpt of an orchestra recording Although theacoustic content was dense groups of harmonics in differ-ent frequency regions are clearly visible For comparisonFigure 10 shows the same signal analysed with the stan-dard MDCT (constant bandwidth) analysis with a trans-form length N of 512 samples the same as used in bandno 3 of the EMTB analysis of Figure 9 Several partialgroups are also clearly visible but little information canbe obtained from the range below 1 kHz The entire upperhalf of the diagram is not informative either
The result of the 10-band EMTB analysis of the samesignal is presented in Figure 11 The transitions betweenthe bands are smoother and it seems that the time-fre-quency resolution is better adjusted to reveal more detailsof the signal
Figure 12 presents the result of the same 10-bandEMTB analysis of several guitar chords Some groups ofharmonics can be resolved and the diagram clearly showsthe time lag between the excitations of lower and higherstrings in a chord
533
ACTA ACUSTICA UNITED WITH ACUSTICA Kleczkowski Acoustic signal expansion in multiple trigonometric basesVol 88 (2002)
frequency [kHz]
207505
16911077
27014410
7717
12127
22050
0 0261 0522 0783 1045 1306 1567 [s]time
781
Figure 12 The results of the 10-band EMTB analysis of severalguitar chords
frequency [kHz]
207505
1077169127014410
7717
12127
22050
0 0261 0522 0783 1045 1306 1567 [s]time
781
Figure 13 The results of the 10-band EMTB analysis of the ut-terance ldquoWhy were you away a year Royrdquo spoken by a malevoice
frequency [kHz]
207505
16911077
27014410
7717
12127
22050
0 0261 0522 0783 1045 1306 1567 [s]time
781
Figure 14 The results of the 10-band EMTB analysis of the ut-terance ldquoTell me whatrsquos the timerdquo spoken by a female voice
Two speech signals have also been analysed with the10-band EMTB method In these presentations the pre-emphasis encompassed the three highest bands and thegain reached dB The first one is a direct digitalrecording of a male voice (Figure 13) and the second oneis a female voice from a vinyl record (Figure 14) All threekinds of information important in speech recognition arerevealed harmonic structure glottal pulses and formanttrajectories The scratches from the vinyl record are visi-ble as narrow vertical strips in Figure 14
8 Conclusion
The EMTB procedure proposed and analysed in this pa-per has all of the basic properties of an orthogonal signalexpansion while allowing for a very flexible tiling of thetime-frequency plane This flexibility can be used for ad-justing the time-frequency characteristics to any applica-tion In this work a crude adjustment to the characteristicsof the ear was investigated The procedure is simple con-ceptually easy to implement and robust The possibilityof using fast algorithms for MDCT computation can makeit computationally inexpensive There are some sourcesof errors in this procedure but means for their alleviationhave been presented
The method proposed differs substantially from earlierimplementations of the similar concept [19 18] in us-ing non-decimated bandpass filters and performing MDCTanalysis on the non-decimated signal Two additional de-grees of freedom have been gained this way The first oneconsists in an arbitrary choice of number widths and lo-calisation of frequency bands In these bands independentanalyses with arbitrary time-frequency resolution can beperformed
The spectral resolution of this expansion is good es-pecially when the improved time windows are used Onesuch window with additional advantage of deepening theanalogy to the auditory systemrsquos characteristics was pro-posed and other efficient windows can be used Practicalanalyses of audio signals showed that this method is use-ful in the graphical presentation of time-frequency spectraof acoustic signals showing most of the details relevant tothe ear
Acknowledgement
The author is indebted to Prof Zbigniew Engel and toProf Jan Adamczyk for their continuing support and helpduring this work and stimulating comments to this text
References
[1] J P Princen A B Bradley Analysissynthesis filter bankdesign based on time domain aliasing cancellation IEEETrans Acoust Speech Signal Processing 34 (1986) 1153ndash1161
[2] H S Malvar Signal processing with lapped transformsArtech House Boston 1992 143-217
[3] A Ferreira Convolutional effects in transform coding withTDAC an optimal window IEEE Trans Speech AudioProcessing 4 (1996) 105ndash114
[4] S Shlien The modulated lapped transform its time-vary-ing forms and its applications to audio coding standardsIEEE Trans Speech Audio Processing 5 (1997) 359ndash366
[5] M Vetterli J Kovacevic Wavelets and subband codingPrentice Hall Englewood Cliffs 1995 92-294
[6] G Gambardella A contribution to the theory of short-timespectral analysis with nonuniform bandwidth filters IEEETrans on Circuit Theory 18 (1971) 455ndash460
[7] G Gambardella The Mellin transforms and constant-Qspectral analysis J Acoust Soc Amer 66 (1979) 913ndash915
534
Kleczkowski Acoustic signal expansion in multiple trigonometric bases ACTA ACUSTICA UNITED WITH ACUSTICA
Vol 88 (2002)
[8] E Terhardt Fourier transformation of time signals Con-ceptual revison Acustica 57 (1985) 242ndash256
[9] W Heinbach Aurally adequate signal representation Thepart-tone-time-pattern 67 (1988) 113ndash120
[10] J C Brown Calculation of a constant Q spectral transformJ Acoust Soc Amer 89 (1990) 425ndash434
[11] I Daubechies The wavelet transform time-frequency lo-calization and signal analysis IEEE Trans on Inform The-ory 36 (1990) 961ndash1005
[12] T Irino H Kawahara Signal reconstruction from modifiedauditory wavelet transform IEEE Trans on Signal Process-ing 41 (1993) 3549ndash3554
[13] H Jeong J-G Ih Implementation of a new algorithm us-ing the STFT with variable frequency resolution for thetime-frequency auditory model J Audio Eng Soc 47(1999) 240ndash251
[14] D Sinha A H Tewfik Low bit rate transparent audio com-pression using adapted wavelets IEEE Trans on SignalProcessing 41 (1993) 3463ndash3479
[15] M Bobrek D B Koch Music segmentation using tree-structured filter banks J Audio Eng Soc 46 (1998) 413ndash427
[16] K Brandenburg J D Johnston Second generation percep-tual audio coding the hybrid coder 88th AES ConventionMontreux 1990 Preprint no 2937
[17] K Tsutsui H Suzuki O Shimoyoshi M Sonohara KAkagiri R M Heddle ATRAC Adaptive transform acous-tic coding for minidisc ndash In Collected Papers on DigitalAudio Bit-Rate Reduction N Gilchrist C Grewin (eds)Audio Engineering Society New York 1996 95ndash101
[18] M V Wickerhauser Adapted wavelet analysis from theoryto software IEEE Pr Piscataway 1994 103-152 237-271
[19] C Herley J Kovacevic K Ramchandran M VetterliTilings of the time-frequency plane construction of arbi-trary orthogonal bases and fast tiling algorithms IEEETrans on Signal Processing 41 (1993) 3341ndash3359
[20] F J Harris On the use of windows for harmonic analy-sis with the discrete Fourier transform Proceedings of theIEEE 66 (1978) 51ndash83
[21] A Ferreira Perceptual audio coding and the choice of ananalysissynthesis filter bank and psychoacoustic model104th AES Convention Amsterdam 1998 Preprint no4691
[22] L D Fielder M Bosi G Davidson M Davis C Todd SVernon AC-2 and AC-3 low complexity transform-basedaudio coding ndash In Collected Papers on Digital Audio Bit-Rate Reduction N Gilchrist C Grewin (eds) Audio En-gineering Society New York 1996 54ndash72
[23] T Sporer K Brandenburg Constraints of filter banks usedfor perceptual measurement J Audio Eng Soc 43 (1995)107ndash116
[24] R D Patterson Auditory filter shapes derived with noisestimuli J Acoust Soc Amer 59 (1976) 640ndash654
[25] B C J Moore B R Glasberg Suggested formulae for cal-culating auditory-filter bandwidths and excitation patternsJ Acoust Soc Amer 74 (1983) 750ndash753
[26] A D Poularkis S Seely Signals and systems PWS Engi-neering Boston 1988 152-155
[27] E Zwicker H Fastl Psychoacoustics facts and modelsSpringer-Verlag Berlin 1990 142
535

Kleczkowski Acoustic signal expansion in multiple trigonometric bases ACTA ACUSTICA UNITED WITH ACUSTICA
Vol 88 (2002)
t t
t
f
(a) (d)
(b) (e)
(c)
f
f f
f
t
t
Figure 1 The comparison of the tilings of the time-frequencyplane obtained by (a) local trigonometric bases (b) waveletpackets (c) Discrete Wavelet Transform (d) generalized tiling[19] (e) proposed in this work
lapping regions of the signal mutually orthogonal A typi-cal example of this is the Modified Discrete-Cosine Trans-form (MDCT) also called Time-Domain Alias Cancel-lation (TDAC) or Modulated Lapped Transform (MLT)Within the class of constant-bandwidth filters the MDCTis considered most appropriate for applications related tothe ear [16] In the extension of this rule called ldquolocaltrigonometric basesrdquo [5 18] the analysed signal can bedivided into segments of arbitrary length The length ofeach segment determines the frequency resolution withinit (Figure 1a)
By building an appropriate filter tree in a wavelet-packetanalysis arbitrary division of the frequency axis can beobtained In this case it is the time resolution inside a fre-quency band that depends on its width (Figure 1b) Dis-crete Wavelet Transform [5 11] leads to an octave-widedivision of the frequency axis with an according dyadic(binary) time resolution pattern (Figure 1c) This is theconstant-Q scheme However the octave resolution is in-adequate for the analysis approximating the functioning ofthe ear Given the sampling frequency filtering parametersdepend on the wavelet used while the tiling is fixed Her-ley et al [19] proposed a generalized tiling which can beadapted along both time and frequency axes (Figure 1d)by varying the wavelet packet tree structure in time Thisrequires the use of special boundary and transition fil-ters and is limited to binary tilings The tiling methodsshown in Figures 1ab and 1d are to be used within thesignal-adaptive system The method presented in this pa-per firstly divides the frequency axis in a fully arbitrary
way Then in each of the frequency bands localisation intime is achieved based on local trigonometric bases (Fig-ure 1e) As there are no constraints to this localisation thisscheme offers high flexibility in tiling the time-frequencyplane
3 Signal expansion method
The basic idea behind the method proposed is to obtainorthogonality of the expansion basis in an indirect wayHowever the orthogonality practically achieved is onlyapproximate By taking an orthogonal basis with desiredproperties as a starting point a lapped basis in partic-ular one might postulate using transforms of differentlength (ie time-frequency resolution) for different fre-quency bands of the time signal as a primary means ofadaptation By a transform one will understand the timesequence of lapped transforms eg the MDCT Such anassumption will simplify the further discussion and is nat-ural for it as individual blocks (frames) of the MDCT areincomplete expansions and are thus not invertible The re-lated bases can be defined as
Bi Bi Bi BiLi
(1a)
Li TNi (1b)
where i is the number of a frequency band analysed and anindex of the respective transform B T is the length of thesignal analysed (in samples)Ni is the length of an individ-ual block of the i-th transformLi is the number of lappedblock transforms needed to represent the signal The valueof Li need not be an integer thus placing no constraintson T and Ni as when it is fractional in practical compu-tations it can be rounded up to the nearest integer and thesamples missing to compute the last block transform in asequence are filled with zeroes
If a signal sn is projected onto M bases by transformsSi of different block length it can be presented as
sn
SSM
MXi
Si (2)
where n is the number of a time signal sample Si is a timesequence of lapped block transforms number i
Si Si Si SiL
(3)
It must be noted that if a signal resynthesis is performed bysumming the outputs from all (inverse) transforms S
i itresults in M sn The expansion procedure in (2) is pre-sented schematically in Figure 2
AllBi bases defined as in (1a) have the same dimensionand hence the expansion in (2) contains M times morecoefficients than the dimension in Bi Another problemfaced in any attempt to construct a common basis from thebasesBi is that the basis functions in one of the transformsare not orthogonal to those in another transform
bik bjl
for i j (4)
527
ACTA ACUSTICA UNITED WITH ACUSTICA Kleczkowski Acoustic signal expansion in multiple trigonometric basesVol 88 (2002)
S0 S1 S2 S3
L=30 L=20 L=15 L=5
+++s[n] Figure 2 Simultaneous projec-
tion of a signal sn by four se-quences of lapped transformsonto four bases of different (ar-bitrary) lengths
L=30 L=20 L=15 L=5
=+ + +Figure 3 Coefficients obtained from theexpansions of bandpass signals in differ-ent bases can be combined into one database
For some time-frequency tilings eg for dyadic tilingwhere
Ti Ti (5)
the basis functions of all transforms are orthogonal(hbik bjli for i j too) but still the bases Bi willnot form one common basis as it would not be complete
Instead of searching for a method to combine the Bi
bases into one orthogonal basis one might divide the sig-nal which is going to be expanded by filtering it with thebank ofM bandpass filters Then each of the band-limitedsignals sin can be expanded in its own basis
sinSi Sik (6)
and (2) still holds which is guaranteed by linearity ofthe transform Si (MDCT) Should the inverse operation(Si k) be performed one would then obtain nearly per-fectly reconstructed band-limited signal sin If one sumsup all of the signals sin together the result is the nearlyperfect reconstruction of the input signal sn There aretwo reasons why the signal reconstruction with the aboveprocedure will not be perfect The first one is the fact thatthere is some out-of-band leakage from the bandpass fil-ters the second one the considerable leakage of energy tothe neighbouring spectral coefficients present in any blocktransform In the discussion below however it is assumedthat both the filters and the transform are ideal
If the above analysissynthesis procedure is compared tothe one defined by (2) (no bandpass filtering) it can be seenthat the difference created by the ideal filtering consists inzeroing all of the coefficients which made the expansionin (2) redundant In the MDCT the basis functions arecosines [1 2 3 4 5] When a band-limited signal sinis expanded by a transform Si assigned to this band alltransform coefficients related to the basis functions hav-ing frequencies outside of the band analysed will equal tozero All remaining nonzero coefficients in all transformsSi can be combined into a common data base That basewhich is not the proper basis of a linear space still has im-
portant features of such a basis and can be used in its placethus justifying the use of the term ldquovirtualrdquo basis The sig-nal can be perfectly reconstructed from the coefficients inthat base and the size of that base is exactly equal to thenumber of samples of the discretized input signal which isan important feature of orthogonal expansions That latterfeature will be proved below and the procedure is shownschematically in Figure 3
Let us denote the frequency of a basis function relatedto the index k in the MDCT as fk and the lower and upperfrequency limits of a given i-th frequency band as fil andfih respectively Then
fk fil fih
Sik (7)
The total number of nonzero transform coefficients in eachtransform Si is
Ki kih kilLi (8)
where kih is the highest transform coefficient k for whichfk fil fih kil is the lowest transform coefficient forwhich fk fil fih The ratio of the width of a partic-ular filterrsquos pass band to the width of the entire acousticspectrum is given by
ri fih fil
A (9)
where fih fil are the filterrsquos cut-off frequencies and A isthe range processed by the signal-processing system used(depending on the sampling frequency) Based on the as-sumptions of the proposed procedure the band-pass filtersused cover the entire range of frequencies A and this isequivalent to
MXi
ri (10)
When the filtersrsquo cut-off frequencies are chosen so that thefrequencies fil and fih are halfway between the frequen-
528
Kleczkowski Acoustic signal expansion in multiple trigonometric bases ACTA ACUSTICA UNITED WITH ACUSTICA
Vol 88 (2002)
cies of the neighbouring basis functions (fk fk)the following proportion holds true
ri fih fil
Akih kil
Ni
(11)
ie
kih kil riNi (12)
from (8)
Ki kih kilLi riNiLi (13)
Now the sum of all nonzero coefficients over all trans-forms Si is
K
MXi
riNiLi
MXi
riT (14)
since the product NiLi for each transform is equal to thesignal length according to (1b) Taking (10) we obtain
K T (15)
which proves that the number of nonzero coefficients isequal to the number of samples in the input signal
In the following sections the entire procedure will bereferred to as EMTB (Expansion in Multiple Trigonomet-ric Basis)
4 Implementation
The signal expansion procedure consists of two stages thefiltering of the input signal by a bank of bandpass filtersfollowed by the MDCT performed independently in eachof the bands (Figure 4) In most applications an additionalstage grouping all ldquoin-bandrdquo coefficients into one database is required The term ldquoin-bandrdquo replaces ldquononzerordquo inpractical implementations as no coefficient will be strictlyzeroed
In order to follow the concept of the EMTB procedurethe filters should closely approximate the characteristicsof the ideal filter This is not difficult if signals of con-siderable length T will be analysed Then very long FIRfilters achieving excellent parameters can be used As thatlength will in practice considerably exceed the lengths oftransform blocks (ie transform filters) one can assumewithout quantitative analysis that imperfections in relationto the assumptions in (7)ndash(15) will be mostly generatedby spectral leakage from transform coefficients and not bythe bandpass filters An essential advantage of using thenon-decimated FIR bandpass filters over decimated onesis high flexibility in choosing the cut-off frequencies Inthe study a bank of very simple bandpass FIR filters wasused based on the Fourier Series method with the vonHann window [20] Increasing the filter length above 8192samples had negligible effects on the obtained results The
Filter no 0
input Filter no 1
Filter noM-1
MDCT no 0length = L0
MDCT no 1length = L1
MDCT noM-1
length = LM-1
Formingcommon
database
Figure 4 Block diagram of the analysis in multiple trigonometricbases
MDCT is based on the DCT-IV type of the DCT and isgiven by [4]
Sk
NXn
sncnk for k N (16)
where N is the block length (as in equations 1b 11ndash14)and
cnk hn
r
Ncos
nN k
N
(17)
where hn is a lowpass-filter impulse responseIf fast algorithms were to be used in the computation
of the MDCT blocks the flexibility in arbitrarily choosingtheir lengths would be limited resulting in limitations intiling of the time-frequency plane Therefore the only op-timisation of computations used by the author was basedon the symmetry of the MDCT basis functions and it re-duced the computation time by a factor of two (approxi-mately)
The function hn must satisfy two conditions it mustbe symmetrical and power complementary ie
hN n hn (18)
hn hnN (19)
in order for the transform to be orthogonal [2]An often used function satisfying (18) and (19) is
hn sin
n
N
(20)
but this window function has poor spectral characteristics(high leakage) The optimisation of the window hn wasshown in [21 22]
The author examined yet another approach to this prob-lem By choosing a window which has the appropriate
529
ACTA ACUSTICA UNITED WITH ACUSTICA Kleczkowski Acoustic signal expansion in multiple trigonometric basesVol 88 (2002)
- 20 dB
- 40 dB
- 60 dB
- 80 dB
0 dB
relative frequency0- 16π π16
Figure 5 The spectral characteristics of the optimized time win-dow hn
spectral characteristics but does not satisfy the power-complement condition (19) it is possible to satisfy thiscondition in a different manner When (19) is not met wecan express the reconstructed signal rn as
rn snmn (21)
where mn is a modulation function depending on hnWhen (19) is satisfied mn The function mn isperiodic with period N It can always be found either an-alytically or by tabulating the mn obtained from the leftside of (19) Then the compensation is straightforward
sn rn
mn (22)
There is an admissibility condition on hn for this methodto be used namely
hn for N
n
N
(23)
resulting from the overlapping factor of successive blocktransforms which is equal to 50 in the MDCT whichguarantees that mn In order to avoid the increasein quantization noise the computations must be performedin the floating-point number format
A special window function hn was chosen It is amodification of the Blackman window [20] given by
hn cos
N 13 cos
Nn
n N
N
(24)
and was designed in order that its spectral characteristicsshown in Figure 5 may have some analogy to the audi-
- 120
- 80
- 40
0
dBfrequency
band
0 coefficient number 511
Figure 6 The absolute value of the DCT of the bandpass fil-tered unit impulse showing the spectral leakage from the anal-ysed band of frequencies The time window defined in (24) wasused
tory filters [23 24 25] The sidelobes fall off rapidly inthe vicinity of the mainlobe which resembles the audi-tory filter and then stay at a nearly constant level closeto dB This latter piece of the characteristics is anunavoidable feature of this window but frequency com-ponents distant from the mainlobe belong to other bandsand will have strong additional attenuation by the band-pass filter The mn for this window function was com-puted based on (19)
5 Errors and their reduction
As it has been mentioned in Section 4 spectral leakageis the dominating reason why the model in (7)ndash(15) couldnot be implemented The implication (7) is not true as co-efficients related to frequencies outside the range fil fihare not equal to zero and the ones closest to this rangemay have meaningful values depending on the choice ofthe function hn In the reconstruction process when allof the coefficients mentioned above are assumed to equalzero the effect similar to the Gibbsrsquo phenomenon occursThis effect is known in the context of the Fourier Series[26] In that context methods for smoothing this effectdeveloped by Lanczos and Fejer are known A trivial anda less efficient method is to gradually taper off the coeffi-cients to be truncated
In the EMTB procedure it is easier to control this effectSignals which are to be reconstructed are band-pass typeand the energy represented by coefficients related to fre-quencies outside the range fil fih falls off rapidly Thisis illustrated by Figure 6 in which the absolute value ofthe DCT of the bandpass-filtered unit impulse is shownSubstantial reduction of the Gibbs effect is obtained by in-cluding in the reconstruction several coefficients related to
530
Kleczkowski Acoustic signal expansion in multiple trigonometric bases ACTA ACUSTICA UNITED WITH ACUSTICA
Vol 88 (2002)
002
-300 300
-002(a)
(b)
002
-002
300-300
Figure 7 The reconstruction of the unit impulse showing theGibbs effect (a) from the raw data base (b) from the data baseextended by 6 coefficients on both sides of each band
Table I The number of out-of-band coefficients at one side usedand their effect on the increase of data base and the attenuationof distortion in the reconstruction of a signal
Out-of-band Increase db [] Attenuation od [dB]
1 27 452 55 983 83 1126 166 164
20 555 320
the frequencies just neighbouring with the fil fih bandkil kil kih kih
Figures 7a and 7b show the Gibbs effect generated inthe reconstruction of the unit impulse The impulse signalhas been processed with the EMTB procedure accordingto Figure 4 with the parameters described in the next sec-tion Figure 7a presents the reconstruction of the impulsewhen all out-of-band coefficients are neglected Figure 7bpresents the reconstruction in which six out-of-band coef-ficients on either side of the band are included In the scaleused to plot Figures 7a and 7b there is not room enoughfor the entire impulse Its height in that scale is equal to50 This corresponds to the impulse to the peak of distor-tion ratio of about 43 dB for the case with all out-of-bandcoefficients neglected (Figure 7a) The total number of theextra coefficients used in Figure 7b when compared withthe critically sampled case (according to (15) Figure 7a)is increased by 5 The comparison of energies of distor-tion signals in Figures 7a and 7b gives an improvementof 166 dB in Figure 7b Table I shows several results inother cases Some experiments suggested that for a given
number of out-of-band coefficients their specific allocationleads to an optimal reduction of the error
This ldquoGibbs noiserdquo is concentrated only in spectral re-gions close to the filtersrsquo cut-off frequencies When prac-tical audio signals of different kinds are reconstructed nodisturbances of any kind can be heard even with all out-of-band coefficients neglected (Figure 7a)
6 Time-frequency tiling for the analysis ofacoustic signals
The EMTB procedure in its most general form allows fora very flexible tiling (Figure 1e) There are no limita-tions on the assignment of frequency bands apart fromslight adjustments needed for any partition of the fre-quency axis This adjustment ensures the optimal place-ment of the boundary between two EMTB bands depend-ing on the frequencies of two neighbouring spectral lines(coefficients) belonging to adjacent transforms
For each frequency band the length Ni of the transformassigned to it is constant The value of Ni can in principlebe arbitrary in each transform In order to obtain simplestructures of time frames in the entire procedure the ratiosof lengths Ni of all transforms should consist of simplerational or integer numbers The simplest structure is ob-tained when all ratios are powers of 2 Then one has thedyadic division of the time axis combined with the arbi-trary division of the frequency axis This differs from theDiscrete Wavelet Transform or the methods of Branden-burg and Johnston [16] and Tsutsui et al [17] where bothdivisions are dyadic
In this work two implementations are presented Thefirst one is most straightforward with a dyadic division ofthe time axis Based on this assumption the number M offrequency bands and their widths and the lengthN of thetransform associated with the lowest frequency band canbe chosen For a number M of bands the length N mustbe divisible by NM and Ni N
iAssuming critical bands (CB) as the model of auditory
bandpass filters the number M of bands should be de-termined on the basis of the scale of widths of those fil-ters According to the most often used table of criticalbands [27] that scale is about 40 (widest CB) to 1 (nar-rowest CB) In the first approximation the ratio of timeresponses of the corresponding filters should be similarWithin the limitations of the dyadic scheme one then hasto choose from the ratios of 32 to 1 or 64 to 1 The initialtests have shown that the graphical results of the analysisare more readable with the lower ratio Hence we arriveat M log bands One then may eitherhave 24 CBs and a uniform distribution of CBs betweenthe EMTB bands ie four CBs in each band or 25 CBswith five CBs in one of the bands Since the width of thelowest five CBs according to the CB table is nearly con-stant (although this is a crude approximation according to[25]) it seems to be very appropriate to include all five ofthe lowest CBs (up to 510 Hz) within the lowest EMTBband The approximation of the auditory system is best in
531
ACTA ACUSTICA UNITED WITH ACUSTICA Kleczkowski Acoustic signal expansion in multiple trigonometric basesVol 88 (2002)
frequency [Hz]B0
84
76663704
B 446
2003Band 340
1077Band 2no of spectral lines 43
511Band 1no of spectral lines 53
Band 00 no of spectral lines 95
0 time [ms] 85
Figure 8 The time-frequencytiling obtained with the 6-bandEMTB procedure dyadic divi-sion of time axis
Table II Parameters of the 6-band implementation of the EMTB procedure
Band No Frequency range [Hz] MDCT spectral lines used MDCT size in bandlowest highest number used
0 0-511 0 94 95 40961 511-1076 47 99 53 20482 1076-2002 50 92 43 10243 2002-3703 46 85 40 5124 3703-7665 43 88 46 2565 7665-22050 44 127 84 128
Table III Parameters of the 10-band implementation of the EMTB procedure
Band No Number of CBs Frequency range [Hz] MDCT spectral lines used MDCT size in bandlowest highest number used
0 2 0-2075 0 26 27 28801 3 2075-505 18 43 26 19202 2 505-781 33 50 18 14403 2 781-1077 34 46 13 9604 3 1077-1691 35 54 20 7205 3 1691-2701 36 58 23 4806 3 2701-4410 44 71 28 3607 3 4410-7717 48 83 36 2408 2 7717-12127 63 98 36 1809 2 12127-22050 66 119 54 120
this lowest band as the earrsquos characteristics are close to theconstant-bandwidth type in this frequency range contraryto the rest of the acoustic range
Figure 8 presents the time-frequency tiling for the aboveparameters of the EMTB analysis The boundaries be-tween the EMTB bands approximately coincide with theappropriate edges of the CBs Table II gives the detailedspecification of the EMTB with these parameters in termsof numbers of spectral lines of the individual MDCTs usedin particular EMTB bands The correction discussed inSection 5 was not used but the adjustment of the fre-quency bands mentioned in the first paragraph of this Sec-tion was This is why the cut-off frequencies of bandsgiven in Tables II and III are not those of critical-bandboundaries of the ear found in the literature
The second implementation was based on a 10-bandanalysis This results in more gradual transitions betweenthe lengths Ni of transforms in particular bands In effectthe characteristics are closer to the constant-Q analysis
The sequence of lengths Ni of transform blocks was cho-sen so that the Ni values were proportional to the follow-ing integers 48 32 24 16 12 8 6 4 3 2 Thus the ra-tio of corresponding time responses of filters was 241 Itwas found that although the analogy to the characteristicsof the ear is weaker the plots are more readable The as-signment of numbers of critical bands to particular EMTBbands cut-off frequencies and MDCT parameters for thiscase are given in Table III
Arbitrary Ni values can also be used resulting in a lessregular data structure This may be perfectly acceptablewhile allowing for yet higher flexibility
7 Results of analysis of audio signals
The DCT which is the basis for the MDCT used in theEMTB procedure is not optimal for spectral analysis assome spectral components of the signal may have phases
532
Kleczkowski Acoustic signal expansion in multiple trigonometric bases ACTA ACUSTICA UNITED WITH ACUSTICA
Vol 88 (2002)
frequency [kHz]
511
1077
2003
3704
7666
22050
0 0371 0742 1113 1484time [ms]
Figure 9 The results of the 6-band EMTB analysis of an excerptof orchestral music
resulting in very low values of DCT coefficients [2]Therefore additional processing was used in order to ob-tain results appropriate for displaying the results of time-frequency analysis of acoustic signals In parallel to theMDCT transform its appropriate sine counterpart (basedon the Discrete Sine Transform-DST) has been computedleading to pairs of coefficients (MDCT and MDST) In thenext step a joint measure of amplitude spectrum was ob-tained by computing
dnk qcnk snk (25)
where snk is the MDST coefficient appropriately com-plementing the cnk of (17)
It is worth noting that if such a spectral analysis is com-pared with the Discrete Fourier Transform it offers twiceas high spectral resolution as for a signal of lengthN thereare N different spectral amplitude coefficients The DFTyields only N spectral amplitudes
Several short fragments of musical material have beenanalysed by the EMTB procedure with the extension pre-sented above Due to this procedurersquos characteristics thetwo-dimensional diagram was found to be most appropri-ate The plots presented in this work display all values ofspectral coefficients dnk obtained according to Tables IIand III The mapping of the values dnk to the grey-scalewas logarithmic in the range of about 40 dB from the high-est coefficient values For the rest of the range (lowest val-ues) a correction to the logarithmic mapping has been in-troduced in order to obtain most readable results This cor-rection consisted in compressing the range of lowest val-ues In order to reveal more details in the high frequencyrange the pre-emphasis in the two highest bands was usedwith the gain of dB at the highest frequency
In the highest frequency band each coefficient is repre-sented by one dot In the lower bands the coefficients arerepresented as short horizontal lines with the lines in thelowest band consisting of respectively 32 and 24 dots eachIn the band no 8 of Table III the length is 15 dots and anappropriate averaging has been used
frequency [kHz]20
16
12
8
4
00 0371 0742 1113 1484
time [ms]
Figure 10 The Discrete SineCosine Transform modulus of thesignal analysed in Figure 9 the lenght of the analysis frame isthe same as in band no 3 of Figure 9
frequency [kHz]
207505
16911077
27014410
7717
12127
22050
0 0261 0522 0783 1045 1306 1567 [s]time
781
Figure 11 The results of the 10-band EMTB analysis of an ex-cerpt of orchestral music
Figure 9 shows the results of the 6-band EMTB analysisof an 18 s excerpt of an orchestra recording Although theacoustic content was dense groups of harmonics in differ-ent frequency regions are clearly visible For comparisonFigure 10 shows the same signal analysed with the stan-dard MDCT (constant bandwidth) analysis with a trans-form length N of 512 samples the same as used in bandno 3 of the EMTB analysis of Figure 9 Several partialgroups are also clearly visible but little information canbe obtained from the range below 1 kHz The entire upperhalf of the diagram is not informative either
The result of the 10-band EMTB analysis of the samesignal is presented in Figure 11 The transitions betweenthe bands are smoother and it seems that the time-fre-quency resolution is better adjusted to reveal more detailsof the signal
Figure 12 presents the result of the same 10-bandEMTB analysis of several guitar chords Some groups ofharmonics can be resolved and the diagram clearly showsthe time lag between the excitations of lower and higherstrings in a chord
533
ACTA ACUSTICA UNITED WITH ACUSTICA Kleczkowski Acoustic signal expansion in multiple trigonometric basesVol 88 (2002)
frequency [kHz]
207505
16911077
27014410
7717
12127
22050
0 0261 0522 0783 1045 1306 1567 [s]time
781
Figure 12 The results of the 10-band EMTB analysis of severalguitar chords
frequency [kHz]
207505
1077169127014410
7717
12127
22050
0 0261 0522 0783 1045 1306 1567 [s]time
781
Figure 13 The results of the 10-band EMTB analysis of the ut-terance ldquoWhy were you away a year Royrdquo spoken by a malevoice
frequency [kHz]
207505
16911077
27014410
7717
12127
22050
0 0261 0522 0783 1045 1306 1567 [s]time
781
Figure 14 The results of the 10-band EMTB analysis of the ut-terance ldquoTell me whatrsquos the timerdquo spoken by a female voice
Two speech signals have also been analysed with the10-band EMTB method In these presentations the pre-emphasis encompassed the three highest bands and thegain reached dB The first one is a direct digitalrecording of a male voice (Figure 13) and the second oneis a female voice from a vinyl record (Figure 14) All threekinds of information important in speech recognition arerevealed harmonic structure glottal pulses and formanttrajectories The scratches from the vinyl record are visi-ble as narrow vertical strips in Figure 14
8 Conclusion
The EMTB procedure proposed and analysed in this pa-per has all of the basic properties of an orthogonal signalexpansion while allowing for a very flexible tiling of thetime-frequency plane This flexibility can be used for ad-justing the time-frequency characteristics to any applica-tion In this work a crude adjustment to the characteristicsof the ear was investigated The procedure is simple con-ceptually easy to implement and robust The possibilityof using fast algorithms for MDCT computation can makeit computationally inexpensive There are some sourcesof errors in this procedure but means for their alleviationhave been presented
The method proposed differs substantially from earlierimplementations of the similar concept [19 18] in us-ing non-decimated bandpass filters and performing MDCTanalysis on the non-decimated signal Two additional de-grees of freedom have been gained this way The first oneconsists in an arbitrary choice of number widths and lo-calisation of frequency bands In these bands independentanalyses with arbitrary time-frequency resolution can beperformed
The spectral resolution of this expansion is good es-pecially when the improved time windows are used Onesuch window with additional advantage of deepening theanalogy to the auditory systemrsquos characteristics was pro-posed and other efficient windows can be used Practicalanalyses of audio signals showed that this method is use-ful in the graphical presentation of time-frequency spectraof acoustic signals showing most of the details relevant tothe ear
Acknowledgement
The author is indebted to Prof Zbigniew Engel and toProf Jan Adamczyk for their continuing support and helpduring this work and stimulating comments to this text
References
[1] J P Princen A B Bradley Analysissynthesis filter bankdesign based on time domain aliasing cancellation IEEETrans Acoust Speech Signal Processing 34 (1986) 1153ndash1161
[2] H S Malvar Signal processing with lapped transformsArtech House Boston 1992 143-217
[3] A Ferreira Convolutional effects in transform coding withTDAC an optimal window IEEE Trans Speech AudioProcessing 4 (1996) 105ndash114
[4] S Shlien The modulated lapped transform its time-vary-ing forms and its applications to audio coding standardsIEEE Trans Speech Audio Processing 5 (1997) 359ndash366
[5] M Vetterli J Kovacevic Wavelets and subband codingPrentice Hall Englewood Cliffs 1995 92-294
[6] G Gambardella A contribution to the theory of short-timespectral analysis with nonuniform bandwidth filters IEEETrans on Circuit Theory 18 (1971) 455ndash460
[7] G Gambardella The Mellin transforms and constant-Qspectral analysis J Acoust Soc Amer 66 (1979) 913ndash915
534
Kleczkowski Acoustic signal expansion in multiple trigonometric bases ACTA ACUSTICA UNITED WITH ACUSTICA
Vol 88 (2002)
[8] E Terhardt Fourier transformation of time signals Con-ceptual revison Acustica 57 (1985) 242ndash256
[9] W Heinbach Aurally adequate signal representation Thepart-tone-time-pattern 67 (1988) 113ndash120
[10] J C Brown Calculation of a constant Q spectral transformJ Acoust Soc Amer 89 (1990) 425ndash434
[11] I Daubechies The wavelet transform time-frequency lo-calization and signal analysis IEEE Trans on Inform The-ory 36 (1990) 961ndash1005
[12] T Irino H Kawahara Signal reconstruction from modifiedauditory wavelet transform IEEE Trans on Signal Process-ing 41 (1993) 3549ndash3554
[13] H Jeong J-G Ih Implementation of a new algorithm us-ing the STFT with variable frequency resolution for thetime-frequency auditory model J Audio Eng Soc 47(1999) 240ndash251
[14] D Sinha A H Tewfik Low bit rate transparent audio com-pression using adapted wavelets IEEE Trans on SignalProcessing 41 (1993) 3463ndash3479
[15] M Bobrek D B Koch Music segmentation using tree-structured filter banks J Audio Eng Soc 46 (1998) 413ndash427
[16] K Brandenburg J D Johnston Second generation percep-tual audio coding the hybrid coder 88th AES ConventionMontreux 1990 Preprint no 2937
[17] K Tsutsui H Suzuki O Shimoyoshi M Sonohara KAkagiri R M Heddle ATRAC Adaptive transform acous-tic coding for minidisc ndash In Collected Papers on DigitalAudio Bit-Rate Reduction N Gilchrist C Grewin (eds)Audio Engineering Society New York 1996 95ndash101
[18] M V Wickerhauser Adapted wavelet analysis from theoryto software IEEE Pr Piscataway 1994 103-152 237-271
[19] C Herley J Kovacevic K Ramchandran M VetterliTilings of the time-frequency plane construction of arbi-trary orthogonal bases and fast tiling algorithms IEEETrans on Signal Processing 41 (1993) 3341ndash3359
[20] F J Harris On the use of windows for harmonic analy-sis with the discrete Fourier transform Proceedings of theIEEE 66 (1978) 51ndash83
[21] A Ferreira Perceptual audio coding and the choice of ananalysissynthesis filter bank and psychoacoustic model104th AES Convention Amsterdam 1998 Preprint no4691
[22] L D Fielder M Bosi G Davidson M Davis C Todd SVernon AC-2 and AC-3 low complexity transform-basedaudio coding ndash In Collected Papers on Digital Audio Bit-Rate Reduction N Gilchrist C Grewin (eds) Audio En-gineering Society New York 1996 54ndash72
[23] T Sporer K Brandenburg Constraints of filter banks usedfor perceptual measurement J Audio Eng Soc 43 (1995)107ndash116
[24] R D Patterson Auditory filter shapes derived with noisestimuli J Acoust Soc Amer 59 (1976) 640ndash654
[25] B C J Moore B R Glasberg Suggested formulae for cal-culating auditory-filter bandwidths and excitation patternsJ Acoust Soc Amer 74 (1983) 750ndash753
[26] A D Poularkis S Seely Signals and systems PWS Engi-neering Boston 1988 152-155
[27] E Zwicker H Fastl Psychoacoustics facts and modelsSpringer-Verlag Berlin 1990 142
535
ACTA ACUSTICA UNITED WITH ACUSTICA Kleczkowski Acoustic signal expansion in multiple trigonometric basesVol 88 (2002)
S0 S1 S2 S3
L=30 L=20 L=15 L=5
+++s[n] Figure 2 Simultaneous projec-
tion of a signal sn by four se-quences of lapped transformsonto four bases of different (ar-bitrary) lengths
L=30 L=20 L=15 L=5
=+ + +Figure 3 Coefficients obtained from theexpansions of bandpass signals in differ-ent bases can be combined into one database
For some time-frequency tilings eg for dyadic tilingwhere
Ti Ti (5)
the basis functions of all transforms are orthogonal(hbik bjli for i j too) but still the bases Bi willnot form one common basis as it would not be complete
Instead of searching for a method to combine the Bi
bases into one orthogonal basis one might divide the sig-nal which is going to be expanded by filtering it with thebank ofM bandpass filters Then each of the band-limitedsignals sin can be expanded in its own basis
sinSi Sik (6)
and (2) still holds which is guaranteed by linearity ofthe transform Si (MDCT) Should the inverse operation(Si k) be performed one would then obtain nearly per-fectly reconstructed band-limited signal sin If one sumsup all of the signals sin together the result is the nearlyperfect reconstruction of the input signal sn There aretwo reasons why the signal reconstruction with the aboveprocedure will not be perfect The first one is the fact thatthere is some out-of-band leakage from the bandpass fil-ters the second one the considerable leakage of energy tothe neighbouring spectral coefficients present in any blocktransform In the discussion below however it is assumedthat both the filters and the transform are ideal
If the above analysissynthesis procedure is compared tothe one defined by (2) (no bandpass filtering) it can be seenthat the difference created by the ideal filtering consists inzeroing all of the coefficients which made the expansionin (2) redundant In the MDCT the basis functions arecosines [1 2 3 4 5] When a band-limited signal sinis expanded by a transform Si assigned to this band alltransform coefficients related to the basis functions hav-ing frequencies outside of the band analysed will equal tozero All remaining nonzero coefficients in all transformsSi can be combined into a common data base That basewhich is not the proper basis of a linear space still has im-
portant features of such a basis and can be used in its placethus justifying the use of the term ldquovirtualrdquo basis The sig-nal can be perfectly reconstructed from the coefficients inthat base and the size of that base is exactly equal to thenumber of samples of the discretized input signal which isan important feature of orthogonal expansions That latterfeature will be proved below and the procedure is shownschematically in Figure 3
Let us denote the frequency of a basis function relatedto the index k in the MDCT as fk and the lower and upperfrequency limits of a given i-th frequency band as fil andfih respectively Then
fk fil fih
Sik (7)
The total number of nonzero transform coefficients in eachtransform Si is
Ki kih kilLi (8)
where kih is the highest transform coefficient k for whichfk fil fih kil is the lowest transform coefficient forwhich fk fil fih The ratio of the width of a partic-ular filterrsquos pass band to the width of the entire acousticspectrum is given by
ri fih fil
A (9)
where fih fil are the filterrsquos cut-off frequencies and A isthe range processed by the signal-processing system used(depending on the sampling frequency) Based on the as-sumptions of the proposed procedure the band-pass filtersused cover the entire range of frequencies A and this isequivalent to
MXi
ri (10)
When the filtersrsquo cut-off frequencies are chosen so that thefrequencies fil and fih are halfway between the frequen-
528
Kleczkowski Acoustic signal expansion in multiple trigonometric bases ACTA ACUSTICA UNITED WITH ACUSTICA
Vol 88 (2002)
cies of the neighbouring basis functions (fk fk)the following proportion holds true
ri fih fil
Akih kil
Ni
(11)
ie
kih kil riNi (12)
from (8)
Ki kih kilLi riNiLi (13)
Now the sum of all nonzero coefficients over all trans-forms Si is
K
MXi
riNiLi
MXi
riT (14)
since the product NiLi for each transform is equal to thesignal length according to (1b) Taking (10) we obtain
K T (15)
which proves that the number of nonzero coefficients isequal to the number of samples in the input signal
In the following sections the entire procedure will bereferred to as EMTB (Expansion in Multiple Trigonomet-ric Basis)
4 Implementation
The signal expansion procedure consists of two stages thefiltering of the input signal by a bank of bandpass filtersfollowed by the MDCT performed independently in eachof the bands (Figure 4) In most applications an additionalstage grouping all ldquoin-bandrdquo coefficients into one database is required The term ldquoin-bandrdquo replaces ldquononzerordquo inpractical implementations as no coefficient will be strictlyzeroed
In order to follow the concept of the EMTB procedurethe filters should closely approximate the characteristicsof the ideal filter This is not difficult if signals of con-siderable length T will be analysed Then very long FIRfilters achieving excellent parameters can be used As thatlength will in practice considerably exceed the lengths oftransform blocks (ie transform filters) one can assumewithout quantitative analysis that imperfections in relationto the assumptions in (7)ndash(15) will be mostly generatedby spectral leakage from transform coefficients and not bythe bandpass filters An essential advantage of using thenon-decimated FIR bandpass filters over decimated onesis high flexibility in choosing the cut-off frequencies Inthe study a bank of very simple bandpass FIR filters wasused based on the Fourier Series method with the vonHann window [20] Increasing the filter length above 8192samples had negligible effects on the obtained results The
Filter no 0
input Filter no 1
Filter noM-1
MDCT no 0length = L0
MDCT no 1length = L1
MDCT noM-1
length = LM-1
Formingcommon
database
Figure 4 Block diagram of the analysis in multiple trigonometricbases
MDCT is based on the DCT-IV type of the DCT and isgiven by [4]
Sk
NXn
sncnk for k N (16)
where N is the block length (as in equations 1b 11ndash14)and
cnk hn
r
Ncos
nN k
N
(17)
where hn is a lowpass-filter impulse responseIf fast algorithms were to be used in the computation
of the MDCT blocks the flexibility in arbitrarily choosingtheir lengths would be limited resulting in limitations intiling of the time-frequency plane Therefore the only op-timisation of computations used by the author was basedon the symmetry of the MDCT basis functions and it re-duced the computation time by a factor of two (approxi-mately)
The function hn must satisfy two conditions it mustbe symmetrical and power complementary ie
hN n hn (18)
hn hnN (19)
in order for the transform to be orthogonal [2]An often used function satisfying (18) and (19) is
hn sin
n
N
(20)
but this window function has poor spectral characteristics(high leakage) The optimisation of the window hn wasshown in [21 22]
The author examined yet another approach to this prob-lem By choosing a window which has the appropriate
529
ACTA ACUSTICA UNITED WITH ACUSTICA Kleczkowski Acoustic signal expansion in multiple trigonometric basesVol 88 (2002)
- 20 dB
- 40 dB
- 60 dB
- 80 dB
0 dB
relative frequency0- 16π π16
Figure 5 The spectral characteristics of the optimized time win-dow hn
spectral characteristics but does not satisfy the power-complement condition (19) it is possible to satisfy thiscondition in a different manner When (19) is not met wecan express the reconstructed signal rn as
rn snmn (21)
where mn is a modulation function depending on hnWhen (19) is satisfied mn The function mn isperiodic with period N It can always be found either an-alytically or by tabulating the mn obtained from the leftside of (19) Then the compensation is straightforward
sn rn
mn (22)
There is an admissibility condition on hn for this methodto be used namely
hn for N
n
N
(23)
resulting from the overlapping factor of successive blocktransforms which is equal to 50 in the MDCT whichguarantees that mn In order to avoid the increasein quantization noise the computations must be performedin the floating-point number format
A special window function hn was chosen It is amodification of the Blackman window [20] given by
hn cos
N 13 cos
Nn
n N
N
(24)
and was designed in order that its spectral characteristicsshown in Figure 5 may have some analogy to the audi-
- 120
- 80
- 40
0
dBfrequency
band
0 coefficient number 511
Figure 6 The absolute value of the DCT of the bandpass fil-tered unit impulse showing the spectral leakage from the anal-ysed band of frequencies The time window defined in (24) wasused
tory filters [23 24 25] The sidelobes fall off rapidly inthe vicinity of the mainlobe which resembles the audi-tory filter and then stay at a nearly constant level closeto dB This latter piece of the characteristics is anunavoidable feature of this window but frequency com-ponents distant from the mainlobe belong to other bandsand will have strong additional attenuation by the band-pass filter The mn for this window function was com-puted based on (19)
5 Errors and their reduction
As it has been mentioned in Section 4 spectral leakageis the dominating reason why the model in (7)ndash(15) couldnot be implemented The implication (7) is not true as co-efficients related to frequencies outside the range fil fihare not equal to zero and the ones closest to this rangemay have meaningful values depending on the choice ofthe function hn In the reconstruction process when allof the coefficients mentioned above are assumed to equalzero the effect similar to the Gibbsrsquo phenomenon occursThis effect is known in the context of the Fourier Series[26] In that context methods for smoothing this effectdeveloped by Lanczos and Fejer are known A trivial anda less efficient method is to gradually taper off the coeffi-cients to be truncated
In the EMTB procedure it is easier to control this effectSignals which are to be reconstructed are band-pass typeand the energy represented by coefficients related to fre-quencies outside the range fil fih falls off rapidly Thisis illustrated by Figure 6 in which the absolute value ofthe DCT of the bandpass-filtered unit impulse is shownSubstantial reduction of the Gibbs effect is obtained by in-cluding in the reconstruction several coefficients related to
530
Kleczkowski Acoustic signal expansion in multiple trigonometric bases ACTA ACUSTICA UNITED WITH ACUSTICA
Vol 88 (2002)
002
-300 300
-002(a)
(b)
002
-002
300-300
Figure 7 The reconstruction of the unit impulse showing theGibbs effect (a) from the raw data base (b) from the data baseextended by 6 coefficients on both sides of each band
Table I The number of out-of-band coefficients at one side usedand their effect on the increase of data base and the attenuationof distortion in the reconstruction of a signal
Out-of-band Increase db [] Attenuation od [dB]
1 27 452 55 983 83 1126 166 164
20 555 320
the frequencies just neighbouring with the fil fih bandkil kil kih kih
Figures 7a and 7b show the Gibbs effect generated inthe reconstruction of the unit impulse The impulse signalhas been processed with the EMTB procedure accordingto Figure 4 with the parameters described in the next sec-tion Figure 7a presents the reconstruction of the impulsewhen all out-of-band coefficients are neglected Figure 7bpresents the reconstruction in which six out-of-band coef-ficients on either side of the band are included In the scaleused to plot Figures 7a and 7b there is not room enoughfor the entire impulse Its height in that scale is equal to50 This corresponds to the impulse to the peak of distor-tion ratio of about 43 dB for the case with all out-of-bandcoefficients neglected (Figure 7a) The total number of theextra coefficients used in Figure 7b when compared withthe critically sampled case (according to (15) Figure 7a)is increased by 5 The comparison of energies of distor-tion signals in Figures 7a and 7b gives an improvementof 166 dB in Figure 7b Table I shows several results inother cases Some experiments suggested that for a given
number of out-of-band coefficients their specific allocationleads to an optimal reduction of the error
This ldquoGibbs noiserdquo is concentrated only in spectral re-gions close to the filtersrsquo cut-off frequencies When prac-tical audio signals of different kinds are reconstructed nodisturbances of any kind can be heard even with all out-of-band coefficients neglected (Figure 7a)
6 Time-frequency tiling for the analysis ofacoustic signals
The EMTB procedure in its most general form allows fora very flexible tiling (Figure 1e) There are no limita-tions on the assignment of frequency bands apart fromslight adjustments needed for any partition of the fre-quency axis This adjustment ensures the optimal place-ment of the boundary between two EMTB bands depend-ing on the frequencies of two neighbouring spectral lines(coefficients) belonging to adjacent transforms
For each frequency band the length Ni of the transformassigned to it is constant The value of Ni can in principlebe arbitrary in each transform In order to obtain simplestructures of time frames in the entire procedure the ratiosof lengths Ni of all transforms should consist of simplerational or integer numbers The simplest structure is ob-tained when all ratios are powers of 2 Then one has thedyadic division of the time axis combined with the arbi-trary division of the frequency axis This differs from theDiscrete Wavelet Transform or the methods of Branden-burg and Johnston [16] and Tsutsui et al [17] where bothdivisions are dyadic
In this work two implementations are presented Thefirst one is most straightforward with a dyadic division ofthe time axis Based on this assumption the number M offrequency bands and their widths and the lengthN of thetransform associated with the lowest frequency band canbe chosen For a number M of bands the length N mustbe divisible by NM and Ni N
iAssuming critical bands (CB) as the model of auditory
bandpass filters the number M of bands should be de-termined on the basis of the scale of widths of those fil-ters According to the most often used table of criticalbands [27] that scale is about 40 (widest CB) to 1 (nar-rowest CB) In the first approximation the ratio of timeresponses of the corresponding filters should be similarWithin the limitations of the dyadic scheme one then hasto choose from the ratios of 32 to 1 or 64 to 1 The initialtests have shown that the graphical results of the analysisare more readable with the lower ratio Hence we arriveat M log bands One then may eitherhave 24 CBs and a uniform distribution of CBs betweenthe EMTB bands ie four CBs in each band or 25 CBswith five CBs in one of the bands Since the width of thelowest five CBs according to the CB table is nearly con-stant (although this is a crude approximation according to[25]) it seems to be very appropriate to include all five ofthe lowest CBs (up to 510 Hz) within the lowest EMTBband The approximation of the auditory system is best in
531
ACTA ACUSTICA UNITED WITH ACUSTICA Kleczkowski Acoustic signal expansion in multiple trigonometric basesVol 88 (2002)
frequency [Hz]B0
84
76663704
B 446
2003Band 340
1077Band 2no of spectral lines 43
511Band 1no of spectral lines 53
Band 00 no of spectral lines 95
0 time [ms] 85
Figure 8 The time-frequencytiling obtained with the 6-bandEMTB procedure dyadic divi-sion of time axis
Table II Parameters of the 6-band implementation of the EMTB procedure
Band No Frequency range [Hz] MDCT spectral lines used MDCT size in bandlowest highest number used
0 0-511 0 94 95 40961 511-1076 47 99 53 20482 1076-2002 50 92 43 10243 2002-3703 46 85 40 5124 3703-7665 43 88 46 2565 7665-22050 44 127 84 128
Table III Parameters of the 10-band implementation of the EMTB procedure
Band No Number of CBs Frequency range [Hz] MDCT spectral lines used MDCT size in bandlowest highest number used
0 2 0-2075 0 26 27 28801 3 2075-505 18 43 26 19202 2 505-781 33 50 18 14403 2 781-1077 34 46 13 9604 3 1077-1691 35 54 20 7205 3 1691-2701 36 58 23 4806 3 2701-4410 44 71 28 3607 3 4410-7717 48 83 36 2408 2 7717-12127 63 98 36 1809 2 12127-22050 66 119 54 120
this lowest band as the earrsquos characteristics are close to theconstant-bandwidth type in this frequency range contraryto the rest of the acoustic range
Figure 8 presents the time-frequency tiling for the aboveparameters of the EMTB analysis The boundaries be-tween the EMTB bands approximately coincide with theappropriate edges of the CBs Table II gives the detailedspecification of the EMTB with these parameters in termsof numbers of spectral lines of the individual MDCTs usedin particular EMTB bands The correction discussed inSection 5 was not used but the adjustment of the fre-quency bands mentioned in the first paragraph of this Sec-tion was This is why the cut-off frequencies of bandsgiven in Tables II and III are not those of critical-bandboundaries of the ear found in the literature
The second implementation was based on a 10-bandanalysis This results in more gradual transitions betweenthe lengths Ni of transforms in particular bands In effectthe characteristics are closer to the constant-Q analysis
The sequence of lengths Ni of transform blocks was cho-sen so that the Ni values were proportional to the follow-ing integers 48 32 24 16 12 8 6 4 3 2 Thus the ra-tio of corresponding time responses of filters was 241 Itwas found that although the analogy to the characteristicsof the ear is weaker the plots are more readable The as-signment of numbers of critical bands to particular EMTBbands cut-off frequencies and MDCT parameters for thiscase are given in Table III
Arbitrary Ni values can also be used resulting in a lessregular data structure This may be perfectly acceptablewhile allowing for yet higher flexibility
7 Results of analysis of audio signals
The DCT which is the basis for the MDCT used in theEMTB procedure is not optimal for spectral analysis assome spectral components of the signal may have phases
532
Kleczkowski Acoustic signal expansion in multiple trigonometric bases ACTA ACUSTICA UNITED WITH ACUSTICA
Vol 88 (2002)
frequency [kHz]
511
1077
2003
3704
7666
22050
0 0371 0742 1113 1484time [ms]
Figure 9 The results of the 6-band EMTB analysis of an excerptof orchestral music
resulting in very low values of DCT coefficients [2]Therefore additional processing was used in order to ob-tain results appropriate for displaying the results of time-frequency analysis of acoustic signals In parallel to theMDCT transform its appropriate sine counterpart (basedon the Discrete Sine Transform-DST) has been computedleading to pairs of coefficients (MDCT and MDST) In thenext step a joint measure of amplitude spectrum was ob-tained by computing
dnk qcnk snk (25)
where snk is the MDST coefficient appropriately com-plementing the cnk of (17)
It is worth noting that if such a spectral analysis is com-pared with the Discrete Fourier Transform it offers twiceas high spectral resolution as for a signal of lengthN thereare N different spectral amplitude coefficients The DFTyields only N spectral amplitudes
Several short fragments of musical material have beenanalysed by the EMTB procedure with the extension pre-sented above Due to this procedurersquos characteristics thetwo-dimensional diagram was found to be most appropri-ate The plots presented in this work display all values ofspectral coefficients dnk obtained according to Tables IIand III The mapping of the values dnk to the grey-scalewas logarithmic in the range of about 40 dB from the high-est coefficient values For the rest of the range (lowest val-ues) a correction to the logarithmic mapping has been in-troduced in order to obtain most readable results This cor-rection consisted in compressing the range of lowest val-ues In order to reveal more details in the high frequencyrange the pre-emphasis in the two highest bands was usedwith the gain of dB at the highest frequency
In the highest frequency band each coefficient is repre-sented by one dot In the lower bands the coefficients arerepresented as short horizontal lines with the lines in thelowest band consisting of respectively 32 and 24 dots eachIn the band no 8 of Table III the length is 15 dots and anappropriate averaging has been used
frequency [kHz]20
16
12
8
4
00 0371 0742 1113 1484
time [ms]
Figure 10 The Discrete SineCosine Transform modulus of thesignal analysed in Figure 9 the lenght of the analysis frame isthe same as in band no 3 of Figure 9
frequency [kHz]
207505
16911077
27014410
7717
12127
22050
0 0261 0522 0783 1045 1306 1567 [s]time
781
Figure 11 The results of the 10-band EMTB analysis of an ex-cerpt of orchestral music
Figure 9 shows the results of the 6-band EMTB analysisof an 18 s excerpt of an orchestra recording Although theacoustic content was dense groups of harmonics in differ-ent frequency regions are clearly visible For comparisonFigure 10 shows the same signal analysed with the stan-dard MDCT (constant bandwidth) analysis with a trans-form length N of 512 samples the same as used in bandno 3 of the EMTB analysis of Figure 9 Several partialgroups are also clearly visible but little information canbe obtained from the range below 1 kHz The entire upperhalf of the diagram is not informative either
The result of the 10-band EMTB analysis of the samesignal is presented in Figure 11 The transitions betweenthe bands are smoother and it seems that the time-fre-quency resolution is better adjusted to reveal more detailsof the signal
Figure 12 presents the result of the same 10-bandEMTB analysis of several guitar chords Some groups ofharmonics can be resolved and the diagram clearly showsthe time lag between the excitations of lower and higherstrings in a chord
533
ACTA ACUSTICA UNITED WITH ACUSTICA Kleczkowski Acoustic signal expansion in multiple trigonometric basesVol 88 (2002)
frequency [kHz]
207505
16911077
27014410
7717
12127
22050
0 0261 0522 0783 1045 1306 1567 [s]time
781
Figure 12 The results of the 10-band EMTB analysis of severalguitar chords
frequency [kHz]
207505
1077169127014410
7717
12127
22050
0 0261 0522 0783 1045 1306 1567 [s]time
781
Figure 13 The results of the 10-band EMTB analysis of the ut-terance ldquoWhy were you away a year Royrdquo spoken by a malevoice
frequency [kHz]
207505
16911077
27014410
7717
12127
22050
0 0261 0522 0783 1045 1306 1567 [s]time
781
Figure 14 The results of the 10-band EMTB analysis of the ut-terance ldquoTell me whatrsquos the timerdquo spoken by a female voice
Two speech signals have also been analysed with the10-band EMTB method In these presentations the pre-emphasis encompassed the three highest bands and thegain reached dB The first one is a direct digitalrecording of a male voice (Figure 13) and the second oneis a female voice from a vinyl record (Figure 14) All threekinds of information important in speech recognition arerevealed harmonic structure glottal pulses and formanttrajectories The scratches from the vinyl record are visi-ble as narrow vertical strips in Figure 14
8 Conclusion
The EMTB procedure proposed and analysed in this pa-per has all of the basic properties of an orthogonal signalexpansion while allowing for a very flexible tiling of thetime-frequency plane This flexibility can be used for ad-justing the time-frequency characteristics to any applica-tion In this work a crude adjustment to the characteristicsof the ear was investigated The procedure is simple con-ceptually easy to implement and robust The possibilityof using fast algorithms for MDCT computation can makeit computationally inexpensive There are some sourcesof errors in this procedure but means for their alleviationhave been presented
The method proposed differs substantially from earlierimplementations of the similar concept [19 18] in us-ing non-decimated bandpass filters and performing MDCTanalysis on the non-decimated signal Two additional de-grees of freedom have been gained this way The first oneconsists in an arbitrary choice of number widths and lo-calisation of frequency bands In these bands independentanalyses with arbitrary time-frequency resolution can beperformed
The spectral resolution of this expansion is good es-pecially when the improved time windows are used Onesuch window with additional advantage of deepening theanalogy to the auditory systemrsquos characteristics was pro-posed and other efficient windows can be used Practicalanalyses of audio signals showed that this method is use-ful in the graphical presentation of time-frequency spectraof acoustic signals showing most of the details relevant tothe ear
Acknowledgement
The author is indebted to Prof Zbigniew Engel and toProf Jan Adamczyk for their continuing support and helpduring this work and stimulating comments to this text
References
[1] J P Princen A B Bradley Analysissynthesis filter bankdesign based on time domain aliasing cancellation IEEETrans Acoust Speech Signal Processing 34 (1986) 1153ndash1161
[2] H S Malvar Signal processing with lapped transformsArtech House Boston 1992 143-217
[3] A Ferreira Convolutional effects in transform coding withTDAC an optimal window IEEE Trans Speech AudioProcessing 4 (1996) 105ndash114
[4] S Shlien The modulated lapped transform its time-vary-ing forms and its applications to audio coding standardsIEEE Trans Speech Audio Processing 5 (1997) 359ndash366
[5] M Vetterli J Kovacevic Wavelets and subband codingPrentice Hall Englewood Cliffs 1995 92-294
[6] G Gambardella A contribution to the theory of short-timespectral analysis with nonuniform bandwidth filters IEEETrans on Circuit Theory 18 (1971) 455ndash460
[7] G Gambardella The Mellin transforms and constant-Qspectral analysis J Acoust Soc Amer 66 (1979) 913ndash915
534
Kleczkowski Acoustic signal expansion in multiple trigonometric bases ACTA ACUSTICA UNITED WITH ACUSTICA
Vol 88 (2002)
[8] E Terhardt Fourier transformation of time signals Con-ceptual revison Acustica 57 (1985) 242ndash256
[9] W Heinbach Aurally adequate signal representation Thepart-tone-time-pattern 67 (1988) 113ndash120
[10] J C Brown Calculation of a constant Q spectral transformJ Acoust Soc Amer 89 (1990) 425ndash434
[11] I Daubechies The wavelet transform time-frequency lo-calization and signal analysis IEEE Trans on Inform The-ory 36 (1990) 961ndash1005
[12] T Irino H Kawahara Signal reconstruction from modifiedauditory wavelet transform IEEE Trans on Signal Process-ing 41 (1993) 3549ndash3554
[13] H Jeong J-G Ih Implementation of a new algorithm us-ing the STFT with variable frequency resolution for thetime-frequency auditory model J Audio Eng Soc 47(1999) 240ndash251
[14] D Sinha A H Tewfik Low bit rate transparent audio com-pression using adapted wavelets IEEE Trans on SignalProcessing 41 (1993) 3463ndash3479
[15] M Bobrek D B Koch Music segmentation using tree-structured filter banks J Audio Eng Soc 46 (1998) 413ndash427
[16] K Brandenburg J D Johnston Second generation percep-tual audio coding the hybrid coder 88th AES ConventionMontreux 1990 Preprint no 2937
[17] K Tsutsui H Suzuki O Shimoyoshi M Sonohara KAkagiri R M Heddle ATRAC Adaptive transform acous-tic coding for minidisc ndash In Collected Papers on DigitalAudio Bit-Rate Reduction N Gilchrist C Grewin (eds)Audio Engineering Society New York 1996 95ndash101
[18] M V Wickerhauser Adapted wavelet analysis from theoryto software IEEE Pr Piscataway 1994 103-152 237-271
[19] C Herley J Kovacevic K Ramchandran M VetterliTilings of the time-frequency plane construction of arbi-trary orthogonal bases and fast tiling algorithms IEEETrans on Signal Processing 41 (1993) 3341ndash3359
[20] F J Harris On the use of windows for harmonic analy-sis with the discrete Fourier transform Proceedings of theIEEE 66 (1978) 51ndash83
[21] A Ferreira Perceptual audio coding and the choice of ananalysissynthesis filter bank and psychoacoustic model104th AES Convention Amsterdam 1998 Preprint no4691
[22] L D Fielder M Bosi G Davidson M Davis C Todd SVernon AC-2 and AC-3 low complexity transform-basedaudio coding ndash In Collected Papers on Digital Audio Bit-Rate Reduction N Gilchrist C Grewin (eds) Audio En-gineering Society New York 1996 54ndash72
[23] T Sporer K Brandenburg Constraints of filter banks usedfor perceptual measurement J Audio Eng Soc 43 (1995)107ndash116
[24] R D Patterson Auditory filter shapes derived with noisestimuli J Acoust Soc Amer 59 (1976) 640ndash654
[25] B C J Moore B R Glasberg Suggested formulae for cal-culating auditory-filter bandwidths and excitation patternsJ Acoust Soc Amer 74 (1983) 750ndash753
[26] A D Poularkis S Seely Signals and systems PWS Engi-neering Boston 1988 152-155
[27] E Zwicker H Fastl Psychoacoustics facts and modelsSpringer-Verlag Berlin 1990 142
535

Kleczkowski Acoustic signal expansion in multiple trigonometric bases ACTA ACUSTICA UNITED WITH ACUSTICA
Vol 88 (2002)
cies of the neighbouring basis functions (fk fk)the following proportion holds true
ri fih fil
Akih kil
Ni
(11)
ie
kih kil riNi (12)
from (8)
Ki kih kilLi riNiLi (13)
Now the sum of all nonzero coefficients over all trans-forms Si is
K
MXi
riNiLi
MXi
riT (14)
since the product NiLi for each transform is equal to thesignal length according to (1b) Taking (10) we obtain
K T (15)
which proves that the number of nonzero coefficients isequal to the number of samples in the input signal
In the following sections the entire procedure will bereferred to as EMTB (Expansion in Multiple Trigonomet-ric Basis)
4 Implementation
The signal expansion procedure consists of two stages thefiltering of the input signal by a bank of bandpass filtersfollowed by the MDCT performed independently in eachof the bands (Figure 4) In most applications an additionalstage grouping all ldquoin-bandrdquo coefficients into one database is required The term ldquoin-bandrdquo replaces ldquononzerordquo inpractical implementations as no coefficient will be strictlyzeroed
In order to follow the concept of the EMTB procedurethe filters should closely approximate the characteristicsof the ideal filter This is not difficult if signals of con-siderable length T will be analysed Then very long FIRfilters achieving excellent parameters can be used As thatlength will in practice considerably exceed the lengths oftransform blocks (ie transform filters) one can assumewithout quantitative analysis that imperfections in relationto the assumptions in (7)ndash(15) will be mostly generatedby spectral leakage from transform coefficients and not bythe bandpass filters An essential advantage of using thenon-decimated FIR bandpass filters over decimated onesis high flexibility in choosing the cut-off frequencies Inthe study a bank of very simple bandpass FIR filters wasused based on the Fourier Series method with the vonHann window [20] Increasing the filter length above 8192samples had negligible effects on the obtained results The
Filter no 0
input Filter no 1
Filter noM-1
MDCT no 0length = L0
MDCT no 1length = L1
MDCT noM-1
length = LM-1
Formingcommon
database
Figure 4 Block diagram of the analysis in multiple trigonometricbases
MDCT is based on the DCT-IV type of the DCT and isgiven by [4]
Sk
NXn
sncnk for k N (16)
where N is the block length (as in equations 1b 11ndash14)and
cnk hn
r
Ncos
nN k
N
(17)
where hn is a lowpass-filter impulse responseIf fast algorithms were to be used in the computation
of the MDCT blocks the flexibility in arbitrarily choosingtheir lengths would be limited resulting in limitations intiling of the time-frequency plane Therefore the only op-timisation of computations used by the author was basedon the symmetry of the MDCT basis functions and it re-duced the computation time by a factor of two (approxi-mately)
The function hn must satisfy two conditions it mustbe symmetrical and power complementary ie
hN n hn (18)
hn hnN (19)
in order for the transform to be orthogonal [2]An often used function satisfying (18) and (19) is
hn sin
n
N
(20)
but this window function has poor spectral characteristics(high leakage) The optimisation of the window hn wasshown in [21 22]
The author examined yet another approach to this prob-lem By choosing a window which has the appropriate
529
ACTA ACUSTICA UNITED WITH ACUSTICA Kleczkowski Acoustic signal expansion in multiple trigonometric basesVol 88 (2002)
- 20 dB
- 40 dB
- 60 dB
- 80 dB
0 dB
relative frequency0- 16π π16
Figure 5 The spectral characteristics of the optimized time win-dow hn
spectral characteristics but does not satisfy the power-complement condition (19) it is possible to satisfy thiscondition in a different manner When (19) is not met wecan express the reconstructed signal rn as
rn snmn (21)
where mn is a modulation function depending on hnWhen (19) is satisfied mn The function mn isperiodic with period N It can always be found either an-alytically or by tabulating the mn obtained from the leftside of (19) Then the compensation is straightforward
sn rn
mn (22)
There is an admissibility condition on hn for this methodto be used namely
hn for N
n
N
(23)
resulting from the overlapping factor of successive blocktransforms which is equal to 50 in the MDCT whichguarantees that mn In order to avoid the increasein quantization noise the computations must be performedin the floating-point number format
A special window function hn was chosen It is amodification of the Blackman window [20] given by
hn cos
N 13 cos
Nn
n N
N
(24)
and was designed in order that its spectral characteristicsshown in Figure 5 may have some analogy to the audi-
- 120
- 80
- 40
0
dBfrequency
band
0 coefficient number 511
Figure 6 The absolute value of the DCT of the bandpass fil-tered unit impulse showing the spectral leakage from the anal-ysed band of frequencies The time window defined in (24) wasused
tory filters [23 24 25] The sidelobes fall off rapidly inthe vicinity of the mainlobe which resembles the audi-tory filter and then stay at a nearly constant level closeto dB This latter piece of the characteristics is anunavoidable feature of this window but frequency com-ponents distant from the mainlobe belong to other bandsand will have strong additional attenuation by the band-pass filter The mn for this window function was com-puted based on (19)
5 Errors and their reduction
As it has been mentioned in Section 4 spectral leakageis the dominating reason why the model in (7)ndash(15) couldnot be implemented The implication (7) is not true as co-efficients related to frequencies outside the range fil fihare not equal to zero and the ones closest to this rangemay have meaningful values depending on the choice ofthe function hn In the reconstruction process when allof the coefficients mentioned above are assumed to equalzero the effect similar to the Gibbsrsquo phenomenon occursThis effect is known in the context of the Fourier Series[26] In that context methods for smoothing this effectdeveloped by Lanczos and Fejer are known A trivial anda less efficient method is to gradually taper off the coeffi-cients to be truncated
In the EMTB procedure it is easier to control this effectSignals which are to be reconstructed are band-pass typeand the energy represented by coefficients related to fre-quencies outside the range fil fih falls off rapidly Thisis illustrated by Figure 6 in which the absolute value ofthe DCT of the bandpass-filtered unit impulse is shownSubstantial reduction of the Gibbs effect is obtained by in-cluding in the reconstruction several coefficients related to
530
Kleczkowski Acoustic signal expansion in multiple trigonometric bases ACTA ACUSTICA UNITED WITH ACUSTICA
Vol 88 (2002)
002
-300 300
-002(a)
(b)
002
-002
300-300
Figure 7 The reconstruction of the unit impulse showing theGibbs effect (a) from the raw data base (b) from the data baseextended by 6 coefficients on both sides of each band
Table I The number of out-of-band coefficients at one side usedand their effect on the increase of data base and the attenuationof distortion in the reconstruction of a signal
Out-of-band Increase db [] Attenuation od [dB]
1 27 452 55 983 83 1126 166 164
20 555 320
the frequencies just neighbouring with the fil fih bandkil kil kih kih
Figures 7a and 7b show the Gibbs effect generated inthe reconstruction of the unit impulse The impulse signalhas been processed with the EMTB procedure accordingto Figure 4 with the parameters described in the next sec-tion Figure 7a presents the reconstruction of the impulsewhen all out-of-band coefficients are neglected Figure 7bpresents the reconstruction in which six out-of-band coef-ficients on either side of the band are included In the scaleused to plot Figures 7a and 7b there is not room enoughfor the entire impulse Its height in that scale is equal to50 This corresponds to the impulse to the peak of distor-tion ratio of about 43 dB for the case with all out-of-bandcoefficients neglected (Figure 7a) The total number of theextra coefficients used in Figure 7b when compared withthe critically sampled case (according to (15) Figure 7a)is increased by 5 The comparison of energies of distor-tion signals in Figures 7a and 7b gives an improvementof 166 dB in Figure 7b Table I shows several results inother cases Some experiments suggested that for a given
number of out-of-band coefficients their specific allocationleads to an optimal reduction of the error
This ldquoGibbs noiserdquo is concentrated only in spectral re-gions close to the filtersrsquo cut-off frequencies When prac-tical audio signals of different kinds are reconstructed nodisturbances of any kind can be heard even with all out-of-band coefficients neglected (Figure 7a)
6 Time-frequency tiling for the analysis ofacoustic signals
The EMTB procedure in its most general form allows fora very flexible tiling (Figure 1e) There are no limita-tions on the assignment of frequency bands apart fromslight adjustments needed for any partition of the fre-quency axis This adjustment ensures the optimal place-ment of the boundary between two EMTB bands depend-ing on the frequencies of two neighbouring spectral lines(coefficients) belonging to adjacent transforms
For each frequency band the length Ni of the transformassigned to it is constant The value of Ni can in principlebe arbitrary in each transform In order to obtain simplestructures of time frames in the entire procedure the ratiosof lengths Ni of all transforms should consist of simplerational or integer numbers The simplest structure is ob-tained when all ratios are powers of 2 Then one has thedyadic division of the time axis combined with the arbi-trary division of the frequency axis This differs from theDiscrete Wavelet Transform or the methods of Branden-burg and Johnston [16] and Tsutsui et al [17] where bothdivisions are dyadic
In this work two implementations are presented Thefirst one is most straightforward with a dyadic division ofthe time axis Based on this assumption the number M offrequency bands and their widths and the lengthN of thetransform associated with the lowest frequency band canbe chosen For a number M of bands the length N mustbe divisible by NM and Ni N
iAssuming critical bands (CB) as the model of auditory
bandpass filters the number M of bands should be de-termined on the basis of the scale of widths of those fil-ters According to the most often used table of criticalbands [27] that scale is about 40 (widest CB) to 1 (nar-rowest CB) In the first approximation the ratio of timeresponses of the corresponding filters should be similarWithin the limitations of the dyadic scheme one then hasto choose from the ratios of 32 to 1 or 64 to 1 The initialtests have shown that the graphical results of the analysisare more readable with the lower ratio Hence we arriveat M log bands One then may eitherhave 24 CBs and a uniform distribution of CBs betweenthe EMTB bands ie four CBs in each band or 25 CBswith five CBs in one of the bands Since the width of thelowest five CBs according to the CB table is nearly con-stant (although this is a crude approximation according to[25]) it seems to be very appropriate to include all five ofthe lowest CBs (up to 510 Hz) within the lowest EMTBband The approximation of the auditory system is best in
531
ACTA ACUSTICA UNITED WITH ACUSTICA Kleczkowski Acoustic signal expansion in multiple trigonometric basesVol 88 (2002)
frequency [Hz]B0
84
76663704
B 446
2003Band 340
1077Band 2no of spectral lines 43
511Band 1no of spectral lines 53
Band 00 no of spectral lines 95
0 time [ms] 85
Figure 8 The time-frequencytiling obtained with the 6-bandEMTB procedure dyadic divi-sion of time axis
Table II Parameters of the 6-band implementation of the EMTB procedure
Band No Frequency range [Hz] MDCT spectral lines used MDCT size in bandlowest highest number used
0 0-511 0 94 95 40961 511-1076 47 99 53 20482 1076-2002 50 92 43 10243 2002-3703 46 85 40 5124 3703-7665 43 88 46 2565 7665-22050 44 127 84 128
Table III Parameters of the 10-band implementation of the EMTB procedure
Band No Number of CBs Frequency range [Hz] MDCT spectral lines used MDCT size in bandlowest highest number used
0 2 0-2075 0 26 27 28801 3 2075-505 18 43 26 19202 2 505-781 33 50 18 14403 2 781-1077 34 46 13 9604 3 1077-1691 35 54 20 7205 3 1691-2701 36 58 23 4806 3 2701-4410 44 71 28 3607 3 4410-7717 48 83 36 2408 2 7717-12127 63 98 36 1809 2 12127-22050 66 119 54 120
this lowest band as the earrsquos characteristics are close to theconstant-bandwidth type in this frequency range contraryto the rest of the acoustic range
Figure 8 presents the time-frequency tiling for the aboveparameters of the EMTB analysis The boundaries be-tween the EMTB bands approximately coincide with theappropriate edges of the CBs Table II gives the detailedspecification of the EMTB with these parameters in termsof numbers of spectral lines of the individual MDCTs usedin particular EMTB bands The correction discussed inSection 5 was not used but the adjustment of the fre-quency bands mentioned in the first paragraph of this Sec-tion was This is why the cut-off frequencies of bandsgiven in Tables II and III are not those of critical-bandboundaries of the ear found in the literature
The second implementation was based on a 10-bandanalysis This results in more gradual transitions betweenthe lengths Ni of transforms in particular bands In effectthe characteristics are closer to the constant-Q analysis
The sequence of lengths Ni of transform blocks was cho-sen so that the Ni values were proportional to the follow-ing integers 48 32 24 16 12 8 6 4 3 2 Thus the ra-tio of corresponding time responses of filters was 241 Itwas found that although the analogy to the characteristicsof the ear is weaker the plots are more readable The as-signment of numbers of critical bands to particular EMTBbands cut-off frequencies and MDCT parameters for thiscase are given in Table III
Arbitrary Ni values can also be used resulting in a lessregular data structure This may be perfectly acceptablewhile allowing for yet higher flexibility
7 Results of analysis of audio signals
The DCT which is the basis for the MDCT used in theEMTB procedure is not optimal for spectral analysis assome spectral components of the signal may have phases
532
Kleczkowski Acoustic signal expansion in multiple trigonometric bases ACTA ACUSTICA UNITED WITH ACUSTICA
Vol 88 (2002)
frequency [kHz]
511
1077
2003
3704
7666
22050
0 0371 0742 1113 1484time [ms]
Figure 9 The results of the 6-band EMTB analysis of an excerptof orchestral music
resulting in very low values of DCT coefficients [2]Therefore additional processing was used in order to ob-tain results appropriate for displaying the results of time-frequency analysis of acoustic signals In parallel to theMDCT transform its appropriate sine counterpart (basedon the Discrete Sine Transform-DST) has been computedleading to pairs of coefficients (MDCT and MDST) In thenext step a joint measure of amplitude spectrum was ob-tained by computing
dnk qcnk snk (25)
where snk is the MDST coefficient appropriately com-plementing the cnk of (17)
It is worth noting that if such a spectral analysis is com-pared with the Discrete Fourier Transform it offers twiceas high spectral resolution as for a signal of lengthN thereare N different spectral amplitude coefficients The DFTyields only N spectral amplitudes
Several short fragments of musical material have beenanalysed by the EMTB procedure with the extension pre-sented above Due to this procedurersquos characteristics thetwo-dimensional diagram was found to be most appropri-ate The plots presented in this work display all values ofspectral coefficients dnk obtained according to Tables IIand III The mapping of the values dnk to the grey-scalewas logarithmic in the range of about 40 dB from the high-est coefficient values For the rest of the range (lowest val-ues) a correction to the logarithmic mapping has been in-troduced in order to obtain most readable results This cor-rection consisted in compressing the range of lowest val-ues In order to reveal more details in the high frequencyrange the pre-emphasis in the two highest bands was usedwith the gain of dB at the highest frequency
In the highest frequency band each coefficient is repre-sented by one dot In the lower bands the coefficients arerepresented as short horizontal lines with the lines in thelowest band consisting of respectively 32 and 24 dots eachIn the band no 8 of Table III the length is 15 dots and anappropriate averaging has been used
frequency [kHz]20
16
12
8
4
00 0371 0742 1113 1484
time [ms]
Figure 10 The Discrete SineCosine Transform modulus of thesignal analysed in Figure 9 the lenght of the analysis frame isthe same as in band no 3 of Figure 9
frequency [kHz]
207505
16911077
27014410
7717
12127
22050
0 0261 0522 0783 1045 1306 1567 [s]time
781
Figure 11 The results of the 10-band EMTB analysis of an ex-cerpt of orchestral music
Figure 9 shows the results of the 6-band EMTB analysisof an 18 s excerpt of an orchestra recording Although theacoustic content was dense groups of harmonics in differ-ent frequency regions are clearly visible For comparisonFigure 10 shows the same signal analysed with the stan-dard MDCT (constant bandwidth) analysis with a trans-form length N of 512 samples the same as used in bandno 3 of the EMTB analysis of Figure 9 Several partialgroups are also clearly visible but little information canbe obtained from the range below 1 kHz The entire upperhalf of the diagram is not informative either
The result of the 10-band EMTB analysis of the samesignal is presented in Figure 11 The transitions betweenthe bands are smoother and it seems that the time-fre-quency resolution is better adjusted to reveal more detailsof the signal
Figure 12 presents the result of the same 10-bandEMTB analysis of several guitar chords Some groups ofharmonics can be resolved and the diagram clearly showsthe time lag between the excitations of lower and higherstrings in a chord
533
ACTA ACUSTICA UNITED WITH ACUSTICA Kleczkowski Acoustic signal expansion in multiple trigonometric basesVol 88 (2002)
frequency [kHz]
207505
16911077
27014410
7717
12127
22050
0 0261 0522 0783 1045 1306 1567 [s]time
781
Figure 12 The results of the 10-band EMTB analysis of severalguitar chords
frequency [kHz]
207505
1077169127014410
7717
12127
22050
0 0261 0522 0783 1045 1306 1567 [s]time
781
Figure 13 The results of the 10-band EMTB analysis of the ut-terance ldquoWhy were you away a year Royrdquo spoken by a malevoice
frequency [kHz]
207505
16911077
27014410
7717
12127
22050
0 0261 0522 0783 1045 1306 1567 [s]time
781
Figure 14 The results of the 10-band EMTB analysis of the ut-terance ldquoTell me whatrsquos the timerdquo spoken by a female voice
Two speech signals have also been analysed with the10-band EMTB method In these presentations the pre-emphasis encompassed the three highest bands and thegain reached dB The first one is a direct digitalrecording of a male voice (Figure 13) and the second oneis a female voice from a vinyl record (Figure 14) All threekinds of information important in speech recognition arerevealed harmonic structure glottal pulses and formanttrajectories The scratches from the vinyl record are visi-ble as narrow vertical strips in Figure 14
8 Conclusion
The EMTB procedure proposed and analysed in this pa-per has all of the basic properties of an orthogonal signalexpansion while allowing for a very flexible tiling of thetime-frequency plane This flexibility can be used for ad-justing the time-frequency characteristics to any applica-tion In this work a crude adjustment to the characteristicsof the ear was investigated The procedure is simple con-ceptually easy to implement and robust The possibilityof using fast algorithms for MDCT computation can makeit computationally inexpensive There are some sourcesof errors in this procedure but means for their alleviationhave been presented
The method proposed differs substantially from earlierimplementations of the similar concept [19 18] in us-ing non-decimated bandpass filters and performing MDCTanalysis on the non-decimated signal Two additional de-grees of freedom have been gained this way The first oneconsists in an arbitrary choice of number widths and lo-calisation of frequency bands In these bands independentanalyses with arbitrary time-frequency resolution can beperformed
The spectral resolution of this expansion is good es-pecially when the improved time windows are used Onesuch window with additional advantage of deepening theanalogy to the auditory systemrsquos characteristics was pro-posed and other efficient windows can be used Practicalanalyses of audio signals showed that this method is use-ful in the graphical presentation of time-frequency spectraof acoustic signals showing most of the details relevant tothe ear
Acknowledgement
The author is indebted to Prof Zbigniew Engel and toProf Jan Adamczyk for their continuing support and helpduring this work and stimulating comments to this text
References
[1] J P Princen A B Bradley Analysissynthesis filter bankdesign based on time domain aliasing cancellation IEEETrans Acoust Speech Signal Processing 34 (1986) 1153ndash1161
[2] H S Malvar Signal processing with lapped transformsArtech House Boston 1992 143-217
[3] A Ferreira Convolutional effects in transform coding withTDAC an optimal window IEEE Trans Speech AudioProcessing 4 (1996) 105ndash114
[4] S Shlien The modulated lapped transform its time-vary-ing forms and its applications to audio coding standardsIEEE Trans Speech Audio Processing 5 (1997) 359ndash366
[5] M Vetterli J Kovacevic Wavelets and subband codingPrentice Hall Englewood Cliffs 1995 92-294
[6] G Gambardella A contribution to the theory of short-timespectral analysis with nonuniform bandwidth filters IEEETrans on Circuit Theory 18 (1971) 455ndash460
[7] G Gambardella The Mellin transforms and constant-Qspectral analysis J Acoust Soc Amer 66 (1979) 913ndash915
534
Kleczkowski Acoustic signal expansion in multiple trigonometric bases ACTA ACUSTICA UNITED WITH ACUSTICA
Vol 88 (2002)
[8] E Terhardt Fourier transformation of time signals Con-ceptual revison Acustica 57 (1985) 242ndash256
[9] W Heinbach Aurally adequate signal representation Thepart-tone-time-pattern 67 (1988) 113ndash120
[10] J C Brown Calculation of a constant Q spectral transformJ Acoust Soc Amer 89 (1990) 425ndash434
[11] I Daubechies The wavelet transform time-frequency lo-calization and signal analysis IEEE Trans on Inform The-ory 36 (1990) 961ndash1005
[12] T Irino H Kawahara Signal reconstruction from modifiedauditory wavelet transform IEEE Trans on Signal Process-ing 41 (1993) 3549ndash3554
[13] H Jeong J-G Ih Implementation of a new algorithm us-ing the STFT with variable frequency resolution for thetime-frequency auditory model J Audio Eng Soc 47(1999) 240ndash251
[14] D Sinha A H Tewfik Low bit rate transparent audio com-pression using adapted wavelets IEEE Trans on SignalProcessing 41 (1993) 3463ndash3479
[15] M Bobrek D B Koch Music segmentation using tree-structured filter banks J Audio Eng Soc 46 (1998) 413ndash427
[16] K Brandenburg J D Johnston Second generation percep-tual audio coding the hybrid coder 88th AES ConventionMontreux 1990 Preprint no 2937
[17] K Tsutsui H Suzuki O Shimoyoshi M Sonohara KAkagiri R M Heddle ATRAC Adaptive transform acous-tic coding for minidisc ndash In Collected Papers on DigitalAudio Bit-Rate Reduction N Gilchrist C Grewin (eds)Audio Engineering Society New York 1996 95ndash101
[18] M V Wickerhauser Adapted wavelet analysis from theoryto software IEEE Pr Piscataway 1994 103-152 237-271
[19] C Herley J Kovacevic K Ramchandran M VetterliTilings of the time-frequency plane construction of arbi-trary orthogonal bases and fast tiling algorithms IEEETrans on Signal Processing 41 (1993) 3341ndash3359
[20] F J Harris On the use of windows for harmonic analy-sis with the discrete Fourier transform Proceedings of theIEEE 66 (1978) 51ndash83
[21] A Ferreira Perceptual audio coding and the choice of ananalysissynthesis filter bank and psychoacoustic model104th AES Convention Amsterdam 1998 Preprint no4691
[22] L D Fielder M Bosi G Davidson M Davis C Todd SVernon AC-2 and AC-3 low complexity transform-basedaudio coding ndash In Collected Papers on Digital Audio Bit-Rate Reduction N Gilchrist C Grewin (eds) Audio En-gineering Society New York 1996 54ndash72
[23] T Sporer K Brandenburg Constraints of filter banks usedfor perceptual measurement J Audio Eng Soc 43 (1995)107ndash116
[24] R D Patterson Auditory filter shapes derived with noisestimuli J Acoust Soc Amer 59 (1976) 640ndash654
[25] B C J Moore B R Glasberg Suggested formulae for cal-culating auditory-filter bandwidths and excitation patternsJ Acoust Soc Amer 74 (1983) 750ndash753
[26] A D Poularkis S Seely Signals and systems PWS Engi-neering Boston 1988 152-155
[27] E Zwicker H Fastl Psychoacoustics facts and modelsSpringer-Verlag Berlin 1990 142
535

ACTA ACUSTICA UNITED WITH ACUSTICA Kleczkowski Acoustic signal expansion in multiple trigonometric basesVol 88 (2002)
- 20 dB
- 40 dB
- 60 dB
- 80 dB
0 dB
relative frequency0- 16π π16
Figure 5 The spectral characteristics of the optimized time win-dow hn
spectral characteristics but does not satisfy the power-complement condition (19) it is possible to satisfy thiscondition in a different manner When (19) is not met wecan express the reconstructed signal rn as
rn snmn (21)
where mn is a modulation function depending on hnWhen (19) is satisfied mn The function mn isperiodic with period N It can always be found either an-alytically or by tabulating the mn obtained from the leftside of (19) Then the compensation is straightforward
sn rn
mn (22)
There is an admissibility condition on hn for this methodto be used namely
hn for N
n
N
(23)
resulting from the overlapping factor of successive blocktransforms which is equal to 50 in the MDCT whichguarantees that mn In order to avoid the increasein quantization noise the computations must be performedin the floating-point number format
A special window function hn was chosen It is amodification of the Blackman window [20] given by
hn cos
N 13 cos
Nn
n N
N
(24)
and was designed in order that its spectral characteristicsshown in Figure 5 may have some analogy to the audi-
- 120
- 80
- 40
0
dBfrequency
band
0 coefficient number 511
Figure 6 The absolute value of the DCT of the bandpass fil-tered unit impulse showing the spectral leakage from the anal-ysed band of frequencies The time window defined in (24) wasused
tory filters [23 24 25] The sidelobes fall off rapidly inthe vicinity of the mainlobe which resembles the audi-tory filter and then stay at a nearly constant level closeto dB This latter piece of the characteristics is anunavoidable feature of this window but frequency com-ponents distant from the mainlobe belong to other bandsand will have strong additional attenuation by the band-pass filter The mn for this window function was com-puted based on (19)
5 Errors and their reduction
As it has been mentioned in Section 4 spectral leakageis the dominating reason why the model in (7)ndash(15) couldnot be implemented The implication (7) is not true as co-efficients related to frequencies outside the range fil fihare not equal to zero and the ones closest to this rangemay have meaningful values depending on the choice ofthe function hn In the reconstruction process when allof the coefficients mentioned above are assumed to equalzero the effect similar to the Gibbsrsquo phenomenon occursThis effect is known in the context of the Fourier Series[26] In that context methods for smoothing this effectdeveloped by Lanczos and Fejer are known A trivial anda less efficient method is to gradually taper off the coeffi-cients to be truncated
In the EMTB procedure it is easier to control this effectSignals which are to be reconstructed are band-pass typeand the energy represented by coefficients related to fre-quencies outside the range fil fih falls off rapidly Thisis illustrated by Figure 6 in which the absolute value ofthe DCT of the bandpass-filtered unit impulse is shownSubstantial reduction of the Gibbs effect is obtained by in-cluding in the reconstruction several coefficients related to
530
Kleczkowski Acoustic signal expansion in multiple trigonometric bases ACTA ACUSTICA UNITED WITH ACUSTICA
Vol 88 (2002)
002
-300 300
-002(a)
(b)
002
-002
300-300
Figure 7 The reconstruction of the unit impulse showing theGibbs effect (a) from the raw data base (b) from the data baseextended by 6 coefficients on both sides of each band
Table I The number of out-of-band coefficients at one side usedand their effect on the increase of data base and the attenuationof distortion in the reconstruction of a signal
Out-of-band Increase db [] Attenuation od [dB]
1 27 452 55 983 83 1126 166 164
20 555 320
the frequencies just neighbouring with the fil fih bandkil kil kih kih
Figures 7a and 7b show the Gibbs effect generated inthe reconstruction of the unit impulse The impulse signalhas been processed with the EMTB procedure accordingto Figure 4 with the parameters described in the next sec-tion Figure 7a presents the reconstruction of the impulsewhen all out-of-band coefficients are neglected Figure 7bpresents the reconstruction in which six out-of-band coef-ficients on either side of the band are included In the scaleused to plot Figures 7a and 7b there is not room enoughfor the entire impulse Its height in that scale is equal to50 This corresponds to the impulse to the peak of distor-tion ratio of about 43 dB for the case with all out-of-bandcoefficients neglected (Figure 7a) The total number of theextra coefficients used in Figure 7b when compared withthe critically sampled case (according to (15) Figure 7a)is increased by 5 The comparison of energies of distor-tion signals in Figures 7a and 7b gives an improvementof 166 dB in Figure 7b Table I shows several results inother cases Some experiments suggested that for a given
number of out-of-band coefficients their specific allocationleads to an optimal reduction of the error
This ldquoGibbs noiserdquo is concentrated only in spectral re-gions close to the filtersrsquo cut-off frequencies When prac-tical audio signals of different kinds are reconstructed nodisturbances of any kind can be heard even with all out-of-band coefficients neglected (Figure 7a)
6 Time-frequency tiling for the analysis ofacoustic signals
The EMTB procedure in its most general form allows fora very flexible tiling (Figure 1e) There are no limita-tions on the assignment of frequency bands apart fromslight adjustments needed for any partition of the fre-quency axis This adjustment ensures the optimal place-ment of the boundary between two EMTB bands depend-ing on the frequencies of two neighbouring spectral lines(coefficients) belonging to adjacent transforms
For each frequency band the length Ni of the transformassigned to it is constant The value of Ni can in principlebe arbitrary in each transform In order to obtain simplestructures of time frames in the entire procedure the ratiosof lengths Ni of all transforms should consist of simplerational or integer numbers The simplest structure is ob-tained when all ratios are powers of 2 Then one has thedyadic division of the time axis combined with the arbi-trary division of the frequency axis This differs from theDiscrete Wavelet Transform or the methods of Branden-burg and Johnston [16] and Tsutsui et al [17] where bothdivisions are dyadic
In this work two implementations are presented Thefirst one is most straightforward with a dyadic division ofthe time axis Based on this assumption the number M offrequency bands and their widths and the lengthN of thetransform associated with the lowest frequency band canbe chosen For a number M of bands the length N mustbe divisible by NM and Ni N
iAssuming critical bands (CB) as the model of auditory
bandpass filters the number M of bands should be de-termined on the basis of the scale of widths of those fil-ters According to the most often used table of criticalbands [27] that scale is about 40 (widest CB) to 1 (nar-rowest CB) In the first approximation the ratio of timeresponses of the corresponding filters should be similarWithin the limitations of the dyadic scheme one then hasto choose from the ratios of 32 to 1 or 64 to 1 The initialtests have shown that the graphical results of the analysisare more readable with the lower ratio Hence we arriveat M log bands One then may eitherhave 24 CBs and a uniform distribution of CBs betweenthe EMTB bands ie four CBs in each band or 25 CBswith five CBs in one of the bands Since the width of thelowest five CBs according to the CB table is nearly con-stant (although this is a crude approximation according to[25]) it seems to be very appropriate to include all five ofthe lowest CBs (up to 510 Hz) within the lowest EMTBband The approximation of the auditory system is best in
531
ACTA ACUSTICA UNITED WITH ACUSTICA Kleczkowski Acoustic signal expansion in multiple trigonometric basesVol 88 (2002)
frequency [Hz]B0
84
76663704
B 446
2003Band 340
1077Band 2no of spectral lines 43
511Band 1no of spectral lines 53
Band 00 no of spectral lines 95
0 time [ms] 85
Figure 8 The time-frequencytiling obtained with the 6-bandEMTB procedure dyadic divi-sion of time axis
Table II Parameters of the 6-band implementation of the EMTB procedure
Band No Frequency range [Hz] MDCT spectral lines used MDCT size in bandlowest highest number used
0 0-511 0 94 95 40961 511-1076 47 99 53 20482 1076-2002 50 92 43 10243 2002-3703 46 85 40 5124 3703-7665 43 88 46 2565 7665-22050 44 127 84 128
Table III Parameters of the 10-band implementation of the EMTB procedure
Band No Number of CBs Frequency range [Hz] MDCT spectral lines used MDCT size in bandlowest highest number used
0 2 0-2075 0 26 27 28801 3 2075-505 18 43 26 19202 2 505-781 33 50 18 14403 2 781-1077 34 46 13 9604 3 1077-1691 35 54 20 7205 3 1691-2701 36 58 23 4806 3 2701-4410 44 71 28 3607 3 4410-7717 48 83 36 2408 2 7717-12127 63 98 36 1809 2 12127-22050 66 119 54 120
this lowest band as the earrsquos characteristics are close to theconstant-bandwidth type in this frequency range contraryto the rest of the acoustic range
Figure 8 presents the time-frequency tiling for the aboveparameters of the EMTB analysis The boundaries be-tween the EMTB bands approximately coincide with theappropriate edges of the CBs Table II gives the detailedspecification of the EMTB with these parameters in termsof numbers of spectral lines of the individual MDCTs usedin particular EMTB bands The correction discussed inSection 5 was not used but the adjustment of the fre-quency bands mentioned in the first paragraph of this Sec-tion was This is why the cut-off frequencies of bandsgiven in Tables II and III are not those of critical-bandboundaries of the ear found in the literature
The second implementation was based on a 10-bandanalysis This results in more gradual transitions betweenthe lengths Ni of transforms in particular bands In effectthe characteristics are closer to the constant-Q analysis
The sequence of lengths Ni of transform blocks was cho-sen so that the Ni values were proportional to the follow-ing integers 48 32 24 16 12 8 6 4 3 2 Thus the ra-tio of corresponding time responses of filters was 241 Itwas found that although the analogy to the characteristicsof the ear is weaker the plots are more readable The as-signment of numbers of critical bands to particular EMTBbands cut-off frequencies and MDCT parameters for thiscase are given in Table III
Arbitrary Ni values can also be used resulting in a lessregular data structure This may be perfectly acceptablewhile allowing for yet higher flexibility
7 Results of analysis of audio signals
The DCT which is the basis for the MDCT used in theEMTB procedure is not optimal for spectral analysis assome spectral components of the signal may have phases
532
Kleczkowski Acoustic signal expansion in multiple trigonometric bases ACTA ACUSTICA UNITED WITH ACUSTICA
Vol 88 (2002)
frequency [kHz]
511
1077
2003
3704
7666
22050
0 0371 0742 1113 1484time [ms]
Figure 9 The results of the 6-band EMTB analysis of an excerptof orchestral music
resulting in very low values of DCT coefficients [2]Therefore additional processing was used in order to ob-tain results appropriate for displaying the results of time-frequency analysis of acoustic signals In parallel to theMDCT transform its appropriate sine counterpart (basedon the Discrete Sine Transform-DST) has been computedleading to pairs of coefficients (MDCT and MDST) In thenext step a joint measure of amplitude spectrum was ob-tained by computing
dnk qcnk snk (25)
where snk is the MDST coefficient appropriately com-plementing the cnk of (17)
It is worth noting that if such a spectral analysis is com-pared with the Discrete Fourier Transform it offers twiceas high spectral resolution as for a signal of lengthN thereare N different spectral amplitude coefficients The DFTyields only N spectral amplitudes
Several short fragments of musical material have beenanalysed by the EMTB procedure with the extension pre-sented above Due to this procedurersquos characteristics thetwo-dimensional diagram was found to be most appropri-ate The plots presented in this work display all values ofspectral coefficients dnk obtained according to Tables IIand III The mapping of the values dnk to the grey-scalewas logarithmic in the range of about 40 dB from the high-est coefficient values For the rest of the range (lowest val-ues) a correction to the logarithmic mapping has been in-troduced in order to obtain most readable results This cor-rection consisted in compressing the range of lowest val-ues In order to reveal more details in the high frequencyrange the pre-emphasis in the two highest bands was usedwith the gain of dB at the highest frequency
In the highest frequency band each coefficient is repre-sented by one dot In the lower bands the coefficients arerepresented as short horizontal lines with the lines in thelowest band consisting of respectively 32 and 24 dots eachIn the band no 8 of Table III the length is 15 dots and anappropriate averaging has been used
frequency [kHz]20
16
12
8
4
00 0371 0742 1113 1484
time [ms]
Figure 10 The Discrete SineCosine Transform modulus of thesignal analysed in Figure 9 the lenght of the analysis frame isthe same as in band no 3 of Figure 9
frequency [kHz]
207505
16911077
27014410
7717
12127
22050
0 0261 0522 0783 1045 1306 1567 [s]time
781
Figure 11 The results of the 10-band EMTB analysis of an ex-cerpt of orchestral music
Figure 9 shows the results of the 6-band EMTB analysisof an 18 s excerpt of an orchestra recording Although theacoustic content was dense groups of harmonics in differ-ent frequency regions are clearly visible For comparisonFigure 10 shows the same signal analysed with the stan-dard MDCT (constant bandwidth) analysis with a trans-form length N of 512 samples the same as used in bandno 3 of the EMTB analysis of Figure 9 Several partialgroups are also clearly visible but little information canbe obtained from the range below 1 kHz The entire upperhalf of the diagram is not informative either
The result of the 10-band EMTB analysis of the samesignal is presented in Figure 11 The transitions betweenthe bands are smoother and it seems that the time-fre-quency resolution is better adjusted to reveal more detailsof the signal
Figure 12 presents the result of the same 10-bandEMTB analysis of several guitar chords Some groups ofharmonics can be resolved and the diagram clearly showsthe time lag between the excitations of lower and higherstrings in a chord
533
ACTA ACUSTICA UNITED WITH ACUSTICA Kleczkowski Acoustic signal expansion in multiple trigonometric basesVol 88 (2002)
frequency [kHz]
207505
16911077
27014410
7717
12127
22050
0 0261 0522 0783 1045 1306 1567 [s]time
781
Figure 12 The results of the 10-band EMTB analysis of severalguitar chords
frequency [kHz]
207505
1077169127014410
7717
12127
22050
0 0261 0522 0783 1045 1306 1567 [s]time
781
Figure 13 The results of the 10-band EMTB analysis of the ut-terance ldquoWhy were you away a year Royrdquo spoken by a malevoice
frequency [kHz]
207505
16911077
27014410
7717
12127
22050
0 0261 0522 0783 1045 1306 1567 [s]time
781
Figure 14 The results of the 10-band EMTB analysis of the ut-terance ldquoTell me whatrsquos the timerdquo spoken by a female voice
Two speech signals have also been analysed with the10-band EMTB method In these presentations the pre-emphasis encompassed the three highest bands and thegain reached dB The first one is a direct digitalrecording of a male voice (Figure 13) and the second oneis a female voice from a vinyl record (Figure 14) All threekinds of information important in speech recognition arerevealed harmonic structure glottal pulses and formanttrajectories The scratches from the vinyl record are visi-ble as narrow vertical strips in Figure 14
8 Conclusion
The EMTB procedure proposed and analysed in this pa-per has all of the basic properties of an orthogonal signalexpansion while allowing for a very flexible tiling of thetime-frequency plane This flexibility can be used for ad-justing the time-frequency characteristics to any applica-tion In this work a crude adjustment to the characteristicsof the ear was investigated The procedure is simple con-ceptually easy to implement and robust The possibilityof using fast algorithms for MDCT computation can makeit computationally inexpensive There are some sourcesof errors in this procedure but means for their alleviationhave been presented
The method proposed differs substantially from earlierimplementations of the similar concept [19 18] in us-ing non-decimated bandpass filters and performing MDCTanalysis on the non-decimated signal Two additional de-grees of freedom have been gained this way The first oneconsists in an arbitrary choice of number widths and lo-calisation of frequency bands In these bands independentanalyses with arbitrary time-frequency resolution can beperformed
The spectral resolution of this expansion is good es-pecially when the improved time windows are used Onesuch window with additional advantage of deepening theanalogy to the auditory systemrsquos characteristics was pro-posed and other efficient windows can be used Practicalanalyses of audio signals showed that this method is use-ful in the graphical presentation of time-frequency spectraof acoustic signals showing most of the details relevant tothe ear
Acknowledgement
The author is indebted to Prof Zbigniew Engel and toProf Jan Adamczyk for their continuing support and helpduring this work and stimulating comments to this text
References
[1] J P Princen A B Bradley Analysissynthesis filter bankdesign based on time domain aliasing cancellation IEEETrans Acoust Speech Signal Processing 34 (1986) 1153ndash1161
[2] H S Malvar Signal processing with lapped transformsArtech House Boston 1992 143-217
[3] A Ferreira Convolutional effects in transform coding withTDAC an optimal window IEEE Trans Speech AudioProcessing 4 (1996) 105ndash114
[4] S Shlien The modulated lapped transform its time-vary-ing forms and its applications to audio coding standardsIEEE Trans Speech Audio Processing 5 (1997) 359ndash366
[5] M Vetterli J Kovacevic Wavelets and subband codingPrentice Hall Englewood Cliffs 1995 92-294
[6] G Gambardella A contribution to the theory of short-timespectral analysis with nonuniform bandwidth filters IEEETrans on Circuit Theory 18 (1971) 455ndash460
[7] G Gambardella The Mellin transforms and constant-Qspectral analysis J Acoust Soc Amer 66 (1979) 913ndash915
534
Kleczkowski Acoustic signal expansion in multiple trigonometric bases ACTA ACUSTICA UNITED WITH ACUSTICA
Vol 88 (2002)
[8] E Terhardt Fourier transformation of time signals Con-ceptual revison Acustica 57 (1985) 242ndash256
[9] W Heinbach Aurally adequate signal representation Thepart-tone-time-pattern 67 (1988) 113ndash120
[10] J C Brown Calculation of a constant Q spectral transformJ Acoust Soc Amer 89 (1990) 425ndash434
[11] I Daubechies The wavelet transform time-frequency lo-calization and signal analysis IEEE Trans on Inform The-ory 36 (1990) 961ndash1005
[12] T Irino H Kawahara Signal reconstruction from modifiedauditory wavelet transform IEEE Trans on Signal Process-ing 41 (1993) 3549ndash3554
[13] H Jeong J-G Ih Implementation of a new algorithm us-ing the STFT with variable frequency resolution for thetime-frequency auditory model J Audio Eng Soc 47(1999) 240ndash251
[14] D Sinha A H Tewfik Low bit rate transparent audio com-pression using adapted wavelets IEEE Trans on SignalProcessing 41 (1993) 3463ndash3479
[15] M Bobrek D B Koch Music segmentation using tree-structured filter banks J Audio Eng Soc 46 (1998) 413ndash427
[16] K Brandenburg J D Johnston Second generation percep-tual audio coding the hybrid coder 88th AES ConventionMontreux 1990 Preprint no 2937
[17] K Tsutsui H Suzuki O Shimoyoshi M Sonohara KAkagiri R M Heddle ATRAC Adaptive transform acous-tic coding for minidisc ndash In Collected Papers on DigitalAudio Bit-Rate Reduction N Gilchrist C Grewin (eds)Audio Engineering Society New York 1996 95ndash101
[18] M V Wickerhauser Adapted wavelet analysis from theoryto software IEEE Pr Piscataway 1994 103-152 237-271
[19] C Herley J Kovacevic K Ramchandran M VetterliTilings of the time-frequency plane construction of arbi-trary orthogonal bases and fast tiling algorithms IEEETrans on Signal Processing 41 (1993) 3341ndash3359
[20] F J Harris On the use of windows for harmonic analy-sis with the discrete Fourier transform Proceedings of theIEEE 66 (1978) 51ndash83
[21] A Ferreira Perceptual audio coding and the choice of ananalysissynthesis filter bank and psychoacoustic model104th AES Convention Amsterdam 1998 Preprint no4691
[22] L D Fielder M Bosi G Davidson M Davis C Todd SVernon AC-2 and AC-3 low complexity transform-basedaudio coding ndash In Collected Papers on Digital Audio Bit-Rate Reduction N Gilchrist C Grewin (eds) Audio En-gineering Society New York 1996 54ndash72
[23] T Sporer K Brandenburg Constraints of filter banks usedfor perceptual measurement J Audio Eng Soc 43 (1995)107ndash116
[24] R D Patterson Auditory filter shapes derived with noisestimuli J Acoust Soc Amer 59 (1976) 640ndash654
[25] B C J Moore B R Glasberg Suggested formulae for cal-culating auditory-filter bandwidths and excitation patternsJ Acoust Soc Amer 74 (1983) 750ndash753
[26] A D Poularkis S Seely Signals and systems PWS Engi-neering Boston 1988 152-155
[27] E Zwicker H Fastl Psychoacoustics facts and modelsSpringer-Verlag Berlin 1990 142
535

Kleczkowski Acoustic signal expansion in multiple trigonometric bases ACTA ACUSTICA UNITED WITH ACUSTICA
Vol 88 (2002)
002
-300 300
-002(a)
(b)
002
-002
300-300
Figure 7 The reconstruction of the unit impulse showing theGibbs effect (a) from the raw data base (b) from the data baseextended by 6 coefficients on both sides of each band
Table I The number of out-of-band coefficients at one side usedand their effect on the increase of data base and the attenuationof distortion in the reconstruction of a signal
Out-of-band Increase db [] Attenuation od [dB]
1 27 452 55 983 83 1126 166 164
20 555 320
the frequencies just neighbouring with the fil fih bandkil kil kih kih
Figures 7a and 7b show the Gibbs effect generated inthe reconstruction of the unit impulse The impulse signalhas been processed with the EMTB procedure accordingto Figure 4 with the parameters described in the next sec-tion Figure 7a presents the reconstruction of the impulsewhen all out-of-band coefficients are neglected Figure 7bpresents the reconstruction in which six out-of-band coef-ficients on either side of the band are included In the scaleused to plot Figures 7a and 7b there is not room enoughfor the entire impulse Its height in that scale is equal to50 This corresponds to the impulse to the peak of distor-tion ratio of about 43 dB for the case with all out-of-bandcoefficients neglected (Figure 7a) The total number of theextra coefficients used in Figure 7b when compared withthe critically sampled case (according to (15) Figure 7a)is increased by 5 The comparison of energies of distor-tion signals in Figures 7a and 7b gives an improvementof 166 dB in Figure 7b Table I shows several results inother cases Some experiments suggested that for a given
number of out-of-band coefficients their specific allocationleads to an optimal reduction of the error
This ldquoGibbs noiserdquo is concentrated only in spectral re-gions close to the filtersrsquo cut-off frequencies When prac-tical audio signals of different kinds are reconstructed nodisturbances of any kind can be heard even with all out-of-band coefficients neglected (Figure 7a)
6 Time-frequency tiling for the analysis ofacoustic signals
The EMTB procedure in its most general form allows fora very flexible tiling (Figure 1e) There are no limita-tions on the assignment of frequency bands apart fromslight adjustments needed for any partition of the fre-quency axis This adjustment ensures the optimal place-ment of the boundary between two EMTB bands depend-ing on the frequencies of two neighbouring spectral lines(coefficients) belonging to adjacent transforms
For each frequency band the length Ni of the transformassigned to it is constant The value of Ni can in principlebe arbitrary in each transform In order to obtain simplestructures of time frames in the entire procedure the ratiosof lengths Ni of all transforms should consist of simplerational or integer numbers The simplest structure is ob-tained when all ratios are powers of 2 Then one has thedyadic division of the time axis combined with the arbi-trary division of the frequency axis This differs from theDiscrete Wavelet Transform or the methods of Branden-burg and Johnston [16] and Tsutsui et al [17] where bothdivisions are dyadic
In this work two implementations are presented Thefirst one is most straightforward with a dyadic division ofthe time axis Based on this assumption the number M offrequency bands and their widths and the lengthN of thetransform associated with the lowest frequency band canbe chosen For a number M of bands the length N mustbe divisible by NM and Ni N
iAssuming critical bands (CB) as the model of auditory
bandpass filters the number M of bands should be de-termined on the basis of the scale of widths of those fil-ters According to the most often used table of criticalbands [27] that scale is about 40 (widest CB) to 1 (nar-rowest CB) In the first approximation the ratio of timeresponses of the corresponding filters should be similarWithin the limitations of the dyadic scheme one then hasto choose from the ratios of 32 to 1 or 64 to 1 The initialtests have shown that the graphical results of the analysisare more readable with the lower ratio Hence we arriveat M log bands One then may eitherhave 24 CBs and a uniform distribution of CBs betweenthe EMTB bands ie four CBs in each band or 25 CBswith five CBs in one of the bands Since the width of thelowest five CBs according to the CB table is nearly con-stant (although this is a crude approximation according to[25]) it seems to be very appropriate to include all five ofthe lowest CBs (up to 510 Hz) within the lowest EMTBband The approximation of the auditory system is best in
531
ACTA ACUSTICA UNITED WITH ACUSTICA Kleczkowski Acoustic signal expansion in multiple trigonometric basesVol 88 (2002)
frequency [Hz]B0
84
76663704
B 446
2003Band 340
1077Band 2no of spectral lines 43
511Band 1no of spectral lines 53
Band 00 no of spectral lines 95
0 time [ms] 85
Figure 8 The time-frequencytiling obtained with the 6-bandEMTB procedure dyadic divi-sion of time axis
Table II Parameters of the 6-band implementation of the EMTB procedure
Band No Frequency range [Hz] MDCT spectral lines used MDCT size in bandlowest highest number used
0 0-511 0 94 95 40961 511-1076 47 99 53 20482 1076-2002 50 92 43 10243 2002-3703 46 85 40 5124 3703-7665 43 88 46 2565 7665-22050 44 127 84 128
Table III Parameters of the 10-band implementation of the EMTB procedure
Band No Number of CBs Frequency range [Hz] MDCT spectral lines used MDCT size in bandlowest highest number used
0 2 0-2075 0 26 27 28801 3 2075-505 18 43 26 19202 2 505-781 33 50 18 14403 2 781-1077 34 46 13 9604 3 1077-1691 35 54 20 7205 3 1691-2701 36 58 23 4806 3 2701-4410 44 71 28 3607 3 4410-7717 48 83 36 2408 2 7717-12127 63 98 36 1809 2 12127-22050 66 119 54 120
this lowest band as the earrsquos characteristics are close to theconstant-bandwidth type in this frequency range contraryto the rest of the acoustic range
Figure 8 presents the time-frequency tiling for the aboveparameters of the EMTB analysis The boundaries be-tween the EMTB bands approximately coincide with theappropriate edges of the CBs Table II gives the detailedspecification of the EMTB with these parameters in termsof numbers of spectral lines of the individual MDCTs usedin particular EMTB bands The correction discussed inSection 5 was not used but the adjustment of the fre-quency bands mentioned in the first paragraph of this Sec-tion was This is why the cut-off frequencies of bandsgiven in Tables II and III are not those of critical-bandboundaries of the ear found in the literature
The second implementation was based on a 10-bandanalysis This results in more gradual transitions betweenthe lengths Ni of transforms in particular bands In effectthe characteristics are closer to the constant-Q analysis
The sequence of lengths Ni of transform blocks was cho-sen so that the Ni values were proportional to the follow-ing integers 48 32 24 16 12 8 6 4 3 2 Thus the ra-tio of corresponding time responses of filters was 241 Itwas found that although the analogy to the characteristicsof the ear is weaker the plots are more readable The as-signment of numbers of critical bands to particular EMTBbands cut-off frequencies and MDCT parameters for thiscase are given in Table III
Arbitrary Ni values can also be used resulting in a lessregular data structure This may be perfectly acceptablewhile allowing for yet higher flexibility
7 Results of analysis of audio signals
The DCT which is the basis for the MDCT used in theEMTB procedure is not optimal for spectral analysis assome spectral components of the signal may have phases
532
Kleczkowski Acoustic signal expansion in multiple trigonometric bases ACTA ACUSTICA UNITED WITH ACUSTICA
Vol 88 (2002)
frequency [kHz]
511
1077
2003
3704
7666
22050
0 0371 0742 1113 1484time [ms]
Figure 9 The results of the 6-band EMTB analysis of an excerptof orchestral music
resulting in very low values of DCT coefficients [2]Therefore additional processing was used in order to ob-tain results appropriate for displaying the results of time-frequency analysis of acoustic signals In parallel to theMDCT transform its appropriate sine counterpart (basedon the Discrete Sine Transform-DST) has been computedleading to pairs of coefficients (MDCT and MDST) In thenext step a joint measure of amplitude spectrum was ob-tained by computing
dnk qcnk snk (25)
where snk is the MDST coefficient appropriately com-plementing the cnk of (17)
It is worth noting that if such a spectral analysis is com-pared with the Discrete Fourier Transform it offers twiceas high spectral resolution as for a signal of lengthN thereare N different spectral amplitude coefficients The DFTyields only N spectral amplitudes
Several short fragments of musical material have beenanalysed by the EMTB procedure with the extension pre-sented above Due to this procedurersquos characteristics thetwo-dimensional diagram was found to be most appropri-ate The plots presented in this work display all values ofspectral coefficients dnk obtained according to Tables IIand III The mapping of the values dnk to the grey-scalewas logarithmic in the range of about 40 dB from the high-est coefficient values For the rest of the range (lowest val-ues) a correction to the logarithmic mapping has been in-troduced in order to obtain most readable results This cor-rection consisted in compressing the range of lowest val-ues In order to reveal more details in the high frequencyrange the pre-emphasis in the two highest bands was usedwith the gain of dB at the highest frequency
In the highest frequency band each coefficient is repre-sented by one dot In the lower bands the coefficients arerepresented as short horizontal lines with the lines in thelowest band consisting of respectively 32 and 24 dots eachIn the band no 8 of Table III the length is 15 dots and anappropriate averaging has been used
frequency [kHz]20
16
12
8
4
00 0371 0742 1113 1484
time [ms]
Figure 10 The Discrete SineCosine Transform modulus of thesignal analysed in Figure 9 the lenght of the analysis frame isthe same as in band no 3 of Figure 9
frequency [kHz]
207505
16911077
27014410
7717
12127
22050
0 0261 0522 0783 1045 1306 1567 [s]time
781
Figure 11 The results of the 10-band EMTB analysis of an ex-cerpt of orchestral music
Figure 9 shows the results of the 6-band EMTB analysisof an 18 s excerpt of an orchestra recording Although theacoustic content was dense groups of harmonics in differ-ent frequency regions are clearly visible For comparisonFigure 10 shows the same signal analysed with the stan-dard MDCT (constant bandwidth) analysis with a trans-form length N of 512 samples the same as used in bandno 3 of the EMTB analysis of Figure 9 Several partialgroups are also clearly visible but little information canbe obtained from the range below 1 kHz The entire upperhalf of the diagram is not informative either
The result of the 10-band EMTB analysis of the samesignal is presented in Figure 11 The transitions betweenthe bands are smoother and it seems that the time-fre-quency resolution is better adjusted to reveal more detailsof the signal
Figure 12 presents the result of the same 10-bandEMTB analysis of several guitar chords Some groups ofharmonics can be resolved and the diagram clearly showsthe time lag between the excitations of lower and higherstrings in a chord
533
ACTA ACUSTICA UNITED WITH ACUSTICA Kleczkowski Acoustic signal expansion in multiple trigonometric basesVol 88 (2002)
frequency [kHz]
207505
16911077
27014410
7717
12127
22050
0 0261 0522 0783 1045 1306 1567 [s]time
781
Figure 12 The results of the 10-band EMTB analysis of severalguitar chords
frequency [kHz]
207505
1077169127014410
7717
12127
22050
0 0261 0522 0783 1045 1306 1567 [s]time
781
Figure 13 The results of the 10-band EMTB analysis of the ut-terance ldquoWhy were you away a year Royrdquo spoken by a malevoice
frequency [kHz]
207505
16911077
27014410
7717
12127
22050
0 0261 0522 0783 1045 1306 1567 [s]time
781
Figure 14 The results of the 10-band EMTB analysis of the ut-terance ldquoTell me whatrsquos the timerdquo spoken by a female voice
Two speech signals have also been analysed with the10-band EMTB method In these presentations the pre-emphasis encompassed the three highest bands and thegain reached dB The first one is a direct digitalrecording of a male voice (Figure 13) and the second oneis a female voice from a vinyl record (Figure 14) All threekinds of information important in speech recognition arerevealed harmonic structure glottal pulses and formanttrajectories The scratches from the vinyl record are visi-ble as narrow vertical strips in Figure 14
8 Conclusion
The EMTB procedure proposed and analysed in this pa-per has all of the basic properties of an orthogonal signalexpansion while allowing for a very flexible tiling of thetime-frequency plane This flexibility can be used for ad-justing the time-frequency characteristics to any applica-tion In this work a crude adjustment to the characteristicsof the ear was investigated The procedure is simple con-ceptually easy to implement and robust The possibilityof using fast algorithms for MDCT computation can makeit computationally inexpensive There are some sourcesof errors in this procedure but means for their alleviationhave been presented
The method proposed differs substantially from earlierimplementations of the similar concept [19 18] in us-ing non-decimated bandpass filters and performing MDCTanalysis on the non-decimated signal Two additional de-grees of freedom have been gained this way The first oneconsists in an arbitrary choice of number widths and lo-calisation of frequency bands In these bands independentanalyses with arbitrary time-frequency resolution can beperformed
The spectral resolution of this expansion is good es-pecially when the improved time windows are used Onesuch window with additional advantage of deepening theanalogy to the auditory systemrsquos characteristics was pro-posed and other efficient windows can be used Practicalanalyses of audio signals showed that this method is use-ful in the graphical presentation of time-frequency spectraof acoustic signals showing most of the details relevant tothe ear
Acknowledgement
The author is indebted to Prof Zbigniew Engel and toProf Jan Adamczyk for their continuing support and helpduring this work and stimulating comments to this text
References
[1] J P Princen A B Bradley Analysissynthesis filter bankdesign based on time domain aliasing cancellation IEEETrans Acoust Speech Signal Processing 34 (1986) 1153ndash1161
[2] H S Malvar Signal processing with lapped transformsArtech House Boston 1992 143-217
[3] A Ferreira Convolutional effects in transform coding withTDAC an optimal window IEEE Trans Speech AudioProcessing 4 (1996) 105ndash114
[4] S Shlien The modulated lapped transform its time-vary-ing forms and its applications to audio coding standardsIEEE Trans Speech Audio Processing 5 (1997) 359ndash366
[5] M Vetterli J Kovacevic Wavelets and subband codingPrentice Hall Englewood Cliffs 1995 92-294
[6] G Gambardella A contribution to the theory of short-timespectral analysis with nonuniform bandwidth filters IEEETrans on Circuit Theory 18 (1971) 455ndash460
[7] G Gambardella The Mellin transforms and constant-Qspectral analysis J Acoust Soc Amer 66 (1979) 913ndash915
534
Kleczkowski Acoustic signal expansion in multiple trigonometric bases ACTA ACUSTICA UNITED WITH ACUSTICA
Vol 88 (2002)
[8] E Terhardt Fourier transformation of time signals Con-ceptual revison Acustica 57 (1985) 242ndash256
[9] W Heinbach Aurally adequate signal representation Thepart-tone-time-pattern 67 (1988) 113ndash120
[10] J C Brown Calculation of a constant Q spectral transformJ Acoust Soc Amer 89 (1990) 425ndash434
[11] I Daubechies The wavelet transform time-frequency lo-calization and signal analysis IEEE Trans on Inform The-ory 36 (1990) 961ndash1005
[12] T Irino H Kawahara Signal reconstruction from modifiedauditory wavelet transform IEEE Trans on Signal Process-ing 41 (1993) 3549ndash3554
[13] H Jeong J-G Ih Implementation of a new algorithm us-ing the STFT with variable frequency resolution for thetime-frequency auditory model J Audio Eng Soc 47(1999) 240ndash251
[14] D Sinha A H Tewfik Low bit rate transparent audio com-pression using adapted wavelets IEEE Trans on SignalProcessing 41 (1993) 3463ndash3479
[15] M Bobrek D B Koch Music segmentation using tree-structured filter banks J Audio Eng Soc 46 (1998) 413ndash427
[16] K Brandenburg J D Johnston Second generation percep-tual audio coding the hybrid coder 88th AES ConventionMontreux 1990 Preprint no 2937
[17] K Tsutsui H Suzuki O Shimoyoshi M Sonohara KAkagiri R M Heddle ATRAC Adaptive transform acous-tic coding for minidisc ndash In Collected Papers on DigitalAudio Bit-Rate Reduction N Gilchrist C Grewin (eds)Audio Engineering Society New York 1996 95ndash101
[18] M V Wickerhauser Adapted wavelet analysis from theoryto software IEEE Pr Piscataway 1994 103-152 237-271
[19] C Herley J Kovacevic K Ramchandran M VetterliTilings of the time-frequency plane construction of arbi-trary orthogonal bases and fast tiling algorithms IEEETrans on Signal Processing 41 (1993) 3341ndash3359
[20] F J Harris On the use of windows for harmonic analy-sis with the discrete Fourier transform Proceedings of theIEEE 66 (1978) 51ndash83
[21] A Ferreira Perceptual audio coding and the choice of ananalysissynthesis filter bank and psychoacoustic model104th AES Convention Amsterdam 1998 Preprint no4691
[22] L D Fielder M Bosi G Davidson M Davis C Todd SVernon AC-2 and AC-3 low complexity transform-basedaudio coding ndash In Collected Papers on Digital Audio Bit-Rate Reduction N Gilchrist C Grewin (eds) Audio En-gineering Society New York 1996 54ndash72
[23] T Sporer K Brandenburg Constraints of filter banks usedfor perceptual measurement J Audio Eng Soc 43 (1995)107ndash116
[24] R D Patterson Auditory filter shapes derived with noisestimuli J Acoust Soc Amer 59 (1976) 640ndash654
[25] B C J Moore B R Glasberg Suggested formulae for cal-culating auditory-filter bandwidths and excitation patternsJ Acoust Soc Amer 74 (1983) 750ndash753
[26] A D Poularkis S Seely Signals and systems PWS Engi-neering Boston 1988 152-155
[27] E Zwicker H Fastl Psychoacoustics facts and modelsSpringer-Verlag Berlin 1990 142
535

ACTA ACUSTICA UNITED WITH ACUSTICA Kleczkowski Acoustic signal expansion in multiple trigonometric basesVol 88 (2002)
frequency [Hz]B0
84
76663704
B 446
2003Band 340
1077Band 2no of spectral lines 43
511Band 1no of spectral lines 53
Band 00 no of spectral lines 95
0 time [ms] 85
Figure 8 The time-frequencytiling obtained with the 6-bandEMTB procedure dyadic divi-sion of time axis
Table II Parameters of the 6-band implementation of the EMTB procedure
Band No Frequency range [Hz] MDCT spectral lines used MDCT size in bandlowest highest number used
0 0-511 0 94 95 40961 511-1076 47 99 53 20482 1076-2002 50 92 43 10243 2002-3703 46 85 40 5124 3703-7665 43 88 46 2565 7665-22050 44 127 84 128
Table III Parameters of the 10-band implementation of the EMTB procedure
Band No Number of CBs Frequency range [Hz] MDCT spectral lines used MDCT size in bandlowest highest number used
0 2 0-2075 0 26 27 28801 3 2075-505 18 43 26 19202 2 505-781 33 50 18 14403 2 781-1077 34 46 13 9604 3 1077-1691 35 54 20 7205 3 1691-2701 36 58 23 4806 3 2701-4410 44 71 28 3607 3 4410-7717 48 83 36 2408 2 7717-12127 63 98 36 1809 2 12127-22050 66 119 54 120
this lowest band as the earrsquos characteristics are close to theconstant-bandwidth type in this frequency range contraryto the rest of the acoustic range
Figure 8 presents the time-frequency tiling for the aboveparameters of the EMTB analysis The boundaries be-tween the EMTB bands approximately coincide with theappropriate edges of the CBs Table II gives the detailedspecification of the EMTB with these parameters in termsof numbers of spectral lines of the individual MDCTs usedin particular EMTB bands The correction discussed inSection 5 was not used but the adjustment of the fre-quency bands mentioned in the first paragraph of this Sec-tion was This is why the cut-off frequencies of bandsgiven in Tables II and III are not those of critical-bandboundaries of the ear found in the literature
The second implementation was based on a 10-bandanalysis This results in more gradual transitions betweenthe lengths Ni of transforms in particular bands In effectthe characteristics are closer to the constant-Q analysis
The sequence of lengths Ni of transform blocks was cho-sen so that the Ni values were proportional to the follow-ing integers 48 32 24 16 12 8 6 4 3 2 Thus the ra-tio of corresponding time responses of filters was 241 Itwas found that although the analogy to the characteristicsof the ear is weaker the plots are more readable The as-signment of numbers of critical bands to particular EMTBbands cut-off frequencies and MDCT parameters for thiscase are given in Table III
Arbitrary Ni values can also be used resulting in a lessregular data structure This may be perfectly acceptablewhile allowing for yet higher flexibility
7 Results of analysis of audio signals
The DCT which is the basis for the MDCT used in theEMTB procedure is not optimal for spectral analysis assome spectral components of the signal may have phases
532
Kleczkowski Acoustic signal expansion in multiple trigonometric bases ACTA ACUSTICA UNITED WITH ACUSTICA
Vol 88 (2002)
frequency [kHz]
511
1077
2003
3704
7666
22050
0 0371 0742 1113 1484time [ms]
Figure 9 The results of the 6-band EMTB analysis of an excerptof orchestral music
resulting in very low values of DCT coefficients [2]Therefore additional processing was used in order to ob-tain results appropriate for displaying the results of time-frequency analysis of acoustic signals In parallel to theMDCT transform its appropriate sine counterpart (basedon the Discrete Sine Transform-DST) has been computedleading to pairs of coefficients (MDCT and MDST) In thenext step a joint measure of amplitude spectrum was ob-tained by computing
dnk qcnk snk (25)
where snk is the MDST coefficient appropriately com-plementing the cnk of (17)
It is worth noting that if such a spectral analysis is com-pared with the Discrete Fourier Transform it offers twiceas high spectral resolution as for a signal of lengthN thereare N different spectral amplitude coefficients The DFTyields only N spectral amplitudes
Several short fragments of musical material have beenanalysed by the EMTB procedure with the extension pre-sented above Due to this procedurersquos characteristics thetwo-dimensional diagram was found to be most appropri-ate The plots presented in this work display all values ofspectral coefficients dnk obtained according to Tables IIand III The mapping of the values dnk to the grey-scalewas logarithmic in the range of about 40 dB from the high-est coefficient values For the rest of the range (lowest val-ues) a correction to the logarithmic mapping has been in-troduced in order to obtain most readable results This cor-rection consisted in compressing the range of lowest val-ues In order to reveal more details in the high frequencyrange the pre-emphasis in the two highest bands was usedwith the gain of dB at the highest frequency
In the highest frequency band each coefficient is repre-sented by one dot In the lower bands the coefficients arerepresented as short horizontal lines with the lines in thelowest band consisting of respectively 32 and 24 dots eachIn the band no 8 of Table III the length is 15 dots and anappropriate averaging has been used
frequency [kHz]20
16
12
8
4
00 0371 0742 1113 1484
time [ms]
Figure 10 The Discrete SineCosine Transform modulus of thesignal analysed in Figure 9 the lenght of the analysis frame isthe same as in band no 3 of Figure 9
frequency [kHz]
207505
16911077
27014410
7717
12127
22050
0 0261 0522 0783 1045 1306 1567 [s]time
781
Figure 11 The results of the 10-band EMTB analysis of an ex-cerpt of orchestral music
Figure 9 shows the results of the 6-band EMTB analysisof an 18 s excerpt of an orchestra recording Although theacoustic content was dense groups of harmonics in differ-ent frequency regions are clearly visible For comparisonFigure 10 shows the same signal analysed with the stan-dard MDCT (constant bandwidth) analysis with a trans-form length N of 512 samples the same as used in bandno 3 of the EMTB analysis of Figure 9 Several partialgroups are also clearly visible but little information canbe obtained from the range below 1 kHz The entire upperhalf of the diagram is not informative either
The result of the 10-band EMTB analysis of the samesignal is presented in Figure 11 The transitions betweenthe bands are smoother and it seems that the time-fre-quency resolution is better adjusted to reveal more detailsof the signal
Figure 12 presents the result of the same 10-bandEMTB analysis of several guitar chords Some groups ofharmonics can be resolved and the diagram clearly showsthe time lag between the excitations of lower and higherstrings in a chord
533
ACTA ACUSTICA UNITED WITH ACUSTICA Kleczkowski Acoustic signal expansion in multiple trigonometric basesVol 88 (2002)
frequency [kHz]
207505
16911077
27014410
7717
12127
22050
0 0261 0522 0783 1045 1306 1567 [s]time
781
Figure 12 The results of the 10-band EMTB analysis of severalguitar chords
frequency [kHz]
207505
1077169127014410
7717
12127
22050
0 0261 0522 0783 1045 1306 1567 [s]time
781
Figure 13 The results of the 10-band EMTB analysis of the ut-terance ldquoWhy were you away a year Royrdquo spoken by a malevoice
frequency [kHz]
207505
16911077
27014410
7717
12127
22050
0 0261 0522 0783 1045 1306 1567 [s]time
781
Figure 14 The results of the 10-band EMTB analysis of the ut-terance ldquoTell me whatrsquos the timerdquo spoken by a female voice
Two speech signals have also been analysed with the10-band EMTB method In these presentations the pre-emphasis encompassed the three highest bands and thegain reached dB The first one is a direct digitalrecording of a male voice (Figure 13) and the second oneis a female voice from a vinyl record (Figure 14) All threekinds of information important in speech recognition arerevealed harmonic structure glottal pulses and formanttrajectories The scratches from the vinyl record are visi-ble as narrow vertical strips in Figure 14
8 Conclusion
The EMTB procedure proposed and analysed in this pa-per has all of the basic properties of an orthogonal signalexpansion while allowing for a very flexible tiling of thetime-frequency plane This flexibility can be used for ad-justing the time-frequency characteristics to any applica-tion In this work a crude adjustment to the characteristicsof the ear was investigated The procedure is simple con-ceptually easy to implement and robust The possibilityof using fast algorithms for MDCT computation can makeit computationally inexpensive There are some sourcesof errors in this procedure but means for their alleviationhave been presented
The method proposed differs substantially from earlierimplementations of the similar concept [19 18] in us-ing non-decimated bandpass filters and performing MDCTanalysis on the non-decimated signal Two additional de-grees of freedom have been gained this way The first oneconsists in an arbitrary choice of number widths and lo-calisation of frequency bands In these bands independentanalyses with arbitrary time-frequency resolution can beperformed
The spectral resolution of this expansion is good es-pecially when the improved time windows are used Onesuch window with additional advantage of deepening theanalogy to the auditory systemrsquos characteristics was pro-posed and other efficient windows can be used Practicalanalyses of audio signals showed that this method is use-ful in the graphical presentation of time-frequency spectraof acoustic signals showing most of the details relevant tothe ear
Acknowledgement
The author is indebted to Prof Zbigniew Engel and toProf Jan Adamczyk for their continuing support and helpduring this work and stimulating comments to this text
References
[1] J P Princen A B Bradley Analysissynthesis filter bankdesign based on time domain aliasing cancellation IEEETrans Acoust Speech Signal Processing 34 (1986) 1153ndash1161
[2] H S Malvar Signal processing with lapped transformsArtech House Boston 1992 143-217
[3] A Ferreira Convolutional effects in transform coding withTDAC an optimal window IEEE Trans Speech AudioProcessing 4 (1996) 105ndash114
[4] S Shlien The modulated lapped transform its time-vary-ing forms and its applications to audio coding standardsIEEE Trans Speech Audio Processing 5 (1997) 359ndash366
[5] M Vetterli J Kovacevic Wavelets and subband codingPrentice Hall Englewood Cliffs 1995 92-294
[6] G Gambardella A contribution to the theory of short-timespectral analysis with nonuniform bandwidth filters IEEETrans on Circuit Theory 18 (1971) 455ndash460
[7] G Gambardella The Mellin transforms and constant-Qspectral analysis J Acoust Soc Amer 66 (1979) 913ndash915
534
Kleczkowski Acoustic signal expansion in multiple trigonometric bases ACTA ACUSTICA UNITED WITH ACUSTICA
Vol 88 (2002)
[8] E Terhardt Fourier transformation of time signals Con-ceptual revison Acustica 57 (1985) 242ndash256
[9] W Heinbach Aurally adequate signal representation Thepart-tone-time-pattern 67 (1988) 113ndash120
[10] J C Brown Calculation of a constant Q spectral transformJ Acoust Soc Amer 89 (1990) 425ndash434
[11] I Daubechies The wavelet transform time-frequency lo-calization and signal analysis IEEE Trans on Inform The-ory 36 (1990) 961ndash1005
[12] T Irino H Kawahara Signal reconstruction from modifiedauditory wavelet transform IEEE Trans on Signal Process-ing 41 (1993) 3549ndash3554
[13] H Jeong J-G Ih Implementation of a new algorithm us-ing the STFT with variable frequency resolution for thetime-frequency auditory model J Audio Eng Soc 47(1999) 240ndash251
[14] D Sinha A H Tewfik Low bit rate transparent audio com-pression using adapted wavelets IEEE Trans on SignalProcessing 41 (1993) 3463ndash3479
[15] M Bobrek D B Koch Music segmentation using tree-structured filter banks J Audio Eng Soc 46 (1998) 413ndash427
[16] K Brandenburg J D Johnston Second generation percep-tual audio coding the hybrid coder 88th AES ConventionMontreux 1990 Preprint no 2937
[17] K Tsutsui H Suzuki O Shimoyoshi M Sonohara KAkagiri R M Heddle ATRAC Adaptive transform acous-tic coding for minidisc ndash In Collected Papers on DigitalAudio Bit-Rate Reduction N Gilchrist C Grewin (eds)Audio Engineering Society New York 1996 95ndash101
[18] M V Wickerhauser Adapted wavelet analysis from theoryto software IEEE Pr Piscataway 1994 103-152 237-271
[19] C Herley J Kovacevic K Ramchandran M VetterliTilings of the time-frequency plane construction of arbi-trary orthogonal bases and fast tiling algorithms IEEETrans on Signal Processing 41 (1993) 3341ndash3359
[20] F J Harris On the use of windows for harmonic analy-sis with the discrete Fourier transform Proceedings of theIEEE 66 (1978) 51ndash83
[21] A Ferreira Perceptual audio coding and the choice of ananalysissynthesis filter bank and psychoacoustic model104th AES Convention Amsterdam 1998 Preprint no4691
[22] L D Fielder M Bosi G Davidson M Davis C Todd SVernon AC-2 and AC-3 low complexity transform-basedaudio coding ndash In Collected Papers on Digital Audio Bit-Rate Reduction N Gilchrist C Grewin (eds) Audio En-gineering Society New York 1996 54ndash72
[23] T Sporer K Brandenburg Constraints of filter banks usedfor perceptual measurement J Audio Eng Soc 43 (1995)107ndash116
[24] R D Patterson Auditory filter shapes derived with noisestimuli J Acoust Soc Amer 59 (1976) 640ndash654
[25] B C J Moore B R Glasberg Suggested formulae for cal-culating auditory-filter bandwidths and excitation patternsJ Acoust Soc Amer 74 (1983) 750ndash753
[26] A D Poularkis S Seely Signals and systems PWS Engi-neering Boston 1988 152-155
[27] E Zwicker H Fastl Psychoacoustics facts and modelsSpringer-Verlag Berlin 1990 142
535

Kleczkowski Acoustic signal expansion in multiple trigonometric bases ACTA ACUSTICA UNITED WITH ACUSTICA
Vol 88 (2002)
frequency [kHz]
511
1077
2003
3704
7666
22050
0 0371 0742 1113 1484time [ms]
Figure 9 The results of the 6-band EMTB analysis of an excerptof orchestral music
resulting in very low values of DCT coefficients [2]Therefore additional processing was used in order to ob-tain results appropriate for displaying the results of time-frequency analysis of acoustic signals In parallel to theMDCT transform its appropriate sine counterpart (basedon the Discrete Sine Transform-DST) has been computedleading to pairs of coefficients (MDCT and MDST) In thenext step a joint measure of amplitude spectrum was ob-tained by computing
dnk qcnk snk (25)
where snk is the MDST coefficient appropriately com-plementing the cnk of (17)
It is worth noting that if such a spectral analysis is com-pared with the Discrete Fourier Transform it offers twiceas high spectral resolution as for a signal of lengthN thereare N different spectral amplitude coefficients The DFTyields only N spectral amplitudes
Several short fragments of musical material have beenanalysed by the EMTB procedure with the extension pre-sented above Due to this procedurersquos characteristics thetwo-dimensional diagram was found to be most appropri-ate The plots presented in this work display all values ofspectral coefficients dnk obtained according to Tables IIand III The mapping of the values dnk to the grey-scalewas logarithmic in the range of about 40 dB from the high-est coefficient values For the rest of the range (lowest val-ues) a correction to the logarithmic mapping has been in-troduced in order to obtain most readable results This cor-rection consisted in compressing the range of lowest val-ues In order to reveal more details in the high frequencyrange the pre-emphasis in the two highest bands was usedwith the gain of dB at the highest frequency
In the highest frequency band each coefficient is repre-sented by one dot In the lower bands the coefficients arerepresented as short horizontal lines with the lines in thelowest band consisting of respectively 32 and 24 dots eachIn the band no 8 of Table III the length is 15 dots and anappropriate averaging has been used
frequency [kHz]20
16
12
8
4
00 0371 0742 1113 1484
time [ms]
Figure 10 The Discrete SineCosine Transform modulus of thesignal analysed in Figure 9 the lenght of the analysis frame isthe same as in band no 3 of Figure 9
frequency [kHz]
207505
16911077
27014410
7717
12127
22050
0 0261 0522 0783 1045 1306 1567 [s]time
781
Figure 11 The results of the 10-band EMTB analysis of an ex-cerpt of orchestral music
Figure 9 shows the results of the 6-band EMTB analysisof an 18 s excerpt of an orchestra recording Although theacoustic content was dense groups of harmonics in differ-ent frequency regions are clearly visible For comparisonFigure 10 shows the same signal analysed with the stan-dard MDCT (constant bandwidth) analysis with a trans-form length N of 512 samples the same as used in bandno 3 of the EMTB analysis of Figure 9 Several partialgroups are also clearly visible but little information canbe obtained from the range below 1 kHz The entire upperhalf of the diagram is not informative either
The result of the 10-band EMTB analysis of the samesignal is presented in Figure 11 The transitions betweenthe bands are smoother and it seems that the time-fre-quency resolution is better adjusted to reveal more detailsof the signal
Figure 12 presents the result of the same 10-bandEMTB analysis of several guitar chords Some groups ofharmonics can be resolved and the diagram clearly showsthe time lag between the excitations of lower and higherstrings in a chord
533
ACTA ACUSTICA UNITED WITH ACUSTICA Kleczkowski Acoustic signal expansion in multiple trigonometric basesVol 88 (2002)
frequency [kHz]
207505
16911077
27014410
7717
12127
22050
0 0261 0522 0783 1045 1306 1567 [s]time
781
Figure 12 The results of the 10-band EMTB analysis of severalguitar chords
frequency [kHz]
207505
1077169127014410
7717
12127
22050
0 0261 0522 0783 1045 1306 1567 [s]time
781
Figure 13 The results of the 10-band EMTB analysis of the ut-terance ldquoWhy were you away a year Royrdquo spoken by a malevoice
frequency [kHz]
207505
16911077
27014410
7717
12127
22050
0 0261 0522 0783 1045 1306 1567 [s]time
781
Figure 14 The results of the 10-band EMTB analysis of the ut-terance ldquoTell me whatrsquos the timerdquo spoken by a female voice
Two speech signals have also been analysed with the10-band EMTB method In these presentations the pre-emphasis encompassed the three highest bands and thegain reached dB The first one is a direct digitalrecording of a male voice (Figure 13) and the second oneis a female voice from a vinyl record (Figure 14) All threekinds of information important in speech recognition arerevealed harmonic structure glottal pulses and formanttrajectories The scratches from the vinyl record are visi-ble as narrow vertical strips in Figure 14
8 Conclusion
The EMTB procedure proposed and analysed in this pa-per has all of the basic properties of an orthogonal signalexpansion while allowing for a very flexible tiling of thetime-frequency plane This flexibility can be used for ad-justing the time-frequency characteristics to any applica-tion In this work a crude adjustment to the characteristicsof the ear was investigated The procedure is simple con-ceptually easy to implement and robust The possibilityof using fast algorithms for MDCT computation can makeit computationally inexpensive There are some sourcesof errors in this procedure but means for their alleviationhave been presented
The method proposed differs substantially from earlierimplementations of the similar concept [19 18] in us-ing non-decimated bandpass filters and performing MDCTanalysis on the non-decimated signal Two additional de-grees of freedom have been gained this way The first oneconsists in an arbitrary choice of number widths and lo-calisation of frequency bands In these bands independentanalyses with arbitrary time-frequency resolution can beperformed
The spectral resolution of this expansion is good es-pecially when the improved time windows are used Onesuch window with additional advantage of deepening theanalogy to the auditory systemrsquos characteristics was pro-posed and other efficient windows can be used Practicalanalyses of audio signals showed that this method is use-ful in the graphical presentation of time-frequency spectraof acoustic signals showing most of the details relevant tothe ear
Acknowledgement
The author is indebted to Prof Zbigniew Engel and toProf Jan Adamczyk for their continuing support and helpduring this work and stimulating comments to this text
References
[1] J P Princen A B Bradley Analysissynthesis filter bankdesign based on time domain aliasing cancellation IEEETrans Acoust Speech Signal Processing 34 (1986) 1153ndash1161
[2] H S Malvar Signal processing with lapped transformsArtech House Boston 1992 143-217
[3] A Ferreira Convolutional effects in transform coding withTDAC an optimal window IEEE Trans Speech AudioProcessing 4 (1996) 105ndash114
[4] S Shlien The modulated lapped transform its time-vary-ing forms and its applications to audio coding standardsIEEE Trans Speech Audio Processing 5 (1997) 359ndash366
[5] M Vetterli J Kovacevic Wavelets and subband codingPrentice Hall Englewood Cliffs 1995 92-294
[6] G Gambardella A contribution to the theory of short-timespectral analysis with nonuniform bandwidth filters IEEETrans on Circuit Theory 18 (1971) 455ndash460
[7] G Gambardella The Mellin transforms and constant-Qspectral analysis J Acoust Soc Amer 66 (1979) 913ndash915
534
Kleczkowski Acoustic signal expansion in multiple trigonometric bases ACTA ACUSTICA UNITED WITH ACUSTICA
Vol 88 (2002)
[8] E Terhardt Fourier transformation of time signals Con-ceptual revison Acustica 57 (1985) 242ndash256
[9] W Heinbach Aurally adequate signal representation Thepart-tone-time-pattern 67 (1988) 113ndash120
[10] J C Brown Calculation of a constant Q spectral transformJ Acoust Soc Amer 89 (1990) 425ndash434
[11] I Daubechies The wavelet transform time-frequency lo-calization and signal analysis IEEE Trans on Inform The-ory 36 (1990) 961ndash1005
[12] T Irino H Kawahara Signal reconstruction from modifiedauditory wavelet transform IEEE Trans on Signal Process-ing 41 (1993) 3549ndash3554
[13] H Jeong J-G Ih Implementation of a new algorithm us-ing the STFT with variable frequency resolution for thetime-frequency auditory model J Audio Eng Soc 47(1999) 240ndash251
[14] D Sinha A H Tewfik Low bit rate transparent audio com-pression using adapted wavelets IEEE Trans on SignalProcessing 41 (1993) 3463ndash3479
[15] M Bobrek D B Koch Music segmentation using tree-structured filter banks J Audio Eng Soc 46 (1998) 413ndash427
[16] K Brandenburg J D Johnston Second generation percep-tual audio coding the hybrid coder 88th AES ConventionMontreux 1990 Preprint no 2937
[17] K Tsutsui H Suzuki O Shimoyoshi M Sonohara KAkagiri R M Heddle ATRAC Adaptive transform acous-tic coding for minidisc ndash In Collected Papers on DigitalAudio Bit-Rate Reduction N Gilchrist C Grewin (eds)Audio Engineering Society New York 1996 95ndash101
[18] M V Wickerhauser Adapted wavelet analysis from theoryto software IEEE Pr Piscataway 1994 103-152 237-271
[19] C Herley J Kovacevic K Ramchandran M VetterliTilings of the time-frequency plane construction of arbi-trary orthogonal bases and fast tiling algorithms IEEETrans on Signal Processing 41 (1993) 3341ndash3359
[20] F J Harris On the use of windows for harmonic analy-sis with the discrete Fourier transform Proceedings of theIEEE 66 (1978) 51ndash83
[21] A Ferreira Perceptual audio coding and the choice of ananalysissynthesis filter bank and psychoacoustic model104th AES Convention Amsterdam 1998 Preprint no4691
[22] L D Fielder M Bosi G Davidson M Davis C Todd SVernon AC-2 and AC-3 low complexity transform-basedaudio coding ndash In Collected Papers on Digital Audio Bit-Rate Reduction N Gilchrist C Grewin (eds) Audio En-gineering Society New York 1996 54ndash72
[23] T Sporer K Brandenburg Constraints of filter banks usedfor perceptual measurement J Audio Eng Soc 43 (1995)107ndash116
[24] R D Patterson Auditory filter shapes derived with noisestimuli J Acoust Soc Amer 59 (1976) 640ndash654
[25] B C J Moore B R Glasberg Suggested formulae for cal-culating auditory-filter bandwidths and excitation patternsJ Acoust Soc Amer 74 (1983) 750ndash753
[26] A D Poularkis S Seely Signals and systems PWS Engi-neering Boston 1988 152-155
[27] E Zwicker H Fastl Psychoacoustics facts and modelsSpringer-Verlag Berlin 1990 142
535
Copyright © 2022 FDOKUMEN