ACKNOWLEDGMENT This work was sponsored by the American ...
157
ACKNOWLEDGMENT This work was sponsored by the American Association of State Highway and Transportation Officials (AASHTO), in cooperation with the Federal Highway Administration, and was conducted in the National Cooperative Highway Research Program (NCHRP), which is administered by the Transportation Research Board (TRB) of the National Academies. COPYRIGHT INFORMATION Authors herein are responsible for the authenticity of their materials and for obtaining written permissions from publishers or persons who own the copyright to any previously published or copyrighted material used herein. Cooperative Research Programs (CRP) grants permission to reproduce material in this publication for classroom and not-for-profit purposes. Permission is given with the understanding that none of the material will be used to imply TRB, AASHTO, FAA, FHWA, FRA, FTA, Transit Development Corporation, or AOC endorsement of a particular product, method, or practice. It is expected that those reproducing the material in this document for educational and not-for-profit uses will give appropriate acknowledgment of the source of any reprinted or reproduced material. For other uses of the material, request permission from CRP. DISCLAIMER The opinions and conclusions expressed or implied in this report are those of the researchers who performed the research. They are not necessarily those of the Transportation Research Board, the National Research Council, or the program sponsors. The information contained in this document was taken directly from the submission of the author(s). This material has not been edited by TRB.
-
Upload
khangminh22 -
Category
Documents
-
view
13 -
download
0
Transcript of ACKNOWLEDGMENT This work was sponsored by the American ...

ACKNOWLEDGMENT
This work was sponsored by the American Association of State Highway and Transportation Officials (AASHTO), in cooperation with the Federal Highway Administration, and was conducted in the National Cooperative Highway Research Program (NCHRP), which is administered by the Transportation Research Board (TRB) of the National Academies.
COPYRIGHT INFORMATION
Authors herein are responsible for the authenticity of their materials and for obtaining written permissions from publishers or persons who own the copyright to any previously published or copyrighted material used herein.
Cooperative Research Programs (CRP) grants permission to reproduce material in this publication for classroom and not-for-profit purposes. Permission is given with the understanding that none of the material will be used to imply TRB, AASHTO, FAA, FHWA, FRA, FTA, Transit Development Corporation, or AOC endorsement of a particular product, method, or practice. It is expected that those reproducing the material in this document for educational and not-for-profit uses will give appropriate acknowledgment of the source of any reprinted or reproduced material. For other uses of the material, request permission from CRP.
DISCLAIMER
The opinions and conclusions expressed or implied in this report are those of the researchers who performed the research. They are not necessarily those of the Transportation Research Board, the National Research Council, or the program sponsors.
The information contained in this document was taken directly from the submission of the author(s). This material has not been edited by TRB.

The National Academy of Sciences is a private, nonprofit, self-perpetuating society of distinguished scholars engaged in scientific
and engineering research, dedicated to the furtherance of science and technology and to their use for the general welfare. Upon the
authority of the charter granted to it by the Congress in 1863, the Academy has a mandate that requires it to advise the federal
government on scientific and technical matters. Dr. Ralph J. Cicerone is president of the National Academy of Sciences.
The National Academy of Engineering was established in 1964, under the charter of the National Academy of Sciences, as a parallel
organization of outstanding engineers. It is autonomous in its administration and in the selection of its members, sharing with the
National Academy of Sciences the responsibility for advising the federal government. The National Academy of Engineering also
sponsors engineering programs aimed at meeting national needs, encourages education and research, and recognizes the superior
achievements of engineers. Dr. C. D. Mote, Jr., is president of the National Academy of Engineering.
The Institute of Medicine was established in 1970 by the National Academy of Sciences to secure the services of eminent members
of appropriate professions in the examination of policy matters pertaining to the health of the public. The Institute acts under the
responsibility given to the National Academy of Sciences by its congressional charter to be an adviser to the federal government
and, upon its own initiative, to identify issues of medical care, research, and education. Dr. Victor J. Dzau is president of the
Institute of Medicine.
The National Research Council was organized by the National Academy of Sciences in 1916 to associate the broad community of
science and technology with the Academy’s purposes of furthering knowledge and advising the federal government. Functioning in
accordance with general policies determined by the Academy, the Council has become the principal operating agency of both the
National Academy of Sciences and the National Academy of Engineering in providing services to the government, the public, and
the scientific and engineering communities. The Council is administered jointly by both Academies and the Institute of Medicine.
Dr. Ralph J. Cicerone and Dr. C. D. Mote, Jr., are chair and vice chair, respectively, of the National Research Council.
The Transportation Research Board is one of six major divisions of the National Research Council. The mission of the Transporta-
tion Research Board is to provide leadership in transportation innovation and progress through research and information exchange,
conducted within a setting that is objective, interdisciplinary, and multimodal. The Board’s varied activities annually engage about
7,000 engineers, scientists, and other transportation researchers and practitioners from the public and private sectors and academia,
all of whom contribute their expertise in the public interest. The program is supported by state transportation departments, federal
agencies including the component administrations of the U.S. Department of Transportation, and other organizations and individu-
als interested in the development of transportation. www.TRB.org
www.national-academies.org
Table of Contents List of Tables .............................................................................................................................. 4
List of Figures ............................................................................................................................ 5
Purpose of This Guide ................................................................................................................ 7
Background and Motivation ....................................................................................................... 7
How to Use This Guide .............................................................................................................. 9
Steps 1 and 2: Diagnosis and Identification of Oversaturated Conditions ............................... 14
Definitions ................................................................................................................................ 14
Extension of the Definition for Spatial Extent ......................................................................... 16
Detrimental Effects ................................................................................................................... 18
Blocking and Non-Blocking Conditions .................................................................................. 19
Oversaturation on a Route ........................................................................................................ 20
Oversaturation on a Network ................................................................................................... 21
Special Cases of Network Oversaturation ................................................................................ 22
Large-Scale Problems and Gridlock ......................................................................................... 23
Duration of Oversaturation ....................................................................................................... 24
Causal Factors .......................................................................................................................... 25
Occurrence Frequency .............................................................................................................. 26
Specific Symptoms on Routes and at Intersections .................................................................. 27
Summary of Characteristics that Define an Oversaturated Scenario ....................................... 29
Oversaturation Problem Characterization and System Dynamics ........................................... 30
High-Level System Dynamics ............................................................................................... 31
Operational System Dynamics .............................................................................................. 32
Quantitative Characterization of the “Intensity” of Oversaturation ...................................... 36
Identifying Critical Routes ....................................................................................................... 40
Summary: Characterizing a Scenario of Oversaturated Traffic Conditions ............................. 42
Step 3: Identifying Appropriate Operational Objectives .......................................................... 42
Delay Minimization .................................................................................................................. 43
Throughput Maximization ........................................................................................................ 44
Application of Traffic Control Strategies for Mitigation of Oversaturated Conditions Page 1
Measurement and Assessment of Throughput ....................................................................... 44
Queue Management .................................................................................................................. 51
Summary .................................................................................................................................. 52
Step 4: Identifying Mitigating Strategies for Oversaturated Conditions ............................... 53
Local Strategies ........................................................................................................................ 53
Split Reallocation .................................................................................................................. 54
Increasing the Cycle Time ..................................................................................................... 56
Green Extension .................................................................................................................... 59
Phase Re-Service ................................................................................................................... 61
Phase Truncation ................................................................................................................... 64
Dynamic Left-Turn Treatments ............................................................................................. 66
Operating Closely-Spaced Intersections on One Controller .................................................. 69
Summary of Mitigation Strategies for Isolated Intersections ................................................ 70
Strategies for Mitigating Oversaturated Conditions on Routes and Arterials .......................... 72
Negative and Simultaneous Offsets ....................................................................................... 72
Offsets to Avoid Spillback ....................................................................................................... 75
Offsets to Avoid Starvation ...................................................................................................... 75
Modifying Phase Sequences for Left Turns .......................................................................... 84
Finding the “Right” Cycle Time for an Oversaturated Route ............................................... 89
“Flaring” Green Times .......................................................................................................... 91
Corridor Preemption (Green “Flush”) ................................................................................... 92
Network Level Strategies ......................................................................................................... 96
Metering or Gating ................................................................................................................ 96
Non-Actuated Operation ........................................................................................................ 99
Adaptive Control ................................................................................................................. 100
Selecting a Combination Mitigating Strategies ...................................................................... 102
Step 5: Plan for Equipment Upgrades, Field Deployment and Operations ............................ 104
Operational Implementation ................................................................................................... 108
Off-line Implementation of Mitigation Strategies .................................................................. 108
On-line Implementation of Mitigation Strategies .................................................................. 109
Determining Detector Locations ......................................................................................... 109
Application of Traffic Control Strategies for Mitigation of Oversaturated Conditions Page 2
Placement of Detectors for On-line Recognition of a Scenario .......................................... 111
Detector Data Aggregation Intervals and Persistence Time ................................................ 111
Logic Configuration Example ............................................................................................. 112
On-Line Performance Evaluation Framework .................................................................... 115
Step 6: Assessment of Effectiveness of Mitigating Strategies ............................................. 117
“Before” Condition Process ................................................................................................... 117
“After” Condition Process ...................................................................................................... 119
Summary ................................................................................................................................ 121
References .............................................................................................................................. 125
Appendix A: Glossary of Terms .......................................................................................... 126
Appendix B: Using SOSI and TOSI Measures to Compute Green Time adjustments ........ 137
Forward-Backward Procedure (FBP) ..................................................................................... 137
Intersection Signal Timing Adjustment based on TOSI and SOSI ........................................ 138
Green Extension for Scenario 1: TOSI > 0 & SOSI = 0. .................................................... 138
Red Extension for Scenario 2: TOSI = 0 & SOSI > 0. ........................................................ 139
Downstream Red Reduction for Scenario 3: TOSI > 0 & SOSI > 0. .................................. 139
Forward-Backward Procedure (FBP) ..................................................................................... 140
Forward Process (FP): ......................................................................................................... 141
Backward Process (BP): ...................................................................................................... 142
FBP for an Oversaturated Network ........................................................................................ 144
Oversaturated Route ............................................................................................................ 144
Critical Intersection ............................................................................................................. 144
Calculation Procedure ............................................................................................................ 145
Real-World Examples ............................................................................................................ 148
An Individual Intersection ...................................................................................................... 148
A Signalized Arterial .............................................................................................................. 152
Summary ................................................................................................................................ 155
Application of Traffic Control Strategies for Mitigation of Oversaturated Conditions Page 3

List of Tables Table 1. Categorization of Oversaturated Conditions Scenario .......................................... 11 Table 2. Special Cases of Network Oversaturation ............................................................... 22 Table 3. Duration of Oversaturation ...................................................................................... 25 Table 4. Causal Factors ............................................................................................................ 26 Table 5. Frequency of Oversaturation.................................................................................... 27 Table 6. Summary of Characteristics of Oversaturated Scenario ....................................... 30 Table 7. Example tabulation of queue information and calculation of SOSI and TOSI ... 39 Table 8. Attributes of an Oversaturated Scenario ................................................................ 53 Table 9. Allocation of split re-allocation strategies to oversaturated scenarios ................. 55 Table 10. Allocation of cycle time increase strategies to oversaturated scenarios ............. 59 Table 11. Allocation of green extension strategy to oversaturated scenarios ..................... 60 Table 12. Allocation of phase re-service strategy to oversaturated scenarios .................... 64 Table 13. Allocation of phase truncation to oversaturated scenarios .................................. 66 Table 14. Possible conditions for switching between left-turn treatment types ................. 68 Table 15. Allocation of dynamic left-turn strategies to oversaturated scenarios ............... 69 Table 16. Allocation of running two intersections together to oversaturated scenarios .... 70 Table 17. Traffic flows during the test scenario .................................................................... 78 Table 18. Tabulation of TOSI and SOSI data for peak hour ............................................... 79 Table 19. Application of mitigating strategies for this oversaturated route ....................... 80 Table 20. Comparison of average vehicle delay for key movements ................................... 81 Table 21. Key to colored cells in performance comparison tables ....................................... 81 Table 22. Allocation of offset strategies to oversaturated scenarios .................................... 83 Table 23. Rules of thumb for switching sequence to mitigate oversaturated conditions ... 88 Table 24. Allocation of lead-lag phasing strategies to oversaturated scenarios ................. 89 Table 25. Allocation of cycle time strategies to oversaturated scenarios ............................ 91 Table 26. Allocation of green flare strategies to oversaturated scenarios ........................... 92 Table 27. Implementation of a route preemption for oversaturation mitigation ............... 93 Table 28. Oversaturated route green flush plan schedule .................................................... 94 Table 29. Allocation of green “flush” strategies to oversaturated scenarios ...................... 95 Table 30. Allocation of metering strategies to oversaturated scenarios .............................. 99 Table 31. Allocation of Non-actuated operation to oversaturated scenarios .................... 100 Table 32. Potential for a mitigating strategy to address a problematic scenario ............. 103 Table 33. Attributes of various mitigation strategies related to field deployment ........... 105 Table 34. Example logic conditions and actions .................................................................. 113 Table 35. Cross reference of link names in Table 33 with Detectors in Figure 50 ........... 113 Table 36. Example tabulation of queue information and calculation of SOSI and TOSI 119 Table 37. Potential for a mitigating strategy to address a problematic scenario ............. 124
Application of Traffic Control Strategies for Mitigation of Oversaturated Conditions Page 4

List of Figures Figure 1. Overview of the Process ............................................................................................. 9 Figure 2. Allocation of optimization objectives to phases of operation ............................... 12 Figure 3. An oversaturated traffic movement ....................................................................... 16 Figure 4. An oversaturated approach for both through and LT movements ..................... 17 Figure 5. Illustration of oversaturated approach due to starvation .................................... 18 Figure 6. Oversaturation at an intersection caused by blocking.......................................... 19 Figure 7. Oversaturated Condition on a Route ..................................................................... 20 Figure 8. Illustration of an oversaturated network ............................................................... 21 Figure 9. Illustration of oversaturated condition on a two-way arterial ............................. 23 Figure 10. A Challenging Regional Network Scenario ......................................................... 24 Figure 11. Approach spillback (de facto red) ........................................................................ 28 Figure 12. Approach starvation due to signal timing ............................................................ 28 Figure 13. Storage bay spillback ............................................................................................. 28 Figure 14. Storage Bay Blocking ............................................................................................. 29 Figure 15. Cross-Blocking Effects ........................................................................................... 29 Figure 16. Loading, Oversaturation, and Recovery Regimes of Operation ........................ 31 Figure 17. Example of dynamic map of queue growth ......................................................... 33 Figure 18. Continuation - Example of dynamic map of queue dissipation ......................... 34 Figure 19. Example of overflow queue estimation. ............................................................... 35 Figure 20. Spillover at the upstream intersection with SOSI > 0 ......................................... 37 Figure 21. Example oversaturated route ................................................................................ 38 Figure 22. Critical oversaturated routes ................................................................................ 41 Figure 23. Example Control Strategies on Reston Parkway Network ................................ 42 Figure 24. Comparison of Input and Output Processing Rates ........................................... 46 Figure 25. Comparison of output processing rates during “Recovery Period” .................. 47 Figure 26. Total vehicles in the system without mitigation .................................................. 48 Figure 27. Total vehicles in the system with mitigation strategy ......................................... 49 Figure 28. Comparison of vehicles “in the system” among various mitigation strategies . 50 Figure 29. Cycle Time Restriction to Prevent Spillback ....................................................... 57 Figure 30. Upper-bound of Cycle length as a function of split ratio and link distance ..... 58 Figure 31. Phase re-service to benefit the Northbound left-turn movement ...................... 62 Figure 32. Phase-barrier diagram for re-service of phase 5 ................................................. 62 Figure 33. Ring-barrier Diagram for service of phases in alternating cycles ..................... 63 Figure 34. Phase truncation could eliminate cross-blocking of other movements ............. 65 Figure 35. Example - Simultaneous Offsets ........................................................................... 73 Figure 36. Example - Negative Offsets ................................................................................... 74 Figure 37. Spillback Avoidance Offset ................................................................................... 75 Figure 38. Starvation Avoidance Offset ................................................................................. 76 Figure 39. Offset Values that avoid spillback and starvation .............................................. 77
Application of Traffic Control Strategies for Mitigation of Oversaturated Conditions Page 5

Figure 40. Hypothetical test network ...................................................................................... 78 Figure 41. Comparison of Average Travel Times by Direction ........................................... 83 Figure 42. Comparison of Lead-lead and Lead-lag left turns on progression window ..... 84 Figure 43. Left-turning vehicles blocking the Northbound approach ................................. 85 Figure 44. Through vehicles blocking left turn vehicles from entering the turn bay ........ 86 Figure 45. Comparison of mitigations on “better” and “worse” links ................................ 90 Figure 46. Flaring the green to clear downstream queues.................................................... 93 Figure 47. Route preemption sequence of preemtps from downstream to upstream ........ 93 Figure 48. Oversaturated route travel time for green flush mitigation ............................... 95 Figure 49. Illustration of gating operation ............................................................................. 98 Figure 50. Recommended placement of oversaturation detection zones ........................... 110 Figure 51. Example Placement of Oversaturation Detection Points ................................. 111 Figure 52. Set up for inputs, logic, and actions .................................................................... 112 Figure 53. Logic Engine Example ......................................................................................... 114 Figure 54. On-line oversaturation management research software integration ............... 116 Figure 55. Example oversaturated route .............................................................................. 118 Figure 56. Overview of the Process ....................................................................................... 122 Figure 57. Allocation of optimization objectives to phases of operation ........................... 123 Figure 58. Green extension for Scenario 1 ........................................................................... 138 Figure 59. Red extension for Scenario 2 ............................................................................... 139 Figure 60. Red reduction (at downstream intersection) for Scenario 3 ............................ 140 Figure 61. Forward and backward process for an oversaturated arterial corridor ........ 141 Figure 62. Oversaturated path and critical intersection ..................................................... 145 Figure 63. Test arterial on TH55, Minneapolis, MN ........................................................... 149 Figure 64. Signal Timing Plan (AM Peak) for Winnetka and Rhode Island .................... 149 Figure 65. SOSI and TOSI values of Rhode Island westbound ......................................... 150 Figure 66. SOSI values of Rhode Island before and after the FBP ................................... 150 Figure 67. TOSI values of Rhode Island before and after the FBP ................................... 151 Figure 68. Estimated queue lengths at Winnetka before and after the FBP .................... 151 Figure 69. Southbound Queue length at Winnetka ............................................................. 152 Figure 70. a) An oversaturated arterial corridor; b) Green change after the FBP ........ 1533 Figure 71. TOSI and SOSI changes before and after the FBP ......................................... 1533 Figure 72. Queued vehicles Westbound at Intersection 3 ................................................... 154 Figure 73. Queued vehicles Eastbound at Intersection 2 .................................................... 154 Figure 74. Comparison of total system throughput ............................................................ 155
Application of Traffic Control Strategies for Mitigation of Oversaturated Conditions Page 6
Purpose of This Guide This guide presents a rational approach for identifying traffic control strategies for mitigating oversaturated conditions at signalized intersections. This guide will discuss the following components of the rational approach:
• Diagnosis of the type and causes of the oversaturated condition.• Identification of appropriate operational objective(s) based on the observed condition(s).• Identification of appropriate strategies to address the situation.• Identifying any necessary infrastructure, equipment, or software requirements for each
strategy.
The intended audience for this guide is a practicing traffic engineer with responsibility for designing and implementing traffic signal system timing, phasing, sequencing, and scheduling. The guide focuses on common traffic control strategies and features available in the majority of traffic controllers. The guide does not address freeway operations, geometric reconfiguration, re-routing, traveler information, or other strategies that seek to influence travel demand, departure time choice, or route choice. Nor does the guide explicitly address strategies or oversaturated conditions for buses, pedestrians, bikes, or trains.
This guide assumes working knowledge of traffic signal system concepts and North American signal control terminology. We will refer to common terms such as phase, movement, ring, barrier, offset, split, and so on, without definition or further explanation. A glossary of terms is available in Appendix A. Additional information on terminology and concepts can be found in the Traffic Signal Timing Manual. New concepts and terminology will be defined and explained. The mitigating traffic signal control strategies noted in this guide are able to be implemented using actuated-coordinated traffic signal controllers that run patterns of timing parameters that can be changed by time-of-day or via detection inputs.
A preliminary approach for determining green time adjustments on oversaturated routes is included in Appendix B. Other mitigations and rules of thumb noted in this guide link common controller capabilities to certain types of traffic scenarios. For some of the strategies, we have provided example results and application guidelines.. . An experimental mathematical optimization approach is documented in the final report for the research project.
Background and Motivation Traffic congestion continues to grow significantly in North America and throughout the world. Agencies tasked with managing traffic control systems are more and more frequently challenged with moving traffic in congested conditions and situations where the traffic demand exceeds the capacity of the system. As indicated by the results of the Traffic Signal Operation Self Assessment
Application of Traffic Control Strategies for Mitigation of Oversaturated Conditions Page 7
surveys (http://www.ite.org/selfassessment/), the majority of agencies involved in the operation and maintenance of traffic signal systems are stretched thin and challenged to provide adequate service to drivers in their jurisdictions.
Oversaturated traffic systems are the most complex and difficult traffic control problems. Under oversaturation, typical traffic control strategies do not work as efficiently as necessary, particularly since the objectives need to be decidedly different when mobility is restricted (e.g. “move someone, somewhere” rather than “give everyone equity treatment per cycle”). Many practitioners argue or conclude that “there is nothing that can be done when there is simply too much traffic”. Under many typical oversaturated conditions, mitigating strategies can be applied that have an appreciable effect on overall system performance. There are two important clarifying factors.
First, it is important to consider at three different regimes (loading, mitigation, and recovery) of operation under which performance is considered. Secondly, during oversaturated conditions, “performance” must be measured with respect to different objectives than objectives that are appropriate during undersaturated operation. In particular, during oversaturated conditions, the objective to minimize individual user delay must be substituted with the objective to maximize system throughput or to manage queues.
In developing this guidance, the research team reviewed a significant amount of literature and past approaches for both measuring oversaturation and applying strategies for oversaturated conditions. Our review indicated that there is a significant range in the level of detail and complexity of previous research. There do exist some mathematical formulations and algorithms for traffic signal settings that have been designed specifically to handle oversaturated conditions. In particular, the algorithms work that was reviewed typically requires data that is difficult to measure in real-time (demand rates) and assumes adaptive-control type signal operation.
Some rules of thumb in designing signal settings were also identified. These principles were used in this research to design signal plans that can improve operation during oversaturated conditions. The test cases evaluated in this project showed that there is some benefit that can be derived from applying these principles. In addition, we developed two quantifying measures for the “severity” of oversaturation and a procedure for applying those measures to re-setting green times and offsets on an arterial corridor. This procedure is explained in Appendix B.
Since the number of combinations of oversaturated conditions is so varied, there is not yet any comprehensive “one size fits all” procedure for using the measures and the design principles for any situation.
Mitigation of oversaturated conditions will frequently involve trade-offs between the storage of
Application of Traffic Control Strategies for Mitigation of Oversaturated Conditions Page 8
traffic queues from the oversaturated movements to other less utilized movements. This practice might be described by the idiom “borrowing from Peter to pay Paul”. Counter-intuitively or perhaps paradoxically, the same control strategy that provides user-optimal delay minimization in under-saturation works against the minimization of total delay when one or more approaches become oversaturated. It may in fact be necessary to induce phase failures and overflow queuing on side streets in order to maximize the flow rates on heavily oversaturated movements. These changes in operational policy or strategy may be challenging to communicate to an organization and the public
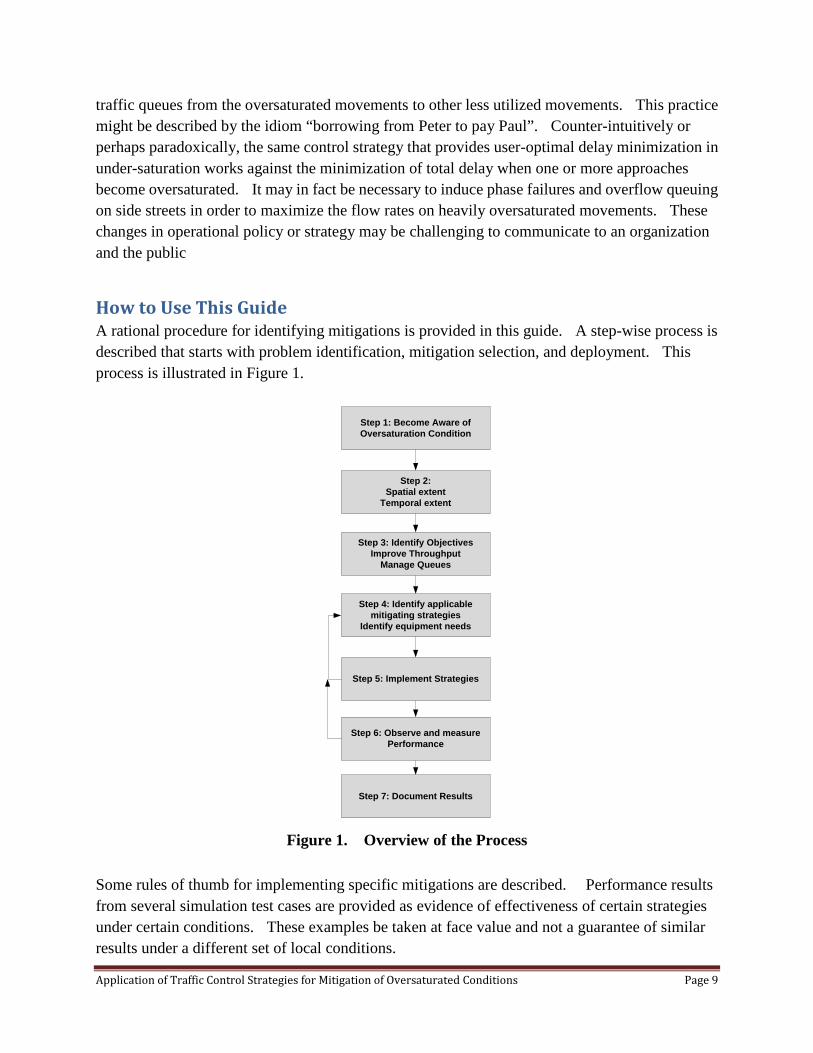
How to Use This Guide A rational procedure for identifying mitigations is provided in this guide. A step-wise process is described that starts with problem identification, mitigation selection, and deployment. This process is illustrated in Figure 1.
Figure 1. Overview of the Process
Some rules of thumb for implementing specific mitigations are described. Performance results from several simulation test cases are provided as evidence of effectiveness of certain strategies under certain conditions. These examples be taken at face value and not a guarantee of similar results under a different set of local conditions.
Step 1: Become Aware of Oversaturation Condition
Step 2:Spatial extent
Temporal extent
Step 3: Identify ObjectivesImprove Throughput
Manage Queues
Step 4: Identify applicable mitigating strategies
Identify equipment needs
Step 5: Implement Strategies
Step 6: Observe and measure Performance
Step 7: Document Results
Application of Traffic Control Strategies for Mitigation of Oversaturated Conditions Page 9

Step 1 of the process is to first become aware that a particular oversaturated condition scenario is occurring. This may come from staff observation, alerts from a signal system (e.g. police control enable, queue detector monitoring), visual evidence from CCTV cameras, phone calls or reports from citizens, or other sources. Confirmation of the condition from multiple sources or indicators is always helpful to improve the reliability of the location, timing, and duration of the problem.
The next step of the process is to expand and refine the known information related to the specific issue that is occurring. This can include a combination of field work, review of signal system logs, and configuration of additional signal system features or diagnostics. The goal in Step 2 is to answer several basic questions:
• How many intersections and directions of travel are affected?• How long does the oversaturated condition last? How does it evolve over time? How
does it dissipate during recovery?• How frequently does the oversaturated condition occur?• What is the cause or causes of this oversaturated condition?• What are the specific symptoms that define the type of oversaturation.
The answers to these questions determine the type or types of mitigating strategies that can be used to mitigate a specific scenario. To help facilitate categorization of scenarios and mitigations the matrix shown in Table 1 was developed. Each mitigating strategy is allocated to one or more of the cells in the matrix to indicate when a mitigating strategy is appropriate for that condition.
Application of Traffic Control Strategies for Mitigation of Oversaturated Conditions Page 10

Table 1. Categorization of Oversaturated Conditions Scenario
Step 3 is to identify what objective or objectives are intended to be met by applying one or more mitigating strategies. The two primary goals during oversaturation are to maximize system throughput (i.e. move the most traffic possible out of the system, into the system, or both) and to mitigate the effects of growing queues and their interactions with each other. Either or both of these objectives will likely play a part in a specific scenario. In certain cases, it is possible that operating the signals for maximum throughput could mitigate the need to manage queues.
In general, there are three regimes of operation during an oversaturated scenario:
• Loading maximize throughput• Oversaturated operation (processing) manage queues• Recovery maximize throughput
Figure 2 illustrates when each operational objective applies during these phases of operation.
Extent Duration Causation Recurrence Symptoms
Movement Situational Signal Timing Recurrent Starvation
Approach Intermittent Geometrics Non-recurrent Spillback
Intersection Persistent Other modes StorageBlocking
Route Prolonged Demand Cross Blocking
One-wayarterial
UnplannedEvents
Two-way arterial
Planned Events
Interchange
Grid
Network
Application of Traffic Control Strategies for Mitigation of Oversaturated Conditions Page 11
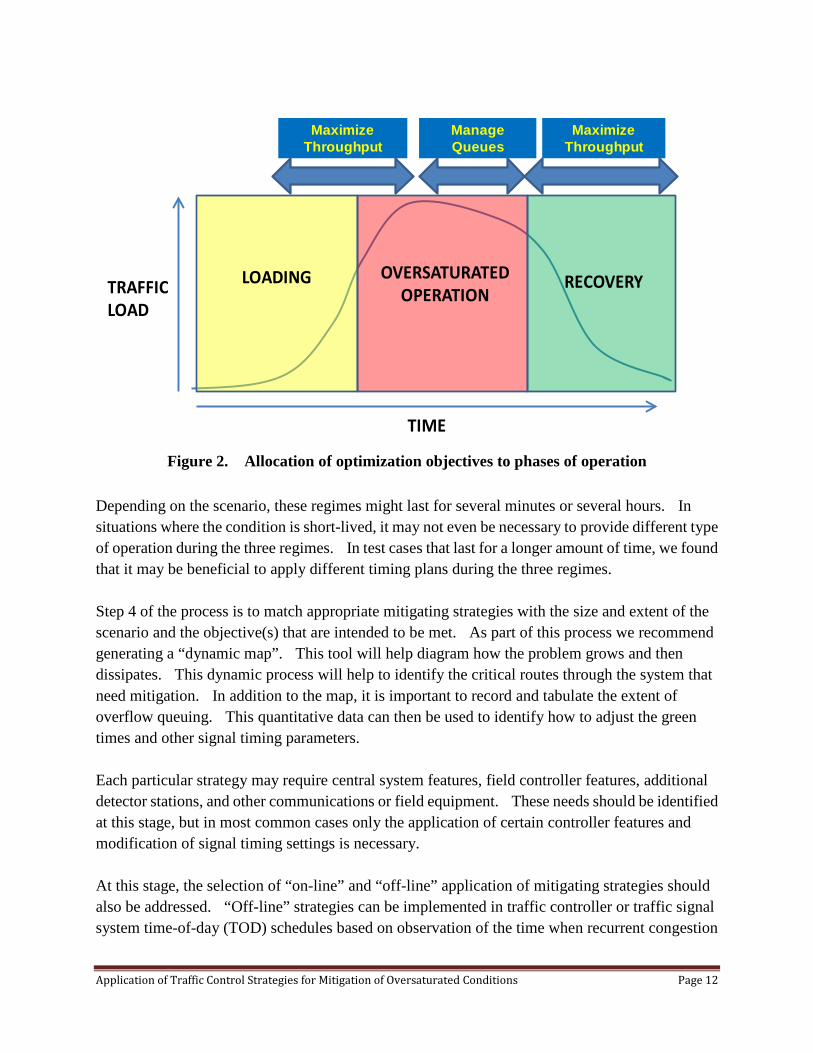
Figure 2. Allocation of optimization objectives to phases of operation
Depending on the scenario, these regimes might last for several minutes or several hours. In situations where the condition is short-lived, it may not even be necessary to provide different type of operation during the three regimes. In test cases that last for a longer amount of time, we found that it may be beneficial to apply different timing plans during the three regimes.
Step 4 of the process is to match appropriate mitigating strategies with the size and extent of the scenario and the objective(s) that are intended to be met. As part of this process we recommend generating a “dynamic map”. This tool will help diagram how the problem grows and then dissipates. This dynamic process will help to identify the critical routes through the system that need mitigation. In addition to the map, it is important to record and tabulate the extent of overflow queuing. This quantitative data can then be used to identify how to adjust the green times and other signal timing parameters.
Each particular strategy may require central system features, field controller features, additional detector stations, and other communications or field equipment. These needs should be identified at this stage, but in most common cases only the application of certain controller features and modification of signal timing settings is necessary.
At this stage, the selection of “on-line” and “off-line” application of mitigating strategies should also be addressed. “Off-line” strategies can be implemented in traffic controller or traffic signal system time-of-day (TOD) schedules based on observation of the time when recurrent congestion
LOADING OVERSATURATEDOPERATION
RECOVERY
TIME
TRAFFICLOAD
Maximize Throughput
Manage Queues
Maximize Throughput
Application of Traffic Control Strategies for Mitigation of Oversaturated Conditions Page 12

is typically occurring. “On-line” strategies use data from detection and automated algorithms to determine when to switch from normal operation to an oversaturated mitigation strategy. If the condition is recurrent, it is not necessary to use an on-line strategy. If the starting time of the scenario fluctuates, monitoring of certain key detectors can be used to enable the mitigating strategy automatically.
Most traffic signal systems include a traffic responsive operation feature. Typically those features are fairly complex to set up, in particular if they use pattern-matching “targets” or “signatures” instead of thresholds. As part of this research project we developed a threshold-based tool that can use the occupancy and oversaturation severity estimates from detectors to trigger the enabling of the mitigation strategy or strategies. This tool is in an experimental stage with simulation-in-the-loop, but is available from NCHRP for anyone’s use. An approach for using the tool for on-line application is included in Step 5 of this guide. For smaller scenarios, it can also be possible to use the logic processor features of modern controller firmware to trigger different timing plans. Since these features are controller-specific, consult your controller support personnel for assistance in applying these techniques.
Step 5 of the process is then to implement the necessary changes to timing plans, sequences, schedules, and other field controller and central system parameters. For recurrent situations, this may require some implementation of mitigations, observation, and fine-tuning of the approach.
Step 6 is to observe the performance of the system during the scenario. This may include field observation and data collection, creating DVR recordings of CCTV cameras, and archiving of data from the signal system and field controllers. Depending on the type of scenario (intersection, route, and network) and the specific strategies being implemented, it may be immediately obvious if the mitigating strategy is effective, or it may take several days or weeks of operation before subtle operational improvements are identified. Based on the initial results, it will probably be necessary to attempt alternative mitigating strategies or modify the current mitigating strategy. Revisions to a strategy would then involve another cycle of the implementation and performance measurement steps of the process.
Finally, in Step 7, we recommend documentation of the strategy and the results for your scenario. This could be cheaply accomplished by a PowerPoint presentation for an ITE chapter meeting or by partnering with a local University. During the literature review stage of this project, we identified that one of the reasons that practitioners typically resolve that “nothing can be done” about oversaturated conditions is that there are few examples or descriptions of successful approaches in “before and after” studies. We have only begin to scratch the surface of exploring mitigating approaches that are enabled by modern controllers, communications, detection technologies and queue estimation algorithms. Please add your experience to the body of literature identifying that certain strategies can be effective under certain conditions.
Application of Traffic Control Strategies for Mitigation of Oversaturated Conditions Page 13

Steps 1 and 2: Diagnosis and Identification of Oversaturated Conditions After the initial identification of “a problem”, and assuming we have reasonable information that the problem is related in some way to oversaturated traffic, the next step is to categorize the problem according to the following dimensions:
• Spatial extent• Temporal extent• Recurrence• Cause(s)• Symptoms
The details of these five dimensions comprise a specific “scenario” of traffic conditions that warrant some mitigating strategies. To further clarify these dimensions, we present a series of definitions. If you’re pressed for time and feel you have a pretty good handle on the characteristics of your problem, you might skim through these definitions and go to the section on Oversaturation Problem Characterization and System Dynamics.
The terms “scenario” and “situation” will be used interchangeably to describe the combination of spatial and temporal traffic conditions that describe the oversaturated traffic control problem. A strategy is a specific component or combination of traffic control actions applied to mitigate the symptoms of a scenario. We will assume that the reader has an understanding of general North American traffic engineering terminology (cycle, split, offset, sequence, rings, movements, etc.) and will use these terms without definition. A glossary of terms is provided in Appendix A.
Definitions As part of the research project that led to this guide, a survey of expert practitioners was conducted. This survey produced a range of definitions for the concept of “oversaturation”. All of the offered definitions considered that oversaturation is directly related to both the traffic demand exceeding the capacity of the intersection and the traffic control strategy in place. From these offered suggestions, and our own experience, we settled on a definition of oversaturation which we tried to identify as the most basic “building block” definition. From this basic definition, further definitions will be presented.
First, we assert that the traffic movement is the lowest level building block of traffic control and operations at an intersection. Movements can have green time specifically allocated to them, such as in the case of a protected left turn. Movements can also be grouped together into phases for the purpose of allocation of green time, or movements can borrow green time from other movements or phases by using overlaps. Thus, we define:
A traffic movement is oversaturated when the traffic demand for the movement exceeds the
Application of Traffic Control Strategies for Mitigation of Oversaturated Conditions Page 14

green-time capacity such that a queue that exists at the beginning of the green time is not fully dissipated at the end of the green time for that movement.
This basic definition of oversaturation does not immediately imply that a change in traffic control strategy is necessary or that any action is required at all. It simply describes the condition at its lowest common denominator in the context of traffic signal control. An example of this basic scenario is shown below in Figure 3. The example on the left shows a queue of vehicles waiting to turn left at an intersection. Vehicles intending to turn left have been shown in green color. A “subject vehicle” is marked in the queue for reference. The illustration on the right then shows the resulting traffic condition after the left-turn green time has elapsed. The “subject vehicle” is highlighted as having made some progress towards the stop bar of the left turn bay, but did not proceed through the intersection on the green light. This illustrates the concept of an oversaturated movement at an intersection.
An overflow queue is defined as a minimum of one vehicle that is left over from a queue that could not be fully discharged during the previous green phase.
Common sense dictates that a scenario where a queue of vehicles is dispersed and one or two vehicles are remaining after the termination of the green time is probably not a serious issue to address with alternative traffic control strategies, at least if it only lasts for one or two cycles. However, from general queuing theory we know that a sustained arrival rate (traffic demand) that exceeds the service rate (green time) of any process will result in queues that grow without bound until the arrival rate is reduced. This can occur naturally as fewer vehicles arrive or the arriving traffic begins taking alternate routes because of the downstream congestion.
Application of Traffic Control Strategies for Mitigation of Oversaturated Conditions Page 15
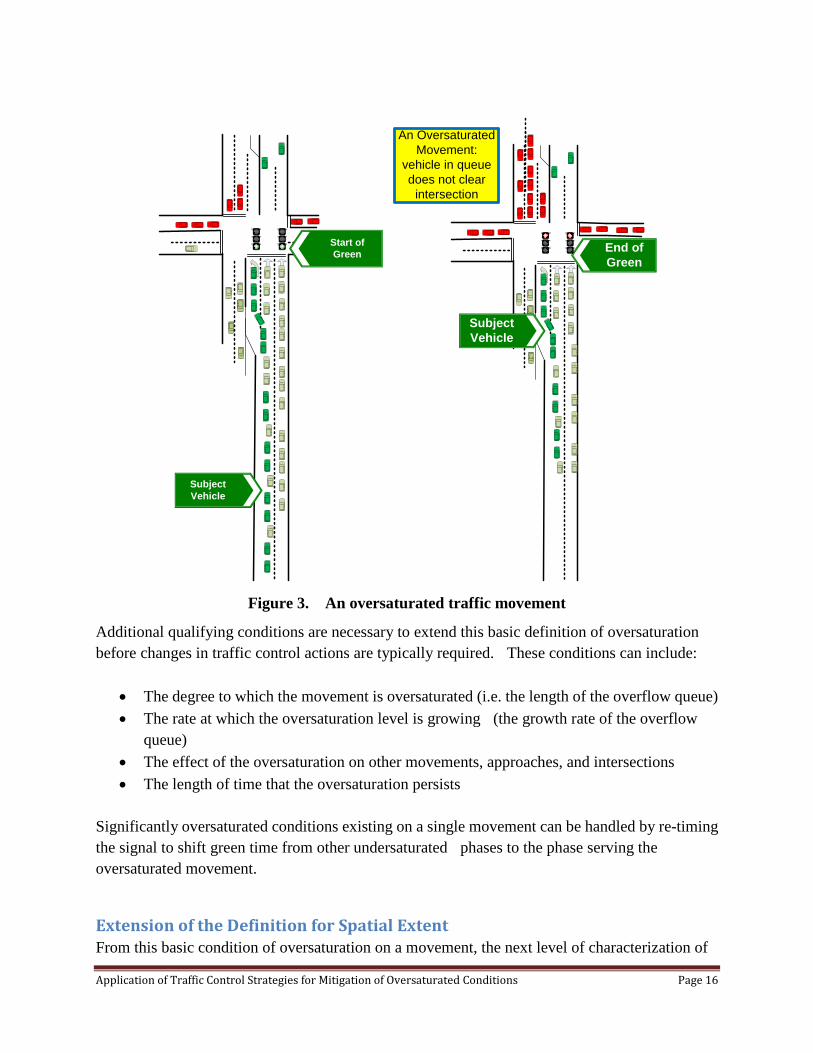
Figure 3. An oversaturated traffic movement
Additional qualifying conditions are necessary to extend this basic definition of oversaturation before changes in traffic control actions are typically required. These conditions can include:
• The degree to which the movement is oversaturated (i.e. the length of the overflow queue)• The rate at which the oversaturation level is growing (the growth rate of the overflow
queue)• The effect of the oversaturation on other movements, approaches, and intersections• The length of time that the oversaturation persists
Significantly oversaturated conditions existing on a single movement can be handled by re-timing the signal to shift green time from other undersaturated phases to the phase serving the oversaturated movement.
Extension of the Definition for Spatial Extent From this basic condition of oversaturation on a movement, the next level of characterization of
Subject Vehicle
Start of Green
Subject Vehicle
End of Green
An Oversaturated Movement:
vehicle in queue does not clear
intersection
Application of Traffic Control Strategies for Mitigation of Oversaturated Conditions Page 16

oversaturation is oversaturation on an approach to an intersection. An approach is defined as a combination of compatible traffic movements that serve traffic in the same direction of travel. A traffic movement is compatible with another movement if they do not inherently conflict (i.e. they could be served by the same traffic phase).
An approach is oversaturated if all movements of the approach are oversaturated or if an oversaturated movement causes “detrimental effects” to one or more of the other movements served by the approach.
Figure 4. An oversaturated approach for both through and LT movements
Figure 4 illustrates the case where both the through movement and the left-turn movement are oversaturated. The “subject vehicle” tags in the figure, for both movements, indicate that both movements are oversaturated since neither vehicle proceeds through the intersection during the green signal. For the purpose of this illustration, and the definition, it is not necessary that both movements are served by one traffic phase or separately by two phases. The oversaturation is defined on the “approach”.
Subject Vehicle
Start of Green
SubjectVehicle
Subject Vehicle
End of Green
An Oversaturated Approach: vehicles in queues of multiple
movements do not clear
Subject vehicle
Application of Traffic Control Strategies for Mitigation of Oversaturated Conditions Page 17

Detrimental Effects A detrimental effect or a symptom is a situation where the oversaturation on one movement causes reduction in the ability of traffic on a compatible movement (or any other movement, in the general sense) to utilize all of the green time allocated for that movement due to starvation or blocking. Starvation is the condition where the light is green
Figure 5 illustrates the condition where the oversaturated condition on the left-turn movement creates starvation for the through movement because the vehicles that intend to turn left have blocked the ability of the through vehicles to proceed to the stop line. Thus, perhaps if the left-turning movement was not oversaturated, the through movement would not have been impeded and the green time might have been adequate to satisfy the through demand.
Figure 5. Illustration of oversaturated approach due to starvation
A traffic control phase would be considered oversaturated if all movements that are served by the phase are oversaturated. Oversaturated conditions that exist on single approaches or single phases can typically be addressed with re-allocation of green time from other undersaturated
Subject Vehicle
Start of Green
Subject Vehicle
End of Green
An Oversaturated Approach: vehicles
in queue for one movement blocks/
starves others (detrimental effects)
Starvation due to
blocking
Application of Traffic Control Strategies for Mitigation of Oversaturated Conditions Page 18
phases or by changes to the phase sequence. Once the oversaturated condition grows to extend past a single movement or approach, the problem trade-offs become more challenging.
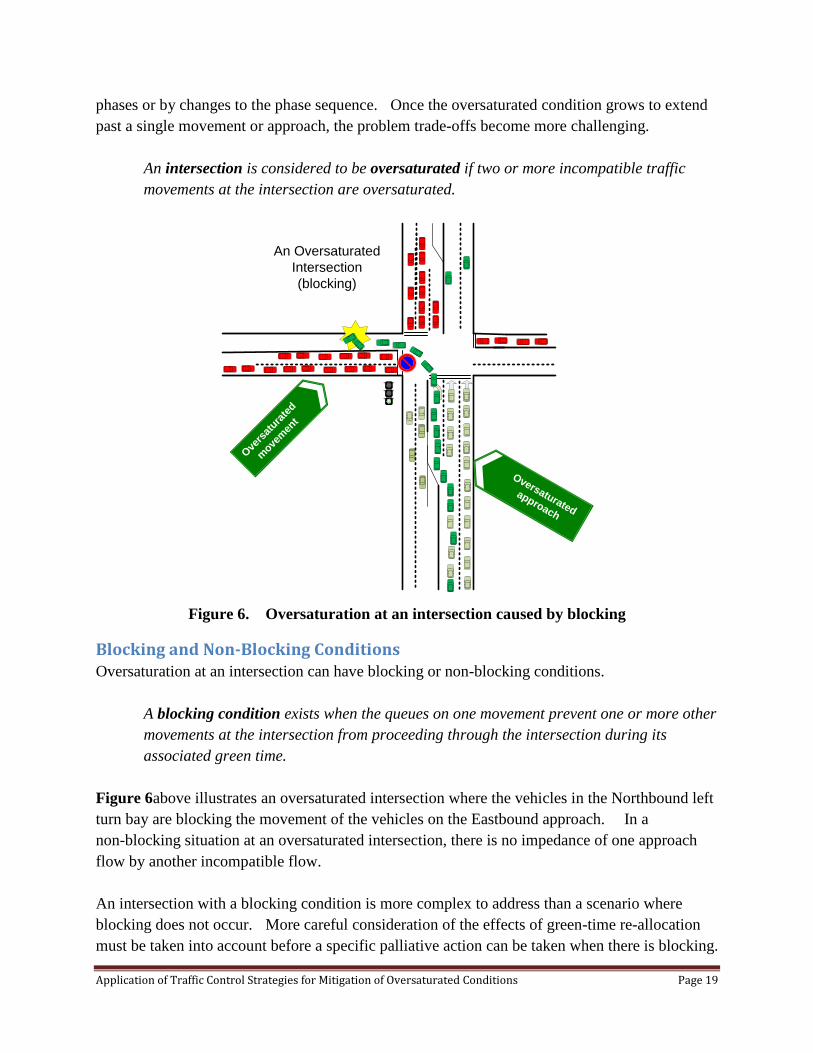
An intersection is considered to be oversaturated if two or more incompatible traffic movements at the intersection are oversaturated.
Figure 6. Oversaturation at an intersection caused by blocking
Blocking and Non-Blocking Conditions Oversaturation at an intersection can have blocking or non-blocking conditions.
A blocking condition exists when the queues on one movement prevent one or more other movements at the intersection from proceeding through the intersection during its associated green time.
Figure 6above illustrates an oversaturated intersection where the vehicles in the Northbound left turn bay are blocking the movement of the vehicles on the Eastbound approach. In a non-blocking situation at an oversaturated intersection, there is no impedance of one approach flow by another incompatible flow.
An intersection with a blocking condition is more complex to address than a scenario where blocking does not occur. More careful consideration of the effects of green-time re-allocation must be taken into account before a specific palliative action can be taken when there is blocking.
Overs
atura
ted
move
men
t
Oversaturated
approach
An Oversaturated Intersection(blocking)
Application of Traffic Control Strategies for Mitigation of Oversaturated Conditions Page 19

In most locales, blocking the intersection is illegal and most drivers will comply with these common sense rules.
Oversaturation on a Route A route is a useful building-block definition to identify oversaturation problems that are larger than an individual intersection. The term “route” is not meant to construe an origin-destination pair or any considerable distance from the beginning point to the ending point. Figure 7illustrates an oversaturated route comprised of a Northbound through movement (intersection GF) a Northbound left turn movement (intersection FB), and then an Eastbound through movement (intersection B). These three movements comprise an oversaturated route when they are oversaturated at the same time. Oversaturation on a route can also be a source of blocking conditions at intersections.
A “route” is considered to be oversaturated if two or more compatible movements on a single travel path through a series of intersections simultaneously have oversaturated conditions.
Figure 7. Oversaturated Condition on a Route
OversaturatedRoute
F
GC
B
Application of Traffic Control Strategies for Mitigation of Oversaturated Conditions Page 20
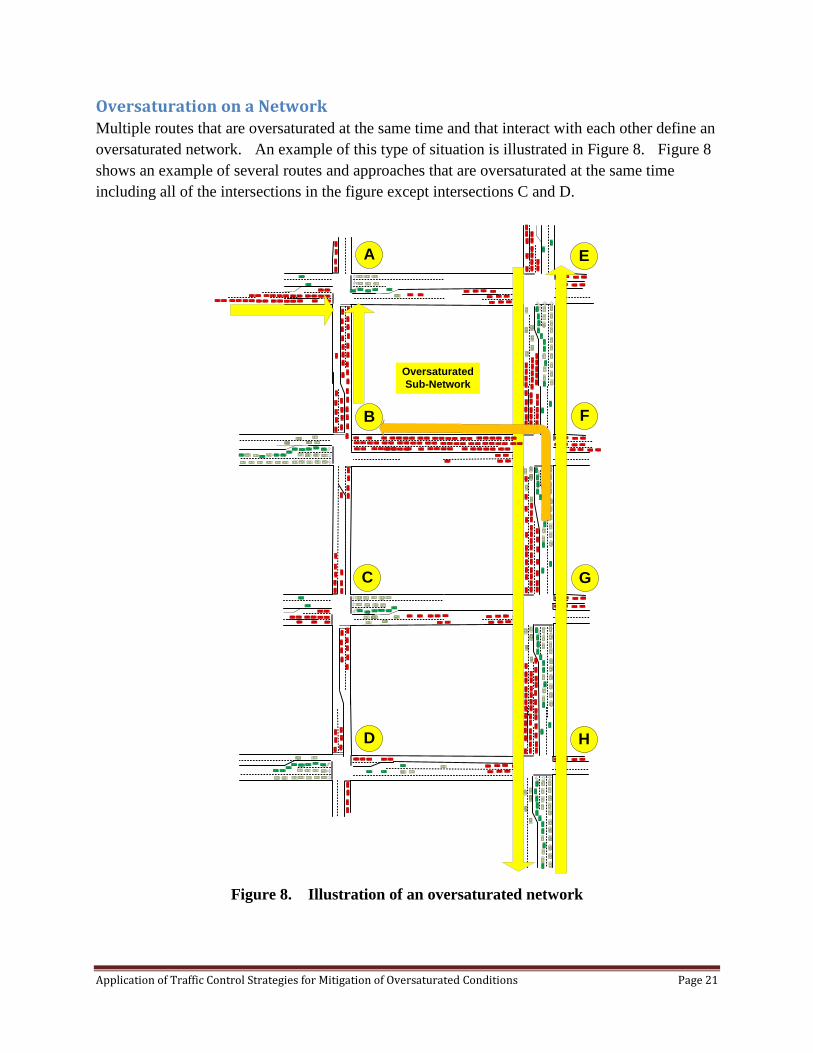
Oversaturation on a Network Multiple routes that are oversaturated at the same time and that interact with each other define an oversaturated network. An example of this type of situation is illustrated in Figure 8. Figure 8 shows an example of several routes and approaches that are oversaturated at the same time including all of the intersections in the figure except intersections C and D.
Figure 8. Illustration of an oversaturated network
OversaturatedSub-Network
F
H
G
E
D
C
B
A
Application of Traffic Control Strategies for Mitigation of Oversaturated Conditions Page 21

Special Cases of Network Oversaturation Several special cases of oversaturated scenarios on networks can be defined. Two examples are freeway-arterial diamond interchanges and arterials with heavy traffic on the arterial and minor flows on side streets. These special cases as listed in Table 2.
Table 2. Special Cases of Network Oversaturation
Special Case Description Two-way arterial Two or more consecutive approaches in both travel directions that are
simultaneously oversaturated.
Interchange Two or more oversaturated routes at the junction of an arterial and a freeway.
Grid Two or more oversaturated routes that intersect each other on roads that are typically described by a group of intersections on parallel streets that have intersecting roads crossing perpendicularly through all of the parallel streets at regular spacing between each intersection in both parallel and perpendicular directions. Neither regular spacing nor perpendicular intersection angles are necessary, but the oversaturated condition must occur on (a) a minimum of two approaches in (roughly) parallel travel directions on different roads and (b) a minimum of three intersections are included in the conflicting oversaturated routes.
Figure 9 illustrates the special case of a oversaturated condition on a two-way arterial. In this example, both directions of North and South travel are oversaturated with traffic at the same time along the route from EFGH and from HGFE.
Oversaturated conditions existing on routes and networks are complex problems requiring careful consideration of green-time re-allocation, sequence, offsets, and cycle selection.
Application of Traffic Control Strategies for Mitigation of Oversaturated Conditions Page 22
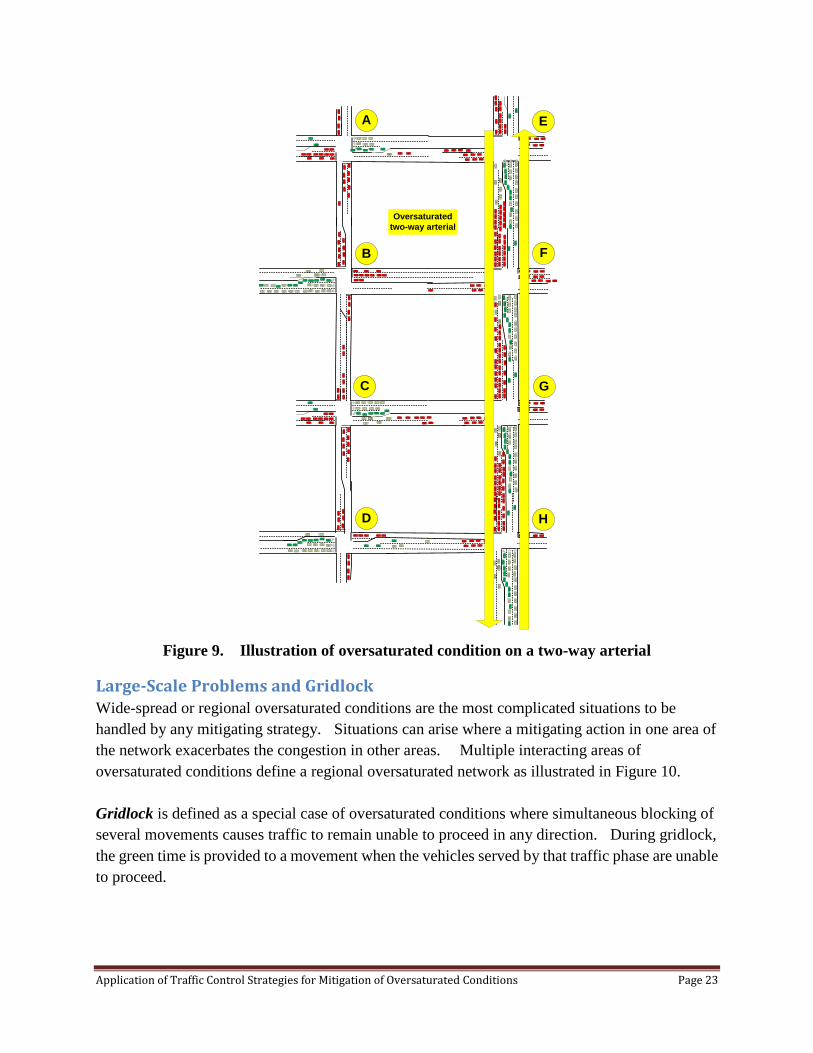
Figure 9. Illustration of oversaturated condition on a two-way arterial
Large-Scale Problems and Gridlock Wide-spread or regional oversaturated conditions are the most complicated situations to be handled by any mitigating strategy. Situations can arise where a mitigating action in one area of the network exacerbates the congestion in other areas. Multiple interacting areas of oversaturated conditions define a regional oversaturated network as illustrated in Figure 10.
Gridlock is defined as a special case of oversaturated conditions where simultaneous blocking of several movements causes traffic to remain unable to proceed in any direction. During gridlock, the green time is provided to a movement when the vehicles served by that traffic phase are unable to proceed.
Oversaturated two-way arterial
F
H
G
E
D
C
B
A
Application of Traffic Control Strategies for Mitigation of Oversaturated Conditions Page 23
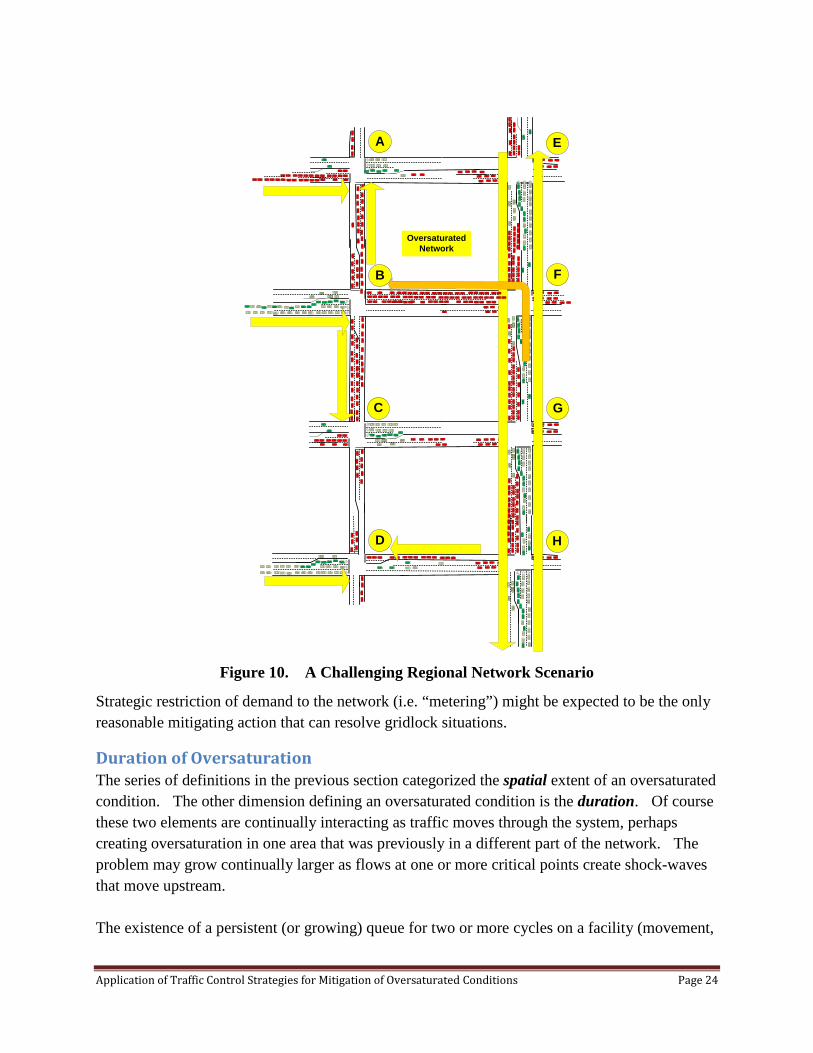
Figure 10. A Challenging Regional Network Scenario
Strategic restriction of demand to the network (i.e. “metering”) might be expected to be the only reasonable mitigating action that can resolve gridlock situations.
Duration of Oversaturation The series of definitions in the previous section categorized the spatial extent of an oversaturated condition. The other dimension defining an oversaturated condition is the duration. Of course these two elements are continually interacting as traffic moves through the system, perhaps creating oversaturation in one area that was previously in a different part of the network. The problem may grow continually larger as flows at one or more critical points create shock-waves that move upstream.
The existence of a persistent (or growing) queue for two or more cycles on a facility (movement,
OversaturatedNetwork
F
H
G
E
D
C
B
A
Application of Traffic Control Strategies for Mitigation of Oversaturated Conditions Page 24
approach, intersection, etc.) defines an oversaturated condition. This is a minimum level of occurrence that provides the definition. As the condition persists for more cycles continuously the condition would be considered to be more and more severe when combined with the severity level presented by the length of the persistent queue with respect to the storage area for the movement or approach. An oversaturated condition is thus considered to be dissipated when a queue that was persistent from the previous cycle is cleared during the following green time.
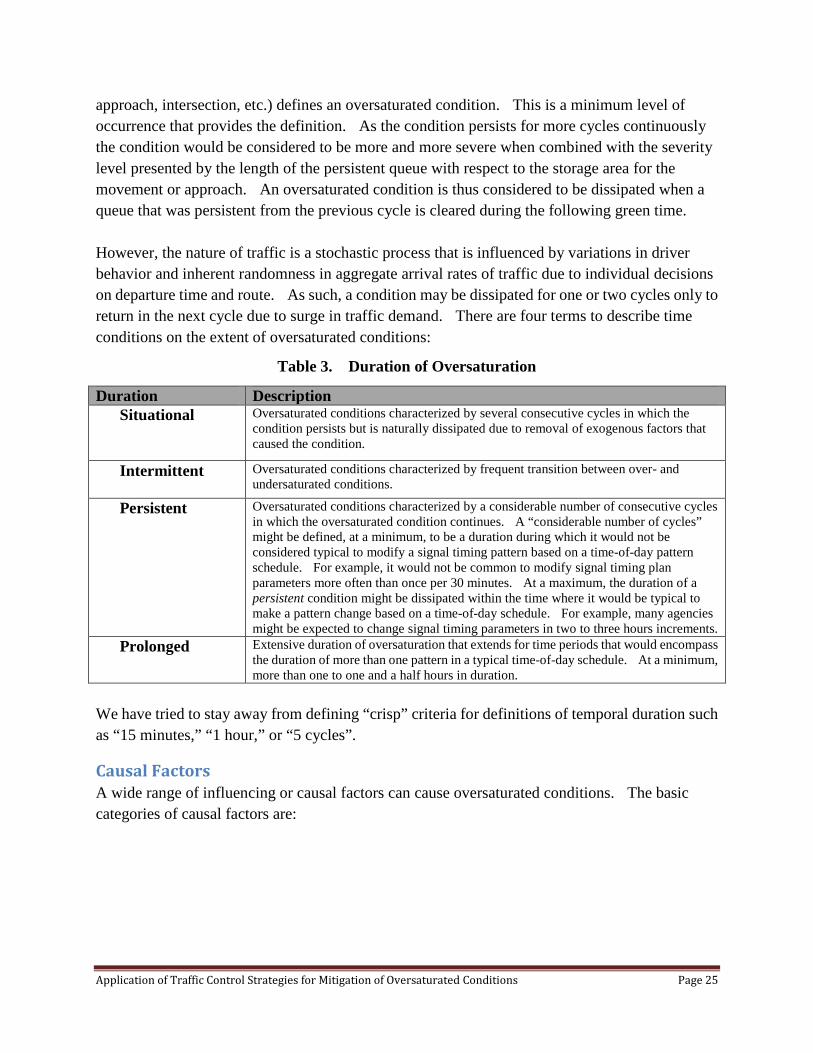
However, the nature of traffic is a stochastic process that is influenced by variations in driver behavior and inherent randomness in aggregate arrival rates of traffic due to individual decisions on departure time and route. As such, a condition may be dissipated for one or two cycles only to return in the next cycle due to surge in traffic demand. There are four terms to describe time conditions on the extent of oversaturated conditions:
Table 3. Duration of Oversaturation
Duration Description Situational Oversaturated conditions characterized by several consecutive cycles in which the
condition persists but is naturally dissipated due to removal of exogenous factors that caused the condition.
Intermittent Oversaturated conditions characterized by frequent transition between over- and undersaturated conditions.
Persistent Oversaturated conditions characterized by a considerable number of consecutive cycles in which the oversaturated condition continues. A “considerable number of cycles” might be defined, at a minimum, to be a duration during which it would not be considered typical to modify a signal timing pattern based on a time-of-day pattern schedule. For example, it would not be common to modify signal timing plan parameters more often than once per 30 minutes. At a maximum, the duration of a persistent condition might be dissipated within the time where it would be typical to make a pattern change based on a time-of-day schedule. For example, many agencies might be expected to change signal timing parameters in two to three hours increments.
Prolonged Extensive duration of oversaturation that extends for time periods that would encompass the duration of more than one pattern in a typical time-of-day schedule. At a minimum, more than one to one and a half hours in duration.
We have tried to stay away from defining “crisp” criteria for definitions of temporal duration such as “15 minutes,” “1 hour,” or “5 cycles”.
Causal Factors A wide range of influencing or causal factors can cause oversaturated conditions. The basic categories of causal factors are:
Application of Traffic Control Strategies for Mitigation of Oversaturated Conditions Page 25
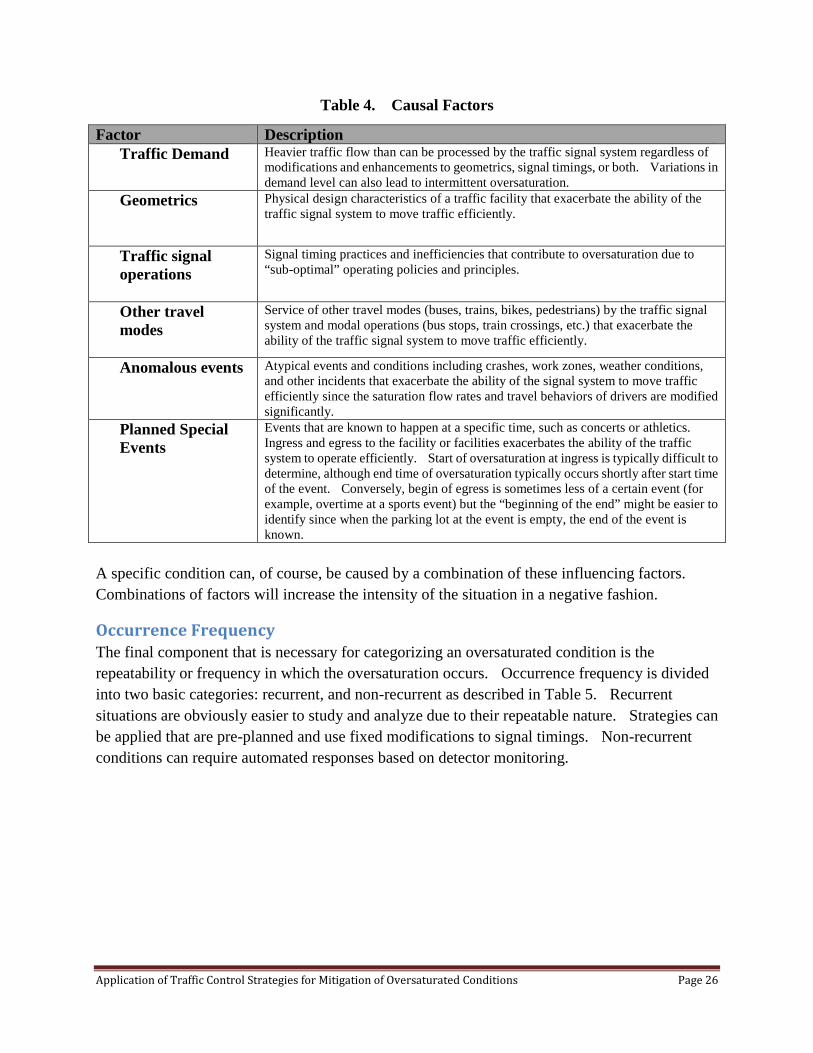
Table 4. Causal Factors
Factor Description Traffic Demand Heavier traffic flow than can be processed by the traffic signal system regardless of
modifications and enhancements to geometrics, signal timings, or both. Variations in demand level can also lead to intermittent oversaturation.
Geometrics Physical design characteristics of a traffic facility that exacerbate the ability of the traffic signal system to move traffic efficiently.
Traffic signal operations
Signal timing practices and inefficiencies that contribute to oversaturation due to “sub-optimal” operating policies and principles.
Other travel modes
Service of other travel modes (buses, trains, bikes, pedestrians) by the traffic signal system and modal operations (bus stops, train crossings, etc.) that exacerbate the ability of the traffic signal system to move traffic efficiently.
Anomalous events Atypical events and conditions including crashes, work zones, weather conditions,and other incidents that exacerbate the ability of the signal system to move traffic efficiently since the saturation flow rates and travel behaviors of drivers are modified significantly.
Planned Special Events
Events that are known to happen at a specific time, such as concerts or athletics. Ingress and egress to the facility or facilities exacerbates the ability of the traffic system to operate efficiently. Start of oversaturation at ingress is typically difficult to determine, although end time of oversaturation typically occurs shortly after start time of the event. Conversely, begin of egress is sometimes less of a certain event (for example, overtime at a sports event) but the “beginning of the end” might be easier to identify since when the parking lot at the event is empty, the end of the event is known.
A specific condition can, of course, be caused by a combination of these influencing factors. Combinations of factors will increase the intensity of the situation in a negative fashion.
Occurrence Frequency The final component that is necessary for categorizing an oversaturated condition is the repeatability or frequency in which the oversaturation occurs. Occurrence frequency is divided into two basic categories: recurrent, and non-recurrent as described in Table 5. Recurrent situations are obviously easier to study and analyze due to their repeatable nature. Strategies can be applied that are pre-planned and use fixed modifications to signal timings. Non-recurrent conditions can require automated responses based on detector monitoring.
Application of Traffic Control Strategies for Mitigation of Oversaturated Conditions Page 26
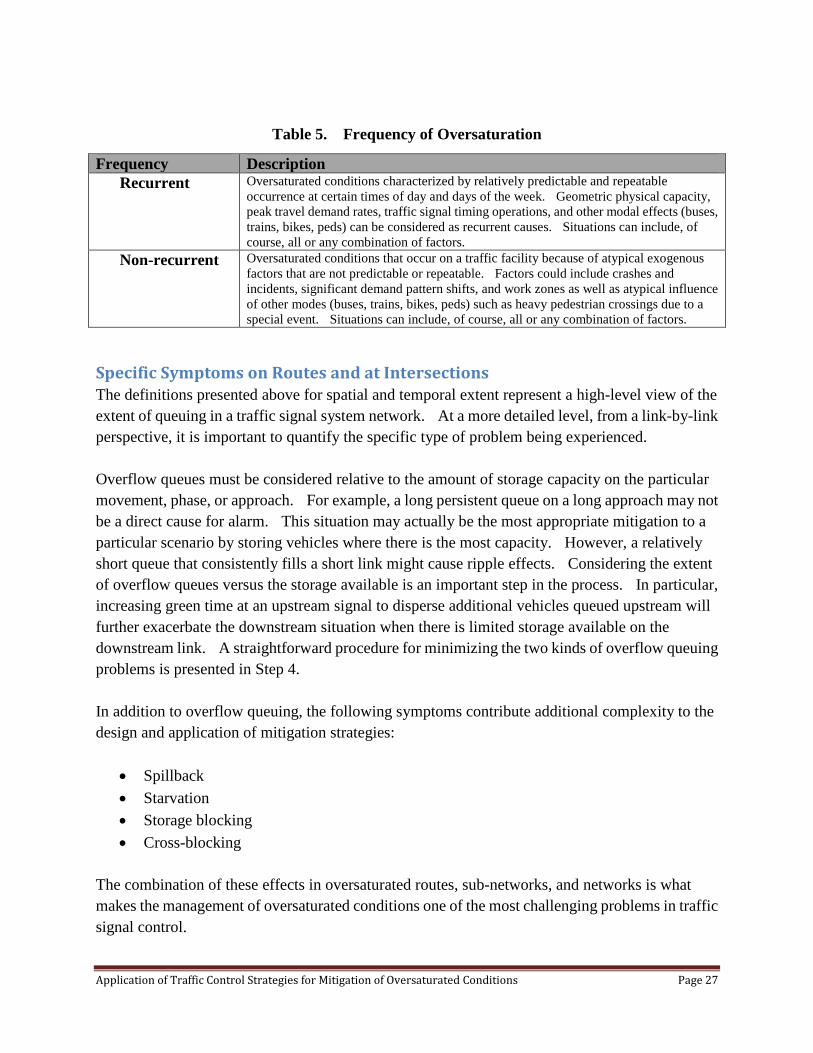
Table 5. Frequency of Oversaturation
Frequency Description Recurrent Oversaturated conditions characterized by relatively predictable and repeatable
occurrence at certain times of day and days of the week. Geometric physical capacity, peak travel demand rates, traffic signal timing operations, and other modal effects (buses, trains, bikes, peds) can be considered as recurrent causes. Situations can include, of course, all or any combination of factors.
Non-recurrent Oversaturated conditions that occur on a traffic facility because of atypical exogenousfactors that are not predictable or repeatable. Factors could include crashes and incidents, significant demand pattern shifts, and work zones as well as atypical influence of other modes (buses, trains, bikes, peds) such as heavy pedestrian crossings due to a special event. Situations can include, of course, all or any combination of factors.
Specific Symptoms on Routes and at Intersections The definitions presented above for spatial and temporal extent represent a high-level view of the extent of queuing in a traffic signal system network. At a more detailed level, from a link-by-link perspective, it is important to quantify the specific type of problem being experienced.
Overflow queues must be considered relative to the amount of storage capacity on the particular movement, phase, or approach. For example, a long persistent queue on a long approach may not be a direct cause for alarm. This situation may actually be the most appropriate mitigation to a particular scenario by storing vehicles where there is the most capacity. However, a relatively short queue that consistently fills a short link might cause ripple effects. Considering the extent of overflow queues versus the storage available is an important step in the process. In particular, increasing green time at an upstream signal to disperse additional vehicles queued upstream will further exacerbate the downstream situation when there is limited storage available on the downstream link. A straightforward procedure for minimizing the two kinds of overflow queuing problems is presented in Step 4.
In addition to overflow queuing, the following symptoms contribute additional complexity to the design and application of mitigation strategies:
• Spillback• Starvation• Storage blocking• Cross-blocking
The combination of these effects in oversaturated routes, sub-networks, and networks is what makes the management of oversaturated conditions one of the most challenging problems in traffic signal control.
Application of Traffic Control Strategies for Mitigation of Oversaturated Conditions Page 27
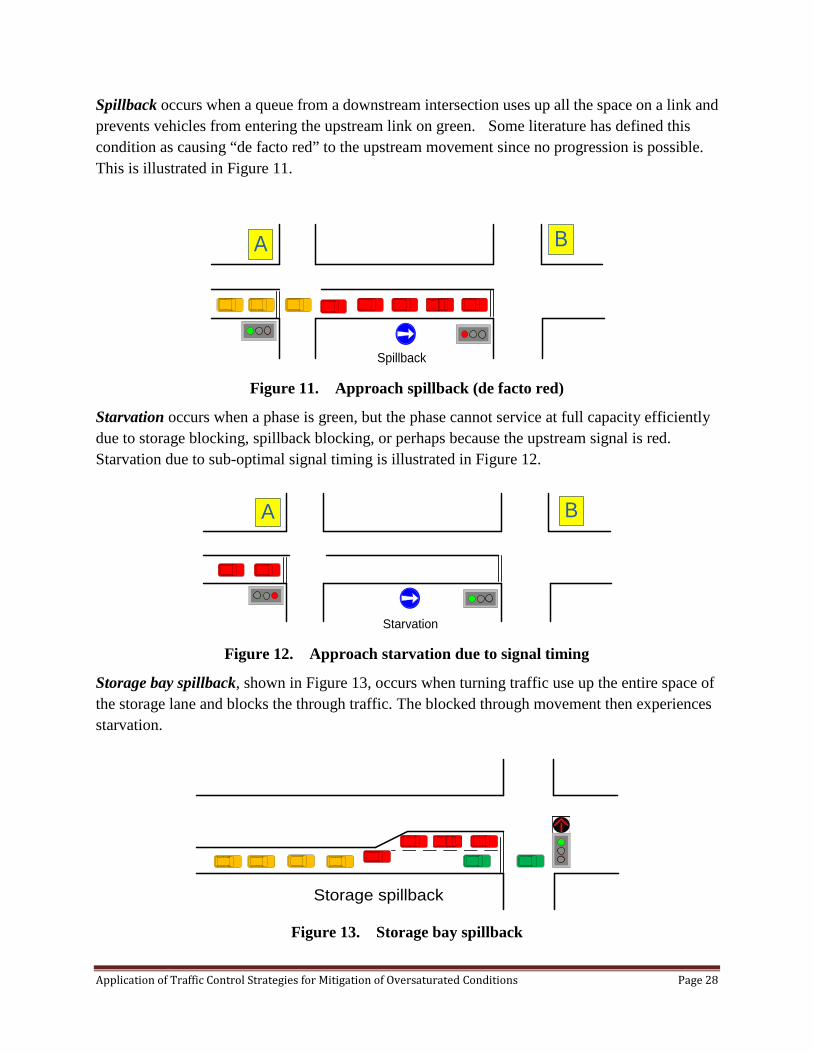
Spillback occurs when a queue from a downstream intersection uses up all the space on a link and prevents vehicles from entering the upstream link on green. Some literature has defined this condition as causing “de facto red” to the upstream movement since no progression is possible. This is illustrated in Figure 11.
Figure 11. Approach spillback (de facto red)
Starvation occurs when a phase is green, but the phase cannot service at full capacity efficiently due to storage blocking, spillback blocking, or perhaps because the upstream signal is red. Starvation due to sub-optimal signal timing is illustrated in Figure 12.
Figure 12. Approach starvation due to signal timing
Storage bay spillback, shown in Figure 13, occurs when turning traffic use up the entire space of the storage lane and blocks the through traffic. The blocked through movement then experiences starvation.
Figure 13. Storage bay spillback
Spillback
BA
Starvation
BA
Storage spillback
Application of Traffic Control Strategies for Mitigation of Oversaturated Conditions Page 28
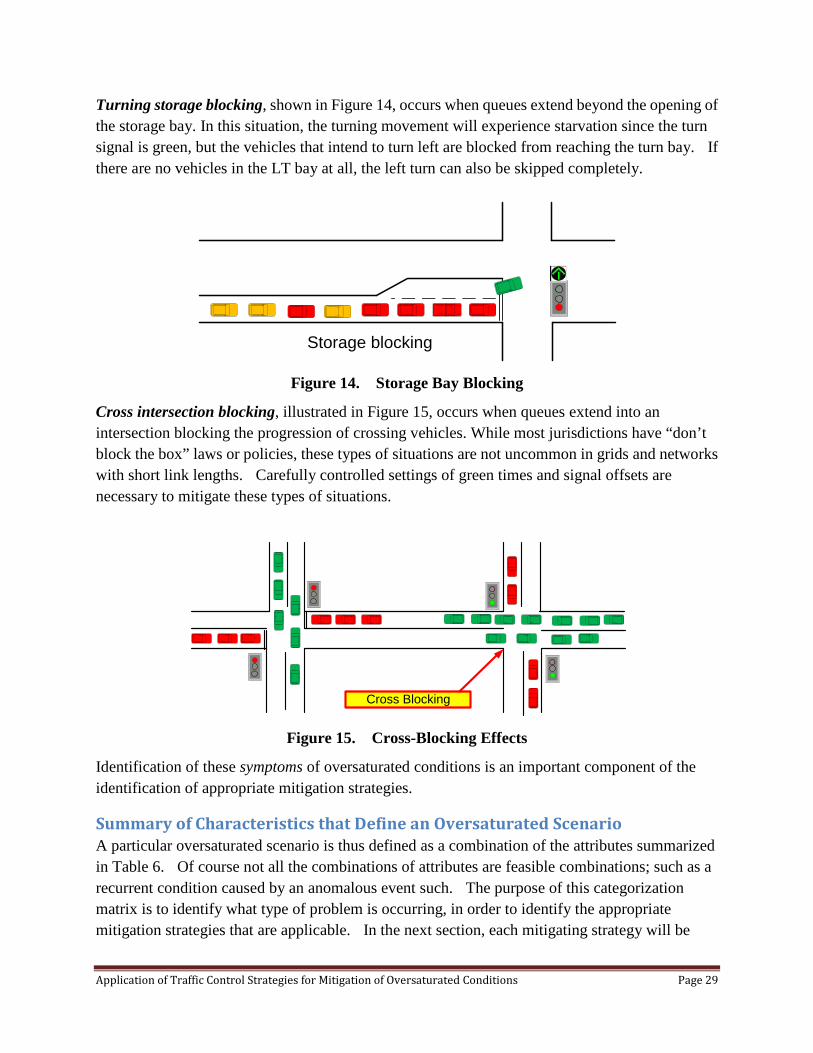
Turning storage blocking, shown in Figure 14, occurs when queues extend beyond the opening of the storage bay. In this situation, the turning movement will experience starvation since the turn signal is green, but the vehicles that intend to turn left are blocked from reaching the turn bay. If there are no vehicles in the LT bay at all, the left turn can also be skipped completely.
Figure 14. Storage Bay Blocking
Cross intersection blocking, illustrated in Figure 15, occurs when queues extend into an intersection blocking the progression of crossing vehicles. While most jurisdictions have “don’t block the box” laws or policies, these types of situations are not uncommon in grids and networks with short link lengths. Carefully controlled settings of green times and signal offsets are necessary to mitigate these types of situations.
Figure 15. Cross-Blocking Effects
Identification of these symptoms of oversaturated conditions is an important component of the identification of appropriate mitigation strategies.
Summary of Characteristics that Define an Oversaturated Scenario A particular oversaturated scenario is thus defined as a combination of the attributes summarized in Table 6. Of course not all the combinations of attributes are feasible combinations; such as a recurrent condition caused by an anomalous event such. The purpose of this categorization matrix is to identify what type of problem is occurring, in order to identify the appropriate mitigation strategies that are applicable. In the next section, each mitigating strategy will be
Storage blocking
Cross Blocking
Application of Traffic Control Strategies for Mitigation of Oversaturated Conditions Page 29

categorized according to which elements in Table 5 are applicable to that strategy.
Table 6. Summary of Characteristics of Oversaturated Scenario
Oversaturation Problem Characterization and System Dynamics Oversaturated conditions might be characterized as being both easy and hard to identify. A motorist that takes a specific route on a daily basis might easily predict where the oversaturated links will occur on her route, and certainly knows almost instinctively when the conditions on certain parts of their route are more heavily congested than normal. Similarly, with extended experience in a particular agency and location, traffic engineers become accustomed to the trouble areas of their jurisdiction and this is not only contained to situations that are recurrent. Special event patterns and intermittent situations (such as those created by bus or train schedules) can certainly be identified.
In any case, the first step to characterization is observation and identifying which type of scenario is being experienced. In many situations, with good local knowledge or limited problem extent, it is straightforward to identify the elements in each column of the table. In other more complex situations it will be important to collect data in the field and analyze how the data helps to identify the appropriate element in each column of Table 6.
As part of the scenario definition you will need to define what is “in” the system and what is not “in” the system. This is a subjective decision. A rule of thumb might be to certainly include intersections that are affected by the oversaturation at some point during the scenario, but no more. Certain mitigation strategies such as gating will necessarily involve approaches becoming
Extent Duration Causation Recurrence Symptoms
Movement Situational Signal Timing Recurrent Starvation
Approach Intermittent Geometrics Non-recurrent Spillback
Intersection Persistent Other modes StorageBlocking
Route Prolonged Demand Cross Blocking
One-wayarterial
UnplannedEvents
Two-way arterial
Planned Events
Interchange
Grid
Network
Application of Traffic Control Strategies for Mitigation of Oversaturated Conditions Page 30
oversaturated that were not initially oversaturated for the explicit purpose of alleviating downstream conditions.
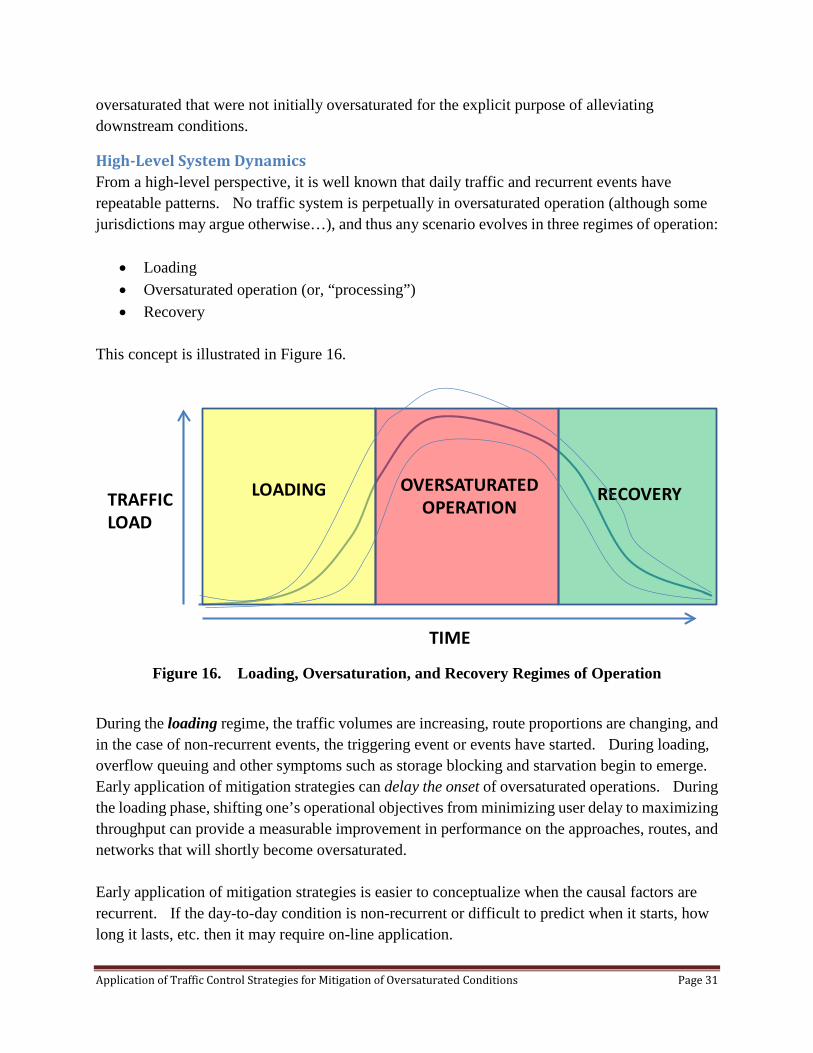
High-Level System Dynamics From a high-level perspective, it is well known that daily traffic and recurrent events have repeatable patterns. No traffic system is perpetually in oversaturated operation (although some jurisdictions may argue otherwise…), and thus any scenario evolves in three regimes of operation:
• Loading• Oversaturated operation (or, “processing”)• Recovery
This concept is illustrated in Figure 16.
Figure 16. Loading, Oversaturation, and Recovery Regimes of Operation
During the loading regime, the traffic volumes are increasing, route proportions are changing, and in the case of non-recurrent events, the triggering event or events have started. During loading, overflow queuing and other symptoms such as storage blocking and starvation begin to emerge. Early application of mitigation strategies can delay the onset of oversaturated operations. During the loading phase, shifting one’s operational objectives from minimizing user delay to maximizing throughput can provide a measurable improvement in performance on the approaches, routes, and networks that will shortly become oversaturated.
Early application of mitigation strategies is easier to conceptualize when the causal factors are recurrent. If the day-to-day condition is non-recurrent or difficult to predict when it starts, how long it lasts, etc. then it may require on-line application.
LOADING OVERSATURATEDOPERATION
RECOVERY
TIME
TRAFFICLOAD
Application of Traffic Control Strategies for Mitigation of Oversaturated Conditions Page 31

During the oversaturated operation regime, the traffic volumes and route proportions are such that queues and congestion are not going to be dissipated until either (a) the traffic volumes are reduced, (b) the route proportions are changed (i.e. drivers’ avoid the area, adjust their routes, decide to travel later, etc.) or (c) both. This is the operational situation that many practitioners might characterize as “there is nothing that can be done”. We disagree that this is the case for all situations, but it is true that it is difficult to discern the difference between different mitigation strategies when the overflow queuing and downstream blockages hinder the ability of traffic to be moved (anywhere). Applying queue management approaches (e.g. decreasing green time or truncating phases when a downstream link is blocked) can provide enhanced service to non-saturated movements and approaches that can increase total system throughput. Mitigation strategies applied during this phase also serve to help the system return to steady-state operation sooner during the recovery phase than continuing to apply the “normal” operational strategies.
During the recovery regime, traffic volumes, route proportions or restrictive downstream capacity (e.g. clearance of crash, opening of additional toll booths, removal of construction, reduction in traffic flow) have been adjusted so that the overflow queues begin to dissipate. In this phase of operation, mitigation strategies are especially effective in returning the system to steady state sooner than continuing to apply the “normal” operational strategies.
Operational System Dynamics In addition to considering the general existence of the loading, oversaturated operation, and recovery regimes of a scenario, it is also helpful to consider the specific dynamic evolution of the queuing and symptoms (blocking, starvation, etc.) of the scenario. Motivated by one of the NCDOT examples cited in (Denney, et al, 2008) we colloquially denote this process as “making a dynamic map”. The concept of the dynamic map captures both the spatial and temporal aspects of the oversaturated scenario in illustrating how large the problem gets and how it evolves over time; how the congestion shifts from one area of the network to another, and how long the problem lasts and dissipates.
The “dynamic map” characterizes:
1. Identification of where the root cause or causes of the congestion are located2. How the oversaturated conditions grow to extend further throughout the system
a. Over spaceb. Over timec. Identification of which symptoms occur at which locations
3. Dissipation of the oversaturationa. Over space – where the relief begins and how it continuesb. Over time – how long it takes for the system to “return to normalcy”
Application of Traffic Control Strategies for Mitigation of Oversaturated Conditions Page 32
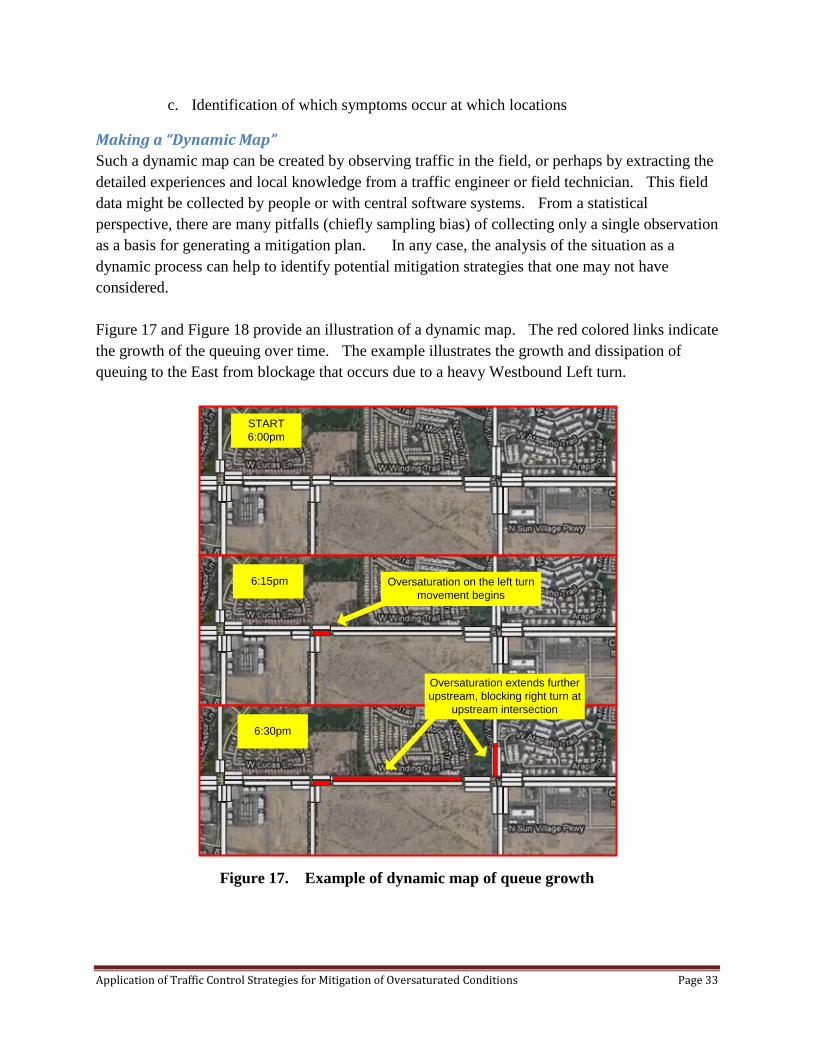
c. Identification of which symptoms occur at which locations
Making a “Dynamic Map” Such a dynamic map can be created by observing traffic in the field, or perhaps by extracting the detailed experiences and local knowledge from a traffic engineer or field technician. This field data might be collected by people or with central software systems. From a statistical perspective, there are many pitfalls (chiefly sampling bias) of collecting only a single observation as a basis for generating a mitigation plan. In any case, the analysis of the situation as a dynamic process can help to identify potential mitigation strategies that one may not have considered.
Figure 17 and Figure 18 provide an illustration of a dynamic map. The red colored links indicate the growth of the queuing over time. The example illustrates the growth and dissipation of queuing to the East from blockage that occurs due to a heavy Westbound Left turn.
Figure 17. Example of dynamic map of queue growth
START 6:00pm
6:15pm
6:30pm
Oversaturation extends further upstream, blocking right turn at
upstream intersection
Oversaturation on the left turn movement begins
Application of Traffic Control Strategies for Mitigation of Oversaturated Conditions Page 33

Figure 18. Continuation - Example of dynamic map of queue dissipation
Archived detector data (primarily occupancy) from system detectors in signal systems might be used to make such a map. Detector occupancy should be aggregated in small increments (i.e. less than five (5) minutes, or calculated on a cycle-by-cycle basis). Approximation using occupancy at point detectors is a significant limitation, but can still be used to approximate the conditions. For example, typical advance detectors can be configured as system detectors. When these detectors show high average occupancy (say, greater than 85%) for many cycles in a row, there is likely an overflow queue that is at least as long as the location of the detector. The longer this high occupancy condition persists, the longer the queue has likely grown. When this value begins to decrease, the overflow queue is being dissipated.
Measuring Length of Queue and Overflow Queuing Effects There are two primary direct measurements of oversaturation. One is the amount of green time
6:45pm
7:00pm
7:15pmOversaturation almost fully
cleared
Oversaturation begins to dissipate upstream
Oversaturation extends further upstream, affecting Westbound
and Northbound approaches
Application of Traffic Control Strategies for Mitigation of Oversaturated Conditions Page 34
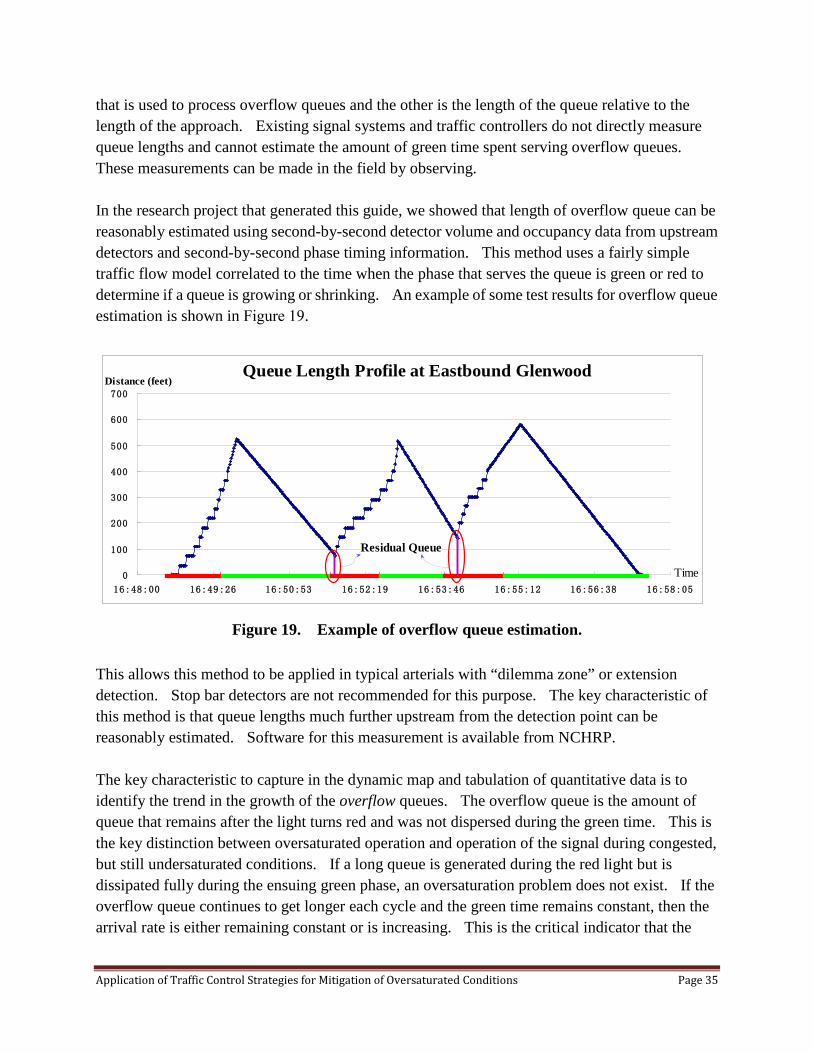
that is used to process overflow queues and the other is the length of the queue relative to the length of the approach. Existing signal systems and traffic controllers do not directly measure queue lengths and cannot estimate the amount of green time spent serving overflow queues. These measurements can be made in the field by observing.
In the research project that generated this guide, we showed that length of overflow queue can be reasonably estimated using second-by-second detector volume and occupancy data from upstream detectors and second-by-second phase timing information. This method uses a fairly simple traffic flow model correlated to the time when the phase that serves the queue is green or red to determine if a queue is growing or shrinking. An example of some test results for overflow queue estimation is shown in Figure 19.
Figure 19. Example of overflow queue estimation.
This allows this method to be applied in typical arterials with “dilemma zone” or extension detection. Stop bar detectors are not recommended for this purpose. The key characteristic of this method is that queue lengths much further upstream from the detection point can be reasonably estimated. Software for this measurement is available from NCHRP.
The key characteristic to capture in the dynamic map and tabulation of quantitative data is to identify the trend in the growth of the overflow queues. The overflow queue is the amount of queue that remains after the light turns red and was not dispersed during the green time. This is the key distinction between oversaturated operation and operation of the signal during congested, but still undersaturated conditions. If a long queue is generated during the red light but is dissipated fully during the ensuing green phase, an oversaturation problem does not exist. If the overflow queue continues to get longer each cycle and the green time remains constant, then the arrival rate is either remaining constant or is increasing. This is the critical indicator that the
Case of Oversaturation
0
100
200
300
400
500
600
700
16:48:00 16:49:26 16:50:53 16:52:19 16:53:46 16:55:12 16:56:38 16:58:05
Queue Length Profile at Eastbound GlenwoodDistance (feet)
Time
Residual Queue
Application of Traffic Control Strategies for Mitigation of Oversaturated Conditions Page 35

phase or movement is oversaturated.
Quantitative Characterization of the “Intensity” of Oversaturation The amount and cause of overflow queuing is the key distinction determining which mitigation strategies are appropriate for a given traffic scenario. If the overflow queue is created because of not enough green time, then essentially more green time is required. However if the overflow queue is created because of a downstream restriction, then more green time for this phase may only make the problem worse. Two quantitative indicators characterize overflow queuing:
• TOSI – temporal oversaturation severity index• SOSI – spatial oversaturation severity index
Detrimental effects in the temporal dimension are characterized by an overflow queue at the end of the signal cycle. These overflow vehicles, which had hoped to pass through the intersection in the current cycle, cannot be discharged due to insufficient green time. This overflow queue must now be served in the next cycle.
The amount of green time that is now used to service the overflow queue is quantified by TOSI, ranging from 0% to 100%. When TOSI = 100%, all of the green time for the phase is used to disperse the overflow queue. If the arrival rate is still constant (or even worse, increasing), the queue will continue to grow so that TOSI could conceptually be 120%, 140%, 200% and so on. The values of TOSI indicate directly how much additional green is needed to disperse the overflow queue.
Detrimental effects in the spatial dimension are characterized by the inability of upstream traffic to proceed due to blockage at the downstream intersection. In this case, vehicles are not discharged from the upstream intersection even though the signal is green. Therefore, some portion of the green time of the upstream intersection becomes “unusable”. The amount of green time that is unusable is quantified by SOSI, ranging from 0% to 100%. When SOSI = 100%, all of the green time for the phase is wasted because the vehicles cannot move downstream. Figure 20 illustrates an example case where spillover occurs at the upstream intersection and SOSI > 0 because of downstream blockage.
Application of Traffic Control Strategies for Mitigation of Oversaturated Conditions Page 36
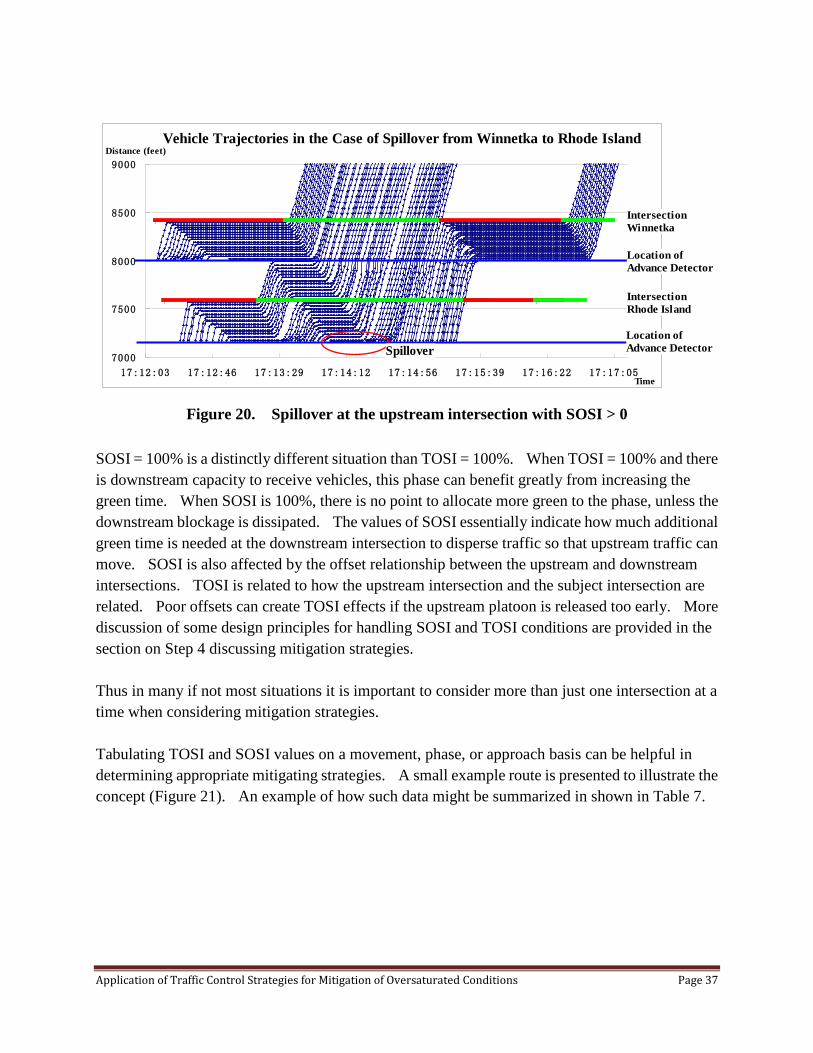
Figure 20. Spillover at the upstream intersection with SOSI > 0
SOSI = 100% is a distinctly different situation than TOSI = 100%. When TOSI = 100% and there is downstream capacity to receive vehicles, this phase can benefit greatly from increasing the green time. When SOSI is 100%, there is no point to allocate more green to the phase, unless the downstream blockage is dissipated. The values of SOSI essentially indicate how much additional green time is needed at the downstream intersection to disperse traffic so that upstream traffic can move. SOSI is also affected by the offset relationship between the upstream and downstream intersections. TOSI is related to how the upstream intersection and the subject intersection are related. Poor offsets can create TOSI effects if the upstream platoon is released too early. More discussion of some design principles for handling SOSI and TOSI conditions are provided in the section on Step 4 discussing mitigation strategies.
Thus in many if not most situations it is important to consider more than just one intersection at a time when considering mitigation strategies.
Tabulating TOSI and SOSI values on a movement, phase, or approach basis can be helpful in determining appropriate mitigating strategies. A small example route is presented to illustrate the concept (Figure 21). An example of how such data might be summarized in shown in Table 7.
Traj
7000
7500
8000
8500
9000
17:12:03 17:12:46 17:13:29 17:14:12 17:14:56 17:15:39 17:16:22 17:17:05
Distance (feet)
IntersectionWinnetka
IntersectionRhode Island
Location ofAdvance Detector
Location ofAdvance Detector
Time
Spillover
Vehicle Trajectories in the Case of Spillover from Winnetka to Rhode Island
Application of Traffic Control Strategies for Mitigation of Oversaturated Conditions Page 37
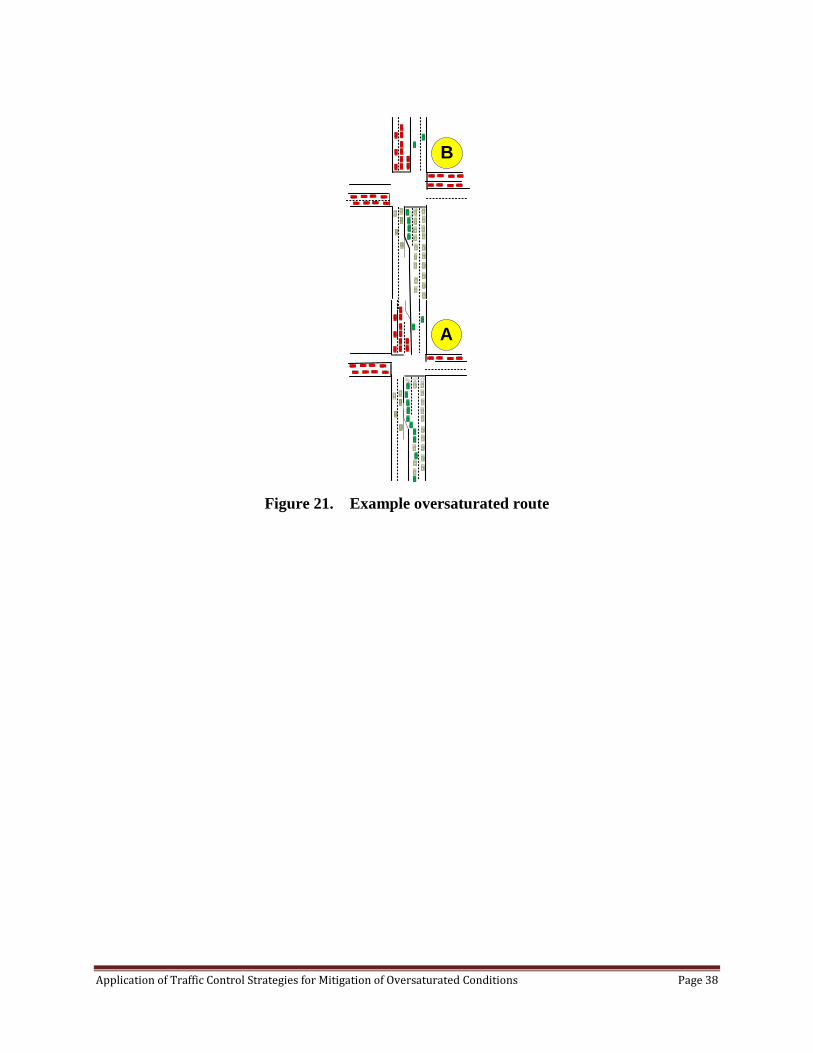
Figure 21. Example oversaturated route
A
B
Application of Traffic Control Strategies for Mitigation of Oversaturated Conditions Page 38
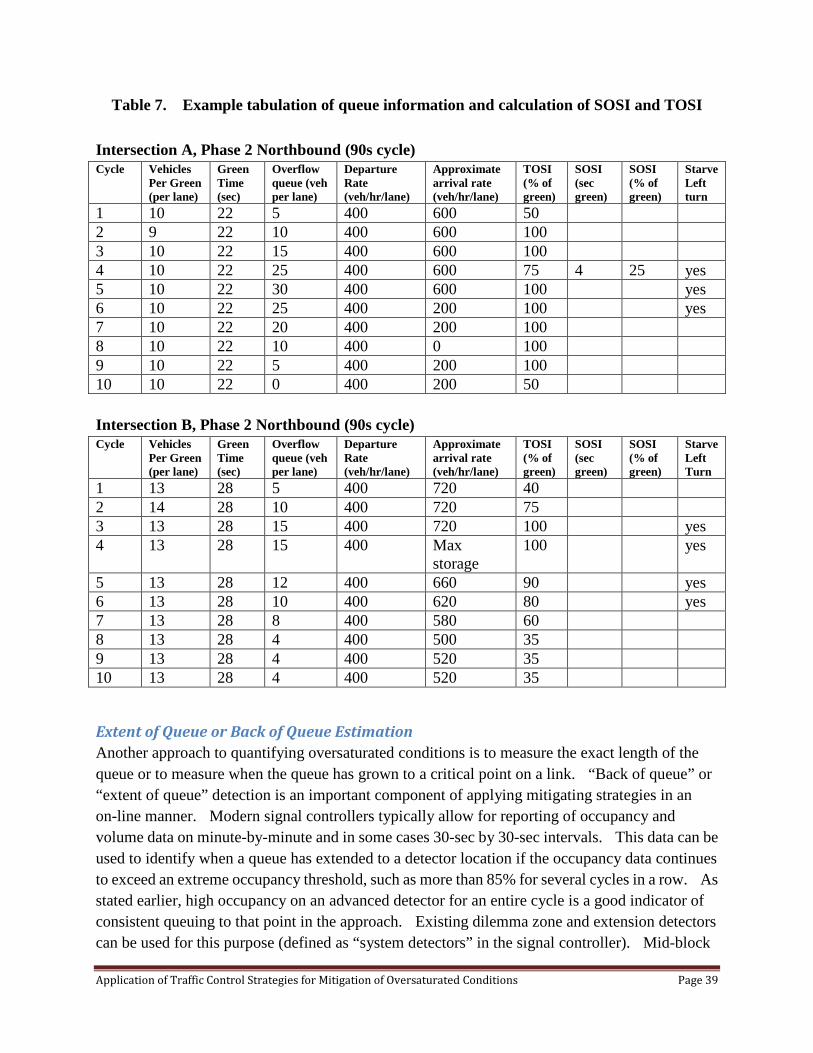
Table 7. Example tabulation of queue information and calculation of SOSI and TOSI
Intersection A, Phase 2 Northbound (90s cycle) Cycle Vehicles
Per Green (per lane)
Green Time (sec)
Overflow queue (veh per lane)
Departure Rate (veh/hr/lane)
Approximate arrival rate (veh/hr/lane)
TOSI (% of green)
SOSI (sec green)
SOSI (% of green)
Starve Left turn
1 10 22 5 400 600 50 2 9 22 10 400 600 100 3 10 22 15 400 600 100 4 10 22 25 400 600 75 4 25 yes 5 10 22 30 400 600 100 yes 6 10 22 25 400 200 100 yes 7 10 22 20 400 200 100 8 10 22 10 400 0 100 9 10 22 5 400 200 100 10 10 22 0 400 200 50
Intersection B, Phase 2 Northbound (90s cycle) Cycle Vehicles
Per Green (per lane)
Green Time (sec)
Overflow queue (veh per lane)
Departure Rate (veh/hr/lane)
Approximate arrival rate (veh/hr/lane)
TOSI (% of green)
SOSI (sec green)
SOSI (% of green)
Starve Left Turn
1 13 28 5 400 720 40 2 14 28 10 400 720 75 3 13 28 15 400 720 100 yes 4 13 28 15 400 Max
storage 100 yes
5 13 28 12 400 660 90 yes 6 13 28 10 400 620 80 yes 7 13 28 8 400 580 60 8 13 28 4 400 500 35 9 13 28 4 400 520 35 10 13 28 4 400 520 35
Extent of Queue or Back of Queue Estimation Another approach to quantifying oversaturated conditions is to measure the exact length of the queue or to measure when the queue has grown to a critical point on a link. “Back of queue” or “extent of queue” detection is an important component of applying mitigating strategies in an on-line manner. Modern signal controllers typically allow for reporting of occupancy and volume data on minute-by-minute and in some cases 30-sec by 30-sec intervals. This data can be used to identify when a queue has extended to a detector location if the occupancy data continues to exceed an extreme occupancy threshold, such as more than 85% for several cycles in a row. As stated earlier, high occupancy on an advanced detector for an entire cycle is a good indicator of consistent queuing to that point in the approach. Existing dilemma zone and extension detectors can be used for this purpose (defined as “system detectors” in the signal controller). Mid-block
Application of Traffic Control Strategies for Mitigation of Oversaturated Conditions Page 39
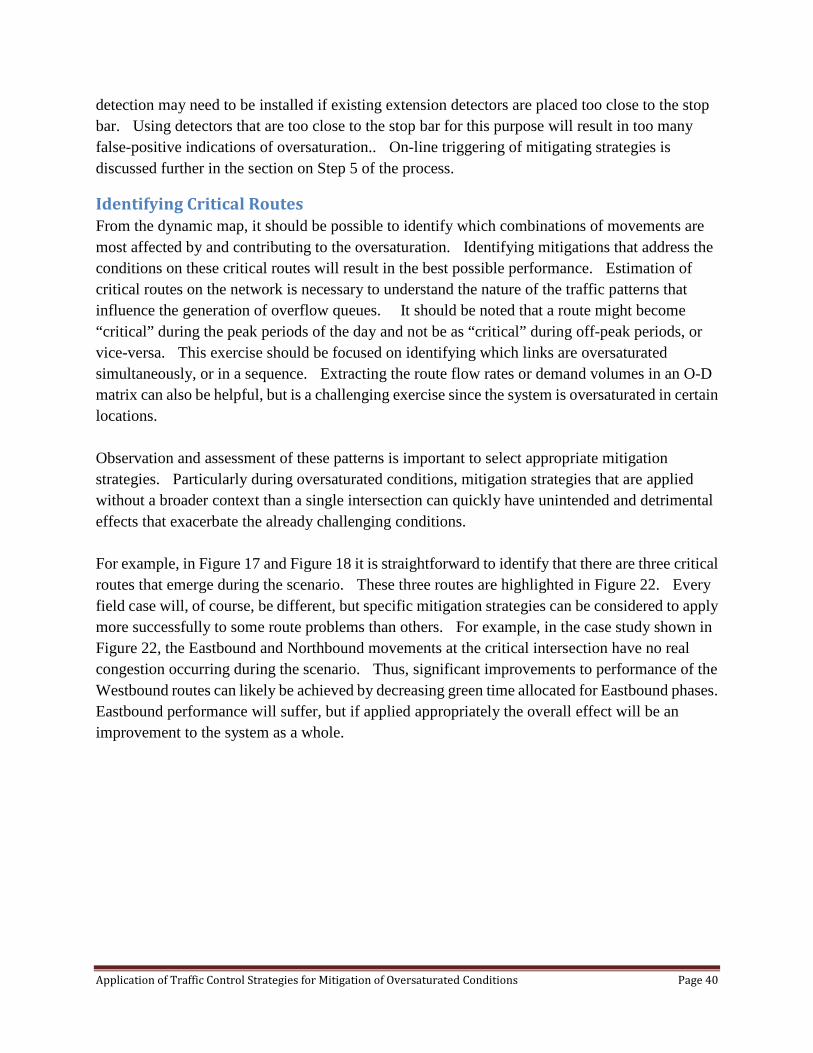
detection may need to be installed if existing extension detectors are placed too close to the stop bar. Using detectors that are too close to the stop bar for this purpose will result in too many false-positive indications of oversaturation.. On-line triggering of mitigating strategies is discussed further in the section on Step 5 of the process.
Identifying Critical Routes From the dynamic map, it should be possible to identify which combinations of movements are most affected by and contributing to the oversaturation. Identifying mitigations that address the conditions on these critical routes will result in the best possible performance. Estimation of critical routes on the network is necessary to understand the nature of the traffic patterns that influence the generation of overflow queues. It should be noted that a route might become “critical” during the peak periods of the day and not be as “critical” during off-peak periods, or vice-versa. This exercise should be focused on identifying which links are oversaturated simultaneously, or in a sequence. Extracting the route flow rates or demand volumes in an O-D matrix can also be helpful, but is a challenging exercise since the system is oversaturated in certain locations.
Observation and assessment of these patterns is important to select appropriate mitigation strategies. Particularly during oversaturated conditions, mitigation strategies that are applied without a broader context than a single intersection can quickly have unintended and detrimental effects that exacerbate the already challenging conditions.
For example, in Figure 17 and Figure 18 it is straightforward to identify that there are three critical routes that emerge during the scenario. These three routes are highlighted in Figure 22. Every field case will, of course, be different, but specific mitigation strategies can be considered to apply more successfully to some route problems than others. For example, in the case study shown in Figure 22, the Eastbound and Northbound movements at the critical intersection have no real congestion occurring during the scenario. Thus, significant improvements to performance of the Westbound routes can likely be achieved by decreasing green time allocated for Eastbound phases. Eastbound performance will suffer, but if applied appropriately the overall effect will be an improvement to the system as a whole.
Application of Traffic Control Strategies for Mitigation of Oversaturated Conditions Page 40
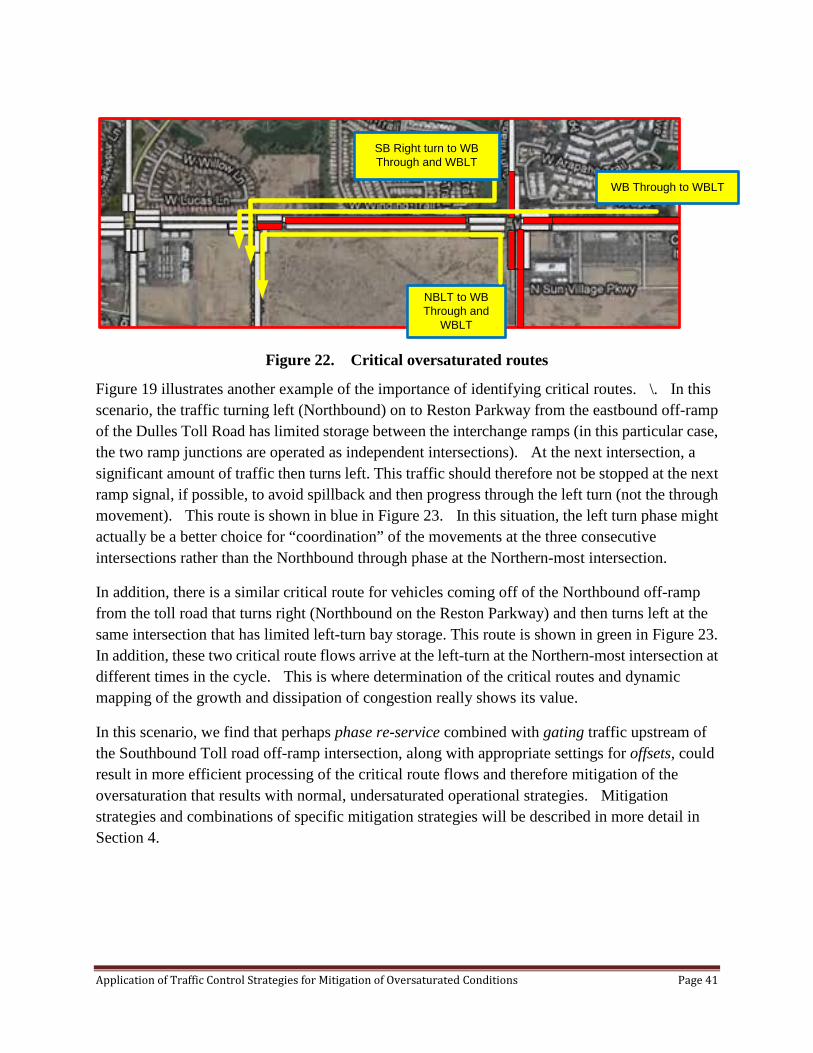
Figure 22. Critical oversaturated routes
Figure 19 illustrates another example of the importance of identifying critical routes. \. In this scenario, the traffic turning left (Northbound) on to Reston Parkway from the eastbound off-ramp of the Dulles Toll Road has limited storage between the interchange ramps (in this particular case, the two ramp junctions are operated as independent intersections). At the next intersection, a significant amount of traffic then turns left. This traffic should therefore not be stopped at the next ramp signal, if possible, to avoid spillback and then progress through the left turn (not the through movement). This route is shown in blue in Figure 23. In this situation, the left turn phase might actually be a better choice for “coordination” of the movements at the three consecutive intersections rather than the Northbound through phase at the Northern-most intersection.
In addition, there is a similar critical route for vehicles coming off of the Northbound off-ramp from the toll road that turns right (Northbound on the Reston Parkway) and then turns left at the same intersection that has limited left-turn bay storage. This route is shown in green in Figure 23. In addition, these two critical route flows arrive at the left-turn at the Northern-most intersection at different times in the cycle. This is where determination of the critical routes and dynamic mapping of the growth and dissipation of congestion really shows its value.
In this scenario, we find that perhaps phase re-service combined with gating traffic upstream of the Southbound Toll road off-ramp intersection, along with appropriate settings for offsets, could result in more efficient processing of the critical route flows and therefore mitigation of the oversaturation that results with normal, undersaturated operational strategies. Mitigation strategies and combinations of specific mitigation strategies will be described in more detail in Section 4.
SB Right turn to WB Through and WBLT
WB Through to WBLT
NBLT to WB Through and
WBLT
Application of Traffic Control Strategies for Mitigation of Oversaturated Conditions Page 41

Figure 23. Example Control Strategies on Reston Parkway Network
Summary: Characterizing a Scenario of Oversaturated Traffic Conditions The first step in attempting to solve any problem is characterizing the attributes of the problem. In this section, we have provided first a number of definitions to frame the discussion. After the basic definitions, we presented the attributes in Table 6 as the key elements that describe a specific situation at a high-level. Identifying the problem on these attributes will help frame the scope of the mitigating strategies that must be applied. In addition to these general problem attributes, the next step is to develop dynamic maps that describe how the scenario evolves and dissipates over time, and identify also from that dynamic map where the critical routes are. Tabulating performance data such as SOSI and TOSI and back-of-queue estimates for key approaches in the system will also be helpful in identifying what type of mitigations can be applied to that situation. In the next section, we will discuss objectives for operation of signal systems during oversaturated conditions and how those objectives apply to the dynamic system concepts we presented in this section. Following the selection and identification of objectives, we will identify and describe a wide range of mitigation strategies that apply to various combinations of the attributes of Table 5.
Step 3: Identifying Appropriate Operational Objectives Looking at the dynamic map and the data characterizing how the oversaturated conditions evolve over space and time, the next step is to identify what the objectives should be to select appropriate mitigations. There are three generalized management objectives available for operating traffic signals: (1) delay minimization, (2) throughput maximization, and (3) queue management. All of these go hand in hand with providing safety for all users of the system. When conditions become
Application of Traffic Control Strategies for Mitigation of Oversaturated Conditions Page 42
oversaturated, the major choice will be between maximizing throughput or queue management.
Delay Minimization Most off-line optimization tools use some kind of formulation for minimizing delay and stops, perhaps balanced with some consideration for providing progression on an arterial route. In undersaturated conditions, this objective is handled sometimes quite loosely to perhaps include solutions that might only be considered to be “effective” or perhaps only “acceptable” and not really a true minimum total delay. This includes (a) minimizing the delay at a single intersection and (b) minimizing delay in a network or series of intersections on a travel route (progression). Intersection delay might be characterized in one of two manners. The first is what might be referred to as the classical “Webster’s method” which is to allocate green time to phases to minimize the total delay at the intersection given known demand for all movements. Since demand fluctuates and is not directly measurable with traditional detection systems, the second and more commonly used interpretation of the objective “minimize delay” is to minimize the frequency that a traffic signal does not serve all the waiting cars during the green period. In other words, “minimize delay” means to minimize “phase failures” in actuated-coordinated signal systems. The former is minimization of system delay. The latter is minimization of user delay. Minimization of user delay is the traditional basis for most actuated-coordinated signal timing in North America. Green splits are typically allocated to ensure that side-streets and left-turn phases have a cushion of additional time in case they need more that they typically need on average, to minimize cycle failures. In most cases this additional time is re-allocated to other phases when the phase “gaps out” due to lack of additional demand. Depending on the use of fixed or floating force offs, the extra time is either returned to the coordination phase or the next phase in the sequence is given additional time. Avoiding cycle failures is an “equitable” traffic management policy; one that over-emphasizes the importance of light traffic movements such as left turns and side-streets. It does not minimize total delay, it rather minimizes each driver’s perception of being delayed at the signal. In undersaturated conditions, this policy can be improved upon by adaptive traffic control strategies, but in most low and medium flow scenarios, a cycle-failure avoidance policy is hard to beat as it meets the objective to provide a consistent user experience for drivers. However, when green times are not long enough to serve all the cars that were waiting at the start of green, policies with fixed split times have no way to react to these changes. Even if the arrival rate remains constant but still higher than the service rate (maximum green time), the overflow queue will continue to grow for that phase. Objectives that continue to consider equity service at the intersection will over-emphasize the minor movements at the detriment to the movements and phases that are oversaturated.
Application of Traffic Control Strategies for Mitigation of Oversaturated Conditions Page 43
“Progression” is an objective that blurs the lines between “minimize delay” and “maximize throughput”. Progression is achieved in signal systems by arranging for the green windows to be consecutively opened (by way of setting offsets) in a desired direction of travel to allow for vehicles to continue through a sequence of intersections without having to stop. By careful setting of the offset values, the objective of minimizing delay (equity treatment for all users) can still be satisfied at individual intersections while at the same time meeting the system objective of progression and providing the “consistent user experience” that drivers’ tend to expect on arterial roads. This objective is hindered when overflow queues begin to form on the movements that the control scheme is trying to progress. Offsets that were designed (i.e. forward-progression offsets) assuming that no queues were present will further exacerbate the situation by creating situations where the overflow queues grow faster than necessary because the upstream vehicles arrive before the overflow queue has started to move.
Throughput Maximization Minimizing user delay is simply not appropriate when the situation is oversaturated since it is no longer possible to avoid cycle failures. Thus, maximizing the number of vehicles actually served by the intersection, with respect to the vehicles presented to the intersection (the load) is a more appropriate objective. This keeps as much of the system operational as possible, with the unfortunate effect of delaying movements or phases where the total traffic demand is quite low. From an equity perspective, strategies that maximize throughput might be considered to “punish” light movements to the benefit of the greater good. This is done by moving much heavier phases for longer amounts of time more frequently than would be expected by the typical actuated control approach. Strategies that maximize throughput have the following characteristics:
• Make best use of the physical space (e.g., Lag heavy left turns, run closely-spaced intersections on single controller).
• Make best use of green time in the cycle (e.g., Prevent actuated short greens, separate congested movements from the uncongested ones, phase re-servicing).
• Reduce the negative impact of other influences (e.g., buses, pedestrian movements) on the overall ability of the signal system to process vehicle flows.
Measurement and Assessment of Throughput There are several ways to measure or assess the “throughput” of a traffic signal network or system:
• The total number of vehicles “input” to a system of intersections • The total number of vehicles “output” by a system of intersections • The ratio of the total vehicles output from the system to the total vehicles input to the
system
Application of Traffic Control Strategies for Mitigation of Oversaturated Conditions Page 44

Throughput is a rate, such as vehicles per hour or vehicle-miles per hour. The concept of an input rate and an output rate must be considered together with the identification of the spatial extent of the “system” of intersections of interest. When a control strategy is operating efficiently, the overall output processing rate of the intersections in the system closely matches the input processing rate and thus overflow storage of vehicles in the system does not occur. . In oversaturated conditions, the output rate is less than the input rate and thus overflow queuing begins to build up within the system at various points. At some point in many oversaturated systems queues will build outside of the system cordon boundaries when queues inside of the system reduce the ability for those vehicles from entering the area. An example will be presented to further illustrate these concepts. This example is a microscopic traffic simulation test network with five intersections on an arterial with a primary destination in the middle of the system. Route proportion matrices and traffic volumes were modified in five intervals during the simulation. Vehicles do not react to congested conditions to modify their route or destination (i.e. dynamic traffic assignment is not considered). Figure 24 compares the average (i.e. averaged over five stochastic simulation iterations) total system input and total system output of a “resonant cycle” mitigating strategy with a baseline “no mitigation” operational strategy of the common undersaturated timing plans. Figure 24(a) illustrates how the mitigating strategy improves the ability of the system to process arriving vehicles over time. In this example, the top (light purple) line indicates the total “offered load” to the system of intersections from all input approaches. As the total arrival rate climbs to the peak period, both the mitigating strategy and the baseline operation are able to fully process the input. As the arrival rate continues at this high level (at approx. 875 veh/hr) for the next 75 minutes, both the mitigation and the baseline operation fail to allow all of the offered load into the system. These vehicles are thus stored outside of the system cordon boundaries. However, the mitigation strategy is able to allow higher rates of total vehicle input. This improves the usage of available spatial capacity inside of the network by reducing the amount of wasted green time due to starvation and spillover. Using a strategy that allows a higher total input rate means that more of the available spatial capacity of the network inside the cordon boundary is being used to process vehicles. This is appropriate during the “loading” and “processing” phases of a scenario.
Application of Traffic Control Strategies for Mitigation of Oversaturated Conditions Page 45
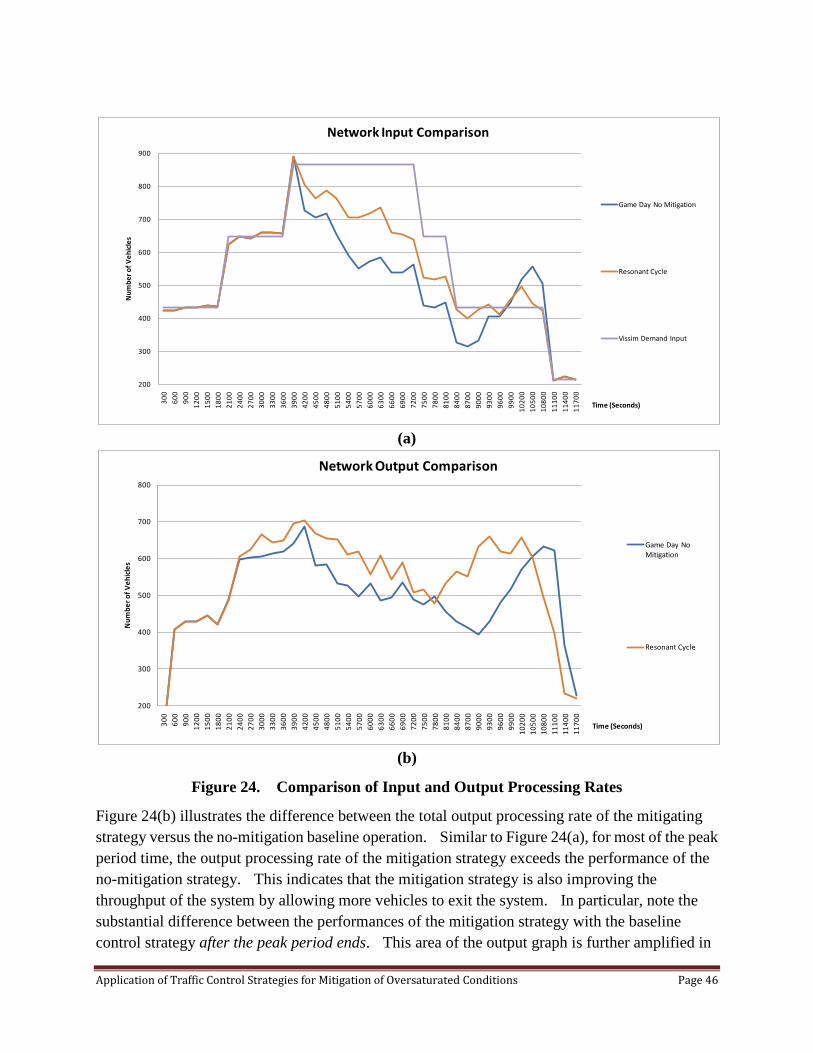
(a)
(b)
Figure 24. Comparison of Input and Output Processing Rates
Figure 24(b) illustrates the difference between the total output processing rate of the mitigating strategy versus the no-mitigation baseline operation. Similar to Figure 24(a), for most of the peak period time, the output processing rate of the mitigation strategy exceeds the performance of the no-mitigation strategy. This indicates that the mitigation strategy is also improving the throughput of the system by allowing more vehicles to exit the system. In particular, note the substantial difference between the performances of the mitigation strategy with the baseline control strategy after the peak period ends. This area of the output graph is further amplified in
200
300
400
500
600
700
800
90030
060
090
012
0015
0018
0021
0024
0027
0030
0033
0036
0039
0042
0045
0048
0051
0054
0057
0060
0063
0066
0069
0072
0075
0078
0081
0084
0087
0090
0093
0096
0099
0010
200
1050
010
800
1110
011
400
1170
0
Num
ber o
f Veh
icles
Time (Seconds)
Network Input Comparison
Game Day No Mitigation
Resonant Cycle
Vissim Demand Input
200
300
400
500
600
700
800
300
600
900
1200
1500
1800
2100
2400
2700
3000
3300
3600
3900
4200
4500
4800
5100
5400
5700
6000
6300
6600
6900
7200
7500
7800
8100
8400
8700
9000
9300
9600
9900
1020
010
500
1080
011
100
1140
011
700
Num
ber o
f Veh
icles
Time (Seconds)
Network Output Comparison
Game Day No Mitigation
Resonant Cycle
Application of Traffic Control Strategies for Mitigation of Oversaturated Conditions Page 46

Figure 25.
Figure 25. Comparison of output processing rates during “Recovery Period”
In Figure 25, it is illustrated that the mitigating strategy begins processing more of the overflow queues much more efficiently after the peak period input flows subside. The “no mitigation” strategy continues to decrease in total system output for an additional 20 minutes and takes another 30 minutes before its’ peak output processing rate is finally reached (approximately 30 minutes behind the mitigation strategy’s maximum output processing rate). Finally, the no-mitigation operation returns to steady-state operation of the system at least 10 minutes later than the mitigation strategy. All three of these metrics indicate that, mitigation strategies can be effective in improving total system output in the recovery regime. Putting the two concepts of total system input and total system output together leads to a third measurement of system performance which is the total vehicles in the system. Figure 21 illustrates the input processing rate (red series), output rate (green series), and total vehicles in the system (blue vertical bars) for the no-mitigation strategy. Comparing the profile of the total vehicles in the system in Figure 26 with Figure 27 illustrates how the input and output rates combine to create another way to identify system improvements.
700
7500
7800
8100
8400
8700
9000
9300
9600
9900
1020
010
500
1080
011
100
1140
011
700
Time (Seconds)
Game Day No Mitigation
Resonant Cycle
20 minutes 30 minutes 10 minutes
End of peak period flow
Baseline operation continues to
degrade
Application of Traffic Control Strategies for Mitigation of Oversaturated Conditions Page 47

Figure 26. Total vehicles in the system without mitigation
Figure 27 illustrates the total vehicles in the system for the mitigating strategy shown in Figure 24. Several characteristics are of note here. First, the peak number of vehicles in the system in Figure 25 is approximately 2000, where the baseline case strategy shown in Figure 26 maxes out at around 1700 total vehicles. Second, the shape of the profile (blue bars) in Figure 27 in the recovery period after the peak period has a much steeper negative slope versus the slope of the reduction in total vehicles in the system shown in Figure 26. This indicates the significant delay savings to the vehicles being stored in the overflow queues as the mitigation strategy begins to be more effective. The mitigation strategy becomes more effective as more spare capacity becomes available since the output rates for the mitigation are higher than the baseline operation strategy.
Application of Traffic Control Strategies for Mitigation of Oversaturated Conditions Page 48

Figure 27. Total vehicles in the system with mitigation strategy
When a mitigating strategy increases both the total output and the total input rates, it can truly be determined to have increased the capacity of the traffic control system. If the mitigation increases total system input, but not output, then it uses more of the available spatial capacity of the system. This in itself is a valuable performance improvement and is desirable during the loading and processing regimes. Similarly, if a mitigation strategy increases total system output, but not input, it is reducing the congestion and oversaturation inside the system cordon line. This is preferable during the recovery regime. Figure 28 summarizes how input and output processing rates can be combined to consider the total vehicles in the system. As shown, significant increases in total vehicles stored in the system can be achieved. In this example, the resonant cycle strategy allows a maximum of 2000 vehicles in the system, approximately 300 vehicles (~20%) higher than the peak value obtained by the baseline strategy. In the beginning of the scenario (during loading and some of the processing phase), there are actually fewer vehicles in the system with the mitigation than with the baseline operation. This indicates that the mitigation is doing a better job of processing vehicles out of the system as shown in Figure 24(b). Similarly, during the recovery period, there are fewer vehicles in the system when applying the mitigation since they were more efficiently processed all along.
0
200
400
600
800
1000
1200
1400
1600
1800
2000
2200
2400
300
600
900
1200
1500
1800
2100
2400
2700
3000
3300
3600
3900
4200
4500
4800
5100
5400
5700
6000
6300
6600
6900
7200
7500
7800
8100
8400
8700
9000
9300
9600
9900
1020
010
500
1080
011
100
1140
011
700
Num
ber o
f Veh
icles
Time (Seconds)
Resonant Cycle
Number of Vehicles in System Input Output
Application of Traffic Control Strategies for Mitigation of Oversaturated Conditions Page 49
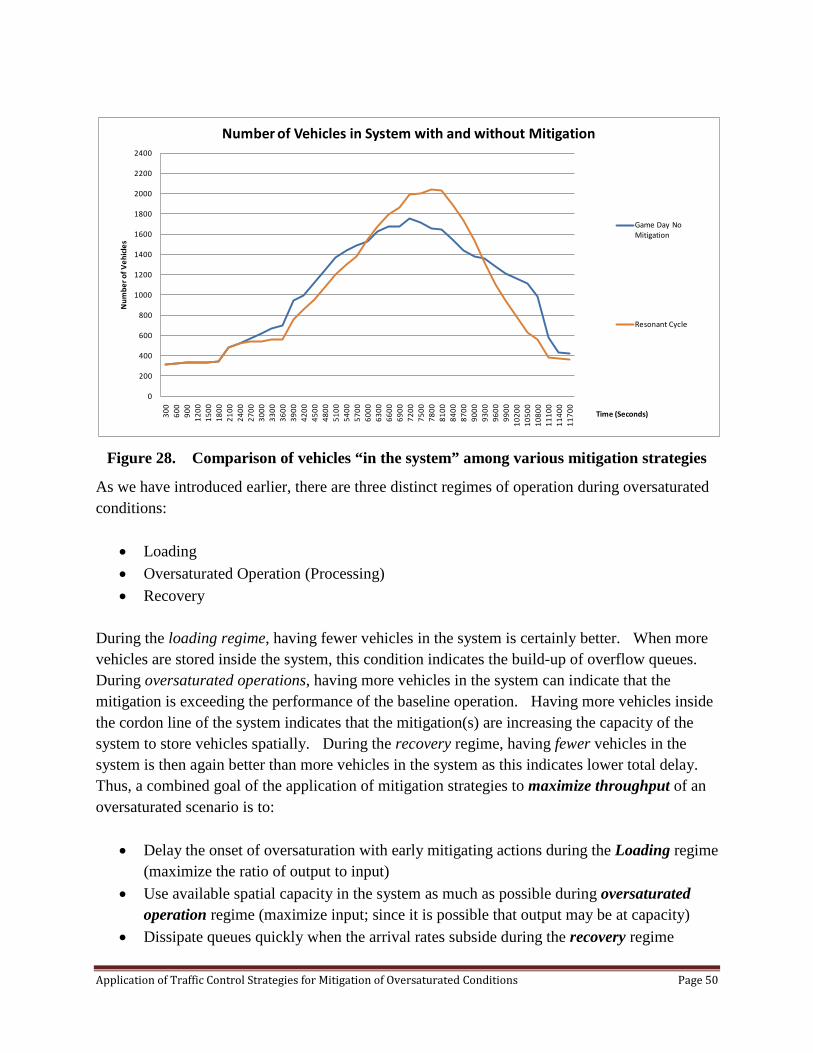
Figure 28. Comparison of vehicles “in the system” among various mitigation strategies
As we have introduced earlier, there are three distinct regimes of operation during oversaturated conditions:
• Loading • Oversaturated Operation (Processing) • Recovery
During the loading regime, having fewer vehicles in the system is certainly better. When more vehicles are stored inside the system, this condition indicates the build-up of overflow queues. During oversaturated operations, having more vehicles in the system can indicate that the mitigation is exceeding the performance of the baseline operation. Having more vehicles inside the cordon line of the system indicates that the mitigation(s) are increasing the capacity of the system to store vehicles spatially. During the recovery regime, having fewer vehicles in the system is then again better than more vehicles in the system as this indicates lower total delay. Thus, a combined goal of the application of mitigation strategies to maximize throughput of an oversaturated scenario is to:
• Delay the onset of oversaturation with early mitigating actions during the Loading regime (maximize the ratio of output to input)
• Use available spatial capacity in the system as much as possible during oversaturated operation regime (maximize input; since it is possible that output may be at capacity)
• Dissipate queues quickly when the arrival rates subside during the recovery regime
0
200
400
600
800
1000
1200
1400
1600
1800
2000
2200
240030
060
090
012
0015
0018
0021
0024
0027
0030
0033
0036
0039
0042
0045
0048
0051
0054
0057
0060
0063
0066
0069
0072
0075
0078
0081
0084
0087
0090
0093
0096
0099
0010
200
1050
010
800
1110
011
400
1170
0
Num
ber o
f Veh
icles
Time (Seconds)
Number of Vehicles in System with and without Mitigation
Game Day No Mitigation
Resonant Cycle
Application of Traffic Control Strategies for Mitigation of Oversaturated Conditions Page 50
(maximize output) Depending on the complexity of a particular scenario, these goals may be satisfied with a single strategy or a combination of actions that change over time. This will be discussed further in the sections discussing Steps 4 and 5 of the process.
Queue Management Throughput maximization strategies have the goal of either increasing input, increase output, or both. At some point, however, no further revision to the signal timing will increase maximum throughput, and queues will continue to grow until demand diminishes. The reason that strategies largely have the same performance during the peak time is that the queues are so pervasive that the cause-and-effect relationships between control actions and the traffic situation are masked by hysteresis. Hysteresis is a delay between an offered input and the system output. For example, when the green time of a downstream intersection can process only one-third or one-quarter of the upstream queue, it is no longer that important if the offset is set for positive or negative progression. When the light turns green at the upstream intersection, there is limited storage for the entering traffic and spillback begins to create SOSI > 0 at the upstream location. The one-to-one dynamic of the offset relationship from one intersection to another is no longer applicable.. The shorter the link distances between intersections, the faster the system can quickly degrade from stable operation to pervasive queues, skipping any potential improvement that a throughput maximizing strategy might have been able to achieve. This usually means constraining capacity upstream from a bottleneck at locations where queue storage will not cause network gridlock, or increasing green time at downstream signals to increase output flow. As noted by (Denney, et al., 2008) if throughput maximization strategies are a curative approach, then queue management strategies can be considered a palliative approach with the objective of treating symptoms rather than seeking a cure. It is in this context that it is most likely that the aphorism “there is nothing that can be done, there is simply too much traffic” is most true. Synchronizing the actions of multiple controllers in a system of intersections for the purpose of queue management is very difficult within the context of actuated-coordinated control by commanding patterns with different parameters. The coordination of actions between intersections for queue management must more closely resemble the operation of a diamond interchange with a carefully orchestrated sequence of actions, with rapid feedback between the detection of queue extent, , and the application of rapid-response mitigation strategies such as phase truncation and green extension. Design of timing plans according to the principles described in Section 4 and adjustment of green times according to the technique described in Appendix B can begin to address these situations.
Application of Traffic Control Strategies for Mitigation of Oversaturated Conditions Page 51
Most modern controllers contain logic processing capabilities (multiple levels of if…then rules with OR, AND, XOR, etc. gates) that can be used for this type of mitigation at a single location. Some controllers also have capabilities for “peer-to-peer” messaging between one controller and another; most often used for cascading calls to transit priority phases at downstream locations. The congestion management logic tool described in Section 4 can be used as a guide for configuring such if…then logic.
Summary After determining a general description of how a particular scenario evolves over space and time (the “dynamic map”) under the current operating conditions, Step 3 of the process is to determine which objectives might be applicable and should be pursued. The following questions should be asked at this point to determine which objectives to pursue and to guide the selection of which mitigation strategies are appropriate:
• When does it appear that I might need to start applying a mitigating strategy? o When does the loading regime begin?
• Maximize Output: Is it possible to increase the system output rate? If so, where? If we do this, might it cause another problem downstream?
• Maximize Input: Is there available storage capacity “in the system”? or “out of the system”? If so, where?
• Manage Queues: When and where do the queues grow to the point where upstream mobility is restricted (de facto red)?
o When does the processing regime begin? • Maximize Output: When does the situation being to dissipate? How long does it take to
return to “normal” operation? Is there enough time to schedule or respond to two or more signal timing pattern changes?
o When does the recovery regime begin? o When does the recovery regime end?
Collecting data on the queue lengths and intensity measures for the affected movements, phases, and routes can begin to characterize the spatial and temporal extent of the situation. This information can be collected in the field simply by observing, or by using approximate data from existing signal systems. The next section will discuss a range of mitigating strategies that can be used to address certain combinations of problematic scenarios.
Application of Traffic Control Strategies for Mitigation of Oversaturated Conditions Page 52
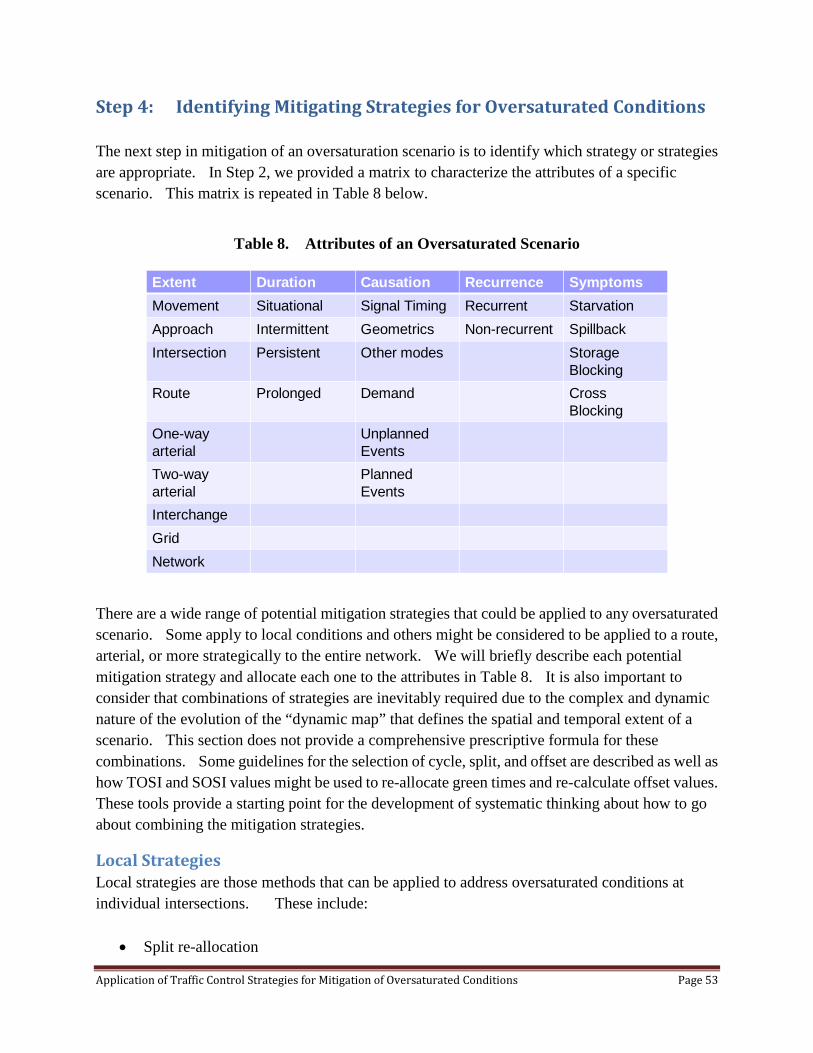
Step 4: Identifying Mitigating Strategies for Oversaturated Conditions The next step in mitigation of an oversaturation scenario is to identify which strategy or strategies are appropriate. In Step 2, we provided a matrix to characterize the attributes of a specific scenario. This matrix is repeated in Table 8 below.
Table 8. Attributes of an Oversaturated Scenario
There are a wide range of potential mitigation strategies that could be applied to any oversaturated scenario. Some apply to local conditions and others might be considered to be applied to a route, arterial, or more strategically to the entire network. We will briefly describe each potential mitigation strategy and allocate each one to the attributes in Table 8. It is also important to consider that combinations of strategies are inevitably required due to the complex and dynamic nature of the evolution of the “dynamic map” that defines the spatial and temporal extent of a scenario. This section does not provide a comprehensive prescriptive formula for these combinations. Some guidelines for the selection of cycle, split, and offset are described as well as how TOSI and SOSI values might be used to re-allocate green times and re-calculate offset values. These tools provide a starting point for the development of systematic thinking about how to go about combining the mitigation strategies.
Local Strategies Local strategies are those methods that can be applied to address oversaturated conditions at individual intersections. These include:
• Split re-allocation
Extent Duration Causation Recurrence Symptoms
Movement Situational Signal Timing Recurrent Starvation
Approach Intermittent Geometrics Non-recurrent Spillback
Intersection Persistent Other modes StorageBlocking
Route Prolonged Demand Cross Blocking
One-wayarterial
UnplannedEvents
Two-way arterial
Planned Events
Interchange
Grid
Network
Application of Traffic Control Strategies for Mitigation of Oversaturated Conditions Page 53

• Green extension • Cycle time increase • Phase truncation • Phase re-service • Dynamic left-turn treatment • Run closely-spaced intersections with one controller
Each of these methods will be defined and discussed in the following sections.
Split Re-allocation When developing signal timing plans, it is typical for splits to be allocated in such a way as to avoid phase failures. In other words, the split provided for minor movements will tend to be large enough to service the traffic even during cycles with above average demand. During oversaturated conditions, it is often necessary to re-allocate splits to provide a larger proportion of the time to oversaturated movements and provide shorter splits for undersaturated movements. In some situations, it is possible to re-allocate the splits so as to reduce congestion on oversaturated approaches without inducing oversaturation on minor movements. However, in many situations, the split re-allocation simply serves to move the oversaturation from major movements that could spill back and cause problems for the corridor to more minor movements that can store excess traffic more easily.
When the problem is localized to a single intersection or approach, this strategy is preferable to increasing the cycle time for several reasons. First, increasing the cycle time on a single intersection tends to disrupt progression at adjacent intersections. Second, the incremental dis-benefit to minor movements is almost always recovered in the incremental benefit (reduction in delay) to the oversaturated approach. This has been proven time and time again by adaptive systems and commonplace traffic engineering adjustments. Even just a few seconds of re-allocated green time can go a long way to reducing the growth of overflow queues.
Table 9 illustrates what attributes of oversaturated scenarios are applicable for split re-allocation.
Application of Traffic Control Strategies for Mitigation of Oversaturated Conditions Page 54

Table 9. Allocation of split re-allocation strategies to oversaturated scenarios
Observation of the overflow queues that build during the scenario is the primary way that split re-allocation adjustments can be calculated. Consider the table of data presented in Section 2 for Intersection “A”.
Intersection A, Phase 2 Northbound (90s cycle) Cycle Vehicles
Per Green (per lane)
Green Time (sec)
Overflow queue (veh per lane)
Departure Rate (veh/hr/lane)
Approximate arrival rate (veh/hr/lane)
TOSI (% of green)
SOSI (sec green)
SOSI (% of green)
1 10 22 5 400 600 50 2 9 22 10 400 600 100 3 10 22 15 400 600 100 4 10 22 25 400 600 75 4 25 5 10 22 30 400 600 100 6 10 22 25 400 200 100 7 10 22 20 400 200 100 8 10 22 10 400 0 100 9 10 22 5 400 200 100 10 10 22 0 400 200 50 In this situation, the overflow queue grows from five (5) vehicles per lane in the first cycle up to thirty (30) vehicles per lane in five (5) cycles and then dissipates as the traffic demand is reduced over the fifteen (15) minute period. If this is the only phase that is oversaturated at the
Extent Duration Causation Recurrence Symptoms
Movement Situational Signal Timing
Recurrent Starvation
Approach Intermittent Geometrics Non-recurrent
Spillback
Intersection Persistent Other modes StorageBlocking
Route Prolonged Demand Cross Blocking
One-wayarterial
UnplannedEvents
Two-way arterial
Planned Events
Interchange
Grid
Network
Application of Traffic Control Strategies for Mitigation of Oversaturated Conditions Page 55

intersection, it is likely that several seconds of green time can be re-allocated from other splits to eliminate this queuing. By observing the growth of the residual queues and the departure capacity of the current split, it is clear that the arrival rate for the first five cycles is at least 600 veh/hr/lane. Since the capacity of the split is approximately 400 veh/hr/lane (about ten vehicles per green per lane), the split needs approximately 50% more green time or 10 seconds of additional time to accommodate the higher flow rate.
To determine which phases can give up split time, it is necessary to calculate their degree of saturation or volume-to-capacity ratio. Phases with the lowest v/c ratios are the best candidates for re-allocating split time to the oversaturated phase. Care should be taken to adjust the other splits such that the re-calculated v/c ratio is not greater than 1.0. If this is not possible, then the phase(s) with the most upstream storage space for queued vehicles should be selected to have their split time reduced.
Increasing the Cycle Time When the dis-benefit to minor approaches is considered to be too problematic, increasing the cycle time is the only option to provide additional green for the oversaturated approach(es) while maintaining the same green split for minor movements. When several phases and movements can be considered to be “minor”, and the intersection is sufficiently “isolated” with plenty of distance to upstream intersections for storage of overflow queues, this is perhaps the most reasonable approach. There is a limit to how large the cycle time can be adjusted. From a practical perspective, most controllers do not allow cycle times above 255. With knowledge of upstream split times that feed each approach, maximum queues for different cycle times can be reasonably estimated. In undersaturated conditions, cycle length is directly a function of the volumes and capacities of the approaches to the intersection. In oversaturated conditions, however, cycle length is a function of the storage capacity of the links, the arrival rate during red intervals along the arterial, and the green split ratio. A short link with a high arrival rate during red would require a shorter cycle length to prevent spillback into the upstream intersection.
The cycle-length policy developed by Lieberman, et. al. (2000), provides an upper-bound of the cycle length that avoids spillback of an overflow queue to an upstream intersection. This cycle time ensures that the queue formation shockwave dissipates before reaching the upstream intersection. Figure 29 illustrates the calculation of the maximum cycle length that prevents spillback.
Application of Traffic Control Strategies for Mitigation of Oversaturated Conditions Page 56
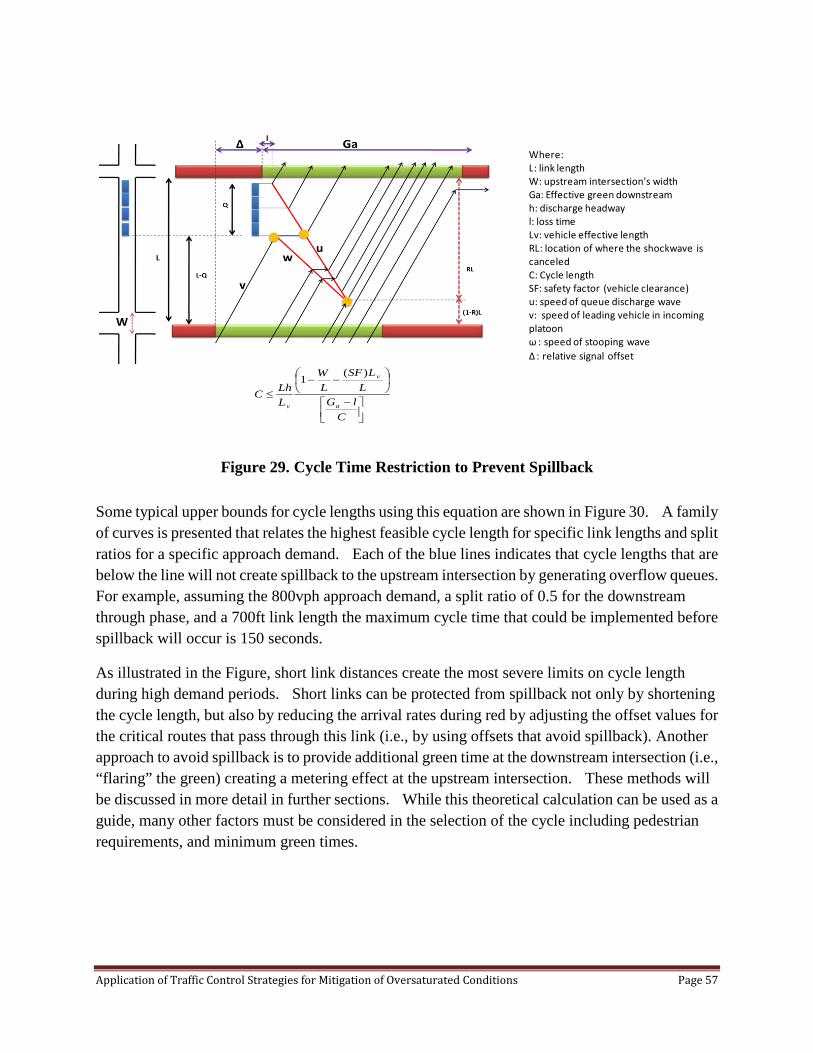
Figure 29. Cycle Time Restriction to Prevent Spillback
Some typical upper bounds for cycle lengths using this equation are shown in Figure 30. A family of curves is presented that relates the highest feasible cycle length for specific link lengths and split ratios for a specific approach demand. Each of the blue lines indicates that cycle lengths that are below the line will not create spillback to the upstream intersection by generating overflow queues. For example, assuming the 800vph approach demand, a split ratio of 0.5 for the downstream through phase, and a 700ft link length the maximum cycle time that could be implemented before spillback will occur is 150 seconds.
As illustrated in the Figure, short link distances create the most severe limits on cycle length during high demand periods. Short links can be protected from spillback not only by shortening the cycle length, but also by reducing the arrival rates during red by adjusting the offset values for the critical routes that pass through this link (i.e., by using offsets that avoid spillback). Another approach to avoid spillback is to provide additional green time at the downstream intersection (i.e., “flaring” the green) creating a metering effect at the upstream intersection. These methods will be discussed in more detail in further sections. While this theoretical calculation can be used as a guide, many other factors must be considered in the selection of the cycle including pedestrian requirements, and minimum green times.
Where:L: link lengthW: upstream intersection's widthGa: Effective green downstreamh: discharge headway l: loss time Lv: vehicle effective length RL: location of where the shockwave is canceled C: Cycle lengthSF: safety factor (vehicle clearance)u: speed of queue discharge wavev: speed of leading vehicle in incoming platoonω : speed of stooping wave Δ : relative signal offset
−
−−
≤
ClGL
LSFL
W
LLhC
a
v
v
)(1
Application of Traffic Control Strategies for Mitigation of Oversaturated Conditions Page 57
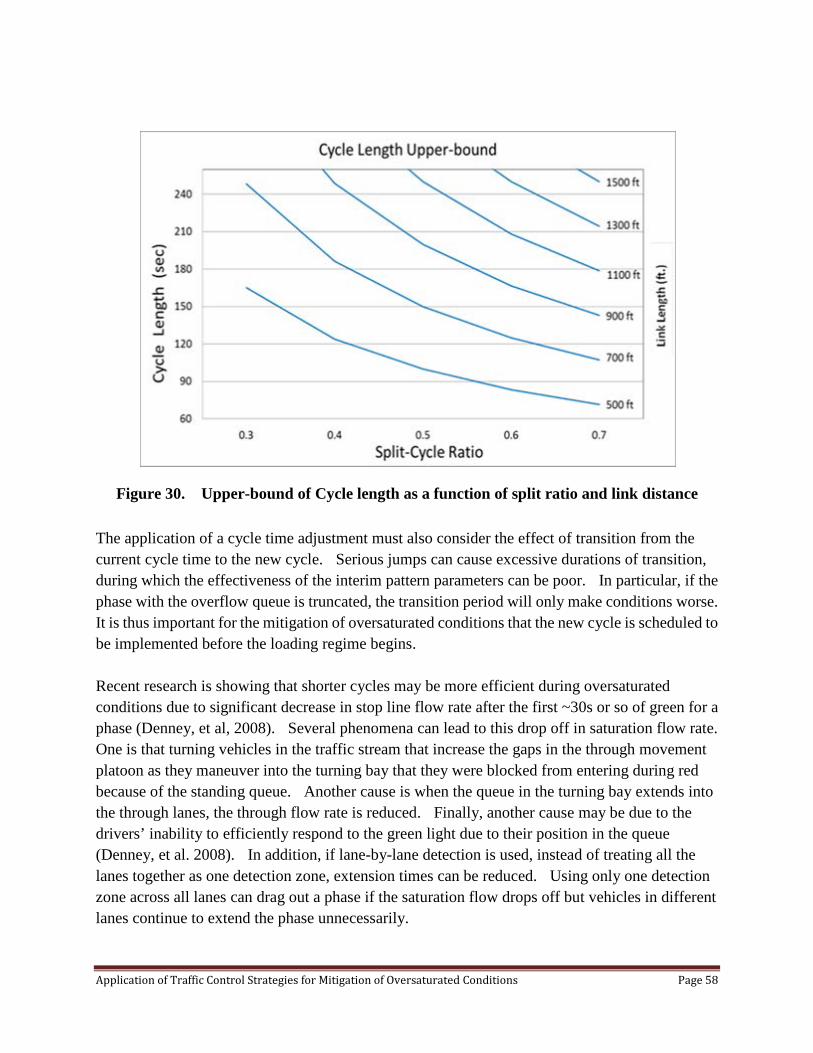
Figure 30. Upper-bound of Cycle length as a function of split ratio and link distance
The application of a cycle time adjustment must also consider the effect of transition from the current cycle time to the new cycle. Serious jumps can cause excessive durations of transition, during which the effectiveness of the interim pattern parameters can be poor. In particular, if the phase with the overflow queue is truncated, the transition period will only make conditions worse. It is thus important for the mitigation of oversaturated conditions that the new cycle is scheduled to be implemented before the loading regime begins. Recent research is showing that shorter cycles may be more efficient during oversaturated conditions due to significant decrease in stop line flow rate after the first ~30s or so of green for a phase (Denney, et al, 2008). Several phenomena can lead to this drop off in saturation flow rate. One is that turning vehicles in the traffic stream that increase the gaps in the through movement platoon as they maneuver into the turning bay that they were blocked from entering during red because of the standing queue. Another cause is when the queue in the turning bay extends into the through lanes, the through flow rate is reduced. Finally, another cause may be due to the drivers’ inability to efficiently respond to the green light due to their position in the queue (Denney, et al. 2008). In addition, if lane-by-lane detection is used, instead of treating all the lanes together as one detection zone, extension times can be reduced. Using only one detection zone across all lanes can drag out a phase if the saturation flow drops off but vehicles in different lanes continue to extend the phase unnecessarily.
Application of Traffic Control Strategies for Mitigation of Oversaturated Conditions Page 58
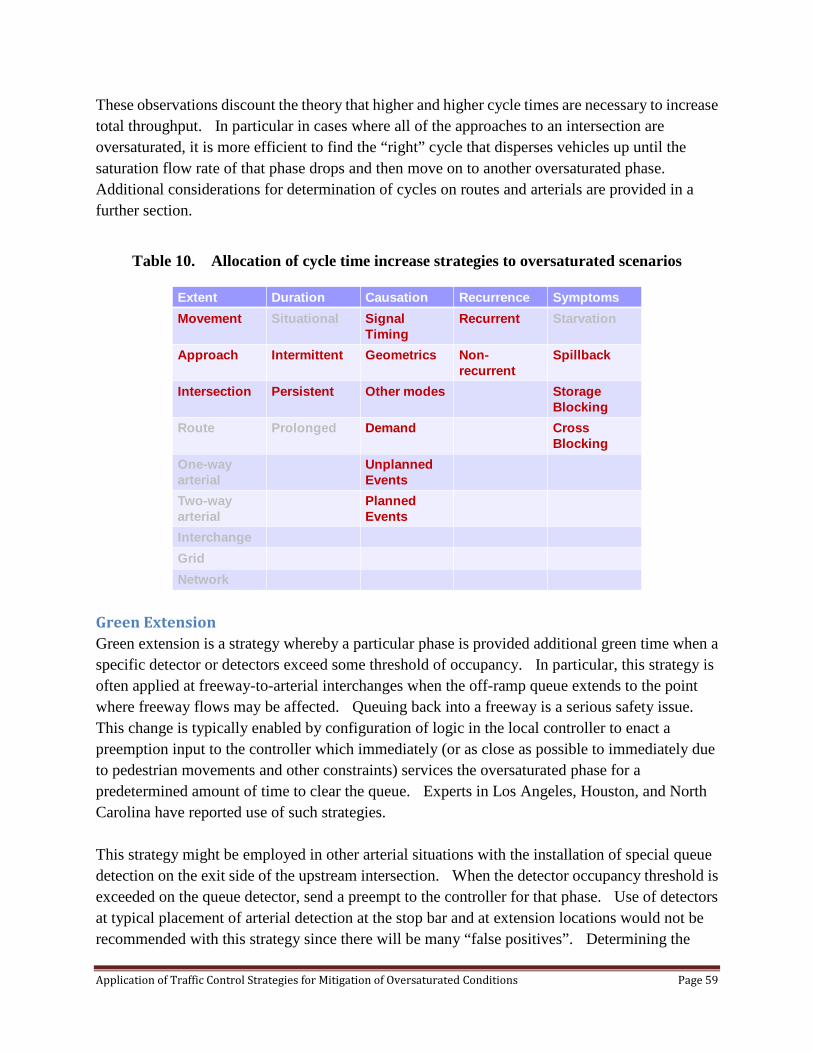
These observations discount the theory that higher and higher cycle times are necessary to increase total throughput. In particular in cases where all of the approaches to an intersection are oversaturated, it is more efficient to find the “right” cycle that disperses vehicles up until the saturation flow rate of that phase drops and then move on to another oversaturated phase. Additional considerations for determination of cycles on routes and arterials are provided in a further section.
Table 10. Allocation of cycle time increase strategies to oversaturated scenarios
Green Extension Green extension is a strategy whereby a particular phase is provided additional green time when a specific detector or detectors exceed some threshold of occupancy. In particular, this strategy is often applied at freeway-to-arterial interchanges when the off-ramp queue extends to the point where freeway flows may be affected. Queuing back into a freeway is a serious safety issue. This change is typically enabled by configuration of logic in the local controller to enact a preemption input to the controller which immediately (or as close as possible to immediately due to pedestrian movements and other constraints) services the oversaturated phase for a predetermined amount of time to clear the queue. Experts in Los Angeles, Houston, and North Carolina have reported use of such strategies. This strategy might be employed in other arterial situations with the installation of special queue detection on the exit side of the upstream intersection. When the detector occupancy threshold is exceeded on the queue detector, send a preempt to the controller for that phase. Use of detectors at typical placement of arterial detection at the stop bar and at extension locations would not be recommended with this strategy since there will be many “false positives”. Determining the
Extent Duration Causation Recurrence Symptoms
Movement Situational Signal Timing
Recurrent Starvation
Approach Intermittent Geometrics Non-recurrent
Spillback
Intersection Persistent Other modes StorageBlocking
Route Prolonged Demand Cross Blocking
One-wayarterial
UnplannedEvents
Two-way arterial
Planned Events
Interchange
Grid
Network
Application of Traffic Control Strategies for Mitigation of Oversaturated Conditions Page 59

duration of the preemption simply requires determining the amount of green time that is anticipated to be needed to clear the queue without creating a spillover condition downstream. Preemption is a disruptive traffic control practice, particularly considering the method that might be used by the controller to return to coordinated operation. Thus, this technique is recommended only in intermittent situations when the situation would be safety critical, such as if the queue were going to back up into a rail crossing. Similarly care should be taken to consider the storage space available downstream. If storage is a factor, then the problem is not an intersection problem but a route problem. Other strategies such as the forward-backward procedure discussed in Appendix B might be employed. Similar and less disruptive effects might be achieved by the use of “transit priority” type inputs to the controller. During transit priority, the green time for the service phase is either extended somewhat if it is already green, or other phases are truncated early if the transit phase is red. In this application, one might trigger a TSP mode for the oversaturated phase based on the occupancy value of a queue detector using controller logic. The other benefit of using a TSP operation is that the controller typically remains in coordination and does not have to go into a transition mode. No research has been done to validate the application of “transit priority” modes when an approach queue is intermittently oversaturated. Intuitively it seems to be a reasonable method to provide a local feedback-based mitigation approach for intermittent, non-recurrent oversaturation. There is a cost however, since queue detection would need to be installed. Table 11 illustrates the attributes of an oversaturation scenario that apply to green extension strategies.
Table 11. Allocation of green extension strategy to oversaturated scenarios
Extent Duration Causation Recurrence Symptoms
Movement Situational Signal Timing Recurrent Starvation
Approach Intermittent Geometrics Non-recurrent
Spillback
Intersection Persistent Other modes StorageBlocking
Route Prolonged Demand Cross Blocking
One-wayarterial
UnplannedEvents
Two-way arterial
Planned Events
Interchange
Grid
Network
Application of Traffic Control Strategies for Mitigation of Oversaturated Conditions Page 60
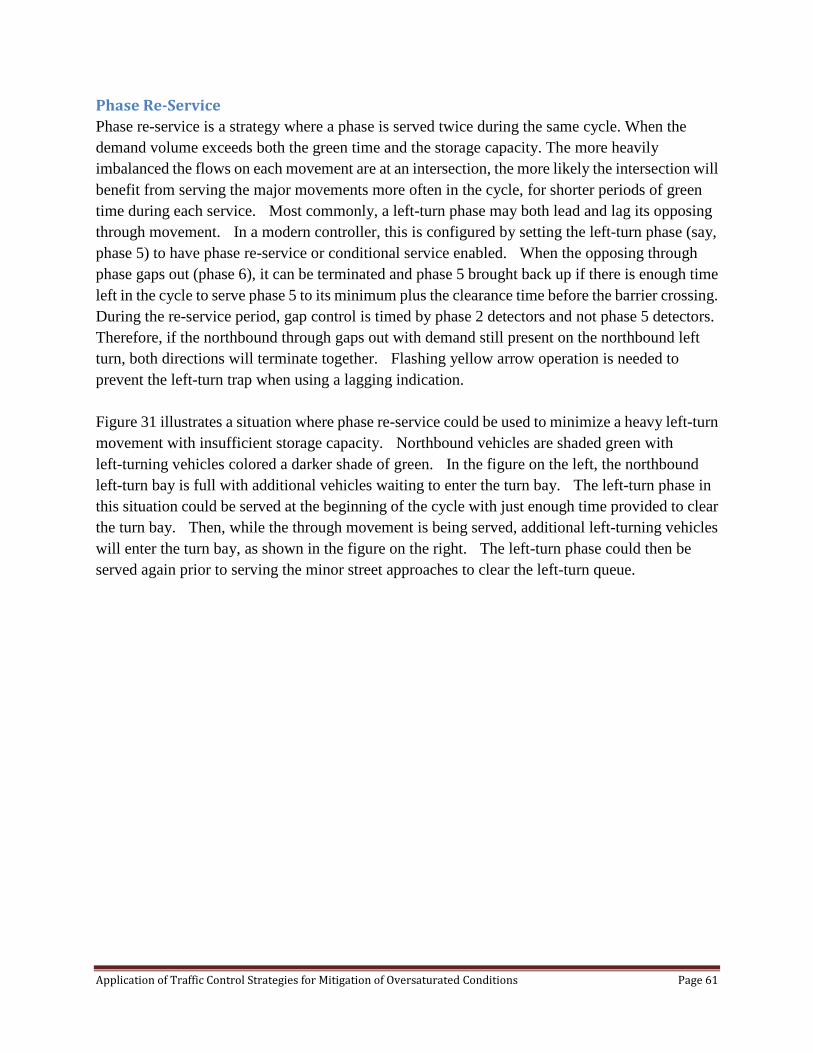
Phase Re-Service Phase re-service is a strategy where a phase is served twice during the same cycle. When the demand volume exceeds both the green time and the storage capacity. The more heavily imbalanced the flows on each movement are at an intersection, the more likely the intersection will benefit from serving the major movements more often in the cycle, for shorter periods of green time during each service. Most commonly, a left-turn phase may both lead and lag its opposing through movement. In a modern controller, this is configured by setting the left-turn phase (say, phase 5) to have phase re-service or conditional service enabled. When the opposing through phase gaps out (phase 6), it can be terminated and phase 5 brought back up if there is enough time left in the cycle to serve phase 5 to its minimum plus the clearance time before the barrier crossing. During the re-service period, gap control is timed by phase 2 detectors and not phase 5 detectors. Therefore, if the northbound through gaps out with demand still present on the northbound left turn, both directions will terminate together. Flashing yellow arrow operation is needed to prevent the left-turn trap when using a lagging indication. Figure 31 illustrates a situation where phase re-service could be used to minimize a heavy left-turn movement with insufficient storage capacity. Northbound vehicles are shaded green with left-turning vehicles colored a darker shade of green. In the figure on the left, the northbound left-turn bay is full with additional vehicles waiting to enter the turn bay. The left-turn phase in this situation could be served at the beginning of the cycle with just enough time provided to clear the turn bay. Then, while the through movement is being served, additional left-turning vehicles will enter the turn bay, as shown in the figure on the right. The left-turn phase could then be served again prior to serving the minor street approaches to clear the left-turn queue.
Application of Traffic Control Strategies for Mitigation of Oversaturated Conditions Page 61
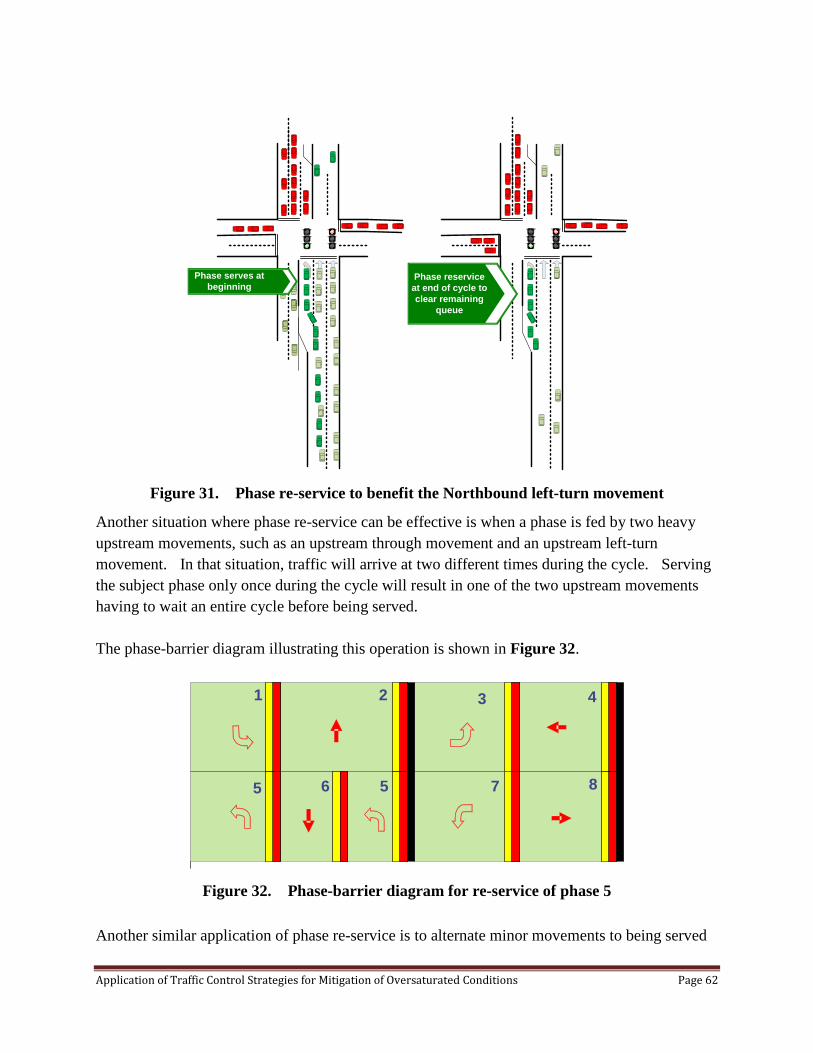
Figure 31. Phase re-service to benefit the Northbound left-turn movement
Another situation where phase re-service can be effective is when a phase is fed by two heavy upstream movements, such as an upstream through movement and an upstream left-turn movement. In that situation, traffic will arrive at two different times during the cycle. Serving the subject phase only once during the cycle will result in one of the two upstream movements having to wait an entire cycle before being served. The phase-barrier diagram illustrating this operation is shown in Figure 32.
Figure 32. Phase-barrier diagram for re-service of phase 5
Another similar application of phase re-service is to alternate minor movements to being served
Phase serves at beginning
Phase reservice at end of cycle to clear remaining
queue
5 6 1 7 8
4321
5
Application of Traffic Control Strategies for Mitigation of Oversaturated Conditions Page 62
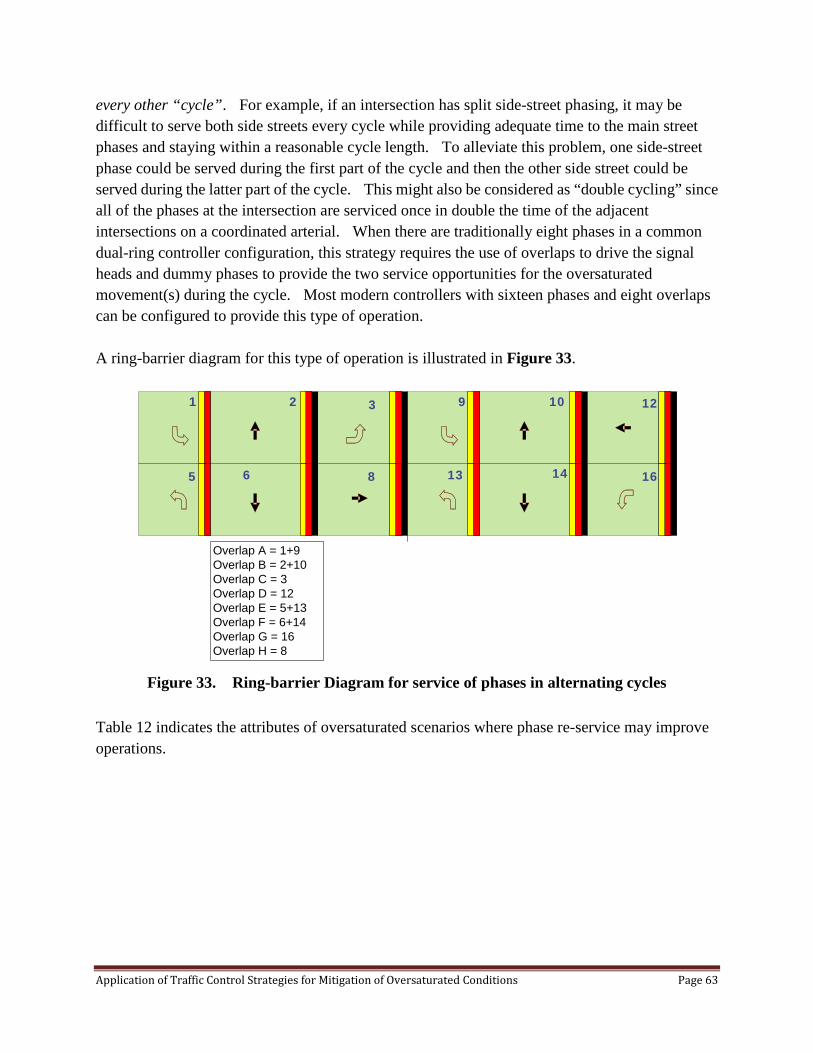
every other “cycle”. For example, if an intersection has split side-street phasing, it may be difficult to serve both side streets every cycle while providing adequate time to the main street phases and staying within a reasonable cycle length. To alleviate this problem, one side-street phase could be served during the first part of the cycle and then the other side street could be served during the latter part of the cycle. This might also be considered as “double cycling” since all of the phases at the intersection are serviced once in double the time of the adjacent intersections on a coordinated arterial. When there are traditionally eight phases in a common dual-ring controller configuration, this strategy requires the use of overlaps to drive the signal heads and dummy phases to provide the two service opportunities for the oversaturated movement(s) during the cycle. Most modern controllers with sixteen phases and eight overlaps can be configured to provide this type of operation. A ring-barrier diagram for this type of operation is illustrated in Figure 33.
Figure 33. Ring-barrier Diagram for service of phases in alternating cycles
Table 12 indicates the attributes of oversaturated scenarios where phase re-service may improve operations.
5 6 1 8
321
1
12109
13 14 16
Overlap A = 1+9Overlap B = 2+10Overlap C = 3Overlap D = 12Overlap E = 5+13Overlap F = 6+14Overlap G = 16Overlap H = 8
Application of Traffic Control Strategies for Mitigation of Oversaturated Conditions Page 63
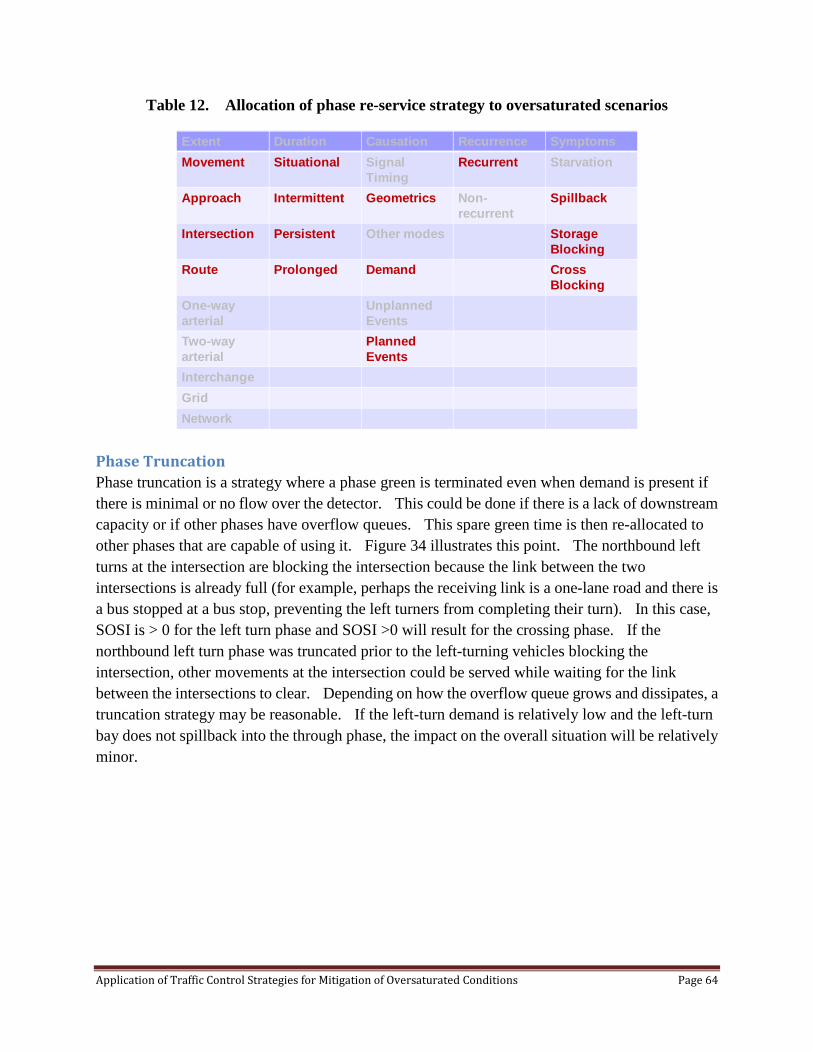
Table 12. Allocation of phase re-service strategy to oversaturated scenarios
Phase Truncation Phase truncation is a strategy where a phase green is terminated even when demand is present if there is minimal or no flow over the detector. This could be done if there is a lack of downstream capacity or if other phases have overflow queues. This spare green time is then re-allocated to other phases that are capable of using it. Figure 34 illustrates this point. The northbound left turns at the intersection are blocking the intersection because the link between the two intersections is already full (for example, perhaps the receiving link is a one-lane road and there is a bus stopped at a bus stop, preventing the left turners from completing their turn). In this case, SOSI is > 0 for the left turn phase and SOSI >0 will result for the crossing phase. If the northbound left turn phase was truncated prior to the left-turning vehicles blocking the intersection, other movements at the intersection could be served while waiting for the link between the intersections to clear. Depending on how the overflow queue grows and dissipates, a truncation strategy may be reasonable. If the left-turn demand is relatively low and the left-turn bay does not spillback into the through phase, the impact on the overall situation will be relatively minor.
Extent Duration Causation Recurrence Symptoms
Movement Situational Signal Timing
Recurrent Starvation
Approach Intermittent Geometrics Non-recurrent
Spillback
Intersection Persistent Other modes StorageBlocking
Route Prolonged Demand Cross Blocking
One-wayarterial
UnplannedEvents
Two-way arterial
Planned Events
Interchange
Grid
Network
Application of Traffic Control Strategies for Mitigation of Oversaturated Conditions Page 64
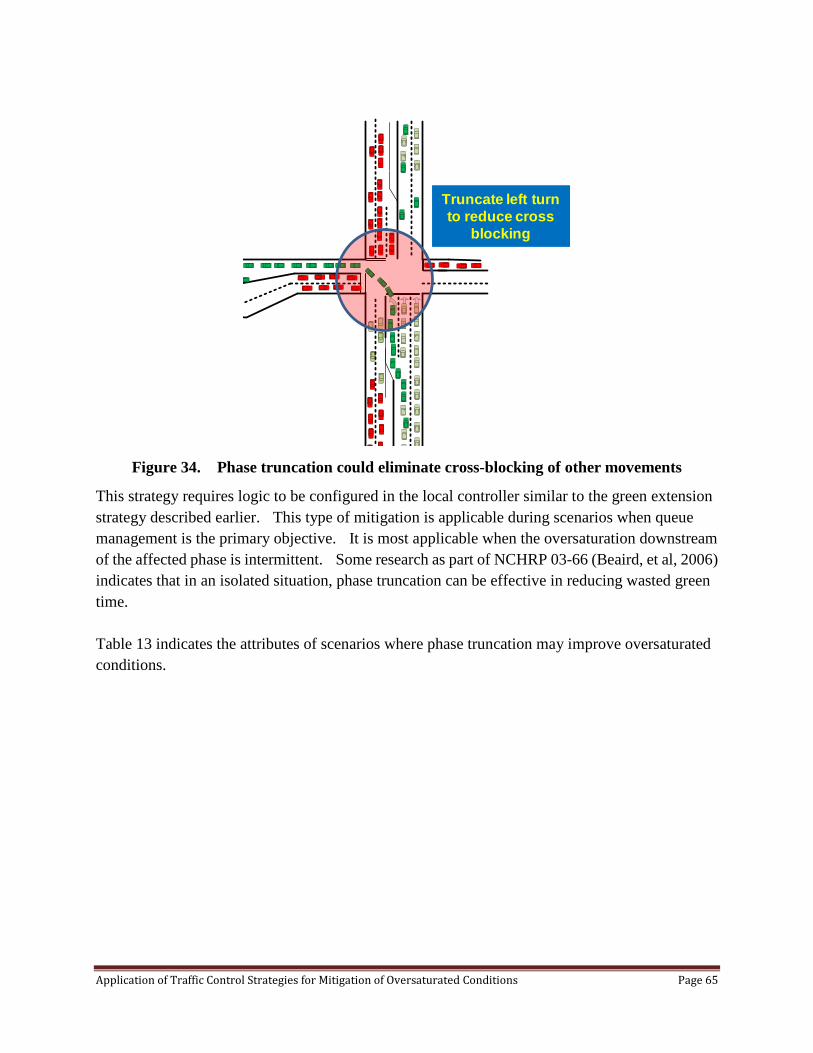
Figure 34. Phase truncation could eliminate cross-blocking of other movements
This strategy requires logic to be configured in the local controller similar to the green extension strategy described earlier. This type of mitigation is applicable during scenarios when queue management is the primary objective. It is most applicable when the oversaturation downstream of the affected phase is intermittent. Some research as part of NCHRP 03-66 (Beaird, et al, 2006) indicates that in an isolated situation, phase truncation can be effective in reducing wasted green time. Table 13 indicates the attributes of scenarios where phase truncation may improve oversaturated conditions.
Truncate left turn to reduce cross
blocking
Application of Traffic Control Strategies for Mitigation of Oversaturated Conditions Page 65
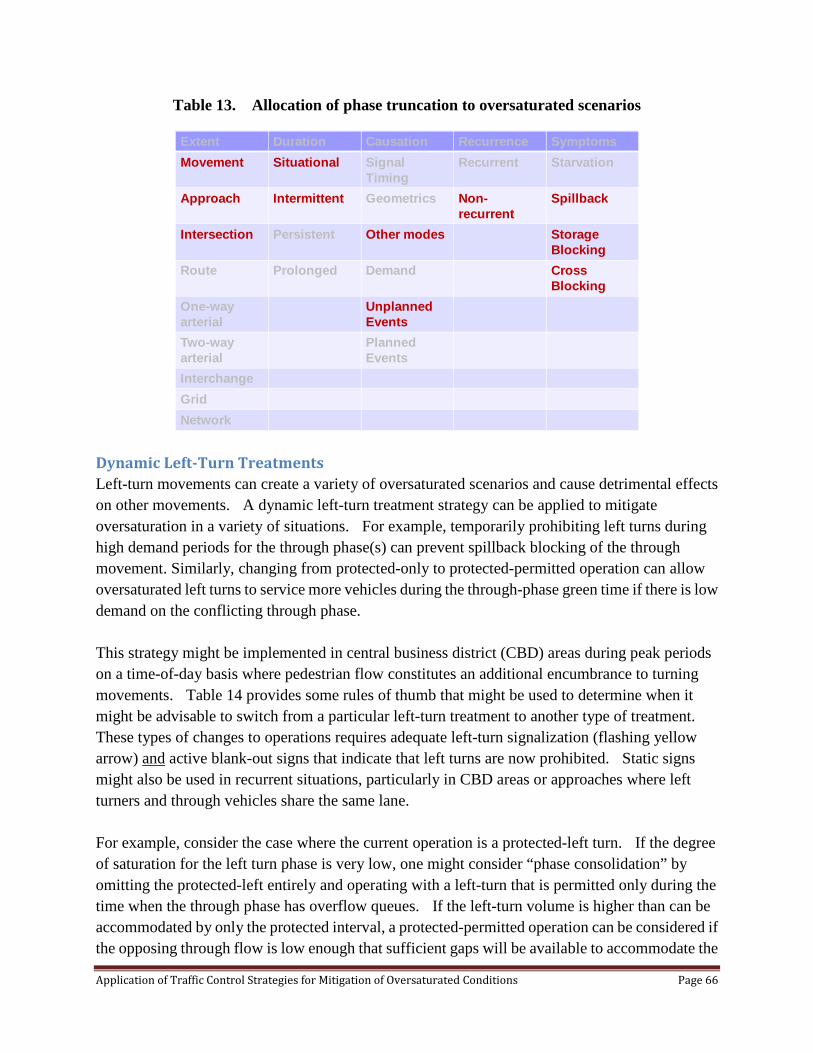
Table 13. Allocation of phase truncation to oversaturated scenarios
Dynamic Left-Turn Treatments Left-turn movements can create a variety of oversaturated scenarios and cause detrimental effects on other movements. A dynamic left-turn treatment strategy can be applied to mitigate oversaturation in a variety of situations. For example, temporarily prohibiting left turns during high demand periods for the through phase(s) can prevent spillback blocking of the through movement. Similarly, changing from protected-only to protected-permitted operation can allow oversaturated left turns to service more vehicles during the through-phase green time if there is low demand on the conflicting through phase. This strategy might be implemented in central business district (CBD) areas during peak periods on a time-of-day basis where pedestrian flow constitutes an additional encumbrance to turning movements. Table 14 provides some rules of thumb that might be used to determine when it might be advisable to switch from a particular left-turn treatment to another type of treatment. These types of changes to operations requires adequate left-turn signalization (flashing yellow arrow) and active blank-out signs that indicate that left turns are now prohibited. Static signs might also be used in recurrent situations, particularly in CBD areas or approaches where left turners and through vehicles share the same lane. For example, consider the case where the current operation is a protected-left turn. If the degree of saturation for the left turn phase is very low, one might consider “phase consolidation” by omitting the protected-left entirely and operating with a left-turn that is permitted only during the time when the through phase has overflow queues. If the left-turn volume is higher than can be accommodated by only the protected interval, a protected-permitted operation can be considered if the opposing through flow is low enough that sufficient gaps will be available to accommodate the
Extent Duration Causation Recurrence Symptoms
Movement Situational Signal Timing
Recurrent Starvation
Approach Intermittent Geometrics Non-recurrent
Spillback
Intersection Persistent Other modes StorageBlocking
Route Prolonged Demand Cross Blocking
One-wayarterial
UnplannedEvents
Two-way arterial
Planned Events
Interchange
Grid
Network
Application of Traffic Control Strategies for Mitigation of Oversaturated Conditions Page 66
permitted left turns. More extensive research is warranted to validate the rules in Table 14. The left-hand column of indicates the current left-turn treatment. The top row of the Table indicates the alternative strategy that could be used. Each cell of the table indicates the local conditions that would need to be true to consider switching from the current strategy to the new one. For example, consider the case where the current left-turn treatment is a permitted turn only. If the compatible through phase is oversaturated and there are many pedestrians crossing in the conflicting crosswalk, the left-turn could be changed to protected-only if there is moderate left-turn demand. If the left-turn demand is low, it might be prohibited altogether to improve the operation of the through phase. Similar to the rules that might be used to employ green-extension or phase truncation strategies, care must be taken to ensure that the oversaturated conditions are localized to this intersection to avoid creating other oversaturation problems elsewhere. Off-line evaluation and incorporation of such strategies into the TOD schedule of the signal controller is a more reliable way to employ such strategies rather than using the logic processor of the controller or traffic responsive operation although careful configuration of logic processors for on-line operation is feasible.
Application of Traffic Control Strategies for Mitigation of Oversaturated Conditions Page 67
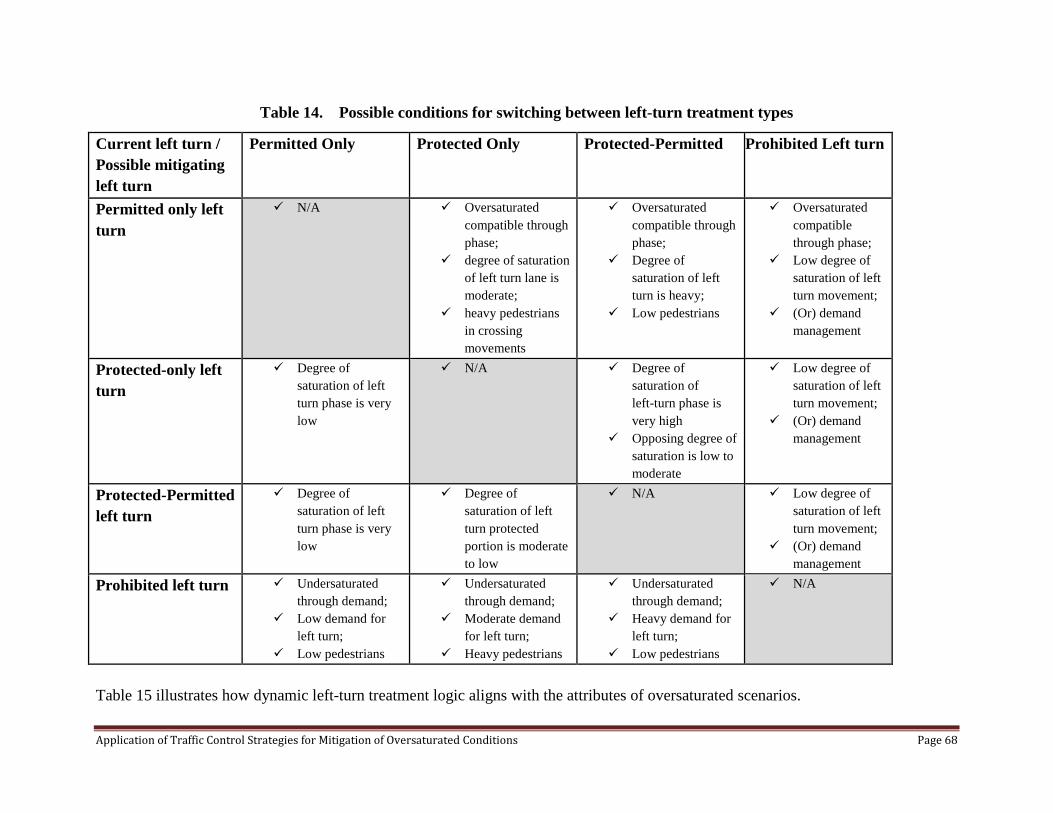
Table 14. Possible conditions for switching between left-turn treatment types
Current left turn / Possible mitigating left turn
Permitted Only Protected Only Protected-Permitted Prohibited Left turn
Permitted only left turn
N/A Oversaturated compatible through phase;
degree of saturation of left turn lane is moderate;
heavy pedestrians in crossing movements
Oversaturated compatible through phase;
Degree of saturation of left turn is heavy;
Low pedestrians
Oversaturated compatible through phase;
Low degree of saturation of left turn movement;
(Or) demand management
Protected-only left turn
Degree of saturation of left turn phase is very low
N/A Degree of saturation of left-turn phase is very high
Opposing degree of saturation is low to moderate
Low degree of saturation of left turn movement;
(Or) demand management
Protected-Permitted left turn
Degree of saturation of left turn phase is very low
Degree of saturation of left turn protected portion is moderate to low
N/A Low degree of saturation of left turn movement;
(Or) demand management
Prohibited left turn Undersaturated through demand;
Low demand for left turn;
Low pedestrians
Undersaturated through demand;
Moderate demand for left turn;
Heavy pedestrians
Undersaturated through demand;
Heavy demand for left turn;
Low pedestrians
N/A
Table 15 illustrates how dynamic left-turn treatment logic aligns with the attributes of oversaturated scenarios.
Application of Traffic Control Strategies for Mitigation of Oversaturated Conditions Page 68
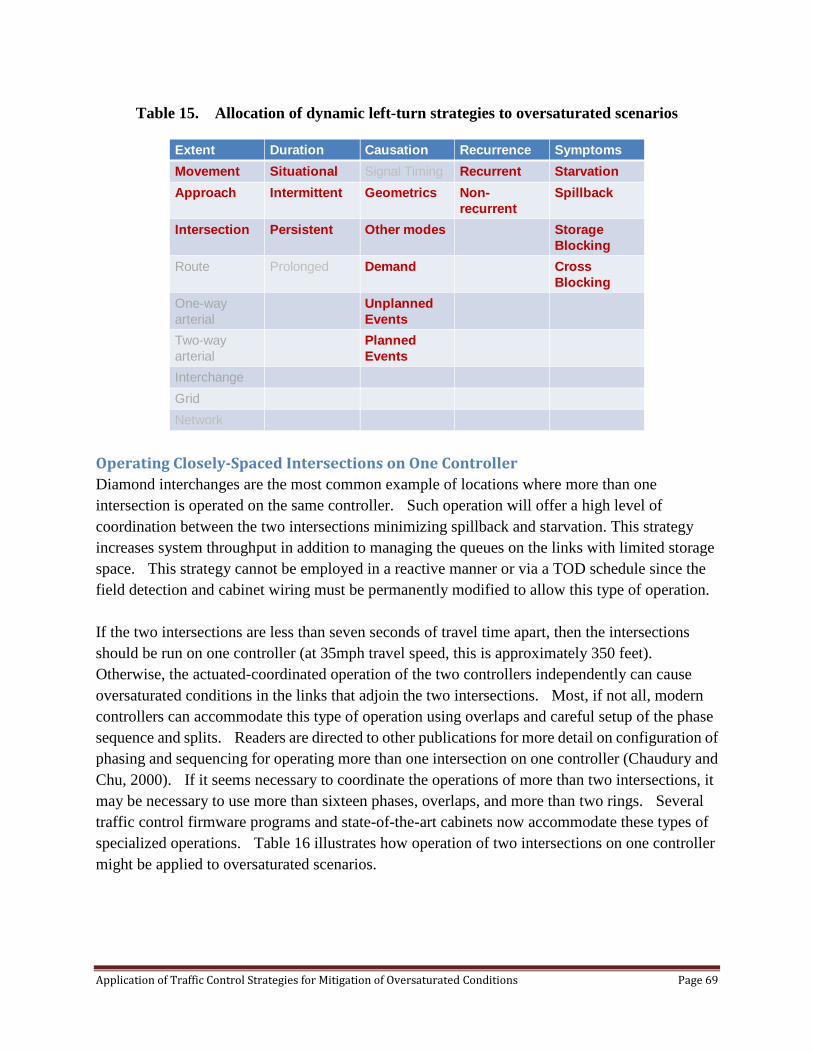
Table 15. Allocation of dynamic left-turn strategies to oversaturated scenarios
Operating Closely-Spaced Intersections on One Controller Diamond interchanges are the most common example of locations where more than one intersection is operated on the same controller. Such operation will offer a high level of coordination between the two intersections minimizing spillback and starvation. This strategy increases system throughput in addition to managing the queues on the links with limited storage space. This strategy cannot be employed in a reactive manner or via a TOD schedule since the field detection and cabinet wiring must be permanently modified to allow this type of operation. If the two intersections are less than seven seconds of travel time apart, then the intersections should be run on one controller (at 35mph travel speed, this is approximately 350 feet). Otherwise, the actuated-coordinated operation of the two controllers independently can cause oversaturated conditions in the links that adjoin the two intersections. Most, if not all, modern controllers can accommodate this type of operation using overlaps and careful setup of the phase sequence and splits. Readers are directed to other publications for more detail on configuration of phasing and sequencing for operating more than one intersection on one controller (Chaudury and Chu, 2000). If it seems necessary to coordinate the operations of more than two intersections, it may be necessary to use more than sixteen phases, overlaps, and more than two rings. Several traffic control firmware programs and state-of-the-art cabinets now accommodate these types of specialized operations. Table 16 illustrates how operation of two intersections on one controller might be applied to oversaturated scenarios.
Extent Duration Causation Recurrence Symptoms
Movement Situational Signal Timing Recurrent Starvation
Approach Intermittent Geometrics Non-recurrent
Spillback
Intersection Persistent Other modes StorageBlocking
Route Prolonged Demand Cross Blocking
One-wayarterial
UnplannedEvents
Two-way arterial
Planned Events
Interchange
Grid
Network
Application of Traffic Control Strategies for Mitigation of Oversaturated Conditions Page 69
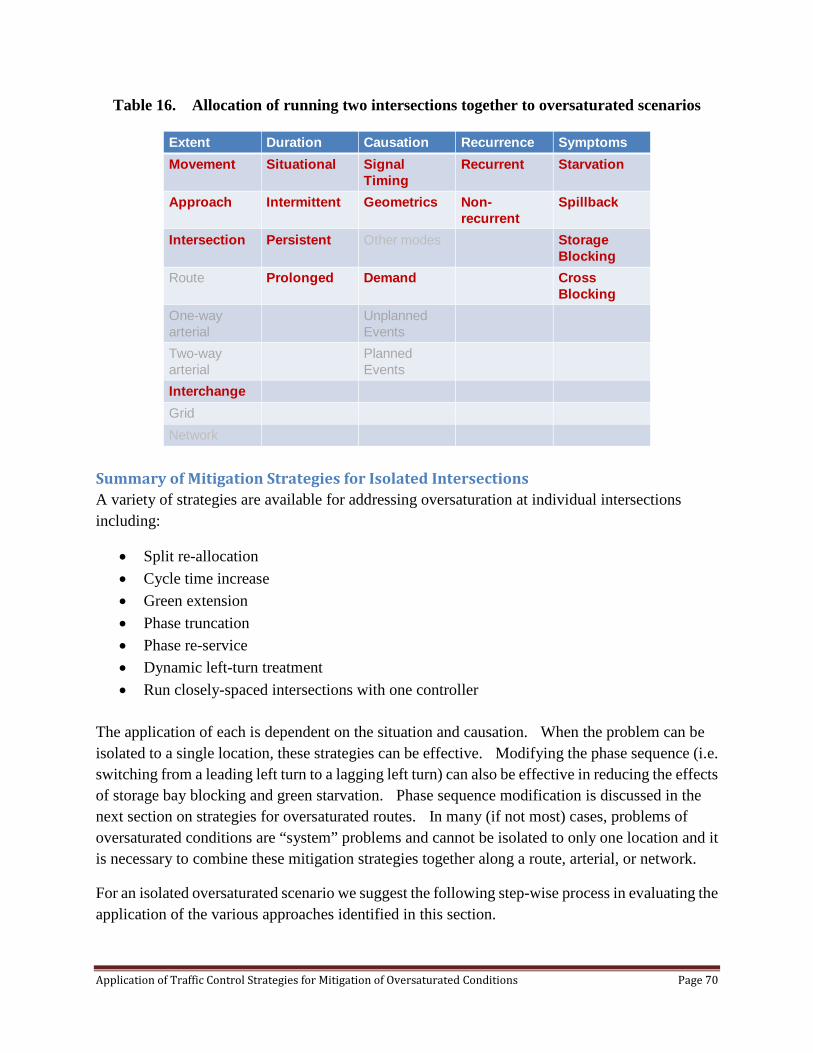
Table 16. Allocation of running two intersections together to oversaturated scenarios
Summary of Mitigation Strategies for Isolated Intersections A variety of strategies are available for addressing oversaturation at individual intersections including:
• Split re-allocation • Cycle time increase • Green extension • Phase truncation • Phase re-service • Dynamic left-turn treatment • Run closely-spaced intersections with one controller
The application of each is dependent on the situation and causation. When the problem can be isolated to a single location, these strategies can be effective. Modifying the phase sequence (i.e. switching from a leading left turn to a lagging left turn) can also be effective in reducing the effects of storage bay blocking and green starvation. Phase sequence modification is discussed in the next section on strategies for oversaturated routes. In many (if not most) cases, problems of oversaturated conditions are “system” problems and cannot be isolated to only one location and it is necessary to combine these mitigation strategies together along a route, arterial, or network.
For an isolated oversaturated scenario we suggest the following step-wise process in evaluating the application of the various approaches identified in this section.
Extent Duration Causation Recurrence Symptoms
Movement Situational Signal Timing
Recurrent Starvation
Approach Intermittent Geometrics Non-recurrent
Spillback
Intersection Persistent Other modes StorageBlocking
Route Prolonged Demand Cross Blocking
One-wayarterial
UnplannedEvents
Two-way arterial
Planned Events
Interchange
Grid
Network
Application of Traffic Control Strategies for Mitigation of Oversaturated Conditions Page 70
1. Collect and tabulate observation data at the subject intersection during the oversaturated condition. Estimation of TOSI and SOSI measures and overflow queue dynamics can be helpful.
2. If there is another signal < 7s travel time from this signal, consider operating the two on one controller.
3. If SOSI > 0 for more than one phases, consider route mitigation strategies, unless the SOSI condition is caused by factors that could not be addressed by adjusting downstream signal timing.
4. If the SOSI condition is isolated to a single phase that has spare capacity, consider phase truncation. If the application of truncation would cause blockage and starvation issues, consider other mitigations.
5. If the oversaturated condition is isolated to left-turn phases, consider dynamic left turns and phase sequence changes.
6. If the oversaturation is isolated to TOSI > 0 for a single phase or movement, consider split re-allocation or green extension.
7. If oversaturated conditions exist on multiple phases, or there is no available split time that can reasonably be re-allocated, consider cycle time modification.
8. If cycle time modification would result in an excessively long cycle, and some minor phases have spare capacity, consider phase re-service.
9. If all phases are oversaturated, consider a lower cycle that minimizes overflow queues.
Application of Traffic Control Strategies for Mitigation of Oversaturated Conditions Page 71
Strategies for Mitigating Oversaturated Conditions on Routes and Arterials A variety of strategies are available for addressing oversaturation on routes and arterials, including:
• Negative and simultaneous offsets • Lead/lag phase sequences • Finding the “right” cycle time • “Flaring” green times using TOSI and SOSI estimates • Corridor preemption (green “flush”)
The application of each is dependent on the situation and causation and in most cases they will need to be combined with intersection specific strategies along the oversaturated route.
Negative and Simultaneous Offsets Arterial progression minimizes vehicle stops on coordinated routes by sequencing the green times on adjacent intersections along a travel path such that a green band is developed. Vehicles traveling at the right speed can thus proceed along the route without stopping. Most green band design algorithms (e.g.. PASSER, TRANSYT, Synchro) assume that vehicles can progress along the route unimpeded by overflow downstream queues. Most offset design algorithms assume that the queue will be cleared by the time that the first traffic arrives at the downstream stop bar. When overflow queues begin to form (i.e. oversaturation), these assumptions are violated since closed-form mathematical approaches are not available to estimate performance measures (stops and delays) typically used for offset design. In certain cases where the storage space is limited, “negative” offsets can be used to release the downstream traffic earlier and slow the growth of the overflow queue. In this context, it is important to remember that the offset reference point considered in this strategy is the start of the green time of the coordinated phases and not the offset reference point used by the controller. Based on the green time of each coordinated phase, a negative or simultaneous relationship between the start times of the green phases may or may not result in a similar relationship between the actual offsets coded into the controller, if the offset reference being used is, for example, the beginning of yellow on the leading or lagging coordinated phase (common in NEMA controllers). As illustrated in Figure 35, a simultaneous offset is the special case when the offset between the start times of two progression phases is zero. In this example, the progression direction is considered to be to the Northeast on the figure as time increases on the x-axis and distance increases on the y-axis. Application of a simultaneous offset is appropriate in the case where the overflow queue on each approach is approximately the same, the green time of each progression phase is approximately equal, and thus the queue growth rate of the two queues is approximately
Application of Traffic Control Strategies for Mitigation of Oversaturated Conditions Page 72

the same. This approach in queuing theory language is sometimes referred to as “store and forward”.
Figure 35. Example - Simultaneous Offsets
Figure 36 illustrates the concept of negative offsets. A negative offset exists if the green at the downstream coordination phase starts prior to the green time at the upstream intersection. This allows the downstream overflow queue to begin moving sooner, which results in less wasted green time where the upstream arriving platoon arrives to the back of the queue, but cannot progress unimpeded. Negative offsets will not clear an overflow queue by themselves if the green time is not adequate for the traffic demand, but they can be effective in reducing the multiplicative negative effects of positive progression offsets that are designed without considering the existence of downstream queues. More powerful improvements can be experienced, as one might expect, by combining green re-allocation and cycle time adjustments together with negative and simultaneous offsets. Without increasing green time for the oversaturated phase, adjustments to negative offsets can only marginally reduce the growth rate of the overflow queue. It is important to note that once the queue grows to a length such that the entire green time is now being spent only on clearing the overflow queue or only on some portion overflow queue (i.e. vehicles in the queue take more than two cycles to clear the intersection), the cause-effect relationship between the offset at the upstream and downstream intersections is no longer meaningful. During this operating condition, the performance of alternate offset values, negative, positive, or otherwise, will be essentially the same. Once the heavy demand rates have subsided,
ProgressionDirection
1
Application of Traffic Control Strategies for Mitigation of Oversaturated Conditions Page 73
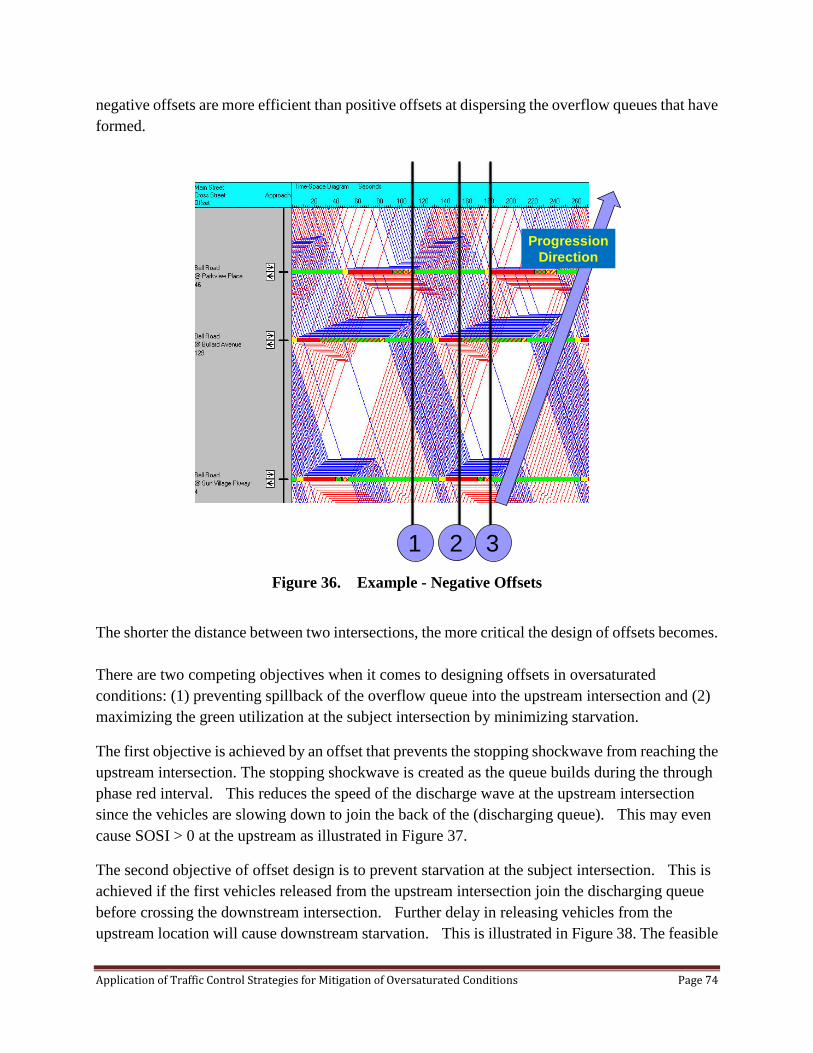
negative offsets are more efficient than positive offsets at dispersing the overflow queues that have formed.
Figure 36. Example - Negative Offsets
The shorter the distance between two intersections, the more critical the design of offsets becomes. There are two competing objectives when it comes to designing offsets in oversaturated conditions: (1) preventing spillback of the overflow queue into the upstream intersection and (2) maximizing the green utilization at the subject intersection by minimizing starvation.
The first objective is achieved by an offset that prevents the stopping shockwave from reaching the upstream intersection. The stopping shockwave is created as the queue builds during the through phase red interval. This reduces the speed of the discharge wave at the upstream intersection since the vehicles are slowing down to join the back of the (discharging queue). This may even cause SOSI > 0 at the upstream as illustrated in Figure 37.
The second objective of offset design is to prevent starvation at the subject intersection. This is achieved if the first vehicles released from the upstream intersection join the discharging queue before crossing the downstream intersection. Further delay in releasing vehicles from the upstream location will cause downstream starvation. This is illustrated in Figure 38. The feasible
1 2 3
ProgressionDirection
Application of Traffic Control Strategies for Mitigation of Oversaturated Conditions Page 74
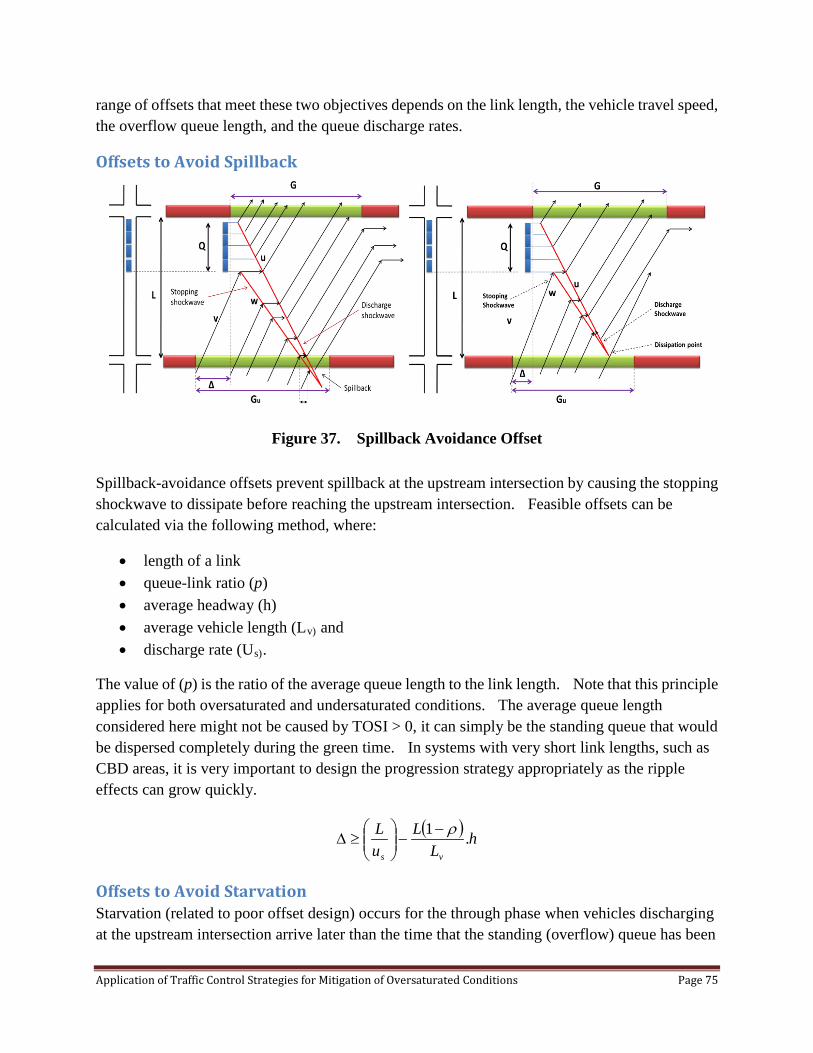
range of offsets that meet these two objectives depends on the link length, the vehicle travel speed, the overflow queue length, and the queue discharge rates.
Offsets to Avoid Spillback
Figure 37. Spillback Avoidance Offset
Spillback-avoidance offsets prevent spillback at the upstream intersection by causing the stopping shockwave to dissipate before reaching the upstream intersection. Feasible offsets can be calculated via the following method, where:
• length of a link • queue-link ratio (p) • average headway (h) • average vehicle length (Lv) and • discharge rate (Us).
The value of (p) is the ratio of the average queue length to the link length. Note that this principle applies for both oversaturated and undersaturated conditions. The average queue length considered here might not be caused by TOSI > 0, it can simply be the standing queue that would be dispersed completely during the green time. In systems with very short link lengths, such as CBD areas, it is very important to design the progression strategy appropriately as the ripple effects can grow quickly.
( ) hL
LuL
vs
.1 ρ−−
≥∆
Offsets to Avoid Starvation Starvation (related to poor offset design) occurs for the through phase when vehicles discharging at the upstream intersection arrive later than the time that the standing (overflow) queue has been
Application of Traffic Control Strategies for Mitigation of Oversaturated Conditions Page 75
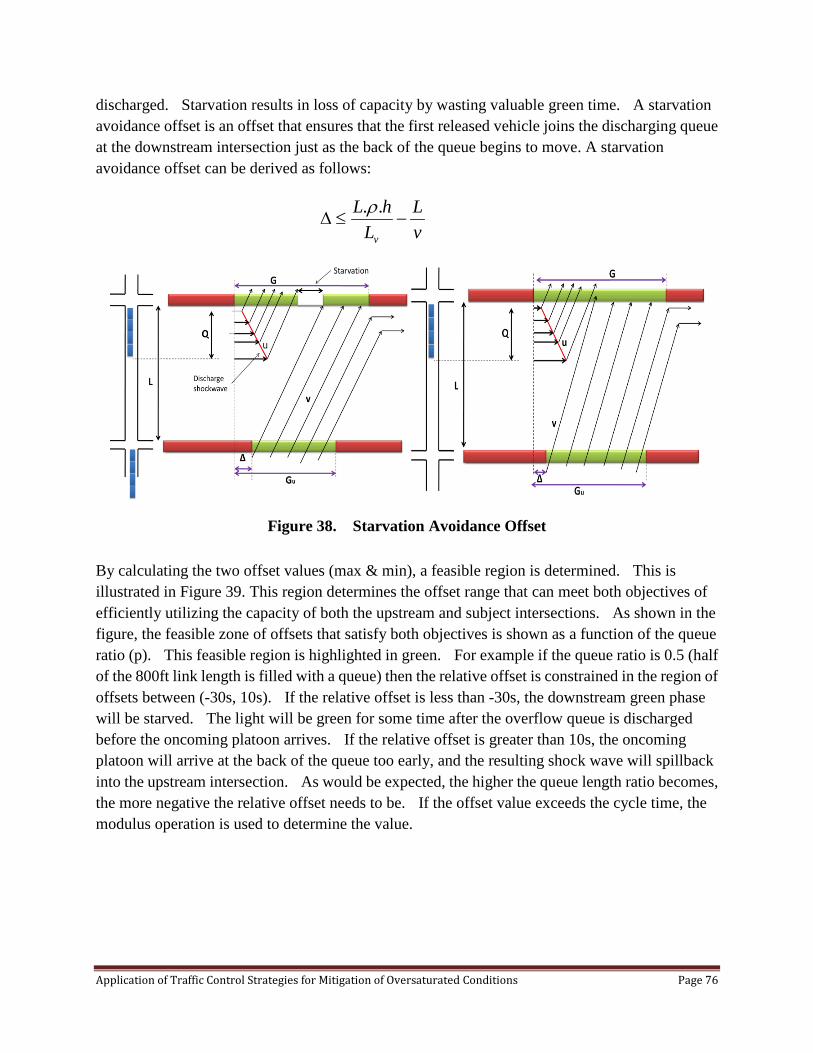
discharged. Starvation results in loss of capacity by wasting valuable green time. A starvation avoidance offset is an offset that ensures that the first released vehicle joins the discharging queue at the downstream intersection just as the back of the queue begins to move. A starvation avoidance offset can be derived as follows:
Figure 38. Starvation Avoidance Offset
By calculating the two offset values (max & min), a feasible region is determined. This is illustrated in Figure 39. This region determines the offset range that can meet both objectives of efficiently utilizing the capacity of both the upstream and subject intersections. As shown in the figure, the feasible zone of offsets that satisfy both objectives is shown as a function of the queue ratio (p). This feasible region is highlighted in green. For example if the queue ratio is 0.5 (half of the 800ft link length is filled with a queue) then the relative offset is constrained in the region of offsets between (-30s, 10s). If the relative offset is less than -30s, the downstream green phase will be starved. The light will be green for some time after the overflow queue is discharged before the oncoming platoon arrives. If the relative offset is greater than 10s, the oncoming platoon will arrive at the back of the queue too early, and the resulting shock wave will spillback into the upstream intersection. As would be expected, the higher the queue length ratio becomes, the more negative the relative offset needs to be. If the offset value exceeds the cycle time, the modulus operation is used to determine the value.
vL
LhL
v
−≤∆..ρ
Application of Traffic Control Strategies for Mitigation of Oversaturated Conditions Page 76
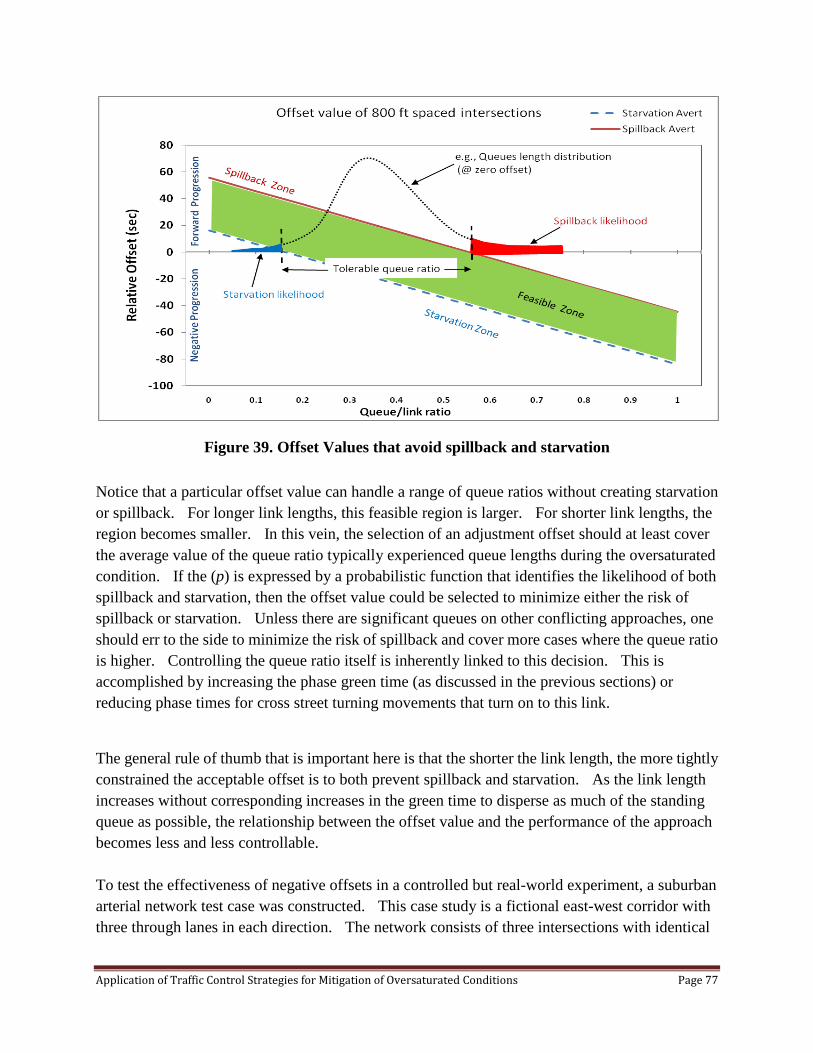
Figure 39. Offset Values that avoid spillback and starvation
Notice that a particular offset value can handle a range of queue ratios without creating starvation or spillback. For longer link lengths, this feasible region is larger. For shorter link lengths, the region becomes smaller. In this vein, the selection of an adjustment offset should at least cover the average value of the queue ratio typically experienced queue lengths during the oversaturated condition. If the (p) is expressed by a probabilistic function that identifies the likelihood of both spillback and starvation, then the offset value could be selected to minimize either the risk of spillback or starvation. Unless there are significant queues on other conflicting approaches, one should err to the side to minimize the risk of spillback and cover more cases where the queue ratio is higher. Controlling the queue ratio itself is inherently linked to this decision. This is accomplished by increasing the phase green time (as discussed in the previous sections) or reducing phase times for cross street turning movements that turn on to this link.
The general rule of thumb that is important here is that the shorter the link length, the more tightly constrained the acceptable offset is to both prevent spillback and starvation. As the link length increases without corresponding increases in the green time to disperse as much of the standing queue as possible, the relationship between the offset value and the performance of the approach becomes less and less controllable. To test the effectiveness of negative offsets in a controlled but real-world experiment, a suburban arterial network test case was constructed. This case study is a fictional east-west corridor with three through lanes in each direction. The network consists of three intersections with identical
Application of Traffic Control Strategies for Mitigation of Oversaturated Conditions Page 77
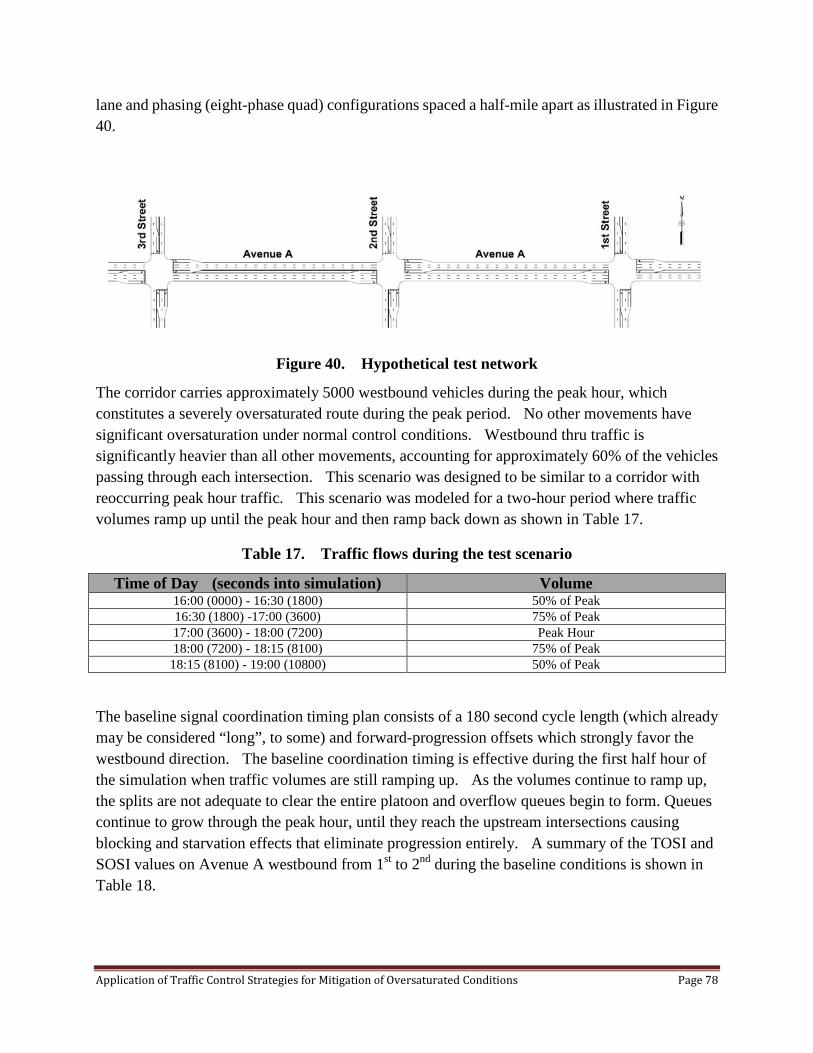
lane and phasing (eight-phase quad) configurations spaced a half-mile apart as illustrated in Figure 40.
Figure 40. Hypothetical test network
The corridor carries approximately 5000 westbound vehicles during the peak hour, which constitutes a severely oversaturated route during the peak period. No other movements have significant oversaturation under normal control conditions. Westbound thru traffic is significantly heavier than all other movements, accounting for approximately 60% of the vehicles passing through each intersection. This scenario was designed to be similar to a corridor with reoccurring peak hour traffic. This scenario was modeled for a two-hour period where traffic volumes ramp up until the peak hour and then ramp back down as shown in Table 17.
Table 17. Traffic flows during the test scenario
Time of Day (seconds into simulation) Volume 16:00 (0000) - 16:30 (1800) 50% of Peak 16:30 (1800) -17:00 (3600) 75% of Peak 17:00 (3600) - 18:00 (7200) Peak Hour 18:00 (7200) - 18:15 (8100) 75% of Peak
18:15 (8100) - 19:00 (10800) 50% of Peak
The baseline signal coordination timing plan consists of a 180 second cycle length (which already may be considered “long”, to some) and forward-progression offsets which strongly favor the westbound direction. The baseline coordination timing is effective during the first half hour of the simulation when traffic volumes are still ramping up. As the volumes continue to ramp up, the splits are not adequate to clear the entire platoon and overflow queues begin to form. Queues continue to grow through the peak hour, until they reach the upstream intersections causing blocking and starvation effects that eliminate progression entirely. A summary of the TOSI and SOSI values on Avenue A westbound from 1st to 2nd during the baseline conditions is shown in Table 18.
Application of Traffic Control Strategies for Mitigation of Oversaturated Conditions Page 78

Table 18. Tabulation of TOSI and SOSI data for peak hour
2nd and Avenue A, Phase 2 Westbound (180s cycle) Peak Hour Cycle Vehicles
Per Green
(per lane)
Green Time (sec)
Overflow queue
(veh per lane)
TOSI (% of green)
SOSI (sec
green)
SOSI (% of green)
1 37 78 10 25 2 37 78 15 38 3 37 78 35 90 4 37 78 35 90 5 37 78 45 115 6 37 78 55 141 7 35 78 65 167 8 34 78 80 205 9 32 78 90 231 10 30 78 100 256 10 13 11 30 78 115 295 10 13 12 30 78 120 308 10 13 13 30 78 125 321 10 13 14 30 78 130 333 10 13 15 30 78 130 333 10 13 16 30 78 132 338 10 13 17 30 78 135 346 10 13 18 30 78 130 333 10 13
The mitigation strategies which were analyzed for this test case are summarized in Table 19. Application of the cycle time increase and flush strategies will be discussed further in the sections related to those mitigation strategies.
Using the design principles above, we calculated the negative offset to prevent spillback as:
∆≥ 260066 𝑓𝑡/𝑠
− 2600(1−0.9)18𝑓𝑡
∗ 1.5𝑠 = 39.4 – 21.7 = 18
Preventing starvation was not going to be a limiting factor in this scenario. Note that Δ is defined as the difference between the start time of the upstream phase and the downstream green phase, so a positive value of delta is a negative offset. We adjusted the signal timings so that the start time of the westbound phase at 2nd and Avenue A started 18s after the start time at of the westbound phase at 3rd and Avenue A.
Application of Traffic Control Strategies for Mitigation of Oversaturated Conditions Page 79

Table 19. Application of mitigating strategies for this oversaturated route
Mitigation Strategy Description Negative Offsets Negative offsets were implemented in the westbound direction
to potentially clear downstream overflow queue. Negative Offsets and Increased Cycle Length
In addition to implementing negative offsets in the westbound direction, the cycle length was increased by 20 seconds. All the additional time was given to the westbound thru phase in the Ring 1 and divided between the eastbound thru and westbound left phases in Ring 2.
Corridor Flush In order to flush westbound traffic through the system, a 255 cycle length was implemented for three 9 minute periods during the peak hour. The additional 75 seconds was given to the westbound thru phase in Ring 1 and divided between the eastbound thru and westbound left phases in Ring 2. Throughout the remaining time during and after the peak hour, negative offsets in the westbound direction were implemented.
Each of the mitigation strategies was implemented by time of day schedule. The transition between plans was set to “dwell” in westbound thru and left to minimize the disruption to the oversaturated route. Negative offsets were implemented at the beginning of the peak hour (17:00/3600 sec) and continued running until the end of the simulation (19:00/10800 sec).
Five iterations of each mitigation strategy were run and the results were compared to baseline to determine better and worse conditions. In this test case, we computed average vehicle delay and average route travel time on critical routes to compare mitigations with the baseline operation. . All of the mitigation strategies improved the average travel time and delay for the westbound route as illustrated in Table 20. Table 21 indicates the meaning of the color indications in each cell of Table 20. Note that the side street links are negatively affected which is not shown in the Table.
Application of Traffic Control Strategies for Mitigation of Oversaturated Conditions Page 80

Table 20. Comparison of average vehicle delay for key movements
Table 21. Key to colored cells in performance comparison tables
Color Indication Green Mitigation is statistically significantly better than the
baseline operation (t-test value >4) Yellow Mitigation is marginally statistically significantly better
than the baseline operation (t-test value >2.5) White Mitigation is not statistically different from the baseline
operation (-2.5 < t-test value < 2.5 ) Orange Mitigation is marginally significantly worse than the
baseline operation (t-test value < -2.5) Red Mitigation is statistically significantly worse than the
baseline operation (t-test value < -4)
Segment Baseline Negative Offsets
Increase Cycle Length and Negative
Offsets Flush WB LT at 3rd Street-Avenue A 94.1 92.7 93.4 86.9
WB TH at 3rd Street-Avenue A 23.9 23.8 21.2 19.2 WB RT at 3rd Street-Avenue A 0.3 0.3 0.3 0.2 WB TH at 3rd Street-Avenue A Upstream of LT Bay 111.1 91.3 61.3 53.8
EB LT at 2nd Street-Avenue A 74.2 83.9 89.1 88.3
EB TH at 2nd Street-Avenue A 60.0 33.3 34.9 49.6
EB RT at 2nd Street-Avenue A 6.1 4.3 4.1 5.1 EB TH at 2nd Street-Avenue A Upstream of LT Bay 20.0 6.1 6.3 10.5
WB LT at 2nd Street-Avenue A 76.6 76.7 77.7 72.2
WB TH at 2nd Street-Avenue A 16.8 16.9 15.0 12.8
WB RT at 2nd Street-Avenue A 2.0 1.9 1.8 1.8 WB TH at 2nd Street-Avenue A Upstream of LT Bay 124.2 100.2 95.1 85.2
EB LT at 1st Street-Avenue A 83.5 93.1 107.1 97.2
EB TH at 1st Street-Avenue A 58.9 27.4 33.0 44.8
EB RT at 1st Street-Avenue A 5.5 3.8 4.3 4.5 EB TH at 1st Street-Avenue A Upstream of LT Bay 18.3 5.8 9.5 9.9
WB LT at 1st Street-Avenue A 89.7 87.9 80.7 78.5
WB TH at 1st Street-Avenue A 21.8 22.0 19.2 16.9
WB RT at 1st Street-Avenue A 2.7 2.7 2.8 2.6 WB TH at 1st Street-Avenue A Upstream of LT Bay 209.0 210.3 176.2 158.7
EB Avenue A 224.7 110.3 124.1 169.5
WB Avenue A 521.7 475.3 398.4 354.8
Application of Traffic Control Strategies for Mitigation of Oversaturated Conditions Page 81

Of the three mitigation strategies tested here, implementing negative offsets alone resulted in the least improvement to westbound travel time and delay (although these improvements were statistically significant), but this mitigation also had minimal negative impacts on the other approaches. Interestingly, the negative offsets for westbound traffic also constitute forward offsets for the Eastbound direction increasing the performance of that direction of travel as well.
The marginal benefit of negative offsets, as discussed previously, is primarily experienced when the overflow queue is not long enough yet that the entire green time is spent serving the overflow queue (i.e. TOSI is still < 1.0). After the overflow queue is longer than can be served by the allocated green time, the cause-effect relationship between the offsets and the upstream traffic flow is no longer direct and thus the performance of any kind of offset settings is indistinguishable from one another.
However, during the recovery time when the upstream traffic flows are reduced and TOSI drops below 1.0, the negative offsets again begin to outperform forward-progression offsets in flushing the overflow queues faster. These performance effects are difficult to isolate in high-level performance measures such as average travel time or average delay over relatively long periods of evaluation time. Similar performance benefits are experienced in almost all other test cases in that the performance of mitigation strategies (of almost any type) during the recovery period is superior to the baseline operation strategy.
Another important point is identified by this test case. As shown, the application of a particular set of negative offsets has a marginal benefit to the oversaturated movements. The spillback and starvation avoidance rules for setting offsets are based on the assumption that the green time is allocated such that the standing queue can be fully dispersed. When the queue is overflow, this, by definition, indicates that the queue will continue to grow over time since the green time is not long enough. The application of negative offsets helps to slow this growth rate. As the queue length changes over time, different negative offsets than the original settings are then necessary. This implies that an adaptive approach to offset changes (i.e. a sequence of offset adjustments over time) may be more appropriate to obtain additional marginal benefit, if it is simply not possible to increase the green time further.
Application of Traffic Control Strategies for Mitigation of Oversaturated Conditions Page 82
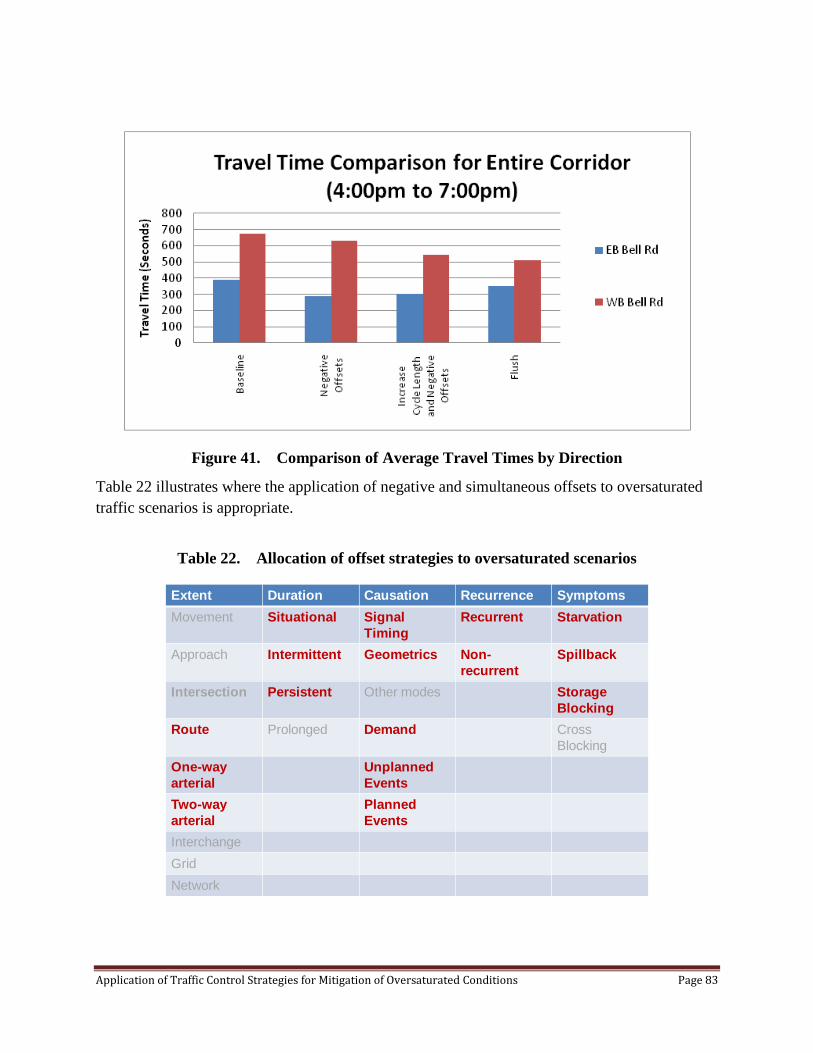
Figure 41. Comparison of Average Travel Times by Direction
Table 22 illustrates where the application of negative and simultaneous offsets to oversaturated traffic scenarios is appropriate.
Table 22. Allocation of offset strategies to oversaturated scenarios
Extent Duration Causation Recurrence Symptoms
Movement Situational Signal Timing
Recurrent Starvation
Approach Intermittent Geometrics Non-recurrent
Spillback
Intersection Persistent Other modes StorageBlocking
Route Prolonged Demand Cross Blocking
One-wayarterial
UnplannedEvents
Two-way arterial
Planned Events
Interchange
Grid
Network
Application of Traffic Control Strategies for Mitigation of Oversaturated Conditions Page 83

Modifying Phase Sequences for Left Turns One strategy to consider during oversaturated conditions is to change the left turn phase order such that one left turn phase leads its opposing through movement and the other left turn phase lags its opposing through movement. Lead/lag phasing can be used with protected-only left turn phasing or with protected/permitted left turn phasing if the left turn and through movements are controlled separately (i.e. flashing yellow arrow) otherwise a yellow trap condition will occur.
Lead/lag left turn phasing has several potential benefits. The first is that it provides a wider window in which to accommodate platoons of vehicles in the through direction(s). While the amount of time available to each direction remains unchanged, the green window increases to allow more flexibility in progressing a platoon. Additionally, by allowing through and left-turning vehicles from a particular direction to travel through the intersection at the same time, left-turning vehicles can frequently be progressed during the cycle in which they arrive. Figure 42 illustrates both of these points.
In Figure 42, the available window at the intersection is smaller than in the second figure and the westbound vehicles experience delay because the platoon arrives too early. Additionally, any left-turning vehicles in the westbound platoon must wait until the next cycle to be served. In the second figure, the overall window is larger, allowing westbound vehicles to progress through without delay and allowing westbound left-turning vehicles to be served in the cycle in which they arrive.
Figure 42. Comparison of Lead-lead and Lead-lag left turns on progression window
Application of Traffic Control Strategies for Mitigation of Oversaturated Conditions Page 84
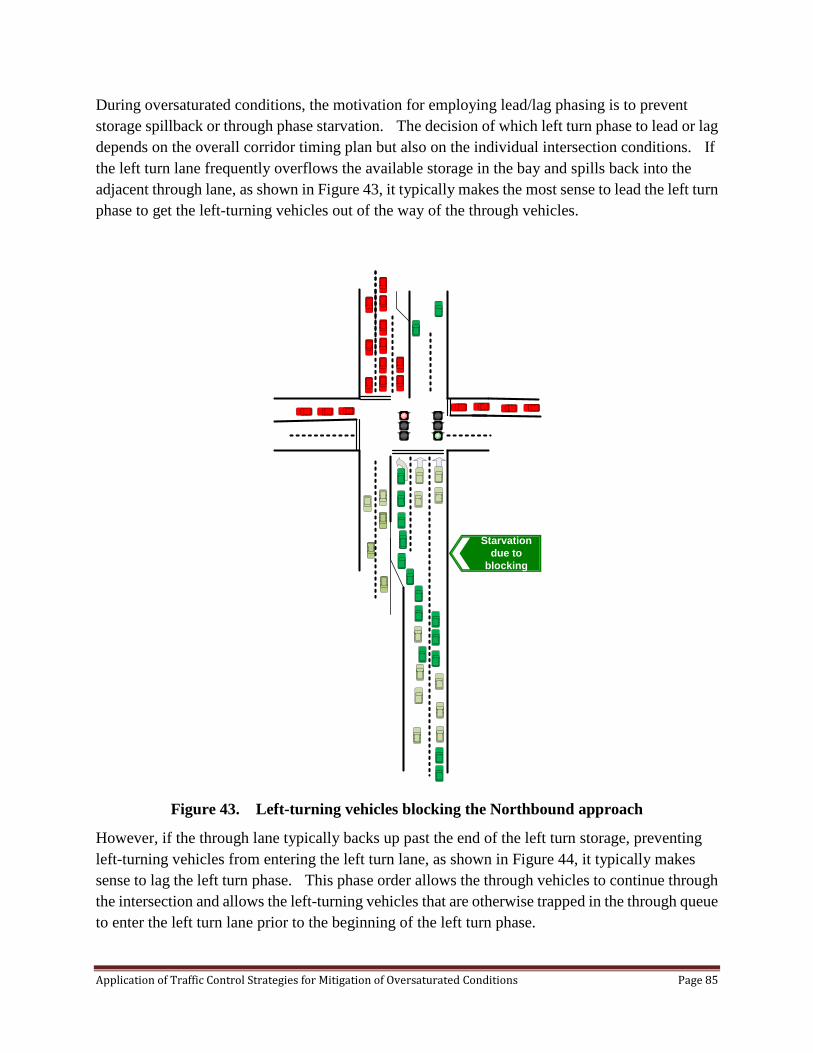
During oversaturated conditions, the motivation for employing lead/lag phasing is to prevent storage spillback or through phase starvation. The decision of which left turn phase to lead or lag depends on the overall corridor timing plan but also on the individual intersection conditions. If the left turn lane frequently overflows the available storage in the bay and spills back into the adjacent through lane, as shown in Figure 43, it typically makes the most sense to lead the left turn phase to get the left-turning vehicles out of the way of the through vehicles.
Figure 43. Left-turning vehicles blocking the Northbound approach
However, if the through lane typically backs up past the end of the left turn storage, preventing left-turning vehicles from entering the left turn lane, as shown in Figure 44, it typically makes sense to lag the left turn phase. This phase order allows the through vehicles to continue through the intersection and allows the left-turning vehicles that are otherwise trapped in the through queue to enter the left turn lane prior to the beginning of the left turn phase.
Starvation due to
blocking
Application of Traffic Control Strategies for Mitigation of Oversaturated Conditions Page 85

Figure 44. Through vehicles blocking left turn vehicles from entering the turn bay
Employing lead/lag left turn phasing on minor street movements can also be beneficial for progressing minor street left turn movements at downstream intersections and for treating the queue spillback and phase starvation problems discussed above. These principles apply not only for route congestion problems but at individual intersections as well.
One additional consideration when choosing the left turn to lag is that, without additional programming, the lagging left turn phase will not gap out but will extend to the end of the coordinated through phase. As such, it is sometimes beneficial to lag the heavier left turn movement since it will always receive the full split time it has been allocated.
Table 23 lists some rules of thumb that might be used to consider switching from one lead/lag sequence to another. The left-most column lists the current lead/lag sequence used in the first barrier group (i.e. phases 1 and 2 in ring 1 and phases 5 and 6 in ring 2). Consideration of the second barrier group (phases 3 and 4 in ring 1 and phases 7 and 8 in ring 2) is symmetrical and thus the same rules apply.
Starvation due to
blocking
Application of Traffic Control Strategies for Mitigation of Oversaturated Conditions Page 86
The top row lists the lead/lag sequence that might be considered to improve operations during a certain condition. The entries in each cell of the table indicate the conditions that could precipitate a modification from one lead/lag condition to another. For example, consider that the current lead/lag setting is lead-lead (phase 1 leads phase 2 and phase 5 leads phase 6).
If phase 1 has higher degree of saturation than phase 5 and the total degree of saturation on phase 1 and phase 6 dominates (i.e. is significantly higher) than the total degree of saturation on phase 2 and phase 5, then it may be prudent to switch from a lead-lead configuration to a lead-lag configuration where phase 1 still leads phase 2, but phase 5 lags phase 6. This creates the larger service opportunity for phase1 and phase 6 (the dominant direction of arterial flow).
Similarly, the phase sequence might be changed from lead-lead to lag-lead if phase 5 has much higher degree of saturation to phase 1, and the total degree of saturation of phase 2 and phase 5 dominates (i.e. is significantly higher than) the degree of saturation on phase 1 and phase 6. Similarly, if offsets at upstream intersections are modified significantly (due to phase sequence changes or using the rules specified in the previous section), the sequence at this intersection may need to be modified to accommodate the change in the arrival time of the oncoming platoon.
Many modern controllers accomplish a similar type of variable sequence treatment by using “third car detection” or “queue detection” in left-turn bays. This strategy enables the protected left arrow for phase 5 if the “third car” detector is active during the permissive period and the corresponding “third car” detector is not active for phase 1. If both phases 1 and 5 have “third car” detectors active, then both left turns lead. If one or the other “third car” detector is active, then that phase is leading and the other phase gets a protected indication that lags only if the “third car” detector is active at the end of the yield point for the conflicting through movement. If neither “third car” detector is active at the beginning of the permissive period, then neither protected indication is displayed. If subsequent vehicles arrive during the cycle, they can be served a protected arrow at the end of the cycle, again if the “third car” detection is enabled.
This operation can be improved during oversaturation by using the estimates of the oversaturation level (TOSI, or queue length estimate) to drive the decision with the relatively straightforward congestion management logic shown in Table 23.
Application of Traffic Control Strategies for Mitigation of Oversaturated Conditions Page 87
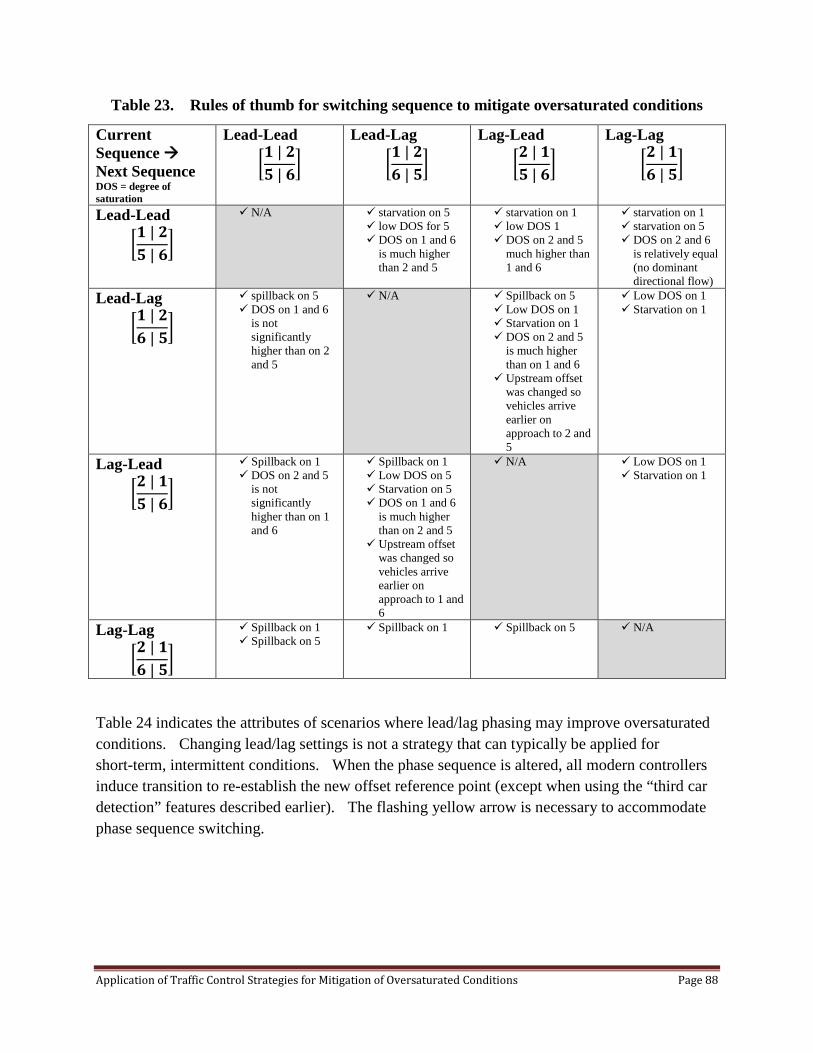
Table 23. Rules of thumb for switching sequence to mitigate oversaturated conditions
Current Sequence Next Sequence DOS = degree of saturation
Lead-Lead
�𝟏 | 𝟐𝟓 | 𝟔
�
Lead-Lag
�𝟏 | 𝟐𝟔 | 𝟓
�
Lag-Lead
�𝟐 | 𝟏𝟓 | 𝟔
�
Lag-Lag
�𝟐 | 𝟏𝟔 | 𝟓
�
Lead-Lead
�𝟏 | 𝟐𝟓 | 𝟔
�
N/A starvation on 5 low DOS for 5 DOS on 1 and 6
is much higher than 2 and 5
starvation on 1 low DOS 1 DOS on 2 and 5
much higher than 1 and 6
starvation on 1 starvation on 5 DOS on 2 and 6
is relatively equal (no dominant directional flow)
Lead-Lag
�𝟏 | 𝟐𝟔 | 𝟓
�
spillback on 5 DOS on 1 and 6
is not significantly higher than on 2 and 5
N/A Spillback on 5 Low DOS on 1 Starvation on 1 DOS on 2 and 5
is much higher than on 1 and 6
Upstream offset was changed so vehicles arrive earlier on approach to 2 and 5
Low DOS on 1 Starvation on 1
Lag-Lead
�𝟐 | 𝟏𝟓 | 𝟔
�
Spillback on 1 DOS on 2 and 5
is not significantly higher than on 1 and 6
Spillback on 1 Low DOS on 5 Starvation on 5 DOS on 1 and 6
is much higher than on 2 and 5
Upstream offset was changed so vehicles arrive earlier on approach to 1 and 6
N/A Low DOS on 1 Starvation on 1
Lag-Lag
�𝟐 | 𝟏𝟔 | 𝟓
�
Spillback on 1 Spillback on 5
Spillback on 1 Spillback on 5 N/A
Table 24 indicates the attributes of scenarios where lead/lag phasing may improve oversaturated conditions. Changing lead/lag settings is not a strategy that can typically be applied for short-term, intermittent conditions. When the phase sequence is altered, all modern controllers induce transition to re-establish the new offset reference point (except when using the “third car detection” features described earlier). The flashing yellow arrow is necessary to accommodate phase sequence switching.
Application of Traffic Control Strategies for Mitigation of Oversaturated Conditions Page 88

Table 24. Allocation of lead-lag phasing strategies to oversaturated scenarios
Finding the “Right” Cycle Time for an Oversaturated Route A process for cycle time adjustments for individual intersections was discussed in a previous section. Determining a cycle time for an oversaturated route or arterial is an iterative process and requires complex trade-offs that are not easy to articulate as a set of simple rules. Even in undersaturated conditions, optimization software is typically used for determining a best cycle time using a traffic model to estimate the total delay for a specific combination of signal parameters and a search procedure to evaluate the performance of a range of cycles. TRANSYT (as of version 8, 1999) includes optimization functions for oversaturated conditions but needs as input the demand volumes, which is difficult to measure. A rational approach to determining cycle time changes for an oversaturated route is to compute the cycle-length policy developed by Lieberman, et. al. (2000), to find the upper-bound of the cycle length that avoids spillback of an overflow queue at each of the intersections on the route. A trade-off will then have to be made to select the best cycle among the maximums computed for each intersection. An optimization process is necessary to search through the estimated performance for each combination of cycle, splits, and offsets for the route. Such a process was developed as part of the research that generated this guide, but is currently in an experimental stage. For a short oversaturated route, with oversaturation occurring in just one direction, it is straightforward to consider adjustments to the cycle time. Simply put, all of the additional green time in the cycle should be allocated to the phases on the oversaturated route. As demonstrated previously for negative offsets, a small example indicates the type of performance improvements
Extent Duration Causation Recurrence Symptoms
Movement Situational Signal Timing
Recurrent Starvation
Approach Intermittent Geometrics Non-recurrent
Spillback
Intersection Persistent Other modes StorageBlocking
Route Prolonged Demand Cross Blocking
One-wayarterial
UnplannedEvents
Two-way arterial
Planned Events
Interchange
Grid
Network
Application of Traffic Control Strategies for Mitigation of Oversaturated Conditions Page 89
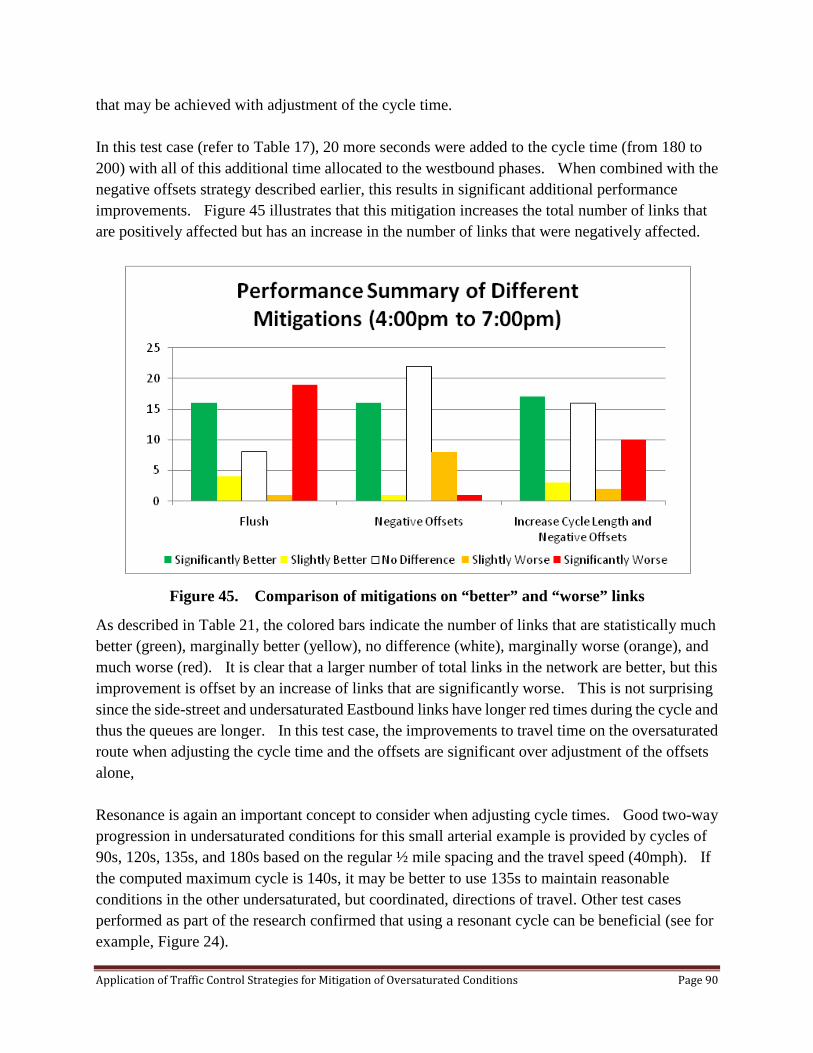
that may be achieved with adjustment of the cycle time. In this test case (refer to Table 17), 20 more seconds were added to the cycle time (from 180 to 200) with all of this additional time allocated to the westbound phases. When combined with the negative offsets strategy described earlier, this results in significant additional performance improvements. Figure 45 illustrates that this mitigation increases the total number of links that are positively affected but has an increase in the number of links that were negatively affected.
Figure 45. Comparison of mitigations on “better” and “worse” links
As described in Table 21, the colored bars indicate the number of links that are statistically much better (green), marginally better (yellow), no difference (white), marginally worse (orange), and much worse (red). It is clear that a larger number of total links in the network are better, but this improvement is offset by an increase of links that are significantly worse. This is not surprising since the side-street and undersaturated Eastbound links have longer red times during the cycle and thus the queues are longer. In this test case, the improvements to travel time on the oversaturated route when adjusting the cycle time and the offsets are significant over adjustment of the offsets alone, Resonance is again an important concept to consider when adjusting cycle times. Good two-way progression in undersaturated conditions for this small arterial example is provided by cycles of 90s, 120s, 135s, and 180s based on the regular ½ mile spacing and the travel speed (40mph). If the computed maximum cycle is 140s, it may be better to use 135s to maintain reasonable conditions in the other undersaturated, but coordinated, directions of travel. Other test cases performed as part of the research confirmed that using a resonant cycle can be beneficial (see for example, Figure 24).
Application of Traffic Control Strategies for Mitigation of Oversaturated Conditions Page 90

Table 25 summarizes the types of oversaturated scenarios that cycle time adjustment is appropriate for.
Table 25. Allocation of cycle time strategies to oversaturated scenarios
“Flaring” Green Times Flaring the green (increasing the green windows at downstream intersections) can be considered when overflow queues exist on a route. This concept is essentially the orchestrated application of green re-allocation at a series of intersections. The “flare”, concept is to intentionally increase the green allocation at the most downstream location (the originating bottleneck) to disperse the most overflow queue. This is illustrated in Figure 46.
Figure 46. Flaring the green to clear downstream queues
Subsequent upstream approaches on the oversaturated route are provided less additional green time that the primary bottleneck location. The TOSI and SOSI estimates on the route can be used with the forward-backward procedure described in Appendix B to generate a flared green pattern.
Extent Duration Causation Recurrence Symptoms
Movement Situational Signal Timing
Recurrent Starvation
Approach Intermittent Geometrics Non-recurrent
Spillback
Intersection Persistent Other modes StorageBlocking
Route Prolonged Demand Cross Blocking
One-wayarterial
UnplannedEvents
Two-way arterial
Planned Events
Interchange
Grid
Network
Tim
e
Application of Traffic Control Strategies for Mitigation of Oversaturated Conditions Page 91

“Flaring” the green times along the oversaturated route might be thought of as a much less aggressive application of a flushing strategy, discussed in the next section. Table 26 summarizes the types of oversaturated scenarios that might be mitigated with flared green times on a route.
Table 26. Allocation of green flare strategies to oversaturated scenarios
Corridor Preemption (Green “Flush”) Significant, persistent, and debilitating queuing on an oversaturated route is very difficult to mitigate with relatively “gentle” measures such as adjusting offsets and modifying the phase sequence. Corridor preemption or “green flush” strategies might be considered an extreme measure, or one that might be applied after the other mitigation strategies have been tried, but have not been determined to have incremental benefit. In considering the application of a green flush strategy the primary consideration is the effect of on the undersaturated approaches. Delays to drivers on side streets will increase significantly. Under the right circumstances where side-street flows are less than, say, 20% of the total system volume, the benefits achieved by flushing strategies simply cannot be matched by any other combination of mitigation strategies. There are two primary ways that corridor flushing can be achieved. First is a series of preemptions to the controllers on the route. The second is to change to a very long cycle time that has the majority of the split time allocated to the oversaturated route. Either approach could be applied off-line by TOD, manually by operators at a TCC, or via logic. Sacramento County, CA. for example has applied a route preemption strategy manually by operators at a TCC based on
Extent Duration Causation Recurrence Symptoms
Movement Situational Signal Timing
Recurrent Starvation
Approach Intermittent Geometrics Non-recurrent
Spillback
Intersection Persistent Other modes StorageBlocking
Route Prolonged Demand Cross Blocking
One-wayarterial
UnplannedEvents
Two-way arterial
Planned Events
Interchange
Grid
Network
Application of Traffic Control Strategies for Mitigation of Oversaturated Conditions Page 92

CCTV surveillance. In a green flush operation, as illustrated in Figure 34, the series of preemptions runs “backwards” in sequence from the most downstream location to the most upstream location. This is different from a route preemption that is enabled for emergency services vehicles which proceed in sequence along the direction of travel of the vehicle (,applied in Miami-Dade County, FL, Windsor, ON, etc.). This “backwards” sequence is important in order to clear the downstream queues first before releasing the upstream traffic. It is also important to consider that the downstream preemption must last as long as necessary (or as close as possible due to the limitation in most field controllers that limits preemptions to 255s) for the traffic from upstream locations to progress through the downstream location. Depending on the persistence of the arrival volume on the oversaturated route, it may be necessary to periodically apply the route preemption several times as the queues rebuild during the time that the intersections returns to “normal” pattern operation. In the example shown in Figure 47, the preemption sequence was applied as shown in Table 27.
Table 27. Implementation of a route preemption for oversaturation mitigation
Intersection Preemption Start
Preemption End
1 0 255 2 45 210 3 90 165
Figure 47. Route preemption sequence of preempts from downstream to upstream
Another challenge with the application of route preemption are the effects of post preemption transition. As with railroad preemption operation, in most modern controllers the recovery behavior can be controlled to immediately service the side-street phases for extended periods before returning to normal operation. This exit behavior should be carefully considered when applying a green flush strategy.
123
Application of Traffic Control Strategies for Mitigation of Oversaturated Conditions Page 93

The second alternative to green flush, which is less severe than a series of route preemptions, is to transition to a pattern with a very long cycle time that has the majority of the green time in the cycle dedicated to the oversaturated route. This approach periodically allows a small window of travel opportunity for undersaturated movements, while dedicating most of the cycle to the movement of the oversaturated route. This method will result in significant queuing on side streets and undersaturated movements, but could be scheduled as a TOD pattern if the route oversaturation is recurrent and predictable. The resultant performance effects of a flushing strategy (using the second strategy of scheduling a very long cycle time) are illustrated by the test case presented earlier. As shown in Figure 48, the flush strategy significantly improves the travel time of the oversaturated route when compared to the less aggressive mitigation strategies. In this example, the flush plan was implemented according to the following time of day schedule shown in Table 28.
Table 28. Oversaturated route green flush plan schedule
Time of Day Timing Plan Westernmost
Intersection Middle
Intersection Easternmost Intersection
16:00 180 second cycle length with forward offsets favoring westbound
17:00 17:01 17:02 Flushing plan (255 second cycle length where extra time is given to westbound thru in Ring 1 and divided between eastbound thru and westbound lefts in Ring 2)
17:11 180 second cycle length with negative offsets
17:24 17:25 17:26 Flushing plan (255 second cycle length where extra time is given to westbound thru in Ring 1 and divided between eastbound thru and westbound lefts in Ring 2)
17:35 180 second cycle length with negative offsets
17:50 17:51 17:52 Flushing plan (255 second cycle length where extra time is given to westbound thru in Ring 1 and divided between eastbound thru and westbound lefts in Ring 2)
18:00 180 second cycle length with negative offsets 19:00 End of Simulation
As shown in Table 22, the route flush plan is applied for approximately 11 minutes (three cycles) and then normal operation is resumed for four cycles (twelve minutes), and then the flush plan is started again for two more iterations. In order to clear the downstream queues further in advance of the additional traffic coming from upstream, the flush plans are implemented one minute earlier at the downstream locations.
Figure 48 dramatically illustrates the significant performance improvements possible with such an approach on the oversaturated route. However, as illustrated in Figure 45, there are understandably more side-street and undersaturated links that are adversely affected when
Application of Traffic Control Strategies for Mitigation of Oversaturated Conditions Page 94
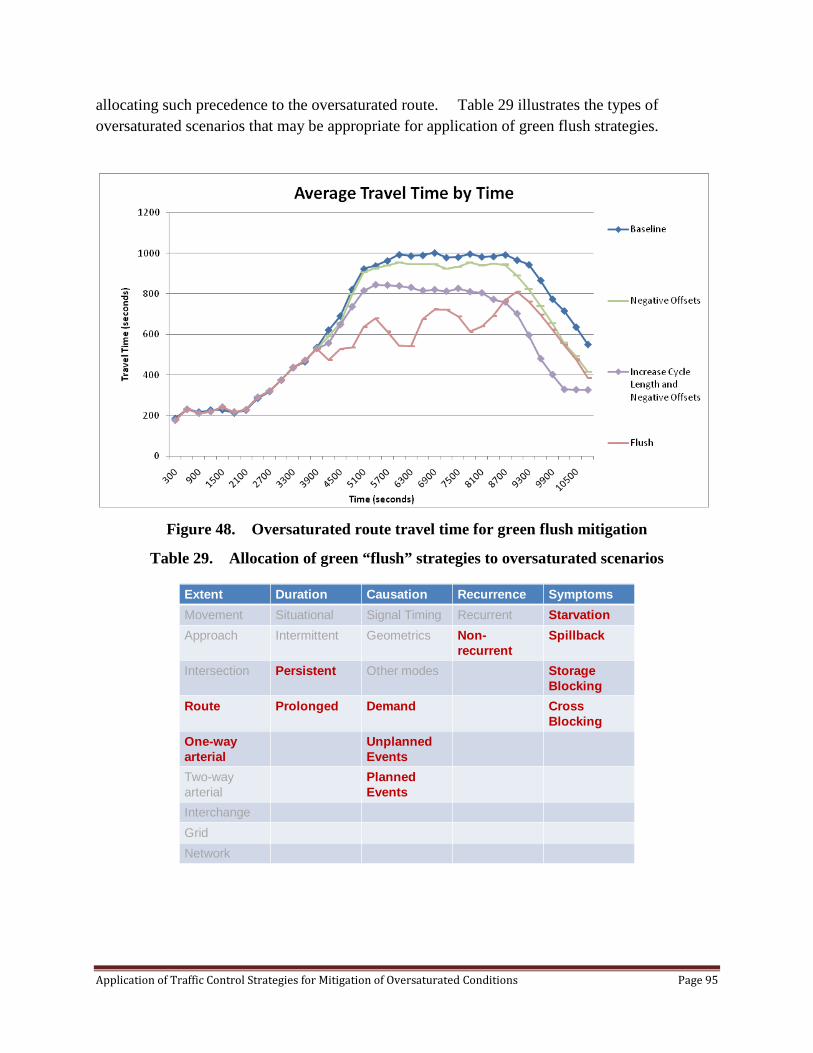
allocating such precedence to the oversaturated route. Table 29 illustrates the types of oversaturated scenarios that may be appropriate for application of green flush strategies.
Figure 48. Oversaturated route travel time for green flush mitigation
Table 29. Allocation of green “flush” strategies to oversaturated scenarios
Extent Duration Causation Recurrence Symptoms
Movement Situational Signal Timing Recurrent Starvation
Approach Intermittent Geometrics Non-recurrent
Spillback
Intersection Persistent Other modes StorageBlocking
Route Prolonged Demand Cross Blocking
One-wayarterial
UnplannedEvents
Two-way arterial
Planned Events
Interchange
Grid
Network
Application of Traffic Control Strategies for Mitigation of Oversaturated Conditions Page 95
Network Level Strategies The previous two sections discussed strategies appropriate for mitigating oversaturated conditions at individual intersections and on routes and arterials. As the oversaturated conditions scenario becomes larger in spatial and temporal extent, involving more intersections and more routes, it may be necessary to apply more extensive mitigations. In this section, we discuss several mitigating approaches for network-level scenarios, including:
• Metering and Gating • Adaptive Control • Non-Actuated Operation • Combinations of Mitigations
Metering or Gating Metering or gating (the two terms can be used interchangeably) is strategy for queue management. Metering is applied to impede traffic at appropriate upstream points to prevent the traffic flow from reaching critical levels at downstream intersections. In situations where SOSI > 0 and downstream spillback is the majority of the problem, gating is at times the only option. The implementation of this strategy requires the identification of the critical intersections in the network that need to be protected from spillback and the exterior links that will be used to store the queues. On a case-by-case basis, it is typically straightforward to determine where the metering locations would be, considering:
• Physical link length and storage capacity • Locations of traffic generators and traffic attractors • Access management issues to generators and attractors; specific input and output points
Links upstream of links where SOSI > 0 for long periods of time are the primary location where gating should be applied. Figure 49 illustrates an application of gating operation. In this figure, the “oversaturated network” example shown in Figure 10 could be mitigated by applying gating at the following points:
• Southbound approach to intersection E • Eastbound approach to intersection A • Eastbound approach to intersection B • Northbound approach to intersection H • Westbound approach to intersection F • Eastbound approach to intersection D
By reducing the green time for these approaches, the overflow queues can be contained to these entrance points to the network. If there is enough storage capacity on these links, this may be an
Application of Traffic Control Strategies for Mitigation of Oversaturated Conditions Page 96
acceptable solution to free up additional capacity on the links inside of the network cordon line. In doing so, care must be taken of course to not just shift the oversaturation problem to another network outside of the area of consideration. Gating can also be used in conjunction with other mitigations to improve their performance further. As discussed earlier, during the “loading” phase of a scenario, mitigating strategies for intersection and routes can be applied to increase the system throughput. When these strategies are no longer effective, applying gating at input points to the network may improve the ability of the intersection and route mitigations to begin to work again by imposing a reduction in the arrival rates (i.e. by providing a “mini” recovery period in the middle of the scenario time) to the critical locations. After there is improvement in the interior critical locations, during the recovery period the gating actions might be lifted at the input points to alleviate those queues and begin to use the spare capacity inside of the system again that was freed up by applying the gating actions. If the situation is recurrent, a TOD schedule could be developed that applies the three strategies during each performance regime. If the start and end times have been observed to be quite variable, the decisions to switch back and forth between mitigating strategies might be done in an “on-line” fashion with logic as discussed in Step 5, or using CCTV images to observe conditions at a TCC and have an operator change the strategy manually. Operators in Anaheim, CA frequently enable these kind of actions during special events. With Disneyland, a baseball stadium, a hockey arena, and a convention center within several miles of each other, Anaheim has an event almost every day of the year.
Application of Traffic Control Strategies for Mitigation of Oversaturated Conditions Page 97

Figure 49. Illustration of gating operation
Table 30 illustrates the types of oversaturated scenarios that may be appropriate for application of metering strategies.
Gating isolates queues outside off the network
F
H
G
E
D
C
B
A
Application of Traffic Control Strategies for Mitigation of Oversaturated Conditions Page 98
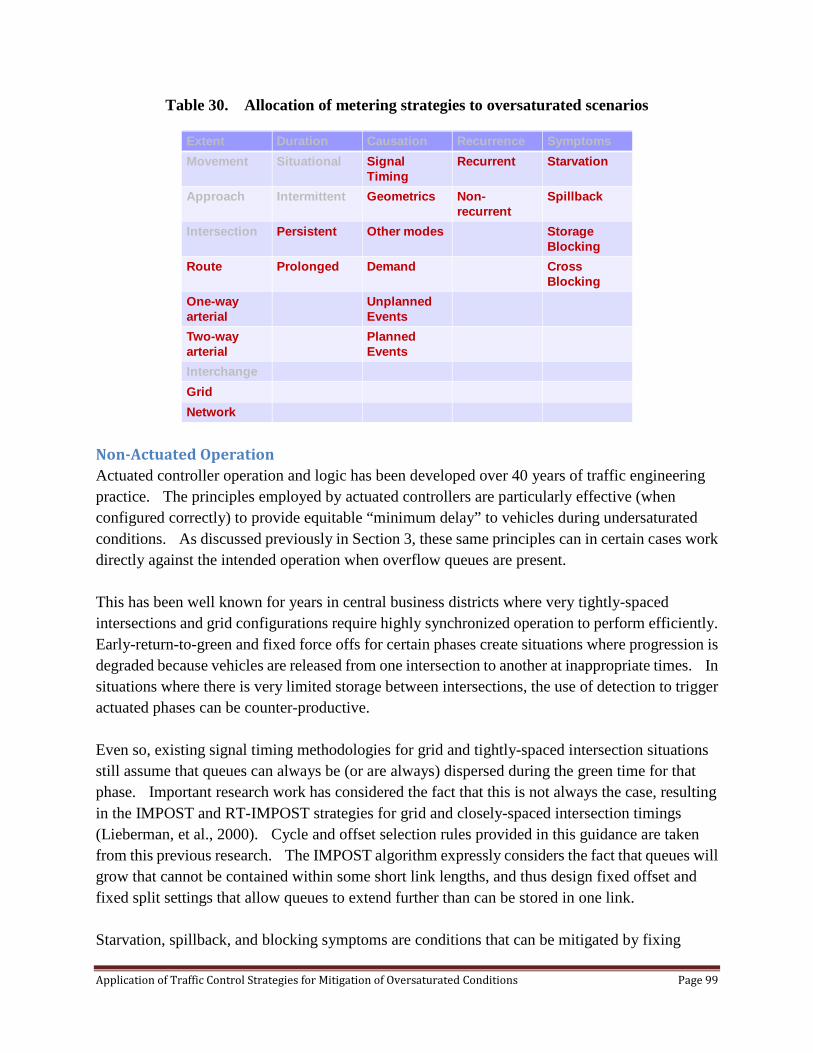
Table 30. Allocation of metering strategies to oversaturated scenarios
Non-Actuated Operation Actuated controller operation and logic has been developed over 40 years of traffic engineering practice. The principles employed by actuated controllers are particularly effective (when configured correctly) to provide equitable “minimum delay” to vehicles during undersaturated conditions. As discussed previously in Section 3, these same principles can in certain cases work directly against the intended operation when overflow queues are present. This has been well known for years in central business districts where very tightly-spaced intersections and grid configurations require highly synchronized operation to perform efficiently. Early-return-to-green and fixed force offs for certain phases create situations where progression is degraded because vehicles are released from one intersection to another at inappropriate times. In situations where there is very limited storage between intersections, the use of detection to trigger actuated phases can be counter-productive. Even so, existing signal timing methodologies for grid and tightly-spaced intersection situations still assume that queues can always be (or are always) dispersed during the green time for that phase. Important research work has considered the fact that this is not always the case, resulting in the IMPOST and RT-IMPOST strategies for grid and closely-spaced intersection timings (Lieberman, et al., 2000). Cycle and offset selection rules provided in this guidance are taken from this previous research. The IMPOST algorithm expressly considers the fact that queues will grow that cannot be contained within some short link lengths, and thus design fixed offset and fixed split settings that allow queues to extend further than can be stored in one link. Starvation, spillback, and blocking symptoms are conditions that can be mitigated by fixing
Extent Duration Causation Recurrence Symptoms
Movement Situational Signal Timing
Recurrent Starvation
Approach Intermittent Geometrics Non-recurrent
Spillback
Intersection Persistent Other modes StorageBlocking
Route Prolonged Demand Cross Blocking
One-wayarterial
UnplannedEvents
Two-way arterial
Planned Events
Interchange
Grid
Network
Application of Traffic Control Strategies for Mitigation of Oversaturated Conditions Page 99
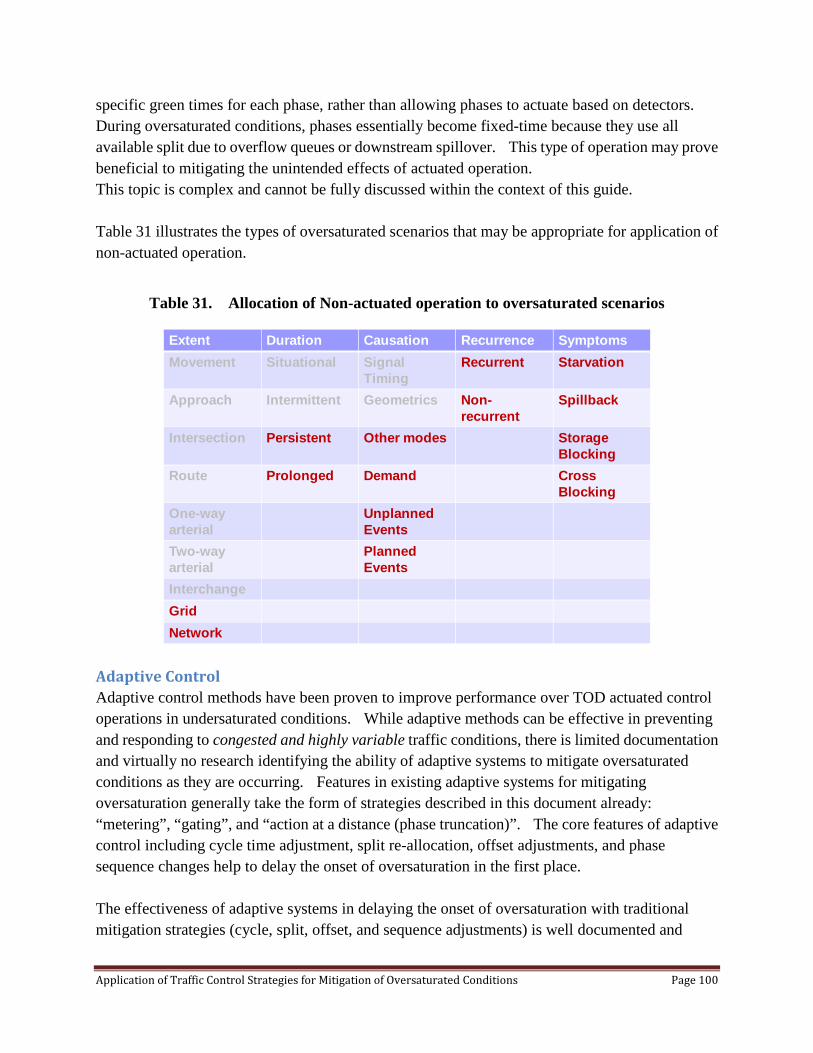
specific green times for each phase, rather than allowing phases to actuate based on detectors. During oversaturated conditions, phases essentially become fixed-time because they use all available split due to overflow queues or downstream spillover. This type of operation may prove beneficial to mitigating the unintended effects of actuated operation. This topic is complex and cannot be fully discussed within the context of this guide. Table 31 illustrates the types of oversaturated scenarios that may be appropriate for application of non-actuated operation.
Table 31. Allocation of Non-actuated operation to oversaturated scenarios
Adaptive Control Adaptive control methods have been proven to improve performance over TOD actuated control operations in undersaturated conditions. While adaptive methods can be effective in preventing and responding to congested and highly variable traffic conditions, there is limited documentation and virtually no research identifying the ability of adaptive systems to mitigate oversaturated conditions as they are occurring. Features in existing adaptive systems for mitigating oversaturation generally take the form of strategies described in this document already: “metering”, “gating”, and “action at a distance (phase truncation)”. The core features of adaptive control including cycle time adjustment, split re-allocation, offset adjustments, and phase sequence changes help to delay the onset of oversaturation in the first place. The effectiveness of adaptive systems in delaying the onset of oversaturation with traditional mitigation strategies (cycle, split, offset, and sequence adjustments) is well documented and
Extent Duration Causation Recurrence Symptoms
Movement Situational Signal Timing
Recurrent Starvation
Approach Intermittent Geometrics Non-recurrent
Spillback
Intersection Persistent Other modes StorageBlocking
Route Prolonged Demand Cross Blocking
One-wayarterial
UnplannedEvents
Two-way arterial
Planned Events
Interchange
Grid
Network
Application of Traffic Control Strategies for Mitigation of Oversaturated Conditions Page 100
proven around the world. Metering and Gating features are provided by SCOOT, and to some extent, SCATS. However, there are no known documented test cases that identify the effectiveness of the mitigation features of adaptive systems such as metering and gating in either real-world or simulation test scenarios. All adaptive systems include some form of traffic modeling for prediction of effects when considering alternative control settings. Since delay computations during overflow queuing cannot be computed in a closed-form manner, existing adaptive systems can only approximate the effect of alternative control parameters to mitigate oversaturated situations. In the case of RHODES, for example, the recurrent existence of long queues at certain times of day is modeled not by a prediction model that attempts to capture the real queue length, but by reducing the assumed saturation flow rate of the (underestimated) queue lengths so that the optimization algorithm allocates more green time to those phases. Similarly, weights can be applied to the delay calculations in RHODES for movements that are habitually oversaturated. This generally inflates the importance of those phases so they are allocated additional green time. This has been shown to be effective in recurrent congestion scenarios (e.g. Pinellas County, FL), but it requires extensive user configuration and calibration of the parameters of the optimization algorithm. ACSLITE has a similar feature for ensuring that coordinated phases receive a higher-proportion of green time which requires no user calibration That feature is not explicitly designed for mitigation of oversaturation but simply providing a bias towards certain phases to improve their performance. On-line measurement of queue length, TOSI, and SOSI from existing types of detection is the necessary component that will enable adaptive control systems to consider oversaturated conditions in their optimization strategies. The FBP algorithm presented in Appendix B is a step in that direction. Much further research is needed before adaptive algorithms could be developed (or extensions or enhancements to existing systems) that consider the myriad combinations of mitigation strategies in a reliable and stable manner. In the interim, simple if….then rules can be used to select pre-configured mitigations on-line based on detection inputs and measured TOSI and SOSI values. Experimental software for this purpose is available from NCHRP. This system is discussed further in the next section.
Application of Traffic Control Strategies for Mitigation of Oversaturated Conditions Page 101
Selecting a Combination Mitigating Strategies As the spatial and temporal scope of the oversaturated scenario grows, it is unlikely that any single mitigation approach is, by itself, enough to handle a complex and dynamic control situation. In most cases it will be necessary to consider adjustments to cycle, splits, offsets, and phase sequence in combination. The particular combination of mitigations will need to consider the inherent trade-offs For example, negative offsets combined with cycle time adjustments were shown to be effective on an oversaturated arterial where offset adjustments alone did not provide significant improvement. A corridor flush strategy provided substantial benefits, but resulted in serious degradation to the performance of other undersaturated movements. Identification of the key critical routes and tabulating quantitative information regarding the dynamics of the overflow queues in a dynamic map and estimated of TOSI and SOSI effects is of utmost importance in selecting a combination of mitigation strategies. A process for developing comprehensive strategies requires a complex optimization procedure. Such a process was developed during the research associated with this guide, but is considered experimental at this time. The FBP process described in Appendix B describes a fairly simple process to link combinations of changes to green time along an intersection route. The changes to green time recommended by the direct assessment of average TOSI and SOSI values from the FBP procedure could be combined with the results of offset analysis from the spillback and starvation avoidance formulas presented in the previous section. Phase sequences could be considered next to alleviate turn-bay spillback and starvation issues. A rational approach for combining mitigations would be as follows:
1. Identify the spatial extent of the affected network to determine if the problem is an intersection problem, a single route problem, or a network problem.
2. Identify the duration of the conditions and approximately how long the loading, processing, and recovery periods last.
3. Identify the symptoms and detrimental effects of the conditions and where and how long those conditions occur.
4. Consider the mitigations in this guide for applicability for the combination of symptoms and overflow queues that are being experienced.
5. Identify the most downstream location or locations. Focus mitigating strategies here first and work backwards along the critical routes from this point.
6. Focus on “gentle” approaches first such as split re-allocation. 7. Implement the mitigation and observe the results. 8. Implement stronger and more comprehensive mitigations as necessary in an iterative
fashion.
Application of Traffic Control Strategies for Mitigation of Oversaturated Conditions Page 102
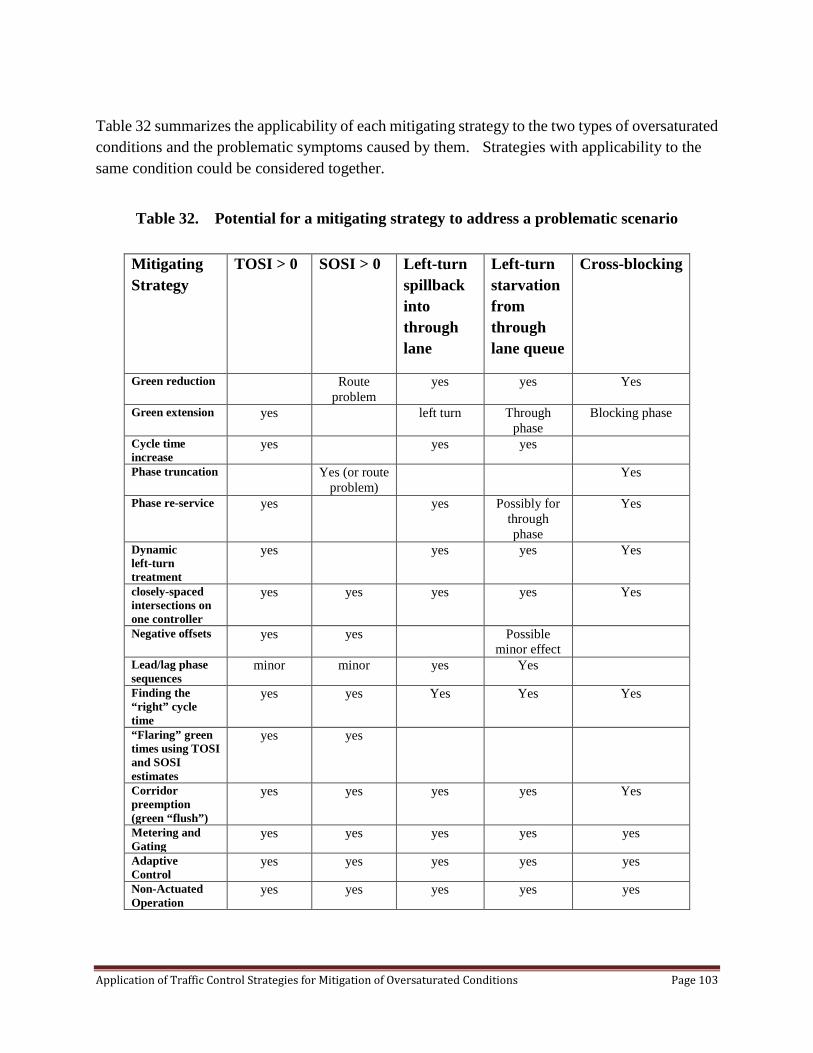
Table 32 summarizes the applicability of each mitigating strategy to the two types of oversaturated conditions and the problematic symptoms caused by them. Strategies with applicability to the same condition could be considered together.
Table 32. Potential for a mitigating strategy to address a problematic scenario
Mitigating Strategy
TOSI > 0 SOSI > 0 Left-turn spillback into through lane
Left-turn starvation from through lane queue
Cross-blocking
Green reduction Route problem
yes yes Yes
Green extension yes left turn Through phase
Blocking phase
Cycle time increase
yes yes yes
Phase truncation Yes (or route problem)
Yes
Phase re-service yes yes Possibly for through phase
Yes
Dynamic left-turn treatment
yes yes yes Yes
closely-spaced intersections on one controller
yes yes yes yes Yes
Negative offsets yes yes Possible minor effect
Lead/lag phase sequences
minor minor yes Yes
Finding the “right” cycle time
yes yes Yes Yes Yes
“Flaring” green times using TOSI and SOSI estimates
yes yes
Corridor preemption (green “flush”)
yes yes yes yes Yes
Metering and Gating
yes yes yes yes yes
Adaptive Control
yes yes yes yes yes
Non-Actuated Operation
yes yes yes yes yes
Application of Traffic Control Strategies for Mitigation of Oversaturated Conditions Page 103

Step 5: Plan for Equipment Upgrades, Field Deployment and Operations The previous section provided descriptions of various types of mitigation strategies for oversaturated scenarios. The next step is to implement the mitigation approach in the field and assess their effectiveness. There are many issues to consider in the selection and application of various strategies, including:
• Controller, infrastructure, detection, and communications equipment • Policy and operations issues • Costs\ design, deployment, analysis, and maintenance • Methods and costs of effectiveness assessment
Table 33 provides an assessment of each mitigation strategy with respect to these attributes. The good news is that almost all of the methods can be deployed without purchasing any new equipment at all. The strategies related to left-turn treatments require installation of the infrastructure to support flashing yellow arrow. Most, if not, all modern controller firmware supports the mitigation strategies identified in this guide for implementation in a TOD schedule fashion. There are variations, however, in support for remote commands (preempts, phase hold, etc.) and capabilities for on-line application. Some mitigation strategies (e.g. running two intersections on one controller and phase re-service strategies) require controller firmware capable of 16-phase, 4-ring operation, but the vast majority of mitigation strategies can be accomplished with 8-phase, dual-ring operation. Communication and detection upgrades are only necessary if the strategies are intended to be implemented on-line. In recurrent situations, this is not necessary. If the scenario does not happen every day but frequently, or if the start or end time of the typical conditions fluctuates significantly, it may be worth investing in the system detection and communications necessary to configure the responsive operation.
Application of Traffic Control Strategies for Mitigation of Oversaturated Conditions Page 104
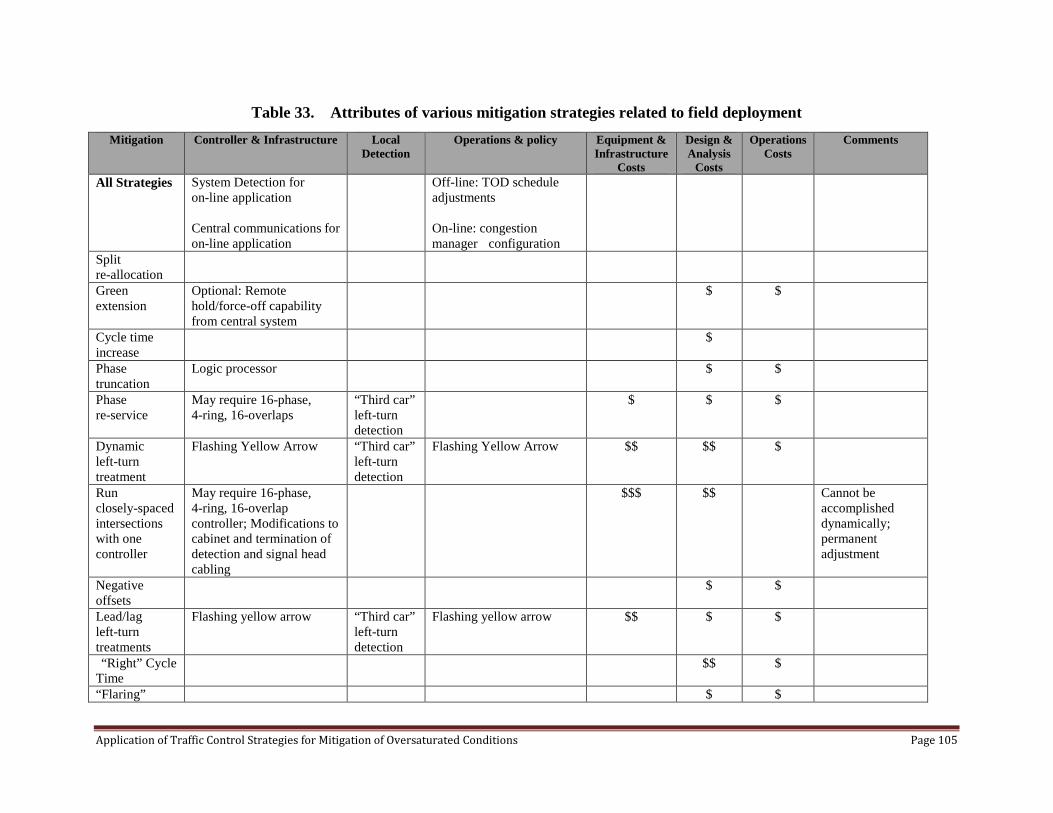
Table 33. Attributes of various mitigation strategies related to field deployment Mitigation Controller & Infrastructure Local
Detection Operations & policy Equipment &
Infrastructure Costs
Design & Analysis
Costs
Operations Costs
Comments
All Strategies System Detection for on-line application Central communications for on-line application
Off-line: TOD schedule adjustments On-line: congestion manager configuration
Split re-allocation
Green extension
Optional: Remote hold/force-off capability from central system
$ $
Cycle time increase
$
Phase truncation
Logic processor $ $
Phase re-service
May require 16-phase, 4-ring, 16-overlaps
“Third car” left-turn detection
$ $ $
Dynamic left-turn treatment
Flashing Yellow Arrow “Third car” left-turn detection
Flashing Yellow Arrow
$$ $$ $
Run closely-spaced intersections with one controller
May require 16-phase, 4-ring, 16-overlap controller; Modifications to cabinet and termination of detection and signal head cabling
$$$ $$ Cannot be accomplished dynamically; permanent adjustment
Negative offsets
$ $
Lead/lag left-turn treatments
Flashing yellow arrow “Third car” left-turn detection
Flashing yellow arrow $$ $ $
“Right” Cycle Time
$$ $
“Flaring” $ $
Application of Traffic Control Strategies for Mitigation of Oversaturated Conditions Page 105

Mitigation Controller & Infrastructure Local Detection
Operations & policy Equipment & Infrastructure
Costs
Design & Analysis
Costs
Operations Costs
Comments
green times Corridor preemption (green “flush”)
$-$$ $-$$ $$ Optional: Remote hold/force-off and preemption capability from central system
Metering $$ $$ Adaptive Control
Typically stop bar and advance detection
$$$ $$$ $$
Non-Actuated Operation
Disabled $$ $
Application of Traffic Control Strategies for Mitigation of Oversaturated Conditions Page 106
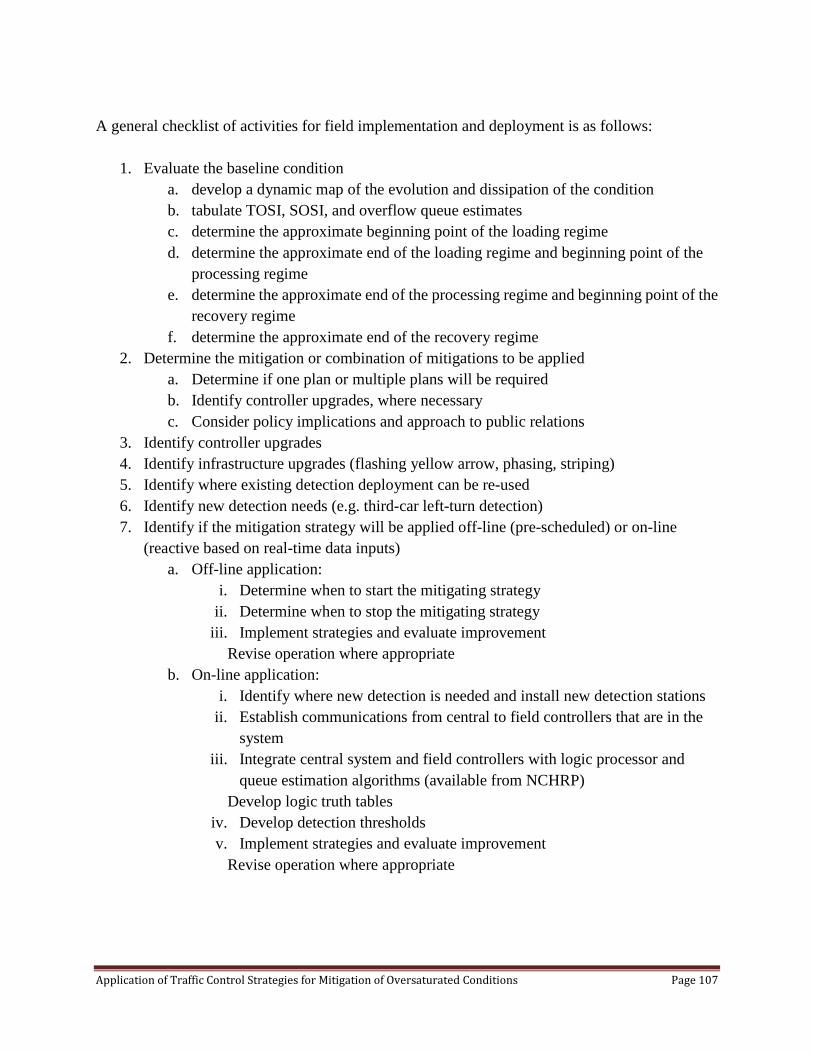
A general checklist of activities for field implementation and deployment is as follows:
1. Evaluate the baseline condition a. develop a dynamic map of the evolution and dissipation of the condition b. tabulate TOSI, SOSI, and overflow queue estimates c. determine the approximate beginning point of the loading regime d. determine the approximate end of the loading regime and beginning point of the
processing regime e. determine the approximate end of the processing regime and beginning point of the
recovery regime f. determine the approximate end of the recovery regime
2. Determine the mitigation or combination of mitigations to be applied a. Determine if one plan or multiple plans will be required b. Identify controller upgrades, where necessary c. Consider policy implications and approach to public relations
3. Identify controller upgrades 4. Identify infrastructure upgrades (flashing yellow arrow, phasing, striping) 5. Identify where existing detection deployment can be re-used 6. Identify new detection needs (e.g. third-car left-turn detection) 7. Identify if the mitigation strategy will be applied off-line (pre-scheduled) or on-line
(reactive based on real-time data inputs) a. Off-line application:
i. Determine when to start the mitigating strategy ii. Determine when to stop the mitigating strategy
iii. Implement strategies and evaluate improvement Revise operation where appropriate
b. On-line application: i. Identify where new detection is needed and install new detection stations
ii. Establish communications from central to field controllers that are in the system
iii. Integrate central system and field controllers with logic processor and queue estimation algorithms (available from NCHRP)
Develop logic truth tables iv. Develop detection thresholds v. Implement strategies and evaluate improvement
Revise operation where appropriate
Application of Traffic Control Strategies for Mitigation of Oversaturated Conditions Page 107
Operational Implementation Most of the mitigating strategies discussed in Section 4 can all be implemented by commanding the intersection(s) of interest to run a specific pattern or plan. Depending on the type of scenario, this can be done either off-line or on-line.
Off-line application is appropriate when the scenario is recurrent and highly predictable or when the scenario is a planned special event. In the case of a recurrent congestion situation, the mitigating strategy can be implemented in the TOD schedule of the controller(s) or central system,. In the case of a special event, the mitigating plan can be scheduled to be implemented from the central system, via a holiday or special event schedule on the field controllers, or even manually commanded by operators at the control center based on observations on CCTV or feedback from field observers.
Automated on-line application of strategies can be accomplished via a central system using the experimental software available from NCHRP. This is described in more detail in a further section.
Off-line Implementation of Mitigation Strategies Implementing a mitigation strategy by time of day and day of week requires only that the situation be predictable and recurrent. This can be verified with repeated field observations and experience. No communications or detection upgrades are necessary since the mitigation strategy is scheduled by time of day, day of week, special event, etc. The two important decisions to be made will be when to start the mitigation strategy and when to stop the mitigation strategy.
The key guideline in determining when to start a mitigation strategy is to identify when the “loading” condition starts to occur. This phase of operation will be marked by the start of overflow queuing at key bottleneck locations. Enacting the mitigation strategy at the beginning of the loading phase of operation can help to delay the onset of debilitating queues. It is also important to consider the transition period between the normal operation and the mitigating strategy. In some cases, primarily changes to the signal cycle time, transition can last for many cycles. Depending on the controller firmware type and the configuration of the transition method type (best way, dwell, etc.), the controller may implement timings that make the situation “worse” during transition. Previous research (Shelby, et al, 2005) on transition methods found that except under extremely specific situations, “best way” methods that get the controller back into coordination as quickly as possible and has the least impact on system delay. Dwell is recommended in oversaturated conditions where the controller dwells in the oversaturated phase (i.e. TOSI > 0 and not SOSI >0) during the transition time.
Similarly, the mitigation strategy can be stopped when the overflow queues have been dissipated and the situation returns to normal operation. It is important that the end time of the mitigation strategy is not “too soon”. The test cases conducted in the research project show that continuing
Application of Traffic Control Strategies for Mitigation of Oversaturated Conditions Page 108
to apply the mitigation strategy during the recovery period is extremely important to maximizing the overall system performance.
On-line Implementation of Mitigation Strategies When the scenario is non-recurrent, mitigating strategies should be implemented based on the status of field detectors. To implement a mitigation strategy on-line, detection zones must be deployed, those detectors must be connected to field controllers, and there must be communications from the field controllers to a central system. Existing traffic responsive logic in central systems might be configured to select among mitigating strategies and normal operating timing plans. Central systems that use the UTCS/USDOT traffic responsive logic should be configured such that “K” values in V+KO calculations are sufficiently large so that the occupancy data far overshadows the volume inputs. This is critical since the volume measurement is largely unreliable and the detector data is dominated by occupancy during oversaturated conditions. Using existing traffic responsive logic components of central systems does not require high-speed communications between field controllers and central.
While detector occupancy increases during oversaturation, its value is capped at 100%. As long as the queue extends across the detection point, there is no way with occupancy alone to determine the difference between a queue of 200 vehicles from a queue of 50 vehicles. As part of the research project, experimental software was developed that can assess TOSI and SOSI and measure queue lengths. This component is integrated with a logic processor tool that can use these measures in selection of mitigating strategies. This software is available from NCHRP.
The key features of the logic processor is that it uses simple if…then threshold rules to determine if a detector status condition is met or not. This can include TOSI, SOSI, queue length, and detector occupancy. These conditions can be combined for several detector stations in “AND” and “OR” logic to make more complicated decisions based on multiple detection inputs. Similarly, thresholds and if…then logic can be applied to determine when to stop applying a certain strategy.
Queue measurement and TOSI/SOSI measures provide more accurate determination of oversaturated conditions, but it is not required that these measures be used to trigger on-line mitigation strategies. Traditional occupancy measurements can also be used with the logic processor application (or traffic responsive features of central systems), given that the detectors are located appropriately and aggregation of the data is configured appropriately. Queue measurement and TOSI/SOSI measures requires high-resolution (i.e. second-by-second) data on phase timing and detector occupancy data to be collected and returned to the central system for processing.
Determining Detector Locations Queue length estimation and identification of saturated occupancy is best applied with detectors that are significantly upstream of the stop bar. Utilization of occupancy data from stop bar detectors is not recommended since those detectors will report 100% occupancy during the red
Application of Traffic Control Strategies for Mitigation of Oversaturated Conditions Page 109
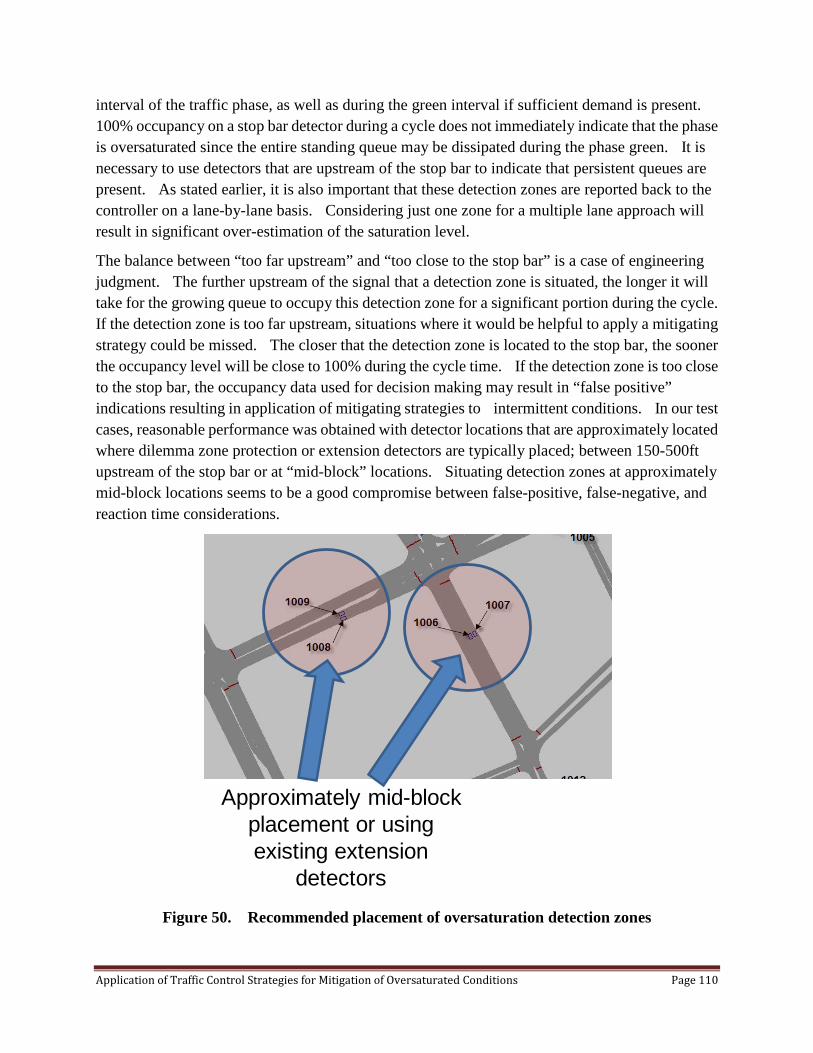
interval of the traffic phase, as well as during the green interval if sufficient demand is present. 100% occupancy on a stop bar detector during a cycle does not immediately indicate that the phase is oversaturated since the entire standing queue may be dissipated during the phase green. It is necessary to use detectors that are upstream of the stop bar to indicate that persistent queues are present. As stated earlier, it is also important that these detection zones are reported back to the controller on a lane-by-lane basis. Considering just one zone for a multiple lane approach will result in significant over-estimation of the saturation level.
The balance between “too far upstream” and “too close to the stop bar” is a case of engineering judgment. The further upstream of the signal that a detection zone is situated, the longer it will take for the growing queue to occupy this detection zone for a significant portion during the cycle. If the detection zone is too far upstream, situations where it would be helpful to apply a mitigating strategy could be missed. The closer that the detection zone is located to the stop bar, the sooner the occupancy level will be close to 100% during the cycle time. If the detection zone is too close to the stop bar, the occupancy data used for decision making may result in “false positive” indications resulting in application of mitigating strategies to intermittent conditions. In our test cases, reasonable performance was obtained with detector locations that are approximately located where dilemma zone protection or extension detectors are typically placed; between 150-500ft upstream of the stop bar or at “mid-block” locations. Situating detection zones at approximately mid-block locations seems to be a good compromise between false-positive, false-negative, and reaction time considerations.
Figure 50. Recommended placement of oversaturation detection zones
Approximately mid-block placement or using existing extension
detectors
Application of Traffic Control Strategies for Mitigation of Oversaturated Conditions Page 110

Placement of Detectors for On-line Recognition of a Scenario In simple situations involving an individual approach or an individual intersection, it is straightforward to identify where detection zones are needed since they should be placed on the approaches where the queuing is experienced. Similarly when dealing with a route or network scenario, the detection points should be placed where the queuing will determine when one or another mitigation strategy is necessary. However, when dealing with a route or network situation, it is a more subjective process to determine where the detection zones should be and which zones should be considered in decision making.
While logic conditions could be constructed that are quite complicated, in most situations, simpler logic and fewer detection points will be easier to manage and understand. Figure 51 illustrates the placement of oversaturation detectors for a common scenario. In this test case, there are three critical routes competing to access the same destination (toll booths at a border crossing). At various times of day, each route can become more critical than the others. In addition, the toll booth plaza can also become saturated to the point that no addition in flow of vehicles is possible. Thus, it is important to monitor each of the routes and select an appropriate timing plan depending on which combinations of routes are oversaturated.
Figure 51. Example Placement of Oversaturation Detection Points
Detector Data Aggregation Intervals and Persistence Time Aggregation of detector occupancy data is also important in balancing the occurrence of false-positive and false-negative conditions. There are two important considerations here: (a) the
CommonDestination for
all routes
Application of Traffic Control Strategies for Mitigation of Oversaturated Conditions Page 111

interval over which the detector occupancy is reported and (b) the number of intervals for this condition to be true before an oversaturated condition is considered to be “true”. Most controller firmware allows aggregation of detector data on a minute-by-minute basis. We recommend using the lowest possible aggregation level of one minute. Persistence times of three to five minutes (larger than most typical normal cycle times) are recommended to provide responsive reaction to oversaturated conditions.
Selection of an occupancy threshold (or queue length, or TOSI/SOSI measures, if used) is also an important consideration in determining reaction time and balancing false positives and false negatives. In order to minimize the number of false-negative indications, it is important that the threshold be set relatively high. However, the threshold should also not be set at 100%. Occupancy thresholds in the 80%-90% range seem effective in providing a compromise between reacting to oversaturated conditions in a timely fashion, but not resulting in false positives.
Logic Configuration Example
Considering the case shown in Figure 51, a number of mitigating timing plans can be applied based on the status of the oversaturation detectors. There are three components to setting up the congestion response plan in the logic tool:
• Configuration of the detection points
• Configuration of the logic clauses
• Configuration of the mitigating timing plans
This setup is illustrated in Figure 52. In this example, not all of the oversaturation detectors are used as inputs.
Figure 52. Set up for inputs, logic, and actions
The key component of the setup is the configuration of the logic engines. The logical clauses should consist of mutually exclusively true clauses that result in only one of the timing plans (“action sets”) selected for implementation. In this test case, we constructed a logic table to
Application of Traffic Control Strategies for Mitigation of Oversaturated Conditions Page 112
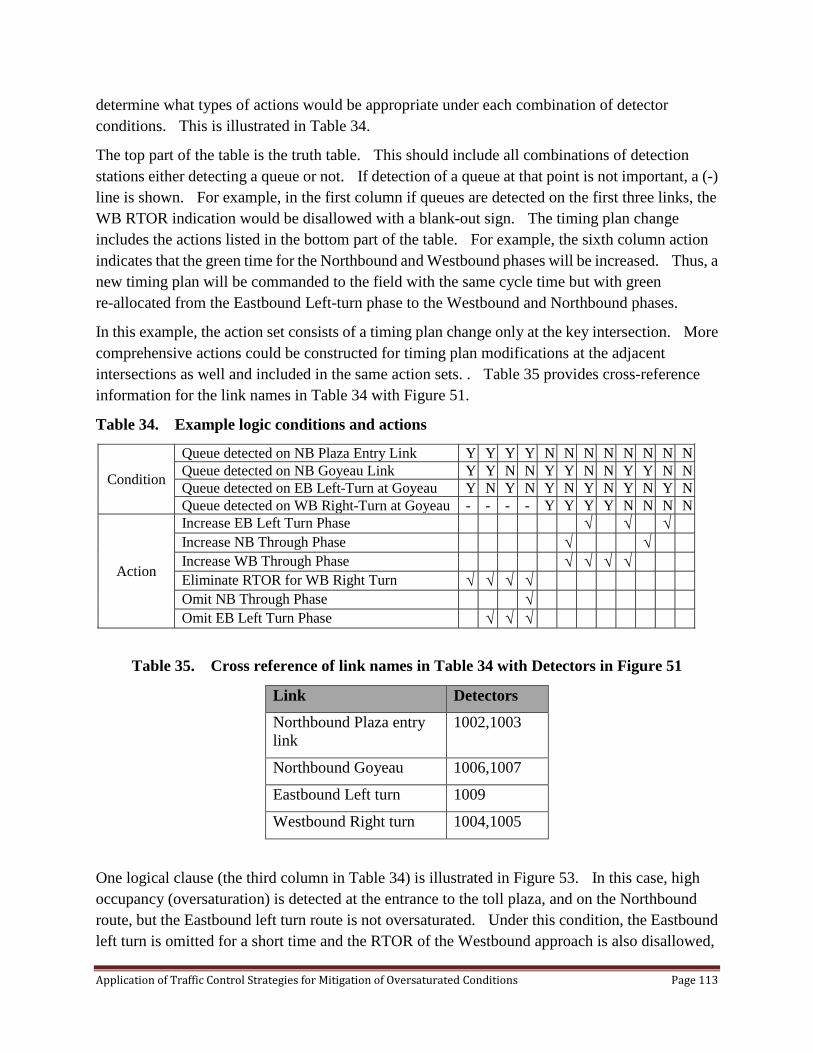
determine what types of actions would be appropriate under each combination of detector conditions. This is illustrated in Table 34.
The top part of the table is the truth table. This should include all combinations of detection stations either detecting a queue or not. If detection of a queue at that point is not important, a (-) line is shown. For example, in the first column if queues are detected on the first three links, the WB RTOR indication would be disallowed with a blank-out sign. The timing plan change includes the actions listed in the bottom part of the table. For example, the sixth column action indicates that the green time for the Northbound and Westbound phases will be increased. Thus, a new timing plan will be commanded to the field with the same cycle time but with green re-allocated from the Eastbound Left-turn phase to the Westbound and Northbound phases.
In this example, the action set consists of a timing plan change only at the key intersection. More comprehensive actions could be constructed for timing plan modifications at the adjacent intersections as well and included in the same action sets. . Table 35 provides cross-reference information for the link names in Table 34 with Figure 51.
Table 34. Example logic conditions and actions
Table 35. Cross reference of link names in Table 34 with Detectors in Figure 51
Link Detectors
Northbound Plaza entry link
1002,1003
Northbound Goyeau 1006,1007
Eastbound Left turn 1009
Westbound Right turn 1004,1005
One logical clause (the third column in Table 34) is illustrated in Figure 53. In this case, high occupancy (oversaturation) is detected at the entrance to the toll plaza, and on the Northbound route, but the Eastbound left turn route is not oversaturated. Under this condition, the Eastbound left turn is omitted for a short time and the RTOR of the Westbound approach is also disallowed,
Condition
Queue detected on NB Plaza Entry Link Y Y Y Y N N N N N N N N Queue detected on NB Goyeau Link Y Y N N Y Y N N Y Y N N Queue detected on EB Left-Turn at Goyeau Y N Y N Y N Y N Y N Y N Queue detected on WB Right-Turn at Goyeau - - - - Y Y Y Y N N N N
Action
Increase EB Left Turn Phase √ √ √ Increase NB Through Phase √ √ Increase WB Through Phase √ √ √ √ Eliminate RTOR for WB Right Turn √ √ √ √ Omit NB Through Phase √ Omit EB Left Turn Phase √ √ √
Application of Traffic Control Strategies for Mitigation of Oversaturated Conditions Page 113
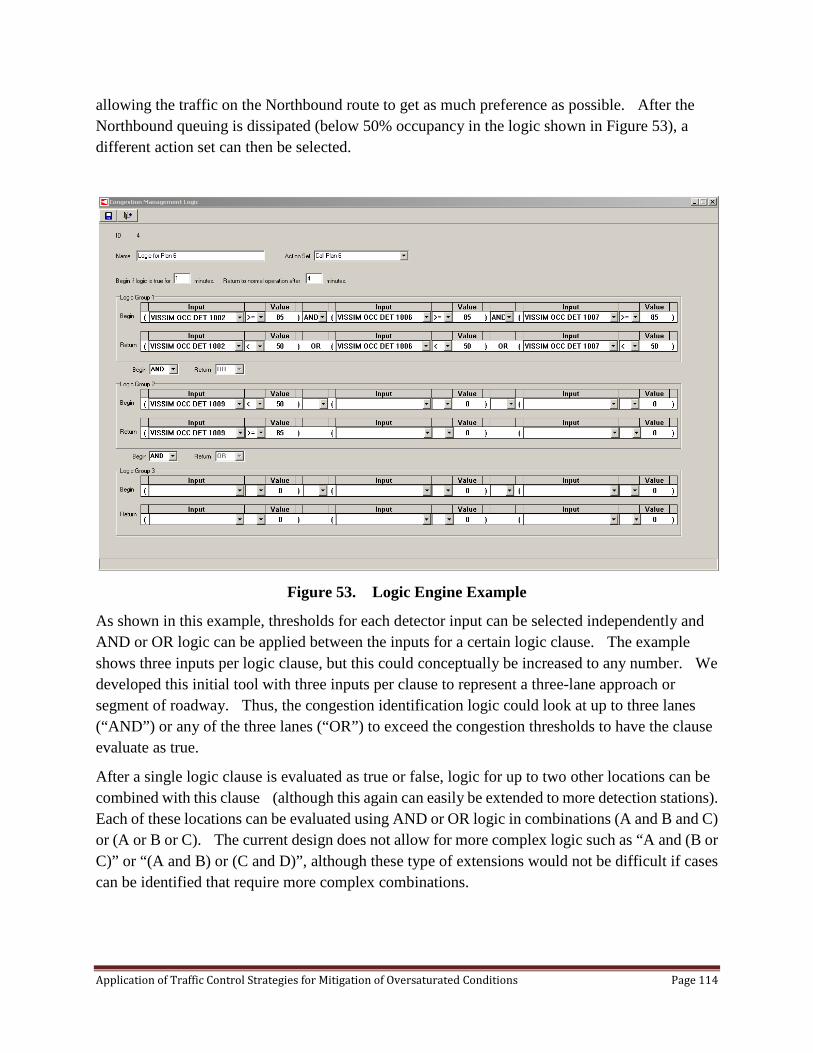
allowing the traffic on the Northbound route to get as much preference as possible. After the Northbound queuing is dissipated (below 50% occupancy in the logic shown in Figure 53), a different action set can then be selected.
Figure 53. Logic Engine Example
As shown in this example, thresholds for each detector input can be selected independently and AND or OR logic can be applied between the inputs for a certain logic clause. The example shows three inputs per logic clause, but this could conceptually be increased to any number. We developed this initial tool with three inputs per clause to represent a three-lane approach or segment of roadway. Thus, the congestion identification logic could look at up to three lanes (“AND”) or any of the three lanes (“OR”) to exceed the congestion thresholds to have the clause evaluate as true.
After a single logic clause is evaluated as true or false, logic for up to two other locations can be combined with this clause (although this again can easily be extended to more detection stations). Each of these locations can be evaluated using AND or OR logic in combinations (A and B and C) or (A or B or C). The current design does not allow for more complex logic such as “A and (B or C)” or “(A and B) or (C and D)”, although these type of extensions would not be difficult if cases can be identified that require more complex combinations.
Application of Traffic Control Strategies for Mitigation of Oversaturated Conditions Page 114

Begin and Return Conditions Each clause has a “begin” and a “return” condition. This will reduce waffling of the logic from on and off conditions. This is an identical concept to the way that traffic responsive thresholds key the currently selected plan running for 15-30 minutes. In this example, the “AND” condition in the first row indicates that the occupancy of the detectors 2002, 2006, and 2007 must all be above 85%, for the clause to resolve as “true”. This condition will then remain true until the occupancy of all the detectors drop below, 50%. This reduces waffling in the timing plan decision if just a single lane drops below 50% for several cycles. Certainly more experimentation and research is necessary to provide guidelines on the setting of entry and return thresholds. Regardless of their exact values, however, it is important to make sure that the entry and exit thresholds are not exactly the same number. If the entry threshold is 85%, the exit threshold should be at least, say, 75% or lower. If the begin and return thresholds are the same value, much more frequent switching between plans will occur resulting in significant performance degradation.
Persistence Time Thresholds Begin and return conditions for each clause each have persistence time thresholds, which can be changed independently, to make sure that the entry or release condition is persistent for a minimum amount of time before the clause is evaluated as true or false. The approach is currently designed so that the entry and release conditions for all clauses in the logic use the same values for the persistence time. This could be modified, but we find no empirical evidence or theoretical justification for different persistence thresholds. However, some experimentation does reveal that it may be useful to configure the “begin” and “return” persistence times differently. In particular, it seems to be more effective to configure a very low threshold for “begin” persistence and a longer time threshold for “return”. In our testing, entry thresholds of one minute and return thresholds of 3-4 minutes seemed to provide reasonably responsive operation. This rule of thumb specifically refers to the use of detector occupancy as trigger inputs, as TOSI, SOSI, and queue length estimates were not tested as extensively.
On-line Performance Evaluation Framework For the research project, this experimental congestion management logic tool was integrated with Virtual D4 traffic control software and the Vissim simulation system as illustrated in Figure 54. This system can use detector occupancy, TOSI/SOSI, and queue length as inputs to logic clauses. Field integration of the logic tool using TOSI/SOSI and queue estimation algorithms with real-world traffic controllers would be necessary for any field implementation. The system is available from NCHRP.
Application of Traffic Control Strategies for Mitigation of Oversaturated Conditions Page 115
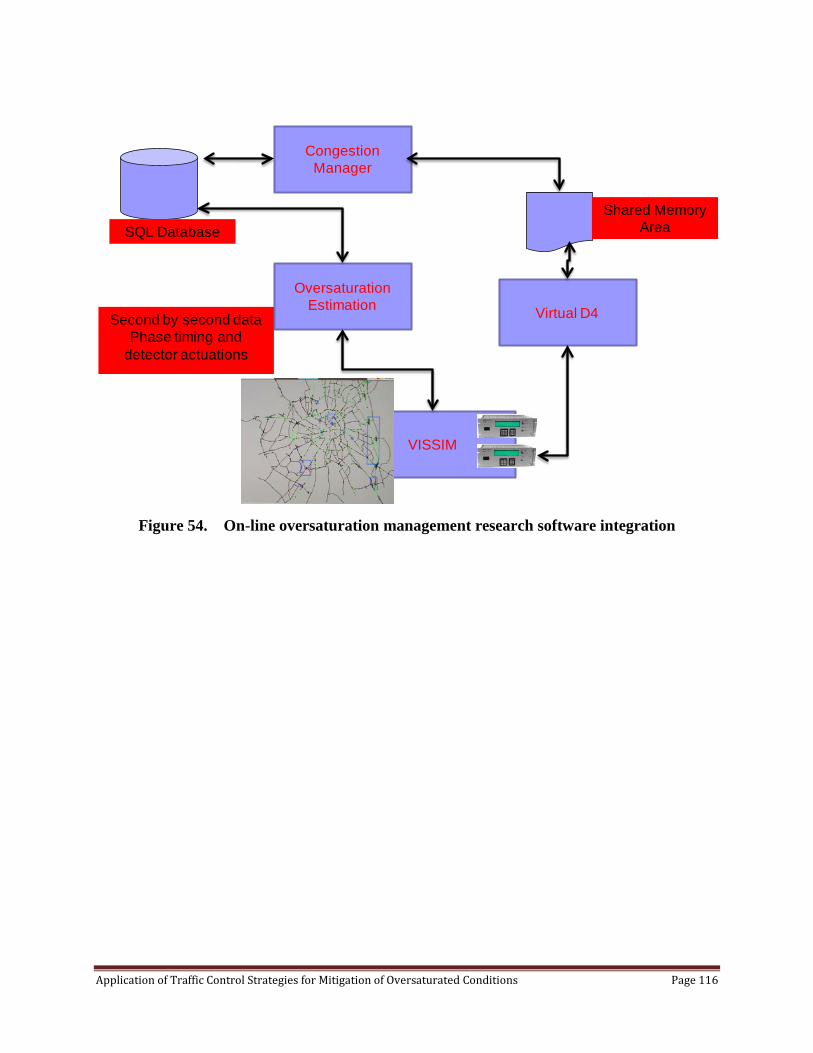
Figure 54. On-line oversaturation management research software integration
VISSIM
Congestion Manager
Oversaturation Estimation
Virtual D4
Second by second dataPhase timing and
detector actuations
SQL Database
Shared Memory Area
Application of Traffic Control Strategies for Mitigation of Oversaturated Conditions Page 116

Step 6: Assessment of Effectiveness of Mitigating Strategies Since there are so many variables and potential mitigating strategies, there are no hard and fast rules yet that can predict how specific sets of signal timing parameters will result in specific benefits. The variety of test cases that were conducted in the research project showed improvements to system throughput and reduction in system delays. Implementation of mitigating strategies is an iterative process of deployment, data collection, revision, and re-deployment. The test cases that were evaluated during the research largely followed this process. Traditional assessment techniques including intersection delay studies and travel time measurement on critical routes can be applied. During an oversaturated conditions scenario, the mitigations that are necessary to alleviate the condition are likely to degrade the performance of other movements and non-critical routes (in some cases, causing those other routes to become oversaturated). The degree to which the other movements and routes are affected is directly proportional to the aggressiveness of the mitigation that is applied. For example, implementing a green flush strategy will increase the side-street queues substantially while only modifying the offsets and cycle time may not have as significant an impact on non-critical movements. In section 3 we introduced the concepts of the total vehicles in the system, total system output and total system input. Holistic performance measures such as these can be assessed easily using simulation models, but are much more difficult to directly measure in the field. However, TOSI and SOSI measures and queue lengths are quite easy to observe directly in the field. A straightforward assessment approach that follows traditional “before” and “after” principles is recommended. This approach is augmented with the characterization of the three regimes of oversaturated operation: loading, processing, and recovery. Estimation of these regimes of operation in the before and after conditions can be helpful in determining a measurable improvement without needing to measure holistic system performance such as total system input or output.
“Before” Condition Process As illustrated in Section 3 of this guide, the calculation of TOSI, SOSI, and queue length effects is helpful in assessing the extent of the problem. That example case is repeated here.
Application of Traffic Control Strategies for Mitigation of Oversaturated Conditions Page 117
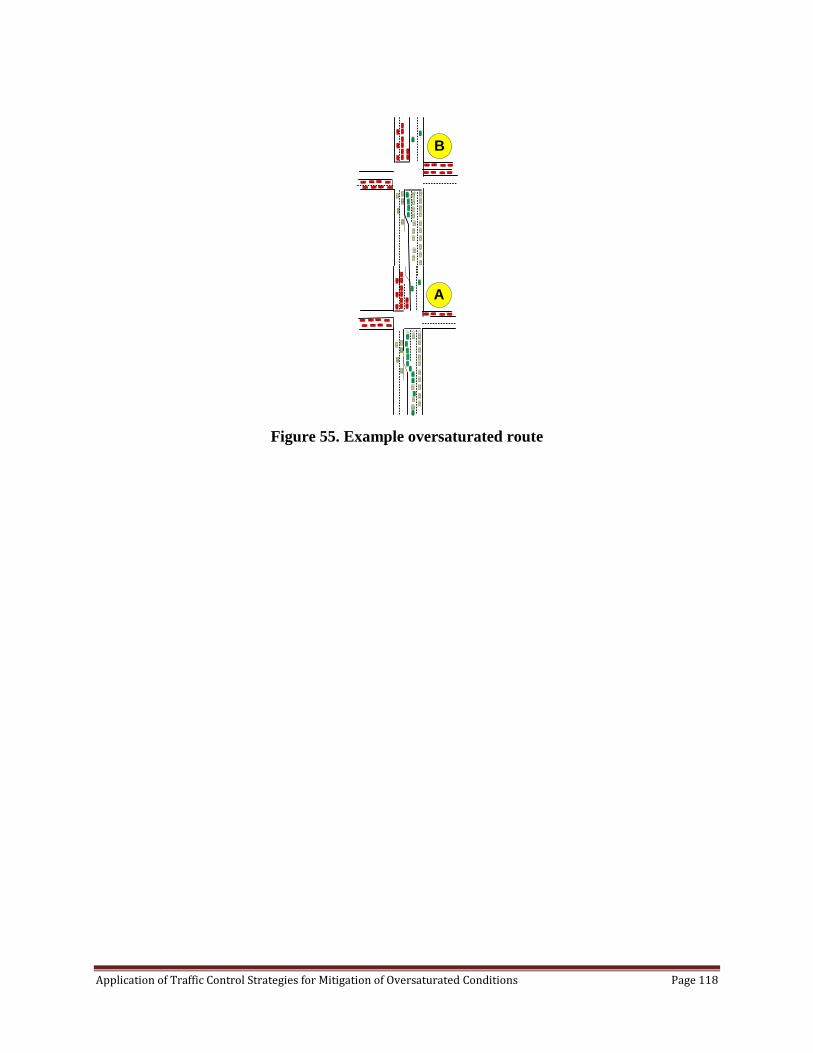
Figure 55. Example oversaturated route
A
B
Application of Traffic Control Strategies for Mitigation of Oversaturated Conditions Page 118
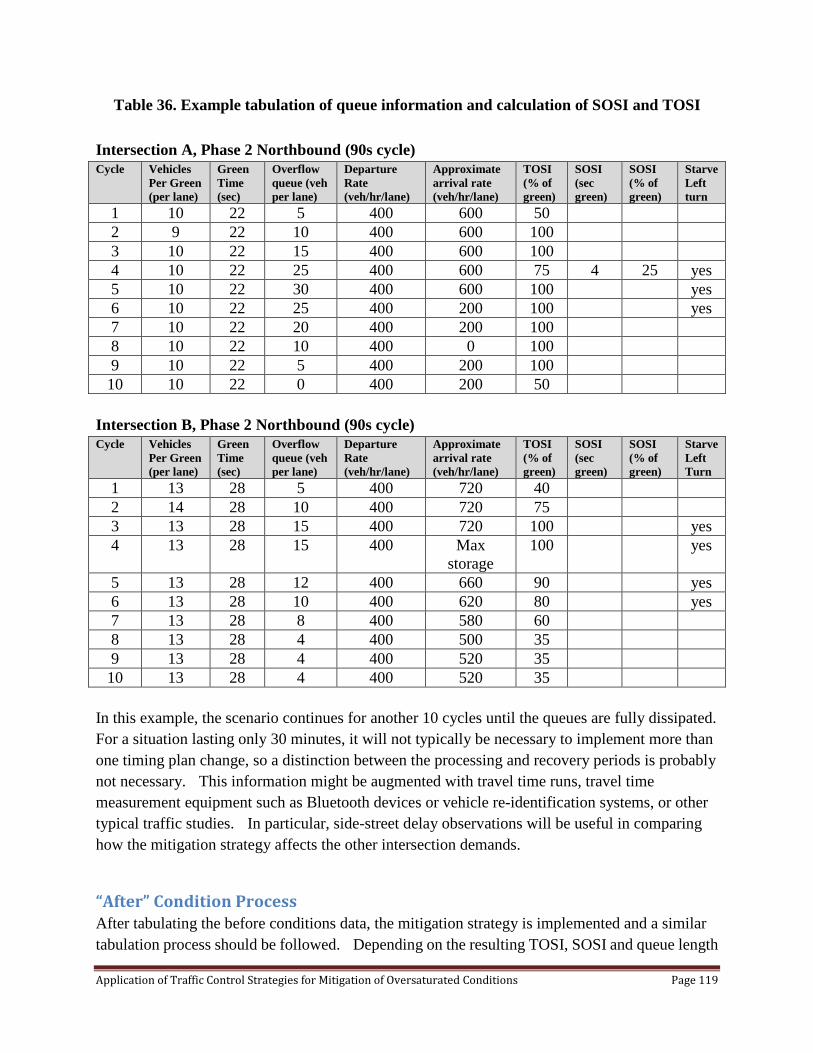
Table 36. Example tabulation of queue information and calculation of SOSI and TOSI
Intersection A, Phase 2 Northbound (90s cycle) Cycle Vehicles
Per Green (per lane)
Green Time (sec)
Overflow queue (veh per lane)
Departure Rate (veh/hr/lane)
Approximate arrival rate (veh/hr/lane)
TOSI (% of green)
SOSI (sec green)
SOSI (% of green)
Starve Left turn
1 10 22 5 400 600 50 2 9 22 10 400 600 100 3 10 22 15 400 600 100 4 10 22 25 400 600 75 4 25 yes 5 10 22 30 400 600 100 yes 6 10 22 25 400 200 100 yes 7 10 22 20 400 200 100 8 10 22 10 400 0 100 9 10 22 5 400 200 100 10 10 22 0 400 200 50
Intersection B, Phase 2 Northbound (90s cycle) Cycle Vehicles
Per Green (per lane)
Green Time (sec)
Overflow queue (veh per lane)
Departure Rate (veh/hr/lane)
Approximate arrival rate (veh/hr/lane)
TOSI (% of green)
SOSI (sec green)
SOSI (% of green)
Starve Left Turn
1 13 28 5 400 720 40 2 14 28 10 400 720 75 3 13 28 15 400 720 100 yes 4 13 28 15 400 Max
storage 100 yes
5 13 28 12 400 660 90 yes 6 13 28 10 400 620 80 yes 7 13 28 8 400 580 60 8 13 28 4 400 500 35 9 13 28 4 400 520 35 10 13 28 4 400 520 35
In this example, the scenario continues for another 10 cycles until the queues are fully dissipated. For a situation lasting only 30 minutes, it will not typically be necessary to implement more than one timing plan change, so a distinction between the processing and recovery periods is probably not necessary. This information might be augmented with travel time runs, travel time measurement equipment such as Bluetooth devices or vehicle re-identification systems, or other typical traffic studies. In particular, side-street delay observations will be useful in comparing how the mitigation strategy affects the other intersection demands.
“After” Condition Process After tabulating the before conditions data, the mitigation strategy is implemented and a similar tabulation process should be followed. Depending on the resulting TOSI, SOSI and queue length
Application of Traffic Control Strategies for Mitigation of Oversaturated Conditions Page 119

measurements, it may be necessary to adjust the mitigation strategy and try the next day. Comparing the two tables can directly measure the effects of the strategy. Comparing the side-street delay performance in the before and after conditions can assess whether the additional delays added to the undersaturated movements offset the performance gains on the oversaturated route.
Application of Traffic Control Strategies for Mitigation of Oversaturated Conditions Page 120

Summary This guide presents a rational approach for identifying traffic control strategies for mitigating oversaturated conditions at signalized intersections. This guide discussed following components of the rational approach:
• Diagnosis of the type and causes of the oversaturated condition. • Identification of appropriate operational objective(s) based on the observed condition(s). • Identification of appropriate strategies to address the situation. • Identifying any necessary infrastructure, equipment, or software requirements for each
strategy. A preliminary approach for determining green time adjustments on oversaturated routes is included in Appendix B. Other mitigations and rules of thumb noted in this guide link common controller capabilities to certain types of traffic scenarios. For some of the strategies, we have provided example results and application guidelines. An experimental mathematical optimization approach is documented in the final report. Oversaturated traffic systems are the most complex and difficult traffic control problems. Under oversaturation, typical traffic control strategies do not work as efficiently as necessary, particularly since the objectives need to be decidedly different when mobility is restricted (e.g. “move someone, somewhere” rather than “give everyone equity treatment per cycle”). Many practitioners argue or conclude that “there is nothing that can be done when there is simply too much traffic”. Under many typical oversaturated conditions, mitigating strategies can be applied that have an appreciable effect on overall system performance. There are two important clarifying factors. First, it is important to consider at three different regimes (loading, mitigation, and recovery) of operation under which performance is considered. Secondly, during oversaturated conditions, “performance” must be measured with respect to different objectives than objectives that are appropriate during undersaturated operation. In particular, during oversaturated conditions, the objective to minimize individual user delay must be substituted with the objective to maximize system throughput or to manage queues. Mitigation of oversaturated conditions will frequently involve trade-offs between the storage of traffic queues from the oversaturated movements to other less utilized movements. This practice might be described by the idiom “borrowing from Peter to pay Paul”. Counter-intuitively or perhaps paradoxically, the same control strategy that provides user-optimal delay minimization in under-saturation works against the minimization of total delay when one or more approaches become oversaturated. It may in fact be necessary to induce phase failures and overflow queuing on side streets in order to maximize the flow rates on heavily oversaturated movements. These changes in operational policy or strategy may be challenging to communicate to an organization and the public.
Application of Traffic Control Strategies for Mitigation of Oversaturated Conditions Page 121

A rational procedure for identifying mitigations is provided in this guide. A step-wise process is described that starts with problem identification, mitigation selection, and deployment. This process is illustrated below.
Figure 56. Overview of the Process
Some rules of thumb for implementing specific mitigations were described. Performance results from several simulation test cases are provided as evidence of effectiveness of certain strategies under certain conditions. These examples should be taken at face value as an example and not a guarantee of similar results under a different set of local conditions. In general, there are three regimes of operation during an oversaturated scenario:
• Loading maximize throughput • Oversaturated operation (processing) manage queues • Recovery maximize throughput
This is repeated from the introduction here.
Step 1: Become Aware of Oversaturation Condition
Step 2:Spatial extent
Temporal extent
Step 3: Identify ObjectivesImprove Throughput
Manage Queues
Step 4: Identify applicable mitigating strategies
Identify equipment needs
Step 5: Implement Strategies
Step 6: Observe and measure Performance
Step 7: Document Results
Application of Traffic Control Strategies for Mitigation of Oversaturated Conditions Page 122

Figure 57. Allocation of optimization objectives to phases of operation
Depending on the scenario, these regimes might last for several minutes or several hours. In situations where the condition is short-lived, it may not even be necessary to provide different type of operation during the three regimes. In test cases that last for a longer amount of time, we found that it may be beneficial to apply different timing plans during the three regimes. A variety of mitigating strategies were explored and described. The following table summarizes the mitigation strategies that were considered and their application to the various symptoms associated with oversaturated conditions.
LOADING OVERSATURATEDOPERATION
RECOVERY
TIME
TRAFFICLOAD
Maximize Throughput
Manage Queues
Maximize Throughput
Application of Traffic Control Strategies for Mitigation of Oversaturated Conditions Page 123
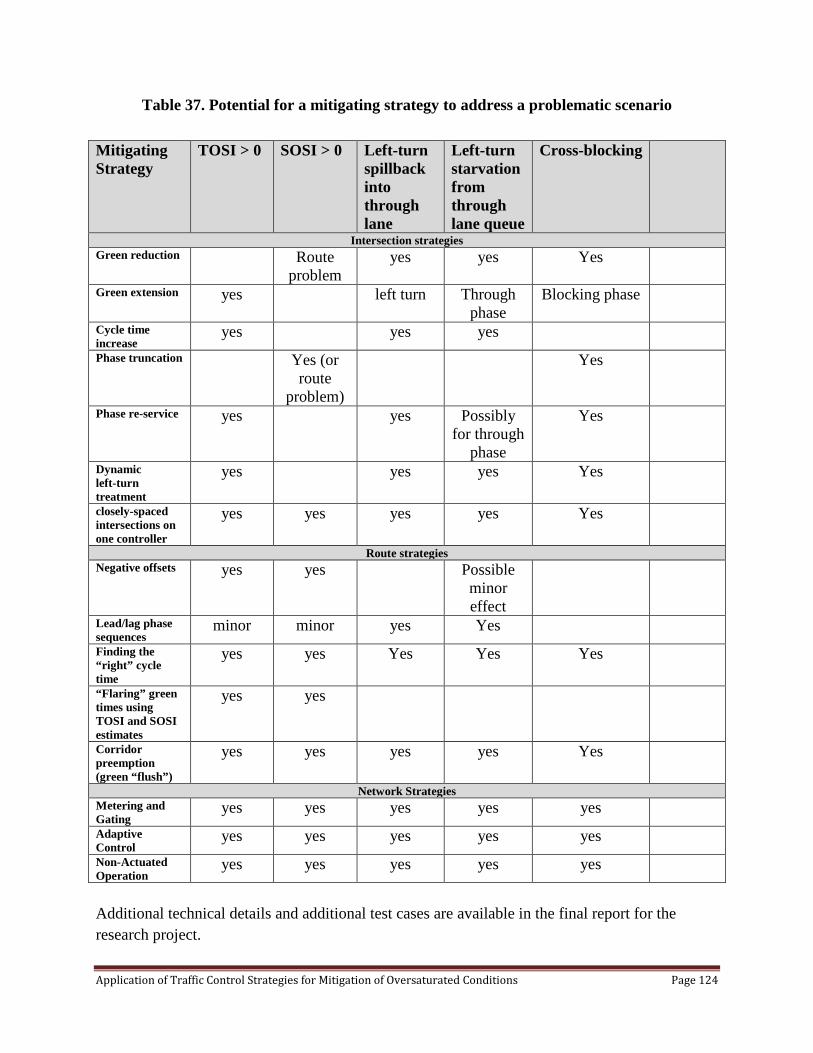
Table 37. Potential for a mitigating strategy to address a problematic scenario
Mitigating Strategy
TOSI > 0 SOSI > 0 Left-turn spillback into through lane
Left-turn starvation from through lane queue
Cross-blocking
Intersection strategies Green reduction Route
problem yes yes Yes
Green extension yes left turn Through phase
Blocking phase
Cycle time increase
yes yes yes Phase truncation Yes (or
route problem)
Yes
Phase re-service yes yes Possibly for through
phase
Yes
Dynamic left-turn treatment
yes yes yes Yes
closely-spaced intersections on one controller
yes yes yes yes Yes
Route strategies Negative offsets yes yes Possible
minor effect
Lead/lag phase sequences
minor minor yes Yes Finding the “right” cycle time
yes yes Yes Yes Yes
“Flaring” green times using TOSI and SOSI estimates
yes yes
Corridor preemption (green “flush”)
yes yes yes yes Yes
Network Strategies Metering and Gating
yes yes yes yes yes Adaptive Control
yes yes yes yes yes Non-Actuated Operation
yes yes yes yes yes
Additional technical details and additional test cases are available in the final report for the research project.
Application of Traffic Control Strategies for Mitigation of Oversaturated Conditions Page 124
References
1. Koonce, P., Rodegerdts, L., Lee, K., Quayle, S., Beaird, S., Braud, C., Bonneson, J., Tarnoff, P., & Urbanik, T. (2008). FHWA Traffic Signal Timing Manual. http://ops.fhwa.dot.gov/arterial_mgmt/tstmanual.htm
2. Bonneson, J., Pratt, M., & Zimmerman, K. (2009). Traffic Signal Operations Handbook.
http://tti.tamu.edu/documents/0-5629-P1.pdf
3. Minnesota Department of Transportation. (2011). Traffic Signal Timing and Coordination Manual. http://www.dot.state.mn.us/trafficeng/publ/signaloperations/2011_Timing%20&_Coordination_Manual2011.pdf
4. Denney, R. W., Head, L., and Spencer, K. (2008). Signal Timing Under Saturated
Conditions, Federal Highway Administration, Report No. FHWA-HOP-09-008. http://ops.fhwa.dot.gov/publications/fhwahop09008/chapter1.htm
5. Shelby, S., Bullock, D., & Gettman, D. (2005). Resonant Cycles in Traffic Signal Control. Transportation Research Record: Journal of the Transportation Research Board, No. 1925. Transportation Research Board of the National Academies, Washington, D.C.
6. Lieberman, E. B., Chang, J. & Prassas, E. S. (2000). Formulation of Real-Time Control
Policy for Oversaturated Arterials. Transportation Research Record: Journal of the Transportation Research Board, No. 1727, TRB, National Research Council, Washington, D.C., 77– 88.
7. Beaird, S., Urbanik II, T. & Bullock, D. (2006). Traffic Signal Phase Truncation in Event of Traffic Flow Restriction. Transportation Research Record: Journal of the Transportation Research Board, No. 1978, Transportation Research Board of the National Academies, Washington, D.C.
8. Chaudury, N. & Chu, C.-L. 2000. Guidelines for Timing and Coordinating Diamond Interchanges with Adjacent Traffic Signals. http://tti.tamu.edu/documents/4913-2.pdf
9. Li, M. T. & Gan, A. C. (1999). Signal Timing Optimization for Oversaturated Networks Using TRANSYT-7F. Transportation Research Record: Journal of the Transportation Research Board, No. 1683, TRB, National Research Council, Washington, D.C.
Application of Traffic Control Strategies for Mitigation of Oversaturated Conditions Page 125

Appendix A: Glossary of Terms Actuated Signal Control The timing duration of a phase is based on detection of demand for the phase. Adaptive Signal Control A signal control concept where detection data is used in conjunction with an optimization technique and a traffic model to adjust green time allocation and signal parameters to meet an optimization objective. Annual average daily traffic The total volume of traffic passing a point or segment of a highway facility in both directions for one year divided by the number of days in the year. Approach A set of lanes at an intersection that accommodates all left-turn, through, and right-turn movements from a given direction. Arrival rate The mean of a statistical distribution of vehicles arriving at a point or uniform segment of a lane or roadway. Arterial A signalized street that primarily serves through traffic and that secondarily provides access to abutting properties, with signal spacing of 2.0 miles or less. Arterial LOS An arterial- and network-level performance measure associated with the class of arterial and the travel speed of arterial under study. Average Speed The average distance a vehicle travels within a measured amount of time. Back of queue The distance between the stop line of a signalized intersection and the farthest reach of an upstream queue, expressed as a number of “average” length vehicles or a distance. The vehicles previously stopped at the front of the queue are counted even if they begin moving. Bandwidth The minimum amount of green time for a designated direction of travel through a sequence of traffic signals at an assumed constant speed, typically measured in seconds, typically achieved by coordination and offset features in the signal controller. Bandwidth efficiency A measure that normalizes bandwidth against the cycle length for the arterial under study. Barnes’ Dance A term for an exclusive pedestrian phase where pedestrians may cross the intersections in any direction, including diagonally. Barrier A separation of intersecting movements in separate rings to prevent operation of conflicting phases at the same time. Blocking Condition A blocking condition exists when the queues of one movement prevent one or more other movements from proceeding through the intersection during its associated green time. Call A term used to describe the presence of vehicle, bicycle, or pedestrian demand in an actuated traffic controller. Capacity The maximum rate at which vehicles can pass through a traffic facility under prevailing conditions. It is also the ratio of time during which vehicles may enter the intersection. Change interval The yellow plus red clearance interval that occurs between phases of a traffic signal to provide for clearance of the intersection before conflicting movements are released. Also known as the clearance interval. Clearance lost time The time, in seconds, between signal phases during which an intersection is not used by any traffic. Concurrent Phases Two or more phases in separate rings that are able to operate together without conflicting movements. Control Delay The amount of additional travel time experienced by a user attributable to a control device.
Application of Traffic Control Strategies for Mitigation of Oversaturated Conditions Page 126
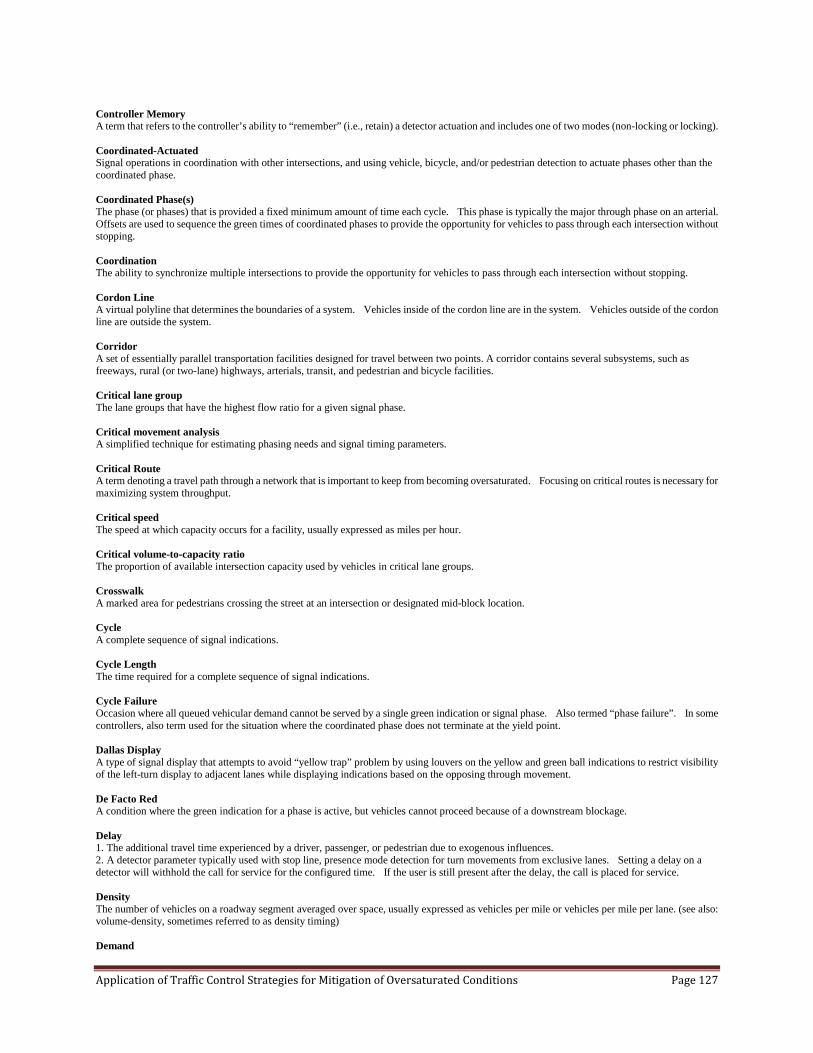
Controller Memory A term that refers to the controller’s ability to “remember” (i.e., retain) a detector actuation and includes one of two modes (non-locking or locking). Coordinated-Actuated Signal operations in coordination with other intersections, and using vehicle, bicycle, and/or pedestrian detection to actuate phases other than the coordinated phase. Coordinated Phase(s) The phase (or phases) that is provided a fixed minimum amount of time each cycle. This phase is typically the major through phase on an arterial. Offsets are used to sequence the green times of coordinated phases to provide the opportunity for vehicles to pass through each intersection without stopping. Coordination The ability to synchronize multiple intersections to provide the opportunity for vehicles to pass through each intersection without stopping. Cordon Line A virtual polyline that determines the boundaries of a system. Vehicles inside of the cordon line are in the system. Vehicles outside of the cordon line are outside the system. Corridor A set of essentially parallel transportation facilities designed for travel between two points. A corridor contains several subsystems, such as freeways, rural (or two-lane) highways, arterials, transit, and pedestrian and bicycle facilities. Critical lane group The lane groups that have the highest flow ratio for a given signal phase. Critical movement analysis A simplified technique for estimating phasing needs and signal timing parameters. Critical Route A term denoting a travel path through a network that is important to keep from becoming oversaturated. Focusing on critical routes is necessary for maximizing system throughput. Critical speed The speed at which capacity occurs for a facility, usually expressed as miles per hour. Critical volume-to-capacity ratio The proportion of available intersection capacity used by vehicles in critical lane groups. Crosswalk A marked area for pedestrians crossing the street at an intersection or designated mid-block location. Cycle A complete sequence of signal indications. Cycle Length The time required for a complete sequence of signal indications. Cycle Failure Occasion where all queued vehicular demand cannot be served by a single green indication or signal phase. Also termed “phase failure”. In some controllers, also term used for the situation where the coordinated phase does not terminate at the yield point. Dallas Display A type of signal display that attempts to avoid “yellow trap” problem by using louvers on the yellow and green ball indications to restrict visibility of the left-turn display to adjacent lanes while displaying indications based on the opposing through movement. De Facto Red A condition where the green indication for a phase is active, but vehicles cannot proceed because of a downstream blockage. Delay 1. The additional travel time experienced by a driver, passenger, or pedestrian due to exogenous influences. 2. A detector parameter typically used with stop line, presence mode detection for turn movements from exclusive lanes. Setting a delay on a detector will withhold the call for service for the configured time. If the user is still present after the delay, the call is placed for service. Density The number of vehicles on a roadway segment averaged over space, usually expressed as vehicles per mile or vehicles per mile per lane. (see also: volume-density, sometimes referred to as density timing) Demand
Application of Traffic Control Strategies for Mitigation of Oversaturated Conditions Page 127
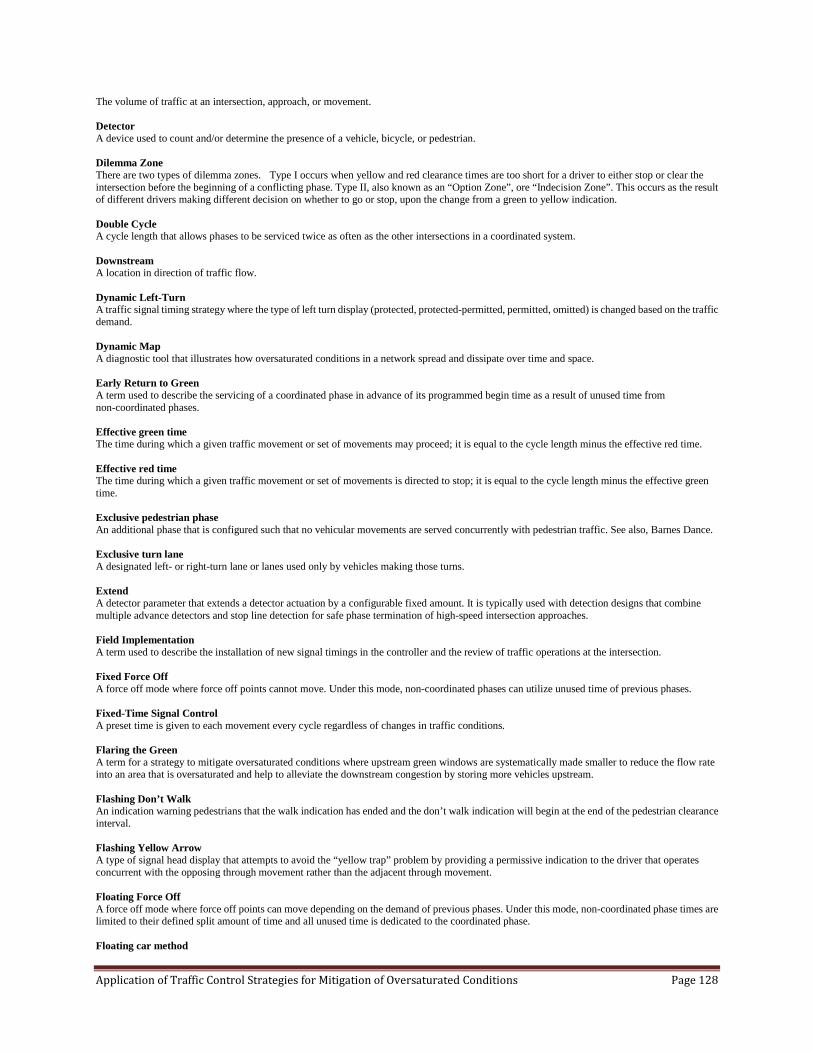
The volume of traffic at an intersection, approach, or movement. Detector A device used to count and/or determine the presence of a vehicle, bicycle, or pedestrian. Dilemma Zone There are two types of dilemma zones. Type I occurs when yellow and red clearance times are too short for a driver to either stop or clear the intersection before the beginning of a conflicting phase. Type II, also known as an “Option Zone”, ore “Indecision Zone”. This occurs as the result of different drivers making different decision on whether to go or stop, upon the change from a green to yellow indication. Double Cycle A cycle length that allows phases to be serviced twice as often as the other intersections in a coordinated system. Downstream A location in direction of traffic flow. Dynamic Left-Turn A traffic signal timing strategy where the type of left turn display (protected, protected-permitted, permitted, omitted) is changed based on the traffic demand. Dynamic Map A diagnostic tool that illustrates how oversaturated conditions in a network spread and dissipate over time and space. Early Return to Green A term used to describe the servicing of a coordinated phase in advance of its programmed begin time as a result of unused time from non-coordinated phases. Effective green time The time during which a given traffic movement or set of movements may proceed; it is equal to the cycle length minus the effective red time. Effective red time The time during which a given traffic movement or set of movements is directed to stop; it is equal to the cycle length minus the effective green time. Exclusive pedestrian phase An additional phase that is configured such that no vehicular movements are served concurrently with pedestrian traffic. See also, Barnes Dance. Exclusive turn lane A designated left- or right-turn lane or lanes used only by vehicles making those turns. Extend A detector parameter that extends a detector actuation by a configurable fixed amount. It is typically used with detection designs that combine multiple advance detectors and stop line detection for safe phase termination of high-speed intersection approaches. Field Implementation A term used to describe the installation of new signal timings in the controller and the review of traffic operations at the intersection. Fixed Force Off A force off mode where force off points cannot move. Under this mode, non-coordinated phases can utilize unused time of previous phases. Fixed-Time Signal Control A preset time is given to each movement every cycle regardless of changes in traffic conditions. Flaring the Green A term for a strategy to mitigate oversaturated conditions where upstream green windows are systematically made smaller to reduce the flow rate into an area that is oversaturated and help to alleviate the downstream congestion by storing more vehicles upstream. Flashing Don’t Walk An indication warning pedestrians that the walk indication has ended and the don’t walk indication will begin at the end of the pedestrian clearance interval. Flashing Yellow Arrow A type of signal head display that attempts to avoid the “yellow trap” problem by providing a permissive indication to the driver that operates concurrent with the opposing through movement rather than the adjacent through movement. Floating Force Off A force off mode where force off points can move depending on the demand of previous phases. Under this mode, non-coordinated phase times are limited to their defined split amount of time and all unused time is dedicated to the coordinated phase. Floating car method
Application of Traffic Control Strategies for Mitigation of Oversaturated Conditions Page 128
A commonly employed technique for travel time runs which requires the vehicle driver to “float” with the traffic stream while traveling at a speed that is representative of the other vehicles on the roadway and to pass as many vehicles as pass the floating car. Flow rate The equivalent hourly rate at which vehicles, bicycles, or persons pass a point on a lane, roadway, or other trafficway; computed as the number of vehicles, bicycles, or persons passing the point, divided by the time interval (usually less than 1 h) in which they pass; expressed as vehicles, bicycles, or persons per hour. Flow ratio The ratio of the actual flow rate to the saturation flow rate for a lane group at an intersection. Force Off A point within a cycle where a phase must end regardless of continued demand. These points in a coordinated cycle ensure that the coordinated phase returns in time to maintain its designated offset. Forward-Backward Procedure (FBP) A technique for solving for the green time modifications along an oversaturated route that will drive TOSI and SOSI values to zero. Free flow A flow of traffic unaffected by upstream or downstream conditions. Fully actuated control A signal operation in which vehicle detectors at each approach to the intersection control the occurrence and length of every phase. Gap The time, in seconds, for the front bumper of the second of two successive vehicles to reach the starting point of the front bumper of the first. Gap Reduction This is a feature that reduces the passage time to a smaller value while the phase is active. Gating A control strategy during oversaturated conditions where vehicles are held at upstream locations by shortening the green time so that downstream oversaturated conditions can be cleared, or kept from occurring. Also see Metering. Green Flush A signal timing strategy for oversaturated conditions where the intersections along an oversaturated route are preempted in sequence in order to quickly clear downstream congestion. See route preemption. Green time The duration, in seconds, of the green indication for a given movement at a signalized intersection. Green time ratio The ratio of the effective green time of a phase to the cycle length. Green Extension A signal priority treatment to extend a current green phase to give priority to a specific movement or vehicle, typically transit. Gridlock Gridlock is a special case of oversaturated conditions where simultaneous blocking of several movements causes traffic to remain unable to proceed in any direction. Hardware The devices that physically operate the signal timing controls, including the controller, detectors, signal heads, and conflict monitor. Headway (1) The time, in seconds, between two successive vehicles as they pass a point on the roadway, measured from the same common feature of both vehicles (for example, the front axle or the front bumper); (2) The time, usually expressed in minutes, between the passing of the front ends of successive transit units (vehicles or trains) moving along the same lane or track (or other guideway) in the same direction. Hardware in the Loop (HITL) A means of providing a direct linkage between simulation models and actual signal controllers. Highway Capacity Manual A National Academies of Science/Transportation Research Board manual containing a collection of state-of-the-art techniques for estimating the capacity and determining the level-of-service for transportation facilities, including intersections and roadways as well as facilities for transit, bicycles, and pedestrians. Inhibit Max A basic timing parameter that removes the Maximum Green input as a phase parameter during coordination and allows the phase to extend beyond its normal maximum green values.
Application of Traffic Control Strategies for Mitigation of Oversaturated Conditions Page 129
Interval The duration of time where a traffic signal indication does not change state (red, yellow, green, flashing don’t walk). A traffic signal controller also has timing intervals (min green, passage time) that determine the length of the green interval. Intersection Level of Service A qualitative measure describing operational conditions based on average intersection delay. Isolated intersection An intersection at least one mile from the nearest upstream signalized intersection. Lagging pedestrian interval A pedestrian timing option that starts pedestrian walk interval several seconds after the adjacent through movement phase, thus allowing a waiting right-turn queue to clear before the pedestrian walk indication is presented and thereby reducing conflicts with right-turning vehicles. Lane group A set of lanes established at an intersection approach for separate capacity and level-of-service analysis. Lane group delay The control delay for a given lane group. Lane utilization The distribution of vehicles among lanes when two or more lanes are available for a movement; however, as demand approaches capacity, uniform lane utilization develops. Leading pedestrian interval A pedestrian interval option that starts a few seconds before the adjacent through movement phase, thus allowing pedestrians to establish a presence in the crosswalk and thereby reducing conflicts with turning vehicles. Lead-Lag Left-Turn Phasing A left-turn phase sequence where one left-turn movement begins with the adjacent through movement and the opposing left-turn movement begins at the end of the conflicting through movement. This option may create a “yellow trap” with some permissive signal displays. Level of service A qualitative measure describing operational conditions within a traffic stream, based on service measures such as speed and travel time, freedom to maneuver, traffic interruptions, comfort, and convenience. Typically graded from A-F. Loading Regime The duration of time in an oversaturated conditions scenario when overflow queues are beginning to form. Local Controller The device used to operate and control the signal displays using signal timing provided by the user, master controller, or central signal system. Locking mode A controller memory mode used to trigger a call for service for the first actuation received by the controller on a specified channel during the red interval Lost Time The portion of time at the beginning of each green period and a portion of each yellow change plus red clearance period that is not usable by vehicles. Master Clock The background timing mechanism within the controller logic to which each controller is referenced during coordinated operations. Master Controller An optional component of a signal system that facilitates coordination of a signal system with the local controller. Manual on Traffic Control Devices (MUTCD) The MUTCD, published by the Federal Highway Administration, provides the standards and guidance for installation and maintenance for traffic control devices on roadways. Maximum Allowable Headway (MAH) / Maximum Time Separation The maximum time separation between vehicle calls on an approach without gapping out the phase, typically defined by passage time or gap time. Maximum allowable headway refers to spacing between common points of vehicles in a single lane, but the term is commonly used to refer to maximum time separation in single or multi-lane approaches as well. Maximum Green The maximum length of time that a phase can be green in the presence of a conflicting call. Maximum Initial
Application of Traffic Control Strategies for Mitigation of Oversaturated Conditions Page 130
The maximum period of time for which the Added Initial can extend the initial green period. This cannot be less than the Minimum Green time. Maximum Recall A recall mode that places a continuous call on a phase. Measure of effectiveness A quantitative parameter indicating the performance of a transportation facility or service. Metering A control strategy during oversaturated conditions where vehicles are held at upstream locations by shortening the green time so that downstream oversaturated conditions can be cleared, or kept from occurring. Also see Gating. Minimum Gap This volume-density parameter that specifies the minimum green extension when gap reduction is used.. Minimum Green The first timed portion of the green interval which may be set in consideration driver expectancy and the storage of vehicles between the detectors and the stop line when volume-density or presence detection is not used. Minimum Recall A recall parameter the phase is timed for its minimum green time regardless what the demand is for the movement. Movement A term used to describe the user type (vehicle or pedestrian) and action (turning movement) taken at an intersection. Two different types of movements include those that have the right-of-way and those that must yield consistent with the rules of the road or the Uniform Vehicle Code. Negative Offsets A coordination signal timing strategy that starts downstream green phases earlier than upstream phases on a coordinated route in order to clear the downstream queue at the stop bar before the upstream platoon arrives. Non-locking mode A controller memory mode that does not retain an actuation received from a detector by the controller after the actuation is dropped by the detection unit. Occupancy The percent of time that a detector indicates a vehicle is present over a total time period. Offset The time relationship between coordinated phases defined reference point and a defined master reference (master clock or sync pulse). Offset Reference Point (Coordination Point) The defined point that creates an association between a signalized intersection and the master clock. Overflow queue Queued vehicles that could not be discharged during the green phase at a signalized intersection. Oversaturation A traffic condition in which the arrival flow rate exceeds capacity. Oversaturated Approach An approach is oversaturated if all movements of the approach are oversaturated or if a movement causes detrimental effects to one of more movements of the approach. Oversaturated Detrimental Effect A detrimental effect is a symptom of oversaturation on a traffic movement that affects other movements. Types of symptoms include storage spillback, starvation, and blocking. Oversaturated Intersection An intersection is oversaturated if two or more incompatible movements are oversaturated. Oversaturated Movement A movement is oversaturated when the traffic demand for the movement exceeds the green-time capacity such that a queue at the beginning of green does not fully dissipate by the end of the green time. Oversaturated Route A route is oversaturated if two or more compatible movements on a single travel path through a series of intersections are oversaturated at the same time. Passage Time (Vehicle Interval, Gap, Passage Gap, Unit Extension) A phase timer that ends a phase when the time from the last detector output exceeds the timer setting.
Application of Traffic Control Strategies for Mitigation of Oversaturated Conditions Page 131
Pattern Sync Reference The time of the day that the zero point in a cycle is referenced to, typically in the middle of the night. Peak Period The time during the day when a traffic facility experiences the most traffic demand. Peak-hour factor The hourly volume during the maximum-volume hour of the day divided by four times the peak 15-min flow rate within the peak hour; a measure of traffic demand fluctuation within the peak hour. Pedestrian Recall A recall mode where there is a continuous call for pedestrian service resulting in the pedestrian walk and clearance phases to occur each time the phase times. Pedestrian Clearance Interval Also known as “Flash Don’t Walk”. The time provided for a pedestrian to cross the entire width of the intersection. Pedestrian Phase Time allocated to pedestrian traffic that may be concurrent with vehicular phases. Pedestrian scramble See Exclusive Pedestrian Phase Pedestrian Walk Interval An indication to the pedestrian that it allows pedestrians to begin crossing the intersection. Performance Index An arterial- and network-level performance measure that allows several measures of effectiveness to be mathematically combined. Performance Measures Signal system related effects on stops, vehicle delay, arterial travel time, or existence of spill back queuing. Permissive Movement A movement where it is allowed to proceed if there are available gaps in the conflicting flow. Permissive Period A period of time during the coordinated cycle in which calls on conflicting phases are accepted in order to transition to a non-coordinated phase(s) with vehicle demand. Permitted plus protected Compound left-turn operation where the left turn phase consists of a permitted phase where the left-turning vehicles must find a gap in the conflicting flow to safely execute the turn and then a protected phase where there is no conflicting phases timing. Permitted turn Left or right turn at a signalized intersection that is made against an opposing or conflicting vehicular or pedestrian flow. Phase A controller timing unit associated with the control of one or more movements. The MUTCD defines a phase as the right-of-way, yellow change, and red clearance intervals in a cycle that are assigned to an independent traffic movement. Phasing Indication The current display for a given phase (green, yellow, red, walk, flashing don’t walk, or don’t walk). Phase Pair A combination of two phases allowed within the same ring and between the same barriers such as 1+2. 5+6, 3+4, and 7+8. Phase Recall A call is placed for a specified phase each time the controller is servicing a conflicting phase. This will ensure that the specified phase will be serviced again. Types of recall include soft, minimum, and maximum. Soft recall only calls the phase back if there is an absence of conflicting calls. Phase Re-Service A signal timing strategy that allow a phase to serve more than once during a cycle, typically applied to left turn phases if the conflicting through phase has light demand. Phase Sequence The order of a series of phases in a ring. Phase Truncation A signal timing strategy using controller logic processor to terminate a phase that is currently green if a downstream restriction does not allow the vehicles to move.
Application of Traffic Control Strategies for Mitigation of Oversaturated Conditions Page 132
Phasing Diagram A graphical representation of a sequence of phases. Platoon A group of vehicles or pedestrians traveling together as a group, either voluntarily or involuntarily because of signal control, geometrics, or other factors. Preemption Traffic signal preemption is the transfer of normal operation of a traffic control signal to a specific phase for the purpose of high-priority vehicles such as trains or fire trucks to traverse the intersection. Also applies to draw bridges. Preempt Trap A condition that can occur when a preemption call is serviced at a signalized intersection near an at-grade train-roadway crossing, where not enough clearance green time is provided to clear a queue of vehicles on the tracks. Vehicles could be trapped on the tracks when the railroad crossing lights and gates come down. Presence Mode A detection mode where a call for service is sent to the controller for the duration of time a vehicle is inside the detection zone. Pre-timed control A signal control method in which the cycle length, phase plan, and phase times are preset to repeat continuously without any detection of demand. Priority Traffic signal priority (TSP) is an operational strategy communicated between transit vehicles and traffic signals to alter signal timing for the benefit or the transit vehicle. Green extension, red truncation, and phase skipping are examples of signal timing alterations under TSP. Processing Regime The time interval during an oversaturated scenario during which the overflow queues have grown to maximum size and the system cannot accommodate any more flow. Vehicles begin to queue outside of the cordon area. Protected Movements A movement where it has the right-of-way and there are no conflicting movements occurring. Protected plus permitted Compound left-turn operation where the left turn phase consists of a protected phase where there is no conflicting phases timing and a permitted phase where the left-turning vehicles must find a gap in the conflicting flow to safely execute the turn. Protected turn The left or right turns at a signalized intersection that are made with no opposing or conflicting vehicular or pedestrian flow allowed. Progression Used to indicate the ability of vehicles on a route to continue through several intersection without stopping. Pulse Mode A detection mode where each vehicle detection is represented by a single “on” pulse to the controller. Contrasts with presence mode where the detection call is active as long as the vehicle is occupying the detection zone. Queue A line of vehicles, bicycles, or persons waiting to be served by the system in which the flow rate from the front of the queue determines the average speed within the queue. Slowly moving vehicles or people joining the rear of the queue are usually considered part of the queue. The internal queue dynamics can involve starts and stops. A faster-moving line of vehicles is often referred to as a moving queue or a platoon. Queue discharge A flow with high density and low speed, in which queued vehicles start to disperse. Queue spillback A term used to describe vehicles stopped at an intersection that exceed the available storage capacity for a particular movement. Queue storage ratio The parameter that uses three parameters (back of queue, queued vehicle spacing, and available storage space) to determine if blockage will occur. Quick-Estimation Method A method defined in Chapter 10 of the HCM 2000 that allows an analyst to identify the critical movements at an intersection, estimate whether the intersection is operating below, near, at, or over capacity, and approximate the amount of green time needed for each critical movement. Recovery Regime The time interval during an oversaturated scenario when the arrival demand starts to reduce and thus the overflow queues begin to reduce in length. Red Change Interval
Application of Traffic Control Strategies for Mitigation of Oversaturated Conditions Page 133
The period of time following a yellow period indicating the end of a phase and stopping the flow of traffic. Red time The period, expressed in seconds, in the signal cycle during which, for a given phase or lane group, the signal is red. Red Truncation A signal priority treatment to terminate non-priority phase green phasing early in order to more quickly return to green for the priority phase. This treatment is also known as early return to green. Ring A set of conflicting phases that operate in sequence. Ring-Barrier Diagram A graphical representation of how a modern traffic controller operates where cycle time is represented on the x-axis. Conflicting phases are assigned to rings. If there are more than one ring, barriers are used to determine the point in time during the cycle that both phases in the two rings must terminate to serve the next phase in each ring. Phases in more than one ring that align vertically on the diagram can be displayed on the signal indications together. Route Preemption
(1) See Green Flush. (2) A series of preemptions that are scheduled by a central system in response to a request from an emergency vehicle.
Saturation Flow Rate The equivalent hourly rate at which vehicles can traverse an intersection approach under prevailing conditions, assuming a constant green indication and no lost time, typically expressed in vehicles per hour per lane. Saturation headway The average headway between vehicles occurring after the fourth vehicle in the queue and continuing until the last vehicle in the initial queue clears the intersection. Section
(1) A group of signalized intersections used to analyze traffic operations, develop new signal timings, and operate in the same control mode—manual, time of day, traffic responsive.
(2) One indication of a signal head, e.g. green ball, yellow arrow, etc. Segment A portion of a facility on which a capacity analysis is performed; it is the basic unit for the analysis, a one-directional distance. A segment is defined by two endpoints. Semi-Actuated Control A type of signal control where detection is provided for the minor movements only and the signal timing returns to the major movement and dwells in the major phase until the next request for service on a minor movement. Signal Head An assembly of one or more signal indications. Signal Coordination An operational mode that synchronizes a series of traffic signals to enhance the operation of one or more directional movements. Simultaneous Gap This parameter requires all phases to concurrently “gap out” prior to crossing the barrier. Simultaneous Offsets A coordination timing strategy where all of the offsets on a coordinated route are set to “zero” and all of the green time windows begin at the same time in order to minimize the interaction of upstream arriving platoons with downstream overflow queues. Software in the loop (SITL) A means of providing a direct linkage between simulation models and desktop emulation of traffic controller firmware so that faster-than-real-time evaluation of the signal performance can be made. Spatial Oversaturation Severity Index (SOSI) A quantitative measure of how much green is unusable during a phase because of downstream congestion. Speed A rate of motion expressed as distance per unit of time. Spillback Avoidance Offset An offset that is designed so that an arriving platoon from upstream will not arrive too early into the back of an overflow queue and spill back into the upstream intersection.
Application of Traffic Control Strategies for Mitigation of Oversaturated Conditions Page 134
Split The time assigned to a phase (green and the greater of the yellow plus all-red or the pedestrian walk and clearance times) during coordinated operations. May be expressed in seconds or percent. Split Re-allocation A strategy for alleviating oversaturated conditions on one phase by reducing green time for another phase and adding that time to the oversaturated phase without increasing the cycle time. Start-up lost time The additional time, in seconds, consumed by the first few vehicles in a queue at a signalized intersection above and beyond the saturation headway, because of the need to react to the initiation of the green phase and to accelerate. Starvation Avoidance Offset An offset that is designed so that the upstream arriving platoon will arrive just as the overflow queue at the downstream intersection is discharging so that no green time is wasted between the discharge of the standing queue and the arrival of the upstream platoon. Stopped Delay A measurement of the aggregate sum of stopped vehicles for a particular time interval divided by the total entering volume for that movement. Stop time A setting on a controller and a switch in a traffic cabinet that allows a user to hold the traffic signal in a certain set of indications until the switch is released. Temporal Oversaturation Severity Index (TOSI) A quantitative measure of how much green time is spent clearing an overflow queue. Throughput A rate measure of the ability of a queuing system to process demand such as vehicles/hr or vehicle-miles/hour Time-Before-Reduction This volume-density timing period begins when the phase is Green and there is a serviceable call on a conflicting phase. During this period, the gap time for each successive vehicle arrival is the same. When this period is completed, the Passage Time begins to reduce linearly. Time of Day Plans Signal timing plans associated to specific hours of the day in order to accommodate changes in traffic demands over the day. Time-Space Diagram A chart that plots the location of signalized intersections along one axis and the signal timing for each intersection along the other axis to illustrates coordination relationships between intersections. Time-To-Reduce This volume-density timing period begins when the Time-Before-Reduction ends and controls the linear rate of reduction until the Minimum Gap is achieved. Total delay The sum of all components of delay for any user or group of users, including control delay, traffic delay, geometric delay, and incident delay. Total lost time The time per signal cycle during which the intersection is effectively not used by any movement; this occurs during the change and clearance intervals and at the beginning of most phases. Traffic Control Center (Traffic Management Center) An optional physical component of a signal system which contains the operational database that stores controller data, allows monitoring of the system, and allows timing and other parameters to be modified. Traffic Control Device A device used to control conflicting traffic flows, typically at an intersection. Examples include traffic signals, stop signs, yield signs, and roundabouts. Traffic Responsive Operation A signal operation method which uses data from traffic detectors to automatically select the timing plan best suited to the current traffic conditions. Traffic Signal A device to warn, control, or direct at least one traffic movement at an intersection. Traffic Signal Controller A device controlling indication changes at a traffic signal. Travel Time (Average)
Application of Traffic Control Strategies for Mitigation of Oversaturated Conditions Page 135

The total elapsed time spent traversing a specified distance. The average travel time represents an average of the runs for the same route. Travel Time and Delay Study This study is used to evaluate the quality of traffic movements along an arterial and determine the locations, types, and extent of traffic delays. Typical measures of effectiveness include travel time, delay, percent runs stopped, and average speed. Two-way left-turn lane A lane in the median area that extends continuously along a street or highway and is marked to provide a deceleration and storage area, out of the through-traffic stream, for vehicles traveling in either direction to use in making left turns at intersections and driveways. Uniform delay The first term of the equation for lane group control delay, assuming uniform arrivals. Unit extension See passage time Unmet demand The number of vehicles on a signalized lane group that have not been served at any point in time as a result of operation in which demand exceeds capacity, in either the current or previous analysis period. This does not include the normal cyclical queue formation on the red and discharge on the green phase. Upstream The direction from which traffic is flowing. Variable Initial A volume-density parameter that uses detector activity to determine if the initial green interval will exceed minimum green time. Volume The number of persons or vehicles passing a point on a lane, roadway, or other trafficway during some time interval, often 1 h, expressed in vehicles, bicycles, or persons per hour. Volume-Density A phase timing function that uses parameters (variable initial, min gap, time-before-reduction, time-to-reduce) to provide appropriate minimum green time to clear intersection queues when stop bar detectors are not used and/or it is desired to adjust the passage time. Volume-to-Capacity Ratio Also known as degree of saturation is a ratio of demand volume to the capacity for a subject movement. Walk Interval An indication providing right-of-way to pedestrians during a phase. Yellow Change Interval An indication warning users that the green indication has ended and the red indication will begin. Yellow Extension The portion of the yellow change interval that some vehicles use to pass through the intersection during the yellow change interval. Yellow Trap A condition that leads the left-turning driver into the intersection when it is possibly unsafe to do so even though the signal displays are correct. Yield Point A point in a coordinated signal operation that defines where the controller decides to terminate the coordinated phase.
Application of Traffic Control Strategies for Mitigation of Oversaturated Conditions Page 136
Appendix B: Using SOSI and TOSI Measures to Compute Green Time Adjustments The following procedure uses estimates of TOSI and SOSI to improve operation for an oversaturated route. In this approach, we do not aim to find the “optimal” solution by solving a large complicated program; instead, we present a reasonable heuristic to address oversaturation by adjusting green times and offsets. This procedure is denoted the forward-backward procedure (FBP). There are two steps to the process, one progressing downstream on the route and one progressing upstream. Positive TOSI indicates that the available green time is insufficient for queue discharge and a residual queue is generated at the end of a cycle. Positive SOSI indicates a downstream bottleneck. The FBP consists of both forward and backward processes: the forward process aims to increase green time for the through phase by searching for available green time which can be taken from side streets or conflicting phases. The backward process is then applied to gate some intersections to prevent overflow queues and downstream queue spillback when the available green time increase is insufficient. The proposed procedure can be applied for off-line signal timing adjustment. To prevent severe congestion on side streets, the procedure also considers the constraints from side streets, such as minimum green requirement and storage space limits.
Forward-Backward Procedure (FBP) From a simple perspective, there are two ways to deal with oversaturation: one is to increase the downstream output; the other is to constrain the upstream input. The FBP applies these two basic ideas in the forward and backward processes, respectively. Based on the real-time TOSI and SOSI measurements, the forward process will follow the traffic direction to search whether downstream capacity can be increased by either extending green or reducing red for each intersection. The values of TOSI and SOSI indicate how much extra green will be needed. Note that extending green is different with reducing red. Extending green is to add green time at the end of green; therefore, the red start will be postponed. Reducing red is to add green time at the beginning of green; so the green start will be advanced. This effectively advances the queued vehicles downstream earlier than planned (i.e. moving the effective offset point). Next the backward process follows the opposing direction of traffic to gate upstream flow by either reducing green or extending red to prevent downstream congestion. The adjustment during the backward process for each intersection is decided by the difference between the required and the available green times. Before introducing the detailed procedure of FBP for a signalized arterial,
Application of Traffic Control Strategies for Mitigation of Oversaturated Conditions Page 137

it is necessary to first explain how to adjust signal timing at individual intersections using TOSI and SOSI values.
Intersection Signal Timing Adjustment Based on TOSI and SOSI Based on the TOSI and SOSI values, three basic mitigation strategies are designed for different oversaturation scenarios. These basic strategies will be used in the FBP.
Green Extension for Scenario 1: TOSI > 0 & SOSI = 0. Since a positive TOSI value indicates an overflow queue at the end of the cycle and zero SOSI value indicates that there is still spare space in the downstream link, the strategy to deal with the situation is to extend the green time for the subject phase, so the vehicles in the overflow queue can be discharged. As shown in Figure 58 which describes the shockwave profiles for two intersections, after extending green, the overflow queue disappears and TOSI becomes zero. The green extension can be calculated as the following (Eq.(0)). ∆𝑔𝑛,𝑖 = 𝑇𝑂𝑆𝐼𝑛,𝑖 ∗ 𝑔𝑛,𝑖 (0) where ∆𝑔𝑛,𝑖 is the adjustment to the green time at intersection n for phase i; 𝑇𝑂𝑆𝐼𝑛,𝑖 is the TOSI value at intersection n for phase i; and 𝑔𝑛,𝑖 is the green time at intersection n for phase i. Note that positive ∆𝑔𝑛,𝑖 means green extension; and a negative value means green reduction. By extending or reducing green, the start time of the following red signal will be shifted.
Distance
Time
#n
#n+1
Distance
Time
Shockwave Trajectory
.n ig∆
Shockwave Trajectory Distance
1,n ir + 1,n ig +
,n ir ,n ig,n iO
1,n iO +1,n ir + 1,n ig +
,n ir ,n ig,n iO
1,n iO +
a) Before Green Extension (TOSI > 0, SOSI=0) b) After Green Extension (TOSI = 0, SOSI=0)
Vehicle Trajectory
fv fv
Vehicle Trajectory
Figure 58. Green extension for Scenario 1
We should also note that by extending the green time at the current intersection, the queue length at the downstream approach will increase and may create spillover. The FBP will address this issue.
Application of Traffic Control Strategies for Mitigation of Oversaturated Conditions Page 138
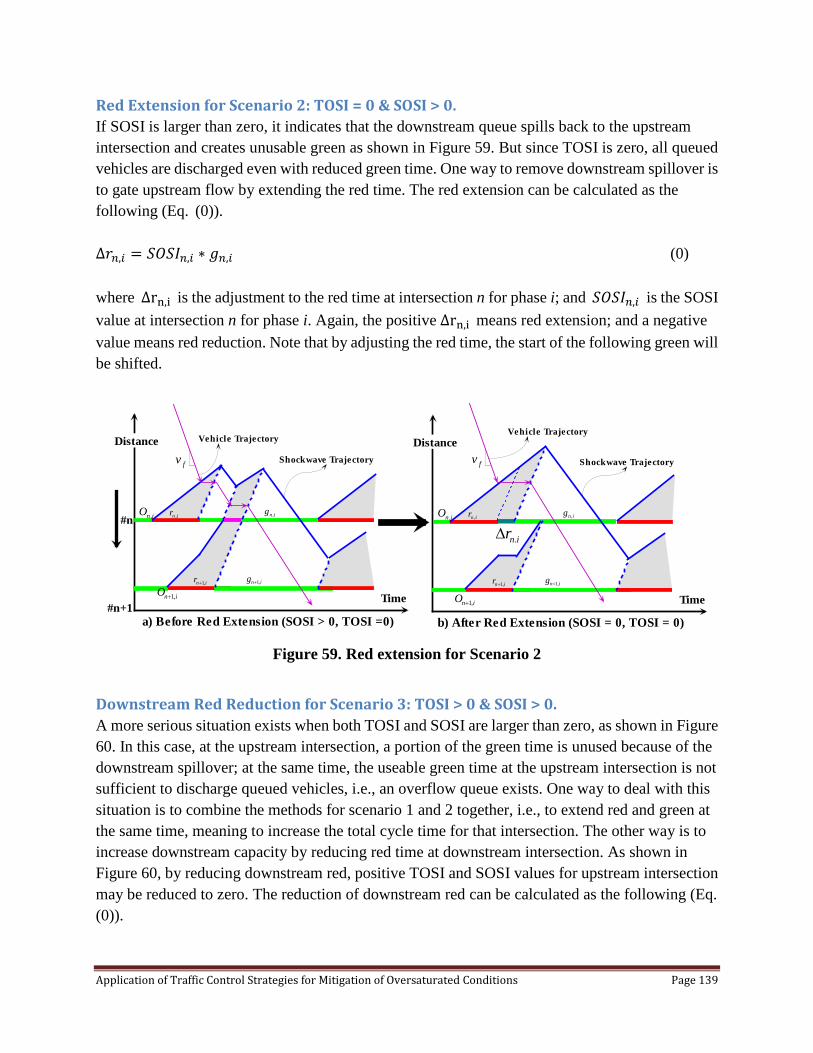
Red Extension for Scenario 2: TOSI = 0 & SOSI > 0. If SOSI is larger than zero, it indicates that the downstream queue spills back to the upstream intersection and creates unusable green as shown in Figure 59. But since TOSI is zero, all queued vehicles are discharged even with reduced green time. One way to remove downstream spillover is to gate upstream flow by extending the red time. The red extension can be calculated as the following (Eq. (0)). ∆𝑟𝑛,𝑖 = 𝑆𝑂𝑆𝐼𝑛,𝑖 ∗ 𝑔𝑛,𝑖 (0) where ∆rn,i is the adjustment to the red time at intersection n for phase i; and 𝑆𝑂𝑆𝐼𝑛,𝑖 is the SOSI value at intersection n for phase i. Again, the positive ∆rn,i means red extension; and a negative value means red reduction. Note that by adjusting the red time, the start of the following green will be shifted.
Distance
Time
Shockwave Trajectory
#n
#n+1
1,n ir + 1,n ig +
,n ir ,n ig,n iO
1,n iO +
.n ir∆
Distance
Time
Shockwave Trajectory
1,n ir + 1,n ig +
,n ir ,n ig,n iO
1,n iO +
Vehicle Trajectory
fv
Vehicle Trajectory
fv
a) Before Red Extension (SOSI > 0, TOSI =0) b) After Red Extension (SOSI = 0, TOSI = 0) Figure 59. Red extension for Scenario 2
Downstream Red Reduction for Scenario 3: TOSI > 0 & SOSI > 0. A more serious situation exists when both TOSI and SOSI are larger than zero, as shown in Figure 60. In this case, at the upstream intersection, a portion of the green time is unused because of the downstream spillover; at the same time, the useable green time at the upstream intersection is not sufficient to discharge queued vehicles, i.e., an overflow queue exists. One way to deal with this situation is to combine the methods for scenario 1 and 2 together, i.e., to extend red and green at the same time, meaning to increase the total cycle time for that intersection. The other way is to increase downstream capacity by reducing red time at downstream intersection. As shown in Figure 60, by reducing downstream red, positive TOSI and SOSI values for upstream intersection may be reduced to zero. The reduction of downstream red can be calculated as the following (Eq. (0)).
Application of Traffic Control Strategies for Mitigation of Oversaturated Conditions Page 139
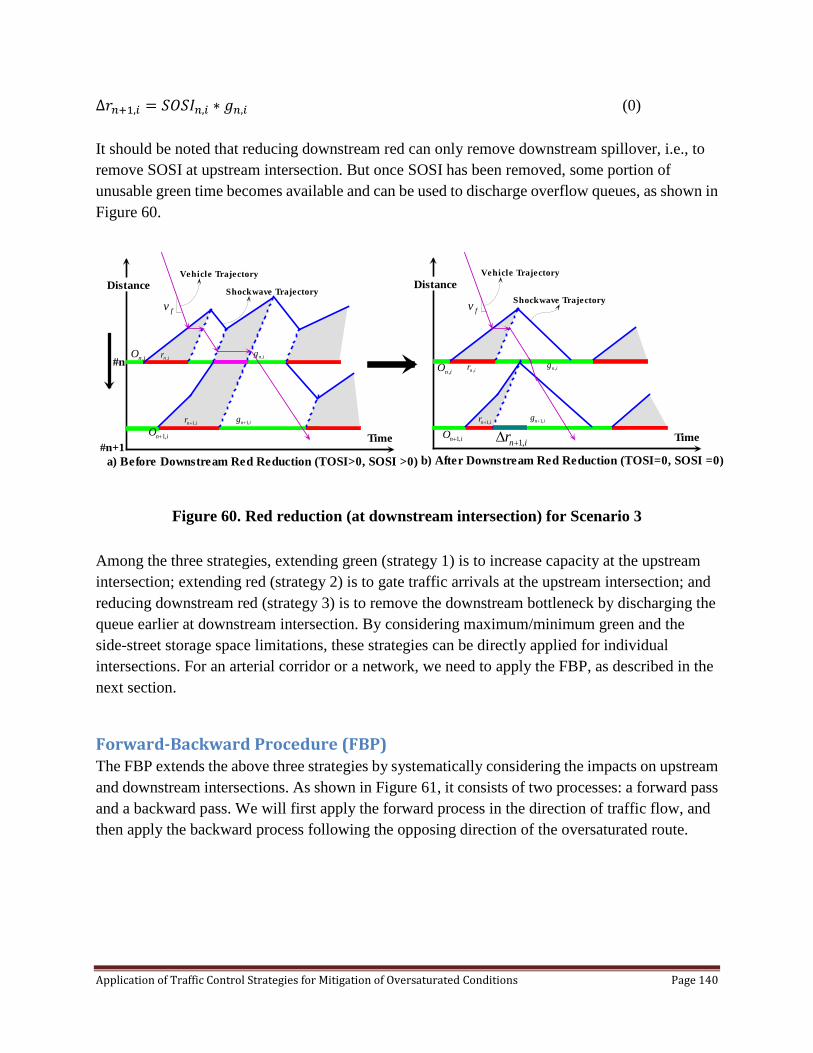
∆𝑟𝑛+1,𝑖 = 𝑆𝑂𝑆𝐼𝑛,𝑖 ∗ 𝑔𝑛,𝑖 (0) It should be noted that reducing downstream red can only remove downstream spillover, i.e., to remove SOSI at upstream intersection. But once SOSI has been removed, some portion of unusable green time becomes available and can be used to discharge overflow queues, as shown in Figure 60.
Distance
Time
Shockwave Trajectory
#n
Distance
Time1,n ir + 1,n ig +
,n ir ,n ig
Shockwave Trajectory
,n iO
1,n iO +
#n+1 1,n ir +∆1,n ir + 1,n ig +
,n ir ,n ig,n iO
1,n iO +
Vehicle Trajectory
fv
Vehicle Trajectory
fv
a) Before Downstream Red Reduction (TOSI>0, SOSI >0) b) After Downstream Red Reduction (TOSI=0, SOSI =0)
Figure 60. Red reduction (at downstream intersection) for Scenario 3
Among the three strategies, extending green (strategy 1) is to increase capacity at the upstream intersection; extending red (strategy 2) is to gate traffic arrivals at the upstream intersection; and reducing downstream red (strategy 3) is to remove the downstream bottleneck by discharging the queue earlier at downstream intersection. By considering maximum/minimum green and the side-street storage space limitations, these strategies can be directly applied for individual intersections. For an arterial corridor or a network, we need to apply the FBP, as described in the next section.
Forward-Backward Procedure (FBP) The FBP extends the above three strategies by systematically considering the impacts on upstream and downstream intersections. As shown in Figure 61, it consists of two processes: a forward pass and a backward pass. We will first apply the forward process in the direction of traffic flow, and then apply the backward process following the opposing direction of the oversaturated route.
Application of Traffic Control Strategies for Mitigation of Oversaturated Conditions Page 140

( )0, 0,,i iTOSI SOSI
FORWARD
( )1, 1,,i iTOSI SOSI
( )1, 1,,n i n iTOSI SOSI− −
( ), ,,ni n iTOSI SOSI
( )1, 1,,n i n iTOSI SOSI+ +
( ), ,, 0N i N iTOSI SOSI =
BACKWARD
Int. 0
Int. 1
Int. n-1Int. n Int. n+1
Int. N
Figure 61. Forward and backward process for an oversaturated arterial corridor
Forward Process (FP): The FP aims to seek any available green time which can be taken from side streets or conflicting phases to discharge more vehicles along the oversaturated route. This process increases capacity, so only strategies 1 and 3 are used. For any intersection (except the first and last ones, which need slightly different treatment) in an oversaturated arterial corridor, the first step is to reduce red according to upstream SOSI value in order to remove spillover and the second step is to extend green to discharge overflow queues. Since in this process we assume that the downstream spillover will be removed by reducing downstream red, the unusable green time caused by spillover will become available and can be used to discharge overflow queues. The backward process will consider the situation if downstream green increase is insufficient. Therefore the green extension might be negative if the SOSI value is larger than the TOSI value, which means we need to reduce green to prevent green starvation when the vehicles at the stop line cannot be discharged. The signal timing adjustment for any intersection except the first and last can be calculated by the following equation:
�∆𝑟𝑛,𝑖
𝐹 = −𝑆𝑂𝑆𝐼𝑛−1,𝑖 ∗ 𝑔𝑛−1,𝑖
∆𝑔𝑛,𝑖𝐹 = ∆𝑔𝑛−1,𝑖
𝐹 − ∆𝑟𝑛−1,𝑖𝐹 + �𝑇𝑂𝑆𝐼𝑛,𝑖 − 𝑆𝑂𝑆𝐼𝑛,𝑖� ∗ 𝑔𝑛,𝑖
𝑛 ≠ 0 & 𝑁 (0)
where ∆𝑟𝑛,𝑖
𝐹 (∆𝑔𝑛,𝑖𝐹 ) is red (green) extension in the FP at intersection n for phase i; and N is the
number of intersections in the corridor. For the first intersection (intersection “0”), we only need to consider how to deal with TOSI, so Eq. (0) becomes:
Application of Traffic Control Strategies for Mitigation of Oversaturated Conditions Page 141

�∆𝑟0,𝑖
𝐹 = 0∆𝑔0,𝑖
𝐹 = �𝑇𝑂𝑆𝐼0,𝑖 − 𝑆𝑂𝑆𝐼0,𝑖� ∗ 𝑔0,𝑖 (0)
For the last intersection (intersection N), since SOSI is zero (if SOSI is not zero, then this intersection should not be the last one; one more intersection downstream should be considered), Eq. (0) becomes:
�∆𝑟𝑁,𝑖
𝐹 = −𝑆𝑂𝑆𝐼𝑁−1,𝑖 ∗ 𝑔𝑁−1,𝑖
∆𝑔𝑁,𝑖𝐹 = ∆𝑔𝑁−1,𝑖
𝐹 − ∆𝑟𝑁−1,𝑖𝐹 + 𝑇𝑂𝑆𝐼𝑁,𝑖 ∗ 𝑔𝑁,𝑖
(0)
Backward Process (BP): The FP is applied in the direction of flow on the oversaturated route and adds extra green for each intersection to discharge the overflow queue and to remove the downstream spillover. However, available green increases at for some intersections may not be sufficient due to the constraints from side streets (i.e., minimum green requirement and storage space for queues). To address this problem, the BP is designed to gate upstream arrivals in order to reduce TOSI and SOSI. Since the main objective of the BP is to gate input, the red extension strategy (scenario 2) described in the last section will be used in this process. This process will start from the last intersection and follow the opposing direction of traffic to determine how much green needs to be reduced for each intersection based on TOSI, SOSI and available green times for current and downstream intersections. To compute the backward adjustment, we first need to calculate the maximum available green time (𝑔𝑛,𝑖
𝑎 ) by restricting the green times on all conflicting phases to the minimum, i.e., 0 ≤ 𝑔𝑛,𝑖
𝑎 ≤ 𝐶𝑛 − ∑ MINgn,jj∈Sn,i (0) where 𝑔𝑛,𝑖
𝑎 is the maximum available green time for intersection n and phase i; 𝐶𝑛 is the cycle length for intersection n; Sn,i is the set of conflict phases to phase i at intersection n; and MINgn,j is the minimum green time for phase j at intersection n. Note that 𝑔𝑛,𝑖
𝑎 may also be constrained by other conditions, such as limited storage space on side streets (i.e., 𝑔𝑛,𝑖
𝑎 can be computed by estimating the maximum queue that will be created based on comparing the side-street green time with an assumed side-street traffic arrival rate). For the last intersection at the furthest downstream (intersection N), the backward adjustment will be the difference between the desired green increase (∆𝑔𝑁,𝑖
𝐹 − ∆𝑟𝑁,𝑖𝐹 ) calculated in the FB and the
available green (𝑔𝑁,𝑖𝑎 ), which is constrained by the minimum green requirement for the conflicting
Application of Traffic Control Strategies for Mitigation of Oversaturated Conditions Page 142
phases. We first check whether there is enough green for red reduction, then check whether there is enough green left for green extension (see Eq. (10)).
�∆𝑟𝑁,𝑖
𝐵 = 𝑚𝑖𝑛�𝑔𝑁,𝑖𝑎 + ∆𝑟𝑁,𝑖
𝐹 , 0�∆𝑔𝑁,𝑖
𝐵 = 𝑚𝑖𝑛�𝑔𝑁,𝑖𝑎 + ∆𝑟𝑁,𝑖
𝐹 − ∆𝑟𝑁,𝑖𝐵 − ∆𝑔𝑁,𝑖
𝐹 , 0� (0)
where ∆𝑟𝑁,𝑖𝐵 and ∆𝑔𝑁,𝑖
𝐵 are the red reduction and the green extension due to the limitation of the available green for intersection N and phase i.
To compute the backward adjustment for other intersections, not only do we need to consider the available green time at the current intersection, but we also need to consider the actual signal timing adjustment at the downstream intersection.
For example, if the red reduction at downstream intersection n+1 (∆𝑟𝑛+1,𝑖𝐵 ) is smaller than that at
upstream intersection n (∆𝑟𝑛,𝑖𝐵 ), then the spillover will still happen. Therefore, it is necessary to
further constrain the upstream red reduction (∆𝑟𝑛,𝑖𝐵 ) according to the adjustment made at the
downstream intersection. The backward adjustment can then be calculated as the following:
�∆𝑟𝑛,𝑖
𝐵 = 𝑚𝑖𝑛�𝑔𝑛,𝑖𝑎 + ∆𝑟𝑛,𝑖
𝐹 ,∆𝑟𝑛+1,𝑖𝐵 , 0�
∆𝑔𝑛,𝑖𝐵 = 𝑚𝑖𝑛�𝑔𝑛,𝑖
𝑎 + ∆𝑟𝑛,𝑖𝐹 − ∆𝑟𝑛,𝑖
𝐵 − ∆𝑔𝑛,𝑖𝐹 ,∆𝑔𝑛+1,𝑖
𝐵 , 0� 𝑛 ≠ 𝑁 (0)
After calculating∆𝑟𝑛,𝑖𝐹 , ∆𝑟𝑛,𝑖
𝐵 , ∆𝑔𝑛,𝑖𝐹 , and ∆𝑔𝑛,𝑖
𝐵 , the final signal timing adjustment after the forward and the backward procedures can be obtained by the following equations:
�∆𝑟𝑛,𝑖 = ∆𝑟𝑛,𝑖
𝐹 − ∆𝑟𝑛,𝑖𝐵
∆𝑔𝑛,𝑖 = ∆𝑔𝑛,𝑖𝐹 + ∆𝑔𝑛,𝑖
𝐵 (0)
where ∆𝑟𝑛,𝑖 and ∆𝑔𝑛,𝑖 are the final red and green adjustment for intersection n phase i. Note that negative values for either adjustment indicate reduction.
The updated signal timing for intersection n and phase i after the FBP will be:
�𝑟𝑛,𝚤���� = 𝑟𝑛,𝑖 + ∆𝑟𝑛,𝑖𝑔𝑛,𝚤����� = 𝑔𝑛,𝑖 + ∆𝑔𝑛,𝑖
(0)
where 𝑟𝑛,𝑖 (𝑔𝑛,𝑖) is original red (green) before the FBP; and 𝑟𝑛,𝚤���� (𝑔𝑛,𝚤�����) is updated red (green) after the FBP. Note that depending on the resulting values of 𝑟𝑛,𝚤���� (𝑔𝑛,𝚤�����) the signal offset will need to be adjusted.
Application of Traffic Control Strategies for Mitigation of Oversaturated Conditions Page 143
Changes to the cycle time will also need to be considered if they are acceptable or not. If both 𝑟𝑛,𝚤���� (𝑔𝑛,𝚤�����) are negative, the cycle time would be recommended to be decreased. If both 𝑟𝑛,𝚤���� (𝑔𝑛,𝚤�����) are positive, the cycle time would be recommended to be increased.
FBP for an Oversaturated Network When extending the FBP to an oversaturated network, the first step is to identify oversaturated routes that intersect with each other. For those routes crossing each other, the following method is designed to allocate the available green time to the conflicting movements or phases.
Oversaturated Route If all the intersections along a route are oversaturated, this route is defined as an oversaturated route. This route need not be a straight line, since the oversaturation condition for some intersections may be caused by turning movements. If we have the TOSI and SOSI values for each movement, it is easy to identify an oversaturated route, since the oversaturated movements will have positive TOSI and/or SOSI values at the same time. For each oversaturated route, the FBP can be directly applied.
Critical Intersection When two oversaturated routes intersect with each other, the crossing intersection becomes a critical intersection (see Figure 62). For each oversaturated route, the FBP will determine the green/red change for each movement on the route. There will be a conflict between (at least) two directions at the critical intersection since both directions are fighting for the additional green time. Therefore it is necessary to set up a principle to assign the available green time. If we assume that the cycle time remains unchanged, an intuitive way is just to assign the modifications based on the proportion of each request. So for two conflicting phases i and j at critical intersection z as shown in Figure 62, after the signal timing adjustments (∆𝑟𝑧,𝑖,∆𝑔𝑧,𝑖,∆𝑟𝑧,𝑗 , and ∆𝑔𝑧,𝑗) have been determined by applying the FBP, the following equation can be used to re-assign green time proportionally.
⎩⎪⎪⎨
⎪⎪⎧ 𝑟𝑧,𝚤���� = 𝐶𝑧 ∗
𝑟𝑧,𝑖+∆𝑟𝑧,𝑖𝑟𝑧,𝑖+∆𝑟𝑧,𝑖+𝑟𝑧,𝑗+∆𝑟𝑧,𝑗
𝑔𝑧,𝚤���� = 𝐶𝑧 ∗𝑔𝑧,𝑖+∆𝑔𝑧,𝑖
𝑔𝑧,𝑖+∆𝑔𝑧,𝑖+𝑔𝑧,𝑗+∆𝑔𝑧,𝑗
𝑟𝑧,𝚥���� = 𝐶𝑧 ∗𝑟𝑧,𝑗+∆𝑟𝑧,𝑗
𝑟𝑧,𝑖+∆𝑟𝑧,𝑖+𝑟𝑧,𝑗+∆𝑟𝑧,𝑗
𝑔𝑧,𝚥����� = 𝐶𝑧 ∗𝑔𝑧,𝑗+∆𝑔𝑧,𝑗
𝑔𝑧,𝑖+∆𝑔𝑧,𝑖+𝑔𝑧,𝑗+∆𝑔𝑧,𝑗
(0)
Application of Traffic Control Strategies for Mitigation of Oversaturated Conditions Page 144
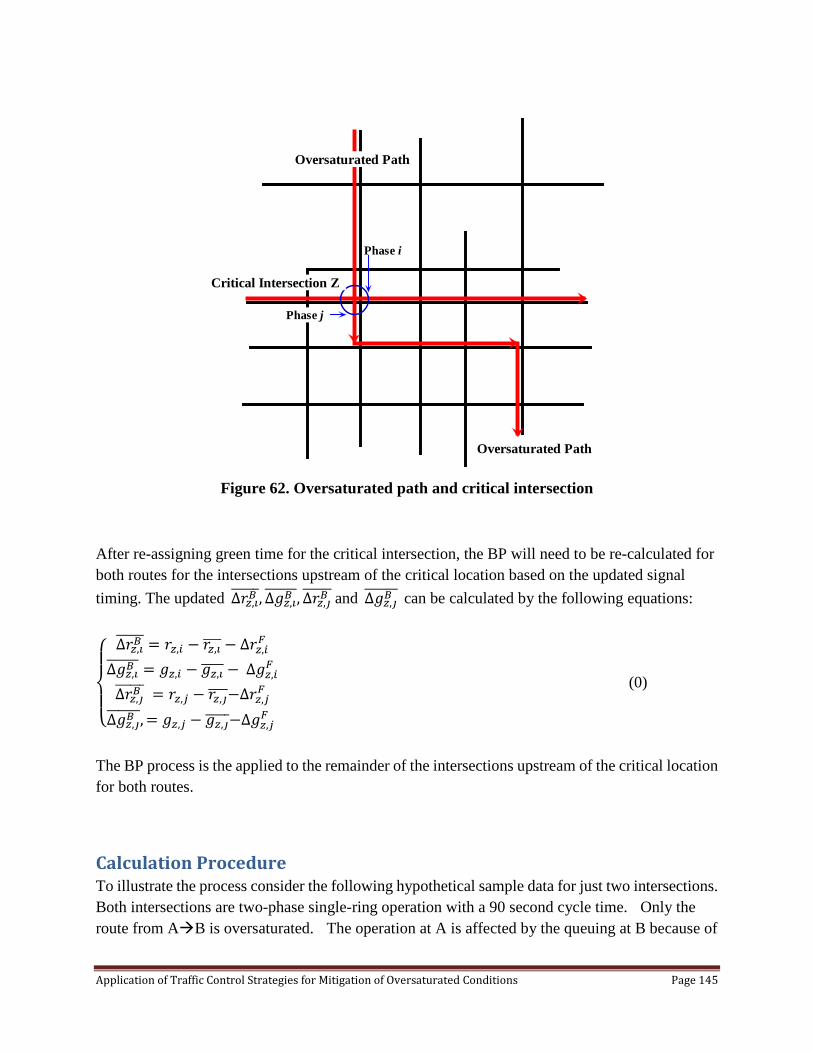
Oversaturated Path
Critical Intersection Z
Oversaturated Path
Phase i
Phase j
Figure 62. Oversaturated path and critical intersection
After re-assigning green time for the critical intersection, the BP will need to be re-calculated for both routes for the intersections upstream of the critical location based on the updated signal timing. The updated ∆𝑟𝑧,𝚤
𝐵�����,∆𝑔𝑧,𝚤𝐵������,∆𝑟𝑧,𝚥
𝐵������ and ∆𝑔𝑧,𝚥𝐵������ can be calculated by the following equations:
⎩⎪⎨
⎪⎧ ∆𝑟𝑧,𝚤
𝐵����� = 𝑟𝑧,𝑖 − 𝑟𝑧,𝚤���� − ∆𝑟𝑧,𝑖𝐹
∆𝑔𝑧,𝚤𝐵������ = 𝑔𝑧,𝑖 − 𝑔𝑧,𝚤���� − ∆𝑔𝑧,𝑖
𝐹
∆𝑟𝑧,𝚥𝐵������ = 𝑟𝑧,𝑗 − 𝑟𝑧,𝚥����−∆𝑟𝑧,𝑗
𝐹
∆𝑔𝑧,𝚥𝐵������, = 𝑔𝑧,𝑗 − 𝑔𝑧,𝚥�����−∆𝑔𝑧,𝑗
𝐹
(0)
The BP process is the applied to the remainder of the intersections upstream of the critical location for both routes.
Calculation Procedure To illustrate the process consider the following hypothetical sample data for just two intersections. Both intersections are two-phase single-ring operation with a 90 second cycle time. Only the route from AB is oversaturated. The operation at A is affected by the queuing at B because of
Application of Traffic Control Strategies for Mitigation of Oversaturated Conditions Page 145
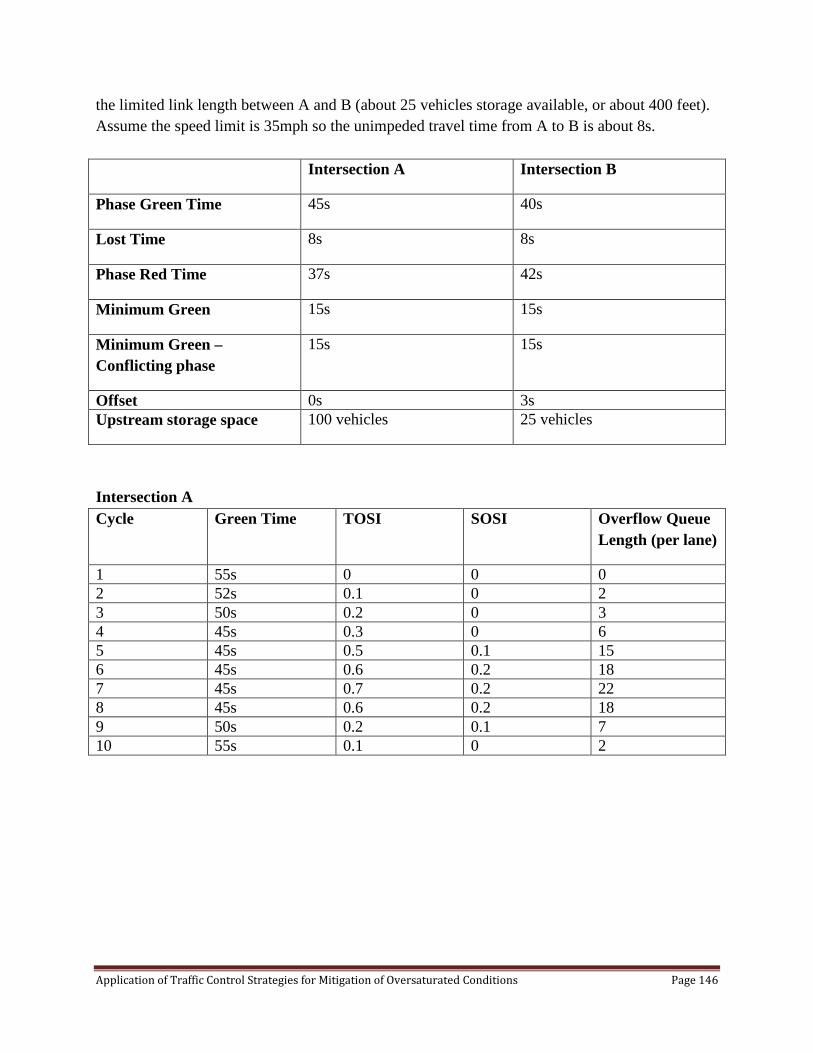
the limited link length between A and B (about 25 vehicles storage available, or about 400 feet). Assume the speed limit is 35mph so the unimpeded travel time from A to B is about 8s. Intersection A Intersection B
Phase Green Time 45s 40s
Lost Time 8s 8s
Phase Red Time 37s 42s
Minimum Green 15s 15s
Minimum Green – Conflicting phase
15s 15s
Offset 0s 3s Upstream storage space 100 vehicles 25 vehicles
Intersection A Cycle Green Time TOSI SOSI Overflow Queue
Length (per lane)
1 55s 0 0 0 2 52s 0.1 0 2 3 50s 0.2 0 3 4 45s 0.3 0 6 5 45s 0.5 0.1 15 6 45s 0.6 0.2 18 7 45s 0.7 0.2 22 8 45s 0.6 0.2 18 9 50s 0.2 0.1 7 10 55s 0.1 0 2
Application of Traffic Control Strategies for Mitigation of Oversaturated Conditions Page 146
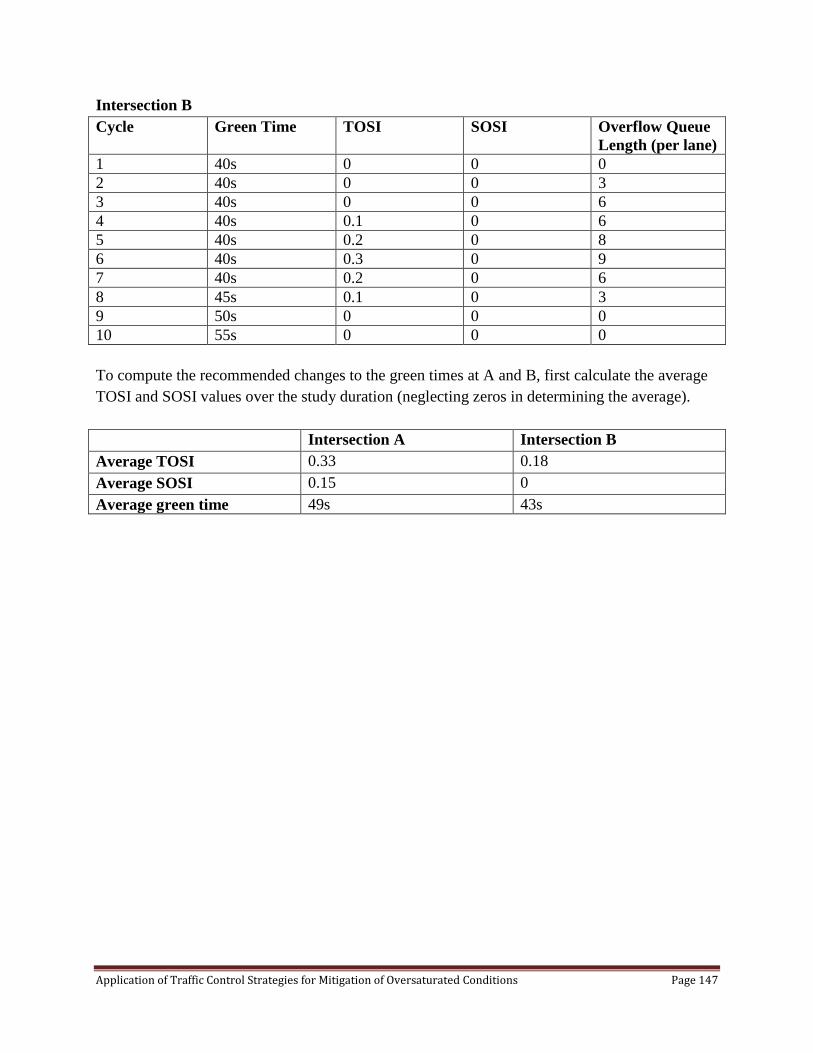
Intersection B Cycle Green Time TOSI SOSI Overflow Queue
Length (per lane) 1 40s 0 0 0 2 40s 0 0 3 3 40s 0 0 6 4 40s 0.1 0 6 5 40s 0.2 0 8 6 40s 0.3 0 9 7 40s 0.2 0 6 8 45s 0.1 0 3 9 50s 0 0 0 10 55s 0 0 0 To compute the recommended changes to the green times at A and B, first calculate the average TOSI and SOSI values over the study duration (neglecting zeros in determining the average). Intersection A Intersection B Average TOSI 0.33 0.18 Average SOSI 0.15 0 Average green time 49s 43s
Application of Traffic Control Strategies for Mitigation of Oversaturated Conditions Page 147

Intersection A Intersection B Forward Pass Delta-R 0s -(0.15)*49s = -7.3s Delta-G (0.33 – 0.15)*49s = 8.8s 8.8s – 0s + 0.18*43s = 16.5s
Backward Pass Delta-R Min(70s + 0s, 0s, 0s) = 0s Min(70s + (-7.3s), 0) = 0 Delta-G Min(70s + 0s – 0s – 8.8s, 0s,
0s) = 0s Min(70s + (-7.3s) – 0s – 16.5s, 0s) = 0s
Resulting adjustments Sum of Delta-R 0s + 0s = 0s -7.3s + 0s = -7.3s (round to
-7s) Sum of Delta-G 8.8s + 0s = 8.8s (round to 9s) 16.5s + 0s = 16.5s (round to
17s) Phase Red 37s + 0s = 37s 42s – 7s = 35s Phase Green 45s + 9s = 54s 40s + 17s = 57s Cycle Time 37s + 54s + 8s = 99s (round to
100s by adding 1s more to green)
35s + 57s + 8s = 100s
Effective changes Add 10s green Reduce side street phase 7s Increase phase green 17s Modify relative offset from 3s to 11s (8s – (54s – 57s)
Real-World Examples Two simulation test cases were evaluated. In both cases, average values for TOSI and SOSI over the peak hour were used to re-calculate green times on the route. The simulation was then re-run with the same random seed to estimate the differences in performance. The comparison results for an individual intersection and a congested arterial are presented.
An Individual Intersection
The first test site is an individual oversaturated intersection located on TH55, in Minneapolis, MN (see Figure 63). Congestion usually occurs on the westbound traffic during the AM peak because traffic signals are coordinated for eastbound direction. Specially, because of the short link between Winnetka and Rhode Island, queue spilled back to Rhode Island intersection creating large values of SOSI and TOSI. Signal timing plans for the intersections Winnetka and Rhode Island are shown in Figure 63.
Application of Traffic Control Strategies for Mitigation of Oversaturated Conditions Page 148
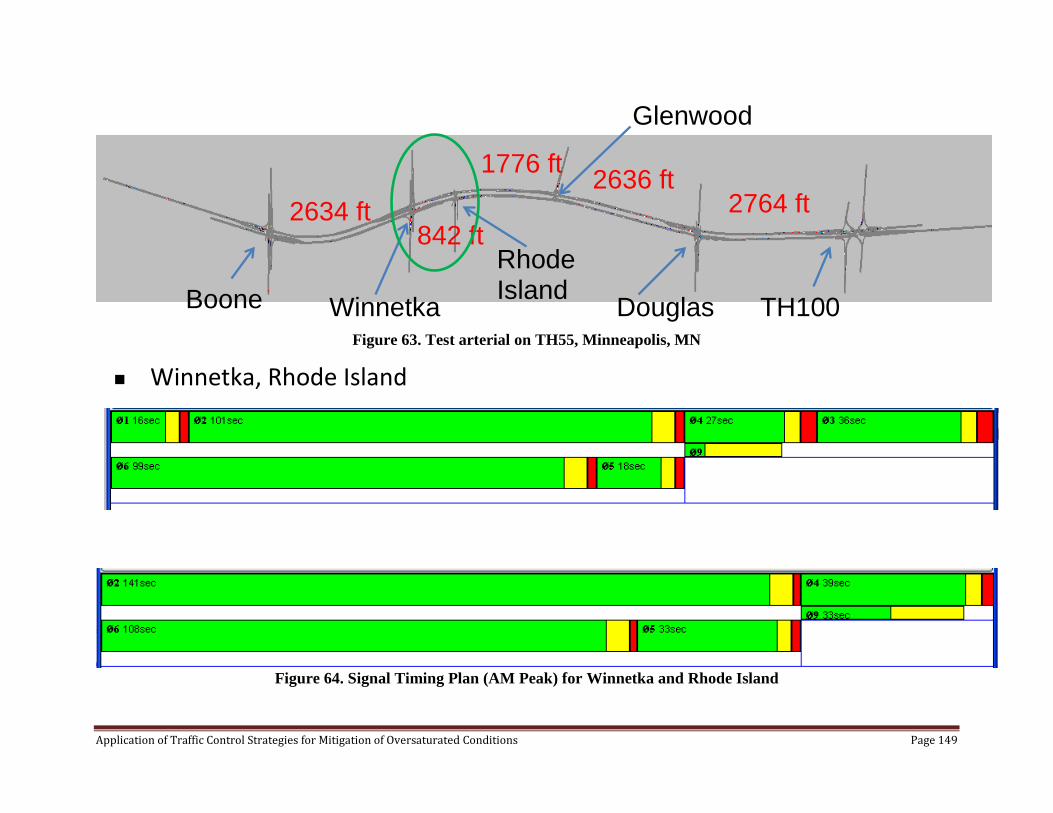
Figure 63. Test arterial on TH55, Minneapolis, MN
Figure 64. Signal Timing Plan (AM Peak) for Winnetka and Rhode Island
Glenwood
Winnetka
Rhode Island Boone Douglas TH100
2634 ft 842 ft
1776 ft 2636 ft
2764 ft
Winnetka, Rhode Island
Application of Traffic Control Strategies for Mitigation of Oversaturated Conditions Page 149
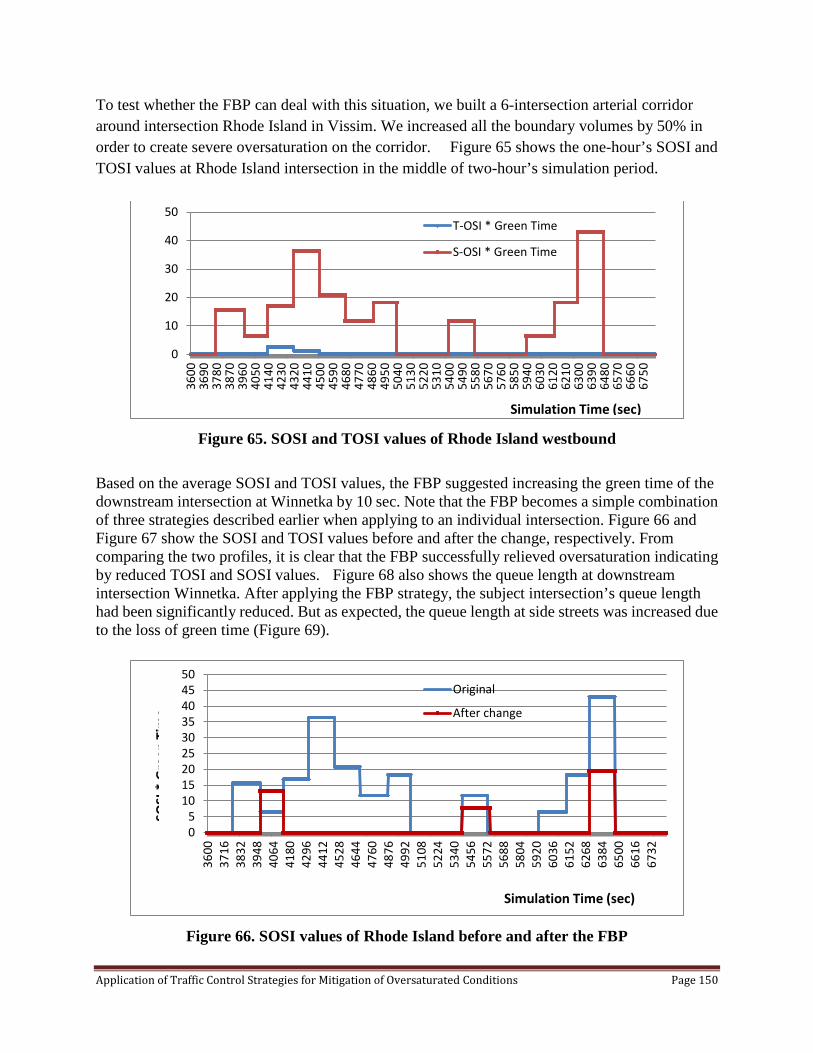
To test whether the FBP can deal with this situation, we built a 6-intersection arterial corridor around intersection Rhode Island in Vissim. We increased all the boundary volumes by 50% in order to create severe oversaturation on the corridor. Figure 65 shows the one-hour’s SOSI and TOSI values at Rhode Island intersection in the middle of two-hour’s simulation period.
Figure 65. SOSI and TOSI values of Rhode Island westbound
Based on the average SOSI and TOSI values, the FBP suggested increasing the green time of the downstream intersection at Winnetka by 10 sec. Note that the FBP becomes a simple combination of three strategies described earlier when applying to an individual intersection. Figure 66 and Figure 67 show the SOSI and TOSI values before and after the change, respectively. From comparing the two profiles, it is clear that the FBP successfully relieved oversaturation indicating by reduced TOSI and SOSI values. Figure 68 also shows the queue length at downstream intersection Winnetka. After applying the FBP strategy, the subject intersection’s queue length had been significantly reduced. But as expected, the queue length at side streets was increased due to the loss of green time (Figure 69).
Figure 66. SOSI values of Rhode Island before and after the FBP
0
10
20
30
40
50
3600
3690
3780
3870
3960
4050
4140
4230
4320
4410
4500
4590
4680
4770
4860
4950
5040
5130
5220
5310
5400
5490
5580
5670
5760
5850
5940
6030
6120
6210
6300
6390
6480
6570
6660
6750
T-OSI * Green Time
S-OSI * Green Time
Simulation Time (sec)
05
101520253035404550
3600
3716
3832
3948
4064
4180
4296
4412
4528
4644
4760
4876
4992
5108
5224
5340
5456
5572
5688
5804
5920
6036
6152
6268
6384
6500
6616
6732
Original
After change
Simulation Time (sec)
SOSI
* G
reen
Tim
e
Application of Traffic Control Strategies for Mitigation of Oversaturated Conditions Page 150
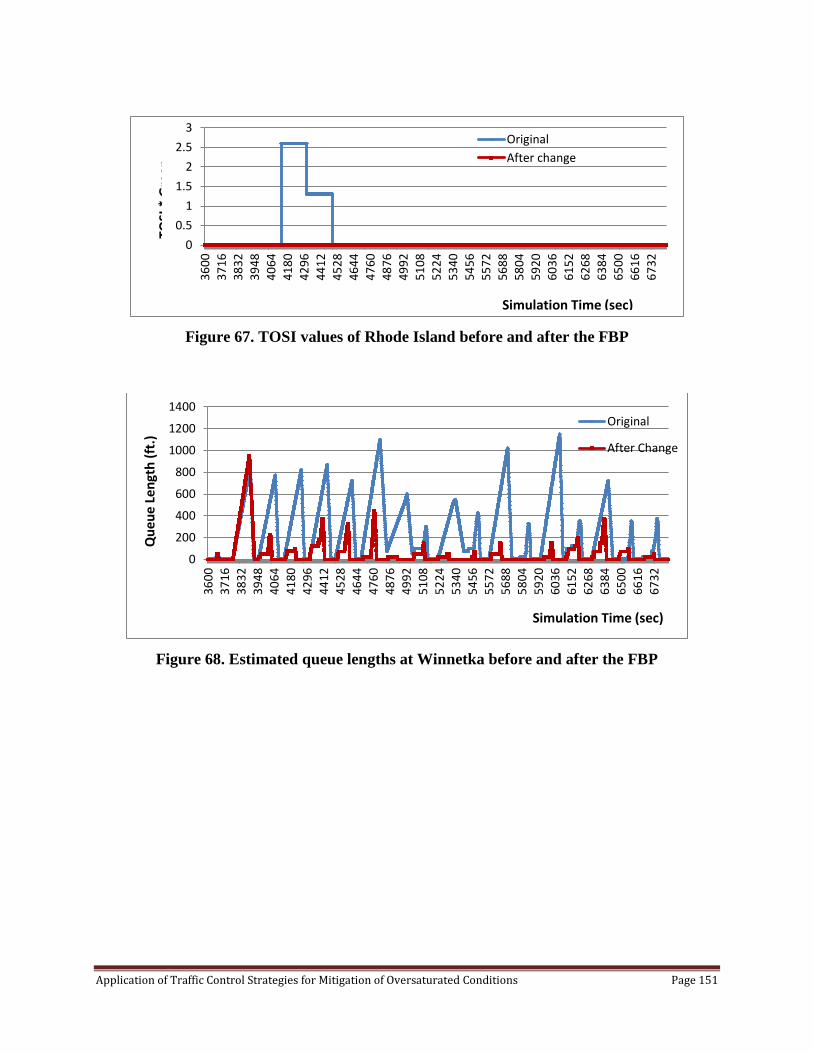
Figure 67. TOSI values of Rhode Island before and after the FBP
Figure 68. Estimated queue lengths at Winnetka before and after the FBP
00.5
11.5
22.5
3
3600
3716
3832
3948
4064
4180
4296
4412
4528
4644
4760
4876
4992
5108
5224
5340
5456
5572
5688
5804
5920
6036
6152
6268
6384
6500
6616
6732
OriginalAfter change
Simulation Time (sec)
TOSI
* G
reen
0
200
400
600
800
1000
1200
1400
3600
3716
3832
3948
4064
4180
4296
4412
4528
4644
4760
4876
4992
5108
5224
5340
5456
5572
5688
5804
5920
6036
6152
6268
6384
6500
6616
6732
Original
After Change
Que
ue L
engt
h (ft
.)
Simulation Time (sec)
Application of Traffic Control Strategies for Mitigation of Oversaturated Conditions Page 151

Figure 69. Southbound Queue lengths at Winnetka
A Signalized Arterial The second test site was an oversaturated arterial corridor of five intersections on Fair Oaks Ave. in the City of Pasadena. An arterial network including 22 intersections was built in VISSIM (see Figure 70a)). To create oversaturation, we increased demand for both directions to 3600 veh/hr for the first one and half hours and then returned the input rates to normal traffic demand for the last half hour. The average TOSI and SOSI values in the middle hour of the two-hour period were used to estimate green changes in the FBP. Figure 70b shows the green changes before and after the FBP (combining green extension and red reduction), and Figure 71 represents the TOSI and SOSI changes before and after signal timing adjustment. The comparisons clearly show that the FBP successfully relieved oversaturation as indicated by significantly reduced TOSI and SOSI values. Further investigating the green changes for five intersections (see 0b), we found out that, based on the FBP, green times for most of the intersections are increased in order to improve arterial throughput; but for the second intersection, due to downstream constraint, the FBP suggests reducing green time, i.e., gating is applied at this intersection.
050
100150200250300350400450500
3600
3713
3826
3939
4052
4165
4278
4391
4504
4617
4730
4843
4956
5069
5182
5295
5408
5521
5634
5747
5860
5973
6086
6199
6312
6425
6538
6651
6764
OriginalAfter change
Que
ue L
engt
h (ft
.)
Simulation Time (sec)
Application of Traffic Control Strategies for Mitigation of Oversaturated Conditions Page 152

Demand Increase:1256 3600vph→
Demand Increase:
651 3600vph→
Cycle Length = 80s
Green Change: 1 : 27 39secg →
2 : 42 22secg →
3 : 37 55secg →
4 : 48 68secg →
5 :52 72secg →
Int. 1
Int. 2
Int. 3
Int. 4
Int. 5
a) b)Light RailFair Oaks Ave.
Walnut St.
Colorado Blvd.
Light RailFair Oaks Ave.
Walnut St.
Colorado Blvd.
Figure 70. a) An oversaturated arterial corridor; b) Green change after the FBP
Figure 71. TOSI and SOSI changes before and after the FBP
As expected, some side streets have become more congested. As shown in Figure 72 the queue lengths for Westbound of Intersection #3 were slightly increased. However, some movements, like the Eastbound at Intersection 2, benefited from the FBP (see Figure 73). The reason for this result is that a gating strategy was deployed in the Southbound direction. More
Application of Traffic Control Strategies for Mitigation of Oversaturated Conditions Page 153

importantly, the overall throughput for this corridor (generated by the VISSIM software, including main streets and all side streets) was improved for the network as shown in Figure 74.
Figure 72. Queued vehicles Westbound at Intersection 3
Figure 73. Queued vehicles Eastbound at Intersection 2
0
20
40
60
80
100
12018
054
090
012
6016
2019
8023
4027
0030
6034
2037
8041
4045
0048
6052
2055
8059
4063
0066
6070
20
BeforeAfter
Intersection 3 N
umbe
r of q
ueue
d ve
hicl
es
Simulation Time
Num
ber o
f que
ued
vehi
cles
Intersection 3 WB
Num
ber o
f que
ued
vehi
cles
N
umbe
r of q
ueue
d ve
hicl
es
02468
1012141618
180
540
900
1260
1620
1980
2340
2700
3060
3420
3780
4140
4500
4860
5220
5580
5940
6300
6660
7020
BeforeAfter
Intersection 2 EB
Num
ber o
f que
ued
vehi
cles
Simulation Time
Application of Traffic Control Strategies for Mitigation of Oversaturated Conditions Page 154

Figure 74. Comparison of total system throughput
Summary A forward-backward procedure (FBP) was developed to adjust traffic signal timing to mitigate oversaturation on a route. The approach is based on measured or estimated TOSI and SOSI values. The forward process aims to increase green time by searching for available green time which can be taken from side streets or conflicting phases to improve throughput for the oversaturated route. The backward process is used to gate some intersections to prevent overflow queues and downstream queue spillback when green time increases are insufficient. In several test cases, we calculated the average TOSI and SOSI values and applied a fixed adjustment to a new timing plan for the entire test duration. These tests indicated that the procedure can improve total throughput and alleviate the existence of TOSI and SOSI on the oversaturated route. As expected, side-street delays were incurred to gain the system-wide improvements. The proposed procedure was applied for off-line signal timing adjustment, but we envision that a similar process could be applied in an on-line, real-time feedback manner with appropriate interface to the signal controller or a signal control system. The approach at this time would be considered experimental in nature. Further development in a number of directions would be necessary for more holistic application of the procedure in conjunction with the timing plan design principles and rules of thumb illustrated in other sections of this guide.
10000
11000
12000
13000
14000
15000
16000
Before After
Total Throughput (2 hours)
14629 15371
Application of Traffic Control Strategies for Mitigation of Oversaturated Conditions Page 155