Achieving Value and Excellence using Six Sigma
98
Achieving Value and Excellence through Six Sigma Aarohan-11 Symbiosis Centre for Management and Human Resource Development Page 1 AAROHAN The Event Magazine LEAN AND SIX SIGMA EXCELLENCE AWARDS ‘11 30 TH September and 1 ST October ‘11 SYMBIOSIS CENTRE FOR MANAGEMENT AND HUMAN RESOURCE DEVELOPMENT, PUNE
-
Upload
khangminh22 -
Category
Documents
-
view
3 -
download
0
Transcript of Achieving Value and Excellence using Six Sigma

Achieving Value and Excellence through Six Sigma
Aarohan-11 Symbiosis Centre for Management and Human Resource Development Page 1
AAROHAN
The Event Magazine
LEAN AND SIX SIGMA EXCELLENCE AWARDS ‘11
30TH September and 1ST October ‘11
SYMBIOSIS CENTRE FOR MANAGEMENT AND HUMAN RESOURCE DEVELOPMENT, PUNE
Achieving Value and Excellence through Six Sigma
Aarohan-11 Symbiosis Centre for Management and Human Resource Development Page 2
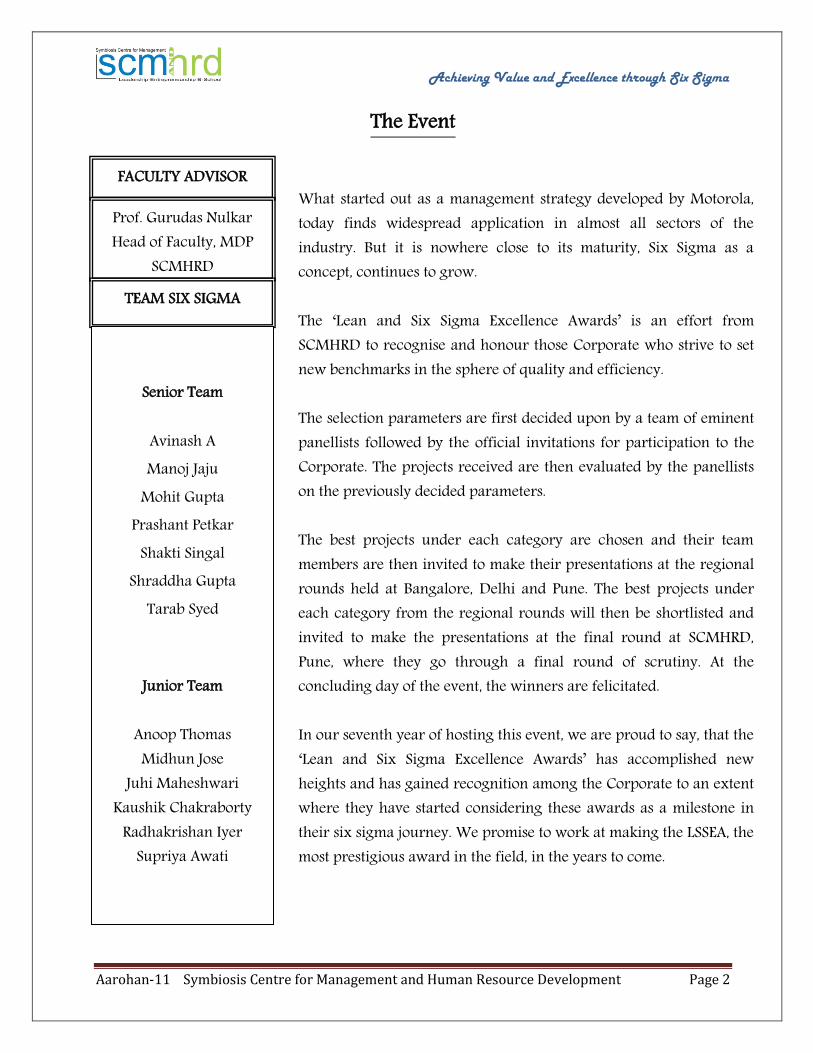
The Event
FACULTY ADVISOR
Prof. Gurudas Nulkar Head of Faculty, MDP
SCMHRD
TEAM SIX SIGMA
Senior Team
Avinash A Manoj Jaju
Mohit Gupta Prashant Petkar
Shakti Singal Shraddha Gupta
Tarab Syed
Junior Team
Anoop Thomas Midhun Jose
Juhi Maheshwari Kaushik Chakraborty
Radhakrishan Iyer Supriya Awati
What started out as a management strategy developed by Motorola, today finds widespread application in almost all sectors of the industry. But it is nowhere close to its maturity, Six Sigma as a concept, continues to grow. The ‘Lean and Six Sigma Excellence Awards’ is an effort from SCMHRD to recognise and honour those Corporate who strive to set new benchmarks in the sphere of quality and efficiency. The selection parameters are first decided upon by a team of eminent panellists followed by the official invitations for participation to the Corporate. The projects received are then evaluated by the panellists on the previously decided parameters. The best projects under each category are chosen and their team members are then invited to make their presentations at the regional rounds held at Bangalore, Delhi and Pune. The best projects under each category from the regional rounds will then be shortlisted and invited to make the presentations at the final round at SCMHRD, Pune, where they go through a final round of scrutiny. At the concluding day of the event, the winners are felicitated. In our seventh year of hosting this event, we are proud to say, that the ‘Lean and Six Sigma Excellence Awards’ has accomplished new heights and has gained recognition among the Corporate to an extent where they have started considering these awards as a milestone in their six sigma journey. We promise to work at making the LSSEA, the most prestigious award in the field, in the years to come.

Achieving Value and Excellence through Six Sigma
Aarohan-11 Symbiosis Centre for Management and Human Resource Development Page 3
From the Desk of the Chancellor, Symbiosis International University
Dear All, It gives me immense pleasure in welcoming you to the ‘Lean and Six Sigma Excellence Awards, 2011’. In this highly competitive world the importance of Six Sigma has become almost indispensable organization. Amidst all the attempts to optimize and standardise the processes in an organization, it is Six Sigma Concepts that hold special importance for one and all. Consistency in quality while minimising waste should be the motto of all organizations. Six Sigma is not only about correcting errors but also about continuously improving what seems perfect! And this is what we strive to do at Symbiosis. At Symbiosis, we aim to improve the efficiency and effectiveness of all those who are a part of the Symbiosis fraternity. Hence Six Sigma is somewhere at the root of all that we do. Wishing you all the very best for all your future endeavours. Best Wishes, Dr. S.B.Mujumdar Chancellor and Founder Director, Symbiosis International University

Achieving Value and Excellence through Six Sigma
Aarohan-11 Symbiosis Centre for Management and Human Resource Development Page 4
From the Desk of the Vice Chancellor, Symbiosis International University
Dear All, I am delighted to welcome you to the seventh edition of the ‘Lean and Six Sigma Excellence Awards’ that is hosted by SCMHRD every year. I appreciate the efforts taken by SCMHRD, to not only felicitate Corporate who have taken Six Sigma initiatives and reaped benefits from them, but also to build a platform where everyone interested in Quality can learn a lot from the experiences of others. We at Symbiosis believe in harnessing and disseminating knowledge to the youth today for a better quality tomorrow. All the very best to all of you! Best Wishes, Dr. Bhushan Patwardhan, Vice Chancellor, Symbiosis International University
Achieving Value and Excellence through Six Sigma
Aarohan-11 Symbiosis Centre for Management and Human Resource Development Page 5
From the Desk of the Principal Director, Symbiosis International University
I am pleased to welcome you all to the ‘Lean and Six Sigma Awards, 2011’. SCMHRD is an institute with a distinct character for itself. Its rapid growth in the last decade has amazed me time and again. The curriculum design is unique to SCMHRD. The intensity of the course coupled with its design makes the course unique in itself. The Lean and Six Sigma Excellence Awards, an initiative from SCMHRD to appreciate the efforts taken by the corporate in implementing lean and six sigma methodologies in their organizations, has been growing in stature year on year. I am happy to see the respect this institute as well as this event draws from the Corporate. My best wishes for all your future endeavours. Dr. Vidya Yeravdekar Principal Director Symbiosis
Achieving Value and Excellence through Six Sigma
Aarohan-11 Symbiosis Centre for Management and Human Resource Development Page 6
From the Desk of the Director, Symbiosis Centre for Management &
Human Resource Development
We are elated to welcome you to SCMHRD ‘Lean and Six Sigma Excellence Awards, 2011’. In today’s competitive world, only a few have the gumption to think in terms of growth, value and excellence. One needs to consistently improve quality while aggressively reducing cost. Lean and Six Sigma methodologies empower organisations to achieve these goals even in adverse economic situations. The sooner we realise this, the better. We strongly believe that Six Sigma is not just a methodology, but a way of life. We, as an institute, wish to act as a catalyst in bringing about this awareness by felicitating those who have reaped the benefits of using Six Sigma Methodologies. We, at SCMHRD constantly strive for perfection in every endeavour that we undertake. We thank the Corporate for enabling us in grooming our students in this regard and also for making this event a well branded one in an international context. Best Wishes, K.S. Subramanian Director SCMHRD
Achieving Value and Excellence through Six Sigma
Aarohan-11 Symbiosis Centre for Management and Human Resource Development Page 7
Contents DFSS
BHARAT ELECTRONICS LTD .............................................................................................................. 11
TO Reduce Design Iterations To Minimum For Power Supply Module Of Out- Door Unit (ODU) ............. 11
BHARAT ELECTRONICS LTD .............................................................................................................. 12
Improvement In Height Accuracy Of Rohini Radar System ....................................................................... 12
INGERSOLL RAND ............................................................................................................................. 13
Employee on Boarding Process .................................................................................................................. 13
CAPGEMINI BUSINESS SERVICES (INDIA) LIMITED ........................................................................... 15
Chakra – Moving up the Value Chain ......................................................................................................... 15
RELIANCE INDUSTRIES LIMITED ....................................................................................................... 15
Improve % Tail-end in POY ......................................................................................................................... 15
HOERBIGER INDIA PRIVATE LIMITED ............................................................................................... 17
New process design to achieve customer satisfaction .............................................................................. 17
DMAIC SUPPORT
CAPGEMINI INDIA PRIVATE LIMITED ............................................................................................... 18
Optimization of Recruitment cycle time .................................................................................................... 18
RELIANCE INDUSTRIES LTD. ............................................................................................................. 20
Security Manpower Reduction .................................................................................................................. 20
CAPGEMINI BUSINESS SERVICES INDIA LIMITED ............................................................................. 21
Project Krama Nirandhara ......................................................................................................................... 21
BHARAT ELECTRONICS LIMITED ....................................................................................................... 22
Defect reduction in GR Details of Shelf Life Items ..................................................................................... 22
TCS E-SERVE LIMITED ....................................................................................................................... 23
Lead Time Reduction of Id Creation Process ............................................................................................. 23
JOHN DEERE INDIA PRIVATE LIMITED .............................................................................................. 25
PTO test stand utilization improvement .................................................................................................... 25
iGATE Patni ....................................................................................................................................... 29
Achieving Value and Excellence through Six Sigma
Aarohan-11 Symbiosis Centre for Management and Human Resource Development Page 8
Energy Conservation for iGATE Patni, Bangalore Location ........................................................................ 29
DMAIC MANUFACTURING
GALA PRECISION TECHNOLOGY PRIVATE LIMITED .......................................................................... 33
Improvement in Edge Radius Quality in Reed Valves ................................................................................ 33
SEPR REFRACTORIES INDIA LIMITED ................................................................................................ 34
Productivity Improvement In Finishing Process Of Azs Blocks In Sepr India Limited ................................ 34
ADITYA BIRLA NUVO LTD ................................................................................................................. 34
Winning Back Customer's Confidence Lean Six Sigma Implementation In Apparel Industry .................... 34
BHARAT ELECTRONICS LTD .............................................................................................................. 36
Yield Improvement Of Enhanced Tactical Computer(Etc) Of Shakti Project ............................................. 36
SKF INDIA LIMITED ........................................................................................................................... 38
Yield improvement of Bore Grinding Wheel in Grinding Channels by 20% (Average 22.1 K to 26.5K
wheel) ........................................................................................................................................................ 38
RIL- HOSHIARPUR MANUFATURING DIVISION ................................................................................ 39
Reduction in PSF Steam Consumption from 1.047 MT/MT TO 0.99 MT/MT ............................................ 39
CUMMINS IPO .................................................................................................................................. 41
Improvement in the capability of Gear parmeters .................................................................................... 41
RELIANCE INDUSTRIES LIMITED ....................................................................................................... 42
Reduce Bromine Index in LAB Plant ........................................................................................................... 42
RELIANCE INDUSTRIES LIMITED ....................................................................................................... 43
Improve First Quality PSF-CP4 ................................................................................................................... 43
RELIANCE INFRASTRUCTURE LTD ..................................................................................................... 45
Reduction in number of Service Contracts by 10% without affecting Plant performance ........................ 45
Larsen & Toubro, Medical Equipment & Systems ........................................................................... 50
Reduce Crimping Defects in PMS1 Products .............................................................................................. 50
DMAIC SERVICES
CAPGEMINI INDIA PRIVATE LTD ....................................................................................................... 51
Reduce Operational cost, by enabling shift left of standardized activities from Level3 to Level2 support
team ........................................................................................................................................................... 51
iGATE PATNI ..................................................................................................................................... 53
Effort Reduction in Test Decision Tree Design ........................................................................................... 53
Achieving Value and Excellence through Six Sigma
Aarohan-11 Symbiosis Centre for Management and Human Resource Development Page 9
FIRST SOURCE .................................................................................................................................. 54
Improving Overall Sales Conversion Percentage for Webchat Sales ......................................................... 54
HCL TECHNOLOGIES ......................................................................................................................... 55
Reduce Client Complaints: Online AD Campaign ....................................................................................... 55
STANDARD CHARTERED ................................................................................................................... 58
First Contact Resolution Improvement in Trade Client Services Group .................................................... 58
STANDARD CHARTERED ................................................................................................................... 60
Efficiency Improvement – Cash Clearing Countries ................................................................................... 60
HCL TECHNOLOGIES ......................................................................................................................... 62
Reducing Provisioner Caused Rework ....................................................................................................... 62
TATA CONSULTANCY SERVICES ........................................................................................................ 63
To Reduce the Client Reported Billing Error Ratio ..................................................................................... 63
SYNTEL INC ....................................................................................................................................... 65
Utilization Improvement in Asset Management ........................................................................................ 65
TATA CONSULTANCY SERVICES ........................................................................................................ 66
Improving Session Completion Rates ........................................................................................................ 66
RELIANCE INDUSTRIES LTD .............................................................................................................. 68
Improving Health Of Diabetic Cases .......................................................................................................... 68
TATA CONSULTANCY SERVICES ........................................................................................................ 69
Improvement in Average Accuracy Rate ................................................................................................... 69
APOLLO MUNICH HEALTH INSURANCE COMPANY LIMITED ........................................................... 72
Mission Badhautri – “Increasing the % Claims closed within TAT” ........................................................... 72
CORELOGIC ....................................................................................................................................... 74
Increase Pre-sale Work Orders Compliance (TAT) Percentage in FS P&P Maintenance Results ............... 74
EXL SERVICE ...................................................................................................................................... 76
Invoice To Pay Cycle Time Reduction......................................................................................................... 76
EXL SERVICE ...................................................................................................................................... 77
Reduction of Processing Time Per Valuation ............................................................................................. 77
COGNIZANT TECHNOLOGY SOLUTIONS LTD .................................................................................... 78
To Reduce The Operating Cost in AVM ...................................................................................................... 78
Achieving Value and Excellence through Six Sigma
Aarohan-11 Symbiosis Centre for Management and Human Resource Development Page 10
CUMMINS IPO .................................................................................................................................. 80
Improve % CETI (Actual vs. Estimated Time index) compliance in a KPO Market Research Project ......... 80
HOERBIGER INDIA PRIVATE LIMITED ............................................................................................... 82
New Process Design To Achieve Customer Satisfaction ............................................................................ 82
TCS E-SERVE LTD .............................................................................................................................. 84
Reduction in TAT – NA Charges ................................................................................................................. 84
TCS E-SERVE LTD .............................................................................................................................. 86
Improving Productivity in PPR ................................................................................................................... 86
TCS E-SERVE LTD .............................................................................................................................. 88
Reject Reduction in corporate account opening ....................................................................................... 88
TCS E-SERVE ..................................................................................................................................... 90
Improvement of Driver ‘Easy to Understand ............................................................................................. 90
BHARAT ELECTRONICS LIMITED ....................................................................................................... 93
To Improve the "Bharat Electronics Retired Employee's Contributory Health Scheme (BERECHS) Booklet
Satisfaction Index" ..................................................................................................................................... 93
CAPGEMINI BUSINESS SERVICES (INDIA) LIMITED ........................................................................... 93
Project Vimana –Productivity Improvement ............................................................................................. 93
CAPGEMINI BUSINESS SERVICES (INDIA) LIMITED ........................................................................... 94
Project Utthanam ....................................................................................................................................... 94
AFTAB Co……………………………………………………………………………………………………………………………………94 Applying lean six sigma to decrease discharge time in ALghadir hospital………………………………………………..94
Achieving Value and Excellence through Six Sigma
Aarohan-11 Symbiosis Centre for Management and Human Resource Development Page 11
DFSS
BHARAT ELECTRONICS LTD
TO Reduce Design Iterations To Minimum For Power Supply Module Of Out- Door Unit (ODU)
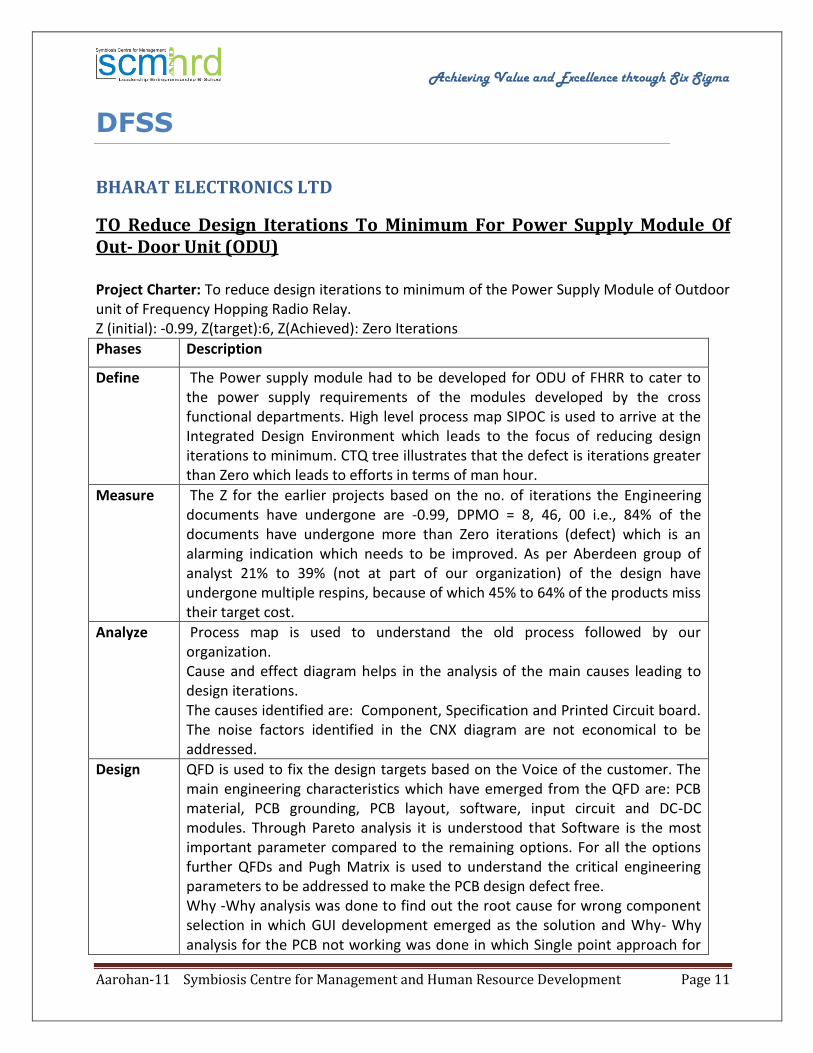
Project Charter: To reduce design iterations to minimum of the Power Supply Module of Outdoor unit of Frequency Hopping Radio Relay. Z (initial): -0.99, Z(target):6, Z(Achieved): Zero Iterations
Phases Description
Define The Power supply module had to be developed for ODU of FHRR to cater to the power supply requirements of the modules developed by the cross functional departments. High level process map SIPOC is used to arrive at the Integrated Design Environment which leads to the focus of reducing design iterations to minimum. CTQ tree illustrates that the defect is iterations greater than Zero which leads to efforts in terms of man hour.
Measure The Z for the earlier projects based on the no. of iterations the Engineering documents have undergone are -0.99, DPMO = 8, 46, 00 i.e., 84% of the documents have undergone more than Zero iterations (defect) which is an alarming indication which needs to be improved. As per Aberdeen group of analyst 21% to 39% (not at part of our organization) of the design have undergone multiple respins, because of which 45% to 64% of the products miss their target cost.
Analyze Process map is used to understand the old process followed by our organization. Cause and effect diagram helps in the analysis of the main causes leading to design iterations. The causes identified are: Component, Specification and Printed Circuit board. The noise factors identified in the CNX diagram are not economical to be addressed.
Design QFD is used to fix the design targets based on the Voice of the customer. The main engineering characteristics which have emerged from the QFD are: PCB material, PCB grounding, PCB layout, software, input circuit and DC-DC modules. Through Pareto analysis it is understood that Software is the most important parameter compared to the remaining options. For all the options further QFDs and Pugh Matrix is used to understand the critical engineering parameters to be addressed to make the PCB design defect free. Why -Why analysis was done to find out the root cause for wrong component selection in which GUI development emerged as the solution and Why- Why analysis for the PCB not working was done in which Single point approach for
Achieving Value and Excellence through Six Sigma
Aarohan-11 Symbiosis Centre for Management and Human Resource Development Page 12
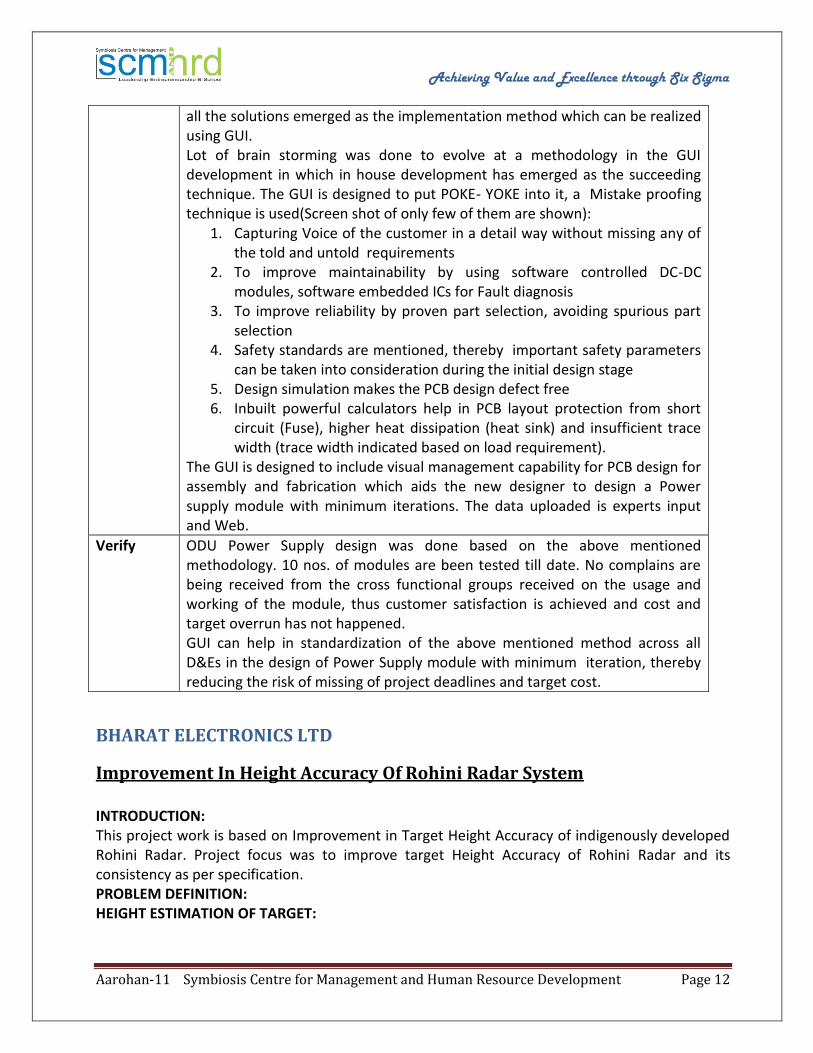
all the solutions emerged as the implementation method which can be realized using GUI. Lot of brain storming was done to evolve at a methodology in the GUI development in which in house development has emerged as the succeeding technique. The GUI is designed to put POKE- YOKE into it, a Mistake proofing technique is used(Screen shot of only few of them are shown):
1. Capturing Voice of the customer in a detail way without missing any of the told and untold requirements
2. To improve maintainability by using software controlled DC-DC modules, software embedded ICs for Fault diagnosis
3. To improve reliability by proven part selection, avoiding spurious part selection
4. Safety standards are mentioned, thereby important safety parameters can be taken into consideration during the initial design stage
5. Design simulation makes the PCB design defect free 6. Inbuilt powerful calculators help in PCB layout protection from short
circuit (Fuse), higher heat dissipation (heat sink) and insufficient trace width (trace width indicated based on load requirement).
The GUI is designed to include visual management capability for PCB design for assembly and fabrication which aids the new designer to design a Power supply module with minimum iterations. The data uploaded is experts input and Web.
Verify ODU Power Supply design was done based on the above mentioned methodology. 10 nos. of modules are been tested till date. No complains are being received from the cross functional groups received on the usage and working of the module, thus customer satisfaction is achieved and cost and target overrun has not happened. GUI can help in standardization of the above mentioned method across all D&Es in the design of Power Supply module with minimum iteration, thereby reducing the risk of missing of project deadlines and target cost.
BHARAT ELECTRONICS LTD
Improvement In Height Accuracy Of Rohini Radar System
INTRODUCTION: This project work is based on Improvement in Target Height Accuracy of indigenously developed Rohini Radar. Project focus was to improve target Height Accuracy of Rohini Radar and its consistency as per specification. PROBLEM DEFINITION: HEIGHT ESTIMATION OF TARGET:
Achieving Value and Excellence through Six Sigma
Aarohan-11 Symbiosis Centre for Management and Human Resource Development Page 13
The good height accuracy is the most vulnerable, sensitive and difficult to achieve parameter as any defect in any of the receive beams, contact problem or misalignment of the gain of the receivers first reflects in the Height Accuracy of the Target. It is also affected by the external factors like weather condition, atmospheric noise etc. It was also observed that height accuracy becomes quite erratic during the course of the Target e.g. it was observed that in the MSTC (Microwave Sensitivity Time Control) zone (up to 60 Km) the Target height is not consistent. Sudden dips and jumps in the height of the Target were being observed. In addition uneven heights were also observed in overhead crossing flights. CONTRACTUAL REQUIREMENTS: As per system specifications it is mandatory to have Target Height Accuracy above 70% during the course of the Target within 100 Km Range of the Radar. If the target height Accuracy of the Radar is below 70%, then radar state is changed from Fully Operational (F-Ops) to Restricted Operational (R-Ops) as it amounts to compromise on Flight safety. It also has the bearing on the Warranty period which is extended accordingly for the down time and financial bearing on the AMC (Annual maintenance Contract) amount. As per AMC contract if the Radar is R-Ops for more than 25% of the time then R-Ops hours are counted in the Non-Operational (Non-ops). Solution: The reasons behind the poor height accuracy were analyzed in details and all identified points were jotted down in the form of cause and effect diagram. The solution of the problems were found and implemented in the phased manner. Vendors were continuously persuaded to implement and control the changes as early as possible. Result: The quality of system is improved and greater flight safety was guaranteed. User confidence is also increased for effective utilization & exploitation of Radar capabilities. It enhanced the Customer satisfaction through improved reliability of the system. Also Financial savings through reduced site visits and better realization of warranty period and AMC amount by enhanced operational availability of Radar.
INGERSOLL RAND
Employee on Boarding Process
Business Case The concept behind “Employee On Boarding Process” was to develop a systematic and comprehensive approach to orient new employees to help them get on boarded. The two high level objectives of on boarding process were to firstly improve employee engagement by making the new hire feel welcome and comfortable in their new surroundings and secondly to improve the turnaround time to get the new hire on boarded as per the expected date of joining. Candidates declining or postponing the offers are commonly observed across the organization and this not only bears a significant impact on the HR recruitment process but also the perception of the Manager about the HR processes decreases. On the other side of it, on the new
Achieving Value and Excellence through Six Sigma
Aarohan-11 Symbiosis Centre for Management and Human Resource Development Page 14
hire joining day if all the immediate requirements are not met, then the new hires perception about the organization policies and procedures also decreases. All this lead to completely redesigning the “Employee On Boarding Process” that can leverage the technology & functional support integration to efficiently on board the new hire. This ensures 100% material compliance and also guides Managers/ Mentors/HR to orient the new hire, which in turn can decrease the learning curve of the new hire and increase the employees speed to business productivity. Identify: A project team comprising of key representatives from HR, IT, Admin was setup and a DFSS (Design for Six Sigma) framework of IDOVC (Identify – Design – Optimize – Verify – Control) was established to execute the project. The team would meet every week to review on the project progress and to decide on future course of actions. As the first step, the team conducted VOC (Voice of Customer) from key stakeholders to identify current process gaps. For all the consolidated customer needs, appropriate CTQs (Critical To Quality) were arrived using QFD – 1 (Quality Function Deployment). The prioritized CTQs were validated to determine whether it is in line with the customer expectations. A thorough process mapping of the current state was also done to identify what are the key factors and risks (FMEA -1) associated in the process. Design: In the design stage QFD -2 was performed to understand which process functions contributed most to meet the customer requirements. The prioritized process steps were further analyzed using Input/output analysis to determine Key process variables. Optimize: In the Optimize phase the team conducted several rounds of brainstorming session to identify what design elements and methods needs to be considered and how the process steps needs to be designed to efficiently manage the process. At the end of the optimize phase a detailed process flow was developed. Verify: The new process was later verified by running a pilot campaign at selected regions. Monthly HR dashboards were also designed to monitor critical metrics. Control: Risk analysis was conducted using FMEA – 2 (Failure Mode Effect Analysis) on the new process to determine how well the controls are designed to mitigate the risks that were identified at the start of the process. Reaction Plan was also put in place to act against the process measures. Project Benefits At the end of the control phase the project was handed over to the HR leadership team & the initial take away was that the process is robustly built by integrating the supports of other functions & considering the current trends in HR recruitment.
Achieving Value and Excellence through Six Sigma
Aarohan-11 Symbiosis Centre for Management and Human Resource Development Page 15
CAPGEMINI BUSINESS SERVICES (INDIA) LIMITED
Chakra – Moving up the Value Chain
This Project is focused on identifying business value added activities in the Financial Accounting process through designing unique solution model. Business value used to be identified only after stabilization of transactional process which is normally 2 years from the project initiation. As a result of the project, business value added tasks can be identified during due diligence itself and delivery to the client. Business Problem: Improving revenue through offshore of 35% business value added activities handled by customer in house and improving value chain capability from 1% to 3%. Project Baseline: Based on benchmarking and client provided data, observed 33% (462 over 1389 Full Time Equivalent resources) are involved in value added activities such as Planning and Strategy, Control and Risk Management and Function Management. Vital Xs: No structure model in identifying business value adding activities during due diligence, no process controls to alert the financial impacts and risks, no study on understanding vendor behaviour and manual intervention. Business Improvements: Designed unique solution model which includes Scientific Evaluation Model for due diligence, Process Monitoring System established for process controls and alert financial impacts and developed database for pattern analytics. Business Benefits: Financial benefits of about Rupees 2.8 crores. Product life cycle process has been improved and organization started evaluating business value added steps during due diligence itself and improvement in customer satisfaction. Customer Benefits: Payment Efficiency improved by faster TAT, Enhanced customer satisfaction.
RELIANCE INDUSTRIES LIMITED
Improve % Tail-end in POY
Need of the Project: Reliance started their First Polyester Filament Yarn at Patalganga in 1982 with Du-Pont winders. These winders are manual operation winders. After attaining the set weight of the bobbin the running yarn thread-line is cut manually and put on the empty paper tube. With the passage of time automatic winders became available in the market. These winders have the advantages of avoiding waste during change over and ensuring tail end availability. With the
Achieving Value and Excellence through Six Sigma
Aarohan-11 Symbiosis Centre for Management and Human Resource Development Page 16
installation automated winders by competitors and also by Reliance during further expansions. Lower % tail end is a major concern area for the earlier PFY Plant at Patalganga. What is a advantage in having a tail end? POY Bobbin has to undergo further processing called as Texturising. During the Texturising the entire POY bobbin is unwind. While unwinding at the end the tail ( few meters of Yarn ) is knotted with the top end of the next bobbin. By doing so interruptions are avoided. This improves the efficiency of the Texturising process. The Availability of the tail-end improves the efficiency of customers i.e. Texturisers. There was a increasing pressure from customers to increasing Tail-end.
1. Improve Tail end % become Must be to stay in the market. 2. This is also considered main Quality Parameter in case of export. Improving the Tail end
will also improve the customer base for export. Lower % tail-end also affected the Delivery time in case of export
External Customer is a Texturiser: Availability of the tail end will improve the efficiency of his process. Marketing Manager: Availability of Tail end will open up the market for Export and ensures on time delivery. Packing Manager: High number of with-out tail end bobbins will have incomplete logical box in the Automatic Packing system and will reduce the efficiency of Packing System. Define: The Daily Data for % tail end was collected for the period May-July 10 . The mean was 95.35% with Std. Dev.0.527 .Sigma level was calculated using Process Capability method and it is -3.21. Measure: Measurement System analysis was done and Process capability analysis carried out. Analysis: Total 60 Potential X’s were identified. After screening 8 Factors and 3 Noise factors were carried forward Design Of experiment. Taguchi design of L18 Array was selected. Total 36 Experiments were done and 1152 Small bobbins were produced. After Statistical analysis Four Factors were identified. One factor having significant effect was implemented using a Design change on Machine. Break through Improvement was achieved after the design change. Total 60 Potential X’s were screened and only Three were selected for action. Improve: After implementation of all the above actions:
% Tail end Improved from 95.34 % to 97.90 % and
Sigma Level from -3.21 to 2.99 Control: Control Plan and Project hand over was done. Specialty Production % increased from 6.5 % to 16.3 % will bring more revenue to the organisation. Customer satisfaction was most critical Benefit achieved from the Project.

Achieving Value and Excellence through Six Sigma
Aarohan-11 Symbiosis Centre for Management and Human Resource Development Page 17
HOERBIGER INDIA PRIVATE LIMITED
New process design to achieve customer satisfaction
We are a MNC engaged in manufacturing and exports of Compressor valves. Valves are used to control the flow of gases into (suction) and out of (discharge) the compressor cylinder. Classical round valves are invented by Hoerbiger and leaders for over 100 years. Valves are designed on the basis of compressor application by Hoerbiger. The process of Shot blasting produces burrs on the edges of slots as the metal flows due constant hitting of shots on the edges. As this metal folding is a part of process, our norms allow a burr of 0.1 mm. One of our potential customer from an oriental country required the valves which are shot blasted but burr free. The customer was buying these parts from European manufacturer and was not happy with the burrs. Realizing that burr free product may not be feasible to produce, he specified the revised tolerance of Max 0.03mm. The potential business from this customer was to the tune of INR 6.5 Million per year. However this depended on our capability to meet his requirement on slot edge quality. A Six Sigma team was formed to tackle this problem through DMADV route. After defining the problem, scope and CTQ, i.e. the burr size, we conducted a gauge R&R study to establish measurement capability . This was followed by a Process Capability study where 50 parts were subjected to checking the burr size and data analysed using Minitab. As the process was not found capable to meet the new requirements, team studied various options for the new process, they included manual deburring, Chamfering on VMC and brushing with Ceramic brush. After a series of trials and analysis of Cycle time, cost and burr quality, the team zeroed in on new process of Brushing. The samples were submitted to the customer, who was quite happy that we have taken up the challenge and produced the valves as per his requirement. As a result we got additional business worth around 14 Mi. INR in 2010 and 2011.

Achieving Value and Excellence through Six Sigma
Aarohan-11 Symbiosis Centre for Management and Human Resource Development Page 18
DMAIC SUPPORT
CAPGEMINI INDIA PRIVATE LIMITED
Optimization of Recruitment cycle time The Problem:
Considering growing demand of number of resources and diversity of technologies from delivery teams, it was challenge for Recruitment team to provide resources at optimum cycle time. Since the current recruitment process had been following traditional approach, it needed systematic way to bring improvement that increases PACE of recruitment. It was business goal the natural urge to short term objectives to reduce cycle time, significant cost savings and eludes the much needed synergistic collaboration between delivery and recruitment teams. Across organization and industries, integrated Six Sigma and Lean techniques have always been extremely useful in analysis and improving effectiveness and consistency of processes. Approach:
Apps one AM team (major business unit) together with the PIE (Process innovation & Excellence) group and recruitment at Capgemini India they embraced the Lean & Six Sigma methodology (DMAIC approach) to fast track the improvement of the hiring process and launched an improvement project in Sep 2010 at Capgemini India. The operations at Capgemini India span across Mumbai, Bangalore and Kolkata locations with Head office at Mumbai.
Define phase:
Initial analysis revealed that the AM team was trailing behind an acceptable pace of hiring especially at junior levels (C/ SC’s) which contributes to 70% of the overall recruitments. Pareto analysis was carried out to prioritize technology wise job requirements for C/SC’s and found that 80% of requirements from SAP, Microsoft, Oracle etc. The scope of the project was taken for C/SC’s and critical technologies
Measure phase:
Recruitment and Delivery teams are tracking job requirements through HR intranet system, extracting reports for further analysis, generating dashboards and reporting the status to senior management. Histogram used to understand the data distribution and outliers, baseline the current performance and arrive targets for improvements (15%) in cycle time. Hypothesis tests demonstrated that 15% improvements in the current mean is significant

Achieving Value and Excellence through Six Sigma
Aarohan-11 Symbiosis Centre for Management and Human Resource Development Page 19
Analyze phase:
Control charts were drawn for cycle time to establish current capable limits and special causes for C/SC’s. A further drilldown by technologies indicated that ERP recruitments for SAP and Oracle took very long to close. Milestone wise analysis was carried out to understand current performance and the variation, new KPI have been derived for each mile stone so that small units can work very closely and ensure that KPI are met. Apart from analyzing the trends revealed by data, an end to end process map was also created for identifying specific activities which took more time than the others and needed immediate attention so as to reduce the blocking effect on the overall chain of the recruitment process. Brainstorming sessions were held with the recruitment and delivery teams to determine the root causes from data door and process door (Outliers from Capability analysis, As Is process and drill down analysis for NVA, Mile stone wise analysis, work load and cancelled JD). Control Impact Matrix and Cost-Benefit Analysis was used to prioritize controllable root causes that has more impact on Critical to Quality (CTQ).
Improve phase:
Root causes were taken to introduce action plans, The following improvement ideas were discussed senior management and got buy-in from deliver team.
· Standardization of the job description template to capture clear and complete requirements
· Automated data transfer to the Internal Recruitment Portal · Prediction models were derived to Forecast technology wise requirements · Improve skill proficiency by establishing Skill wise standard interview panelists and
certification programs for recruitment teams to avoid operational glitches · Visual management for close monitoring milestones and early warning for effective
tracking to meet KPI · Load was split among various teams and balancing the work load among the team
Control Phase:
In this phase the recommended solution that was piloted and elaborated for full scale socialization and implementation.
Achieving Value and Excellence through Six Sigma
Aarohan-11 Symbiosis Centre for Management and Human Resource Development Page 20
Tools/Techniques:
VOC, Brainstorming, Fishbone, Control Impact Matrix, Value added analysis, 5-whys, Load balancing, hypothesis tests, Takt time analysis (Milestone and KPI tracking), control charts, histograms, Box plots, visual dash boards Benefits and Value Proposition:
Post-implementation of improvement actions, the results demonstrated an average improvement of 25 percent across each of the milestones within the recruitment process. This has lead to a sustained reduction of nearly 22 percent in the overall recruitment cycle time. Before v/s After Individual Control Charts were drawn for demonstrating improvements. The result of these improvements is a financial savings of INR 17.3 million annually. Sustenance plan
The scope of the project was limited one of the Major business units, Recruitment together with process innovation excellence team derived the strategy to roll out best practices in all other business units. As the recruitment team targets to hire 3000 consultants and 2500 Senior Consultants organization wide this year, industrialization of the improvements is likely to have a huge potential for savings estimated at INR 487 million annually.
RELIANCE INDUSTRIES LTD.
Security Manpower Reduction Need of the Project:
There are no boundaries for the security to perform. Security is required to keep track of the number of Visitors who enter and leave the Premises. The time of arrival and departure, the reason of visit and so forth. All these details must be recorded.
o All Material Inwards – Outwards. o Traffic Control within and around the premises. o Assist Incident Emergencies and First Aid. o Handle all inwards and outwards couriers/postages. o Another important responsibility of the security services includes close surveillance. They
keep close watch on people and places, thereby avoiding illegal activities and problems. They are keen in spotting people behaving suspiciously and doing illegal activities.

Achieving Value and Excellence through Six Sigma
Aarohan-11 Symbiosis Centre for Management and Human Resource Development Page 21
Total area of RIL , Patalganga is 220 acres and it situated on the bank of River Patalganga and to provide Dependable Security Protection and strike right balance of cost-effectiveness was a real challenge. Define and Measure: Clearly defined charter (In scope, out scope and constraint CTQ with Process owner) Analysis:
o Pareto analysis was done to identify areas. o Study the % Occupancy of a each Security Guard o List down the activities , o Frequency of each activity , o Cycle time for each activity.
Actions were suggested based on following approaches. o Challenge Frequency of each activity. o Reduce Cycle time by Automation / Other means o Rearranging Activities based on % Occupancy o Stopping a Non Value added activities o Alternative Method of Surveillance/ Vigilance
Improve and Control: After implementation of all the above actions,Man power duty posts were reduced from 81/ Day to 63/ Day Benefit achieved – Rs-26.76 Lacs/Annum.
CAPGEMINI BUSINESS SERVICES INDIA LIMITED
Project Krama Nirandhara
Project is focused on elimination or reduction of connectivity downtime (System outages). Before initiating the project, the average 6 hours per outage to acceptable threshold of 15 minutes per outage. As a result of the project, the average connectivity downtime reduced to less than 15 minutes per outage i.e. elimination of 7575 man hours observed (Feb 11 – Mar 11). Business Problem: Process and IT SLA’s were missed due to average downtime of 6 hours per outage. Frequent System downtime and performance degradation. Low Payment Efficiency resulted in customer dissatisfaction. Statistical Problem: The connectivity issue has resulted in loss of several thousands of man hour Loss extends to 7575 (Avg. of 6 hours per outage) Man hours in Feb and Mar’11. Vital Xs:
Achieving Value and Excellence through Six Sigma
Aarohan-11 Symbiosis Centre for Management and Human Resource Development Page 22
Citrix network disconnects, High Bandwidth utilization, Network Switch failure, Issue with MPLS, Network switch / IP Plug issue, Firewall Issue, Router failure, WAN Link failure, Software related issue, Issue with Citrix Farm Server, frequent disruption due to system bandwidth issues and Server Capacity issue. Business Improvements: 1. Implementation of additional monitoring between Frankfurt and Grenoble (FRIA) – Felix (Syngenta), 2. Provide info on prioritization of ICA and ICMP traffic between FRK and FRIA – Felix (Syngenta), 3. Provide logs from Citrix servers that could provide clues why sessions are being dropped - Kiran & Brian (Syngenta/HP), 4. Provide information on Citrix Configuration (TCP KeepAlive settings) – Kiran & Brian (Syngenta/HP), 5. Test connectivity between Bangalore and FRK to check if any issue can be found – Michal/Pawel (CG SOC/NOC) Business Benefits: Financial benefits of about INR 2.93 Crores per annum. Reduced or Eliminated system downtime, Real time monitoring and alerting on system disruption (Every 9 Secs monitoring and reporting), Better control of process, Enhanced Customer Satisfaction, Reduced System outage from average 6 hours per outage to less than 15 minutes per outage acceptable threshold/target set for this project. Customer Benefits:
o Payment Efficiency improved by faster TAT. o Enhanced customer satisfaction.
BHARAT ELECTRONICS LIMITED
Defect reduction in GR Details of Shelf Life Items
Introduction: This project is based on voice of customer. He was getting error at the time of posting goods receipt (GR) of chemical shelf life items in SAP system. Considering the fact that items are very hazardous in nature and delay in posting of goods receipt may affect defined quality of shelf life items, there was a need of posting of goods receipt (GR) in time. Old Process: After receiving the shelf items, inward goods store (IGS) does visual inspection and makes goods receipt (GR) in SAP system. In few cases user was not able to generate goods receipt (GR) document and then was informing to our department i.e. Information System (IS). Information System used to troubleshoot the GR and after troubleshooting IS was taking correct shelf life data from material control department and repairing it in material master of SAP. Information System was also repairing shelf life data in purchase order and info record so that problem may not come in future. For NYRO/SIRO purchase orders, Information System was not having authorization to update purchase orders, so these purchase orders were updated by

Achieving Value and Excellence through Six Sigma
Aarohan-11 Symbiosis Centre for Management and Human Resource Development Page 23
Corporate-Information System Bangalore on Ghaziabad –Information System request. Problems: Shelf life data fields were not configured in material master at the time of go-live of SAP system in Bharat Electronics Ltd. and legacy system was also terminated. Hence there was insufficient information. Highly significant fields total shelf life, minimum remaining shelf life and period indicator if not filled correctly were giving adverse effect at the time of posting of GR. Improved Process: Process is same but SOP is available to clear field significance at each level. Material master template has been designed to capture correct data .Existing data has been corrected in material master by IS so unwanted steps of old process has been removed and GR is getting posted timely.
TCS E-SERVE LIMITED
Lead Time Reduction of Id Creation Process
Background: Once a new recruit joins the team, there are applications which he needs to be accessed to become productive. As the Volume pressures are high, it’s always the urgent need to get these associates productive. However, in the present situations, this is taking almost a month before a person becomes productive leading to Productivity loss and Client Dissatisfaction due to Holdovers. Goal: To reduce the Lead Time of ID creation from DOJ from approx. 30 days to 18 days by July 2011 Analysis:
Achieving Value and Excellence through Six Sigma
Aarohan-11 Symbiosis Centre for Management and Human Resource Development Page 24
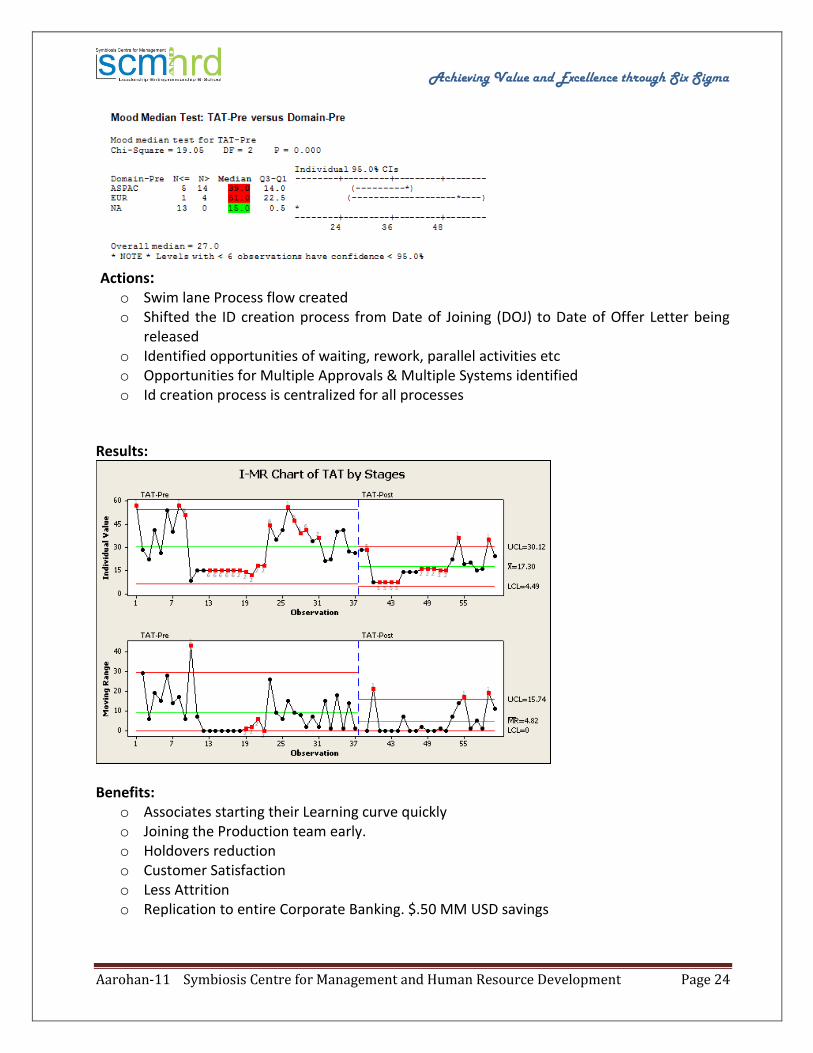
Actions:
o Swim lane Process flow created o Shifted the ID creation process from Date of Joining (DOJ) to Date of Offer Letter being
released o Identified opportunities of waiting, rework, parallel activities etc o Opportunities for Multiple Approvals & Multiple Systems identified o Id creation process is centralized for all processes
Results:
Benefits: o Associates starting their Learning curve quickly o Joining the Production team early. o Holdovers reduction o Customer Satisfaction o Less Attrition o Replication to entire Corporate Banking. $.50 MM USD savings
Achieving Value and Excellence through Six Sigma
Aarohan-11 Symbiosis Centre for Management and Human Resource Development Page 25
JOHN DEERE INDIA PRIVATE LIMITED
PTO test stand utilization improvement
Problem Statement: Baseline Utilization time of PTO test stand in Product Verification and Validation center is at 32% Project Scope: In Scope : Test setup, Instrumentation, Manpower, Scheduling, Maintenance. Out of Scope : New test stand / Facility Statistical Goal Statement for the Project:
o Improve utilization of PTO test stand to min 55% and establish test scheduling process o Primary Metric for the Project o Improve utilization in hrs
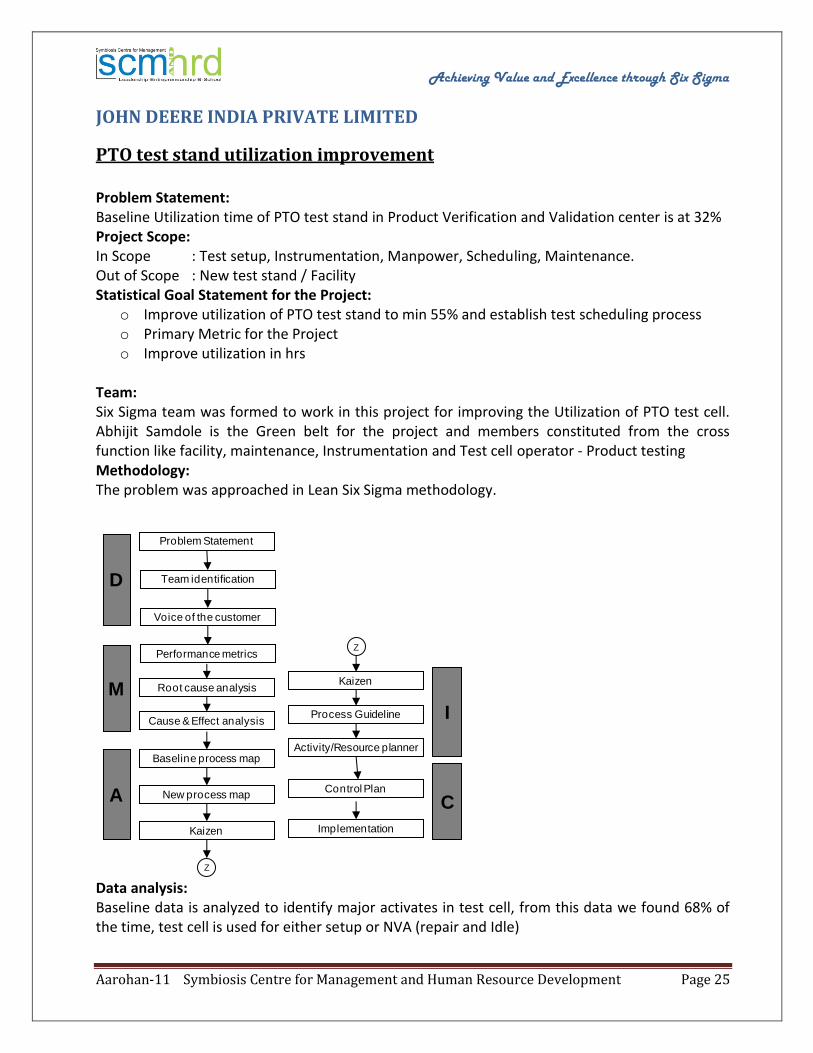
Team: Six Sigma team was formed to work in this project for improving the Utilization of PTO test cell. Abhijit Samdole is the Green belt for the project and members constituted from the cross function like facility, maintenance, Instrumentation and Test cell operator - Product testing Methodology: The problem was approached in Lean Six Sigma methodology.
Root cause analysis
Cause & Effect analysis
Baseline process map
New process map
Kaizen
Kaizen
Process Guideline
Activity/Resource planner
Control Plan
Implementation
Z
M
A
I
C
Performance metrics
Problem Statement
Team identification
Voice of the customer
D
Z Data analysis: Baseline data is analyzed to identify major activates in test cell, from this data we found 68% of the time, test cell is used for either setup or NVA (repair and Idle)

Achieving Value and Excellence through Six Sigma
Aarohan-11 Symbiosis Centre for Management and Human Resource Development Page 26
Root Cause analysis: The primary Root Cause analysis was done by drill down with Pareto charts, where Setup hours is further sub divided into Changeover, Assembly and Removal time.Changeover time is customized and will have multiple setup requirements as shown below. Major contributors for changeover time are identified and taken for further analysis
Similarly major contributors for Breakdown and Idle hours are analyzed using pareto analysis. Cause and Effect diagram, 5 why Cause and effect diagram for breakdown and 5 why analysis for Idle time was done to further drill down and identify input variables (x) on the Output variable (Y).This was done to identify and prioritize the input variables for further evaluation and corrective action as necessary.

Achieving Value and Excellence through Six Sigma
Aarohan-11 Symbiosis Centre for Management and Human Resource Development Page 27
Process map: Process map is used to identify VA and NVA in Assembly & Removal process as shown below. It is found that total time taken for assembling the tractor to Dynamometer and Removal after the testing is currently ~2.5 hours.
Process map: Re-engineered: Process map is re engineered by removing non value added process/activity to save the time. Estimated new time for assembly and removal is 30 mins. This is achieved by planning instrumentation outside the test cell and parking it in staging area identified inside the test Cell

Achieving Value and Excellence through Six Sigma
Aarohan-11 Symbiosis Centre for Management and Human Resource Development Page 28
during the testing. This will allow less time for the tractor to couple with dynamometer for the testing
Improvement Action: List of improvement action for Setup, Breakdown and Idle time are identified and listed as shown below. Process Kaizen are initiated and examples of the same are shown below:
Achieving Value and Excellence through Six Sigma
Aarohan-11 Symbiosis Centre for Management and Human Resource Development Page 29
iGATE Patni
Energy Conservation for iGATE Patni, Bangalore Location Problem Identification:
The Facilities team at iGATE Patni is responsible for Operations and Maintenance of the Facility on 24/7 basis. The average electricity consumption for its Bangalore Whitefield main (old) campus location is 8, 23, 646 KWH / month. The total monthly cost of the energy billing in Bangalore Whitefield main (old) campus location constitutes 51% of the overall total cost and 60% of total energy consumption. The Target for improvement is 15% of energy consumption by Sep 2010, without increasing the internal complaints received per month. At the current rate of Rs.6 per unit, the savings amount to 123547 KWH / month i.e, 700099 KWH/month, i.e Rs.7, 41, 282 and 13 internal complaints per month. This Black Belt project using DMAIC methodology was identified as an improvement initiative to address optimization of energy consumption through continual improvements. A dedicated team was formed for executing this project. Project charter and the milestone plan were reviewed and approved by Sponsor and MBB. The problem statement, project CTQ, operational definition and utilization goals of the project were finalized. Process capability of the AS-Is process was assessed based on the data collected. Causal analysis for high energy consumption using techniques such as Brainstorming sessions was conducted. Prioritization of Xs was done through Pareto analysis. Solution approach was finalized based on these. For reducing the energy consumption new solutions were recommended and implemented for the Bangalore location, post the approval from the Sponsor and MBB. The critical Xs to be addressed through this initiative were identified as energy consumption by Air handling units(AC), Motors, Pumps, Uninterruptible power supply (UPS), Lighting and Lifts, Pantry, Gym, Canteen, Garden equipments. Customer perspective and impact on business: Part of the iBEEs initiative and continual improvement initiatives prompts the senior management to look at further optimizing the energy consumption on a regular basis. As the Bangalore location is the relatively older campus compared to the new buildings which have implemented intelligent Building Automated Systems and Variable Air Volume (VAV) and we have received GOLD certification on LEED (Leadership in Energy and Environmental design) for the new building campus Kazhiranga and other new implementations. These solutions have been identified based on the Cost impact and Organisation mandates. Based on learnings on earlier implementations and continual improvements, all new Building implementation have adopted the best practices and received appropriate green certificates. In order to ensure that the older Buildings also adopt the greener initiatives, improvements are implemented for reduced cost even though iGATE Patni’s utilization is currently at 1.81 units per sq. ft / month as against LEED gold standards of 1.6 to 1.65 units utilization sq.ft / month. Problem selection and quantification: Though the energy reduction is seeing a reducing trend, optimum electricity usage and reduced costs are some of the VOC from the Sponsor and Function Head and also contributing to the high costs of the Selling, General and Administrative (SG & A) overheads. Interviews and focused

Achieving Value and Excellence through Six Sigma
Aarohan-11 Symbiosis Centre for Management and Human Resource Development Page 30
discussions were organized to derive the problem statement of the project. After problem selection, Project CTQs were defined (no need of CTQ drill down in this case as CTQs are explicit) and Operational definition were arrived at. The goal of the project was set as ‘To reduce the consumption of Electricity for Bangalore Location by 15% of KWH/month by 28th Feb 2011. ie. 700099 KWH/month, i.e Rs.7, 41, 282 per month, without increasing the internal complaints received per month. Energy consumption data and internal complaints were collected, baselined and analysed. AS-IS process performance was assessed and found that based on the trends, the unit consumption was influenced by the seasonal changes in weather in Bangalore, India. Complexities / Scope of Project: Measurement tools like the energy meters and Building Management Systems are not implemented in its Bangalore Whitefield main (old) campus location to assess the high contributors and categorizing them. Based on the industry standards and other newer building energy usage, the analysis was derived on the high cost contributors. Due to lack of Building Management Systems segregated data availability for optimizing also was identified as a challenge. A core team was formed with stakeholders from Facilities along with extended team members to support this project. Process Deliverables: Project charter was created and the milestone plan was reviewed and approved by Sponsor and MBB. Milestone reviews were conducted with whole team, sponsor and MBB to ensure the rigor of the project and adherence to the timelines. Deliverables and the goals to be achieved were identified and approved by Sponsor and MBB. Phase wise deliverables: Define: (Tools /Techniques used: SIPOC),Project Charter,Overall Project Plan Measure: (Tools /Techniques used: Data analysis including Normality test, Process sigma level computation and process capability analysis using control charts)CTQ and Operational Definition,Baselined Data Analysis: (Tools /Techniques used: VOC, Analysis of responses during brain-storming sessions using Pareto, Ishikawa (cause-effect diagram) analysis, Validation of the prioritized Xs with stakeholders/SMEs)Current Process Performance baseline,Analysis of brain-storming sessions, Prioritized causes and action Items using Pareto and Ishikawa (cause-effect diagram) analysis Improve: (Tools /Techniques used: Quick wins, New solutions roll-out, Process capability analysis using control charts, Process sigma level computation)Modified Process for product roll out, Modified review process for service payments Control: (Tools /Techniques used: Hypothesis testing using moods median and Test for equal variance, Defining and institutionalize Standard Operating procedures)Result of Improved Process Methodology: DMAIC was identified as the methodology to be followed to systematically analyze and improve the process. Detailed analysis and the senior management review of the Solutions were conducted Validating the Root Cause:
Achieving Value and Excellence through Six Sigma
Aarohan-11 Symbiosis Centre for Management and Human Resource Development Page 31
Initial analysis of the problem statement was done and based on that the brain-storming sessions were held with people from different functions, including the Facilities Team as well. Key Areas covered in the sessions were:
o Areas contributing to high energy consumption o Reasons for electricity wastage o Suggestions on improving usage
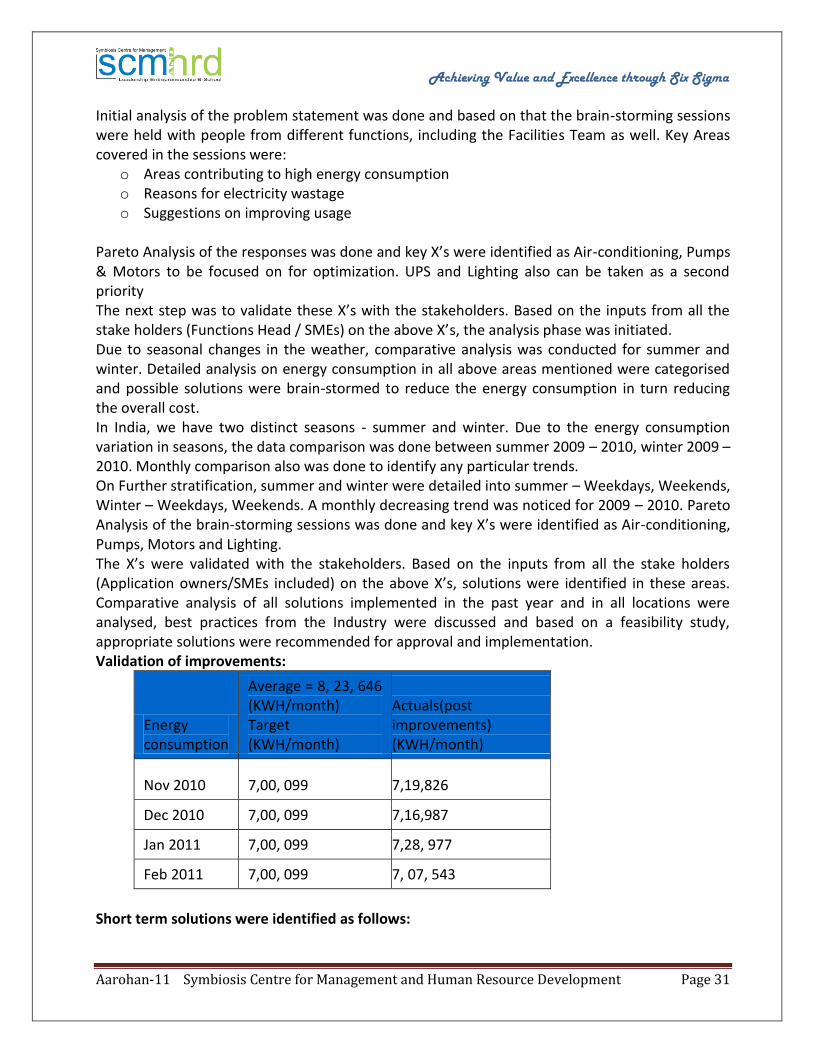
Pareto Analysis of the responses was done and key X’s were identified as Air-conditioning, Pumps & Motors to be focused on for optimization. UPS and Lighting also can be taken as a second priority The next step was to validate these X’s with the stakeholders. Based on the inputs from all the stake holders (Functions Head / SMEs) on the above X’s, the analysis phase was initiated. Due to seasonal changes in the weather, comparative analysis was conducted for summer and winter. Detailed analysis on energy consumption in all above areas mentioned were categorised and possible solutions were brain-stormed to reduce the energy consumption in turn reducing the overall cost. In India, we have two distinct seasons - summer and winter. Due to the energy consumption variation in seasons, the data comparison was done between summer 2009 – 2010, winter 2009 – 2010. Monthly comparison also was done to identify any particular trends. On Further stratification, summer and winter were detailed into summer – Weekdays, Weekends, Winter – Weekdays, Weekends. A monthly decreasing trend was noticed for 2009 – 2010. Pareto Analysis of the brain-storming sessions was done and key X’s were identified as Air-conditioning, Pumps, Motors and Lighting. The X’s were validated with the stakeholders. Based on the inputs from all the stake holders (Application owners/SMEs included) on the above X’s, solutions were identified in these areas. Comparative analysis of all solutions implemented in the past year and in all locations were analysed, best practices from the Industry were discussed and based on a feasibility study, appropriate solutions were recommended for approval and implementation. Validation of improvements:
Energy consumption
Average = 8, 23, 646 (KWH/month) Target (KWH/month)
Actuals(post improvements) (KWH/month)
Nov 2010 7,00, 099 7,19,826
Dec 2010 7,00, 099 7,16,987
Jan 2011 7,00, 099 7,28, 977
Feb 2011 7,00, 099 7, 07, 543
Short term solutions were identified as follows:
Achieving Value and Excellence through Six Sigma
Aarohan-11 Symbiosis Centre for Management and Human Resource Development Page 32
o Increased the temperature from 23^ to 24^ from Jan 2010, Standardized the temperature 24 degrees to 25 degrees from Mar 2010. Setting the AC temperature as per National building codes
o Water flow regulation across taps so that the load on Hydro pneumatic pumps is reduced o Switching off 1 Lift on non-peak hours each in Serengeti and Yellow Stone o Switching off 1 coffee-machine of the two on every floor, after 6pm & on weekends
Long term solutions such as follows:
o Sensor based lighting. Sensors for discussion rooms and cabins –67 units saved per day (12000 units saved power savings till date)
o Switching off AC using timers during non-peak hours using a timer. Air handling unit (AHU) distributes flow of air – switching off during non-peak hours using a timer for Air handling units – 3000 units saved per month (Rs.18, 000/= per month)
o Preparation of Standard Operating Procedures(SOP) for meter reading, machine handling o Energy meter installation in all areas – For measurement purposes for ongoing
improvements o LED lighting – power savings of 9% (60% of lighting load). CFL lighting is currently resulting
in additional billing of approximately 10 lacs additional p.a vs. LED lighting for 2 buildings. o LED replacement of lighting will be implemented to reduce energy consumption and
maintenance expenses. The energy consumption was found to be improved by more than 5% and this was validated through Hypothesis testing. The improvements rolled out have resulted in actual cost saving of $60,000 for a period of 4 months, without increasing the internal complaints received per month. For further improvements of an additional 9%, the LED implementation will be done in the Bangalore Whitefield (old) main campus.
Achieving Value and Excellence through Six Sigma
Aarohan-11 Symbiosis Centre for Management and Human Resource Development Page 33
DMAIC MANUFACTURING
GALA PRECISION TECHNOLOGY PRIVATE LIMITED
Improvement in Edge Radius Quality in Reed Valves
This project is about the Edge Radius Quality Improvement of Reed Valves which is used in Automotive A/C Compressors .Reed valves are stamped from Steel Strips. The edges need to be Rounded and Burr free to achieve effective sealing. No machining process can produce the required Edge Radius due to the complex profiles. Controlled radius of edges is an important requirement on many components because it reduces the possibility of stress cracking and increasing life of moving parts. In Gala HOERBIGER, we achieve the required Radius profile by Patented Tumbling Process. Centrifugal Tumbling is a Mass Finishing Process where the parts are loaded in a Barrel along with Media, De-burring & Cleaning Chemicals and Water in defined ratios and are finished by the Centrifugal Force generated. During the period March to August 2010, 16 % of the lots were put for extended tumbling resulting in non-value added operations and Cost of Poor Quality. This also resulted in loss of Business Opportunity. This was the driving need to take up a project using DMAIC Methodology. Team selected a particular product known as VC600 , based on a selection criteria based on volume and other considerations. Team collected the data on CTQ ( Edge radius) and found that the process capability was low (Cpk =0.34). On further investigation, machine to machine difference was found significant, and team decided to study further on machine type CFM160, which gave a Cpk of 0.7. After brainstorming and making Fishbone diagram, team decided to carry out experiment to find out the factor that significantly affects the CTQ. For this, team used Taguchi’s method of DOE and used L16 215 array and associated Linear graph. This was suitably modified to accommodate the experimental factors and possible interactions. The experiment was conducted carefully and results analyzed. The analysis included ANOVA, Main effect plots and S/N ratio plots. Idea was to select factors which are significant and maximizes the S/N ratio (Nominal is best formula). Based on this analysis, confirmatory trials were conducted. Through further study on the significant factor, “Media qty”, an optimum level was achieved using linear Regression. The results were implemented for specific product and monitored through control phase.
Achieving Value and Excellence through Six Sigma
Aarohan-11 Symbiosis Centre for Management and Human Resource Development Page 34
SEPR REFRACTORIES INDIA LIMITED
Productivity Improvement In Finishing Process Of Azs Blocks In Sepr India Limited
Background of the project/Relation with business case: Finishing process was the bottleneck process in the company for increasing the output. Hence this project taken up to reduce the finishing time and improve the output. In finishing the maximum time taken was for cutting the AZS blocks using VBS Machines. On an average cutting one block was taking 45 minutes and the setup time was 20 minutes on an average. This was to be improved by at least 50% to meet the current customer demand. Hence the project taken up. Methodology:
o Lean Six Sigma DMAIC Methodology was used and the areas for improvement were identified through PFMEA.
o Corrective actions were taken on the High RPN causes and Setup time was reduced from 20 minutes to 5 minutes.
o Factors and Levels for Experimentation were identified and L8 Orthogonal Array Experimentation was carried out.
o The response cutting time was analyzed and the optimum combination of factors and levels were identified. The cutting time reduced by 50%. That is from 45 minutes to 24 minutes.
o Horizontal Deployment was done across all the machines in the Plant. Financial Benefits: The output could be doubled since this was a bottleneck process. Also additional Capital Expenditure required for purchasing two similar machines is avoided. The total financial benefit from the project is 72 lacs/annum.
ADITYA BIRLA NUVO LTD
Winning Back Customer's Confidence Lean Six Sigma Implementation In Apparel Industry
Madura Garments is a leading fashion and lifestyle company comprising of brands like – Louis Philippe, Van Heusen and Allen Solly. Madura Clothing (MC) is the manufacturing arm of Madura Garments, located on the outskirts of Bangalore in south India, Madura Clothing comprises of four factories with employee strength of around 3,000 The various challenges faced by Madura Clothing are
o Huge pressure to reduce operating costs

Achieving Value and Excellence through Six Sigma
Aarohan-11 Symbiosis Centre for Management and Human Resource Development Page 35
o Increasing labor costs due to rise in minimum wages leading to an increase in manufacturing operating costs
o Reverse migration from the city, coupled with high attrition and scarce availability of labor o To provide the brands (Customer) with the most competitive conversion charges (rate for
stitching a garment) along with the best quality and short lead time The Madura Clothing focus is on improving productivity along with building flexibility and quality Problem Definition: Madura Clothing works with 6 conventional sewing manufacturing lines. The output achieved from a conventional line was 400 to 550 garments (Trousers) per shift with manpower of 54 to 57 per line and available working time of 465 minutes with current efficiency in between 48% to 66%. The current production of men’s trousers per month is on an average 68,000 with variation between 65,000 to 70,000 as against the market demand of an average of 88,000 with variation between 85,000 to 88,000 trousers per month without increase in resources with efficiency in between 66% to 70% The Lead Time in the conventional line (for a work order quantity of 500) was 2 days as against a lead time requirement of 1 day. Manpower resource comprises of 65% of the manufacturing operating cost and thus its optimization would lead to a huge impact on the objective of bringing down the factory operating cost. With the current production, the bottom line was very less and hence there was a great pressure to increase the output without increase in resources. Methodology: The Lean Six Sigma DMAIC methodology was used in this project. The DMAIC (Define, Measure, Analyse, Improve and Control) approach was followed as detailed below.
DEFINE PHASE
MEASURE PHASE
The CTQ s identified by tree diagram in define phase are : (INDICATORS CTQ’s)
As is values(Conventional Line) were collected for the identified CTQ’s (Big Y’s)
PRODUCTION PER DAY (Y) 2554 LEAD TIME (min) (Y) 92.2 Manufacturing COST / GARMENT (Rs.) (Y) 100
ANALYSE PHASE: -The concept was developed and customized to address the above root causes in a staged manner. The following table lists the concepts and the corresponding root causes addressed respectively.
Stage No Stage and Concept Root causes addressed
I NVA Identification and its reduction / elimination.
Lean Tools
Elimination of Non Value Added activities such as Pairing, trimming at EOL, Changing Program for each trouser, etc
Achieving Value and Excellence through Six Sigma
Aarohan-11 Symbiosis Centre for Management and Human Resource Development Page 36
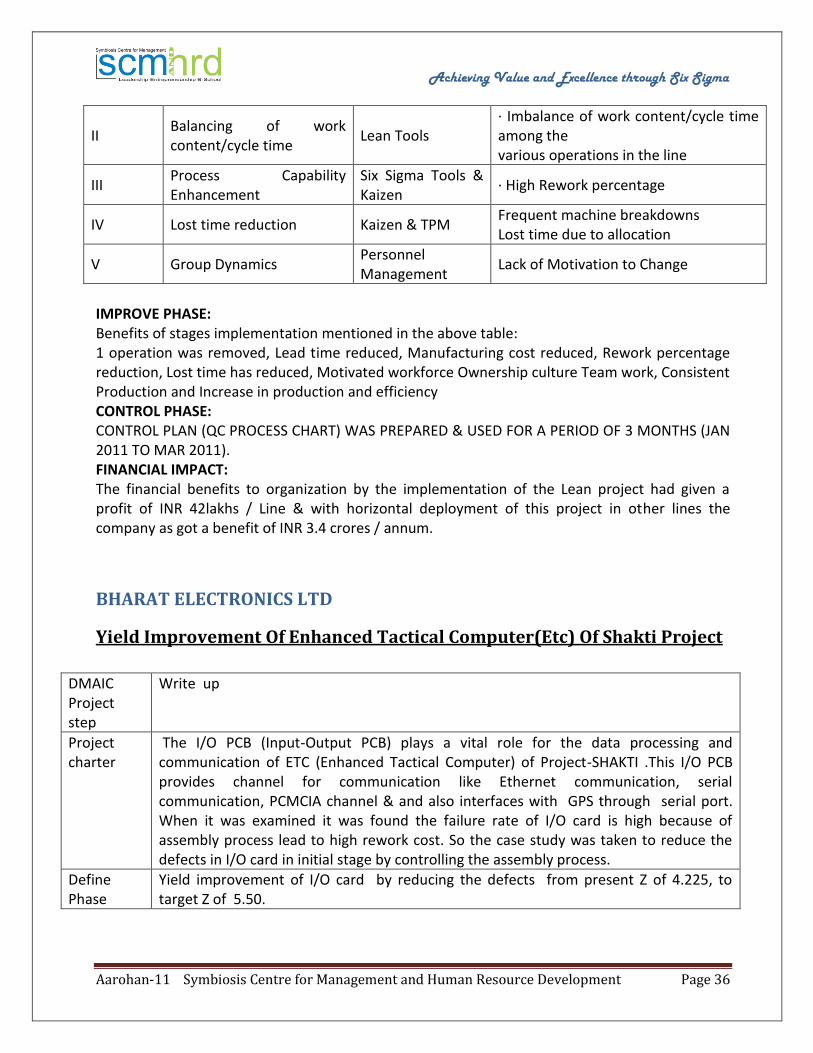
II Balancing of work content/cycle time
Lean Tools · Imbalance of work content/cycle time among the various operations in the line
III Process Capability Enhancement
Six Sigma Tools & Kaizen
· High Rework percentage
IV Lost time reduction Kaizen & TPM Frequent machine breakdowns Lost time due to allocation
V Group Dynamics Personnel Management
Lack of Motivation to Change
IMPROVE PHASE: Benefits of stages implementation mentioned in the above table: 1 operation was removed, Lead time reduced, Manufacturing cost reduced, Rework percentage reduction, Lost time has reduced, Motivated workforce Ownership culture Team work, Consistent Production and Increase in production and efficiency CONTROL PHASE: CONTROL PLAN (QC PROCESS CHART) WAS PREPARED & USED FOR A PERIOD OF 3 MONTHS (JAN 2011 TO MAR 2011). FINANCIAL IMPACT: The financial benefits to organization by the implementation of the Lean project had given a profit of INR 42lakhs / Line & with horizontal deployment of this project in other lines the company as got a benefit of INR 3.4 crores / annum.
BHARAT ELECTRONICS LTD
Yield Improvement Of Enhanced Tactical Computer(Etc) Of Shakti Project
DMAIC Project step
Write up
Project charter
The I/O PCB (Input-Output PCB) plays a vital role for the data processing and communication of ETC (Enhanced Tactical Computer) of Project-SHAKTI .This I/O PCB provides channel for communication like Ethernet communication, serial communication, PCMCIA channel & and also interfaces with GPS through serial port. When it was examined it was found the failure rate of I/O card is high because of assembly process lead to high rework cost. So the case study was taken to reduce the defects in I/O card in initial stage by controlling the assembly process.
Define Phase
Yield improvement of I/O card by reducing the defects from present Z of 4.225, to target Z of 5.50.
Achieving Value and Excellence through Six Sigma
Aarohan-11 Symbiosis Centre for Management and Human Resource Development Page 37
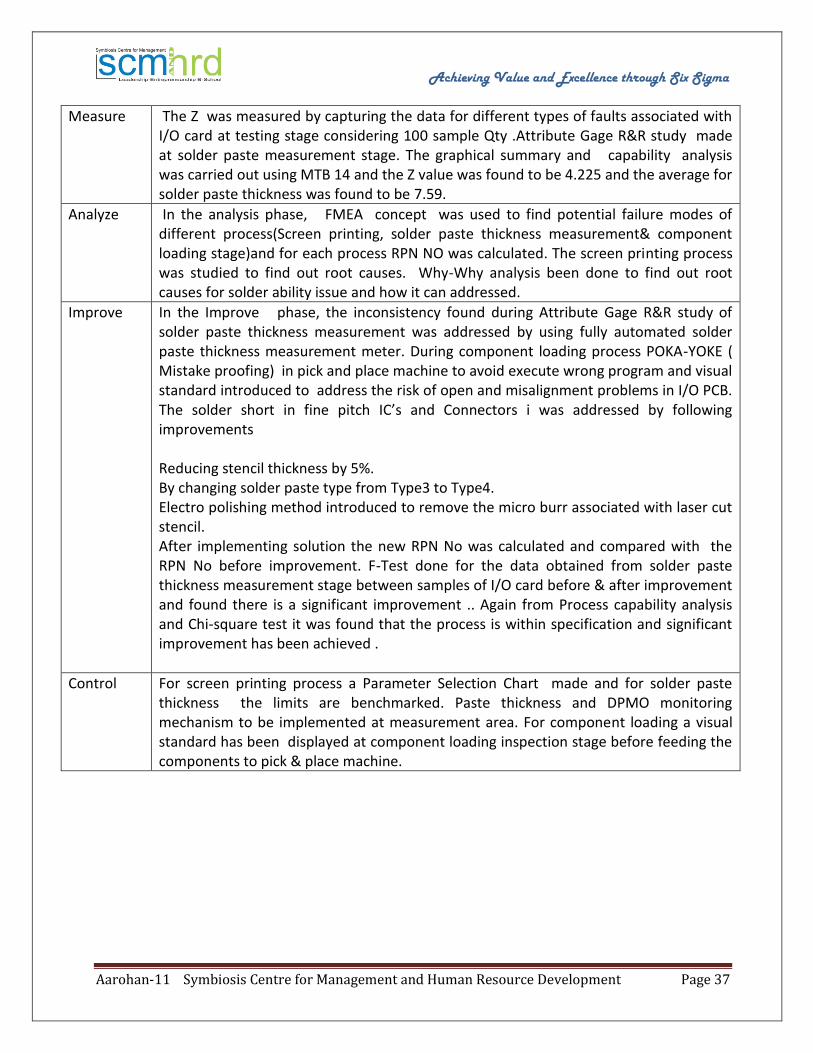
Measure The Z was measured by capturing the data for different types of faults associated with I/O card at testing stage considering 100 sample Qty .Attribute Gage R&R study made at solder paste measurement stage. The graphical summary and capability analysis was carried out using MTB 14 and the Z value was found to be 4.225 and the average for solder paste thickness was found to be 7.59.
Analyze In the analysis phase, FMEA concept was used to find potential failure modes of different process(Screen printing, solder paste thickness measurement& component loading stage)and for each process RPN NO was calculated. The screen printing process was studied to find out root causes. Why-Why analysis been done to find out root causes for solder ability issue and how it can addressed.
Improve In the Improve phase, the inconsistency found during Attribute Gage R&R study of solder paste thickness measurement was addressed by using fully automated solder paste thickness measurement meter. During component loading process POKA-YOKE ( Mistake proofing) in pick and place machine to avoid execute wrong program and visual standard introduced to address the risk of open and misalignment problems in I/O PCB. The solder short in fine pitch IC’s and Connectors i was addressed by following improvements Reducing stencil thickness by 5%. By changing solder paste type from Type3 to Type4. Electro polishing method introduced to remove the micro burr associated with laser cut stencil. After implementing solution the new RPN No was calculated and compared with the RPN No before improvement. F-Test done for the data obtained from solder paste thickness measurement stage between samples of I/O card before & after improvement and found there is a significant improvement .. Again from Process capability analysis and Chi-square test it was found that the process is within specification and significant improvement has been achieved .
Control For screen printing process a Parameter Selection Chart made and for solder paste thickness the limits are benchmarked. Paste thickness and DPMO monitoring mechanism to be implemented at measurement area. For component loading a visual standard has been displayed at component loading inspection stage before feeding the components to pick & place machine.

Achieving Value and Excellence through Six Sigma
Aarohan-11 Symbiosis Centre for Management and Human Resource Development Page 38
SKF INDIA LIMITED
Yield improvement of Bore Grinding Wheel in Grinding Channels by 20% (Average 22.1 K to 26.5K /wheel)
Project Metrics:
Project Context – Voice of the Customer: The cost of Grinding wheels constitutes 27% (4.98 MINR/month) of the total consumables cost (i.e. 18.46 MINR/month). Out of which, 50% is incurred due to Bore grinding wheels (2.5 MINR). The basic cost of CBN Wheels is very high. The cost varies from 7K to 20K/ wheel, depending on the wheel size. An average of 350 Bore Grinding Wheels/month is being consumed to produce an average of 7 MIL bearings/month. High Consumption of wheels results in high consumable cost and it’s alarming, having direct impact on the manufacturing cost and stores inventory. It was also observed that Grinding wheels are discarded before its actual worn out size, specified in the process set up chart. Project Solution: An innovative idea of Two Level Dressing Intervals introduced by replacing the One fixed dressing interval through following improvement activities : Wheel Wear Program modified in the Bore Grinding machine to utilize the benefit of New Wheel Diameter and thereby increase the Bore Grinding Wheel life (CBN Wheel) New Register value (R 144) introduced in the wheel wear programming of Bore Grinding Machine Early discard of grinding wheels was completely eliminated by : Program Modification implemented for worn out wheel position by de-linking the manual compensation. This has resulted in elimination of mismatch of down counter display and actual wheel dimension.
Project Matrix (Baseline and Actual – Status @ time closing)
Actual
20.8 20.6
48.4
54.0
42.7
25.2
18.9 Ch 5 - 6000
19.0 15.9 Ch 5 - 6200
29.8 24.9 Ch 4 - 6201
31.6 26.4 Ch 4 - 6002
32.6 27.2 Ch 4 - 6202
26.2 21.9 Ch 3 - 6301
Goal (20%) Baseline
Channel/Brg.
Type Mean ( Bearings in K)
15.8
Achieving Value and Excellence through Six Sigma
Aarohan-11 Symbiosis Centre for Management and Human Resource Development Page 39
To eliminate the loss of additional Initial Dressing (not as per standard) the Dressed Wheel diameter Gauges (Poka yoke) are introduced and the replenishment by the Presetting function is being ensured. To eliminate the wheel damages, Poka-yoke developed and installed for Wrong /small ring entry Project Result: 1. Bore Grinding Wheel life increased from 30K to 104K rings /wheel (290%) 3 times improvement. 2. No. of Wheel changes reduced by 50% per week. Wheel setting time reduced by 30 minutes per week and M/c. uptime increased by 30 minutes per week. ( productivity increased approx. 1000 bearings /30 minutes) 3. Operator Team spirit is very high and pride for their contribution and eager to participate in more no. of projects. 4. Financial Benefit : Actual savings from Dec,10 – Jun, 2011 - 2.1 Mil Rs. Estimated savings as per 2011 loading plan is 4.9 Mil Rs. + 5 Mil Rs. from replication projects. Total Rs.10 Million
RIL- HOSHIARPUR MANUFATURING DIVISION
Reduction in PSF Steam Consumption from 1.047 MT/MT TO 0.99 MT/MT
PSF (Polyester Staple Fiber) is the end product of Staple Fibre Plant. The main processes involved are Polymerization, Spinning and Draw Line. After being packed in bales the material is dispatched to the external customer for further processing. PSF in combination with other fibres like cotton, viscose etc. are processed depending upon its end usage like suiting and shirting fabrics. As explained, PSF is made in three Processes. First Process is Polymerization; At Polymerization the PTA (Polyethylene Terepthalic Acid) and MEG (Mono Ethylene Glycol) converted into polymer having long continuous molecular chain and transferred to spinning through pumps. Second Process is Spinning. In Spinning, this polymer is converted into the filaments and filaments are assembled to form the tow which is accumulated in cans for further processing. The Third Process is Draw-Line. In this section the filaments collected in cans are converted to Fibre through various stages like; Drawing, Annealing, Crimping, Drying, Cutting and baling. Steam is an integral part in manufacturing of POLYESTER STAPLE FIBRE (PSF). It is mainly used in Draw-Line section in Annealer Unit or Thermo Setting Unit (TSU) for imparting the required physical properties in the Polyester Fibre. Steam cost has about 25 % contribution in overall conversion cost of Staple Fibre. The input costs are going up and product realization reducing due to competition, recession effects and other market conditions. Therefore cost reduction is focus area for management. Reduction in steam consumption will save conversion cost, which is an important business objective. Project Summary: In Define Phase, Project Charter was firmed up covering the Goal statement, team members, expected saving & time frame. SIPOC was prepared to identify the process boundary, process
Achieving Value and Excellence through Six Sigma
Aarohan-11 Symbiosis Centre for Management and Human Resource Development Page 40
steps, suppliers, inputs & outputs. Major CTQ was identified as per VOB and CTQ Tree. Target Specification (0.99 MT/MT) was set below yearly budget (1.0 MT/MT) as per Sponsor requirement, which was also below the best achieved level (1.047 MT/MT). In Measure Phase, CTQ specification Table & Data collection plan was prepared. Process stability and Data distribution checked through Normality test and initial capability established along with Sigma rating and mean value. In Analyze Phase, Brainstorming sessions were conducted to list all the probable causes of high Steam Consumption. All these Cause were organized through C & E Diagram using why-why Concept. The Failure Mode Effect Analysis (FMEA) was done to identify High RPN for potential causes. Further GEMBA and various statistical tools like test of Hypothesis e.g. One way ANOVA, 2 Sample t-test were used to validate the Root Causes. The following high impact root causes were identified: Overshooting of Dryer Temperature, Steam Wastage during Creel changeover, Lower Cascade Levels in DM#4, High Consumption in Steam Boxes, Cascade safety Passing, Popping of 3.0 bar Safety in DM#4, Delay in getting the leaks attended and High exhaust temp due to blower running. Solutions for validated root causes were developed and selected through brainstorming. Risk analysis of all the identified solutions were taken in consideration before implementing them. Selected Solutions are: Dryer steam supply to be connected to 3.0 bar generation instead of 10.0 Bar generation, Steam to be stopped manually if stoppage is more than one hour, Trial with increased Cascade Level of V-51 and V-52 from 40 % to 70 % to reduce Control V/V openings, Steam consumption to be optimized in Draw Steam chest before Annealer ( Opening reduced from 10 % to 2 %), All Safety valves of cascade to be attended, All Steam Traps return's to V-51 to be blocked and realigned to eliminate the back pressure problem in V-51, All S/I and Checklist operators to be counselled for prompt action along with Utility person's regular audit and Dryer Exhaust Blower should be interlocked with line running. In Improve phase, solutions were implemented with specific time frame and responsibility. Improvements were validated through statistical tools like 2 sample t-test etc. In Control phase, the required modifications and changes in SOP and SOC were documented and aligned with ISO documentation to sustain the gains. Necessary training was also provided to shop floor crew to adapt to the changes. Project has eventually led to Reduction in PSF Steam Consumption from 1.047 MT/MT to 0.952 MT/MT (Avg of Apr, May & June-10). The improvements have been sustained for last one year. With the above improvements the Annualized Savings in the Year 2010-11 were approximately 84.0 Lacs. Besides this, the improvements have led to betterment in Product Quality in terms of Dye Index.

Achieving Value and Excellence through Six Sigma
Aarohan-11 Symbiosis Centre for Management and Human Resource Development Page 41
CUMMINS IPO
Improvement in the capability of Gear parmeters
Background: Project was initiated at Supplier’s organization. The Supplier manufactures gears in India, which are then exported to Cummins US. The focus of this project was to identify the parameter affecting the noise and then improve its capability. Aligned to Cummins Operating System - Treat preferred suppliers as partners Project undertaken as part of reduced rejections at user plant: DMAIC approach used Methodology:
o Project charter was launched with the supplier. Tracker was filled in. Tracker gives a guideline for the completion of the phases during the project. Analyzed the parameters which affects for gear noise.
o A Process map was done. All Key Process Input Variables (KPIV’s) were listed. With the help of tools like Cause and effect matrix, FTA funneling was done.
o After the funneling MSA (Measurement System Analysis) was conducted for the gauges being used.
o Quick improvements were done based on the expertise available in the team. Multi-vari study was conducted for Speed, feed, dwell time during shaving and furnace location. This helped the team in deriving at the actual root cause. It showed that the “Feed and dwell time affects the component, and also since the R-sq adj was low it suggested that there are other contributors which needs to be looked into.
o Response optimization was done to derive the best combination, o Shot blasting analysis was done and KPIV’s were selected for further analysis. o DOE was conducted in shot blasting operation for – time, shot size and RPM.
Best combination was derived. Actual problem was converted into a statistical problem. It was then solved statistically. Statistical solution was then converted into actual solution.
Achieving Value and Excellence through Six Sigma
Aarohan-11 Symbiosis Centre for Management and Human Resource Development Page 42
Actions: All actions were implemented based on the analysis. Results:
o Cpk of the parameters which affected improved to >1.66 o Rejection due to noise reduced from 12% in Jan 2010 to 0.12% in June 2010 and it is
sustained. o This resulted into phenomenal cost savings and on time delivery of engines to Chrysler.
Lessons learnt: o 6 Sigma is a powerful tool for solving problem when absolutely no clue is available. o Domain knowledge is also necessary. o Statistical tools guide in taking the correct decisions.
RELIANCE INDUSTRIES LIMITED
Reduce Bromine Index in LAB Plant
Why this Project? Bromine index is an important quality parameter which determines the saleability of product. LAB product having higher bromine index (>10) is not saleable in the market even after discount Plant shutdown was planned in the month May 11 for replacement of reactor column trays with better design. But after start up of plant, Continuous high variation in Bromine index was observed which was having a negative impact on LAB contributing loss of Rs.48 lacs every day Hence Project was launched on voice of internal customer to reduce heavy contribution loss on urgent basis Define: CTQ identified as Bromine Index Number. Cross functional team was formed including technical expertise and Six Sigma Black Belt. Roles and responsibilities of each and every team member identified and project charter prepared. Problem and goal statement is “Reduce Bromine Index to less than 10. Project boundaries were well defined using project scoping tool. High level process map prepared to identify input and output of process. Project kicked off after financial validation by Finance Manager. Measure: In Measure phase, team collected baseline data and including baseline, mean, standard deviation, sigma level and defect levels. Sigma level was -1.25 Measurement System error assessed using MSA & Team moved ahead after confirming Gage R&R within acceptable limit. Analyze:
o To improve process capability, team walk through the process to identify hidden factory and hardware abnormality.
Achieving Value and Excellence through Six Sigma
Aarohan-11 Symbiosis Centre for Management and Human Resource Development Page 43
o Potential X’s identified using series of Brain storming session & stratified using Fish bone Diagram.
o Further screening of X’s carried out using Cause and Effect Matrix. o Then preliminary Relationship between High Bromine Index and different parameters
studied using Matrix plot & strength & direction confirmed using Correlation Analysis done.
o To find out best combination parameters, Best subset analysis carried out & then Regression analysis revealed only two parameters were significant.
Improve: DOE done using these two parameters at two levels. Center point included in Experiment to determine curvature & whole experiment replicated once. Both parameters optimized after studying main effect & interaction plot. Response Optimizer used to arrive best setting. Control: Hypothesis Test was carried out for actual improvement, and confirmed that Bromine Index reduced statically to level of 3.2 Improved Sigma level calculated & observed Sigma level improved from -1.25 to 4.55. To sustain the improvement, a transparent control plan prepared indicating control method, responsibility for each X’s. All X’s & Y monitoring started using Control Chart. Highlights: This project is completed within 15 days as there is very high priority from Top management to avoid daily down gradation of 330 MT & loss of Rs.48 lacs/day.
RELIANCE INDUSTRIES LIMITED
Improve First Quality PSF-CP4
Why this Project? RELIANCE is a leader in PSF Manufacturing To expand its leadership position in Speciality fibre manufacturing, Reliance introduced more & more speciality products in the market. Since PSF plant in Patalganga is of smaller capacity, this feature made it most suitable for producing speciality fibre.But in the process of manufacturing new differentiated products along with Spinning grade product, Overall First grade quality of PSF plant got adversely affected. Voice of Customer WasProduce various differentiated products without compromising overall PSF quality Target. Increase in First Quality will increase PSF Bottom line to the tune of Rs 57.5 Lacs/Annum & it also increase customer delight. Define: Project was taken up in response to the Voice of the internal Customer. % First Quality was chosen as the Critical to Quality (CTQ) parameter.

Achieving Value and Excellence through Six Sigma
Aarohan-11 Symbiosis Centre for Management and Human Resource Development Page 44
Impact of project is identified on revenue generation, delivery cycle time & reduction in customer complaint.A cross functional team was formed and the Project charter was prepared with benefits, scope, constraints CTQ & timelines. Problem and goal statement was “Increase First Quality to > 95.0 % with product mix not less than current. Project kicked off after financial validation by Finance Manager. Measure: Team collected baseline data and Baseline mean & standard deviation was calculated Sigma level calculated after conducting normality test & was arrived at -1.38 MSA done on crimp measurement (Gage R&R) & Attribute MSA on segregation method. Team moved ahead after assessing Gage R&R. Analyze:
o Initially team did Box plot analysis to determine Product wise First Quality level & low quality in two products.
o Series of Brainstorming session was conducted to identify potential X’s . o Cause wise Pareto analysis also done & found 80% reason for low quality was 6 vital
causes. X’s related to 6 Vital X’s selected for further analysis. o Further Screening of X’s done using Correlation Analysis, Box plots Analysis & GEMBA
Study for visual observation. o Total 17 X’s out of 36 X’s found having relationship with low quality & selected for
improvement in First Quality Improve:
o Regression Analysis, Analysis Of Variance & Design of Experiment tools used to optimize 12 X’s.
o Team also used a Innovative approach on 5 X’s to reduce down gradation. o Important innovation is Special jig for high pr water & steam jet cleaning for removal of
residual polymer from pack body & use of hydraulic operated roll as well as wrap detector to avoid tight ends.
o After confirming positive result in trial, full scale implementation of all solutions carried out.
Control: Significant improvement in First Quality observed & same confirmed using 2 sample t test .Improved Sigma level also calculated & observed Sigma level improved from -1.38 to 0.04To sustain the improvement, a transparent control plan for all vital 8 X’s prepared indicating control method, responsibility for each X’s. Various Control type (SPC,SOC,SOP,Flag) recommended for different X’s. Highlights:
o This project is in control since Jan 11. o Team managed to improve the First Quality without compromising product mix.
Achieving Value and Excellence through Six Sigma
Aarohan-11 Symbiosis Centre for Management and Human Resource Development Page 45
o CP4 Quality is continuously at 95% level despite of increase in Speciality product production
o A savings of Rs 53.3 Lacs/Annum achieved & validated by Account Dept
RELIANCE INFRASTRUCTURE LTD
Reduction in number of Service Contracts by 10% without affecting Plant performance
DTPS has been recognized as a model power station in the country. Since inception, the plant has received more than 85 awards in various categories such as performance, environment, safety and CSR at National and International forums. DTPS has over the period developed competency in measurement, monitoring, evaluation and control of various parameters related to plant performance and also implemented numerous improvement programs. The plant undertook Six Sigma initiatives, which has directly resulted in considerable improvement in Key Performance indicators i.e. achieving best heat rate, lowest Specific Oil consumption, Highest Plant load factor and plant availability along with improved Environmental performance, etc. At DTPS, Six sigma initiatives are undertaken since 2005 and so far 4 waves have been successfully completed with 136 employees as green belt holders and 12 employees as Black belt holders. So far, more than 50 projects are successfully completed. Remarkable improvement is achieved through implementation of these projects Analysis: WHY-WHY analysis for the findings of Y1, Y2 & Y3 was carried out for further narrowing down to root causes. Figure shows the typical model of root-cause analysis followed in this project. The model first expands to identify all causes for the problems identified; then it congregates to a few more likely causes. Finally, the insignificant causes are filtered out, common causes were grouped and the important causes are highlighted. Decisions on the importance of causes are based on discussions and consensus. These are further validated by brain storming sessions with the functional heads.
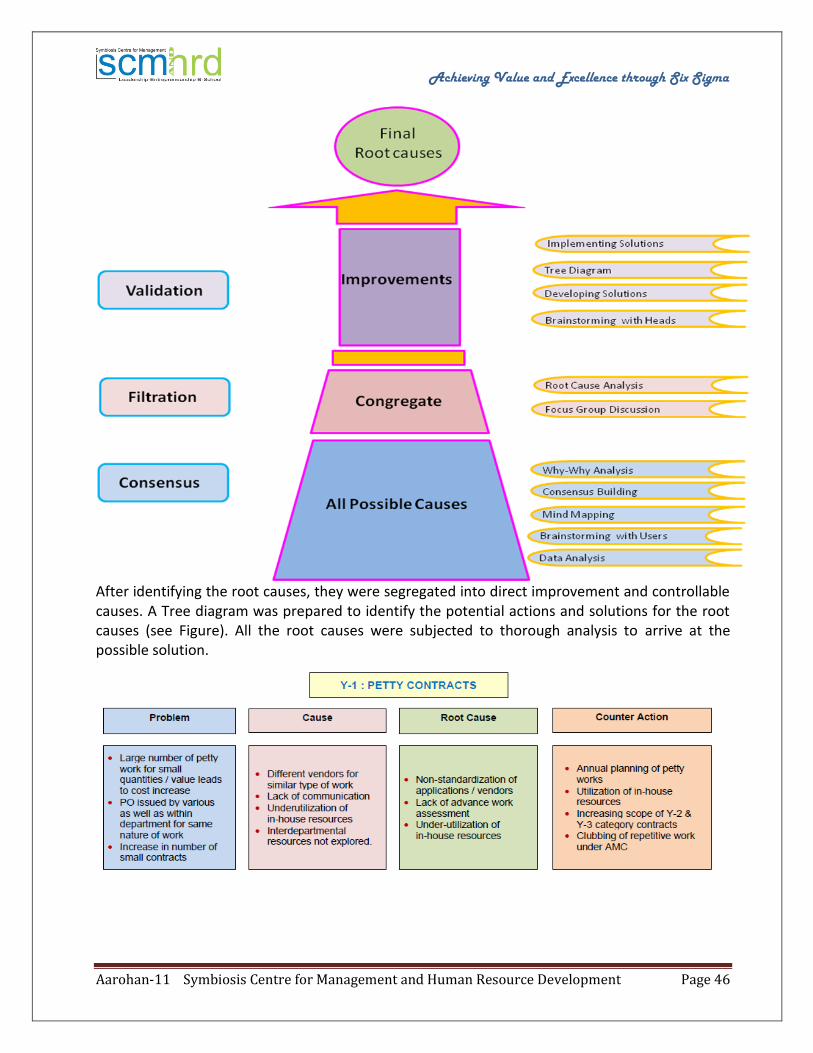
Achieving Value and Excellence through Six Sigma
Aarohan-11 Symbiosis Centre for Management and Human Resource Development Page 46
After identifying the root causes, they were segregated into direct improvement and controllable causes. A Tree diagram was prepared to identify the potential actions and solutions for the root causes (see Figure). All the root causes were subjected to thorough analysis to arrive at the possible solution.
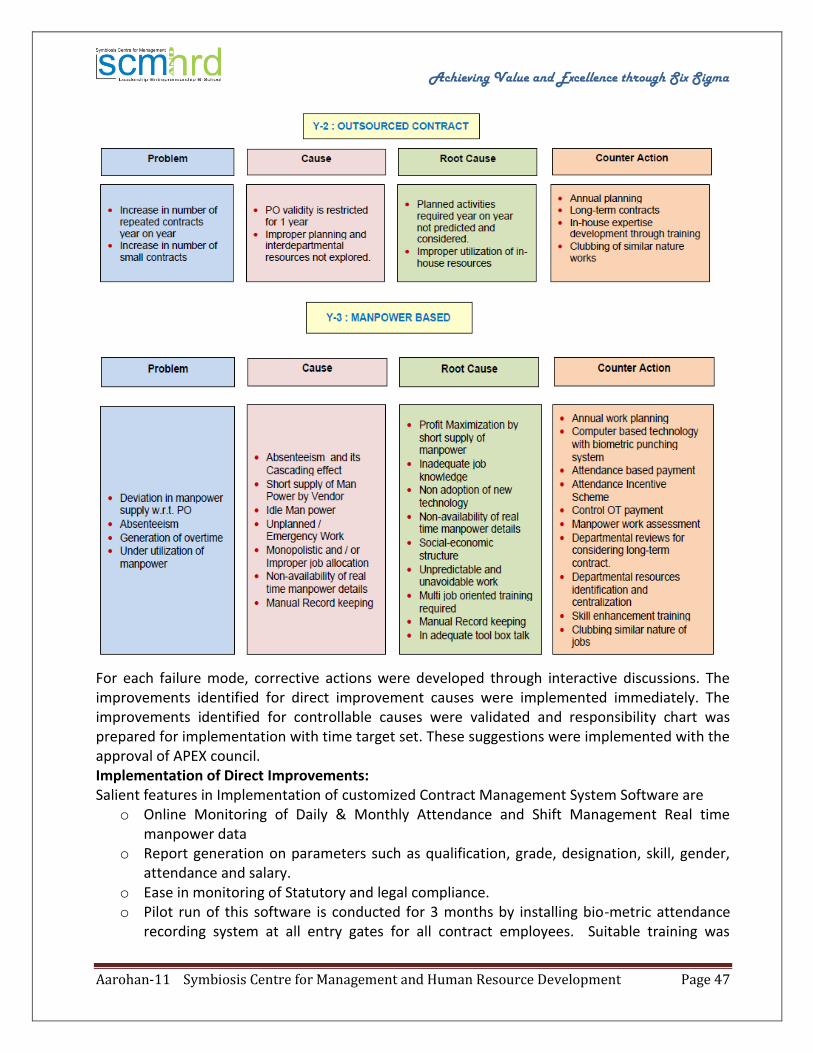
Achieving Value and Excellence through Six Sigma
Aarohan-11 Symbiosis Centre for Management and Human Resource Development Page 47
For each failure mode, corrective actions were developed through interactive discussions. The improvements identified for direct improvement causes were implemented immediately. The improvements identified for controllable causes were validated and responsibility chart was prepared for implementation with time target set. These suggestions were implemented with the approval of APEX council. Implementation of Direct Improvements: Salient features in Implementation of customized Contract Management System Software are
o Online Monitoring of Daily & Monthly Attendance and Shift Management Real time manpower data
o Report generation on parameters such as qualification, grade, designation, skill, gender, attendance and salary.
o Ease in monitoring of Statutory and legal compliance. o Pilot run of this software is conducted for 3 months by installing bio-metric attendance
recording system at all entry gates for all contract employees. Suitable training was
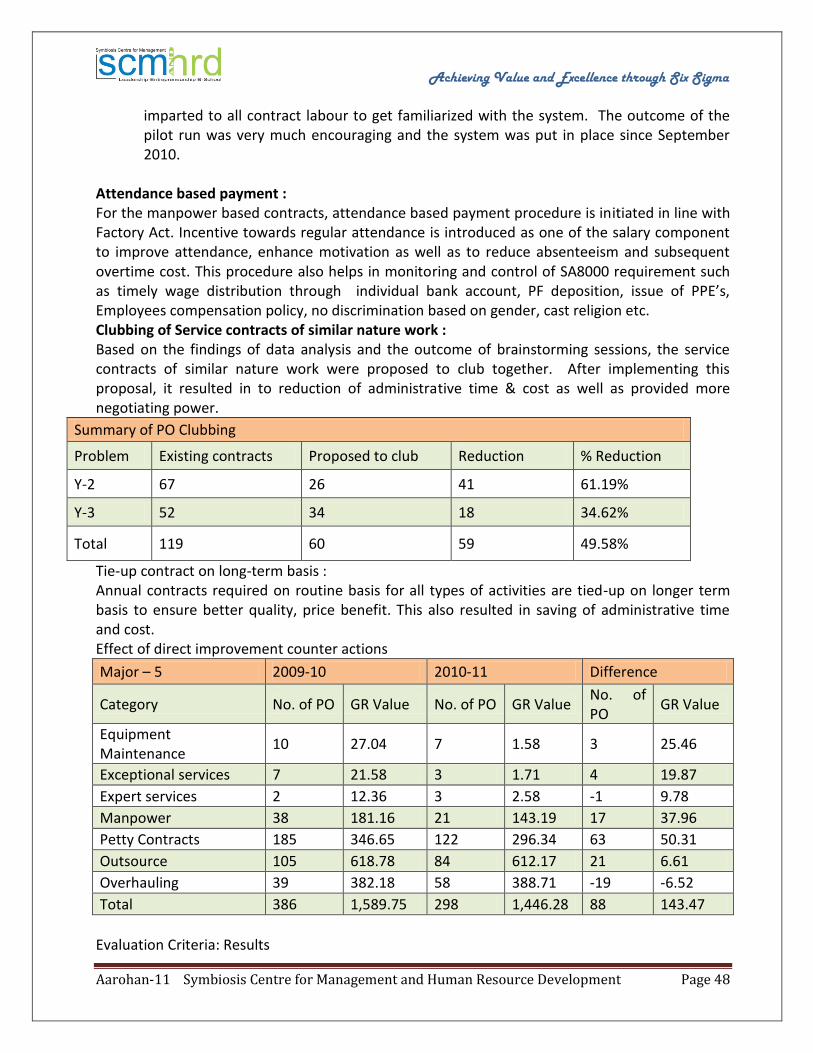
Achieving Value and Excellence through Six Sigma
Aarohan-11 Symbiosis Centre for Management and Human Resource Development Page 48
imparted to all contract labour to get familiarized with the system. The outcome of the pilot run was very much encouraging and the system was put in place since September 2010.
Attendance based payment : For the manpower based contracts, attendance based payment procedure is initiated in line with Factory Act. Incentive towards regular attendance is introduced as one of the salary component to improve attendance, enhance motivation as well as to reduce absenteeism and subsequent overtime cost. This procedure also helps in monitoring and control of SA8000 requirement such as timely wage distribution through individual bank account, PF deposition, issue of PPE’s, Employees compensation policy, no discrimination based on gender, cast religion etc. Clubbing of Service contracts of similar nature work : Based on the findings of data analysis and the outcome of brainstorming sessions, the service contracts of similar nature work were proposed to club together. After implementing this proposal, it resulted in to reduction of administrative time & cost as well as provided more negotiating power.
Summary of PO Clubbing
Problem Existing contracts Proposed to club Reduction % Reduction
Y-2 67 26 41 61.19%
Y-3 52 34 18 34.62%
Total 119 60 59 49.58%
Tie-up contract on long-term basis : Annual contracts required on routine basis for all types of activities are tied-up on longer term basis to ensure better quality, price benefit. This also resulted in saving of administrative time and cost. Effect of direct improvement counter actions
Major – 5 2009-10 2010-11 Difference
Category No. of PO GR Value No. of PO GR Value No. of PO
GR Value
Equipment Maintenance
10 27.04 7 1.58 3 25.46
Exceptional services 7 21.58 3 1.71 4 19.87
Expert services 2 12.36 3 2.58 -1 9.78
Manpower 38 181.16 21 143.19 17 37.96
Petty Contracts 185 346.65 122 296.34 63 50.31
Outsource 105 618.78 84 612.17 21 6.61
Overhauling 39 382.18 58 388.71 -19 -6.52
Total 386 1,589.75 298 1,446.28 88 143.47
Evaluation Criteria: Results
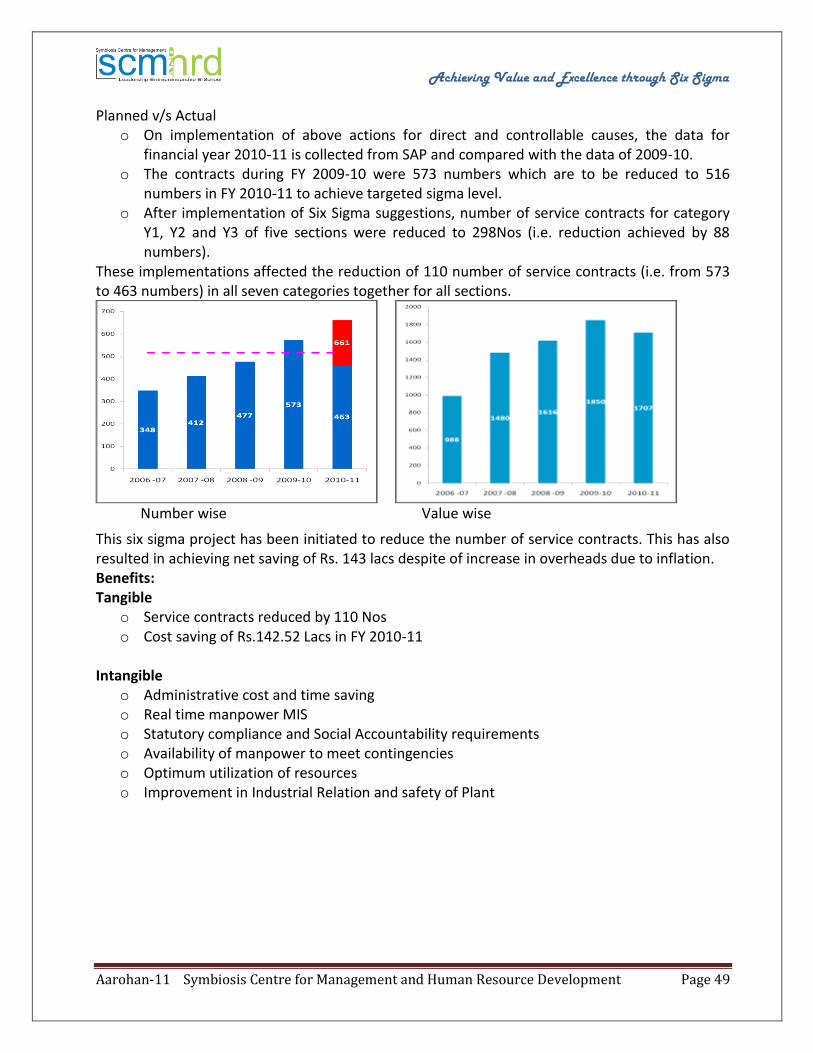
Achieving Value and Excellence through Six Sigma
Aarohan-11 Symbiosis Centre for Management and Human Resource Development Page 49
Planned v/s Actual o On implementation of above actions for direct and controllable causes, the data for
financial year 2010-11 is collected from SAP and compared with the data of 2009-10. o The contracts during FY 2009-10 were 573 numbers which are to be reduced to 516
numbers in FY 2010-11 to achieve targeted sigma level. o After implementation of Six Sigma suggestions, number of service contracts for category
Y1, Y2 and Y3 of five sections were reduced to 298Nos (i.e. reduction achieved by 88 numbers).
These implementations affected the reduction of 110 number of service contracts (i.e. from 573 to 463 numbers) in all seven categories together for all sections.
Number wise Value wise
This six sigma project has been initiated to reduce the number of service contracts. This has also resulted in achieving net saving of Rs. 143 lacs despite of increase in overheads due to inflation. Benefits: Tangible
o Service contracts reduced by 110 Nos o Cost saving of Rs.142.52 Lacs in FY 2010-11
Intangible
o Administrative cost and time saving o Real time manpower MIS o Statutory compliance and Social Accountability requirements o Availability of manpower to meet contingencies o Optimum utilization of resources o Improvement in Industrial Relation and safety of Plant
Achieving Value and Excellence through Six Sigma
Aarohan-11 Symbiosis Centre for Management and Human Resource Development Page 50
Larsen & Toubro, Medical Equipment & Systems
Reduce Crimping Defects in PMS1 Products
At L&T, working towards delivering the best quality at affordable price to our customers, a project to reduce crimping defects was initiated. Although cable forms may not appear as critical components in our complex electronic system, failure to achieve contact may lead to entire system failure. Thus to ensure high quality and reliable cable connection this project was taken. Define: Project charter was used to define the problem and limit scope of the project. Selection of Head-Process Engineering as a champion ensured allocation of required resources and removal of roadblocks. Stakeholder analysis was done to include relevant people as team members. SIPOC was plotted to understand the process and identify key suppliers and inputs. VOC and VOB were collected through interaction with quality, design, production, and Head of Business respectively. CTQ tree was used to identify critical parameters of the process. Measure: Data collection plan was made. Data was collected from reliable sources. Actual failure instances were observed and recorded in the form of pictures. From the failure data collected current sigma value was calculated. Analyze: Possible causes were identified using cause-effect matrix, Gemba investigation was used to confirm the potential causes. Root causes were identified after analysis. Solution selection matrix was used in finalizing a solution for one of the root causes. A DOE was conducted to arrive at best parameters for the crimping process. After ANOVA the best settings were selected. The new settings were tried on a lot of 30 samples. Capability analysis of these 30 samples confirmed the validity of the experimental results. Improve: Training and skill related causes were removed by implementing multi-skill chart system and hence ensuring that only trained people do the required job. New tool was introduced with setting decided by DOE this reduced tool related causes. Introduction of rejection box, weekly production chart, and process status card reduced process related problems. Control: Chi-square test and test of two proportions were used to confirm the improvement. Improved sigma value was calculated and compared against initial and target sigma value. Control plan was implements, which included validation records, DPU charts, training records etc. Total cost saving from this project was Rs. 2, 00,000/-
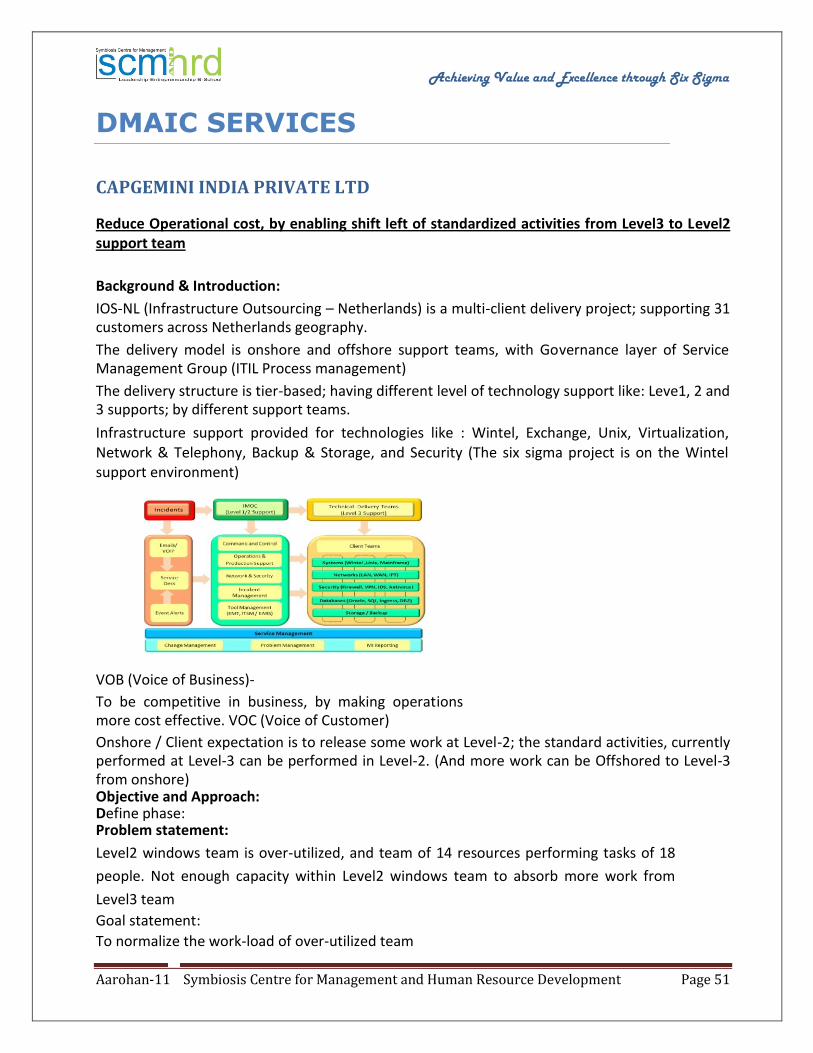
Achieving Value and Excellence through Six Sigma
Aarohan-11 Symbiosis Centre for Management and Human Resource Development Page 51
DMAIC SERVICES
CAPGEMINI INDIA PRIVATE LTD
Reduce Operational cost, by enabling shift left of standardized activities from Level3 to Level2 support team
Background & Introduction: IOS-NL (Infrastructure Outsourcing – Netherlands) is a multi-client delivery project; supporting 31 customers across Netherlands geography. The delivery model is onshore and offshore support teams, with Governance layer of Service Management Group (ITIL Process management) The delivery structure is tier-based; having different level of technology support like: Leve1, 2 and 3 supports; by different support teams. Infrastructure support provided for technologies like : Wintel, Exchange, Unix, Virtualization, Network & Telephony, Backup & Storage, and Security (The six sigma project is on the Wintel support environment) VOB (Voice of Business)- To be competitive in business, by making operations more cost effective. VOC (Voice of Customer) Onshore / Client expectation is to release some work at Level-2; the standard activities, currently performed at Level-3 can be performed in Level-2. (And more work can be Offshored to Level-3 from onshore) Objective and Approach: Define phase: Problem statement: Level2 windows team is over-utilized, and team of 14 resources performing tasks of 18
people. Not enough capacity within Level2 windows team to absorb more work from
Level3 team
Goal statement: To normalize the work-load of over-utilized team

Achieving Value and Excellence through Six Sigma
Aarohan-11 Symbiosis Centre for Management and Human Resource Development Page 52
To release capacity with-in Level2 support team (by 750hrs/month), thus enabling shift left of standard work from Level-3 support team. Measure Phase: Data collection in-terms of Level-2 teams Utilization and Efforts spent in different activities were performed to understand the CTQ’s (Critical To Quality) using Line chart and Bar chart. 2 months (Sep – Oct’10) Average utilization is 96.14%, which is very high to standard 85%. Most time consuming task is ticket based support (approx. 82% of the time is spent in incident solving) Remaining approx.18% is spent on changes, proactive and other operational tasks. The measurement on ticket volume is done using tool Run-chart.
Analyze Phase: FMEA (Failure Mode Effect Analysis) was conducted to analyze the key failure points and their impacts. Further fishbone analysis was performed on the top causes (with high Impact); which could potentially be mitigated by improvement actions, as per the Cost Benefit analysis report. Improve Phase: The focus was to study the process performances in terms of CTQ’s (Critical To Quality) and Implement the Improvement suggestions, analyze compare results after the Improvement implementation, and measure the results using the Staged I_MR chart at each CTQ (Critical To Quality). Control Phase: In this phase the recommended solution was developed and implementation. (I-MR Chart to show the Pre Improvement, During Improvement, and Post Improvement Phases) is attached: Goal versus Achievement checked with help of Hypothesis test. Process capability measured at different phase of project (Pre Improvement, During Improvement, and Post Improvement) using CpK value. Benefits and Value Proposition: Reduction in Tickets : 5555 (Actual 3139 + Child calls 2416) Release of capacity in Level2 windows support team. (994 hours per month; against the targeted
Achieving Value and Excellence through Six Sigma
Aarohan-11 Symbiosis Centre for Management and Human Resource Development Page 53
value of 750 hours per month) No. of FTE (Full Time Employee) efforts saved: 7 Shift left made possible Results converted into financial savings: Tangible savings (3 FTE savings passed to onshore): EUROS 55,440 / year Non Tangible savings (4 FTE workload balanced of over-utilized Level-2 team) : EUROS 52,800 / year Total six sigma project savings : EUROS 108,240 / year (55,440 + 52,800)
Sustainment: The check on the System generated (HPOV) calls will continue; with the Problem management process, and the various teams in the delivery will play their part to keep maintain the ticket volume.
Replications / Recommendations:
With-in Netherlands project - Our vision now is to launch further optimization; as shift-left is also
applicable for other technical domains like Unix; with similar approach the capacity can be
release in the respective Level 2 support teams to absorb more work from Level-3. And Level-3
can get further off shoring of work done from Onshore / Front Office. (The Project is kicked off with Project charter submitted, and estimated benefit of 2.2 FTE capacity release (equi. to savings of EUR 38K p.a)
With other geographies / projects –We conducted a knowledge sharing sessions (as a best
practices) with other geography managers and key people, to take the approach into their areas
to achieve similar improvements and benefits.
iGATE PATNI
Effort Reduction in Test Decision Tree Design
iGATE Patni, the first integrated Technology & Operations (iTOPS) organization in India had a steady climb in the customer’s value chain in terms of penetrating deeper (instead of wider) into customer portfolio. iGATE Patni’s comprehensive portfolio of services includes application development and management, verification & validation, enterprise application solutions, infrastructure management, customer interaction services & business process outsourcing, product engineering services, and business & technology consulting. Independent Verification Validation Group is engaged in end to end testing services for large transformation programs like core banking implementation, data center migration etc., and activities which include defining test strategy, test planning etc. This team is also involved in providing end to end testing services.
Achieving Value and Excellence through Six Sigma
Aarohan-11 Symbiosis Centre for Management and Human Resource Development Page 54
As part of an engagement with a leading Commercial Bank in Canada, multiple projects in different application groups requires the Testing team to gather Application Specification from the Client and depending on the scenarios originating from the Specification, a Fish Bone Diagram (FBD) depicting the scenarios giving a 100% coverage of the particular Application Specification is generated. Test Decision Tree (TDT) is then generated using Mind Maps and test design created. The Effort spent on calculating test cases for estimating effort and effort spent on TDT design was considerably high. Since the TDT is generated manually based on the review findings on FBDs by offshore team and the client. In case of any defects, Test cases would be generated again as per the review comment which contributes to review effectiveness and high rework effort. This Black Belt project using DMAIC methodology was identified as the improvement initiative to address the above. Project charter was created and the milestone plan was reviewed and approved by Sponsor and MBB. After arriving at the problem statement, project CTQ were defined and goal of the project was set. Operational definitions were arrived at and current process capability study was conducted based on the data collected. Solution approach was finalized based on data analysis and addressing causes based on Root Cause Analysis and Prioritization matrix of Xs. As part of the new process, in order to reduce Estimation effort on TDT design, a utility was designed and developed using Groovy script to provide the total number of end nodes in each FBD, which in turn helped on estimating the TDT design effort more accurately. In addition, to address reduction in actual test design effort, an additional utility was developed using VB script which is designed to auto populate most of the entries of the TDT columns like Root requirement, Numbering, Test type, Priority, Complexity, etc., thereby aiming at reducing manual intervention in designing the TDT template, thereby reducing number of review defects and rework effort. For the new process FMEA was conducted and found that Risk Priority Number (RPN) decreased from 54.75 to 3.5. Detailed analysis was conducted on the effectiveness of the proposed utility and the results were proven to be statistically significant through Hypothesis testing. The improvement project resulted in reduction of Test Design Effort by 40%, Test Design Estimation Effort by 90% and reduction of defects to below 3.5/500 test cases from 5.65/500 test cases by end of June.
FIRST SOURCE
Improving Overall Sales Conversion Percentage for Webchat Sales
Firstsource (NSE: FSL, BSE: 532809, Reuters: FISO.BO, Bloomberg: FSOL@IN) is a global provider of BPO (business process outsourcing) services headquartered in India. Firstsource provides customized business process management to global leaders in the Banking & Financial Services, Telecom & Media and Healthcare sectors. Its clients include Fortune 500 Financial Services, Telecommunications and Healthcare companies. Firstsource has a global delivery model with operations in India, US, UK and Philippines. One of the most prominent verticals at Firstsource;
Achieving Value and Excellence through Six Sigma
Aarohan-11 Symbiosis Centre for Management and Human Resource Development Page 55
The Telecom and Media vertical has presence across the US and the UK geographies. With circa 6000 employees and delivery centres in India, UK, Ireland and Philippines, it caters to major players in the telecom and media segments viz Cable and Satellite Television, Fixed Line and Wireless/Mobile Phones and Broadband/Narrowband. Client is one of the leading UK mobile communications group. Webchat sales process was initiated with a scope to increase the incremental sales to deliver an increase in total online sales efficiency. In session sales and Cross session sales are the two major metrics of the process. Lower overall sales conversion % directly impacts the process performance and the online sales efficiency. To take the sales efficiency to a higher level it was imperative to improve the overall sales conversion. The overall sales conversion percentage for the month of Nov ’09 to Mar ’10 was 12.49%. The In session sales conversion was 9.76% & cross session sales conversion was 2.73% for the same period. The projects team identified the project as the clients voiced out their aspiration over several occasions in review meetings to see the delivery centre taking the overall sales conversion to 15%, as the client aspired to achieve the best in class performance for sales conversion. The project team was equally enthusiastic as this would make them the best service provider in the entire estate. DMAIC was a clear choice for the methodology to be used for the project, as the team was undertaking the task of improving the existing process. The Z bench baseline was at (1.25). The team validated the target through One Proportions test. They arrived at the root causes by process mapping, brainstorming, cause and effect diagram and control impact matrix and the use of statistical tool (Spearman’s Rho and Chi Square Tests). The team then developed a comprehensive Solution Tool Kit which targeted at improving the sales conversion followed by a successful implementation of the solutions. The project was instrumental in helping the process achieve the metric successfully and maintaining it for a period of six months. The new Z-Bench was at 1.87. Two proportions test was used for revalidation of the target post completion of the project. To ensure sustenance, Control and monitoring plan was documented and process was standardized to conduct periodic audits to check whether the changed process was rigorously followed. These improvement lead to a client value add of circa GBP 1.02 million. The solution tool kit was replicated in other telecom processes across the organization adding huge customer value by generating additional revenue for clients.
HCL TECHNOLOGIES
Reduce Client Complaints: Online AD Campaign
Our Client is a leading worldwide media company providing integrated marketing solutions
for the Fashion, Life Sciences and Power Sports industries. They are involved in serving
business professionals and consumers in these industries with its portfolio of 91 events, 67
Achieving Value and Excellence through Six Sigma
Aarohan-11 Symbiosis Centre for Management and Human Resource Development Page 56
publications and directories, 150 electronic publications and Web sites, as well as educational
and direct marketing products and services. Our client has approximately 1,000 employees
and currently operates from multiple offices in North America and Europe. HCL has signed up
a deal with this Media Company to provide a range of services; i.e. from design to fulfilment
for their events/ trade shows, print and online publications. They expect HCL to improve the
performance from the current level to best in class while we transition the process from
onshore. HCL has agreed to stringent service level agreements (SLA)..
Define Phase: We developed SIPOC and high level process diagram along with clear time lines
of different stages of the project. CTQ’s are derived from VOC which is collected from external
customers. Identified team members cross functional areas.
Measure Phase: Plotted the trend of Client Complaints since Jan. Process FMEA done to
identify the potential failure mode. The Process Capability at measure stage is at 4.12 (Short
Term Sigma).
Analysis Phase: We followed the correlation study for continuous data of Big Y (Saturn) and
many X’s. Major X’s were identified during the analysis. We followed our hypothesis in
analysis, in which we identified implementation of cell structure in process by splitting
the AD trafficking process as Copy Chasing and AD Trafficking.
Improvement Phase: We started implementing action plan on high priority items derived based
on RPN from FMEA. Process change was implemented and control plans were in place. All the
potential X’s were taken care by our action plan. The complaints followed a declining trend in
April.
Control Phase: We designed control flow process to monitor factors daily. Every day the data is
published aligned these factors as KRA for pro cess SPOCs and continued to circulate dashboard.
Process became much STABLE in end of May and from June we have achieved zero complaints.
Process Sigma
IMPROVED from 4.1 in March 2011 to Zero defects in June 2011
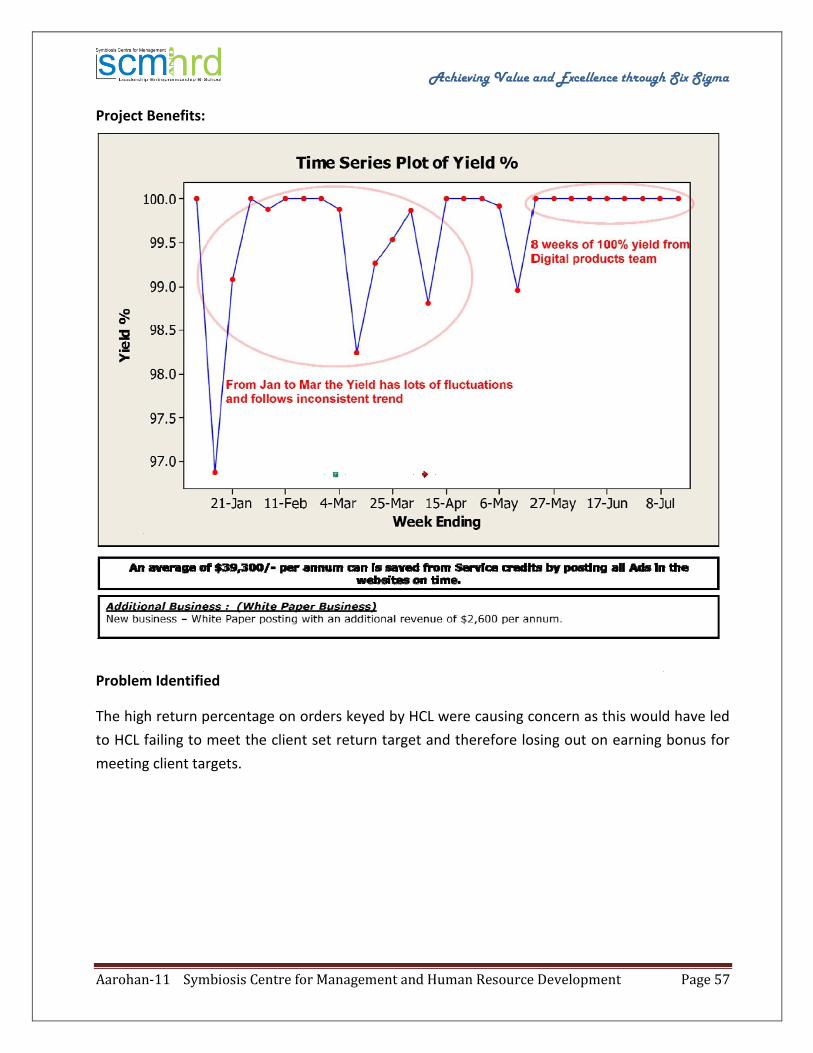
Achieving Value and Excellence through Six Sigma
Aarohan-11 Symbiosis Centre for Management and Human Resource Development Page 57
Project Benefits:
Problem Identified The high return percentage on orders keyed by HCL were causing concern as this would have led
to HCL failing to meet the client set return target and therefore losing out on earning bonus for
meeting client targets.

Achieving Value and Excellence through Six Sigma
Aarohan-11 Symbiosis Centre for Management and Human Resource Development Page 58
STANDARD CHARTERED
First Contact Resolution Improvement in Trade Client Services Group
Business Case Customer Service Group at Scope International, Chennai handles client enquiries pertaining to Trade transactions which are received through e. mails. Enquiries resolved immediately upon receipt, are called Quick kills or Resolved on first contact. Client Services Group global standards require First Contact Resolution rate to be at minimum of 70%, however FCR % for countries supported from CSG, Chennai was always below minimum threshold value of 70%. FCR is a key driver for customer satisfaction.
Define Project Metric: FCR % Problem Statement FCR% for UK and UAE markets for the baseline period of Jan & Feb ’11 was 51% and 67% respectively. This was far below the expectations of CSG Global standards and leading to dis-satisfied customers. Goal Statement Increase FCR % for UK & UAE from 62% to >70% by June 2011. Actions done in Define phase
Voice of customer captured
Customer and Business impact measured,
Current process map prepared
Quick wins identified and implemented Measure
Verification of CTQ Measurement system done and found to be complying to standard procedures
Sigma level calculated for baseline period (0.57 Sigma).
11 Potential causes identified through Brainstorming. Prioritization was done through Cause and Effect Matrix.
Data collection template designed and data was collected for various factors. Analyse Tools used for data analysis Chi-square test, 1P test, Pie Chart, Ishikawa diagram and Why-Why analysis.
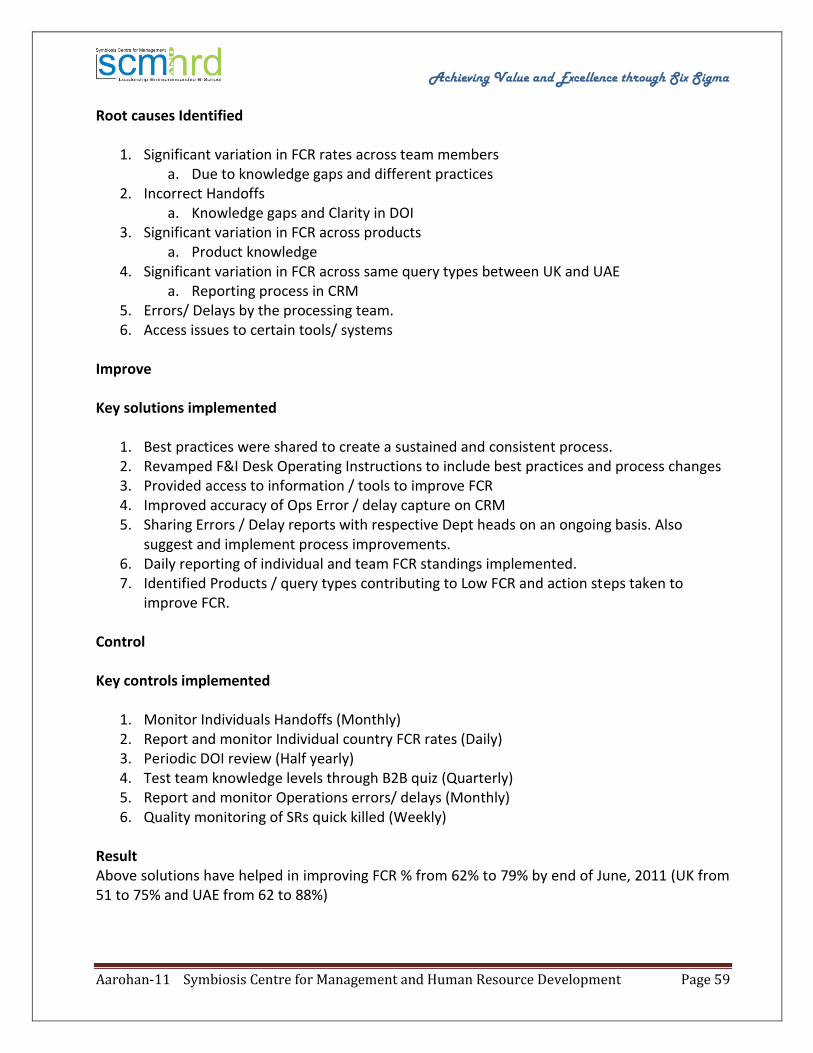
Achieving Value and Excellence through Six Sigma
Aarohan-11 Symbiosis Centre for Management and Human Resource Development Page 59
Root causes Identified
1. Significant variation in FCR rates across team members a. Due to knowledge gaps and different practices
2. Incorrect Handoffs a. Knowledge gaps and Clarity in DOI
3. Significant variation in FCR across products a. Product knowledge
4. Significant variation in FCR across same query types between UK and UAE a. Reporting process in CRM
5. Errors/ Delays by the processing team. 6. Access issues to certain tools/ systems
Improve Key solutions implemented
1. Best practices were shared to create a sustained and consistent process. 2. Revamped F&I Desk Operating Instructions to include best practices and process changes 3. Provided access to information / tools to improve FCR 4. Improved accuracy of Ops Error / delay capture on CRM 5. Sharing Errors / Delay reports with respective Dept heads on an ongoing basis. Also
suggest and implement process improvements. 6. Daily reporting of individual and team FCR standings implemented. 7. Identified Products / query types contributing to Low FCR and action steps taken to
improve FCR. Control Key controls implemented
1. Monitor Individuals Handoffs (Monthly) 2. Report and monitor Individual country FCR rates (Daily) 3. Periodic DOI review (Half yearly) 4. Test team knowledge levels through B2B quiz (Quarterly) 5. Report and monitor Operations errors/ delays (Monthly) 6. Quality monitoring of SRs quick killed (Weekly)
Result Above solutions have helped in improving FCR % from 62% to 79% by end of June, 2011 (UK from 51 to 75% and UAE from 62 to 88%)
Achieving Value and Excellence through Six Sigma
Aarohan-11 Symbiosis Centre for Management and Human Resource Development Page 60
STANDARD CHARTERED
Efficiency Improvement – Cash Clearing Countries
Business Case Clearing refers to the settlement of claims of financial institutions against other financial institutions. Clearing teams in Chennai take care of Clearing and Settlement processes for US, UK, FFT and JP. Processes for all countries are similar; however these teams work in silos. As the processes and systems are the same, there is an opportunity to improve efficiency of these teams. Also it has been noticed that in the initial part of the month, volumes are not high for Japan which is resulting into lower productivity and efficiency. Define Problem Statement Though there is 5% cross-skilling (2 out of 40 staff), during attrition, staff outage/ high volumes there is a stretch by team members to complete BAU as the cross-trained resources do not move across teams to provide BAU support in the impacted teams. This will have direct impact on Productivity of teams. This also increases the risk of disruption in work, missing cut-offs, staff overtime etc. Project Metric: Monthly Productivity % of Cash Clearing teams Goal Statement Baseline: Q1 (Jan-Mar’11) Efficiency for Clearing Teams was 107% Target: Improve Efficiency from 107% to 112% Measure
Current CTQ level measured collecting MIS data of staff indicating their efficiency level across teams, roles and grades (Q1 Data)
Sigma Level calculated for Baseline Period (Q1 2011) – 1.66 Sigma
Hourly volumes data generated for Clearing countries for a month
Current Skill Matrix of Clearing staff developed
Actual and Standard Cycle time comparison

Achieving Value and Excellence through Six Sigma
Aarohan-11 Symbiosis Centre for Management and Human Resource Development Page 61
Analysis Root Cause Analysis Tools used: Ishikawa diagram, Scatter Plot, Multi-Vari Chart, Control Chart, Level Loading Root Causes Identified
Under utilization of teams during specific times of a day
Variation in intra-day volumes
Staff Tenure
Staff grade
Country specific process differences
Differences in Standard and Actual CTs for few activities Improve Key Solutions Implemented
Cross-Skilling
Level Loading
Process Standardization
Change of Std cycle times in Capacity models
Staff Rotation Control
Control charts for monitoring of daily efficiencies
Capacity model validation – Once in 6 months
Cross skill matrix review – Once in 3 months. Threshold – 30%
Result · Increase in Team’s average Efficiency from 107% to 112% · Release of 3 FTE · 50,000 USD saves · Concept paper released on Level Loading and horizontal deployment across other units · Initiation of Part-timers hiring · TAT reduction and FTE saves in other units due to Level loading

Achieving Value and Excellence through Six Sigma
Aarohan-11 Symbiosis Centre for Management and Human Resource Development Page 62
HCL TECHNOLOGIES
Reducing Provisioner Caused Rework
Business Case: Client is a US based Telecom Major. Process deals with circuit designing and placing the order
with Telecom company for a particular product or service as per customer requirement or in
other words it is a Configuration of Hardware (equipments and wiring) and Software
(transmission and network services) services in order to activate telecom services for its
customer. Provisioner caused rework is one of the most important SLA metric of the process,
failing which would lead to reworks & delays, not handing of the circuit to the customer on time,
there by incurring losses to both the client as well as end user. Since, the process is not meeting
the target consistently for this SLA metric, it is utmost essential to develop and deploy a
structured approach in the process to meet the target and sustain it.
Define Phase: Project Charter was used to define the problem and limit scope of the project. We
developed SIPOC and high level process diagram along with clear time lines of different stages of
the project. CTQ’s are derived from VOC and VOB which were collected from both internal and
external customers. Identified team members cross functional areas.
Measure Phase: We arrived at Data Collection Plan with clear definitions of CTQs. Conducted
Brain storming with different groups in batches covering Agents, SME, TL, Ops manager and
support functions. Developed Fish-Bone/ C&E diagram based on brainstorming points. Using
control impact matrix tool causes impacting the most which are controllable were identified.
Process Sigma is at ‘1.99’
Analyze Phase: We followed the Correlation study to gage if there was any correlation between
volume processed and provisioner caused supplements (rework done due to provisioner error).
There was no correlation between volume processed and provisioner caused rework. Root cause
analysis was done on baseline data to find the following:- Top reasons for provisioner caused errors
Contribution of each Stage in reference to provisioner caused errors

Achieving Value and Excellence through Six Sigma
Aarohan-11 Symbiosis Centre for Management and Human Resource Development Page 63
Top contributors for provisioner caused errors Using FMEA based on RNP scores, actions were planned to improve the scores.
Improvement Phase: We started implementing action plan on high priority items derived based
on RPN from FMEA. The critical failure modes were a) Meet Point Orders, b) CFA Format, c)
ECCKT d) Engg. Codes, e) ICSC Code. Few actions taken for improvement a) Macro created to
notify Provisioner for inappropriate usage of rework code via e-mail b) Implementation of rework
code approver form to restrict the inappropriate usage rework code c) Revised training module &
Issue Tracker has been deployed in the process to capture complex / repeated issues and is
shared with the training team to make the new trainees aware of common issues being
experienced on floor. We successfully bridged the process gaps and project targets were met. by
Dec ’10.
Control Phase: We designed control flow process to monitor factors daily. Everyday the Rework
RCA data is published Aligned these factors as KRA for process SPOCs and continued to circulate
dashboard on all above critical factors. Positive impact on other SLA metric -> Cycle time &
Expedites. Process became more STABLE in Mar ‘11 in Control Phase apart from month on month
improvement. Process Sigma IMPROVED from ‘1.99 (OND’ 10) to 2.33 (JFMJ’ 11)
TATA CONSULTANCY SERVICES
To Reduce the Client Reported Billing Error Ratio
PROJECT SUMMARY: TCS carries out a data entry process for a client who is a global market leader in international express, overland transport and air freight. The project is in operation since a year and is in a steady state. The accuracy target of 99.55% was met on a consistent basis. However the 0.45% billing error rate was resulting in a revenue loss for the client to the tune of £209967 per month. Also, in the event that we are successful in reducing the loss, the client would consider business expansion with us by increasing the number of FTEs. To ensure customer delight and expansion of business with them, it was important to reduce the errors in billing fields and hence reduce the revenue loss to the client. A Six Sigma project was under-taken to understand root cause of the errors made in the billing fields & take corrective actions to improve and sustain performance. As part of project target, it
Achieving Value and Excellence through Six Sigma
Aarohan-11 Symbiosis Centre for Management and Human Resource Development Page 64
was decided to reduce billing error % from 0.45% to 0.20% by May 2010. Team went with data collection base-lining; identification of possible causes through cause and effect analysis. Chi-square and ANOVA studies were conducted to establish relationship between various factors contributing to errors. Corrective actions were designed and implemented based on the identified priority level. Ensuring effective implementation of the solutions helped reduce the billing errors from 0.45% to 0.15%, resulting in a savings of 1.6 Million GBP (2.5 Million USD) per annum. The TCS team thus achieved customer satisfaction and created a prospect for more business. PROJECT IDENTIFICATION: To be able to concentrate efforts and bring about improvement in key areas, some of the possible improvement opportunities/projects were listed. These projects were rated on parameters like financial impact to client and TCS, operational efficiency and impact on SLAs. This project scored high hence indicating that it was a priority and was crucial. PROBLEM STATEMENT: For the period Dec’09-Feb’10 billing error percentage was at 0.45% of the volume processed by TCS team which has resulted average revenue loss of £209967 per month to the client. This is a huge value loss as per client & has lead to customer dissatisfaction. All billing errors committed during the data entry process (receiving scanned images to manifestation) are considered in-scope. However errors on manifestation fields (non-billing) will be out-of-scope for this project. Data on billing errors sent by the client was collected for a period of 3 months. BASE MEASUREMENT: As - Is process consists of client on-site team scanning images and sending the same to TCS. Associate accesses and analyzes the scanned images. The information is then manifested on the client system. The manifested images are saved and shipment is completed. These are then used by the client to bill their end customer post checking accuracy of transactions. Applications processed by TCS are reviewed by Client and audited for accuracy. Client then provides feedback on the erroneous transactions. Thus, Billing Error % = (Count of billing error received from client / Count of volume processed by TCS) * 100. Data for errors done in the billing fields was collected for 3 months and checked for special causes by use of run chart. No special causes were observed and process was stable. Baseline data showed no special causes, data was normal, mean 0.45%, and process sigma of 4.11. Data was collected on various stratification aspects: billing field wise errors, shift wise errors associate wise errors, service station wise errors, errors from various shipment types and AWB types. ROOT CAUSE DIAGNOSTICS: Fishbone Diagram was used to brainstorm and identify all possible causes for higher number of billing errors (displayed in the presentation).Cross functional team comprising of operations, process quality & process excellence brainstormed to identify these possible causes. Pareto analysis was done to identify the top opportunities in the X’s outlined (Please refer to the presentation for details). ANOVA, Regression and Chi-Square were done to study of the impact of potential X’s on Y (Details in the presentation) REMEDIAL ACTIONS:
Achieving Value and Excellence through Six Sigma
Aarohan-11 Symbiosis Centre for Management and Human Resource Development Page 65
Brain storming was used to come up with solutions for the Xs identified. The solutions were prioritized based on the control impact matrix. Solutions were rated on high or low impact levels and in terms of in-control or out-of-control. Changes were made to the existing internal processes/methodologies, SLAs were redefined, and a detailed quality plan was implemented as part of the solutions. SOLUTIONS DEPLOYMENT:
Detailed implementation plan prepared & weekly reviews conducted to ensure smooth implementation.
Implementation of the solutions was monitored closely and 2 –Sample T-Test was used to observe the impact post implementation. Process sigma level increased from 4.11 to 4.46
SUSTENANCE OF GAINS: Control Plan was put in place clearly defining Measure, Frequency and Responsibility. Team has already replicated some of innovative solutions in other similar processes with same client BENEFITS REALIZED: Tangible:
1. Savings of 1.6 Million GBP (2.5 Million USD) per annum for the client 2. Savings per annum is 2.7 times of revenue earned by TCS 3. Savings of 0.5 Million USD achieved by implementing solutions in similar processes
Intangible: 1. Reduction in loss resulted in client satisfaction 2. This also resulted in increased prospect of business expansion as client’s confidence with
the TCS team got stronger.
SYNTEL INC
Utilization Improvement in Asset Management
Project Summary ORGANIZATION GOAL: Syntel’s goal is to be a $1 Billion Corporation with a market capitalization of $5 Billion by the year 2010 by creating new opportunities for our clients by harnessing our passion, talent, and innovation as stated in the Syntel’s mission. PROJECT LINKAGE TO GOAL: The projected growth would be achieved by innovative uses of technology and operating the businesses of our global 2000 clients more efficiently which will help them remain at the forefront of their industries. The submitted project is once such high impact & high visibility initiative, which has been the path breaker to harnessing the potential of our people for our organization wide LEAN SS Transformation drive. Focusing on effective utilization is the need of this hour with direct impacts to our bottom line, customer delight & effective work life balance for our people. SCOPE IDENTIFICATION:

Achieving Value and Excellence through Six Sigma
Aarohan-11 Symbiosis Centre for Management and Human Resource Development Page 66
Syntel has followed a very structured approach to identify potential areas for utilization improvement. Teams conducted time and motion studies to find out the current utilization levels. Using Lean tools like “Value Stream Maps” & “Time Value Maps” team identified the opportunities across end to end operations of Asset Management. POTENTIAL CAUSES: Identified areas were drilled to locate the potential causes through rigorous brainstorming sessions. Team effectively used fishbone diagram, 5 why analysis & affinity diagrams to come up with root causes. Further these root causes were validated methods like FMEA (Failure modes and effects analysis) and Rating techniques. SOLUTION DESIGN: Validated root causes comprised of diverse categories like people, process and technology. Depending upon the category root cause belongs to, team applied varied concepts to identify relevant solutions. These include SIPOC drill down, competence mapping, float identification, application process matrix & cost benefit analysis. PRIORITIZATION & IMPLEMENTATION: Proposed solutions were then prioritized using solution impact matrix, feasibility study and cost benefit analysis. Once team narrowed down on prioritized solutions, these were implemented on pilot basis. This implementation was predominantly done in three phases based on the term of implementation for respective solutions (Phase 1: < 1 month, Phase 2: 1 to 2 months, and Phase 3: > 2 months) BENEFITS: Based on the effectiveness and impact in pilot phase, the horizon of implementation of these solutions were decided and replicated across the functions. Post implementation, benefits were quantified as follows -
1. Resource Utilization Improved from 79% to 97% 2. Paper Savings of ~2,400,000, equivalent of 287 trees 3. Improved Resource Capacity equivalent of 92 FTEs 4. Scaled up Business : 1248 Accounts, 3142 Funds 5. Annual Saving of $1943 K
TATA CONSULTANCY SERVICES
Improving Session Completion Rates
Background: TCS has been involved with a leading enterprise software maker (customer) in providing services which are part of the annual maintenance contracts with its clients. Post product purchase, clients who enter into annual maintenance contracts with the customer are provided regular upgrades, software maintenance services, defect resolution services, system performance services etc. The maintenance contracts entered by the clients with the customer run into

Achieving Value and Excellence through Six Sigma
Aarohan-11 Symbiosis Centre for Management and Human Resource Development Page 67
millions of dollars and are multi-year deals. The clients book the maintenance services with the customer maintenance team. This is referred to as a ‘session’. The maintenance team then passes on this information to the TCS team. The checks have to be performed by the TCS team before a scheduled date which is referred to as the ‘session date’. Once the checks are completed successfully, the sessions are marked as ‘complete’. The senior consultants from the customer maintenance team perform additional validation activities post which the up gradation or go live of the systems happens. In case the checks are not completed successfully (either because of controllable or uncontrollable reasons), the sessions are rescheduled. Problem Statement: The customer maintenance team has raised a concern that the reduced weekly “completion rates” have resulted in sub optimal capacity utilization in the customers maintenance team. The session completion rate for Jan – Jul 2010 is at 56.74% and does not meet customer expectations. Goal Statement: The goal for the project was to improve the session completion rate from 57% to 70% by January 2011. Analysis and Improvement: The team assessed the current process capabilities with respect to the completion rate and found that it was at -0.21. Brainstorming sessions were done to identify the potential causes. The causes were prioritized based on the impact using the Control Impact Matrix. Post data collection for the high impact causes, a detailed analysis was done to check their relation to the completion rate. Delay in sending pre step mails, Group Level differences and Lack of motivation were identified as significant causes. Brainstorming sessions were conducted to identify plausible solutions and they were prioritized using the alternate selection matrix. The alternate selection matrix allowed for the solutions to be assessed against sigma impact, time impact and cost benefit impact. The top solutions for each of the causes were implemented. Automatic generation of report highlighting pre step mail delays and sessions due for completion and institution of ‘Reward & Recognition’ mechanism were done as part of solution implementation. In addition to this, suggestions provided by the TCS team were implemented by the customer maintenance team. The improvements in the process capabilities were monitored for a three month period. It was found that the post project completion rate showed significant improvement over the pre project completion rate. The post project completion rate was at 62.15%. This improvement was brought about by the reduction in the controllable reschedules by 42% (12.38% to 6.77%). The process capability with respect to the completion rate was now at 0.49. Benefits Realized:
1. $353K savings identified as a result of the project 2. increased customer satisfaction resulting in retention of customers on Enterprise Support

Achieving Value and Excellence through Six Sigma
Aarohan-11 Symbiosis Centre for Management and Human Resource Development Page 68
3. Increased service revenue for customer due to greater adoption of Enterprise Support Intangible
RELIANCE INDUSTRIES LTD
Improving Health Of Diabetic Cases
Introduction: Business Case: At present there are 186 number of known Diabetics cases in RIL-NMD. Most of them are having high sugar level while some of them having complications. Due to this they are prone to heart attack, stroke, pneumonia, renal diseases ,Eye diseases or they were going to have surgery. By controlling these diabetic status the morbidity and complications can be avoided and ultimately productivity will increase. Define: To decide no of samples, following activities are done
1. Awareness session for all residences explaining the scope of project. Participation for project kept as voluntarily.
2. RIL management supported by bearing 50 % expenses for lab investigations. Total >200 residents attended the session Self declaration form got filled up from participation. for participation in project
Total 93 cases registered for the project. Base data calculation done on the basis of Fasting Blood sugar and10 elements of parametric score(Exercise, BMI,BP,S & d, FBS, Trigyceride,HDL level, HBA 1c,Renal involvement, serum creatine, albumin urea, retinopathy, and macro eagiopathy/Neuropathy)all 93 participants tested for above and score sheet for individual is prepared based on normal and abnormal levels CTQ decided as
1. Fasting Glucose level range( present level 90 to 315mgdl ) 2. 10 element Score (present range( 1 to 59 )
Goal Statement:- To reduce HB1Ac below 8% & improvements in parameters score by 10% by Feb 2011 Accordingly SICOP chart is prepared Measure: All the above participant’s FBS, PPBS, monitored monthly, and test related to 10 element scores done quarterly. And data is recorded. The blood analyser measurement variations controlled by calibration. Lab is certified by NABL. Analyse: Brain storming was done and Fish bone diagram was prepared. Causes analysed further and necessary action was recommended .the baseline capability Analysis was carried out for FBS & scores and was found to be -0.18 & -0.23 respectively and PPM was 594495.
Achieving Value and Excellence through Six Sigma
Aarohan-11 Symbiosis Centre for Management and Human Resource Development Page 69
Improve: Following steps taken for improvement
1. Awareness session on diabetes - arranged for diabetic patients as part of six Sigma project 2. Awareness sessions on “Diabetes & Health "By Diabetologist Mrs.Samudra 3. Diabetes screening camp for retinopathy /eye tastings 4. Cardiac Screening camp for cardiac health of diabetic patients 5. Awareness sessions on Life style & Diabetes by Dr.Vishal Gupta 6. Daily Heath tips to customer on their mobile & on intranet system 7. Six Awareness sessions on food & health by Dr.Mrs. Sanchita, Dietician 8. SMS Reminder on mobile 9. Date of birth aligned with date of testing, follow up for easy remember 10. Continuous counseling by treating doctor 11. Change of treatment as required 12. Control:& Benefits 13. Improved Capacity enhancement was established and 14. Sigma level improved
For FBS. From 1.32 to 1.82
For score from 1.27 to 2.5
For Hb1Ac from 0.67 to 1.5
PPM reduced from 800000 to 50000 (Hb1Ac)
Actual average FBS reduced from 157 mgdl to 136 as against set target of 140 mgdl
Deliverables: It has been recorded that SM grade production has reduced. Control plan is in place. Tools & Techniques: SIPOC, Brainstorming, Fish bone diagram, Pareto analysis. Control chart.Box Plot, capability analysis, Impact of the project on Business: Increasing productivity due to fitness. Road Blocks & their mitigation: Convincing patients for blood test and regular exercise, diet control Forward Path: This is not an end, we will strive to achieve benchmark in FBs i.e 110 Mgdl, improvement in HDL levels, BMI reduction etc. Journey will continue.
TATA CONSULTANCY SERVICES
Improvement in Average Accuracy Rate
PROJECT SUMMARY: A specialized leverage team in TCS carries out Inter area Order entry transactions for a client who is a global market leader in Chemical industry. These services are rendered to meet the

Achieving Value and Excellence through Six Sigma
Aarohan-11 Symbiosis Centre for Management and Human Resource Development Page 70
requirements of the internal customers of the client. Orders are sourced from different regions and are imported into Europe, India, Bangladesh and Pakistan. This team coordinates the initial Product, Order Handling and follow-up during In-transit until material has arrived at the customer site. The project is in operation since 2 years however there were certain issues / complaints around order entry accuracy. The accuracy was averaging at 94.17 % which was low as per customer’s expectations. This resulted in cost incurred to the company in form of demurrage charges, freight charges on returns / diversions, extra freight for delivering material by Air due to delays and due to incorrect expected delivery dates. By reducing the error rate through this Six Sigma project, revenue loss to the client drastically reduced by 81% and this also helped in generating opportunity for absorbing additional business to the team (TCS). A Six Sigma project was under-taken to identify the root causes of the errors made in order entry fields & accordingly take corrective actions to improve and sustain performance. Customer expectation on accuracy % was 97%, while the process performance in the baseline was 94.17%.The project target was to achieve 97 % by Sept 2010. A series of quality tools and methods were used to carry out this project using the DMAIC methodology. As-IS Process Map was created to identify the gaps, NVA’s and other areas of improvement. All possible/potential causes were identified through cause and effect analysis, FMEA, issue-tree and Pareto which was then prioritized using the C&E Matrix. Statistical analysis was done on the shortlisted X’s where Chi-square studies were conducted to establish relationship between various factors contributing to errors and thereby derive to the validated Xs. Corrective actions were designed and implemented based on the identified priority level. Effective implementation of the solutions helped improve the order entry accuracy from 94.17% to 99.07%, resulting in customer satisfaction by reducing wrong shipments, avoiding additional supply chain costs and consequentially had a financial impact saving of 13,919 USD per annum over last year. This TCS team thus created opportunity for taking additional work and created a prospect for more business. PROJECT IDENTIFICATION: A sudden increase in customer complaints was observed which resulted in few escalations even getting highlighted to higher Management and heavy loss incurred to the Client. This was raised as a critical issue by the Client and there was urgency to re look at the process and streamline the same through process improvement. PROBLEM STATEMENT: Based on the data for the period Jan’10 – Apr’10 at Customer Service- Interarea process, the accuracy % has been averaging at 94.17%. This has resulted in cost incurred to the client due to errors made in Order entry. However, the client expects to zero down the complaints and perform at 97% accuracy. All order entries done for Open order, Letter of Credit, Bulk and Sample across regions forms a part of the process scope. However, communication errors are not part of the project scope as this does not form a part of order entry field. BASE MEASUREMENT: As - Is process consists of customer facing CSR(Customer Sales Representative) who sends the order entry requests(Open Order/Letter of Credit) for various regions through mail to Inter-area team. Associate then verifies the documents/request received and seeks clarification if any. Few
Achieving Value and Excellence through Six Sigma
Aarohan-11 Symbiosis Centre for Management and Human Resource Development Page 71
order entry fields like GMID no. / Quantity is validated with planners/ CSR’s if required and the same is entered in client application - SAP using Order templates. There are certain business exceptions which need to be followed during order entry for certain regions. Post order entry, the associate is required to do timely follow up with the respective sources like Logistics, Planners, and Credit Manager till such time the goods are delivered to the customer. In case of any errors found in Order entered by TCS, the same is sent across on monthly basis by the Client, highlighting the fields where error have occurred. Accuracy % = 100 - Defect rate, where the defect rate is calculated as No. of orders reported as defectives as per Order Entry month / Total no of Order entry requests entered in the Order entry month. Base lining was done for order entry accuracy post collecting 4 months data on count of errors. As the data was non-normal, process sigma was calculated for Attribute/Non normal data which came to 3.07. Data was collected and analysis of the errors was done on various stratification aspects:
Order entry field
Region
Business
Associate level
Experience in the system
Order stage
ROOT CAUSE DIAGNOSTICS: Cross functional team comprising of Operations, SME, Quality auditors and process excellence was formed for brainstorming to identify the possible causes. Fishbone Diagram was used to identify all possible causes for low Accuracy rate and through FMEA all potential high risks associated to the process was captured. Cause and effect Matrix was then used to prioritize and shortlist these X’s. Chi-Square test was used to study the impact of potential X’s on Y (Details in the presentation) REMEDIAL ACTIONS: Action plan was put in place for process steps with high risks identified through FMEA. Brain storming was done to come up with solutions for the Xs identified. The solutions were prioritized based on the control impact matrix, where solutions were rated on high or low impact levels and ease of implementation. The changes were made to the existing internal processes/methodologies, standard procedures were set post sign off from SME/Client, and a thorough quality check mechanism was introduced as part of the solutions along with proposed training plan for new joiners. SOLUTIONS DEPLOYMENT: Detailed implementation plan prepared & weekly reviews with project team were conducted to ensure smooth implementation and observe the progress of the project. Implementation of the solutions was monitored closely and clear responsibilities were defined for project team members to observe the impact post implementation. Process sigma level increased from 3.07 to 3.86. SUSTENANCE OF GAINS:
Achieving Value and Excellence through Six Sigma
Aarohan-11 Symbiosis Centre for Management and Human Resource Development Page 72
Control Plan was put in place clearly defining Measure, Frequency and Responsibility. Control charts were prepared to monitor the performance closely and ensure that the process stays in control. Team has already replicated some of the solutions in other similar Order entry processes with same client. BENEFITS REALIZED: Tangible • Savings of USD 13,919/- per annum for the client Intangible • Reduction in cost by 81%. • Opportunity for future prospect of business expansion as client’s confidence with the TCS got stronger.
APOLLO MUNICH HEALTH INSURANCE COMPANY LIMITED
Mission Badhautri – “Increasing the % Claims closed within TAT” Project Selection: Top management of AMHI ensures that customer requirements are determined and fulfilled with the aim of enhancing customer satisfaction. Specific focus is on:On time delivery of policy and claim disbursements. Further, the industry processes have become stagnant & this is reflecting in the C-Sat scores. The providers are not providing any further discounts citing delay in payments in settling the claims raised with the insurer. VOC taken from C-Sat survey reflects: “All requirements should be stated at once, the queries need to be asked in one go”, “As a private insurance player, we expect you to take less than a month in processing claims”, “I’ve not received my claim cheque, just dispatching does not absolve you of your responsibilities” etc. To ensure all three objectives are met, we propose to take up this project Impact:
Customer impact. Business Impact.
Reduction in TAT & quick receipt of claim
amount
C-Sat Score improvement
Standardized & reduced queries, if any raised &
cleared in one go
Ina better position to bargain for higher
Service Providers Discount
Insurer living upto its promise of being there at
the time of need
Work / Process Efficiency will increase
from present -2.76 to 2.10 Sigma.
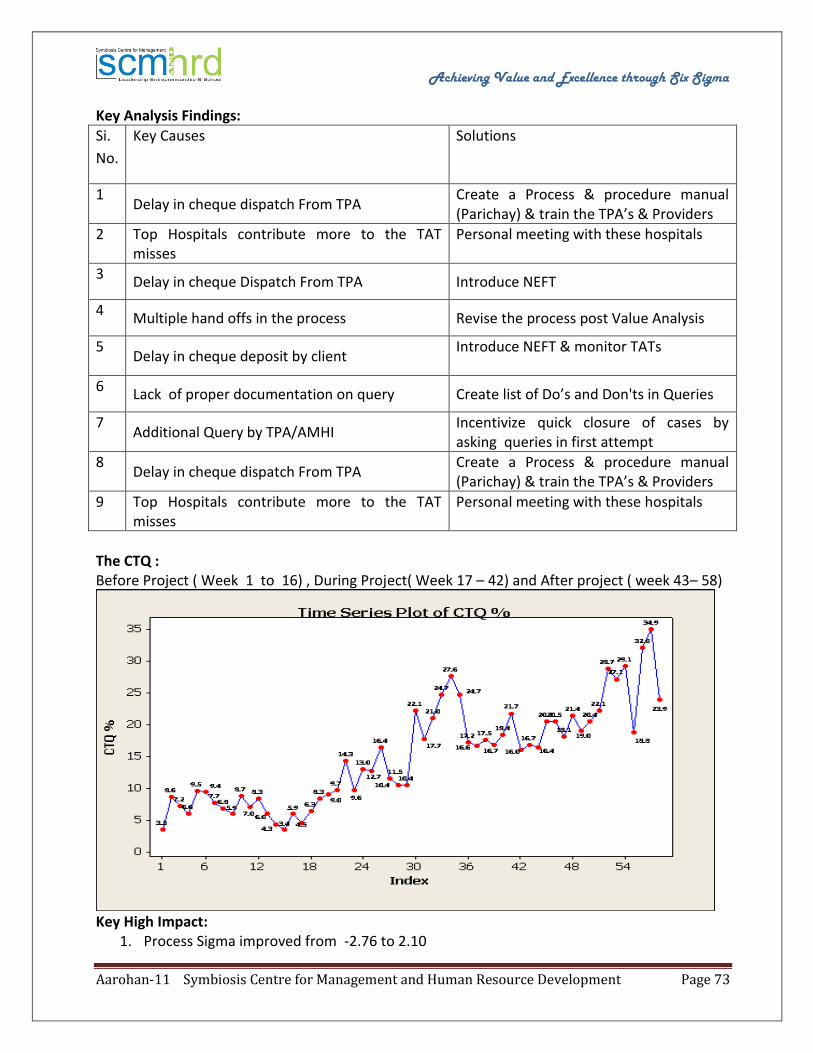
Achieving Value and Excellence through Six Sigma
Aarohan-11 Symbiosis Centre for Management and Human Resource Development Page 73
Key Analysis Findings:
Si.
No.
Key Causes Solutions
1 Delay in cheque dispatch From TPA
Create a Process & procedure manual (Parichay) & train the TPA’s & Providers
2 Top Hospitals contribute more to the TAT misses
Personal meeting with these hospitals
3 Delay in cheque Dispatch From TPA Introduce NEFT
4 Multiple hand offs in the process Revise the process post Value Analysis
5 Delay in cheque deposit by client
Introduce NEFT & monitor TATs
6 Lack of proper documentation on query Create list of Do’s and Don'ts in Queries
7 Additional Query by TPA/AMHI
Incentivize quick closure of cases by asking queries in first attempt
8 Delay in cheque dispatch From TPA
Create a Process & procedure manual (Parichay) & train the TPA’s & Providers
9 Top Hospitals contribute more to the TAT misses
Personal meeting with these hospitals
The CTQ : Before Project ( Week 1 to 16) , During Project( Week 17 – 42) and After project ( week 43– 58)
Key High Impact:
1. Process Sigma improved from -2.76 to 2.10
Achieving Value and Excellence through Six Sigma
Aarohan-11 Symbiosis Centre for Management and Human Resource Development Page 74
2. CTQ improved from 6.729 % to 23.9%, against a target of 15% as of Jun, 2011. Benefits:
1. Net Financial Saving of Rs 89.00 Lakhs 2. C-Sat Score zoomed from 74% to 94%
Key Highlights of the project:
1. Strategic alignment with Business goals 2. Deviation from the traditional concept of “my ownership ends at..” 3. Customer – the ultimate beneficiary 4. All intermediaries involved in implementation 5. Financial benefit to AMHI 6. Best in class services, as per independent ET report 7. Two projects triggered from the closure report of this project
CORELOGIC
Increase Pre-sale Work Orders Compliance (TAT) Percentage in FS P&P Maintenance Results Business Case: Field Services (FS), is a function which provides services for maintenance of property for various clients. The documents related to property maintenance would be submitted by field representatives, who will conduct physical activities of Inspection & maintenance of property. These results will be checked by CoreLogic India- FS team for correctness as per client guidelines & submit final results to client with in TAT of 9 business days from the request date. If compliance of TAT is not met for consecutive 2 months, there will be a penalty by the client to CoreLogic. Hence meeting compliance is very critical for business & to improve customer satisfaction. Problem Statement: 5 months Average was 88%, which is low as per the client’s requirement of 90% hence, it is effecting on Client satisfaction and SLA rating. Goal Statement: Increase compliance percentage from 88 % to 95% in 5 months. Root cause identified: Delay in Vendor Submission: Vendor submits the order on or after the 6th day, causing delay in the processing the order in time at FICH. Vendor submits the order with incorrect or insufficient information after the 6th day. Delay in FIC Submission due to RTV(Return to Vendor):
o RTV’s were multiple times , as not submission of the required information by Vendor o Not able to process all received orders in the same shift due to which few orders are
getting forwarded to next shift.
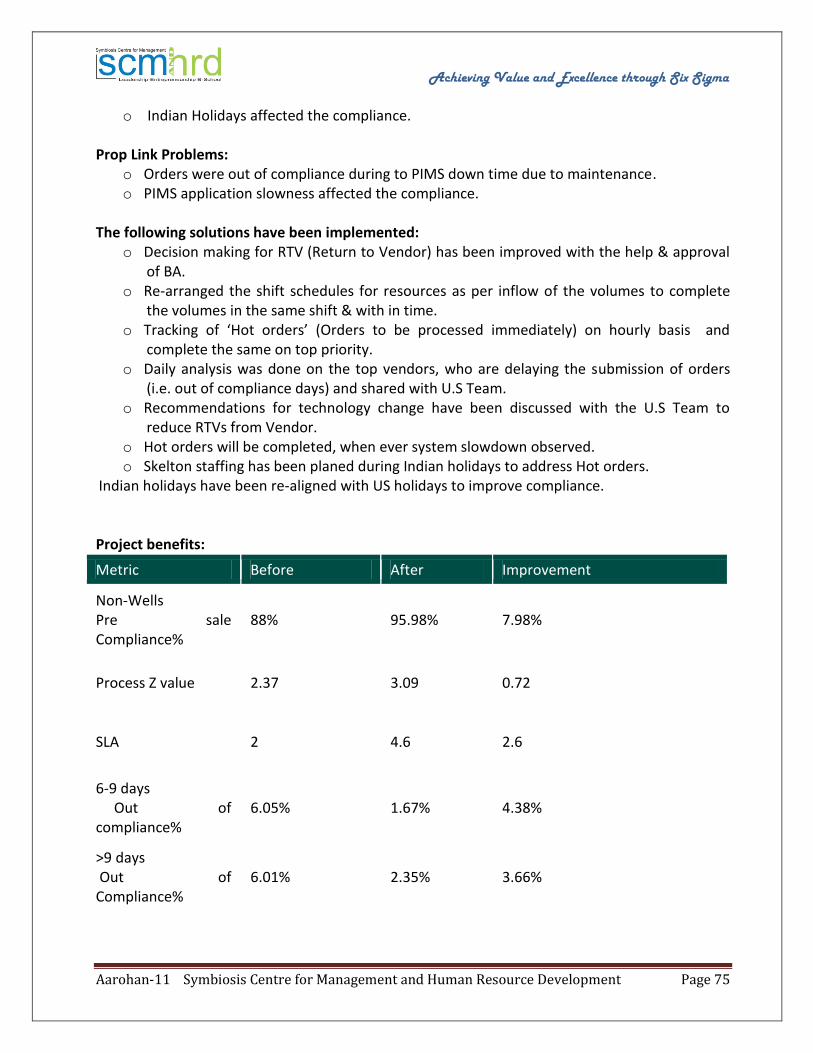
Achieving Value and Excellence through Six Sigma
Aarohan-11 Symbiosis Centre for Management and Human Resource Development Page 75
o Indian Holidays affected the compliance. Prop Link Problems:
o Orders were out of compliance during to PIMS down time due to maintenance. o PIMS application slowness affected the compliance.
The following solutions have been implemented:
o Decision making for RTV (Return to Vendor) has been improved with the help & approval of BA.
o Re-arranged the shift schedules for resources as per inflow of the volumes to complete the volumes in the same shift & with in time.
o Tracking of ‘Hot orders’ (Orders to be processed immediately) on hourly basis and complete the same on top priority.
o Daily analysis was done on the top vendors, who are delaying the submission of orders (i.e. out of compliance days) and shared with U.S Team.
o Recommendations for technology change have been discussed with the U.S Team to reduce RTVs from Vendor.
o Hot orders will be completed, when ever system slowdown observed. o Skelton staffing has been planed during Indian holidays to address Hot orders.
Indian holidays have been re-aligned with US holidays to improve compliance. Project benefits:
Metric Before After Improvement
Non-Wells Pre sale Compliance%
88% 95.98% 7.98%
Process Z value 2.37 3.09 0.72
SLA 2 4.6 2.6
6-9 days Out of compliance%
6.05% 1.67% 4.38%
>9 days Out of Compliance%
6.01% 2.35% 3.66%

Achieving Value and Excellence through Six Sigma
Aarohan-11 Symbiosis Centre for Management and Human Resource Development Page 76
Penalty 15% * (for GMAC Client)
Rs 86,53,698 (calculated-May09)
No Penalty Saving of Rs.86,53,698
Compliance Trend:
EXL SERVICE
Invoice To Pay Cycle Time Reduction
In the year 2010, the Accounts Payable process at EXL service encountered a breakdown in internal process controls as a result of high cycle time which was at 35 days. This resulted in a rush environment leading to making payments to incorrect vendors, non-payment of approved invoices and delayed payments. There was an urgent business need to improve cycle time, thereby increasing the on time payment rate, identify newer process controls to prevent invoice and payment errors and identify potential improvements including the application of relevant best practices. The key stakeholders from the Client and EXL service decided to deploy Lean Six Sigma project to improve the overall cycle time. This project was perfectly aligned to the strategic imperative of the business. The goal of the project was to reduce the pay cycle time by 28% within 5 months. The project started in Oct 2010 and closed on Mar, 2011. Thereafter, the primary metric (Invoice to pay cycle time) was monitored to ensure sustenance of improvement achieved. Root cause analysis performed during DMAIC journey helped identify the most significant causes for high cycle time. The key root causes identified were:
o Invoices sent to other department like marketing, ops take longer to get scanned o Invoices sent through snail mail or hand delivered takes longer to get scanned o Invoices put on hold (for resolution) takes longer to pay than invoices not put on hold.
Achieving Value and Excellence through Six Sigma
Aarohan-11 Symbiosis Centre for Management and Human Resource Development Page 77
o Errors committed during invoice creation results in delay o Vendor maintenance/creation, delays the process of invoice creation
The team then brainstormed to determine potential solutions for each of the verified root causes. Focused efforts resulted in Accounts payable group move from “reactive” mode to “proactive” mode. This was accomplished by the implementation of the following:
o Implementation of centralized receipt of all invoices o Encouraging all freight vendors to send their invoices in electronic format o Improving the exception process by establishing service levels for exception resolution o Implementation workflow solution to handle exceptions o Inactivating the duplicate vendors to avoid duplicate invoice processing / payments. o Perform vendor master clean up to correct default pay groups for all vendors. o Standardize/Rationalize payment terms
Post implementation, an effective control plan was put in place to ensure sustenance of improvements. This six sigma project resulted in the following benefits:
o Cash flow benefit of $ 15MM (million) due to rationalization of payments terms o Reduction of cycle time by 40% o Improvement in on time payments by 24% o Reduction in errors by 15%.
EXL SERVICE
Reduction of Processing Time Per Valuation
At A Glance: EXL knowledge services provide valuation services to private companies. Based on the information provided by client and methodology adopted for valuation, data is processed and calculations are performed to generate a valuation for the subject company. It is a necessity in the present competitive environment to be efficient in both timeliness and quality. There is an urgent business need to reduce processing time by simplifying the process and reducing repetitive calculations performed. In Q4, 2010, the average processing time per project was at 33:11 hrs. There existed an opportunity to identify redundant, manual, and non-value added activities, elimination of which would result in reduction of processing time. Also, the process was at saturation point, where further resources could not be hired due to client’s budget constraint and risk aversion policy. At the same time, competition increased as the client hired another vendor. This situation demanded us to be more productive with available resources without compromising on quality, strive towards customer delight, and stay ahead of competitors.
Achieving Value and Excellence through Six Sigma
Aarohan-11 Symbiosis Centre for Management and Human Resource Development Page 78
There was an urgent business need to improve productivity of the team by reducing the processing time on valuation models. Thus, the key stakeholders decided to deploy Lean Six Sigma methodology to reduce processing time, and this goal perfectly aligned with the strategic imperatives of the business. The process goal was to reduce processing time per Valuation by 15% (from 33:11 hrs. to <28:00 hrs.). The project started in Dec 2010 and closed in April 2011. Thereafter, the primary metric, valuation time, was consistently monitored to ensure sustenance of improvement achieved. Root cause analysis was performed during DMAIC journey, which helped in indentifying the most significant causes of high processing time.
o NVA’s leading to high processing time. o Manual calculations of OPM, PWERM and CVM waterfall o Manual entry of financial inputs , capitalization tables, comparables . o Repetitive activities of calculations & inputs o Errors committed during data input and calculations o Research of comparables data. o Rework on account of change of assumptions, errors, updated financial information etc. o Waiting for financial information from client o Multiple reviews - Level 1 and level 2, Math check
The team brainstormed to determine potential solution for each of the major root causes.
o Designed a tool that calculates OPM breakpoints, PWERM waterfalls, CVM waterfalls automatically
o Implemented automated formatting by designing a macro o Report writing inputs automated using a macro o Comparables database created based on the process requirement o Process has been established where the analysts are dedicated to a specific industry and
are trained as per the industry type Post implementation, an effective control plan was put in place to ensure sustenance of improvements. This six sigma project resulted in the following:
o Processing time reduction of 15%. o Capacity increase of 22 valuation models per month. o Potential benefit of 2.52 FTEs o Annualized Financial benefit of $153,476
COGNIZANT TECHNOLOGY SOLUTIONS LTD
To Reduce The Operating Cost in AVM
Overview:
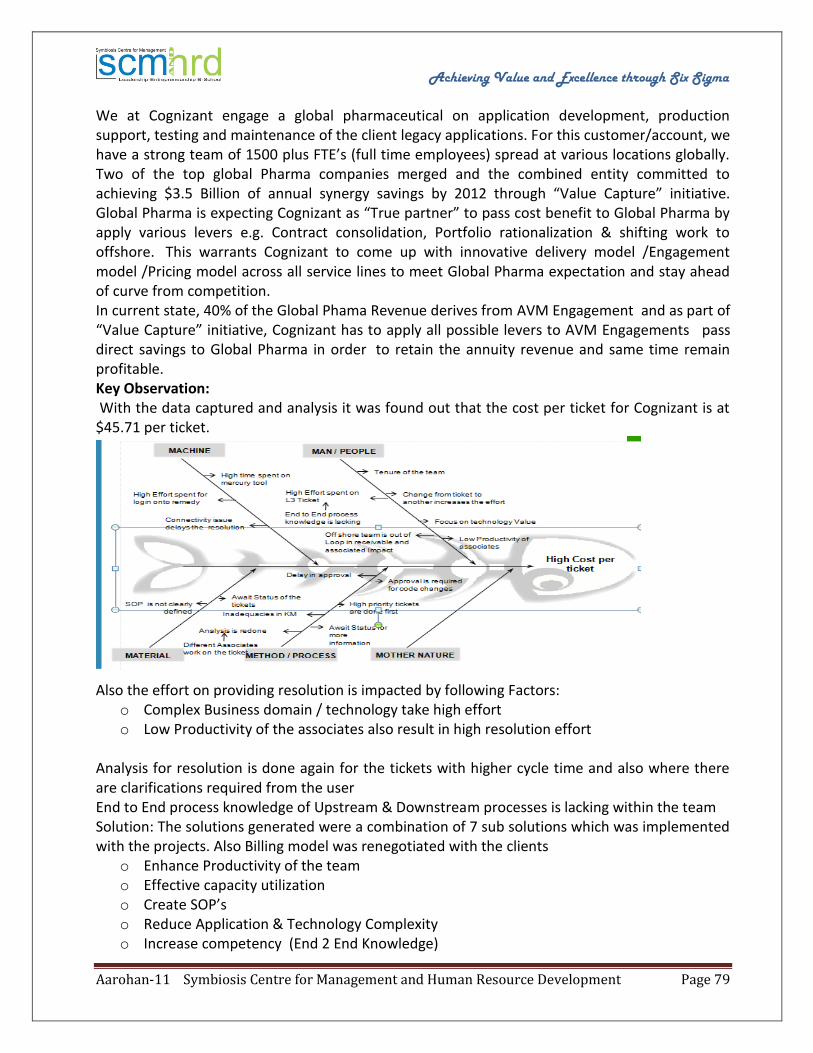
Achieving Value and Excellence through Six Sigma
Aarohan-11 Symbiosis Centre for Management and Human Resource Development Page 79
We at Cognizant engage a global pharmaceutical on application development, production support, testing and maintenance of the client legacy applications. For this customer/account, we have a strong team of 1500 plus FTE’s (full time employees) spread at various locations globally. Two of the top global Pharma companies merged and the combined entity committed to achieving $3.5 Billion of annual synergy savings by 2012 through “Value Capture” initiative. Global Pharma is expecting Cognizant as “True partner” to pass cost benefit to Global Pharma by apply various levers e.g. Contract consolidation, Portfolio rationalization & shifting work to offshore. This warrants Cognizant to come up with innovative delivery model /Engagement model /Pricing model across all service lines to meet Global Pharma expectation and stay ahead of curve from competition. In current state, 40% of the Global Phama Revenue derives from AVM Engagement and as part of “Value Capture” initiative, Cognizant has to apply all possible levers to AVM Engagements pass direct savings to Global Pharma in order to retain the annuity revenue and same time remain profitable. Key Observation: With the data captured and analysis it was found out that the cost per ticket for Cognizant is at $45.71 per ticket.
Also the effort on providing resolution is impacted by following Factors:
o Complex Business domain / technology take high effort o Low Productivity of the associates also result in high resolution effort
Analysis for resolution is done again for the tickets with higher cycle time and also where there are clarifications required from the user End to End process knowledge of Upstream & Downstream processes is lacking within the team Solution: The solutions generated were a combination of 7 sub solutions which was implemented with the projects. Also Billing model was renegotiated with the clients
o Enhance Productivity of the team o Effective capacity utilization o Create SOP’s o Reduce Application & Technology Complexity o Increase competency (End 2 End Knowledge)
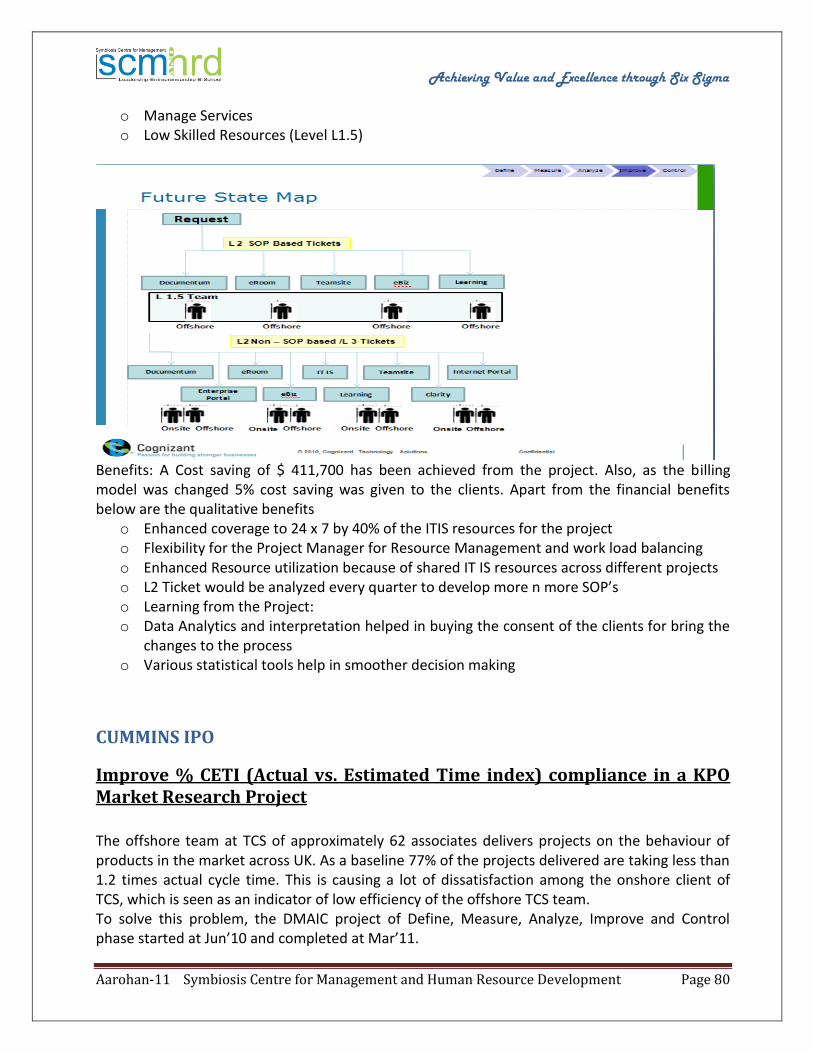
Achieving Value and Excellence through Six Sigma
Aarohan-11 Symbiosis Centre for Management and Human Resource Development Page 80
o Manage Services o Low Skilled Resources (Level L1.5)
Benefits: A Cost saving of $ 411,700 has been achieved from the project. Also, as the billing model was changed 5% cost saving was given to the clients. Apart from the financial benefits below are the qualitative benefits
o Enhanced coverage to 24 x 7 by 40% of the ITIS resources for the project o Flexibility for the Project Manager for Resource Management and work load balancing o Enhanced Resource utilization because of shared IT IS resources across different projects o L2 Ticket would be analyzed every quarter to develop more n more SOP’s o Learning from the Project: o Data Analytics and interpretation helped in buying the consent of the clients for bring the
changes to the process o Various statistical tools help in smoother decision making
CUMMINS IPO
Improve % CETI (Actual vs. Estimated Time index) compliance in a KPO Market Research Project The offshore team at TCS of approximately 62 associates delivers projects on the behaviour of products in the market across UK. As a baseline 77% of the projects delivered are taking less than 1.2 times actual cycle time. This is causing a lot of dissatisfaction among the onshore client of TCS, which is seen as an indicator of low efficiency of the offshore TCS team. To solve this problem, the DMAIC project of Define, Measure, Analyze, Improve and Control phase started at Jun’10 and completed at Mar’11.
Achieving Value and Excellence through Six Sigma
Aarohan-11 Symbiosis Centre for Management and Human Resource Development Page 81
Define: We formed the team with Onshore client and Offshore associates. The charter created got signed off by the delivery head offshore and his counterpart onshore. The stakeholder analysis done helped on achieving smoother communication channel. The program management governing body has set up a fortnightly status update. The Risk mitigation plan and Project Plan helped control the tasks on the Roadmap. The goal of this DMAIC project is to improve the Actual to Estimated time ratio within 120times Cycle time from 77% to 90%. Measure: In the measure phase, to understand and come to know the probable causes we ran several sessions of brainstorming with the process associates and client teams. We used the fishbone diagram for this exercise. There were a lot of X’s that came up during our Brainstorming and plotting Fishbone diagram. After the Cause & Effect diagram we put all the probable x’s into a Cause- Effect Matrix and filtered out the workable probable X’s by prioritizing. To run several statistical tests to come close to the validated X’s we have designed the data collection plan. We found out the process capability as 0.09. Analyze: Before starting the Analyze phase we conducted Anderson Darling normality test, which proved the data for project Y, ie Actual Vs Estimated or CETI as non normal. So, we could not use regular statistical tests for inference for mean and standard deviation. Our statistical tests were limited to Non parametric tests. At the start of the Analyze phase we had approx 40 probable causes to run into different Statistical tests. We had a first level of filtration with the probable causes generated during the brainstorming with Cause and Effect diagram reducing this number to 21. We had a second level of filtration with prioritization matrix and reduced the probable causes to 14 and a 3rd level of filtration with inferential statistics made the root causes to 6 . Multiple linear regression, Single Linear regression, Kruskal Wallis, Moods Median, 2 sample t test, Binary Logistic Regression, Time Study with Random Sample Selection, Shainin DOE (Multivari Chart) are used for getting the validated 6 root causes. The validated root causes or X’s that impacted the CETI or project Y are Request Type, End Client, Incorrect Specification, Out Put Type, Actual Time, Data Pull Time and Interaction of (Request type, Client category and weekday of delivery). Improve: To put solutions during the Improve phase to counter the impact of root causes we ran several brainstorming sessions with associates of the offshore hub and the client on the onshore. We chose few solutions out of a multiple number of generated solutions with solutions prioritization matrix. A detailed mapped plan of implementation ensured the rigor of reaching the solution to all associates. Below are a list of the most important solutions:-
o Master guide which is created either in the form of a WSP/WSV or PPT with the commonly used charts with respective teams is placed in the shared area so that it was accessible to the team members.
o Lego is a way to standardise client presentations & still keep them personalized – based on briefs received from clients. A set of dynamic road- templates which cover the most
Achieving Value and Excellence through Six Sigma
Aarohan-11 Symbiosis Centre for Management and Human Resource Development Page 82
frequent business issues raised by manufacturer clients. LEGO follows an analysis flow that is fully aligned with Analytical Skills training. Uses are to to reduce the cycle time/turnaround time to produce presentations for clients, to prepare more standard presentations for clients according to best practice and to enable TCS to be able to provide insight of consistently high standard to us more quickly
o To work efficiently on LEGO VDI is a must as per the IT team. VDI (Virtual desktop Interface) has advantages in terms of down time minimization and also the bigger drive space, easier interaction between the Local drive and VDI.
Control: To validate the results obtained with the applied solutions we did Mann Whitney Hypothesis test and we found that the after data has improved, with a process capability of 0.48. A control chart on the CETI value clearly signifies an improving trend during the course of the project. We have put in place control plan to monitor the data collection and ensure continuous solution implementation. An overall financial saving of 1.589 m USD per year is achieved due to 45.2% reduction in cycle time.
HOERBIGER INDIA PRIVATE LIMITED
New Process Design To Achieve Customer Satisfaction
HCL Technologies Ltd. – BSERV established in 2001 is one of the early players of Business Process Outsourcing. HCL BPO Business Services has over 11,200 employees across 26 global BPO delivery centres providing over 220 domain specific and quality driven processes to several Fortune 500/Fortune Global 500 customers. HCL BSERV offers a comprehensive range of voice/ non voice /web based support services. Business Case & Back Ground:
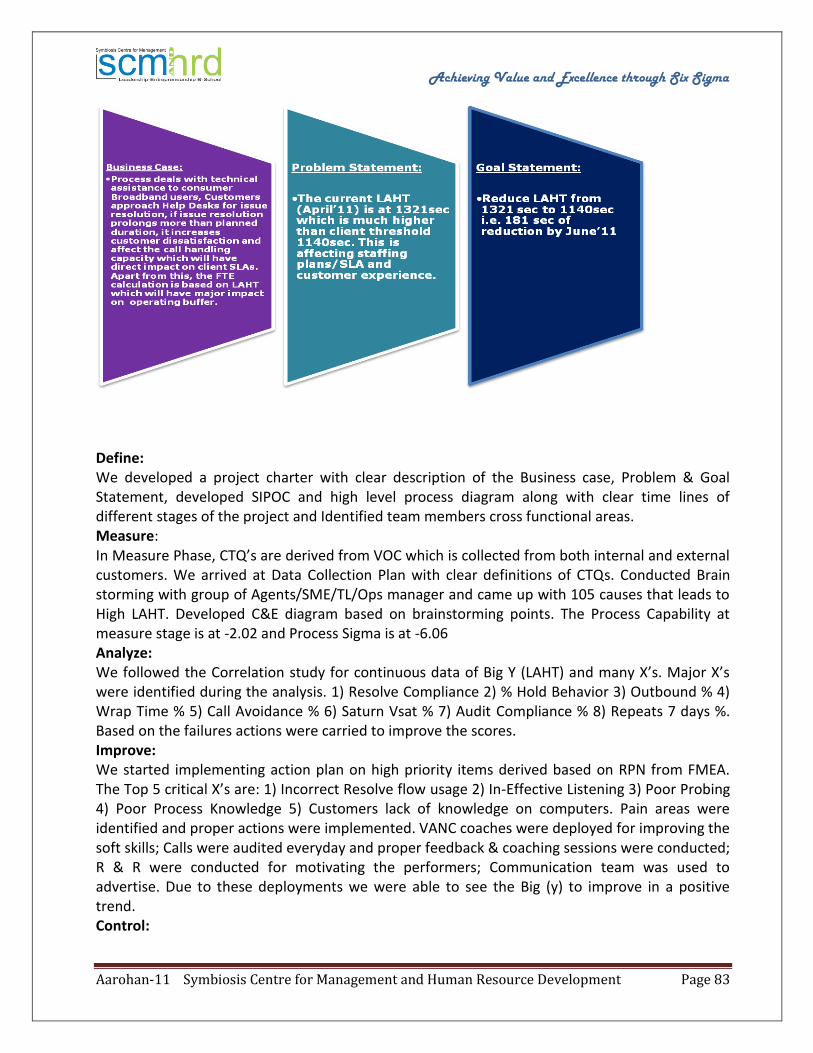
Achieving Value and Excellence through Six Sigma
Aarohan-11 Symbiosis Centre for Management and Human Resource Development Page 83
Define: We developed a project charter with clear description of the Business case, Problem & Goal Statement, developed SIPOC and high level process diagram along with clear time lines of different stages of the project and Identified team members cross functional areas. Measure: In Measure Phase, CTQ’s are derived from VOC which is collected from both internal and external customers. We arrived at Data Collection Plan with clear definitions of CTQs. Conducted Brain storming with group of Agents/SME/TL/Ops manager and came up with 105 causes that leads to High LAHT. Developed C&E diagram based on brainstorming points. The Process Capability at measure stage is at -2.02 and Process Sigma is at -6.06 Analyze: We followed the Correlation study for continuous data of Big Y (LAHT) and many X’s. Major X’s were identified during the analysis. 1) Resolve Compliance 2) % Hold Behavior 3) Outbound % 4) Wrap Time % 5) Call Avoidance % 6) Saturn Vsat % 7) Audit Compliance % 8) Repeats 7 days %. Based on the failures actions were carried to improve the scores. Improve: We started implementing action plan on high priority items derived based on RPN from FMEA. The Top 5 critical X’s are: 1) Incorrect Resolve flow usage 2) In-Effective Listening 3) Poor Probing 4) Poor Process Knowledge 5) Customers lack of knowledge on computers. Pain areas were identified and proper actions were implemented. VANC coaches were deployed for improving the soft skills; Calls were audited everyday and proper feedback & coaching sessions were conducted; R & R were conducted for motivating the performers; Communication team was used to advertise. Due to these deployments we were able to see the Big (y) to improve in a positive trend. Control:
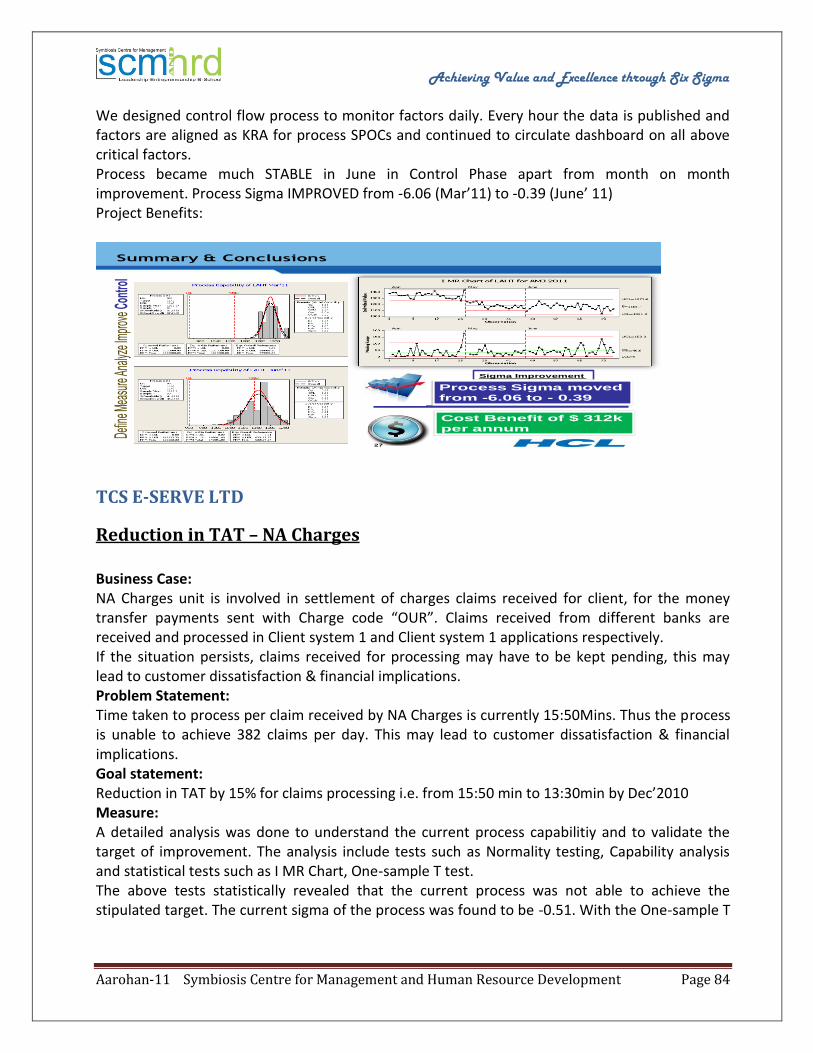
Achieving Value and Excellence through Six Sigma
Aarohan-11 Symbiosis Centre for Management and Human Resource Development Page 84
We designed control flow process to monitor factors daily. Every hour the data is published and factors are aligned as KRA for process SPOCs and continued to circulate dashboard on all above critical factors. Process became much STABLE in June in Control Phase apart from month on month improvement. Process Sigma IMPROVED from -6.06 (Mar’11) to -0.39 (June’ 11) Project Benefits:
27
Summary & Conclusions
Sigma Improvement
Process Sigma moved
from -6.06 to - 0.39
Cost Benefit of $ 312k
per annum
TCS E-SERVE LTD
Reduction in TAT – NA Charges
Business Case: NA Charges unit is involved in settlement of charges claims received for client, for the money transfer payments sent with Charge code “OUR”. Claims received from different banks are received and processed in Client system 1 and Client system 1 applications respectively. If the situation persists, claims received for processing may have to be kept pending, this may lead to customer dissatisfaction & financial implications. Problem Statement: Time taken to process per claim received by NA Charges is currently 15:50Mins. Thus the process is unable to achieve 382 claims per day. This may lead to customer dissatisfaction & financial implications. Goal statement: Reduction in TAT by 15% for claims processing i.e. from 15:50 min to 13:30min by Dec’2010 Measure: A detailed analysis was done to understand the current process capabilitiy and to validate the target of improvement. The analysis include tests such as Normality testing, Capability analysis and statistical tests such as I MR Chart, One-sample T test. The above tests statistically revealed that the current process was not able to achieve the stipulated target. The current sigma of the process was found to be -0.51. With the One-sample T
Achieving Value and Excellence through Six Sigma
Aarohan-11 Symbiosis Centre for Management and Human Resource Development Page 85
test, it was found that the target of 15% improvement from the current situation is a significant target. Analysis: In order to understand the various issues currently faced in the process, a brainstorming session was conducted with team members who listed out the bottle-necks in the process. Questionnaires were given to them covering detailed procedures, for inputs from the team members. Also, parallelly, a detailed walk-through of the entire process was done and a Process Map was drawn based on the same which detailed the end-to-end activities of claim processing. A Value steam map was drawn which explained in detail, various value add and non-value add activities involved in the processing and the time taken to complete the activities. Based on the above analysis, several factors affecting the TAT were listed. Based on the Value Stream Map and Correlation analysis, the major factors affecting the AHT were found. Duplication Check of transactions: It was found that 90% of the transactions required duplication check which requires searching duplicated payment from the system. This contributed towards 51% of the total NVA while processing payments. Allocation of volumes: Allocation of volumes was one of the key issues faced by the Team Lead on regular basis. It had following impacts:
o Manual effort of saving claim messages in multiple excel files o Difficulty in tracking the status of the claims processed o Difficulty in retrieving the pending claims for the day
MIS & Workflow activities: It was found that 46% of the NVA was due to the MIS, workflow activities and consolidation efforts. Training need: Assessments conducted on process guidelines and system skills revealed that there were few staffs that require more training in both the aspects (process and system skills). Solution: Duplications check: An alternate method of duplication check was found which is far less time consuming than the original method. Instead of searching the transactions in the system, they can opt to find the duplicated payment in specific reports. For this, reports pertaining to past 6 months needs to be consolidated. Workflow activities: Implementation of an Access database for workflow in lieu of excel files and has to be designed in such a way that makers and verifiers have different menu screen for data updation. Also, all instructions will be displayed in the same screen where the data is being updated. Database would need to be designed to accommodate the option of generating reports required for the MIS prepared in the unit. Training need:
Achieving Value and Excellence through Six Sigma
Aarohan-11 Symbiosis Centre for Management and Human Resource Development Page 86
A two week training program has been planned for the concerned staffs wherein one of the process trainers would monitor these staffs and provide adequate training in process and system skills. Also, regular Process refresher sessions should be conducted and adequate soft skills for the team members should be provided. Results: Access database implemented: An Access database has been implemented a.) Where all workflow activities pertaining to claim processing will be managed b.) This would serve as a one-file reference for various instructions related to the process. c) Where the duplication can be done within few seconds when compared to the traditional method. d) Reports can be generated for reconciliation activities and other MIS requirements. Performance improvement: The exclusive training provided to the staffs has resulted in better performance of these staffs. The staffs that were trained had shown significant improvement in their performance and were able to achieve better productivity. It was mandated to conduct regular process refresher sessions every month for all the team members. Improvement: Post the Improvement phase, the overall TAT has been reduced by 15% as. The sigma level has now improved to 3.33 Benefits: Quantitative: The reduction in TAT by 15% has lead to annual save of USD 54,709.20. Qualitative:
o Enhanced productivity o Work life balance o Manual and time consuming efforts in workflow activities has been minimized o Increased Client satisfaction o Improvement in quality. o Manual efforts spent on duplication check and data consolidation is minimized
TCS E-SERVE LTD
Improving Productivity in PPR
Business Background: Correspondent Operations is a 172 employee team with site operation across Cincinnati, Mumbai & Chennai. The process involves pre-purchase review of closed loans received from Correspondents and Accesses Imaged loan documents like Note, Mortgage, CBR, DU/LP, Insurance, Income docs, HUD, Title, Appraisal etc and reviewing the same. Project Business case: Having Expert vintage members, increases possibility of reducing the Unit Processing time for these loans hence the TCS team had initiated a green belt project to reduce the Unit Processing
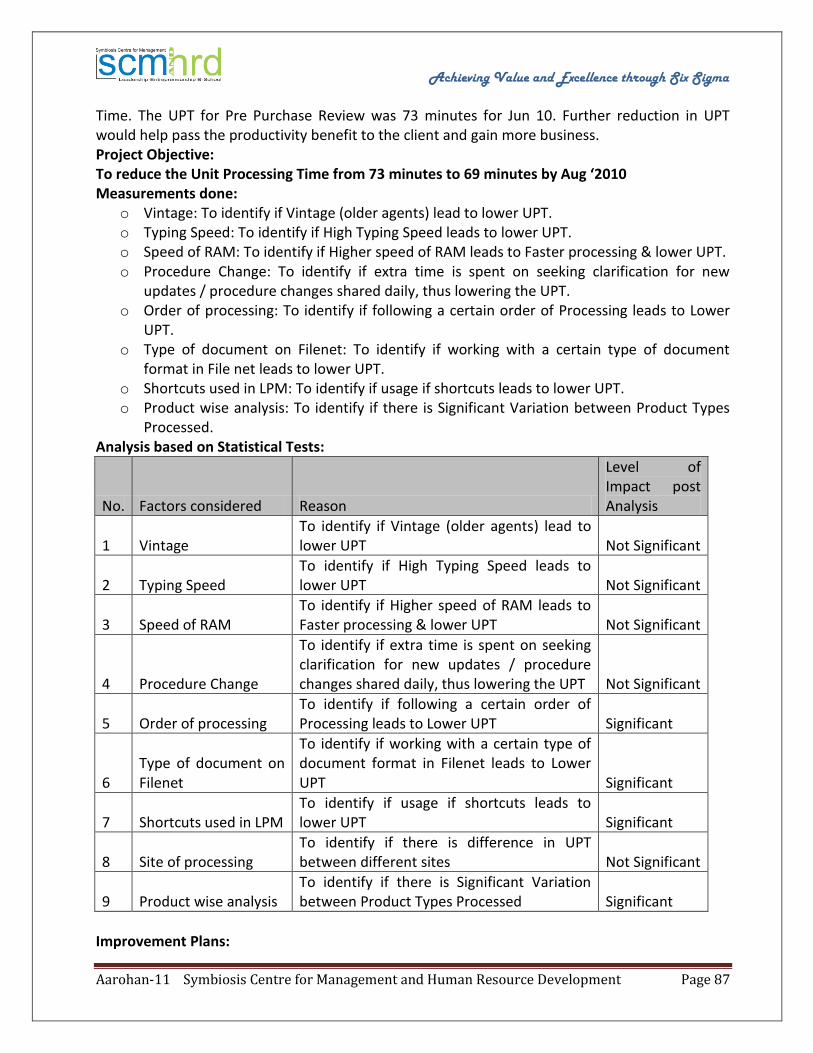
Achieving Value and Excellence through Six Sigma
Aarohan-11 Symbiosis Centre for Management and Human Resource Development Page 87
Time. The UPT for Pre Purchase Review was 73 minutes for Jun 10. Further reduction in UPT would help pass the productivity benefit to the client and gain more business. Project Objective: To reduce the Unit Processing Time from 73 minutes to 69 minutes by Aug ‘2010 Measurements done:
o Vintage: To identify if Vintage (older agents) lead to lower UPT. o Typing Speed: To identify if High Typing Speed leads to lower UPT. o Speed of RAM: To identify if Higher speed of RAM leads to Faster processing & lower UPT. o Procedure Change: To identify if extra time is spent on seeking clarification for new
updates / procedure changes shared daily, thus lowering the UPT. o Order of processing: To identify if following a certain order of Processing leads to Lower
UPT. o Type of document on Filenet: To identify if working with a certain type of document
format in File net leads to lower UPT. o Shortcuts used in LPM: To identify if usage if shortcuts leads to lower UPT. o Product wise analysis: To identify if there is Significant Variation between Product Types
Processed. Analysis based on Statistical Tests:
No. Factors considered Reason
Level of Impact post Analysis
1 Vintage To identify if Vintage (older agents) lead to lower UPT Not Significant
2 Typing Speed To identify if High Typing Speed leads to lower UPT Not Significant
3 Speed of RAM To identify if Higher speed of RAM leads to Faster processing & lower UPT Not Significant
4 Procedure Change
To identify if extra time is spent on seeking clarification for new updates / procedure changes shared daily, thus lowering the UPT Not Significant
5 Order of processing To identify if following a certain order of Processing leads to Lower UPT Significant
6 Type of document on Filenet
To identify if working with a certain type of document format in Filenet leads to Lower UPT Significant
7 Shortcuts used in LPM To identify if usage if shortcuts leads to lower UPT Significant
8 Site of processing To identify if there is difference in UPT between different sites Not Significant
9 Product wise analysis To identify if there is Significant Variation between Product Types Processed Significant
Improvement Plans:

Achieving Value and Excellence through Six Sigma
Aarohan-11 Symbiosis Centre for Management and Human Resource Development Page 88
1. Introduced Uniform Processing Steps to bring about a standardized and systematic approach in File Processing.
2. Refresher Trainings were conducted on Updates/Procedure Changes mainly for FHA and also for Conventional Loans.
3. Best practices System Shortcuts were identified and disseminated to the team to help reduce the processing time.
4. Explored with the business the option to review files saved in “.pdf” format rather than “.tif” format however due to size restrictions on the servers this could not be executed.
Result: UPT in the month of June-10 was at 73.48 min’s, which had come down to 66.13 min’s in the month of Aug-10.
TCS E-SERVE LTD
Reject Reduction in corporate account opening Business Case: Corporate Salary Account Booking is done out of the centralized operations located in Chennai. The first level of documentation checks process is done out of Chennai for all the locations except for the following 3 locations :DEL,BLR & MUMBAI for which Ist level check is carried out by the third party vendor of the Regional operations of the respective 3 cities ,where the forms are received through the Frontend team and post first level of checks done by the Regional Ops vendor, the forms are dispatched to the centralized Ops in Chennai for the 2nd level of checks and subsequent booking of the a/c.Multi level checks are performed by the Regional Operations & Centralized Operations ensuring the completion and correctness of the application form and the documentation. Problem Statement: Out of 28497(Oct'09 to Jan'10) applications processed, 2448(9%) of applications are rejected at Centralized Operations for multiple reasons due to the controllable factors.The problem was identified basis a constant feedback received from the client depicting their dissatisfaction with the current standards. Project Goal Statement: Reducing the Controllable Rejects to below 4.5% from the current 9% by Oct'2010 and striving towards zero. Why Six Sigma & DMAIC approach was followed: Why Six Sigma : Six Sigma methodologies has a broad set of tools associated with it– one of the key benefits it brings is this proven framework to deliver results. One of the common uses for six sigma is process improvement – Six sigma comes with a ready defined, and very effective, process improvement methodology called DMAIC. Why DMAIC methodology:
Achieving Value and Excellence through Six Sigma
Aarohan-11 Symbiosis Centre for Management and Human Resource Development Page 89
The six sigma DMAIC methodology offers a number of benefits – its structured in such a way that it methodically analyses a process before attempting any improvements – that in itself is an important step – one of the primary reasons for business improvement failure is the lack of analysis that is done prior to implementing an improvement – which can result in failure to deliver improvements (in many cases it can actually make the system worse), hence this approach was identified as best applicable for the project undertaken. Highlights covered under the DMAIC methodology: DEFINE: KANO MODEL survey helped in finding out that though the Client is dissatisfied with the current standards; they would be satisfied if we could deliver more. SIPOC- (Supplier, Inputs, Processes, Outputs & customers) was defined depicting the process flow on a macro level. MEASURE: AS IS PROCESS FLOW was devised providing all the steps in detail involved in the process. MEASUREMENT SYSTEM ANALYSIS (GAGE R & R) was done to figure out the process capability which gave the following conclusions: Conclusions:
o The current measurement system doesn’t match the requirements. o Hence the following improvement plan was suggested o Training for vendors on CIPP (policy) every month and as and when there is policy change,
strengthening the process of first level of QA at the Regional Operations Cpa. Implementation of standardized review and feedback format to the vendor
o Promote usage of the exhaustive checklists at the vendor shop for an effective QA. o Suggest changes in the account opening form to minimize rejects. o Streamline and revamp the reject tracking process.
Gage R & R was done to measure the improvement done by implementing the Improvement plan .The process capability is checked post implementing the improvements in the Measurement System. The Binomial Process Capability analysis is used to calculate the process sigma as Rejects are DEFECTIVE DATA. THE % REJECTS IS REDUCED FROM 9% TO 7.07% BY IMPROVING THE MEASUREMENT SYSTEM ANALYSIS:
o Fishbone analysis was done for categorizing the factors causing the maximum rejects. o Pareto analysis was done to prioritize the important reasons affecting the higher rejects. o Brainstorming sessions were done with the frontend. o With the analysis the following critical causes were identified for the higher rejects:
o Inadequate training amongst the sales and the vendor. o Lack of concentrated focus on reject resolution
IMPROVE: o Changes incorporated in the policy to reduce the rejects.( Name mismatch & dveiation
policy) o Extensive trainings conducted with the frontline and the vendor. Awareness created on
importance of focus on reject reduction
Achieving Value and Excellence through Six Sigma
Aarohan-11 Symbiosis Centre for Management and Human Resource Development Page 90
o A software installation was done at the centralized operation for cropping the signatures reducing the rejects related to signature mismatches etc.
o Detailed granular level checklist was prepared to be followed up by front-end. o Influence of rework is reduced in order to make more time to handle month end skews. o Improved Process flow was devised depicting the benefits of the changed process. o Changes incorporated in the account opening form
The process capability is checked post implementing the improvements The Binomial Process Capability analysis is used to calculate the process sigma as Rejects are DEFECTIVE DATA. THE % REJECTS IS REDUCED FROM 9% TO 3.4% CONTROL: Control plan was put in place to track the performance and further improvements I- Chart was done to review the continuous improvement of the project depicting the rejects were further reduced to 2.56% in the month of November from 9%. Benefits reaped:
Productivity Amount INR pa
Type 2 gains – Direct Client saves arising out of handling increased volumes with the existing capacity–ROPS productivity
11.60 Lac
Type 2 gains –Handling of increased volumes with the existing capacity- Vendor productivity-
4.48 Lac
Rejects were reduced from 9 % to 2.56%.
TCS E-SERVE
Improvement of Driver ‘Easy to Understand Project Brief Sunshine is one of the largest voice operations process for TCS BPO with over 600 FTEs engaged in providing service to end customers of a renowned US Bank operating in over 100 countries. Business need was to improve customer experience scores. End customer satisfaction score is one of the key performance measures for the unit. It is measured on the basis of end user responses to an email survey. One of the parameters on the survey form is ETU (Easy to Understand) has a high degree of correlation with the overall CSAT. A low ETU score was adversely impacting the overall CSAT and hence a project was undertaken to improve the ETU scores. Measurement & Analysis:

Achieving Value and Excellence through Six Sigma
Aarohan-11 Symbiosis Centre for Management and Human Resource Development Page 91
YTD scores (Jan – Jul 2010) for Easy to Understand was running at 58.70%. A Brainstorming session was done to identify the various drivers affecting ETU scores and a fish bone diagram which helped in categorization of potential X’s. Potential X’s were validated using data analysis and statistical tests. Chi-Square Test validated that agent tenure, FCR (First Call Resolution), Hiring thresholds on language and V&A (Voice & Accent) grade had an impact on ETU scores. A Pareto chart was used to identify the call types with low ETU scores. Improvement Action: A detailed improvement plan was drawn basis the root causes identified and validated in the Analyze Phase.
Sr
# Root Cause Observation Solution
1
Impact of Low
Tenure on ETU
scores
With increase in tenure we see
an improvement in ETU scores
and associates who have spent
<3 months in the process have a
lower ETU score
Deployed a Easy to Understand
module in the 4th week of
training to take back learning's &
Best practices from tenured reps
to new hire associates
2
Day of the
week Impact
on ETU
performance
It was observed that the
performance for calls taken on
Sunday had the lowest ETU
scores as compared to the other
days
Increased presence of Unit
Managers on the floor.
Operations Manager is present
on shift on all days of the week
from a additional support
purpose.
3
Lower FCR
resulting in
lower ETU
It was observed that with lower
FCR scores results in lower ETU
scores
Site, OM, UM & Reps level FCR
Dashboard was introduced to
improve awareness, Increased
SBS call monitoring, usage of
ENKATA for coaching of the
bottom performers to improve
FCR.
4 Impact of
Hiring on ETU
It was observed that associates
who were hired with a merit
trac score of < 3 on grammar,
accent or Fluency resulted in
lower ETU scores
Hiring standards were made
stringent & individuals with
scores of < 3 on grammar, accent
& fluency are not selected to be
a part of the program
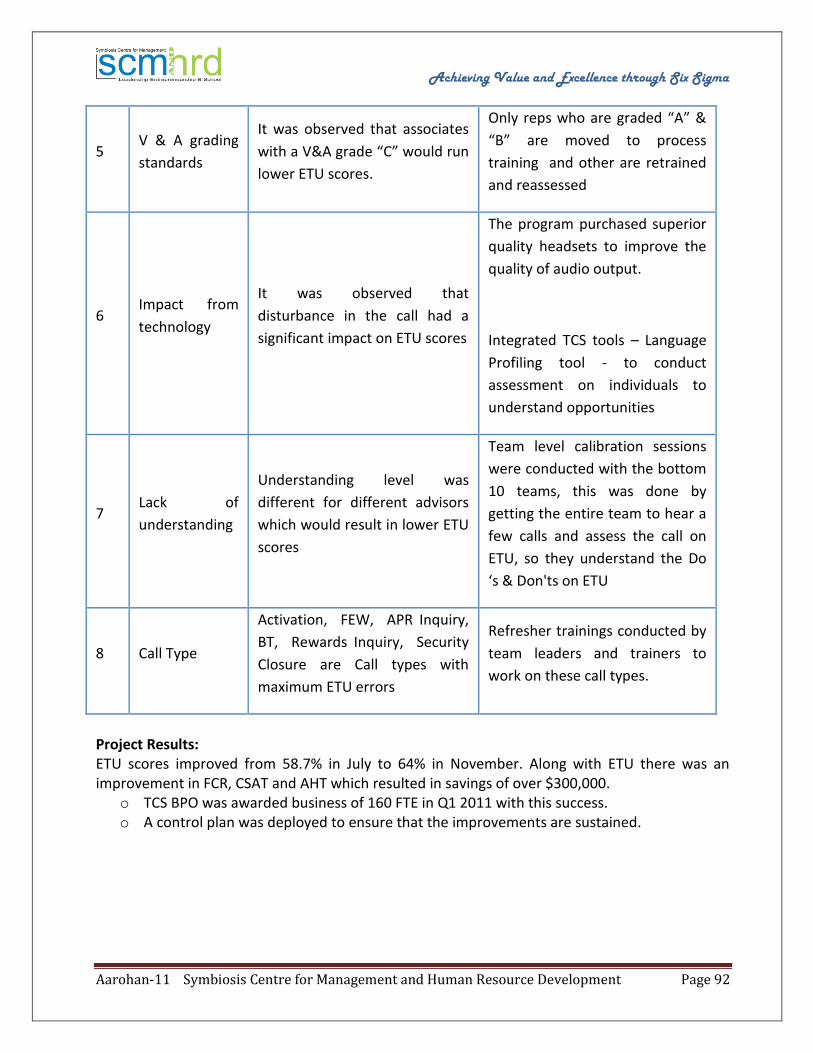
Achieving Value and Excellence through Six Sigma
Aarohan-11 Symbiosis Centre for Management and Human Resource Development Page 92
5 V & A grading
standards
It was observed that associates
with a V&A grade “C” would run
lower ETU scores.
Only reps who are graded “A” &
“B” are moved to process
training and other are retrained
and reassessed
6 Impact from
technology
It was observed that
disturbance in the call had a
significant impact on ETU scores
The program purchased superior
quality headsets to improve the
quality of audio output.
Integrated TCS tools – Language
Profiling tool - to conduct
assessment on individuals to
understand opportunities
7 Lack of
understanding
Understanding level was
different for different advisors
which would result in lower ETU
scores
Team level calibration sessions
were conducted with the bottom
10 teams, this was done by
getting the entire team to hear a
few calls and assess the call on
ETU, so they understand the Do
‘s & Don'ts on ETU
8 Call Type
Activation, FEW, APR Inquiry,
BT, Rewards Inquiry, Security
Closure are Call types with
maximum ETU errors
Refresher trainings conducted by
team leaders and trainers to
work on these call types.
Project Results: ETU scores improved from 58.7% in July to 64% in November. Along with ETU there was an improvement in FCR, CSAT and AHT which resulted in savings of over $300,000.
o TCS BPO was awarded business of 160 FTE in Q1 2011 with this success. o A control plan was deployed to ensure that the improvements are sustained.

Achieving Value and Excellence through Six Sigma
Aarohan-11 Symbiosis Centre for Management and Human Resource Development Page 93
BHARAT ELECTRONICS LIMITED
To Improve the "Bharat Electronics Retired Employee's Contributory Health Scheme (BERECHS) Booklet Satisfaction Index" PREVIOUS PROCESS: Interested retiring employee fills up the BERECHS form for the membership. The request is sent to Corporate Office for generation of BERECHS ID.BERECHS ID Prescription Booklet and Medical Hospitalization card (United Healthcare card) are prepared on in basis of BERECHS ID. One week before retirement date Contents of BERECHS Booklet is explained to the employee and all the three (BERECHS ID Prescription Booklet, United Healthcare card BERECHS Booklet) are handed over to him. Now after retirement, employee communicates to united health care for Hospitalization directly and for OPD contact BEL MI room and HR department. IMPROVEMENT SUGGESTED & IMPLEMENTED: Based on the feedback form and cause and effect diagram, factors leading to Poor Satisfaction Level for BERECHS Booklet were identified and improvement was done accordingly. This included complete redesigning of BERECHS booklet. The same was uploaded on the Intranet site for retiring employee’s reference. The Booklet was made Bilingual. After implementation satisfaction level showed improvement of 50.05. BENEFITS: TANGIBLES:
o 336 Man-hours per year IN- TANGIBLES:
o Customer Satisfaction o Job Satisfaction o Concentration in work o Improved Company Image
CAPGEMINI BUSINESS SERVICES (INDIA) LIMITED
Project Vimana –Productivity Improvement
This Project is focused on the improving the productivity per resource for the Tech pub project (seven programs). Before initiating the project, the average productivity was at 16 UOWs (Unit of work) per person/month (Feb10-Jan-11). As a result of the project, the average productivity improved by 30% i.e. 21 UOWs per person/month (Feb 11 – Jun-11). Business Problem:
o Low productivity per person resulted in high back logs. o People dependent process. o low Efficiency resulted in customer dissatisfaction.
Achieving Value and Excellence through Six Sigma
Aarohan-11 Symbiosis Centre for Management and Human Resource Development Page 94
Statistical Problem: The average productivity was at 16 UOWs per person/month for the period Feb 10- Jan 11. Average TAT per WO (Work order) for 40hrs of effort was more than 10 days. Vital Xs: Proper work allotment (pull system) not in place, frequent changes in process/priorities, Capacity plan visibility and adherence not 100%, Competency mismatch during allocation, Bottlenecks/waiting time within the process. Business Improvements: Implementation of pull system for WO allocation, Capacity plan of 45 days with full visibility and adherence implemented in the WMT (work management tool), VSM suggestion on work flow process implemented to eliminate NVA activities and waiting time/bottlenecks within the process, Camtasia study results implemented to standardize the process and implement the best practices, Dashboards modified to give visibility to all on team/individual targets, backlogs, quality trend, etc, skill metrics visibility provided to leads to promote competency based loading of resources. WO categorisation based on complexity and effort implemented in WMT. Business Benefits: Cost Avoidance benefits of around $700,000 per annum (Roughly 3crores +) with no change in the baseline resources Improvement in Productivity resulting in handling higher volume with optimal resources. Standardization and Streamlining of various sub-processes leading to better control of process. Enhanced Customer Satisfaction. Minimisation of Person dependency and load is uniformly distributed resulting in No stretch hours & controlled Backlogs. Deployment benefits resulted with 30% improvement in productivity for additional process Customer Benefits:
o Coat avoidance benefits, o Faster TAT and o Enhanced customer satisfaction.
CAPGEMINI BUSINESS SERVICES (INDIA) LIMITED
Project Utthanam This Project is focused on the Accounts Payables process in improving the productivity of invoice processing. Before initiating the project, the average productivity was at 54 invoices per person/day. As a result of the project, the average productivity improved by 88% i.e. 102 invoices per person/day. Business Problem: Low productivity per person resulted in high back logs. More headcounts employed than contracted. Low Payment Efficiency resulted in customer dissatisfaction. Statistical Problem: The average productivity was at 54 invoices per person/day for the period Mar-Apr 09 with baseline Z score as 0. Average processing time per invoice was 12.0 minutes against baseline of 9.4 minutes.
Achieving Value and Excellence through Six Sigma
Aarohan-11 Symbiosis Centre for Management and Human Resource Development Page 95
Vital Xs: No process standardization, Resources are activity centric than process centric, no monitoring system in the process, no dedicated/qualified personnel to handle skilled activities, lack of process metrics, high fluctuation in the incoming volumes, no recognition program, lot of manual activities /reports, no effective workflow management to understand queue system, and poor visual management about process/people performance Business Improvements: Developed workflow management system through which individual can pull the invoice rather push, Heijunka concept resulted in load leveling and elimination of Muri (Overburdening of Processors), Takt time for resource planning, improved visual management to display process and people performance, Skill Set mapping done to understand the knowledge of individual and bridge the gap, implemented OAE (Lean concept of OEE) and Stack Ranking for measuring individual productivity and quality and implemented rewards & recognition program based on stack ranking. Business Benefits:
o Financial benefits of about 3.29 crores with process head count reduction of 24 FTEs. o Improvement in Productivity resulting in handling higher volume with optimal resources. o Standardization and Streamlining of various sub-processes leading to better control of
process. o Enhanced Customer Satisfaction. o Elimination of Person dependency and load is uniformly distributed resulted No stretch
hours & Backlogs. D o deployment benefits resulted with 50% improvement in productivity for additional
process Customer Benefits:
o Payment Efficiency improved by faster TAT. o Enhanced customer satisfaction.
AFTAB Co.
Applying lean six sigma to decrease discharge time in ALghadir Hospital
Abstract: Alghadir is a grand non-governmental hospital in east of Tehran and its major customers are poor people and it is customized to satisfy them. We apply lean six sigma tools to decrease delays in discharge patients after treatment and finished hospitalization. Our target was “change discharge time from 14pm to 11am in all departments”. We have done it in two steps, First with usage of DMAIC and elimination of bugs and difficulties which were non-value added, hospital discharge time reduced from 14pm to 12pm
Achieving Value and Excellence through Six Sigma
Aarohan-11 Symbiosis Centre for Management and Human Resource Development Page 96
Second with usage of software technology it has decreased even less than11 am. Key words: Hospital, lean, six sigma, DMAIC, non-value added, discharge
1. Introduction
Alghadir Hospital is the most famous and the biggest hospital in east of Tehran(the capital city of Iran with nearly 18million people). It is private and charitable for poor people, so it is first selection for all poor People. And due to multi-specialty, it is first selection for the others. So in 24-hour it is crowded and in spite of working pressure, the workers do not paid much in compare with the other similar hospital so doing any improvement there is with difficulty and human management play a key role in such projects. The head of this hospital is Dr. Farhadi . She is the first lady in Iran who has been the head of the hospital and also the head of this project. Waiting to be discharged from the hospital is frustrating for patients and costly for hospitals. In such crowded hospital long delay in discharge time varied from 11a.m. to 11p.m., and it results in not only costs but also:
Unsatisfied patients and their family and the customer satisfaction was 40%
Unsatisfied surgeons who should wait until reception their patients
Unsatisfied customers who were waiting for reception
Unsatisfied afternoon shift personnel due to workload (because discharge steps had been
moved from morning to afternoon and added to afternoon shift duties)
2. Implementing DMIAC (lean tools) to reduce the discharge time from 14 to 11a.m. In the first phase (Define): Because the scope is covered most of hospital departments, so the head of the hospital is champion, sponsor and also team leader, and all other related personnel: matron, supervisors and head of emergency, internal ward, surgery ward, genecology ward, operation room, pediatric ward, discharge, laboratory and radiology are lean team members. In this project lean six sigma methodology and DMAIC tools applied to solve the problem and to change discharge time from 14 to 11. This improvement has been done in two steps: First with elimination of special cause it reached to 12, and after elimination of some common cause it reaches from 12 to 11. CTQs are as: 1. Delay in discharge time in newborn department 2. Delay in discharge time in POST CCU, CCU,ICU,surgery 3. Delay in discharge time in OB and GY
Discharge was a three-step process. First, physicians had to write discharge orders. Next,
clerks had to prepare them. Finally, nurses had to give patients their discharge
instructions. It was a formula for lots of waiting time—“waste” in lean terminology.
In the second phase (Measure): The lean team arranged data collection plan after that in 30 working days the exact discharge time collected and all reasons of any delays from 11am recorded. The average time 14 found by spc charts and also the lean team forecast if they eliminate special cause they can reduce average discharge time to 12 or less and reduce variance too.
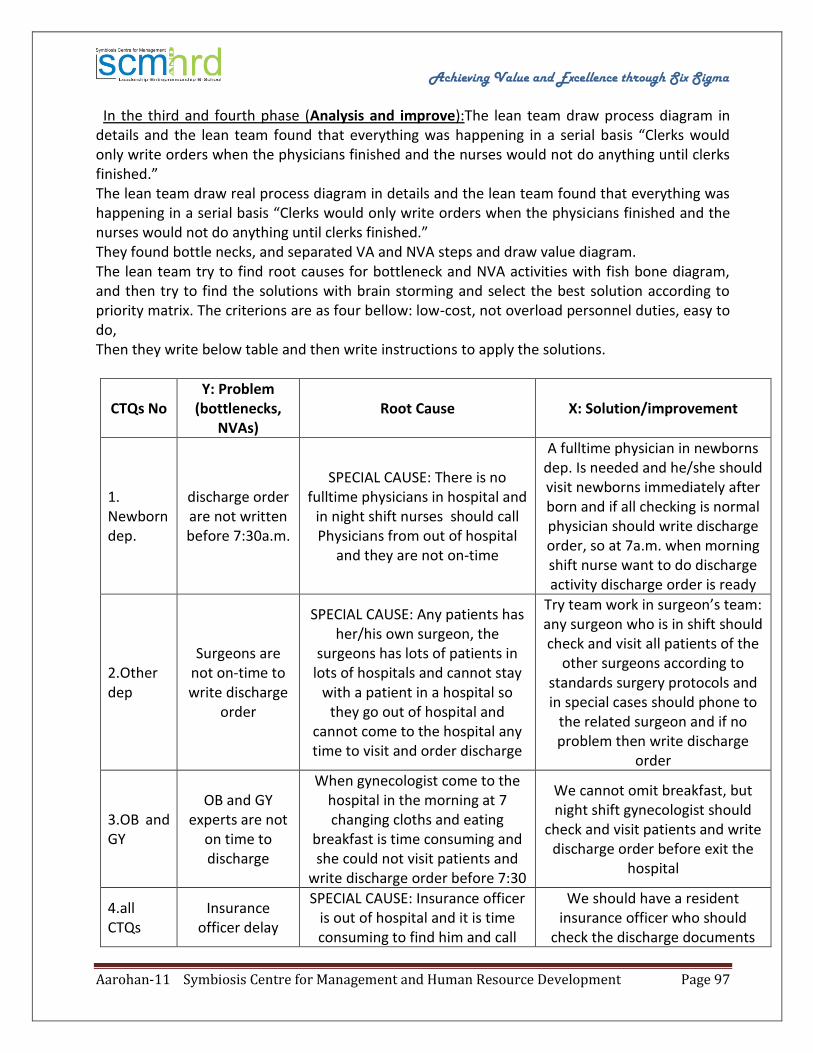
Achieving Value and Excellence through Six Sigma
Aarohan-11 Symbiosis Centre for Management and Human Resource Development Page 97
In the third and fourth phase (Analysis and improve):The lean team draw process diagram in details and the lean team found that everything was happening in a serial basis “Clerks would only write orders when the physicians finished and the nurses would not do anything until clerks finished.” The lean team draw real process diagram in details and the lean team found that everything was happening in a serial basis “Clerks would only write orders when the physicians finished and the nurses would not do anything until clerks finished.” They found bottle necks, and separated VA and NVA steps and draw value diagram. The lean team try to find root causes for bottleneck and NVA activities with fish bone diagram, and then try to find the solutions with brain storming and select the best solution according to priority matrix. The criterions are as four bellow: low-cost, not overload personnel duties, easy to do, Then they write below table and then write instructions to apply the solutions.
X: Solution/improvement Root Cause Y: Problem
(bottlenecks, NVAs)
CTQs No
A fulltime physician in newborns dep. Is needed and he/she should visit newborns immediately after born and if all checking is normal physician should write discharge order, so at 7a.m. when morning shift nurse want to do discharge activity discharge order is ready
SPECIAL CAUSE: There is no fulltime physicians in hospital and
in night shift nurses should call Physicians from out of hospital
and they are not on-time
discharge order are not written before 7:30a.m.
1. Newborn dep.
Try team work in surgeon’s team: any surgeon who is in shift should check and visit all patients of the
other surgeons according to standards surgery protocols and in special cases should phone to
the related surgeon and if no problem then write discharge
order
SPECIAL CAUSE: Any patients has her/his own surgeon, the
surgeons has lots of patients in lots of hospitals and cannot stay
with a patient in a hospital so they go out of hospital and
cannot come to the hospital any time to visit and order discharge
Surgeons are not on-time to write discharge
order
2.Other dep
We cannot omit breakfast, but night shift gynecologist should
check and visit patients and write discharge order before exit the
hospital
When gynecologist come to the hospital in the morning at 7 changing cloths and eating
breakfast is time consuming and she could not visit patients and
write discharge order before 7:30
OB and GY experts are not
on time to discharge
3.OB and GY
We should have a resident insurance officer who should
check the discharge documents
SPECIAL CAUSE: Insurance officer is out of hospital and it is time consuming to find him and call
Insurance officer delay
4.all CTQs
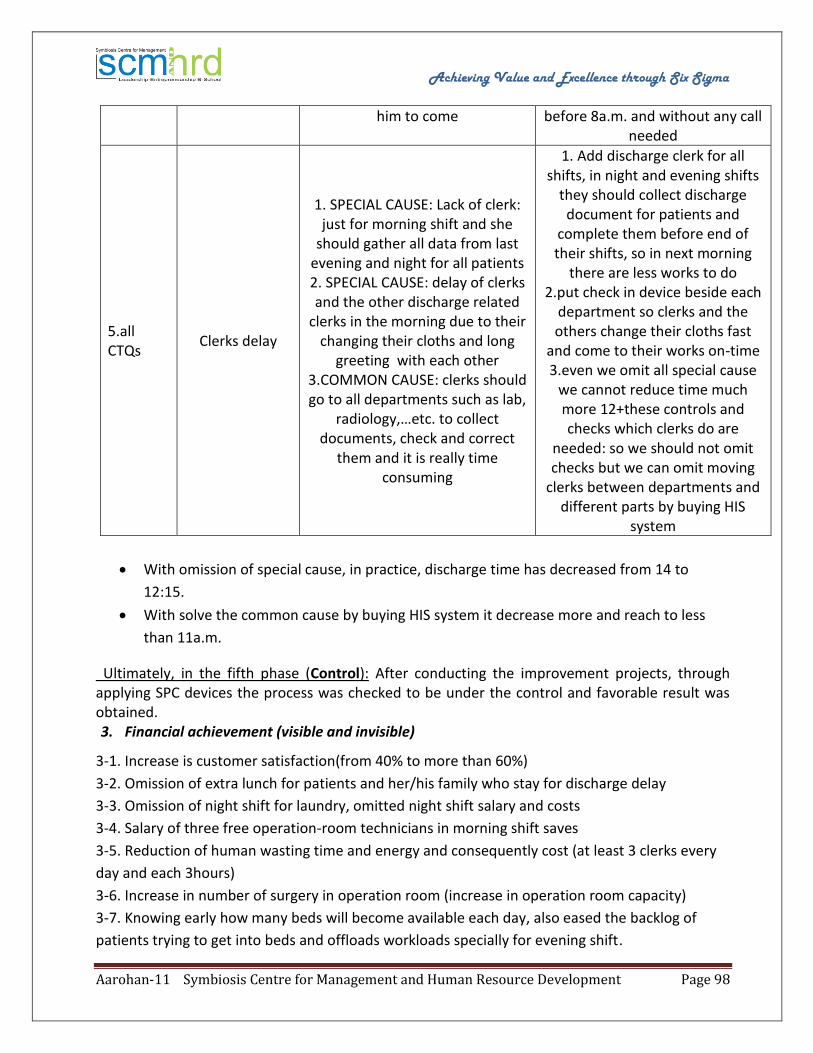
Achieving Value and Excellence through Six Sigma
Aarohan-11 Symbiosis Centre for Management and Human Resource Development Page 98
before 8a.m. and without any call needed
him to come
1. Add discharge clerk for all shifts, in night and evening shifts
they should collect discharge document for patients and
complete them before end of their shifts, so in next morning
there are less works to do 2.put check in device beside each
department so clerks and the others change their cloths fast
and come to their works on-time 3.even we omit all special cause
we cannot reduce time much more 12+these controls and checks which clerks do are
needed: so we should not omit checks but we can omit moving
clerks between departments and different parts by buying HIS
system
1. SPECIAL CAUSE: Lack of clerk: just for morning shift and she
should gather all data from last evening and night for all patients 2. SPECIAL CAUSE: delay of clerks and the other discharge related
clerks in the morning due to their changing their cloths and long
greeting with each other 3.COMMON CAUSE: clerks should go to all departments such as lab,
radiology,…etc. to collect documents, check and correct
them and it is really time consuming
Clerks delay 5.all CTQs
With omission of special cause, in practice, discharge time has decreased from 14 to
12:15.
With solve the common cause by buying HIS system it decrease more and reach to less
than 11a.m.
Ultimately, in the fifth phase (Control): After conducting the improvement projects, through applying SPC devices the process was checked to be under the control and favorable result was obtained. 3. Financial achievement (visible and invisible)
3-1. Increase is customer satisfaction(from 40% to more than 60%)
3-2. Omission of extra lunch for patients and her/his family who stay for discharge delay
3-3. Omission of night shift for laundry, omitted night shift salary and costs
3-4. Salary of three free operation-room technicians in morning shift saves
3-5. Reduction of human wasting time and energy and consequently cost (at least 3 clerks every
day and each 3hours)
3-6. Increase in number of surgery in operation room (increase in operation room capacity)
3-7. Knowing early how many beds will become available each day, also eased the backlog of
patients trying to get into beds and offloads workloads specially for evening shift.