Achieving a High-Performance Health Care System with Universal Access: What the United States Can...
21
Achieving a High-Performance Health Care System with Universal Access: What the United States Can Learn from Other Countries American College of Physicians* This issue contains a 3-part article about improving health care in the United States. Unlike previous highly focused policy papers by the American College of Physicians, this article takes a comprehen- sive approach to improving access, quality, and efficiency of care. The first part describes health care in the United States. The second compares it to health care in other countries. The concluding sec- tion proposes lessons that the U.S. can learn from these countries and recommendations for achieving a high-performance health care system in the United States. The articles are based on a position paper developed by the American College of Physicians’ Health and Public Policy Committee. This policy paper (not included in this article) also provides a detailed analysis of health care systems in 12 other industrialized countries. Although we can learn much from other health systems, the College recognizes that our political and social culture, demograph- ics, and form of government will shape any solution for the United States. This caution notwithstanding, we have identified several approaches that have worked well for countries like ours and could probably be adapted to the unique circumstances in the United States. www.annals.org For author affiliations, see end of text. HEALTH CARE IN THE UNITED STATES For most Americans, high-quality care generally is readily accessible without long waits but at high cost. However, the uninsured and, increasingly, the underin- sured, the poor, and members of underserved minorities often have poor access to health care and poor health out- comes—in some cases worse than that of residents of de- veloping countries. The health workforce is well trained, yet the United States faces a severe shortage of primary care physicians. Most Americans—250 million (84.2%)— have some form of health insurance coverage. But an estimated 47 million Americans (15.8%) were uninsured for a year, as reported for 2006 by the U.S. Bureau of the Census (1). A survey by the Centers for Disease Control and Prevention found that 43.6 million people (14.8%) of all ages were uninsured at the time of the National Health Expenditure Survey interview in 2006 (2). However, as many as 89.5 million people under the age of 65 lacked health insurance for at least 1 month or more during 2006 –2007, according to a study by Lewin and associates published by Families USA (3). In addition, another 16 million people can be considered underinsured (4). People without health insur- ance are much less likely than those with insurance to receive recommended preventive services and medications, are less likely to have access to regular care by a personal physician, and are less able to obtain needed health care services. Consequently, the uninsured are more likely to succumb to preventable illnesses, more likely to suffer complications from those illnesses, and more likely to die prematurely (5, 6). Even among those with health insurance coverage, wide variations exist within the United States concerning cost, utilization, quality, and access to health care services (7, 8). For example, Medicare spending per capita in 1996 was $8414 per enrollee in the Miami, Florida, region com- pared with $3341 in the Minneapolis, Minnesota, region (8). Most of the variations among geographic areas are due to differences in the volume and intensity of practice (that is, differences in the quantity of services provided per cap- ita) (7, 8). Yet, patients in high-intensity areas on average have outcomes that are no better, and perhaps worse, than those in geographic areas with lower rates of utilization (9, 10). Americans receive appropriate preventive, short-term, and long-term health care as recommended by professional guidelines only about 55% of the instances in which those recommendations would apply (11). The Institute of Med- icine has documented high levels of medical errors and inappropriate and unnecessary care, indicating system-wide problems with delivering consistently high-quality care (12, 13). Approximately 45% of the U.S. population has a chronic medical condition, and about 60 million people, See also: Print Editorial comment Web-Only Conversion of graphics into slides *This paper, written by Jack A. Ginsburg, Robert B. Doherty, J. Fred Ralston Jr., MD, and Naomi Senkeeto, was developed for the Health and Public Policy Committee of the American College of Physicians (ACP): J. Fred Ralston Jr., MD (Chair); Molly Cooke, MD (Vice Chair); Charles Cutler, MD; David A. Fleming, MD; Brian P. Freeman, MD; Robert A. Gluckman, MD; Mark Liebow, MD; Robert M. McLean, MD; Kenneth A. Musana, MBChB; Patrick M. Nichols; Mark W. Purtle, MD; P. Preston Reynolds, MD; and Kathleen M. Weaver, MD; with contributions from David C. Dale, MD (ACP President, ex officio); Joel S. Levine, MD (Chair, ACP Board of Regents); and Joseph W. Stubbs, MD (Chair, ACP Medical Service Committee). It was approved by the ACP Board of Regents on 27 October 2007. Annals of Internal Medicine Position Paper © 2008 American College of Physicians 1 Ann Intern Med. 2008;148.
Transcript of Achieving a High-Performance Health Care System with Universal Access: What the United States Can...

Achieving a High-Performance Health Care System with UniversalAccess: What the United States Can Learn from Other CountriesAmerican College of Physicians*
This issue contains a 3-part article about improving health care inthe United States. Unlike previous highly focused policy papers bythe American College of Physicians, this article takes a comprehen-sive approach to improving access, quality, and efficiency of care.The first part describes health care in the United States. The secondcompares it to health care in other countries. The concluding sec-tion proposes lessons that the U.S. can learn from these countriesand recommendations for achieving a high-performance health caresystem in the United States. The articles are based on a positionpaper developed by the American College of Physicians’ Health andPublic Policy Committee. This policy paper (not included in thisarticle) also provides a detailed analysis of health care systems in 12
other industrialized countries.Although we can learn much from other health systems, the
College recognizes that our political and social culture, demograph-ics, and form of government will shape any solution for the UnitedStates. This caution notwithstanding, we have identified severalapproaches that have worked well for countries like ours and couldprobably be adapted to the unique circumstances in the UnitedStates.
www.annals.orgFor author affiliations, see end of text.
HEALTH CARE IN THE UNITED STATES
For most Americans, high-quality care generally isreadily accessible without long waits but at high cost.However, the uninsured and, increasingly, the underin-sured, the poor, and members of underserved minoritiesoften have poor access to health care and poor health out-comes—in some cases worse than that of residents of de-veloping countries. The health workforce is well trained,yet the United States faces a severe shortage of primary carephysicians.
Most Americans—250 million (84.2%)—have someform of health insurance coverage. But an estimated 47million Americans (15.8%) were uninsured for a year, asreported for 2006 by the U.S. Bureau of the Census (1). Asurvey by the Centers for Disease Control and Preventionfound that 43.6 million people (14.8%) of all ages wereuninsured at the time of the National Health ExpenditureSurvey interview in 2006 (2). However, as many as 89.5million people under the age of 65 lacked health insurancefor at least 1 month or more during 2006–2007, accordingto a study by Lewin and associates published by FamiliesUSA (3). In addition, another 16 million people can beconsidered underinsured (4). People without health insur-ance are much less likely than those with insurance toreceive recommended preventive services and medications,are less likely to have access to regular care by a personalphysician, and are less able to obtain needed health careservices. Consequently, the uninsured are more likely tosuccumb to preventable illnesses, more likely to suffercomplications from those illnesses, and more likely to dieprematurely (5, 6).
Even among those with health insurance coverage,wide variations exist within the United States concerningcost, utilization, quality, and access to health care services(7, 8). For example, Medicare spending per capita in 1996was $8414 per enrollee in the Miami, Florida, region com-pared with $3341 in the Minneapolis, Minnesota, region(8). Most of the variations among geographic areas are dueto differences in the volume and intensity of practice (thatis, differences in the quantity of services provided per cap-ita) (7, 8). Yet, patients in high-intensity areas on averagehave outcomes that are no better, and perhaps worse, thanthose in geographic areas with lower rates of utilization (9,10). Americans receive appropriate preventive, short-term,and long-term health care as recommended by professionalguidelines only about 55% of the instances in which thoserecommendations would apply (11). The Institute of Med-icine has documented high levels of medical errors andinappropriate and unnecessary care, indicating system-wideproblems with delivering consistently high-quality care(12, 13).
Approximately 45% of the U.S. population has achronic medical condition, and about 60 million people,
See also:
PrintEditorial comment
Web-OnlyConversion of graphics into slides
*This paper, written by Jack A. Ginsburg, Robert B. Doherty, J. Fred Ralston Jr., MD, and Naomi Senkeeto, was developed for the Health and Public Policy Committee of the AmericanCollege of Physicians (ACP): J. Fred Ralston Jr., MD (Chair); Molly Cooke, MD (Vice Chair); Charles Cutler, MD; David A. Fleming, MD; Brian P. Freeman, MD; Robert A.Gluckman, MD; Mark Liebow, MD; Robert M. McLean, MD; Kenneth A. Musana, MBChB; Patrick M. Nichols; Mark W. Purtle, MD; P. Preston Reynolds, MD; and Kathleen M.Weaver, MD; with contributions from David C. Dale, MD (ACP President, ex officio); Joel S. Levine, MD (Chair, ACP Board of Regents); and Joseph W. Stubbs, MD (Chair, ACPMedical Service Committee). It was approved by the ACP Board of Regents on 27 October 2007.
Annals of Internal Medicine Position Paper
© 2008 American College of Physicians 1
Ann Intern Med. 2008;148.
half of these, have multiple chronic conditions (14). Forthe Medicare program, 83% of beneficiaries have 1 ormore chronic medical conditions and 23% have 5 or morechronic medical conditions (15). By 2015, an estimated150 million Americans will have at least 1 chronic medicalcondition (14).
The U.S. health care system has much potential forimprovement. Disparities related to race, ethnicity, and so-cioeconomic status pervade the U.S. health care system(16). In addition to the large numbers of Americans wholack adequate health insurance, the cost, quality, and utili-zation of health care services vary widely. Meanwhile, theneed for long-term care services and care coordination isincreasing. Preventive care, cross-discipline coordination,and proactive management of long-term care might reducethe cost of care, but these services often are uncovered orpoorly reimbursed.
The Cost of Health Care in the United StatesSpending on health care in the United States has been
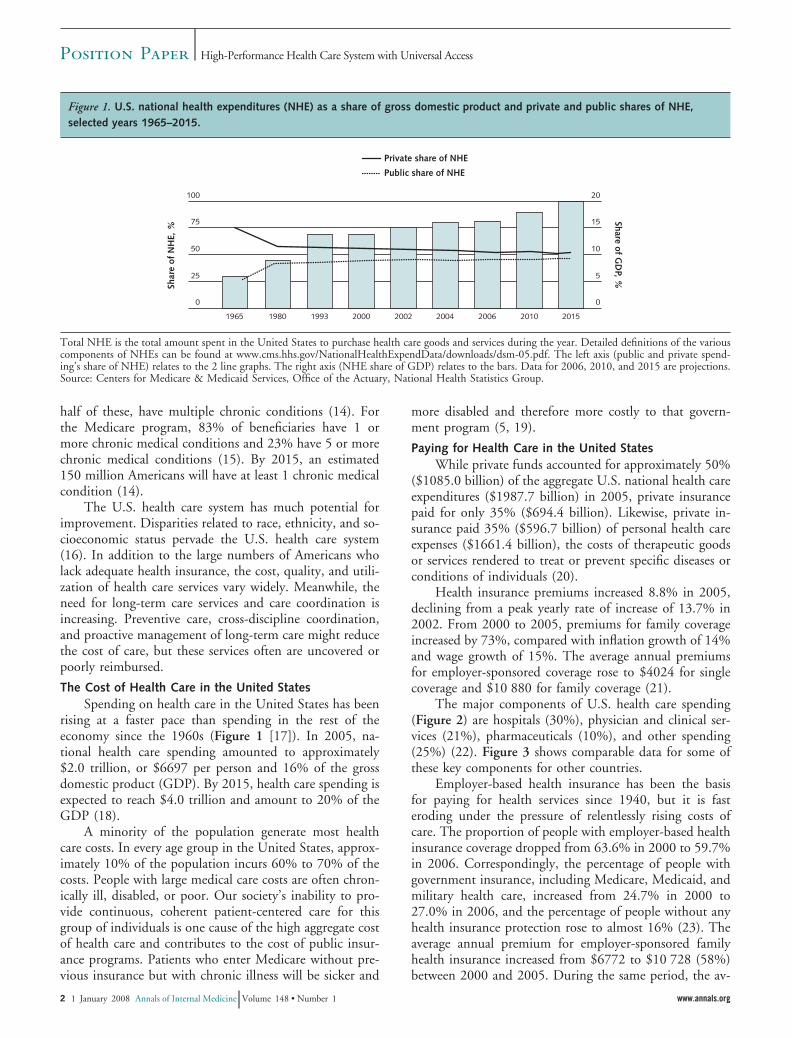
rising at a faster pace than spending in the rest of theeconomy since the 1960s (Figure 1 [17]). In 2005, na-tional health care spending amounted to approximately$2.0 trillion, or $6697 per person and 16% of the grossdomestic product (GDP). By 2015, health care spending isexpected to reach $4.0 trillion and amount to 20% of theGDP (18).
A minority of the population generate most healthcare costs. In every age group in the United States, approx-imately 10% of the population incurs 60% to 70% of thecosts. People with large medical care costs are often chron-ically ill, disabled, or poor. Our society’s inability to pro-vide continuous, coherent patient-centered care for thisgroup of individuals is one cause of the high aggregate costof health care and contributes to the cost of public insur-ance programs. Patients who enter Medicare without pre-vious insurance but with chronic illness will be sicker and
more disabled and therefore more costly to that govern-ment program (5, 19).
Paying for Health Care in the United StatesWhile private funds accounted for approximately 50%
($1085.0 billion) of the aggregate U.S. national health careexpenditures ($1987.7 billion) in 2005, private insurancepaid for only 35% ($694.4 billion). Likewise, private in-surance paid 35% ($596.7 billion) of personal health careexpenses ($1661.4 billion), the costs of therapeutic goodsor services rendered to treat or prevent specific diseases orconditions of individuals (20).
Health insurance premiums increased 8.8% in 2005,declining from a peak yearly rate of increase of 13.7% in2002. From 2000 to 2005, premiums for family coverageincreased by 73%, compared with inflation growth of 14%and wage growth of 15%. The average annual premiumsfor employer-sponsored coverage rose to $4024 for singlecoverage and $10 880 for family coverage (21).
The major components of U.S. health care spending(Figure 2) are hospitals (30%), physician and clinical ser-vices (21%), pharmaceuticals (10%), and other spending(25%) (22). Figure 3 shows comparable data for some ofthese key components for other countries.
Employer-based health insurance has been the basisfor paying for health services since 1940, but it is fasteroding under the pressure of relentlessly rising costs ofcare. The proportion of people with employer-based healthinsurance coverage dropped from 63.6% in 2000 to 59.7%in 2006. Correspondingly, the percentage of people withgovernment insurance, including Medicare, Medicaid, andmilitary health care, increased from 24.7% in 2000 to27.0% in 2006, and the percentage of people without anyhealth insurance protection rose to almost 16% (23). Theaverage annual premium for employer-sponsored familyhealth insurance increased from $6772 to $10 728 (58%)between 2000 and 2005. During the same period, the av-
Figure 1. U.S. national health expenditures (NHE) as a share of gross domestic product and private and public shares of NHE,selected years 1965–2015.
Total NHE is the total amount spent in the United States to purchase health care goods and services during the year. Detailed definitions of the variouscomponents of NHEs can be found at www.cms.hhs.gov/NationalHealthExpendData/downloads/dsm-05.pdf. The left axis (public and private spend-ing’s share of NHE) relates to the 2 line graphs. The right axis (NHE share of GDP) relates to the bars. Data for 2006, 2010, and 2015 are projections.Source: Centers for Medicare & Medicaid Services, Office of the Actuary, National Health Statistics Group.
Position Paper High-Performance Health Care System with Universal Access
2 1 January 2008 Annals of Internal Medicine Volume 148 • Number 1 www.annals.org

erage annual premium cost for single-person coverage in-creased from $2655 to $3991 (50%). Premiums increased60% for employees over the 5-year period, from $1614 to$2585 (24). As health insurance premiums have risen, em-ployers have reduced their costs by decreasing or droppingcoverage or benefits, shifting to managed care plans, adopt-ing pharmacy benefit management plans, and increasingthe extent of cost sharing between employer and employee.
From 1999 to 2003, the percentage of workers en-rolled in employer-sponsored health plans that requiredcost-sharing of hospital bills increased from 33.8% to54.7%, an increase of more than 60%, and the proportionof workers subject to copayments greater than $10 for phy-sician visits more than doubled (25). In 2005, 76.7% ofnonfederal employees enrolled in employer-sponsoredhealth insurance paid a copayment for doctor visits. Theaverage copayment was $18.20 (26). Copayments detersome insured people from obtaining needed care (27). Inaddition, high health insurance costs deter employers whodo not provide health insurance from buying coverage fortheir employees and make it nearly impossible for mostuninsured people to buy more expensive individual policieson their own (28).
Despite the growing need for coordination of healthcare services, government and private insurers pay forhealth care services primarily on an episodic, visit-relatedbasis with few, if any, incentives for providing comprehen-
sive, coordinated, and continuous care for the preventionand management of chronic illness. Primary care physi-cians now spend about 20% of their time in unreimbursedcoordination of care tasks using the telephone or e-mail(29). Unless changes are made in payment policy to com-pensate for these services, disincentives for care coordina-tion will continue while the need will increase.
Government ProgramsGovernment pays 46% of all U.S. health care costs
through public programs. Medicare pays 17%, Medicaidand the State Children’s Health Insurance Program(SCHIP) account for 16%, and other public programs(such as Veterans Health Administration, Department ofDefense, workers’ compensation, and public health) pay13%. Despite repeated attempts to rein in federal expen-ditures for Medicare and Medicaid, federal expenditureshave continued to increase much faster than inflation inthe entire economy (30).
Figure 3. Percentage of health care costs paid out of pocket,2004.
Data are from a previous year for 2 countries: For the Slovak Republic,data are from 2003; for Japan, data are from 2002. Recent data areavailable only for 26 of the 30 Organization for Economic Co-operationand Development (OECD) countries. Source: Congressional ResearchService based on OECD Health Data 2006 (October 2006).
Figure 2. The nation’s health dollar, calendar year 2005:where it went.
“Physician and Clinical Services” includes offices of physicians, outpa-tient care centers, and medical and diagnostic laboratories. “OtherSpending” includes dentist services, other professional services, homehealth, durable medical products, over-the-counter medicines and sun-dries, public health, other personal health care, research, and structuresand equipment. Source: Centers for Medicare & Medicaid Services, Of-fice of the Actuary, National Health Statistics Group.
Position PaperHigh-Performance Health Care System with Universal Access
www.annals.org 1 January 2008 Annals of Internal Medicine Volume 148 • Number 1 3
Medicare
Currently, approximately 42.5 million Americans arecovered by the Medicare program: 35.6 million because ofeligibility based on age and 6.7 million because of disabil-ity, including those being treated for end-stage renal dis-ease. Total Medicare expenditures in 2005 were $342 bil-lion (31).
Medicare Part A reimburses hospitals for covered ser-vices for inpatient care. It also reimburses skilled nursingfacilities for covered services, but not for custodial or long-term care. It also covers hospice care and some homehealth care for qualified beneficiaries. The source of fund-ing is primarily payroll contributions (Federal Insurance
Medicare Part B covers medically necessary physicianservices, outpatient care, diagnostic and laboratory services,some supplies, and some services, such as care by physicaland occupational therapists and some home health care notcovered by Part A. Beneficiaries pay monthly premiums forPart B to the Supplemental Medical Insurance Trust Fund.The other source of funding is the federal governmentfrom general revenues. The Medicare Modernization Actof 2003, increased Part B premiums and established grad-uated payments on an income-based scale for individualswith incomes above $82 000 and for couples with incomesabove $164 000. The scale is indexed to rise with inflation.
Medicare Part C provides an option (Medicare Advan-tage) for beneficiaries to enroll in private insurance plansthat are approved to provide Medicare benefits. MedicareAdvantage plans provide all Part A and Part B coverage andgenerally offer extra benefits or lower costs. Many includePart D drug coverage. These plans receive capitated pay-ments from Medicare and often restrict covered services toprovider networks, such as preferred-provider organiza-tions, health maintenance organizations, and private fee-for-service plans.
Under the traditional Medicare program, doctors,
to schedules that set the maximum fees that Medicare willreimburse. Beneficiaries in the original program—still byfar the largest component of Medicare—must pay annualdeductibles and co-insurance or copayments for coveredservices and supplies.
In 2006, Medicare prescription drug coverage becameavailable as Medicare Part D. All Medicare beneficiaries areeligible to enroll in Part D. Coverage is provided throughprivate insurance companies, and enrollment is voluntary.Beneficiaries must pay monthly premiums. Previously,many Medicare beneficiaries purchased private supplemen-tal insurance (Medigap) to obtain coverage for prescriptiondrugs. However, following implementation of MedicarePart D, insurers are not offering new Medigap policiescovering prescription drugs (32).
Medicaid
The Medicaid program provides medical benefits toover 52 million people who meet categorical eligibilitystandards. It covers about 25% of U.S. children (21 mil-lion), and supplements Medicare coverage for 7 millionelderly and disabled people. Children account for almosthalf of the enrollees, but 70% of the expenditures are forcare of elderly (25%) and disabled (45%) adults (33). Thefederal government establishes general guidelines for theprogram, but each state sets its own rules on eligibility andservices. States may also offer additional coverage for op-tional services. The federal government and the states shareresponsibility for funding Medicaid. In 2005, Medicaidspending, exclusive of SCHIP, amounted to $313 billion,with federal funds accounting for about $179 billion(57%) and state funds accounting for approximately $134billion (43%). The federal share for each state ranged from50% to 77%, depending on average personal income ineach state (34).
SCHIP was enacted in 1997 to expand health coveragefor children in families with incomes that are low butabove the level for Medicaid eligibility. By 2005, about 4.2million children were covered by the program. SCHIP isjointly financed by the federal and state governments but isadministered by the states. In 2005, total expenditures forSCHIP were $5.5 billion, with the federal governmentproviding $3.8 (69%) and state governments funding $1.7billion (31%) (31). Legislative authorization for SCHIPexpired on 30 September 2007. Disagreement betweenPresident Bush and Congress on funding and eligibility hasled the President to veto legislation to reauthorize the pro-gram, and to date there have been insufficient votes in theHouse of Representatives to override a veto. In the mean-time, Congress has maintained funding for SCHIP under atime-limited temporary extension.
Veterans Health Administration
The Veterans Health Administration (VA) provides arange of benefits and services to about 5.5 million eligibleveterans and their dependents, primarily by salaried physi-cians working in government-owned facilities. The VA is asingle-payer system that may provide some important les-sons for the rest of the U.S. health care system.
The VA operates 156 hospitals, 135 nursing homes,43 residential rehabilitation treatment centers, and 711community-based outpatient clinics. It is the nation’s larg-est integrated direct health care delivery system. The VAfacilities are affiliated with 107 of the nation’s 126 medicalschools and 1200 other health professions schools (35).Veterans who became disabled because of a service-relatedinjury or illness have first priority for access to VA healthcare. Other veterans have access or are not depending onannual discretionary appropriations by Congress. Fundsare allocated to geographic regions that typically containseveral hospitals. If funding runs out before the end of afiscal year, services are curtailed.
Position Paper High-Performance Health Care System with Universal Access
4 1 January 2008 Annals of Internal Medicine Volume 148 • Number 1 www.annals.org
Hospital Insurance Trust Fund.Contributions Act) from workers and employers to the
other providers, and suppliers receive payments according
In the mid-1990s, the VA responded to criticism ofdeficiencies in VA health care by adopting a system-widereorganization. Reforms included modernization of facili-ties, reorganization and decentralization, reduction of in-patient capacity, and reallocation of greater resources toambulatory care. The VA developed patient data registries,an electronic medical record (EMR) system, and a com-mitment to improving quality and patient safety (36). Re-forms included adoption of a performance-based incentivesystem and other measures to improve quality, and in-creased emphasis on primary care, preventive services, andcase management for long-term care (36). As a result, theVA has become a leader in developing a coordinated sys-tem of care and health care quality improvement. Compar-isons of VA patients with a national sample show that VApatients receive higher quality of care, with highest qualityin areas where the VA actively monitors performance (37).The VA patients received higher-quality long-term andpreventive care than Medicare patients, particularly forsuch diseases as diabetes (38). The VA’s reorganization andplacement of greater emphasis on outpatient primary carehas resulted in better access to care for veterans who havehad trouble accessing care in the private sector (39). TheVA is also a leader in providing comprehensive rehabilita-tion services for spinal cord injuries, for which it integratesvocational, psychological, and social services within a con-tinuum of care that involves a team-based approach (40).
The VA has managed prescription drug costs astutely.The VA relies on a formulary that encourages the use ofgeneric and lower-cost drugs. Costs are also reduced bycombining purchasing power with the Department of De-fense to jointly purchase drugs and by using a highly au-tomated mail order system that dispenses more than threefourths of all VA prescriptions (41). One recent studyfound that the prices paid for drugs most often used byseniors under the Medicare Part D drug plan are 60%higher than prices paid for the same drugs by the VA (42).However, critics contend that comparing drug costs in theVA and Medicare is unfair because the VA is a closedsystem, with drugs restricted to a formulary and dispensedonly through the mail or at government-owned pharma-cies. They also note that the drugs approved for the for-mulary are typically older than those generally available.The VA formulary contains only 38% of drugs approvedby the U.S. Food and Drug Administration in the 1990sand 19% of drugs approved since 2000. One study indi-cates that using older drugs is associated with a 2-monthshorter life expectancy worth $25 000 in economic value(43).
The success of the VA system in dramatically restruc-turing itself indicates that major gains can be achieved inthe United States in improving health care access and qual-ity while reducing costs. Although reforms may be morereadily achievable in a closed single-payer system, such asthe VA, the VA experience provides some key lessons forimproving health care system performance. These lessons
include shifting services to outpatient care, placing greateremphasis on primary and preventive care, facilitating casemanagement for long-term care, adopting informationtechnology and a system-wide EMR, use of performancemeasurement, and controlling prescription drug costs.
Out-of-Pocket SpendingIndividuals in the United States pay 13% of all health
care costs out of pocket. Rising costs create an especiallysevere financial burden for individuals who must payhealth care costs out of pocket. Rising health care costs alsocontribute to increased personal debt and bankruptcy rates(44, 45). In 2001–2002, nearly 1 in 6 families (27 million)spent 10% or more of their income (5% or more if low-income) on out-of-pocket medical costs (45).
One response to rising health care costs has been theadoption of consumer-directed health plans in which theindividual takes greater responsibility for paying for care
Increased cost sharing is one means to encourage patientsto be more cost conscious and to use health services morejudiciously. Unfortunately, for those with modest incomes,cost sharing has reduced medically necessary care, such astaking medicines for hypertension (4, 46).
Physician WorkforceThe United States is in the midst of a primary health
care workforce crisis that is expected to worsen precipi-tously in the next decade. The population is aging, andBaby Boomers, the largest subcohort of the population,will soon be over age 65 and at greater risk for needing carefor chronic conditions (47). Yet the United States currentlydoes not have national policies to guide the training, sup-ply, and distribution of health care providers to meet fu-ture needs for particular specialties of medicine, such asprimary care.
Primary care physicians are leaving practice soonerthan other physician specialists at the same time that thenumbers of medical students and residents choosing topursue careers in primary care are declining rapidly. TheU.S. primary care workforce is undergoing a gradual butinexorable contraction that will seriously affect access tocare (48). The long-term result will be higher costs, lowerquality, diminished access, and decreased patient satisfac-tion (49). The health care system will become increasinglyfragmented, overspecialized, and costly.
Technology and InnovationTechnological innovation is a hallmark of U.S. medi-
cine. Anyone in the United States with adequate insuranceor the ability to pay has access to the latest clinically effec-tive technology with little or no waiting time (49). TheUnited States has no effective public policies to restrain thespread of technology, which often occurs before adequateevaluation of its effectiveness. Even when research showsthat technology is ineffective for some groups of patients,translating these research findings into more selective deci-sion making often proceeds slowly, requires educational
Position PaperHigh-Performance Health Care System with Universal Access
www.annals.org 1 January 2008 Annals of Internal Medicine Volume 148 • Number 1 5
out of pocket, rather than the employer or government.

efforts to promote best practices, and encounters resistancefrom practitioners.
Diffusion of new technology into practice is associatedwith greater per capita utilization and higher spending(50). Technological progress accounts for a large share ofthe rise in U.S. health care expenditures (51). Many newbiotechnology products (for example, monoclonal antibod-ies against tumor necrosis factor) are very effective but alsoextremely expensive when taken regularly for chronic dis-eases, such as arthritis.
The United States also lacks centralized authority forcoordinating assessments of the clinical effectiveness orcost-effectiveness of new technology. Instead, technologyassessments are conducted by various public and privateorganizations, including the Agency for Healthcare Re-search and Quality (AHRQ), the Medicare Coverage Ad-visory Committee, Blue Cross/Blue Shield, and the VA.Evaluations of clinical effectiveness and determinations ofbest practices are also made by professional organizations,such as the American College of Physicians (ACP), theAmerican College of Cardiology, the American Heart As-sociation, and others. This pluralistic system leads to large-scale duplication of efforts to provide evidence-based guid-ance to good medical practice. This duplication of effort isnot necessary. At least 45 agencies in 22 countries, includ-ing AHRQ for the United States, share technology assess-ment information through the International Network ofAgencies for Health Technology Assessment.
The pluralistic health care system in the United Statesdoes not have effective ways of controlling the use of healthtechnology. Health insurance plans and health mainte-nance organizations are free to base coverage decisions onany available evaluations, to make their own assessments orpurchase them from private companies, or to ignore re-search findings. Likewise, physicians, hospitals, and pa-tients are free to order or utilize health care technologyregardless of whether they are clinically effective or cost-effective.
The Performance of the U.S. Health Care SystemCriteria for a Well-Functioning System
The Commonwealth Fund has developed a set of cri-teria for comparing and evaluating health care systems. InJuly 2005, it established an 18-member Commission on aHigh Performance Health System to chart a course foradvancing promising strategies for health system improve-ment (52). The Commission identified 37 indicators of“high performance” for measuring health systems (Table1). It aggregated performance indicators into broad catego-ries to measure and monitor health care outcomes. TheCommission used these indicators to identify top-perform-ing health systems to use as benchmarks against which tocompare health care systems.
The Commission then issued a national score card.The U.S. scores on 6 categories of system performanceranged from 51 to 71 on a scale in which systems with the
best scores were used as benchmarks and were rated at 100.Overall, the U.S. health care system received a score of 66(53).
The U.S. composite scores for each of the 6 categoriesare listed after each category: long, healthy, and productivelives: 69; quality: 71; access: 67; efficiency: 51; equity: 71;capacity to innovate and improve: not scored.
Commonwealth Fund Commission Key Indicators for
Long, Healthy, and Productive Lives. The Common-wealth Commission defined the overarching mission of ahigh-performance health care system as being “to help ev-eryone, to the extent possible, lead long, healthy, and pro-ductive lives.” All performance indicators reflect on a sys-tem’s ability to achieve this goal. Specific measures ofhealth outcomes for this indicator include high life expect-ancy, low preventable mortality, low infant mortality, andlow proportions of adults with limitations on their activi-ties. The U.S. ranked last overall on all 3 indicators of healthylives. The U.S. infant mortality rate is 7.0 deaths per 1000live births, compared with 2.7 in the top 3 countries.
Quality. A well-functioning, high-performance healthcare system would provide care that is necessary, appropri-ate, and of high quality. Care would be provided in accordwith evidence of clinical effectiveness and with a minimumof avoidable errors. Indicators of high quality include pro-vision of preventive care services, management of chronicdiseases, care coordination, provision of patient-centeredcare, low nursing home admission and readmission rates,low instances of medical errors, and low preventable deathrates. The United States scored well on the provision ofpreventive care but received low scores on long-term caremanagement, safe care, and patient-centered care. Foroverall quality, the United States ranked fifth and Canadaranked sixth.
Access. In a high-performance health care system,needed health care services would be readily accessible toall members of the population. Measures of access includehealth insurance coverage, ability to see a physician andobtain needed medical attention, families spending lessthan 10% of income on out-of-pocket medical costs andpremiums (5% if low income), ease of obtaining after-hours care, short waiting times for doctor appointments,and a minimal number of patients with problems withmedical bills or high medical debts. With 47 million un-insured, the United States ranked last on access. However,the report noted that insured patients in the United Stateshave rapid access to specialized care. Overall, Germanyranked first on access.
Efficiency. A well-functioning system would have lowrates of overuse, inappropriate use, or waste; minimal ex-penditures for administrative and regulatory cost; and useof information tools (for example, health information tech-nology and EMRs) to support efficient care. Of the 6countries compared, the United States ranked last in terms
Position Paper High-Performance Health Care System with Universal Access
6 1 January 2008 Annals of Internal Medicine Volume 148 • Number 1 www.annals.org
Measuring Performance

Table 1. National Scorecard on U.S. Health System Performance
Indicator U.S. NationalRate
Benchmark BenchmarkRate
Score: Ratio ofUnited Statesto Benchmark
Mortality amenable to health care, deaths per 100 000population
115 Top 3 of 19 countries 80 70
Infant mortality, deaths per 1000 live births 7.0 Top 3 of 23 countries 2.7 39Healthy life expectancy at age 60, y 16.6 Top 3 of 23 countries 19.1 87Adults under 65 limited in any activities because of
physical, mental, or emotional problems, %14.9 Top 10% states 11.5 77
Children missed 11 or more school days due to illness orinjury, %
5.2 Top 10% states 3.8 73
Adults received recommended screening and preventivecare, %
49 Target 80 61
Children received recommended immunizations andpreventive care†
Various Various Various 85
Needed mental health care and received treatment† Various Various Various 66Chronic disease under control† Various Various Various 61Hospitalized patients received recommended care for
AMI, CHF, and pneumonia (composite) , %84 Top hospitals 100 84
Adults under 65 with accessible primary care provider, % 66 65� y, high income 84 79Children with a medical home, % 46 Top 10% states 60 77Care coordination at hospital discharge† Various Various Various 70Nursing homes: hospital admissions and readmissions
among residents†Various Various Various 64
Home health: hospital admissions, % 28 Top 25% agencies 17 62Patients reported medical, medication, or lab test error, % 34 Best of 6 countries 22 65Unsafe drug use† Various Various Various 60Nursing home residents with pressure sores† Various Various Various 67Hospital-standardized mortality ratios, actual to expected
deaths101 Top 10% hospitals 85 84
Ability to see doctor on same/next day when sick orneeded medical attention, %
47 Best of 6 countries 81 58
Very/somewhat easy to get care after hours withoutgoing to the emergency department, %
38 Best of 6 countries 72 53
Doctor–patient communication: always listened,explained, showed respect, spent enough time, %
54 90th percentile Medicare plans 74 74
Adults with chronic conditions given self-managementplan, %
58 Best of 6 countries 65 89
Patient-centered hospital care† Various Various Various 87Adults under 65 insured all year, not underinsured, % 65 Target 100 65Adults with no access problem due to costs, % 60 Best of 5 countries 91 66Families spending �10% of income or �5% of income, if
low income, on out-of-pocket medical costs andpremiums, %
83 Target 100 83
Population under 65 living in states where premiums foremployer-sponsored health coverage are�15% of under-65 median household income, %
58 Target 100 58
Adults under 65 with no medical bill problems or medicaldebt, %
66 Target 100 66
Potential overuse or waste† Various Various Various 48Went to emergency department for condition that could
have been treated by regular doctor, %26 Best of 6 countries 6 23
Hospital admissions for ambulatory care sensitiveconditions†
Various Various Various 57
Medicare hospital 30-day readmission rates, % 18 10th percentile regions 14 75
fracture, and colon cancer, annual Medicare outlays in$; deaths per 100 beneficiaries
10th percentile regions 23 314; 27 88
Medicare annual costs of care for chronic diseases:diabetes, CHF, COPD†
Various Various Various 68
Percentage of national health expenditures spent onhealth administration and insurance, %
7.3 Top 3 of 11 countries 2.0 28
Physicians using electronic medical records, % 17 Top 3 of 19 countries 80 21Overall score – – – 66
* Source: The Commonwealth Fund, calculated from the OECD Health Data 2006 (www.commonwealthfund.org); Cylus J, Anderson GF. Multinational Comparisons ofHealth Systems Data, 2006. The Commonwealth Fund; May 2007. AMI � acute myocardial infarction; CHF � congestive heart failure; COPD � chronic obstructivepulmonary disease. Reproduced with permission from reference 85.† “Various” denotes indications that make up 2 or more related measures. Scores average the individual ratios for each component. For detailed information on the nationaland benchmark rates for individual components, please refer to Schoen C, Davis K, How SK, Schoenbaum SC. U.S. health system performance: a national scorecard. HealthAff (Millwood). 2006;25:w457-75. Epub 2006 Sep 20. [PMID: 16987933].
Position PaperHigh-Performance Health Care System with Universal Access
www.annals.org 1 January 2008 Annals of Internal Medicine Volume 148 • Number 1 7
26 829; 30Medicare annual costs of care and mortality for AMI, hip

of efficiency. The Commonwealth Fund found that theUnited States had poor performance in terms of measuresof national health expenditures, administrative costs, theuse of information technology, and the use of multidisci-plinary teams. It noted that “the US lags well behind othernations in the in the use of electronic medical records: 17percent of U.S. doctors compared with 80 percent in thetop three countries” (53).
Equity. Measures of equity in the health care systemreflect differences based on income, insurance status, andgeography (urban versus rural), as well as differencesamong population groups based on age, sex, race, and eth-nicity. A well-functioning system would have minimal dif-ferences among groups in terms of access to and quality ofhealth care services. The United States also ranked last onmeasures of equity, particularly because of inequities inaccess and quality based on income. The CommonwealthFund noted that there is a wide gap between low-incomeor uninsured populations and those with higher incomesand insurance. It also considered disparities among racialand ethnic groups and concluded that “Overall, it wouldrequire a 24% or greater improvement in African-Ameri-can mortality, quality, access and efficiency indicators toapproach benchmark white rates” (53).
Capacity to Innovate and Improve. A system’s ability toinnovate and improve is a crucial element for attaininghigh performance. The Commonwealth Commission didnot identify specific indicators or scores for this element.Measures could include investments in research (clinical,technological, pharmaceutical, and health services research)and having a health care infrastructure that fosters innova-tion. This indicator could also include having an infra-structure and workforce planning capacity to assure suffi-cient numbers of appropriately trained physicians andother health care professionals.
The Commonwealth Commission’s data indicate thatthe U.S. health care system has much room for improve-ment. The Commission concluded that
The Scorecard results make a compelling case forchange. Simply put, we fall far short of what is achiev-able on all major dimensions of health system perfor-mance. The overwhelming picture that emerges is oneof missed opportunities—at every level of the sys-tem—to make American health care truly the best thatmoney can buy (53).
The Commonwealth Commission estimated that clos-ing the gaps between actual and achievable performance asmeasured by its scorecard could save at least $50 billion to$100 billion per year in health care spending and couldprevent 100 000 to 150 000 deaths per year (53). In addi-tion it cited the Institute of Medicine’s estimate that thenation could achieve economic savings of up to $130 bil-lion per year from insuring the uninsured (54).
Clearly, the evaluations and comparisons by the Com-
monwealth Fund Commission indicate that the U.S.health care system must improve considerably to achievethe r performance levels attained by health care systems inother countries. The next section of this article contains adetailed comparison of health care systems in the UnitedStates and other countries.
THE U.S. HEALTH CARE SYSTEM COMPARED WITH
THAT IN OTHER COUNTRIES
Difficulties with Comparing Health Care in DifferentCountries
Although many individuals in the United States re-ceive exemplary health care, international comparisons onmost key indicators of the public’s health have shown thatthe United States has poorer health outcomes in the aggre-gate than many other industrialized countries. However,comparing health data from different countries can be dif-ficult because differences in health outcomes may also re-flect economic, demographic, social, and cultural factors.International comparisons by definition involve nationalaverages and fail to recognize wide variations within suchcountries as the United States, in which, for example, pub-lic spending on health varies from $59 per capita in Iowato $499 per capita in Hawaii and infant mortality ratesrange from 4.7 deaths per 1000 births in Massachusetts to10.1 in Mississippi (55). International comparisons aresubject to error because of differences in the way countries
of cross-national travel for health care—European Union(EU) citizens can now receive care anywhere within theEU—makes it difficult to attribute health outcomes tohealth care in one country. These caveats notwithstanding,the ACP believes that the United States has much to learnby closely examining how other countries’ health care sys-tems tried to solve the problems that underlie the UnitedStates’ low-ranking performance relative to its per capitanational health care expenditures, which rank first amongnations.
In the past, data for these comparisons generally werelimited to such indicators of health status as life expectancyand infant mortality and national health expenditures. In2001, the Organization for Economic Co-operation andDevelopment (OECD) began a project to measure andcompare health care quality among countries (56). In2005, OECD and the World Health Organization agreedto compile health data on countries in the EU and otherindustrialized countries. This international benchmarkingproject uses international standards and definitions, verifiesdata, and develops uniform methodological guidelines.Valid comparative data will enable researchers to betterunderstand how major changes to health care delivery af-fect health care quality (57). All nations stand to learnfrom the OECD health care project.
Position Paper High-Performance Health Care System with Universal Access
8 1 January 2008 Annals of Internal Medicine Volume 148 • Number 1 www.annals.org
define, report, and interpret data. Also, the growing practice

Expenditures for Health Care ServicesThe United States spends a greater share of its GDP
on health care than any other country. Data for 2005 fromthe OECD for its 30 member countries show that al-though the United States spent 15.3% of its GDP onhealth care, other industrialized countries were spending8% to 11%, with an average of 9.0% (58). Table 2 showsthat the United States spent $6401 per capita on health in2005, far more per person than any other country. Swit-zerland, with the next highest per capita health spending,spent only two thirds as much, $4177 per person. Otherindustrial countries, including Canada, France, Germany,Japan, and the United Kingdom, spent about half as muchper capita as the United States (59).
The reasons for these differences are not easily under-stood. Despite far greater expenditures, the volume ofmedical services (for example, physician and hospital visits)used by U.S. residents is roughly comparable to that of theother 29 OECD countries. In 1996, only 12% of the U.S.population was hospitalized per year, compared with 16%on average in OECD countries. The United States hasfewer inpatient hospital beds per 1000 people, but hospitalstays are generally shorter and less frequent in the UnitedStates. The differences in total and per capita expendituresappear to be due primarily to higher prices in the UnitedStates and greater intensity of services, including greateruse and earlier dispersion of technology (60).
As a wealthy nation, the United States can devote agreater share of its national income on health care than canother countries. As wealth increases, individuals and societyas a whole have greater means to purchase health care ser-vices, including services that in other countries might beconsidered discretionary or luxuries. Consequently, the
United States adopts and disperses new medical technol-ogy, such as computed tomography, magnetic resonanceimaging, neonatal intensive care units, cardiac and coro-nary artery bypass grafting, angioplasty, and positron-emis-sion tomography, more readily and more rapidly thanother countries (50). Although the United States producesand consumes more goods and services than any othercountry, resources still are limited and greater spending onhealth care will mean that less is available for other high-priority items, such as housing, education, and nationaldefense, or will contribute to the escalation of the publicdebt.
Administrative and Regulatory CostsDifferences in the definitions of administrative costs
and methods for measuring them have resulted in widelydiffering estimates. For example, one study (61) estimatedadministrative and regulatory costs to be 31.0% of healthcare expenditures in the United States ($1059 per capita),as compared with Canada’s rate of 16.7 % ($307 per cap-ita). However, OECD data for 2003 (Figure 4 [62]) indi-cate that the United States spent 7.3% of total nationalhealth expenditures on health administration and insur-ance costs; Germany spent 5.6%, and Canada spent 2.6%.
Studies performed by the Centers for Medicare &Medicaid Services (CMS) show that gross administrativeoverhead for private U.S. health insurance was 14.3% in2005 (18). The CMS data show that administrative costsfor the 42 million enrollees covered by Medicare Part A(hospital insurance) were less than 1.6% of disbursementsand were under 2.1% for the 40 million enrollees in Medi-care Part B (supplemental medical insurance). The CMS
Table 2. International Comparisons of Key Health Care Statistics
Variable United States Australia Belgium Canada Denmark France Germany Japan
Infant mortality per 1000 births (2004) 6.8† 5 3.7 5.3† 4.4 3.6 3.9 2.8Life expectancy at birth (2004) 77.8† 80.9 79.4† 80.2† 77.9 80.3 79 82Population age �65 y (2007), %‡ 12.5 13.1 17.4 13.3 15.2 16.4 19.4 20.0Obesity rate 32.2† 20.4† 12.7† 18 11.4 9.5† 13.6 3†Adult smoking rate 16.9 17.7† 20 17.3 26† 23† 24.3§ 26.3 (2006)Practicing physicians per 1000 persons 2.4 2.7† 4 2.2† 3.6 3.4 3.4† 2Generalists of practicing physicians (2000), %¶ 43.6 51.9 NA 47.5 19.1** 48.8 32.7 NAInpatient beds per 1000 persons 2.7 3.6† 4.4 2.9† 3.1† 3.7 6.4 8.2MRI units per 1 million persons 26.6† 4.2 6.8 5.5 10.2† 3.2 7.1 40.1Per capita health spending, $ 6401 3128† 3389 3326 3108 3374 3287 2358†Prescription drug spending per capita, $ 792 383 344 559 270 NA 438 425Drug spending as % of total health, $ 12.4 13.3 11.3 17.8 (2006) 8.9 16.4 15.2 19†
* Data are for 2005 (unless otherwise noted) from: World Health Organization. World Health Statistics 2007. Accessed at www.who.int/whosis/whostat2007.pdf on 22 May2007 and Organization for Economic Co-operation and Development (OECD). OECD Health Data 2007. Accessed at www.oecd.org/document/30/0,3343,en_2649_37407_12968734_1_1_1_37407,00.html on 23 July 2007. MRI � magnetic resonance imaging; NA � not available.† Latest available data: 2004.‡ CIA World Factbook. Age Structure 65 Years and Over (%) 2007. Accessed at www.photius.com/rankings/population/age_structure_65_years_and_over_2007_0.html on10 May 2007.§ Latest available data: 2003.� Latest available data: 2002.¶ Colombo F, Tapay N. Private Health Insurance in OECD Countries: The Benefits and Costs for Individual and Health Systems. OECD, 2006.** The low percentages of generalist physicians reported for Denmark and the Netherlands compared to other countries may be due to different methods for collecting andreporting workforce data. Further research is needed to better understand these apparent discrepancies.
Position PaperHigh-Performance Health Care System with Universal Access
www.annals.org 1 January 2008 Annals of Internal Medicine Volume 148 • Number 1 9
reported combined state and federal administrative costs

for Medicaid as less than 1% of disbursements (18). Whilethe estimates differ, they all show that administrative costsof private for-profit insurance plans in the United Statesare higher than those of Canada, other countries, and non-profit government programs in the United States. The dif-ferences reflect the added administrative costs incurred inthe United States by private insurance companies for ad-vertising, marketing, collecting premiums, and profits.
Out-of-Pocket CostsIn the United States, out-of-pocket spending by pa-
tients accounts for 13.2% of total health care spending, afigure that is less than the 14.9% share in Canada. Al-though the Canadian national health program does nothave cost sharing for covered health care services, Canadadoes not cover prescription drugs provided outside of hos-pitals. Figure 3 shows that out-of-pocket spending in theUnited States also accounts for a smaller share of totalhealth spending than in most other OECD countries, forwhich the average is 19.8 However, out-of-pocket expen-ditures in the United States are still higher in absoluteterms compared with other countries. Differences in cost-
sharing requirements and covered services in insuranceplans account for much of these differences among coun-tries (63).
Quality and Outcomes of Health Care in DifferentCountries
Recent surveys of patient care experiences and patientratings of various dimensions of care in the United Statesand 5 other countries (Australia, Canada, New Zealand,the United Kingdom, and Germany) show that patientsrank the United States health care system lower than healthsystems of other countries on several key measures. Peoplein these countries, whose physician workforces have alarger proportion of primary care physicians than theUnited States, see less need for a complete rebuilding oftheir health care systems, find their regular physicians’ ad-vice to be helpful, and feel that they receive coordinatedcare. As Figure 5 shows, the United States had the poorestratings on access, patient-centered care, unnecessary tests,prescription drug costs, adverse effects, and ratings of med-ical care received (64). The U.S. health care system rankedlast on patient safety, patient-centeredness, efficiency, andequity. Of 51 indicators of quality of care, the UnitedStates ranked first on only 6 indicators, including effective-ness of care, but last or tied for last on 27 (65).
Table 2 compares some key health statistics for se-lected countries. Measures of health (life expectancy atbirth, infant mortality, and deaths per 100 000 for diseasesof the respiratory system and for diabetes) indicate thathealth in the United States is not better than in otherindustrialized countries, and in many cases is clearly worse,despite the higher level of U.S. expenditures (58).
Some Health System Characteristics That May ExplainInternational Differences in Health System PerformanceCommitment to Primary Care
Most strongly performing health care systems havestrong primary care. Indeed, it is at the center of thesecountries’ systems. Strong primary care systems and prac-tice characteristics are associated with improved populationhealth. Systems that enhance the provision of primaryhealth care are associated with better overall mortalityrates, including premature death from asthma and bron-chitis, emphysema and pneumonia, and cardiovascular dis-ease (66). Access to primary care also is associated with amore equitable distribution of health in populations (67).Yet, the United States is in the midst of a primary healthcare workforce crisis and may not have a sufficient supplyof primary care physicians to meet future needs.
Control over Workforce Supply
Control over the supply of different types of physi-cians is another characteristic of well-performing healthcare systems. In the United Kingdom and Canada, coun-tries with single-payer systems, the government has lever-age to manipulate the health care workforce supply, includ-ing controlling both training capacity and employment
Figure 4. Percentage of national health expenditures spenton health administration and insurance, 2003.
Source: Commonwealth Fund National Scorecard on U.S. Health Sys-tem Performance: Complete Chartpack (62) (www.commonwealthfund.org). *Data from 2002. †Data from 1999. ‡Data from 2001. §Includesclaims administration, underwriting, marketing, profits, and other ad-ministrative costs; based on premiums minus claims expenses for privateinsurance.
Table 2—Continued
Netherlands New Zealand Switzerland United Kingdom
4.9 5.1 4.2 5.179.4 79 81.3 7914.2 11.8 15.6 15.810.7 20.9§ 7.7� 2331 22.5 26.8� 243.7† 2.2 3.8 2.4†
14.3** 69.2 50.7 31.83.1 6� 3.6 3.15.6 3.7§ 14.4 5.4
3094† 2343 4177 2724318 NA NA NA11.5† 12.4 10.4 NA
Position Paper High-Performance Health Care System with Universal Access
10 1 January 2008 Annals of Internal Medicine Volume 148 • Number 1 www.annals.org
F5

opportunities. In the United States, the federal govern-ment’s primary policy for influencing physician supply isthrough Medicare reimbursement of graduate medical ed-ucation residency training positions. The United Statesalso has limited funding to support primary care trainingprograms (Title VII) and scholarship programs with serviceobligations, such as the National Health Service Corps,Uniformed Services, and Indian Health Service.
Widespread Implementation of Electronic Health Records
Compared with countries with well-performing healthcare systems, the United States lags seriously in the imple-mentation of EMR systems in office practice. Comparedwith primary care doctors in 6 other countries, U.S. phy-sicians are among the least likely to have extensive clinicalinformation systems. In 2006, nearly all of the primarycare doctors in the Netherlands (98%), and 79% to 92%of doctors in Australia, New Zealand, and the UnitedKingdom, have EMR systems, while the rate was only 28%in the United States and 23% in Canada. Most doctors incountries with high rates of EMR systems routinely usethem to electronically order tests, prescribe medications,and access patients’ test results. Compared with doctors inthe United States, doctors in these countries are morelikely to receive computerized alerts about potential prob-lems concerning drug dosages and interactions, have re-minder systems to notify patients about preventive or fol-low-up care, and (except for the Netherlands) receive
generate such lists. Likewise, doctors in countries with highrates of EMR systems are 2 to 4 times as likely to say it iseasy to generate lists of patients who are due or overdue fortests or preventive care; only 20% of doctors in the UnitedStates report that it is easy (68).
LESSONS FROM OTHER COUNTRIES AND ACPRECOMMENDATIONS FOR REDESIGNING THE U.S.HEALTH CARE SYSTEM
of health care in 12 other industrialized
access to high-quality health care. Each system has pro-vided comparable or better health care at less cost than inthe United States. The United States has much to learnfrom these countries. The following section describes keylessons from these countries and recommendations thatbuild on these lessons. Figure 6 summarizes the lessonslearned and the recommendations that flow from them.
Paying for Health CareLesson 1: Well-functioning health systems all guarantee
that all residents will have access to affordable health cov-erage for a defined set of benefits (that is, universal cover-age). Countries have used different strategies to achieveuniversal coverage. Some have opted for a system fundedsolely by the national or provincial governments (single-payer systems, as in Canada, United Kingdom, Japan, andTaiwan), while others have a mix of public and privatesources of funding (pluralistic systems, as in Australia, Bel-gium, Denmark, France, Germany, the Netherlands, NewZealand, and Switzerland).
Lesson 2: Global budgets (Canada, Germany, NewZealand, Taiwan, the United Kingdom, and the U.S. Vet-
Figure 5. Commonwealth Fund overall rankings of 6 countries according to key indicators of performance.
Source: Calculated by the Commonwealth Fund based on the Commonwealth Fund 2004 International Health Policy Survey, the Commonwealth Fund2005 International Health Policy Survey of Sicker Adults, the 2006 Commonwealth Fund International Health Policy Survey of Primary CarePhysicians, and the Commonwealth Fund Commission on a High Performance Health System National Scorecard (65) (www.commonwealthfund.org).*Data from 2003.
Position PaperHigh-Performance Health Care System with Universal Access
www.annals.org 1 January 2008 Annals of Internal Medicine Volume 148 • Number 1 11
ACP analysis
prompts to provide patients with test results. More than60% of the doctors in the 4 countries with high EMR use,as well as those in Germany (where 42% have EMR sys-tems), say it is easy to generate lists of patients by diagnosisor health risk; in contrast, only 37% of U.S. doctors say itis easy, and 60% say it is somewhat difficult or worse to erans Administration) can help restrain health care
countries illustrates various approaches to assuring universal

Lesson
Well-functioning health systems guarantee that all residents have access to affordable health care. Countries differ in how they have chosen to achieve universal coverage; some have opted for a system funded solely by the national or provincial governments, whereas most others have opted for models that include a mix of public and private sources of funding.
Global budgets can help restrain health care costs, but do not provide incentives for improved efficiency unless they are set reasonably and targeted to small enough groups.
Cost savings can be achieved through the use of government power to negotiate prices but may result in shortages of services subject to price controls, delays in obtaining elective procedures, cost-shifting, and creation of parallel private sector markets.
In countries with shared authority between national and regional governments, universal coverage can be achieved by providing financial support from the national government to efforts by regional governments to establish their own programs.
Cost-sharing, designed so that low-income individuals pay no or nominal amounts, can help restrain costs while assuring that poorer individuals are still able to access services.
Societal investment in medical and other health professional education can help achieve a health care workforce that is balanced, well-trained, and in sufficient supply. Investment in primary and preventive care can result in better health outcomes, reduce costs, and may better assure an adequate supply of primary care physicians.
Effective physician payment systems include support for the role of primary care physicians, incentives for quality improvement and reporting, and incentives for care coordination. Higher quality of care can be encouraged through establishment of performance measures, financial incentives, and active monitoring of performance.
Uniform billing systems and electronic processing of claims improve efficiency and reduce administrative expenses.
Insufficient investments in research and medical technology result in reliance on outdated technologies and medical equipment and delay patients’ access to advances in medical science.
Recommendation
Provide universal health insurance coverage to ensure that all people within the United States have equitable access to appropriate health care. Federal and state governments should consider adopting one of the following pathways:
Single-payer systems, which generally have the advantage of being more equitable, with lower administrative costs than systems using private health insurance, lower per capita health care expenditures, high levels of consumer/patient satisfaction, and high performance on measures of quality and access. Such systems typically rely on global budgets and price negotiation to help restrain health care expenditures, which may result in shortages of services and delays in obtaining elective procedures and limit individuals’ freedom to make their own health care choices.
Pluralistic systems, which can be designed to assure universal access while allowing individuals the freedom to purchase private supplemen-tal coverage. Such systems are more likely to result in inequities in coverage and higher administrative costs.
Congress should encourage state innovation by providing dedicated federal funds to support state-based programs to cover all uninsured persons within the state.
Cost-sharing provisions should encourage patient cost-consciousness without deterring patients from receiving needed and appropriate services.
Develop a national health care workforce policy for the education and training of an adequate supply of health professionals to meet the nation’s health care needs, including primary care physicians.
Redirect federal health care policy toward supporting patient-centered health care that builds upon the relationship between patients and their primary care physicians and the patient-centered medical home.
Support initiatives that provide financial incentives to physicians for the voluntary achievement of evidence-based performance standards, to encourage quality improvement and reduction of avoidable medical errors, and incentives for systems performance that encourage comprehensive and continuous care coordination and prudent stewardship of health care resources.
Support an interoperable health information technology infrastructure with federal funds to assist physicians in acquiring technology that will enhance delivery of evidence-based patient-centered care.
Reduce administrative and regulatory burdens, such as multiple and duplicative physician credentialing forms and multiplicity of types of insurance forms, and their attendant costs.
Encourage public and private investments in all kinds of medical research, including research on the comparative effectiveness of different treatments, to foster continued innovation and improvements in health care.
Figure 6. Lessons learned and resulting American College of Physicians policy recommendations.
Position Paper High-Performance Health Care System with Universal Access
costs but do not provide effective incentives for improvedefficiency unless the annual expense budget is reasonableand the target region is small enough to motivate individ-ual providers to avoid overutilization of services.
Lesson 3: Cost savings can be achieved through the useof government power to negotiate prices (Belgium, Can-ada, Japan, and the U.S. Veterans Health Administration)but may result in shortages of the services that are subjectto price controls, delays in obtaining elective procedures,cost shifting, and creation of parallel private sector markets
for health care services for those who can afford to buyservices from sources not subject to price controls (Japan,New Zealand, and the United Kingdom).
Lesson 4: Countries that have federal systems in whichnational and regional governments share authority canachieve universal coverage by establishing a system inwhich regional governments receive substantial financialsupport from the national government but are free to es-tablish their own programs. In Canada, federal support issubject to federal requirements for provinces to assure
12 1 January 2008 Annals of Internal Medicine Volume 148 • Number 1 www.annals.org

cross-border consistency in benefits andcosts and access to services across regional borders.
Recommendation 1a: Provide universal health insur-ance coverage to assure that all people within the UnitedStates have equitable access to appropriate health care with-out unreasonable financial barriers. Health insurance cov-erage and benefits should be continuous and not depen-dent on place of residence or employment status. The ACPfurther recommends that the federal and state governmentsconsider adopting one or the other of the following path-ways to achieving universal coverage:
1. Single-payer financing models, in which one gov-ernment entity is the sole third-party payer of health carecosts, can achieve universal access to health care withoutbarriers based on ability to pay. Single-payer systems gen-erally have the advantage of being more equitable, withlower administrative costs than systems using privatehealth insurance, lower per capita health care expenditures,high levels of consumer and patient satisfaction, and highperformance on measures of quality and access. They mayrequire a higher tax burden to support and maintain suchsystems, particularly as demographic changes reduce thenumber of younger workers paying into the system. Suchsystems typically rely on global budgets and price negotia-tion to help restrain health care expenditures, which mayresult in shortages of services and delays in obtaining elec-tive procedures and limit individuals’ freedom to maketheir own health care choices.
2. Pluralistic systems, which involve government enti-ties as well as multiple for-profit or not-for-profit privateorganizations, can assure universal access, while allowingindividuals the freedom to purchase private supplementalcoverage, but are more likely to result in inequities in cov-erage and higher administrative costs (Australia and NewZealand). Pluralistic financing models must provide 1) alegal guarantee that all individuals have access to coverageand 2) sufficient government subsidies and funded cover-age for those who cannot afford to purchase coveragethrough the private sector. (See the ACP’s proposal forexpanding access to health insurance as an example of howa pluralistic system can achieve universal coverage [69].)
Recommendation 1b: Provide everyone access to afford-able coverage—whether provided through a single-payer orpluralistic financing model—that includes coverage for acore package of benefits, including preventive services, pri-mary care services—including but not limited to chronicillness management—and protection from catastrophichealth care expenses.
Recommendation 1c: Until there is political consensusfor achieving universal coverage at a federal level, Congressshould encourage state innovation by providing dedicatedfederal funds to support state-based programs with an ex-plicit goal of covering all uninsured persons within thestate. (See the ACP position paper, “State Experimentationwith Reforms to Expand Access to Health Care” [70].)
Comment: Universal health care insurance is necessary
to ensure that everyone within the United States has accessto needed health care services of high quality. The federalgovernment should assure that all persons within the bor-ders of the United States also have access to health careservices without undue financial barriers and that healthcare services provided are adequately reimbursed. The ACPrecommends two alternatives: a system funded solely orprincipally by government (federal and states), commonlyknown as a single-payer system, or a pluralistic system thatincorporates existing public and private programs withadditional guarantees of coverage and with sufficient sub-sidies and other protections to assure that coverage is avail-able and affordable for all. The ACP has proposed a step-by-step plan that would achieve universal coverage whilemaintaining a pluralistic system of mixed public and pri-vate sector funding (69).
Controlling Health Care CostsLesson 5: The best systems ensure access to health care
without financial barriers. Cost sharing with co-paymentschedules based on income, so that low-income individualspay no or nominal amounts (Belgium, France, Japan, NewZealand, and Switzerland), can help restrain costs whileassuring that poorer individuals can access services.
Lesson 6: Incentives to encourage personal responsibil-ity for health (Australia, Belgium, Japan, New Zealand, theNetherlands, Switzerland, and Taiwan) can lead to healthybehaviors, improved health outcomes, and responsible uti-lization of health care services. These countries restraincosts without punishing people who fail to adopt recom-mended behaviors or lifestyles.
Recommendation 2: Create incentives to encourage pa-tients to be prudent purchasers and to participate in theirhealth care. Patients should have ready access to healthinformation necessary for informed decision making. Cost-sharing provisions should be designed to encourage patientcost-consciousness without deterring patients from receiv-ing needed and appropriate services or participating intheir care.
Comment: Consumer-directed health care—in whichpatients are actively involved in medical decision makingand are prudent purchasers of health care—is one strategyfor reducing health care costs and improving the efficiencyof the health care system. However, for patients to makeinformed decisions, they must have access to pertinent,accurate, and understandable information. Health systemsshould provide easy access to information about the actualprices of medical services and available treatment optionsand patient education about health, diet and nutrition, andpreventive health care. Patients should have access not onlyto information about their own health and treatment op-tions but also to information that compares the effective-ness and costs of drugs, tests, and medical procedures. Pub-lic access to information about the qualifications andperformance of physicians, hospitals, and other providersof health care services would also inform patient decision
Position PaperHigh-Performance Health Care System with Universal Access
www.annals.org 1 January 2008 Annals of Internal Medicine Volume 148 • Number 1 13
out-of-pocket

making. Achieving a transparent and interactive health in-formation system that facilitates ready access to valid andreliable data will require collaboration between the publicand private sectors (71).
Greater cost sharing is one means to encourage pa-tients to be more prudent purchasers of health care. How-ever, merely imposing greater cost-sharing requirementscan reduce appropriate use of health care services. Increas-ing cost sharing can also create greater financial burdensand barriers to obtaining needed health care services. In-creased cost sharing can increase inequities because it raisesout-of-pocket costs. It can create financial burdens thatespecially affect low-income people. Out-of-pocket costsmay cause patients to skip preventive health care servicesthat could prevent more serious health problems and thatultimately would be cost-effective. Nevertheless, as theirhealth care costs continue to rise, other countries are in-creasingly resorting to requiring patient cost sharing(France, Japan, New Zealand, and Switzerland). As yet, theimpact of these measures on health is unknown.
Another approach is to create positive incentives forpatients to seek increased value for their health care dollar.Congress sought to achieve this objective by permittingindividuals and their employers to make tax-free contribu-tions to Health Savings Accounts. The individual ownsand controls these accounts and can use them to pay for“qualified medical expenses.” Unused funds in an HSAgrow year-to-year tax free, thereby creating further incen-tives for the individual to be prudent purchasers of healthcare services (72).
Lesson 7: Societal investment in health professional ed-ucation, which would reduce the cost to students, can helpachieve a health care workforce that has the right propor-tion of primary care physicians and subspecialists, is welltrained, and is large enough to assure access to care(France, Germany, the United Kingdom, and the U.S.
Lesson 8: Investment in primary and preventive carecan result in better health outcomes, reduce costs, and maybetter assure an adequate supply of primary care physi-cians. These efforts can be further enhanced by assuringthat all residents have equitable access to primary care phy-sicians (Australia, Canada, Denmark, France, the Nether-lands, New Zealand, Switzerland, and the United King-dom) and utilizing the patient-centered primary caremodel (Denmark).
Recommendation 3: Develop a national health careworkforce policy that includes sufficient support to educateand train a supply of health professionals that meets thenation’s health care needs. To meet this goal, the nation’sworkforce policy must focus on ensuring an adequate sup-ply of primary and principal care physicians trained tomanage care for the whole patient. The federal government
must intervene to avert the impending catastrophic short-age of primary care physicians. A key element of workpolicy is setting specific targets for producing generalistsand specialists and enacting policy to achieve those targets.
Comment: All stakeholders must be involved in coor-dinated workforce planning to ensure an adequate supplyof health care professionals. This planning must includedetermining the workforce needs for all health care profes-sionals, including physicians, nurses, and other health careprofessionals. The United States has a lower proportion ofprimary care physicians relative to other specialists thanmany other industrialized nations that score better on mea-sures of cost and quality. The ACP is particularly con-cerned about the looming crisis in the supply of primarycare physicians in the United States. Within the UnitedStates, states with more primary care physicians per capitahave better health outcomes, including mortality from can-cer, heart disease, or stroke (73, 74). In the United States,states with higher proportions of specialist physicians havehigher per capita Medicare spending. Conversely, a greaternumber of primary care physicians is associated with in-creased quality of health services, as well as a reduction incosts (75). The preventive care that primary care physiciansprovide can help to reduce hospitalization rates (76). Infact, hospitalization rates and expenditures for conditionsamenable to ambulatory care are higher in areas with fewerprimary care physicians and limited access to primary care(77, 78). The supply of primary care physicians is alsoassociated with an increase in life span (79, 80).
Several countries appear to be exceptions to the rulethat successful health systems have more primary care phy-sicians. In particular, the relatively low percentages of pri-mary care physicians reported for Denmark and the Neth-erlands stand out, even though both countries have policiesto encourage patients to have a long-term relationship witha primary care physician. This anomaly may be an artifactof different methods for collecting and reporting workforcedata despite the efforts of the OECD. Possibly, these coun-tries rely more on physician extenders and the extensive useof EMRs to achieve better efficiency and fail to count asprimary physicians those who provide night coverage andwhat would be considered as primary in-hospital care inthe United States. Further research is needed to better un-derstand these apparent exceptions. Another important is-sue to study is how the organization of care affects the ratesof referrals to subspecialists—a key determinant of differ-ences in per capita costs between geographic regions in theUnited States—in the United States and other countries.
Workforce planning should strive to achieve a diverseworkforce of health professionals that increases representa-tion of ethnic and minority providers (81, 82, 83, 84).Consequently, federal and state funding should be contin-ued and increased for programs and initiatives that strive toincrease the number of health care providers in minoritycommunities. National health workforce planning shouldalso encourage medical and other health professional
Position Paper High-Performance Health Care System with Universal Access
14 1 January 2008 Annals of Internal Medicine Volume 148 • Number 1 www.annals.org
Health Care NeedsAssuring a Healthcare Workforce to Meet the Nation’s
Veterans Administration)

schools to revitalize efforts to improve matriculation andgraduation rates of minority students and to recruit andretain minority faculty (85).
All users and payers of health care must contributetheir share to support medical education, which is a publicgood that benefits all of society. Undergraduate, graduate,and continuing medical education must have adequatefunding. Most other countries finance medical school ed-ucation with public funds; so that students pay little (theNetherlands) or no (Australia, Canada, France, Germany,Japan, and Switzerland) tuition and typically are responsi-ble only for the cost of books and fees (86).
In contrast, the average tuition in the United States in2005 was $20 370 for public medical schools and $38 190at private medical schools. Students and their families paymost of this cost. As a result, 85% of graduating medicalstudents begin their careers with substantial educationaldebts. The average debt in 2005 was $105 000 for gradu-ates of public medical institutions and $135 000 for grad-uates of private medical schools (87). Rising educationaldebt influences physician career choices and is one of thefactors that discourage medical students from choosing acareer in primary care (88). The long pipeline of medicaleducation and training, the impending crisis in primarycare, and the retirement and career changes of older phy-sicians require the United States to take action to assure aconstant influx of new students embarking on medical ca-reers, particularly in primary care.
Physician workforce planning should determine thenation’s current and future needs for appropriate numbersof physicians by specialty and among geographic areas. Anational commission should provide a blueprint for actionat the federal level to accomplish this task. Such planningwould involve a systematic determination of residencytraining needs and guidance for allocation of federal fund-ing support. Immediate and comprehensive reforms areneeded to assure that the United States has enough pri-mary care physicians to care for an aging population thatwill suffer from chronic diseases.
A more detailed presentation of ACP recommenda-tions concerning a national health workforce policy can befound in the position papers “Creating a New NationalWorkforce for Internal Medicine” (89) and “The Impend-ing Collapse of Primary Care Medicine and Its Implica-tions for the State of the Nation’s Health Care” (48).
Policies That Promote Patient-Centered CareLesson 9: Effective physician payment systems include
adequate payment for primary care services, incentives forquality improvement and reporting (Belgium and theUnited Kingdom), recognizing geographic or local pay-ment differences (Canada, Denmark, Germany, and theUnited Kingdom), and incentives for care coordination(Denmark and the Netherlands).
Recommendation 4: Redirect federal health care policytoward supporting patient-centered health care that builds
on the relationship between patients and their primary andprincipal care physicians and financially supports the pa-tient-centered medical home, a practice system that theevidence suggests has the potential to improve health out-comes, achieve more efficient use of resources, and reducehealth care disparities.
Comment: Principal care physicians provide the pre-dominant source of care for a patient. Primary care physi-cians are principal care physicians, but so are other medicalspecialists and subspecialists when they are the patient’sprincipal source of care. In the position paper “A System inNeed of Change: Restructuring Payment Policies to Sup-port Patient-Centered Care” (90), the ACP proposes thatthe federal government take the lead in restructuring pay-ment policies to achieve patient-centered health care. (Theadvanced medical home is a model—described in previousACP position papers—that offers the benefits of a wholeperson–oriented personal physician who accepts overall re-sponsibility for the care of the patient and leads a team thatprovides enhanced access to care, improved coordinatedand integrated care, and increased efforts to ensure safetyand quality. The American Academy of Family Physicianshas proposed a similar model called the personal medicalhome. The ACP and the American Academy of FamilyPhysicians have adopted a joint statement of principles thatuses the patient-centered medical home as a common de-scriptor for both models. The American Academy of Pedi-atrics has also promoted the concept of a medical home forchildren with special needs. We will use the term patient-centered medical home, which is interchangeable with theterm advanced medical home as described in other ACPposition papers.)
A patient-centered medical home is a medical practicein which:
1. Each patient has an ongoing relationship with apersonal physician trained to provide first contact, contin-uous, and comprehensive care.
2. A personal physician leads a team of individuals atthe practice level who collectively take responsibility fortreating and managing care for the whole patient, ratherthan limiting practice to a single disease condition, organsystem, or procedure.
3. Care is coordinated and/or integrated across all el-ements of the health care system (for example, subspecialtycare, hospitals, home health agencies, nursing homes) andthe patient’s community (for example, family, public, andprivate community-based services).
4. The practice consistently uses evidence-based med-icine, clinical decision-support tools, health informationexchange, and other means to guide decision making andto assure that patients get the indicated care when andwhere they need and want it in a culturally and linguisti-cally appropriate manner.
5. Patients are involved in planning, decision making,and accountability for ongoing medical care.
6. Patients have enhanced access to care through such
Position PaperHigh-Performance Health Care System with Universal Access
www.annals.org 1 January 2008 Annals of Internal Medicine Volume 148 • Number 1 15

systems as open scheduling, expanded hours, and new op-tions for communication between patients, their personalphysician, and practice staff.
7. Practices go through a voluntary recognition processby an appropriate nongovernment entity to demonstratethat they have the capabilities to provide patient-centeredservices consistent with the medical home model.
8. Practices receive payments that appropriately recog-nize the added value provided to patients (91).
The ACP has previously proposed a series of funda-mental changes to improve the delivery of health care ser-vices. Patients should be encouraged or provided incentivesto enroll in a medical home. Medical homes should meetstandards of accessibility and care coordination. Positionpapers from the ACP provide greater detail on each of thefollowing proposals:
1. Change payment policies to provide physician casemanagement fees for care coordination services (92).
2. Encourage the use of electronic health records (93).3. Encourage the use of and exchange of electronic
health care information (94).4. Provide incentives for coordinated, patient-centered
care (advanced medical home) (95).5. Use evidence-based performance measures to im-
prove the quality of care and providing incentives, includ-ing financial incentives, to reward physicians who meet orexceed standards (96).
6. Pay physicians for computer-based consultations(97).
7. Pay physicians for telephone consultations (98).8. Promote professionalism and the patient–physician
relationship, including physician responsibility to be pru-dent managers of resources (99).
Measuring the Quality of Health CareLesson 10: Performance measures, financial incentives,
and active monitoring of performance are key elements ofhealth systems that provide high-quality care (Australia,New Zealand, the United Kingdom, and the U.S. Veterans
Recommendation 5: Provide financial incentives forphysicians to achieve evidence-based performance stan-dards. The United States should consider revising existingvolume-based payment systems used by Medicare andmost private insurers to 1) better support physician–pa-tient relationships by creating care coordination paymentsand other incentives for physicians working with healthcare teams to provide patient care management that in-cludes comprehensive ongoing care and 2) maintain a fee-for-service component for separately identifiable visits andprocedures, such as the bundled and hybrid payment struc-ture used in Denmark and the Netherlands.
Comment: The current physician payment system inthe United States provides incentives for increasing thevolume of physician services but few financial incentivesfor cost-effective or efficient care. It also better rewards
physicians for the use of technological procedures as op-posed to time-intensive services. Physician payment meth-ods in the United States also provide little incentive forphysicians to assume responsibility for being prudent man-agers of health care resources. A better payment model isthe blended approach as used in Denmark, where primarycare physicians receive a capitated payment for providingcare coordination and case management—by telephone ore-mail—as in a medical home, in addition to receivingfee-for-service payments for office visits.
Achieving a well-functioning health care system thatencourages quality improvement will require incentives toencourage change. Performance measurement, the objec-tive assessment of how well physicians adhere to evidence-based standards to achieve desired outcomes, is increasinglybeing applied in the health care sector to improve the qual-ity, safety, and accountability of medical care. Pay-for-per-formance programs utilize performance measures to en-hance the quality of health care by rewarding physicians foradhering to evidence-based standards of care. The ACPpolicy and its analysis of performance measurement andpay-for-performance is presented in greater detail in 2 po-sition papers “The Use of Performance Measurements toImprove Physician Quality of Care” (96) and “LinkingPhysician Payments to Quality Care” (100).
In these papers, the ACP warns that:
Performance measures—if done right—have poten-tial to assess physician performance, improve the qual-ity of patient care, enhance the coordination and man-agement of care, and reward physicians who meet orexceed the benchmarks set by performance measures.However, if applied in a bureaucratic, arbitrary, or pu-nitive manner, performance measurement can hinderquality and harm patient care, undermine the physi-cian–patient relationship, and cause physician frustra-tion and career dissatisfaction (96).
Pay-for-performance systems should be evidence-based, transparent, fair, and equitable for practicing physi-cians. The ACP believes that the primary goal of suchprograms must be to promote continuously improvingquality care across the health care delivery system. Accord-ingly, pay-for-performance programs should focus on thefollowing:
1. Demonstrating that they lead to patient care that issafer and more effective as the result of program implemen-tation.
2. Provide incentives for all physicians to perform bet-ter, continually raising the bar on quality.
3. Establishing or linking to technical assistance effortsand learning collaboratives so that all providers are moti-vated and helped to improve their performance.
Major changes are needed to the current physicianpayment system in the United States to achieve a systemthat truly rewards quality improvement on evidence-based
Position Paper High-Performance Health Care System with Universal Access
16 1 January 2008 Annals of Internal Medicine Volume 148 • Number 1 www.annals.org
Administration).

measures of care. Adding reimbursement tied to physicianperformance on top of the current payment system, unlesssubstantial, will be inadequate to materially change thecurrent level of physician performance. Instead, physicianpayment methods need fundamental redesign (as outlinedin recommendation 5), so that physician reimbursementwould no longer be based on volume and episodes of acuteillnesses but on patient-centered, physician-guided care co-ordination and quality performance based on evidence-based clinical measures.
Practice-based electronic health information systems(see recommendation 6 below) will facilitate the collectionand reporting of patient data for measurement purposes, sothat physicians can easily report and share informationwithout further adding to administrative and paperworkburdens. Performance measures will not lead to qualityimprovement if physicians in practice lack the ability toincorporate proven quality improvement measures intotheir practices.
Electronic Billing and Medical RecordsLesson 11: Adoption of a uniform billing system and
electronic processing of claims improves efficiency and re-duces administrative expenses (Germany, Canada, Taiwan,the United Kingdom, and most others, including the U.S.
Recommendation 6: Reduce the costs of health careadministration and the attendant burdens they place onpatients and their physicians by creating uniform billingand credentialing systems across all payers.
Recommendation 7: Support with federal funds an in-teroperable health information technology infrastructurethat assists physicians in delivering evidence-based patient-centered care.
Comment: Reducing paperwork, claims processing,and regulatory requirements could yield tremendous sav-ings. The ACP has long advocated measures to reduce ad-ministrative burdens and regulatory hassles (101). In a1998 policy paper on the topic of hassles created by insur-ers (102), the American Society of Internal Medicinefound the following:
1. Physicians are spending more time on insurancepaperwork and less time seeing patients.
2. Physicians believe that insurers question their pro-fessional judgment too often.
3. Physicians have been forced to hire additional per-sonnel to keep up with the abundant paperwork that in-surance hassles create.
The ACP continues to advocate the following long-held positions:
1. All health insurance industry forms should be uni-form, with one form per task rather than a different formfor the same task from every insurer (for example, a singledurable medical equipment approval form and a single re-ferral form).
2. All health care plans and hospitals should use onestandard physician credentialing and recredentialing form.
Electronic technology will allow automating paymentand health insurance transactions without reliance on pa-per processing. Automated point-of-care transactions aremade possible by using smart card technology (similar toautomated teller machine cards) that will automaticallyverify the individual’s coverage status, benefits, and re-quired copayments and co-insurance, and bill the appro-priate payer for care rendered and the individual for theirrequired cost sharing on a debit basis. Denmark uses thissystem.
Greater use of health information technology, use ofEMRs, and implementation of systems to enable electronicprescribing can improve the quality of patient care, reducemedical errors, increase efficiency, reduce administrativecosts, and achieve substantial cost savings. Coordination ofpatient care—which is the essence of the patient-centeredprimary care model recommended by the ACP—requiressmooth transfer of information (with appropriate safe-guards of patient privacy) among a team of providers. Useof interoperable health information technology systems inthis model will help eliminate duplication of informationgathering and testing and will promote care coordination.
Denmark, Taiwan, and the Netherlands have an in-teroperable health information infrastructure that incorpo-rates decision-support tools. Systems like these will enablephysicians to obtain instantaneous information at the pointof medical decision making and will enhance electroniccommunications among physicians, hospitals, pharmacies,diagnostic testing laboratories, and patients. Health infor-mation technology would support patient registries, en-hance monitoring of patient adherence, increase access tolaboratory and test results, provide prompts for physicianand patient reminders and alerts, recommend treatmentplans, and enable longitudinal charting of risk factors, uti-lization of services, and health outcomes (68). Health in-formation technology could also enable ongoing, routinefeedback from patients to the practice, using low-cost, In-ternet-based, patient-centered care surveys. This feedbackcould lead to targeted plans for practice improvement.
However, physician practices in the United States lagfar behind those in other developed countries in their ca-pacity to access and share information electronically (68).Several barriers have slowed progress. The United Statesdoes not provide tax credits or incentives for implementingEMR systems and does not maintain an interoperable sys-tem for sharing health information. Medicare and otherhealth care payers do not reimburse physicians for elec-tronic consultations, even though they would cost muchless than office visits. Barriers limiting physician adoptionof systems of EMRs include not only the initial cost ofrequired investments in the technology but also the disrup-tion and possibly greater costs of time, training, and dataentry involved in transferring paper to electronic records(103). Physicians are also hesitant to invest in systems that
Position PaperHigh-Performance Health Care System with Universal Access
www.annals.org 1 January 2008 Annals of Internal Medicine Volume 148 • Number 1 17
Veterans Administration).

may not become the industry standard, that may not beable to communicate with other systems, and that mayquickly become obsolete. Regulatory barriers and lack ofinteroperability also impede physicians from being able totransmit prescriptions electronically. Concerns about pro-tecting patient privacy also limit electronic access to med-ical and hospital records and to laboratory and diagnostictest results.
Dealing with New Medical Care TechnologyLesson 12: Insufficient investments in research and
medical technology result in reliance on outdated technol-ogies and medical equipment, and delay patients’ access toadvances in medical science (Canada and the United King-dom).
Recommendation 8: Encourage public and private in-vestments in all kinds of medical research—including re-search on comparative effectiveness of different treat-ments—to foster continued innovation and improvementsin health care.
Comment: Investments in basic health research are crit-ical to advance medical knowledge. The nation’s invest-ments, in basic research both privately and through theNational Institutes of Health, have led to important ad-vances in medicine. The public benefits from discoveriesthat advance medical science as well as from the develop-ment of new pharmaceuticals, medical equipment, pro-cesses, and procedures. Incentives to continually invest inbasic and clinical research are essential to progress.
Another form of research has received less attention—and far less funding—but is necessary to properly evaluatethe health consequences of advances in medical research:health services research and the scientific assessment of thesafety, clinical effectiveness, and cost and benefits of healthcare technology. The U.S. must invest in health servicesresearch in order to determine the safety, effectiveness, andefficacy of medical tests and procedures, and to determinethe comparative effectiveness—cost, value, and effica-cy—of different treatment regimens and technologies. In-formation obtained from this research must be widely dis-seminated to guide health care providers to appropriatelyutilize new technologies and avoid inappropriate use.
Quality, “Health services research examines how people getaccess to health care, how much care costs, and what hap-pens to patients as a result of this care. The main goals ofhealth services research are to identify the most effectiveways to organize, manage, finance, and deliver high qualitycare; reduce medical errors; and improve patient safety”(104).
Many other countries that have national health insur-ance programs, such as the United Kingdom and Australia,perform evidence-based evaluations of new drugs and tech-nology. Much of this information is shared through theNetwork of Agencies for Health Technology Assessment,of which the U.S. Agency for Healthcare Research and
Quality is a member. To attain a well-functioning healthcare system, the United States should increase investmentin technology assessments, comparative effectiveness, andhealth services research. AHRQ must have adequate fund-ing to support research, to disseminate the results of healthservices research and technology assessments, and to fosterinternational cooperation in sharing information.
SUMMARY AND CONCLUSIONS
Health care in the United States has many positivefeatures and in many respects is superb compared withhealth care anywhere else in the world. Those with ade-quate health insurance coverage or sufficient financialmeans have access to the latest technology and the bestcare. However, as this paper points out, the U.S. healthcare system is inefficient and inconsistent: Health carequality and access vary widely both geographically amongpopulations, some services are overutilized, and costs arefar in excess of those in other countries. Moreover, theUnited States ranks lower than other industrialized coun-tries on many of the most important measures of health.Current international comparisons of measures of health(life expectancy at birth, infant mortality, and deaths per100 000 for diseases of the respiratory system and for dia-betes) indicate that population health in the United Statesis not better than in other industrialized countries despitethe greater U.S. expenditures (58).
The experience and innovations of health care systemsin other countries provide many lessons as the UnitedStates tries to improve its health system. Among these les-sons are the value of an orientation and emphasis on pa-tient-centered primary care and the importance of assuringa well educated physician workforce that meets the coun-try’s need for primary care physicians. The quality andaccessibility of health care in the United States could beimproved by adopting reimbursement programs like thosein other countries that provide substantial rewards basedon performance on quality metrics and care coordinationrather than solely on the volume of services provided.These payment systems together with national workforceplanning might also help address the impending primaryhealth care workforce shortages in the United States. Uni-versal and compulsory health insurance coverage couldeliminate many of the disparities and inequities in theUnited States. Expanded use of health information tech-nology and substantial governmental investments and sup-port for a health information technology infrastructurewith appropriate patient privacy protections could enhancehealth care decision making by physicians and patients andwould bolster the growing movement for consumer-di-rected health care. These are some of the lessons we canlearn from other industrialized countries.
Other lessons for a more efficiently functioning healthcare system include achieving lower administrative costs bystandardizing coverage and insurance transactions; provid-
Position Paper High-Performance Health Care System with Universal Access
18 1 January 2008 Annals of Internal Medicine Volume 148 • Number 1 www.annals.org
According to the Agency for Healthcare Research and

ing coverage through publicly funded programs rather thanprivate insurance; and automating transactions among pro-viders, patient, and insurers. This article does not addressmany other issues in depth. Topics for further in-depthanalysis include the costs and impact of malpractice liabil-ity insurance, determination of prescription drug prices,differences in medical education (including costs and stu-dent debt), financing long-term care, and physician earn-ings and income. The United States may also benefit byexamining how other countries manage end-of-life care,determine the distribution of health care resources, andmake decisions on coverage and benefits.
The ACP has offered a series of recommendations toachieve a well-functioning health care system. All Ameri-cans should have access to a primary care physician andshould have a patient-centered medical home for their on-going, continuous, comprehensive, and coordinated care.All Americans should have health insurance coverage thatincludes preventive and primary care services, as well asprotection from catastrophic health care costs. Federalhealth policy should support the patient-centered primarycare model. The United States lacks a national health careworkforce policy. It should provide for sufficient supportfor the infrastructure required to educate and train an ad-equate supply of health professionals that would properlymeet the nation’s health care needs, including primary andprincipal care physicians that are trained to manage care ofthe whole patient. Workforce planning should specify anappropriate mix of physicians between primary and spe-cialty care and describe the policies required to achieve thatgoal. Public and private investments in research must con-tinue to support advances in basic and clinical medicalscience as well as in health services research. Other ACPrecommendations call for financial incentives to encouragequality improvement and reduction of avoidable medicalerrors, support for a health information technology infra-structure to assist patients and physicians in making in-
services, and use of technology to achieve a more efficienthealth care system.
The main lesson of this article is that many countrieshave better functioning, lower cost health care systems thatoutperform the United States. We must learn from them.
Requests for Single Reprints: Customer Service, American College ofPhysicians, 190 N. Independence Mall West, Philadelphia, PA 19106.
References1. U.S. Bureau of the Census. Income, poverty, and health insurance coverage inthe United States. Washington, DC: U.S. Department of Commerce, Bureau ofthe Census; 2006.2. Centers for Disease Control and Prevention. Lack of health insurance andtype of coverage. early release of selected estimates based on data from the 2006National Health Interview Survey. Atlanta: Centers for Disease Control and Pre-vention; June 2007.3. Families USA. Wrong direction: one out of three Americans are uninsured.Publication No. 07-108; 2007. Accessed at www.familiesusa.org/assets/pdfs
/wrong-direction.pdf on 28 September 2007.4. Schoen C, Doty MM, Collins SR, Holmgren AL. Insured but not protected:how many adults are underinsured? Health Aff (Millwood). 2005;Suppl WebExclusives:W5-289-W5-302. [PMID: 15956055]5. Ayanian JZ, Weissman JS, Schneider EC, Ginsburg JA, Zaslavsky AM.Unmet health needs of uninsured adults in the United States. JAMA. 2000;284:2061-9. [PMID: 11042754]6. McWilliams JM, Meara E, Zaslavsky AM, Ayanian JZ. Use of health servicesby previously uninsured Medicare beneficiaries. N Engl J Med. 2007;357:143-53. [PMID: 17625126]7. Wennberg JE, Cooper MM. The Dartmouth Atlas of Health Care 1999.Chicago: American Hospital Publishing; 1999.8. Fisher ES, Wennberg DE, Stukel TA, Gottlieb DJ, Lucas FL, Pinder EL.The implications of regional variations in Medicare spending. Part 1: the content,quality, and accessibility of care. Ann Intern Med. 2003;138:273-87. [PMID:12585825]9. Sirovich BE, Gottlieb DJ, Welch HG, Fisher ES. Regional variations inhealth care intensity and physician perceptions of quality of care. Ann InternMed. 2006;144:641-9. [PMID: 16670133]10. Fisher ES, Wennberg DE, Stukel TA, Gottlieb DJ, Lucas FL, Pinder EL.The implications of regional variations in Medicare spending. Part 2: healthoutcomes and satisfaction with care. Ann Intern Med. 2003;138:288-98.[PMID: 12585826]11. McGlynn EA, Asch SM, Adams J, Keesey J, Hicks J, DeCristofaro A, et al.The quality of health care delivered to adults in the United States. N Engl J Med.2003;348:2635-45. [PMID: 12826639]12. Institute of Medicine. To Err Is Human: Building a Safer Health System.Washington, DC: National Academies Pr; 2000.13. Institute of Medicine. Crossing the Quality Chasm: A New Health Systemfor the 21st Century. Washington, DC: National Academies Pr; 2001.14. Wu S, Green A. Projection of Chronic Illness Prevalence and Cost Inflation.Santa Monica, CA: RAND Health; October 2000.15. Anderson GF. Medicare and chronic conditions. N Engl J Med. 2005;353:305-9. [PMID: 16034019]16. Agency for Healthcare Research and Quality. 2005 national healthcare dis-parities report. Rockville, MD: U.S. Department of Health and Human Services,Agency for Healthcare Research and Quality; December 2005. AHRQ publica-tion no. 06-0017.17. Borger C, Smith S, Truffer C, Keehan S, Sisko A, Poisal J, et al. Healthspending projections through 2015: changes on the horizon. Health Aff (Mill-wood). 2006;25:w61-73. [PMID: 16495287]18. Centers for Medicare & Medicaid Services. Office of the Actuary, NationalHealth Statistics Group. National health expenditures aggregate, per capita, per-cent distribution, and annual percent change by source of funds: calendar years1960-2005. Accessed at www.cms.hhs.gov/NationalHealthExpendData/downloads/tables.pdf on 30 January 2007.19. Williams B, Dulio A, Claypool H, Perry MJ, Cooper BS. Waiting forMedicare: experience of uninsured people with disabilities in the two-year waitingperiod for Medicare. Christopher Reeve Paralysis Foundation and the Common-wealth Fund; October 2004. Accessed at www.cmwf.org/usr_doc/786_Williams_waiting_for_Medicare.pdf on 2 November 2007.20. Centers for Medicare & Medicaid Services. National health expendituresaccounts: definitions, sources, and methods used in the NHEA 2005. Accessed atwww.cms.hhs.gov/NationalHealthExpendData/downloads/dsm-05.pdf on 19May 2007.21. Kaiser Family Foundation and Health Education Trust. Employer healthbenefits 2005 annual survey. Accessed at www.kff.org/insurance/7315/index.cfmon 15 August 2006.22. Centers for Medicare & Medicaid Services. Office of the Actuary, NationalHealth Statistics Group. National health expenditure data, historical. The na-tion’s health dollar, calendar year 2005—where it went, where it came from.Accessed at www.cms.hhs.gov/NationalHealthExpendData/downloads/PieChartSourcesExpenditures2005.pdf on 30 January 2007.23. U.S. Bureau of the Census. Income, poverty and health insurance coveragein the United States. Washington, DC: U.S. Department of Commerce, Bureauof the Census; 2006.24. By 2005 average family premium reached over $10, 000 per year, healthagency says. BNA. Health Care Daily Report. 20 August 2007;12.25. Crimmel BL, Taylor AK, Zawacki AM. Changes in co-pays for employer-sponsored health insurance plans, 1999-2003. June 2006. Agency for Healthcare
Position PaperHigh-Performance Health Care System with Universal Access
www.annals.org 1 January 2008 Annals of Internal Medicine Volume 148 • Number 1 19
formed decisions about the appropriate use of health care

Research and Quality. Statistical brief no. 127. Accessed at www.meps.ahrq.gov/mepsweb/data_files/publications/st127/stat127.pdf on 10 August 2007.26. Sommers JP. Medical Expenditure Panel Survey: Co-pays, deductibles, andcoinsurance percentages for employer-sponsored health insurance in the non-federal workforce, by industry classification, 2005. August 2007. Agency forHealthcare Research and Quality. Statistical brief 182. Accessed at www.meps.ahrq.gov/mepsweb/data_files/publications/st182/stat182.pdf on 30 August2007.27. Braithwaite RS, Rosen AB. Linking cost sharing to value: an unrivaled yetunrealized public health opportunity. Ann Intern Med. 2007;146:602-5.[PMID: 17438319]28. Dubay L, Holahan J, Cook A. The uninsured and the affordability ofhealth insurance coverage. Health Aff (Millwood). 2007;26:w22-30. [PMID:17138578]
30. Centers for Medicare & Medicaid Services. National health expendituredata, historical. Accessed at www.cms.hhs.gov/NationalHealthExpendData/02_NationalHealthAccountsHistorical.asp#TopOfPage on 29 August 2007.31. Centers for Medicare & Medicaid Services. Overview, national SCHIP
Accessed at www.cms.hhs.gov/NationalSCHIPPolicy/ on 29 August 2007.32. Centers for Medicare & Medicaid Services. Medicare & you 2008. Accessedat www.medicare.gov/Publications/Pubs/pdf/10050.pdf on 5 October 2007.33. Rowland D. Medicaid—implications for the health safety net. N Engl J Med.2005;353:1439-41. [PMID: 16207845]34. Centers for Medicare & Medicaid Services. Medicaid at-a-glance 2005: aMedicaid information source. Accessed at www.cms.hhs.gov/MedicaidGenInfo/Downloads/MedicaidAtAGlance2005.pdf on 14 August 2006.35. Panangala SV. Congressional Research Service. Veterans’ medical care:FY2007 appropriations. CRS Report for Congress. 8 May 2006; #RL33409.36. Iglehart JK. Reform of the Veterans Affairs heath care system. N Engl J Med.1996;335:1407-11. [PMID: 8857026]37. Asch SM, McGlynn EA, Hogan MM, Hayward RA, Shekelle P, Ruben-stein L, et al. Comparison of quality of care for patients in the Veterans HealthAdministration and patients in a national sample. Ann Intern Med. 2004;141:938-45. [PMID: 15611491]38. Jha AK, Perlin JB, Kizer KW, Dudley RA. Effect of the transformation ofthe Veterans Affairs Health Care System on the quality of care. N Engl J Med.2003;348:2218-27. [PMID: 12773650]39. Long JA, Polsky D, Metlay JP. Changes in veterans’ use of outpatient carefrom 1992 to 2000. Am J Public Health. 2005;95:2246-51. [PMID: 16257943]40. U.S. Department of Veterans Affairs. VA and spinal cord injury. Fact Sheet.May 2005. Accessed at www1.va.gov/opa/fact/spinalcfs.asp on 7 November2007.41. U.S. General Accounting Office. VA and DOD health care: factors contrib-uting to reduced pharmacy costs and continuing challenges. Testimony beforethe Subcommittee on National Security, Veterans Affairs and International Re-lations. Washington, DC: U.S. General Accounting Office; July 2002: GAO-02-969T.42. Families USA. No bargain: Medicare drug plans deliver high prices. Publi-cation no. 07-101, January 2007. Accessed at www.familiesusa.org/assets/pdfs/no-bargain-medicare-drug.pdf in May 2007.43. Lichtenberg FR. Older drugs, shorter lives? An examination of the healtheffects of the Veterans Health Administration formulary. New York: Center forMedical Progress; 2005: Medical Progress Report No. 2.44. Doty MM, Edwards JN, Holmgren AL. Seeing Red: Americans Driven intoDebt by Medical Bills. New York: The Commonwealth Fund; August 2005.45. Merlis M, Gould D, Mahato B. Rising out-of-pocket spending on medicalcare: a growing strain on family budgets. New York: The Commonwealth Fund;February 2006: publication no. 887.46. Hsu J, Price M, Huang J, Brand R, Fung V, Hui R, et al. Unintendedconsequences of caps on Medicare drug benefits. N Engl J Med. 2006;354:2349-59. [PMID: 16738271]47. U.S. Government Accountability Office. Public payers face burden of enti-tlement program growth, while all payers face rising prices and increasing use ofservices: testimony of A. Bruce Steinwald to the Subcommittee on Military Con-struction, Veterans Affairs, and Related Agencies, Committee on Appropriations,House of Representatives. Washington, DC: U.S. Government AccountabilityOffice; 15 February 2007. GAO-07-497T. Accessed at www.gao.gov/new.items
/d07497t.pdf on 1 August 2007.48. American College of Physicians. The impending collapse of primary caremedicine and its implications for the state of the nation’s health care. 30 January2006. Accessed at www.acponline.org/hpp/statehc06_1.pdf on 6 November2007.49. Bodenheimer T. Primary care—will it survive? N Engl J Med. 2006;355:861-4. [PMID: 16943396]50. Bodenheimer T. High and rising health care costs. Part 2: technologic inno-vation. Ann Intern Med. 2005;142:932-7. [PMID: 15941701]51. Cutler DM, McClellan M. Is technological change in medicine worth it?Health Aff (Millwood). 2001;20:11-29. [PMID: 11558696]52. Commonwealth Fund Commission on a High Performance Health Sys-tem. Framework For A High Performance Health System For The United States,August 2006. Accessed at www.cmwf.org on 9 January 2007.53. Commonwealth Fund Commission on a High Performance Health Sys-tem. Why not the best? Results from a national scorecard on U.S. health systemperformance. September 2006. Accessed at www.cmwf.org on 9 January 2007.54. Schoen C, How SK. National scorecard on U.S. health system performance:technical report. Commonwealth Fund Commission on a High PerformanceHealth System. 2006. Accessed at www.commonwealthfund.org/usr_doc/Schoen_natscorecard_techrpt_954.pdf?section�4039 on 4 October 2007.55. United Health Foundation. America’s health rankings: a call to action forpeople & their communities. 2006. Accessed at www.unitedhealthfoundation.org/ahr.html on 15 August 2007.56. Wilson JF. Lessons for health care could be found abroad. Ann Intern Med.2007;146:473-6. [PMID: 17371900]57. Organization for Economic Co-operation and Development. Joint OECD-Eurostat-WHO health accounts data-collection initiative launched. OECDHealth Update. January 2006;1. Accessed at www.oecd.org/dataoecd/13/32/36040504.pdf on 5 April 2007.58. Organization for Economic Co-operation and Development. OECD HealthData 2006: frequently requested data. Accessed at www.oecd.org/document/16/0,2340,en_2649_37407_2085200_1_1_1_37407,00.html on 9 August 2006.59. Organization for Economic Co-operation and Development. Total expen-ditures per capita, June 2006. Accessed at www.oecd.org/document/16/0,2340,en_2649_37407_2085200_1_1_1_37407,00.html on 8 August 2006.60. Anell A, Willis M. International comparison of health care systems usingresource profiles. Bull World Health Organ. 2000;78:770-8. [PMID: 10916914]61. Woolhandler S, Campbell T, Himmelstein DU. Costs of health care ad-ministration in the United States and Canada. N Engl J Med. 2003;349:768-75.[PMID: 12930930]62. Schoen C, How SKH. National scorecard on U.S. health system perfor-mance: complete chartpack. Commonwealth Fund. 2003; p. 34. Accessed atwww.commonwealthfund.org/usr_doc/Schoen_natscorecard_chartpack_955.pdf?section�4039 on 4 October 2007.63. Peterson CL, Burton R. U.S. health care spending: comparison with otherOECD countries. Congressional Research Service. 2007. Accessed at http://digitalcommons.ilr.cornell.edu/cgi/viewcontent.cgi?article�1316&context�key_workplace on 2 October 2007.64. Schoen C, Osborn R, Huynh PT, Doty M, Zapert K, Peugh J, et al.Taking the pulse of health care systems: experiences of patients with health prob-lems in six countries. Health Aff (Millwood). 2005;Suppl Web Exclusives:W5-509-25. [PMID: 16269444]65. Davis K, Schoen C, Schoenbaum SC, Audet AJ, Doty MM, Holmgren AL,et al. Mirror, mirror on the wall: an update on the quality of American healthcare through the patient’s lens. The Commonwealth Fund. April 2006. Accessedat www.cmwf.org/publications/publications_show.htm?doc_id�364436 on 9August 2006.66. Macinko J, Starfield B, Shi L. The contribution of primary care systems tohealth outcomes within Organization for Economic Cooperation and Develop-ment (OECD) countries, 1970-1998. Health Serv Res. 2003;38:831-65.[PMID: 12822915]67. Starfield B, Shi L, Macinko J. Contribution of primary care to health systemsand health. Milbank Q. 2005;83:457-502. [PMID: 16202000]68. Schoen C, Osborn R, Huynh PT, Doty M, Peugh J, Zapert K. On thefront lines of care: primary care doctors’ office systems, experiences, and views inseven countries. Health Aff (Millwood). 2006;25:w555-71. [PMID: 17102164]69. American College of Physicians–American Society of Internal Medicine.Achieving affordable health insurance coverage for all within seven years. A pro-posal from America’s internists. Philadelphia: American College of Physicians–
Position Paper High-Performance Health Care System with Universal Access
20 1 January 2008 Annals of Internal Medicine Volume 148 • Number 1 www.annals.org
2007;1 4 7147:693-8.29. Farber J, Siu A, Bloom P. How much time do physicians spend providing care
policy, SCHIP and NHE summary including share of GDP, CY 1960-2004.
outside of office visits? Ann Intern Med.

American Society of Internal Medicine; 2002. Accessed at www.acponline.org/hpp/afford_7years.pdf on 6 November 2007.70. American College of Physicians. State experimentation with reforms to ex-pand access to health care: a summary of state efforts to reform health care andrecommendations from the American College of Physicians on key elements thatshould be included in any reform. Philadelphia: American College of Physicians;July 2007. Accessed at www.acponline.org/hpp/state_exp.pdf on6 November2007.71. Clancy CM. Getting to ‘smart’ health care. Health Aff (Millwood). 2006;25:w589-92. [PMID: 17090557]72. American College of Physicians. Consumer-directed health care and healthsavings accounts [policy monograph]. Philadelphia: American College of Physi-cians; 2005. Accessed at www.acponline.org/hpp/consumer_savings.pdf on 6 No-vember 2007.73. Shi L. The relationship between primary care and life chances. J Health CarePoor Underserved. 1992;3:321-35. [PMID: 1420668]74. Shi L. Primary care, specialty care, and life chances. Int J Health Serv. 1994;24:431-58. [PMID: 7928012]75. Baicker K, Chandra A. Medicare spending, the physician workforce, andbeneficiaries’ quality of care. Health Aff (Millwood). 2004;Suppl Web Exclusives:W184-97. [PMID: 15726699]76. Bindman AB, Grumbach K, Osmond D, Komaromy M, Vranizan K, LurieN, et al. Preventable hospitalizations and access to health care. JAMA. 1995;274:305-11. [PMID: 7609259]77. Parchman ML, Culler S. Primary care physicians and avoidable hospitaliza-tions. J Fam Pract. 1994;39:123-8. [PMID: 8057062]78. Basu J, Friedman B, Burstin H. Managed care and preventable hospitaliza-tion among Medicaid adults. Health Serv Res. 2004;39:489-510. [PMID:15149475]79. Vogel RL, Ackermann RJ. Is primary care physician supply correlated withhealth outcomes? Int J Health Serv. 1998;28:183-96. [PMID: 9493759]80. Greenfield S, Nelson EC, Zubkoff M, Manning W, Rogers W, Kravitz RL,et al. Variations in resource utilization among medical specialties and systems ofcare. Results from the medical outcomes study. JAMA. 1992;267:1624-30.[PMID: 1542172]81. Institute of Medicine. Unequal Treatment: Confronting Racial and EthnicDisparities in Health Care. Washington, DC: National Academies Pr; 2002.82. Betancourt JR. Eliminating racial and ethnic disparities in health care: whatis the role of academic medicine? Acad Med. 2006;81:788-92. [PMID:16936481]83. Institute of Medicine. In the Nation’s Compelling Interest: Achieving Di-versity in the Health Care Workforce. Washington, DC: National Academies Pr;2004.84. Powe NR, Cooper LA. Diversifying the racial and ethnic composition of thephysician workforce. Ann Intern Med. 2004;141:223-4. [PMID: 15289221]85. American College of Physicians. Racial and ethnic disparities in health care:a position paper of the American College of Physicians. Ann Intern Med. 2004;141:226-32. [PMID: 15289223]86. Institute of Medicine. Medical Education and Societal Needs: A PlanningReport for Health Professions. Washington, DC: National Academies Pr; 1983.Accessed at http://books.nap.edu/openbook.php?record_id�729&chapselect�yo&page�R1 on 17 July 2007.87. AAMC, medical education costs and student debt. Report of the AAMCWorking Group on Medical Education Costs and Student Debt. Washington,DC: Association of American Medical Colleges; 2005.88. Rosenblatt RA, Andrilla CH. The impact of U.S. medical students’ debt ontheir choice of primary care careers: an analysis of data from the 2002 medical
school graduation questionnaire. Acad Med. 2005;80:815-9. [PMID: 16123459]89. American College of Physicians. Creating a new national workforce forinternal medicine. Philadelphia: American College of Physicians; 2006. Accessedat www.acponline.org/hpp/im_workforce.pdf on 6 November 2007.90. American College of Physicians. A system in need of change: restructuringpayment policies to support patient-centered care. Philadelphia: American Col-lege of Physicians; January 2007. Accessed at www.acponline.org/hpp/statehc07_5.pdf on 4 November 2007.91. American Academy of Family Physicians, American Academy of Pediatrics,American College of Physicians, American Osteopathic Association. Joint prin-ciples of the patient-centered medical home. Accessed at www.acponline.org/hpp/approve_jp.pdf on 18 October 2007.92. American College of Physicians. Patient-centered, physician-guided care forthe chronically ill: the American College of Physicians prescription for change.Philadelphia: American College of Physicians; October 2004. Accessed at www.acponline.org/hpp/patcen_chronill.pdf on 4 November 2007.93. American College of Physicians. The paperless medical office: digital tech-nology’s potential for the internist. Philadelphia: American College of Physicians;March 2004. Accessed at www.acponline.org/ppvl/policies/e000977.pdf on 4November 2007.94. American College of Physicians. Enhancing the quality of patient carethrough interoperable exchange of electronic healthcare information. Philadel-phia: American College of Physicians; April 2004. Accessed at www.acponline.org/hpp/quality_care.pdf on 4 November 2007.95. American College of Physicians. The advanced medical home: a patient-centered, physician-guided model of health care. Philadelphia: American Collegeof Physicians; January 2006. Accessed at www.acponline.org/hpp/statehc06_5.pdf on 4 November 2007.96. American College of Physicians. The use of performance measurements toimprove physician quality of care. Philadelphia: American College of Physicians;March 2004. Accessed at www.acponline.org/hpp/performance_measure.pdf onon 4 November 2007.97. American College of Physicians. The changing face of ambulatory medi-cine—reimbursing physicians for computer-based care. Philadelphia: AmericanCollege of Physicians; March 2003. Accessed at www.acponline.org/ppvl/policies/e000920.pdf on 4 November 2007.98. American College of Physicians–American Society of Internal Medicine.Telephone triage. Philadelphia: American College of Physicians–American Soci-ety of Internal Medicine; September 2000. Accessed at www.acponline.org/ppvl/policies/e000707.pdf on 4 November 2007.99. American College of Physicians. Medical professionalism in the changinghealth care environment: revitalizing internal medicine by focusing on the pa-tient-physician relationship. Philadelphia: American College of Physicians; April2004. Accessed at www.acponline.org/ethics/changing.pdf.100. American College of Physicians. Linking physician payments to qualitycare. Philadelphia: American College of Physicians; 2005. Accessed at www.acponline.org/hpp/link_pay.pdf on 6 November 2007.101. American Society of Internal Medicine. America’s health care system stran-gling in red tape. Washington, DC: American Society of Internal Medicine;1990.102. American Society of Internal Medicine. America’s reducing the managedcare hassle factor. Washington, DC: Amerian Society of Internal Medicine; 1998.103. Baron RJ. Quality improvement with an electronic health record: achiev-able, but not automatic. Ann Intern Med. 2007;147:549-52. [PMID: 17938393]104. Agency for Healthcare Research and Quality. Role and mission of theAgency for Healthcare Research and Quality. 2002. Accessed at www.ahrq.gov/about/annrpt02/annrpt02b.htm on 6 November 2007.
Position PaperHigh-Performance Health Care System with Universal Access
www.annals.org 1 January 2008 Annals of Internal Medicine Volume 148 • Number 1 21