Accounting for Decision Making and Control, 7th Edition
717
-
Upload
independent -
Category
Documents
-
view
0 -
download
0
Transcript of Accounting for Decision Making and Control, 7th Edition

Seventh Edition
Accounting forDecision Makingand Control
Jerold L. ZimmermanUniversity of Rochester
zim36725_fm_i-xvi.qxd 12/15/09 2:31 PM Page i

ACCOUNTING FOR DECISION MAKING AND CONTROL, SEVENTH EDITION
Published by McGraw-Hill, a business unit of The McGraw-Hill Companies, Inc., 1221 Avenue of the Americas,New York, NY 10020. Copyright © 2011 by The McGraw-Hill Companies, Inc. All rights reserved. Previouseditions © 2009, 2006, and 2003. No part of this publication may be reproduced or distributed in any form or byany means, or stored in a database or retrieval system, without the prior written consent of The McGraw-HillCompanies, Inc., including, but not limited to, in any network or other electronic storage or transmission, orbroadcast for distance learning.
Some ancillaries, including electronic and print components, may not be available to customers outside the United States.
This book is printed on acid-free paper.
1 2 3 4 5 6 7 8 9 0 DOW/DOW 1 0 9 8 7 6 5 4 3 2 1 0
ISBN 978-0-07-813672-6MHID 0-07-813672-5
Vice President & Editor-in-Chief: Brent GordonVice President of EDP: Sesha BolisettyEditorial Director: Stewart MattsonSponsoring Editor: Dick HercherMarketing Manager: Sankha BasuEditorial Coordinator: Rebecca MannProject Manager: Erin MelloyDesign Coordinator: Brenda A. RolwesCover Designer: Studio Montage, St. Louis, MissouriProduction Supervisor: Sue CulbertsonMedia Project Manager: Balaji SundararamanCompositor: MPS Limited, A Macmillan CompanyTypeface: 10/12 Times New RomanPrinter: R. R. Donnelley-Willard
All credits appearing on page or at the end of the book are considered to be an extension of the copyright page.
Library of Congress Cataloging-in-Publication Data
Zimmerman, Jerold L., 1947-Accounting for decision making and control / Jerold L. Zimmerman.—7th ed.
p. cm.Includes bibliographical references and index.ISBN-13: 978-0-07-813672-6 (acid-free paper)ISBN-10: 0-07-813672-5 (acid-free paper) 1. Managerial accounting. I. Title. HF5657.4.Z55 2010658.15'11—dc22
2009049120
To: Conner, Easton, and Jillian
www.mhhe.com
zim36725_fm_i-xvi.qxd 12/15/09 2:31 PM Page ii

About the Author
iii
Jerold L. ZimmermanJerold Zimmerman is Ronald L. Bittner Professor at theWilliam E. Simon Graduate School of Business, Univer-sity of Rochester. He holds an undergraduate degree fromthe University of Colorado, Boulder, and a doctoratefrom the University of California, Berkeley.
While at Rochester, Dr. Zimmerman has taught a va-riety of courses spanning accounting, finance, and eco-nomics. Accounting courses include nonprofit accounting,intermediate accounting, accounting theory, and manage-rial accounting. A deeper appreciation of the challenges ofmanaging a complex organization was acquired by spend-ing four years as Deputy Dean of the Simon School.
Professor Zimmerman publishes widely in accounting on topics as diverse as cost al-locations, Sarbanes-Oxley Act, disclosure, financial accounting theory, capital markets, andexecutive compensation. His paper “The Costs and Benefits of Cost Allocations” won theAmerican Accounting Association’s Competitive Manuscript Contest. He is recognized fordeveloping Positive Accounting Theory. This work, co-authored with colleague Ross Watts,at the Massachusetts Institute of Technology, received the American Institute of CertifiedPublic Accountants’ Notable Contribution to the Accounting Literature Award for “Towardsa Positive Theory of the Determination of Accounting Standards” and “The Demand forand Supply of Accounting Theories: The Market for Excuses.” Both papers appeared in theAccounting Review. Professors Watts and Zimmerman are also co-authors of the highlycited textbook Positive Accounting Theory (Prentice Hall, 1986). More recently, ProfessorsWatts and Zimmerman received the 2004 American Accounting Association Seminal Con-tribution to the Literature award. Professor Zimmerman’s textbooks also include: Manage-rial Economics and Organizational Architecture with Clifford Smith and James Brickley,5th ed. (McGraw-Hill/Irwin, 2009); and Management Accounting: Analysis and Interpreta-tion with Cheryl McWatters and Dale Morse (Pearson Education Limited UK, 2008). He isa founding editor of the Journal of Accounting and Economics, published by North-Holland.This scientific journal is one of the most highly referenced accounting publications.
He and his wife Dodie have two daughters, Daneille and Amy. Jerry has been knownto occasionally engage friends and colleagues in an amicable diversion on the links.
zim36725_fm_i-xvi.qxd 12/15/09 2:31 PM Page iii

Preface
iv
During their professional careers, managers in all organizations, profit and nonprofit, in-teract with their accounting systems. Sometimes managers use the accounting system to ac-quire information for decision making. At other times, the accounting system measuresperformance and thereby influences their behavior. The accounting system is both a sourceof information for decision making and part of the organization’s control mechanisms—thus, the title of the book, Accounting for Decision Making and Control.
The purpose of this book is to provide students and managers with an understanding andappreciation of the strengths and limitations of an organization’s accounting system, therebyallowing them to be more intelligent users of these systems. This book provides a frameworkfor thinking about accounting systems and a basis for analyzing proposed changes to thesesystems. The text demonstrates that managerial accounting is an integral part of the firm’sorganizational architecture, not just an isolated set of computational topics.
Distinguishing FeaturesThis book differs from other managerial accounting texts in several ways. The most importantdifference is that it offers a conceptual framework for the study of managerial accounting.This book relies on opportunity cost and organizational architecture as the underlyingframework to organize the analysis. Opportunity cost is the conceptual foundation underlyingdecision making. While accounting-based costs are not opportunity costs, in some circum-stances accounting costs provide a starting point to estimate opportunity costs. Organizationalarchitecture provides the conceptual foundation to understand how accounting is employed aspart of the organization’s control mechanism. These two concepts, opportunity costs andorganizational architecture, provide the framework and illustrate the trade-offs created whenaccounting systems serve both functions: decision making and control.
This text emphasizes that there is no “free lunch”; improving an accounting system’sdecision-making ability often reduces its effectiveness as a control device. Likewise, usingan accounting system as a control mechanism usually comes at the expense of using thesystem for decision making. Most texts discuss the importance of deriving different esti-mates of costs for different purposes. Existing books do a good job illustrating howaccounting costs developed for one purpose, such as inventory valuation, cannot be usedwithout adjustment for other purposes, such as a make-or-buy decision. However, thesebooks often leave the impression that one accounting system can be used for multiplepurposes as long as the users make the appropriate adjustments in the data.
What existing texts do not emphasize is the trade-off between designing the account-ing system for decision making and designing it for control. For example, activity-basedcosting presumably improves the accounting system’s ability for decision making (pricingand product design), but existing texts do not address what activity-based costing gives upin terms of control. Accounting for Decision Making and Control emphasizes the trade-offsmanagers confront in an organization’s accounting system.
Trade-Offs
ConceptualFramework
zim36725_fm_i-xvi.qxd 12/15/09 2:31 PM Page iv

A central theme throughout this book is economic Darwinism, which simply implies thataccounting systems that survive in competitive industries must be yielding benefits that areat least as large as their costs. While newer accounting innovations such as the balancedscorecard are described, the text also indicates through a series of company histories thatmany elements of today’s modern costing systems can be traced back to much earlier times.It is useful to understand that today’s managers are struggling with the same accounting is-sues as their predecessors, because today’s students will also be struggling with the sameproblems. These problems continue to exist because they involve making trade-offs, usu-ally between systems for decision making (e.g., product pricing and make-or-buy deci-sions) versus control (e.g., performance evaluation).
Accounting systems differ across firms and change as firms’ circumstances change.Today’s students will be making these trade-offs in the future. The current rage in manage-rial accounting texts is to present the latest, most up-to-date accounting system innovations.While recent innovations are important to discuss, they should be placed in their properperspective. Traditional absorption costing systems have survived the test of time for hun-dreds of years. Accounting system innovations are new, not necessarily better. We certainlydo not know if they will survive.
Another meaningful distinction between this text and other books in the field is that thechapters in this text build on one another. The first four chapters develop the opportunitycost and organization theory foundation for the course. The remaining chapters apply thefoundation to analyzing specific topics such as budgets and standard costs. Most of thecontroversy in product costing involves apportioning overhead. Before absorption, variable,and activity-based costing are described, an earlier chapter provides a general analysis ofcost allocation. This analysis is applied in later chapters as the analytic framework forchoosing among the various product costing schemes. Other books emphasize a modular,flexible approach that allows instructors to devise their own sequence to the material, withthe result that these courses often appear as a series of unrelated, disjointed topics withoutany underlying cohesive framework. This book has 14 chapters, compared with the usual18–25. Instead of dividing a topic such as cost allocation into three small chapters, mosttopics are covered in one or at most two unified chapters.
The end-of-chapter problem material is an integral part of any text, and especially impor-tant in Accounting for Decision Making and Control. The problems and cases are drawnfrom actual company applications described by former students based on their work expe-rience. Many problems require students to develop critical thinking skills and to write shortessays after preparing their numerical analyses. Good problems get students excited aboutthe material and generate lively class discussions. Some problems do not have a single cor-rect answer. Rather, they contain multiple dimensions demanding a broad managerial per-spective. Marketing, finance, and human resource aspects of the situation are frequentlyposed. Few problems focus exclusively on computations.
Changes in the Seventh EditionBased on extensive feedback from instructors using the six editions and from my ownteaching experience, the seventh edition focuses on improving the book’s readability andaccessibility. In particular, the following changes have been made:
• Each chapter has been updated and streamlined based on student and instructorfeedback. More intuitive, easier-to-understand numerical examples have beenadded.
End-of-ChapterMaterial
Logical Sequence
EconomicDarwinism
Preface v
zim36725_fm_i-xvi.qxd 12/15/09 2:31 PM Page v

• Additional actual company practices have been integrated into the text.
• Sixteen new problems and cases supplement the existing problems. Users wereuniform in their praise of the problem material. They found it challenged their studentsto critically analyze multidimensional issues while still requiring numerical problem-solving skills. Further problems and cases to complement this selection have beenadded.
Overview of ContentChapter 1 presents the book’s conceptual framework by using a simple decision context re-garding accepting an incremental order from a current customer. The chapter describes whyfirms use a single accounting system and the concept of economic Darwinism, among otherimportant topics. This chapter is an integral part of the text.
Chapters 2, 4, and 5 present the underlying conceptual framework. The importance ofopportunity costs in decision making, cost–volume–profit analysis, and the difference be-tween accounting costs and opportunity costs are discussed in Chapter 2. Chapter 4 sum-marizes recent advances in the theory of organizations and Chapter 5 describes the crucialrole of accounting as part of the firm’s organizational architecture. Chapter 3 on capitalbudgeting extends opportunity costs to a multiperiod setting. This chapter can be skippedwithout affecting the flow of later material. Alternatively, Chapter 3 can be assigned at theend of the course.
Chapter 6 applies the conceptual framework and illustrates the trade-off managersmust make between decision making and control in a budgeting system. Budgets are adecision-making tool to coordinate activities within the firm and are a device to controlbehavior. This chapter provides an in-depth illustration of how budgets are a significantpart of an organization’s decision-making and control apparatus.
Chapter 7 presents a general analysis of why managers allocate certain costs and thebehavioral implications of these allocations. Cost allocations affect both decision makingand incentives. Thus, there is again the trade-off between decision making and control.Chapter 8 continues the cost allocation discussion by describing the “death spiral” that canoccur when significant fixed costs exist and excess capacity arises. This leads to an analy-sis of how to treat capacity costs—a trade-off between underutilization and overinvestment.Finally, several specific cost allocation methods such as service department costs and jointcosts are described.
Chapter 9 applies the general analysis of overhead allocation in Chapters 7 and 8 to thespecific case of absorption costing in a manufacturing setting. The managerial implicationsof traditional absorption costing are provided in Chapters 10 and 11. Chapter 10 analyzesvariable costing, and activity-based costing is the topic of Chapter 11. Variable costing is aninteresting example of economic Darwinism. Proponents of variable costing argue that itdoes not distort decision making and therefore should be adopted. Nonetheless it is notwidely practiced, probably because of tax, financial reporting, and control considerations.
Chapter 12 discusses the decision-making and control implications of standard laborand material costs. Chapter 13 extends the discussion to overhead and marketing vari-ances. Chapter 13 can be omitted without interrupting the flow of later material. Finally,Chapter 14 synthesizes the course by reviewing the conceptual framework and applying itto recent organizational innovations, such as Six Sigma, lean production, and the balancedscorecard. These innovations provide an opportunity to apply the analytic framework un-derlying the text.
vi Preface
zim36725_fm_i-xvi.qxd 12/15/09 2:31 PM Page vi

Overview of Table of Contents
Preface vii
Chapter 1Introduction
Chapter 2The Nature of Costs
Chapter 6Budgeting
Chapter 7Cost Allocation: Theory
Chapter 8Cost Allocation: Practices
Chapter 9Absorption Cost Systems
Chapter 4Organizational Architecture
Chapter 5Responsibility Accounting
& Transfer PricingChapter 3*
Opportunity Cost ofCapital and Capital Budgeting
Chapter 10Criticisms of Absorption Cost Systems: Incentive to Overproduce
Chapter 11Criticisms of Absorption Cost Systems: Inaccurate Product Costs
Chapter 12Standard Costs: Direct Labor and Materials
Chapter 13*Overhead & Marketing Variances
Chapter 14Management Accounting in a
Changing Environment
*Chapter can be omitted without interrupting the flow of material.
zim36725_fm_i-xvi.qxd 12/15/09 2:31 PM Page vii

Using the TextThis book assumes that the student is familiar with introductory financial accounting.Accounting for Decision Making and Control can be used in advanced undergraduate, grad-uate, or executive programs. It is being used widely outside the United States. While thebook relies on opportunity costs and organizational economics, much of the discussion isat an intuitive level. To focus on the managerial implications of the material, journal entriesare deliberately de-emphasized.
The text is concise, which allows the instructor to supplement the course with additionaloutside readings or heavy problem assignments. The text has been used in a 10-week quar-ter course with few outside readings and two to three hours of homework assignments forevery class period. MBA students find this challenging and rewarding. They report a betterunderstanding of how to use accounting numbers, are more comfortable at preparing finan-cial analyses, and are better able to take a set of facts and communicate a cogent analysis.Alternatively, the text can support a semester-length course. Executive MBA students praisethe text’s real-world applicability, readability, and the relevance of the problem material.
Some of the more challenging material is presented in appendixes following the chap-ters. Chapter 2’s appendix describes the pricing decision. Chapter 6’s appendix contains acomprehensive master budget. The reciprocal method for allocating service departmentcosts is described in the appendix to Chapter 8. The appendixes to Chapter 9 describeprocess costing and demand shifts, fixed costs, and pricing. Appendixes can be deletedwithout affecting future chapter discussions.
Online Learning Center (OLC): www.mhhe.com/zimerman7e.The Instructor Edition of Accounting for Decision Making and Control, 7e, OLC is pass-word protected and a convenient place for instructors to access course supplements. Re-sources for professors include chapter-by-chapter teaching strategies, suggested problemassignments, recommended outside cases, lecture notes, sample syllabi, chapter PowerPointpresentations, and complete solutions to all problems and case material within the text.
The Student Edition of Accounting for Decision Making and Control, 7e, OLCcontains review material to help students study, including PowerPoint presentations andmultiple-choice quizzes.
Tegrity Campus: Lectures 24/7 Tegrity Campus is a service that makesclass time available 24/7 by automatically capturing lectures in a searchable format for stu-dents to review when they study and complete assignments. With a simple one-click start-and-stop process, you capture all computer screens and corresponding audio. Students canreplay any part of any class with easy-to-use browser-based viewing. With Tegrity Campus,students quickly recall key moments by using Tegrity Campus’s unique search feature.
To learn more about Tegrity, watch a two-minute Flash demo at http://tegritycampus.mhhe.com.
AcknowledgmentsWilliam Vatter and George Benston motivated my interest in managerial accounting. Thegenesis for this book and its approach reflect the oral tradition of my colleagues, past andpresent, at the University of Rochester. William Meckling and Michael Jensen stimulatedmy thinking and provided much of the theoretical structure underlying the book, as anyonefamiliar with their work will attest. My long and productive collaboration with Ross Wattssharpened my analytical skills and further refined the approach. He also furnished most ofthe intellectual capital for Chapter 3, including the problem material. Ray Ball has been a
Supplements
viii Preface
zim36725_fm_i-xvi.qxd 12/15/09 2:31 PM Page viii

constant source of ideas. Clifford Smith and James Brickley continue to enhance my eco-nomic education. Three colleagues, Andrew Christie, Dan Gode, and Scott Keating, sup-plied particularly insightful comments that enriched the analysis at critical junctions.Valuable comments from Anil Arya, Ron Dye, Andy Leone, K. Ramesh, Shyam Sunder,and Joseph Weintrop are gratefully acknowledged.
This project benefited greatly from the honest and intelligent feedback of numerousinstructors. I wish to thank Mahendra Gupta, Susan Hamlen, Badr Ismail, Charles Kile,Leslie Kren, Don May, William Mister, Mohamed Onsi, Ram Ramanan, Stephen Ryan,Michael Sandretto, Richard Sansing, Deniz Saral, Gary Schneider, Joe Weber, and WilliamYancey. This book also benefited from two other projects with which I have been involved.Writing Managerial Economics and Organizational Architecture (McGraw-Hill/Irwin,2009) with James Brickley and Clifford Smith and Management Accounting: Analysis andInterpretation (Pearson Education, Limited (UK), 2008) with Cheryl McWatters and DaleMorse helped me to better understand how to present certain topics.
To the numerous students who endured the development process, I owe an enormousdebt of gratitude. I hope they learned as much from the material as I learned teaching them.Some were even kind enough to provide critiques and suggestions, in particular Jan DickEijkelboom. Others supplied, either directly or indirectly, the problem material in the text.The able research assistance of P. K. Madappa, Eamon Molloy, Jodi Parker, Steve Sanders,Richard Sloan, and especially Gary Hurst, contributed amply to the manuscript and prob-lem material. Janice Willett and Barbara Schnathorst did a superb job of editing the manu-script and problem material.
The very useful comments and suggestions from the following reviewers are greatlyappreciated:
Preface ix
Urton Anderson
Howard M. Armitage
Vidya Awasthi
Kashi Balachandran
Da-Hsien Bao
Ron Barden
Howard G. Berline
Margaret Boldt
David Borst
Eric Bostwick
Marvin L. Bouillon
Wayne Bremser
David Bukovinsky
Linda Campbell
William M. Cready
James M. Emig
Gary Fane
Anita Feller
Tahirih Foroughi
Ivar Fris
Jackson F. Gillespie
Irving Gleim
Jon Glover
Gus Gordon
Sylwia Gornik-Tomaszewski
Susan Haka
Bert Horwitz
Steven Huddart
Robert Hurt
Douglas A. Johnson
Lawrence A. Klein
Thomas Krissek
A. Ronald Kucic
Daniel Law
Chi-Wen Jevons Lee
Suzanne Lowensohn
James R. Martin
Alan H. McNamee
Marilyn Okleshen
Shailandra Pandit
Sam Phillips
Frank Probst
Kamala Raghavan
Ram Ramanan
William Rau
Jane Reimers
Thomas Ross
Harold P. Roth
P. N. Saksena
Donald Samaleson
Michael J. Sandretto
Arnold Schneider
Henry Schwarzbach
Elizabeth J. Serapin
Norman Shultz
James C. Stallman
William Thomas Stevens
Monte R. Swain
Clark Wheatley
Lourdes F. White
Paul F. Williams
Robert W. Williamson
Jeffrey A. Yost
S. Mark Young
zim36725_fm_i-xvi.qxd 12/15/09 2:31 PM Page ix

x Preface
Kathy Jones, my very able assistant, had the difficult and often impossible task ofmanaging and editing the manuscript and instructor manual. She did a superb job. To mywife Dodie and daughters Daneille and Amy, thank you for setting the right priorities andfor giving me the encouragement and environment to be productive. Finally, I wish to thankmy parents for all their support.
Jerold L. ZimmermanUniversity of Rochester
zim36725_fm_i-xvi.qxd 12/15/09 2:31 PM Page x

xi
Brief Contents
1 Introduction 1
2 The Nature of Costs 22
3 Opportunity Cost of Capital and Capital Budgeting 89
4 Organizational Architecture 135
5 Responsibility Accounting and Transfer Pricing 170
6 Budgeting 229
7 Cost Allocation: Theory 302
8 Cost Allocation: Practices 347
9 Absorption Cost Systems 409
10 Criticisms of Absorption Cost Systems: Incentive to Overproduce 468
11 Criticisms of Absorption Cost Systems: Inaccurate Product Costs 501
12 Standard Costs: Direct Labor and Materials 554
13 Overhead and Marketing Variances 592
14 Management Accounting in a Changing Environment 627
Solutions to Concept Questions 674Glossary 684Index 693
zim36725_fm_i-xvi.qxd 12/15/09 2:31 PM Page xi
Contents
1 Introduction 1
A. Managerial Accounting: Decision Making and Control 2B. Design and Use of Cost Systems 4C. Marmots and Grizzly Bears 8D. Management Accountant’s Role in the Organization 10E. Evolution of Management Accounting: A Framework for Change 13F. Vortec Medical Probe Example 15G. Outline of the Text 18H. Summary 19
2 The Nature of Costs 22
A. Opportunity Costs 231. Characteristics of Opportunity Costs 242. Examples of Decisions Based on Opportunity Costs 24
B. Cost Variation 281. Fixed, Marginal, and Average Costs 282. Linear Approximations 313. Other Cost Behavior Patterns 324. Activity Measures 33
C. Cost–Volume–Profit Analysis 341. Copier Example 342. Calculating Break-Even and Target Profits 363. Limitations of Cost–Volume–Profit Analysis 404. Multiple Products 405. Operating Leverage 42
D. Opportunity Costs versus Accounting Costs 451. Period versus Product Costs 462. Direct Costs, Overhead Costs, and Opportunity Costs 46
E. Cost Estimation 501. Account Classification 502. Motion and Time Studies 50
F. Summary 50Appendix: Costs and the Pricing Decision 51
3 Opportunity Cost of Capital and Capital Budgeting 89
A. Opportunity Cost of Capital 90B. Interest Rate Fundamentals 93
1. Future Values 932. Present Values 94
xii
zim36725_fm_i-xvi.qxd 12/16/09 8:30 PM Page xii

Contents xiii
3. Present Value of a Cash Flow Stream 954. Perpetuities 965. Annuities 976. Multiple Cash Flows per Year 98
C. Capital Budgeting: The Basics 1001. Decision to Acquire an MBA 1002. Decision to Open a Video Rental Store 1013. Essential Points about Capital Budgeting 102
D. Capital Budgeting: Some Complexities 1041. Risk 1042. Inflation 1053. Taxes and Depreciation Tax Shields 107
E. Alternative Investment Criteria 1091. Payback 1092. Accounting Rate of Return 1093. Internal Rate of Return (IRR) 1114. Methods Used in Practice 114
F. Summary 115
4 Organizational Architecture 135
A. Basic Building Blocks 1361. Self-Interested Behavior, Team Production,
and Agency Costs 1362. Decision Rights and Rights Systems 1423. Role of Knowledge and Decision Making 1424. Markets versus Firms 1435. Influence Costs 145
B. Organizational Architecture 1461. Three-Legged Stool 1472. Decision Management versus Decision Control 150
C. Accounting’s Role in the Organization’s Architecture 152D. Example of Accounting’s Role: Executive
Compensation Contracts 155E. Summary 157
5 Responsibility Accounting and Transfer Pricing 170
A. Responsibility Accounting 1711. Cost Centers 1712. Profit Centers 1743. Investment Centers 1754. Economic Value Added (EVA®) 1805. Controllability Principle 183
B. Transfer Pricing 1851. International Taxation 1852. Economics of Transfer Pricing 1873. Common Transfer Pricing Methods 1914. Reorganization: The Solution If All Else Fails 1975. Recap 197
C. Summary 199
zim36725_fm_i-xvi.qxd 12/15/09 2:31 PM Page xiii

6 Budgeting 229
A. Generic Budgeting Systems 2311. Country Club 2312. Private University 2363. Large Corporation 238
B. Trade-Off between Decision Management and Decision Control 241
1. Communicating Specialized Knowledge versus Performance Evaluation 242
2. Budget Ratcheting 2423. Participative Budgeting 2454. New Approaches to Budgeting 2465. Managing the Trade-Off 249
C. Resolving Organizational Problems 2491. Short-Run versus Long-Run Budgets 2502. Line-Item Budgets 2523. Budget Lapsing 2534. Static versus Flexible Budgets 2535. Incremental versus Zero-Based Budgets 257
D. Summary 258Appendix: Comprehensive Master Budget Illustration 259
7 Cost Allocation: Theory 302
A. Pervasiveness of Cost Allocations 3041. Manufacturing Organizations 3052. Hospitals 3063. Universities 306
B. Reasons to Allocate Costs 3081. External Reporting/Taxes 3082. Cost-Based Reimbursement 3093. Decision Making and Control 311
C. Incentive/Organizational Reasons for Cost Allocations 312
1. Cost Allocations Are a Tax System 3122. Taxing an Externality 3133. Insulating versus Noninsulating Cost Allocations 319
D. Summary 322
8 Cost Allocation: Practices 347
A. Death Spiral 348B. Allocating Capacity Costs: Depreciation 353C. Allocating Service Department Costs 353
1. Direct Allocation Method 3552. Step-Down Allocation Method 3573. Service Department Costs and Transfer Pricing of Direct
and Step-Down Methods 3594. Reciprocal Allocation Method 3625. Recap 364
xiv Contents
zim36725_fm_i-xvi.qxd 12/15/09 2:31 PM Page xiv

Contents xv
D. Joint Costs 3641. Chickens 3662. Net Realizable Value 3673. Decision Making and Control 371
E. Segment Reporting and Joint Benefits 372F. Summary 373Appendix: Reciprocal Method for Allocating Service Department Costs 374
9 Absorption Cost Systems 409
A. Job Order Costing 411B. Cost Flows through the T-Accounts 413C. Allocating Overhead to Jobs 416
1. Overhead Rates 4162. Over/Underabsorbed Overhead 4173. Flexible Budgets to Estimate Overhead 4204. Expected versus Normal Volume 423
D. Permanent versus Temporary Volume Changes 427E. Plantwide versus Multiple Overhead Rates 428F. Process Costing: The Extent of Averaging 432G. Summary 433Appendix A: Process Costing 433Appendix B: Demand Shifts, Fixed Costs, and Pricing 439
10 Criticisms of Absorption Cost Systems: Incentive to Overproduce 468
A. Incentive to Overproduce 4701. Example 4702. Reducing the Overproduction Incentive 472
B. Variable (Direct) Costing 4741. Background 4742. Illustration of Variable Costing 4743. Overproduction Incentive under Variable
Costing 477C. Problems with Variable Costing 478
1. Classifying Fixed Costs as Variable Costs 4782. Ignores Opportunity Cost of Capacity 480
D. Beware of Unit Costs 481E. Summary 483
11 Criticisms of Absorption Cost Systems: Inaccurate Product Costs 501
A. Inaccurate Product Costs 502B. Activity-Based Costing 506
1. Choosing Cost Drivers 5072. Absorption versus Activity-Based Costing: An Example 513
C. Analyzing Activity-Based Costing 5171. Reasons for Implementing Activity-Based Costing 5172. Benefits and Costs of Activity-Based Costing 5193. ABC Measures Costs, Not Benefits 521
D. Acceptance of Activity-Based Costing 523E. Summary 527
zim36725_fm_i-xvi.qxd 12/15/09 2:31 PM Page xv
12 Standard Costs: Direct Labor and Materials 554
A. Standard Costs 5551. Reasons for Standard Costing 5562. Setting and Revising Standards 5573. Target Costing 561
B. Direct Labor and Materials Variances 5621. Direct Labor Variances 5632. Direct Materials Variances 5673. Risk Reduction and Standard Costs 571
C. Incentive Effects of Direct Labor and Materials Variances 5711. Build Inventories 5722. Externalities 5723. Discouraging Cooperation 5734. Mutual Monitoring 5735. Satisficing 573
D. Disposition of Standard Cost Variances 574E. The Costs of Standard Costs 576F. Summary 578
13 Overhead and Marketing Variances 592
A. Budgeted, Standard, and Actual Volume 593B. Overhead Variances 596
1. Flexible Overhead Budget 5962. Overhead Rate 5973. Overhead Absorbed 5984. Overhead Efficiency, Volume, and Spending Variances 5995. Graphical Analysis 6026. Inaccurate Flexible Overhead Budget 604
C. Marketing Variances 6051. Price and Quantity Variances 6052. Mix and Sales Variances 606
D. Summary 608
14 Management Accounting in a Changing Environment 627
A. Integrative Framework 6281. Organizational Architecture 6292. Business Strategy 6303. Environmental and Competitive Forces Affecting Organizations 6334. Implications 633
B. Organizational Innovations and Management Accounting 6341. Total Quality Management (TQM) 6352. Just-in-Time (JIT) Production 6393. Six Sigma and Lean Production 6424. Balanced Scorecard 644
C. When Should the Internal Accounting System Be Changed? 650D. Summary 651
Solutions to Concept Questions 674Glossary 684Index 693
xvi Contents
zim36725_fm_i-xvi.qxd 12/15/09 2:31 PM Page xvi

1
Chapter One
Introduction
Chapter Outline
A. Managerial Accounting: Decision Makingand Control
B. Design and Use of Cost Systems
C. Marmots and Grizzly Bears
D. Management Accountant’s Role in theOrganization
E. Evolution of Management Accounting:A Framework for Change
F. Vortec Medical Probe Example
G. Outline of the Text
H. Summary
zim36725_ch01_001-021.qxd 12/15/09 11:24 AM Page 1

A. Managerial Accounting: Decision Making and Control
Managers at BMW must decide which car models to produce, the quantity of each modelto produce given the selling prices for the models, and how to manufacture the automo-biles. They must decide which car parts, such as headlight assemblies, BMW should man-ufacture internally and which parts should be outsourced. They must decide not only onadvertising, distribution, and product positioning to sell the cars, but also the quantity andquality of the various inputs to use. For example, they must determine which models willhave leather seats and the quality of the leather to be used.
How are future revenues and costs of proposed car models estimated? Similarly, in de-ciding which investment projects to accept, capital budgeting analysts require data on fu-ture cash flows. How are these numbers derived? How does one coordinate the activities ofhundreds or thousands of employees in the firm so that these employees accept senior man-agement’s leadership? At BMW and organizations small and large, managers must havegood information to make all these decisions and the leadership abilities to get others toimplement the decisions.
Information about firms’ future costs and revenues is not readily available but must beestimated by managers. Organizations must obtain and disseminate the knowledge to makethese decisions. Decision making is much easier with the requisite knowledge.
Organizations’ internal information systems provide some of the knowledge for thesepricing, production, capital budgeting, and marketing decisions. These systems range fromthe informal and the rudimentary to very sophisticated, computerized management infor-mation systems. The term information system should not be interpreted to mean a single,integrated system. Most information systems consist not only of formal, organized, tangi-ble records such as payroll and purchasing documents but also informal, intangible bits ofdata such as memos, special studies, and managers’ impressions and opinions. The firm’sinformation system also contains nonfinancial information such as customer and employeesatisfaction surveys. As firms grow from single proprietorships to large global corporationswith tens of thousands of employees, managers lose the knowledge of enterprise affairsgained from personal, face-to-face contact in daily operations. Higher-level managers oflarger firms come to rely more and more on formal operating reports.
The internal accounting system, an important component of a firm’s information sys-tem, includes budgets, data on the costs of each product and current inventory, and periodicfinancial reports. In many cases, especially in small companies, these accounting reportsare the only formalized part of the information system providing the knowledge for deci-sion making. Many larger companies have other formalized, nonaccounting–based infor-mation systems, such as production planning systems. This book focuses on how internalaccounting systems provide knowledge for decision making.
After making decisions, managers must implement them in organizations in whichthe interests of the employees and the owners do not necessarily coincide. Just becausesenior managers announce a decision does not necessarily ensure that the decision will beimplemented.
Organizations do not have objectives; people do. A discussion of an organization’sobjectives requires addressing the owners’ objectives. One common objective of owners isto maximize profits, or the difference between revenues and expenses. Maximizing firmvalue is equivalent to maximizing the stream of profits over the organization’s life. Em-ployees, suppliers, and customers also have their own objectives—usually maximizing theirself-interest.
Not all owners care only about monetary flows. An owner of a professional sports teammight care more about winning (subject to covering costs) than maximizing profits.
2 Chapter 1
zim36725_ch01_001-021.qxd 12/15/09 11:24 AM Page 2

1 Control refers to the process that helps “ensure the proper behaviors of the people in the organization.These behaviors should be consistent with the organization’s strategy,” as noted in K Merchant, Control inBusiness Organizations (Boston: Pitman Publishing Inc., 1985), p. 4. Merchant provides an extensive discussionof control systems and a bibliography. In Theory of Accounting and Control (Cincinnati, OH: South-WesternPublishing Company, 1997), S Sunder describes control as mitigating and resolving conflicts betweenemployees, owners, suppliers, and customers that threaten to pull organizations apart.
Nonprofits do not have owners with the legal rights to the organization’s profits. More-over, nonprofits seek to maximize their value by serving some social goal such as educa-tion, health care, or welfare.
No matter what the firm’s objective, the organization will survive only if its inflow ofresources (such as revenue) is at least as large as the outflow. Accounting information isuseful to help manage the inflow and outflow of resources and to help align the owners’ andemployees’ interests, no matter what objectives the owners wish to pursue.
Throughout this book, we assume that individuals maximize their self-interest. Theowners of the firm usually want to maximize profits, but managers and employees will doso only if it is in their interest. Hence, a conflict of interest exists between owners—who, ingeneral, want higher profits—and employees—who want easier jobs, higher wages, andmore fringe benefits. To control this conflict, senior managers and owners design systemsto monitor employees’ behavior and incentive schemes that reward employees for generatingmore profits. Not-for-profit organizations face similar conflicts. Those people responsiblefor the nonprofit organization (boards of trustees and government officials) must designincentive schemes to motivate their employees to operate the organization efficiently.
All successful firms must devise mechanisms that help align employee interests withmaximizing the organization’s value. All of these mechanisms constitute the firm’s controlsystem; they include performance measures and incentive compensation systems, promo-tions, demotions, and terminations, security guards and video surveillance, internal auditors,and the firm’s internal accounting system.1
As part of the firm’s control system, the internal accounting system helps align the in-terests of managers and shareholders to cause employees to maximize firm value. It soundslike a relatively easy task to design systems to ensure that employees maximize firm value.But a significant portion of this book demonstrates the exceedingly complex nature ofaligning employee interests with those of the owners.
Internal accounting systems serve two purposes: (1) to provide some of the knowledgenecessary for planning and making decisions (decision making) and (2) to help motivate andmonitor people in organizations (control). The most basic control use of accounting is to pre-vent fraud and embezzlement. Maintaining inventory records helps reduce employee theft.Accounting budgets, discussed more fully in Chapter 6, provide an example of both decisionmaking and control. Asking each salesperson in the firm to forecast their next year’s sales isuseful for planning next year’s production (decision making). However, if the salesperson’ssales forecast is used to benchmark their performance for compensation purposes (control),they have strong incentives to underestimate their budget forecasts.
Using internal accounting systems for both decision making and control gives rise tothe fundamental trade-off in these systems: A system cannot be designed to perform twotasks as well as a system that must perform only one task. Some ability to deliver know-ledge for decision making is usually sacrificed to provide better motivation (control). Thetrade-off between providing knowledge for decision making and motivation/control arisescontinually throughout this text.
This book is applications oriented: It describes how the accounting system assemblesknowledge necessary for implementing decisions using the theories from microeconomics,
Introduction 3
zim36725_ch01_001-021.qxd 12/15/09 11:24 AM Page 3

finance, operations management, and marketing. It also shows how the accounting systemhelps motivate employees to implement these decisions. Moreover, it stresses the contin-ual trade-offs that must be made between the decision making and control functions ofaccounting.
A survey of 2,000 senior-level executives (chief financial officers, vice presidents offinance, controllers, etc.) asked managers to rank the importance of various goals of theirfirm’s accounting system. The typical respondent was in a company with $300 million ofsales and 1,700 employees. Eighty percent of the respondents reported that cost manage-ment (controlling costs) was a significant goal of their accounting system and was impor-tant to achieving their company’s overall strategic objective. Another top priority of theirfirm’s accounting system, even higher than cost management or strategic planning, is in-ternal reporting and performance evaluation. These results indicate that firms use their in-ternal accounting system both for decision making (strategic planning, cost reduction,financial management) and for controlling behavior (internal reporting and performanceevaluation).2
The firm’s accounting system is very much a part of the fabric that helps hold the or-ganization together. It provides knowledge for decision making, and it provides informationfor evaluating and motivating the behavior of individuals within the firm. Being such an in-tegral part of the organization, the accounting system cannot be studied in isolation fromthe other mechanisms used for decision making or for reducing organizational problems. Afirm’s internal accounting system should be examined from a broad perspective, as part ofthe larger organization design question facing managers.
This book uses an economic perspective to study how accounting can motivate andcontrol behavior in organizations. Besides economics, a variety of other paradigms also areused to investigate organizations: scientific management (Taylor), the bureaucratic school(Weber), the human relations approach (Mayo), human resource theory (Maslow, Rickert,Argyris), the decision-making school (Simon), and the political science school (Selznick).Behavior is a complex topic. No single theory or approach is likely to capture all the ele-ments. However, understanding managerial accounting requires addressing the behavioraland organizational issues. Economics offers one useful framework.
B. Design and Use of Cost SystemsManagers make decisions and monitor subordinates who make decisions. Both managersand accountants must acquire sufficient familiarity with cost systems to perform theirjobs. Accountants (often called controllers) are charged with designing, improving, andoperating the firm’s accounting system—an integral part of both the decision-making andperformance evaluation systems. Both managers and accountants must understand thestrengths and weaknesses of current accounting systems. Internal accounting systems, likeall systems within the firm, are constantly being refined and modified. Accountants’responsibilities include making these changes.
An internal accounting system should have the following characteristics:
1. Provides the information necessary to assess the profitability of products orservices and to optimally price and market these products or services.
4 Chapter 1
2 Ernst & Young and IMA, “State of Management Accounting,” www.imanet.org/pdf/SurveyofMgtAcctingEY.pdf, 2003.
zim36725_ch01_001-021.qxd 12/15/09 11:24 AM Page 4

2. Provides information to detect production inefficiencies to ensure that theproposed products and volumes are produced at minimum cost.
3. When combined with the performance evaluation and reward systems, createsincentives for managers to maximize firm value.
4. Supports the financial accounting and tax accounting reporting functions. (In some instances, these latter considerations dominate the first three.)
5. Contributes more to firm value than it costs.
Figure 1–1 portrays the functions of the accounting system. In it, the accountingsystem supports both external and internal reporting systems. Examine the top half of Fig-ure 1–1. The accounting procedures chosen for external reports to shareholders and taxingauthorities are dictated in part by regulators. The Securities and Exchange Commission(SEC) and the Financial Accounting Standards Board (FASB) regulate the financial state-ments issued to shareholders. The Internal Revenue Service (IRS) administers the ac-counting procedures used in calculating corporate income taxes. If the firm is involved ininternational trade, foreign tax authorities prescribe the accounting rules applied in calcu-lating foreign taxes. Regulatory agencies constrain public utilities’ and financial institu-tions’ accounting procedures.3
Management compensation plans and debt contracts often rely on external reports.Senior managers’ bonuses are often based on accounting net income. Likewise, if the firm
Introduction 5
3 Tax laws can affect financial reporting and internal reporting. For example, a 1973 U.S. tax code changeallowed firms to exclude manufacturing depreciation from inventories and write it off directly against taxableincome of the period if the same method was used for external financial reporting. Such a provision reducestaxes for most firms, although few firms adopted the procedure. See E Noreen and R Bowen, “Tax Incentivesand the Decision to Capitalize or Expense Manufacturing Overhead,” Accounting Horizons, 1989.
FIGURE 1–1
The multiple role ofaccounting systems
TaxingAuthorities
Shareholders
Regulation Board of Directors
Senior ManagementCompensation Plans
RegulatoryAuthorities
SEC/FASB
IRS & ForeignTax Authorities
ExternalReports
AccountingSystem
InternalReports
DecisionMaking
Control ofOrganizational
Problems
Debt Covenants Bondholders
zim36725_ch01_001-021.qxd 12/15/09 11:24 AM Page 5

issues long-term bonds, it agrees in the debt covenants not to violate specified accounting-based constraints. For example, the bond contract might specify that the debt-to-equityratio will not exceed some limit. Like taxes and regulation, compensation plans and debtcovenants create incentives for managers to choose particular accounting procedures.4
As firms expand into international markets, external users of the firm’s financial state-ments become global. No longer are the firm’s shareholders, tax authorities, and regulatorsdomestic. Rather, the firm’s internal and external reports are used internationally in a vari-ety of ways.
The bottom of Figure 1–1 illustrates that internal reports are used for decision makingas well as control of organizational problems. As discussed earlier, managers use a varietyof sources of data for making decisions. The internal accounting system provides one im-portant source. These internal reports are also used to evaluate and motivate (control) thebehavior of managers in the firm. The internal accounting system reports on managers’ per-formance and therefore provides incentives for them. Any changes to the internal account-ing system can affect all the various uses of the resulting accounting numbers.
The internal and external reports are closely linked. The internal accounting system af-fords a more disaggregated view of the company. These internal reports are generated morefrequently, usually monthly or even weekly or daily, whereas the external reports are pro-vided quarterly for publicly traded U.S. companies. The internal reports offer costs andprofits by specific products, customers, lines of business, and divisions of the company. Forexample, the internal accounting system computes the unit cost of individual products asthey are produced. These unit costs are then used to value the work-in-process and finishedgoods inventory, and to compute cost of goods sold. Chapter 9 describes the details of prod-uct costing.
Because internal systems serve multiple users and have several purposes, the firm em-ploys either multiple systems (one for each function) or one basic system that serves allthree functions (decision making, performance evaluation, and external reporting). Firmscan either maintain a single set of books and use the same accounting methods for both in-ternal and external reports, or they can keep multiple sets of books. The decision dependson the costs of writing and maintaining contracts based on accounting numbers, the costsfrom the dysfunctional internal decisions made using a single system, the additional book-keeping costs arising from the extra system, and the confusion of having to reconcile thedifferent numbers arising from multiple accounting systems.
Inexpensive accounting software packages and falling costs of computers have reducedsome of the costs of maintaining multiple accounting systems. However, confusion arises
6 Chapter 1
4 For further discussion of the incentives of managers to choose accounting methods, see R Watts andJ Zimmerman, Positive Accounting Theory (Englewood Cliffs, NJ: Prentice Hall, 1986).
ManagerialApplication:SpaceshipLost BecauseTwo MeasuresUsed
Multiple accounting systems are confusing and can lead to errors. An extreme exampleof this occurred in 1999 when NASA lost its $125 million Mars spacecraft. Engineers atLockheed Martin built the spacecraft and specified the spacecraft’s thrust in Englishpounds. But NASA scientists, navigating the craft, assumed the information was in met-ric newtons. As a result, the spacecraft was off course by 60 miles as it approached Marsand crashed. Whenever two systems are being used to measure the same underlyingevent, people can forget which system is being used.
SOURCE: A Pollack, “Two Teams, Two Measures Equaled One Lost Spacecraft,” The New York Times, October 1, 1999, p. 1.
zim36725_ch01_001-021.qxd 12/15/09 11:24 AM Page 6

when the systems report different numbers for the same concept. For example, when onesystem reports the manufacturing cost of a product as $12.56 and another system reports itat $17.19, managers wonder which system is producing the “right” number. Some man-agers may be using the $12.56 figure while others are using the $17.19 figure, causing in-consistency and uncertainty. Whenever two numbers for the same concept are produced, thenatural tendency is to explain (i.e., reconcile) the differences. Managers involved in thisreconciliation could have used this time in more productive ways. Also, using the same ac-counting system for multiple purposes increases the credibility of the financial reports foreach purpose.5 With only one accounting system, the external auditor monitors the internalreporting system at little or no additional cost.
Interestingly, a survey of large U.S. firms found that managers typically use the sameaccounting procedures for both external and internal reporting. For example, the same ac-counting rules for leases are used for both internal and external reporting by 93 percent ofthe firms. Likewise, 79 percent of the firms use the same procedures for inventory account-ing and 92 percent use the same procedures for depreciation accounting.6 Nothing preventsfirms from using separate accounting systems for internal decision making and internal per-formance evaluation except the confusion generated and the extra data processing costs.
Probably the most important reason firms use a single accounting system is it allows re-classification of the data. An accounting system does not present a single, bottom-line num-ber, such as the “cost of publishing this textbook.” Rather, the system reports the componentsof the total cost of this textbook: the costs of proofreading, typesetting, paper, binding, cover,and so on. Managers in the firm then reclassify the information on the basis of different at-tributes and derive different cost numbers for different decisions. For example, if the publisheris considering translating this book into Russian, not all the components used in calculatingthe U.S. costs are relevant. The Russian edition might be printed on different paper stock witha different cover. The point is, a single accounting system usually offers enough flexibility formanagers to reclassify, recombine, and reorganize the data for multiple purposes.
A single internal accounting system requires the firm to make trade-offs. A system thatis best for performance measurement and control is unlikely to be the best for decision mak-ing. It’s like configuring a motorcycle for both off-road and on-road racing: Riders on bikesdesigned for both racing conditions probably won’t beat riders on specialized bikes designedfor just one type of racing surface. Wherever a single accounting system exists, additionalanalyses arise. Managers making decisions find the accounting system less useful and de-vise other systems to augment the accounting numbers for decision-making purposes.
Introduction 7
5A Christie, “An Analysis of the Properties of Fair (Market) Value Accounting,” in Modernizing U.S.Securities Regulation: Economic and Legal Perspectives, K Lehn and R Kamphuis, eds. (Pittsburgh, PA:University of Pittsburgh, Joseph M. Katz Graduate School of Business, 1992).
6 R Vancil, Decentralization: Managerial Ambiguity by Design (Burr Ridge, IL: Dow Jones-Irwin, 1979), p. 360.
HistoricalApplication:DifferentCosts forDifferentPurposes
“. . . cost accounting has a number of functions, calling for different, if not inconsistent,information. As a result, if cost accounting sets out, determined to discover what the costof everything is and convinced in advance that there is one figure which can be foundand which will furnish exactly the information which is desired for every possible pur-pose, it will necessarily fail, because there is no such figure. If it finds a figure which isright for some purposes it must necessarily be wrong for others.”
SOURCE: J Clark, Studies in the Economics of Overhead Costs (Chicago: University of Chicago Press, 1923), p. 234.
zim36725_ch01_001-021.qxd 12/15/09 11:24 AM Page 7
C. Marmots and Grizzly BearsEconomists and operating managers often criticize accounting data for decision making.Accounting data are often not in the form managers want for decision making. For exam-ple, the book value of a factory (historical cost less accumulated accounting depreciation)does not necessarily indicate the market or selling value of the factory, which is what amanager wants to know when contemplating shutting down the factory. Why do managerspersist in using (presumably inferior) accounting information?
Before addressing this question, consider the parable of the marmots and the grizzlybears.7 Marmots are small groundhogs that are a principal food source for certain bears.Zoologists studying the ecology of marmots and bears observed bears digging and movingrocks in the autumn in search of marmots. They estimated that the calories expended
8 Chapter 1
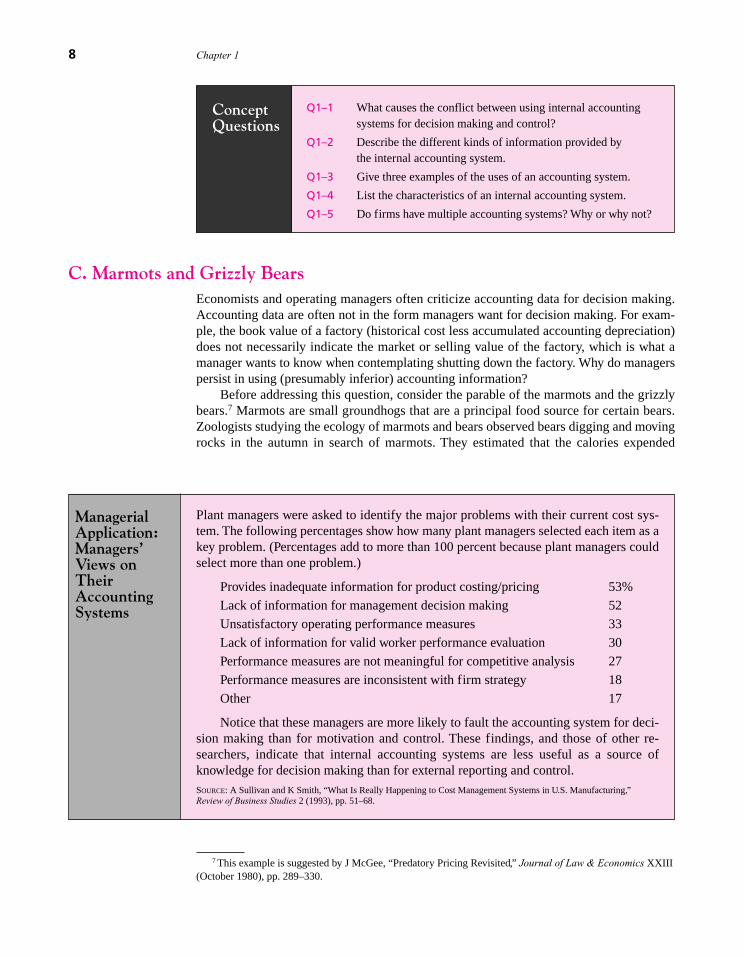
ManagerialApplication:Managers’Views onTheirAccountingSystems
Plant managers were asked to identify the major problems with their current cost sys-tem. The following percentages show how many plant managers selected each item as akey problem. (Percentages add to more than 100 percent because plant managers couldselect more than one problem.)
Provides inadequate information for product costing/pricing 53%
Lack of information for management decision making 52
Unsatisfactory operating performance measures 33
Lack of information for valid worker performance evaluation 30
Performance measures are not meaningful for competitive analysis 27
Performance measures are inconsistent with firm strategy 18
Other 17
Notice that these managers are more likely to fault the accounting system for deci-sion making than for motivation and control. These findings, and those of other re-searchers, indicate that internal accounting systems are less useful as a source ofknowledge for decision making than for external reporting and control.
SOURCE: A Sullivan and K Smith, “What Is Really Happening to Cost Management Systems in U.S. Manufacturing,”Review of Business Studies 2 (1993), pp. 51–68.
7 This example is suggested by J McGee, “Predatory Pricing Revisited,” Journal of Law & Economics XXIII(October 1980), pp. 289–330.
ConceptQuestions
Q1–1 What causes the conflict between using internal accountingsystems for decision making and control?
Q1–2 Describe the different kinds of information provided bythe internal accounting system.
Q1–3 Give three examples of the uses of an accounting system.
Q1–4 List the characteristics of an internal accounting system.
Q1–5 Do firms have multiple accounting systems? Why or why not?
zim36725_ch01_001-021.qxd 12/15/09 11:24 AM Page 8
searching for marmots exceeded the calories obtained from their consumption. A zoologistrelying on Darwin’s theory of natural selection might conclude that searching for marmotsis an inefficient use of the bear’s limited resources and thus these bears should become ex-tinct. But fossils of marmot bones near bear remains suggest that bears have been search-ing for marmots for tens of thousands of years.
Since the bears survive, the benefits of consuming marmots must exceed the costs.Bears’ claws might be sharpened as a by-product of the digging involved in hunting formarmots. Sharp claws are useful in searching for food under the ice after winter’s hiberna-tion. Therefore, the benefit of sharpened claws and the calories derived from the marmotsoffset the calories consumed gathering the marmots.
What does the marmot-and-bear parable say about why managers persist in using ap-parently inferior accounting data in their decision making? As it turns out, the marmot-and-bear parable is an extremely important proposition in the social sciences known aseconomic Darwinism. In a competitive world, if surviving organizations use some operat-ing procedure (such as historical cost accounting) over long periods of time, then this pro-cedure likely yields benefits in excess of its costs. Firms survive in competition by sellinggoods or services at lower prices than their competitors while still covering costs. Firmscannot survive by making more mistakes than their competitors.8
Economic Darwinism suggests that in successful (surviving) firms, things should notbe fixed unless they are clearly broken. Currently, considerable attention is being directed
Introduction 9
8 See A Alchian, “Uncertainty, Evolution and Economic Theory,” Journal of Political Economy 58 (June 1950),pp. 211–21.
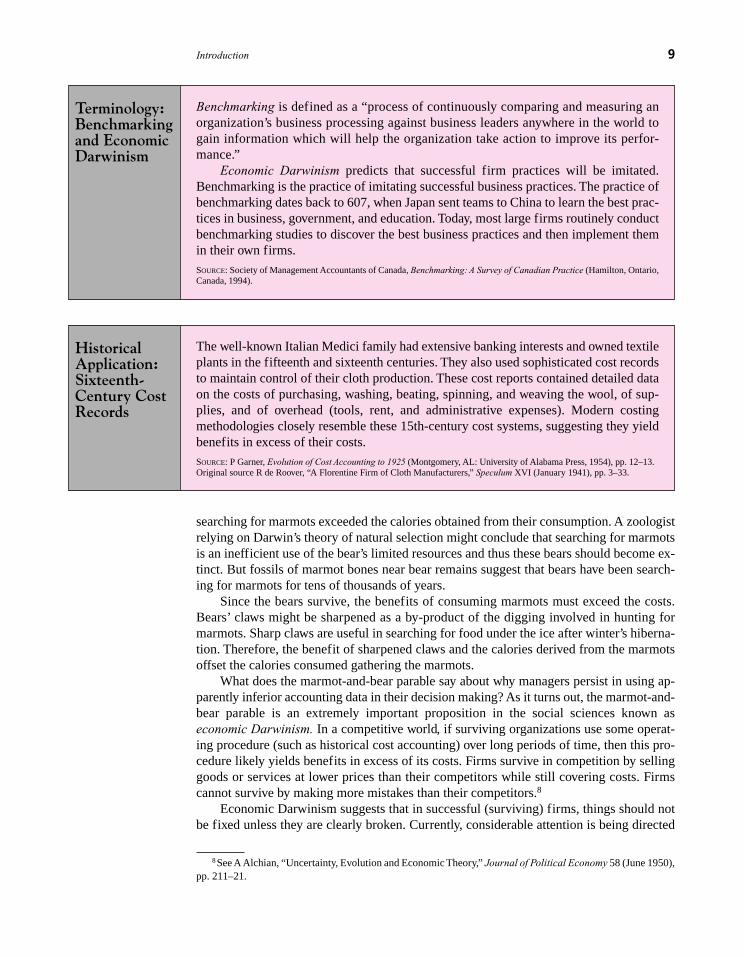
Terminology:Benchmarkingand EconomicDarwinism
Benchmarking is defined as a “process of continuously comparing and measuring anorganization’s business processing against business leaders anywhere in the world togain information which will help the organization take action to improve its perfor-mance.”
Economic Darwinism predicts that successful firm practices will be imitated.Benchmarking is the practice of imitating successful business practices. The practice ofbenchmarking dates back to 607, when Japan sent teams to China to learn the best prac-tices in business, government, and education. Today, most large firms routinely conductbenchmarking studies to discover the best business practices and then implement themin their own firms.
SOURCE: Society of Management Accountants of Canada, Benchmarking: A Survey of Canadian Practice (Hamilton, Ontario,Canada, 1994).
HistoricalApplication:Sixteenth-Century CostRecords
The well-known Italian Medici family had extensive banking interests and owned textileplants in the fifteenth and sixteenth centuries. They also used sophisticated cost recordsto maintain control of their cloth production. These cost reports contained detailed dataon the costs of purchasing, washing, beating, spinning, and weaving the wool, of sup-plies, and of overhead (tools, rent, and administrative expenses). Modern costingmethodologies closely resemble these 15th-century cost systems, suggesting they yieldbenefits in excess of their costs.
SOURCE: P Garner, Evolution of Cost Accounting to 1925 (Montgomery, AL: University of Alabama Press, 1954), pp. 12–13.Original source R de Roover, “A Florentine Firm of Cloth Manufacturers,” Speculum XVI (January 1941), pp. 3–33.
zim36725_ch01_001-021.qxd 12/15/09 11:24 AM Page 9

at revising and updating firms’ internal accounting systems because many managers be-lieve their current accounting systems are “broken” and require major overhaul. Alternativeinternal accounting systems are being proposed, among them activity-based costing(ABC), balanced score cards, economic value added (EVA), and Lean accounting systems.These systems are discussed and analyzed later in terms of their ability to help managersmake better decisions as well as to help provide better measures of performance for man-agers in organizations, thereby aligning managers’ and owners’ interests.
Although internal accounting systems may appear to have certain inconsistencies withsome particular theory, these systems (like the bears searching for marmots) have survivedthe test of time and therefore are likely to be yielding unobserved benefits (like claw sharp-ening). This book discusses these additional benefits. Two caveats must be raised concern-ing too strict an application of economic Darwinism:
1. Some surviving operating procedures can be neutral mutations. Just because asystem survives does not mean that its benefits exceed its costs. Benefits lesscosts might be close to zero.
2. Just because a given system survives does not mean it is optimal. A better systemmight exist but has not yet been discovered.
The fact that most managers use their accounting system as the primary formal infor-mation system suggests that these accounting systems are yielding total benefits that exceedtheir total costs. These benefits include financial and tax reporting, providing informationfor decision making, and creating internal incentives. The proposition that surviving firmshave efficient accounting systems does not imply that better systems do not exist, only thatthey have not yet been discovered. It is not necessarily the case that what is, is optimal.Economic Darwinism helps identify the costs and benefits of alternative internal accountingsystems and is applied repeatedly throughout the book.
D. Management Accountant’s Role in the OrganizationTo better understand internal accounting systems, it is useful to describe how firms organizetheir accounting functions. No single organizational structure applies to all firms. Figure 1–2presents one common organization chart. The design and operation of the internal and exter-nal accounting systems are the responsibility of the firm’s chief financial officer (CFO). Thefirm’s line-of-business or functional areas, such as marketing, manufacturing, and research anddevelopment, are combined and shown under a single organization, “operating divisions.” Theremaining staff and administrative functions include human resources, chief financial officer,legal, and other. In Figure 1–2, the chief financial officer oversees all the financial and ac-counting functions in the firm and reports directly to the president. The chief financial officer’sthree major functions include: controllership, treasury, and internal audit. Controllership in-volves tax administration, the internal and external accounting reports (including statutory fil-ings with the Securities and Exchange Commission if the firm is publicly traded), and theplanning and control systems (including budgeting). Treasury involves short- and long-term fi-nancing, banking, credit and collections, investments, insurance, and capital budgeting. De-pending on their size and structure, firms organize these functions differently. Figure 1–2shows the internal audit group reporting directly to the chief financial officer. In other firms,internal audit reports to the controller, the chief executive officer, or the board of directors.
The controller is the firm’s chief management accountant and is responsible for datacollection and reporting. The controller compiles the data for balance sheets and incomestatements and for preparing the firm’s tax returns. In addition, this person prepares the in-ternal reports for the various divisions and departments within the firm and helps the other
10 Chapter 1
zim36725_ch01_001-021.qxd 12/15/09 11:24 AM Page 10

managers by providing them with the data necessary to make decisions—as well as thedata necessary to evaluate these managers’ performance.
Usually, each operating division or department has its own controller. For example, if a firmhas several manufacturing plants, each plant has its own plant controller, who reports to both theplant manager and the corporate controller. In Figure 1–2, the operating divisions have their owncontrollers. The plant controller provides the corporate controller with periodic reports on theplant’s operations. The plant controller oversees the plant’s budgets, payroll, inventory, and prod-uct costing system (which reports the cost of units manufactured at the plant). While most firmshave plant-level controllers, some firms centralize these functions to reduce staff, so that all theplant-level controller functions are performed centrally out of corporate headquarters.
The controllership function at the corporate, division, and plant levels involves assist-ing decision making and control. The controller must balance providing information to
Introduction 11
Board of Directors
President and ChiefExecutive Officer (CEO)
HumanResources
Chief FinancialOfficer (CFO) Legal OtherOperating
Divisions
Treasury Controller InternalAudit
Controller–OperatingDivisions
Tax FinancialReporting
CostAccounting
FIGURE 1–2
Organization chartfor a typicalcorporation
ManagerialApplication:Super CFOs(ChiefFinancialOfficers)
CFOs have greater responsibilities than ever before. As an integral part of the seniormanagement team, CFOs oversee organizations that provide decision-making infor-mation, identify risks and opportunities, and often make unpopular decisions, such asshutting down unprofitable segments.
Global competition, greater attention on corporate governance, and technologicalchange requires the CFO to have diverse skills, including:
• Deep understanding of the business.
• Knowledge of market dynamics and operational drivers of success.
• Strong analytic focus.
• Flexibility.
• Communication and team-building skills.
• Customer orientation.
• Appreciation for change management.
SOURCE: K Kuehn, “7 Habits of Strategic CFOs,” Strategic Finance (September 2008), pp. 27–30.
zim36725_ch01_001-021.qxd 12/15/09 11:24 AM Page 11

other managers for decision making against providing monitoring information to top exec-utives for use in controlling the behavior of lower-level managers.
Besides overseeing the controllership and treasury functions in the firm, the chieffinancial officer usually has responsibility for the internal audit function. The internal au-dit group’s primary roles are to seek out and eliminate internal fraud and to provide internalconsulting and risk management. The Sarbanes-Oxley Act of 2002 mandated numerous cor-porate governance reforms, such as requiring boards of directors of publicly traded compa-nies in the United States to have audit committees composed of independent (outside)directors and requiring these companies to continuously test the effectiveness of the internalcontrols over their financial statements. This federal legislation indirectly expanded the inter-nal audit group’s role. The internal audit group now works closely with the audit committeeof the board of directors to help ensure the integrity of the firm’s financial statements by test-ing whether the firm’s accounting procedures are free of internal control deficiencies.
The Sarbanes-Oxley Act also requires companies to have corporate codes of conduct(ethics codes). While many firms had ethics codes prior to this act, these codes define hon-est and ethical conduct, including conflicts of interest between personal and professionalrelationships, compliance with applicable governmental laws, rules and regulations, andprompt internal reporting of code violations to the appropriate person in the company. Theaudit committee of the board of directors is responsible for overseeing compliance with thecompany’s code of conduct.
The importance of the internal control system cannot be stressed enough. Throughoutthis book, we use the term control to mean aligning the interests of employees with maxi-mizing the value of the firm. The most basic conflict of interest between employees andowners is employee theft. To reduce the likelihood of embezzlement, firms install internalcontrol systems, which are an integral part of the firm’s control system. Internal and exter-nal auditors’ first responsibility is to test the integrity of the firm’s internal controls. Fraudand theft are prevented not just by having security guards and door locks but also by hav-ing procedures that require checks above a certain amount to be authorized by two people.Internal control systems include internal procedures, codes of conduct, and policies thatprohibit corruption, bribery, and kickbacks. Finally, internal control systems should preventintentional (or accidental) financial misrepresentation by managers.
12 Chapter 1
ManagerialApplication:CFO’s RoleDuring aGlobalEconomicCrisis
CFOs’ usual duties include managing the firm’s financial resources and maintaining theintegrity of the financial reporting systems, but these responsibilities became even morecritical to their organizations during the global financial crisis of 2008–2009. Duringnormal economic times, firms have ready access to short-term bank loans to financeoperations such as inventories and accounts receivable. Seasonal businesses usually bor-row while they build inventories and provide their customers credit to make purchases.These short-term loans are repaid when the inventories and receivables are liquidated. Butduring the subprime mortgage financial crisis starting in 2008, financially weakenedbanks stopped making these normal loans. CFOs and their treasury staffs started moni-toring daily the financial health of the banks who were lending them money. Corporationsalso rely on their banks to transfer funds across countries and various operations to paytheir employees and suppliers. If a firm’s bank fails and these critical cash transactions areimpaired, the firm’s operations are severely compromised. As PNC Bank senior vice pres-ident Scott Horan states, firms want “an ironclad guarantee for their cash accounts.”
SOURCE: V Ryan, “All Eyes on Treasury,” CFO (January 2009), pp. 36–41.
zim36725_ch01_001-021.qxd 12/15/09 11:24 AM Page 12

Introduction 13
ConceptQuestions
Q1–6 Define economic Darwinism.
Q1–7 Describe the major functions of the chief financial officer.
E. Evolution of Management Accounting: A Framework for ChangeManagement accounting has evolved with the nature of organizations. Prior to 1800, mostbusinesses were small, family-operated organizations. Management accounting was lessimportant for these small firms. It was not critical for planning decisions and control rea-sons because the owner could directly observe the organization’s entire environment. Theowner, who made all of the decisions, delegated little decision-making authority and had noneed to devise elaborate formal systems to motivate employees. The owner observing slack-ing employees simply replaced them. Only as organizations grew larger with remote oper-ations would management accounting become more important.
Most of today’s modern management accounting techniques were developed in theperiod from 1825 to 1925 with the growth of large organizations.9 Textile mills in the earlynineteenth century grew by combining the multiple processes (spinning the thread, dying,weaving, etc.) of making cloth. These large firms developed systems to measure the costper yard or per pound for the separate manufacturing processes. The cost data allowed man-agers to compare the cost of conducting a process inside the firm versus purchasing theprocess from external vendors. Similarly, the railroads of the 1850s to 1870s developed costsystems that reported cost per ton-mile and operating expenses per dollar of revenue. Thesemeasures allowed managers to increase their operating efficiencies. In the early 1900s,Andrew Carnegie (at what was to become U.S. Steel) devised a cost system that reporteddetailed unit cost figures for material and labor on a daily and weekly basis. This systemallowed senior managers to maintain very tight controls on operations and gave themaccurate and timely information on marginal costs for pricing decisions. Merchandisingfirms such as Marshall Field’s and Sears, Roebuck developed gross margin (revenues lesscost of goods sold) and stock-turn ratios (sales divided by inventory) to measure andevaluate performance. Manufacturing companies such as Du Pont Powder Company andGeneral Motors were also active in developing performance measures to control theirgrowing organizations.
In the period from 1925 to 1975, management accounting was heavily influenced byexternal considerations. Income taxes and financial accounting requirements (e.g., those ofthe Financial Accounting Standards Board) were the major factors affecting managementaccounting.
Since 1975, two major environmental forces have changed organizations and causedmanagers to question whether traditional management accounting procedures (pre-1975)are still appropriate. These environmental forces are (1) factory automation and com-puter/information technology and (2) global competition. To adapt to these environmentalforces, organizations must reconsider their organizational structure and their managementaccounting procedures.
Information technology advances such as the Internet, intranets, wireless communica-tions, and faster microprocessors have had a big impact on internal accounting processes.
9 P Garner, Evolution of Cost Accounting to 1925 (Montgomery, AL: University of Alabama Press, 1954);and A Chandler, The Visible Hand (Cambridge, MA: Harvard University Press, 1977).
zim36725_ch01_001-021.qxd 12/15/09 11:24 AM Page 13
More data are now available faster than ever before. Electronic data interchange,XHTML, e-mail, B2B e-commerce, bar codes, data warehousing, and online analyticalprocessing (OLAP) are just a few examples of new technology impacting managementaccounting. For example, managers now have access to daily sales and operating costs inreal time, as opposed to having to wait two weeks after the end of the calendar quarter forthis information. Firms have cut the time needed to prepare budgets for the next fiscalyear by several months because the information is transmitted electronically in standard-ized formats.
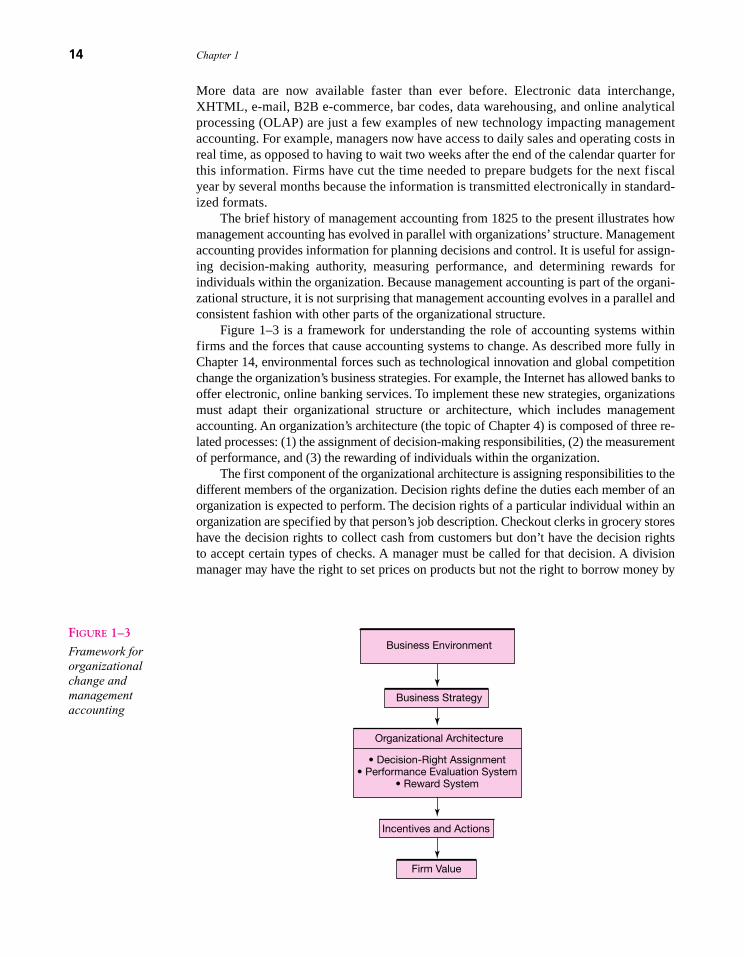
The brief history of management accounting from 1825 to the present illustrates howmanagement accounting has evolved in parallel with organizations’ structure. Managementaccounting provides information for planning decisions and control. It is useful for assign-ing decision-making authority, measuring performance, and determining rewards forindividuals within the organization. Because management accounting is part of the organi-zational structure, it is not surprising that management accounting evolves in a parallel andconsistent fashion with other parts of the organizational structure.
Figure 1–3 is a framework for understanding the role of accounting systems withinfirms and the forces that cause accounting systems to change. As described more fully inChapter 14, environmental forces such as technological innovation and global competitionchange the organization’s business strategies. For example, the Internet has allowed banks tooffer electronic, online banking services. To implement these new strategies, organizationsmust adapt their organizational structure or architecture, which includes managementaccounting. An organization’s architecture (the topic of Chapter 4) is composed of three re-lated processes: (1) the assignment of decision-making responsibilities, (2) the measurementof performance, and (3) the rewarding of individuals within the organization.
The first component of the organizational architecture is assigning responsibilities to thedifferent members of the organization. Decision rights define the duties each member of anorganization is expected to perform. The decision rights of a particular individual within anorganization are specified by that person’s job description. Checkout clerks in grocery storeshave the decision rights to collect cash from customers but don’t have the decision rightsto accept certain types of checks. A manager must be called for that decision. A divisionmanager may have the right to set prices on products but not the right to borrow money by
14 Chapter 1
FIGURE 1–3
Framework fororganizationalchange andmanagementaccounting
Business Environment
Business Strategy
Incentive and Actions
Firm Value
Organizational Architecture
• Decision-Right Assignment• Performance Evaluation System
• Reward System
Incentives and Actions
zim36725_ch01_001-021.qxd 12/15/09 11:24 AM Page 14

issuing debt. The president or the board of directors usually retains the right to issue debt,subject to board of directors’ approval.
The next two parts of the organizational architecture are the performance evaluationand reward systems. To motivate individuals within the organization, organizations musthave a system for measuring their performance and rewarding them. Performance measuresfor a salesperson could include total sales and customer satisfaction based on a survey ofcustomers. Performance measures for a manufacturing unit might be number of units pro-duced, total costs, and percentage of defective units. The internal accounting system is of-ten an important part of the performance evaluation system.
Performance measures are extremely important because rewards are generally basedon these measures. Rewards for individuals within organizations include wages andbonuses, prestige and greater decision rights, promotions, and job security. Becauserewards are based on performance measures, individuals and groups are motivated to act toinfluence the performance measures. Therefore, the performance measures chosen influ-ence individual and group efforts within the organization. A poor choice of performancemeasures can lead to conflicts within the organization and derail efforts to achieve organi-zational goals. For example, measuring the performance of a college president based on thenumber of students attending the college encourages the president to allow ill-prepared stu-dents to enter the college and reduces the quality of the educational experience for otherstudents.
As illustrated in Figure 1–3, changes in the business environment lead to new strate-gies and ultimately to changes in the firm’s organizational architecture, includingchanges in the accounting system to better align the interests of the employees with theobjectives of the organization. The new organizational architecture provides incentivesfor members of the organization to make decisions, which leads to a change in the valueof the organization. Within this framework, accounting assists in the control of the orga-nization through the organization’s architecture and provides information for decisionmaking. This framework for change will be referred to throughout the book.
F. Vortec Medical Probe ExampleTo illustrate some of the basic concepts developed in this text, suppose you have been askedto evaluate the following decision. Vortec Inc. manufactures a single product, a medicalprobe. Vortec sells the probes to wholesalers who then market them to physicians. Vortechas two divisions. The manufacturing division produces the probes; the marketing divisionsells them to wholesalers. The marketing division is rewarded on the basis of sales rev-enues. The manufacturing division is evaluated and rewarded on the basis of the averageunit cost of making the probes. The plant’s current volume is 100,000 probes per month.The following income statement summarizes last month’s operating results.
VORTEC MANUFACTURINGIncome Statement
Last Month
Sales revenue (100,000 units @ $5.00) $500,000Cost of sales (100,000 units @ $4.50) 450,000
Operating margin $ 50,000Less: Administrative expenses 27,500
Net income before taxes $ 22,500
Introduction 15
zim36725_ch01_001-021.qxd 12/15/09 11:24 AM Page 15

Medsupplies is one of Vortec’s best customers. Vortec sells 10,000 probes per month toMedsupplies at $5 per unit. Last week Medsupplies asked Vortec’s marketing division to in-crease its monthly shipment to 12,000 units, provided that Vortec would sell the additional2,000 units at $4 each. Medsupplies would continue to pay $5 for the original 10,000 units.Medsupplies argued that because this would be extra business for Vortec, no overheadshould be charged on the additional 2,000 units. In this case, a $4 price should be adequate.
Vortec’s finance department estimates that with 102,000 probes the average cost is$4.47 per unit, and hence the $4 price offered by Medsupplies is too low. The current ad-ministrative expenses of $27,500 consist of office rent, property taxes, and interest and willnot change if this special order is accepted. Should Vortec accept the Medsupplies offer?
Before examining whether the marketing and manufacturing divisions will accept theorder, consider Medsupplies’s offer from the perspective of Vortec’s owners, who are inter-ested in maximizing profits. The decision hinges on the cost to Vortec of selling an addi-tional 2,000 units to Medsupplies. If the cost is more than $4 per unit, Vortec should rejectthe special order.
It is tempting to reject the offer because the $4 price does not cover the average totalcost of $4.47. But will it cost Vortec $4.47 per unit for the 2,000-unit special order? Is$4.47 the cost per unit for each of the next 2,000 units?
To begin the analysis, two simplifying assumptions are made that are relaxed later:
• Vortec has excess capacity to produce the additional 2,000 probes.
• Past historical costs are unbiased estimates of the future cash flows for producing thespecial order.
Based on these assumptions, we can compare the incremental revenue from the addi-tional 2,000 units with its incremental cost:
Incremental revenue (2,000 units � $4.00) $8,000Total cost @ 102,000 units (102,000 � $4.47) $455,940Total cost @ 100,000 units (100,000 � $4.50) 450,000
Incremental cost of 2,000 units 5,940
Incremental profit of 2,000 units $2,060
The estimated incremental cost per unit of the 2,000 units is then
The estimated cost per incremental unit is $2.97. Therefore, $2.97 is the average per-unitcost of the extra 2,000 probes. The $4.47 cost is the average cost of producing 102,000 units,which is more than the $2.97 incremental cost per unit of producing the extra 2,000 probes.
Based on the $2.97 estimated cost, Vortec should take the order. Is this the right deci-sion? Not necessarily. There are some other considerations:
1. Will these 2,000 additional units affect the $5 price of the 100,000 probes? WillVortec’s other customers continue to pay $5 if Medsupplies buys 2,000 units at $4? Whatprevents Medsupplies from reselling the probes to Vortec’s other customers at less than $5per unit but above $4 per unit? Answering these questions requires management to acquireknowledge of the market for the probes.
Change in total cost
Change in volume�
$455,940 � $450,000
2,000� $2.97
16 Chapter 1
zim36725_ch01_001-021.qxd 12/15/09 11:24 AM Page 16

2. What is the alternative use of the excess capacity consumed by the additional 2,000 probes?As plant utilization increases, congestion costs rise, production becomes less efficient, and the costper unit rises. Congestion costs include the wages of the additional production employees and su-pervisors required to move, store, expedite, and rework products as plant volume increases. The$2.97 incremental cost computed from the average cost data on page 16 might not include thehigher congestion costs as capacity is approached. This suggests that the $4.47 average cost esti-mate is wrong. Who provides this cost estimate and how accurate is it? Management must acquireknowledge of how costs behave at a higher volume. If Vortec accepts the Medsupplies offer, willVortec be forced at some later date to forgo using this capacity for a more profitable project?
3. What costs will Vortec incur if the Medsupplies offer is rejected? Will Vortec losethe normal 10,000-unit Medsupplies order? If so, can this order be replaced?
4. Does the Robinson-Patman Act apply? The Robinson-Patman Act is a U.S. federallaw prohibiting charging customers different prices if doing so is injurious to competition.Thus, it may be illegal to sell an additional 2,000 units to Medsupplies at less than $5 perunit. Knowledge of U.S. antitrust laws must be acquired. Moreover, if Vortec sells interna-tionally, it will have to research the antitrust laws of the various jurisdictions that mightreview the Medsupplies transaction.
We have analyzed the question of whether Medsupplies’s 2,000-unit special order max-imizes the owners’ profit. The next question to address is whether the marketing and man-ufacturing divisions will accept Medsupplies’ offer. Recall that marketing is evaluatedbased on total revenues, and manufacturing is evaluated based on average unit costs. There-fore, marketing will want to accept the order as long as Medsupplies does not resell theprobes to other Vortec customers and as long as other Vortec customers do not expect sim-ilar price concessions. Manufacturing will want to accept the order as long as it believes av-erage unit costs will fall. Increasing production lowers average unit costs and makes itappear as though manufacturing has achieved cost reductions.
Suppose that accepting the Medsupplies offer will not adversely affect Vortec’s othersales, but the incremental cost of producing the 2,000 extra probes is really $4.08, not$2.97, because there will be overtime charges and additional factory congestion costs.Under these conditions, both marketing and manufacturing will want to accept the offer.Marketing increases total revenue and thus appears to have improved its performance.Manufacturing still lowers average unit costs from $4.50 to $4.4918 per unit:
However, the shareholders are worse off. Vortec’s cash flows are lower by $160 [or2,000 units � ($4.00 � $4.08)]. The problem is not that the marketing and manufacturingmanagers are “making a mistake.” The problem is that the measures of performance arecreating the wrong incentives. In particular, rewarding marketing for increasing total rev-enues and manufacturing for reducing average unit costs means there is no mechanism toensure that the incremental revenues from the order ($8,000 � $4 � 2,000) are greater thanthe incremental costs ($8,160 � $4.08 � 2,000). Both marketing and manufacturing aredoing what they were told to do (increase revenues and reduce average costs), but the valueof the firm falls because the incentive systems are poorly designed.
Four key points emerge from this example:
1. Beware of average costs. The $4.50 unit cost tells us little about how costs willvary with changes in volume. Just because a cost is stated in dollars per unit doesnot mean that producing one more unit will add that amount of incremental cost.
($4.50 � 100,000) � ($4.08 � 2,000)
102,000� $4.4918
Introduction 17
zim36725_ch01_001-021.qxd 12/15/09 11:24 AM Page 17
2. Use opportunity costs. Opportunity costs measure what the firm forgoes when itchooses a specific action. The notion of opportunity cost is crucial in decisionmaking. The opportunity cost of the Medsupplies order is what Vortec forgoes byaccepting the special order. What is the best alternative use of the plant capacityconsumed by the Medsupplies special order? (More on this in Chapter 2.)
3. Supplement accounting data with other information. The accounting systemcontains important data relevant for estimating the cost of this special order fromMedsupplies. But other knowledge that the accounting system cannot capture mustbe assembled, such as what Medsupplies will do if Vortec rejects its offer. Managersusually augment accounting data with other knowledge such as customer demands,competitors’ plans, future technology, and government regulations.
4. Use accounting numbers as performance measures cautiously. Accountingnumbers such as revenues or average unit manufacturing costs are often used toevaluate managers’ performance. Just because managers are maximizingparticular performance measures tailored for each manager does not necessarilycause firm profits to be maximized.
The Vortec example illustrates the importance of understanding how accounting num-bers are constructed, what they mean, and how they are used in decision making and con-trol. The accounting system is a very important source of information to managers, but it isnot the sole source of all knowledge. Also, in the overly simplified context of the Vortec ex-ample, the problems with the incentive systems and with using unit costs are easy to detect.In a complex company with hundreds or thousands of products, however, such errors arevery difficult to detect. Finally, for the sake of simplicity, the Vortec illustration ignores theuse of the accounting system for external reporting.
G. Outline of the TextInternal accounting systems provide data for both decision making and control. Theorganization of this book follows this dichotomy. The first part of the text (Chapters 2through 5) describes how accounting systems are used in decision making and providingincentives in organizations. These chapters provide the conceptual framework for theremainder of the book. The next set of chapters (Chapters 6 through 8) describes basic top-ics in managerial accounting, budgeting, and cost allocations. Budgets not only are a mech-anism for communicating knowledge within the firm for decision making but also serve asa control device and as a way to partition decision-making responsibility among the man-agers. Likewise, cost allocations serve decision-making and control functions. In analyzingthe role of budgeting and cost allocations, these chapters draw on the first part of the text.
The next section of the text (Chapters 9 through 13) describes the prevalent account-ing system used in firms: absorption costing. Absorption cost systems are built aroundcost allocations. The systems used in manufacturing and service settings generate productcosts built up from direct labor, direct material, and allocated overheads. After first de-scribing these systems, we critically analyze them. A common criticism of absorption costsystems is that they produce inaccurate unit cost information, which can lead to dysfunc-tional decision making. Two alternative accounting systems (variable cost systems andactivity-based cost systems) are compared and evaluated against a traditional absorptioncost system. The next topic describes the use of standard costs as extensions of absorptioncost systems. Standard costs provide benchmarks to calculate accounting variances: thedifference between the actual costs and standard costs. These variances are performancemeasures and thus are part of the firm’s motivation and control system described earlier.
18 Chapter 1
zim36725_ch01_001-021.qxd 12/15/09 11:24 AM Page 18

The last chapter (Chapter 14) expands the integrative approach summarized in sectionE of this chapter. This approach is then used to analyze three modifications of internal costsystems: quality measurement systems, just-in-time production, and balanced scorecards.These recent modifications are evaluated within a broad historical context. Just becausethese systems are new does not suggest they are better. Some have stood the test of time,while others have not.
H. SummaryThis book provides a framework for the analysis, use, and design of internal accounting systems. Itexplains how these systems are used for decision making and motivating people in organizations.Employees care about their self-interest, not the owners’ self-interest. Hence, owners must deviseincentive systems. Accounting numbers are used as measures of managers’ performance and henceare part of the control system used to motivate managers. Most firms use a single internal accountingsystem as the primary data source for external reporting and internal uses. The fact that managers relyheavily on accounting numbers is not fully understood. Applying the economic Darwinism principle,the costs of multiple systems likely outweigh the benefits for most firms. The costs are not only thedirect costs of operating the system but also the indirect costs from dysfunctional decisions resultingfrom faulty information and poor performance evaluation systems. The remainder of this bookaddresses the costs and benefits of internal accounting systems.
ProblemsP 1–1: MBA Students
One MBA student was overheard saying to another, “Accounting is baloney. I worked for a geneticengineering company and we never looked at the accounting numbers and our stock price was alwaysgrowing.”
“I agree,” said the other. “I worked in a rust bucket company that managed everything by thenumbers and we never improved our stock price very much.”
Evaluate these comments.
SOURCE: K Gartrell.
P 1–2: One Cost System Isn’t Enough
Robert S. Kaplan in “One Cost System Isn’t Enough” (Harvard Business Review, January–February1988, pp. 61–66) states,
No single system can adequately answer the demands made by diverse functions of cost systems.While companies can use one method to capture all their detailed transactions data, the processingof this information for diverse purposes and audiences demands separate, customized develop-ment. Companies that try to satisfy all the needs for cost information with a single system have dis-covered they can’t perform important managerial functions adequately. Moreover, systems thatwork well for one company may fail in a different environment. Each company has to design meth-ods that make sense for its particular products and processes.
Of course, an argument for expanding the number of cost systems conflicts with a stronglyingrained financial culture to have only one measurement system for everyone.
Critically evaluate the preceding quote.
P 1–3: U.S. and Japanese Tax Laws
Tax laws in Japan tie taxable income directly to the financial statements’ reported income. That is, tocompute a Japanese firm’s tax liability, multiply the net income as reported to shareholders by the
Introduction 19
zim36725_ch01_001-021.qxd 12/15/09 11:24 AM Page 19
20 Chapter 1
appropriate tax rate to derive the firm’s tax liability. In contrast, U.S. firms typically have more dis-cretion in choosing different accounting procedures for calculating net income for shareholders(financial reporting) and taxes.
What effect would you expect these institutional differences in tax laws between the UnitedStates and Japan to have on internal accounting and reporting?
P 1–4: Managers Need Accounting Information
The opening paragraph of an accounting textbook says, “Managers need accounting information andneed to know how to use it.”10 Critically evaluate this statement.
P 1–5: Using Accounting for Planning
The owner of a small software company felt his accounting system was useless. He stated, “Account-ing systems only generate historical costs. Historical costs are useless in my business because every-thing changes so rapidly.”
Required:
a. Are historical costs useless in rapidly changing environments?
b. Should accounting systems be limited to historical costs?
P 1–6: Goals of a Corporation
A finance professor and a marketing professor were recently comparing notes on their perceptions ofcorporations. The finance professor claimed that the goal of a corporation should be to maximize thevalue to the shareholders. The marketing professor claimed that the goal of a corporation should beto satisfy customers.
What are the similarities and differences in these two goals?
P 1–7: Budgeting
Salespeople at a particular firm forecast what they expect to sell next period. Their supervisors thenreview the forecasts and make revisions. These forecasts are used to set production and purchasingplans. In addition, salespeople receive a fixed bonus of 20 percent of their salary if they exceed theirforecasts.
Discuss the incentives of the salespeople to forecast next-period sales accurately. Discuss thetrade-off between using the budget for decision making versus using it as a control device.
P 1-8: Golf Specialties
Golf Specialties (GS), a Belgian company, manufactures a variety of golf paraphernalia, such as headcovers for woods, embroidered golf towels, and umbrellas. GS sells all its products exclusively inEurope through independent distributors. Given the popularity of Tiger Woods, one of GS’s morepopular items is a head cover in the shape of a tiger.
GS is currently making 500 tiger head covers a week at a per unit cost of 3.50 euros, which in-cludes both variable costs and allocated fixed costs. GS sells the tiger head covers to distributors for4.25 euros. A distributor in Japan, Kojo Imports, wants to purchase 100 tiger head covers per weekfrom GS and sell them in Japan. Kojo offers to pay GS 2 euros per head cover. GS has enoughcapacity to produce the additional 100 tiger head covers and estimates that if it accepts Kojo’s offer,the per unit cost of all 600 tiger head covers will be 3.10 euros. Assume the cost data provided(3.50 euros and 3.10 euros) are accurate estimates of GS’s costs of producing the tiger head covers.Further assume that GS’s variable cost per head cover does not vary with the number of head coversmanufactured.
10 D Hansen and M Mowen, Management Accounting, 3rd ed. (Cincinnati: South-Western Publishing Co.,1994), p. 3.
zim36725_ch01_001-021.qxd 12/15/09 11:24 AM Page 20

Introduction 21
Required:
a. To maximize firm value, should GS accept Kojo’s offer? Explain why or why not.
b. Given the data in the problem, what is GS’s weekly fixed cost of producing the tiger headcovers?
c. Besides the data provided above, what other factors should GS consider before making adecision to accept Kojo’s offer?
P 1–9: Parkview Hospital
Parkview Hospital, a regional hospital, serves a population of 400,000 people. The next closesthospital is 50 miles away. Parkview’s accounting system is adequate for patient billing. The systemreports revenues generated per department but does not break down revenues by unit within depart-ments. For example, Parkview knows patient revenue for the entire psychiatric department butdoes not know revenues in the child and adolescent unit, the chemical dependence unit, or theneuropsychiatric unit.
Parkview receives its revenues from three principal sources: the federal government (Medicare),the state government (Medicaid), and private insurance companies (Blue Cross Blue Shield). Untilrecently, the private insurance companies continued to pay Parkview’s increasing costs and passedthese on to the firms through higher premiums for their employees’ health insurance.
Last year Trans Insurance (TI) entered the market and began offering lower-cost health insuranceto local firms. TI cut benefits offered and told Parkview that it would pay only a fixed dollar amountper patient. A typical firm could cut its health insurance premium 20 percent by switching to TI. TIwas successful at taking 45 percent of the Blue Cross–Blue Shield customers. These firms faced stiffcompetition and sought to cut their health care costs.
Parkview management estimated that its revenues would fall 6 percent, or $3.2 million, nextyear because of TI’s lower reimbursements. Struggling with how to cope with lower revenues,Parkview began the complex process of deciding what programs to cut, how to shift the delivery ofservices from inpatient to outpatient clinics, and what programs to open to offset the revenue loss (forexample, open an outpatient depression clinic). Management can forecast some of the costs of theproposed changes, but many of its costs and revenues (such as the cost of the admissions office) havenever been tracked to the individual clinical unit.
Required:
a. Was Parkview’s accounting system adequate 10 years ago?
b. Is Parkview’s accounting system adequate today?
c. What changes should Parkview make in its accounting system?
P 1–10: Montana Pen Company
Montana Pen Company manufactures a full line of premium writing instruments. It has 12 differentstyles and within each style, it offers ball point pens, fountain pens, mechanical pencils, and a rollerball pen. Most models also come in three finishes—gold, silver, and black matte. Montana Pen’sBangkok, Thailand, plant manufactures four of the styles. The plant is currently producing the goldclip for the top of one of its pen styles, no. 872. Current production is 1,200 gold no. 872 pens eachmonth at an average cost of 185 baht per gold clip. (One U.S. dollar currently buys 35 baht.) A Chi-nese manufacturer has offered to produce the same gold clip for 136 baht. This manufacturer will sellMontana Pen 400 clips per month. If it accepts the Chinese offer and cuts the production of the clipsfrom 1,200 to 800, Montana Pen estimates that the cost of each clip it continues to produce will risefrom 185 baht to 212.5 baht per gold clip.
Required:
a. Should Montana Pen outsource 400 gold clips for pen style no. 872 to the Chinese firm?Provide a written justification of your answer.
b. Given your answer in part (a), what additional information would you seek before decidingto outsource 400 gold clips per month to the Chinese firm?
zim36725_ch01_001-021.qxd 12/15/09 11:24 AM Page 21

22
Chapter Two
The Nature of Costs
Chapter Outline
A. Opportunity Costs
1. Characteristics of Opportunity Costs
2. Examples of Decisions Based on OpportunityCosts
B. Cost Variation
1. Fixed, Marginal, and Average Costs
2. Linear Approximations
3. Other Cost Behavior Patterns
4. Activity Measures
C. Cost–Volume–Profit Analysis
1. Copier Example
2. Calculating Break-Even and Target Profits
3. Limitations of Cost–Volume–Profit Analysis
4. Multiple Products
5. Operating Leverage
D. Opportunity Costs versus Accounting Costs
1. Period versus Product Costs
2. Direct Costs, Overhead Costs, and Opportunity Costs
E. Cost Estimation
1. Account Classification
2. Motion and Time Studies
F. Summary
Appendix: Costs and the Pricing Decision
zim36725_ch02_022-088.qxd 12/16/09 8:33 AM Page 22

The Nature of Costs 23
As described in Chapter 1, accounting systems measure costs that managers use forexternal reports, decision making, and controlling the behavior of people in the organiza-tion. Understanding how accounting systems calculate costs requires a thorough under-standing of what cost means. Unfortunately, that simple term has multiple meanings.Saying a product costs $3.12 does not reveal what the $3.12 measures. Additional explana-tion is often needed to clarify the assumptions that underlie the calculation of cost. A largevocabulary has arisen to communicate more clearly which cost meaning is being conveyed.Some examples include average cost, common cost, full cost, historical cost, joint cost,marginal cost, period cost, product cost, standard cost, fixed cost, opportunity cost, sunkcost, and variable cost, just to name a few.
We begin this chapter with the concept of opportunity cost, a powerful tool for under-standing the myriad cost terms and for structuring managerial decisions. In addition,opportunity cost provides a benchmark against which accounting-based cost numbers canbe compared and evaluated. Section B discusses how opportunity costs vary with changesin output. Section C extends this discussion to cost–volume–profit analysis. Section Dcompares and contrasts opportunity costs and accounting costs (which are very different).Section E describes some common methods for cost estimation.
A. Opportunity CostsWhen you make a decision, you incur a cost. Nobel Prize–winning economist RonaldCoase noted, “The cost of doing anything consists of the receipts that could havebeen obtained if that particular decision had not been taken.”1 This notion is calledopportunity cost—the benefit forgone as a result of choosing one course of actionrather than another. Cost is a sacrifice of resources. Using a resource for one purposeprevents its use elsewhere. The return forgone from its use elsewhere is the opportunitycost of its current use. The opportunity cost of a particular decision depends on the otheralternatives available.
The alternative actions comprise the opportunity set. Before making a decision andcalculating opportunity cost, the opportunity set itself must be enumerated. Thus, it isimportant to remember that opportunity costs can be determined only within the context ofa specific decision and only after specifying all the alternative actions. For example, theopportunity set for this Friday night includes the movies, a concert, staying home andstudying, staying home and watching television, inviting friends over, and so forth.
The opportunity cost concept focuses managers’ attention on the available alterna-tive courses of action. Suppose you are considering three job offers. Job A pays a salaryof $100,000, job B pays $102,000, and job C pays $106,000. In addition, you value eachjob differently in terms of career potential, developing your human capital, and the typeof work. Suppose you value these nonpecuniary aspects of the three jobs at $8,000 forA, $5,000 for B, and only $500 for C. The following table summarizes the total valueof each job offer. You decide to take job A because it has the highest total pecuniaryand nonpecuniary compensation. The opportunity cost of job A is $107,000(or $102,000 � $5,000), representing the amount forgone by not accepting job B, thenext best alternative.
1 R Coase, “Business Organization and the Accountant,” originally published in Accountant, 1938. Reprintedin L.S.E. Essays in Cost, ed. J Buchanan and G Thirlby (New York University Press, 1981), p. 108.
zim36725_ch02_022-088.qxd 12/15/09 11:38 AM Page 23

The decision to continue to search for more job offers has an opportunity cost of$108,000 if job offer A expires. If you declined job offer L last week, which had a totalvalue of $109,000, this job offer is no longer in the opportunity set and hence is not anopportunity cost of accepting job A now. Besides jobs A, B, and C, you learn there is a 0.9probability of receiving job offer D, which has a total value of $110,000. If you wait for jobD and you do not get it, you will be forced to work in a job valued at $48,000. Job D has anexpected total value of $103,800 (or $110,000 � 0.9 � $48,000 � 0.1). Since job D’sopportunity cost of $108,000 (the next best alternative forgone) exceeds its expected value($103,800), you should reject waiting for job offer D.
Opportunity costs are not necessarily the same as payments. The opportunity cost of takingjob A included the forgone salary of $102,000 plus the $5,000 of intangibles from job B.The opportunity cost of going to a movie involves both the cash outlay for the ticket andpopcorn, and also forgoing spending your time studying or attending a concert. Remember,the opportunity cost of obtaining some good or service is what must be surrendered or for-gone in order to get it. By taking job A, you forgo job B at $107,000.
Opportunity costs are forward looking. They are the estimated forgone benefits fromactions that could, but will not, be undertaken. In contrast, accounting is based on histori-cal costs in general. Historical costs are the resources expended for actions actually under-taken. Opportunity cost is based on anticipations; it is necessarily a forward-lookingconcept. Job offers B, C, and D are part of the opportunity set when you consider job A, butjob offer L, which expired, is no longer part of the opportunity set. Your refusal of job L lastweek is not an opportunity cost of accepting job A now.
Opportunity costs differ from (accounting) expenses. Opportunity cost is the sacrificeof the best alternative for a given action. An (accounting) expense is a cost incurred to gen-erate a revenue. For example, consider an auto dealer who sells a used car for $7,500. Sup-pose the dealer paid $6,500 for the car and the best alternative use of cars like this one is tosell them at auction for $7,200. The car’s opportunity cost in the decision to keep it for re-sale is $7,200, but in matching expenses to revenues, the accounting expense is $6,500. Fi-nancial accounting is concerned with matching expenses to revenues. In decision making,the concern is with estimating the opportunity cost of a proposed decision. We return to thedifference between opportunity and accounting costs in section D.
Several examples illustrate opportunity costs. The first four examples pertain to rawmaterials and inventories.
Opportunity cost of materials (no other uses)What is the opportunity cost of materials for a special order if the materials have no otheruse and a firm has these materials in stock? The firm paid $16,000 for the materials andanticipates no other orders in which it can use these materials. The opportunity cost of thesematerials is whatever scrap value they may have. If the materials have no alternative use and
2. Examples ofDecisions Basedon OpportunityCosts2
1. Characteristicsof OpportunityCosts
24 Chapter 2
2Some of the examples presented here are drawn from Coase (1938), pp. 109–22.
Job Offer Salary $ Equivalent of Intangibles Total Value
A $100,000 $8,000 $108,000B 102,000 5,000 107,000C 106,000 500 106,500
zim36725_ch02_022-088.qxd 12/15/09 11:38 AM Page 24

The Nature of Costs 25
they have no storage or disposal cost, their opportunity cost is zero. In fact, the opportunitycost is negative if the firm incurs costs for storing the product and if disposal is costly.
Opportunity cost of materials (other uses)The opportunity cost of materials not yet purchased for a job is the estimated cash outflownecessary to secure their delivery. If the materials are already in stock, their opportunitycost is their highest-valued use elsewhere. If the materials will be used in another order,using them now requires us to replace them in the future. Hence, the opportunity cost isthe cost of replacement.
Interest on inventory as an opportunity costAn automobile manufacturer plans to introduce a new car model. Included in the opportu-nity cost of the new model are the payments for materials, labor, capital, promotion, and ad-ministration. Opportunity cost also contains the interest forgone on the additional inventoryof cars and parts the firm carries as part of the normal operations of manufacturing andselling cars. If the average inventory of materials, work in process, and finished cars is$125 million and the market rate of interest for this type of investment is 10 percent, thenthe opportunity cost of interest on this investment is $12.5 million per year.
The next raw material example introduces the concept of sunk costs, expenditures thathave already been made and are irrelevant for evaluating future alternatives.
Sunk costs and opportunity costsA firm paid $15,000 for a coil of stainless steel used in a special order. Twenty percent (or$3,000 of the original cost) of the coil remains. The remaining steel in the coil has no al-ternative use; a scrap steel dealer is willing to haul it away at no charge. The remaining$3,000 of the original cost is a sunk cost. Sunk costs are expenditures incurred in the pastthat cannot be recovered. The $3,000 is sunk because it has already been incurred and is notrecoverable. Because it cannot be recovered, the $3,000 should not influence any decision.In this case, the remaining steel coil has a zero opportunity cost. Sunk costs are irrelevantfor future uses of this stainless steel. Suppose the scrap dealer is willing to pay $500 for theremaining coil. Using the remainder in another job now has an opportunity cost of $500.
Remember that sunk costs are irrelevant for decision making unless you are the onewho sunk them. However, sunk costs are not irrelevant as a control device. Holding man-agers responsible for past actions causes them to take more care in future decisions. Sup-pose $4 million was spent on new software that doesn’t work and the firm buys acommercial package to replace it. The manager responsible for the failed software devel-opment will be held accountable for the failure and will have incentives to consume morefirm resources trying to either fix it or cover up its failure before this knowledge becomeswidely known.
The next example applies the opportunity cost concept to evaluating alternativesregarding labor.
Opportunity cost of laborSuppose a firm’s work force cannot be changed because of existing labor agreements. Em-ployees are guaranteed 40 hours of pay per week. For the next three weeks only 35 hours ofwork per week per employee exists. What is the cost of taking a special order that will addfive hours of work per employee? One is tempted to cost the five hours of labor in the spe-cial order at zero because these employees must be paid anyway. But the question remains,what will these employees do with the five hours if this special order is rejected? If theywould do preventive maintenance on the machines or do general maintenance or improvetheir skills through training, then the opportunity cost of the labor for the special order isnot zero but the value of the best forgone alternative use of the employees’ time.
zim36725_ch02_022-088.qxd 12/15/09 11:38 AM Page 25

26 Chapter 2
Public accounting firms confront this issue. The summer months tend to be low-demand periods relative to year-end. How the firm prices summer (off-peak) auditsdepends in part on the perceived opportunity cost of the staff’s time.
If a firm owns long-lived assets such as buildings and equipment, understanding theiropportunity costs involves alternative uses of these assets. The next three examples describethe opportunity costs of capital assets.
Asset depreciation as an opportunity costUsing assets can affect their value. Suppose a delivery van used four days a week can besold next year for $34,000. If additional business is taken and the delivery van is used sixdays a week, its market value next year will be $28,000. Depreciation due to use for theadditional business is $6,000 ($34,000 � $28,000). Additional labor for the driver’s time,maintenance, gasoline, and oil are required.
The opportunity cost of using an asset is the decline in its value. Accounting depreciation(such as straight-line depreciation) is based on historical costs. Accounting depreciationdoes not necessarily reflect the opportunity cost of the van (its decline in value from use).However, accounting depreciation can be a reasonably accurate approximation of the de-cline in the market value of the asset. In any given year, accounting depreciation may notexactly capture the decline in the asset’s market value. However, over the asset’s economiclife, accumulated accounting depreciation equals the decline in value. Holding managers
ManagerialApplication:The Costs ofthe Sarbanes-Oxley Act
Following the accounting scandal at Enron and the demise of Arthur Andersen, the U.S. gov-ernment enacted the Sarbanes-Oxley Act of 2002, the “Public Company Accounting Reformand Investor Protection Act.” This law has many provisions, including the stipulations thatindependent auditors may not provide nonaudit services to their clients and that publiccompanies and their auditors must report annually that management has “an adequate inter-nal control structure and procedures for financial reporting.” This last provision, known assection 404 of the act, is causing the greatest concern among publicly traded companies.
In a survey of U.S. firms, CFO magazine reports that 48 percent of companies willspend at least $500,000 complying with Sarbanes-Oxley, with 52 percent reporting thattheir compliance has yielded no benefits for their company. Digene Corp., a biotechfirm, has seen its audit bill jump 72 percent.
Sarbanes-Oxley, by increasing both the duties and the liability of the officers anddirectors of public companies, has caused directors’ fees and the insurance premiumsof directors and officers to increase. Board-related costs, including director compensa-tion and insurance, increased 50 percent.
In addition to the direct costs of complying with Sarbanes-Oxley, the act is impos-ing significant opportunity costs on companies. The CFO of the $5 billion ConstellationEnergy Group believes that the law makes the “fear of personal liability so great thatmanagers are afraid to take risks on innovation.” Some 33 percent of the CFO-surveyedcompanies have delayed or canceled projects so they can comply with the law. Financialexecutives have less time to make strategic decisions as compliance efforts absorb 10 percent of a CFO’s time in 40 percent of the companies. More small, publicly tradedcompanies are going private because the cost of remaining public has increased. This de-prives these companies of the benefits of being public, such as access to public equitymarkets and liquidity for equity investments.
But not everyone has been harmed by Sarbanes-Oxley. The law has been a windfallfor auditors, lawyers, and software firms.
SOURCE: A Nyberg, “Sticker Shock: The True Costs of Sarbanes-Oxley Compliance,” CFO, September 2003, pp. 51–62.
zim36725_ch02_022-088.qxd 12/15/09 11:38 AM Page 26

The Nature of Costs 27
responsible for accounting depreciation commits them to recovering the historical cost ofthe asset in either additional revenues or cost savings.
Interest on an asset as an opportunity costIf the asset can be sold, then interest should be included as an opportunity cost. If the assethas no resale value, then obviously no interest is forgone. For example, a local area networkand computers are purchased for $100,000. The interest rate is 8 percent. Should interest on the capital tied up in the hardware ($8,000) be included as a cost in the decision to con-tinue to use the system? If the equipment has no market value, then interest is not a costbecause the firm is not forgoing selling the hardware and earning interest on the proceeds.If the system can be sold, then the forgone interest on the proceeds is a cost. Chapter 3 presentsan expanded discussion of the opportunity cost of a capital investment.
Opportunity cost of excess capacitySuppose a plant operates at 75 percent capacity. Is the firm forgoing profits on the 25 per-cent of idle capacity? It is usually optimal to have some “excess” capacity in order to ab-sorb random shocks to normal production, such as machine breakdowns and demandfluctuations, which increase production time and costs. When plants are built, rarely arethey expected to run at 100 percent capacity. As plant utilization increases, per-unit costsincrease as congestion rises. The opportunity cost of increasing the plant’s expectedutilization, say from 75 percent to 85 percent of capacity, is the higher production costimposed on the existing units that currently utilize 75 percent of the capacity.
Consider this illustration. The following table lists the output of a plant in units of pro-duction and the average cost per unit. Average costs rise as volume increases because con-gestion increases. This causes more machine breakdowns, and indirect labor (expediters,material handlers, production schedulers) must be hired to manage the increased conges-tion. The plant is currently operating at 75 percent capacity (150 units) and incurring aver-age costs of $6.04 per unit.
Units Capacity Average Cost
130 65% $6.00140 70 6.02150 75 6.04160 80 6.06170 85 6.08180 90 6.11190 95 6.15200 100 6.20
Suppose production increases from 150 units (75 percent capacity) to 170 units (85 percentcapacity). Increasing production by an extra 20 units causes the average cost of the baseproduction of 150 units to rise from $6.04 to $6.08, or 4¢ per unit. The opportunity cost ofproducing 20 more units is not the average cost of $6.08 but the incremental cost of the last20 units, $6.38 (or [(170 � $6.08) � (150 � $6.04)] � 20 units). Another way of computingthe opportunity cost of the last 20 units is
$6.38 � $6.08 � (4¢ � 150) � 20
Or the opportunity cost of producing 20 more units is composed of their averagecost ($6.08) plus the cost increase that each of the 20 units imposes on the first 150 units[(4¢ � 150) � 20].
The final example describes evaluating the opportunity costs of introducing new products.
zim36725_ch02_022-088.qxd 12/15/09 11:38 AM Page 27

28 Chapter 2
Opportunity cost of product line cannibalizationA company that produces personal computers (PCs) has 60 percent of a particular marketniche. The company plans to introduce a new, high-end, faster computer with additionalfeatures. The major competition for the new PC is the firm’s current high-end machine. Inthe first year, management projects sales of the new model to be 20,000 units. Sales of theexisting machines are expected to fall by 7,000 units. Thus, the new PC “cannibalizes” theold PC’s sales by 7,000 units. Are the forgone profits from the 7,000 units that could havebeen sold an opportunity cost of introducing the new computer? It depends on the oppor-tunity set. If management expects competitors to introduce a machine that competes withthe 7,000 units, meaning that the company is likely to have lost those units anyway, then theprofits forgone on the 7,000 units are not an opportunity cost of introducing the newmachine.
ConceptQuestions
Q2–1 Define opportunity cost.
Q2–2 What are some characteristics of opportunity costs?
Q2–3 A firm paid $8,325 last year for some raw material it planned touse in production. When is the $8,325 a good estimate of theopportunity cost of the material?
Q2–4 Define sunk cost and give an example.
Q2–5 What are avoidable and unavoidable costs? How are they relatedto opportunity costs?
B. Cost VariationManagers commonly decide how many units to produce or how much service to provideduring a certain time period. Dell Computer must decide how many computers of a partic-ular model to manufacture next quarter. United Airlines must decide whether to fly a 90-passenger jet or a 130-passenger jet between Denver and Palm Springs next month.Making these decisions requires an understanding of how costs change with volume—thetopic of this section.
Cost behavior is defined relative to some activity, such as the number of units produced,hours worked, pounds of ore mined, miles driven, or meals served. Usually, units producedis the measure of activity. For example, consider Figure 2–1, which illustrates the generalrelation between cost and units produced. Two important points emerge from Figure 2–1.First, even with no units produced, the firm still must incur some costs. The costs incurredwhen there is no production are called fixed costs. If the plant is idle, some costs such asproperty taxes, insurance, plant management, security, and so on must be incurred to pro-vide production capacity. For example, Intel acquires land and builds a plant to manufac-ture a specific quantity of computer chips. It pays annual property taxes of $1.75 millionon this land. The $1.75 million expenditure on property taxes is part of the cost Intel paysto have this manufacturing capacity at this plant.
Second, in general the cost curve is not a straight line as output expands, but rather iscurvilinear. The particular shape of the curve arises because marginal cost varies with the levelof production. Marginal cost is the cost of producing one more unit. In Figure 2–1, marginalcost is the slope of a line drawn tangent to the total cost curve. For the first few units, such asto the left of output level X, the slope of the tangent is quite steep. The marginal cost for the
1. Fixed,Marginal, andAverage Costs
zim36725_ch02_022-088.qxd 12/15/09 11:38 AM Page 28

The Nature of Costs 29
first few units is high because employees must be hired, suppliers must be found, and market-ing channels must be opened. Therefore, the cost of starting operations and producing the firstfew units may be extremely high. Expanding output beyond the first few units allows the or-ganization to achieve smooth, efficient production techniques. At normal production rates, themarginal cost of making additional units is relatively low. At high levels of output (output levelY ), additional costs are incurred because of constraints on the use of space, machines, and em-ployees. Machines are more likely to fail when operating at or near capacity. Labor costsincrease because employees are paid for overtime. Therefore, the marginal cost of makingadditional units when operating near capacity is higher than under normal operations.
By definition a fixed cost is not an opportunity cost of the decision to change thelevel of output. The decision to expand output usually does not affect property insurancepremiums. Therefore, property insurance is a fixed cost with respect to volume and is nota cost when deciding to increase output. However, lower property insurance premiumsare an important benefit when deciding to install smoke detectors. And an insurance pre-mium is a cost of building and operating the plant.
The fact that a cost is fixed with respect to volume changes, however, does not meanthat it cannot be managed or reduced. A firm can reduce insurance premiums by increasingdeductibles or by lowering the risks being insured (installing fire alarms and sprinklersystems). Many fixed costs can be altered in the long run, in the sense that a particular plantcan be closed. If a cost is fixed, this does not mean it is a constant and known with certainty.Fixed costs vary over time due to changes in prices. But fixed costs do not vary withchanges in the number of units produced.
Another important cost term is average cost. Average cost per unit is calculated by di-viding total cost by the number of units produced. Average cost is the slope of the line drawnfrom the origin to the total cost curve and is depicted in Figure 2–2 as the slope of the linefrom point O through point C.3 The average cost at output level Z represents the cost per unitof producing Z units. For the pattern of costs in Figure 2–2, the average cost per unit is veryhigh at low levels of output but declines as output increases. The average cost per unit only in-creases as output nears capacity. Notice that at Z units of production, the average cost is largerthan the marginal cost. (The slope of OC is steeper than the slope of the tangent at point C.)
FIGURE 2–1
Nonlinear cost curve
X Y
A
B
Totalcost
Fixedcost
Units produced
Cost
3Recall that the slope of a line is the ratio of the change in its vertical distance divided by the change in itshorizontal distance. In Figure 2–2, the slope of the line OC is the distance CZ divided by the distance OZ.CZ � OZ is the total cost of producing Z units divided by Z units, which is the average cost of producing Z units.
zim36725_ch02_022-088.qxd 12/15/09 11:38 AM Page 29

30 Chapter 2
ManagerialApplication:Metro-Goldwyn-Mayer Inc.
MGM produces and distributes entertainment products worldwide, including motionpictures, television programming, home video, interactive media, and music. The com-pany owns the largest modern film library in the world, consisting of approximately4,000 titles. MGM significantly improved its operating performance after a carefulanalysis of the fixed and variable costs of distributing movies to local cinemas. Thisanalysis led MGM to convert a large fixed cost into a variable cost. It reduced headcount 10 percent and stopped distributing independent films through United Interna-tional Pictures. It now distributes these films itself.
SOURCE: L Calabro, “Everything in Moderation,” CFO, February 2004, pp. 59–65.
O Z
C
Totalcost
Fixedcost
Units produced
Cost
Marginal cost at Z is the slope of the line tangent at C
Average cost at Z is slope of the line from O to C
FIGURE 2–2
Average andmarginal cost
Exercise 2–1:
Suppose that a plant making steam boilers has the following costs per month:
Number of Boilers Total Cost
1 $ 50,0002 98,0003 144,0004 184,0005 225,0006 270,0007 315,0008 368,0009 423,000
10 480,000
continued
zim36725_ch02_022-088.qxd 12/15/09 11:38 AM Page 30

The Nature of Costs 31
Required:
a. What are the marginal and average costs for each level of output?
b. The plant is currently making and selling eight boilers per month. The company can
sell another steam boiler for $53,000. Should the company accept the offer?
Solution:
a. Number of Boilers Total Cost Marginal Cost Average Cost
1 $ 50,000 $50,000 $50,0002 98,000 48,000 49,0003 144,000 46,000 48,0004 184,000 40,000 46,0005 225,000 41,000 45,0006 270,000 45,000 45,0007 315,000 45,000 45,0008 368,000 53,000 46,0009 423,000 55,000 47,000
10 480,000 57,000 48,000
b. The company should reject the offer because the marginal cost of making the next
boiler is $55,000, whereas the price is only $53,000. The average cost of $47,000
should not be used in this decision.
The cost of changing production levels is not always easy to estimate. Estimating the totalcost curve in Figure 2–1 requires knowledge of both fixed cost and how consumption of fa-cilities, labor, and materials varies as the rate of production increases. Such estimates aredifficult to obtain, so managers often use approximations of these costs. One such approx-imation assumes the curve is linear instead of curvilinear.
An approximation of total cost in Figure 2–1 using a linear cost curve is provided inFigure 2–3. In this figure, estimating total cost requires an estimate of the y-axis interceptand the slope of the straight line. The intercept, FC, approximates the fixed costs. Theslope of the line is the variable cost per unit. Variable costs are the additional costs in-curred when output is expanded. When Honda expands the production of minivans at aparticular plant from 200 to 250 vans per day, it must buy more parts, hire more employ-ees, use more power, and so forth. All costs that increase when more vans are produced arevariable costs.4
In Figure 2–3, the straight line is the sum of the fixed and variable cost approximationsof total cost. The line is closest to the total cost in the range of normal operations. Thisrange between output levels X and Y is called the relevant range. The relevant rangeencompasses the rates of output for which the sum of fixed and variable costs closely
2. LinearApproximations
4While most managers understand intuitively the difference between fixed and variable costs, not everyonedoes. When asked the difference between a fixed cost and a variable cost, one employee replied, “A fixed cost?If it’s broke, I fix it and it costs me.” See R Suskind, “Guys Holding Axes and Chainsaws Get to Use Any NameThey Like,” The Wall Street Journal, February 26, 1992, p. B–1.
zim36725_ch02_022-088.qxd 12/15/09 11:38 AM Page 31

approximates total cost. Because the slopes of the total cost curve and the fixed and vari-able cost curve are about the same, the variable cost is a close approximation of the mar-ginal cost. In the relevant range, variable cost can be used to estimate the cost of makingadditional units of output.
Notice that variable cost per unit approximates marginal cost per unit. The slope of thevariable cost line is constant as the activity measure increases. Variable cost per unit isusually assumed to be constant. Later chapters relax this assumption. The terms marginalcost and variable cost are often used interchangeably, but the two are not necessarily thesame. Marginal cost refers to the cost of the last unit produced and in most cases varies asvolume changes. In some situations, marginal cost per unit does not vary with volume.Then marginal cost (per unit) and variable cost per unit are equal.
The straight-line approximation of total cost can be represented by the followingequations:
Total cost � Fixed cost � Variable costTotal cost � Fixed cost � (Variable cost per unit)(Units produced)
TC � FC � VC � Q
where TC represents total cost, FC represents fixed cost, VC is variable cost per unit, andQ is the number of units. For example, suppose the fixed cost is $100,000 per month, thevariable cost per unit is $3, and 15,000 units are to be manufactured. Total cost is calcu-lated to be $145,000 (or $100,000 � $3 � 15,000 units). The total cost of $145,000 is anestimate of the cost of manufacturing 15,000 units.
Some costs vary with output (variable costs) and others do not (fixed costs). Between thesetwo extreme cases are step costs and mixed (semivariable) costs. Each of these is describedin turn and illustrated in Figure 2–4.
Step costsOne type of cost behavior involves step costs, expenditures fixed over a range of outputlevels (line I in Figure 2–4). For example, each supervisor can monitor a fixed numberof employees. As output expands and the number of supervisors increases with the num-ber of employees, the resulting increases in supervisory personnel expenditures are a
3. Other CostBehavior Patterns
32 Chapter 2
Y
A
Totalcost
Fixedcost,
FC
Units produced
Costs
B
Total variablecost at Y
Fixed cost
X Relevant range
FIGURE 2–3
Linear approximationof total cost
zim36725_ch02_022-088.qxd 12/15/09 11:38 AM Page 32
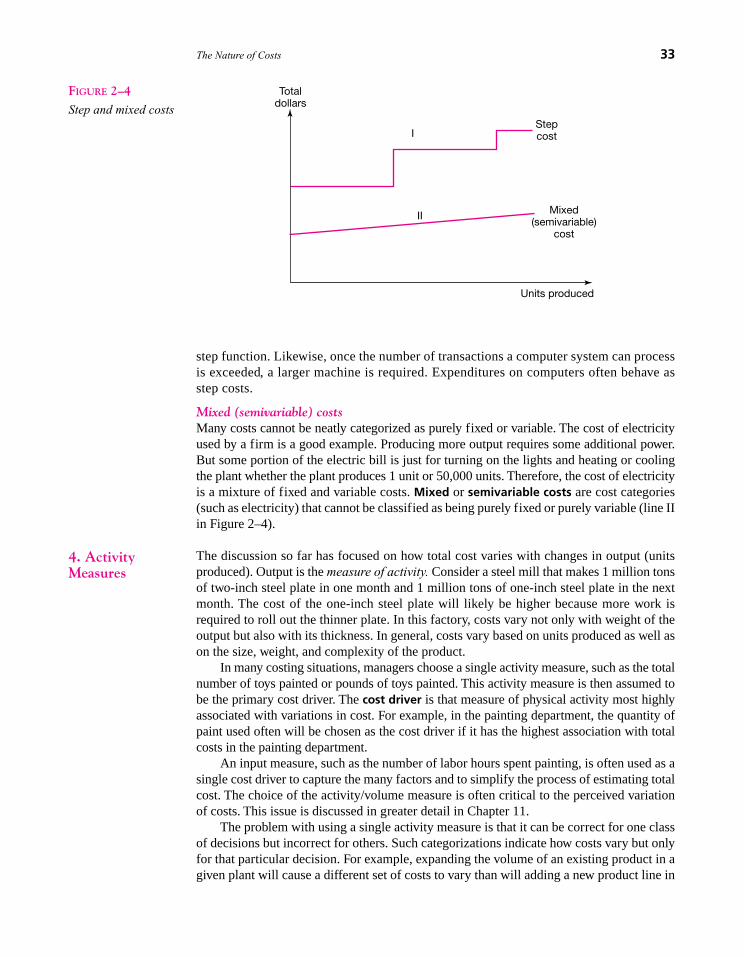
The Nature of Costs 33
step function. Likewise, once the number of transactions a computer system can processis exceeded, a larger machine is required. Expenditures on computers often behave asstep costs.
Mixed (semivariable) costsMany costs cannot be neatly categorized as purely fixed or variable. The cost of electricityused by a firm is a good example. Producing more output requires some additional power.But some portion of the electric bill is just for turning on the lights and heating or coolingthe plant whether the plant produces 1 unit or 50,000 units. Therefore, the cost of electricityis a mixture of fixed and variable costs. Mixed or semivariable costs are cost categories(such as electricity) that cannot be classified as being purely fixed or purely variable (line IIin Figure 2–4).
The discussion so far has focused on how total cost varies with changes in output (unitsproduced). Output is the measure of activity. Consider a steel mill that makes 1 million tonsof two-inch steel plate in one month and 1 million tons of one-inch steel plate in the nextmonth. The cost of the one-inch steel plate will likely be higher because more work isrequired to roll out the thinner plate. In this factory, costs vary not only with weight of theoutput but also with its thickness. In general, costs vary based on units produced as well ason the size, weight, and complexity of the product.
In many costing situations, managers choose a single activity measure, such as the totalnumber of toys painted or pounds of toys painted. This activity measure is then assumed tobe the primary cost driver. The cost driver is that measure of physical activity most highlyassociated with variations in cost. For example, in the painting department, the quantity ofpaint used often will be chosen as the cost driver if it has the highest association with totalcosts in the painting department.
An input measure, such as the number of labor hours spent painting, is often used as asingle cost driver to capture the many factors and to simplify the process of estimating totalcost. The choice of the activity/volume measure is often critical to the perceived variationof costs. This issue is discussed in greater detail in Chapter 11.
The problem with using a single activity measure is that it can be correct for one classof decisions but incorrect for others. Such categorizations indicate how costs vary but onlyfor that particular decision. For example, expanding the volume of an existing product in agiven plant will cause a different set of costs to vary than will adding a new product line in
4. ActivityMeasures
II
Units produced
Totaldollars
IStepcost
Mixed(semivariable)
cost
FIGURE 2–4
Step and mixed costs
zim36725_ch02_022-088.qxd 12/15/09 11:38 AM Page 33

the same plant or expanding the volume of a given product by building a new plant. Con-sider an automobile assembly line producing a single car model. Adding 125 cars per dayof a second car model costs more than increasing production of the existing model by 125cars. More labor is required to schedule, order parts, and store them for two differentmodels than if just one model is produced. Thus, the variable costs of 125 cars depend onwhether the additional cars are for an existing model or a new model.
Some costs are fixed with respect to some decisions but not others. Consider machinesetups. Before a computer-controlled milling machine can begin milling parts, a technicianmust set up the machine by loading the proper computer program, loading the correct toolsinto the machine, adjusting the settings, making a few parts, and checking their tolerances.Once set up, the machine can produce a large number of parts without another machinesetup. The cost of the setup is the cost of the technician’s time, the material used to checkthe machine, and the forgone profits of not using the machine while it is being set up. Thissetup cost is independent of the number of units produced and thus is a fixed cost. How-ever, if the machine produces 1,000 parts per batch, expanding volume from 1,000 parts to2,000 parts doubles the number of setups and doubles the setup costs. On the other hand, ifthe plant increases volume to 2,000 parts by doubling batch size, setup costs remain fixed.Therefore, classifying setup costs as being either fixed or variable can be right for some de-cisions and wrong for others, depending on whether batch sizes change. If some decisionscause batch sizes to change and others do not, then any classification of setup costs as fixedor variable will be wrong for some decisions.
34 Chapter 2
C. Cost–Volume–Profit AnalysisOnce costs are classified into fixed/variable categories, managers can performcost–volume–profit analysis. The following example illustrates the essential features of thisanalysis. Suppose Xerox Corp. has a walk-up copy division that places coin-operated colorphotocopying machines in public areas such as libraries, bookshops, and supermarkets.Customers pay 25¢ per copy and the store providing the space receives 5¢ per copy. Xeroxprovides the machine, paper, toner, and service. Machines are serviced every 20,000 copiesat an average cost of $200 per service call. Paper and toner cost 4¢ per copy. Xerox’s walk-up copy division is charged $150 per month per machine placed (the opportunity cost of themachine). The variable costs per copy are
Paper and toner $0.04Store owner 0.05Service ($200 � 20,000) 0.01
Variable costs $0.10
The contribution margin is the difference between the price and the variable costper copy. The contribution margin is the net receipts per copy that are contributed toward
1. CopierExample
ConceptQuestions
Q2–6 Define mixed cost and give an example.
Q2–7 Define step cost and give an example.
Q2–8 Define fixed cost.
Q2–9 Define variable cost. Is it the same as marginal cost? Explain.
zim36725_ch02_022-088.qxd 12/15/09 11:38 AM Page 34

The Nature of Costs 35
Exercise 2–2:
Total cost in the painting department of a toy factory varies not only with the number of toys
painted but also with the sizes of the toys, the types of surfaces painted, the kinds of paint
applied, and so on.
Paint costs $15 per gallon. To set up the painting machines to paint a part costs $500,
which includes cleaning out the old color. Using the paint machine for one hour costs $70,
which also includes the labor to operate it.
A particular part with 4,200 pieces in the batch requires 10 gallons of paint and eight
hours of paint machine time.
Required:
Calculate the total cost to paint this batch.
Solution:
Using multiple activity bases, the cost of painting this part is calculated as
Setup cost $ 500Paint 150Machine time 560
Total painting cost $1,210
Notice that the cost of painting the parts includes a fixed setup cost of $500, which does
not vary with the number of parts painted.
covering fixed costs and providing profits. In this example, the contribution margin is cal-culated as
Price $0.25Less variable costs (0.10)
Contribution margin $0.15
Given the contribution margin and monthly fixed costs, the number of copies eachmachine must sell monthly to recover costs is the ratio of fixed costs to the contributionmargin. This quantity of copies is called the break-even point and is calculated as
In other words, if the copier makes 1,000 copies each month, it produces net receipts (aftervariable costs) of $150 (or 1,000 � $0.15), which is just enough to recover the fixed costs.
The Xerox copier example illustrates that classifying costs into fixed and variablecomponents provides a simple decision rule as to where to place copiers. If a store isexpected to produce (or actually produces) fewer than 1,000 copies per month, a copier
Break-even point =
Fixed costs
Contribution margin=
$150
$0.15= 1,000 copies
zim36725_ch02_022-088.qxd 12/15/09 11:38 AM Page 35

should not be located there. The break-even volume provides a useful management tool forwhere to place machines.
Let us study the cost–volume–profit analysis further. For simplicity, assume that productionequals sales (to avoid inventory valuation issues such as the LIFO/FIFO choice). Also as-sume that the firm produces a single product. Figure 2–5 displays the total cost and revenueof producing various levels of output. The total revenue curve shows revenue when higherunit sales can be achieved only at lower prices. At high prices, volumes are low. As pricesfall, volume increases and the slope of the total revenue curve becomes less steep. The totalcost curve, also nonlinear, is the same cost curve depicted in Figure 2–1. Break-even occurswhen total revenues equal costs. In Figure 2–5, two break-even volumes exist, labeled“Break-even point 1” and “Break-even point 2.” The profit-maximizing point of outputoccurs when marginal revenue equals marginal cost (MC � MR). Marginal revenue refersto the receipts from the last unit sold. At any point, marginal revenue, like marginal cost, isthe slope of the line just tangent to the total revenue curve.
As described in section B, it is difficult to estimate nonlinear functions. Linearapproximations are often used. Figure 2–6 substitutes linear cost and linear revenue ap-proximations for nonlinear curves. Instead of allowing price to vary with quantity, assumea constant price, P. The total revenue function, TR, is then
TR � P � Q
where Q is output. If the firm can sell as much as it wants without affecting price, then as-suming a linear revenue function, TR, does not distort the analysis. Likewise, total cost isassumed to follow a linear function of the form
TC � FC � VC � Q
where FC is the fixed cost and VC is the variable cost per unit. For the moment, ignoreincome taxes.
2. CalculatingBreak-Even andTarget Profits
36 Chapter 2
DollarsTotalcost
MR Totalrevenue
MC
FC
Break-evenpoint 1
Profit-maximizing
point
Break-evenpoint 2
Units produced
MC: Marginal cost is the slope of the total cost curve.MR: Marginal revenue is the slope of the total revenue curve.MC and MR are equal at the profit-maximizing point.
FIGURE 2–5
Total cost andrevenue curves
zim36725_ch02_022-088.qxd 12/15/09 11:38 AM Page 36

The Nature of Costs 37
Using linear functions allows managers to simplify analyzing how profits vary withoutput. In particular,
Profit � TR � TC � P � Q � VC � Q � FC (2.1)
Profit � (P � VC) � Q � FC (2.2)
Break-even volume is the number of units sold that just covers fixed and variable costs.To find break-even volume, QBE, set equation (2.2) equal to zero and solve for QBE.
(2.3)
Price minus variable costs (P � VC), the contribution margin per unit (CM), is theprofit per unit sold that can be used to cover fixed costs (FC). Contribution margin isimportant because it measures the incremental net receipts of selling one more unit. Referto Figure 2–6. If units produced is less than the break-even point, a loss occurs. If outputexceeds break-even quantity, a profit is earned.
Note that the estimated break-even point, QBE, will not exactly correspond to the“real” break-even point, where total revenue equals total cost. The discrepancy occursbecause TR and TC do not perfectly represent total revenue and opportunity costs,respectively.
Suppose we want to make a target after-tax profit of ProfitT and the income tax rate is t.We can compute the number of units needed to make an after-tax profit by modifying equa-tion (2.2) and solving for QT, target output:
(2.4)
(2.5) QT �ProfitT
(1 � t) � CM�
FC
CM
ProfitT = [QT * 1P - VC2 - FC ] * 11 - t2
QBE �FC
P � VC�
FC
Contribution margin�
FC
CM
Profit � 0 � (P � VC) � QBE � FC
Dollars
Profit
LossFC
Break-evenpoint 1
TR
TC
Units produced
FC: Fixed costTR: Total revenue equals a constant price times total output (P � Q)TC: Total cost equals fixed costs plus the variable cost per unit times output (FC + VC � Q)
FIGURE 2–6
Linear approximations ofcost and revenuecurves andcost–volume–profitanalysis
zim36725_ch02_022-088.qxd 12/15/09 11:38 AM Page 37

Instead of memorizing this formula, it is better to start with equation (2.1) or (2.2) andmake the necessary modifications to solve the particular problem at hand. Exercise 2–3illustrates how to modify the formula.
Exercise 2–3:
DGA Tile manufactures ceramic flooring tiles. DGA’s annual fixed costs are $740,000. The
variable cost of each tile is $0.25, and tiles are sold for $6.50. DGA has a combined state and
federal tax rate of 45 percent.
Required:
a. How many tiles does DGA need to make and sell each year to earn an after-tax profit
of $85,000?
b. DGA must pay 10 percent of before-tax profits as a royalty payment to its founder.
Now how many tiles must DGA make and sell to generate $85,000 after taxes?
(Assume the royalty payment is not a tax-deductible expense.)
Solution:
a. Let Q denote the number of tiles made and sold that generates $85,000 of after-tax
profit. Given the above data, we can write
($6.50Q � $0.25Q � $740,000) (1 � 0.45) � $85,000
(6.25Q � $740,000) � 0.55 � $85,000
Solving for Q:
$3.4375Q � $85,000 � $740,000 � 0.55
Q � 143,127 tiles
Therefore, to generate an after-tax profit of $85,000, about 143,000 tiles must be sold.
b. The formula with the royalty payment, R, is
($6.25Q � $740,000) � 0.55 � R � $85,000
where
R � ($6.25Q � $740,000) � 0.10
Substituting R into the earlier equation,
($6.25Q � $740,000) (0.55 � 0.10) � $85,000
Q � 148,622
The following exercise illustrates another use of contribution margins. It involveschoosing the most profitable product to produce when capacity is constrained.
38 Chapter 2
zim36725_ch02_022-088.qxd 12/15/09 11:38 AM Page 38

The Nature of Costs 39
Exercise 2–4:
The Ralston Company produces three shirts. It only has 200 machine hours per day to produce
shirts and has the following cost and production information:
Basic Deluxe Super
Selling price $7.50 $9 $13Variable cost of production $6.00 $7 $ 7Machine hours to complete one shirt 0.6 2 3Demand per day (shirts) 50 50 50
Ralston has fixed costs of $75 per day. How many shirts of each type should be produced?
Solution:
The opportunity cost of producing one type of shirt arises from not using those machine hours
to produce another type of shirt. In this problem, to maximize firm profits in light of a capacity
constraint, we must produce those products with the highest contribution margin per unit of
capacity. First calculate the contribution margin per shirt and then convert this to the contribu-
tion margin per machine hour.
Basic Deluxe Super
Selling price $7.50 $9 $13Variable cost of production $6.00 $7 $7
Contribution margin per shirt $1.50 $2 $6Hours to complete one shirt � 0.6 � 2 � 3
Contribution margin per machine hour $2.50 $1 $2Demand per day (shirts) 50 50 50
Production schedule (shirts) 50 10 50� Hours to complete one shirt 0.6 2 3
Hours consumed 30 20 150
To maximize profits Ralston should produce the shirt(s) with the highest contribution
margin per unit of scarce resource (machine hours). This is an application of the opportunity
cost principle. Even though super has the highest contribution margin per unit, basic has the
highest contribution margin per machine hour. Therefore, to maximize profits, produce
50 units of basic, which will consume 30 hours (or 50 units � 0.6 hours per unit). Next,
produce 50 units of super, which consumes 150 hours of capacity. This leaves 20 hours of
capacity to be used to produce 10 units of deluxe.
The preceding analysis suggests producing the market demand for basic and super but not
for deluxe. Fixed costs never enter the analysis. By definition, fixed costs are fixed and cannot
be relevant to the decision, which depends only on selling price, variable cost, and the capac-
ity constraint.*
*One artificial aspect of this exercise is that the quantity demanded and the price are taken as constants. Clearly, atlower prices, more shirts will be demanded. Fixed demand is assumed merely to simplify the problem and focus on thecost behavior.
zim36725_ch02_022-088.qxd 12/15/09 11:38 AM Page 39

The Ralston Company example illustrates a very simple situation in which there isonly one constraint. If there are multiple constraints, linear programming is a useful tech-nique for identifying the profit-maximizing mix of products. The next section describessome of the shortcomings of cost–volume–profit analysis.
Exercise 2–5:
Using equation (2.2), find the output, Q, that maximizes profits.
Solution:
Profits are maximized by setting output to infinity. That is, equation (2.2) cannot be used to
maximize profits.
Exercise 2–5 illustrates that cost–volume–profit analysis is not useful for choosingthe profit-maximizing output quantity when both revenues and costs are linear. Given thisconclusion, what good is it? Cost–volume–profit analysis offers a useful place to startanalyzing business problems. It gives managers an ability to do sensitivity analysis andask simple what-if questions. And, as we saw in the copier example, break-even analysiscan prove useful for certain types of decisions. However, there are several limitations ofcost–volume–profit analysis:
1. Price and variable cost per unit must not vary with volume.
2. Cost–volume–profit is a single-period analysis. All revenues and costs occur inthe same time period.
3. Cost–volume–profit analysis assumes a single-product firm. All fixed costs areincurred to produce a single product. If the firm produces multiple products,and fixed costs such as property taxes are incurred to produce multipleproducts, then the break-even point or target profit for any one of the productsdepends on the volume of the other products. With multiple products andcommon fixed costs, it is not meaningful to discuss the break-even point for justone product.
Although these limitations are important, cost–volume–profit analysis forces man-agers to understand how costs and revenues vary with changes in output.
Notice in the earlier Xerox copier example that the assumptions underlying break-evenanalysis are not violated:
• Price does not vary with quantity.
• Variable cost per unit does not vary with quantity.
• Fixed costs are known.
• There is a single product (copies).
• All output is sold.
As we saw above, one limitation of cost–volume–profit analysis is that it applies only tofirms making a single product. One way to overcome this limitation is to assume a constantoutput mix of bundles with fixed proportions of the multiple products. Then a break-evenor a target profit number of bundles can be calculated.
4. MultipleProducts
3. Limitations ofCost–Volume–Profit Analysis
40 Chapter 2
zim36725_ch02_022-088.qxd 12/15/09 11:38 AM Page 40

The Nature of Costs 41
For example, suppose a winery produces two types of wine: merlot and chablis. Thefollowing table summarizes prices and variable costs of the winery, which has fixed costsof $500,000 per year.
Merlot Chablis
Price per case $30 $20Variable cost per case 20 15
Contribution margin per case $10 $ 5
For every case of merlot produced, three cases of chablis are produced. Define a winebundle to consist of four cases of which one is merlot and three are chablis. Each wine bun-dle has revenues of $90 (1 � $30 � 3 � $20), variable costs of $65 (1 � $20 � 3 � $15),and a contribution margin of $25 (1 � $10 � 3 � $5). The number of bundles required tobreak even is:
Twenty thousand bundles needed to break even translate into 20,000 cases of merlotand 60,000 cases of chablis to break even. Hence, if a firm produces a variety of productsin fixed proportions, then break-even analysis can be conducted by creating a standardbundle of products.
Exercise 2–6:
Using the winery example above, how many cases of merlot and chablis must be produced and
sold to make an after-tax profit of $100,000 if the tax rate is 20 percent?
Solution:
The after-tax profit is calculated from the following equation:
After-tax profit � (1 � Tax rate) � (Revenues � Variable cost � Fixed costs)
$100,000 � (1 � 20%) � ($90B � $65B � $500,000)
where B is the number of bundles.
Solving for B yields:
$100,000 � .8 � ($25B � $500,000)
$100,000 � $20B � $400,000
B � $500,000�$20
B � 25,000 bundles
In other words, 25,000 cases of merlot and 75,000 cases (3 � 25,000) of chablis must be
sold to break even. At these production levels, $100,000 of after-tax profit is generated as
demonstrated by the following income statement:
continued
Break-even numberof bundles
�Fixed costs
Contribution margin�
$500,000
$25� 20,000 bundles
zim36725_ch02_022-088.qxd 12/15/09 11:38 AM Page 41

Revenue—Merlot 25,000 � $30 $ 750,000Revenue—Chablis 75,000 � $20 1,500,000
Total revenue $2,250,000Less: Variable costs
Merlot 25,000 � $20 $ 500,000Chablis 75,000 � $15 1,125,000
Fixed costs 500,000
Total costs $2,125,000
Income before taxes $ 125,000Taxes (20%) 25,000
Net income after taxes $ 100,000
Q2–10 What are the underlying assumptions in a cost–volume–profitanalysis?
Q2–11 What are the benefits and limitations of cost–volume–profitanalysis?
Separating costs into fixed and variable components is useful for calculating break-evenpoints. Estimating contribution margin is useful for pricing decisions and for deciding to takenew orders. Understanding a product’s fixed and variable costs is also useful for strategicreasons.
The higher a firm’s fixed costs, the higher its operating leverage, which is the ratio offixed costs to total costs. Operating leverage measures the sensitivity of profits to changes insales. The higher the operating leverage, the greater the firm’s risk. In firms with high oper-ating leverage, small percentage changes in volume (i.e., sales) lead to large percentagechanges in net cash flows (and profits). Therefore, firms with high operating leverage tendto have greater variability in cash flows and hence greater risk than firms with a lower ratioof fixed costs to total costs.
To illustrate the importance of operating leverage, consider the illustration in Table 2–1.Two companies, HiLev and LoLev, each sell 10,000 units of an identical product for $8 perunit. At that level of production, both companies have identical total costs of $70,000, andboth companies are making $10,000 in profits. But three-sevenths of LoLev’s costs arefixed, whereas five-sevenths of HiLev’s costs are fixed. Therefore, HiLev has more operat-ing leverage.
Suppose volume falls 25 percent. Table 2–2 indicates the impact on net income. InLoLev, net income falls to zero; in HiLev, a loss of $5,000 results. Table 2–3 illustratesthat when volume increases 25 percent, HiLev has a greater increase in profits thanLoLev. Operating leverage amplifies the impact on earnings of a given percentage changein volume.
5. OperatingLeverage
ConceptQuestions
42 Chapter 2
zim36725_ch02_022-088.qxd 12/15/09 11:38 AM Page 42

The Nature of Costs 43
Firms with low variable costs per unit can sustain larger short-term price cuts whenfaced with increased competition. For example, a firm selling a product for $10 per unitthat has a variable cost of $7 per unit can cut the price to just above $7 (for short peri-ods of time) and still cover the variable costs of each unit. If that same firm has variablecosts of $8 per unit, a price cut to below $8 causes a cash drain with each incrementalunit. Knowledge of a competitor’s cost structure is valuable strategic information indesigning marketing campaigns. Estimating a firm’s riskiness also requires knowledgeof operating leverage.
TABLE 2–1 Operating Leverage(Production and Sales Are 10,000 Units)
LoLev HiLev
Revenue 10,000 units @ $8 $80,000 $80,000Variable costs 10,000 units @ $4 40,000
10,000 units @ $2 20,000Fixed costs 30,000 50,000
Net income $10,000 $10,000
TABLE 2–2 Operating Leverage(Production and Sales Are 7,500 Units)
LoLev HiLev
Revenue 7,500 units @ $8 $60,000 $60,000Variable costs 7,500 units @ $4 30,000
7,500 units @ $2 15,000Fixed costs 30,000 50,000
Net income (loss) $ 0 $(5,000)
TABLE 2–3 Operating Leverage(Production and Sales Are 12,500 Units)
LoLev HiLev
Revenue 12,500 units @ $8 $100,000 $100,000Variable costs 12,500 units @ $4 50,000
12,500 units @ $2 25,000Fixed costs 30,000 50,000
Net income $ 20,000 $ 25,000
zim36725_ch02_022-088.qxd 12/15/09 11:38 AM Page 43

Exercise 2–7:
Two Internet retailers have the following data:
(millions) BuyEverything.com SportsWhere.com
Sales $120 $186Variable costs 70 150Fixed costs 40 24
Net income $ 10 $ 12
Required:
a. Which retailer has more operating leverage?
b. Suppose the sales of each retailer double; which one’s net income shows the greatest
percentage increase?
c. Calculate the percentage change in each retailer’s net income if sales fall 50 percent.
Solution:
a. BuyEverything.com’s operating leverage (as measured by the ratio of fixed to
total cost) is .36 ($40�$110) and SportsWhere.com’s operating leverage
is .14 ($24�$174). Hence, BuyEverything.com has more operating leverage.
b. The following table calculates how net income changes with a doubling of sales:
(millions) BuyEverything.com SportsWhere.com
Sales $240 $372Variable costs 140 300Fixed costs 40 24
Net income $ 60 $ 48
Prior net income $ 10 $ 12% change 500%* 300%†
*($60 � $10)/$10†($48 � $12)/$12
BuyEverything.com (which has more operating leverage from part a) shows the
greatest percentage increase in net income.
c. The following table calculates how net income changes when sales fall 50 percent:
(millions) BuyEverything.com SportsWhere.com
Sales $60 $93Variable costs 35 75Fixed costs 40 24
Net income ($15) ($ 6)
Prior net income $10 $12% change �250%* �150%†
*(�$15 � $10)�$10†(�$6 � $12)�$12
BuyEverything.com (which has more operating leverage from part a) shows the
greatest percentage decrease in net income.
44 Chapter 2
zim36725_ch02_022-088.qxd 12/15/09 11:38 AM Page 44

The Nature of Costs 45
D. Opportunity Costs versus Accounting CostsThe theoretically correct way to evaluate choices requires estimating opportunity costs.Estimating opportunity costs requires the decision maker to formulate all possible actions(the opportunity set) and the forgone net receipts from each of those alternatives so that thehighest net cash flows from the set of actions not undertaken can be calculated. This yieldsthe opportunity cost of the selected action. Such an exercise requires a special study forevery decision, a time-consuming and costly activity. And after completing the study, theopportunity cost changes as the opportunity set changes. It is little wonder that managersdevise shortcut approximations to estimating opportunity costs. Accounting-based costs aresuch a shortcut.
Accounting systems record “costs” after making the decisions. Accounting systemstrack asset conversions. When the firm acquires assets such as raw material, accountantsrecord them in monetary terms (historical cost valuation). As the raw inputs are con-verted into intermediate products, accountants value the intermediate products at the his-torical costs of the raw inputs converted into the intermediate products. The in-process,partially completed units flowing through departments, are recorded in the accounts athistorical costs. If an employee paid $12 per hour completes an intermediate product intwo hours, the accounting system increases the cost of the intermediate product by $24.Completion and sale of the manufactured unit causes the historical costs attached to it tobe transferred from the inventory accounts to the expense account “cost of goods sold.”Accounting costs are not forward-looking opportunity costs; they look backward at thehistorical cost of the resources consumed to produce the product. Accounting systemsproduce accounting costs, not opportunity costs. However, accounting costs often pro-vide a reasonable approximation of opportunity costs. Over short periods of time, pricesand costs do not change very much. Thus, accounting costs can be reasonably accurateestimates of opportunity costs of producing the same products again.
ManagerialApplication:New EconomyFirms andHighOperatingLeverage
High technology firms incur large fixed costs and relatively low variable costs to pro-duce intellectual property such as software and Web sites. This combination creates highoperating leverage that causes these firms to be very risky. In good times they are flyinghigh. In weak times, there is very little they can do to trim expenses.
Inktomi Corp. was a high-flying software company. It spent $10 million developingresearch engines and software to manage Web content. Once those fixed costs wereincurred, each additional sale was almost pure profit. The president remarked, “You haveno cost of goods. We don’t even ship a physical diskette anymore. Next to the federal gov-ernment, this is the only business that’s allowed to print money.” All this has changed.
Software development costs rose and sales nosedived, causing Inktomi to report aloss of $58 million for the first quarter of 2001. Enormous fixed costs are required to re-search, develop, design, test, and market software. Intense competition and rapid obso-lescence require high levels of spending each year. The result is a dramatic reversal offortune leading to big swings in profits, stock prices, and hiring when sales sag.
High operating leverage at Yahoo! caused its profits to plummet $87 million to aloss of $33 million in the second quarter of 2001 because sales fell 42 percent, yetexpenses remained largely fixed. Inktomi did not survive the Internet bubble and wassold to Yahoo! in 2002.
SOURCE: G Ip, “Blame the Profit Dive on a Marked Change in Companies’ Costs,” The Wall Street Journal, May 16, 2001, p. A1; http://en.wikipedia.org/wiki/Inktomi.
zim36725_ch02_022-088.qxd 12/15/09 11:38 AM Page 45

Besides providing data for decision making, internal accounting systems also providedata for controlling the behavior of people in organizations as well as the data for externalfinancial reporting. The resources consumed to produce this textbook might differ from theopportunity cost of a new textbook. But the historical cost of this book provides informa-tion to senior managers as to how well the persons responsible for producing this book dis-charged their duties. Valuing the ending inventory of books, calculating taxes payable, andcomputing net income require the historical cost of this textbook.
Cost systems do not focus on opportunity costs, nor can they, since opportunity costsdepend on the particular decision being contemplated. Accounting systems cannot antici-pate all future decisions. For example, suppose you purchased land on a busy commercialstreet last month, paying $1 million. If you open a fast-food restaurant on this land, you es-timate it will be worth $1.6 million. If, on the other hand, you open a gas station, its valueis estimated at $1.7 million. Using the land for a gas station costs you $1.6 million in termsof the next best forgone opportunity (the fast-food restaurant). The $1 million historicalcost of the land, even though only one month old, is not the opportunity cost. Thus, the termcost can refer to accounting cost (historical amounts) or to opportunity cost (the amountforgone by some decision), two very different concepts. In some cases, the user’s meaningis obvious, but it is always important to question whether the term cost means opportunitycost or accounting cost.
To further understand how accounting costs differ from opportunity costs, we distinguishbetween product costs and period costs. Product costs include all those accounting costsincurred to manufacture a product. Product costs are inventoried and expensed only whenthe product is sold. Period costs are those costs that are expensed in the period in whichthey are incurred. They include all nonmanufacturing accounting costs incurred to sell theproduct. For example, administration, distribution, warehousing, selling, and advertisingexpenditures are period costs. Research and development is a period cost. Period costs arenot part of the product’s cost included in inventory valuation.
Product costs include both fixed and variable manufacturing components. Like-wise, period costs, the costs of distributing and selling the product, contain both fixedand variable components. Fixed period costs include salespersons’ salaries, advertising,and marketing costs. Examples of variable period costs include distribution costs andsales commissions.
Accounting systems, even those used for internal purposes, distinguish betweenproduct and period costs. In most situations, unit cost figures refer to product costsexcluding all period costs. Suppose that the unit manufacturing cost of a particular cellphone is $23. Selling and distributing this product costs an additional $4 per unit. This$4 period cost includes both fixed and variable period costs. The total cost of manufac-turing and selling each unit is $27. Many firms refer to the $23 product cost as a unitmanufacturing cost (UMC). For decision-making purposes both period ($4) and product($23) costs must be considered, so it is important to remember that a UMC usuallyexcludes period costs.
Period costs and product costs are historical costs. They are not opportunity costs.However, to the extent that the future looks a lot like the past, these historical costs can beuseful predictors of opportunity costs.
The accounting concepts of direct costs versus overhead costs also illustrate the differencebetween opportunity and accounting costs. Direct costs and overhead costs form the coreof this book, to which we will return in later chapters, particularly Chapters 9 through 13.But it is useful to introduce the terms now.
2. Direct Costs,Overhead Costs,and OpportunityCosts
1. Period versusProduct Costs
46 Chapter 2
zim36725_ch02_022-088.qxd 12/15/09 11:38 AM Page 46

The Nature of Costs 47
Direct costs of a product or service are those items that are easily traced to the productor service. Direct labor and direct material costs are direct costs. An employee producing aproduct is classified as direct labor. If this employee is idled by a machine breakdown, thatidle time is classified as indirect labor. Indirect materials include those used in maintainingand testing machines as well as those lost in the machine during a breakdown. Overheadincludes indirect labor and indirect material costs as well as other types of general manu-facturing costs that cannot be directly traced, or are not worth tracing, to units being pro-duced. Examples include the cost of the purchasing department; factory property taxes,maintenance, depreciation, insurance, and security guards; and some engineering services.Indirect cost is another term for overhead.
Direct costs are usually variable. For example, to produce more copies of this bookrequires additional paper and ink (direct materials) and additional time by the person run-ning the printing press (direct labor). But direct costs can be fixed. For example, the costsassociated with a machine (depreciation, electricity, and routine maintenance) dedicated toone product are direct costs of that product and are largely fixed. Or, if the firm has a fixedlabor force and does not adjust the quantity of labor as output changes, direct labor is afixed cost. (This occurs when the firm has a “no-cut” labor agreement with its union.) Ifthe firm has a material supply contract to purchase a fixed amount of noninventoriable in-put, then this direct material is a fixed cost over the life of the contract. For example, if asteel mill has a long-run supply contract to purchase a fixed amount of natural gas per yearover the life of the contract, this direct material (natural gas) is largely a fixed cost. If thecompany can sell what it does not use, the natural gas is a variable cost. Overhead costscontain both fixed costs and variable costs.
The distinction between overhead and direct costs can be difficult to determineat times. For example, should the 10¢ worth of glue used in each bookcase containing$9 of wood and $30 of direct labor be treated as a direct or an indirect cost? To applya cost–benefit criterion, we must decide what decisions will be affected if the glue isclassified as direct versus indirect. In most cases, small dollar amounts of direct costs aretreated as overhead because the costs of tracking and reporting them separately exceedthe benefits. Never assume that all direct costs are variable and all overhead costs arefixed costs.
The following chart summarizes the relations among accounting cost terminology:
Direct materialDirect costs Direct labor
Product costs
Factory overhead Conversion costs• Variable factory overhead• Fixed factory overhead
Selling, general, and administrative (SG&A) costs• Variable SG&A Period costs• Fixed SG&A
12
3
144
24
43
144
24
43
12
3
Product costs consist of direct material, direct labor, and overhead. The term conversioncosts refers to direct labor and factory overhead. Period costs consist of selling, general,and administrative costs.
To illustrate these cost terms in a specific situation, consider the hot dog vendor Maryon the corner of 47th Street and Park Avenue in Manhattan. She sells hot dogs only. She
zim36725_ch02_022-088.qxd 12/15/09 11:38 AM Page 47
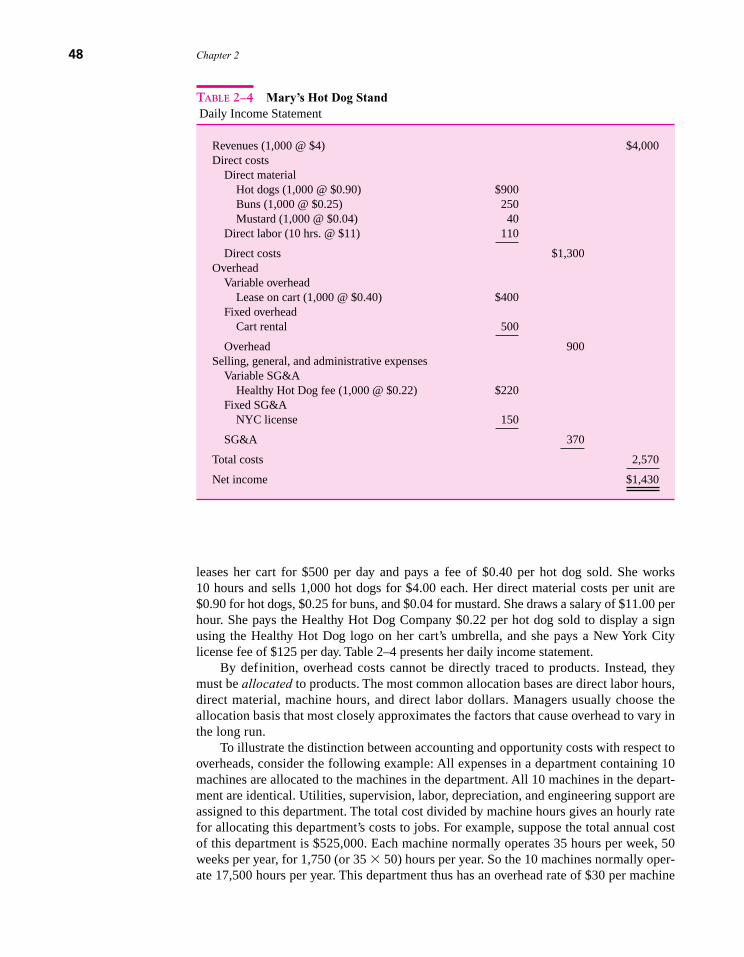
leases her cart for $500 per day and pays a fee of $0.40 per hot dog sold. She works10 hours and sells 1,000 hot dogs for $4.00 each. Her direct material costs per unit are$0.90 for hot dogs, $0.25 for buns, and $0.04 for mustard. She draws a salary of $11.00 perhour. She pays the Healthy Hot Dog Company $0.22 per hot dog sold to display a signusing the Healthy Hot Dog logo on her cart’s umbrella, and she pays a New York Citylicense fee of $125 per day. Table 2–4 presents her daily income statement.
By definition, overhead costs cannot be directly traced to products. Instead, theymust be allocated to products. The most common allocation bases are direct labor hours,direct material, machine hours, and direct labor dollars. Managers usually choose theallocation basis that most closely approximates the factors that cause overhead to vary inthe long run.
To illustrate the distinction between accounting and opportunity costs with respect tooverheads, consider the following example: All expenses in a department containing 10machines are allocated to the machines in the department. All 10 machines in the depart-ment are identical. Utilities, supervision, labor, depreciation, and engineering support areassigned to this department. The total cost divided by machine hours gives an hourly ratefor allocating this department’s costs to jobs. For example, suppose the total annual costof this department is $525,000. Each machine normally operates 35 hours per week, 50weeks per year, for 1,750 (or 35 � 50) hours per year. So the 10 machines normally oper-ate 17,500 hours per year. This department thus has an overhead rate of $30 per machine
48 Chapter 2
TABLE 2–4 Mary’s Hot Dog StandDaily Income Statement
Revenues (1,000 @ $4) $4,000Direct costs
Direct materialHot dogs (1,000 @ $0.90) $900Buns (1,000 @ $0.25) 250Mustard (1,000 @ $0.04) 40
Direct labor (10 hrs. @ $11) 110
Direct costs $1,300Overhead
Variable overheadLease on cart (1,000 @ $0.40) $400
Fixed overheadCart rental 500
Overhead 900Selling, general, and administrative expenses
Variable SG&AHealthy Hot Dog fee (1,000 @ $0.22) $220
Fixed SG&ANYC license 150
SG&A 370
Total costs 2,570
Net income $1,430
zim36725_ch02_022-088.qxd 12/15/09 11:38 AM Page 48

The Nature of Costs 49
hour ($525,000 � 17,500 hours). If a particular job takes nine hours on the machines inthis department, it is allocated $270 of “cost” (9 � $30). But did the firm actually incur$270 to process this job in the department? We don’t know. The machine-hour rate($30/hour) is an average accounting cost. It is a mixture of both fixed and variable costs,and it gives a false impression of variability. It does not tell us whether we made moneyon this job. In bidding for future jobs, the $30 per hour does not tell us what competitorswill bid or what additional overhead costs will be incurred.
As plant volumes rise, congestion costs rise. Queues form. More expediters are hiredto track inventory. Machine scheduling becomes more difficult. Marginal overhead costsmay be more or less than $30 per hour.
In the long run, if the firm cannot charge prices (and generate sales) that cover all over-head costs (including depreciation of the assets), it will not be able to replace its assets. Ofcourse, charging prices that cover overhead may price the firm out of the market com-pletely. But by applying overhead costs (fixed and variable costs) to products, managementcan see whether the firm is viable under current conditions. The other reason for applyingoverhead costs to products is to control organizational problems. If the machine-hour rateis $30 this year and rises to $35 next year, senior managers are alerted that something haschanged. By reporting the higher overhead cost, managers will investigate the reason forthe change and presumably take corrective action.
Q2–12 Why are opportunity costs costly to estimate?
Q2–13 Define direct costs.
Q2–14 Define overhead costs. How are they allocated?
Q2–15 What are period costs?
ConceptQuestions
HistoricalApplication:RailroadsDevelop UnitCost Data
In the 1870s, the railroads developed detailed and highly accurate cost estimates of haul-ing one ton of freight one mile. This has come to be known as the cost per ton mile. Thecalculation first involved separating the accounting records into four groups of accounts:costs that did not vary with the volume of traffic (general superintendence), costs thatvaried with the volume of freight but not the length of the haul (stations and agents),costs that varied with the number of trains run (conductors, engineers, and fuel), and in-terest on the capital investment. Each of these four costs was converted into a unit rate,and each freight shipment was costed based on its weight and how many miles it wascarried.
These cost data allowed senior managers to monitor costs and to evaluate theperformance of the managers responsible for the various segments of track. Cost per tonmile allowed subordinates’ performance to be judged. By studying how the unit costdata varied over time and across various branches of the railroad, managers could eval-uate the performance of the parts of the railroad and its managers. The railroads are anearly but sophisticated example of using account classification as the basis of estimat-ing unit costs.
SOURCE: A Chandler, The Visible Hand (Cambridge, MA: Harvard University Press, 1977), pp. 116–19.
zim36725_ch02_022-088.qxd 12/15/09 11:38 AM Page 49

E. Cost EstimationNow that the important concepts of opportunity cost and how opportunity costs vary withchanges in output have been introduced, they must be put into practice. Costs must beestimated, either from the accounting records or by some other method. This sectiondescribes two approaches to cost estimation: account classification and motion and timestudies.
The simplest and the most common method of estimating fixed and variable costs isaccount classification. Each account in the accounting system is classified as being eitherfixed or variable. The sum of all the variable cost accounts, divided by a measure of volume(e.g., units produced), yields variable cost per unit. Likewise, the sum of all the accountsclassified as fixed costs yields an estimate of the total fixed costs. While this method isquick and simple, it is not very precise. Its accuracy depends on the knowledge and intu-ition of the person classifying the accounts as fixed or variable.
In motion and time studies, industrial engineers estimate how much time a particular taskor work activity requires with the goal of determining the optimal work method. Motionstudies involve the systematic analysis of work methods considering the raw materials,the design of the product or process, the process or order of work, the tools, and the ac-tivity of each step. Besides estimating how long a particular activity should take, indus-trial engineers are often able to redesign the product or process to reduce the requiredtime. Time studies employ a wide variety of techniques for determining the duration re-quired for a particular activity under certain standard conditions. Work sampling (onetype of time study) involves selecting a large number of observations taken at random in-tervals and observing how long employees take to perform various components of thejob. It tells management how employees are currently spending their time, not how effi-ciently they could be spending their time. No benchmarks exist to judge performance.Work sampling tends to institutionalize existing inefficiencies. Motion and time studiesare often expensive in terms of engineering time used in the studies. They also sufferfrom potential bias because of employees’ incentives to underperform during the studyperiod to set lower quotas.
Most of the problems presented in this and other books furnish the necessary cost datato solve the problem being posed. However, deriving the cost data is often more difficultthan making a decision after securing the information. Besides engineering cost estimationtechniques, accounting records are often the most prevalent source of cost data. Chapter 9describes how accounting develops product costs.
Q2–16 What are motion and time studies? What are their objectives?
F. SummaryThis chapter emphasizes that decision making requires knowledge of opportunity costs, or the bene-fits forgone from actions precluded by the alternative selected. Opportunity costs can be determinedonly within a specific decision context by specifying all the alternative actions. While opportunitycost is the theoretically correct concept to use in decision making, it can be costly to estimate. Spe-cial studies are required to identify the alternative actions and forecast their likely consequences.
ConceptQuestion
2. Motion andTime Studies
1. AccountClassification
50 Chapter 2
zim36725_ch02_022-088.qxd 12/15/09 11:38 AM Page 50

The Nature of Costs 51
Accounting costs often provide useful and less costly approximations for opportunity costs. However,costs reported by accounting systems are not opportunity costs. Opportunity costs are forward-looking and are usually not recorded by accounting systems.
Accounting costs measure the monetary resources expended for a particular activity. They pro-vide a useful database to begin the process of estimating opportunity costs. Accounting costs alsoserve the important function of influencing the behavior of the firms’ employees and managers. Theaccounting system reports the accounting cost of making the sofa this month and what the cost waslast month to make the same sofa. Senior managers can then assess the performance of sofa pro-duction, providing incentives for the sofa-producing managers to pay attention to costs. If theaccounting cost of the sofa is $208 this month, this number is not the opportunity cost of makingthe sofa. But if the same type of sofa had an accounting cost of $150 last month, something hashappened that senior management will want to investigate. Chapter 4 explores these organizationalcontrol issues in more detail.
Managers must decide how many units of each product to manufacture. This decision also re-quires opportunity costs. One method of estimating opportunity costs for these decisions assumes thattotal costs are linear; hence, total costs are the fixed costs and variable costs per unit. A linear costcurve is also useful for cost–volume–profit analyses. These analyses focus managers’ attention on howcosts and profits vary with some volume measure. However, such analyses require assumptions to bemade. These include assuming a single-period, single-product plant and linear cost and revenue curves.
When someone asks what something costs, the first reaction should be to find out for what pur-pose the cost number is to be used. If the cost number will be used for decision making, an oppor-tunity cost must be generated for that decision context, which requires the decision maker to specifyall the relevant alternative actions. If the number is to be used for financial reporting or taxes, a dif-ferent cost number will be produced. If the cost number is being used to control behavior within thefirm, probably a different number will be used. Cost numbers can vary significantly according to thepurpose for which they are being produced.5
Appendix: Costs and the Pricing DecisionOne of the most important decisions managers make involves pricing the firm’s goods and services.Clearly, the cost of producing the good or service is a crucial variable entering the pricing decision.This appendix discusses how managers use cost information in setting prices. There are two cases toconsider: (1) the firm is a “price taker” and (2) the firm has “market power.”
Price Takers Some markets are very competitive. With many buyers and sellers of the same product, no singleproducer or consumer can influence the market price. For example, consider wheat farmers. Withthousands of wheat farmers, no single farmer can affect the price of wheat by altering the amountof wheat the farmer produces. In this case, wheat farmers are price takers who do not set the price.They do, however, use cost information when deciding to grow (or not to grow) wheat.
While price takers understand that the price is given, they still must decide how much, if any, ofthe product to produce. Here cost data are extremely important. Suppose a wheat farmer leases landand equipment for $2,200,000 per year and expects to produce 1 million bushels of wheat. The vari-able cost per bushel is $1.60 and the market price of wheat is expected to be $3.90 per bushel whenthe wheat is harvested. The farmer expects to make $100,000 of profit (1 million bushels � ($3.90 �$1.60) � $2,200,000). If this is adequate compensation for the farmer’s time and risk, she will lease
5It has long been recognized that no single cost concept can serve all purposes. J Clark, writing in Studies inthe Economics of Overhead Costs (Chicago: University of Chicago Press, 1923), p. 175, states, “We may startwith the general proposition that the terminology of costs is in a state of much confusion and that it isimpossible to solve this confusion by discovering and adopting the one correct usage, because there is no onecorrect usage, usage being governed by the varying needs of varying business situations and problems.”
zim36725_ch02_022-088.qxd 12/15/09 11:38 AM Page 51

52 Chapter 2
the land and equipment and plant the wheat. So in this case, before the farmer decides to lease theland and plant wheat, she uses cost data to determine if the production decision (growing wheat) isworthwhile.
Suppose the land and equipment have been leased (and paid), but before the wheat is planted andthe variable costs have been incurred, the price of wheat is expected to be only $3.65. Taking into accountthe fixed costs that have already been incurred, the farmer now expects to lose $150,000 (1 millionbushels � ($3.65 � $1.60) � $2,200,000). However, the lease payments are sunk. The farmer stillgenerates $2,050,000 of contribution margin, but not enough to recoup her fixed costs. She will stillgo ahead and plant the wheat. Not doing so will cost her the entire fixed cost of $2.2 million. If shethinks wheat prices next year will remain at $3.65 per bushel, she will not lease the land and equip-ment again.
To summarize, price takers use cost data to determine whether to undertake production, not toset prices. Fixed costs that have not yet been incurred are relevant in this production decision. Onceincurred, the fixed costs are irrelevant in making production decisions.
Market Power A more complicated pricing situation arises when producers have market power. Firms have marketpower if perfect substitutes do not exist for their products. This means that they can raise priceswithout losing all their customers to competitors. For instance, although Colgate and Crest competedirectly, many customers do not view these toothpaste brands as perfect substitutes. Each companycan raise their price and some consumers will not switch to the other toothpaste. But with higherprices, more customers will defect to competitors. This is not the situation with price takers. If awheat farmer were to ask for a price above the prevailing market price, no buyers would pay thisprice because they can purchase identical wheat at a lower price.
When firms have market power, managers must decide not only whether to produce but alsowhat price to charge. The next example illustrates how managers use cost data in the pricingdecision.
Consider a tennis racket company with a patent for a unique, high-performance tennis racket.The number of rackets sold depends on the price charged for the racket. At low prices, more racketscan be sold than at higher prices. After extensive study of competitors’ prices for high-performancerackets, management expects the relation between price and quantity of rackets sold to be as depictedin Table 2–5. For example, at a price of $1,050 per racket, only 500 are sold, but if the price isdropped to $100 per racket, 10,000 can be sold.
The cost of producing the rackets consists of annual fixed costs of $1.9 million and variablecosts of $100 per racket. The fixed costs include all fixed marketing, production, interest, andadministration expenses, and the variable costs include all variable production and distributionexpenses. Thus, total annual costs, TC, can be expressed as:
TC � $1,900,000 � $100Q (where Q is the number of rackets)
Notice that with this linear cost function, marginal cost (the cost of the last racket) and variable costare both $100.
Given the data in Table 2–5 and the total cost curve, management can determine the profit-maximizing price to charge for tennis rackets. Table 2–6 provides the calculations.
As Table 2–6 shows, 500 rackets will be sold when the price per racket is $1,050, thereby pro-ducing total revenues of $525,000 ($1,050 � 500), total cost of $1,950,000 ($1,900,000 � $100 �500), and thus a loss of $1,425,000. Clearly, this is not the right price to charge. By calculating profitsat all the other price-quantity combinations, we see that profits are maximized at $600,000 when priceis set at $600 per racket and 5,000 rackets are sold. Total costs are $2.4 million ($1,900,000 � $100 �5,000). Notice that profits are not maximized where revenues are maximized. Maximum revenuesoccur at a price-quantity combination of $550 per racket and 5,500 rackets, which is a lower-price–higher-quantity combination than the profit-maximizing combination.
Now let’s study more closely how fixed and variable costs enter the profit-maximizing pricingdecision. We will examine two types of cost changes: an increase in fixed costs and an increase invariable costs.
zim36725_ch02_022-088.qxd 12/15/09 11:38 AM Page 52
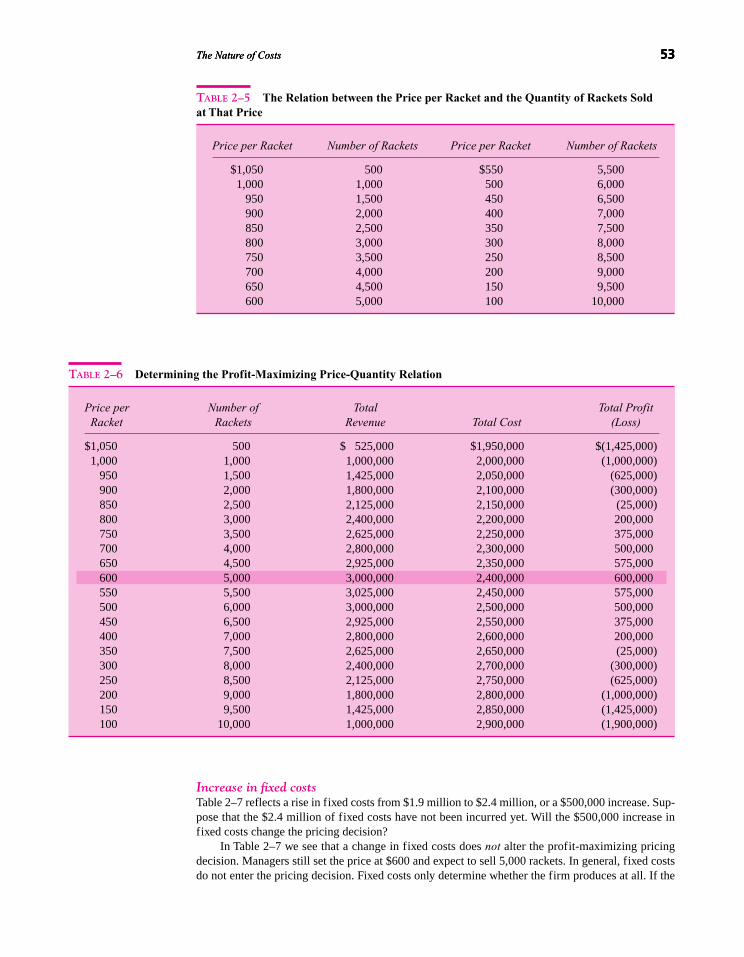
The Nature of Costs 53The Nature of Costs 53The Nature of Costs 53
Increase in fixed costsTable 2–7 reflects a rise in fixed costs from $1.9 million to $2.4 million, or a $500,000 increase. Sup-pose that the $2.4 million of fixed costs have not been incurred yet. Will the $500,000 increase infixed costs change the pricing decision?
In Table 2–7 we see that a change in fixed costs does not alter the profit-maximizing pricingdecision. Managers still set the price at $600 and expect to sell 5,000 rackets. In general, fixed costsdo not enter the pricing decision. Fixed costs only determine whether the firm produces at all. If the
TABLE 2–5 The Relation between the Price per Racket and the Quantity of Rackets Sold at That Price
Price per Racket Number of Rackets Price per Racket Number of Rackets
$1,050 500 $550 5,5001,000 1,000 500 6,000
950 1,500 450 6,500900 2,000 400 7,000850 2,500 350 7,500800 3,000 300 8,000750 3,500 250 8,500700 4,000 200 9,000650 4,500 150 9,500600 5,000 100 10,000
TABLE 2–6 Determining the Profit-Maximizing Price-Quantity Relation
Price per Number of Total Total Profit Racket Rackets Revenue Total Cost (Loss)
$1,050 500 $ 525,000 $1,950,000 $(1,425,000)1,000 1,000 1,000,000 2,000,000 (1,000,000)
950 1,500 1,425,000 2,050,000 (625,000)900 2,000 1,800,000 2,100,000 (300,000)850 2,500 2,125,000 2,150,000 (25,000)800 3,000 2,400,000 2,200,000 200,000750 3,500 2,625,000 2,250,000 375,000700 4,000 2,800,000 2,300,000 500,000650 4,500 2,925,000 2,350,000 575,000600 5,000 3,000,000 2,400,000 600,000550 5,500 3,025,000 2,450,000 575,000500 6,000 3,000,000 2,500,000 500,000450 6,500 2,925,000 2,550,000 375,000400 7,000 2,800,000 2,600,000 200,000350 7,500 2,625,000 2,650,000 (25,000)300 8,000 2,400,000 2,700,000 (300,000)250 8,500 2,125,000 2,750,000 (625,000)200 9,000 1,800,000 2,800,000 (1,000,000)150 9,500 1,425,000 2,850,000 (1,425,000)100 10,000 1,000,000 2,900,000 (1,900,000)
zim36725_ch02_022-088.qxd 12/15/09 11:38 AM Page 53

54 Chapter 254 Chapter 254 Chapter 2
contribution margin at the profit-maximizing price-quantity combination fails to cover the fixed costs(and the fixed costs have not yet been paid), the firm should not produce. For example, if fixed costsincreased to $2.55 million, the profit-maximizing price-quantity combination would still be $600 and5,000 rackets. But now the firm loses $50,000 at this price-quantity combination and it should notproduce any rackets.
Increase in variable costsWe now consider how variable costs affect the pricing decision. Fixed costs are $1.9 million. If thevariable cost of rackets increases from $100 to $200 per racket, the profit-maximizing price risesfrom $600 to $650 per racket and fewer rackets are sold (4,500 instead of 5,000). See Table 2–8. No-tice that only $50 of the $100 variable cost increase is passed on to consumers. If the price were raisedto $700 to recover all the $100 variable cost increase, even fewer rackets would be sold and the rev-enue decline would be greater than the cost increase.
Tables 2–6 to 2–8 illustrate a central point from economics: Only variable cost (which equalsmarginal cost in our linear cost function) affects the pricing decision. Fixed costs do not affect thepricing decision. Fixed costs only determine whether the firm should produce the product. Econom-ics texts demonstrate that the profit-maximizing price is determined where marginal (variable) costequals marginal revenue.
Cost-Plus Pricing One of the more common pricing methods used by firms is cost-plus pricing. Firms that use thistechnique calculate average total cost and mark up the cost to yield the selling price. Or,
Selling price � Cost � (Markup percentage � Cost)
To solve for the selling price, managers begin by calculating a unit cost:
Unit cost � Variable cost � (Fixed costs/Unit sales)
54 Chapter 2
TABLE 2–7 Determining the Profit-Maximizing Price-Quantity Relation: Fixed Costs Increased by $500,000
Price per Number of Total Total Racket Rackets Revenue Total Cost Profit (Loss)
$1,050 500 $ 525,000 $2,450,000 $(1,925,000)1,000 1,000 1,000,000 2,500,000 (1,500,000)
950 1,500 1,425,000 2,550,000 (1,125,000)900 2,000 1,800,000 2,600,000 (800,000)850 2,500 2,125,000 2,650,000 (525,000)800 3,000 2,400,000 2,700,000 (300,000)750 3,500 2,625,000 2,750,000 (125,000)700 4,000 2,800,000 2,800,000 0650 4,500 2,925,000 2,850,000 75,000600 5,000 3,000,000 2,900,000 100,000550 5,500 3,025,000 2,950,000 75,000500 6,000 3,000,000 3,000,000 0450 6,500 2,925,000 3,050,000 (125,000)400 7,000 2,800,000 3,100,000 (300,000)350 7,500 2,625,000 3,150,000 (525,000)300 8,000 2,400,000 3,200,000 (800,000)250 8,500 2,125,000 3,250,000 (1,125,000)200 9,000 1,800,000 3,200,000 (1,500,000)150 9,500 1,425,000 3,350,000 (1,925,000)100 10,000 1,000,000 3,400,000 (2,400,000)
zim36725_ch02_022-088.qxd 12/15/09 11:38 AM Page 54

The Nature of Costs 55The Nature of Costs 55The Nature of Costs 55
Using our tennis racket example and 5,000 rackets,
Unit cost � $100 � ($1,900,000/5,000 rackets) � $480
Managers using a markup of 25 percent would set the price as:
Selling price � $480 � (25 percent � $480) � $600
In this example, the formula yields the same price as our profit-maximizing price-quantity combina-tion from Table 2–6. However, we started with the profit-maximizing quantity and markup. So byconstruction, we had to end up with the profit-maximizing price.
Suppose that fixed costs increase to $2 million and variable costs decrease to $80. Managersstill expect to sell 5,000 rackets. Unit costs remain at $480 ($80 � $2,000,000/5,000). If managersmaintain the same 25 percent markup, they will keep the price at $600. But this is no longer theprofit-maximizing price. Variable costs have fallen, so managers should lower the price to $590 andsell 5,100 rackets.6
Profit-maximizing pricing considers only variable (marginal) costs and depends on the pricesensitivity of customers. Cost-plus pricing appears to ignore both of these considerations. The cost-plus price marks up average total cost (both fixed and variable cost) and seems to ignore the demandfor the product. Just because managers target a 25 percent markup on average cost does not mean thatcustomers will necessarily buy the product in the required quantities at the implied price.
TABLE 2–8 Determining the Profit-Maximizing Price-Quantity Relation: Variable Costs Increased by $100 per Racket
Price per Number of Total Total Racket Rackets Revenue Total Cost Profit (Loss)
$1,050 500 $ 525,000 $2,000,000 $(1,475,000)1,000 1,000 1,000,000 2,100,000 (1,100,000)
950 1,500 1,425,000 2,200,000 (775,000)900 2,000 1,800,000 2,300,000 (500,000)850 2,500 2,125,000 2,400,000 (275,000)800 3,000 2,400,000 2,500,000 (100,000)750 3,500 2,625,000 2,600,000 25,000700 4,000 2,800,000 2,700,000 100,000650 4,500 2,925,000 2,800,000 125,000600 5,000 3,000,000 2,900,000 100,000550 5,500 3,025,000 3,000,000 25,000500 6,000 3,000,000 3,100,000 (100,000)450 6,500 2,925,000 3,200,000 (275,000)400 7,000 2,800,000 3,300,000 (500,000)350 7,500 2,625,000 3,400,000 (775,000)300 8,000 2,400,000 3,500,000 (1,100,000)250 8,500 2,125,000 3,600,000 (1,475,000)200 9,000 1,800,000 3,700,000 (1,900,000)150 9,500 1,425,000 3,800,000 (2,375,000)100 10,000 1,000,000 3,900,000 (2,900,000)
6 To derive this new price-quantity combination, note that the price-quantity combinations in Table 2–5 are based on the following formula: Price � $1,100 � 0.1 � Quantity. This equation is used to calculate price-quantity combinations in 100-racket increments.
zim36725_ch02_022-088.qxd 12/15/09 11:38 AM Page 55

56 Chapter 256 Chapter 2
Firms that consistently use bad pricing policies find themselves earning lower profits than theycould with better pricing techniques and may even go out of business. If cost-plus pricing is so un-sound, why is it so widely used? One explanation is that managers implicitly consider market demandin choosing the markup and unit sales in calculating the unit cost. If managers know that they face lit-tle competition, more units can be sold and higher markups will be chosen than when facing greatercompetition. Conceptually, there is always some target volume and markup that produces the profit-maximizing price.
The idea that managers choose markups and unit volumes based on market power when they usecost-plus price is supported empirically. Consider the price markups by a typical grocery store em-ploying cost-plus pricing. One experienced grocery store manager noted that “price sensitivity is theprimary consideration in setting margins.”7 Staple products such as bread, hamburger, milk, and soupare relatively price sensitive and carry low margins (markups of under 10 percent above cost). Prod-ucts with high margins (markups as high as 50 percent or more) tend to be those where consumers areless price sensitive, such as spices, seasonal fresh fruit, and nonprescription drugs.
Self-Study ProblemsSelf-Study Problem 1: Exclusive Billiards
In each month, Exclusive Billiards produces between 4 and 10 pool tables. The plant operates one 40-hour shift to produce up to seven tables. Producing more than seven tables requires the craftsmen towork overtime. Overtime work is paid at a higher hourly wage. The plant can add overtime hours andproduce up to 10 tables per month. The following table contains the total cost of producing between4 and 10 pool tables.
Pool Tables Total Cost
4 $62,8005 66,0006 69,2007 72,4008 75,8009 79,200
10 82,600
Required:
a. Prepare a table computing the average cost per pool table for 4 to 10 tables.
b. Estimate Exclusive Billiards’ fixed costs per month.
c. Suppose Exclusive Billiards sells its tables for $13,200 each. How many tables must it sellto break even?
d. Next month Exclusive Billiards has orders for eight tables. Another order for two tables isreceived. What is the absolute lowest price Exclusive Billiards should accept for the twoadditional tables?
56 Chapter 2
7 J Pappas and M Hirschey, Managerial Economics, 6th ed. (Chicago: Dryden Press, 1990).
Q2–17 How do fixed costs enter the pricing decision?ConceptQuestion
zim36725_ch02_022-088.qxd 12/15/09 11:38 AM Page 56
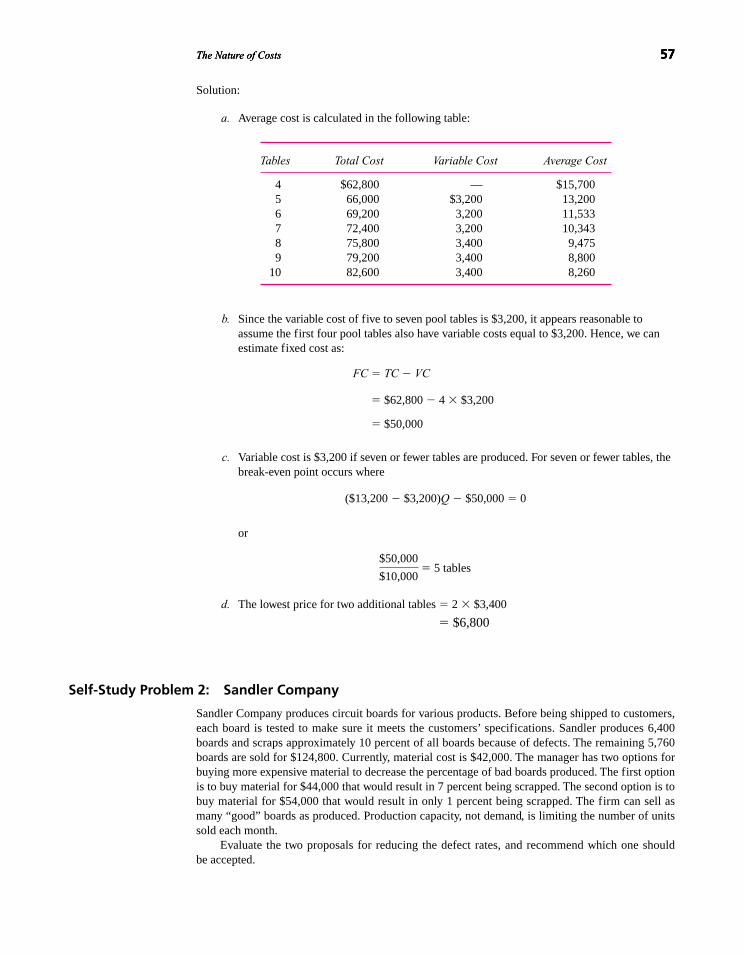
The Nature of Costs 57The Nature of Costs 57The Nature of Costs 57
Solution:
a. Average cost is calculated in the following table:
Tables Total Cost Variable Cost Average Cost
4 $62,800 — $15,7005 66,000 $3,200 13,2006 69,200 3,200 11,5337 72,400 3,200 10,3438 75,800 3,400 9,4759 79,200 3,400 8,800
10 82,600 3,400 8,260
b. Since the variable cost of five to seven pool tables is $3,200, it appears reasonable toassume the first four pool tables also have variable costs equal to $3,200. Hence, we canestimate fixed cost as:
FC � TC � VC
� $62,800 � 4 � $3,200
� $50,000
c. Variable cost is $3,200 if seven or fewer tables are produced. For seven or fewer tables, thebreak-even point occurs where
($13,200 � $3,200)Q � $50,000 � 0
or
d. The lowest price for two additional tables � 2 � $3,400
� $6,800
Self-Study Problem 2: Sandler Company
Sandler Company produces circuit boards for various products. Before being shipped to customers,each board is tested to make sure it meets the customers’ specifications. Sandler produces 6,400boards and scraps approximately 10 percent of all boards because of defects. The remaining 5,760boards are sold for $124,800. Currently, material cost is $42,000. The manager has two options forbuying more expensive material to decrease the percentage of bad boards produced. The first optionis to buy material for $44,000 that would result in 7 percent being scrapped. The second option is tobuy material for $54,000 that would result in only 1 percent being scrapped. The firm can sell asmany “good” boards as produced. Production capacity, not demand, is limiting the number of unitssold each month.
Evaluate the two proposals for reducing the defect rates, and recommend which one shouldbe accepted.
$50,000
$10,000� 5 tables
zim36725_ch02_022-088.qxd 12/15/09 11:38 AM Page 57
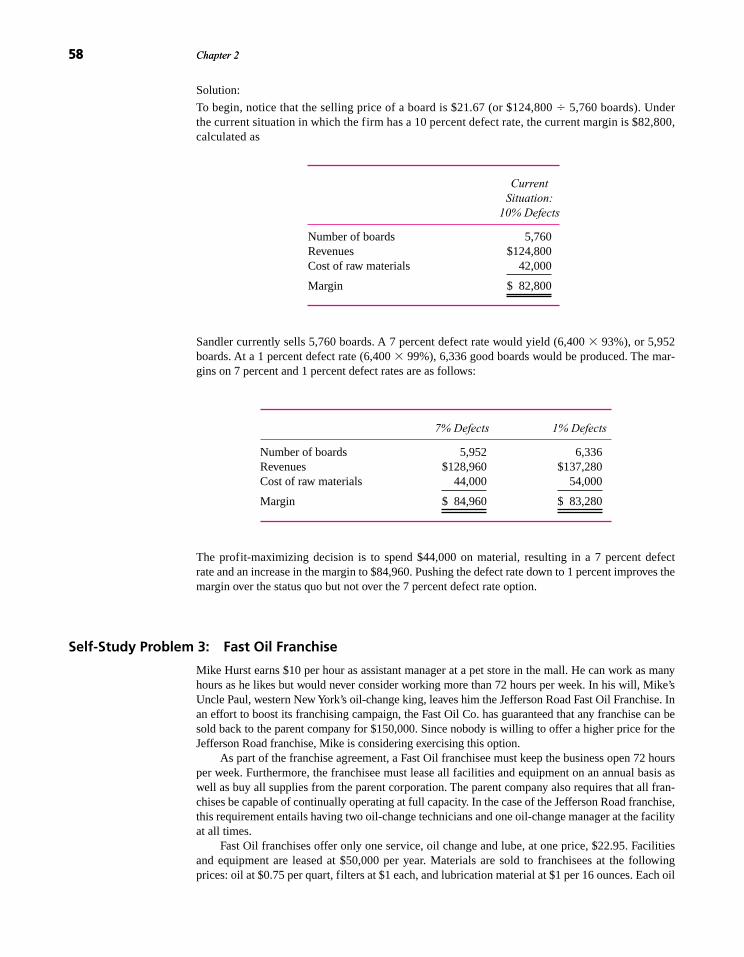
58 Chapter 2
Solution:
To begin, notice that the selling price of a board is $21.67 (or $124,800 � 5,760 boards). Underthe current situation in which the firm has a 10 percent defect rate, the current margin is $82,800,calculated as
Current Situation:
10% Defects
Number of boards 5,760Revenues $124,800Cost of raw materials 42,000
Margin $ 82,800
Sandler currently sells 5,760 boards. A 7 percent defect rate would yield (6,400 � 93%), or 5,952boards. At a 1 percent defect rate (6,400 � 99%), 6,336 good boards would be produced. The mar-gins on 7 percent and 1 percent defect rates are as follows:
7% Defects 1% Defects
Number of boards 5,952 6,336Revenues $128,960 $137,280Cost of raw materials 44,000 54,000
Margin $ 84,960 $ 83,280
The profit-maximizing decision is to spend $44,000 on material, resulting in a 7 percent defectrate and an increase in the margin to $84,960. Pushing the defect rate down to 1 percent improves themargin over the status quo but not over the 7 percent defect rate option.
Self-Study Problem 3: Fast Oil Franchise
Mike Hurst earns $10 per hour as assistant manager at a pet store in the mall. He can work as manyhours as he likes but would never consider working more than 72 hours per week. In his will, Mike’sUncle Paul, western New York’s oil-change king, leaves him the Jefferson Road Fast Oil Franchise. Inan effort to boost its franchising campaign, the Fast Oil Co. has guaranteed that any franchise can besold back to the parent company for $150,000. Since nobody is willing to offer a higher price for theJefferson Road franchise, Mike is considering exercising this option.
As part of the franchise agreement, a Fast Oil franchisee must keep the business open 72 hoursper week. Furthermore, the franchisee must lease all facilities and equipment on an annual basis aswell as buy all supplies from the parent corporation. The parent company also requires that all fran-chises be capable of continually operating at full capacity. In the case of the Jefferson Road franchise,this requirement entails having two oil-change technicians and one oil-change manager at the facilityat all times.
Fast Oil franchises offer only one service, oil change and lube, at one price, $22.95. Facilitiesand equipment are leased at $50,000 per year. Materials are sold to franchisees at the followingprices: oil at $0.75 per quart, filters at $1 each, and lubrication material at $1 per 16 ounces. Each oil
58 Chapter 2
zim36725_ch02_022-088.qxd 12/15/09 11:38 AM Page 58
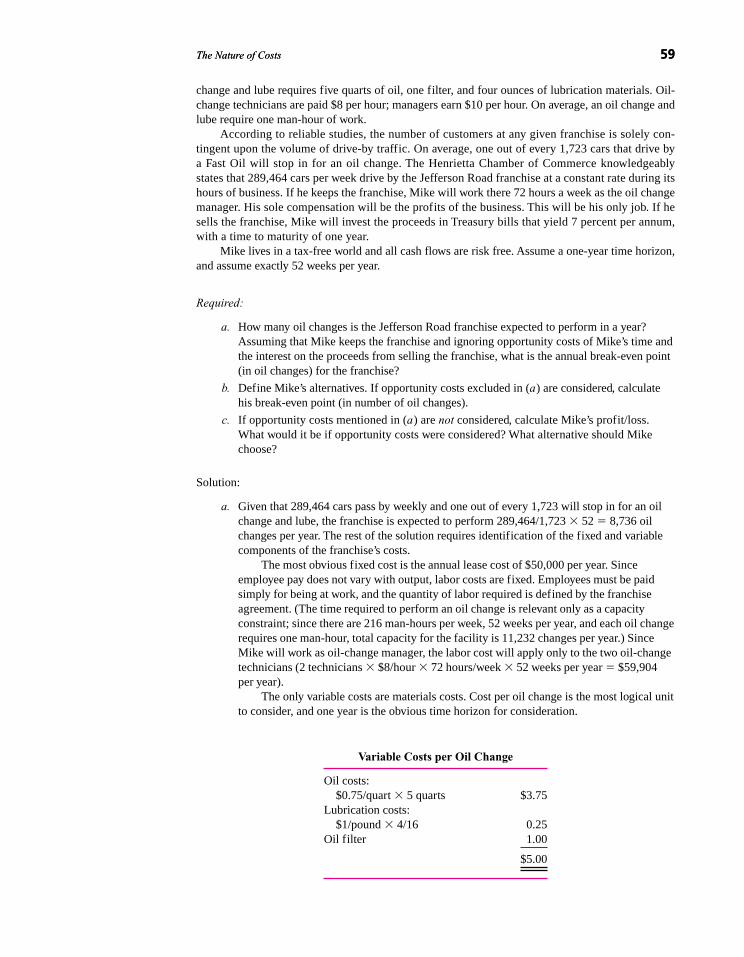
The Nature of Costs 59The Nature of Costs 59
change and lube requires five quarts of oil, one filter, and four ounces of lubrication materials. Oil-change technicians are paid $8 per hour; managers earn $10 per hour. On average, an oil change andlube require one man-hour of work.
According to reliable studies, the number of customers at any given franchise is solely con-tingent upon the volume of drive-by traffic. On average, one out of every 1,723 cars that drive bya Fast Oil will stop in for an oil change. The Henrietta Chamber of Commerce knowledgeablystates that 289,464 cars per week drive by the Jefferson Road franchise at a constant rate during itshours of business. If he keeps the franchise, Mike will work there 72 hours a week as the oil changemanager. His sole compensation will be the profits of the business. This will be his only job. If hesells the franchise, Mike will invest the proceeds in Treasury bills that yield 7 percent per annum,with a time to maturity of one year.
Mike lives in a tax-free world and all cash flows are risk free. Assume a one-year time horizon,and assume exactly 52 weeks per year.
Required:
a. How many oil changes is the Jefferson Road franchise expected to perform in a year?Assuming that Mike keeps the franchise and ignoring opportunity costs of Mike’s time andthe interest on the proceeds from selling the franchise, what is the annual break-even point(in oil changes) for the franchise?
b. Define Mike’s alternatives. If opportunity costs excluded in (a) are considered, calculatehis break-even point (in number of oil changes).
c. If opportunity costs mentioned in (a) are not considered, calculate Mike’s profit/loss.What would it be if opportunity costs were considered? What alternative should Mikechoose?
Solution:
a. Given that 289,464 cars pass by weekly and one out of every 1,723 will stop in for an oilchange and lube, the franchise is expected to perform 289,464/1,723 � 52 � 8,736 oilchanges per year. The rest of the solution requires identification of the fixed and variablecomponents of the franchise’s costs.
The most obvious fixed cost is the annual lease cost of $50,000 per year. Sinceemployee pay does not vary with output, labor costs are fixed. Employees must be paidsimply for being at work, and the quantity of labor required is defined by the franchiseagreement. (The time required to perform an oil change is relevant only as a capacityconstraint; since there are 216 man-hours per week, 52 weeks per year, and each oil changerequires one man-hour, total capacity for the facility is 11,232 changes per year.) SinceMike will work as oil-change manager, the labor cost will apply only to the two oil-changetechnicians (2 technicians � $8/hour � 72 hours/week � 52 weeks per year � $59,904per year).
The only variable costs are materials costs. Cost per oil change is the most logical unitto consider, and one year is the obvious time horizon for consideration.
Variable Costs per Oil Change
Oil costs:$0.75/quart � 5 quarts $3.75
Lubrication costs:$1/pound � 4/16 0.25
Oil filter 1.00
$5.00
zim36725_ch02_022-088.qxd 12/15/09 11:38 AM Page 59

60 Chapter 2
The price of an oil change is $22.95. The accompanying table summarizes the break-evenanalysis:
Fixed costs (annual)Lease $50,000Technicians 59,904
Total fixed costs $109,904� Contribution margin (per unit)Price $ 22.95Variable cost 5.00
Contribution margin per unit $ 17.95
Break-even (in oil changes) 6,123
b. Opportunity costs are defined as “the benefits forgone from actions that are precluded bythe alternative selected.” To assess the opportunity costs of a particular action, the set ofmutually exclusive opportunities must be considered. Mike faces two choices:
• Quit his present job, work as oil-change manager, and keep the profits of the franchise.
• Keep his present job, sell the franchise to the parent company, and invest the proceeds inTreasury bills.
If Mike keeps the franchise, the following benefits are forgone:
• Income from the pet store job and value of free time given up. Mike earns $10 per hour.Therefore, the annual opportunity cost of the time he gives up to work at the oil-changefranchise is $10 � 72 � 52 � $37,440 per year.
• Income lost from not selling the franchise and investing in Treasury bills. At 7 percentper year, $150,000 would provide income of $10,500.
The total opportunity cost of keeping the franchise is:
Opportunity cost of Mike’s time $37,440Investment proceeds from sale of franchise 10,500
$47,940
This cost should be considered a fixed cost, bringing break-even volume to 8,794 oilchanges [($109,904 � $47,940) � $17.95].
c. Ignoring Mike’s opportunity costs, annual fixed costs for the business are covered at the6,123rd oil change. The franchise “profit,” therefore, is the contribution margin of alladditional oil changes done during the year. For Mike, the profit is (8,736 � 6,123) �$17.95 � $46,907. Since $46,907 is far more than Mike could earn at the pet store, hemight be tempted to keep and operate the oil-change franchise. However, when opportunitycosts are considered, it would be better for Mike to sell the franchise back to the parentcompany. Since his opportunity costs are $47,940, Mike would in reality lose $1,033 bykeeping the franchise.
This analysis ignores a number of additional factors that Mike should consider beforemaking a final decision:
• How much growth is likely to occur in the oil-change business?
• What is the likelihood of losing the pet store job?
60 Chapter 2
zim36725_ch02_022-088.qxd 12/15/09 11:38 AM Page 60
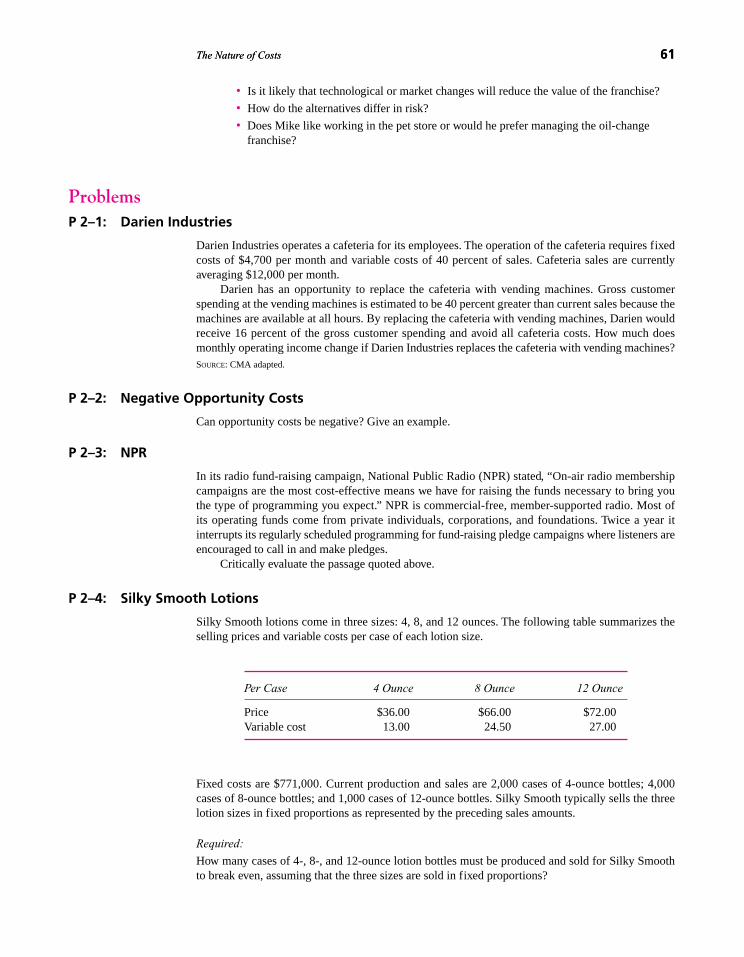
The Nature of Costs 61The Nature of Costs 61
• Is it likely that technological or market changes will reduce the value of the franchise?
• How do the alternatives differ in risk?
• Does Mike like working in the pet store or would he prefer managing the oil-changefranchise?
ProblemsP 2–1: Darien Industries
Darien Industries operates a cafeteria for its employees. The operation of the cafeteria requires fixedcosts of $4,700 per month and variable costs of 40 percent of sales. Cafeteria sales are currentlyaveraging $12,000 per month.
Darien has an opportunity to replace the cafeteria with vending machines. Gross customerspending at the vending machines is estimated to be 40 percent greater than current sales because themachines are available at all hours. By replacing the cafeteria with vending machines, Darien wouldreceive 16 percent of the gross customer spending and avoid all cafeteria costs. How much doesmonthly operating income change if Darien Industries replaces the cafeteria with vending machines?SOURCE: CMA adapted.
P 2–2: Negative Opportunity Costs
Can opportunity costs be negative? Give an example.
P 2–3: NPR
In its radio fund-raising campaign, National Public Radio (NPR) stated, “On-air radio membershipcampaigns are the most cost-effective means we have for raising the funds necessary to bring youthe type of programming you expect.” NPR is commercial-free, member-supported radio. Most ofits operating funds come from private individuals, corporations, and foundations. Twice a year itinterrupts its regularly scheduled programming for fund-raising pledge campaigns where listeners areencouraged to call in and make pledges.
Critically evaluate the passage quoted above.
P 2–4: Silky Smooth Lotions
Silky Smooth lotions come in three sizes: 4, 8, and 12 ounces. The following table summarizes theselling prices and variable costs per case of each lotion size.
Per Case 4 Ounce 8 Ounce 12 Ounce
Price $36.00 $66.00 $72.00Variable cost 13.00 24.50 27.00
Fixed costs are $771,000. Current production and sales are 2,000 cases of 4-ounce bottles; 4,000cases of 8-ounce bottles; and 1,000 cases of 12-ounce bottles. Silky Smooth typically sells the threelotion sizes in fixed proportions as represented by the preceding sales amounts.
Required:
How many cases of 4-, 8-, and 12-ounce lotion bottles must be produced and sold for Silky Smoothto break even, assuming that the three sizes are sold in fixed proportions?
zim36725_ch02_022-088.qxd 12/15/09 11:38 AM Page 61

62 Chapter 262 Chapter 2
P 2–5: J.P. Max Department Stores
J.P. Max is a department store carrying a large and varied stock of merchandise. Management is con-sidering leasing part of its floor space for $72 per square foot per year to an outside jewelry companythat would sell merchandise. Two areas currently in use are being considered: home appliances (1,000square feet) and televisions (1,200 square feet). These departments had annual profits of $64,000 forappliances and $82,000 for televisions after allocated fixed occupancy costs of $7 per square footwere deducted. Allocated fixed occupancy costs include property taxes, mortgage interest, insurance,and exterior maintenance for the department store.
Required:
Considering all the relevant factors, which department should be leased and why?
P 2–6: Bidwell Company
Data for the Bidwell Company are as follows:
Sales (100,000 units) $1,000,000
Costs Fixed VariableRaw material $ 0 $300,000Direct labor 0 200,000Factory costs 100,000 150,000Selling and administrative costs 110,000 50,000
Total costs $210,000 $700,000 910,000
Operating income $ 90,000
Required:
a. Based on the preceding data, calculate break-even sales in units.
b. If Bidwell Company is subject to an effective income tax rate of 40 percent, calculate thenumber of units Bidwell would have to sell to earn an after-tax profit of $90,000.
c. If fixed costs increase $31,500 with no other cost or revenue factors changing, calculatethe break-even sales in units.
SOURCE: CMA adapted.
P 2–7: Vintage Cellars
Vintage Cellars manufactures a 1,000-bottle wine storage system that maintains optimum temperature(55–57 °F) and humidity (50–80 percent) for aging wines. The system has a backup battery for powerfailures and can store red and white wines at different temperatures. The following table depicts howaverage cost varies with the number of units manufactured and sold (per month):
Quantity Average Cost
1 $12,0002 10,0003 8,6004 7,7005 7,1006 7,1007 7,3508 7,8509 8,600
10 9,600
zim36725_ch02_022-088.qxd 12/15/09 11:38 AM Page 62

The Nature of Costs 63The Nature of Costs 63
Required:
a. Prepare a table that computes the total cost and marginal cost for each quantity between 1and 10 units.
b. What is the relation between average cost and marginal cost?
c. What is the opportunity cost of producing one more unit if the company is currentlyproducing and selling four units?
d. Vintage Cellars sells the units for $9,000 each. This price does not vary with the number ofunits sold. How many units should Vintage manufacture and sell each month?
P 2–8: Sunnybrook Farms
Sunnybrook Farms is a local grocery store that is currently open only Monday through Saturday.Sunnybrook is considering opening on Sundays. The annual incremental costs of Sunday openingsare estimated at $24,960. Sunnybrook Farms’ gross margin on sales is 20 percent. Sunnybrookestimates that 60 percent of its potential Sunday sales to customers are now made on other days.What one-day volume of Sunday sales would be necessary for Sunnybrook Farms to attain the sameweekly operating income as in the current six-day week?SOURCE: CMA adapted.
P 2–9: Taylor Chemicals
Taylor Chemicals produces a particular chemical at a fixed cost of $1,000 per day. The following tabledisplays how marginal cost varies with output (in cases):
Quantity (Cases) Marginal Cost
1 $5002 4003 3254 2755 3256 4007 5008 6259 775
10 950
Required:
a. Given the preceding data, construct a table that reports total cost and average cost atvarious output levels from 1 to 10 cases.
b. At what quantity is average cost minimized?
c. Does marginal cost always intersect average cost at minimum average cost? Why?
P 2–10: Emrich Processing
Emrich Processing is a small custom stainless steel parts processor. Customers send new and usedstainless steel parts to Emrich for cleaning in various acid baths to remove small imperfections orfilms on the surface. These parts are used in a variety of applications, ranging from nuclear reactorsto chemical and medical applications. Depending on the foreign substance to be removed, Emrichchooses the acid bath mixture and process.
Such chemical cleaning operations require highly skilled technicians to handle the dangerousacids. Environmental Protection Agency (EPA) and Occupational Safety and Health Administration
zim36725_ch02_022-088.qxd 12/15/09 11:38 AM Page 63

64 Chapter 2
(OSHA) regulations are closely followed. Once the part is treated in the proper chemical bath usingother chemicals, a benign waste solution results that can be disposed of via the city sewer system.
On May 12, Emrich ordered a 50-gallon drum of a specialty acid known as GX-100 for use in aMay 15 job. It used 25 of the 50 gallons in the drum. The 50 gallons cost $1,000. GX-100 has a shelflife of 30 days after the drum is opened before it becomes unstable and must be discarded. Becauseof the hazardous nature of GX-100 and the other chemicals Emrich uses, Emrich works closely withEnviron Disposal, a company specializing in the disposal of hazardous wastes. At the time of order-ing the GX-100, Emrich anticipated no other orders in the May–June time period that could use theremaining 25 gallons of GX-100. Knowing it would have 25 gallons remaining, it built $1,000 intothe cost of the job to cover the cost of the GX-100 plus an additional $400 to cover the cost of havingEnviron dispose of the remaining 25 gallons.
On June 1, a customer called and asked for a price bid for a rush job to be completed on June 5.This job will use 25 gallons of GX-100. Emrich is preparing to bid on this order. What cost amountfor the GX-100 must be considered in preparing the bid? Justify your answer.
P 2–11: Gas Prices
After the Iraqi invasion of Kuwait in August 1990, the world price of crude oil doubled to more than$30 per barrel in anticipation of reduced supply. Immediately, the oil companies raised the retail priceon refined oil products even though these products were produced from oil purchased at the earlier,lower prices. The media charged the oil companies with profiteering and price gouging, and politi-cians promised immediate investigations.
Required:
Critically evaluate the charge that the oil companies profited from the Iraqi invasion. What advicewould you offer the oil companies?
P 2–12: Penury Company
You are a new consultant with the Boston Group and have been sent to advise the executives ofPenury Company. The company recently acquired product line L from an out-of-state concern andnow plans to produce it, along with its old standby K, under one roof in a newly renovated facility.Management is quite proud of the acquisition, contending that the larger size and related cost savingswill make the company far more profitable. The planned results of a month’s operations, based onmanagement’s best estimates of the maximum product demanded at today’s selling prices are
Line K Line LCombined
Amount Per Unit Amount Per Unit Amount
Sales revenue $120,000 $1.20 $80,000 $0.80 $200,000Variable expense 60,000 0.60 60,000 0.60 120,000
Contribution margin $ 60,000 $0.60 $20,000 $0.20 80,000
Fixed expense 50,000
Net income $ 30,000
Required:
a. Based on historical operations, K alone incurred fixed expenses of $40,000, and L aloneincurred fixed expenses of $20,000. Find the break-even point in sales dollars and unitsfor each product separately.
zim36725_ch02_022-088.qxd 12/15/09 11:38 AM Page 64

The Nature of Costs 65
b. Give reasons why the fixed costs for the two products combined are expected to be lessthan the sum of the fixed costs of each product line operating as a separate business.
c. Assuming that for each unit of K sold, one unit of L is sold, find the break-even point insales dollars and units for each product.
SOURCE: Kenneth Gartrell.
P 2–13: Volume and Profits
Assuming the firm sells everything it produces and assuming that variable cost per unit does notchange with volume, total profits are higher as volume increases because fixed costs are spread overmore units.
Required:
a. True or false?
b. Explain your answer in part (a).
P 2–14: American Cinema
American Cinema shows first-run movies. It pays the company distributing the movies a fixed fee of $1,000per week plus a percentage of the gross box office receipts. In the first two weeks a movie is released, thetheater pays the fixed fee of $1,000 per week plus 90 percent of gross box office receipts to the distributor.If the theater keeps the movie for weeks 3 and 4, the theater pays the distributor $1,000 per week plus 80 per-cent of its gross box office receipts received during those two weeks. American Cinema charges $6.50 perticket for all movies, including those shown for two weeks and those shown for four weeks.
American Cinema must decide what movies to show and for how many weeks to show eachmovie (either two weeks only or four weeks) before the movie is released. For most movies, the au-dience demand is higher in the first two weeks than in the next two weeks.
American Cinema is evaluating two similar situation comedies. The first one, Paris Is for Lovers,is scheduled for release on October 1. The second comedy, I Do, is scheduled for release on October 14.American Cinema has decided to rent Paris Is for Lovers but must decide whether to run it for fourweeks or to run it for two weeks and then replace it with I Do. Based on all the information about thestars in the movie, production costs, and prerelease publicity, management expects the two movies willhave the same demand in the first two weeks and will have the same (lower) demand in weeks 3 and 4.
Required:
a. The only movie being released on October 14 is I Do. How should management go aboutdeciding whether to rent Paris for four weeks or to rent it for two weeks and then replace itwith I Do? In other words, provide American Cinema management with a decision-makingrule to use in choosing between renting Paris for four weeks or just two weeks. AmericanCinema’s tax rate is zero. Be sure to justify your advice with clearly described analysis.
b. How does your answer in part (a) change if American Cinema’s income tax rate is 30 percent?
c. American Cinema’s average movie patron purchases soda, popcorn, and candy that yieldsprofits of $2 after supplies and labor. How does profit on these concession items affectyour answer to part (a)? (Ignore taxes.)
P 2–15: Home Auto Parts
Home Auto Parts is a large retail auto parts store selling the full range of auto parts and supplies fordo-it-yourself auto repair enthusiasts. The store is arranged with three prime displays in the store:front door, checkout counters, and ends of aisles. These display areas receive the most customer traf-fic and contain special stands that display the merchandise with attractive eye-catching designs. Eachdisplay area is set up at the beginning of the week and runs for one week. Three items are schedulednext week for special display areas: Texcan Oil, windshield wiper blades, and floor mats. The ac-companying table provides information for the three promotional areas scheduled to run next week:
zim36725_ch02_022-088.qxd 12/15/09 11:38 AM Page 65

66 Chapter 2
Planned Displays for Next Week
Ends of CheckoutAisles Front Door Counter
Item Texcan Oil Wiper blades Floor matsSales price 69¢/can $9.99 $22.99Projected weekly volume 5,000 200 70Unit cost 62¢ $7.99 $17.49
Based on past experience, management finds that virtually all display-area sales are made byimpulse buyers. The display items are extra purchases by consumers attracted by the exhibits.
Before the store manager sets up the display areas, the distributor for Armadillo car wax visitsthe store. She says her firm wants its car wax in one of the three display areas and is prepared to of-fer the product at a unit cost of $2.50. At a retail price of $2.90, management expects to sell 800 unitsduring the week if the wax is on special display.
Required:
a. Home Auto has not yet purchased any of the promotion items for next week. Shouldmanagement substitute the Armadillo car wax for one of the three planned promotiondisplays? If so, which one?
b. A common practice in retailing is for the manufacturer to give free units to a retail storeto secure desirable promotion space or shelf space. The Armadillo distributor decides tosweeten the offer by giving Home Auto 50 free units of car wax if it places the Armadillowax on display. Does this change your answer to part (a)?
P 2–16: Measer Enterprises
Measer Enterprises produces standardized telephone keypads and operates in a highly competitivemarket in which the keypads are sold for $4.50 each. Because of the nature of the production tech-nology, the firm can produce only between 10,000 and 13,000 units per month, in fixed incrementsof 1,000 units. Measer has the following cost structure:
Production and Cost Data
Units Produced
10,000 11,000 12,000 13,000
Factory cost, variable $37,000 $40,800 $44,600 $48,400Factory cost, fixed 9,000 9,000 9,000 9,000Selling cost, variable 6,000 6,600 7,400 8,200Administration, fixed 6,000 6,000 6,000 6,000
Total $58,000 $62,400 $67,000 $71,600
Average unit cost $5.80 $5.67 $5.58 $5.51
Required:
At what output level should the firm operate?
zim36725_ch02_022-088.qxd 12/15/09 11:38 AM Page 66

The Nature of Costs 67
P 2–17: Affording a Hybrid
With gasoline prices at $3.00 per gallon, consumers are flocking to purchase hybrid vehicles (com-bination of gasoline and electric motors) that get 50 miles per gallon of gasoline. The monthly pay-ment on a three-year lease of a hybrid is $499 compared to $399 per month on a conventional,equivalent traditional gasoline car that gets 25 miles per gallon. Both vehicles require a one-time$1,500 payment for taxes, license, and dealer charges. Both vehicles have identical lease terms for theresidual value, maximum number of miles allowed without penalty, and so forth.
Required:
a. Calculate how many miles the consumer must drive per year to make the hybrid theeconomical choice over the conventional gasoline-only vehicle.
b. How does your answer to part (a) change if the price of gasoline is $4.00 per gallon?
P 2–18: Fast Photo
Fast Photo operates four film developing labs in upstate New York. The four labs are identical: Theyemploy the same production technology, process the same mix of films, and buy raw materials fromthe same companies at the same prices. Wage rates are also the same at the four plants. In reviewingoperating results for November, the newly hired assistant controller, Matt Paige, became quite con-fused over the numbers:
Plant A Plant B Plant C Plant D
Number of rolls processed 50,000 55,000 60,000 65,000Revenue ($000s) $500 $550 $600 $650Less:
Variable costs (195) (242) (298) (352)Fixed costs (300) (300) (300) (300)
Profit (loss) $ 5 $ 8 $ 2 $ (2)
Upon further study, Matt learned that each plant had fixed overhead of $300,000. Matt remem-bered from his managerial accounting class that as volume increases, average fixed cost per unit falls.Because Plant D had much lower average fixed costs per roll than Plants A and B, Matt expectedPlant D to be more profitable than Plants A and B. But the numbers show just the opposite. Write aconcise but clear memo to Matt that will resolve his confusion.
P 2–19: MedView
The MedView brochure said, “Only 45 scans per month to cover the monthly equipment rental of$18,000.”* The footnote at the bottom of the brochure read: *“Assumes a reimbursable fee of $475per scan.”
The MedView brochure refers to a new radiology imaging system that MedView rents for $18,000per month. A “scan” refers to one imaging session that is billed at $475 per scan. Each scan involvesgiving the patient a chemical injection and requires exposing and developing an X-ray negative.
Required:
a. What variable cost per scan is MedView assuming in calculating the 45-scans-per-monthamount?
b. Is the MedView brochure really telling the whole financial picture? What is it omitting?
zim36725_ch02_022-088.qxd 12/15/09 11:38 AM Page 67

68 Chapter 2
P 2–20: Manufacturing Cost Classification
A company makes DVD players and incurs a variety of different costs. Place a check in the appropri-ate column if the cost is a product cost or a period cost. Further, classify each product cost as directmaterials, direct labor, or manufacturing overhead.
Period Product Direct Direct Cost Cost Labor Materials Overhead
Advertising expenses for DVD
Depreciation on PCs in marketing dept.
Fire insurance on corporate headquarters
Fire insurance on plant
Leather carrying case for the DVD
Motor drive (externally sourced)
Overtime premium paid assembly workers
Factory building maintenance department
Factory security guards
Plastic case for the DVD
Property taxes paid on corporate headquarters
Salaries of public relations staff
Salary of corporate controller
Wages of engineers in quality control
Wages paid assembly line employees
Wages paid employees in finished goods warehouse
P 2–21: Australian Shipping
In the 1800s Australia was a colony of England and most of its trade was with England. Australia pri-marily exported agricultural products such as wheat and imported manufactured goods such as steel,machinery, and textiles. The volume of trade measured in British pounds (£) was roughly equal in thesense that exports equaled imports. (Imports were slightly larger as there were net positive invest-ments being made in Australia.) However, in cubic feet of cargo being shipped, exports to Englandexceeded imports. A British pound (£) of wheat required more cubic feet than £1 of manufacturedgoods. Hence, an imbalance of shipping existed. Numerous ships would carry agricultural productsto England but return to Australia empty because no cargo of manufactured goods existed.
Large sail-powered ships required substantial ballast (weight) in the hold to keep the ship sail-ing properly, especially in rough seas. Before leaving England empty, the ships would purchase stonefrom local quarries for ballast. However, once in Australia, the stone had no market value, and in facthad to be hauled from the harbor area.
Consider the following facts for a particular ship in England with a shipment of Australian cargofor England.
1. The ship has contracted to sail to Australia and return with a cargo of Australian wheat.The ship has no cargo scheduled for London to Sydney.
zim36725_ch02_022-088.qxd 12/15/09 11:38 AM Page 68

The Nature of Costs 69
2. The wheat-shipping contract calls for paying the captain and crew £4,900 for theround trip. The wheat seller will arrange for and pay Australian dock hands £250 toload the wheat in Sydney, and the wheat purchaser will arrange for and pay Englishdock hands to unload the wheat in London. The ship’s crew does not load or unloadthe cargo.
3. To sail to Australia, the ship requires 10 tons of ballast. (1 ton � 2,000 pounds)
4. Stone can be quarried in England, transported to the docks, and loaded as ballast for £40 per ton. In Sydney, the stone can be unloaded and hauled away for £15 per ton.
5. Wrought iron bars of 10-foot lengths can also be used as ship ballast. Wrought iron barscan be purchased in England at £1.20 per bar. Each bar weighs 20 pounds. Wrought ironbars sell for £0.90 per bar in Sydney. The cost of loading the wrought iron in London is£15 per ton, and the cost of unloading it and transporting it to the Sydney market is £10 per ton.
Required:
a. Write a memo to the ship’s captain describing what actions he should take with respect tousing stone or wrought iron as ballast. Assume that interest rates are zero and all prices andquantities are known with certainty. Support your recommendation with a clearly labeledfinancial analysis.
b. Why do you think the price of wrought iron is lower in Sydney than in London?
P 2–22: iGen3
The Xerox DocuColor iGen3 digital production press is a high volume, on-demand, full-color printercapable of producing up to 6,000 impressions (pages) per hour. It weighs nearly 3 tons, stretches30 feet long, and holds more than 40 pounds of dry ink. It sells for over $500,000, and its principalmarket is print shops that produce mail order catalogs (e.g., L.L. Bean). Xerox offers two leasingoptions for the iGen3. Option A requires a three-year agreement with a monthly lease fee of $10,000plus $0.01 per impression. Option B (also a three-year agreement) does not include a monthly leasefee but requires a charge of $0.03 per impression.
ColorGrafix is a print shop considering leasing the iGen3 to begin producing customized mail-order catalogs. Besides leasing the iGen3, ColorGrafix estimates that it will have to buy ink for theiGen3 at a cost of $0.02 per impression and hire an operator to run the iGen3 to produce the cus-tomized catalogs at a cost of $5,000 per month. ColorGrafix estimates that it can charge $0.08 perimpression for customized color catalogs. (Note: the customer provides the paper stock on whichthe color impressions are printed.)
Required:
a. If ColorGrafix leases the iGen3 and chooses Option A, how many impressions per monthwill ColorGrafix have to sell and produce to break even?
b. If ColorGrafix leases the iGen3 and chooses Option B, how many impressions per monthwill ColorGrafix have to sell and produce to break even?
c. Should ColorGrafix choose Option A or Option B? Explain why.
d. ColorGrafix is a fairly new firm (only three years old) and has a substantial amount of debtthat was used to help start the company. ColorGrafix has positive net cash flow afterservicing the debt, but the owners of ColorGrafix have not felt it wise to withdraw anycash from the business since its inception, except for their salaries. ColorGrafix expects tosell and produce 520,000 impressions per month. Which lease option would yourecommend ColorGrafix choose? Explain why.
zim36725_ch02_022-088.qxd 12/15/09 11:38 AM Page 69

70 Chapter 2
P 2–23: Adapt, Inc.
You work for the strategy group of Adapt Inc., a firm that designs and manufactures memory cardsfor digital cameras. Your task is to gather intelligence about Adapt’s key competitor, DigiMem, a pri-vately held company. Your boss has asked you to estimate DigiMem’s fixed costs. Industry sources,such as trade associations, provide the following information on DigiMem:
Last Fiscal DigiMem Year
Revenues (millions) $6.200Net income after taxes (millions) $1.700Income tax rate 40%Operating margin* 70%
*Ratio of revenues less variable costs divided by revenues.
Required:
a. Using the preceding data, estimate DigiMem’s annual fixed costs.
b. Why might your boss be interested in knowing DigiMem’s fixed costs?
P 2–24: Exotic Roses
Exotic Roses, owned by Margarita Rameriz, provides a variety of rare rose bushes to local nurseriesthat sell Rameriz’s roses to the end consumer (landscapers and retail customers). Rameriz grows theroses from cuttings that she has specifically cultivated for their unusual characteristics (color, size,heartiness, and resistance to disease). Margarita’s roses are in great demand as evidenced by thewholesale price she charges nurseries, $15 per potted plant. Exotic Roses has the following cost struc-ture (variable costs are per potted plant):
Fixed Costs Variableper Year Costs
Plant materials $0.50Pot 0.30Labor $8,000 0.70Utilities 9,000Rent 7,500Other costs 2,500
Required:
a. How many potted rose plants must Exotic Roses sell each year to break even?
b. If Rameriz wants to make profits of $10,000 before taxes per year, how many potted roseplants must be sold?
c. If Rameriz wants to make profits of $10,000 after taxes per year, how many potted roseplants must be sold assuming a 35 percent income tax rate?
P 2–25: Oppenheimer Visuals
Oppenheimer Visuals manufactures state-of-the-art flat-panel plasma display screens that large com-puter companies like Dell and Gateway assemble into flat-panel monitors. Oppenheimer producesjust the display panels, not any of the electronics, cases, or stands needed to make a complete unit. It
zim36725_ch02_022-088.qxd 12/15/09 11:38 AM Page 70

The Nature of Costs 71
is about to launch a new product employing TN polarized glass with a unique microscopic groovepattern. Two different technologies exist that can produce the unique groove pattern. One technologyhas a fixed cost of $34,000 per day and a variable cost of $200 per panel. The second technology hasa fixed cost of $16,000 per day and a variable cost of $400 per panel. The fixed costs of the two tech-nologies consist entirely of three-year leases for equipment to produce the panels. Both technologiesare equally reliable and produce panels of equal quality. The only difference between the two tech-nologies is their cost structures.
Because Oppenheimer holds a patent on the new YN polarized glass flat-panel displays, it hassome market power and expects to sell the new display panels to computer companies based on thefollowing demand schedule:
Price per QuantityDisplay Panel (per Day)
$760 60740 65720 70700 75680 80660 85640 90620 95600 100580 105560 110
In other words, if Oppenheimer sets the price per panel at $760, it expects to sell 60 panels per day.If it sets the price at $560, it expects to sell 110 panels per day.
Required:
a. To maximize firm value, should Oppenheimer Visuals choose technology 1 or technology 2to manufacture the new flat-panel display?
b. Given the technology choice you made in part (a), what price should Oppenheimer chargefor the new flat-panel display?
c. Using Oppenheimer Visuals as an example, explain what is meant by the often usedexpression, “All costs are variable in the long run.”
P 2–26: Eastern University Parking
Eastern University faces a shortage of parking spaces and charges for parking. For nearby parking (e.g.,behind the business school), faculty and staff pay $180 per year. Parking in lots Z and B, which are northand south of the campus and involve about a 10-minute walk to the business school, costs $124 per year.In setting these prices, the university seeks to recover the costs of parking and to manage the queue ofpeople wishing to park on campus. The current $180 and $124 fees cover the costs of surface spaces.Lots Z and B have lower fees to compensate people for the longer walks and to encourage them to parkin outlying lots. University officials say this fee structure, when multiplied by the number of parkingstickers of each type sold, covers the cost of running the parking office and building new spaces.
The cost of providing a parking space consists of costs of construction of the space, maintenance,and security. The construction cost is the annual amount required to repay the cost of grading, draining,and asphalting the space. Maintenance includes snow removal, line painting, fixing the gates after thearms are broken by irate faculty members searching for a space, and patching the asphalt. Security costsinclude all costs of the parking officers who ticket the cars of staff and students parked illegally.
zim36725_ch02_022-088.qxd 12/15/09 11:38 AM Page 71

72 Chapter 2
The university recently evaluated a proposal to construct an enclosed, multifloor parking facil-ity. Design estimates place the construction cost at $12,000 per enclosed space. The equivalent costof a surface space is $900. The university uses a 10 percent cost of capital. (Assume that this is an ap-propriate interest rate.) To compensate the university for the cost of the capital involved in buildingparking garages, parking fees would have to be at least $1,200 per space per year, as opposed to $90per space per year for the surface space. Because the university does not believe that faculty, staff, andstudents are willing to pay over $1,200 per year for a covered parking space, no plans exist to build aparking building.
Required:
Critically evaluate Eastern University’s costing of parking permits. What do you think accounts forthe university administration’s reluctance to build a parking garage?
P 2–27: William Company
William Company owns and operates a nationwide chain of movie theaters. The 500 properties in theWilliam chain vary from low-volume, small-town, single-screen theaters to high-volume, big-city,multiscreen theaters.
The management is considering installing machines that will make popcorn on the premises.These machines would allow the theaters to sell freshly popped popcorn rather than prepopped cornthat is currently purchased in large bags. This new feature would be advertised and is intended toincrease patronage at the company’s theaters.
Annual rental costs and operating costs vary with the size of the machines. The machine capac-ities and costs are as follows:
Economy Regular Super
Annual capacity (boxes) 50,000 120,000 300,000Costs
Annual machine rental $8,000 $11,000 $20,000Popcorn cost per box 13¢ 13¢ 13¢Other costs per box 22¢ 14¢ 05¢Cost of each box 08¢ 08¢ 08¢
Required:
a. Calculate the volume level in boxes at which the economy popper and regular popperwould earn the same profit (loss).
b. Management can estimate the number of boxes to be sold at each of its theaters. Present adecision rule that would enable William’s management to select the most profitablemachine without having to make a separate cost calculation for each theater.
c. Could management use the average number of boxes sold per seat for the entire chain andthe capacity of each theater to develop this decision rule? Explain your answer.
SOURCE: CMA adapted.
P 2–28: Mastich Counters
Mastich Counters manufactures a material used to fabricate kitchen counters. It is a very durable,high-fashion, and expensive product that is installed in luxury homes. The manufacturing process iscomplicated and requires highly skilled employees, supervisors, and engineers. Mastich employs 450people in its manufacturing operation. Most of the production employees are cross-functionallytrained to perform several manufacturing tasks.
The firm’s vacation policy gives employees three hours of paid vacation for every week of work.An employee who works 52 weeks accrues 156 hours or 3.9 weeks (156 � 40) of paid vacation. In thepast, Mastich allowed employees unlimited accumulation of vacation time. Some long-time employees
zim36725_ch02_022-088.qxd 12/15/09 11:38 AM Page 72
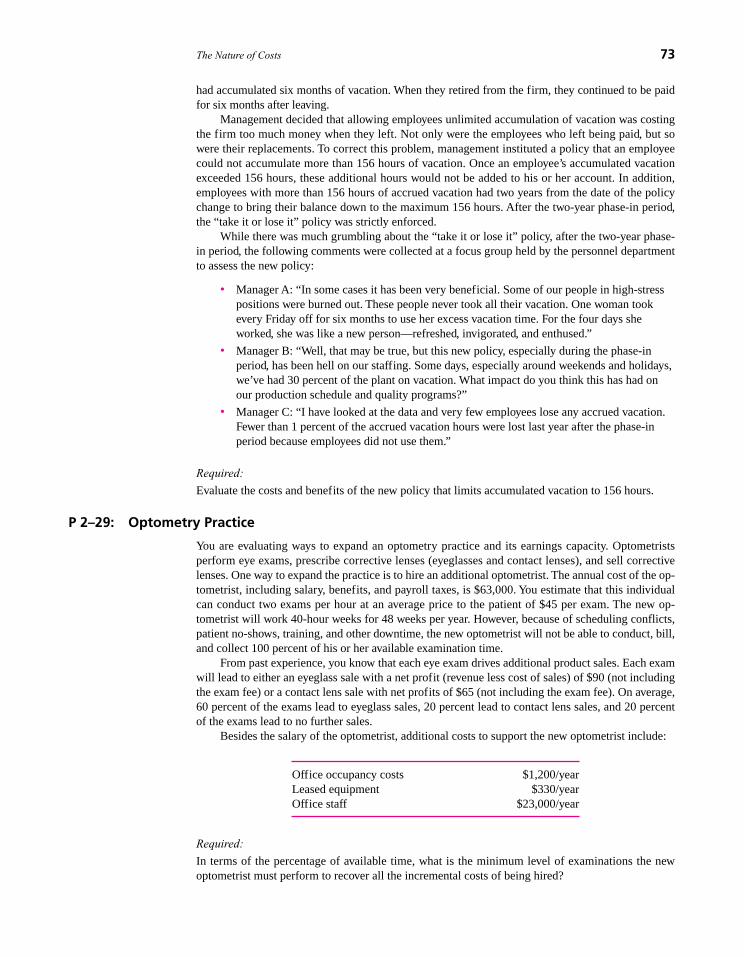
The Nature of Costs 73
had accumulated six months of vacation. When they retired from the firm, they continued to be paidfor six months after leaving.
Management decided that allowing employees unlimited accumulation of vacation was costingthe firm too much money when they left. Not only were the employees who left being paid, but sowere their replacements. To correct this problem, management instituted a policy that an employeecould not accumulate more than 156 hours of vacation. Once an employee’s accumulated vacationexceeded 156 hours, these additional hours would not be added to his or her account. In addition,employees with more than 156 hours of accrued vacation had two years from the date of the policychange to bring their balance down to the maximum 156 hours. After the two-year phase-in period,the “take it or lose it” policy was strictly enforced.
While there was much grumbling about the “take it or lose it” policy, after the two-year phase-in period, the following comments were collected at a focus group held by the personnel departmentto assess the new policy:
• Manager A: “In some cases it has been very beneficial. Some of our people in high-stresspositions were burned out. These people never took all their vacation. One woman tookevery Friday off for six months to use her excess vacation time. For the four days sheworked, she was like a new person—refreshed, invigorated, and enthused.”
• Manager B: “Well, that may be true, but this new policy, especially during the phase-inperiod, has been hell on our staffing. Some days, especially around weekends and holidays,we’ve had 30 percent of the plant on vacation. What impact do you think this has had onour production schedule and quality programs?”
• Manager C: “I have looked at the data and very few employees lose any accrued vacation.Fewer than 1 percent of the accrued vacation hours were lost last year after the phase-inperiod because employees did not use them.”
Required:
Evaluate the costs and benefits of the new policy that limits accumulated vacation to 156 hours.
P 2–29: Optometry Practice
You are evaluating ways to expand an optometry practice and its earnings capacity. Optometristsperform eye exams, prescribe corrective lenses (eyeglasses and contact lenses), and sell correctivelenses. One way to expand the practice is to hire an additional optometrist. The annual cost of the op-tometrist, including salary, benefits, and payroll taxes, is $63,000. You estimate that this individualcan conduct two exams per hour at an average price to the patient of $45 per exam. The new op-tometrist will work 40-hour weeks for 48 weeks per year. However, because of scheduling conflicts,patient no-shows, training, and other downtime, the new optometrist will not be able to conduct, bill,and collect 100 percent of his or her available examination time.
From past experience, you know that each eye exam drives additional product sales. Each examwill lead to either an eyeglass sale with a net profit (revenue less cost of sales) of $90 (not includingthe exam fee) or a contact lens sale with net profits of $65 (not including the exam fee). On average,60 percent of the exams lead to eyeglass sales, 20 percent lead to contact lens sales, and 20 percentof the exams lead to no further sales.
Besides the salary of the optometrist, additional costs to support the new optometrist include:
Office occupancy costs $1,200/yearLeased equipment $330/yearOffice staff $23,000/year
Required:
In terms of the percentage of available time, what is the minimum level of examinations the newoptometrist must perform to recover all the incremental costs of being hired?
zim36725_ch02_022-088.qxd 12/15/09 11:38 AM Page 73

74 Chapter 2
P 2–30: JLE Electronics
JLE Electronics is an independent contract manufacturer of complex printed circuit board assemblies.Computer companies and other electronics firms engage JLE to assemble their boards. Utilizingcomputer-controlled manufacturing and test machinery and equipment, JLE provides manufacturingservices employing surface mount technology (SMT) and pin-through-hole (PTH) interconnectiontechnologies. The customer purchases the subcomponents and pays JLE a per-board fee to assemblethe components.
JLE has a new one-of-a-kind, state-of-the-art board assembly line. The line can be operated20 hours per day, seven days a week, in each three-week (21-day) period. Four customers have asked thattheir boards be manufactured on this line over the next three-week period. The following table summa-rizes the number of units of each board requested, the price JLE will charge for each board, JLE’s vari-able and fixed cost per board, and the number of assembly line minutes each board requires. Fixed costper board is the allocated cost of property taxes, fire insurance, accounting, depreciation, and so forth.
Customers
A B C D
Number of boards requested 2,500 2,300 1,800 1,400Price $38 $42 $45 $50Variable cost/board* 23 25 27 30Fixed cost/board 9 10 10 15Number of machine minutes/board 3 4 5 6
*Allocated based on both machine minutes and direct labor cost.
Make the following assumptions:
• The four customer orders can be produced only on the new JLE line.
• If JLE rejects an order, future orders from that customer are not affected.
• There is no setup or downtime between orders.
• Customers are willing to have any number of boards produced by JLE up to the number ofunits specified above. For example, customer A has requested 2,500 boards in the 21-dayperiod, but would accept a smaller number.
• The four customers comprise the entire set of potential customers who would want to usethe new JLE line in the next 21-day period.
Required:
Which customer orders should be accepted? In other words, complete the following table:
Customers
A B C D
Number of boards requested to be produced in the next 21 days 2,500 2,300 1,800 1,400
Number of boards scheduled to be produced in the next 21 days ? ? ? ?
P 2–31: News.com
News.com is a Web site that offers users access to current national and international news stories.News.com does not charge users a fee for accessing the site, but rather charges advertisers $0.05 perhit to the Web site. A “hit” is a user that logs on the Web site.
zim36725_ch02_022-088.qxd 12/15/09 11:38 AM Page 74

The Nature of Costs 75
News.com is considering two alternate ISPs that will link News.com’s computer system to theWorld Wide Web—NetCom and Globalink. These firms are identical in access speeds and the num-ber of users able to connect to the site per minute. Both ISPs are equally reliable. NetCom proposesto charge $3,000 per month plus $0.01 per hit to News.com. Globalink proposes to charge $2,000per month plus $0.02 per hit. Assume that the only costs News.com incurs are the access fees chargedby the ISP.
Required:
a. Calculate the number of hits to its Web site needed to break even if News.com usesNetCom.
b. Calculate the number of hits to its Web site needed to break even if News.com usesGlobalink.
c. Which ISP do you recommend that News.com use? Explain why.
d. Monthly demand (in number of hits) for News.com is expected to be either 50,000 if theeconomy is slumping or 150,000 if the economy is booming, each equally probable. WhichISP should News.com choose and why?
P 2–32: Kinsley & Sons
Kinsley & Sons is a large, successful direct-mail catalog company in the highly competitive marketfor upscale men’s conservative business and business-casual dress wear. On sales of $185 millionthey had earnings of $13 million. Most of the sales are from customers receiving the Kinsley cata-log and placing orders through a toll-free (1-800) phone line. The remainder of their sales are fromthe www.kinsley&sons.com Web site, where customers place orders directly. Kinsley is organizedinto four departments: buying, catalog sales, Web sales, and distribution. Prices and margins arethe same for catalog and Web sales.
The Web sales department is considering a major advertising and marketing campaign to driveadditional sales to the Web site. Kinsley’s market demographics, affluent professional males be-tween 25 and 45, are very active Web buyers. The Web sales department expects the campaign togenerate $56 million of additional Web site sales and profits of $4 million (before including thecosts of the campaign). The annual cost of the advertising and marketing campaign is $2.8 million.The campaign also will have a favorable spillover effect on catalog sales through the 1-800 tele-phone line because the marketing for the Kinsley Web site will prompt additional catalog pur-chases. Additional profits of $600,000 are expected from catalog purchases resulting from the Webcampaign.
In reviewing the proposal, the manager of catalog sales predicts that half of the additional Websales and profits will come at the expense of catalog sales. That is, about $28 million of additionalWeb sales and $2 million of profits will come from Kinsley’s existing catalog customers. Assume thatall the data presented above are accurate, unbiased estimates.
Required:
a. Should Kinsley & Sons undertake the additional advertising and marketing campaign forits Web site? Support your conclusion with data and/or figures.
b. What critical/important assumptions underlie your recommendation in part (a)?
P 2–33: Littleton Imaging
Dr. Na Gu plans to open a radiology office that provides CAT scans. She can lease the CAT scannerfor $1,200 per month plus $45 for each imaging session. In addition to the $45 lease cost per imag-ing session, Dr. Gu must purchase film for each session at a cost of $55. She plans to charge $250 foreach session. Dr. Gu has identified a suitable office that she can rent for $1,400 per month. Themonthly cost of a receptionist is $2,400 and two radiology technicians are $3,200 each per month.Office furnishings, phones, and office equipment cost $600 per month. She expects that her salarywill be $15,000 per month.
zim36725_ch02_022-088.qxd 12/15/09 11:38 AM Page 75

76 Chapter 2
Required:
a. How many imaging sessions per month must Littleton Imaging conduct in order for theoffice to break even?
b. How many imaging sessions per month must Littleton Imaging conduct in order for theoffice to yield an after-tax profit of $5,000 if the tax rate is 40 percent?
c. Dr. Gu expects that the office will perform 200 imaging sessions per month. How muchmust she charge per session to break even?
P 2–34: Candice Company
Candice Company has decided to introduce a new product that can be manufactured by either of twomethods. The manufacturing method will not affect the quality of the product. The estimated manu-facturing costs of the two methods are as follows:
Method A Method B
Raw materials $5.00 $5.60Direct labor 6.00 7.20Variable overhead 3.00 4.80Directly traceable incremental fixed
manufacturing costs per year $2,440,000 $1,320,000
Candice’s market research department has recommended an introductory unit sales price of $30.The incremental selling expenses are estimated to be $500,000 annually plus $2 for each unit sold,regardless of manufacturing method.
Required:
a. Calculate the estimated break-even point in annual unit sales of the new product if CandiceCo. uses
(i) Manufacturing method A.
(ii) Manufacturing method B.
b. Which production technology should the firm use and why?SOURCE: CMA adapted.
P 2–35: Mat Machinery
Mat Machinery has received an order from Dewey Sales Corp. for special machinery. Dewey paysMat Machinery a deposit of 10 percent of the sales price for the order. Just before the order is com-pleted, Dewey Sales Corp. declares bankruptcy. Details of the transaction from Mat’s records showthe following:
Sale price $80,000Cost incurred:
Direct materials 15,000Direct labor 25,000Overhead applied
Variable 12,500Fixed 6,250Fixed administration costs 5,875
zim36725_ch02_022-088.qxd 12/15/09 11:38 AM Page 76

The Nature of Costs 77
Raytell Corp. offers to buy the machinery for $68,000 if it is reworked to its specifications.Additional costs for reworking are
Materials—$5,000 Labor—$6,000
A second alternative is to convert the machine to a standard model, which has a list price of$64,500. Converting the machine will require additional labor of $2,000 and materials of $6,500.
The third alternative is to sell the machine as-is for $55,000, net of discount. For commissionpurposes, this is treated as-a “standard” model.
Sales commissions are 2 percent on special orders and 1 percent on standard models. Raytell isconsidered a special order. All sales commissions are calculated on sales price, net of discount. A dis-count of 2 percent of the sales price is given on standard models.
Application rates for manufacturing overhead on all work, including rework and conversion, are
Variable 50 percent of direct labor cost
Fixed 25 percent of direct labor cost
Administration overheads are
Fixed 10 percent of direct labor, materials, and manufacturing overhead
Required:
Which of the three alternatives should be chosen?
P 2–36: Cost Behavior Patterns
For each of the following questions draw a graph that depicts how costs vary with volume. Com-pletely label each graph and axis.
a. Plant XXX works a 40-hour week. Management can vary the number of employees.Currently, 200 employees are being paid $10 per hour. The plant is near capacity. Toincrease output, a second 40-hour shift is being considered. To attract employees to thesecond shift, a 20 percent wage premium will be offered. Plot total labor costs as afunction of labor hours per week.
b. Plant YYY has a contract with the Texas Gas Company to purchase up to 150 million cubicfeet of natural gas per month for a flat fee of $1.5 million. Additional gas can be purchasedfor $0.0175 per cubic foot. Plant YYY manufactures aluminum cans. One thousand cansrequire 10 cubic feet of gas. Plot total gas costs as a function of can production.
c. Use the same facts as in (b), but plot the gas cost per can as a function of can production.
P 2–37: Royal Holland Line
Royal Holland is a cruise ship company. It currently has six ships and plans to add two more. It offersluxury passenger cruises in the Caribbean, Alaska, and the Far East. Management is currently ad-dressing what to do with an existing ship, the S.S. Amsterdam, when she is replaced by a new ship.
The S.S. Amsterdam was built 20 years ago for $100 million. For accounting purposes, she wasassumed to have a 20-year life and hence is now fully depreciated. To replace the S.S. Amsterdamwould cost $500 million, but her current market value is $371,250,000. The Holland Line can borrowor lend money at 10 percent.
The S.S. Amsterdam is now sailing the Caribbean and will be replaced next year by a new ship.The S.S. Amsterdam might be moved to the Mediterranean for a new seven-day Greek island tour.A seven-day cruise would depart Athens Sunday night, stop at four ports before returning to AthensSunday morning, and prepare for a new cruise that afternoon. The S.S. Amsterdam can carry asmany as 1,500 passengers. The accompanying data summarize the operating cost for this seven-daycruise.
zim36725_ch02_022-088.qxd 12/15/09 11:38 AM Page 77

78 Chapter 2
Estimated Operating Cost of Seven-Day Greek Island Cruise(S.S. Amsterdam)
Variable Cost* Fixed Cost†
Labor $ 60,000 $ 80,000Food 236,000 10,500Fuel 177,000Port fees and services 62,000Marketing, advertising, promotion 240,000Supplies 28,000 38,000
Totals $324,000 $607,500
*Based on 1,200 passengers.†Fixed costs per weekly cruise. Assume there are 50 weeks (and hence 50 cruises) in a year.
Required:
a. Assuming the seven-day Greek island cruise can be priced at an average of $1,620,calculate the break-even number of passengers per cruise using the data provided.
b. What major cost component is not included in management’s estimates?
c. If you were to include the omitted cost component identified in (b), recalculate the break-even point for the S.S. Amsterdam’s Greek island cruise.
d. Passengers purchase beverages, souvenirs, and services while on the ship. The ship makesmoney on the purchases. If the ship line has a margin of 50 percent on all such on-boardpurchases, how much would the average passenger have to purchase for the break-evenpoint to be 900 passengers?
P 2–38: Roberts Machining
Roberts Machining specializes in fabricating metal racks that hold electronic equipment such astelephone switching units, power supplies, and so forth. Roberts designs and produces the metalstamping dies used to fabricate the racks. It is currently fabricating several racks for GTE. A newrack, the 1160, is scheduled to begin production. The die used to fabricate this rack cost Roberts$49,000 to design and build. This die was completed last week, and production of the 1160 isscheduled to begin next week. Rack 1160 is a specialized custom product only for GTE. GTE andRoberts have a one-year contract whereby Roberts agrees to manufacture and GTE agrees to pur-chase a fixed number of 1160 racks over the next 12 months for a fixed price per rack. The 1160rack will not be produced beyond one year. This contract generates profits of $358,000 (after de-ducting the die’s cost of $49,000). Roberts’s accounting system recorded all expenditures for the1160 die as a fixed asset with a one-year life. If this die is scrapped today or in one year’s time, ithas a scrap value of $6,800.
Easton, another metal fabricator, has offered to buy the 1160 die from Roberts for $588,000 andwill supply 1160 racks to GTE. GTE has agreed to this supplier substitution. Roberts estimates thatif it sells the 1160 tools and dies to Easton, it will lose a current cash equivalent of $192,000 of futureprofits that would have been generated from GTE and similar customers, but now this business willgo to Easton. (Ignore all tax effects.)
Required:
a. List all the alternatives in Roberts’s opportunity set with respect to the 1160 die.
b. Calculate the net cash flows associated with each alternative in Roberts’s opportunity setlisted in part (a).
c. What is the opportunity cost of each alternative in the opportunity set listed in part (a)?
d. What action should Roberts take with respect to the 1160 die?
zim36725_ch02_022-088.qxd 12/15/09 11:38 AM Page 78

The Nature of Costs 79
P 2–39: Doral Rentals
Amos Doral owns a small store that rents punchbowls, dishes, silverware, glassware, tables, andchairs to people having large parties. Amos runs the business by himself. He is considering addingpower spray painters to his inventory of rentable items. A power spray painter is an electric air com-pressor and a paint sprayer used to paint or stain houses. Amos can lease the sprayers for $27 perweek from a supplier. Amos expects he can rent the units for $38 per week. After each rental, Amoshas to clean the sprayers with a solvent that costs $2 in materials per sprayer cleaned. Each customeris required to give Amos a credit card number for a deposit in case the sprayer is not returned or isdamaged. Other rental companies report negligible losses due to theft or damage once the sprayeris secured with a credit card. Assume that sprayers are always rented for one-week periods andreturned at the end of the week. (Note: Amos leases the sprayers and then rents them out.)
Required:
a. What fraction of the paint sprayers does Amos have to rent each week in order to break even?
b. Is Amos considering all the relevant factors if he just focuses on the lease cost of $27and the cleaning costs of $2 per unit? What other costs and benefits should he consider inhis analysis?
c. Before Amos signs the lease for the paint sprayers, he does some more research anddiscovers no other rental company in town rents sprayers. He decides to take out a yellowpages ad in the phone book for $25 per week and hire a part-time employee to clean themachines for $40 per week. Amos expects 90 percent of the sprayers can be rented eachweek. How many machines must Amos lease to break even?
d. Being the sole supplier of power spray painters in town, Amos realizes he has market power.After talking to rental companies in other towns, he concludes that the following equationcaptures the relation between the market demand for sprayers rented per week and price:
Rental price per sprayer � $69 � Quantity of sprayers
If Doral rents his sprayers using the above equation, he can rent all the sprayers thathe leases. In other words, if Amos wants to rent 50 sprayers a week, he has to charge$19 per sprayer per week. Using the above price-quantity relation and the previous costinformation ($27 weekly lease, $2 cleaning cost, and $65 per week for advertising andlabor) AND assuming that all the sprayers he leases are rented each week, how many paintsprayers should Amos lease and what price should he charge?
P 2–40: Fuller Aerosols
Fuller Aerosols manufactures six different aerosol can products (room deodorants, hair sprays, furniturepolish, and so forth) on its fill line. The fill line mixes the ingredients, adds the propellant, fills and sealsthe cans, and packs the cans in cases in a continuous production process. These aerosol products arethen sold to distributors. The following table summarizes the weekly operating data for each product.
Fuller AerosolsWeekly Operating Data
AA143 AC747 CD887 FX881 HF324 KY662
Price/case $37 $54 $62 $21 $34 $42Fill time/case (minutes) 3 4 5 2 3 4Fixed cost per product
per week $900 $240 $560 $600 $1,800 $600Cases ordered per week 300 100 50 200 400 200Variable cost/case $28 $50 $48 $17 $28 $40
zim36725_ch02_022-088.qxd 12/15/09 11:38 AM Page 79

80 Chapter 2
Each product has fixed costs that pertain only to that product. If the product is discontinued for theweek, the product’s fixed costs are not incurred that week.
Required:
a. Calculate the break-even volume for each product.
b. Suppose the aerosol fill line can operate only 70 hours per week. Which products shouldbe manufactured?
c. Suppose the aerosol fill line can operate only 50 hours per week. Which products shouldbe manufactured?
P 2–41: Happy Feet
Dr. Lucy Zang, a noted local podiatrist, plans to open a retail shoe store specializing in hard-to-findfootwear for people with feet problems such as bunions, flat feet, mallet toes, diabetic feet, and soforth. Because of the wide variety of foot ailments and shoe sizes needed, Dr. Zang estimates that shewould have to stock a large inventory of shoes, perhaps as much as $1.5 million (at her cost). Shefound a 4,000 square foot store in a popular mall that provides adequate retail space and storage forher inventory. Store improvements including carpeting, lighting, shelving, computer terminals, andso forth, require an additional $0.2 million investment. Initial advertising, hiring expenses, legal fees,and working capital are projected to add another $0.1 million of initial investment. To finance this$1.8 million investment, Dr. Zang and her family will invest $0.4 million and the balance of the $1.4million will be borrowed from a bank.
The mall charges rent of $40 per square foot per year, payable in equal monthly installments,plus 3 percent of her retail sales. So, to rent the 4,000 foot store, the annual rent is $160,000, or$13,333 per month PLUS 3 percent of her sales. Besides the rent, Dr. Zang estimates other monthlyexpenses for labor, utilities, and so on to be $38,000. These expenses will not vary with the amountof shoe sales. She plans to markup the shoes 100 percent, so a pair of shoes she buys wholesale for$110 will be sold at retail for $220. Based on her research, she expects monthly retail sales to be$150,000, but in any given month total sales can be $80,000 or $220,000 with equal probability.
Dr. Zang talks to her local banker and lays out her business plan; the banker tells her the bankwould make a three-year interest-only loan at 10 percent interest, with the principal of $1.4 milliondue in three years (or it could be refinanced). The high interest rate of 10 percent was caused by therather large risk of default due to the substantial fixed costs in the business plan. The banker explainsthat the monthly rent ($13,333), other expenses ($38,000), and interest ($11,667), or $63,000, requirethe shoe store to generate a fairly large minimum level of sales to pay these expenses.
Required:
a. Calculate the amount of sales the Happy Feet store must do each month to breakeven.
b. After calculating the breakeven point in part (a), Dr. Zang still believes that her Happy Feetstore can be commercially successful and provide a valuable service to her patients. Shegoes back to the mall leasing agent and asks if the mall would take a lower fixed monthlyrental amount and a larger percentage fee of her sales. The mall leasing agent (who happensto have sore feet and believes the Happy Feet store will drive new customers to his mall) saysthe mall would accept a rental fee of $1,000 per month plus 12.5 percent of her monthlysales. While Dr. Zang likes the idea of dropping her monthly rent from $13,333 to $1,000,she feels that raising the percentage of sales from 3 percent to 12.5 percent is a bit steep. Butshe goes back to the bank and presents the revised rental agreement. The banker says thebank would lower the annual interest rate from 10 percent to 9 percent if Dr. Zang accepts thenew lease agreement. Both the original lease and the new lease are for three years, and can berenegotiated at the end of the three years. Should Dr. Zang accept the new lease agreement($1,000 per month plus 12.5 percent) or the original lease terms ($13,333 per month plus 3 percent)? Support your recommendation with both a written analysis and a quantitativeanalysis backing up your recommendation. (Hint: First, conduct an analysis comparing thetwo options, using the expected monthly sales of $150,000. Second, conduct an analysiscomparing the two options, using the two extreme sales of $80,000 and $220,000.)
zim36725_ch02_022-088.qxd 12/15/09 11:38 AM Page 80

The Nature of Costs 81
P 2–42: Digital Convert
Digital Convert (DC) is a three-year-old start-up company with most of its capital coming from banksand personal investments by the founders. DC manufactures a high-resolution scanner (MXP35) forprofessional photographers that scans 35-mm negative films and converts them to 30-megapixel dig-ital images. The MXP35 is sold to wholesalers who then sell them to high-end professional photog-raphy stores. At the heart of the MXP35 is a photoelectric light sensor that converts light into digitalpixels. DC currently produces the MXP35 for $480 (variable cost) per unit and incurs virtually nofixed manufacturing costs. All of its equipment is leased, and the leases are structured whereby DConly pays for the actual units produced. DC operates out of a building that is provided free by NewYork State for entrepreneurial start-ups. New York State also pays utilities, taxes, insurance, and ad-ministrative costs. DC does have fixed financing costs to service its existing loans, and these financ-ing costs consume most of its profits from sales of the MXP35.
DC faces the following monthly demand schedule for the MXP35 (where price is the wholesaleprice DC receives):
Quantity Price
19 $1,27820 1,24021 1,20222 1,16423 1,12624 1,08825 1,05026 1,012
(The equation of the demand curve for the above table is: P = $2,000 – 38Q). In other words, if DCwants to sell 20 MXP35s per month, it would charge a wholesale price of $1,240 per unit.
Required:
a. Given DC’s current cost structure of $480 variable cost and zero fixed costs, what is itsprofit-maximizing price-quantity combination for MXP35?
b. DC learns of a new manufacturing process for their photoelectric light sensor that lowersthe variable cost from $480 per unit to $100 per unit. But the equipment must be leased for $7,000 per month for 24 months. If DC leases the new equipment, then over the next24 months DC commits to paying $7,000 each month. If DC installs the new equipment,what is the price-quantity combination that maximizes profits? (Assume the quality andquantity of sensors produced by the existing and new technologies are identical.)
c. Before deciding to adopt the new photoelectric light sensor production technology, DCdoes some further research into its cost of financial distress. While the demand curve DC faces represents its normal demand, random monthly variation can cause demand toshift up or down unexpectedly. Given its existing bank loans, its variable costs of $480 perunit, no fixed manufacturing costs, and its small cash balances, DC faces a 15 percentchance of defaulting on its loans sometime over the next 24 months. If DC defaults on itsloans, the owners of DC estimate the costs of default (legal costs, bank fees, lost sales,and so forth) to be $500,000. With the additional fixed leasing cost of the new sensormanufacturing technology, the owners of DC predict that the likelihood of defaulting on their fixed monthly commitments (bank loans and the $7,000 equipment lease)increases to 25 percent over the next 24 months. Prepare an analysis supporting yourrecommendation as to whether DC should adopt the new sensor manufacturing process or stay with their current manufacturing technology. (To simplify your analysis, assume a zero discount rate.)
zim36725_ch02_022-088.qxd 12/15/09 11:38 AM Page 81

82 Chapter 2
P 2–43: APC Electronics
APC is a contract manufacturer of printed circuit board assemblies that specializes in manufacturingand test engineering support of complex printed circuit boards for companies in the defense and med-ical instruments industries. The assembly process begins with raw printed circuit boards, into whichpreprogrammed robotic machines insert various integrated circuits and other components, and thenthese parts are soldered onto the board. The board is then tested before shipment to the customer.
Four separate assembly lines, each with roughly the same type of equipment, are used to assem-ble the circuit boards. Before running a particular board assembly, the insertion equipment must beloaded with the correct components, and the equipment programmed and tested before production be-gins. Set-up time varies between 3 to 6 hours depending on the complexity of the board being as-sembled. Set-up labor costs APC $40 per hour, and technicians assembling and testing the completedboards cost $28 per hour. Not every assembly line can manufacture every type of board. Some lineshave older insertion and testing equipment inappropriate for more complex assemblies. The assign-ment of boards to assembly lines depends on the number and complexity of the component insertions,the type of soldering to be applied, and the testing required.
Each assembly line has an hourly cost consisting of the accounting depreciation on the equip-ment (straight line) and occupancy costs (factory depreciation, taxes, insurance, and utilities). Occu-pancy costs are fixed with respect to volume changes. Direct labor to set up and test the line as wellas the direct labor to manufacture the complete board assemblies and test each board is tracked sep-arately to each batch of boards. The following table summarizes the costs of operating each line andthe annual number of hours each line is expected to run assembling boards (excluding set-up and test-ing time).
Line I Line II Line III Line IV
Equipment depreciation $ 840,000 $1,300,000 $480,000 $ 950,000Occupancy costs 213,000 261,000 189,000 237,000
Total annual line costs $1,053,000 $1,561,000 $669,000 $1,187,000
Expected hours of operations 1,800 2,200 1,600 2,000
The equipment depreciation cost varies widely across the two lines because some of the lines (espe-cially Line III) have older machines, some of which are fully depreciated.
Required:
a. Calculate the hourly cost of operating each of the four lines.
b. One of APC’s customers, Healthtronics, has requested a special order for one of its boardsAPC currently builds. Healthtronics needs 150 boards by next week. These boards have tobe run on Line I because that is the only one with the specialized soldering capabilityneeded for these boards. Healthtronics will ship APC the raw boards and components to beinserted, so APC will not have to buy any of the parts. Set-up time is expected to be fourhours, and run time for these boards is expected to be 30 hours. Three technicians, eachworking 30 hours, are needed to staff Line I while the Healthtronics boards are beingassembled and tested. Healthtronics splits the production of this particular board betweenAPC and another contract manufacturer. So, if APC refuses this special offer, the customerwill take the work to the other manufacturer. APC does not expect refusing this order toadversely affect Healthtronics’ demand for future APC work. If APC accepts the specialorder, the line will be set up next Monday during the day. The job will start Mondayafternoon and be finished by Wednesday. Sixteen of the 30 hours of run time will beduring an evening shift when the technicians are paid time and a half, or $42 an hour
zim36725_ch02_022-088.qxd 12/15/09 11:38 AM Page 82

The Nature of Costs 83
($28 � 1.5). Calculate the cost APC will record as cost of goods sold when it ships thespecial order to Healthtronics.
c. Assume that accepting this special order from Healthtronics does not adversely affect thedelivery schedules of any of APC’s other customers. What is APC’s out-of-pocket cashflow of accepting this Healthtronics special order?
d. Instead of assuming no other APC customers’ deliveries are affected by accepting thespecial order from Healthtronics as in part (c), assume that another APC customer,SonarTech, will be affected. SonarTech’s boards are currently running on Line I. They willhave to be pulled from the line (two hours of tear-down time using set-up technicians tounload the automatic parts feeders and return the parts to the storeroom), and Line I willhave to be set up and tested as described in part (b). Healthtronics boards are run as in part (b). Then on Wednesday, six hours of set-up time is needed to unload the remainingHealthtronics parts and reload and retest the SonarTech parts. To partially catch up on theSonarTech job, 14 hours of line run time that would have been done during the day isshifted to the evening, when the four technicians needed to run the SonarTech boards arepaid time and a half ($42 per hour). Instead of shipping all the SonarTech boards in oneshipment, two overnight shipments will be made—the first occurring when the first half isproduced, and the second batch when the order is completed, costing an additional $2,300of freight. SonarTech is willing to have their boards delayed a few days as long as they canreceive the boards in two overnight shipments. But SonarTech is unwilling to pay theadditional freight. What is the opportunity cost of accepting the Healthtronics specialorder?
P 2–44: Amy’s Boards
Amy Laura is opening a snowboard rental store. She rents snowboards for skiing on a weekly basisfor $75 per week including the boots. The skiing season is 20 weeks long. Laura can buy a snowboardand boots for $550, rent them for a season, and sell them for $250 at the end of the season.
The store rent is $7,200 per year. During the off-season, Laura sublets the store for $1,600.Salaries, advertising, and office expenses are $26,000 per year.
On average, 80 percent of the boards in any given week are rented. After each rental, the boardsmust be resurfaced and the boots deodorized. Labor (not included in the $26,000) and materials toprepare the board and boots to be rerented cost $7.
Required:
a. How many boards must Laura purchase in order to break even?
b. Suppose that Laura purchases 50 boards. What profit does she expect?
c. Laura purchases 50 boards. What fraction of her boards must she rent each week to breakeven (including covering the cost of the boards)?
d. Explain why the percentage utilization you calculated in part (c ) differs from the expectedrental rate of 80 percent.
P 2–45: Blue Sage Mountain
Blue Sage Mountain produces hinged snowboards. The price charged affects the quantity sold. Thefollowing equation captures the relation between price and quantity each month:
Selling price � $530 � .2 � Quantity sold
In other words, if they wish to sell 500 boards a month, the price must be $430 ($530 � .2 � 500).Fixed costs of producing the boards are $70,000 a month and the variable costs per board are $90.
Required:
a. Prepare a table with quantities between 100 and 2,000 boards in increments of 100 thatcalculates the price, total revenue, total costs, and profits for each quantity-price combination.
zim36725_ch02_022-088.qxd 12/15/09 11:38 AM Page 83

84 Chapter 2
b. Determine the profit-maximizing quantity-price combination.
c. Fixed costs fall from $70,000 a month to $50,000 a month. Should Blue Sage change itspricing decision?
d. Variable costs fall from $90 per unit to $50 per unit. Should Blue Sage change its pricingdecision?
P 2–46: Gold Mountain Ski Resort
You work for a venture capitalist and have been asked to analyze a proposal from a group of investorsinterested in building a new ski area in Colorado, the Gold Mountain Ski Resort. The demand for ski-ing is growing. Existing ski resorts have raised prices and reported record profits for the last two sea-sons. Gold Mountain’s business strategy is to offer the ultimate ski experience—short lift lines,uncongested ski slopes, and spectacular scenery. With a 2,500-foot vertical drop, 10 trails, and a singletriple (three-person) ski lift, it can provide a very uncongested ski resort. The planned triple-personski lift delivers a chair every 20 seconds, 180 chairs per hour (3 chairs per minute � 60 minutes perhour), or 540 skiers per hour (180 chairs per hour � 3 skiers per chair). This puts an average of only54 skiers per hour on each of the 10 trails. Some trails will be more popular than others, but thisaverage number of skiers per trail per hour is still below industry average.
The cost to build the ski runs, parking lots, and buildings and to erect the chair lift is $52 mil-lion. To raise this amount of capital requires an annual financing cost (debt service and dividends) of$8.3 million. The annual fixed operating cost (land lease, utilities, labor, taxes, insurance) of the skiresort is projected to be $4.1 million. For each 100 skiers per day, additional employees must be hiredto staff the ticket office, ski patrol, parking lots, and so forth. The daily cost of the additional labor is$200 per 100 skiers per day.
The typical skier makes two ski runs per day (uses the lift twice). Ski resorts operate their lifts8 hours per day, 120 days per year. Gold Mountain plans to sell one-day lift tickets for $60 per skierper day; no season passes will be offered.
Required:
a. Write a memo to the venture capital partner in charge of this account recommending oneof three actions: aggressively pursue this investment, gather more information, or rejectimmediately. Justify your recommendation with a concise, well-reasoned, fact-based analysis.
b. After completing your analysis in (a), but before you submit it to your boss, GoldMountain informs you that it is changing the triple-person chair lift to a four-person chairlift. This new chair will add an additional $75,000 per year to the annual financing cost,bringing the annual financing cost to $8.375 million. But instead of being able to lift 540skiers per hour, the new chair can lift 720 skiers per hour. How do these new facts alteryour conclusion in (a)?
CasesCase 2–1: Old Turkey Mash
Old Turkey Mash is a whiskey manufactured by distilling grains and corn and then aging the mixturefor five years in 50-gallon oak barrels. Distilling requires about a week and aging takes place in care-fully controlled warehouses. Before it ages, the whiskey is too bitter to be consumed. Aging mellowsthe brew (and ultimately the consumer). The cost of the product prior to aging is $100 per barrel(direct plus indirect costs of distilling). In the aging process, each barrel must be inspected monthlyand any leaks repaired. Every six months the barrels are rotated and sampled for quality. Costs ofdirect labor and materials in the aging process (excluding the cost of oak barrels) amount to $50 perbarrel per year (all variable). As the whiskey ages, evaporation and leakage cause each 50-gallonbarrel to produce only 40 gallons of bottled whiskey. New oak barrels cost $75 each and cannotbe reused. After aging, they are cut in half and sold for flowerpots. The revenues generated from salesof the pots just cover the costs of disposing of the used barrels. As soon as the whiskey is aged fiveyears, it is bottled and sold to wholesalers.
zim36725_ch02_022-088.qxd 12/15/09 11:38 AM Page 84

The Nature of Costs 85
While domestic consumption of whiskey is falling, an aggressive international marketing cam-paign has opened up new international markets. The firm is in the third year of a five-year campaignto double production. Because it takes five years to increase production (an additional barrel ofmash produced today does not emerge from the aging process for five years), the firm is adding100,000 gallons of distilled product each year. Prior to the expansion, 500,000 distilled gallons wereproduced each year. Distilled output is being increased 100,000 gallons a year for five years until itreaches 1 million gallons. Distilled output is currently 800,000 gallons and is projected to rise to900,000 gallons next year. The accompanying table describes production, sales, and inventory in theaging process.
Base Year Year 1 Year 2 Year 3
Production (distilled gallons) 500,000 600,000 700,000 800,000Aged gallons sold 400,000 400,000 400,000 400,000
Warehouse Inventory at Beginning of Year
4-year-old bbls 10,000 10,000 10,000 10,0003-year-old bbls 10,000 10,000 10,000 10,0002-year-old bbls 10,000 10,000 10,000 12,0001-year-old bbls 10,000 10,000 12,000 14,000New bbls added 10,000 12,000 14,000 16,000
Total bbls to be aged in year 50,000 52,000 56,000 62,000
(bbls � barrels)
Warehousing rental costs to age the base-year production of 10,000 barrels per year are $1 mil-lion per year. Additional warehouse rental cost of $40,000 per year must be incurred to age eachadditional 20,000 barrels (100,000 distilled gallons). All costs incurred in warehousing are treatedas handling or carrying costs and are written off when incurred. Bottled Old Turkey is sold todistributors for $15 per gallon. These income statements summarize the firm’s current operatingperformance:
Base Year Year 1 Year 2 Year 3
Revenues $6,000,000 $6,000,000 $6,000,000 $6,000,000Less:
Cost of goods sold:10,000 bbls @ $100/ bbl 1,000,000 1,000,000 1,000,000 1,000,000
Oak barrels 750,000 900,000 1,050,000 1,200,000Warehouse rental 1,000,000 1,040,000 1,120,000 1,240,000Warehouse direct costs 2,500,000 2,600,000 2,800,000 3,100,000
Net income (loss)before taxes $ 750,000 $ 460,000 $ 30,000 $ (540,000)
Income taxes (30%) 225,000 138,000 9,000 (162,000)
Net income after taxes $ 525,000 $ 322,000 $ 21,000 $ (378,000)
Management is quite concerned about the loss that is projected for the third year of the expan-sion (the current year). The president has scheduled a meeting with the local bank to review the firm’scurrent financial performance. This bank has been lending the firm the capital to finance theproduction expansion.
zim36725_ch02_022-088.qxd 12/15/09 11:38 AM Page 85

86 Chapter 2
Required:
a. Instead of writing off all the warehousing and oak barrel costs, prepare revised incomestatements for years 1 through 3, treating the warehousing and barrel costs as productcosts.
b. Which set of income statements (those given or the ones you prepared) should thepresident show the bank at the meeting? Justify your answer.
Case 2–2: Mowerson Division
The Mowerson Division of Brown Instruments manufactures testing equipment for the automobileindustry. Mowerson’s equipment is installed in several places along an automobile assembly line forcomponent testing and is also used for recording and measurement purposes during track and roadtests. Mowerson’s sales have grown steadily, and revenue will exceed $200 million for the first timein 2001.
Mowerson designs and manufactures its own printed circuit boards (PCBs) for use in the testequipment. The PCBs are manually assembled in the Assembly Department, which employs 45 tech-nicians. Because of a lack of plant capacity and a shortage of skilled labor, Mowerson is consideringhaving the printed circuit boards manufactured by Tri-Star, a specialist in this field. Quality controlrestrictions and vendor requirements dictate that all PCBs be either manufactured by Mowerson orcontracted to an outside vendor. The per-board cost of outside manufacture is higher than the in-housecost; however, management thinks that savings could also be realized from this change.
Jim Wright, a recently hired cost analyst, has been asked to prepare a financial analysis of theoutside manufacturing proposal. Wright’s report includes the assumptions he used in his analysis,along with his recommendation. His financial analysis appears next, and his notes and assumptionsfollow the analysis.
Required:
a. Discuss whether Jim Wright should have analyzed only the costs and savings thatMowerson will realize in 2002.
b. For each of the 10 items listed in Wright’s financial analysis, indicate whether
(i) The item is appropriate or inappropriate for inclusion in the report. If the item isinappropriate, explain why it should not be included in the report.
(ii) The amount is correct or incorrect. If the amount is incorrect, state what the correctamount is.
c. What additional information about Tri-Star would be helpful to Mowerson in evaluatingits manufacturing decision?
Annual Cost Savings Analysis for Tri-Star Contract
Savings1. Reduction in assembly technicians
($28,500 � 40) $1,140,0002. Assembly supervisor transferred 35,0003. Floor space savings
[(1,000 � $9.50) � (8,000 � $6.00)] 57,5004. Purchasing clerk, 1/2 time on special project 6,0005. Purchase order reduction
(2,000 orders @ $1.25 each) 2,5006. Reduced freight expense 7,500
Total savings $1,248,500
zim36725_ch02_022-088.qxd 12/15/09 11:38 AM Page 86

The Nature of Costs 87
Costs7. Increased production cost
[($60.00 � 52.00) � 100,000 units] $800,0008. Hire junior engineer 20,0009. Hire quality control inspector 22,000
10. Increased storage cost for safety stock(Expected value of 4,200 units @ $2.00/unit) 8,400
Total costs 850,400
Net annual savings $ 398,100
Notes and assumptionsPersonnel. Assembly department technicians will be reduced by 40 at an annual savings (salaryplus benefits) of $28,500 each. Five assemblers will remain to assist the field service department withrepair work on the printed circuit boards; assemblers have always assisted in repair work. The super-visor of the assembly department will remain with Mowerson because he has only two years untilretirement; a position will be created for him in the machining department, where he will serve as aspecial consultant.
Because of the elimination of purchasing and stocking of component parts required for PCBassembly, one purchasing clerk will be assigned half-time to a special project until his time can bemore fully utilized.
A junior engineer will be hired to act as liaison between Mowerson and the manufacturer of thePCBs. In addition, a third quality control inspector will be needed to monitor the vendor’s adherenceto quality standards.
Floor space. For the past two years, Mowerson has rented, on a month-to-month basis, 1,000 squarefeet of space for $9.50 per square foot in a neighboring building to accommodate the overflow ofassembly work. The 8,000 square feet currently being used in Mowerson’s main plant by the assem-bly department will be used for temporary stockroom storage. However, this space could be reclaimedfor manufacturing use without overloading the stockroom facilities. This floor space is valuedat $6 per square foot.
Production costs and volume. Mowerson’s cost for manufacturing printed circuit boards is asfollows:
Direct material $24.00Direct labor 12.50Variable overhead 6.25Fixed overhead 9.25
Total cost $52.00
The direct material cost includes normal scrap and other such material-related costs as incom-ing freight and issuing costs. Mowerson’s annual cost for incoming freight attributed to PCBs is$7,500. Tri-Star will charge $60 per board, including the cost of delivery.
Mowerson’s production volume of printed circuit boards for the past two years has been 80,000and 90,000 boards, respectively. Projected production volumes for the next three years are:
2002 100,0002003 120,0002004 130,000
Storage costs. Because Mowerson will not have direct control over the manufacture of the PCBs,the level of safety stock will be increased over the current level of 1,800 boards. The supervisor of the
zim36725_ch02_022-088.qxd 12/15/09 11:38 AM Page 87

88 Chapter 2
assembly department has provided the accompanying probabilities associated with reductions inTri-Star’s ability to produce and/or deliver PCBs.
Percentage of Time Safety Stock Expected Tri-Star Deliveries Probability of PCBs Value
Will Be Late (1) (2) (1) � (2)
4% 0.30 2,500 7506 0.40 4,000 1,6008 0.25 6,000 1,500
10 0.05 7,000 350
New safety stock level 4,200
The variable cost to store the PCBs is $2 per board per year.
Other. The variable cost of executing a purchase order at Mowerson is $1.25 for items such aspostage, forms, and telephone. Since Mowerson will no longer have to purchase all the componentparts required for the printed circuit boards, there will be a reduction of 2,000 purchase ordersprepared annually.
Recommendation. Based on the annual savings of $398,100 projected above, Mowerson shouldenter into an agreement with Tri-Star to manufacture the printed circuit boards.SOURCE: CMA adapted.
Case 2–3: Puttmaster
Innovative Sports sells a patented golf trainer called the Puttmaster. This device, which sells for$69.95, consists of a metal strip on the floor that is attached to the golfer’s putter with elastic bands.By taking practice strokes with the putter attached to the Puttmaster, the golfer learns to feel how theputt should be stroked.
The Puttmaster is sold through a distributor who sells to retail stores (golf shops and sportsoutlets) and to the public through infomercials. The distributor pays Innovative Sports $30.85 for eachPuttmaster. Innovative Sports also sells them through 30-minute television infomercials and on theGolf Channel (a cable TV channel) for $69.95 plus $15.95 for shipping and handling. Although eachinfomercial increases the public awareness of the product, thereby stimulating sales in the retail stores,infomercial sales also preempt retail sales. The distributor sells sufficiently large numbers of unitsthat, for every 10 Puttmasters sold via the infomercial, two units will not be sold in a retail outlet.
For each unit sold on the infomercial, Innovative Sports pays $5.80 to the shipping company formailing and $2.00 to the phone-answering company for providing the toll-free number and process-ing the order. Innovative Sports purchases Puttmasters from the manufacturer, which produces themfor $9.55. They are shipped directly to either the distributor or to the shipping company.
A 30-minute infomercial on the Golf Channel costs $845,000. Innovative Sports has alreadyproduced the taped show for the infomercial and is now deciding how many 30-minute infomercialsto purchase over the next three months. The Golf Channel sells half-hour time slots 90 days inadvance. From past experience, Innovative Sports estimates the first 30-minute infomercial will yield22,000 unit sales. Each subsequent showing of the infomercial will yield only 90 percent of the unitssold following the previous infomercial.
How many 30-minute infomercials should Innovative Sports purchase for the next 90 days?
zim36725_ch02_022-088.qxd 12/15/09 11:38 AM Page 88

89
Chapter Three
Opportunity Cost ofCapital and CapitalBudgeting
Chapter Outline
A. Opportunity Cost of Capital
B. Interest Rate Fundamentals
1. Future Values
2. Present Values
3. Present Value of a Cash Flow Stream
4. Perpetuities
5. Annuities
6. Multiple Cash Flows per Year
C. Capital Budgeting: The Basics
1. Decision to Acquire an MBA
2. Decision to Open a Video Rental Store
3. Essential Points about Capital Budgeting
D. Capital Budgeting: Some Complexities
1. Risk
2. Inflation
3. Taxes and Depreciation Tax Shields
E. Alternative Investment Criteria
1. Payback
2. Accounting Rate of Return
3. Internal Rate of Return (IRR)
4. Methods Used in Practice
F. Summary
zim36725_ch03_089-134.qxd 12/15/09 12:25 PM Page 89

90 Chapter 3
The previous chapter defined opportunity cost as the benefit forgone from a specific deci-sion. Opportunity cost is the analytic framework underlying all decision making. If under-taking a particular action does not involve forgoing a better alternative, then the proposedaction is optimum relative to the alternatives in the opportunity set.
The discussion in Chapter 2 focused on alternatives in the opportunity set thatoccurred in the same time period. In the job offer example, all of the offers were presumedto be in the same calendar period. In the raw materials examples, the alternative uses of thematerial were assumed to be immediate. However, there is no reason to presume that all al-ternatives to the present decision occur in the same time period. A recent college graduatecan defer accepting a current job offer and either continue to search for another year or re-turn to school. The existing stock of raw materials can be used in current production or elsestored and used next year. Decisions usually have a time element. At any point in time priorto accepting the pending decision, there is always the option of delaying or forgoing the de-cision and continuing to search for better alternatives. An alternative to all decisions is the“procrastination decision”—wait for something better to emerge.
Many decisions explicitly involve a trade-off in cash receipts and expenditures overtime. For example, the decision to invest in research and development (R&D) involvespostponing current cash payments to investors in order to fund R&D in hopes of highercash payments to investors in the future (when the R&D projects produce profitable newproducts). The decision to buy a government savings bond involves trading current con-sumption for future consumption. In fact, most decisions span several time periods andtherefore involve cash flows over different time periods.
For example, the decision to attend graduate business school and earn an MBA degreeinvolves comparing cash flows over time. Instead of working and earning a salary, theMBA student pays tuition in anticipation of a higher-paying job in the future. Current in-come is sacrificed to make payments on books and tuition in order to invest in human cap-ital and thereby earn higher wages in the future. The sacrifices occur in the first two years,while the benefits of higher wages and prestige accrue over the remainder of the workingcareer. The decision to study for an MBA involves comparing the alternatives of getting adifferent advanced degree or no advanced degree at all. The opportunity cost of the MBAis what is forgone by not getting the degree. However, the cash flows from the variousalternatives occur in different time periods.
Calculating the opportunity cost of alternatives that involve cash flows occurring atdifferent points in time is complicated because a dollar today is not equivalent to a dollartomorrow. Time is money! A dollar received today can be invested and earn interest and istherefore worth more than a dollar tomorrow.
This chapter describes how to derive the opportunity cost of alternatives for whichcash receipts and disbursements occur at different points in time. Section A discusses theopportunity cost of capital. Section B then describes how to compare and aggregate cashflows that occur in different time periods. Section C illustrates the basic concepts in ana-lyzing capital investment projects. The analysis of investment alternatives involving cashflows received or paid over time is called capital budgeting. Some complexities of capitalbudgeting are discussed in section D. Alternative methods of evaluating capital investmentsare described and critiqued in section E. Finally, section F summarizes the chapter.
A. Opportunity Cost of CapitalA fundamental law of finance is that a dollar today is worth more than a dollar tomorrow.Today’s dollar can be invested to start earning interest and will therefore grow to more thana dollar tomorrow. A $1,000 deposit in a bank account paying 5 percent interest will grow
zim36725_ch03_089-134.qxd 12/15/09 12:25 PM Page 90

Opportunity Cost of Capital and Capital Budgeting 91
to $1,050 by the end of the year. A loan of $1,000 to a relative should be repaid with at least$50 in interest; otherwise, there has been an opportunity loss. Actually, the relative shouldpay more than $50 interest because the loan is probably riskier than depositing money in abank, where federal deposit insurance guarantees the bank account. For the moment, how-ever, all investments are assumed to be riskless.
If all investments are riskless, then all investments must pay the same return. Other-wise, it would be possible to borrow money from banks with lower interest rates and investin banks or projects with higher rates and pocket the difference. Everyone would see thisprofit opportunity and borrow from the lower-interest banks and invest the funds at thehigher interest rates. Eventually, the lower interest rate would rise and the higher interestrate would fall, eliminating the profit opportunity. We also assume that there are no trans-actions costs in borrowing and lending. This assumption and the assumption of riskless in-vestments give rise to the law of one price. Only one interest rate will prevail in a risklessand zero-transactions-cost world. (Later, we will relax these assumptions.)
Suppose it is possible to buy young bonsai trees for $1,000 today, hire someone to tendthem for $145 a year (paid in advance), and sell them one year later for $1,200, with norisk. Is this a good investment? The accounting profit is $55 (or $1,200 � $1,000 � $145).But notice that the cash flows occur at different times. The tree purchases and maintenancecash flows occur at the beginning of the year and the sales occur at the end of the year. Ifthe interest rate is 5 percent, the $1,000 initial investment is really costing $1,050 (or$1,000 � 0.05 � $1,000 � $1,000 � 1.05) in terms of the interest forgone by not invest-ing this money in the bank. Similarly, the $145 is really costing $152.25 (or $145 � 1.05)in terms of end-of-year dollars. The economic, as opposed to accounting, profits on thebonsai business are shown in Table 3–1.
While the accounting statement on the bonsai business shows a profit of $55, the projectshows an economic loss of $2.25. The reason for the difference is that the accounting prof-its do not include the opportunity cost of money tied up in the project, whereas economicprofits include these costs. The arrows in Table 3–1 represent the conversion of beginning-of-year cash flows into end-of-year cash flows. The conversion factor is 1 plus the interestrate, or 1.05 (principal plus interest).
Table 3–1 illustrates that end-of-year cash flows are worth less than beginning-of-yearcash flows. Adding beginning-of-year cash flows to end-of-year cash flows without anyconversion factors is like adding apples to oranges. If alternative decisions have cash flowsthat occur in different time periods, one must convert all the cash flows into equivalent cashflows as though they were all received or paid at the same time.
ManagerialApplication:The Costs andBenefits of anMBA Degree
The costs of acquiring an MBA can be $150,000 or more once you factor in tuition,books, and two years of forgone salary. A large statistical study of people with the MBAdegree identified four economic benefits of obtaining an MBA degree: a higher startingsalary, greater compensation growth, more stable long-term employment, and a higherlikelihood of participating in the workforce. After quantifying these factors the studyfound that MBA graduates earn significantly more than those without it, and the differ-ence is large enough to recover the cost of acquiring the MBA. In fact, the cash-in-handvalue of the MBA (its net present value) is more than half a million dollars, whichincludes the opportunity cost of the forgone wages for two years while pursuing thedegree.
SOURCE: A Davis and T Cline, “The ROI on the MBA, BizEd, January/February 2005, pp. 42–45.
zim36725_ch03_089-134.qxd 12/15/09 12:25 PM Page 91

Table 3–1 converted all the cash flows into equivalent dollars at the end of the firstyear. We could instead convert all the cash flows into beginning-of-period dollars, which islike asking how much one would be willing to pay today to receive a dollar in one year.How much must be invested today to get a dollar in one year? The following equationillustrates the relation between beginning- and end-of-year dollars:
Beginning-of-year dollars � (1 � Interest rate) � End-of-year dollars
Substituting, we know that
Beginning-of-year dollars � 1.05 � $1.00
Solving for the unknown variable,
Beginning-of-year dollars � � $1.00
Beginning-of-year dollars � $0.9524
If $0.9524 is invested at 5 percent interest, in one year it will grow to $1. The $0.9524is called the present value of that dollar. Now we can recompute Table 3–1 and, inTable 3–2, convert all the cash flows into beginning-of-year dollars instead of end-of-yeardollars. The arrow in Table 3–2 represents the conversion of end-of-period cash flows intobeginning-of-year cash flows.
The bonsai project still shows an economic loss. But now the economic loss is smaller,$2.14 versus $2.25. What accounts for the difference? Remember, $2.14 is in beginning-of-year dollars and $2.25 is in end-of-year dollars. However,
$2.14 � 1.05 � $2.25
The two figures are equivalent. They are like Celsius and Fahrenheit temperature; they areboth measures of temperature but in different units.
Two points emerge from this illustration: (1) cash flows occurring at different points oftime must be converted to flows as if they all occurred at the same time and (2) the answersare equivalent whether we are converting all cash flows to beginning-of-year or end-of-yeardollars. However, it is easier to convert all cash flows into beginning-of-year cash flows.Suppose there are three alternatives. The first involves cash flows today, the secondinvolves cash flows today and next year, and the third involves cash flows in the third year
1
1.05
TABLE 3–1 The Profitability of Bonsai Tree Investment after Opportunity Cost Is Considered(End-of-Year Dollars)
Dollars in Dollars at Beginning of Conversion End of
Year Factor Year
Revenues $1,200.00Cost of trees $(1,000.00) � 1.05 (1,050.00)Maintenance (145.00) � 1.05 (152.25)
Total costs (1,145.00) � 1.05 (1,202.25)
Economic loss $ (2.25)
92 Chapter 3
zim36725_ch03_089-134.qxd 12/15/09 12:25 PM Page 92

Opportunity Cost of Capital and Capital Budgeting 93
TABLE 3–2 The Profitability of Bonsai Tree Investment after Opportunity Cost Is Considered(Beginning-of-Year Dollars)
Dollars in Dollars at Beginning of Conversion End of
Year Factor Year
Revenues $ 1,142.86 � $1,200
Cost of trees (1,000.00)Maintenance (145.00)
Total costs $(1,145.00)
Economic loss $ (2.14)
only. Which end-of-year should be used, the second or third year? It simplifies the analysisto convert all future cash flows to present dollars.
Q3–1 Why is a dollar today not worth the same as a dollar in thefuture?
Q3–2 How could there be an economic profit but not anaccounting profit?
B. Interest Rate FundamentalsThis section develops the relations for converting cash flows received or paid at differenttimes. Describing the various equations clarifies the logic of the calculations and theunderlying concepts. The basic equation relates beginning-of-year dollars to end-of-yeardollars and is derived first.
We continue to assume that all cash flows are riskless and that there are no transactionscosts. These two assumptions imply that only one interest rate exists whether people areborrowing or lending. We continue to assume an interest rate of 5 percent and an initialinvestment of $1,000. Now, however, the investment period is two years at 5 percent peryear. How much will the investment be worth at the end of two years? At the end of the firstyear it is worth $1,050 (or $1,000 principal plus $50 of interest). Reinvesting this amountyields $1,102.50 (or $1,050 principal plus interest of $52.50). Of the $52.50 of interest inthe second year, $50 is interest on the original $1,000 and $2.50 is interest on the first-yearinterest ($50 � 5%). Or, at the end of the second year,
$1,000 � 2(0.05 � $1,000) � [0.05 � (0.05 � $1,000)]� $1,000 � $100 � $2.50� $1,102.50
The interest earned on the interest in the second year is called compounding.Compound interest describes the interest earned on the reinvested interest. To simplify the
1. Future Values
ConceptQuestions
1
1.05
zim36725_ch03_089-134.qxd 12/16/09 9:41 PM Page 93

computations, Table 3–14 on page 133 contains compound interest factors. For example,the entry in Table 3–14 for two periods and 5 percent is 1.103. This 1.103 is the amount $1will grow to in two years at 5 percent. One thousand dollars invested will grow to $1,103(1.103 � $1,000).
We will now generalize the preceding illustration. Let PV represent the amount ofmoney invested today at r percent per year and let FV represent the amount that will beavailable at the end of the two years. The general formula relating present dollars to dollarsin two years at r percent per year is
PV (1 � r)2 � PV (1 � 2r � r2) � FV
The 2r term represents interest for two years on the original investment of PV, and r2
is the interest on the interest (compound interest).Figure 3–1 illustrates how $1,000 invested at 5 percent interest will increase in value.
At the end of the first year, it has grown to $1,050 as we saw earlier. At the end of the sec-ond year, the $1,000 has grown to $1,103 (actually $1,102.50). By the end of the tenth year,the $1,000 amounts to $1,629. Notice that the values in Figure 3–1 correspond to the com-pound interest factors contained in Table 3–14 under the 5 percent column. The generalformula for leaving money in the bank for n years and allowing the interest to accumulateand earn interest is
PV (1 � r)n � FV (Future value formula)
All of the formulas of interest rate mathematics are just algebraic manipulations of this basicequation. The next formula derived is used to calculate present values.
Suppose that instead of asking how much an investment will be worth at the end of n years,the question is how much money must be invested today at r percent per year to have FVtomorrow? For example, how much money must be invested today to be able to buy a$25,000 boat in six years? FV and r are known, but PV is unknown. This equation has threevariables. For any two given variables, the equation can be solved for the third:
(Present value formula)PV =
FV
11 + r2n
2. Present Values
$1,800
1,600
1,400
1,200
1,000
800
600
400
200
00 1 2 3 4 109
Year
85 6 7
$1,000 $1,050 $1,103$1,158
$1,551$1,629
$1,407
$1,216 $1,276 $1,340
Dol
lars
$1,477
FIGURE 3–1
Future value of $10invested at 5 percent
94 Chapter 3
zim36725_ch03_089-134.qxd 12/15/09 12:25 PM Page 94

Opportunity Cost of Capital and Capital Budgeting 95
To solve for the boat example,
A deposit of $18,655.38 in the bank at 5 percent (allowing the principal and interestto compound) will grow to $25,000 at the end of six years. For the time being, we ignorethe effects of taxes. Again, there is a table to help simplify the computation. Table 3–12on page 131 contains the factor 0.746, which is what $1 received at the end of six yearsis worth today if the interest rate is 5 percent. Multiplying $25,000 by 0.746 yields$18,650, the same answer (except for rounding error).
So far, we have been dealing with just a single cash flow invested today or received in thefuture. Suppose there is a series of cash flows occurring at the end of each year for the nextn years. That is, FV1 is the cash received at the end of the first year, FV2 is the cash receivedat the end of the second year, and FVn is the cash received at the end of the nth year. Whatis the present value of this cash flow stream? We can apply the above PV formula to eachcash flow:
For example, suppose an investor will receive payments of $500 at the end of the first year,$1,000 at the end of the second year, and $1,500 at the end of the third year. Figure 3–2 il-lustrates the stream of the three cash flows. How much is this stream of cash flows worth?Using the above formula
= $2,678.98
PV =
$500
(1 + 0.05)1+
$1,000
(1 + 0.05)2+
$1,500
(1 + 0.05)3
PV =
FV1
(1 + r)1+
FV2
(1 + r)2+
FV3
(1 + r)3+
# # #+
FVn
(1 + r)n
3. Present Valueof a Cash FlowStream
= $18,655.38
=
$25,000
1.3401
PV =
$25,000
11 + 0.0526
$1,600
1,400
1,200
1,000
800
600
400
200
01 2 3
Year
Dol
lars
FIGURE 3–2
zim36725_ch03_089-134.qxd 12/15/09 12:25 PM Page 95

Therefore, receiving the cash flow stream illustrated in Figure 3–2 is the same as receiving$2,678.98 today if the interest rate is 5 percent.
The same answer can be found using Table 3–12. The first three numbers under the 5 per-cent column are 0.952, 0.907, and 0.864. These factors correspond to the numbers used in thepreceding calculation of $2,678.98. The following illustrates how the factors in Table 3–12can be used to compute the present value of the three cash flows just described:
Cash Table 3–12 Discounted Year Flow � Factor � Cash Flow
1 $ 500 0.952 $ 4762 1,000 0.907 9073 1,500 0.864 1,296
Total $2,679
Each of the cash flows, FVt, is said to be discounted (or divided) by (1 � r)t where t isthe year in which the cash flow is received. Notice that 1 � (1 � r)t is always less than 1for all positive interest rates. Therefore, a dollar received in the future is always worth lessthan a dollar today for positive interest rates. We will see that discounting is central to theconcept of comparing alternatives involving cash flows received at different points of time.By discounting the future cash flows from each alternative to present values (or dollarstoday), we can compare which alternative is best.
The net present value of a stream of cash flows represents the increment to the valueof the firm from accepting the investment. For example, suppose the current value of a firmis $400 million. This is the current market value of all the firm’s outstanding debt andequity claims. If the firm makes an investment with a net present value of $17 million, thenthe value of all the outstanding debt and equity claims will rise to $417 million. The netpresent value of a cash flow stream is the change in the value of the firm from accepting theproject. In perfectly competitive capital and product markets, the net present value of all in-vestment projects should be zero. Under perfect competition, firms cannot earn abnormalprofits; all investments return the market rate of interest. Therefore, investments can havea positive net present value only if the firm has some market power that allows it to chargeprices that exceed long-run average cost; markets are not perfectly competitive. When an-alyzing investment projects with positive net present values, it is important to understandthe source of the abnormal profits. (What factors are allowing the firm to earn a returnmore than its cost of capital?)
We next consider perpetuities, or infinite streams of equal payments received each year.Some government bonds issued by the British government promise to pay a fixed amountof cash each year forever. How much would investors be willing to pay for such bonds? Allof the future payments, FV1, FV2, . . . , FVn are the same and equal to FV. Substituting FVinto the general equation yields
Fortunately, using a bit of algebra, this expression simplifies to
(Perpetuity formula)PV +
FV
r
PV =
FV
(1 + r)1+
FV
(1 + r)2+
FV
(1 + r)3+
# # #
4. Perpetuities
96 Chapter 3
zim36725_ch03_089-134.qxd 12/15/09 12:25 PM Page 96

Opportunity Cost of Capital and Capital Budgeting 97
This is the basic formula for a perpetuity, or an infinite cash flow stream, when the interestrate is r percent. If a bond pays $100 per year in perpetuity and the interest rate is 5 percent,then investors would be willing to pay
The next basic formula that is useful in many applications is the present value of anannuity, a stream of equal cash flows for a fixed number of years. Many financial instru-ments are annuities. For example, car loans and mortgage payments involve a fixed numberof equal monthly payments. Corporate bonds pay a fixed amount twice a year over the termof the bond (usually 20 years). To derive the formula for an annuity, let FV again denote theannual cash flow received at the end of each of the next n years. The following diagramshows the timing of the n cash flows of each FV:
Year 0 1 2 3 . . . n n � 1 n � 2
Cash flow 0 FV FV FV . . . FV 0 0
The formula for this annuity stream is
(Present value of annuity formula)
To illustrate the application of the formula, suppose a prospective borrower can affordto pay $1,000 per year for 10 years. How large a loan can be taken out today at an interestrate of 5 percent? Using our annuity formula, we get
Therefore, the bank will lend $7,721.73 today, with payments of $1,000 per year for 10 years.Instead of having to calculate a somewhat messy formula, let alone remember it, presentvalue tables of annuity factors exist. Table 3–13 (on page 132) under the 5 percent columnand 10 periods row contains the factor 7.722. This factor represents the present value of10 annual cash flows discounted at 5 percent. If each annual cash flow is $1,000, then thepresent value of this cash flow stream is $7,722 (7.722 � $1,000). This is the same answerwe got using the formula.
Another useful formula is the future value of an annuity. For example, how much willan investment of $1,000 a year for 18 years generate for a child’s college education? Startwith the present value of an annuity and then convert this amount to a future value bytaking the present value formula for an annuity and multiplying it by (1 � r)n. Or,
(Future value of annuity formula)= FV c(1 + r)n
- 1
rd
FV
r c1 -
1
(1 + r)n d (1 + r)n
= $7,721.73
= $20,000 (0.386087)
PV =
$1,000
0.05 ¢1 -
1
1.0510 ≤
FV
r c1 -
1
(1 + r)n d
5. Annuities
= $2,000
PV =
$100
0.05
zim36725_ch03_089-134.qxd 12/15/09 12:25 PM Page 97

To solve for how much money will be available for a child’s education, substitute into theabove equation:
Therefore, if interest is left to accumulate in the bank, an investment of $1,000 a year for18 years at an interest rate of 5 percent will grow to over $28,000. Table 3–15 on page 134simplifies the computation of future values of annuities. For the preceding example, thefactor in Table 3–15 for 5 percent and 18 years is 28.132. This represents the future valueof a stream of 18 annual payments of $1, discounted at 5 percent. Since $1,000 is receivedeach year, the future value of this annuity stream at 5 percent is $28,132, as we computedusing the future value of annuity formula.
So far we have considered only cash flows that occur once per year. How do we handle cashflows that occur more frequently, say, monthly? We could add up the monthly flows and treatthem as a single annual cash flow on the last day of the year. But this ignores the interestwe could earn on the monthly receipts. To illustrate, consider the difference between thefollowing two alternatives: (1) receiving 12 monthly $1,000 payments or (2) receiving a sin-gle $12,000 payment at the end of the year. Before we can calculate which option is worthmore, we first have to understand the relation between monthly and annual interest rates.
An annual interest rate involves only a single compounding interval. A monthly inter-est rate involves 12 compounding intervals. If the annual interest rate is 6 percent, what isthe interest rate per month? It might be tempting to say 0.06 � 12 � 0.005, but this iswrong. To derive the monthly interest rate, recall the law of one interest rate. With no trans-actions costs and no risk, there can be only one interest rate in the market. The monthly andannual interest rates must be such that no one can earn more by investing at the monthlyinterest rate rather than the annual interest rate. A dollar invested at the monthly interestrate, rm, must accumulate to the same amount at the end of the year as a dollar invested atthe annual interest rate, r. The opportunity cost of investing at the monthly interest ratemust be the same as the opportunity cost of investing at the annual interest rate or else aprofit opportunity exists. Therefore, the following equation must hold:
(1 � rm)12 � (1 � r)
(1 � rm) � (1 � r)1/12
rm � (1 � r)1/12 � 1
� 1.061/12 � 1
� 0.004868
Now we can return to the original question and value the two alternatives. The monthlyinterest rate just derived is 0.004868, and the annual interest rate is 6 percent. Using the pre-sent value of the annuity formula to calculate the stream of 12 monthly $1,000 payments,
= $11,628.79
= $205,423(0.056609)
FV
r c1 -
1
(1 + r)n d =
$1,000
0.004868 ¢1 -
1
1.00486812 ≤
6. Multiple CashFlows per Year
= $28,132.38
$1,000 c(1.0518
- 1)
0.05d = $1,000 (28.13238)
98 Chapter 3
zim36725_ch03_089-134.qxd 12/15/09 12:25 PM Page 98

Opportunity Cost of Capital and Capital Budgeting 99
1 0.05127 = ¢1 +
0.05
365≤365
- 1.
TABLE 3–3 Example Using Compound Interest Tables(Interest Rate � 5%)
Discount Source of Present Cash Flow Factor Factor Value
Years 1–20 $1,000 12.462 Table 3–13 $12,462Years 1–10 1,000 7.722 Table 3–13 7,722Year 21 3,000 0.359 Table 3–12 1,077
Total present value $21,261
The present value of the single $12,000 payment is
Therefore, the 12 payments of $1,000 received at the end of each month are worth $308.04more today than a single $12,000 payment received at the end of the year. The 12 monthly$1,000 payments are worth more than a single $12,000 payment at the end of the yearbecause the monthly payments can earn interest during the year.
The preceding example illustrates that the earlier a payment is received, the more valu-able is the payment. It also introduces the notion of the compounding interval. The keypoint is that the annual interest rate cannot be used to discount cash flows received morefrequently than yearly. Some banks quote interest rates in annual terms, say 5 percent, butthen compound the interest monthly. In this case, the effective annual interest is
Therefore, if the bank has a stated annual interest rate of 5 percent but compounds monthly,the effective annual interest rate is 5.116 percent. If the bank’s interest rate is 5 percent butit compounds interest daily, the effective annual rate is 5.127 percent.1 Depositors wantingthe highest effective interest rate will always choose the bank with the most frequent com-pounding interval, if the banks are all offering the same annual interest rate.
Besides using Tables 3–12 through 3–15 at the end of this chapter to simplify the com-putations, most computer spreadsheet programs and handheld calculators compute presentvalues and future values. For example, Table 3–3 calculates the present value of the fol-lowing cash flows (at r � 5%): $2,000 for the first 10 years, $1,000 for the next 10 years,and $3,000 at the end of year 21.
Note how the calculations were simplified. In particular, the $2,000 stream for years1 through 10 and the $1,000 stream for years 11 through 20 are equivalent to a $1,000 streamfor the first 20 years and a $1,000 stream for the first 10 years. The discount factors for these
= 0.05116
= 1.004166666712- 1
¢1 +
r
12≤ - 1 = ¢1 +
0.05
12≤12
- 1
FV
(1 + r)n =
$12,000
1.061= $11,320.75
zim36725_ch03_089-134.qxd 12/15/09 12:25 PM Page 99

two streams are taken from the annuity table (Table 3–13 on page 132). The single $3,000payment in year 21 is discounted using the present value factor (Table 3–12 on page 131).Adding the three discounted cash flows together yields a present value of $21,261. As always,$21,261 represents the opportunity cost or the value of the cash flows when they are certainand the market rate of interest is 5 percent.
Q3–3 Define the present value of a future amount.
Q3–4 Define the future value of a present amount.
Q3–5 Define compound interest.
Q3–6 How do perpetuities differ from annuities?
C. Capital Budgeting: The BasicsSection A presented the concept of the opportunity cost of capital (a dollar today is not thesame as a dollar tomorrow). Section B described how to convert dollars in different timeperiods into equivalent dollars. This section applies these concepts of opportunity cost tocapital budgeting.
Suppose Sue Koerner is considering returning to school to get an MBA degree. Her currentwages are $50,000. Tuition, books, and fees cost $35,000 per year for two years. After earn-ing her MBA, Sue’s starting salary will be $100,000. Therefore, the MBA degree adds$50,000 per year to her salary. However, Sue must give up two years of current salary dur-ing graduate school plus pay tuition, books, and fees. At a current age of 31 and with anexpected retirement age of 60, should Sue pursue the MBA? The market rate of interest is5 percent. To illustrate the basic concepts, this example focuses on just the monetaryaspects of the MBA and ignores the additional utility Sue receives from the prestige ofearning an advanced degree. Table 3–4 calculates the net present value of the MBA—thedifference between the present value of the cash inflows and outflows.
1. Decision toAcquire an MBA
ConceptQuestions
100 Chapter 3
TABLE 3–4 The Decision to Get an MBA Degree
Net Discount Present Cash Flow Factor Value
Years 1–2 Forgone wages � Cost of school $(85,000) 1.859 $(158,015)
Years 1–30 Additional wages with MBA 50,000 15.372 768,600
Years 1–2 Higher MBA wages not earned in first two years* (50,000) 1.859 (92,950)
Total present value $ 517,635
*The present value of $30,000 for two years is being deducted in this line because the line above includes the first two years.However, the higher salaries do not begin until year 3.
zim36725_ch03_089-134.qxd 12/15/09 12:25 PM Page 100

Opportunity Cost of Capital and Capital Budgeting 101
TABLE 3–5 Video Store Projected Profits,Years 1–4
Year 1 Year 2 Year 3 Year 4
1. Sales (cash inflows) $300,000 $450,000 $500,000 $500,0002. Operating costs (cash
outflows) 180,000 200,000 220,000 220,0003. Depreciation 71,450 122,450 87,450 62,450
4. Pretax profit(1 � 2 � 3) $ 48,550 $127,550 $192,550 $217,550
5. Tax at 34% 16,507 43,367 65,467 73,967
6. Net income after tax(4 � 5) $ 32,043 $ 84,183 $127,083 $143,583
In Table 3–4, the additional wages of $50,000 are treated as an annuity beginningin year 1, and then a two-year annuity of $50,000 beginning in year 1 is subtracted. Thisis the simplest way to perform the calculation. The computations in Table 3–4 assume thatall cash flows occur at the end of the year. To keep the example simple, the additionalwages from having the MBA degree are assumed to be constant at $50,000 per year overSue’s career. Given these assumptions, the decision to get an MBA is worth $517,635 intoday’s dollars. That is, the present value of the additional wages from receiving the MBAis greater than the amount forgone (two years’ wages plus schooling costs) to acquire thedegree by over half a million dollars.
The MBA degree example illustrates how to compare alternatives that have cash flowsoccurring at different points of time. The next example considers a slightly more compli-cated investment decision.
Suppose Paul Woolf is considering opening a video rental store. The initial investment forDVDs, lease improvements, shelving, and equipment is $500,000. Suppose the store willbe operated for four years and then sold at the end of the fourth year for $200,000 cash.Table 3–5 shows the projections of the store’s annual operating profitability.
In this video store business, all the sales are for cash. Hence, all sales represent cashinflows. Depreciation amounts in Table 3–5 are based on accelerated depreciation tablesallowed by the federal government in calculating taxable income. The after-tax profit in
2. Decision toOpen a VideoRental Store
AcademicApplication:When Is aFixed Cost anOpportunityCost?
All costs are variable in the long run. When managers decide to build a plant of a givencapacity, they commit the firm to making an investment. The amount invested in theplant becomes a sunk cost (assuming it has little resale value). The accountants thendepreciate the investment over the life of the plant. These depreciated amounts are fixedcosts in the accounting reports.
Capital budgeting is the process of deciding how much to invest in projects thatyield cash flows that span several periods. Prior to implementing a capital project, all thecosts of the project are opportunity costs. Once the project is built, these opportunitycosts become fixed costs to the extent that higher levels of output do not cause addi-tional wear and tear on the facility.
zim36725_ch03_089-134.qxd 12/15/09 12:25 PM Page 101

TABLE 3–6 Video Store Net Present Value,Years 1–4
Initial Investment Year 1 Year 2 Year 3 Year 4
1. Sales (cash inflows) $300,000 $450,000 $500,000 $500,0002. Operating costs (cash outflows) 180,000 200,000 220,000 220,0003. Tax at 34% (cash outflows) 16,507 43,367 65,467 73,967
4. Cash flow from operations(1 � 2 � 3) 103,493 206,633 214,533 206,033
5. Cash flow from investment $(500,000)6. Cash flow from disposal 185,108*7. Net cash flow (4 � 5 � 6) $(500,000) $103,493 $206,633 $214,533 $391,1418. Discount rate 1 � 1.05n 1.000 0.952 0.907 0.864 0.8239. Present value at 5% $(500,000) $98,565 $187,422 $185,322 $321,793
10. Net present value $293,102
*Cash flow from disposal � $200,000 less tax on excess of $200,000 over depreciated book value
� $200,000 � 0.34($200,000 � $156,200)
� $185,108
2 In general, adding back to net income all non-cash flow expenses, such as depreciation, and subtractingfrom net income all non-cash flow revenues, such as accrued bond interest income, yields cash flow fromoperations.
Table 3–5 is not the same as the net cash flow stream from the video store. The differenceis the accounting accrual process of depreciation. The $500,000 initial investment is notwritten off in the first year but rather is capitalized and expensed via the accountingaccrual of depreciation. In order to calculate the net present value of this investment, wemust convert the accounting profit numbers in Table 3–5 into cash flows. The resultingcash flows and the net present value are presented in Table 3–6.
The net present value of the video store is $293,102. The net cash flows in each year(line 7) are composed of the cash flows from operations (line 4), the initial investment(line 5), and the cash flows from disposal (line 6). Cash flows from operations (line 4) aresales (line 1) less operating expenses (line 2) less taxes (line 3). At the end of the fourth year,the store is sold for $200,000. Under U.S. tax regulations, disposal values are ignored in cal-culating depreciation, and any gain on disposal is taxed as ordinary income when received.Thus, cash flow from disposal (line 6) is the disposal value less the 34 percent tax on thegain when the gain is the salvage value less book value. All of the initial cash outflow of$500,000 is assumed to occur immediately and therefore is discounted with a value of 1.000.The cash flows in years 1 through 4 are assumed to occur at the end of each year.
Instead of calculating the annual net cash flows as the sum of the component cashflows, as in Table 3–6, just add depreciation back to net income and subtract out newinvestments. Table 3–7 presents these calculations, which yield identical cash flows to thosein Table 3–6.2
Discount cash flows, not accounting earningsThe important lesson in Table 3–6 is to discount cash flows, not accounting earnings. Thereason for focusing on cash flows is that accounting earnings contain accounting accruals.The accounting process by its very nature keeps certain cash flows out of earnings.
3. EssentialPoints aboutCapital Budgeting
102 Chapter 3
zim36725_ch03_089-134.qxd 12/15/09 12:25 PM Page 102

Opportunity Cost of Capital and Capital Budgeting 103
TABLE 3–7 Calculating Video Store Annual Cash Flows Starting with Net Income,Years 1–4
Initial Investment Year 1 Year 2 Year 3 Year 4
1. Net income after tax (Table 3–5) $ 32,043 $ 84,183 $127,083 $143,5832. Depreciation (Table 3–5) 71,450 122,450 87,450 62,4503. Cash flow from investment $(500,000)4. Cash flow from disposal 0 0 0 185,108
5. Net cash flow (1 � 2 � 3 � 4) $(500,000) $103,493 $206,633 $214,533 $391,141
Investments are capitalized and then depreciated. Earnings do not contain amounts spentuntil the economic benefits of the investments are received. Likewise, sales are usuallyrecorded when the legal liability arises, not when the cash is collected. Therefore, dollarsearned, as computed by accounting earnings, do not reflect the dollars actually received.Table 3–7 illustrates that accounting income differs from cash flows due to the timing ofdepreciation and investment.
The reason we discount cash flows and not accounting earnings is because cash flowscan be invested in the bank to generate interest. Accounting earnings, however, cannot beused to open a bank account. You cannot go to the store and buy soda and pretzels withaccounting earnings.
Include working capital requirementsThe video store example is simple and does not include cash needed for working capital. Work-ing capital consists of current assets (cash, marketable securities, accounts receivable, inven-tory) less current liabilities (accounts payable, notes payable, and current portion of long-termdebt). Many businesses carry significant accounts receivable and inventories. Such inventoriesrepresent cash tied up that could be earning interest if invested. Therefore, cash invested insuch inventories should be included in the analysis. Likewise, many businesses allow cus-tomers to make purchases on credit. In these cases, additional cash must be invested to financethese accounts receivable. On the other hand, to the extent that the firm acquires goods andservices on credit, the accounts payable offset the cash needed to finance current assets.
Include opportunity costs but not sunk costsIn the MBA example, the current wages forgone by attending graduate school are an op-portunity cost of getting the MBA. They are included in the analysis and discounted as cashflows forgone. However, sunk costs are ignored. For example, the costs of acquiring theundergraduate degree (wages forgone, undergraduate tuition, and housing) necessary foradmission into an MBA program are not included. The expenses incurred to receive theundergraduate degree are sunk costs because they were incurred prior to the decision toattend graduate school.
Exclude financing costsDo not include the interest charges on the debt used to finance the project. The costs offinancing the project are implicitly included when future cash flows are discounted. If theproject has a positive net present value, then its cash flows yield a return in excess of thefirm’s cost of capital, which more than compensates the firm for the financing costs.
The discounted cash flow analyses of both the MBA and video store examples excludeall mention of how either of these projects would be financed. Were savings or studentloans used to finance the MBA degree? Was the investment in the video store financed by
zim36725_ch03_089-134.qxd 12/15/09 12:25 PM Page 103

3Note that the expected return on the stock of the video chain has comparable risk to the video store only ifthe chain has no debt. If the chain has debt, then the expected return on the stock is higher than the firm’s costof capital.
a bank loan or by bringing in a partner who contributed cash? These considerations areexcluded because the discount rate incorporates the cost of financing the project. Under theassumption of complete certainty and perfect capital markets, there can be only one inter-est rate in the market. Therefore, the firm can borrow all the necessary funds at this inter-est rate, and the financing of the project is irrelevant.
D. Capital Budgeting: Some ComplexitiesThe preceding section presented two simplified capital budgeting examples: the MBAdecision and the video store decision. These examples illustrate the basic mechanics ofdiscounted cash flow (DCF) analysis. This section adds more complexities: risk, inflation,and depreciation tax shields.
One of our assumptions has been that all cash flows are riskless. This assumption, whencoupled with the zero transactions-costs assumption, led to the result that there would beonly one interest rate prevailing in the market and all future cash flows would be discountedat this riskless interest rate. But few cash flow streams are riskless, so we must have a wayto deal with risky cash flows.
Once we allow the possibility of risk, then the law of one interest rate no longer holds.Instead, we have the law of one interest rate for each risk class. Investments that have dif-ferent risk will have different interest rates. In order to induce investments in higher-riskprojects, a higher expected return is required. This is another law of finance: A safe dollaris more valuable than a risky dollar. Risky projects are discounted at a higher interest ratethan safe projects.
What we mean by risk, how it is measured, and how to choose risk-adjusted discountfactors are the subject of corporate finance. We will not concern ourselves with derivingrisk-adjusted discount rates. For any given risky cash flow stream, we assume that an equiv-alent risk-adjusted interest rate exists.
Recall Paul Woolf ’s investment in a video retail store. One of Paul’s alternatives isto invest at 5 percent in U.S. Treasury bonds, which are very unlikely to default. If thevideo store cash flows are risky, then 5 percent is not the opportunity cost of investing inthe video store. Since a risky dollar is less valuable than a safe dollar, Paul must discountthe video store cash flows using an interest rate from an investment with a comparabledegree of risk. Suppose that the equity of a national chain of video stores returns 13 per-cent per year, and the stock in this company is comparable in risk to Paul’s video store.Then 13 percent is the relevant, risk-adjusted interest rate to use in discounting the videostore cash flows.3
Let ri be the risk-adjusted discount rate for the ith investment project and let rf be therisk-free rate of interest on government bonds. The following equation describes the rela-tion between the risk-adjusted rate, the riskless rate of interest, and the risk premium:
ri � rf � Risk premiumi
This equation states that the required rate of return on an investment in risk class i is com-posed of two pieces. The first piece is the return that must be paid for investing in a risklessasset, rf, and the second piece is a risk premium associated with risk class i. Thus, the first
1. Risk
104 Chapter 3
zim36725_ch03_089-134.qxd 12/15/09 12:25 PM Page 104

Opportunity Cost of Capital and Capital Budgeting 105
adjustment we must make when valuing risky cash flows is to choose a higher discount ratethat corresponds to the risk inherent in the project’s cash flows.
The second adjustment is to discount the expected cash flows. Since the cash flows areuncertain, one of several possible cash flows can result. Instead of discounting the highestor lowest cash flow that can occur, we discount the expected or average anticipated cashflow. For example, if the cash flows next year can be either $100 or $200 with equalprobability, we would discount the expected cash flow of $150. The general formula fordiscounting risky cash flows is
is the risky cash flow in year t and E( ) is the expected value of the uncertaincash flow. This formula says to discount expected cash flows using a risk-adjusted discountrate, ri, appropriate for the risk inherent in the project. For example, if cash flows for thenext five years will be either $100 or $200 per year with equal probability, the expectedcash flows are $150. Suppose the discount rate for equivalent risk investments is 30 per-cent. Using Table 3–13 on page 132, the present value of this risky five-year annuity is$365.40 (or $150 � 2.436).
So far we have ignored the effects of inflation. In fact, we have implicitly assumed therewas no inflation. In the MBA example, the difference of $50,000 between Sue Koerner’scurrent salary ($50,000) and her salary with the MBA ($100,000) was assumed to remainconstant over time. However, even a small inflation rate of 3 percent per year can causecash flows in 20 years to be very different from what they would be without inflation. At3 percent inflation per year, a dollar will grow to about $1.81 in 20 years. Therefore, oneshould not ignore inflation in a DCF analysis.
Absent any inflation, people would still prefer a dollar today instead of a dollar tomor-row. In such an inflation-free world, the interest rate is the compensation paid to postponeconsumption. Let rreal denote the real interest rate, or the rate of interest that would occurif there were no inflation. The real interest rate consists of the risk-free rate of return plus arisk premium. It is the market price that equates the supply and demand for capital for agiven amount of risk.
If inflation is f percent per year, and $1 of consumption is delayed for one year, it willtake $(1 � f ) at the end of the year to buy the same $1 bundle of goods as could have beenpurchased at the beginning of the year. If inflation is 7 percent per year, buying the same $1bundle costs $1.07 at the end of the year. To compensate for delaying consumption for oneyear when inflation is running at i percent, the nominal interest rate is
1 � rnominal � (1 � rreal) (1 � f )
The nominal interest rate is the interest rate observed in the market. It includes boththe real component, rreal, and expected inflation. If the real interest rate is 3 percent andexpected inflation is 7 percent, then the nominal interest rate is (1.03)(1.07) � 1 � 0.1021 �10.21%. A loan from a bank is repaid in future dollars whose purchasing power willbe eroded by inflation. When lending money, the bank will impound the expected rate ofinflation into the interest rate.
If discount rates are stated in nominal interest rates, then the cash flows beingdiscounted should be stated in nominal terms. That is, they should be adjusted for inflation
2. Inflation
'
CFt
'
CFt
PV = an
t = 0
E(C'
Ft)
(1 + ri)t
zim36725_ch03_089-134.qxd 12/15/09 12:25 PM Page 105

TABLE 3–8 Video Store Net Present Value,Years 1–4(Cash Flows Adjusted for Inflation)
Initial Investment Year 1 Year 2 Year 3 Year 4
1. Sales (real) $300,000 $450,000 $500,000 $500,0002. Inflation factor (1.02)n 1.020 1.040 1.061 1.0823. Sales (nominal) (1 � 2) $306,000 $468,180 $530,604 $541,2164. Operating costs (real) 180,000 200,000 220,000 220,0005. Inflation factor (1.03)n 1.030 1.061 1.093 1.1266. Operating costs (nominal) (4 � 5) $185,400 $212,180 $240,400 $247,6127. Depreciation 71,450 122,450 87,450 62,450
8. Pretax profit (3 � 6 � 7) $ 49,150 $133,550 $202,754 $231,1549. Tax at 34% (8 � 0.34) 16,711 45,407 68,936 78,592
10. Cash flow from operations(3 � 6 � 9) $103,889 $210,593 $221,268 $215,012
11. Cash flow from investment $(500,000)12. Cash flow from disposal 195,989*13. Net cash flow (10 � 11 � 12) $(500,000) $103,889 $210,593 $221,268 $411,00114. Discount rate 1 � (1.09)n 1.000 0.917 0.842 0.772 0.70815. Present value at 9% $(500,000) $ 95,311 $177,252 $170,859 $291,16316. Net present value $234,585
*Cash flow from disposal � Nominal sales price less tax on excess of nominal sales price over depreciated book value
� $200,000(1.02)4 � 0.34[$200,000(1.02)4 � 156,200]
� $195,989
as well. If nominal interest rates are used in the denominator of the present value equa-tion and the cash flows in the numerator are not adjusted, then inconsistent results areproduced. To illustrate how to adjust cash flows for inflation, return to the video storeexample in Tables 3–5 and 3–6. There was no explicit statement about whether the cashflows in Table 3–6 were in real or nominal terms. Suppose the cash flows are real, mean-ing they do not account for inflation. Table 3–8 makes the following inflation assump-tions: Price inflation for sales and disposal value will be 2 percent per year, and priceinflation on operating costs will be 3 percent per year. First restate the cash flows intonominal dollars. Then discount these dollars using the nominal interest rate. Assume thenominal interest rate is 9 percent.
Sales (line 1) are restated at an inflation rate of 2 percent per year and operating costs(line 4) are restated at 3 percent per year. This produces inflation-adjusted sales (line 3) andinflation-adjusted operating costs (line 6). Depreciation is not adjusted because the tax lawsdo not allow historical cost depreciation to be adjusted for inflation. Nominal cash flowsfrom operations are nominal sales less nominal operating costs less taxes. The remainder ofTable 3–8 follows directly from Table 3–6, except the discount rate is 9 percent. The onlyother difference is that the disposal value of $200,000 is increased by a 2 percent inflationfactor. After adjustment for inflation, the net present value of the video store is $234,585,compared with a net present value of $293,102 before. The net present value is lowerbecause the future cash inflows, while increased by inflation, are being discounted at an evenhigher discount rate (9 percent versus the 5 percent in Table 3–6).
The important point to remember from this section is to discount nominal (inflation-adjusted) cash flows using nominal interest rates.
106 Chapter 3
zim36725_ch03_089-134.qxd 12/15/09 12:25 PM Page 106

Opportunity Cost of Capital and Capital Budgeting 107
Taxes are a very significant cash flow item in most discounted cash flow analyses. A cor-porate income tax rate of 34 percent implies that about a third of any project’s profitabilityis taxed away. Therefore, taxes and how to minimize them become a very important ele-ment in capital budgets.
Accounting depreciation is an important device in minimizing taxes. The intuition isreally quite simple. Suppose a company car costs $25,000 and taxable income will exceed$25,000 into the foreseeable future. For tax purposes, it would be highly preferable to reducetaxable income by expensing the entire $25,000 purchase price against this year’s taxableincome. However, the government will not permit this and insists that the car be depreciatedover its useful life, say five years. The car has already been purchased, so the $25,000 isgone. The only question remaining is how quickly the cost of the car can be written offagainst taxable income. As long as the firm has taxable income, then accounting deprecia-tion shields some portion of that income from taxes. And it is preferable to shield a dollar oftaxable income today rather than tomorrow because a dollar saved today is worth more thana dollar saved tomorrow. Hence, a depreciation schedule for the car for the next five yearsof $10,000, $6,000, $3,600, $2,160, and $3,240 is preferable to a depreciation schedule of$5,000 per year for five years. Both schedules depreciate a total of $25,000, but the firstrecognizes the depreciation sooner, thereby reducing the present value of taxes paid.
Most firms use different depreciation methods for external reports to shareholders thanfor the Internal Revenue Service (IRS). The IRS allows firms to elect straight-line depreci-ation for shareholder reports and accelerated depreciation for tax returns. There are otheraccounting methods that can cause tax expense reported to shareholders to differ from thefirm’s actual tax bill. For example, the expected costs of product warranties are included infinancial reports to shareholders when the product is sold. However, the cost of the war-ranty work is included for tax purposes only when actually incurred. When calculatinga project’s net present value, it is important to use the tax accounting rules rather than theaccounting rules for shareholders. Taxes are a cash flow, and the accounting rules used tocompute taxes affect the tax cash flows. The accounting methods used only for shareholderreports, however, do not affect tax cash flows.
As illustrated in the video store example, the treatment of accounting depreciationrequires care. The following points should be noted:
• Depreciation is not a cash flow.
• Net income after deducting depreciation is not a cash flow.
• Depreciation is a tax-allowed expense.
• Depreciation affects taxes and therefore has an indirect effect on cash flows via taxes.
• When considering the cash flow effect of depreciation, use the depreciation methodallowed for tax purposes.
Some simple algebra illustrates the indirect cash flow effect of depreciation. Let
� � Tax rateR � RevenueE � All cash expenses (except depreciation)D � Depreciation allowed for tax purposes
Using this notation, we can write down the following familiar formulas:
Net income � NI � (R � E � D) (1 � �)
Taxes � TAX � (R � E � D)�
Cash flow � CF � R � E � TAX
� R � E � (R � E � D)�
� (R � E) (1 � �) � D�
3. Taxes andDepreciation TaxShields
zim36725_ch03_089-134.qxd 12/15/09 12:25 PM Page 107

TABLE 3–9 Net Present Value of Depreciation Tax Shields*
Straight-Line Depreciation Double-Declining-Balance Depreciation
Tax PV of Book Value Tax PV of Deprec. Shield Tax DDB at Beg. Deprec. Shield Tax
Year Expense (D�) Shield Rate† of Year Expense (D�) Shield
1 $100,000 $34,000 $ 32,381 0.4 $500,000 $200,000 $68,000 $ 64,7622 100,000 34,000 30,839 0.4 300,000 120,000 40,800 37,0073 100,000 34,000 29,370 0.4 180,000 72,000 24,480 21,1474 100,000 34,000 27,972 0.4 108,000 43,200 14,688 12,0845 100,000 34,000 26,640 64,800 64,800 22,032 17,213
$500,000 $147,202 $500,000 $152,263
*$500,000 asset, no salvage, five-year life, 34% tax rate, 5% interest.†DDB rate (double-declining-balance rate) is twice the straight-line rate; or, 40% � 2 � .
1
5
Notice the last term in the last cash flow equation, D�. This is the annual depreciationcharge, D, times the tax rate, �. The product of the two is added to the annual after-tax op-erating net cash flow, (R � E) (1 � �), to arrive at the after-tax net cash flow as long as thefirm has taxable income. From the last formula, we can clearly see that the larger thedepreciation expense, the higher the firm’s cash flow because the tax liability is lower. Inthis sense, depreciation is said to be a tax shield because it results in lower taxes and thushigher after-tax cash flow. The total amount of depreciation that can be deducted from taxesis limited to the original cost of the asset. Therefore, the sooner the depreciation is taken(assuming the firm has positive taxable income), the higher is the present value of thedepreciation tax shield. Accelerated tax depreciation methods that allow earlier recognitionof depreciation increase a project’s net present value.
To illustrate the importance of early recognition of depreciation, consider the follow-ing example that captures the flavor of the tax code but avoids many of the technical com-plexities. An asset is purchased for $500,000. The asset has a five-year life and no salvagevalue. The tax rate is 34 percent. Table 3–9 lays out the calculation of the present value ofthe tax shields under the straight-line and double-declining-balance depreciation methods.
Double-declining-balance depreciation writes off the $500,000 original cost fasterthan straight-line depreciation. Therefore, its tax shield has a higher present value by$5,061. In other words, if double-declining-balance depreciation is used instead of straight-line depreciation for tax purposes (assuming the tax regulations allow this), the net presentvalue of the project is increased by $5,061. This is about 1 percent of the asset’s cost.
Q3–7 Define net present value.
Q3–8 Explain why the interest rate on a one-year bank accountpaying interest monthly is not just one-twelfth the interest rateon a one-year bank account paying interest annually.
Q3–9 What does it mean to say depreciation is a tax shield whenevaluating capital projects?
Q3–10 What are the components of the real interest rate?
Q3–11 What are the components of the nominal interest rate?
ConceptQuestions
108 Chapter 3
zim36725_ch03_089-134.qxd 12/15/09 12:25 PM Page 108

Opportunity Cost of Capital and Capital Budgeting 109
E. Alternative Investment CriteriaUp to this point we have presented discounted cash flow (DCF) analysis, also called netpresent value (NPV) analysis, as the correct way to compare alternatives involving cashflows occurring at different points in time. Cash flows received or paid in different yearscannot simply be added together, because a dollar today is worth more than a dollar tomor-row. Therefore, a future dollar must be discounted before it can be added to today’s dollars.However, DCF analysis is not the only way to evaluate investment projects. Some firms usepayback, accounting rates of return, or internal rates of return. These methods are firstdescribed and then critically evaluated. The last section presents survey data on howfrequently they are used in practice.
A much simpler method of evaluating projects is the payback method. Payback is thenumber of years or months it takes to return the initial investment. Suppose a project’s ini-tial investment is $700,000 and subsequent yearly cash inflows are $200,000 for five years.This project has a payback of three and one-half years ($700,000 � $200,000). In three andone-half years, the cash inflows just equal the initial investment of $700,000. The great ad-vantage of payback is its simplicity. It is easy to compute and understand. No assumptionsare required about the appropriate opportunity cost of capital for the particular project.
However, payback ignores the time value of money. Two projects are viewed as equallyattractive if they have the same payback, even though all of the payback may occur in thepayback year for one project but be spread out evenly over time for the other. For example,suppose two projects each require $300,000 investments but one pays $100,000 for threeyears and the other pays nothing for two years and $300,000 in the third year. Each has athree-year payback, but the first is more valuable because the $100,000 payments in years 1and 2 can be earning interest.
Payback also ignores the cash flows beyond the payback period. Thus, payback ignoresthe “profitability” of the project. Two projects with the same investments and same cashflows per year up to the payback year have the same payback. But if one investment hasno cash flows beyond the payback year and the other investment does, clearly the latterinvestment has a higher net present value.
Finally, payback lacks a benchmark for deciding which projects to accept and which toreject. What payback cutoff should the firm use as a criterion for project selection? Is athree-year payback good or bad? In contrast, the discounted cash flow method uses the op-portunity cost of capital to discount the cash flows. If a project has a positive NPV usingthe opportunity cost of capital, the project is accepted. The benchmark in DCF analysis isthe existence of a positive NPV. But no such benchmark exists for payback.
Advocates of payback argue that net present value, even after future cash flows are dis-counted, places too much emphasis on cash flows received in the future. Some managers be-lieve that it is very difficult to forecast cash flows accurately beyond three or four years. Thus,they place very little weight on these cash flows. However, net present value mathematics au-tomatically incorporates the higher uncertainty of the more distant cash flows. These inherentlyriskier future cash flows are discounted by larger discount factors. The cash flow in year t isdiscounted by 1/(1 � r)t where r is the appropriate risk-adjusted discount rate. As t increases,the discount rate becomes smaller. The exclusive use of payback to evaluate investment pro-jects tends to cause a firm to focus on short-term cash flows and ignore long-term rewards.
Another method for project evaluation is the accounting rate of return. A project’s account-ing rate of return, also called return on investment (ROI), is
ROI =
Average annual income from the project
Average annual investment in the project
2. AccountingRate of Return
1. Payback
zim36725_ch03_089-134.qxd 12/15/09 12:25 PM Page 109

TABLE 3–10 Average Net Income and Average Book Value of Investment
Average Net Book Value
Year Income of Investment
1 $900,000 $9,000,0002 900,000 7,000,0003 900,000 5,000,0004 900,000 3,000,0005 900,000 1,000,000
Average $900,000 $5,000,000
Consider the following investment of $10 million in a project that has a five-year life andno salvage value. The project’s income in each of the next five years is
Operating income $3,500,000Depreciation (straight-line) (2,000,000)
Net income before taxes $1,500,000Taxes (40%) (600,000)
Net income $ 900,000
The average net income and average investment are calculated in Table 3–10. Given the av-erage net income and average investment, we can compute the project’s ROI:
The accounting rate of return has the advantage of being easy to calculate, and itrelates to the firm’s accounting statements, which are familiar to managers. The problemis that it can lead to incorrect investment decisions. For example, suppose that a securitypurchased today for $100 pays $2,000 in 50 years. This security has the following ROI:
This security has a 40 percent accounting rate of return. Suppose the market rate ofreturn is 10 percent. Using the accounting rate of return as our investment criterion, this
= 40%
ROI =
$40
$100
= $40
Average annual cash inflow =
$2,000
50 years
= 18%
=
$900,000
$5,000,000
ROI =
Average annual income from project
Average annual investment in the project
110 Chapter 3
zim36725_ch03_089-134.qxd 12/15/09 12:25 PM Page 110

Opportunity Cost of Capital and Capital Budgeting 111
investment appears quite attractive. But compute its net present value:
Actually, this investment has a negative net present value. Alternatively, investing the $100at 10 percent would yield $11,739 in 50 years.
The accounting rate of return results in incorrect decisions because it ignores the timevalue of money. Calculating ROI involves computing the average annual income from theproject. A dollar of income received today is treated the same as a dollar of income receivedin the future. The fact that these dollars are worth different amounts is ignored whenaccounting ROI is computed.
The internal rate of return (IRR) method for comparing different projects appears on thesurface to be very similar to the DCF method. The IRR method finds the interest rate thatequates the initial outlay to the discounted future cash flows. If the project’s internal rate ofreturn exceeds a certain cutoff rate (e.g., the project’s cost of capital), the project should beundertaken. For example, suppose an investment of $1,000 today generates $1,070 in ayear. We can solve for the internal rate of return (IRR) or the interest rate that equates thetwo cash flows:
In this very simple example, the internal rate of return on an investment of $1,000 todaythat generates a $1,070 payment in one year is 7 percent. If the cost of capital is 5 percent,then this investment offers a return in excess of its opportunity cost. The net present valueof this investment is
Since the internal rate of return exceeds the cost of capital and the net present value is pos-itive, both investment criteria give the same answer. The investment should be undertaken.
= $19.05
= -$1,000 + $1,019.05
NPV = -$1,000 +
$1,070
1.05
IRR = 0.07 = 7%
(1 + IRR) =
$1,070
$1,000
$1,000 =
$1,070
(1 + IRR)
PV =
FV
(1 + IRR)
3. Internal Rateof Return (IRR)
= -$82.96
= -$100 + $17.04
= -$100 +
$2,000
117.391
= -$100 +
$2,000
(1 + 0.10)50
NPV = - Initial investment +
FV
(1 + r)n
zim36725_ch03_089-134.qxd 12/15/09 12:25 PM Page 111

The advantage of IRR is that an investment project’s return is stated as an interest rate.Some argue that it is easier to understand a project’s return as 14 percent than to understandthat it has a net present value of $628,623.
But the IRR and DCF (or net present value) methods do not always give consistentanswers. Consider the following two mutually exclusive investments:
Investment 1: Invest $1,000 today and receive $1,070 in one year.
Investment 2: Invest $5,000 today and receive $5,300 in one year.
We know from the above that Investment 1 has an IRR of 7 percent and an NPV of $19.05.For Investment 2,
Which investment is better? The IRR criterion says Investment 1 is better becauseit has the higher IRR. But the net present value (DCF) criterion says Investment 2 isbetter because it has the higher NPV. Which is more valuable: a rate of return or cash?Net present value indicates how much cash in today’s dollars an investment is worth, orthe magnitude of the investment’s return. The IRR indicates only the relative return onthe investment. A 20 percent return on $1,000 ($20) is preferable to a 200 percent returnon $1 ($2).
The fact that IRR and DCF can give inconsistent answers is not the only problemwith the internal rate of return method. The IRR method also can give multiple rates forthe same cash flows. Consider the following investment: $72,727 is received today inexchange for a promise to pay $170,909 next year; at the end of year 2, another$100,000 is received. To compute the IRR of this investment, solve the followingequation:
Let
Then rewrite the formula as
PV � $100,000x2 � $170,909x � $72,727
Figure 3–3 plots the net present value of the preceding equation as a function of thediscount rate. Notice that at discount rates of 10 percent and 25 percent, the net present
x =
1
1 + IRR
PV = $72,727 -
$170,909
(1 + IRR)+
$100,000
(1 + IRR)2= 0
= $47.62
= -$5,000 + $5,047.62
NPV = -$5,000 +
$5,300
1.05
IRR = 0.06 = 6%
(1 + IRR) =
$5,300
$5,000
$5,000 =
$5,300
(1 + IRR)
112 Chapter 3
zim36725_ch03_089-134.qxd 12/15/09 12:25 PM Page 112

Opportunity Cost of Capital and Capital Budgeting 113
4An exact numerical solution for the IRR can be found using the quadratic formula:
ax2 � bx � c � 0
where
Substitute the values of a, b, and c into the quadratic formula and solve for x:
or
Since
then
and
IRR2 =
1
0.79998- 1 = 0.25 = 25%
IRR1 =
1
0.90911- 1 = 0.10 = 10%
IRR =
1
x- 1
x =
1
1 + IRR
x2 = 0.79998x1 = 0.90911 and
x =
$170,909 ; $10,913
$200,000
c = $72,727
b = -$170,909
a = $100,000
x =
-b ; 2b2- 4ac
2a
Netpresentvalue
010% 25%
Internalrate ofreturn
FIGURE 3–3
The net present valueof investment as afunction of theinternal rate of return(IRR). Investment:Receive $72,727today and $100,000in two years, but pay$170,909 next year.
value of the investment is zero; the curve crosses the x-axis in two places.4 Thus, this par-ticular investment has two discount rates that equate the investment cash inflows and out-flows: 10 percent and 25 percent. Which is the right IRR for evaluating this project? As itturns out, if the cost of capital is less than 10 percent or greater than 25 percent, this pro-ject has a positive NPV and should be accepted. If the cost of capital is between 10 and25 percent, the project has a negative NPV and should be rejected.
So far the examples have illustrated how internal rates of return are computed whenthere are two or three cash flows. With more than three cash flows, trial-and-error search isused to compute the IRR. Set up the problem as a standard discounted cash flow computa-tion except you do not know the discount rate. Guess at a beginning discount rate (forexample, 15 percent) and use this rate to compute the NPV. If the resulting NPV is positive,raise the discount rate (20 percent) and recompute the NPV. If the new NPV is now negative
zim36725_ch03_089-134.qxd 12/15/09 12:25 PM Page 113

TABLE 3–11 Survey of Basic Capital Budgeting Techniques Used in Practice
Percent Using Mean Score (Max 4)Always or Almost
Always Small Firms Large Firms
Net present value 74.9 2.83 3.42Payback period 56.7 2.72 2.25Accounting rate of return 20.3 1.41 1.25Internal rate of return 75.6 2.87 3.41
SOURCE: Graham and Harvey (2001).
5J Graham and C Harvey, “The Theory and Practice of Corporate Finance: Evidence from the Field,”Journal of Financial Economics 60 (2001), pp. 187–243.
with the revised discount rate, try a lower discount rate (18 percent). Continue this trial-and-error procedure until the NPV of the project is very close to zero. The discount rate thatcauses the NPV to be zero is the IRR.
Figure 3–3 illustrates that in some cases the IRR method can yield multiple internalrates of return. In other cases, no internal rate of return can be computed even though theproject has a positive NPV. These problems can make it difficult to implement the IRRmethod.
But perhaps the most serious problem with the internal rate of return method involvesits reinvestment rate. The reinvestment rate is the interest rate used to compound cashflows received or paid over the life of the project. In the discounted cash flow method,each cash flow is discounted at the opportunity cost of capital. The implicit assumption inDCF is that intermediate cash flows are being reinvested at the market’s rate of interest. Ifthe market rate of interest is expected to be higher or lower in future years, nonconstantdiscount rates can be used. The IRR method assumes that all of the intermediate cashflows are being automatically reinvested at the project’s constant internal rate of return.Thus, the IRR method implicitly assumes that the intermediate cash flows can be investedin a stock of projects identical to the one being considered and that the same internal rateof return can be achieved. If this is a one-time project, there are no projects like it in thefuture in which to reinvest the project’s cash flows. Therefore, the internal rate of returnmethod overstates a project’s rate of return if other investments with the same reinvest-ment rate do not exist.
Based on the preceding discussions of internal rate of return, payback, and accountingrate of return, the theoretically correct method for comparing cash inflows and outflowsthat occur at different points of time is the discounted cash flow (net present value) method.
This section describes a survey of capital budgeting methods used in practice.5 Table 3–11reports the results of a survey of the capital budgeting procedures of around 400 large andsmall publicly traded U.S. firms. The following capital budgeting evaluation techniqueswere listed: net present value, payback, accounting rate of return, and internal rate of re-turn. Each firm was asked to score how frequently it used each of the capital budgetingtechniques on a scale of 0 to 4 where 0 means “never” and 4 means “always.” Firms can,and usually do, use multiple methods.
4. Methods Usedin Practice
114 Chapter 3
zim36725_ch03_089-134.qxd 12/15/09 12:25 PM Page 114

Opportunity Cost of Capital and Capital Budgeting 115
The first thing to note from Table 3–11 is the relatively high usage of the two dis-counting methods: net present value and internal rate of return. Results show 74.9 percentof the firms always or almost always (responses of 4 and 3) use net present value and 75.6percent always or almost always use internal rate of return. Payback is used always or al-most always by 56.7 percent of firms, but only 20.3 percent of the firms always or almostalways use accounting rate of return. It is somewhat surprising that payback is used to thisextent given its known drawbacks. The second noteworthy fact is that large firms (thosewith at least $1 billion sales) are much more likely to use net present value (3.42) thansmall firms (2.83). The same holds for internal rate of return. Large firms are more likelyto use IRR than small firms. However, small firms are more likely to use payback (2.72)than large firms (2.25). Large and small firms use accounting rate of return with roughlythe same level of infrequency.
Q3–12 What are three problems with basing investment decisions oninternal rate of return?
Q3–13 Why is a dollar of initial investment in a building morevaluable than a dollar of initial investment in land or workingcapital?
Q3–14 Why are cash flows but not accounting earnings discountedin capital budgeting analyses?
F. SummaryChapter 2 discussed opportunity cost as the benefit forgone from a specific decision. The benefit for-gone by delaying a dollar today for a dollar in the future is the interest that could be earned on thatdollar. A fundamental law of finance states that a dollar today is worth more than a dollar tomorrow.Making a decision that affects cash flows over time requires a mechanism for comparing current cashflows with future cash flows. This chapter demonstrates that discounted cash flow (net present value)analysis is the theoretically correct way to evaluate decisions that have multiperiod cash flow impli-cations. Therefore, compound interest formulas are important mechanisms for comparing multiyearcash flow streams.
To simplify the presentation of concepts, the analysis initially assumed a zero-inflation, risklessworld with no transactions costs. In such a world, a single risk-free rate of return would prevail; thisriskless return is the opportunity cost of capital. All cash flow streams would be discounted at thisriskless rate of return. If a cash flow stream’s net present value is positive, then this stream should beaccepted because its benefits exceed its opportunity cost.
But the world is not inflation-free and riskless. Therefore, the simple discounting mechanismswere modified in the following ways:
• Discount expected cash flows using the rate of return offered by an investment ofcomparable risk. The discount rate from an investment of comparable risk is theopportunity cost for bearing the risk in the project being evaluated.
• Discount nominal cash flows using nominal discount rates. Market interest rates are statedin nominal terms; they contain both a real interest rate and an inflation element. Therefore,in projecting cash flows, be sure to increase future cash flows by the amount of expectedinflation when using nominal (market) discount rates. However, some future cash flows are
ConceptQuestions
zim36725_ch03_089-134.qxd 12/15/09 12:25 PM Page 115

116 Chapter 3
contractually fixed, such as home or car loans or government and corporate bondrepayments. These should not be increased for inflation.
Another very important consideration in valuing future cash flow streams is the effect of taxes,especially depreciation tax shields. Depreciation tax shields reduce future tax payments by theamount of the tax-allowed depreciation expense for initial capital investments. The tax-allowed de-preciation methods should be used, not the depreciation methods used for external financial reportsto shareholders.
It is important to realize that the value of the firm increases by the net present value of theinvestment project. For example, suppose the firm can invest $10 million in a project generatingdiscounted cash flows of $13 million. This investment project with a net present value of $3 millionincreases the value of the firm by $3 million.
The final topic was alternative investment criteria: payback, accounting rate of return, and in-ternal rate of return. Payback and accounting rate of return are simpler than net present value, butthey can often lead to incorrect decisions because they do not incorporate the opportunity cost of cap-ital. Internal rate of return is very similar to net present value, but it too has some problems. First,people want to maximize dollars in their pocket, not rates of return. Second, internal rate of return canyield multiple rates of return or no rates of return on projects, which is confusing and can lead to er-rors in accepting or rejecting projects. But the most serious problem is that IRR assumes there areother projects with the same rate of return as the project under consideration in which to invest theinterim cash flows from the original project. This assumption can distort the project’s profitabilityand lead to decision errors.
Managers can avoid all of these problems by following the net present value rule: Acceptprojects with positive expected nominal after-tax cash flows discounted using risk-adjusted nominalrates of return.
Self-Study ProblemsSelf-Study Problem 1: Avroland
Avroland is an amusement park in California. It currently uses a computer system to perform gen-eral accounting functions, including tracking ticket sales and payroll as well as employee andmaintenance scheduling functions. The original system cost $300,000 when purchased two yearsago. It has been depreciated for tax purposes using straight-line depreciation with an expecteduseful life of four more years and a zero salvage value. However, due to recent expansion, thecomputer system is no longer large enough. Upgrading the system to increase the storage capac-ity and processing speed to accommodate the extra data processing demands costs $65,000, andthe upgraded system becomes obsolete in four years. These system additions also would be de-preciated using straight-line depreciation and would have a zero salvage value. The company’s ac-countant estimates that the firm will increase operating spending by $28,000 a year after taxes fordata processing, payroll (including Avroland personnel), and annual updates of software for theupgraded system. Alternatively, the firm could outsource payroll to a local payroll processingfirm at the cost of $40,000 a year after taxes. This would free up enough capacity in the computerto avoid upgrading the machine. Assume a real cost of capital of 4 percent and a tax rate of40 percent.
What should Avroland do?
Solution:
If Avroland continues to process its payroll internally, it must pay to upgrade the computer plus paythe variable cost of processing the information minus the tax savings from depreciating the upgradedmachine. Outsourcing payroll costs $40,000 per year. Over the next four years, Avroland’s cash flowswould be as follows under the two possibilities:
zim36725_ch03_089-134.qxd 12/15/09 12:25 PM Page 116
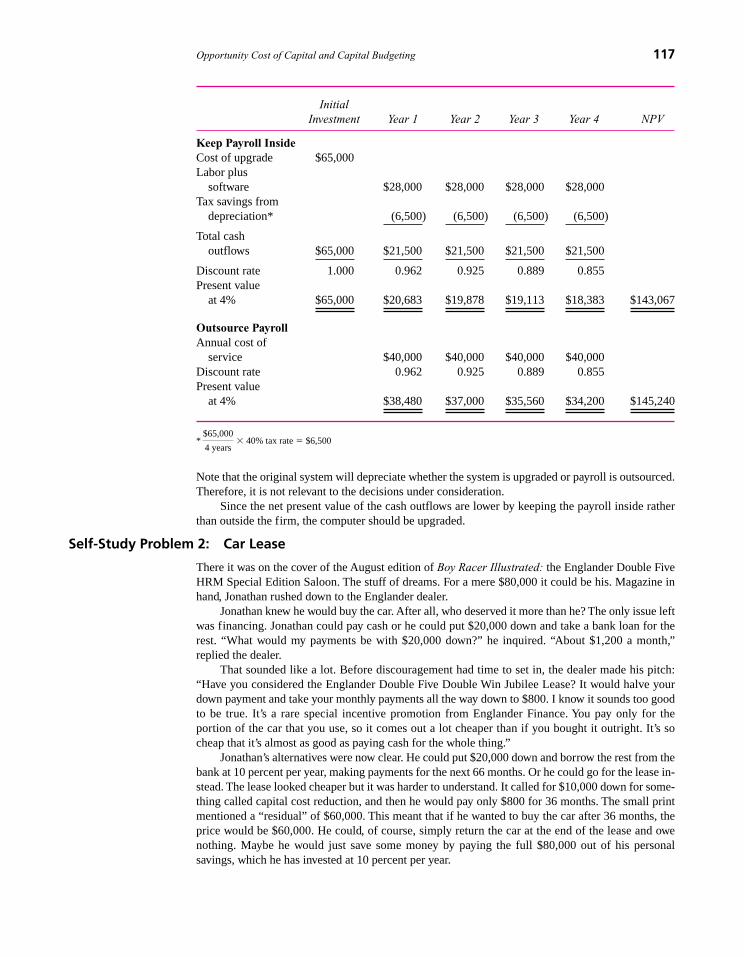
Opportunity Cost of Capital and Capital Budgeting 117
Initial Investment Year 1 Year 2 Year 3 Year 4 NPV
Keep Payroll InsideCost of upgrade $65,000Labor plus
software $28,000 $28,000 $28,000 $28,000Tax savings from
depreciation* (6,500) (6,500) (6,500) (6,500)
Total cash outflows $65,000 $21,500 $21,500 $21,500 $21,500
Discount rate 1.000 0.962 0.925 0.889 0.855Present value
at 4% $65,000 $20,683 $19,878 $19,113 $18,383 $143,067
Outsource PayrollAnnual cost of
service $40,000 $40,000 $40,000 $40,000Discount rate 0.962 0.925 0.889 0.855Present value
at 4% $38,480 $37,000 $35,560 $34,200 $145,240
* � 40% tax rate � $6,500
Note that the original system will depreciate whether the system is upgraded or payroll is outsourced.Therefore, it is not relevant to the decisions under consideration.
Since the net present value of the cash outflows are lower by keeping the payroll inside ratherthan outside the firm, the computer should be upgraded.
Self-Study Problem 2: Car Lease
There it was on the cover of the August edition of Boy Racer Illustrated: the Englander Double FiveHRM Special Edition Saloon. The stuff of dreams. For a mere $80,000 it could be his. Magazine inhand, Jonathan rushed down to the Englander dealer.
Jonathan knew he would buy the car. After all, who deserved it more than he? The only issue leftwas financing. Jonathan could pay cash or he could put $20,000 down and take a bank loan for therest. “What would my payments be with $20,000 down?” he inquired. “About $1,200 a month,”replied the dealer.
That sounded like a lot. Before discouragement had time to set in, the dealer made his pitch:“Have you considered the Englander Double Five Double Win Jubilee Lease? It would halve yourdown payment and take your monthly payments all the way down to $800. I know it sounds too goodto be true. It’s a rare special incentive promotion from Englander Finance. You pay only for theportion of the car that you use, so it comes out a lot cheaper than if you bought it outright. It’s socheap that it’s almost as good as paying cash for the whole thing.”
Jonathan’s alternatives were now clear. He could put $20,000 down and borrow the rest from thebank at 10 percent per year, making payments for the next 66 months. Or he could go for the lease in-stead. The lease looked cheaper but it was harder to understand. It called for $10,000 down for some-thing called capital cost reduction, and then he would pay only $800 for 36 months. The small printmentioned a “residual” of $60,000. This meant that if he wanted to buy the car after 36 months, theprice would be $60,000. He could, of course, simply return the car at the end of the lease and owenothing. Maybe he would just save some money by paying the full $80,000 out of his personalsavings, which he has invested at 10 percent per year.
$65,000
4 years
zim36725_ch03_089-134.qxd 12/15/09 12:25 PM Page 117

Required:
a. Calculate Jonathan’s monthly payments if he took the bank loan. What would his totalcash outlay be if he purchased the car in this manner? Does your answer demonstratethat Jonathan could save money by self-financing the purchase? Why or why not?
b. Compare the present value of leasing against that of buying. Which is the better choice?Suppose that Jonathan had good reason to expect that his Double Five would be worth atleast $65,000 at the end of three years. Would this fact change your analysis? What if theexpected value would be $55,000? What does your analysis of these hypothetical situationstell you about the economic value of the Englander lease?
Solution:
a. To calculate Jonathan’s monthly payments, we must convert the given annual rate, r, to amonthly rate, rm. As explained in this chapter’s discussion of multiple cash flows within ayear, the formula is
For r � 10%, the monthly rate would be
rm � (1 � 0.1)1/12 � 1
� (1.1)1/12 � 1
� 0.007974
The present value of the loan is, obviously, the amount being borrowed, which is thecost of the car less the down payment. PV � $80,000 � $20,000 � $60,000. The numberof monthly payments is given in the problem as 66. With these figures, one can solve forthe monthly payment by using the present value of an annuity formula:
Jonathan’s monthly payments would be $1,172.74 for the life of the loan. The total ofhis monthly payments would be the amount of each payment times the number of months.Adding the down payment, the total cash outlay via borrowing is
$1,172.74 � 66 � $20,000 � $97,401
The fact that this figure is greater than the $80,000 purchase price of the car isprobably the source of the contention that paying the whole amount up front ischeaper than bank financing. This analysis is fallacious because it ignores theopportunity cost of money; it should not be taken as a demonstration of any costsavings. Indeed, given that 10 percent is a fair market price for such a loan, there is noreason to suppose that Jonathan would have a preference between paying cash and bankfinancing.
b. Although the terms of the lease are somewhat different from those of the loan, it isreasonable to accept, for determining the present value of the lease, the annual discount
= $1,172.74
FV =
$60,000
51.162
60,000 =
FV
0.007974 ¢1 -
1
1.00797466 ≤
PV =
FV
r c1 -
1
(1 + r)n d
rm = (1 + r)1�12- 1
118 Chapter 3
zim36725_ch03_089-134.qxd 12/15/09 12:25 PM Page 118
Opportunity Cost of Capital and Capital Budgeting 119
rate of 10 percent and, therefore, the monthly discount rate of 0.7974 percent. The presentvalue of an annuity formula is used. In this case, n � 36 and FV � $800:
To buy the car through the Double Five lease, Jonathan would have to pay the residualof $60,000 at the end of the lease. As stated in the text,
PV � FV � (1 � r)n
The period of the lease is three years and the annual rate is 10 percent. (Monthlyfigures could, of course, be used for r and n, but calculations are simpler in this case ifannual figures are used.) FV is the single payment of $60,000. Accordingly,
Additionally, the $10,000 up-front fee also must be considered. Since it is paid at thetime of acquisition, it is not discounted. When all stated cash flows for purchasing via thelease are considered,
PVlease � $24,950 � $45,079 � $10,000
� $80,029
On the face of it, it looks as if Jonathan should be indifferent between leasing andbuying. However, the above analysis does not tell the entire story. Suppose Jonathan livesin an area where Englanders are particularly desirable. If the market value of the car isexpected to be $65,000 at the end of the lease, Jonathan could then expect to buy the car at$5,000 below market value. This expectation ought to have value and could fairly beconsidered to be worth $5,000 � 1.13 � $3,757. One could then argue that, in thiscircumstance, leasing is cheaper than buying:
PVlease � $80,029 � $3,757 � $76,272
What is most interesting here is that the same conclusion can be reached even if theresidual is overpriced. Suppose Jonathan conducted business with the Englander dealer basedupon the expectation that his Double Five would be worth $60,000 after three years, but thereal market value turns out to be only $55,000 at the end of the lease. If Jonathan buys thecar, he will bear the risk of such unexpected devaluation. However, if he leases it, he does notbear the risk of an unexpected decline in value. The option to purchase at the residual price atthe end of the lease allows the lessee to reap the rewards for which the lessor bears the risk.
Obviously, such an option has economic value and deserves to be part of any analysisof Jonathan’s alternatives. Although assigning a value to such an option is beyond thescope of this problem, one is inclined to believe that it would be worth more than $29. Ifthis option is included and all other factors are held constant, Jonathan should preferleasing to buying.
= $45,079
=
$60,000
1.331
PV =
$60,000
1.13
= $24,950
=
$800
0.007974 ¢1 +
1
1.00797436 ≤
= $800 *
1.00797436- 1
0.007974(1.007974)36
PV =
FV
r c1 -
1
(1 + r)n d
zim36725_ch03_089-134.qxd 12/16/09 8:42 AM Page 119

ProblemsP 3–1: IRR Problem
A present investment of $50,000 is expected to yield receipts of $8,330 a year for seven years.What is the internal rate of return on this investment? (Show your calculations.)
P 3–2: Accelerated Depreciation Problem
Is it preferable to use an accelerated depreciation method rather than the straight-line method fortax purposes?
P 3–3: Jasper, Inc.
Jasper, Inc., is considering two mutually exclusive investments. Alternative A has a current outlay of$300,000 and returns $100,300 a year for five years. Alternative B has a current outlay of $150,000and returns $55,783 a year for five years.
Required:
a. Calculate the internal rate of return for each alternative.
b. Which alternative should Jasper take if the required rate of return for similar projects in thecapital market is 15 percent?
P 3–4: Just One, Inc.
Just One, Inc., has two mutually exclusive investment projects, P and Q, shown below. Suppose themarket interest rate is 10 percent.
Initial Project Investment Year 1 Year 2 IRR NPV (r � 10%)
P �$200.00 $140.00 $128.25 22.4% $33.26Q � 100.00 80.00 56.25 25.0 19.21
The ranking of projects differs, depending on the use of IRR or NPV measures. Which project shouldbe selected? Why is the IRR ranking misleading?
P 3–5: Equity Corp.
Equity Corp. paid a consultant to study the desirability of installing some new equipment. The con-sultant recently submitted the following analysis:
Cost of new machine $100,000Present value of after-tax revenues from operation 90,000Present value of after-tax operating expenses 20,000Present value of depreciation expenses 87,500Consulting fees and expenses 750
The corporate tax rate is 40 percent. Should Equity Corp. accept the project?
P 3–6: Declining Market, Inc.
Declining Market, Inc., is considering the problem of when to stop production of a particular productin its product line. Sales of the product in question have been declining and all estimates are that theywill continue to decline. Capital equipment used to manufacture the product is specialized but can be
120 Chapter 3
zim36725_ch03_089-134.qxd 12/15/09 12:25 PM Page 120

Opportunity Cost of Capital and Capital Budgeting 121
readily sold as used equipment. What, if anything, is wrong with a decision rule for this case thatsays, “Keep producing the product as long as its contribution to net earnings is positive”? [Contribu-tion to net earnings, where � is the tax rate, is (1 � �) (Sales � Variable cost � Depreciation onequipment used to manufacture product).]
P 3–7: Northern Sun, Inc.
At the beginning of year 1, Northern Sun, Inc., a food processing concern, is considering a new lineof frozen entrees. The accompanying table shows projected cash outflows and inflows. Assume thatall inflows and outflows are end-of-period payments.
Cash Outflows ($000s)
Initial Investment
Year 1 Year 2 Year 3 Year 4 Year 5
R&D $(200)Packaging and design (55)Product testing (100) $ (50)Marketing $ (15) $ (10) $ (10) (10)Distribution (30) (50) (50) (50)Cash inflow 100 250 300 300
Net cash flows $(355) $ 55 $190 $240 $190
Required:
The company’s cost of capital is 10 percent. Compute the following:
a. Net present value.
b. Payback.
P 3–8: Ab Landlord
Ab Landlord owns a dilapidated 30-year-old apartment building in Los Angeles. The net cash flowfrom renting the apartments last year was $200,000. She expects that inflation will cause the net cashflows from renting the apartments to increase at a rate of 10 percent per year (next year’s net cashflows will be $220,000, the following year’s $242,000, etc.). The remaining useful life of the apart-ment building is 10 years. A developer wants to buy the apartment building from Landlord, demolishit, and construct luxury condominiums. He offers Landlord $1.5 million for the apartments.
Assume there are no taxes. The market rate of return for investments of this type is 16 percentand is expected to remain at that level in the future. The 16 percent interest rate includes an expectedinflation rate of 10.5 percent. The real rate of interest is 5 percent:
1.16 � (1.05)(1.105)
Required:
a. Evaluate the developer’s offer and make a recommendation to Landlord. Support yourconclusions with neatly labeled calculations where possible. Note that the $1.5 millionpurchase offer would be paid immediately, whereas the first cash flow from retaining thebuilding is not received until the end of the first year.
b. Suppose that Los Angeles imposes rent controls, so that Landlord will not be able toincrease her rents except to the extent justified by increases in costs such as maintenance.Effectively, the future net cash flows from rents will remain constant at $200,000 per year.Does the imposition of rent controls change Landlord’s decision on the developer’s offer?Support your answer with neatly labeled calculations where possible.
zim36725_ch03_089-134.qxd 12/16/09 8:42 AM Page 121

P 3–9: Lottery
Suppose the market rate of interest is 10 percent and you have just won a $1 million lottery that enti-tles you to $100,000 at the end of each of the next 10 years.
Required:
a. What is the minimum lump-sum cash payment you would be willing to take now in lieu ofthe 10-year annuity?
b. What is the minimum lump sum you would be willing to accept at the end of the 10 yearsin lieu of the annuity?
c. Suppose three years have passed; you have just received the third payment and you haveseven left when the lottery promoters approach you with an offer to settle up for cash.What is the minimum you would accept at the end of year 3?
d. How would your answer to (a) change if the first payment came immediately (at t � 0) andthe remaining payments were at the beginning instead of the end of each year?
P 3–10: Mr. Jones’s Retirement
Mr. Jones intends to retire in 20 years at the age of 65. As yet he has not provided for retirement in-come, and he wants to set up a periodic savings plan to do this. If he makes equal annual paymentsinto a savings account that pays 4 percent interest per year, how large must his payments be to ensurethat after retirement he will be able to draw $30,000 per year from this account until he is 80?
P 3–11: NPV vs. Payback
An investment under consideration has a payback of five years and a cost of $1,200. If the requiredreturn is 20 percent, what is the worst-case NPV? Explain fully.SOURCE: R. Watts.
P 3–12: Simple Investment
An investment opportunity that will involve an investment of $1,000 will generate $300 per year forfive years and then earn $140 per year forever.
What is the net present value of this investment, assuming the interest rate is 14 percent?SOURCE: R. Watts.
P 3–13: Demand for DVD Players
The demand for DVD players is expanding rapidly, but the industry is highly competitive. A plant tomake DVD players costs $40 million, has an annual capacity of 100,000 units, and has an indefinitephysical life. The variable production cost per unit is $20 and is not expected to change. If the cost ofcapital is 10 percent, what is the price of a DVD player?SOURCE: R. Watts.
P 3–14: Clean Tooth
Several years ago, your firm paid $25,000,000 for Clean Tooth, a small, high-technology companythat manufactures laser-based tooth cleaning equipment. Unfortunately, due to extensive productionline and sales resistance problems, the company is considering selling the division as part of a“modernization program.” Based on current information, the following are the estimated accountingnumbers if the company continues to operate the division:
Estimated cash receipts, next 10 years $500,000/year
Estimated cash expenditures, next 10 years $450,000/year
Current offer for the division from another firm $250,000
122 Chapter 3
zim36725_ch03_089-134.qxd 12/15/09 12:25 PM Page 122

Opportunity Cost of Capital and Capital Budgeting 123
Assume
1. The firm is in the 0 percent tax bracket (no income taxes).
2. There are no additional expenses associated with the sale.
3. After year 10, the division will have sales (and expenses) of 0.
4. Estimates are completely certain.
Should the firm sell the division for $250,000?
P 3–15: New Car
You are considering buying a $50,000 car. The dealer has offered you a 13.6 percent loan with 30equal monthly payments. On questioning him, you find that the interest charge of $17,000 (or 0.136� $50,000 � 2.5 years) is added to the $50,000 for a total amount of $67,000. The payments are$2,233.33 a month ($67,000 � 30). What is the approximate effective annual interest rate?
P 3–16: National Taxpayers Union
Using your knowledge of the relationship between inflation and nominal interest rates, and assumingthat the savings were invested in government bills, comment briefly on the analysis presented in thefollowing letter from the National Taxpayers Union:
Dear Friend:You know how much it costs you to join National Taxpayers Union—$15 a year. You may
think that you can save that $1.25 a month by not confirming your membership. But are yousure? Is it really cheaper for you not to join than it is to pitch in and fight?
Consider this simple arithmetic: Before taxes were raised to their present level, the averagefamily saved $1,000 per year. You may have saved this much in the past. Over your 45-year workcycle this savings, with compound interest, should accumulate to $230,000. That would yield anannual income of $13,800 without ever touching the principal.
But when inflation rose to 6 percent, it canceled out the interest rate, reducing the value ofyour savings to the amount that you put in—$45,000.
With inflation as it is today, the value of your savings would end up being worth only about$16,000, which could yield a monthly income worth only about $70. That represents a clear anddirect loss to you of more than $1,000 per month of retirement income plus more than $200,000of capital confiscated through riskless government.
Think about it. The cost of big government to you is enormous and growing. Even if youdon’t think you have that much to lose, you do. Everything you have left will be wiped outunless there is a massive “taxpayers’ revolt” to bring inflation and high taxes under control.The $1.25 per month that you spend to support this effort is a bargain considering that thecertain alternative is bankruptcy for you and the whole country.
P 3–17: Federal Dam Project
Farmers in a valley are subject to occasional flooding when heavy rains cause the river to overflow. Theyhave asked the federal government to build a dam upstream to prevent flooding. The construction costof this project is to be repaid by the farm owners without interest over a period of years. The cost is $300an acre. If a farm has 100 acres, a total of $30,000 is to be repaid. No payments at all are to be made forthe first five years. Then $1,000 is to be paid at the end of each year for 30 years to pay off the $30,000.
Is the farmer receiving a subsidy? Why? If the interest rate is 10 percent, what is the approxi-mate capitalized value of the subsidy (if any)? Show all calculations.
P 3–18: South American Mining
Suppose that a mining operation has spent $8 million developing an ore deposit in South America. Cur-rent expectations are that the deposit will require two years of development and will result in a realizablecash flow of $10 million at that time. The company engineer has discovered a new way of extracting theore in only one year, but the procedure would necessitate an immediate outlay of $1 million.
zim36725_ch03_089-134.qxd 12/15/09 12:25 PM Page 123

Required:
a. Compute the IRR for the new outlay. (Note: There are two solutions! One is 787 percent.Find the other one.)
b. Based on your answer to (a), use the IRR criterion to determine if the company shouldmake the outlay. Assume the market interest rate is 15 percent on one- and two-year bonds.
P 3–19: House Mortgage
You have just purchased a house and have obtained a 30-year, $200,000 mortgage with an interest rateof 10 percent.
Required:
a. What is your annual payment?
b. Assuming you bought the house on January 1, what is the principal balance after one year?After 10 years?
c. After four years, mortgage rates drop to 8 percent for 30-year fixed-rate mortgages. Youstill have the old 10 percent mortgage you signed four years ago and you plan to live in thehouse for another five years. The total cost to refinance the mortgage is $3,000, includinglegal fees, closing costs, and points. The rate on a five-year CD is 6 percent. Should yourefinance your mortgage or invest the $3,000 in a CD? The 6 percent CD rate is youropportunity cost of capital.
P 3–20: Flower City Grocery
The Flower City Grocery is faced with the following capital budgeting decision. Its display freezersystem must be repaired. The cost of this repair will be $1,000 and the system will be usable for an-other five years. Alternatively, the firm could purchase a new freezer system for $5,000 and sell theold one for $500. The new freezer system has more display space and will increase the profits attrib-utable to frozen foods by 30 percent. Profits for that department were $5,000 in the last fiscal year.The company’s cost of capital is 9 percent. Ignoring taxes, what should the firm do?
P 3–21: Toledo Stadium
The city of Toledo has received a proposal to build a new multipurpose outdoor sports stadium. Theexpected life of the stadium is 20 years. It will be financed by a 20-year bond paying 8 percent inter-est annually. The stadium’s primary tenant will be the city’s Triple-A baseball team, the Red Hots. Theplan’s backers anticipate that the site also will be used for rock concerts and college and high schoolsports. The city does not pay any taxes. The city’s cost of capital is 8 percent. The costs and estimatedrevenues are presented below.
Cash OutflowsConstruction costs $12,000,000General maintenance (including labor) $250,000 per year
Cash InflowsRed Hots’ lease payment $650,000 per yearConcerts $600,000 per yearCollege and high school sports $50,000 per year
Required:
a. Should the city build the stadium? (Assume payments are made at the end of the year.)
b. The Red Hots have threatened to move out of Toledo if they do not get a new stadium. Thecity comptroller estimates that the move will cost the city $350,000 per year for 10 years inlost taxes, parking, and other fees. Should the city build the stadium now? State yourreasoning.
124 Chapter 3
zim36725_ch03_089-134.qxd 12/15/09 12:25 PM Page 124

Opportunity Cost of Capital and Capital Budgeting 125
P 3–22: PQR Coal Company
The PQR Coal Company has several conventional and strip mining operations. Recently, new legisla-tion has made strip mining, which produces coal of high sulfur content, unprofitable, so those opera-tions will be discontinued. Unfortunately, PQR purchased $1 million of earth-moving equipment for thestrip mines two years ago and this equipment is not particularly well-suited to conventional mining.
Ms. Big, the president, suggests that since the equipment can be sold for $500,000, it should bescrapped. In her words, “I learned a long time ago that when you make mistakes it’s best to admitthem and take your lumps. By ignoring sunk costs you aren’t tempted to throw good money after bad.The original value of the equipment is gone.”
A new employee, Mr. Embeay, has suggested that the equipment should be adapted to the con-ventional operations. He argues, “We are about to spend $800,000 on some new conventional equip-ment. However, for a smaller expenditure of $250,000 we can adapt the old equipment to perform thesame task. Of course, it will cost about $20,000 per year more to operate over the assumed 10-yearlives of each alternative. But at an interest rate of 10 percent, the inclusion of the present value of$20,000 per year for 10 years and the initial $250,000 is still less than $800,000 for new equipment.While it’s true that we should ignore sunk costs, at least this way we can cut our losses somewhat.”
Who’s correct? Why? What should PQR do? Why?
P 3–23: Student Loan Program
The National Direct Student Loan (NDSL) program allows college students to borrow funds from thefederal government. The contract stipulates that the annual percentage rate of interest is 0 percent un-til 12 months after the student ceases his or her formal education (defined as at least half-time en-rollment). At that time, interest becomes 4 percent per year. The maximum repayment period is10 years. Assume that the student borrows $10,000 in the beginning of the first year of college andcompletes his or her education in four years. Loan repayments begin one year after graduation.
Required:
a. Assuming that the student elects the maximum payment period, what are the uniformannual loan repayments? (Assume all repayments occur at the end of the year.)
b. If the rate of interest on savings deposits is 6 percent, what is the minimum amount thestudent has to have in a bank account one year after graduation to make the loan paymentscalculated in (a)?
c. Are recipients of the NDSL program receiving a subsidy? If so, what is the present valueof the subsidy when the loan is taken out?
P 3–24: Geico
Geico is considering expanding an existing plant on a piece of land it already owns. The land was pur-chased 15 years ago for $325,000 and its current market appraisal is $820,000. A capital budgetinganalysis shows that the plant expansion has a net present value of $130,000. The expansion will cost$1.73 million, and the discounted cash inflows are $1.86 million. The expansion cost of $1.73 milliondoes not include any provision for the cost of the land. The manager preparing the analysis argues thatthe historical cost of the land is a sunk cost, and, since the firm intends to keep the land whether ornot the expansion project is accepted, the current appraisal value is irrelevant.
Should the land be included in the analysis? If so, how?
P 3–25: Cost-Saving Device
A proposed cost-saving device has an installed cost of $59,400. It will be depreciated for tax purposeson a straight-line basis over three years (zero salvage), although its actual life will be five years. Thetax rate is 34 percent and the required rate of return on investments of this type is 10 percent.
zim36725_ch03_089-134.qxd 12/15/09 12:25 PM Page 125

What must be the pretax cost savings per year to favor the investment? Assume a zero salvagevalue for the device at the end of the five years.SOURCE: R. Watts.
P 3–26: Depreciation Tax Shield
An investment project involves the purchase of equipment at a cost of $100 million. For tax purposes,the equipment has a life of five years and will be depreciated on a straight-line basis. Inflation is ex-pected to be 5 percent and the real interest rate is 5 percent. The tax rate is 40 percent.
What is the present value of the depreciation tax shield for the machine?SOURCE: R. Watts.
P 3–27: Housing Markets
A home identical to yours in your neighborhood sold last week for $150,000. Your home has a$120,000 assumable, 8 percent mortgage (compounded annually) with 30 years remaining. An as-sumable mortgage is one that the new buyer can assume at the old terms, continuing to make pay-ments at the original interest rate. The house that recently sold did not have an assumable mortgage;that is, the buyers had to finance the house at the current market rate of interest, which is 15 percent.What price should you ask for your home?
A third home, again identical to the one that sold for $150,000, is also being offered for sale. Theonly difference between this third home and the $150,000 home is the property taxes. The $150,000home’s property taxes are $3,000 per year, while the third home’s property taxes are $2,000 per year.The differences in the property taxes are due to vagaries in how the property tax assessors assessedthe taxes when the homes were built. In this tax jurisdiction, once annual taxes are set, they are fixedfor the life of the home. Assuming the market rate of interest is still 15 percent, what should be theprice of this third home?
P 3–28: Mortgage Department
Suppose you are the manager of a mortgage department at a savings bank. Under the state usury law,the maximum interest rate allowed for mortgages is 10 percent compounded annually.
Required:
a. If you granted a $50,000 mortgage at the maximum rate for 30 years, what would be theequal annual payments?
b. If the current market internal rate on similar mortgages is 12 percent, how much moneydoes the bank lose by issuing the mortgage described in (a)?
c. The usury law does not prohibit banks from charging points. One point means that theborrower pays 1 percent of the $50,000 loan back to the lending institution at the inceptionof the loan. That is, if one point is charged, the repayments are computed as in (a), but theborrower receives only $49,500. How many points must the bank charge to earn 12 percenton the 10 percent loan?
P 3–29: Electric Generator
A firm that purchases electric power from the local utility is considering the alternative of generatingits own electricity. The current cost of obtaining the firm’s electricity from its local utility is $42,000per year. The cost of a steam generator (installed) is $140,000 and annual maintenance and fuel ex-penses are estimated at $22,000. The generator is expected to last for 10 years, at which time it willbe worthless. The cost of capital is 10 percent and the firm pays no taxes.
Required:
a. Should the firm install the electric generator? Why or why not?
b. The engineers have calculated that with an additional investment of $40,000, the excesssteam from the generator can be used to heat the firm’s buildings. The current cost of
126 Chapter 3
zim36725_ch03_089-134.qxd 12/15/09 12:25 PM Page 126

Opportunity Cost of Capital and Capital Budgeting 127
heating the buildings with purchased steam is $21,000 per year. If the generator is to beused for heat as well as electricity, additional fuel and maintenance costs of $10,000 peryear will be incurred. Should the firm invest in the generator and the heating system?Show all calculations.
P 3–30: Watson’s Bay
Watson’s Bay Co. is considering a contract to manufacture didgeridoos. Producing didgeridoos willrequire an investment in equipment of $100,000 and operating costs of $15 per didgeridoo produced.The contract calls for the company to deliver 3,000 didgeridoos a year for each of four years at a priceof $30 per didgeridoo. At the end of four years the equipment is expected to be sold for $10,000. Theequipment will be depreciated as follows:
Year Depreciation Factor
1 0.33332 0.44453 0.14814 0.0741
The depreciation factor is applied to the full cost of the equipment (i.e., salvage value is not consid-ered when depreciation is determined). The tax rate is 33 percent and the market rate of return forinvestments of this risk is 20 percent. Should Watson’s Bay Co. take the contract to manufacturedidgeridoos?SOURCE: R. Watts.
P 3–31: Linda Lion Co.
The Linda Lion Co. has an investment opportunity that involves a current outlay of $1,000 for equip-ment. The investment will yield net cash inflows for four years. The net cash inflow at the end of thefirst year will be $400. Later years’ cash inflows grow at the general rate of inflation. The equipmentwill be depreciated to zero on a straight-line basis, and there will be no salvage value at the end offour years. The tax rate is 40 percent, and the real rate of return required on investments of this riskis 10 percent.
Required:
a. Should Linda Lion take the investment if the general rate of inflation is 5 percent?
b. Is your answer different if the general rate of inflation is 15 percent? Explain why or why not.SOURCE: R. Watts.
P 3–32: Dakota Mining
Dakota Mining is considering operating a strip mine, the cost of which is $4.4 million. Cash returnswill be $27.7 million, all received at the end of the first year. The land must be returned to its naturalstate at a cost of $25 million, payable after two years. What is the project’s internal rate of return?
Required:
a. Should the project be accepted if the market rate of return is 8 percent?
b. If the market rate of return is 14 percent?
Explain your reasoning.SOURCE: R. Watts.
zim36725_ch03_089-134.qxd 12/15/09 12:25 PM Page 127

P 3–33: Overland Steel
Overland Steel operates a coal-burning steel mill in New York state. Changes in the state’s air qualitycontrol laws will result in this mill’s incurring a $1,000 per day fine (which will be paid at the endof the year) if it continues to operate. The mill currently operates every day of the year.
The mill was built 20 years ago at a cost of $15 million and has a remaining undepreciated bookvalue of $3 million. The expected remaining useful life of the mill is 30 years.
The firm can sell the mill to a developer who wants to build a shopping center on the site. Thebuyer will pay $1 million for the site if the company demolishes the mill and prepares the site forthe developer. Demolition and site preparation costs are estimated at $650,000.
Alternatively, the firm could install pollution control devices and other modernization devices atan initial outlay of $2.75 million. These improvements do not extend the useful life or salvage valueof the plant, but they do reduce net operating costs by $25,000 per year in addition to eliminating the$1,000 per day fine. Currently, the net cash flows of operating the plant are $450,000 per year beforeany fines.
Assume
1. The market rate of interest is 14 percent.
2. There are no taxes.
3. The annual cash flow estimates given above are constant over the next 30 years.
4. At the end of the 30 years, the mill has an estimated salvage value of $2 million whether ornot the pollution equipment has been installed.
Required:
Evaluate the various courses of action available to management and make a recommendation.Support your conclusions with neatly labeled calculations where possible.
P 3–34: Black Feather Indian Nation
Black Feather Indian Nation is a 900 square-mile territory in North Dakota that has the legal right tosell gasoline without having to collect or pay state and federal taxes on it. Gasoline in North Dakotasells for $1.20 per gallon, which includes $0.50 of taxes. The reservation is in a rural part of NorthDakota and is within 3–20 miles of five small cities, each with a population of between 20,000 and60,000 people.
Black Feather Indian Nation asks your consulting firm to advise it about entering the retail gaso-line business. It can buy gasoline at the wholesale delivered price of $0.65 per gallon. The Nation isconsidering building five stations on the perimeter of its territory to sell tax-free gasoline to non-Black Feather consumers for $0.70 per gallon. The total cost of the five stations, new road signs, andworking capital is $4 million.
The consulting partner of your firm in charge of this assignment is preparing the firm’s proposalto the Nation. He asks you to prepare a short memo outlining the analysis you think is necessary toanswer this question: “Should the Black Feather Indian Nation invest $4 million and enter the retailgasoline business?”
Required:
Your memo should contain the following elements:
a. An outline of the general methodology (approach) you propose.
b. A detailed list of the data you propose to collect to implement the methodology suggestedin (a). For each data item, describe how you plan to use the data.
P 3–35: Scottie Corporation
a. Scottie Corporation has been offered a contract to produce 100 castings a year for fiveyears at a price of $200 per casting. Producing the castings will require an investment in
128 Chapter 3
zim36725_ch03_089-134.qxd 12/15/09 12:25 PM Page 128

Opportunity Cost of Capital and Capital Budgeting 129
the plant of $35,000 and operating costs of $50 per casting produced. For tax purposes,depreciation will be on a straight-line basis over five years, with a full year’sdepreciation taken in both the beginning and ending years. The tax rate is 40 percent andthe market’s required rate of return on investments of this type is 10 percent. Assumecash flows except the initial investment occur at the end of the relevant years. ShouldScottie accept the contract?
b. Suppose that the contract in (a) involves the use of some warehouse space that Scottie canneither use in the business nor rent out. Just before Scottie accepts or rejects the contract,Kampmeier Realty offers to rent the space for $3,000 a year for five years if Scottierenovates the space. The renovations would cost $10,000. The renovations also would bedepreciated on a straight-line basis over five years, and the required return on the rentalproject is also 10 percent.
(i) Does the rental offer change the net present value of the casting contract? Show allcalculations.
(ii) Is the annual rent for the space an opportunity cost of the casting order? Why or why not?SOURCE: R. Watts.
P 3–36: Punch Press
A punch press currently in use has a book value of $1,800 and needs design modifications totaling$16,200, which would be capitalized at the present time and depreciated. The press can be sold for$2,600 now, but it could be used for three more years if the necessary modifications were made, atthe end of which time it would have no salvage value.
A new punch press can be purchased at an invoice price of $26,900 to replace the present equip-ment. Freight-in will amount to $800, and installation will cost $500. These expenses will be depre-ciated, along with the invoice price, over the life of the machine. Because of the nature of the productmanufactured, the new machine also will have an expected life of three years and will have no salvagevalue at the end of that time.
Using the old machine, operating profits before taxes and depreciation (revenues less costs) are$10,000 the first year and $8,000 in each of the next two years. Using the new machine, operatingprofits before taxes and depreciation (revenues less costs) are $18,000 in the first year and $14,000in each of the next two years.
Corporate income taxes are 40 percent, and the same tax rate is applicable to gains or losses onsales of equipment. Both the present and proposed equipment would be depreciated on a straight-linebasis over three years. Assuming the company wants to earn a 10 percent rate of return after taxes,should it modify the old machine or purchase the new one?
P 3–37: Apex Corporation
Two types of machine tools are available for performing a particular job in Apex Corporation. ToolA has an initial investment of $52,000, with operating costs of $26,000 per year, an economic ser-vice life of 12 years, and a salvage value of $6,000 at the end of that period. Tool B has an initialinvestment of $41,000, with operating costs of $32,000 per year, an economic service life of 12years, and a salvage value of $4,500 at the end of that period. The tax rate is 40 percent, the depre-ciation method is sum of the years’ digits, and the tax life for depreciation equals the economic ser-vice life.
Required:
a. Assuming the cost of capital is 8 percent, which tool should be purchased?
b. How would your answer to (a) change if double-declining-balance depreciation were used?(You may assume that you are allowed to switch to straight-line depreciation at any pointduring the asset’s life.)
zim36725_ch03_089-134.qxd 12/15/09 12:25 PM Page 129

P 3–38: Eastern Educational Services
Eastern Educational Services is considering the following proposal to sell its teaching machine andpurchase a new, improved machine. The following data are presented by the department head:
Present Machine New Machine
Purchase date 1/1/99 1/1/05Original cost, installed $100,000 $140,000Salvage value $20,000 $40,000Useful life 10 years 4 yearsDepreciation method Straight line Straight linePresent market value, net of disposal costs
(book value $52,000) $60,000 —Property taxes and insurance 5% of original cost 5% of original costAnnual maintenance costs and otherwise
fixed costs (other than depreciation) $10,000 $4,000Variable production costs per unit $5 $2
Additional information:
1. The company expects to produce 10,000 units a year selling at $10 each with eithermachine.
2. The company’s tax rate is 40 percent on all income and expenses.
3. All annual income and expenses are assumed to occur at year-end.
4. The company’s cost of capital is 12 percent after taxes.
5. The firm is located in a European country where capital gains are taxed at 40 percent.Capital gains are computed as the difference between the sales price and book value(original cost less accumulated depreciation).
Required:
a. Present a financial analysis in which you evaluate the proposal. A clear presentation isimportant.
b. Would you be more likely, less likely, or equally likely to recommend the purchase of thenew machine given the following:
(i) The company’s discount rate is increased.
(ii) The new machine can be depreciated by the double-declining-balance method.
130 Chapter 3
zim36725_ch03_089-134.qxd 12/15/09 12:25 PM Page 130

131
TABLE 3–12 Present Value of $1 Received at the End of Period n at an Interest Rate of i%
Periods 3% 4% 5% 6% 7% 8% 9% 10% 12% 14% 16% 18% 20% 25% 30% 35% 40%
1 0.971 0.962 0.952 0.943 0.935 0.926 0.917 0.909 0.893 0.877 0.862 0.847 0.833 0.800 0.769 0.741 0.7142 0.943 0.925 0.907 0.890 0.873 0.857 0.842 0.826 0.797 0.769 0.743 0.718 0.694 0.640 0.592 0.549 0.5103 0.915 0.889 0.864 0.840 0.816 0.794 0.772 0.751 0.712 0.675 0.641 0.609 0.579 0.512 0.455 0.406 0.3644 0.888 0.855 0.823 0.792 0.763 0.735 0.708 0.683 0.636 0.592 0.552 0.516 0.482 0.410 0.350 0.301 0.2605 0.863 0.822 0.784 0.747 0.713 0.681 0.650 0.621 0.567 0.519 0.476 0.437 0.402 0.328 0.269 0.223 0.1866 0.837 0.790 0.746 0.705 0.666 0.630 0.596 0.564 0.507 0.456 0.410 0.370 0.335 0.262 0.207 0.165 0.1337 0.813 0.760 0.711 0.655 0.623 0.583 0.547 0.513 0.452 0.400 0.354 0.314 0.279 0.210 0.159 0.122 0.0958 0.789 0.731 0.677 0.627 0.582 0.540 0.502 0.467 0.404 0.351 0.305 0.266 0.233 0.168 0.123 0.091 0.0689 0.766 0.703 0.645 0.592 0.544 0.500 0.460 0.424 0.361 0.308 0.263 0.225 0.194 0.134 0.094 0.067 0.048
10 0.744 0.676 0.614 0.558 0.508 0.463 0.422 0.386 0.322 0.270 0.227 0.191 0.162 0.107 0.073 0.050 0.03511 0.722 0.650 0.585 0.527 0.475 0.429 0.388 0.350 0.287 0.237 0.195 0.162 0.135 0.086 0.056 0.037 0.02512 0.701 0.625 0.557 0.497 0.444 0.397 0.356 0.319 0.257 0.208 0.168 0.137 0.112 0.069 0.043 0.027 0.01813 0.681 0.601 0.530 0.469 0.415 0.368 0.326 0.290 0.229 0.182 0.145 0.116 0.093 0.055 0.033 0.020 0.01314 0.661 0.577 0.505 0.442 0.388 0.340 0.299 0.263 0.205 0.160 0.125 0.099 0.078 0.044 0.025 0.015 0.00915 0.642 0.555 0.481 0.417 0.362 0.315 0.275 0.239 0.183 0.140 0.108 0.084 0.065 0.035 0.020 0.011 0.00616 0.623 0.534 0.458 0.394 0.339 0.292 0.252 0.218 0.163 0.123 0.093 0.071 0.054 0.028 0.015 0.008 0.00517 0.605 0.513 0.436 0.371 0.317 0.270 0.231 0.198 0.146 0.108 0.080 0.060 0.045 0.023 0.012 0.006 0.00318 0.587 0.494 0.416 0.350 0.296 0.250 0.212 0.180 0.130 0.095 0.069 0.051 0.038 0.018 0.009 0.005 0.00219 0.570 0.475 0.396 0.331 0.277 0.232 0.194 0.164 0.116 0.083 0.060 0.043 0.031 0.014 0.007 0.003 0.00220 0.554 0.456 0.377 0.312 0.258 0.215 0.178 0.149 0.104 0.073 0.051 0.037 0.026 0.012 0.005 0.002 0.00121 0.538 0.439 0.359 0.294 0.242 0.199 0.164 0.135 0.093 0.064 0.044 0.031 0.022 0.009 0.004 0.002 0.00122 0.522 0.422 0.342 0.278 0.226 0.184 0.150 0.123 0.083 0.056 0.038 0.026 0.018 0.007 0.003 0.001 0.00123 0.507 0.406 0.326 0.262 0.211 0.170 0.138 0.112 0.074 0.049 0.033 0.022 0.015 0.006 0.002 0.001 0.00024 0.492 0.390 0.310 0.247 0.197 0.158 0.126 0.102 0.066 0.043 0.028 0.019 0.013 0.005 0.002 0.001 0.00025 0.478 0.375 0.295 0.233 0.184 0.146 0.116 0.092 0.059 0.038 0.024 0.016 0.010 0.004 0.001 0.001 0.00026 0.464 0.361 0.281 0.220 0.172 0.135 0.106 0.084 0.053 0.033 0.021 0.014 0.009 0.003 0.001 0.000 0.00027 0.450 0.347 0.268 0.207 0.161 0.125 0.098 0.076 0.047 0.029 0.018 0.011 0.007 0.002 0.001 0.000 0.00028 0.437 0.333 0.255 0.196 0.150 0.116 0.090 0.069 0.042 0.026 0.016 0.010 0.006 0.002 0.001 0.000 0.00029 0.424 0.321 0.243 0.185 0.141 0.107 0.082 0.063 0.037 0.022 0.014 0.008 0.005 0.002 0.000 0.000 0.00030 0.412 0.308 0.231 0.174 0.131 0.099 0.075 0.057 0.033 0.020 0.012 0.007 0.004 0.001 0.000 0.000 0.00035 0.355 0.253 0.181 0.130 0.094 0.068 0.049 0.036 0.019 0.010 0.006 0.003 0.002 0.000 0.000 0.000 0.00040 0.307 0.208 0.142 0.097 0.067 0.046 0.032 0.022 0.011 0.005 0.003 0.001 0.001 0.000 0.000 0.000 0.00060 0.170 0.095 0.054 0.030 0.017 0.010 0.006 0.003 0.001 0.000 0.000 0.000 0.000 0.000 0.000 0.000 0.000
zim36725_ch03_089-134.qxd 12/15/09 12:25 PM Page 131

132
TABLE 3–13 Present Value of an Annuity (A Stream of Dollars Received at the End of Each of the Next n Periods at an Interest Rate of i%)
Periods 3% 4% 5% 6% 7% 8% 9% 10% 12% 14% 16% 18% 20% 25% 30% 35% 40%
1 0.971 0.962 0.952 0.943 0.935 0.926 0.917 0.909 0.893 0.877 0.862 0.847 0.833 0.800 0.769 0.741 0.7142 1.913 1.886 1.859 1.833 1.808 1.783 1.759 1.736 1.690 1.647 1.605 1.566 1.528 1.440 1.361 1.289 1.2243 2.829 2.775 2.723 2.673 2.624 2.577 2.531 2.487 2.402 2.322 2.246 2.174 2.106 1.952 1.816 1.696 1.5894 3.717 3.630 3.546 3.465 3.387 3.312 3.240 3.170 3.037 2.914 2.798 2.690 2.589 2.362 2.166 1.997 1.8495 4.580 4.452 4.329 4.212 4.100 3.993 3.890 3.791 3.605 3.433 3.274 3.127 2.991 2.689 2.436 2.220 2.0356 5.417 5.242 5.076 4.917 4.767 4.623 4.486 4.355 4.111 3.889 3.685 3.498 3.326 2.951 2.643 2.385 2.1687 6.230 6.002 5.786 5.582 5.389 5.206 5.033 4.868 4.564 4.288 4.039 3.812 3.605 3.161 2.802 2.508 2.2638 7.020 6.733 6.463 6.210 5.971 5.747 5.535 5.335 4.968 4.639 4.344 4.078 3.837 3.329 2.925 2.598 2.3319 7.786 7.435 7.108 6.802 6.515 6.247 5.995 5.759 5.328 4.946 4.607 4.303 4.031 3.463 3.019 2.665 2.379
10 8.530 8.111 7.722 7.360 7.024 6.710 6.418 6.145 5.650 5.216 4.833 4.494 4.192 3.571 3.092 2.715 2.41411 9.253 8.760 8.306 7.887 7.499 7.139 6.805 6.495 5.938 5.453 5.029 4.656 4.327 3.656 3.147 2.752 2.43812 9.954 9.385 8.863 8.384 7.943 7.536 7.161 6.814 6.194 5.660 5.197 4.793 4.439 3.725 3.190 2.779 2.45613 10.635 9.986 9.394 8.853 8.358 7.904 7.487 7.103 6.424 5.842 5.342 4.910 4.533 3.780 3.223 2.799 2.46914 11.296 10.563 9.899 9.295 8.745 8.244 7.786 7.367 6.628 6.002 5.468 5.008 4.611 3.824 3.249 2.814 2.47815 11.938 11.118 10.380 9.712 9.108 8.559 8.061 7.606 6.811 6.142 5.575 5.092 4.675 3.859 3.268 2.825 2.48416 12.561 11.652 10.838 10.106 9.447 8.851 8.313 7.824 6.974 6.265 5.668 5.162 4.730 3.887 3.283 2.834 2.48917 13.166 12.166 11.274 10.477 9.763 9.122 8.544 8.022 7.120 6.373 5.749 5.222 4.775 3.910 3.295 2.840 2.49218 13.754 12.659 11.690 10.828 10.059 9.372 8.756 8.201 7.250 6.467 5.818 5.273 4.812 3.928 3.304 2.844 2.49419 14.324 13.134 12.085 11.158 10.336 9.604 8.950 8.365 7.366 6.550 5.877 5.316 4.843 3.942 3.311 2.848 2.49620 14.877 13.590 12.462 11.470 10.594 9.818 9.129 8.514 7.469 6.623 5.929 5.353 4.870 3.954 3.316 2.850 2.49721 15.415 14.029 12.821 11.764 10.836 10.017 9.292 8.649 7.562 6.687 5.973 5.384 4.891 3.963 3.320 2.852 2.49822 15.937 14.451 13.163 12.042 11.061 10.201 9.442 8.772 7.645 6.743 6.011 5.410 4.909 3.970 3.323 2.853 2.49823 16.444 14.857 13.489 12.303 11.272 10.371 9.580 8.883 7.718 6.792 6.044 5.432 4.925 3.976 3.325 2.854 2.49924 16.936 15.247 13.799 12.550 11.469 10.529 9.707 8.985 7.784 6.835 6.073 5.451 4.937 3.981 3.327 2.855 2.49925 17.413 15.622 14.094 12.783 11.654 10.675 9.823 9.077 7.843 6.873 6.097 5.467 4.948 3.985 3.329 2.856 2.49926 17.877 15.983 14.375 13.003 11.826 10.810 9.929 9.161 7.896 6.906 6.118 5.480 4.956 3.988 3.330 2.856 2.50027 18.327 16.330 14.643 13.211 11.987 10.935 10.027 9.237 7.943 6.935 6.136 5.492 4.964 3.990 3.331 2.856 2.50028 18.764 16.663 14.898 13.406 12.136 11.051 10.116 9.307 7.984 6.961 6.152 5.502 4.970 3.992 3.331 2.857 2.50029 19.188 16.984 15.141 13.591 12.278 11.158 10.198 9.370 8.022 6.983 6.166 5.510 4.975 3.994 3.332 2.857 2.50030 19.600 17.292 15.372 13.765 12.409 11.258 10.274 9.427 8.055 7.003 6.177 5.517 4.979 3.995 3.332 2.857 2.50035 21.487 18.665 16.374 14.498 12.948 11.655 10.567 9.644 8.176 7.070 6.215 5.539 4.992 3.998 3.333 2.857 2.50040 23.115 19.793 17.159 15.046 13.332 11.925 10.757 9.779 8.244 7.105 6.233 5.548 4.997 3.999 3.333 2.857 2.50060 27.676 22.623 18.929 16.161 14.039 12.377 11.048 9.967 8.324 7.140 6.249 5.555 5.000 4.000 3.333 2.857 2.500
120 32.373 24.774 19.943 16.651 14.281 12.499 11.111 10.000 8.333 7.143 6.250 5.556 5.000 4.000 3.333 2.857 2.500360 33.333 25.000 20.000 16.667 14.286 12.500 11.111 10.000 8.333 7.143 6.250 5.556 5.000 4.000 3.333 2.857 2.500
zim36725_ch03_089-134.qxd 12/15/09 12:25 PM Page 132

133
TABLE 3–14 Future Value of $1 Invested Today at i% Interest and Allowed to Compound for n Periods
Periods 3% 4% 5% 6% 7% 8% 9% 10% 12% 14% 16% 18% 20% 25% 30% 35% 40%
1 1.030 1.040 1.050 1.060 1.070 1.080 1.090 1.100 1.120 1.140 1.160 1.180 1.200 1.250 1.300 1.350 1.4002 1.061 1.082 1.103 1.124 1.145 1.166 1.188 1.210 1.254 1.300 1.356 1.392 1.440 1.563 1.690 1.823 1.9603 1.093 1.125 1.158 1.191 1.225 1.260 1.295 1.331 1.405 1.482 1.561 1.643 1.728 1.953 2.197 2.460 2.7444 1.126 1.170 1.216 1.262 1.311 1.360 1.412 1.464 1.574 1.689 1.811 1.939 2.074 2.441 2.856 3.322 3.8425 1.159 1.217 1.276 1.338 1.403 1.469 1.539 1.611 1.762 1.925 2.100 2.288 2.488 3.052 3.713 4.484 5.3786 1.194 1.265 1.340 1.419 1.501 1.587 1.677 1.772 1.974 2.195 2.436 2.700 2.986 3.815 4.827 6.053 7.5307 1.230 1.316 1.407 1.504 1.606 1.714 1.828 1.949 2.211 2.502 2.826 3.185 3.583 4.768 6.275 8.172 10.5418 1.267 1.369 1.477 1.594 1.718 1.851 1.993 2.144 2.476 2.853 3.278 3.759 4.300 5.960 8.157 11.032 14.7589 1.305 1.423 1.551 1.689 1.838 1.999 2.172 2.358 2.773 3.252 3.803 4.435 5.160 7.451 10.604 14.894 20.661
10 1.344 1.480 1.629 1.791 1.967 2.159 2.367 2.594 3.106 3.707 4.411 5.234 6.192 9.313 13.786 20.107 28.92511 1.384 1.539 1.710 1.898 2.105 2.332 2.580 2.853 3.479 4.226 5.117 6.176 7.430 11.642 17.922 27.144 40.49612 1.426 1.601 1.796 2.012 2.252 2.518 2.813 3.138 3.896 4.818 5.936 7.288 8.916 14.552 23.928 36.644 56.69413 1.469 1.665 1.886 2.133 2.410 2.720 3.066 3.452 4.363 5.492 6.886 8.599 10.699 18.190 30.288 49.470 79.37114 1.513 1.732 1.980 2.261 2.579 2.937 3.342 3.797 4.887 6.261 7.988 10.147 12.839 22.737 39.374 66.784 111.12015 1.558 1.801 2.079 2.397 2.759 3.172 3.642 4.177 5.474 7.138 9.266 11.974 15.407 28.422 51.186 90.158 155.56816 1.605 1.873 2.183 2.540 2.952 3.426 3.970 4.595 6.130 8.137 10.748 14.129 18.488 35.527 66.542 121.714 217.79517 1.653 1.948 2.292 2.693 3.159 3.700 4.328 5.054 6.866 9.276 12.468 16.672 22.186 44.409 86.504 164.314 304.91318 1.702 2.026 2.407 2.854 3.380 3.996 4.717 5.560 7.690 10.575 14.463 19.673 26.623 55.511 112.455 221.824 426.87919 1.754 2.107 2.527 3.026 3.617 4.316 5.142 6.116 8.613 12.056 16.777 23.214 31.948 69.389 146.192 299.462 597.63020 1.806 2.191 2.653 3.207 3.870 4.661 5.604 6.727 9.646 13.743 19.461 27.393 38.338 86.736 190.050 404.274 836.68321 1.860 2.279 2.786 3.400 4.141 5.034 6.109 7.400 10.804 15.668 22.574 32.324 46.005 108.420 247.065 545.769 1,171.35622 1.916 2.370 2.925 3.604 4.430 5.437 6.659 8.140 12.100 17.861 26.186 38.142 55.206 135.525 321.184 736.789 1,639.89823 1.974 2.465 3.072 3.820 4.741 5.871 7.258 8.954 13.552 20.362 30.376 45.008 66.247 169.407 417.539 994.665 2,295.85724 2.033 2.563 3.225 4.049 5.072 6.341 7.911 9.850 15.179 23.212 35.236 53.109 79.497 211.758 542.801 1,342.797 3,214.20025 2.094 2.666 3.386 4.292 5.427 6.848 8.623 10.835 17.000 26.462 40.874 62.669 95.396 264.698 705.641 1,812.776 4,499.88026 2.157 2.772 3.556 4.549 5.807 7.396 9.399 11.918 19.040 30.167 47.414 73.949 114.475 330.872 917.333 2,447.248 6,299.83127 2.221 2.883 3.733 4.822 6.214 7.988 10.245 13.110 21.325 34.390 55.000 87.260 137.371 413.590 1,192.533 3,303.785 8,819.76428 2.288 2.999 3.920 5.112 6.649 8.627 11.167 14.421 23.884 39.204 63.800 102.967 164.845 516.988 1,550.293 4,460.109 12,347.67029 2.357 3.119 4.116 5.418 7.114 9.317 12.172 15.863 26.750 44.693 74.009 121.501 197.814 646.235 2,015.381 6,021.148 17,286.73730 2.427 3.243 4.322 5.743 7.612 10.063 13.268 17.449 29.960 50.950 85.850 143.371 237.376 807.794 2,619.996 8,128.550 24,201.43235 2.814 3.946 5.516 7.686 10.677 14.785 20.414 28.102 52.800 98.100 180.314 327.997 590.668 2,465.190 9,727.860 36,448.688 130,161.11240 3.262 4.801 7.040 10.286 14.974 21.725 31.409 45.259 93.051 188.884 378.721 750.378 1,469.772 7,523.164 36,118.865 163,437.135 700,037.697
zim36725_ch03_089-134.qxd 12/15/09 12:25 PM Page 133
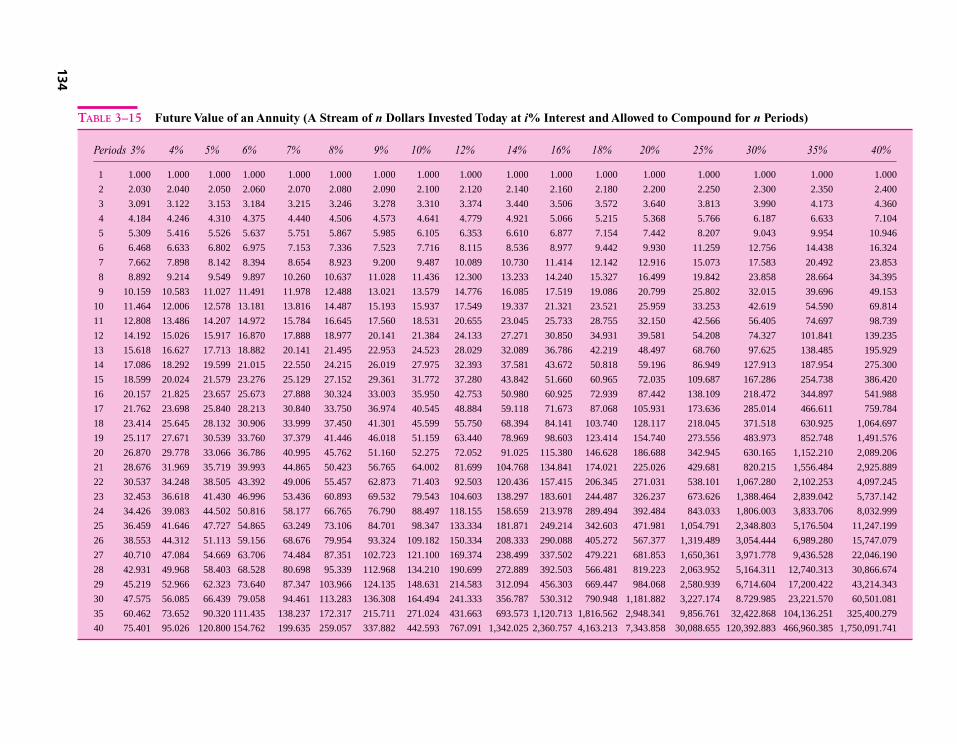
134
TABLE 3–15 Future Value of an Annuity (A Stream of n Dollars Invested Today at i% Interest and Allowed to Compound for n Periods)
Periods 3% 4% 5% 6% 7% 8% 9% 10% 12% 14% 16% 18% 20% 25% 30% 35% 40%
1 1.000 1.000 1.000 1.000 1.000 1.000 1.000 1.000 1.000 1.000 1.000 1.000 1.000 1.000 1.000 1.000 1.000
2 2.030 2.040 2.050 2.060 2.070 2.080 2.090 2.100 2.120 2.140 2.160 2.180 2.200 2.250 2.300 2.350 2.400
3 3.091 3.122 3.153 3.184 3.215 3.246 3.278 3.310 3.374 3.440 3.506 3.572 3.640 3.813 3.990 4.173 4.360
4 4.184 4.246 4.310 4.375 4.440 4.506 4.573 4.641 4.779 4.921 5.066 5.215 5.368 5.766 6.187 6.633 7.104
5 5.309 5.416 5.526 5.637 5.751 5.867 5.985 6.105 6.353 6.610 6.877 7.154 7.442 8.207 9.043 9.954 10.946
6 6.468 6.633 6.802 6.975 7.153 7.336 7.523 7.716 8.115 8.536 8.977 9.442 9.930 11.259 12.756 14.438 16.324
7 7.662 7.898 8.142 8.394 8.654 8.923 9.200 9.487 10.089 10.730 11.414 12.142 12.916 15.073 17.583 20.492 23.853
8 8.892 9.214 9.549 9.897 10.260 10.637 11.028 11.436 12.300 13.233 14.240 15.327 16.499 19.842 23.858 28.664 34.395
9 10.159 10.583 11.027 11.491 11.978 12.488 13.021 13.579 14.776 16.085 17.519 19.086 20.799 25.802 32.015 39.696 49.153
10 11.464 12.006 12.578 13.181 13.816 14.487 15.193 15.937 17.549 19.337 21.321 23.521 25.959 33.253 42.619 54.590 69.814
11 12.808 13.486 14.207 14.972 15.784 16.645 17.560 18.531 20.655 23.045 25.733 28.755 32.150 42.566 56.405 74.697 98.739
12 14.192 15.026 15.917 16.870 17.888 18.977 20.141 21.384 24.133 27.271 30.850 34.931 39.581 54.208 74.327 101.841 139.235
13 15.618 16.627 17.713 18.882 20.141 21.495 22.953 24.523 28.029 32.089 36.786 42.219 48.497 68.760 97.625 138.485 195.929
14 17.086 18.292 19.599 21.015 22.550 24.215 26.019 27.975 32.393 37.581 43.672 50.818 59.196 86.949 127.913 187.954 275.300
15 18.599 20.024 21.579 23.276 25.129 27.152 29.361 31.772 37.280 43.842 51.660 60.965 72.035 109.687 167.286 254.738 386.420
16 20.157 21.825 23.657 25.673 27.888 30.324 33.003 35.950 42.753 50.980 60.925 72.939 87.442 138.109 218.472 344.897 541.988
17 21.762 23.698 25.840 28.213 30.840 33.750 36.974 40.545 48.884 59.118 71.673 87.068 105.931 173.636 285.014 466.611 759.784
18 23.414 25.645 28.132 30.906 33.999 37.450 41.301 45.599 55.750 68.394 84.141 103.740 128.117 218.045 371.518 630.925 1,064.697
19 25.117 27.671 30.539 33.760 37.379 41.446 46.018 51.159 63.440 78.969 98.603 123.414 154.740 273.556 483.973 852.748 1,491.576
20 26.870 29.778 33.066 36.786 40.995 45.762 51.160 52.275 72.052 91.025 115.380 146.628 186.688 342.945 630.165 1,152.210 2,089.206
21 28.676 31.969 35.719 39.993 44.865 50.423 56.765 64.002 81.699 104.768 134.841 174.021 225.026 429.681 820.215 1,556.484 2,925.889
22 30.537 34.248 38.505 43.392 49.006 55.457 62.873 71.403 92.503 120.436 157.415 206.345 271.031 538.101 1,067.280 2,102.253 4,097.245
23 32.453 36.618 41.430 46.996 53.436 60.893 69.532 79.543 104.603 138.297 183.601 244.487 326.237 673.626 1,388.464 2,839.042 5,737.142
24 34.426 39.083 44.502 50.816 58.177 66.765 76.790 88.497 118.155 158.659 213.978 289.494 392.484 843.033 1,806.003 3,833.706 8,032.999
25 36.459 41.646 47.727 54.865 63.249 73.106 84.701 98.347 133.334 181.871 249.214 342.603 471.981 1,054.791 2,348.803 5,176.504 11,247.199
26 38.553 44.312 51.113 59.156 68.676 79.954 93.324 109.182 150.334 208.333 290.088 405.272 567.377 1,319.489 3,054.444 6,989.280 15,747.079
27 40.710 47.084 54.669 63.706 74.484 87.351 102.723 121.100 169.374 238.499 337.502 479.221 681.853 1,650,361 3,971.778 9,436.528 22,046.190
28 42.931 49.968 58.403 68.528 80.698 95.339 112.968 134.210 190.699 272.889 392.503 566.481 819.223 2,063.952 5,164.311 12,740.313 30,866.674
29 45.219 52.966 62.323 73.640 87.347 103.966 124.135 148.631 214.583 312.094 456.303 669.447 984.068 2,580.939 6,714.604 17,200.422 43,214.343
30 47.575 56.085 66.439 79.058 94.461 113.283 136.308 164.494 241.333 356.787 530.312 790.948 1,181.882 3,227.174 8.729.985 23,221.570 60,501.081
35 60.462 73.652 90.320 111.435 138.237 172.317 215.711 271.024 431.663 693.573 1,120.713 1,816.562 2,948.341 9,856.761 32,422.868 104,136.251 325,400.279
40 75.401 95.026 120.800 154.762 199.635 259.057 337.882 442.593 767.091 1,342.025 2,360.757 4,163.213 7,343.858 30,088.655 120,392.883 466,960.385 1,750,091.741
zim36725_ch03_089-134.qxd 12/15/09 12:25 PM Page 134
135
Chapter Four
OrganizationalArchitecture
Chapter Outline
A. Basic Building Blocks
1. Self-Interested Behavior, Team Production, andAgency Costs
2. Decision Rights and Rights Systems
3. Role of Knowledge and Decision Making
4. Markets versus Firms
5. Influence Costs
B. Organizational Architecture
1. Three-Legged Stool
2. Decision Management versus Decision Control
C. Accounting’s Role in the Organization’sArchitecture
D. Example of Accounting’s Role: ExecutiveCompensation Contracts
E. Summary
zim36725_ch04_135-169.qxd 12/15/09 12:36 PM Page 135

136 Chapter 4
Chapter 2 described the important concept of opportunity cost and its relation to other cost-ing terms. Understanding the nature of costs is critical to making decisions. Internal ac-counting systems are used not only in decision making but also for influencing the behaviorof individuals within organizations.
This chapter addresses the general problem of controlling behavior and describes howthe firm’s organizational architecture can influence behavior. Individuals working in firmswill maximize their welfare, sometimes to the detriment of the organization’s objectives,unless provided incentives to do otherwise. Accounting systems are often used to providethese incentives. For example, incentive bonuses are often based on accounting earnings.Section A presents some building blocks underlying the analysis. Section B describes howthe firm’s organizational architecture creates incentives for employees to maximize the or-ganization’s objectives. Sections C and D describe how accounting controls conflicts of in-terest inside the organization. The next chapter discusses two more accounting tools that areused to resolve organizational problems: responsibility accounting and transfer pricing.
A. Basic Building Blocks1
Before describing the general problem of how to motivate and control behavior in organiza-tions (the economics of organizations), this section first describes some underlying concepts:
1. Self-interested behavior, team production, and agency costs.
2. Decision rights and rights systems.
3. Role of knowledge and decision making.
4. Markets versus firms.
5. Influence costs.
One of the fundamental tenets of economics is that individuals act in their self-interestto maximize their utility. Employees, managers, and owners are assumed to be rational,utility-maximizing people. Individuals have preferences for a wide variety of not onlygoods and services but also intangibles such as prestige, love, and respect, and they arewilling to trade one thing they value for another. People evaluate the opportunities they faceand select those that they perceive will make them better off. Moreover, individuals are notgenerally able to satisfy all their preferences. Limited resources (time, money, or skills)force people to make choices. When confronted with constraints or a limited set of alterna-tives, individuals will use their resourcefulness to relax the constraints and generate a largeropportunity set. For example, when the highway speed limit was reduced to 55 miles perhour, the CB radio and radar detector industries emerged to help resourceful, self-interestedpeople circumvent the new law.2
Individuals coalesce to form a firm because it can (1) presumably produce more goodsor services collectively than individuals are capable of producing alone and (2) thus generatea larger opportunity set. Team production is the key reason that firms exist. Firms arecontracting intermediaries. They facilitate exchanges among resource owners who voluntarily
1. Self-InterestedBehavior, TeamProduction, andAgency Costs
1 Much of the next two sections is based on M Jensen and W Meckling, “Specific and General Knowledgeand Organizational Structure,” Contract Economics, ed. L Werin and H Wijkander (Oxford: Blackwell, 1992),pp. 251–74. Also see J Brickley, C Smith, and J Zimmerman, Managerial Economics and OrganizationalArchitecture, 5th ed. (Boston: McGraw-Hill, 2009).
2 W Meckling, “Values and the Choice of the Model of the Individual in the Social Sciences,” SchweizerischeZeitschrift für Volkswirtschaft und Statistik, December 1976.
zim36725_ch04_135-169.qxd 12/15/09 12:36 PM Page 136

Organizational Architecture 137
contract among themselves to benefit each party.3 People choose to enter contracts becausethey are made better off by the exchange; there are gains to each party in contracting.
Team production implies that the productivity of any one resource owner is affected bythe productivity of all the other team members, because output is a joint product of all theinputs. Suppose Sally and Terry can produce more working together than working sepa-rately because they assist each other. Hence, Sally can increase Terry’s output and viceversa. This interdependency has important implications for organizations and internal ac-counting. For one thing, measuring the productivity of one team member requiresobserving the inputs of all the other team members. However, inputs (such as effort) aretypically difficult to observe. If two people are carrying a large, awkward box and it slipsand falls, which employee do you blame? Did one of them let it go? Or did it slip out of oneemployee’s hands because the other employee tripped?
In most cases, a resource owner’s input cannot be directly observed. Hence, team mem-bers have incentives to shirk their responsibilities. If it is difficult to observe Sally’s effort, shehas incentives to shirk when working with Terry. She can always blame either Terry or randomuncontrollable events such as bad weather or missing parts as the reason for low joint output.If Sally and Terry are paid based on their joint output, each still has an incentive to shirkbecause each bears only half the cost of the reduced output. As the team size is increased, theincentive to shirk becomes greater because the reduced output is spread over more team mem-bers. The incentive to shirk in team production is called the free-rider problem. Teams try toovercome the free-rider problem through the use of team loyalty—pressure from other teammembers—and through monitoring. Team production clearly has advantages, but it also causesa variety of organizational problems, in particular the free-rider problem.4
AcademicApplication:AlternativeModels ofBehavior
Economists assume that individuals are self-interested and have preferences over a widevariety of things. This is not the only model of behavior. Psychologists offer another setof assumptions about how individuals make choices. Like economists, Maslow (1954)assumes that individuals are self-interested and have their own goals. He describes thesegoals in terms of satisfying different levels of needs. According to Maslow, an individ-ual first seeks to satisfy physiological needs (food and shelter), followed by safety needs(security), love and belonging (a place within a group), esteem (self-respect), and self-actualization (creative expression).
No single model perfectly describes all behavior. Choosing among models of humanbehavior involves trading off predictive ability and complexity. Usually, the more com-plex the model, is the more it can explain. The advantage of using a simple economicmodel as presented here is its ease of exposition. While it is not literally correct and ignoresmany important complicating issues, its simplicity allows the essential elements to becommunicated easily.
SOURCE: A Maslow, Motivation and Personality (New York: Harper & Row, 1954). For an excellent review of alternativemodels of behavior, including a critique of the economic theories, see C Perrow, Complex Organizations: A Critical Essay,3rd ed. (New York: Random House, 1986).
3 C Barnard, The Functions of the Executive (Cambridge, MA: Harvard University Press, 1938), p. viiidefines organizations as “a system of consciously coordinated activities or forces of two or more persons.” Seealso M Jensen and W Meckling, “Theory of the Firm: Managerial Behavior, Agency Costs and OwnershipStructure,” Journal of Financial Economics 3 (1976), pp. 305–60.
4 A Alchian and H Demsetz, “Production, Information Costs, and Economic Organization,” AmericanEconomic Review 62 (1972), pp. 777–95.
zim36725_ch04_135-169.qxd 12/15/09 12:36 PM Page 137

138 Chapter 4
Another organizational problem arises when principals hire agents to perform tasks forthem. For example, the chief executive officer (CEO) is the agent of the board of directors,who are in turn the elected agents of the shareholders. Vice presidents of the firm are agentsof the president, managers are agents of vice presidents, and employees are agents ofsupervisors. Most employees in a chain of command are both principals to those who re-port to them and agents to those to whom they report. These principal-agent relationshipspervade all organizations: profit and nonprofit firms, the military, and other governmentunits.
When hired to do a task, agents maximize their utility, which may or may not maximizethe principal’s utility. Agents’ pursuit of their self-interest instead of the principal’s is calledthe principal-agent problem or simply the agency problem.5 The extreme example of anagency problem is employee theft of firm property. If undetected, such theft benefits the agentat the expense of the principal. The agent would prefer to see firm resources directed into ac-tivities that improve the agent’s welfare even if these expenditures do not benefit the princi-pal to the same degree. For example, agents prefer excessive perquisites such as gourmetcompany-provided lunches and on-the-job leisure. Differences among employees’ risk toler-ances, working horizons, and desired levels of job perks generate agency costs—the declinein firm value that results from agents pursuing their own interests to the detriment of the prin-cipal’s interest. Agency costs can also arise when agents seek larger organizations to manage(empire building) for the sole purpose of increasing either their job security or their pay.(Many firms base pay on the number of employees reporting to the manager.)
In general, agency problems arise because of information asymmetries. The principalpossesses less information than the agent. In the classic principal-agent problem, the princi-pal hires the agent to perform some task, such as managing the principal’s investment port-folio. If the agent works hard, the portfolio grows more than if the agent shirks. But theprincipal cannot observe how hard the agent is working (information asymmetry). Moreover,
5 M Jensen and W Meckling (1976); H Simon, “A Formal Theory of the Employment Relationship,”Econometrica 19 (1951), pp. 293–305; S Ross, “The Economic Theory of Agency: The Principal’s Problem,”American Economic Review 63 (1973), pp. 134–39; and O Williamson, The Economic Institutions of Capitalism(NewYork: The Free Press, 1985).
ManagerialApplication:AgencyProblems atGeneralElectric
General Electric’s (GE) former CEO Jack Welch received a lavish retirement packagethat attracted considerable public attention when the details became public. The packagepromised Welch lifetime access to such perks as use of a luxury Manhattan apartment,office space in New York and Connecticut, and access to GE aircraft and a chauffeuredlimousine. Mr. Welch received lifetime use of a $15 million apartment facing Central Park,floor-level seats to New York Knicks basketball games, Yankees tickets, a box at theMetropolitan Opera, use of the corporate Boeing 737, free flowers, free toiletries, and freesatellite TV at his four homes. The exact details of Mr. Welch’s retirement perks came tolight when his wife filed for divorce. The perks, valued at $2.5 million a year, were a frac-tion of Welch’s total retirement package, estimated at $20 million to $50 million. Afteran investigation by securities industry regulators and public outcry, GE revoked some ofWelch’s privileges, and he said he would pay for the rest.
SOURCE: L Browning, “Executive Pay: A Special Report; The Perks Still Flow (But With Less Fizz),” The New York Times,April 6, 2003, and A Borrus, “Exposing Execs’ ‘Stealth’ Compensation,” BusinessWeek, September 12, 2004,http://www.businessweek.com/bwdaily/dnflash/sep2004/nf20040924_8648_db016.htm.
zim36725_ch04_135-169.qxd 12/15/09 12:36 PM Page 138

Organizational Architecture 139
the investment portfolio’s performance depends not just on how hard the agent works, butalso on random events, such as general market movements or embezzlement by managers ina company in the investment portfolio. If the principal were able to observe the agent’s ef-fort, then a simple contract that pays the agent for effort expended could be used to force theagent to work hard. But since the agent’s effort is not observable by the principal, the prin-cipal must contract on some other basis. One such contract could pay the agent a fraction ofthe portfolio’s growth. But since part of the portfolio’s performance depends on random fac-tors, the agent could work hard, but adverse random events outside the agent’s control couldnegate that hard work. While this contract induces hard work, it also imposes risk on theagent for which he or she must be compensated. Hence, most agency problems involve bal-ancing stronger incentives for the agent to work hard against the higher risk premium re-quired by the agent to compensate for the additional risk involved.
Consider another example of an agency problem, that of senior executives paid a fixedsalary. Because executives have less incentive to maximize shareholder value than if theyowned the entire firm themselves, incentive compensation plans are introduced to tie the ex-ecutive’s welfare more closely to shareholder welfare. The agent may have a lower tolerance forrisk than the principal and therefore will choose more conservative actions. Principal–agentproblems can also arise because most supervisors find it personally unpleasant to discipline ordismiss poorly performing subordinates. Instead of taking these unpopular actions, supervisors
ManagerialApplication:AgencyProblems atSociétéGénérale
Société Générale was founded in the 1860s and in 2008 was France’s second largestbank. It pioneered some of the most complex international finance instruments, earnedbillions of dollars, and gained the respect of bankers throughout the world. In January2008 the bank discovered fraudulent securities trading by one of its low-level traders,Jérôme Kerviel. The fraud was estimated to cost a staggering $7.14 billion, making itone of the largest financial frauds in history. The bank asserted that the fraud was theresult of one employee’s illegal activities, did not involve other employees at the bank,and represented the aberrant and unexplainable actions of one “rogue trader.”
Kerviel’s job involved arbitraging small differences between various stock marketindexes, such as the CAC in France and the DAX in Germany, by selling a security on theexchange with the higher price and simultaneously buying an equivalent instrument onthe exchange with the lower price. Small prices differences on the two exchanges can pro-duce a substantial profit when done in sufficient volume. Purchasing and selling equalamounts on the two exchanges should produce little net exposure to price changes. How-ever, Kerviel had bought securities on both markets, betting that European stock priceswould increase. When they fell, the bank incurred a substantial loss. Kerviel told investi-gators that all he wanted was to be respected and to earn a large bonus. One of his primarygoals was to have his supervisors recognize his “financial genius.”
Prior to becoming a trader, Kerviel had worked in the bank’s trading accountingoffice, where he gained knowledge of the bank’s risk-management system. This allowedhim to conceal the trades and bypass the firm’s control system. An investigation of thisincident concluded that Société Générale “allowed a culture of risk to flourish, creatingmajor flaws in its operations” that enabled Kerviel’s actions to proceed. Traders wererewarded for making risky investments with the bank’s money. Top executives at thebank received large bonuses because of the bank’s successful trading operations.
This example illustrates that agency problems (including fraud) can impose enor-mous costs on firms.
SOURCE: Adapted from J Brickley, C Smith, and J Zimmerman (2009), p. 13.
zim36725_ch04_135-169.qxd 12/15/09 12:36 PM Page 139

140 Chapter 4
allow underperforming subordinates to remain in their positions, which reduces firm value.The difference between the value of the firm with and without the poorly performing subordi-nate is the agency cost imposed on the owners of the firm by the shirking supervisor.
If the agent expects to leave the organization before the principal, the agent will tendto focus on short-run actions. This leads to the horizon problem: Managers expecting toleave the firm in the near future place less weight than the principal on those consequencesthat may occur after they leave. As an example of the horizon problem, consider the case ofa divisional manager, Henry Metz, who expects to retire in three years. Henry is paid afixed salary plus 5 percent of his division’s profits. To simplify the example, make the un-realistic assumption that Henry cares only about cash compensation. He can spend$100,000 on process improvements this year and next year that will yield $150,000 of costsavings for each of the following four years. Table 4–1 illustrates the cash flows.
The process improvements are clearly profitable, so they should be accepted.6 ButHenry, who has a three-year horizon, rejects the project because it reduces his total bonus.He bears much of the cost while his successor receives most of the benefits in years 4, 5,and 6. Nonpecuniary interests of the manager, such as peer pressure, tend to reduce thehorizon problem. However, the basic point remains: Agents facing a known departure dateplace less weight on events that occur after they leave than on events that occur while theyare still there; the short-term consequences of current decisions will matter far more tothem than the long-term consequences.
To reduce agency costs such as employee theft and the free-rider and horizon prob-lems, firms incur costs. These costs include hiring security guards to prevent theft, hiringsupervisors to monitor employees, installing accounting and reporting systems to measure
TABLE 4–1 Example of the Horizon Problem
Effect on Henry Metz’s Year Outlay Cost Savings Bonus Compensation
1 $100,000 — �$5,0002 100,000 — � 5,0003 0 $150,000 � 7,5004 0 150,000 05 0 150,000 06 0 150,000 0
6 These process improvements have a positive net present value unless the discount rate is greater than45 percent. Hence, under most market discount rates, they are profitable.
ManagerialApplication:AgencyProblems withCorporate JetPilots
Corporate jets often have to refuel on intercontinental flights, usually in Kansas orNebraska. Refuelers at the same airport compete by offering pilots frozen steaks, wine,or top-of-the-line golf gear. These freebies are usually offered only if the pilot forgoesdiscounts on fuel, and they are almost always given in a covert manner—so that the cor-poration owning the plane never knows why the pilot has chosen that particular refueler.Suppose the pilot chooses a refueler who charges $150 more than the least-cost optionbecause the pilot gets $80 worth of gifts. This wealth transfer from the owners of the jetto the pilot is an example of an agency problem.
SOURCE: S McCartney, “We’ll Be Landing So the Crew Can Grab a Steak,” The Wall Street Journal, September 8, 1998, p. A1.
zim36725_ch04_135-169.qxd 12/15/09 12:36 PM Page 140

Organizational Architecture 141
and reward output, and paying legal fees to enforce compliance with contracts. However, aslong as it is costly to monitor agents’ actions, some divergence of interests between agentsand principals will remain. It is usually not cost-efficient to eliminate all divergent acts.
Agency costs are also limited by the existence of a job market for managers, the mar-ket for corporate control, and competition from other firms. The job market for managerscauses managers to limit their divergent actions to avoid being replaced by other (outside)managers.7 Replacements will occur if the board of directors has access to these job mar-kets and incentives to replace the managers. If the board fails to reduce the firm’s agencycosts, the firm’s stock price declines. Low stock prices encourage takeovers. The market forcorporate control will then limit the agency costs of existing management via unfriendlytakeovers. Finally, if both the job and corporate control markets fail, other firms in the sameproduct market will supply better products at lower prices and eventually force firms withhigh agency costs out of business. However, to the extent that there are transactions costsin all these markets, it will not be cost-beneficial to drive agency costs to zero. For exam-ple, if the transaction costs of a corporate takeover, including legal, accounting, and under-writing fees, are 3 percent of the value of the firm, then it will not pay outsiders to acquirethe firm if the magnitude of the agency costs they hope to eliminate are less than 3 percent.Thus, this level of agency costs will persist.
Agents maximize their utility, not the principal’s. This problem is commonly referredto as goal incongruence, which simply means that individual agents have different goalsfrom their principal. The term is misleading, because it suggests that the firm can securecongruence by changing personal preferences (i.e., utility functions) so that all individualsin the organization adopt the principal’s goal. However, self-interested individuals’ prefer-ences are not easily altered. The firm can reduce the agency problem, if not goal incongru-ence, by structuring agents’ incentives so that when agents maximize their utility (primarilyincentive-based compensation), the principal’s utility (or wealth) is also maximized. Inother words, the agents’ and principals’ goals become congruent through the agents’ incen-tive scheme, not through a change in the agents’ underlying preferences.
AcademicApplication:AdverseSelection andMoral HazardProblems
Two types of agency problems have been given specific names. Adverse selection refersto the tendency of individuals with private information about something that benefitsthem to make offers that are detrimental to the trading partner. For example, individualshave more information regarding their health than do life insurance companies. If un-constrained, people who buy life insurance are likely to have more severe health prob-lems than the average person assumed by the insurance company when setting its rates.After the insurance company sets its rates based on an average person, an adverse groupof individuals will buy the insurance and the insurance company will lose money.To protect itself from adverse selection, insurance companies require medical exams toexclude the overly ill or to charge them higher prices (e.g., smokers).
Moral hazard problems arise when an individual has an incentive to deviate fromthe contract and take self-interested actions because the other party has insufficient in-formation to know if the contract was honored. An example of a moral hazard problemoften occurs in automobile accident claims. The insured may claim that the door wasdented in the accident when in fact it was already damaged. To reduce moral hazardproblems a variety of solutions exist, including inspections and monitoring.
7 E Fama, “Agency Problems and the Theory of the Firm,” Journal of Political Economy, April 1980,pp. 288–307.
zim36725_ch04_135-169.qxd 12/15/09 12:36 PM Page 141

142 Chapter 4
All economic resources or assets are bundles of decision rights with respect to how they canor cannot be used. For example, ownership of a car includes a bundle of decision rights overits use, although not unrestricted use. The car owner can drive, sell, paint, or even destroy thecar, but it is illegal to drive the car over the speed limit. The police powers of the state en-force private decision rights over assets; the threat of legal sanctions is brought to bearagainst someone interfering with another’s rights. If someone prevents you from drivingyour car by stealing it, the thief can be imprisoned. Our system of private property rights,including the courts and the police, enforces and limits individual decision rights.
Decision rights over the firm’s assets are assigned to various people within the firm whoare then held accountable for the results. If an individual is given decision-making authorityover some decision (such as setting the price of a particular product), we say that personhas the decision right for that product’s price. Throughout the remainder of the book, we de-scribe the importance of assigning decision rights to various individuals within the organiza-tion and the role of accounting in the assignment process. Who or what group of individualshas the decision rights to set the price, hire employees, accept a new order, or sell an asset? Akey decision for many managers is whether to retain the right to make a particular decision ordelegate the right to someone else. The question of whether the organization is centrally man-aged or decentralized is an issue of decision right assignment. Employee empowerment isa term that means assigning more decision rights to employees (i.e., decentralization).Accounting-based budgets assign decision rights to make expenditures to specific employees.
Although they are rational and self-interested, individuals have limited capacities to gather andprocess knowledge. Since information (knowledge) is costly to acquire, store, and process, in-dividual decision-making capacities are limited. Steve Jobs cannot make all of the decisions atApple because he lacks the time to acquire the knowledge necessary for decision making. Theprocess of generating the knowledge necessary to make a decision and then transferring thatknowledge within the firm drives the assignment of decision rights.8
3. Role ofKnowledge andDecision Making
2. DecisionRights and RightsSystems
ManagerialApplication:Use of SpecificKnowledgeat AppleComputer
Apple’s PowerBook was among the first portable Macs. It had so many bells and whis-tles that it weighed 17 pounds. It did not do well in the market. In 1990, Apple begancompletely reworking the design of the computer from the consumer’s viewpoint. Theentire product-development team of software designers, industrial engineers, marketingpeople, and industrial designers was sent into the field to observe potential customersusing other products. The team discovered that people used laptops on airplanes, in cars,and at home in bed. People wanted mobile computers, not just small computers. Inresponse, Apple redesigned the PowerBook as a new product that was easy to use anddistinctive. Sales improved.
The knowledge of what customers really wanted in a laptop computer was acquiredby a team who interacted closely with customers. The team also had important knowl-edge that allowed them to take this information and use it to design a marketable prod-uct. Finally, they had the authority to modify the product based on their findings. It isless likely that this specific knowledge would have been incorporated in product designin a large centrally planned firm—in which a central office is in charge of making liter-ally thousands of decisions.
SOURCE: “Hot Products, Smart Design Is the Common Thread,” BusinessWeek, June 7, 1993, pp. 54–57.
8 M Jensen and W Meckling, Contract Economics, ed. L Werin and H Wijkander (Oxford: Blackwell, 1992),pp. 251–74.
zim36725_ch04_135-169.qxd 12/15/09 12:36 PM Page 142

Organizational Architecture 143
Because knowledge is valuable in decision making, knowledge and decision makingare generally linked; the right to make the decision and the knowledge to make it usuallyreside within the same person. In fact, a key organizational architecture issue is whetherand how to link knowledge and decision rights. Some knowledge, such as price and quan-tity, is easy (inexpensive) to transfer. In these cases, the knowledge is transferred to the per-son with the right to make the decision. Other knowledge is more difficult and hencecostlier to transfer. Technical knowledge, such as how to design a computer chip, is costlyto transfer. Knowledge that changes quickly, such as whether a machine is idle for the nexthour, is costly to transfer in time to be useful; therefore, the decision right to schedule themachine is transferred to the person with the knowledge.
Ideally, knowledge and decision rights are linked, but they do not always reside with thesame person. Suppose it is very difficult to transfer knowledge and very difficult to monitorthe person with the knowledge. Moreover, suppose large agency costs arise if the person withthe knowledge has the decision rights. Firm value might be higher if another manager withless knowledge makes the decision. This will occur if the costs from the inferior decisionsmade by the manager with less knowledge are smaller than the agency costs that result fromgiving the decision rights to the person with the better knowledge. For example, in manyfirms, salespeople do not have the decision right to negotiate prices directly with the cus-tomer, even though they have specialized knowledge of the customer’s demand curve. Pricingis determined centrally by managers with less information, perhaps to reduce the likelihoodthat the salesperson will offer a low price and receive a kickback from the customer.
Within all organizations, decision rights and knowledge must be linked. As we willsee, accounting systems, especially budgets (Chapter 6) and standard costs (Chapter 12),are important devices for transferring knowledge to the individuals with the decision rightsor giving the decision rights to individuals with the knowledge.
Production occurs either within a firm or across markets. For example, some computer soft-ware is produced by computer hardware companies and bundled with the computer, whileother software is produced and sold separately. As another example, stereos can be pur-chased as entire systems. Here, the manufacturer designs, assembles, and ships completeunits composed of a tuner-amplifier, CD player, speakers, and tape deck. Alternatively, theconsumer can purchase the components separately and assemble a complete system.
Nobel Prize winner in economics Ronald Coase argued that firms lower certain trans-actions costs below what it would cost to acquire equivalent goods or services in a seriesof market transactions.9 He conjectured that firms exist when they have lower costs thanmarkets. Team production, discussed earlier, is one way firms can have lower costs thanmarkets. When a firm can substitute one transaction that occurs inside the firm for a seriesof external market contracts, total contracting costs usually are lower.
4. Markets versusFirms
ManagerialApplication:Skoda
The large Czech automaker, Skoda, has some of its suppliers actually located physicallyinside Skoda’s assembly plants. To improve quality and costs, an independent supplierthat provides dashboards is in the Skoda assembly plant. While this is an example of twoseparate firms producing across markets, the two firms are closely linked physically.
SOURCE: H Noori and W Lee, “Fractal Manufacturing Partnership,” Logistics Information Management, 2000, pp. 301–11.
9 R Coase, “The Nature of the Firm,” Economica 4 (1937), pp. 386–405. Also, see R Watts, “AccountingChoice Theory and Market-Based Research in Accounting,” British Accounting Journal 24 (1992), pp. 242–46 fora summary of the arguments for the types of costs that are lowered by firms. These arguments include economiesof scale in contracting, team production and monitoring, postcontractual opportunism, and knowledge costs.
zim36725_ch04_135-169.qxd 12/15/09 12:36 PM Page 143

144 Chapter 4
The longer the term of a contract, the more difficult and costly it is to negotiate and tospecify the respective parties’ tasks. Firms eliminate a series of short-term market contracts andreplace them with a single long-term contract. For example, if the firm has a long-term projectto develop a sophisticated piece of computer software, it is likely that such software will bedeveloped inside the firm as opposed to being purchased from an outside firm.
The costs of acquiring knowledge and enforcing contracts drive some production tooccur within firms and other production to occur in markets. If knowledge were costless toacquire and process and there were no transactions costs, there would be no multipersonfirms. To purchase an automobile, the consumer would enter into thousands of separatecontracts with individual assemblers. If knowledge were free, these contracts would becostless. But knowledge is not free; our ability to acquire and process it is limited. Firmsemerge because they economize on repetitive contracting. For example, individuals usuallyhire general contractors to build custom homes. The general contractor has specializedknowledge of the various skilled tradespeople (plumbers, carpenters, and electricians) andcan monitor these subcontractors more cheaply (including transaction costs) than the indi-vidual home owner.
Coase’s analysis has led to an important proposition in economics. Firms that survive incompetition must have a comparative advantage in constructing contracts for internalproduction. Surviving firms have lower transactions costs than the market. This is an appli-cation of economic Darwinism (discussed in Chapter 1).
Nonetheless, markets perform certain functions far better than firms. Ultimately, marketsexist because of the right to transfer ownership of an asset and receive the proceeds. As notedearlier, individuals or firms have decision rights with respect to resources that they own,including the right to use those resources as they see fit (within the limits of the law), the right
HistoricalApplication:Firms versusMarkets WhenMarkets Ruled
Much of the world’s economic activity is conducted within firms. In fact, it is hard to envi-sion a world where large firms do not play an important role in the production and distrib-ution of products. The importance of firms, however, is a relatively recent phenomenon.Prior to the middle of the nineteenth century, there were almost no large firms. Most pro-duction was conducted by small owner-managed operations. The activities of these opera-tions were coordinated almost entirely through market transactions and prices.
The traditional American business (before 1950 ) was a single-unit business enterprise. Insuch an enterprise an individual or a small number of owners operated a shop, factory, bank,or transportation line out of a single office. Normally, this type of firm handled only a singleeconomic function, dealt in a single product line, and operated in one geographic area. Beforethe rise of the modern firm, the activities of one of these small personally owned and managedenterprises were coordinated and monitored by market and price mechanisms.
The large firm became feasible only with the development of improved energy sources,transportation, and communications. In particular, coal provided a source of energy thatmade it possible for the factory to replace artisans and small mill owners, while railroadsenabled firms to ship large quantities of goods to newly emerging urban centers. Thetelegraph allowed firms to coordinate activities of employees over larger geographicareas. These developments made it less expensive to coordinate production and distrib-ution using administrative controls, rather than relying on numerous market transactionsamong numerous small firms.
SOURCE: A Chandler, The Visible Hand: The Managerial Revolution in American Business (Cambridge, MA: HarvardUniversity Press, 1977).
zim36725_ch04_135-169.qxd 12/15/09 12:36 PM Page 144

Organizational Architecture 145
to sell the resources, and the right to the sales proceeds. Markets discipline those who have theresources to use them in their highest-valued way. If owners lower the value of their assets bynot properly maintaining them, markets punish them by lowering the resale price. Thus, mar-kets not only measure decision makers’ performance but also reward or punish that behavior.In fact, markets do three things automatically that organizations (firms) can accomplish onlythrough elaborate administrative devices: (1) measure performance, (2) reward performance,and (3) partition rights to their highest-valued use. When Adam Smith described the invisiblehand of the market and how the market allocates resources to their most highly valued use, hewas describing how the market influences behavior and assigns decision rights.10
Because an asset’s current price reflects the future cash flows associated with it, deci-sion rights over how assets will be used in the future tend to be assigned to those who valuethem the highest. In markets, decision rights are linked with knowledge. Individuals orfirms with “better” knowledge in using the asset will be willing to pay a higher price for theasset, thereby linking knowledge with decision rights.
To this point, we have assumed that when decision-making authority is granted to an individ-ual or a team within the firm, that agent or team is then actively involved in decision making(subject to ratification and monitoring from others). Sometimes, however, firms use bureau-cratic rules that purposely limit active decision making. For example, airlines allocate routesto flight attendants based on seniority—there is no supervisor deciding who gets which route.Similarly, some firms base promotions solely on years worked with the firm.
One potential benefit of limiting discretion in making decisions is that it reduces theresources consumed by individuals in trying to influence decisions. Employees are oftenvery concerned about the personal effects of decisions made within the firm. For example,flight attendants care about which routes they fly. Employees are not indifferent to whichcolleagues are laid off in an economic downturn. These concerns motivate politicking andother potentially nonproductive activities. For instance, employees might waste valuabletime trying to influence decision makers. In vying for promotions, employees might takedysfunctional actions to make other employees look bad.
By not assigning the decision right to a specific individual, influence costs are lowe-redbecause there is no one to lobby. This policy, however, can impose costs on an organization. Forexample, consider individuals who are competing for a promotion. Each of these individuals
5. InfluenceCosts
ManagerialApplication:Marketsversus Firms:Taxicabs
To illustrate how markets help to control human behavior, consider the example of pri-vately owned and operated cabs versus cabs owned by a taxi company and driven bydifferent-salaried drivers. Which cabs will have a higher market value after being driven50,000 miles? The owners of privately owned cabs have a greater incentive to maintaintheir cabs than the drivers of company-owned cabs. The resale price of each cab reflectswear and tear and maintenance. Since private cab drivers, as the sole drivers, bear all thefinancial consequences of their actions, they have an incentive to provide the correctamount of maintenance and generally drive the cab in such a way as to maximize the mar-ket value of the cab at resale. Drivers for the taxi company do not bear the consequencesof any abusive driving and/or poor maintenance, unless the taxi company implementscostly procedures to monitor the condition of the cabs after each driver’s shift. To provideincentives for the cabbies not to damage the cabs, the taxi company must install monitor-ing devices, but it is prohibitively costly to detect all abuse (such as transmission damage).
10 A Smith, The Wealth of Nations, 1776, Cannan edition (New York: Modern Library, 1937).
zim36725_ch04_135-169.qxd 12/15/09 12:36 PM Page 145

146 Chapter 4
B. Organizational ArchitectureWhen firms undertake certain repetitive transactions instead of contracting for them in out-side markets, market prices for resources used inside the firm no longer exist. For example,the firm can be thought of as a bundle of resources used jointly to produce a product. Supposeone of the many jointly used resources is a machine used in manufacturing. There is not aspecific market price for the machine used inside the firm. There is not a price for an hourof time on the machine because the firm does not engage in selling time on this machine.There may be market prices for leasing time on other firms’ machine, but if buying outsidemachine firm was cheaper than using the internal machine, the machine would not exist in-side the time.11 The cost of buying outside services includes the external price and thetransactions costs of using the market. Even if prices for seemingly equivalent transactionsoccurring in markets exist, they are unlikely to represent the opportunity cost for transac-tions within the firm. The transaction exists within the firm, not in the market, because thefirm can perform the transaction more cheaply than the market. Hence, the external marketprice for the machine, while indicative of what the firm can charge for time on its machine,does not capture the opportunity cost of using the machine inside the firm. The marketprice does not entirely capture the transactions cost savings of owning the machine.12
11 R Ball, “The Firm as a Specialist Contracting Intermediary: Applications to Accounting and Auditing,”manuscript (Rochester, NY: William E. Simon Graduate School of Business Administration, University ofRochester, 1989).
12 “Observed market prices cannot directly guide the owner of the input to perform in the same manner asif every activity he performs were measured and priced.” S Cheung, “The Contractual Nature of the Firm,”Journal of Law & Economics 26 (April 1983), p. 5.
Q4–1 What generates agency costs?
Q4–2 How are agency costs reduced, and what limits them?
Q4–3 Define goal incongruence.
Q4–4 How does one achieve goal congruence?
Q4–5 Why are knowledge and decision making linked within a firm?
Q4–6 Name three things markets do automatically that must bereplaced with elaborate administrative systems in the firm.
Q4–7 What are influence costs?
Q4–8 Why do firms exist?
ConceptQuestions
has an incentive to provide evidence to the supervisor that he or she is the most qualified per-son for the promotion. Such information is often useful in making better promotion decisions.However, the information comes at a cost—employees spend time trying to convince the su-pervisor that they are the most qualified candidate rather than performing some other activ-ity such as selling products.
In some cases, the firm’s profits are largely unaffected by decisions that greatly affectindividual employee welfare. For example, firm profits might be invariant as to whichflight attendant gets the Hawaii route versus the Sioux Falls route. It is in this setting thatbureaucratic rules for decision making are most likely. The firm benefits from a reductionin influence costs but is little affected by the particular outcome of the decision process.
zim36725_ch04_135-169.qxd 12/15/09 12:36 PM Page 146

Organizational Architecture 147
The firm cannot always use the external market’s price (even if available) to guide internaltransactions. More important, in the absence of the discipline of the market, the parties tothe firm must design administrative devices to (1) measure performance, (2) rewardperformance, and (3) partition decision rights. These three activities (called organizationalarchitecture) are performed automatically by markets but must be performed by (costly)administrative devices inside the firm.13
Performance evaluation can involve either objective or subjective performance mea-sures or combinations of both. Objective criteria include explicit, verifiable measures suchas paying employees on piece rates or sales. Subjective criteria focus on multiple hard-to-measure factors. For example, subjective performance measures of a manager include a va-riety of factors such as improving team spirit, getting along with peers, meeting budgetsand schedules, and affirmative action hiring. Firms use implicit, subjective performancemeasures because jobs typically have multiple dimensions. If a few explicit characteristicsare chosen to reward performance, employees will ignore the hard-to-quantify aspects oftheir work. Although firms must measure and reward performance, the performance mea-sure need not be objective. Firms that use objective performance measures supplementthem with subjective measures to ensure that employees do not focus entirely on the objec-tive criteria to the detriment of their other responsibilities.
Besides measuring performance, organizations must reward favorable performanceand in some cases punish unwanted behaviors (sometimes by firing employees). Agentsmeeting or exceeding performance expectations are rewarded with pay increases, bonuses,promotions, and perquisites. Superior performance is rewarded with both monetaryand nonmonetary compensation. Monetary rewards involve salary, bonus, and retirementbenefits. Nonmonetary rewards include prestigious job titles, better office location and fur-nishings, reserved parking spaces, and country club memberships.
Another administrative device in firms is partitioning decision rights. Within organi-zations, all decision rights initially reside with the board of directors. The vast majority ofthese rights are assigned to the chief executive officer (CEO), with the exception of theright to replace the CEO and set his or her pay. The CEO retains some rights and reassignsthe rest to subordinates. This downward cascading of decision rights within an organizationgives rise to the familiar pyramid of hierarchies. Centralization and decentralization revolvearound the issues of partitioning decision rights between higher versus lower levels of theorganization and linking knowledge and decision rights.
1. Three-LeggedStool
ManagerialApplication:GamingObjectivePerformance-EvaluationSystems
This example illustrates how members of one local management team who did not wantto lose their jobs successfully gamed the performance-evaluation system their companyused in deciding when to close unprofitable mines.
In this particular company, mines were shut down after the yield per ton of ore droppedbelow a certain level. One old marginal mine managed to stay open for several years becauseof the strategic behavior of its management. It happened that the mine contained one veryrich pocket of ore. Instead of mining this all at once, the management used it as its reserve.Every time the yield of the ore it was mining fell below an acceptable level, it would mix ina little high-grade ore so the mine would remain open.
SOURCE: E Lawler and J Rhode, Information and Control in Organizations (Santa Monica, CA: Goodyear Publishing, 1976),pp. 87–88.
13 Jensen and Meckling (1992), p. 265.
zim36725_ch04_135-169.qxd 12/15/09 12:36 PM Page 147

148 Chapter 4
ManagerialApplication:Objective andSubjectivePerformanceCriteria atLincolnElectricCompany
Lincoln Electric manufactures electric arc welding machines and welding disposables(electrodes). At the heart of Lincoln Electric’s success is a strategy of building qualityproducts at a lower cost than its competitors and passing the savings on to customers.Lincoln has been able to implement this strategy, in part, through an employee incentivesystem that fosters labor-productivity increases arising from a pay-for-performancecompensation plan.
The two components of Lincoln’s performance evaluation scheme are pieces pro-duced and merit rating. The first component is an objective, readily quantifiable perfor-mance measure for each production employee (i.e., the number of good units produced).The employee’s wage is equal to the piece rate times the number of good units produced.(Employees are not paid for defects.) By working hard, in some cases even throughlunch and breaks, employees can double and sometimes triple their pay.
The second component of Lincoln’s evaluation scheme is the employee’s merit rat-ing. These ratings are used to determine the employee’s share of the bonus pool. The sizeof the bonus pool approximately equals wages and is about twice Lincoln’s net incomeafter taxes, although there is substantial annual variation in the size of the pool. Eachemployee’s merit evaluation is based on employee dependability, quality, output, andideas and cooperation, assessed primarily by the employee’s immediate supervisor.
Two important observations emerge from Lincoln Electric. First, the output from theperformance evaluation system is used as an input by the performance reward system; thetwo systems are linked. Second, Lincoln uses highly objective, explicit measures of per-formance (piecework) as well as subjective measures (ideas and cooperation).
SOURCE: www.lincolnelectric.com
ManagerialApplication:PerformanceEvaluationand Rewardsat the HaierGroup
Haier, one of China’s fastest growing firms, stresses customer service, product quality,efficiency, and speed to market. It is one of the 100 most recognizable brands in theworld and manufactures more than 15,000 different home appliances such as refrigera-tors, air conditioners, microwaves, and washing machines that are sold in 160 countriesthrough 59,000 sales outlets. In the 1980s it was near bankruptcy. What explains Haier’sphenomenal success?
Haier utilizes advanced information technology in operating its employee perfor-mance measurement and reward systems. Each day every factory worker receives a de-tailed report card outlining his or her production quantity, quality, defects, technologylevel, equipment use, and safety record. Each employee is expected to improve 1 percentover the previous day. Realizing these improvements results in higher wages, bonuses,more job training, and additional social benefits. People not achieving their targets aredemoted and eventually fired. Managers are reviewed weekly based on their achievingboth qualitative and quantitative goals such as process improvement and innovation.Managers, like factory workers, are rewarded with additional pay and promotions formeeting their targets or they are demoted or even fired for poor performance. Dozens ofHaier employees are fired every month. “Whoever tarnishes the brand of the companywill be dismissed by the company.”
SOURCE: T Lin, “Lessons from China,” Strategic Finance, October 2006, pp. 48–55; http://www.haier.com.pk/.
zim36725_ch04_135-169.qxd 12/15/09 12:36 PM Page 148

Organizational Architecture 149
ManagerialApplication:Use ofFinancial andNonfinancialPerformanceMeasures
One study found that nonfinancial physical measures such as labor headcounts, unitsof output, units in inventory, and units scrapped are used to run day-to-day operations.The nonfinancial data chosen are highly correlated with the financial reports of themanager’s performance and are readily available on a daily or even hourly basis. Also,the nonfinancial data tend to be variables that the manager can control. Yet whenasked about their “most valuable report in general,” respondents said it was themonthly income or expense statement.
SOURCE: S McKinnon and W Bruns, The Information Mosaic (Boston: Harvard Business School Press, 1992).
Ultimately, all organizations must construct three systems:
1. A system that measures performance.
2. A system that rewards and punishes performance.
3. A system that assigns decision rights.
These three systems make up the firm’s organizational architecture. They are like the legsof a three-legged stool. For the stool to remain level, all three legs must balance. Similarly,each of the three systems that compose the organization’s architecture must be coordinatedwith the other two. The performance measurement system must measure the agent’s per-formance in areas over which he or she has been assigned the decision rights. Likewise, thereward system must be matched to those areas over which performance is being measured.A person should not be assigned decision rights if the exercise of these rights cannot bemeasured and rewarded. Though this sounds obvious, changing one system often requireschanging the other two systems.
The internal accounting system is a significant part of the performance measurementsystem. Changes are often made to this system without regard to their impact on theperformance-reward and decision-assignment systems. Managers making changes to theaccounting system are surprised when the stool is no longer level because one leg is now adifferent length than the other two.
Performance measurement systems generally use financial and nonfinancial measures ofperformance. Nonfinancial metrics include: percentage of on-time deliveries, order com-pleteness, factory ability to meet production schedules, excess inventory, employee turnover,manufacturing quality, percentage of defects and units of scrap, schedule performance, andcustomer complaints.
Financial indicators are collected and audited by the firm’s accountants, whereas non-financial measures are more likely to be self-reported. Therefore, financial measures areusually more objective and less subject to managerial discretion. Nonfinancial indicatorsusually relate to important strategic factors. For example, airline profitability is very sen-sitive to the fraction of airline seats occupied. Thus, load factors are an important strate-gic measure in airlines. Nonfinancial measures provide information for decision making.Financial measures of performance tend to be for control.
One problem with using nonfinancial measures is that they tend to proliferate to thepoint that managers can no longer jointly maximize multiple measures. Numerous perfor-mance measures dilute attention. If several key indicators are used, senior managers mustimplicitly specify the relative weights for each indicator for performance evaluation. Whichindicator is really the most important in assessing performance? If senior management doesnot specify the weights, subordinates are uncertain which specific goal should receive themost attention. Chapter 14 describes the Balanced Score Card, and specifically the problemof using multiple performance measures.
zim36725_ch04_135-169.qxd 12/15/09 12:36 PM Page 149

150 Chapter 4
Markets automatically control behavior and partition decision rights. The firm must designadministrative devices to do what the market does. These mechanisms include hierarchies toseparate decision management from control, budgeting systems, periodic performance eval-uation systems, standard operating rules and policy manuals, bonus plans and executivecompensation schemes, and accounting systems. Some of these administrative devices, suchas hierarchies and performance evaluation systems, are described in greater detail below.Budgeting systems and accounting systems are deferred to later chapters. (Standard oper-ating rules and policy manuals are not addressed.)
2. DecisionManagementversus DecisionControl
ManagerialApplication:BonusesAbused at the VA
Most federal agencies pay executive bonuses to increase accountability in governmentby tying pay closely to performance. Federal bonuses are designed to retain and rewardknowledgeable and professional career public servants. While bonuses can help retainkey employees, nonperformance-based bonuses can be counter-productive.
In 2007, top officials at the Department of Veterans Affairs (VA), the agencycharged with caring for military veterans, received an average bonus of $16,700, and adeputy assistant secretary and several regional directors each received $33,000, about20 percent of their salaries. The heads of the VA’s various divisions supposedly deter-mine the bonuses, based in part on performance evaluations.
These bonuses came to light and proved politically embarrassing after stories ap-peared about a $1 billion shortfall that put veterans’ health care in peril and substandardcare at Walter Reed Hospital in Washington, D.C.
Senator Daniel Akaka, chairman of the Senate Veterans’ Affairs Committee, saidthe payments pointed to an improper “entitlement for the most centrally placed or well-connected staff, and awards should be determined according to performance.”
Steve Ellis, vice president of Taxpayers for Common Sense, said that “while the VAbonuses were designed to increase accountability in government by tying raises moreclosely to performance, damage can be done when payments turn into an automatichandout regardless of performance.”
This example illustrates how pay-for-performance systems, in this case bonuses,can be gamed and, in the end, produce dysfunctional results.
SOURCE: “VA Officials’ Bonuses Raise Eyebrows,” May 3, 2007, http://www.cbsnews.com/stories/2007/05/03/national/main2757717.shtml.
ManagerialApplication:When theLegs of theStool Don’tBalance
This example illustrates how dysfunctional decisions can result when the three legsof the stool do not match. A plane was grounded for repairs at an airport. The nearestqualified mechanic was stationed at another airport. The decision right to allow the me-chanic to work on the airplane was held by the manager of the second airport. The man-ager’s compensation, however, was tied to meeting his own budget rather than to theprofits of the overall organization. The manager refused to send the mechanic to fix theplane immediately, because the mechanic would have had to stay overnight and the ho-tel bill would have been charged to the manager’s budget. The mechanic was dispatchedthe next morning so that he could return the same day. A multimillion-dollar aircraft wasgrounded, costing the airline thousands of dollars. The manager, however, avoided a$100 hotel bill. The mechanic would probably have been dispatched immediately hadthe manager been rewarded on the overall profit of the company or had the decisionright been held by someone else with this objective.
SOURCE: M Hammer and J Champy, Reengineering the Corporation (New York: Harper Business, 1993).
zim36725_ch04_135-169.qxd 12/15/09 12:36 PM Page 150

Organizational Architecture 151
Perhaps the most important mechanism for resolving agency problems is a hierarchicalstructure that separates decision management from decision control.14 All organizations havehierarchies with higher-level managers supervising lower-level employees. Decision manage-ment refers to those aspects of the decision process in which the manager either initiates or im-plements a decision. Decision control refers to those aspects of the decision process wherebymanagers either ratify or monitor decisions. See Figure 4–1. Managers rarely are given all thedecision rights to make a particular decision. Rather, an elaborate system of approvals andmonitoring exists. Consider a typical decision to hire a new employee. First, a manager re-quests authorization to add a new position. This request is reviewed by higher-level managers.Once the position is authorized, the manager making the request usually begins the recruitingand interviewing process. Eventually a new employee is hired. After a certain period, the em-ployee’s performance is evaluated. In general, the following steps in the decision process occur(categorized according to decision management or decision control): (1) initiation (manage-ment), (2) ratification (control), (3) implementation (management), and (4) monitoring (con-trol). Initiation is the request to hire a new employee. Ratification is the approval of the request.Implementation is hiring the employee. Monitoring involves assessing the performance of thehired employee at periodic intervals to evaluate the person who hires the employee.
Individual managers typically do not have the authority to undertake all four steps inthis decision process. The manager requesting a new position does not have the decisionright to ratify (approve) the request. There is a separation of decision management fromcontrol. The same principle in the U.S. Constitution separates the powers of the variousbranches of government. The executive branch requests spending, which is approved bythe legislature. The executive branch is then charged with making the expenditures. Thejudicial branch ultimately monitors both the executive and legislative branches.
As another example of how knowledge is linked with initiation rights and how hierarchiesseparate decision management from decision control, consider the decision to acquire capitalassets. The decision to build a new plant usually begins with division managers who make aformal proposal to senior management. This is decision initiation. The initiating managershave specialized knowledge of their production process and product demand. The formal pro-posal usually takes the form of a capital budget request. Senior managers then ask the financedepartment to evaluate the discounted cash flow assumptions in the capital budget request. Thefinance department possesses specialized knowledge to judge risk-and-return assumptions inthe discount rate and the analysis of the cash flows in the plan. Senior management assemblesother knowledge from the human resource, real estate, and legal departments in the ratification
14 See E Fama and M Jensen, “Separation of Ownership and Control,” Journal of Political Economy, June1983, pp. 301–25.
1. Initiation
Decision Management Decision Control
2. Ratification
4. Monitoring
3. Implementation
FIGURE 4–1
Steps in the decision-making process:Decisionmanagement versusdecision control
zim36725_ch04_135-169.qxd 12/15/09 12:36 PM Page 151

152 Chapter 4
process. Construction of the project—implementation—is the responsibility of the proposingmanagers or a separate facilities department within the firm. After construction is completed,accountants prepare monthly, quarterly, and annual reports on the division requesting and op-erating the capital project. This is part of the monitoring process.
Organizations separate decision management from decision control. Before imple-menting a decision, someone higher up in the organization must ratify it. Management andcontrol are not separated, however, when it is too costly to separate them. For example,managers are often assigned the decision rights to make small purchases (perhaps under$500) without ratification because the cost of separating management from control exceedsthe benefits. Since it takes time to receive ratification, lost opportunities or other adverseconsequences can occur. The most vivid illustration of delay costs is in the military. Fighterpilots flying in noncombat situations do not have the decision rights to fire at unauthorizedor potential enemy planes. They first must notify their superiors and seek authority to shoot.But in combat situations, decision management and decision control are not separated be-cause to do so would hamper the pilots’ ability to respond in situations when delays can becatastrophic. In combat, pilots have the authority to fire at enemy aircraft. An example ofavoiding a delay that could possibly be deadly: In some states paramedics can administercertain drugs in life-threatening situations without first getting a physician’s approval.
ManagerialApplication:CapitalProjectMonitoring atCaterpillar
Caterpillar Inc. monitors strategic capital projects such as a new plant over the life of eachproject. Once a capital project is approved and installed, a monitoring team reviews it everysix months. Only large strategic projects (often composed of several individual capitalassets), such as an axle factory or an assembly line, are evaluated. The project monitoringteam consists of representatives from industrial engineering, manufacturing, materialsacquisition, and cost accounting. They prepare a report that compares the actual results withthe budgeted results. Reasons for any differences are listed, including a detailed report thatreconciles why the project’s current results differ from what was expected at the time thecapital project was approved. In addition, the monitoring team issues a list of recommen-dations to improve the performance of the project. The monitoring team’s findings aredistributed to the manager of the project being evaluated, the building superintendent, theplant manager, the group presidents, and the corporate board of directors.
SOURCE: J Hendricks, R Bastian, and T Sexton, “Bundle Monitoring of Strategic Projects,” Management Accounting,February 1992, pp. 31–35.
Q4–9 Define decision management and decision control and give anexample of each.
Q4–10 Describe the three systems all organizations must construct tocontrol agency problems.
Q4–11 Describe the four major steps in the management decisionprocess. How are agency problems reduced in this process?
ConceptQuestions
C. Accounting’s Role in the Organization’s ArchitectureThe preceding section described the separation of decision management from decision con-trol. One way to limit agency costs is to separate the decision rights to initiate and implementdecisions (decision management) from the ratifying and monitoring functions (decision
zim36725_ch04_135-169.qxd 12/15/09 12:36 PM Page 152

Organizational Architecture 153
control). Accounting systems play a very important role in monitoring as part of the perfor-mance evaluation system. Accounting numbers are probably more useful in decision moni-toring and often least useful in decision initiation and implementation. For decisionmanagement, managers want opportunity costs (described in Chapter 2). Accounting dataare often criticized as not being useful for decision management, but their usefulness fordecision control is frequently overlooked.
As a monitoring device, the accounting function is usually independent of operat-ing managers whose performance the accounting report is measuring. The reason forthis separation is obvious. Accounting, as part of the firm’s monitoring technology, isdesigned to reduce agency costs, including theft and embezzlement. Since accountingreports bring subordinates’ performance to the attention of their superiors, the reportsshould not be under the control of the subordinates. Internal accounting reports providean overall review of subordinates’ performance by giving senior managers reasonablyobjective and independent information. Shareholders and the board of directors use theaccounting system to check on the performance of the chief executive officer (CEO)and senior managers. The CEO often has substantial influence over the accounting sys-tem since the corporate controller usually reports ultimately to the CEO. Some firmshave the controller report to the independent audit committee of the board of directors.
HistoricalApplication:PerformanceMeasures inRetailing
Large department stores with multiple lines of goods such as clothing, furniture, jewelry,and glassware began to appear in the United States in the latter half of the 1800s (Lord& Taylor in 1858 and Macy’s in 1870). These stores were in big cities that could supportthe large inventories they carried. These successful retailers had high volume and highinventory turnover by selling at low prices and low margins. They marked down slow-moving lines and did extensive local advertising.
In rural areas, mass marketing was done by mail-order houses. Montgomery Wardbegan in 1872; Sears and Roebuck began in 1887. The 1887 Montgomery Ward mail-order catalog was 540 pages long and contained 24,000 items. The success of the mail-order houses, like the department stores, was due to low prices and high volumes.Mail-order houses could process 100,000 orders per day.
At the heart of both the department stores and mail-order houses were the operat-ing departments (such as women’s and children’s clothing, furniture, and housewares)and their buyers. The buyers had to acquire specialized knowledge of their customers’preferences. They committed their departments to purchase millions of dollars of goodsbefore they knew whether the items could be sold.
Two types of information generated by the accounting department were used to eval-uate the operating managers and their buyers: gross margin and stock turn. Gross marginis income (sales less cost) divided by sales. Stock turn or inventory turnover is sales di-vided by average inventory; it measures the number of times stock on hand is sold and re-placed during the year. Departments with higher stock turns are using their capital investedin inventories more efficiently. For example, the large Chicago merchandiser MarshallField’s had a stock turn of around five in the 1880s. The development of gross margin andstock turn illustrates how accounting-based performance-evaluation measures develop tomatch the decision rights partitioned to particular managers. Critical to the success of largemass distributors was partitioning decision rights to the buyers with the specialized knowl-edge and then evaluating and rewarding them based on their decision rights.
SOURCE: A Chandler, The Visible Hand: The Managerial Revolution in American Business (Cambridge, MA: HarvardUniversity Press, 1977), pp. 223–36.
zim36725_ch04_135-169.qxd 12/15/09 12:36 PM Page 153

154 Chapter 4
To use the accounting system for control of the CEO and senior management, the share-holders and outside directors on the board insist on an external, third-party audit of thefinancial results.15
To the extent financial measures are used for decision control and nonfinancialmeasures are used for decision management, the following implications arise:
1. Financial measures are not under the complete control of the people beingmonitored (i.e., the operating managers).
2. Nonaccounting measures, such as customer complaints and defect rates, areoften more timely than accounting measures. Nonfinancial data can be reportedmore frequently than quarterly or monthly, as is usually the case for accountingdata.
3. Not every decision requires ratification or monitoring. Decision control can bebased on aggregate data to average out random fluctuations. Instead ofmonitoring every machine setup, it is usually cost-efficient to aggregate all setupsoccurring over the week and make sure the average setup time or cost is withinacceptable levels.
4. Operating managers tend to be dissatisfied with financial measures formaking operating decisions. The accounting numbers are not especially timelyfor operating decisions. They often are at too aggregate a level and do notprovide sufficient detail for the particular decision. In response, these operatingmanagers develop their own, often nonfinancial, information systems to providethe more timely knowledge they require for decision management. But at thesame time, they rely on accounting data to monitor the managers who reportto them.
A number of specific internal accounting procedures, such as standard costs, budget-ing, and cost allocations (described in later chapters), help reduce agency problems. Manyaccounting procedures are better understood as control mechanisms than as aids in decisionmanagement. For example, economists have long cautioned against using accountants’allocation of fixed costs to compute “average” unit costs in making short-term decisions.These unit costs bear little relation to short-term variable cost, which is necessary for de-termining the short-term profit-maximizing level of output. However, average unit ac-counting costs can be useful as a control mechanism for detecting changes in a subunit’scost performance.
Applying the economic Darwinism principle (marmots and bears) suggests that theseseemingly irrational accounting procedures must be yielding benefits in excess of theircosts. Economists describe the dysfunctional output/pricing decision that can result whenaccounting average costs are used instead of variable costs. These dysfunctional decisionsare the indirect costs of using the accounting procedures. Reducing the firm’s agency prob-lems provides the necessary offsetting benefits to explain the preponderance of so-calledirrational accounting procedures. In addition to the benefits provided via organizationalreasons, such procedures can provide benefits (or costs) via external reporting, tax report-ing, and/or as a cost control device (see Figure 1–1).
The next section provides a specific example of how accounting earnings are used inexecutive compensation plans to better align managers’ and shareholders’ interests.
15 R Watts and J Zimmerman, “Agency Problems, Auditing and the Theory of the Firm: Some Evidence,”Journal of Law & Economics, October 1983, pp. 613–33.
zim36725_ch04_135-169.qxd 12/15/09 12:36 PM Page 154

Organizational Architecture 155
D. Example of Accounting’s Role: Executive Compensation ContractsExecutive compensation contracts illustrate how accounting numbers help reduce agencycosts. To better align the interests of shareholders and senior managers, most large U.S. cor-porations have incentive compensation contracts. This section briefly describes the designof these contracts and their reliance on accounting numbers. It illustrates how accountingperformance measures are used to reduce agency problems.
Senior executives in large U.S. firms typically are paid a salary plus an annual bonus; thebonus is often 100 percent of the salary. The compensation committee of the board of direc-tors, which usually consists of outside nonmanagement directors, administers the annualbonus and the annual salary adjustment. The committee annually sets performance goals foreach senior executive and establishes how large a bonus each will receive if the goals areachieved. The goals often consist of earnings growth targets, market share, new product in-troduction schedules, affirmative action hiring targets, and other strategic measures appropri-ate for the particular manager. If executives meet their targets, they receive some combinationof cash, stock options, restricted stock, or deferred compensation.
To protect shareholders from excessive payouts to senior executives and to give seniorexecutives a sense of the whole organization rather than just their own part, the total bonuspayout to all eligible managers is limited to some fraction of accounting earnings. Execu-tive compensation contracts usually must be approved by the shareholders every threeyears. Besides defining who is eligible for awards and how they are administered and paid,these contracts constrain the total annual bonus payments to be paid out of an annual fund.
Accounting numbers enter executive compensation in two ways. First, accounting earn-ings are often used as individual performance measures (such as divisional profits). Second,accounting earnings constrain the total amount of compensation paid out to executives.
Surveys of compensation practices in publicly traded firms find that almost all of themrely on some measure of accounting profit to measure and reward the performance ofsenior executives.16 Large-scale empirical studies routinely find a strong positive associa-tion between changes in accounting profits and changes in executive pay. Executive pay isusually measured as salary plus bonus paid to the chief executive officer. In these studies,
ManagerialApplication:GeneralElectric’sExecutiveCompensationContract
General Electric defines its 2007 bonus formula as follows:
The Plan Authorizes the Board of Directors to appropriate to an incentive compensation re-serve each year up to 10% of the amount by which the company’s consolidated net earningsexceeds 5% of the Company’s average consolidated capital investment.
In General Electric’s plan, the executives do not receive a bonus unless the firmearns at least 5 percent on capital. This is a lower bound. Some businesses also place anupper bound on the bonus payout. A typical upper limit to a bonus payout might bestated as, “The incentive compensation reserve shall not exceed 10 percent of the totalamount of the dividends paid on the corporation’s stock.” This upper bound, which istied to dividends, helps reduce the overretention of cash in the firm. If the business isvery profitable, the only way executives can increase their bonus payouts is by increas-ing dividends paid out to the shareholders.
SOURCE: General Electric Co. Proxy Statement (February 28, 2007).
16 K Murphy, “Executive Compensation,” in Handbook of Labor Economics 3, ed. O Ashenfelter and D Card(Amsterdam: North Holland, 1999).
zim36725_ch04_135-169.qxd 12/15/09 12:36 PM Page 155

156 Chapter 4
accounting profits are usually one of the most important explanatory variables of executivepay among firm size, stock returns, and industry classification. Thus, it appears as ifaccounting profits either are used directly in setting executive compensation or are highlycorrelated with performance measures used in setting pay.
All executive bonus plans have a lower bound and some have upper bounds. Fig-ure 4–2 shows how the bonus pool varies with firmwide accounting earnings. Ifaccounting earnings are below the lower bound, the pool is zero and no bonuses are paid.Between the lower and upper bounds, the pool increases with earnings. Above the upperbound, the pool stops increasing with earnings. Bonus plans with upper and lower boundscreate incentives for management to increase accounting earnings if earnings are between
AcademicApplication:ExecutivesManageAccountingEarnings
A research study examining Fortune 250 firms with bonus plans (some dating back to1930) provides evidence that executives manage earnings. Using 1,527 observationsfrom 94 firms, the study finds that managers are more likely to take accounting actionsthat increase earnings when earnings are between the two bonus plan bounds and totake accounting actions that decrease earnings when earnings are outside the bounds.While the evidence suggests that managers manage reported earnings to increase exec-utive bonuses, the prevalence of accounting-based executive bonus plans indicates thatthese plans are useful in resolving agency problems.
Accounting earnings are also used to measure the performance of lower-level man-agers. A study of 54 profit centers in 12 publicly traded U.S. corporations finds that all12 firms link bonuses to profit center accounting performance. The profit center man-ager’s annual bonus depends on achieving a budgeted target. The size of the bonus forachieving the target varies from 20 to 100 percent of the base salary, with the most com-mon being about 25 percent.
SOURCE: P Healy, “The Effect of Bonus Schemes on Accounting Decisions,” Journal of Accounting & Economics 7 (April1985), pp. 85–107. For later evidence, see J Gaver, K Gaver, and J Austin, “Additional Evidence on Bonus Plans andIncome Management,” Journal of Accounting & Economics 19 (February 1995); R Holthausen, D Larcker, and R Sloan,“Annual Bonus Schemes and the Manipulation of Earnings,” Journal of Accounting & Economics 19 (February 1995);A Leone, F Guidry, and S Rock, “Earnings-Based Bonus Plans and Earnings Management by Business-Unit Managers,”Journal of Accounting & Economics 26 (January 1999), pp. 113–42.
Bonuspool
Accountingearnings
Maximumbonus pool
Lowerbound
Upperbound
FIGURE 4–2
Typical executivebonus pool
zim36725_ch04_135-169.qxd 12/15/09 12:36 PM Page 156

Organizational Architecture 157
the lower and upper bounds. Earnings can be increased by increasing net cash flows or byselecting income-increasing accounting methods. For example, reducing bad debt expenseraises net income. If earnings are below Figure 4–2’s lower bound or above the upperbound, managers have incentives to choose income-decreasing accounting accruals,such as writing off obsolete inventories and plant and equipment. These types of account-ing charges remove assets from the balance sheet that would have been expensed infuture accounting periods, thereby lowering income in this period but raising incomein future years.
E. SummaryBesides providing information for making operating decisions, accounting numbers are also used incontrolling conflicts of interest between owners (principals) and employees (agents). Agency prob-lems arise because self-interested employees maximize their welfare, not the principal’s welfare, andprincipals cannot directly observe the agents’ actions.
The free-rider problem, one specific agency problem, arises because, for agents working inteams, the incentive to shirk increases with team size. Usually it is more difficult to monitor individ-ual agents as team size increases. Also, each agent bears a smaller fraction of the reduced output fromhis or her shirking. The horizon problem, another agency problem, arises when employees expectingto leave the firm in the future place less weight than the principal does on those consequences occur-ring after they leave.
Transactions that occur across markets have fewer agency problems because the existence ofmarkets and market prices gives owners of an asset the incentive to maximize its value by linkingknowledge with decision rights. But once transactions occur within firms, administrative devicesmust replace market-induced incentives. In particular, firms try to link decision rights with knowl-edge and then provide incentives for people with the knowledge and decision rights to maximize firmvalue.
To maximize firm value, which involves minimizing agency costs, managers design the organi-zation’s architecture—three interrelated and coordinated systems that measure and reward perfor-mance and assign decision rights. The analogy of the three-legged stool illustrates how important itis that the three legs be matched to one another. Changing one leg usually requires changing the othertwo to keep the stool level.
The internal accounting system, used to measure agents’ performance, provides an importantmonitoring function. Hence, the accounting system usually is not under the control of those agentswhose performance is being monitored. Primarily a control device, accounting is not necessarily asuseful for decision making as managers would like.
The performance evaluation system, one leg of the stool, consists of both financial and nonfi-nancial measures of performance. Executive compensation plans routinely use accounting earningsas a performance measure both to evaluate managers and to reduce agency costs by constrainingthe total bonus payouts to managers. Chapter 5 describes two more accounting tools that are used toreduce agency problems: responsibility accounting and transfer pricing.
Self-Study ProblemSpan of Control
Span of control is defined as “the number of subordinates whom a superior directly controls.”17
Whether the span of control is large or small depends on several factors, including training. “(I)f aperson was well trained, he or she would need little supervision. The span of control would be wide. If
17 C Perrow, Complex Organizations: A Critical Essay, 3rd ed. (New York: Random House, 1986), p. 30.
zim36725_ch04_135-169.qxd 12/15/09 12:36 PM Page 157
158 Chapter 4
personnel were not well trained, they would need more supervision, and the span of control would benarrow and the hierarchy higher.” But the evidence shows “the more qualified the people, the less thespan of control” and the higher the hierarchy.18
In some situations, we observe a span of control of 40 or 50 (e.g., the faculty in a businessschool). In other situations, we observe spans of control of two to five (e.g., card dealers in a casino).What factors would you expect to be important in determining the optimum span of control? Giveexamples where appropriate.
Solution:
Span of control (or the height/shape of the organization chart) is a central feature of the control prob-lem faced by organizations. The amount of monitoring required by each individual in the firm affectsthe span of control. High levels of monitoring decrease the span of control because supervisors havelimited processing capacities.
A number of factors will affect the span of control:
1. Knowledge—it is useful to try to link knowledge and decision rights. If decisionmanagement rights are delegated, decision control rights are usually retained, therebydecreasing the span of control.
2. If monitoring costs are reduced, span of control increases, other things being equal. A caseof reduced monitoring costs is grouping subordinates close to the supervisor. Performanceevaluation and reward systems that reduce agency costs (including monitoring costs)increase the span of control. If agency costs are high because the residual loss is large(e.g., bank tellers or card dealers in casinos), the span of control is smaller, other thingsbeing equal.
3. Perrow argues that one can change behavior via training to induce people to behave in theorganization’s interest. This is inconsistent with the view that people are self-interested,rational maximizers.
ProblemsP 4–1: Empowerment
It is frequently argued that for empowerment to work, managers must “let go of control” and learn tolive with decisions that are made by their subordinates. Evaluate this argument.
P 4–2: Pay for Performance
Communities are frequently concerned about whether or not police are vigilant in carrying out theirresponsibilities. Several communities have experimented with incentive compensation for police. Inparticular, some cities have paid members of the police force based on the number of arrests that theypersonally make. Discuss the likely effects of this compensation policy.
P 4–3: Course Packets
Faculty members at a leading business school receive a budget to cover research expenditures, soft-ware and hardware purchases, travel expenses, photocopying for classroom use, and so forth. Thebudget is increased $250 for each class taught (independent of the number of students enrolled). Forexample, a faculty member receives a base budget of $14,000 for this year and teaches threecourses—hence, the faculty’s total budget is $14,750.
Finance professors teach much larger classes than any other functional area (e.g., accounting) andthey tend to have larger course packets per student. Faculty can photocopy their course packets and havetheir budgets reduced by the photocopying charges. Or the faculty can distribute course materials via theschool’s network where students can download them and print them on their personal printers.
18 Perrow (1986), p. 31.
zim36725_ch04_135-169.qxd 12/15/09 12:36 PM Page 158

Organizational Architecture 159
Required:
a. Which faculty members are more likely to put course packets and lecture notes on theirWeb pages and which faculty are more likely to photocopy the material and distribute it totheir students?
b. Is this partitioning of faculty members distributing materials electronically versus makingpaper copies efficient?
P 4–4: Allied Van Lines
Why are drivers for long-haul (cross-country) moving companies (e.g., Allied Van Lines) often fran-chised, while moving companies that move households within the same city hire drivers as employ-ees? Franchised drivers own their own trucks. They are not paid a fixed salary but rather receive theprofits from each move after paying the franchiser a fee.
P 4–5: Voluntary Financial Disclosure
Prior to the Securities Acts of 1933 and 1934, corporations with publicly traded stock were notrequired to issue financial statements, yet many voluntarily issued income statements and balancesheets. Discuss the advantages and disadvantages of such voluntary disclosures.
P 4–6: University Physician Compensation
Physicians practicing in Eastern University’s hospital have the following compensation agreement.Each doctor bills the patient (or Blue Cross Blue Shield) for his or her services. The doctor pays forall direct expenses incurred in the clinic, including nurses, medical malpractice insurance, secretaries,supplies, and equipment. Each doctor has a stated salary target (e.g., $100,000). For patient fees col-lected over the salary target, less expenses, the doctor retains 30 percent of the additional net fees. Forexample, if $150,000 is billed and collected from patients and expenses of $40,000 are paid, then thedoctor retains $3,000 of the excess net fees [30 percent of ($150,000 � $40,000 � $100,000)] andEastern University receives $7,000. If $120,000 of fees are collected and $40,000 of expenses are in-curred, the physician’s net cash flow is $80,000 and Eastern University receives none of the fees.
Required:
Critically evaluate the existing compensation plan and recommend any changes.
P 4–7: Desert Storm Mail Deliveries
Mail delivery during the Christmas holidays of 1990 to U.S. troops stationed in Saudi Arabia for Op-eration Desert Storm was haphazard. So many letters and packages were mailed during the holidays,that warehouse space in Germany, which was the intermediate staging area for mail to Saudi Arabia,became full. Letters were often delivered weeks late, while packages were delivered with less delay.Airplanes flying between Germany and the Middle East have both a physical volume capacity and aweight capacity. A cubic foot of letters weighs more than a cubic foot of packages.
Required:
Analyze the mail delivery system and offer a plausible explanation as to why letters were treateddifferently than packages.SOURCE: N O’Connor, Capt., 2nd Marine Division.
P 4–8: American InterConnect I
Employee satisfaction is a major performance measure used at American Inter Connect (AI), a largecommunications firm. All employees receive some bonus compensation. The lower-level employeesreceive a bonus that averages 20 percent of their base pay whereas senior corporate officers receivebonus pay that averages 80 percent of their base salary. Bonus payments for all employees are linkedto their immediate work group’s performance on the following criteria: income, revenue growth,
zim36725_ch04_135-169.qxd 12/15/09 12:36 PM Page 159

160 Chapter 4
customer satisfaction, and employee satisfaction. Managers can have these criteria supplemented withadditional specific measures including hiring targets and some other specific objective for each man-ager such as meeting a new product introduction deadline or a market share target.
Employee satisfaction usually has a weight of between 15 and 20 percent in determining mostemployees’ overall bonus. To measure employee satisfaction, all employees in the group complete atwo-page survey each quarter. The survey asks a variety of questions regarding employee satisfaction.One question in particular asks employees to rate how satisfied they are with their job using a seven-point scale (where 7 is very satisfied and 1 is very dissatisfied). The average score on this questionfor all employees in the group is used to calculate the group’s overall employee satisfaction score.
Required:
Describe what behaviors you would expect to observe at AI.
P 4–9: Raises
A company recently raised the pay of employees by 20 percent. The productivity of the employees,however, remained the same. The CEO of the company was quoted as saying, “It just goes to showthat money does not motivate people.” Provide a critical evaluation of this statement.
P 4–10: Decentralization
Some economists (e.g., Hayek) argue that decentralization of economic decisions in the economy leadsto efficient resource allocation. What differences exist within the firm that make the link betweendecentralization and efficiency less clear?
P 4–11: Vanderschmidt’s
Jan Vanderschmidt was the founder of a successful chain of restaurants located throughout Europe.He died unexpectedly last week at the age of 55. Jan was sole owner of the company’s common stockand was known for being very authoritarian. He made most of the company’s personnel decisionshimself. He also made most of the decisions on the menu selection, food suppliers, advertising pro-grams, and so on. Employees throughout the firm are paid fixed salaries and have been heavily mon-itored by Mr. Vanderschmidt. Jan’s son, Joop, spent his youth driving BMWs around the Netherlandsand Germany at high speeds. He spent little time working with his dad in the restaurant business.Nevertheless, Joop is highly intelligent and just received his MBA degree from a prestigious school.Joop has decided to follow his father as the chief operating officer of the restaurant chain. Explainhow the organization’s architecture might optimally change now that Joop has taken over.
P 4–12: Sales Commissions
Sue Koehler manages a revenue center of a large national manufacturer that sells office furniture to lo-cal businesses in Detroit. She has decision rights over pricing. Her compensation is a fixed wage of$23,000 per year plus 2 percent of her office’s total sales. Critically evaluate the organizational archi-tecture of Koehler’s revenue center.
P 4–13: Formula 409
“I used to run the company that made Formula 409, the spray cleaner. From modest entrepreneurialbeginnings, we’d gone national and shipped the hell out of P&G, Colgate, Drackett, and every othergiant that raised its head. From the beginning, I’d employed a simple incentive plan based on ‘casesales’: Every month, every salesman and executive received a bonus check based on how many casesof 409 he’d sold. Even bonuses for the support staff were based on monthly case sales. It was a happytime, with everyone making a lot of money, including me.
“We abandoned our monthly case-sales bonus plan and installed an annual profit-sharing plan,based on personnel evaluations. It didn’t take long for the new plan to produce results.”SOURCE: Wilson Harrell, “Inspire Action: What Really Motivates Your People to Excel?” Success, September 1995.
Required:
What do you think happened at this company after it started the annual profit-sharing plan?
zim36725_ch04_135-169.qxd 12/15/09 12:36 PM Page 160

Organizational Architecture 161
P 4–14: Pratt & Whitney
A Wall Street Journal article (December 26, 1996) describes a series of changes at the Pratt &Whitney plant in Maine that manufactures parts for jet engines. In 1993 it was about to be closedbecause of high operating costs and inefficiencies. A new plant manager overhauled operations.He broadened job descriptions so inspectors do 15 percent more work than they did five years ago. A“results-sharing” plan pays hourly employees if the plant exceeds targets such as cost cutting andon-time delivery. Now, everyone is looking to cut costs.
Hourly employees also helped design a new pay scheme that is linked to the amount of training,not seniority, that an employee has. This was after the plant manager drafted 22 factory-flooremployees, gave them a conference room, and told them to draft a new pay plan linked to learning.
Shop-floor wages vary between $9 and $19 per hour with the most money going to peoplerunning special cost studies or quality projects, tasks previously held by managers.
This text emphasizes the importance of keeping all three legs of the stool in balance. Identify thechanges Pratt & Whitney made to all three legs of the stool at its Maine plant.
P 4–15: Theory X–Theory Y
A textbook on organization theory says:
Drawing upon the writings of Maslow, McGregor presented his Theory X–TheoryY dichotomy todescribe two differing conceptions of human behavior. Theory X assumptions held that people areinherently lazy, they dislike work, and that they will avoid it whenever possible. Leaders who acton Theory X premises are prone to controlling their subordinates through coercion, punishment,and the use of financial rewards; the use of external controls is necessary, as most human beingsare thought to be incapable of self-direction and assuming responsibility. In contrast, Theory Y isbased on the assumption that work can be enjoyable and that people will work hard and assumeresponsibility if they are given the opportunity to achieve personal goals at the same time.19
Using the framework presented in the text, critically analyze Theory X–Theory Y.
P 4–16: American InterConnect II
Employee bonuses at American InterConnect (AI), a large communications firm, depend on meetinga number of targets, one of which is a revenue target. Some bonus is awarded to the group if it meetsor exceeds its target revenue for the year. The bonus is also tied to meeting targets for earnings,employee satisfaction, hiring goals, and other specific objectives tailored to the group or manager.
AI has several product development groups within the firm. Each is assigned the task of devel-oping new products for specific divisions within the firm. Product developers, primarily engineersand marketing people, are assigned to a new product development team to develop a specific newproduct. Afterward, they are assigned to new development teams for a different division or are reas-signed back to their former departments. Sometimes they become product managers for the newproduct. Product development teams take roughly 18 months to develop and design the product. Forexample, Network Solutions is one group of products AI sells. The employees in the product devel-opment group for Network Solutions receive part of their bonus based on whether Network Solutionsachieves its revenue target for that year.
It typically takes AI three years from the time a product development team is formed until theproduct reaches the market. Once a new product idea is identified and researched, a prototype mustbe built and tested. Finally it is introduced. Another 18 months is required for approval, manufactur-ing design, further testing, and marketing. These functions are performed after the product develop-ment team has been reassigned.
Required:
Analyze the incentives created by basing a portion of each current product developer’s bonus onrevenues for products now being sold.
19 V K Narayanan and R Nath, Organization Theory: A Strategic Approach (Burr Ridge, IL: Richard D.Irwin, 1993), p. 403.
zim36725_ch04_135-169.qxd 12/15/09 12:36 PM Page 161

162 Chapter 4
P 4–17: Private Country Clubs
It is often argued that private country clubs tend to have low-quality food operations because themembers do not join or frequent their clubs for the food but rather for the golf and fellowship.
(Note: A private country club charges an initiation fee and monthly dues. Members pay forfood and drink they consume. The members own the club and frequently pay annual assessments.When members resign or die, some clubs allow the members or their estate to resell the member-ship, subject to board approval of the new member. Other clubs resell the membership and retain thenew initiation fee.)
Critically evaluate the first paragraph.
P 4–18: Tipping
One of the main tenets of economic analysis is that people act in their narrow self-interest. Why thendo people leave tips in restaurants? If a study were to compare the size of tips earned by servers inrestaurants on interstate highways with those in restaurants near residential neighborhoods, whatwould you expect to find? Why?
P 4–19: White’s Department Store
Employees at White’s Department Store are observed engaging in the following behavior: (1) Theyhide items that are on sale from the customers and (2) they fail to expend appropriate effort in de-signing merchandise displays. They are also uncooperative with one another. What do you thinkmight be causing this behavior and what might you do to improve the situation?
P 4–20: Coase Farm
Coase Farm grows soybeans near property owned by Taggart Railroad. Taggart can build zero,one, or two railroad tracks adjacent to Coase Farm, yielding a net present value of $0, $9 million, or$12 million.
Value of Taggart Railroad (in millions)
as a Function of the Number of Train Tracks
(before any damages)
Zero tracks $ 0One track 9Two tracks 12
Coase Farm can grow soybeans on zero, one, or two fields, yielding a net present value of $0,$15 million, or $18 million before any environmental damages inflicted by Taggart trains. Environ-mental damages inflicted by Taggart’s trains are $4 million per field per track. Coase Farm’s payoffsas a function of the number of fields it uses to grow soybeans and the number of tracks that Taggartbuilds are shown below.
Value of Coase Farm (in millions)as a Function of the Number of Fields Planted
and the Number of Train Tracks
Zero fields One field Two fields
Zero tracks $0 $15 $18One track 0 11 10Two tracks 0 7 2
zim36725_ch04_135-169.qxd 12/15/09 12:36 PM Page 162

Organizational Architecture 163
It is prohibitively expensive for Taggart Railroad and Coase Farm to enter into a long-term contractregarding either party’s use of its land.
Required:
a. Suppose Taggart Railroad cannot be held liable for the damages its tracks inflict on CoaseFarm. Show that Taggart Railroad will build two tracks and Coase Farm will plantsoybeans on one field.
b. Suppose Taggart Railroad can be held fully liable for the damages that its tracks inflict onCoase Farm. Show that Taggart Railroad will build one track and Coase Farm will plantsoybeans on two fields.
c. Now suppose Taggart Railroad and Coase Farm merge. Show that the merged firm willbuild one track and plant soybeans on one field.
d. What are the implications of the merger for the organizational architecture of the newlymerged firm in terms of decision rights, performance measurement, and employeecompensation?
SOURCE: R Sansing.
P 4–21: Rothwell Inc.
Rothwell Inc. is the leader in computer-integrated manufacturing and factory automation productsand services. The Rothwell product offering is segmented into 15 product categories, based on prod-uct function and primary manufacturing location.
Rothwell’s sales division sells all 15 product categories and is composed of 25 district officeslocated throughout the United States. The company is highly decentralized, with district officesresponsible for setting sales price, product mix, and other variables.
District offices are rewarded based on sales. Some large customers have plants in more than oneof Rothwell’s sales districts. In cases where sales are made to these customers, the district officesparticipate jointly and sales credits are shared by each district involved.
The sales division compensation plan designed by L. L. Rothwell, founder of the firm, wasstructured so that the staff would pursue sales in each of the 15 product categories. The selling pro-gram has the following features:
• Each sales representative receives a commission based on a percentage of the sales revenuegenerated.
• Each district (approximately 160 sales reps) is assigned a quota for each product line,defined in terms of dollar sales.
• In addition to commission, sales reps are eligible for an annual bonus. The companycalculates individual bonuses by multiplying the number of bonus points earned by theindividual target bonus amount. Points are credited at the district level.
• In order for all sales reps in a district to qualify for a bonus, the district must achieve50 percent of quota in all 15 product groups and 85 percent of quota in at least 13 groups.
• Bonus points are awarded for sales greater than 85 percent of quota.
• Five product groups have been identified as strategic to Rothwell. These “pride-level”products are weighted more heavily in bonus point calculations.
Over the past three years, Rothwell generated exceptionally high sales—and awarded record bonuses.Profits, however, were lackluster. L. L. was befuddled!
Required:
a. Evaluate the compensation situation at Rothwell.
b. Identify the types of behavior the existing system promotes and explain how such behaviormay be contributing to the firm’s declining profitability. Suggest improvements.
zim36725_ch04_135-169.qxd 12/15/09 12:36 PM Page 163

164 Chapter 4
P 4–22: Gong-Fen
“It was in Deyang in 1969 that I came to know how China’s peasants really lived. Each day startedwith the production team leader allocating jobs. All the peasants had to work, and they each earneda fixed number of ‘work points’ (gong-fen) for their day’s work. The number of work points accu-mulated was an important element in the distribution at the end of the year. The peasants got food,fuel, and other daily necessities, plus a tiny sum of cash, from the production team. After the har-vest, the production team paid part of it over as tax to the state. Then the rest was divided up. First,a basic quantity was meted out equally to every male, and about a quarter less to every female.Children under three received a half portion.
“The remainder of the crop was then distributed according to how many work points each per-son had earned. Twice a year, the peasants would all assemble to fix the daily work points for eachperson. No one missed these meetings. In the end, most young and middle-aged men would be allo-cated 10 points a day, and women 8. One or two whom the whole village acknowledged to be excep-tionally strong got an extra point. ‘Class enemies’ like the former village landlord and his family gota couple of points less than the others, in spite of the fact that they worked no less hard and were usu-ally given the toughest jobs.
“Since there was little variation from individual to individual of the same gender in terms ofdaily points, the number of work points accumulated depended mainly on how many days oneworked, rather than how one worked.”SOURCE: J Chang, Wild Swans: Three Daughters of China (New York: Anchor Books, 1991), pp. 414–15.
Required:
What predictable behavior do you expect the Chinese agricultural system will generate?
P 4–23: International Computer Company
International Computer Company (ICC) has annual revenues of $2 billion primarily from selling and leas-ing large networked workstation systems to businesses and universities. The manufacturing division pro-duces the hardware that is sold or leased by the marketing division. After the expiration of the lease, leasedequipment is returned to ICC, where it is either disassembled for parts by the field service organization orsold by the international division. Internal studies have shown that equipment leased for four years is worth362⁄3 percent of its original manufacturing cost as parts or sold overseas. About half of ICC’s systems areleased and half are sold, but the fraction being leased by ICC is a falling proportion of total sales.
The leasing department is evaluated on profits. Its annual profits are based on the present valueof the lease payments from new leases signed during the year, less
1. The unit manufacturing cost of the equipment.
2. Direct selling, shipping, and installation costs.
3. The present value of the service agreement costs.
Each leased piece of equipment will be serviced over its life by ICC’s field service organization. Theleasing division arranges a service contract for each piece of leased equipment from the field serviceorganization. The field service organization commits to servicing the leased equipment at a fixedannual cost, determined at the time the lease is signed. The leasing department then builds the servicecost into the annual lease payment.
The leasing department negotiates the lease terms individually for each customer. In general, theleasing division sets the annual lease terms to recover all three cost components plus a 25 percentmarkup (before taxes). The 25 percent markup for setting the annual lease payment seemed to workwell in the past and provided the firm with a reasonable return on its investment when ICC had dom-inance in the workstation market niche. However, in recent years new entrants have forced the ICCleasing department to reduce its markup to as low as 10 percent to sign leases. At this small margin,senior management is considering getting out of the lease business and just selling the systems.
The following lease to Gene Science is being priced by the leasing department. A four-year leaseof a small network of three workstations is being negotiated. The unit manufacturing cost of the networkis $30,000. The service costs, which are payable to the field service department at the beginning of eachyear, are $2,000 (payable at installation), $3,000, $4,000, and $5,000 (payable at the beginning of each
zim36725_ch04_135-169.qxd 12/15/09 12:36 PM Page 164

Organizational Architecture 165
of the next three years, respectively). Selling, shipping, and installation costs are $7,000. The leasingdepartment has an 8 percent cost of capital.
To simplify the analysis, ignore all tax considerations.
Required:
a. Using a 25 percent markup on costs and an 8 percent discount rate, calculate the fixedannual lease payment for the four-year lease to Gene Science.
b. Comment on some likely reasons why a 25 percent markup on leased equipment is provingmore difficult to sustain. Should ICC abandon the lease market? What are some alternativecourses of action?
P 4–24: Repro Corporation
Repro Corporation is the leading manufacturer and seller of office equipment. Its most profitablebusiness segment is the production and sale of large copiers. The company is currently organizedinto two divisions: manufacturing and sales. Manufacturing produces all products; sales is respon-sible for the distribution of all finished products to the final customers. Each division is evaluatedon profits. Market research shows an existing demand for a facilities management service wherebyRepro installs its equipment and personnel at a client’s site and operates the client’s copy center. Tomeet this demand, Repro is considering a proposal to expand its operations to include a service di-vision responsible for contracting with firms to install Repro’s equipment in a copy service agree-ment. This copy service is named Facilities Management (FM).
A contract for FM includes the leasing of a complete copy center from the service division, in-cluding all necessary equipment and personnel. The client provides space for FM on site.
The value offered by the service division is threefold. The service division will be organized sothat a base center in each city covered will be responsible for acting as both an independent copy cen-ter and a backup to the FMs contracted in the local area. Any FM processing shortfalls due to equip-ment failure or shop overflows would result in a transfer of copy needs to the center. Additionally,since the equipment used in FM contracts is leased and not purchased, contracting companies are notstrapped with showing a return on assets for this equipment (allowing the flexibility of adjusting thelease as company needs vary). Nor are they responsible for equipment maintenance. Finally, the per-sonnel to run the equipment in the FM sites are service division employees, not employees of theclient. Thus, no additional headcount is needed by the client. For this complete value-added service,firms are charged based on projected monthly copy volume, with an agreed-upon surcharge forcopies processed in excess of the contracted volume.
With the introduction of this new division, Repro would reorganize itself into three divisions:manufacturing, products, and service. The responsibility of selling business equipment (copiers, faxmachines, etc.) would be assigned to the products division, and the service division would becomeresponsible for the sale of FM sites (products and services would utilize separate sales forces). Bothdivisions would buy hardware from manufacturing at similar costs.
Currently, Repro’s sales comprise approximately 80 percent repeat-purchase customers (who areeither replacing existing equipment with similar equipment or upgrading to new Repro products) and20 percent new customers. It has been estimated that 30 percent of the current market base would, giventhe opportunity, choose a Facilities Management contract rather than purchase equipment outright.
Repro’s current sales force compensation is a function of a fixed salary plus a commission basedon a percentage of sales. The average salesperson’s compensation consists of a $25,000 base salaryand a 2 percent sales commission. Over the last four years, the average piece of copy equipment fromRepro sold for $80,000 and the average salesperson sold $1 million of equipment (adjusted for infla-tion). If the proposal for a service division is undertaken, this compensation scheme will be appliedto both the products and service divisions’ sales force.
Required:
a. Discuss the conflict that will result if the service division is introduced.
b. Propose a solution to solve this conflict.
SOURCE: D Holahan, D Lee, W Reidy, A Tom, and E Tufekcioglu.
zim36725_ch04_135-169.qxd 12/15/09 12:36 PM Page 165

166 Chapter 4
CasesCase 4–1: Christian Children’s Fund
Christian Children’s Fund, Inc. (CCF), established in 1938, is an international, nonsectarian,nonprofit organization dedicated to assisting children. With program offices around the world, itprovides health and educational assistance to more than 4.6 million children and families throughover 1,000 projects in 30 countries, including the United States. CCF’s programs promote long-termdevelopment designed to help break the cycle of poverty by improved access to health care, safe wa-ter, immunizations, better nutrition, educational assistance, literacy courses, skills training, and otherservices specific to improving children’s welfare.
Most of CCF’s revenues come from individual donors who are linked with a specific child.About 75 percent of the sponsors are in the United States, and in 2003, CCF had total revenues ofabout $143 million. (See Exhibit 1.)
In 1995 CCF began developing an evaluation system, nicknamed AIMES (Annual Impact Mon-itoring and Evaluation System), to assess the performance of its programs and whether they are mak-ing a positive, measurable difference in children’s lives. A working group of national directors,program managers, CCF finance and audit managers, and outside consultants developed a series ofmetrics that allowed CCF to be more accountable to its sponsors as well as an evaluation tool to con-tinually assess the impact of its programs on children. The working group wanted metrics that (1) cap-tured critical success factors for CCF’s projects; (2) focused on a program’s impact, not its activities;(3) measured the program’s impact on children; and (4) could be measured and tracked.
The following indicators were chosen:
Under 5-year old mortality rate
Under 5-year old moderate and severe malnutrition rate
Adult literacy
One-to-two-year-old immunizations
Tetanus vaccine-protected live births
Families that correctly know how to manage a case of diarrhea
Families that correctly know how to manage acute respiratory infection
Families that have access to safe water
Families that practice safe sanitation
Children enrolled in a formal or informal educational program
Each family in a community with a CCF program is given a family card that tracks each of thepreceding 10 indicators for that family. In 1997, the first year of implementation, AIMES captured thehealth status of about 1.9 million children in approximately 850 projects in 18 countries. Annual visitsby project staff or volunteers update each family’s card. The family cards are aggregated at the com-munity level, national level, and then in total for CCF, and provide a reporting system. CCF managersthen track trends and compare performance at the community, national, and organizational levels.
It took CCF two years to develop these metrics, test them, and train the staff in all the nationaloffices in how to use the system. AIMES does not prescribe the strategy each community shouldadopt but rather allows each community to design programs that promote the well-being of childrenin that community. Program directors can use the AIMES data as a tool to monitor and manage theirprograms. If child mortality is high, local program directors decide how best to reduce the rate. The10 AIMES metrics have made project managers more focused and better able to concentrate re-sources in those areas that make a measurable difference in children’s health. CCF uses the informa-tion to make program and resource allocation decisions at the community level. The family card haspromoted better nutrition via appropriate feeding and child care practices because there is now moredirect contact between CCF staff and volunteers and families.
Required:
Using this chapter’s organizational architecture framework, discuss the strengths and weaknesses ofCCF’s AIMES project.
SOURCE: D Henderson, B Chase, and B Woodson, “Performance Measures for NPOs,” Journal of Accountancy (January 2002),pp. 63–68, and www.christianchildrensfund.org.
zim36725_ch04_135-169.qxd 12/15/09 12:36 PM Page 166

EXHIBIT 1CHRISTIAN CHILDREN’S FUND, INC.
Consolidated Statements of Activities and Changes in Net AssetsFor the Years Ended June 30, 2003, and 2002
Total
2003 2002
Public SupportSponsorships:
U.S. sponsors $ 76,838,477 $ 74,077,556International sponsors 22,086,375 18,151,969Special gifts from sponsors for children 12,351,284 11,838,912
Total sponsorships $111,276,136 $104,068,437
Contributions:General contributions $ 13,657,676 $ 13,642,476Major gifts and bequests 4,712,032 4,751,059Gifts in kind 804,247 637,977
Total contributions $ 19,173,955 $ 19,031,512
Grants:Grants and contracts $ 10,164,264 $ 7,768,755
Total public support $140,614,355 $130,868,704
RevenueInvestment and currency transactions $ 264,893 $ 350,841Service fees and other 1,636,717 1,522,652
Total revenue $ 1,901,610 $ 1,873,493
Net Assets Released from RestrictionsSatisfaction of program and time restrictions — —
Total public support and revenue $142,515,965 $132,742,197
ExpensesProgram:
Basic education $ 41,263,708 $ 40,964,478Health and sanitation 28,767,904 29,442,196Nutrition 13,824,871 15,635,046Early childhood development 11,850,954 10,717,133Micro enterprise 14,555,029 9,183,004Emergencies 2,802,575 2,861,528
Total program expenses $113,032,041 $108,803,385
Supporting ServicesFund raising $ 16,777,149 $ 15,484,634Management and general 12,651,014 11,156,134
Total supporting services 29,428,163 26,640,768
Total expenses from operations 142,493,204 135,444,153
Change in net assets from operations $ 22,761 $ (2,701,956)
Non-Operating Revenues (Expenses)Realized (loss) gain on investments $ (602,619) $ 387,223Unrealized gain (loss) on investments 696,584 (1,967,114)
Total non-operating revenues (expenses) 93,965 (1,579,891)
Change in net assets $ 116,726 $ (4,281,847)
167
zim36725_ch04_135-169.qxd 12/15/09 12:36 PM Page 167

Case 4–2: Woodhaven Service
BackgroundWoodhaven Service is a small, independent filling station located in the Woodhaven section ofQueens. The station has three gasoline pumps and two service bays. The repair facility specializesin automotive maintenance (oil changes, tune-ups, etc.) and minor repairs (mufflers, shock ab-sorbers, etc.). Woodhaven generally refers customers who require major work such as transmis-sion rebuilds and electronics to shops that are better equipped to handle such repairs. Majorrepairs are done in-house only when both the customer and mechanic agree that this is the bestcourse of action.
During the 20 years that he has owned Woodhaven Service, Harold Mateen’s competence andfairness have built a loyal customer base of neighborhood residents. In fact, demand for his serviceshas been more than he can reasonably meet, yet the repair end of his business is not especially prof-itable. Most of his competitors earn the lion’s share of their profits through repairs, but Harold ismaking almost all of his money by selling gasoline. If he could make more money on repairs, Wood-haven would be the most successful service station in the area. Harold believes that Woodhaven’sweakness in repair profitability is due to the inefficiency of his mechanics, who are paid the industryaverage of $500 per week. While Harold does not think he overpays them, he feels he is not gettinghis money’s worth.
Harold’s son, Andrew, is a student at the university, where he has learned the Socratic dictum,“To know the Good is to do the Good.” Andrew provided his father with a classic text on em-ployee morality, Dr. Weisbrotten’s Work Hard and Follow the Righteous Way. Every morning fortwo months, Harold, Andrew, and the mechanics devoted one hour to studying this text. Despitemany lively and fascinating discussions on the rights and responsibilities of the employee, pro-ductivity did not improve one bit. Harold figured he would just have to go out and hire harder-working mechanics.
The failure of the Weisbrotten method did not surprise Lisa, Harold’s daughter. She knew thatAndrew’s methods were bunk. As anyone serious about business knows, the true science of produc-tivity and management of human resources resides in Professor von Drekken’s masterful ModifyingOrganizational Behavior through Employee Commitment. Yes, employee commitment was the an-swer to everything! Harold followed the scientific methods to the letter. Yet, despite giving out goldstars, blowing up balloons, and wearing a smiley face button, he found Lisa’s approach no more suc-cessful than Andrew’s.
Compensation PlansHarold thinks that his neighbor Jack Myers, owner of Honest Jack’s Pre-Enjoyed Autorama, might behelpful. After all, one does not become as successful as Jack without a lot of practical knowledge. Ormaybe it is Jack’s great radio jingle that does it. Jack tells Harold,
It’s not the jingle, you idiot! It’s the way I pay my guys. Your mechanics make $500 a week nomatter what. Why should they put out for you? Because of those stupid buttons? My guys—myguys get paid straight commission and nothing more. They do good by me and I do good bythem. Otherwise, let ’em starve.
Look, it’s real simple. Pay ’em a percent of the sales for the work they do. If you need to bea nice guy about it, make that percent so that if sales are average, then they make their usual$500. But if sales are better, they get that percent extra. This way they don’t get hurt but got realreason to help you out.
This hurt Harold. He really liked those buttons. Still, Jack did have a point. Straight commission,however, seemed a little radical. What if sales were bad for a week? That would hurt the mechanics.
Harold figured that it would be better to pay each mechanic a guaranteed $300 a week plus acommission rate that would, given an average volume of business, pay them the extra $200 that wouldbring their wage back to $500. Under this system, the mechanics would be insulated from a bad week,would not be penalized for an average week, and would still have the incentive to attempt to improvesales. Yes, this seemed more fair.
168 Chapter 4
zim36725_ch04_135-169.qxd 12/15/09 12:36 PM Page 168

Organizational Architecture 169
On the other hand, maybe Jack knows only about the used car business, not about business ingeneral. Harold figured that he should look for an incentive pay method more in line with the waythings are done in the auto repair business. Perhaps he should pay his mechanics as he is paid by hiscustomers—by the job. It is standard practice for service stations to charge customers a flat rate forthe labor associated with any job. The number of labor hours for which the customer is charged isgenerally taken from a manual that outlines expected labor times for specific jobs on specific vehi-cles. The customer pays for these expected hours regardless of how many actual labor hours are ex-pended on the job. Many shops also pay their mechanics by the job. Harold thinks that this approachmakes sense because it links the mechanic’s pay to the labor charges paid by the customer.
Required:
a. This case presents some popular approaches to alleviating agency costs. Although certainaspects of each of these methods are consistent with the views presented in the text, noneof these methods is likely to succeed. Discuss the similarities and differences between theideas of the chapter and
(i) Dr. Weisbrotten’s approach.
(ii) Harold Mateen’s idea of hiring “harder-working” mechanics.
b. Discuss the expected general effect on agency costs at Woodhaven Service of the newincentive compensation plans. How might they help Woodhaven? Assuming that Haroldwants his business to be successful for a long time to come, what major divergentbehaviors would be expected under the new compensation proposals? How damagingwould you expect these new behaviors to be to a business such as Woodhaven Service?Also, present a defense of the following propositions:
(i) Harold’s plan offers less incentive for divergent behavior than Honest Jack’s.
(ii) Limiting a mechanic’s pay by placing an upper bound of $750 per week on his or herearnings reduces the incentive for divergent behavior.
c. Suppose Harold owned a large auto repair franchise located in a department store in apopular suburban shopping mall. Suppose also that this department store is a heavilypromoted, well-known national chain that is famous for its good values and easy credit.How should Harold’s thinking on incentive compensation change? What if Harold did notown the franchise but was only the manager of a company-owned outlet?
d. In this problem, it is assumed that knowledge and decision rights are linked. The mechanicwho services the car decides what services are warranted. Discuss the costs and benefits ofthis fact for Woodhaven Service and the independently owned chain-store repair shop.
e. Suppose that Woodhaven’s problems are not due to agency costs. Briefly describe a likelyproblem that is apparent from the background description in this problem.
zim36725_ch04_135-169.qxd 12/15/09 12:36 PM Page 169

Chapter Five
ResponsibilityAccounting andTransfer Pricing
Chapter Outline
A. Responsibility Accounting
1. Cost Centers
2. Profit Centers
3. Investment Centers
4. Economic Value Added (EVA®)
5. Controllability Principle
B. Transfer Pricing
1. International Taxation
2. Economics of Transfer Pricing
3. Common Transfer Pricing Methods
4. Reorganization: The Solution If All Else Fails
5. Recap
C. Summary
170
zim36725_ch05_170-228.qxd 12/15/09 12:39 PM Page 170

Responsibility Accounting and Transfer Pricing 171
Chapter 4 described the general agency problem of motivating and thereby influencing indi-vidual behavior. Chapter 4 also described how the organization’s architecture can reduce thisproblem. The firm’s organizational architecture consists of three interrelated systems: theperformance evaluation system, the performance reward system, and the system that assignsdecision rights. The accounting system plays an integral part in most firms’ performanceevaluation. This chapter discusses two additional examples of how accounting systems canbe applied to reduce agency problems: responsibility accounting and transfer pricing.
A. Responsibility Accounting1
All but the smallest organizations are divided into subunits, each of which is granteddecision rights and then evaluated based on performance objectives for that subunit. Forexample, the firm might be organized into marketing, manufacturing, and distributiondepartments. Manufacturing is further subdivided into parts manufacturing and assembly,and assembly is further organized by product assembled. These basic building blocks of theorganization form the work groups that define and characterize what each part of the firmdoes. Assigning decision rights to the subunits is a critical part of solving the limited pro-cessing capacity of humans discussed in Chapter 4. Responsibility accounting begins withformal recognition of these subunits as responsibility centers. A responsibility accountingsystem is part of the performance evaluation system used to measure the operating resultsof the responsibility center.
The decision rights assigned to a subunit categorize the unit as a cost center, a profitcenter, or an investment center. The particular decision rights assigned to a subunit are thekey determinants of how the unit’s performance is evaluated and rewarded. Each of thesecategories implies a different assignment of decision rights and, accordingly, a differentperformance measurement system. In each case, decision rights are linked with the spe-cialized knowledge necessary to exercise them. Responsibility accounting then dictates thatthe performance measurement system (the accounting system) measures the performancethat results from the decision rights assigned to the responsibility center. For example, if anagent is assigned decision rights to sell products to customers in New York, the perfor-mance measurement of this agent should not include sales to customers in Maine.
Matching the decision rights assigned to a subunit to its performance measurereduces the agency problems described in Chapter 4. A subunit is assigned a set of deci-sion rights, a performance measure designed to evaluate the exercise of those rights, andrewards based on the measures. In this way the subunit focuses on those tasks the princi-pal wants performed. Table 5–1 describes the various responsibility centers. (In all cases,accounting numbers are used in the performance measurement system.)2
Cost centers are established whenever a subunit is assigned the decision rights to producesome stipulated level of output and the unit’s efficiency in achieving this objective is to bemeasured and rewarded. Cost center managers are assigned decision rights for determiningthe mix of inputs (labor, outside services, and materials) used to produce the output.
1. Cost Centers
1 This section draws heavily on M Jensen and W Meckling, “Divisional Performance Measurement,”manuscript (Boston: Harvard Business School, 1986); and J Brickley, C Smith, and J Zimmerman, ManagerialEconomics and Organizational Architecture, 5th ed. (New York: McGraw-Hill/Irwin, 2009).
2 In this chapter, we focus on three centers (cost, profit, and investment centers). Other types, such asexpense and revenue centers, are not as prevalent as the three discussed. For discussion of these additional typesof centers, see Jensen and Meckling (1986); and Brickley et al. (2007).
zim36725_ch05_170-228.qxd 12/15/09 12:39 PM Page 171

172 Chapter 5
HistoricalApplication:ResponsibilityAccountingNot New
In 1922, James O. McKinsey, founder of the consulting firm McKinsey & Co., describedresponsibility accounting:
In the modern business organization, control is exercised through individuals who composethe organization. If control of expenses is to be effected through members of the organiza-tion, it is necessary that they be classified so as to show responsibility for each class. Ifresponsibility is taken as the controlling factor in an expense classification, each departmentwill be charged with those expenses over which the executive head of the department exer-cises control. In addition it may be charged with some items of expense the amount of whichis fixed or at least beyond the control of any officer.
To illustrate, the production department will be charged for the supplies used in produc-tion, for these are under the control of the production manager, and in addition it will becharged with the depreciation on production equipment, the estimated amount of which isdetermined in most cases by others than the production manager.*
Notice that McKinsey advocates the use of responsibility accounting and he also arguesin favor of charging not only expenses over which managers have direct control but alsoexpenses they control indirectly, such as depreciation.
*J McKinsey, Budgetary Control (New York: Ronald Press, 1922), p. 281.
TABLE 5–1 Summary of Cost, Profit, and Investment Centers
Decision Rights Performance Measures Typically Used When
Cost center • Input mix (labor, • Minimize total • Central manager can measure materials, supplies cost for a fixed output, knows the cost
output functions, and can set the • Maximize output optimal quantity and
for a fixed budget appropriate rewards• Central manager can observe
the quality of the cost center’soutput
• Cost center manager hasknowledge of the optimal input mix
Profit center • Input mix • Actual profits • Profit center manager has the • Product mix • Actual compared knowledge to select the • Selling prices (or to budgeted profits optimal price/quantity
output quantities) • Profit center manager has the knowledge to select the optimal product mix
Investment • Input mix • Actual ROI • Investment center manager center • Product mix • Actual residual has the knowledge to select
• Selling prices (or income the optimal price/quantityoutput quantities) • Actual compared • Investment center manager
• Capital invested with budgeted ROI has the knowledge to select in center or residual income the optimal product mix
• Investment center manager hasknowledge about investmentopportunities
zim36725_ch05_170-228.qxd 12/15/09 12:39 PM Page 172

Responsibility Accounting and Transfer Pricing 173
Managers of cost centers are evaluated on their efficiency in applying inputs to produceoutputs. Since they are not responsible for selling the final services or products, they arenot judged on revenues or profits.
To evaluate the performance of a cost center, its output must be measurable. Moreover,some higher unit in the organization with the specialized knowledge and decision rightsmust specify the department’s output or budget. Manufacturing departments like a partsmanufacturing department in a factory are usually cost centers. The output of a partsdepartment is measured by counting the number of parts produced. Cost centers are alsoused in service organizations for functions such as check processing in a bank (number ofchecks processed) or food services in a hospital (number of meals served). In addition tomeasuring the quantity of output, its quality must be monitored effectively. If not, cost cen-ter managers who are evaluated on costs can meet their targets by cutting quality.
Various objectives are used for evaluating cost center performance. One is to minimizecosts for a given output; another is to maximize output for a given budget. Minimizingcosts for a given output is consistent with profit maximization as long as central manage-ment has selected the profit-maximizing level of output. For example, the manager of ametal stamping department is told to produce 10,000 stampings per day of a fixed specifi-cation and quality. The manager is evaluated on meeting the production schedule and onreducing the cost of the 10,000 stampings while maintaining quality. The cost centermanager does not have the decision rights to set the price or scale of operations.
Another possible evaluation criterion, maximizing output for a specified budget, pro-vides incentives equivalent to the first criterion as long as the specified budget is the min-imal budget necessary for producing the profit-maximizing quantity of output. Forexample, the manager has a fixed budget ($27,500 per week) and is evaluated based onthe number of metal stampings produced that meet quality specifications within the fixedbudget.
For both objectives, the manager is constrained either by total output or by budget. Thetwo objectives are optimal if the central management chooses (1) the profit-maximizingoutput level or (2) the correct budget for efficient production of this output level. Nonethe-less under both cost center arrangements, the cost center manager has incentives to reducecosts (or increase output) by lowering quality. Therefore, the quality of products manufac-tured in cost centers must be monitored.
Sometimes cost center managers are evaluated based on minimizing average cost. Inthis case the manager has the incentive to choose the output at which average costs are min-imized and to produce this output efficiently. It is important to emphasize that profit max-imization need not occur when average costs are minimized. In general, minimizingaverage unit cost is not the same as maximizing profit. For example, suppose a cost centerhas some fixed costs and constant variable costs per unit. In this case, average unit costswill continue to fall with increases in output. To illustrate, assume total costs are
TC � $300,000 � $6Q
Here fixed costs are $300,000 and variable costs are a constant $6 per unit. Given this equa-tion, average costs are derived by dividing both sides of the equation by Q to get
With a constant variable cost, the average cost falls as the quantity produced increases. Inthis situation, a cost center manager who is evaluated based on minimizing average unitcosts has incentives to increase output, even as inventories mount. Focusing on minimizing
AC =
TC
Q=
$300,000
Q+ $6
zim36725_ch05_170-228.qxd 12/15/09 12:39 PM Page 173

174 Chapter 5
TABLE 5–2 Example Demonstrating that Minimizing Average Cost May Not Yieldthe Profit-Maximizing Level of Sales
Total Total Average Quantity Price Revenue Cost Profits Cost
1 $35 $ 35 $ 78 $�43 $78.02 33 66 83 �17 41.53 31 93 90 3 30.04 29 116 99 17 24.85 27 135 110 25 22.06 25 150 123 27 20.57 23 161 138 23 19.78 21 168 155 13 19.49 19 171 174 �3 19.3
10 17 170 195 �25 19.5
average unit cost can provide incentives for cost center managers to either overproduce orunderproduce; it depends on how the profit-maximizing output level compares to the quan-tity where average costs are minimized.
Table 5–2 provides another simple example that minimizing average cost is not equiv-alent to profit maximization. This table shows that profits are maximized by selling sixunits. However, minimum average cost occurs by producing nine units.
Cost centers work most effectively if: (1) the central managers have a good under-standing of the cost functions, can measure quantity, and can set the profit-maximizingoutput level and appropriate rewards; (2) the central managers can observe the quality ofthe cost center’s output; and (3) the cost center manager has specific knowledge of theoptimal input mix.
Profit centers are often composed of several cost centers. Profit center managers are givena fixed capital budget and have decision rights for input mix, product mix, and sellingprices (or output quantities). Profit centers are most appropriate when the knowledgerequired to make the product mix, quantity, pricing, and quality decisions is specific to thedivision and costly to transfer.
Senior managers rely on their internal accounting systems to measure the performanceof profit centers. Profit centers are usually evaluated on the difference between actual andbudgeted accounting profits for their division. Although measuring profit centers’ profitsseems straightforward, two complications often consume managers’ attention: how to pricetransfers of goods and services between business units (transfer pricing) and which corpo-rate overhead costs to allocate to business units. In every firm managers constantly debatethese two issues. We examine the transfer pricing problem in the next section. Chapters 7and 8 discuss the allocation of corporate overhead costs to responsibility centers.
When interdependencies exist among business units, motivating individual profit cen-ters to maximize their unit’s profits will not generally maximize profits for the firm as awhole. For example, individual units focusing on their own profits frequently ignore howtheir actions affect the sales and costs of other units.3 One division might free-ride on
2. Profit Centers
3 Conceptually, other units could offer money to take these effects into account. However, in the presence ofinformation asymmetries and transactions costs these offers are likely to be limited.
zim36725_ch05_170-228.qxd 12/15/09 12:39 PM Page 174

Responsibility Accounting and Transfer Pricing 175
another division’s quality reputation, thereby reaping short-run gains at the expense of theother division. For example, Chevrolet and Buick are two profit centers within GeneralMotors. Suppose Chevrolet, in pursuit of higher profits, decides to raise the quality ofits cars. This might affect consumers’ perceptions of the average quality of all GeneralMotors cars, including Buick’s perceived quality. An enhanced reputation for all GeneralMotors cars helps Buick. But if Chevrolet receives no credit for Buick’s profits, Chevroletmanagers will likely ignore the positive effects they generate for Buick and tend to under-invest in quality enhancements. To help managers internalize both the positive and negativeeffects that their actions impose on other profit center managers, firms often base incentivecompensation not just on the manager’s own profit center profits but also on a group of re-lated profit centers’ profits and/or firmwide profits. Unless the entire firm makes a certainprofit target, no individual profit center manager earns a bonus.
Investment centers are similar to profit centers. However, they have additional decisionrights for capital expenditures and are evaluated on measures such as return on investment(ROI). Investment centers are most appropriate when the manager of the unit has specificknowledge about investment opportunities as well as information relevant for makingoperating decisions for the unit.
Investment centers are often composed of several profit centers. They have all thedecision rights of cost and profit centers, as well as the decision rights over the amount ofcapital invested. For example, suppose the consumer electronics group of an electronics
3. InvestmentCenters
ManagerialApplication:Intel’sReorganization
In 2005 Intel reorganized. It changed from a functional organization to a product-lineorganization. Instead of being organized around functions such as engineering, manu-facturing, and marketing, Intel now focuses on bringing together chips and software intoso-called platforms designed to perform specific tasks, such as showing movies onhome PCs. In describing the change the CEO says, “For the first three decades ofthe company, we made mostly discrete chips. But they weren’t designed to be usedtogether . . . and they weren’t marketed together.” The new Intel organization bringstogether engineers, software writers, and marketers into five market-focused units:corporate computing, the digital home, mobile computing, health care, and channelproducts. Each market-focused unit is a profit center that contains engineering, manu-facturing, and marketing. The goal of the reorganization was to increase responsiveness,flexibility, and customer focus.
Besides changing the organizational chart (and hence decision rights) Intel alsopushed decision making downward by empowering employees and holding themaccountable for a market focus. New performance measures replaced the old one. In-stead of rewarding managers for just their own work, now teams will be judged onprofitability.
Intel’s example highlights some key points from the last chapter: Performance sys-tems are rarely changed in isolation. Successful organizational change usually requiresmodifying all three legs of the stool. In Intel’s case, it changed all three: decision rightsassignment (shifting from primarily cost to profit centers and empowering teams tofocus on specific markets), performance measures (profits in their markets), and com-pensation schemes (linking pay to profits).
SOURCE: C Edwards, “Shaking Up Intel’s Insides,” BusinessWeek, January 31, 2005.(http://www.businessweek.com/magazine/content/05_05/b3918074_mz011.htm).
zim36725_ch05_170-228.qxd 12/15/09 12:39 PM Page 175

firm consists of three profit centers: the television division, the DVD division, and thestereo division. Consumer electronics has decision rights over the amount of capital in-vested in the group.
Investment center managers are usually constrained in terms of the quality of productsthey can sell and the market niches they can enter. These constraints prevent investmentcenter managers from debasing the firm’s reputation (also called its brand name capital).Debasing the firm’s reputation by lowering the quality of its products is one example of anadverse effect that one responsibility center can have on another. Responsibility centers caninteract in many ways and can have adverse or favorable impacts on other centers. A plant’soperating efficiency can be affected by the quantity and timing of the orders it receivesfrom the marketing department. A purchasing department can affect the manufacturing de-partment’s operations by the timing and quality of the raw materials purchased. A respon-sibility center sharing a newly discovered cost-saving idea or R&D development with othercenters is an example of a favorable (or positive) interaction. Managing these interactions(eliminating the negative ones and encouraging the positive ones) is critical to the success-ful linking of decision rights to individual(s) with the specialized knowledge. As discussedthroughout the remaining chapters, the firm’s internal accounting system can play a pow-erful role in either enhancing the positive interactions or exacerbating the negative ones.
In all of the responsibility centers in Table 5–1, the measure of performance is linkedto the decision rights vested in the management. Investment center performance can bemeasured in at least three ways: net income, return on investment, and residual income.Each of these is described below.
Net incomeThe simplest of the three performance measures is accounting net income generated by theinvestment center (revenues minus expenses). However, net income does not consider allthe investment used in the investment center to generate that income. Net income incorpo-rates interest on any debt used to finance the assets, but it does not include any equityfinancing charge. Measuring investment center performance using net income createsdysfunctional incentives in investment centers to overinvest. Managers have incentives tooverinvest as long as the new investment yields positive net income, no matter how small itis relative to the investment. Two investment centers can have the same net income, but ifone has substantially more investment than the other, the one with the smaller investmentis yielding a substantially higher rate of return. If investment center managers have thedecision rights over capital investments but are not held accountable for how efficiently thatcapital is employed, they likely will overinvest.
176 Chapter 5
AcademicApplication:How FirmsOrganizeinto Cost,Profit, andInvestmentCenters
A survey of 121 large publicly traded firms inquired about the type of reporting rela-tionship between the CEO and the line units reporting directly to the CEO’s office. Thestudy reported that in 21 percent of the firms, the line units reporting to the CEO areexclusively cost centers, in 54 percent they are exclusively profit or investment centers,and in the remaining 25 percent of the firms, a combination of profit, investment, andcost centers report to the CEO. The study did not distinguish between profit and invest-ment centers. These findings suggest there is substantial variation in how firms areorganized.
SOURCE: A Christie, M Joye, and R Watts, “Decentralization of the Firm: Theory and Evidence,” Journal of CorporateFinance, January 2003, pp. 3–36.
zim36725_ch05_170-228.qxd 12/15/09 12:39 PM Page 176

Responsibility Accounting and Transfer Pricing 177
Return on investmentA commonly used investment center performance measure is return on investment(ROI). ROI is the ratio of accounting net income generated by the investment centerdivided by the total assets invested in the investment center. The other variants of ROI areROA (return on total assets) and RONA (return on net assets � total assets less currentliabilities). Exactly how the denominator is measured is unimportant for understanding the
HistoricalApplication:The Du PontCompany ROIMethod
In the early 1900s, the E.I. Du Pont de Nemours Powder Company was the leading firmmanufacturing high explosives and was later to grow into one of the world’s largestchemical companies. To control and evaluate its operations, Du Pont managers devel-oped the concept of return on investment.
The financial staff traced the cost and revenues for each product produced. Thisgave management accurate information on profits, which provided a more precise wayof evaluating financial performance. However, managers found product-line profits tobe an incomplete measure of performance because these did not indicate the rate ofreturn on capital invested. One manager said, “The true test of whether the profit is toogreat or too small is the rate of return on the money invested in the business and not thepercent of profit on the cost.”
Developing a rate of return on each segment of business required accurate data oninvestment. Du Pont undertook a careful valuation of each of its plants, properties, andinventories by product line. These data, along with profits, allowed management to trackROI by product line. In addition, Du Pont managers decomposed ROI (Profits �Investment) into its component parts to understand the underlying changes in ROI. Theaccompanying figure illustrates this decomposition.
ROI is the product of sales turnover (Sales � Total investment) and return on sales(Earnings � Sales). Given these data, managers could determine the causes of a prod-uct’s change in ROI. Du Pont managers used these data to evaluate new capital appro-priations by establishing the policy that there “be no expenditures for additions to theearnings equipment if the same amount of money could be applied to some better pur-pose in another branch of the company’s business.”
SOURCE: A Chandler, The Visible Hand: The Managerial Revolution in American Business (Cambridge, MA: HarvardUniversity Press, 1977), pp. 445–49.
Return oninvestment
Salesturnover
Returnon sales
Sales
Totalinvestment
divided by
Sales
Earnings
divided by
multiplied by
zim36725_ch05_170-228.qxd 12/15/09 12:39 PM Page 177

key conceptual issues. Hence, for subsequent discussion, ROI, ROA, and RONA are usedinterchangeably.
ROI overcomes the overinvestment problem of net income by holding the investmentcenter manager responsible for earning a return on the capital employed in the center. It hasintuitive appeal because ROI can be compared with external market-based yields to providea benchmark for a division’s performance. However, using ROI creates problems. ROI isnot a measure of the division’s economic rate of return because accounting net income (thenumerator) excludes some value increases, such as land value appreciation, until the landis sold. Accounting net income tends to be conservative in that it recognizes most lossesand defers most gains. The denominator of ROI, total assets invested, excludes many in-tangible assets such as patents and the firm’s brand-name capital.
Whereas net income as an investment center performance measure creates an overin-vestment problem, using ROI typically creates an underinvestment problem. Managershave incentives to reject profitable projects with ROIs below the mean ROI for the divi-sion because accepting these projects lowers the division’s overall ROI. For example, sup-pose the division has an average ROI of 19 percent, 4 percent above its 15 percent cost ofcapital.4 A new investment project that is 10 percent the size of the combined division isavailable. Its ROI is 16 percent, which is above the cost of capital of 15 percent, so thattaking this project would increase the value of the firm. However, accepting this projectlowers the division’s average ROI to 18.7 percent (or 0.90 � 19% � 0.10 � 16%). If thedivision is evaluated based on increasing ROI, the division management will reject theproject, even though its return exceeds the opportunity cost of capital. Underinvestingresults. In some cases overinvestment also can occur using ROI. For example, suppose adivision has a 15 percent cost of capital, but only a 10 percent ROI. This division has in-centive to seek out and accept a 12 percent ROI project. Doing so raises the division’sROI. But clearly this project is unprofitable because it is earning less than its cost ofcapital.
Riskier projects require a higher cost of capital to compensate investors for bearing thisrisk. If managers are rewarded solely for increasing their division’s ROI without beingcharged for any additional risk imposed on the firm, they have an incentive to plunge thefirm into risky projects. Also, a manager with a short time horizon who is evaluated basedon ROI would prefer projects that boost ROI in immediate years (the horizon problem)even if they were expected to be unprofitable over the life of the project.
Residual incomeTo overcome some of the incentive deficiencies of ROI, such as underinvesting, some firmsuse residual income to evaluate performance. Residual income measures divisional per-formance by subtracting the opportunity cost of capital employed from division profits (af-ter excluding any interest expense included in division profits). Suppose a division hasprofits of $20 million and investment (total assets) of $100 million. This division also hasa cost of capital of 15 percent. Its ROI is 20 percent, which is in excess of its cost of capi-tal (15 percent). Residual income is $5 million (or $20M � 15% � $100M). Under theresidual income approach, divesting a project with an ROI of less than 20 percent, butabove 15 percent, lowers residual income, although it raises average ROI.
Nonetheless, residual income is not without its own problems. Residual income is anabsolute number, and thus larger divisions typically have larger residual incomes thansmaller divisions, making relative performance-evaluation comparisons across investment
178 Chapter 5
4 Cost of capital is the rate of return the firm must pay the market to raise capital. If the firm can raisemoney at 15 percent and invest in projects earning 16 percent, the firm’s value increases.
zim36725_ch05_170-228.qxd 12/15/09 12:39 PM Page 178

Responsibility Accounting and Transfer Pricing 179
centers of different sizes more difficult. To implement residual income measures, seniormanagers must estimate the cost of capital for each division. In principle each division willhave a different cost of capital to allow more precise performance evaluations by control-ling for risk differences.
Like ROI, residual income measures performance over one year. It does not measurethe impact of actions taken today on future firm value. For example, cutting maintenanceincreases current period residual income (and ROI) but jeopardizes future cash flow andhence firm value.
Table 5–3 illustrates the differences between ROI and residual income. Division Bhas 10 times the invested capital and more than 8 times the net income of Division A.Which division is better? Division B has five times the residual income of Division A, butDivision A has the higher ROI. Does this mean Division A is better? The larger division, B,is more important to the firm, since more of the firm’s income is from Division B. DivisionA, if younger than B, will have a higher ROI partly because it has taken its most profitableprojects first. As firms (or divisions) grow, their ROI tends to fall to the extent they investin the most profitable projects first. Therefore, Division A’s higher ROI does not imply thatit is the better-managed division or has the best investment prospects.
Identifying the “better” division requires establishing a benchmark. Suppose DivisionsA and B had budgeted residual incomes of $12 million and $45 million, respectively. Wewould likely conclude that Division B was the better performer because it exceeded itsbudget by $5 million, whereas Division A fell short of its budget by $2 million. Of course,
ManagerialApplication:UniversalCorporation’sUse ofResidualIncome
Universal corporation, a multibillion-dollar agriproduct business, uses residual incometo evaluate and reward internal performance. As described in its proxy statement,
The annual cash incentive awards to our named executive officers in fiscal year 2007 werebased 50 percent on the generation of economic profit and 50 percent on the generation ofadjusted earnings per share. We use economic profit and adjusted earnings per share, as theseperformance measures strongly encourage capital discipline and better investment decisionsand lead to enhanced cash flow. . . . For purposes of the Incentive Plan, we define economicprofit as consolidated earnings before interest and taxes after certain adjustments, minus acapital charge equal to the weighted average cost of capital times average funds employed,and we define adjusted earnings per share as the fully-diluted earnings per share of CommonStock, adjusted to exclude extraordinary gains and losses and annual cash incentive awardaccruals under the Incentive Plan.
SOURCE: Universal Corporation 2006 Proxy Statement, June 28, 2007,http://sec.gov/Archives/edgar/data/102037/000119312507144467/ddef14a.htm.
TABLE 5–3 Comparison of Residual Income with ROI ($000,000)
Division A Division B
Invested capital $100 $1,000Net income 30 250Capital charge (20%) 20 200Residual income 10 50ROI 30% 25%
zim36725_ch05_170-228.qxd 12/15/09 12:39 PM Page 179

these conclusions depend on whether, at the end of the year, we still believe the beginning-of-year budgets ($12 and $45 million) to be valid performance benchmarks.
A number of large companies, including AT&T, Best Buy, Coca-Cola Company, Directv,Kaiser Aluminum, and Whirlpool Corp., use economic value added, or EVA®, as a measure ofperformance.5 EVA is widely heralded in the business press, and several large consulting firmshelp companies implement EVA. Other EVA-like terms have been created such as economicprofit, shareholder value added, total business return, and cash-flow return on investment. Andlike EVA, these other metrics are variants of residual income. The formula for EVA is:
This formula is basically the same as residual income. EVA, like residual income,measures the total return after deducting the cost of all capital employed by the division orfirm. Even though the formula is the same as the residual income formula, the two differ inthree ways. First, different accounting procedures are often used to calculate “adjustedaccounting earnings” than are used in reporting to shareholders.6 For example, U.S.accounting rules require that the entire amount spent on research and development eachyear be deducted from earnings. This creates incentives for managers with a short horizonto cut R&D spending. One adjustment to accounting earnings that EVA advocates suggestis adding back R&D spending and treating it as an asset to be amortized, usually over threeto seven years. Total capital in the EVA formula consists of all the division’s or firm’sassets, including the amount of capitalized R&D and other capitalized accounting adjust-ments. However, many firms using EVA choose not to make any accounting adjustments.
Exercise 5–1
A company has spent $1.2 million, $1.5 million, and $1.8 million over the last three years on
R&D and spent $2.4 million this year. Calculate the amount of R&D assets and R&D expense
in the current year under two alternative accounting procedures: (1) all current year R&D is
expensed immediately, and (2) R&D is capitalized and then amortized over three years. (As-
sume that all R&D spending for the year occurs on the first day of the year.)
Solution:
If R&D is expensed immediately, the R&D asset on the balance sheet is $0 and current
expense is $2.4 million. The following table amortizes R&D spending over three years. For
example, three years ago $1.2 million was spent on R&D. If this amount is capitalized, its
annual amortization would be $0.4 million per year. But this $1.2 million would have been
completely amortized before the current year began; none of its amortization would be in the
EVA =
Adjusted accountingearnings
- ¢Weighted-average cost of capital * Total capital
≤
4. EconomicValue Added(EVA®)
180 Chapter 5
continued
5 EVA is a registered trademark of Stern Stewart & Co.6 For a more complete description of EVA see B Stewart, The Quest for Value (New York: Harper Business,
1991). Also see D Solomons, Divisional Performance: Measurement and Control (Homewood, IL: Richard D.Irwin, 1968) for a discussion of residual income.
zim36725_ch05_170-228.qxd 12/15/09 12:39 PM Page 180

Responsibility Accounting and Transfer Pricing 181
current year. The current year’s amortization expense of $1.9 million consists of one-third of
the R&D spending for the last two years and the current year (1�3 � $5.7 million).
Total R&D Amortization
R&D Current Expense in Spending Year 3 Year 2 Year 1 Year Current Year
Year 3 $1.2 $0.4Year 2 1.5 0.4 $0.5Year 1 1.8 0.4 0.5 $0.6Current year 2.4 0.5 0.6 $0.8 $1.9
Using the amortization amounts in the previous table, the next table calculates the amount
of the R&D asset at the end of the current year.
Total R&D Year Year Year Current Asset in
3 2 1 Year Current Year
Beginning of Year 3 $1.2Beginning of Year 2 0.8 $1.5Beginning of Year 1 0.4 1.0 $1.8Beginning of
current year 0.0 0.5 1.2 $2.4End of current year 0.0 0.0 0.6 1.6 $2.2
The $2.2 million of R&D asset remaining after the end of the current year consists of the
remaining unamortized portion of last year’s R&D spending ($0.6 million) plus the unamor-
tized portion from this year’s R&D spending ($1.6 million). The $1.2 million spent three years
ago and $1.5 million spent two years ago are fully amortized, and hence no remaining portion
of these amounts is in the R&D asset balance at the end of the current year.
Exercise 5–2
The company in Exercise 5–1 has EVA before R&D of $15.2 million and a weighted-average
cost of capital of 20 percent. Calculate its EVA under two alternative accounting procedures:
(1) All current year R&D is expensed immediately, and (2) R&D is capitalized and then amor-
tized over three years.
Solution:
1. If all R&D is expensed immediately, the company’s EVA after R&D is
$12.8 million ($15.2 � $2.4).
2. If R&D is capitalized and then amortized, the company’s EVA after R&D is
$12.86 million ($15.2 � $1.9 � 20% � $2.2).
Amortization of R&D Spending Incurred in
Balance of the R&D Asset Acquired in
zim36725_ch05_170-228.qxd 12/15/09 12:39 PM Page 181

182 Chapter 5
Second, the EVA formula uses a weighted-average cost of capital, which reflects thecost of equity and debt. The cost of equity is the price appreciation and dividends the share-holders could have earned in a portfolio of companies of similar risk. This is the opportunitycost the shareholders bear by buying the company’s stock. The cost of debt is the currentmarket yield on debt of similar risk. The costs of debt and equity are weighted by the rela-tive amounts of debt and equity. Suppose the cost of equity is 18 percent, the cost of debt is10 percent, and the firm’s capital structure is 40 percent debt and 60 percent equity. Then theweighted-average cost of capital is 14.8 percent (or 0.60 � 18% � 0.40 � 10%).7
Third, many companies implementing EVA not only adopt EVA as their performancemeasure but also link compensation to performance measured by EVA. For example,bonuses are paid only if managers achieve prestated EVA targets. Usually, firms adoptingEVA put more of the total compensation paid to managers at risk. Instead of the bonus be-ing 10 percent of the base salary, it becomes 30 percent. The pool of managers eligible toearn bonuses is expanded. Thus, firms adopting EVA increase the sensitivity of their man-agers’ pay to performance. While adopting EVA-based compensation plans imposes morerisk on managers, EVA also increases their incentives to maximize firm value.
Adopting EVA as a performance measure and then linking pay to EVA performance isa complicated process. Employees receiving EVA-based bonuses must be trained in howEVA is measured and how their actions affect EVA. For example, EVA creates incentivesfor managers to reduce unused assets, plant, equipment, and inventory. Eliminating under-utilized assets lessens the capital charge applied to these assets and hence increases EVA.8
Consulting firms that help companies adopt EVA train their employees in how to calculateEVA and how to manage the firm to increase EVA.
EVA (and residual income) has several advantages over earnings as a performancemeasure. It creates incentives to use assets more efficiently. However, like ROI and resid-ual income, EVA still focuses on short-run accounting earnings. Some of the accountingadjustments, such as capitalizing R&D, help reduce this problem. However, the future cashinflows from the R&D are not recognized in EVA (or ROI or residual income) until they are
ManagerialApplication:GeorgiaPacific andEVA
Georgia Pacific, a large forest products company with more than $10 billion of sales,uses EVA to evaluate all projects, including environmental investments. Each environ-mental project is evaluated in terms of how it will reduce consulting fees, lower capitalcosts, increase revenues, reduce fines, and so forth. An internal environmental team forcomplex environmental permitting was formed and generated $2.1 million of EVA byspeeding up the permitting process and by reducing outside consulting.
SOURCE: M Epstein and S Young, “Greening with EVA,” Management Accounting, January 1999, pp. 45–49; GeorgiaPacific Corp., Economic Value Incentive Plan, Form: DEFA filing date 3/29/2001.
7 EVA is calculated on an after-tax basis. In particular, adjusted accounting earnings are net of income taxesand the weighted-average cost of capital is computed as follows: The after-tax cost of debt is computed using 1minus the marginal corporate tax rate times the market yield on debt of similar risk. For example, if the marketyield on equivalent debt is 15 percent and the marginal corporate tax rate is 38 percent, the after-tax cost of debt is9.3 percent (15% � [1 � 0.38]). If the cost of equity is 20 percent and the proportions of debt and equity are thesame, the after-tax weighted-average cost of capital is 14.65 percent (0.50 � 9.3% � 0.50 � 20.0%).
8 See J Wallace, “Adopting Residual Income-Based Compensation Plans: Do You Get What You Pay For?”Journal of Accounting and Economics 24 (1997), pp. 275–300.
zim36725_ch05_170-228.qxd 12/15/09 12:39 PM Page 182

Responsibility Accounting and Transfer Pricing 183
received. Thus, a company can be making very profitable investments, but the returns fromthese investments will not show up in EVA until the cash inflows from these investmentsare received.
Responsibility accounting seeks to identify the objectives of each part of the organizationand then to develop performance measures that report the achievement of those objectives.For example, the department handling customer complaints might be evaluated basedon how long customers wait for a representative or how many callers hang up. Holdingmanagers responsible for only those decisions for which they have authority is called thecontrollability principle. Controllable costs are all costs affected by a manager’s decisions.Uncontrollable costs are those that are not affected by the manager.
Some people argue that managers’ performance should be judged solely on those itemsunder their control but not on costs over which they have no influence. However, a strictapplication of the controllability principle has two major drawbacks. First, holding man-agers accountable for only those variables directly under their control does not give theman incentive to take actions that can affect the consequences of the uncontrollable event. Forexample, if the marina manager is not held accountable for damage done by hurricanes, themanager has less incentive to prepare the marina for severe storms. While managers cannotinfluence the likelihood of hurricanes, they can certainly influence the costs incurred whena hurricane strikes.9
Consider whether profit center managers should be evaluated based on their profits be-fore or after taxes. One argument is that since profit center managers cannot controlchanges in state and federal tax policies, they should not be evaluated on after-tax profits.However, profit center managers’ decisions affect corporate tax payments in a variety of
5. ControllabilityPrinciple
ManagerialApplication:KeyControllableMeasures
Global firms employ a variety of measures of performance to control and motivate man-agers. The most common metrics include:
• Design products (average time to market for new products and new product salesdollars as a percentage of total sales)
• Build products (percent first-time quality, actual versus planned production, andunit cost)
• Distribute products (order/ship cycle time and days’ supply of finished goodsinventory)
• Market and sell products (sales forecast accuracy, sales dollars and percent growth,and market share percentage)
• Manage and develop people (employee satisfaction)
• Satisfy customers (customer satisfaction)
• Satisfy shareholders (cash flow from operations, profitability, and return on netassets)
SOURCE: A Neely, Business Performance Measurement (Cambridge: Cambridge University Press, 2008).
9 G Baker, M Jensen, and K Murphy, “Compensation and Incentives: Practice vs. Theory,” Journal ofFinance 43 (July 1988), p. 611. Also see K Merchant, Rewarding Results: Motivating Profit Center Managers(Boston: Harvard Business School Press, 1989), pp. 87–141.
zim36725_ch05_170-228.qxd 12/15/09 12:39 PM Page 183

ways. Export sales affect tax credits. Charitable contributions and inventory write-offsaffect taxes. One company reports that before it started charging taxes to profit center man-agers, the corporation’s income taxes were between 46 and 48 percent of its profits. Afterit started charging taxes to the profit center managers, the average tax rate fell to 40.5 per-cent.10 This example illustrates an important point. Evaluating managers on items that theycan at least influence, if not control, such as corporate taxes, changes the managers’ incen-tives regarding those items.
The second drawback of the controllability principle is that it ignores the often usefulrole of relative performance evaluation, in which performance is judged relative to howsome comparison group performed instead of by absolute standards. The comparison grouphelps control for random events that affect both the person being evaluated and the com-parison group. For example, many instructors curve grades. Instead of awarding As forscores of 94 to 100, they give As to the top 15 percent of the class. Curving grades controlsfor unusually easy or hard exams and removes some of the risk from student.
Whenever the controllability principle is applied and managers are held accountablefor their actions, dysfunctional actions can occur. All of the performance measures inTable 5–1 are prone to managerial opportunism in the form of accounting manipulations.Managers can choose depreciation methods or estimates that reduce expenses and in-crease reported earnings (e.g., straight-line depreciation or longer estimated asset lives).These accounting choices artificially raise ROI. Investment center managers can increaseROI by rejecting or divesting profitable projects with ROIs below the division average.All of the accounting measures in Table 5–1 are short-term measures of performancethat suffer from the horizon problem, whereby managers emphasize short-term perfor-mance at the expense of long-term returns. Each measure requires careful monitoringby senior managers to reduce dysfunctional suboptimal subordinate behavior from theviewpoint of the owners.
Two important points must be stressed regarding the controllability principle:
1. Performance measurement schemes (including accounting-based methods) usedmechanically and in isolation from other measures are likely to producemisleading results and induce dysfunctional behavior. For example, in the formerSoviet Union, Moscow cab drivers were evaluated on the number of miles driven.This scheme caused cab drivers to circle the city on the uncongested outerhighways while most of the demand for cabs remained in the congested center of Moscow, where there were no cabs.
2. No performance measurement and reward system works perfectly. There willalways remain some managerial action that can be used to enhance the manager’swelfare at the expense of the shareholders. One should avoid discarding a system
184 Chapter 5
10 Merchant (1989), p. 99.
ManagerialApplication:Gaming inCall Centers
At one call center, operators taking queries from customers about their accounts wereevaluated on the number of calls answered per day. Customers with difficult, time-con-suming questions had their calls forwarded to other departments. Customer satisfactionfell. Now most call centers record all calls and base operator performance on a subjec-tive evaluation of a random sampling of their calls.
SOURCE: C Day, Call Center Operations: Profiting from Teleservices (McGraw-Hill Professional, 2000).
zim36725_ch05_170-228.qxd 12/15/09 12:39 PM Page 184

Responsibility Accounting and Transfer Pricing 185
because some managerial opportunism exists and the system proves to be lessthan perfect. The key question is whether the current system outperforms the nextbest alternative after considering all costs and benefits.
Q5–1 What is responsibility accounting?
Q5–2 What role does the firm’s internal accounting system play inresolving organizational problems?
Q5–3 Describe three different types of responsibility centers.Include any shortcomings the centers might have.
Q5–4 How does EVA differ from residual income?
Q5–5 What is the controllability principle and what are itslimitations?
Q5–6 What two points must be kept in mind when examiningperformance-based measurement systems?
B. Transfer PricingWhen goods are transferred from one profit (or investment) center to another, an internalprice (the transfer price) is assigned to the units transferred. If Chevrolet manufactures anengine that is installed in a Buick, the transfer price is the internal charge paid by the Buickdivision of General Motors to the Chevrolet division of General Motors. Transfer prices aremuch more prevalent in organizations than most managers realize. Consider the charge thatthe advertising department receives from the maintenance department for janitorial service,or the monthly charge for telephones, security services, e-mail, legal and personnel ser-vices, and so on. Most firms use cost allocations as a method of charging internal users forgoods or services received from another part of the organization. These cost allocations arein reality transfer prices. Hence, transfer pricing and cost allocations are two closely relatedtopics. (The specifics of cost allocations are discussed in Chapters 7 and 8.)
There are basically two main reasons for transfer pricing within firms: internationaltaxation and performance measurement of profit and investment centers. Each of these isdescribed below.
When products are transferred overseas, the firm’s corporate tax liability in both the ex-porting and importing country is affected. For example, when a copier is manufactured inRochester, New York, by Xerox Corp. and shipped to England to be sold, U.S. and Britishtaxes paid by Xerox are affected. The transfer price of the copier is a revenue for U.S. taxpurposes and a tax-deductible expense in England. To the extent allowed by the tax regula-tions, the firm will set a transfer price that minimizes the joint tax liability in the two coun-tries. If the two tax jurisdictions have different income tax rates, then the firm will set thetransfer price to shift as much of the profit into the lower-rate jurisdiction as possible,subject to the taxing authorities’ guidelines.
For example, suppose Bausch & Lomb manufactures a box of contact lenses inthe Netherlands and ships the lenses to an Australian subsidiary that sells them for 85Australian dollars. The variable out-of-pocket cost of manufacturing the contact lenses is50 euros. The exchange rate is 0.70 Australian dollars to 1 euro. Suppose the Dutch corpo-rate tax rate is 30 percent and the Australian corporate tax rate is 40 percent. Bausch &Lomb will want to set the transfer price on the lenses as high as permissible to recognize
1. InternationalTaxation
ConceptQuestions
zim36725_ch05_170-228.qxd 12/15/09 12:39 PM Page 185

the most profits in the lower tax-rate jurisdiction, which is the Netherlands in this case. Thetransfer price of the contacts can vary, depending on what fixed costs are allocated to themand how. Suppose Australian and Dutch tax treaties allow Bausch & Lomb to set a transferprice at anywhere between 80 and 110 euros. Table 5–4 illustrates how the combined taxliability varies with the transfer price.
By choosing the highest allowed transfer price, 110 euros, Bausch & Lomb can recog-nize more profits in the country with the lowest corporate income tax rate. If Australia hadthe lower tax rate, then Bausch & Lomb would select the lowest transfer price, 80 euros,thereby reducing its Dutch tax liability and raising its Australian tax liability. But the highertaxes paid in Australia would be offset by the lower taxes paid in the Netherlands.
Each country has tax regulations that define how companies in its jurisdiction calcu-late the price of goods transferred in and out of the country. Section 482 of the U.S. InternalRevenue Code authorizes the Internal Revenue Service to regulate the allocation of rev-enues and costs to prevent tax evasion. International tax treaties regulate allowable transferpricing methods.11 Because tax codes vary across jurisdictions, we ignore the role of inter-national taxation in setting transfer prices in this chapter and focus instead on the organi-zational issues. Small differences in tax rates can generate large cash flow differences,depending on the transfer prices. Thus, in many firms international taxation is the primaryfactor determining the firm’s transfer pricing policy.
Firms can have two sets of transfer prices: one for taxes and one for internal purposes.However, maintaining two such systems is costly. Additional bookkeeping costs are incurred
186 Chapter 5
TABLE 5–4 Bausch & Lomb: Effect of Transfer Pricing on Combined Tax Liability
Transfer Transfer Price at Price at 80 Euros 110 Euros
Taxes Paid in the NetherlandsRevenue (transfer price) €80 €110Variable cost �50 �50
Taxable income €30 €60Tax rate 30% 30%
Dutch taxes €9 €18
Taxes Paid in AustraliaRevenue† A$85 A$85Transfer price in euros € 80 €110� Exchange rate 0.70 A$/Euro � 0.70 � 0.70
Transfer price as A$† �A$56 �A$77
Taxable income A$29 A$8Tax rate 40% 40%
Australian taxes A$11.6 A$3.2Converted to euros (� 0.70) €16.57 €4.57
Sum of Dutch and Australian taxes €25.57 €22.57
†A$ denotes Australian dollars.
11 A Anandarjan, M McGhee, and A Curatola, “A Guide to International Transfer Pricing,” Journal ofCorporate Accounting and Finance, September/October 2007, P. 33.
zim36725_ch05_170-228.qxd 12/15/09 12:40 PM Page 186

Responsibility Accounting and Transfer Pricing 187
and are confusing to users. In addition, some tax jurisdictions may argue that the transferprices used for internal purposes should also be used for taxes, especially if they result inhigher taxes than the transfer prices used for taxes.
As discussed earlier, firms are organized into responsibility centers. Whenever responsibilitycenters transfer goods or services among themselves, measuring their performance requiresthat a “transfer price” be established for the goods and services exchanged. For example, sup-pose a large chemical company is organized into profit centers. Besides producing for andselling to outside customers, these profit centers also sell intermediate products to otherprofit centers within the company, which then further process the intermediate products intofinal products that are sold to outside customers. To measure the performance of the profitcenters, each of these internal transactions requires a transfer price. The purchasing divisionpays the transfer price and the producing division receives the transfer price.
Some senior executives do not view the transfer pricing problem as important. They thinkthat alternative transfer pricing methods merely shift income among divisions and that, exceptfor relative performance evaluation, little else is affected. But this is a mistake: The choice oftransfer pricing method does not merely reallocate total company profits among businessunits; it also affects the firm’s total profits. Think of the firm’s total profit as a pie. Choiceamong transfer pricing methods not only changes how the pie is divided among responsibil-ity centers; it also changes the size of the pie to be divided.
Managers make investment, purchasing, and production decisions based on the trans-fer prices they face. If, from the firm’s perspective, these transfer prices do not reflect thetrue value of the resources, managers will make inappropriate decisions and the value ofthe firm will be reduced. For example, if the opportunity cost to the firm of producing anintermediate chemical is $20 per kilogram but the transfer price is $30, the purchasingdivision will consume too little of the chemical relative to the quantity it would purchase ifthe transfer price were $20, and total firm profits will be reduced. Purchasing-unit man-agers will have the incentive to shift away from using the chemical toward using otherinputs that in reality are more expensive for the firm. Also, because transfer prices affectthe managers’ performance evaluations, incorrect transfer prices can result in inappropriatepromotion and bonus decisions.
Because transfer prices (including chargeback systems) are widespread in many firmsand because transfer pricing affects performance evaluation and hence the rewards managers
2. Economics ofTransfer Pricing
ManagerialApplication:Dual TransferPricingSystems?
Some consultants advocate using two separate transfer pricing systems, one for tax pur-poses and another for internal decision making, even though maintaining two systemscan be costly. Jay Tredwell, director of CEO Solutions for AnswerThink ConsultingGroup, says, “Having a separate system can give senior managers a better view of . . .real profitability [as opposed to] their ‘tax profitability.’” However, Michael Patton, apartner at Ernst & Young, counters,
An essential problem with separated reporting is that transfer prices already reflect the prof-itability of a division or project. If you are trying to make decisions about new activities orfacilities, and trying to judge their returns on invested capital, you need good benchmarks tojudge these by, and good transfer prices provide part of that. Basically, then, the question iswhether your current transfer prices reflect economic reality or not. If they do, there’s littleneed for a new system. If not, the tax authorities may have a question or two for you on au-dit in a few years’ time.
SOURCE: I Springsteel, “Separate But Unequal,” CFO, August 1999, pp. 89–91.
zim36725_ch05_170-228.qxd 12/15/09 12:40 PM Page 187

receive, disputes over the transfer price between divisions are inevitable. Transfer pricing isa constant source of tension within firms. It is not uncommon for managers in most multi-divisional firms to be involved in transfer pricing disputes over the course of their careers.
The transfer price that maximizes firm value is quite simple to state: The optimaltransfer price for a product or service is its opportunity cost—it is the value forgone by notusing the transferred product in its next best alternative use. Unfortunately, as we will see,this simple rule is often difficult to implement in practice.
Transfer pricing with perfect informationTo illustrate the concept of using opportunity cost to set the transfer price, suppose the firmhas two profit centers: Manufacturing and Distribution. Senior management is consideringmaking a product in Manufacturing and transferring it to Distribution. Assume also thatManufacturing’s variable cost of production is $3 per unit, and that it has excess capacity. Ifthe product is transferred to Distribution, Distribution can sell it and receive $5 for each unit,net of its own variable cost. Also, everyone knows each division’s cost and revenue data.
If the unit is not manufactured, the firm saves $3 but forgoes $5, hence reducing prof-its by $2. If the unit is manufactured and transferred, the firm forgoes $3 (variable cost toproduce) and receives $5 for a net receipt of $2. The better alternative is to manufacture andtransfer the unit. The resources forgone by transferring the unit from Manufacturing toDistribution—and hence the opportunity cost of such a transfer—are $3 per unit, the sameas Manufacturing’s variable cost of production.
As this example is meant to suggest, the variable cost of producing the unit is often theopportunity cost. But this is not always the case. Sometimes the opportunity cost is the rev-enue of selling the intermediate good externally. For example, suppose Manufacturing canproduce one unit for $3 and can either transfer that unit to Distribution or sell it for $5.50outside the firm—but, because of limited capacity, it cannot do both. In this case, by hav-ing Manufacturing transfer the unit to Distribution, the firm forgoes selling the intermedi-ate good in the market. Even though the variable cost of producing the unit is $3, theopportunity cost of the transfer is $5.50. Thus, it is now optimal to sell it externally ratherthan transfer it to Distribution. Selling it externally yields profits of $2.50 ($5.50 � $3.00).Transferring it to Distribution who sells it for $5 yields profits of only $2 ($5 � $3).
188 Chapter 5
ManagerialApplication:TransferPricing andTaxes
U.K.-based GlaxoSmithKline (GSK) agreed to settle its transfer pricing dispute with theU.S. IRS by paying $3.1 billion. At issue was how GSK treated marketing expenses andR&D costs as part of the transfer price of making its popular ulcer drug Zantac. In fact,30 percent of all U.S. corporate tax adjustments made each year involve transfer-pricingdisputes. Beginning in the late 1980s, the United States began imposing penalties of be-tween 20 percent and 40 percent of the tax underpayment caused by transfer-pricing is-sues. As a result, corporate tax departments quickly realized that if they underpaid theirU.S. taxes, they could be exposed to huge penalties; if they underpaid other countries,they would face less severe penalties. But other countries quickly followed suit. Canadadoubled the size of its staff of transfer-pricing examiners. Australia, Brazil, Japan, andFrance put new penalties in place.
In an attempt to streamline the transfer-pricing dispute-resolution process, the IRShas an Advance Pricing Agreement (APA) Program. The taxpayer team and the IRS teamwork together prospectively to develop the transfer-pricing method the taxpayer will use.As long as the taxpayer complies with the agreement, the IRS will not challenge subse-quent years’ transfer prices. The IRS had negotiated about 500 APAs by the end of 2003.
SOURCE: www.irs.gov/pub/irs-utl/apa03.pdf and R.Fink, “Haven or Hell,” CFO Magazine, March 1, 2004.
zim36725_ch05_170-228.qxd 12/15/09 12:40 PM Page 188

Responsibility Accounting and Transfer Pricing 189
When opportunity cost is used to set the transfer price, Manufacturing will produceto the point at which the variable cost of the last unit equals the transfer price. Likewise,Distribution will buy units from Manufacturing as long as Distribution’s net receipts justcover the transfer price. When opportunity cost is used to set the transfer price and bothManufacturing and Distribution are maximizing their respective profits, assuming there areno interdependencies between the business units (a case we consider later), total firm prof-its are maximized. If the transfer price is too high or too low relative to opportunity cost,too few units are transferred and firm profits are not maximized.
Transfer pricing with asymmetric informationThe preceding discussion assumes everyone knows (1) that Manufacturing’s variable pro-duction cost is $3, (2) that the intermediate product has an external price of $4, (3) that Dis-tribution’s revenue is $5, and (4) whether Manufacturing has excess capacity. Yet if all ofthis knowledge were readily available, there would be no reason to decentralize decisionmaking within the organization. Central management would have the knowledge to makethe decision and could either retain the decision rights or, if the decision rights were dele-gated, monitor the process at low cost. In reality, much of the information is not readilyavailable to central management. Especially in large, multidivisional firms, such knowl-edge generally resides at lower levels of the firm where it is private knowledge, costly toeither transfer or verify by senior management. In some circumstances, lower-level managershave incentives to distort the information they pass up to senior managers. To illustratethese incentives, we consider the role of market power.
Consider a situation in which Burt Brown, the manager of Manufacturing, is the only per-son with knowledge of his division’s variable costs, and assume that Burt seeks to maximizethe profits of his division. Even if Distribution is allowed to purchase the product on the out-side, if Manufacturing has market power in setting the transfer price it will attempt to set theprice above its variable cost to increase its measured profits. When this happens, the firm man-ufactures and sells too few units of the product. The Manufacturing division, possessing whatamounts to monopoly rights in information, behaves like a monopolist. Just as monopolistsearn “monopoly profits” by raising prices and restricting output, Manufacturing’s higher prof-its lead to lower-than-optimal production levels and lower total firm profits. Example 5–1illustrates how firm profits are reduced when the transfer price is not set at opportunity cost.
Example 5–1
There are two profit centers: the Seller and Buyer divisions.12 The Seller division produces and
sells an intermediate product (electric motors) to the Buyer Division. The Buyer Division uses
the motors in making a toy car. Both divisions are profit centers and maximize their division’s
profits. The following outlines the cost structure of the two divisions:
Cost Structure of the Two Divisions
Selling Division (Seller) Buying Division (Buyer)
Fixed costs $150/day $100 (1st 100 units per day)Variable costs $0.10/unit $0.20/unit (over 100 units)
12 This example is based on D Solomons, Divisional Performance: Measurement and Control (Burr Ridge,IL: Richard D. Irwin, 1965), pp. 167–71.
continued
zim36725_ch05_170-228.qxd 12/15/09 12:40 PM Page 189

The Buyer Division faces a downward-sloping demand curve for its final product (the toy car),
which includes the intermediate product with the following price-quantity relationship:
Demand for Buyer Division’s Toy Car
Quantity Sold Price/Car Total Revenue
100 $2.00 $200200 1.80 360300 1.50 450400 1.30 520500 1.20 600600 1.04 624
Suppose the transfer price is set at $0.95 per unit and 200 motors are transferred. The $0.95
was set by taking Seller’s variable cost of $0.10 per unit and adding $0.75 for fixed costs (Unit
fixed cost � $0.75 � $150/200) and $0.10 for profits. Seller’s profit is $20 � 200 � $0.10.
The Buyer Division produces 200 cars and maximizes profits at $50. These relations are
summarized in the next table.
Buying Division’s Costs and Revenues
Buyer’s Own Cost Total Cost
($100 Cost from (Buyer’s Own Total Revenue Profit Output � .20/Unit Seller Cost � (Price � (Revenue (Units) over 100) ($0.95/Unit) Transfer Quantity) � Cost)
100 $100 $ 95 $195 $200 $ 5200 120 190 310 360 50300 140 285 425 450 25400 160 380 540 520 �20500 180 475 655 600 �55600 200 570 770 624 �146
Notice that at 200 motors, Buyer is maximizing profits at $50. Any other level of output
reduces Buyer’s profits.
Selling Division’s Costs and Revenues
Output Revenue Costs Profits
100 $ 95 $160 $�65200 190 170 20300 285 180 105400 380 190 190500 475 200 275600 570 210 360
190 Chapter 5
continued
zim36725_ch05_170-228.qxd 12/15/09 12:40 PM Page 190

Both divisions seem to be operating well, and both are making a profit. The Buyer Division is
maximizing profit. The selling division, Seller, is making $20 profit and could make more mo-
tors if only the Buyer Division would buy more. But the company is not maximizing profits.
Company profits are maximized at 500 motors. The accompanying table indicates the to-
tal companywide costs and revenues at the various output levels.
Firm Profits
Seller Buyer Total Total Firm Output Costs Costs Costs Revenue Profit
100 $160 $100 $260 $200 $�60200 170 120 290 360 70300 180 140 320 450 130400 190 160 350 520 170500 200 180 380 600 220600 210 200 410 624 214
Company profits rise from $70 at 200 motors per day to $220 at 500 motors per day. In
this example, the correct transfer price is at variable cost ($0.10). Transferring at $0.10/motors
maximizes company profits. Charging more than variable cost causes the Buyer Division to
purchase too few motors. But the Seller Division shows a loss (its fixed costs, if the transfer
price is set at variable cost).
The correct transfer price is opportunity cost. But, as we have also noted, determiningopportunity costs is expensive—in part because the information necessary to calculate suchcosts resides with operating managers who have incentives to distort it. To address thisproblem, companies sometimes commission special studies of the firm’s cost structure byoutside experts. However, not only are such studies costly but their findings become out-dated whenever the firm’s business opportunities or productive capacities change. On theother hand, if senior management simply vests the right to set the transfer price with eitherManufacturing or Distribution, prices will be set too high or too low, resulting in too fewunits transferred, and the firm’s value will be lower than it could be.
Because determining opportunity costs is itself an expensive undertaking, managersresort to various lower-cost approximations. There are at least four different methods thatfirms regularly use to approximate the opportunity cost of the units transferred: marketprice, variable production cost, full cost, and negotiated pricing. As discussed below, eachone of these four methods is better than the others in some situations, but not in others. Forexample, if the divisions operate in different countries with different tax rates, then thechoice of method will be driven in part by tax considerations. Our aim in the rest of thissection is to describe these basic alternatives and set forth their advantages and disadvan-tages so that managers can select the one best-suited for their particular situation.
Market-based transfer pricesThe standard transfer pricing rule offered by most textbooks is: Given a competitive exter-nal market for the good, the product should be transferred at the external market price. IfManufacturing cannot make a long-run profit at the external price, then the company is bet-ter off not producing internally and instead should purchase in the external market. If the
3. CommonTransfer PricingMethods
Responsibility Accounting and Transfer Pricing 191
zim36725_ch05_170-228.qxd 12/15/09 12:40 PM Page 191

purchasing division cannot make a long-run profit at the external price, then the companyis better off not processing the intermediate product and instead should sell it in the exter-nal market. Using the external market price of goods and services transferred internally isoften an objective way to set transfer prices. Such external prices are not subject to manip-ulations by managers in the selling division as are accounting-based transfer prices. (Dis-cussed below.)
In short, the use of market-based transfer prices is often assumed to produce the cor-rect make-versus-buy decisions. In many situations, however, market prices will not pro-vide an accurate reflection of opportunity cost. If the firm and the market both are makingthe intermediate good, the fundamental question arises, Can both survive in the long run?If one can produce the good at a lower, long-run, average cost than the other, the high-costproducer should not be producing the intermediate product.
Yet it is important to keep in mind that transactions generally take place inside ratherthan outside firms whenever the cost of repetitive internal contracting is cheaper than out-sourcing.13 For example, firms often produce products inside even though they could pur-chase them externally. Firms produce internally when there are important interdependenciesor synergies among those products. And, of course, the more valuable such synergies are, themore likely it is that the firm will continue producing internally.
At the same time, however—and this is what makes the issue of transfer pricing sodifficult—in circumstances where the firm is more likely to produce a good internally, theexternal market price is least likely to provide an accurate reflection of the opportunity costof internal production. For example, it is often the case that an intermediate good is notbeing produced by other firms or that the good produced externally is not identical to thegood produced internally. In the first case, there is no market price; in the second, the mar-ket price is often an unreliable guide to opportunity cost. And, even when there are virtu-ally identical “cheaper” external products, producing internally can still make sense insofaras it provides greater quality control, more timely supply, or better protection of proprietaryinformation. When these factors are included in the analysis, the external market may nolonger be “cheaper.”
In such cases, using the market price as the transfer price may understate the prof-itability of the product and its contribution to the value of the firm. Suppose, for example,
192 Chapter 5
AcademicApplication:Why TransferPricing IsSo Hard
“The economist’s first instinct is to set the transfer price equal to marginal cost. But itmay be difficult to find out marginal cost. As a practical matter, marginal cost informa-tion is rarely known to anybody in the firm, because it depends on opportunity costs thatvary with capacity use. And even if marginal cost information were available, there is noguarantee that it would be revealed in a truthful fashion for the purpose of determiningan optimal transfer price.”
SOURCE: B Holmstrom and J Tirole, “Transfer Pricing and Organizational Form,” Journal of Law, Economics, &Organizations 7 (1991), pp. 201–28.
13 Advantages to internal transactions include the elimination of credit risk, lower marketing costs, andlearning from production. See R Coase, “The Nature of the Firm,” Economica 4 (1937), pp. 386–405 and see R Watts, “Accounting Choice Theory and Market-Based Research in Accounting,” British Accounting Journal24 (1992), pp. 242–46.
zim36725_ch05_170-228.qxd 12/15/09 12:40 PM Page 192

Responsibility Accounting and Transfer Pricing 193
that an intermediate product can be purchased but not sold externally for $3 per unit. Syn-ergies such as high transactions costs of using the market make it beneficial to produce theitem internally. Internal production avoids the costs of writing and enforcing contracts.Suppose there are $0.50 worth of synergies, so that the “correct” transfer price is $2.50 inthe sense that $2.50 is the opportunity cost to the firm. But, if the market price of $3.00 isused as the transfer price, Distribution will purchase fewer units than if $2.50 were used,and the value of the firm will not be maximized.
Variable-cost transfer pricesIf no external market for the intermediate good exists or if large synergies among respon-sibility centers cause the market price to be an inaccurate measure of opportunity cost,then variable production cost may be the most effective alternative transfer price. As wesaw earlier, variable cost represents the value of the resources forgone to produce onemore unit.
As with other transfer-pricing methods, however, there are problems with variable costas a measure of opportunity cost. One is that Manufacturing does not necessarily recoverits fixed costs. If Manufacturing’s entire output is transferred internally and variable cost isbelow its average total cost, Manufacturing’s fixed costs are not recovered. Thus, Manu-facturing appears to be losing money.14
One variant of variable-cost transfer pricing is to price all transfers at variable costwhile also charging Distribution a fixed fee for these services. Distribution pays the vari-able cost for the additional units and buys the number of units that maximizes firm profits.Unlike straight variable-cost pricing, however, this variant allows Manufacturing to coverits full cost and earn a profit. The fixed fee represents the right of Distribution to acquirethe product at variable cost and is set to cover Manufacturing’s fixed cost plus a return onequity.
Another problem with variable-cost transfer pricing occurs in situations where the vari-able cost per unit is not constant as volume changes. Suppose the variable cost per unit in-creases as volume expands (say, a night shift is added within a higher hourly wage). Ifvariable cost is greater than average cost and all users are charged the higher variable cost,the total cost charged to all the users is greater than the total cost incurred by the firm.Users who did not expand their volume will still see their costs increase. In such cases, con-flicts are likely within the firm over the appropriate measure of variable cost and whetherall users should pay variable cost or just those users who expanded output, thereby prompt-ing the addition of the night shift.
A similar problem arises when Manufacturing approaches capacity. To illustrate theproblem, assume that Manufacturing is considering a $2.5 million outlay to add morecapacity. These additional capacity costs of $2.5 million are variable in the long run butbecome short-run fixed costs (depreciation and higher utilities and maintenance). Thus,conflicts arise between Manufacturing and Distribution as to whether these additionalcapacity costs should be included in the transfer price or not. What makes such conflicts sodifficult to resolve is that there is no indisputably objective method for calculating variablecosts. They are not reported in The Wall Street Journal. Instead, they have to be estimated
14 Of course, if central management knows the magnitude of the fixed costs, they can budget for this loss. But,once again, if central management knows the magnitude of the fixed costs, then they know variable cost, and thusthere is little reason to have a separate responsibility center and transfer pricing system in the first place.
zim36725_ch05_170-228.qxd 12/15/09 12:40 PM Page 193

from accounting records. Although most of the components of variable cost are easily ob-served, such as the cost of direct labor and direct material, some components are difficultto estimate. For example, it is not easy to estimate the additional costs incurred by the pur-chasing department when additional units are manufactured.
Variable-cost transfer pricing also creates incentives for Manufacturing to distort vari-able cost upward, perhaps by misclassifying fixed costs as variable costs. For example, howmuch of the electricity bill is fixed and how much is variable? Since these classificationsare to some extent arbitrary, influence costs are generated as managers in Manufacturingand Distribution debate various cost terms and their applications—and as senior managersare forced to spend time arbitrating such disputes.
Moreover, under variable-cost transfer pricing, Manufacturing can have an incentive toconvert a dollar of fixed costs into more than a dollar of variable costs—for example, byusing high-priced outsourcing of parts instead of cheaper internal manufacturing—eventhough this clearly reduces the value of the firm. For Manufacturing, the use of outsourc-ing can remove the burden of any fixed costs while Distribution, as well as the firm as awhole, bears the extra cost of such decisions.
Exercise 5–3
Scoff Division of Worldwide Paint is currently losing money and senior management is con-
sidering selling or closing Scoff. Scoff’s only product, an intermediate chemical called Binder,
is used principally by the latex division of the firm. If Scoff is sold, the latex division can
purchase ample quantities of Binder in the market at sufficiently high quality levels to meet its
requirements. Worldwide requires all of its divisions to supply product to other Worldwide
divisions before servicing the external market.
194 Chapter 5
ManagerialApplication:TevaAbandonsVariable-CostTransferPricing
Teva Pharmaceutical Industries Ltd. in Israel implemented a variable-cost transfer pric-ing system defined as only material cost. Labor was largely fixed because of the highcost of firing and hiring employees in Israel. Manufacturing produced drugs that severalgeographic marketing divisions sold. These marketing divisions could also sell otherproducers’ pharmaceuticals. Market-based transfer pricing was rejected because manyof Teva’s products did not sell in intermediate markets. Senior executives rejected nego-tiated transfer pricing because they believed it would lead to endless arguments.
Variable-cost transfer pricing proved very unpopular. Senior managers worried thatmarketing divisions would show extremely high profits because they were not beingcharged for labor or capital costs. They also worried that manufacturing would havelittle incentive to control labor and other so-called fixed expenses. Finally, if manufac-turing were less efficient than outside suppliers, variable-cost transfer pricing wouldprovide little incentive to the marketing divisions to buy internally.
Teva replaced the variable-cost transfer pricing system with one based on full cost,including materials, labor, and overhead.
SOURCE: R Kaplan, D Weiss, and E Desheh, “Transfer Pricing with ABC,” Management Accounting, May 1997, pp. 20–28.
continued
zim36725_ch05_170-228.qxd 12/15/09 12:40 PM Page 194

Responsibility Accounting and Transfer Pricing 195
Scoff’s statement of operations for the latest quarter is:
SCOFF DIVISIONProfit/LossLast Quarter($ thousands)
RevenuesInside $200Outside 75 $275
Operating expensesVariable costs $260Fixed costs 15Allocated corporate overhead 40 315
Net income (loss) before taxes ($40)
NOTES:
1. Worldwide Paint has the policy of transferring all products internally at variable cost. In Scoff’s case,variable cost is 80 percent of the market price.
2. All of Scoff’s fixed costs are avoidable cash flows if Scoff is closed or sold.
3. $4,000 of the $40,000 allocated corporate overhead will be avoided if Scoff is closed or sold.
Required:
Calculate the annual net cash flows to Worldwide Paint of closing or selling Scoff.
Solution:
The key to this problem is recognizing that the transfer price is very favorable to Latex and is
causing Scoff to appear unprofitable. If Scoff is closed or sold, Latex will have to pay the mar-
ket price for Binder, which is higher than the current transfer price. Also, not all the corporate
overhead is saved by closing or selling Scoff.
Selling or closing Scoff changes the potential synergies within the firm. Can Worldwide
Paint maintain the same quality/delivery times on Binder? One question to raise is what these
are worth. Analyzing these “intangibles” will be necessary only if an outside offer is larger
than the value of the cash flows forgone from selling Scoff. The table below indicates that
Scoff is generating positive cash flow to Worldwide despite the operating losses reported.
SCOFF DIVISIONQuarterly Net Cash Flows to Worldwide Paint of Closing
Last Quarter Ending($ thousands)
Operating expenses saved:Variable costs $260Fixed costs 15Allocated corporate overhead 4
Scoff’s operating expenses avoided $279Revenues forgone:
Outside (75)Market purchases by Latex Division
of Binder ($200 ÷ 80%) (250)Decline in quarterly cash flows � ($46)
4 quarters per year � 4Annual decline in Worldwide cash flows ($184)
zim36725_ch05_170-228.qxd 12/15/09 12:40 PM Page 195

Full-cost transfer pricesBecause of the information and incentive problems described above, simple, objective, hard-to-change transfer price rules can often lead to higher firm value than transfer pricing rulesthat give one responsibility center discretion over the transfer price. Objective transfer pric-ing rules such as those based on full accounting cost are often adopted primarily to avoidwasteful disputes over measuring variable costs. Full cost includes both direct materials andlabor as well as a charge for overhead. Since full cost is the sum of fixed and variable cost,full cost cannot be changed simply by reclassifying a fixed cost as a variable cost.
The problem, however, is that full-cost transfer pricing frequently overstates the opportu-nity cost to the firm of producing and transferring one more unit internally, especially if Man-ufacturing has excess capacity. And so Distribution usually will buy too few units internally.Full cost also allows Manufacturing to transfer any of its inefficiencies to Distribution. Thus,Manufacturing has less incentive to be efficient under a full-cost transfer price rule.15
Despite all these problems, however, full-cost transfer pricing is quite common. Vari-ous surveys of firms report 40–50 percent usage of full-cost transfer prices. One reason forthe popularity of full-cost transfer prices is their ability to deal with the problem of changesin capacity. As a plant begins to reach capacity, opportunity cost is likely to rise because ofcongestion and the cost of alternative uses of now-scarce capacity. Hence, opportunity costis likely to be higher than direct materials and labor costs. In this case, full cost might be acloser approximation to opportunity cost than just variable cost.
Perhaps the most important benefit of full-cost transfer pricing, however, is its sim-plicity and hence low cost of implementation. Because operating managers have much lessability to manipulate full-cost than variable-cost calculations, senior management arbitratefewer disputes over calculating the transfer price. Nevertheless, managers should considercarefully whether full-cost pricing is optimal for their particular situation. If the opportu-nity cost is substantially different from full cost, the firm’s forgone profits can be large.
Negotiated transfer pricesTransfer prices can be set by negotiation between Manufacturing and Distribution. Thismethod can result in transfer prices that approximate opportunity cost because Manufac-turing will not agree to a price that is below its opportunity cost and Distribution will notpay a price that is above the product’s price elsewhere.
With negotiated transfer prices, the two divisions have the incentive to set the numberof units to maximize the combined profits of the two divisions. Once the value-maximizingnumber of units is agreed upon, the negotiated transfer price determines how the total prof-its are divided between the two divisions. If the two divisions negotiate both price andquantity, they have the joint incentive to maximize the total profit to be split. Yet, if the twodivisions only negotiate the price, there is no guarantee that they will arrive at the transferprice that maximizes firm value.
While negotiation is a fairly common method, it too has drawbacks. It is time-consumingand can produce conflicts among divisions. Divisional performance measurement becomessensitive to the relative negotiating skills of the two division managers. Moreover, if the twodivisions negotiate a transfer price without at the same time agreeing on the quantity to betransferred at that price, there is no guarantee that they will arrive at the transfer price thatmaximizes the firm’s value.
196 Chapter 5
15 To be sure, variable-cost transfer prices also allow the selling division to export some of its inefficiencies to thepurchasing division, but the problem is not as pronounced as under full cost. Nevertheless, the problem of exportinginefficiencies to the buying division through cost-based transfer prices is reduced if the purchasing division canpurchase externally as well as from the selling division. This forces the selling division to remain competitive.
zim36725_ch05_170-228.qxd 12/15/09 12:40 PM Page 196

Responsibility Accounting and Transfer Pricing 197
In some cases, transfer pricing conflicts among responsibility centers can become suffi-ciently divisive as to impose large costs on the firm. These costs arise when other thanfirm-value-maximizing transfer prices are chosen. Costly transfer pricing disputes usuallyoccur when the relative volume of transactions among divisions is large. In such cases, asmall change in the transfer price can have a large effect on the division’s reported profits.Hence, the potential for (and destructive effects of) opportunistic transfer pricing actions byoperating managers is substantial.
If transfer pricing becomes sufficiently dysfunctional, reorganize the firm. For exam-ple, senior management could combine two profit centers with a large volume of transfersinto a single division. Alternatively, it might make more sense to convert Manufacturinginto a cost center rather than a profit center and compensate the operating head based onefficiency in production. Or both divisions might be reorganized as cost centers and keepthe pricing and quantity decisions at the central office.
A final possibility is to change the decision rights allocation and give both Manufac-turing and Distribution the rights to produce the transferred good. However, this alternativecan be expensive due to duplication of resources and effort.
To review the discussion on transfer pricing, firms decentralize and create responsibilitycenters to take advantage of the divisional manager’s specialized knowledge of localconditions. Incentives must then be provided for these managers to use their specializedknowledge to make profit-maximizing decisions for their firms. Forming responsibilitycenters and linking performance measures to their decision rights (as described inTable 5–1) provides these incentives. When one responsibility center buys or sells goods orservices from another center, a transfer price must be established for this internal transac-tion in order that each center’s performance measures, such as earnings, can be calculated.This provides each center the incentive to engage in internal transactions that benefit thefirm. Hence, transfer pricing permits managers to exploit the specialized information theypossess about local opportunities.16 Various methods exist for calculating transfer prices.Table 5–5 summarizes the advantages and disadvantages of each method.
No single method is best in all circumstances. Since each method has its advantages anddisadvantages, managers must choose the method that trades off decision making, control,and taxes given their unique circumstances. Market-based transfer pricing is objective, butmight not capture interdependencies that exist within the firm. While variable-cost transferpricing approximates the opportunity cost of producing one more unit when excess capacityexists, it is rarely used in practice. While we do not know exactly why variable costing isused infrequently, we can speculate on some plausible reasons. Full-cost transfer pricing ap-proximates the costs of adding fixed capacity (in the absence of inflation and productivitychanges). Also, with variable-cost transfer pricing it is difficult to separate fixed and vari-able costs. Finally, as discussed earlier, variable costing gives the selling division significantdiscretion in altering the transfer price by reclassifying fixed costs as variable costs.
The trade-off between decision making and control discussed in Chapter 1 also appliesto transfer prices. The transfer price that most accurately measures the opportunity cost tothe firm of transferring one more unit inside the firm may not be the transfer pricing methodthat gives internal managers the incentive to maximize firm value. For example, if the trans-fer pricing method that most accurately measures the opportunity cost of transferred units
5. Recap
4. Reorganization:The Solution IfAll Else Fails
16 For an expanded discussion of transfer pricing, see R Eccles, “Analyzing Your Company’s Transfer PricingPractices,” Journal of Cost Management, Summer 1987, pp. 21–33; R Eccles, The Transfer Pricing Problem: ATheory for Practice (Lexington, MA: Lexington Books, 1985), and B Holmstrom and J Tirole, “Transfer Pricingand Organizational Form,” Journal of Law, Economics, & Organizations 7 (1991), pp. 201–28.
zim36725_ch05_170-228.qxd 12/15/09 12:40 PM Page 197

also requires managers producing these units to reveal privately held and hard-to-verify dataof their costs, then these managers have considerable discretion over the transfer prices. Ifthese transfer prices are important in rewarding managers, the producing managers can dis-tort the transfer price to their benefit. Alternatively, a transfer pricing scheme that measuresopportunity cost less accurately but more objectively might produce a higher firm value thana transfer pricing scheme that more closely approximates opportunity costs.
Managers often have authority for external sourcing. The ability to buy/sell outside isan important control device on the transfer pricing scheme. No matter how the internaltransfer price is set, the ability to go outside limits the monopoly profits that can be earnedby one responsibility center at the expense of another.
Changing transfer-pricing methods does more than shift income among responsibilitycenters. The level of the firm’s output changes, as does firmwide profitability. The transferprice not only changes how the total profit pie is divided among responsibility centers; italso affects the size of the pie.
Finally, transfer pricing is more ubiquitous in organizations than many managers real-ize. Most organizations recharge inside users for information technology, telecommunica-tions, janitorial service, maintenance, and so forth. In effect, these recharge schemes, basedon cost allocations, are cost-based transfer prices. Since much of management accountingand cost accounting deals with cost allocations, many of the same issues that apply to trans-fer pricing also arise in later chapters.
198 Chapter 5
TABLE 5–5 Advantages and Disadvantages of Common Transfer Pricing Methods
Method Advantages Disadvantages
Market-based • Objective • Might not exist for specialty transfer prices • Less subject to manipulation items
• Often leads to correct long-run • Might not capture make/buy decisions interdependencies among
divisionsVariable-cost • Can approximate the • Does not allow the selling
transfer prices opportunity cost of division to recover its fixed transferring one more unit costs
• Gives the buying division • Variable cost might vary with incentive to purchase the correct outputnumber of units if selling • Selling division has incentive to division has excess capacity classify fixed costs as variable
costsFull-cost • Avoids disputes over which costs • Selling division can export its
transfer prices are fixed and which are variable inefficiencies to the buying • Simplicity division
• Buying division purchases too few units
Negotiated • Both selling and buying divisions • Time-consumingtransfer prices have incentives to transfer the • Depends on the relative
number of units that maximize negotiating skills of the two their combined profits divisions
Reorganize the • Eliminates costly disputes over • Reduces the benefits from having buying and selling transfer pricing two decentralized responsibility divisions centers
zim36725_ch05_170-228.qxd 12/15/09 12:40 PM Page 198

Responsibility Accounting and Transfer Pricing 199
Q5–7 What are the two main reasons for transfer pricing withinfirms?
Q5–8 Name four alternative methods for determining transferprices.
Q5–9 Is the choice of transfer pricing methods a zero-sum game?
C. SummaryBesides making operating decisions that involve pricing, marketing, and financing, managers mustalso ensure that employees perform tasks that add value to the firm. Chapter 4 described the generalagency problem and how the firm’s organizational architecture can provide incentives for self-interested employees to take value-adding actions. In particular, the organizational architecture, whichconsists of the three legs of the stool (the performance evaluation system, the performance reward sys-tem, and the partitioning of decision rights), helps align employees’ and owners’ interests. Accountingsystems are an integral part of the firm’s organizational architecture. This chapter described two cen-tral ways in which accounting systems are used: responsibility accounting and transfer pricing.
In responsibility accounting, decision rights within the firm are partitioned to cost, profit, andinvestment centers. Cost centers usually have decision rights over the mix of inputs used to producethe product or service. Cost centers are then evaluated based on the ability of the center to maximizeoutput for a given cost or to minimize cost for a predetermined amount of output. Profit centers havedecision rights over input mix and pricing and are evaluated based on profits. Investment centers haveall the decision rights of profit centers plus the rights over how much capital is invested in the center.They are evaluated based on either return on investment or residual income.
Accounting is also often used in transfer pricing. Whenever goods or services are transferredacross responsibility centers and the performance of these centers is measured, a transfer price for thetransferred item must be calculated. Market prices, cost-based transfer prices, or negotiated transferprices are used. Cost-based transfer prices include both variable costs and full costs (variable plusfixed costs). Each transfer pricing scheme has pros and cons that depend on the particular circum-stances of the firm. Hence, each firm must determine the transfer pricing scheme that is best for itssituation. In general, no transfer pricing scheme, just as no particular organizational architecture, isbest for all firms or even best for a single firm over time. In transfer pricing schemes, as in other in-ternal accounting methods, a trade-off exists between decision making and control. Transfer priceschemes that are best for decision making are not always the best for control and vice versa.
Chapter 6 describes another example of how accounting systems are used to reduce agencyproblems: budgeting systems.
Self-Study ProblemsSelf-Study Problem 1: Tam Burger
In the past five years, Tam Burger has expanded to more than 200 stores, 80 percent of which arefranchised. Two of the company-operated units, Northside and Southside, are among the fastest-growing stores. Both are considering expanding their menus to include pizza. Purchase and installa-tion of the necessary equipment costs $180,000 per store. The current investment in the Northsidestore totals $890,000. Store revenues are $1,100,500 and expenses are $924,420. Expansion of theNorthside’s menu should increase profits by $30,600. The current investment in the Southside storetotals $1,740,000. The store’s revenues are $1,760,800 and expenses are $1,496,680. Adding pizza toSouthside’s menu should increase its profits by $30,600.
Tam Burger evaluates its managers based on return on investment. Managers of individual storeshave decision rights over the pizza expansion.
ConceptQuestions
zim36725_ch05_170-228.qxd 12/15/09 12:40 PM Page 199

200 Chapter 5
Required:
a. Calculate the return on investment for both stores before pizza is added, for the pizzaproject only, and for the stores after expansion.
b. Assuming a 14 percent cost of capital, calculate residual income for both stores before andafter the potential expansion.
c. Will the Tam Burger stores choose to expand? How would the answer change if the storeswere franchised units?
Solution:
a. Return on investment before and after the pizza expansion:
Northside Southside
ROI before PizzaRevenue $1,100,500 $1,760,800Expenses 924,420 1,496,680
Net income $ 176,080 $ 264,120� Assets 890,000 1,740,000
ROI 19.78% 15.18%
ROI of Pizza OnlyIncreased profits from pizza $ 30,600 $ 30,600� Expansion cost 180,000 180,000
ROI of project 17.00% 17.00%
ROI after PizzaTotal income $ 206,680 $ 294,720� Total assets 1,070,000 1,920,000
Total ROI 19.32% 15.35%
b. Residual income before and after the pizza expansion:
Northside Southside
Cost of capital 14.00% 14.00%
Residual Income before PizzaNet income $176,080 $264,120Less: Assets � 14% (124,600) (243,600)
Residual income $ 51,480 $ 20,520
Residual Income of Pizza OnlyIncreased profits from pizza $ 30,600 $ 30,600Less: 14% � Expansion cost (25,200) (25,200)
Residual income $ 5,400 $ 5,400
Residual Income after PizzaNet income $206,680 $294,720Less: 14% � Assets (149,800) (268,800)
Residual income $ 56,880 $ 25,920
zim36725_ch05_170-228.qxd 12/15/09 12:40 PM Page 200

Responsibility Accounting and Transfer Pricing 201
c. The two units currently have different ROIs. The smaller Northside store is earning anROI of just under 20 percent, while the larger Southside store is earning an ROI of justover 15 percent. Since the project’s ROI is 17 percent, adding the project to the Northsidestore lowers its average ROI; adding the project to the Southside store raises its averageROI. The Northside manager will avoid adding pizza to the menu, since the store’s ROIwould drop as a result. The Southside manager, however, will want to add pizza since thestore’s ROI would subsequently rise.
If the stores were franchised units, both owners would definitely expand. The ROI ofthe project is higher than the cost of capital. This ensures a positive residual income for theproject. As long as the residual income is positive, any franchise owner would jump at theopportunity. Franchise owners would not care if the store’s ROI dropped as long as theresidual income increased.
Self-Study Problem 2: BioScience
Tomato beetles, a major pest to the tomato crop, are now being controlled by toxic pesticides. Thefirm BioScience invested $5 million in R&D over the last five years to produce a genetically engi-neered, patented microbe, MK-23, which controls tomato beetles in an environmentally safe way.BioScience built a plant with capacity to produce 10,000 pounds of MK-23 per month. The plant cost$12 million and has a 10-year life. MK-23 has a variable cost of $3 per pound. Fixed costs are$50,000 per month for such costs as plant management, insurance, taxes, and security. Plant depreci-ation is not included in the $50,000 fixed cost.
The following table summarizes the full cost of producing MK-23:
Depreciation per month ($12 million � 120 months) $100,000Other fixed costs 50,000
Total fixed costs $150,000� Capacity per month (pounds) 10,000
Fixed costs per unit of capacity (pound) $ 15.00Variable costs per pound 3.00
Full cost per pound $ 18.00
MK-23 is sold for $30 per pound. BioScience is currently selling 8,000 pounds per month totomato farmers.
Another division of BioScience, Home Life, wants to secure 1,000 pounds per month of MK-23that it will process further into a consumer product, Tomato Safe, for gardeners. Home Life is willingto pay an internal transfer price of $5 per pound. Home Life will incur an additional $4 of variablecost per pound of MK-23 in packaging and reducing the potency of MK-23 to make Tomato Safemore appropriate for home gardeners. Tomato Safe will sell for $20 per pound of MK-23.
Required:
a. Should the internal transfer be allowed?
b. What happens if the transfer price is set at full cost, $18? What happens if the transferprice is set at variable cost, $3?
c. After deciding to use variable cost as the transfer price, new farm orders for 2,000 pounds ofMK-23 at $30 per pound per month are received. Suppose plants come only in fixed sizes of10,000-pound capacities of $12 million each. Analyze the various options facing BioScience.
d. What is the opportunity cost of the excess capacity prior to producing MK-23 for Tomato Safe?
e. What happened to the $5 million R&D costs incurred to invent MK-23?
Solution:
a. The following table indicates that BioScience generates incremental cash flow of $13 forevery pound of MK-23 it transfers to Home Life to be converted to Tomato Safe, assumingit does not forgo selling this pound of MK-23 directly to farmers for $30 per pound.
zim36725_ch05_170-228.qxd 12/15/09 12:40 PM Page 201

Contribution Margins for MK-23 and Tomato Safe
MK-23 Tomato Safe
Selling price $30.00 $20.00Variable costs
Manufacturing MK-23 3.00 3.00Additional processing 4.00
Contribution margin $27.00 $13.00
Clearly, if BioScience has excess capacity of 2,000 pounds of MK-23 production permonth, then transferring 1,000 pounds of MK-23 enhances overall firm profits.
b. If a full-cost transfer price of $18 per pound is charged for MK-23, Home Life will notaccept the transfer because its total cost of $22 ($18 transfer price plus $4 for furtherprocessing) is above the market price of $20. If the firm has unused capacity, thentransferring at full cost causes it to forgo selling Tomato Safe and receiving $13 per poundfor its unused capacity. Transferring at variable cost ($3) allows Tomato Safe to beproduced. In the case where the firm has unused excess capacity, full-cost transfer pricingleads to the wrong decision.
If variable-cost transfer pricing is used, each month 1,000 pounds of MK-23 aretransferred to Home Life.
c. After receiving new farm orders for 2,000 pounds of MK-23, management has threeoptions. First, it can fill 1,000 pounds of the 2,000-pound order, because this is all thecapacity available after transferring 1,000 pounds to Home Life. Second, management cancancel the 1,000 pounds transferred for Tomato Safe and fill all 2,000 pounds of the newfarm order. Or third, management can build a new plant to increase capacity. Canceling the1,000-pound transfer to Home Life and using this production capacity to fill the new farmorders increases BioScience’s cash flows:
Contribution from new order 2,000 � $27 $54,000Contribution forgone from Tomato Safe 1,000 � $13 13,000
Additional contribution $41,000
Every additional pound of MK-23 sold to farmers instead of converted to Tomato Safecontributes $14 (or $27 � $13) to BioScience’s cash flows, assuming the firm does nothave enough capacity to meet demand in the farm market. The third option of addingcapacity to meet both farm and home demand is not profitable. Each pound, including newcapacity for MK-23, costs $18, and Tomato Safe cannot recover these costs. Therefore,full-cost transfer pricing includes the cost of adding additional capacity.
The managers of Home Life will object to canceling the internal transfer because theirdivisional profits will fall. They will most likely construct reasons that such a decision willadversely affect their other products. Undoing the decision to transfer MK-23 will requiresenior managers’ time and patience. Thus, influence costs are likely to be generated. Ingeneral, internal transfers tend to be permanent and difficult to change.
d. Prior to accepting the internal transfer of MK-23 to produce Tomato Safe, BioScience has2,000 pounds of unused capacity. If the demand for MK-23 is growing, then eitherconsuming this capacity with an internal transfer causes the firm to forgo the contributionmargin on lost sales of MK-23 or else the firm has to add capacity. The decision topermanently consume fixed capacity should not be based on the short-run incremental costof the transfer unless it is highly likely that the internal transfer is the only long-run use ofthe unused capacity. Full-cost transfer pricing includes an estimate of the cost of adding
202 Chapter 5
zim36725_ch05_170-228.qxd 12/15/09 12:40 PM Page 202

Responsibility Accounting and Transfer Pricing 203
capacity and reveals the past (historical) cost of a unit of capacity. A new unit of capacitywill cost more than historical cost if there has been construction cost inflation. However, aunit of capacity can cost less than the historic cost if adding a second plant createsproductivity enhancements or synergies.
e. These R & D costs were not included in the manufacturing costs of MK-23. Theaccounting system writes these costs off when incurred. The firm has an unrecordedbut real economic asset, the patent on MK-23. The profit of $12 per pound of MK-23($30 � $18) represents the firm’s return on this investment.
ProblemsP 5–1: Canadian Subsidiary
The following data summarize the operating performance of your company’s wholly owned Canadiansubsidiary for 2009 to 2011. The cost of capital for this subsidiary is 10 percent.
($000,000)
2009 2010 2011
Subsidiary net income $14.0 $14.3 $14.4Total assets in subsidiary 125 130 135Return on net investment* in subsidiary 20% 22% 24%
*Net investment is calculated as total assets less all liabilities.
Required:
Critically evaluate the performance of this subsidiary.
P 5–2: Phipps Electronics
Phipps manufactures circuit boards in Division Low in a country with a 30 percent income tax rateand transfers them to Division High in a country with a 40 percent income tax. An import duty of15 percent of the transfer price is paid on all imported products. The import duty is not deductible incomputing taxable income. The circuit boards’ full cost is $1,000 and variable cost is $700; they aresold by Division High for $1,200. The tax authorities in both countries allow firms to use either vari-able cost or full cost as the transfer price.
Required:
Analyze the effect of full-cost and variable-cost transfer pricing methods on Phipps’ cash flows.
P 5–3: Sunder Properties
Brighton Holdings owns private companies and hires professional managers to run its companies.One company in Brighton Holdings’ portfolio is Sunder Properties. Sunder owns and operates apart-ment complexes, and has the following operating statement.
SUNDER PROPERTIES(Last Fiscal Year)
(Millions)
Revenues $86.50Expenses* (72.30)Net income before taxes $14.20
*Includes interest expense of $2.6 million.
zim36725_ch05_170-228.qxd 12/15/09 12:40 PM Page 203
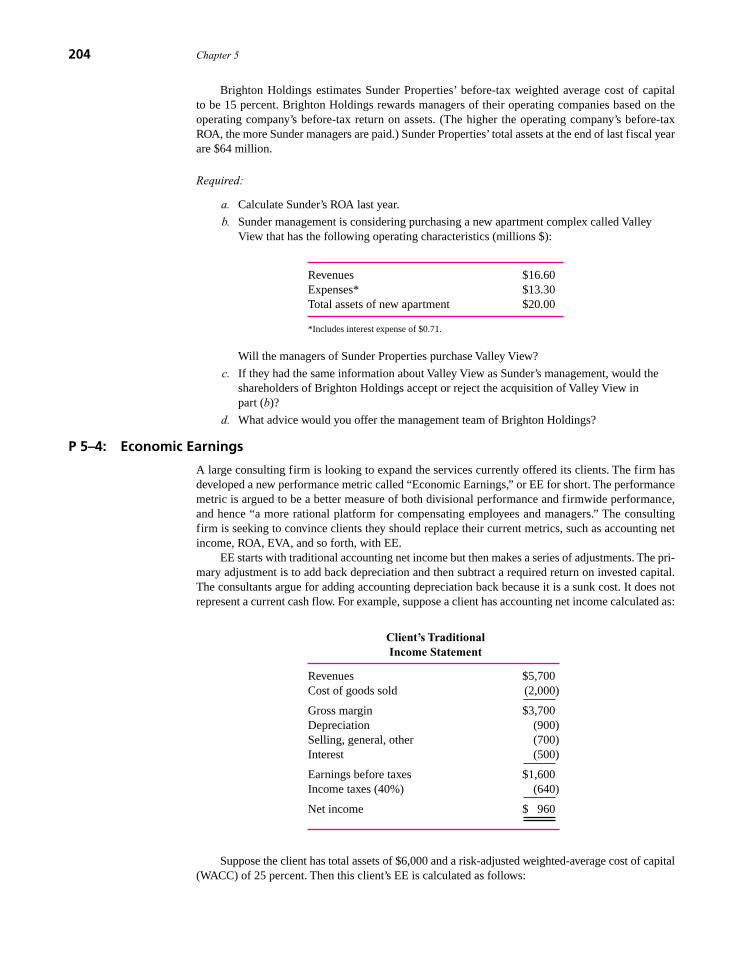
Brighton Holdings estimates Sunder Properties’ before-tax weighted average cost of capitalto be 15 percent. Brighton Holdings rewards managers of their operating companies based on theoperating company’s before-tax return on assets. (The higher the operating company’s before-taxROA, the more Sunder managers are paid.) Sunder Properties’ total assets at the end of last fiscal yearare $64 million.
Required:
a. Calculate Sunder’s ROA last year.
b. Sunder management is considering purchasing a new apartment complex called ValleyView that has the following operating characteristics (millions $):
Revenues $16.60Expenses* $13.30Total assets of new apartment $20.00
*Includes interest expense of $0.71.
Will the managers of Sunder Properties purchase Valley View?
c. If they had the same information about Valley View as Sunder’s management, would theshareholders of Brighton Holdings accept or reject the acquisition of Valley View inpart (b)?
d. What advice would you offer the management team of Brighton Holdings?
P 5–4: Economic Earnings
A large consulting firm is looking to expand the services currently offered its clients. The firm hasdeveloped a new performance metric called “Economic Earnings,” or EE for short. The performancemetric is argued to be a better measure of both divisional performance and firmwide performance,and hence “a more rational platform for compensating employees and managers.” The consultingfirm is seeking to convince clients they should replace their current metrics, such as accounting netincome, ROA, EVA, and so forth, with EE.
EE starts with traditional accounting net income but then makes a series of adjustments. The pri-mary adjustment is to add back depreciation and then subtract a required return on invested capital.The consultants argue for adding accounting depreciation back because it is a sunk cost. It does notrepresent a current cash flow. For example, suppose a client has accounting net income calculated as:
Client’s Traditional Income Statement
Revenues $5,700Cost of goods sold (2,000)
Gross margin $3,700Depreciation (900)Selling, general, other (700)Interest (500)
Earnings before taxes $1,600Income taxes (40%) (640)
Net income $ 960
Suppose the client has total assets of $6,000 and a risk-adjusted weighted-average cost of capital(WACC) of 25 percent. Then this client’s EE is calculated as follows:
204 Chapter 5
zim36725_ch05_170-228.qxd 12/15/09 12:40 PM Page 204
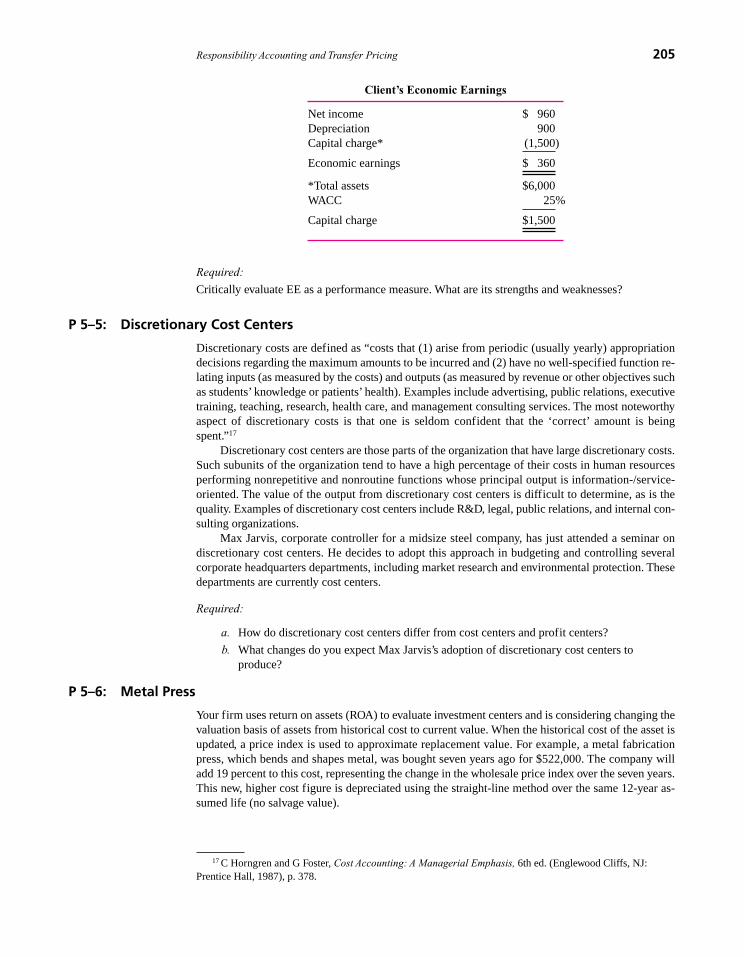
Responsibility Accounting and Transfer Pricing 205
Client’s Economic Earnings
Net income $ 960Depreciation 900Capital charge* (1,500)
Economic earnings $ 360
*Total assets $6,000WACC 25%
Capital charge $1,500
Required:
Critically evaluate EE as a performance measure. What are its strengths and weaknesses?
P 5–5: Discretionary Cost Centers
Discretionary costs are defined as “costs that (1) arise from periodic (usually yearly) appropriationdecisions regarding the maximum amounts to be incurred and (2) have no well-specified function re-lating inputs (as measured by the costs) and outputs (as measured by revenue or other objectives suchas students’ knowledge or patients’ health). Examples include advertising, public relations, executivetraining, teaching, research, health care, and management consulting services. The most noteworthyaspect of discretionary costs is that one is seldom confident that the ‘correct’ amount is beingspent.”17
Discretionary cost centers are those parts of the organization that have large discretionary costs.Such subunits of the organization tend to have a high percentage of their costs in human resourcesperforming nonrepetitive and nonroutine functions whose principal output is information-/service-oriented. The value of the output from discretionary cost centers is difficult to determine, as is thequality. Examples of discretionary cost centers include R&D, legal, public relations, and internal con-sulting organizations.
Max Jarvis, corporate controller for a midsize steel company, has just attended a seminar ondiscretionary cost centers. He decides to adopt this approach in budgeting and controlling severalcorporate headquarters departments, including market research and environmental protection. Thesedepartments are currently cost centers.
Required:
a. How do discretionary cost centers differ from cost centers and profit centers?
b. What changes do you expect Max Jarvis’s adoption of discretionary cost centers toproduce?
P 5–6: Metal Press
Your firm uses return on assets (ROA) to evaluate investment centers and is considering changing thevaluation basis of assets from historical cost to current value. When the historical cost of the asset isupdated, a price index is used to approximate replacement value. For example, a metal fabricationpress, which bends and shapes metal, was bought seven years ago for $522,000. The company willadd 19 percent to this cost, representing the change in the wholesale price index over the seven years.This new, higher cost figure is depreciated using the straight-line method over the same 12-year as-sumed life (no salvage value).
17 C Horngren and G Foster, Cost Accounting: A Managerial Emphasis, 6th ed. (Englewood Cliffs, NJ:Prentice Hall, 1987), p. 378.
zim36725_ch05_170-228.qxd 12/15/09 12:40 PM Page 205

Required:
a. Calculate depreciation expense and book value of the metal press under both historical costand price-level-adjusted historical cost.
b. In general, what is the effect on ROA of changing valuation bases from historical cost tocurrent values?
c. The manager of the investment center with the metal press is considering replacing itbecause it is becoming obsolete. Will the manager’s incentives to replace the metal presschange if the firm shifts from historical cost valuation to the proposed price-level-adjustedhistorical cost valuation?
P 5–7: ICB, Intl.
ICB has four manufacturing divisions, each producing a particular type of cosmetic or beauty aid.These products are then transferred to five marketing divisions, each covering a particular geographicregion. Manufacturing and marketing divisions are free to negotiate among themselves the transferprices for products transferred internally. The manufacturing division that produces all the hair careproducts wants a particular hair conditioner it developed and produces for Asian markets priced at fullcost plus a 5 percent profit markup, which amounts to $105 per case.
The South American marketing division believes it can sell this conditioner in South Americaafter redesigning the labels. However, most South American currencies have weakened against thedollar, putting further pressure on the prices of U.S.–produced products. The South Americanmarketing division estimates it can make money on the hair conditioner only if it can buy it frommanufacturing at $85 per case.
Manufacturing claims that it cannot make a profit at $85 per case. Moreover, the other ICBmarketing divisions that are paying around $105 per case will likely want to renegotiate the $105transfer price if South America marketing buys it for $85.
You work for the corporate controller of ICB, Intl. She has asked you to write a short, nontech-nical memo to her that spells out the key points she should consider in her upcoming meeting withthe two division heads regarding transfer pricing. You are not being asked to recommend a particulartransfer price, but rather to list the important issues the controller should be aware of for the meeting.
P 5–8: Shop and Save
Shop and Save (S&S) is a large grocery chain with 350 supermarkets. Twenty-eight S&S stores arelocated within the Detroit metropolitan region and serviced by the S&S Detroit Bakery, a large cen-tral bakery producing all of the fresh-baked goods (breads, rolls, donuts, cakes, and pies) sold in the28 individual S&S stores in the Detroit region. Besides selling S&S baked goods, the stores also sellother nationally branded commercial baked goods both in the baked goods section of the store and inthe frozen section as well. But all freshly baked items sold in the 28 S&S stores come from the S&SDetroit Bakery. Each store orders all the baked goods from the S&S Detroit Bakery the day before.The S&S Detroit Bakery also is a profit center and sells only to the 28 Detroit S&S stores. Each storepays the bakery 60 percent of the retail selling price. So, for example, if a store manager orders fromthe bakery a loaf of whole grain bread that has a retail price of $5.00, that store is charged $3.00(60% � $5.00) and the Detroit Bakery records revenues of $3.00.
Each store manager is evaluated and compensated as a profit center and has some decision rightsover the particular items stocked in each store. But roughly 85 percent of all SKUs (stock keepingunits) carried by each store and the retail price of each SKU are dictated centrally by the S&S DetroitRegional headquarters, which oversees both the 28 stores and the bakery. Each store manager hasdecision rights over the quantity of the various baked goods ordered from the S&S Detroit Bakery.The retail price of each freshly baked item produced by the S&S Detroit Bakery and sold in the gro-cery stores is set by the Detroit Regional headquarters, not the individual grocery stores or the S&SDetroit Bakery.
The manager of the Detroit Bakery complains that the reason her central bakery loses moneyis that the 60 percent rate is too low to cover her costs. The individual grocery store managers com-plain that the quality and variety of fresh baked goods they receive from the S&S Detroit Bakery arenot competitive with high-end private specialty bake shops in the Detroit area.
206 Chapter 5
zim36725_ch05_170-228.qxd 12/15/09 12:40 PM Page 206

Responsibility Accounting and Transfer Pricing 207
Required:
a. Evaluate the advantages and disadvantages of the S&S policy of each S&S grocery storepaying the S&S Detroit Bakery 60 percent of the retail price of the bakery item.
b. Suggest ways that S&S can improve the relationship between its grocery stores and itscentral bakery.
P 5–9: Microelectronics
Microelectronics is a large electronics firm with multiple divisions. The circuit board division man-ufactures circuit boards, which it sells externally and internally. The phone division assembles cellu-lar phones and sells them to external customers. Both divisions are evaluated as profit centers. Thefirm has the policy of transferring all internal products at market prices.
The selling price of cellular phones is $400, and the external market price for the cellular phonecircuit board is $200. The outlay cost for the phone division to complete a phone (not including thecost of the circuit board) is $250. The variable cost of the circuit board is $130.
Required:
a. Will the phone division purchase the circuit boards from the circuit board division? (Showcalculations.)
b. Suppose the circuit board division is currently manufacturing and selling externally 10,000circuit boards per month and has capacity to manufacture 15,000 boards. From thestandpoint of Microelectronics, should 3,000 additional boards be manufactured andtransferred internally?
c. Discuss what transfer price should be set for (b).
d. List the three most important assumptions underlying your analysis in (b) and (c).
P 5–10: US Copiers
US Copiers manufactures a full line of copiers including desktop models. The Small Copier Division(SCD) manufactures desktop copiers and sells them in the United States. A typical model has a retailprice of less than $500. An integral part in the copier is the toner cartridge that contains the blackpowder used to create the image on the paper. The toner cartridge can be used for about 10,000 pagesand must then be replaced. The typical owner of an SCD copier purchases four replacement car-tridges over the life of the copier.
SCD buys the initial toner cartridges provided with the copier from the Toner Division (TD) ofUS Copiers. TD sells subsequent replacement cartridges to distributors that sell them to U.S. retailstores. Toner cartridges sell to the end consumer for $50. TD sells the cartridges to distributors forabout 70 percent of the final retail price paid by the consumer. The Toner Division manager arguesthat the market price to TD of $35 (70% � $50) is the price SCD should pay to TD for each tonercartridge transferred.
Required:
a. Why does US Copiers manufacture both copiers and toner cartridges? Why don’t separatefirms specialize in either copiers or toner cartridges like Intel specializes in makingcomputer chips and Gateway specializes in assembling and selling PCs?
b. You work for the president of SCD. Write a memo to your boss identifying the salientissues she should raise in discussing the price SCD should pay TD for toner cartridgesincluded in SCD copiers.
P 5–11: Cogen
Cogen’s Turbine Division manufactures gas-powered turbines for generating electric power and hotwater for heating systems. Turbine’s variable cost per unit is $150,000 and its fixed cost is $1.8 mil-lion per month. It has excess capacity. Cogen’s Generator Division buys gas turbines from Cogen’sTurbine Division and incorporates them into electric steam generating units. Both divisional man-agers are evaluated and rewarded as profit centers.
zim36725_ch05_170-228.qxd 12/15/09 12:40 PM Page 207

The Generator Division has variable cost of $200,000 per completed unit, excluding the cost ofthe turbine, and fixed cost of $1.4 million per month. The Generator Division faces the followingmonthly demand schedule for its complete generating unit (turbine and generator):
Quantity Price ($000) Quantity Price ($000)
1 $1,000 5 $8002 950 6 7503 900 7 7004 850 8 650
Required:
a. If the transfer price of turbines is set at Turbine’s variable cost ($150,000), how manyturbines will the Generator Division purchase to maximize its profits?
b. The Turbine Division expects to sell a total of 20 turbines a month, which includes bothexternal and internal sales. Calculate the (average) full cost of a turbine (fixed cost plusvariable cost) at this level of sales.
c. If the transfer price of turbines is set at Turbine’s (average) full cost calculated in (b), howmany turbines will the Generator Division purchase?
d. Should Cogen use a variable-cost transfer price or a full-cost transfer price to transferturbines between the Turbine and Generator divisions? Why?
P 5–12: University Lab Testing
Joanna Wu manages the University Lab Testing department within the University Hospital. LabTesting, a profit center, performs most of the standard medical tests (such as blood tests) for otheruniversity clinical care units as well as for outside health care providers (independent hospitals, clin-ics, and physician groups). These outside health care providers are charged a price for each lab testusing a predetermined rate schedule. University Hospital health care providers reimburse UniversityLab Testing using a transfer price formula. Roughly 70 percent of all Lab Testing procedures are per-formed for University Hospital units and the remainder for outside health care providers. Other labtesting firms in the community perform many of the same tests as Lab Testing. Lab Testing operatesat about 85 percent capacity, on average. But when Lab Testing is operating at 100 percent of capac-ity it must refuse outside work and even sends some inside- (University Hospital–) generated speci-mens to other community testing labs.
A standard blood test (code Q796) performed by Lab Testing has the following cost structure:
Cost Structure for Q796
Variable CostsChemical & supplies $8.90Labor 13.15 $22.05
Fixed CostsEquipment $17.20Supervision & administration 2.05Occupancy 6.68 25.93
Total Cost $47.98
The predetermined rate paid by the outsiders (non–University Hospital health care providers) for thistest (Q796) is $68.90.
208 Chapter 5
zim36725_ch05_170-228.qxd 12/15/09 12:40 PM Page 208

Responsibility Accounting and Transfer Pricing 209
Required:
a. Suppose Lab Testing has excess capacity. What transfer price maximizes UniversityHospital’s profits?
b. Using the transfer price you chose in part (a), how much profit does Joanna Wu generate forher department if she performs one more Q796 test for an internal University Hospital user?
c. Suppose Lab Testing has no excess capacity. What transfer price maximizes UniversityHospital’s profits?
d. Using the transfer price you chose in part (c), how much profit does Joanna Wu generate forher department if she performs one more Q796 test for an internal University Hospital user?
e. What transfer pricing policy should University Hospital implement regarding otherUniversity Hospital clinical care units reimbursing Lab Testing for Q796 blood tests? Besure to describe the logic (and any administrative problems that you considered) underlyingyour proposed transfer pricing policy for Q796.
P 5–13: Beckett Automotive Group
Beckett is a large car dealership that sells several different automobile manufacturers new cars(Toyota, Ford, Lexus, and Subaru). Beckett also consists of a Pre-owned Cars Department and a largeservice department. Beckett is organized into three profit centers: New Cars, Pre-owned Cars, andService. Each profit center has a manager who is paid a fixed salary plus a bonus based on the netincome generated in his or her profit center.
When customers buy new cars, they first negotiate a price with a new car salesperson. Once theyhave agreed on a price for the new car, if the customer has a used car to trade in, the Pre-owned CarsDepartment manager gives the customer a price for the trade in. If the customer agrees with the trade-in price offered by Pre-owned Cars, the customer pays the difference between the price of the new carand the trade-in price.
Suppose a customer buys a new car for $47,000 that has a dealer cost of $46,200. The same cus-tomer receives and accepts $11,000 for the trade-in of her used car and pays the balance of $36,000in cash (ignoring taxes and license). In this case, New Cars shows a profit of $800 (before any com-mission to the salesperson). If the customer does not accept the trade-in value, she does not purchasethe new car from Beckett.
Once the deal is struck, the trade-in is then either sold by Pre-owned Cars to another customerat retail or is taken to auction where it is sold at wholesale. Continuing the above example, supposethe customer accepts $11,000 as the trade-in for her used car. The Pre-owned Cars Department cansell it on its used car lot for $15,000 at retail or sell it at auction for $12,000. If the trade-in is sold for$15,000, Pre-owned Cars would have a profit of $4,000 ($15,000 � $11,000). If it is sold at auction,Pre-owned Cars reports a profit of $1,000 ($12,000 � $11,000).
Required:
a. Describe some of the synergies that exist within Beckett. In other words, why does Beckettconsist of three departments (New Cars, Pre-owned Cars, and Service) as opposed to justselling new cars, or just selling used cars, or just providing service?
b. What potential conflicts of interest exist between the New Cars and Pre-owned Carsdepartment managers? For example, describe how in pursuing their own self-interest, themanager of New Cars or Pre-owned Cars will behave in a way that harms the othermanager.
c. Suggest two alternative mechanisms to reduce the conflicts of interest you described inpart (b).
P 5–14: Assembly and Parts Departments
A large corporation has a manufacturing division with 40 parts departments and 20 assembly depart-ments. The parts departments manufacture most of the parts for the products, and the assemblydepartments assemble the parts (some of which are purchased outside the firm) into final products.
zim36725_ch05_170-228.qxd 12/15/09 12:40 PM Page 209

About 70 percent of the manufacturing operation occurs in one geographic location, and the remain-der is in plants around the world. Several hundred different final products, some in very large unit vol-umes, are produced, involving thousands of different parts. The final products range from inexpensiveconsumer goods (selling price $50) to very expensive business products (selling price $500,000).
The marketing division forecasts sales six months in advance. These forecasts then become man-ufacturing’s production quotas. As soon as manufacturing produces the product, it is turned over tomarketing for either shipment or storage.
Manufacturing’s production quotas are “exploded” into parts requirements and the parts depart-ments begin producing parts for use by assembly. In order for assembly to meet its production quotaon final products, every part in the product must be on hand for assembly. Not having a spring cost-ing $0.0001 is just as costly to the assembly department as not having a motor costing $500; both shutdown the assembly line.
If a part is not available, the assembly department tries to assemble another product, often bycoercing a parts department to alter its schedule to produce parts for the alternative product assembly.
Assembly and parts departments are evaluated as cost centers. Parts departments are evaluatedon being able to produce parts cheaper than last year while meeting quality standards. They must alsomeet their production quotas and schedules. Parts departments that continually force assembly linesto shut down because of parts shortages impose significant costs on assembly lines. Assembly de-partments are evaluated based on (1) their labor costs to assemble products versus budgeted laborcosts and (2) their production quotas.
In order to minimize average costs, parts departments try to manufacture all the units of a par-ticular part required for a six-month period at once. The major discretionary fixed cost per part issetup time. That is, when the machine is being converted from producing one part to another, no out-put is produced. Setup time is often half a day. Therefore, to reduce average unit costs, parts are pro-duced in large lot sizes. As soon as parts are produced, they are sent to the assembly departments.Parts departments carry no inventories of final parts, only raw materials.
There is no transfer price for parts. There is no need for a transfer price because assembly andparts departments are evaluated as cost centers. One senior manager feels that considerable squabblingover transfer prices could be avoided by focusing on departmental costs that are under the control ofthe department managers. A modification is being proposed that would charge each department a hold-ing cost for inventory on hand (12 percent cost of inventory). That is, each assembly department cur-rently charged for its direct labor, overhead, and factory burden will also be charged 12 percent of allparts inventories. Assembly managers think this is unfair because they have no control over when andhow many parts the parts departments produce. Assembly departments would like to get all the partsfor one month’s assembly instead of having to hold a six-month inventory of parts.
The parts department managers argue that the inventory holding cost charged to assemblydepartments is fair because assembly departments are always screaming for more inventory as safetystocks to their assembly lines, and this inventory holding charge will force assembly departments tobear the costs they are imposing on the firm by demanding large inventories. Parts department man-agers argue that it is inefficient to produce in one-month lot sizes.
Required:
Critically evaluate the existing management control system. Describe the strengths and weaknessesof the current and proposed systems. What dysfunctional behaviors exist in the current and proposedsystems?
P 5–15: U.S. Pump Systems
U.S. Pump is a multidivisional firm that manufactures and installs chemical piping and pump sys-tems. The valve division makes a single standardized valve. The valve division and the installation di-vision are currently involved in a transfer pricing dispute. Last year, half of the valve division’s outputwas sold to the installation division for $40 and the remaining half was sold to outsiders for $60.
The existing transfer price has been set at $40 per pump through a process of negotiationbetween the two divisions, with the involvement of senior management. The installation division hasreceived a bid from an outside valve manufacturer to supply it with an equivalent valve for $35 each.
210 Chapter 5
zim36725_ch05_170-228.qxd 12/15/09 12:40 PM Page 210
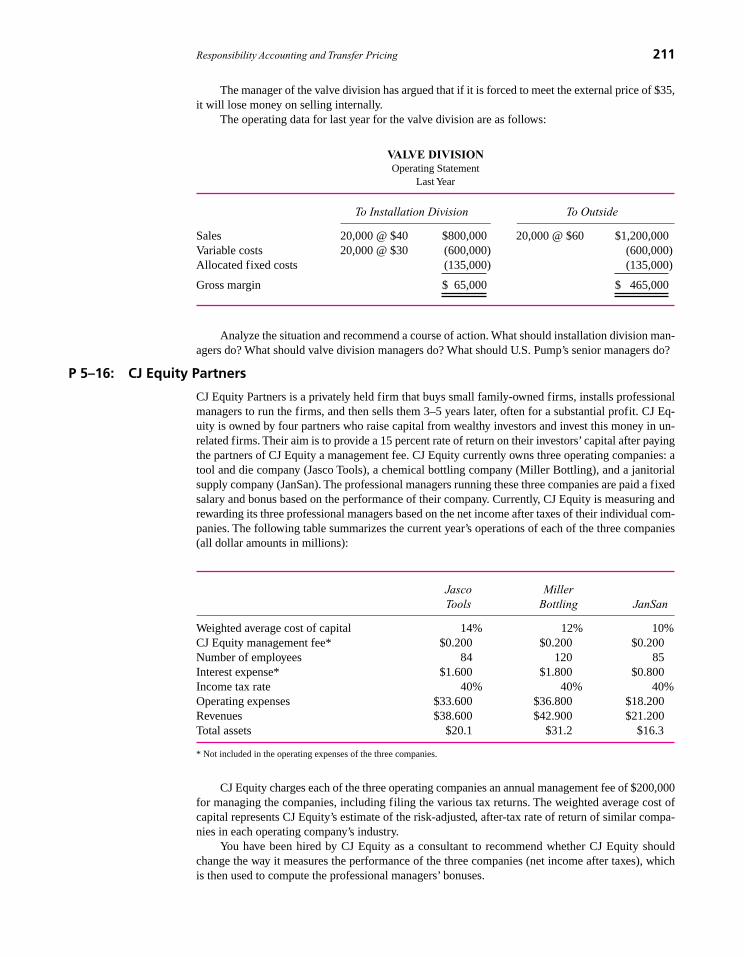
Responsibility Accounting and Transfer Pricing 211
The manager of the valve division has argued that if it is forced to meet the external price of $35,it will lose money on selling internally.
The operating data for last year for the valve division are as follows:
VALVE DIVISIONOperating Statement
Last Year
To Installation Division To Outside
Sales 20,000 @ $40 $800,000 20,000 @ $60 $1,200,000Variable costs 20,000 @ $30 (600,000) (600,000)Allocated fixed costs (135,000) (135,000)
Gross margin $ 65,000 $ 465,000
Analyze the situation and recommend a course of action. What should installation division man-agers do? What should valve division managers do? What should U.S. Pump’s senior managers do?
P 5–16: CJ Equity Partners
CJ Equity Partners is a privately held firm that buys small family-owned firms, installs professionalmanagers to run the firms, and then sells them 3–5 years later, often for a substantial profit. CJ Eq-uity is owned by four partners who raise capital from wealthy investors and invest this money in un-related firms. Their aim is to provide a 15 percent rate of return on their investors’ capital after payingthe partners of CJ Equity a management fee. CJ Equity currently owns three operating companies: atool and die company (Jasco Tools), a chemical bottling company (Miller Bottling), and a janitorialsupply company (JanSan). The professional managers running these three companies are paid a fixedsalary and bonus based on the performance of their company. Currently, CJ Equity is measuring andrewarding its three professional managers based on the net income after taxes of their individual com-panies. The following table summarizes the current year’s operations of each of the three companies(all dollar amounts in millions):
Jasco MillerTools Bottling JanSan
Weighted average cost of capital 14% 12% 10% CJ Equity management fee* $0.200 $0.200 $0.200Number of employees 84 120 85 Interest expense* $1.600 $1.800 $0.800Income tax rate 40% 40% 40%Operating expenses $33.600 $36.800 $18.200Revenues $38.600 $42.900 $21.200 Total assets $20.1 $31.2 $16.3
* Not included in the operating expenses of the three companies.
CJ Equity charges each of the three operating companies an annual management fee of $200,000for managing the companies, including filing the various tax returns. The weighted average cost ofcapital represents CJ Equity’s estimate of the risk-adjusted, after-tax rate of return of similar compa-nies in each operating company’s industry.
You have been hired by CJ Equity as a consultant to recommend whether CJ Equity shouldchange the way it measures the performance of the three companies (net income after taxes), whichis then used to compute the professional managers’ bonuses.
zim36725_ch05_170-228.qxd 12/15/09 12:40 PM Page 211

212 Chapter 5
Required:
a. Design and prepare a performance report for the three operating companies that youbelieve best measures each operating company’s performance and which will be used incomputing the three professional managers’ bonuses. In other words, using yourperformance measure, compute the performance of each of the three operatingcompanies.
b. Write a short memo explaining why you believe the performance measure you chose inpart (a) best measures the performance of the three professional managers.
P 5–17: Sunstar Appliances
Sunstar sells a full line of small home kitchen appliances, including toasters, coffee makers, blenders,and bread machines. It is organized into a marketing division and a manufacturing division. The man-ufacturing division is composed of several plants, each a cost center, making one type of appliance.The toaster plant makes several different models of toasters and toaster ovens. Most of the parts, suchas the heating elements and racks for each toaster, are purchased externally, but a few are manufac-tured in the plant, including the sheet metal forming the body of the toaster. The toaster plant has anumber of departments including sheet metal fabrication, purchasing, assembly, quality assurance,packaging, and shipping.
Each toaster model has a product manager who is responsible for manufacturing the product.Each product manager manages several similar models. Product managers, with the help of purchas-ing, negotiate prices and delivery schedules with external part vendors. Sunstar’s corporate head-quarters sets all the toaster models’ selling prices and quarterly production quotas to maximizeprofits. Product managers’ compensation and promotions are based on lowering unit costs and meet-ing corporate headquarters’ production quota.
The product manager sets production schedule quotas for the product and is responsible for en-suring that the distribution division of Sunstar has the appropriate number of toasters at each distrib-ution center. Product managers have discretion over outsourcing, production methods, and laborscheduling to manufacture the particular models under their control. For example, they do not haveto produce the exact number of toasters set by corporate headquarters quarterly, but rather productmanagers have some discretion to produce more or fewer toasters as long as the distribution centershave enough inventory to meet demand.
The following data were collected for one particular toaster oven, model CVP-6907. These dataare corporate forecasts for model CVP-6907 in regard to how prices and total manufacturing costs areexpected to vary with the number of toasters manufactured (and sold) per day.
MODEL CVP-6907Total Cost and Price
by Quantity
Quantity Manufacturing Cost Price
100 $1,450 $120105 1,496 116110 1,545 112115 1,596 108120 1,650 104125 1,706 100130 1,765 96135 1,826 92140 1,890 88145 1,956 84150 2,025 80
zim36725_ch05_170-228.qxd 12/15/09 12:40 PM Page 212

Responsibility Accounting and Transfer Pricing 213
In addition to the manufacturing costs reported in the table, there are $10 of variable selling anddistribution costs per toaster.
Required:
a. What daily production quantity would you expect the product manager for model CVP-6907 to set? Why?
b. Evaluate Sunstar’s performance evaluation system as it pertains to product managers. Whatbehavior does it likely create among manufacturing product managers?
c. Describe the changes you would recommend Sunstar consider making in its performanceevaluation system for manufacturing product managers.
P 5–18: Stale-Mart
Joan Chris is the Denver district manager of Stale-Mart, an old established chain of more than 100department stores. Her district contains eight stores in the Denver metropolitan area. One of herstores, the Broadway store, is over 30 years old. Chris began working at the Broadway store as anassistant buyer when the store first opened, and she has fond memories of the store. The Broadwaystore remains profitable, in part because it is mostly fully depreciated, even though it is small, is in alocation that is not seeing rising property values, and has had falling sales volume.
Stale-Mart owns neither the land nor the buildings that house its stores but rather leases themfrom developers. Lease payments are included in “operating income before depreciation.” Each storerequires substantial leasehold improvements for interior decoration, display cases, and equipment.These expenditures are capitalized and depreciated as fixed assets by Stale-Mart. Leasehold im-provements are depreciated using accelerated methods with estimated lives substantially shorter thanthe economic life of the store.
All eight stores report to Chris, and like all Stale-Mart district managers, 50 percent of her com-pensation is a bonus based on the average return on investment of the eight stores (total profits fromthe eight stores divided by the total eight-store investment). Investment in each store is the sum ofinventories, receivables, and leasehold improvements, net of accumulated depreciation.
She is considering a proposal to open a store in the new upscale Horse Falls Mall three milesfrom the Broadway store. If the Horse Falls proposal is accepted, the Broadway store will be closed.Here are data for the two stores (in millions of dollars):
Broadway Horse Falls (Actual) (Forecast)
Average inventories and receivables during the year $2.100 $2.900Leasehold improvements, net of accumulated
depreciation 0.900 4.600Operating income before depreciation 1.050 3.300Depreciation of leasehold improvements 0.210 1.425
Assume that the forecasts for Horse Falls are accurate. Also assume that the Broadway store dataare likely to persist for the next four years with little variation.
Stale-Mart finds itself losing market share to newer chains that have opened stores in growthareas of the cities in which they operate. The rate of return on Stale-Mart stock lags that of other firmsin the retail department store industry. Its cost of capital is 20 percent.
Required:
a. Calculate the return on total investment and residual income for the Broadway and HorseFalls stores.
zim36725_ch05_170-228.qxd 12/15/09 12:40 PM Page 213

214 Chapter 5
b. Chris expects to retire in five years. Do you expect her to accept the proposal to open theHorse Falls store and close the Broadway store? Explain why.
c. Offer a plausible hypothesis supported by facts in the problem that explains why Stale-Mart is losing market share and also explains the poor relative performance of its stockprice. What changes at Stale-Mart would you suggest to correct the problem?
P 5–19: R&D Inc.
R&D Inc. has the following financial data for the current year (millions):
Earnings before R&D expenditures $21.5Interest expense $0.0R&D expenditures $6.0Total invested capital (excluding R&D assets) $100.0Weighted average cost of capital 14%
Assume the tax rate is zero.
Required:
a. R&D Inc. writes off R&D expenditures as an operating expense. Calculate R&D Inc.’sEVA for the current year.
b. R&D Inc. decides to capitalize R&D and amortize it over three years. R&D expendituresfor the last three years have been $6.0 million per year. Calculate R&D Inc.’s EVA for thecurrent year after capitalizing the current year and previous years’ R&D and amortizing thecapitalized R&D balance.
c. In the specific case of R&D Inc., how does capitalizing and amortizing R&D expendituresinstead of expensing R&D affect the incentive for managers approaching retirement tounderspend on R&D at R&D Inc.
P 5–20: Flat Images
Flat Images develops and manufactures large, state-of-the-art flat-panel television screens that con-sumer electronic companies purchase and incorporate into a complete TV unit by adding the case,mounting brackets, tuner, amplifier, other electronics, and speakers. Flat Images has just introduceda new high-resolution, high-definition 60-inch screen. Flat Images is composed of two profit centers:Manufacturing and Marketing. Manufacturing produces sets that are sold internally to Marketing.Each profit center has the following cost structure:
Manufacturing Marketing
Fixed cost (per month) $300,000 $150,000Variable cost per screen $800 $200
Note that Marketing’s fixed cost of $150,000 and variable cost of $200 per screen do not contain anytransfer price from Manufacturing. The numbers in the preceding table consist only of their owncosts, not any costs transferred from the other department.
The selling price that Marketing receives for each 60-inch screen depends on the number ofscreens sold that month, according to the following table:18
18 An equivalent way to express the price-quantity relation in the table is P = $9,000 – 20Q, where P = priceand Q = quantity.
zim36725_ch05_170-228.qxd 12/15/09 12:40 PM Page 214
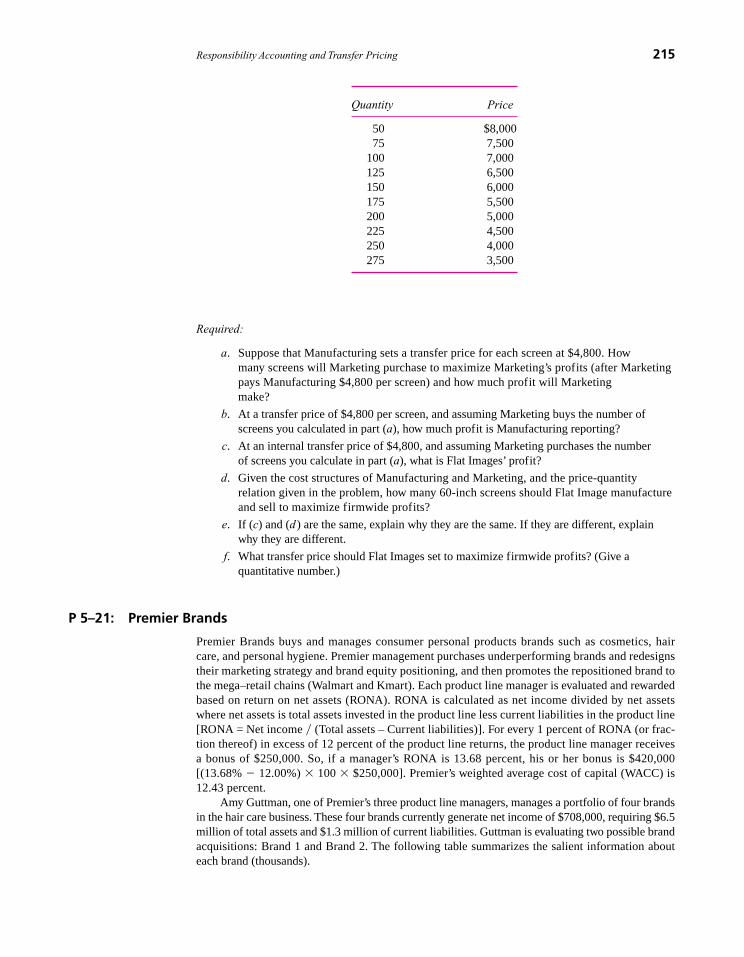
Responsibility Accounting and Transfer Pricing 215
Required:
a. Suppose that Manufacturing sets a transfer price for each screen at $4,800. How many screens will Marketing purchase to maximize Marketing’s profits (after Marketingpays Manufacturing $4,800 per screen) and how much profit will Marketing make?
b. At a transfer price of $4,800 per screen, and assuming Marketing buys the number ofscreens you calculated in part (a), how much profit is Manufacturing reporting?
c. At an internal transfer price of $4,800, and assuming Marketing purchases the number of screens you calculate in part (a), what is Flat Images’ profit?
d. Given the cost structures of Manufacturing and Marketing, and the price-quantityrelation given in the problem, how many 60-inch screens should Flat Image manufactureand sell to maximize firmwide profits?
e. If (c) and (d) are the same, explain why they are the same. If they are different, explainwhy they are different.
f. What transfer price should Flat Images set to maximize firmwide profits? (Give aquantitative number.)
P 5–21: Premier Brands
Premier Brands buys and manages consumer personal products brands such as cosmetics, haircare, and personal hygiene. Premier management purchases underperforming brands and redesignstheir marketing strategy and brand equity positioning, and then promotes the repositioned brand tothe mega–retail chains (Walmart and Kmart). Each product line manager is evaluated and rewardedbased on return on net assets (RONA). RONA is calculated as net income divided by net assetswhere net assets is total assets invested in the product line less current liabilities in the product line[RONA = Net income � (Total assets – Current liabilities)]. For every 1 percent of RONA (or frac-tion thereof) in excess of 12 percent of the product line returns, the product line manager receivesa bonus of $250,000. So, if a manager’s RONA is 13.68 percent, his or her bonus is $420,000[(13.68% � 12.00%) � 100 � $250,000]. Premier’s weighted average cost of capital (WACC) is12.43 percent.
Amy Guttman, one of Premier’s three product line managers, manages a portfolio of four brandsin the hair care business. These four brands currently generate net income of $708,000, requiring $6.5million of total assets and $1.3 million of current liabilities. Guttman is evaluating two possible brandacquisitions: Brand 1 and Brand 2. The following table summarizes the salient information abouteach brand (thousands).
Quantity Price
50 $8,00075 7,500
100 7,000125 6,500150 6,000175 5,500200 5,000225 4,500250 4,000275 3,500
zim36725_ch05_170-228.qxd 12/15/09 12:40 PM Page 215

Brand 1 Brand 2
Current liabilities $ 82 $ 498Net assets 522 1,546Net income 67 228Total assets 604 2,044
Required:
a. Given Premier’s incentive plan, will Amy Guttman acquire Brand 1 and/or Brand 2, orneither? Justify your answer with supporting calculations.
b. Suppose that Premier’s WACC is 15.22 percent instead of 12.43 percent, and the bonussystem remains as described in the problem. How do Amy’s decisions in part (a) change?Explain your answer.
c. Given the facts as stated in the problem, if you were the sole owner of Premier Products,would you acquire Brand 1 and/or Brand 2, or neither? Justify your answer with supportingcalculations.
d. Given the facts as stated in the problem except that Premier’s WACC is 15.22 percentinstead of 12.43 percent, if you were the sole owner of Premier Products, would you acquireBrand 1 and/or Brand 2, or neither? Justify your answer with supporting calculations.
e. Why do some companies use RONA instead of ROA (net income/total assets)? In otherwords, describe how the incentives generated by using RONA differ from the incentivesfrom using ROA.
P 5–22: Hochstedt
Hochstedt is a German firm with a wholly owned U.S. subsidiary. The parent firm manufactures andexports products from Germany to its U.S. subsidiary for sale in the United States. Hochstedt also haswholly owned subsidiaries in 14 other countries. The firm has a 35 percent cost of capital requirementon its foreign subsidiaries. Hochstedt invested $5.8 million in the U.S. operation three years ago. Theinvestment consisted of land, buildings, equipment, and working capital. Today, the book value of theinvestment (original cost less accumulated depreciation) is $6 million. Here is the balance sheet forthe U.S. subsidiary:
HOCHSTEDT U.S. SUBSIDIARYBalance Sheet
Current Year (Millions)
Current assets $0.5
Buildings and equipment Equity of parent $6.0Cost $3.0Accumulated depreciation 0.6 2.4
Land 3.1
Total assets $6.0 Total equity $6.0
Current investment in U.S. subsidiary stated in euros at the exchange rate at the time of the investment of 1.4 euros per dollar($6 � 1.4€/$) €8.4
When it started the U.S. operation, Hochstedt invested 8.12 million ($5.8 � 1.4) euros when theexchange rate was 1.4 euros per U.S. dollar ($1 � €1.4). The exchange rate over the current year hasbeen constant at $1 � €1.57.
This table summarizes the operations of the U.S. subsidiary for the current calendar year:
216 Chapter 5
zim36725_ch05_170-228.qxd 12/15/09 12:40 PM Page 216

Responsibility Accounting and Transfer Pricing 217
HOCHSTEDT U.S. SUBSIDIARYCurrent-Year Operations
U.S. sales $14 millionU.S. expenses (including depreciation) $ 8 millionImports from parent sold in the year €6.2 million
The U.S. subsidiary imported from the parent €6.2 million of product that it sold for $14 million. Itincurred expenses in the United States of $8 million. Ignore taxes.
Required:
a. Senior management of Hochstedt are interested in comparing the profitability of itsvarious foreign wholly owned subsidiaries. Prepare a performance report for the U.S.subsidiary for the current year.
b. List and discuss some of the issues that management must address in designing a measureof performance for its foreign subsidiaries.
P 5–23: Savannah Products
Savannah Products, a small integrated wood and lumber products company with substantial timberholdings, has two divisions: Forest and Lumber. Forest Division manages the timber holdings, main-tains the land, and plants and harvests trees. It acquired its various forests over the last 50 years; itstotal asset value as stated on Savannah’s balance sheet is $2.2 billion. Most of the timber the ForestDivision harvests is sold internally to the Lumber Division. Any harvested timber not sold to theLumber Division can be sold externally. Last year, the Forest Division sold 200 million board feet oftimber to external customers at $4.50 per board foot. A board foot is a standard unit of measure in thetimber business. Forest Division sold another 800 million board feet of timber to the Lumber Divi-sion. The Forest Division’s operating expenses last year totaled $2 billion.
The Lumber Division only purchases timber from the Forest Division. The purchase price iscomputed as Lumber’s share of Forest’s operating expenses where the share is based on Lumber’sfraction of Forest’s total board feet harvested. Lumber takes the timber from Forest, cuts it intolumber, and sells it to distributors. Lumber’s total revenues, other operating expenses, and assets are$7.6 billion, $3.5 billion, and $2.7 billion, respectively. Lumber’s operating expenses of $3.5 billiondo not include its pro rata share of Forest’s operating expenses.
Savannah Products uses economic value added (EVA) to evaluate and reward the performanceof the senior managers in the two divisions. The risk-adjusted weighted-average cost of capital for theForest and Lumber Divisions is 15 percent and 20 percent, respectively.
Required:
a. Calculate the EVA of the Forest and Lumber Divisions.
b. Based on your calculations in (a), identify the most profitable division.
c. Do the calculations in (a) correctly identify the most profitable division? Explain why orwhy not.
d. What changes would you recommend Savannah Products make in its performancemeasurement scheme?
P 5-24: Transfer Price Company
The Transfer Price Company has two divisions (Intermediate and Final) that report to the corporateoffice (Corporate). The two divisions are profit centers. Intermediate produces a proprietary product(called “intermed”) that it sells both inside the firm to Final and outside the firm. Final can only pur-chase intermed from Intermediate because Intermediate holds the patent to manufacture intermed.Intermed’s variable cost is $15 per unit, and Intermediate has excess capacity in the sense that it cansatisfy demand from both its outside customers and Final. Final buys one intermed from Intermediate,
zim36725_ch05_170-228.qxd 12/15/09 12:40 PM Page 217

(The demand schedule above can be represented algebraically as: P = $500 – 20Q)
Required:
a. Calculate the quantity-price combination of final that maximizes firm value. In otherwords, if Corporate knew the variable costs of the two divisions, for what price would theysell final, and how many units of intermed would Corporate tell Intermediate to produceand transfer to Final?
b. Assume that the managers in Corporate do not know the variable costs in the two divisions.Intermediate has the decision rights to set the transfer price of intermed to Final. Intermediateknows Final’s variable cost of $5 and the demand schedule Final faces for selling final to itscustomers. Intermediate, therefore, knows that the following schedule explains how manyunits of intermed Final will purchase given the transfer price Intermediate sets:
218 Chapter 5
Quantity Price
4 $4205 4006 3807 3608 3409 320
10 30011 28012 26013 240
Quantity ofintermed
Transfer PurchasedPrice by Final
$220 7230 7240 6250 6260 6270 6280 5290 5
In other words, if Intermediate sets a transfer price of $260, Final will purchase six units ofintermed and produce 6 units of final. Given the above schedule of possible transfer prices thatIntermediate can choose, what transfer price will Intermediate set to maximize its profits?
c. While Corporate does not know intermed’s variable cost, it does know that the total cost ofintermed is $48 per unit. This $48 per unit cost consists of both the variable costs tomanufacture intermed plus the allocated fixed manufacturing costs. Intermediate allocatesall its fixed costs over all the products it produces, including intermed. If Corporate setsthe transfer price of intermed at $48, how many units of intermed will Final purchase?
incurs an additional variable cost of $5 per unit, and sells the product (called “final”) to external con-sumers. Final faces the following demand schedule for final.
zim36725_ch05_170-228.qxd 12/16/09 8:55 AM Page 218
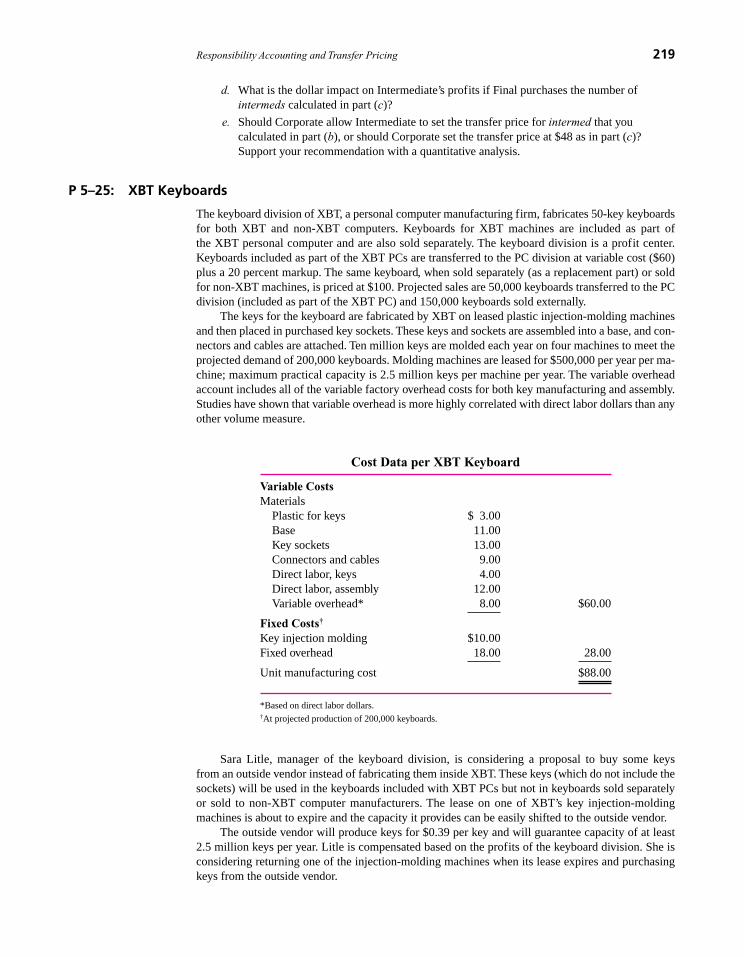
Responsibility Accounting and Transfer Pricing 219
d. What is the dollar impact on Intermediate’s profits if Final purchases the number ofintermeds calculated in part (c)?
e. Should Corporate allow Intermediate to set the transfer price for intermed that youcalculated in part (b), or should Corporate set the transfer price at $48 as in part (c)?Support your recommendation with a quantitative analysis.
P 5–25: XBT Keyboards
The keyboard division of XBT, a personal computer manufacturing firm, fabricates 50-key keyboardsfor both XBT and non-XBT computers. Keyboards for XBT machines are included as part ofthe XBT personal computer and are also sold separately. The keyboard division is a profit center.Keyboards included as part of the XBT PCs are transferred to the PC division at variable cost ($60)plus a 20 percent markup. The same keyboard, when sold separately (as a replacement part) or soldfor non-XBT machines, is priced at $100. Projected sales are 50,000 keyboards transferred to the PCdivision (included as part of the XBT PC) and 150,000 keyboards sold externally.
The keys for the keyboard are fabricated by XBT on leased plastic injection-molding machinesand then placed in purchased key sockets. These keys and sockets are assembled into a base, and con-nectors and cables are attached. Ten million keys are molded each year on four machines to meet theprojected demand of 200,000 keyboards. Molding machines are leased for $500,000 per year per ma-chine; maximum practical capacity is 2.5 million keys per machine per year. The variable overheadaccount includes all of the variable factory overhead costs for both key manufacturing and assembly.Studies have shown that variable overhead is more highly correlated with direct labor dollars than anyother volume measure.
Cost Data per XBT Keyboard
Variable CostsMaterials
Plastic for keys $ 3.00Base 11.00Key sockets 13.00Connectors and cables 9.00Direct labor, keys 4.00Direct labor, assembly 12.00Variable overhead* 8.00 $60.00
Fixed Costs†
Key injection molding $10.00Fixed overhead 18.00 28.00
Unit manufacturing cost $88.00
*Based on direct labor dollars.†At projected production of 200,000 keyboards.
Sara Litle, manager of the keyboard division, is considering a proposal to buy some keysfrom an outside vendor instead of fabricating them inside XBT. These keys (which do not include thesockets) will be used in the keyboards included with XBT PCs but not in keyboards sold separatelyor sold to non-XBT computer manufacturers. The lease on one of XBT’s key injection-moldingmachines is about to expire and the capacity it provides can be easily shifted to the outside vendor.
The outside vendor will produce keys for $0.39 per key and will guarantee capacity of at least2.5 million keys per year. Litle is compensated based on the profits of the keyboard division. She isconsidering returning one of the injection-molding machines when its lease expires and purchasingkeys from the outside vendor.
zim36725_ch05_170-228.qxd 12/16/09 8:55 AM Page 219

Required:
a. How much will XBT save per key if it outsources the 2.5 million keys rather thanproducing them internally?
b. What decision do you expect Sara Litle to make? Explain why.
c. If you were a large shareholder of XBT and knew all the facts, would you make the samedecision as Litle? Explain.
d. What changes in XBT’s accounting system and/or organizational structure would yousuggest, given the facts of the case? Explain why.
P 5–26: Infantino Saab
Infantino Saab is a car dealership that has been in business for 40 years at the same 20-acre locationselling and servicing new and “pre-owned” (used) Saabs. Two years ago Infantino Saab replaced itsaging showroom and service center with a new, state-of-the-art facility. When Ms. Infantino’s fatherstarted the dealership, the business was on the outskirts of town. Now with city sprawl, the dealershipis located on a busy commercial street surrounded by other dealerships, restaurants, and shoppingcenters.
The market for new cars is very competitive because many buyers shop on the Internet beforevisiting new car dealers. Once customers decide to purchase a new car from a dealer, they usuallytrade in their used car to avoid the hassle of selling the car themselves, and hence these new car buy-ers are willing to accept lower prices from car dealers for their trade-ins. Also, pre-owned cars havehigher margins because there is less competition for used cars, as each used car differs in terms ofmileage, condition, and options. Suppose a new car is sold for $45,000 ($500 over dealer cost) andthe buyer receives a trade-in allowance on his old car of $8,000 and pays the difference in cash. Thatused car is then sold for $10,800. The dealer makes $500 on the new car and $2,800 on the used car.Infantino also offers parts and service for the new and pre-owned cars it sells.
Infantino Saab is organized into three departments: New Cars, Pre-owned Cars, and Service. Allthree share the same building and lot where the new and used cars are displayed. Ms. Infantino com-pensates her three department heads based on residual income. After careful analysis by her financialmanager, they determine that all three departments should be charged for the capital invested in theirdepartments at 16 percent.
The new building cost $12 million and the land cost $900,000. The following table summarizesthe land and building utilization by each department, each department’s net income, and other netassets invested in each department:
Pre-owned Parts & New Cars Cars Service Total
Percent of land 50% 40% 10% 100%Percent of building 30% 10% 60% 100%Department Income $600,000 $1,725,000 $1,813,000 $4,138,000 Other net assets $2,500,000 $6,700,000 $1,300,000 $10,500,000
For example, the new car department occupies 50 percent of the land and 30 percent of the building. Ithad net income of $600,000 and other net assets of $2,500,000. Other net assets consist of all invento-ries and receivables (net of external financing) invested in the department. For example, the new cardepartment has a substantial inventory of new cars. But this new car inventory is mostly financed byshort-term bank loans. The new car department pays interest on these loans, which is deducted (andhence included) in the new car department’s net income of $600,000. Each department’s income con-sists of all revenues and expenses directly traceable to that department, including interest on any debtused to finance the department’s inventory. Income taxes are not included in each department’s net in-come reported in the table. Infantino Saab uses the trade-in allowance of used cars taken in trade as thetransfer price of used cars in calculating the net incomes of the new and pre-owned car departments.
220 Chapter 5
zim36725_ch05_170-228.qxd 12/15/09 12:40 PM Page 220

Required:
a. Calculate the residual income of each of the three divisions of Infantino Saab.
b. Discuss the relative profitability of the three departments. Which is making the mostmoney and which is making the least amount of money?
c. Discuss whether the residual incomes of the three departments capture the true profitabilityof each department. What problems do you see in the way Ms. Infantino is evaluating theperformance of the three department managers and of Infantino Saab as a whole?
P 5–27: Wujo
Wujo is a Shanghai company that designs high-end software to enhance and edit digital images. Its soft-ware, EzPhoto, is more powerful and easier to use than Adobe Photoshop, but sells at a much lower price.Currently, EzPhoto is written in Chinese for the Chinese market, but Wujo is entering the English-speak-ing market. This requires a substantial investment to convert EzPhoto to English. Wujo has established aU.K. wholly owned subsidiary (Wujo U.K., or WUK for short) to sell EzPhoto to North American andEuropean consumers—professional and serious amateur photographers. The following table displays thevarious combinations of prices and quantities it expects to sell EzPhoto to English-speaking users:
Price Quantity(euros) (000)
270 130265 135260 140255 145250 150245 155240 160235 165230 170225 175
For example, at a price of €270 it expects to sell 130,000 units of EzPhoto, or at €225 it can sell175,000 units. To enter this market WUK must spend €15 million to convert EzPhoto from Chineseto English, advertise EzPhoto, establish a Web site where purchasers can download EzPhoto, and hirean administrative staff to market and maintain the Web site. For each English version of EzPhoto sold,WUK expects to incur costs of €70 for sales commissions paid to third parties who market EzPhoto(e.g., Amazon, ZDNet.com, and Buy.com) and technical support for customers purchasing EzPhoto.EzPhoto will be distributed only via the WUK Web site. There are no packaging or CD-ROM costs.
WUK is evaluated and its managers compensated based on reported WUK profits. Wujo China,the parent company, is considering charging WUK a transfer price (actually a royalty) for each unitof EzPhoto WUK sells.
Required:
a. If Wujo China does not charge WUK a royalty for each unit of EzPhoto WUK sells(i.e., the transfer price is zero), what price-quantity combination will WUK select andhow much profit will WUK make?
b. If Wujo China charges WUK a royalty of €50 for each unit of EzPhoto WUK sells (i.e., thetransfer price is €50), what price-quantity combination will WUK select and how muchprofit will WUK make?
c. Ignoring any income taxes, what is the firm-value maximizing royalty (either zero euros or€50) that Wujo should charge WUK for each unit of EzPhoto WUK sells? Explain youranswer.
Responsibility Accounting and Transfer Pricing 221
zim36725_ch05_170-228.qxd 12/15/09 12:40 PM Page 221

d. Wujo (the parent) has to pay income taxes to the People’s Republic of China (PRC) at therate of 15 percent on any royalty payments it receives from WUK, while WUK faces aU.K. tax rate of 33 percent on profits of EzPhoto. Note that WUK’s taxable income iscalculated after deducting any transfer price (royalties) paid to Wujo. What is the firm-value maximizing royalty (either zero euros or €50) that Wujo should charge WUK foreach unit of EzPhoto WUK sells? Whichever transfer price Wujo charges WUK (zero or€50), that transfer price is used to (1) measure and reward WUK managers, and (2)calculate income taxes in the PRC and the U.K. Provide a detailed explanation supportedby calculations justifying your answer.
e. Suppose that Wujo is able to use a different transfer price for determining WUK’s profits(and hence the compensation paid to WUK management) than it uses for calculatingincome taxes on its PRC and U.K. tax returns. What transfer prices should Wujo use forcalculating WUK’s net income in determining WUK’s managers’ bonuses and for use onits two tax returns? The same transfer price has to be used on the two tax returns, but thistransfer price need not be the same transfer price used for calculating WUK’s income formanagement bonuses.
f. Why might you expect Wujo will be unable to implement the two transfer prices youpropose in (e)?
P 5–28: Serviflow
Serviflow manufactures products that move and measure various fluids, ranging from water to high-viscosity polymers, corrosive or abrasive chemicals, toxic substances, and other difficult pumpingmedia. The Supply Division, a profit center, manufactures all products for the various marketingdivisions, which also are profit centers. One of the marketing divisions, the Natural Gas MarketingDivision (NGMD), designed and sells a liquid natural gas pressure regulating valve, NGM4010,which the Supply Division manufactures.
To produce one NGM4010, the Supply Division incurs a variable cost of $6, and NGMDincurs a variable cost of $14. The $6 and $14 variable costs per unit of NGM4010 are constant anddo not vary with the number of units produced or sold. While both the Supply Division and NGMDhave substantial fixed costs, for the purpose of this question, assume both divisions’ fixed costs arezero.
The following table depicts how the price of the NGM4010 to outside customers varies with thenumber of units sold each week. (That is, the external customers’ weekly demand curve forNGM4010 is given by the following formula: P = 1000 – 10Q, where P is the final selling price andQ is the total number of units sold each week.)
Quantity Price Paid Purchased per Unit by the
by the External ExternalCustomer Customer
20 $80022 78024.5 75526 74030 70040 60045 55049 51050 50060 400
222 Chapter 5
zim36725_ch05_170-228.qxd 12/15/09 12:40 PM Page 222

Required:
a. If the senior managers in the corporate headquarters of Serviflow knew all the relevantinformation (the variable costs in the Supply Division and NGMD and the market demandcurve for NGM4010), what profit maximizing final price would they set for NGM4010and how many units would they tell the Supply Division to produce and NGMD to selleach week?
b. How much total profit does Serviflow generate each week based on the profit maximizingprice-quantity decision made in part (a)?
c. Assume that Serviflow senior managers do not know all the relevant information to choosethe profit maximizing price-quantity decision for NGM4010. Instead, they assign thedecision rights to set the transfer price to the Supply Division. Assume the Supply Divisionknows how many units of NGM4010 NGMD will purchase as a function of the transferprice. The following table shows how NGMD’s purchase decision of NGM4010 dependson the transfer price set by the Supply Division.
Units PurchasedTransfer Weekly byPrice NGMD
$480 25.30490 24.80491 24.75492 24.70493 24.65494 24.60495 24.55496 24.50497 24.45498 24.40499 24.35500 24.30
(In other words, the Supply Division knows that NGMD’s demand curve for NGM4010 isT � 986 � 20Q, where T is the transfer price and Q is the number of units of NGM4010transferred from Supply to NGMD and sold by NGMD each week.) What transfer pricewill the Supply Division select to maximize the Supply Division’s profit on NGM4010?
d. If the Supply Division selects the transfer price to maximize its profits in part (c), howmuch profit will the Supply Division make each week, and how much profit will NGMDmake each week?
e. Compare the level of firmwide profits calculated in part (b) with the sum of the SupplyDivision’s and NGMD’s profits calculated in part (d). Which one is larger (firm profits orSupply Division profits plus NGMD profits), and explain why.
f. Suppose corporate headquarters has all the information about customer demand and costsin the two divisions [the same assumption as in part (a)], but instead of telling the twodivisions how many units to produce and transfer each week, they set the transfer price onNGM4010. What transfer price would corporate headquarters set in order to maximizefirmwide profit?
g. What organizational problems are created if the transfer price for NGM4010 is setfollowing your recommendation in part (f ) above? Describe the dysfunctional incentivescreated by such a transfer pricing rule.
Responsibility Accounting and Transfer Pricing 223
zim36725_ch05_170-228.qxd 12/15/09 12:40 PM Page 223

CasesCase 5–1: Swan Systems
Swan Systems developed and manufactures residential water filtration units that are installed undersinks. The filtration unit removes chlorine and other chemicals from drinking water. This Dutch com-pany has successfully expanded sales of its units in the European market for the past 12 years. Swanstarted a U.S. manufacturing and marketing division six years ago and an Australian manufacturingand marketing division three years ago. Here are summary operating data for the last fiscal year:
SWAN SYSTEMSSummary of Operations, Last Fiscal Year
(Millions of Euros)
Australia Netherlands U.S. Total
Sales €50 €55 €75 €180Divisional expenses 38 33 58 129
Net income €12 €22 €17 € 51
Senior management is in the process of evaluating the relative performance of each division. TheNetherlands division generates the most profits and has the largest investment of assets, as indicatedby the following table:
SWAN SYSTEMSMiscellaneous Operating Data,
Last Fiscal Year(Millions of Euros)
Australia Netherlands U.S. Total
Divisional net assets €80 €195 €131 €406Allocated corporate overhead* €4 €4 €6 €14Cost of capital 8.0% 8.0% 8.0%
*Allocated based on divisional sales revenue.
After careful consideration, senior management decided to examine the relative performance ofthe three divisions using several alternative measures of performance: ROI (return on investment asmeasured by net assets, or total assets less liabilities), residual income (net income less the cost ofcapital times net assets), and both of these measures after allocated corporate overhead is subtractedfrom divisional income. The cost of capital in each division was estimated to be 8 percent. (Assumethis 8 percent estimate is accurate.)
There was much debate about whether corporate overhead should be allocated to the divisionsand subtracted from divisional income. It was decided to allocate back to each division that portionof corporate overhead that is incurred to support and manage the division. The allocated corporateoverhead items include worldwide marketing, legal expenses, and accounting and administration.Sales revenue was chosen as the allocation base because it is simple and best represents the cause-and-effect relation between the divisions and the generation of corporate overhead.
Required:
a. Calculate ROI and residual income (1) before any corporate overhead allocations and (2) after corporate overhead allocations for each division.
224 Chapter 5
zim36725_ch05_170-228.qxd 12/15/09 12:40 PM Page 224

b. Discuss the differences among the various performance measures.
c. Based on the data presented in the case, evaluate the relative performance of the three operatingdivisions. Which division do you think performed the best and which performed the worst?
Case 5–2: Celtex
Celtex is a large and very successful decentralized specialty chemical producer organized into fiveindependent investment centers. Each of the five investment centers is free to buy products either in-side or outside the firm and is judged based on residual income. Most of each division’s sales are toexternal customers. Celtex has the general reputation of being one of the top two or three companiesin each of its markets.
Don Horigan, president of the synthetic chemicals (Synchem) division, and Paul Juris, presidentof the consumer products division, are embroiled in a dispute. It all began two years ago when Jurisasked Horigan to modify a synthetic chemical for a new household cleaner. In return, Synchem wouldbe reimbursed for out-of-pocket costs. After Synchem spent considerable time perfecting the chemi-cal, Juris solicited competitive bids from Horigan and some outside firms and awarded the contractto an outside firm that was the low bidder. This angered Horigan, who expected his bid to receivespecial consideration because he developed the new chemical at cost and the outside vendors tookadvantage of his R&D.
The current conflict involves Synchem’s production of chemical Q47, a standard product, forconsumer products. Because of an economic slowdown, all synthetic chemical producers have excesscapacity. Synchem was asked to bid on supplying Q47 for the consumer products division. Consumerproducts is moving into a new, experimental product line, and Q47 is one of the key ingredients.While the order is small relative to Synchem’s total business, the price of Q47 is very important in de-termining the profitability of the experimental line. Horigan bid $3.20 per gallon. Meas Chemicals,an outside firm, bid $3.00. Juris is angry because he knows that Horigan’s bid contains a substantialamount of fixed overhead and profit. Synchem buys the base raw material, Q4, from the organicchemicals division of Celtex for $1.00 per gallon. The organic chemical division’s out-of-pocket costs(i.e., variable costs) are 80 percent of the selling price. Synchem then further processes Q4 into Q47and incurs additional variable costs of $1.75 per gallon. Synchem’s fixed manufacturing overheadadds another $0.30 per gallon.
Horigan argues that he has $3.05 of cost in each gallon of Q47. If he turned around and sold theproduct for anything less than $3.20, he would be undermining his recent attempts to get his salespeo-ple to stop cutting their bids and start quoting full-cost prices. Horigan has been trying to enhance thequality of the business he is getting, and he fears that if he is forced to make Q47 for consumer prod-ucts, all of his effort the last few months will be for naught. He argues that he already gave away thestore once to consumer products and he won’t do it again. He asks, “How can senior managers expectme to return a positive residual income if I am forced to put in bids that don’t recover full cost?”
Juris, in a chance meeting at the airport with Debra Donak, senior vice president of Celtex,described the situation and asked Donak to intervene. Juris believed Horigan was trying to get evenafter their earlier clash. Juris argued that the success of his new product venture depended on beingable to secure a stable, high-quality supply of Q47 at low cost.
Required:
a. Calculate the incremental cash flows to Celtex if the consumer products division obtainsQ47 from Synchem versus Meas Chemicals.
b. What advice would you give Debra Donak?
Case 5–3: Executive Inn
Sarah Adams manages Executive Inn of Toronto, a 200-room facility that rents furnished suites to ex-ecutives by the month. The market is for people relocating to Toronto and waiting for permanenthousing. Adams’s compensation contains a fixed component and a bonus based on the net cash flowsfrom operations. She seeks to maximize her compensation. Adams likes her job and has learned a lot,but she expects to be working for a financial institution within five years.
Responsibility Accounting and Transfer Pricing 225
zim36725_ch05_170-228.qxd 12/15/09 12:40 PM Page 225

Adams’s occupancy rate is running at 98 percent, and she is considering a $10 million expansionof the present building to add more rental units. She has very good private knowledge of the futurecash flows. In year 1, they will be $2 million and will decline $100,000 a year. The following tablesummarizes the expansion’s cash flows:
Net Cash Net Cash Flow Flow
Year (Millions) Year (Millions)
0 $(10.0) 6 1.51 2.0 7 1.42 1.9 8 1.33 1.8 9 1.24 1.7 10 1.15 1.6
Based on the preceding data, Adams prepares a discounted cash flow analysis of the addition, whichis contained in the following report:
Net Cash Present Flow Discount Value of
Year (Millions) Factor Cash Flow
0 $(10.0) 1.000 $(10.00)1 2.0 0.893 1.792 1.9 0.797 1.513 1.8 0.712 1.284 1.7 0.636 1.085 1.6 0.567 0.916 1.5 0.507 0.767 1.4 0.452 0.638 1.3 0.404 0.539 1.2 0.361 0.43
10 1.1 0.322 0.35
Total $ (0.73)
The discount factors are based on a weighted-average cost of capital of 12 percent, which accu-rately reflects the inn’s nondiversifiable risk.
Adams’s boss, Kathy Judson, manages the Inn Division of Comfort Inc., which has 15 proper-ties located around North America including Executive Inn of Toronto. Judson does not have the de-tailed knowledge of the Toronto hotel/rental market as Adams does. Her general knowledge is not asdetailed or as accurate as Adams’s. (For the following questions, ignore taxes.)
Required:
a. The Inn Division of Comfort Inc. has a very crude accounting system that does not assignthe depreciation of particular inns to individual managers. As a result, Adams’s annual netcash flow statement is based on the operating revenues less operating expenses. Neither the
226 Chapter 5
zim36725_ch05_170-228.qxd 12/15/09 12:40 PM Page 226

cost of expansion nor depreciation on expanding her inn is charged to her operatingstatement. Given the facts provided so far, what decision do you expect her to makeregarding building the $10 million addition? Explain why.
b. Adams prepares the following report for Judson to justify the expansion project:
Net Cash Present Flow Discount Value of
Year (Millions) Factor Cash Flow
0 $(10.0) 1.000 $(10.00)1 2.0 0.893 1.792 1.9 0.797 1.513 1.9 0.712 1.354 1.8 0.636 1.145 1.8 0.567 1.026 1.8 0.507 0.917 1.8 0.452 0.818 1.8 0.404 0.739 1.7 0.361 0.61
10 1.7 0.322 0.55
Net present value $0.42
Judson realizes that Adams’s projected cash flows are most likely optimistic, but she doesnot know how optimistic or even whether or not the project is a positive net present valueproject. She decides to change Adams’s performance measure used in computing herbonus. Adams’s compensation will be based on residual income (EVA). Judson alsochanges the accounting system to track asset expansion and depreciation on the expansion.Adams’s profits from operations will now be charged for straight-line depreciation of theexpansion using a 10-year life (assume a zero salvage value). Calculate Adams’s expectedresidual income from the expansion for each of the next 10 years.
c. Based on your calculations in (b), will Adams propose the expansion project? Explain why.
d. Instead of using residual income as Adams’s performance measure in (b), Judson uses netcash flows from operations less straight-line depreciation. Will Adams seek to undertakethe expansion? Explain why.
e. Reconcile any differences in your answers for (c) and (d).
Case 5–4: Royal Resort and Casino
Royal Resort and Casino (RRC), a publicly traded company, caters to affluent customers seeking plushsurroundings, high-quality food and entertainment, and all the “glitz” associated with the best resortsand casinos. RRC consists of three divisions: hotel, gaming, and entertainment. The hotel divisionmanages the reservation system and lodging operations. Gaming consists of operations, security, andjunkets. Junkets offers complimentary air fare and lodging and entertainment at RRC for customersknown to wager large sums. The entertainment division consists of restaurants, lounges, catering, andshows. It books lounge shows and top-name entertainment in the theater. Although many of those peo-ple attending the shows and eating in the restaurants stay at RRC, customers staying at other hotels andcasinos in the area also frequent RRC’s shows, restaurants, and gaming operations. The following tabledisaggregates RRC’s total EVA of $12 million into an EVA for each division:
Responsibility Accounting and Transfer Pricing 227
zim36725_ch05_170-228.qxd 12/15/09 12:40 PM Page 227

ROYAL RESORT AND CASINOEVA by Division
(Millions $)
Entertainment Hotel Gaming Total
Adjusted accounting profits $ 5 $ 10 $30 $ 45Invested Capital $40 $120 $60 $220Weighted-average cost of capital 15% 15% 15% 15%
EVA $ (1) $ (8) $21 $ 12
Based on an analysis of similar companies, it is determined that each division has the same weighted-average cost of capital of 15 percent.
Across town from RRC is a city block with three separate businesses: Big Horseshoe Slots &Casino, Nell’s Lounge and Grill, and Sunnyside Motel. These businesses serve a less affluentclientele.
Required:
a. Why does RRC operate as a single firm, whereas Big Horseshoe Slots, Nell’s Lounge andGrill, and Sunnyside Motel operate as three separate firms?
b. Describe some of the interdependencies that are likely to exist across RRC’s threedivisions.
c. Describe some of the internal administrative devices, accounting-based measures, and/ororganizational structures that senior managers at RRC can use to control theinterdependencies that you described in part (b).
d. Critically evaluate each of the “solutions” you proposed in part (c).
228 Chapter 5
zim36725_ch05_170-228.qxd 12/15/09 12:40 PM Page 228

229
Chapter Six
Budgeting
Chapter Outline
A. Generic Budgeting Systems
1. Country Club
2. Private University
3. Large Corporation
B. Trade-Off between Decision Managementand Decision Control
1. Communicating Specialized Knowledge versusPerformance Evaluation
2. Budget Ratcheting
3. Participative Budgeting
4. New Approaches to Budgeting
5. Managing the Trade-Off
C. Resolving Organizational Problems
1. Short-Run versus Long-Run Budgets
2. Line-Item Budgets
3. Budget Lapsing
4. Static versus Flexible Budgets
5. Incremental versus Zero-Based Budgets
D. Summary
Appendix: Comprehensive Master BudgetIllustration
zim36725_ch06_229-301.qxd 12/15/09 12:43 PM Page 229

Chapter 4 described the firm’s organizational architecture as consisting of three integratedsystems: assigning decision rights, measuring performance, and rewarding performance.The firm’s organizational architecture reduces conflicts of interest among the variousparties contracting with the firm. This chapter describes how budgeting is used for decisionmaking and to control conflicts of interest. A budget is management’s formal quantifica-tion of the operations of an organization for a future period. It is an aggregate forecast ofall transactions expected to occur.
Giving a manager an advertising budget of $8 million authorizes that manager to con-sume $8 million of firm resources on advertising. Put another way, the advertising budgetauthorizes the manager to spend $8 million on advertising by assigning these decisionrights to the manager. At the end of the year, actual spending on advertising can be com-pared with the budget; any difference is a measure of the manager’s performance and canbe used in determining the manager’s performance rewards. Budgets are thus part of thefirm’s organizational architecture; they partition decision rights and control behavior.
Dwight D. Eisenhower, Supreme Commander of the Allied Forces in Europe duringWorld War II and the 34th president of the United States, is quoted as saying, “In preparingfor battle, I have always found that plans are useless but planning is indispensable.”1 Budgetsare a form of planning. And as expressed by Eisenhower, in many cases their value lies morein the process of planning than in the actual budgets produced. Many times budgets are ob-solete before they can be implemented because the world has changed in some unexpectedmanner. However, the process of budgeting remains vital.
Budgets are an integral part of decision making by assembling knowledge and commu-nicating it to the managers with the decision rights. Budgets are developed using key plan-ning assumptions or basic estimating factors that are widely accepted forecasts of strategicelements faced by the firm. Typical planning assumptions are product prices, unit sales, for-eign currency exchange rates, and external prices of key inputs. Budgets help assemble andthen communicate these key planning assumptions. Various managers throughout the firmmust accept these planning assumptions as reasonable and likely. Key planning assumptionsrepresent those factors that are, to some extent, beyond management control and that set alimit on the overall activities of the firm.
Each key planning assumption must be forecast using past experience, field estimates,and/or statistical analysis. Making these forecasts usually involves accumulating thecollective knowledge of numerous individuals in the firm. No single manager has detailedknowledge of total expected unit sales, but individual salespeople have knowledge of likelyunit sales in their districts. Because salespersons have specific knowledge of theircustomer’s future purchases, the firm develops an accurate estimate of the planningassumption (firmwide sales) by adding sales forecasts from all the salespeople. From thesekey planning assumptions, a complete set of management plans is developed regarding rawmaterials acquisition, labor requirements, financing plans, and distribution and marketingbudgets.
Figure 6–1 summarizes the various functions performed by budgets. James McKinsey,founder of the consulting firm McKinsey & Co., describes budgetary control as involvingthe following:
1. The statement of the plans of all departments of the business for a certain periodof time in the form of estimates.
2. The coordination of these estimates into a well-balanced program for the businessas a whole.
230 Chapter 6
1 Quoted by Richard Nixon in Six Crises (Garden City, NY: Doubleday, 1962), http://en.wikipedia.org/wiki/Dwight_D._Eisenhower#_note-34.
zim36725_ch06_229-301.qxd 12/15/09 12:43 PM Page 230

Budgeting 231
Budgets
Decision Management• Assemble knowledge• Communicate knowledge• Plan
Decision Control• Assign decision rights• Measure performance
FIGURE 6–1
Functions of budgets
ManagerialApplication:Budgeting at GeneralElectric
General Electric has grown by global acquisition. Once it acquires a company, GE installsits management system. Nuovo Pignone (NP) of Italy illustrates the process. NP manu-factures machinery and equipment for the oil and gas industry. Following acquisition byGE, NP underwent a massive cultural transformation with the installation of performancemeasurement systems built around the budgeting process. The first three GE executives toarrive at NP were the chief financial officer, the financial planning manager, and the cor-porate auditor. These managers installed a new budgeting and performance evaluation sys-tem that aligned business goals with timely and accurate financial information as well aslinking NP with GE’s global environment. The integration process at NP involved a majorchange in performance measurement. Very early in the integration process, significant ef-fort was put into creating financial budgets that tied NP and GE’s strategy to metrics forspecific departments. Before NP initiates a new project, the project’s benefits and costs arequantified in a budget, and this information is used to select and prioritize projects. Butmore important, the GE systems in NP are driven by the language of measurement, com-munication, and accountability.
SOURCE: C Busco, M Frigo, E Giovannoni, A Riccaboni, and R Scapens, “Integrating Global Organizations throughPerformance Measurement Systems,” Strategic Finance, January 2006, pp. 31–35.
3. The preparation of reports showing a comparison between the actual and theestimated performance, and the revision of the original plans when these reportsshow that such revision is necessary.2
Because budgeting performs such critical functions involving decision managementand decision control, it is ubiquitous—virtually all organizations prepare budgets. Thischapter first describes some generic budgeting systems used by different organizations(section A). It then discusses how budgeting involves the trade-off between decision man-agement and decision control (section B). Section C describes how budgets help reduceconflicts of interest between owners and managers. A comprehensive budget example isprovided in the appendix.
A. Generic Budgeting SystemsThe following discussion illustrates the essential aspects of budgeting using a simple orga-nizational form (a hypothetical private country club), a more complicated organization(a university), and a large corporation. In all three examples, budgeting is part of the sys-tem whereby decision rights are partitioned and performance is measured and rewarded.
This example illustrates the use of budgets to assign decision rights and create incentivesfor employees to act in the owners’ interests.
1. Country Club
2 J McKinsey, Budgetary Control (New York: Ronald Press, 1922), p. 8.
zim36725_ch06_229-301.qxd 12/15/09 12:43 PM Page 231

Bay View Country Club is a private club with 350 members. Members pay a one-timeinitiation fee of $45,000 and dues of $385 per month. They have access to the golf course,pool, tennis courts, and restaurant.
Bay View Country Club has three departments (each managed by a full-time employee):the restaurant, the golf course, and the pro shop. The restaurant is managed by the club man-ager; the maintenance of the golf course is supervised by the golf course superintendent; andthe pro shop is operated by the golf professional. The restaurant is treated as a profit center andthe golf course and pro shop are treated as cost centers. The club manager is responsible forrevenues and expenses in operating the restaurant, whereas the golf course superintendentand golf professional are responsible primarily for controlling expenses in their operations.
Table 6–1 is the operating statement for the club. Bay View Country Club is essentiallya cash business. All of the members pay their dues on time and there are negligible inven-tories of food and liquor. Because it is a cash business, revenues are equivalent to cash re-ceipts, while expenses are equivalent to cash disbursements. Table 6–1 lists the revenuesand expenses for September 2011 and September 2010, and the budget for September2011, including variances from budget. Parentheses denote negative numbers and unfavor-able variances from budget. An unfavorable budget variance occurs when actual expensesexceed budgeted expenses or when actual revenues are less than budgeted revenues. Theannual operating budget and monthly operating statement are the principal control devicesused in most organizations, including Bay View Country Club.
At the beginning of the operating year, the board of directors submits an operating bud-get to the general membership for approval. This plan shows projected revenues (including
232 Chapter 6
TABLE 6–1
BAY VIEW COUNTRY CLUBOperating Results
September 2011
FavorableActual Budget (Unfavorable)
September September Variance Last Year
RevenuesDues $133,350 $134,750 $(1,400) $129,600Guest fees 2,900 2,500 400 2,200Food and bar 46,000 44,500 1,500 45,000Golf carts 2,200 1,900 300 2,100Miscellaneous 1,600 1,800 (200) 1,700
Total revenue $186,050 $185,450 $ 600 $180,600
ExpensesFood & bar $ 57,000 $ 51,300 $(5,700) $ 49,700Golf course 79,500 80,000 500 75,000Administration &
maintenance 47,050 45,350 (1,700) 45,600Interest on debt 8,500 8,500 0 9,000
Total expenses $192,050 $185,150 $(6,900) $179,300
Net operating surplus(deficit) $ (6,000) $ 300 $(6,300) $ 1,300
zim36725_ch06_229-301.qxd 12/15/09 12:43 PM Page 232

dues) and projected expenses. To prepare the budget, management and the board examineeach revenue and expense item for the previous year and adjust it for expected inflation andany change in operating plans. For example, the golf course superintendent reviews lastyear’s spending on labor and supplies. The superintendent decides how to change the golfcourse maintenance schedule and forecasts how these changes, adjusted for price changes,translate into a total operating budget for the year. Knowing the maintenance program foreach month, the superintendent estimates how the annual amount will be spent each month.
The annual budget, after approval by the members, authorizes the board and club man-agement to operate the club for the next year under the limits it specifies. For example, the bud-geted amount to be spent on the golf course in September 2011 is $80,000. The members (whoare the owners of the club) control the operations by authorizing the board of directors andhence the management to spend club resources according to the plan. If there is a major unan-ticipated cost during the year (e.g., the swimming pool heater breaks), the board of directorscan either pay for this out of cash generated from prior years’ accumulated surpluses or call aspecial meeting of the membership and propose an assessment from each member.
Table 6–1 reports the actual amounts received and spent in September 2011. The clubhad a net operating deficit of $6,000 in September. The budget projected a surplus of $300.Thus, September’s operations were $6,300 below budget. Last year in September, actualrevenue exceeded actual expenses by $1,300. Comparing budget with actual for individualline items indicates that most of this September’s $6,300 unfavorable variance is from foodand bar expenses, which were $5,700 over budget. At this point, additional information isneeded to determine the reasons for the unfavorable variance in food and bar expenses. Theoperating statement merely identifies a budget variance. Additional analysis is required toidentify its causes and any corrective action needed to solve the problem.
Table 6–2 provides additional information on the food and bar operations. It indicatesthat actual expenses exceeded actual revenues by $11,000. The budget called for only a
Budgeting 233
TABLE 6–2
BAY VIEW COUNTRY CLUBFood and Bar Operations
September 2011
Favorable Actual Budget (Unfavorable)
September September Variance Last Year
RevenuesParties $ 8,300 $11,500 $(3,200) $11,000Food 24,000 22,000 2,000 21,500Bar 12,700 10,500 2,200 10,500Miscellaneous 1,000 500 500 2,000
Total revenue $ 46,000 $44,500 $ 1,500 $45,000
ExpensesParties $ 9,000 $ 4,000 $(5,000) $ 5,000Food 44,000 43,000 (1,000) 40,000Bar 4,000 4,300 300 4,700
Total expenses $ 57,000 $51,300 $(5,700) $49,700
Net operating surplus(deficit) $(11,000) $(6,800) $(4,200) $(4,700)
zim36725_ch06_229-301.qxd 12/15/09 12:43 PM Page 233
$6,800 deficit. Thus, there was an unfavorable budget variance of $4,200 in the net operatingdeficit. September’s unfavorable variances occurred because party revenue was $3,200 un-der budget and party expenses were $5,000 over budget. Further investigation reveals thatthe assistant manager in charge of parties quit in August. A large party was canceled inSeptember, but no one at the club canceled the additional staff, food, and flower orders. The board criticized the club manager for not supervising these parties more closely duringthe absence of the assistant manager. A new assistant manager for parties was hired, andthese problems were solved.3
Chapter 4 described organizational architecture as consisting of administrative systemsthat assign decision rights and evaluate and reward performance. Bay View Country Club’sbudgeting system illustrates how each of these three administrative systems is used to reduceagency problems at Bay View. Decision rights, which are initially held by the members, areassigned to the board of directors. The board hires professional managers who have the spe-cialized knowledge to operate the various club functions: the club manager, the golf coursesuperintendent, and the golf professional. These individuals submit their operating plans forthe upcoming year via the budget.
Their budgets translate the plans for the next year into financial terms—the dollars ofrevenue and expenses that are expected to occur when their plans are implemented. Theboard reviews and modifies these plans to reflect member preferences and to ensure thatmonies are available to implement the plans. Once the membership approves the budget,the three managers have the decision rights to spend monies as specified in the budget.Decision rights are linked with knowledge. For example, the golf course superintendent hasthe specialized knowledge of the golf course as well as the available chemicals and main-tenance procedures to maintain the course. The budget assigns to the superintendent thedecision rights to implement a specific set of actions.
Notice the bottom-up nature of the budgeting process. The operating managers submittheir budgets to the board of directors, who adjust the budgeted figures and recommend thebudget to the membership. The members then have final approval rights over the budget.
Budgets are also a performance measurement system. Monthly operating statementsfor each manager are prepared. Table 6–2 is the operating statement for the club manager’sfood and bar operation. This statement is only one component of the club manager’sperformance. It shows whether the club manager met revenue and expense targets. Anotherindication of the manager’s performance is the level of member satisfaction with the foodand bar operation. Member satisfaction will ultimately show up in revenues and expensesif quality falls and members stop using the restaurant. Similarly, it does little good for thegolf course superintendent to meet financial targets if the golf course condition deterio-rates. Also, the condition of the course relative to other courses in the area is an importantconsideration in evaluating the superintendent’s performance.
Budget variances are indicators of whether managers are meeting expectationsand they are used in the performance reward system to determine pay increases or, inthe case of extremely unfavorable variances, the need to terminate the responsible
234 Chapter 6
3 A well-known agency problem with private clubs (and other nonprofit organizations) is that the board ofdirectors has little financial incentive to oversee the club. Board members receive no cash compensation forserving on the board. Thus, firing the manager imposes costs on them because they have to spend their timereplacing the manager. All the members gain from the improved operations with the new (better) manager. Eachboard member receives 1/350th of the benefit (if there are 350 members) but incurs 1/15th of the cost (if thereare 15 board members). This free-rider problem is one of the reasons member-owned country clubs usually arerun less efficiently than owner-managed, for-profit clubs. Members are willing to bear these higher agency costsbecause of the prestige and exclusivity of belonging to the club and because of social interactions fromassociating with a stable membership.
zim36725_ch06_229-301.qxd 12/15/09 12:43 PM Page 234

manager. The large unfavorable variance in party operations caused the board ofdirectors to search for reasons for the variance, which led to the discovery that themanager did not supervise the parties. The lack of supervision caused the board tocriticize the club manager. If unfavorable variances continue and the board determinesthat they are the fault of the manager, they may be grounds for dismissal or for notgranting a pay increase. On the other hand, favorable budget variances need not indi-cate superior performance. If less was spent than was budgeted, quality may have beensacrificed.
One danger inherent in annual budgets such as the Bay View Country Club exampleis their tendency to focus managers’ attention on next year’s operations only, ignoring thelong-term well-being of the organization. For example, if budgeted expenses exceed bud-geted revenues, there is pressure to reduce maintenance expenditures. Reducing mainte-nance and repairs brings the one-year budget into line, but the long-term goals of theorganization are compromised. To reduce the tendency of short-term budgets to focusmanagers too narrowly on short-term performance, many organizations prepare long-term budgets of three- to five-year duration at the same time as the short-run budgets. Abudget for five years is more likely to reveal the effects of reducing short-run mainte-nance than a one-year budget. Section C discusses short-run versus long-run budgets ingreater detail.
Bay View Country Club’s budget separates decision management (decision initiationand implementation) from decision control (decision ratification and monitoring):
1. Decision initiation (budget preparation) is done by the operating managers.
2. Decision ratification (budget approval) is done by the board and the members.
3. Decision implementation (operating decisions) is done by the managers.
4. Decision monitoring (reviewing monthly operating statements) is done directly bythe board and indirectly by the members.
The managers prepare the budget and make day-to-day operating decisions in theirarea (decision management rights). The board of directors approves budget requests andmonitors operations (decision control rights). The board not only examines financial oper-ating variances (the favorable and unfavorable variances on the operating statements) butalso monitors member satisfaction with the club’s food and golf operations.
In the country club example, the budget and the monthly operating statements are anintegral part of the various administrative mechanisms that reduce the club’s organizationalproblems. We now turn to a larger, more complex organization—namely, a private univer-sity. Again, the budget is a key device in resolving organizational problems.
Budgeting 235
ManagerialApplication:Most LargeCorporationsReviewBudgetsMonthly
Most organizations compare actual operations with budget on a monthly basis. Thiscomparison is usually made by the chief executive officer (CEO). A survey of 120 largepublicly traded firms inquired how frequently budgeted and actual results are compared.The study reports that 90 percent of the line managers reporting to the CEO comparemonthly, 4 percent compare weekly or biweekly, and 6 percent compare quarterly. CEOscompare actual and budgeted results monthly in 83 percent of the firms and quarterly in15 percent of the firms.
SOURCE: A Christie, M Joye, and R Watts, “Decentralization of the Firm: Theory and Evidence,” Journal of CorporateFinance 118 (2001).
zim36725_ch06_229-301.qxd 12/15/09 12:43 PM Page 235
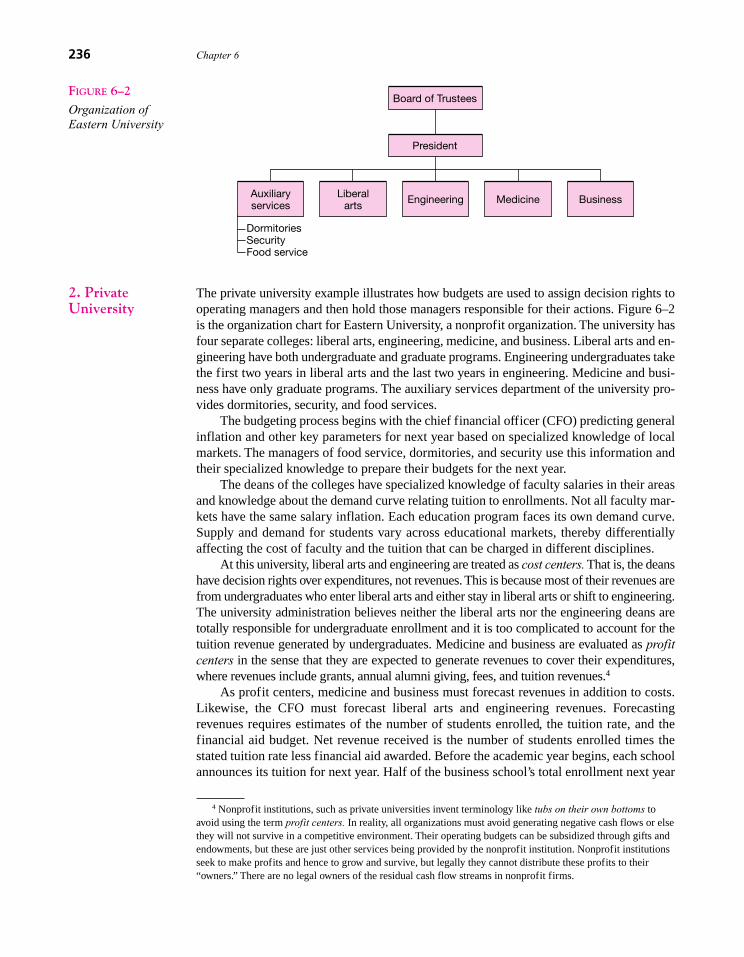
The private university example illustrates how budgets are used to assign decision rights tooperating managers and then hold those managers responsible for their actions. Figure 6–2is the organization chart for Eastern University, a nonprofit organization. The university hasfour separate colleges: liberal arts, engineering, medicine, and business. Liberal arts and en-gineering have both undergraduate and graduate programs. Engineering undergraduates takethe first two years in liberal arts and the last two years in engineering. Medicine and busi-ness have only graduate programs. The auxiliary services department of the university pro-vides dormitories, security, and food services.
The budgeting process begins with the chief financial officer (CFO) predicting generalinflation and other key parameters for next year based on specialized knowledge of localmarkets. The managers of food service, dormitories, and security use this information andtheir specialized knowledge to prepare their budgets for the next year.
The deans of the colleges have specialized knowledge of faculty salaries in their areasand knowledge about the demand curve relating tuition to enrollments. Not all faculty mar-kets have the same salary inflation. Each education program faces its own demand curve.Supply and demand for students vary across educational markets, thereby differentiallyaffecting the cost of faculty and the tuition that can be charged in different disciplines.
At this university, liberal arts and engineering are treated as cost centers. That is, the deanshave decision rights over expenditures, not revenues. This is because most of their revenues arefrom undergraduates who enter liberal arts and either stay in liberal arts or shift to engineering.The university administration believes neither the liberal arts nor the engineering deans aretotally responsible for undergraduate enrollment and it is too complicated to account for thetuition revenue generated by undergraduates. Medicine and business are evaluated as profitcenters in the sense that they are expected to generate revenues to cover their expenditures,where revenues include grants, annual alumni giving, fees, and tuition revenues.4
As profit centers, medicine and business must forecast revenues in addition to costs.Likewise, the CFO must forecast liberal arts and engineering revenues. Forecastingrevenues requires estimates of the number of students enrolled, the tuition rate, and thefinancial aid budget. Net revenue received is the number of students enrolled times thestated tuition rate less financial aid awarded. Before the academic year begins, each schoolannounces its tuition for next year. Half of the business school’s total enrollment next year
2. PrivateUniversity
236 Chapter 6
EngineeringLiberalarts
Auxiliaryservices Medicine Business
Board of Trustees
President
DormitoriesSecurityFood service
FIGURE 6–2
Organization ofEastern University
4 Nonprofit institutions, such as private universities invent terminology like tubs on their own bottoms toavoid using the term profit centers. In reality, all organizations must avoid generating negative cash flows or elsethey will not survive in a competitive environment. Their operating budgets can be subsidized through gifts andendowments, but these are just other services being provided by the nonprofit institution. Nonprofit institutionsseek to make profits and hence to grow and survive, but legally they cannot distribute these profits to their“owners.” There are no legal owners of the residual cash flow streams in nonprofit firms.
zim36725_ch06_229-301.qxd 12/15/09 12:43 PM Page 236

is reasonably easy to forecast based on the number of first-year students currently enrolledwho are expected to return next year. The size of this group will not change much based onthe tuition increase. However, the new entering class is more price sensitive than the classalready enrolled. A large tuition increase may require an increase in the financial aid bud-get if the school is to maintain both the quantity and quality of entering students. Thus, es-timating revenue requires trading off total revenue net of financial aid for student quality.Lowering student quality reduces the demand for the school’s programs by high-qualitystudents in the future.
Once the deans prepare their budgets for next year, they are sent to the CFO, who en-sures that total projected revenues cover total projected expenditures. The CFO and thepresident also must ensure that the plans of each college are consistent with the overallstrategy of the university. For example, if the president sees the university as primarily agraduate research institution, college budgets that put substantial additional resources intoundergraduate education are inconsistent with that mission. The president would cut backthese undergraduate resource requests. Through this back-and-forth negotiating process be-tween the president, who has specialized knowledge of the university’s mission, and themanagers and deans of the various units, a consensus is reached and an overall budget forthe university is prepared.
The budget is then sent to the board of trustees for approval. The board of trustees at thisprivate institution consists of alumni, local leaders, and donors. Trustees do not receive anycash compensation from the university. They are appointed to the board for fixed terms andusually have a strong commitment to the preservation and improvement of the institution.The board of trustees examines the budget to ensure that it meets the university’s missionand that it is fiscally prudent, meaning that the university will survive in the long run.
After the budget is approved, managers and deans have the decision rights to operatetheir units. Faculty are hired, food is purchased, and dormitory maintenance is providedconsistent with the amounts in the budget. Monthly and annual reports, similar to Tables 6–1and 6–2, are prepared to show each unit’s compliance with the budget. These reports arepart of the decision-monitoring process. This example again illustrates the linking ofknowledge and decision rights and the separation of decision management and decisioncontrol via the use of the hierarchy. Like most budgeting systems, it is bottom up; lowerlevels in the organization prepare the initial budgets because they have much of the spe-cialized knowledge. As the budget moves through the decision ratification process, higherlevels review the budget and bring to bear their specialized knowledge.
Two points emerge from this example. First, managers and deans have an incentive torequest “too large” a budget. The dean of liberal arts is under pressure from students andfaculty in liberal arts to add more courses, more programs, and more student services,which can be done only by requesting more money. The dean of medicine is under pressureto provide more medical services in the hospital and more medical education. Even thoughmedicine is treated as a profit center, the dean of medicine has an incentive to prepare abudget that shows a deficit (where expenditures exceed revenues) in hopes that the presi-dent will finance this deficit out of surpluses generated in other divisions. That is, the med-ical school dean hopes for cross subsidization.
The second point is that the deans of liberal arts and engineering have different incen-tives from the deans of medicine and business. Liberal arts and engineering are treated ascost centers, so they receive little benefit from additional revenues generated by addingmore students. These deans have less incentive than the medicine and business deans toinnovate cash-generating new programs because they do not directly capture the additionaltuition. The liberal arts and engineering deans have incentives to lobby for more resourcesfor new programs. But since these deans do not bear the full consequences of adding programs
Budgeting 237
zim36725_ch06_229-301.qxd 12/15/09 12:43 PM Page 237

that cost more than they bring in, they are more likely to add unprofitable programs thanare the business and medicine deans.
One problem the president faces with the medicine and business deans is their incen-tives to free ride on the university’s reputation by offering lower-quality programs. Forexample, suppose the university has a reputation for high quality. The dean of medicinecan generate additional revenues by starting low-quality programs, but this will debase theoverall university reputation. The dean’s incentive to reduce quality is controlled by presi-dential monitoring of faculty appointments and academic programs.
The two previous examples described budgeting primarily as a process by which knowl-edge is assembled vertically, from both lower levels and higher levels in the organization’shierarchy. But budgeting is also an important device for assembling specialized knowledgehorizontally within the firm. In a large, complex corporation, it is a major challenge to dis-seminate specific knowledge. Getting managers to share their knowledge among superiorsand subordinates (vertically) as well as among peers in other parts of the organization (hor-izontally) and giving managers incentives to acquire valuable knowledge are important as-pects of the budgeting system. Consider the case of Xerox Corporation.
Xerox produces, sells, leases, and services a wide range of copiers with different copyoutput rates, features, and sales and rental plans. The field organization consists of branchoffices with sales, service, and administrative personnel. The manufacturing organizationproduces copiers at sites around the world and is treated as a cost center. Besides manufac-turing copiers, Xerox also sells supplies, such as toner. The field offices that are part ofmarketing are cost centers; the supplies division is a profit center.
Each year Xerox must plan how many new copiers of each type will be placed in ser-vice and how many old copiers will be returned. These numbers drive the manufacturingplans for the year. The number of various types of copiers currently in the field, which iscalled the installed base, affects the number of service personnel in the field, the trainingprograms they require, and the stock of spare parts needed to service the base. The installedbase also affects the amount of supplies Xerox sells.
Each part of Xerox must communicate with the other parts of the firm. Manufacturingwants to know how many of each type of copier marketing expects to sell. Marketing wantsto know what prices will be charged for each type of copier. Copier placements depend on themarket’s expectation of new product introductions. In setting their forecasts, manufacturing
3. LargeCorporation
238 Chapter 6
ManagerialApplication:“Budgetingfor CurveBalls”
The Chicago White Sox baseball team has an annual budget of over $200 million. Budgetassumptions are set in August/September, and by October the new budget is prepared forthe next year. The team owner first sets guidelines for the total player salary budget; thisis the largest single expense category. Department heads assemble assumption sheets,books of 1,500–2,000 pages, one for every account. These sheets contain details—suchas the number of security people for each game based on expected attendance levels,their pay rates, and union contracts—and explain any recommended changes from lastyear. Then the vice president of finance, the accounting manager, and the controllerreview the budgets with each department head. These meetings ensure consistentassumptions are being made across departments and that the budget requests are realistic.The team owner then reviews the budget requests. Once the budget is set, departmentheads must explain cost overruns and underruns.
SOURCE: A Dennis, “Budgeting for Curve Balls,” Journal of Accountancy, September 1998, pp. 89–92;www.usatoday.com/sports/baseball/salaries.
zim36725_ch06_229-301.qxd 12/15/09 12:43 PM Page 238

and marketing managers want to know about new products. Likewise, the toner divisionneeds to know the size of the installed base and its composition so it can plan the produc-tion of supplies for the year.
Not only must the various parts of Xerox share their specialized knowledge, but theymust have incentives to acquire it. The sales force must acquire the knowledge, about theforecasted quantities and prices of particular copiers to be sold (or leased). These sales es-timates must be transmitted to manufacturing with enough lead time to build the projectedquantities of new copiers.
An important part of the budgeting process is sharing and assembling knowledgeabout such key planning assumptions as unit placements, prices, and copier returns.Knowledge of these numbers is widely dispersed throughout the firm. In the process ofassembling the knowledge, people will change their expectations of the key planningassumptions. In addition, all managers affected by a key planning assumption are usuallyrequired to approve it and then build their budgets using it. Each manager’s approval helpsensure that expectations are consistent throughout the firm.
The corporate budgeting system is also a communication device through which some ofthe specialized knowledge and key planning assumptions are transmitted. It also involves aprocess by which various individuals arranged vertically and horizontally in the organizationnegotiate the terms of trade among the various parts of the organization. For example, for agiven price schedule, the marketing organization estimates the quantity of each type of copierplaced. Manufacturing agrees to produce this quantity of copiers and estimates the cost at
Budgeting 239
ManagerialApplication:Budgeting atNestlé WatersDivision
The Nestlé Waters Division was created to manage the two Nestlé water businesses: theFrench brands of Perrier, Vittel, and Contrex, and the Italian brands of Pellegrino and AcquaPanna. These brands are sold worldwide through the Nestlé Waters distribution system. TheFrench and Italian units start the budgeting process by developing a multiyear, long-termglobal brand strategy that includes positioning, pricing, and brand development. Next, theNestlé Waters headquarters approves the global strategy. This strategy then generates a planfor each Nestlé distributor that defines market priorities, volumes, and price targets, as wellas budgets to implement the plan. Each distributor prepares a budget for achieving its pieceof the global strategy and discusses it with the French and Italian Nestlé Waters producersuntil all parties are in agreement. Once approved by the French and Italian units and dis-tributors, the first year of the plan becomes the operating plan (budget).
Monthly, quarterly, and annual reports provide actual sales statistics, outlook bybrand, actual profits by brand, and variances from budget. Prior to implementing thenew organization and budgeting system, very limited information flowed laterallyamong the French and Italian producers and distributors, and there was no integrated in-ternational brand strategy. The new structure and budgeting system forces Nestlé Watersproducers and distributors to think strategically in terms of joint profitability as equalpartners belonging to the same global organization. A Pellegrino finance manager said,“The new performance measurement and accountability . . . has brought a new end-to-end mentality, fostering the (business unit) integration through shared goals between theproducer and the distributor. On the one hand, it improved the producer’s control overthe distributors’ activities. On the other hand, it links the distributors and the producer toa common faith as they have a shared goal to achieve, and, in so doing, it favors identi-fication around a global brand commitment.”
SOURCE: C Busco, M Frigo, E Giovannoni, A Riccaboni, and R Scapens, “Integrating Global Organizations throughPerformance Measurement Systems,” Strategic Finance, January 2006, pp. 31–35.
zim36725_ch06_229-301.qxd 12/15/09 12:43 PM Page 239

which they will be produced. Usually, price schedules are adjusted to bring manufacturing(supply) in line with marketing (demand). In principle, when sales forecasts and productionplans are produced, knowledge of cost (from manufacturing) and revenue (from marketing)is transferred to those agents with the decision rights to set prices, who ideally set the pricefor each product to maximize profits. Likewise, the supplies and service organizations accepttheir targets. Senior management ensures that all parts of the budget are consistent: Market-ing and manufacturing are in agreement, the financing is in place, the parts inventory is ade-quate to meet service requirements, and so on. Moreover, senior management likely hasspecialized knowledge to forecast some assumptions such as interest rates and salary levelsand to arbitrate disputes that arise between departments during the budgeting process.
240 Chapter 6
ManagerialApplication:BudgetingContinuousImprovements
A number of Japanese car companies use an elaborate system of continuous cost im-provement called Kaizen costing. Toyota defines Kaizen as the work process and ethicthat involves continuous search for improvement, constantly taking measures to improvework procedures and equipment. Kaizen often involves utilizing teams of employeeswho revise their work procedures and standards round-the-clock to achieve improve-ments in efficiency, quality, and working conditions. Kaizen systems employ a varietyof planning documents, including production, distribution, and sales plan; unit sales andcontribution margins; capital projects; and fixed expenses. Kaizen also requires a vari-able cost reduction goal for each plant and each department within the plant. Monthlyvariance reports document differences between actual and budgeted cost reductions andmanagers in each department are held responsible for the variances.
SOURCE: J Liker, The Toyota Way Field Book (New York: McGraw-Hill, 2006).
Exercise 6–1:
Shocker Company’s sales budget shows quarterly sales for next year as follows:
Quarter 1 10,000 unitsQuarter 2 8,000 unitsQuarter 3 12,000 unitsQuarter 4 14,000 units
Company policy is to have a finished goods inventory at the end of each quarter equal to
20 percent of the next quarter’s sales.
Required:
Compute budgeted production for the second quarter of next year.
Solution:
Quarter 2 sales 8,000 units+ Ending Inventory: 20% of Quarter 3 sales (12,000 � 20%) 2,400 units– Beginning Inventory: 20% of Quarter 2 sales
(8,000 � 20%) (1,600) units
Budgeted production 8,800 units
zim36725_ch06_229-301.qxd 12/15/09 12:43 PM Page 240

Budgeting 241
Many budgeting systems involve a bottom-up, top-down approach. Usually, some keyplanning assumptions are announced. Then, the lowest levels in the decision hierarchysubmit budgets for the next year. For example, product prices or the general inflation ratefor next year is announced by a budget officer at the beginning of the budget process.These first-round, lowest-level projections are accumulated at the next level up in the or-ganization, revised and submitted again to the next level, and so on up the hierarchy. Ateach level, managers ensure that the budget assumptions are consistent across their de-partments and that each department’s forecast is reasonable. Each manager also modifiessubordinates’ plans with any specialized knowledge the manager has acquired. In mostfirms, lower-level managers have a significant role in both the initial and revision stagesof the budget’s preparation.
As the budget is passed from one level of the organization up to a higher level, poten-tial bottlenecks are uncovered before they occur. For example, if one department’s budgetcalls for 10,000 units of a part and the parts fabrication department can produce only 7,500units, this bottleneck is identified before production actually begins. At some point, the keyassumptions may be challenged by managers with better specialized knowledge. On occa-sion, the assumptions are revised and the budgets updated.
The budget is revised at the top and passed back down through the organization. Eitherlower-level managers with specialized knowledge will agree with the changes and adapt tothe new strategy or they will disagree. If there is enough disagreement and it is madeknown to senior management, another round of budget revisions will occur.
Large corporations use budgets to
1. Assign decision rights.
2. Communicate information both vertically and horizontally.
3. Set goals through negotiation and internal contracting.
4. Measure performance.
Q6–1 How are budgets developed?
Q6–2 How are key planning assumptions derived?
Q6–3 Define budget variance.
Q6–4 Are budgets part of the performance measurement system orthe performance reward system?
Q6–5 What are some of the synergies that budgets provide withina large corporation?
Q6–6 How do budgets partition decision rights within a firm?
Q6–7 What purposes are served by the budgeting process in a largefirm?
B. Trade-Off between Decision Management and Decision ControlThe budgeting process plays an important role in both decision management and decisioncontrol in organizations. In one survey, over 50 percent of managers agreed that budgetsare indispensable in running their business.5
ConceptQuestions
5 T Libby and M Lindsay, “Beyond Budgeting or Better Budgeting,” Strategic Finance, August 2007, pp. 47–51.
zim36725_ch06_229-301.qxd 12/15/09 12:43 PM Page 241

242 Chapter 6
6 In some cases, it is possible to structure an incentive contract that induces managers to disclose theirprivate information in an unbiased fashion. See J Gonik, “Tie Salesmen’s Bonuses to Their Forecasts,” HarvardBusiness Review, 1978, pp. 116–23; M Weitzman, “The New Soviet Incentive Model,” Bell Journal ofEconomics, Spring 1976, pp. 251–57; and A Kirby, S Reichelstein, P Sen, and Y Paik, “Participation, Slack, andBudget-Based Performance Evaluation,” Journal of Accounting Research, Spring 1991, pp. 109–28.
7T Libby and M Lindsay, “Beyond Budgeting or Better Budgeting,” Strategic Finance, August 2007, p. 50.
As the earlier examples describe, budgeting systems perform several functions withinfirms, including decision management and decision control. In decision management,budgets serve to communicate specialized knowledge about one part of the organizationto another part. In decision control, budgets are part of the performance measurement sys-tem. Because budgets serve several purposes, trade-offs must be made when a budgetingsystem is designed or changed. The budget becomes the benchmark against which tojudge actual performance. If too much emphasis is placed on the budget as a performancebenchmark, then managers with the specialized knowledge will stop disclosing unbiasedforecasts of future events and will report conservative budget figures that enhance theirperformance measure.
The trade-off between decision management and decision control is best illustrated inmarketing. Salespeople usually have specialized knowledge of future sales. This informa-tion is important in setting production plans. But if budgeted sales are used to evaluate salesreps at the end of the year (i.e., actual sales are compared with budget), then sales reps havean incentive to ex ante underforecast future sales, thus improving their ex post performanceevaluation. However, production plans will then be too low and the firm will not be able toplan the most efficient production schedules.6 For example, suppose the salespeople un-derforecast sales by 20 percent. When actual sales are higher than the plant expects, over-time must be paid to produce the extra units. It would have been cheaper to expand theplant’s permanent work force.
An important lesson from this chapter is that whenever budgets are used to evaluatemanagers’ performance and then to compensate (or promote) them based on their perfor-mance relative to the budget target, strong incentives are created for these managers togame the system. Even subjective performance evaluations based on meeting or exceedingthe budget create dysfunctional behavior. Gaming occurs in both the budget-settingprocess and in the actions managers take during the year to achieve the budgeted targets.Most companies report that budgeting induces dysfunctional behaviors, including negoti-ating easier targets to help ensure they will receive bonuses (“sandbagging”), spendingmoney at the end of the year to avoid losing it in the next budget period, deferring neededspending (maintenance and advertising) to meet the budget, accelerating sales near the endof the period to achieve the budget, and taking a “big bath” when budgets cannot beachieved in order to lower next year’s budgets. In rare cases, trying to achieve budget tar-gets has induced managers to commit fraud by recording fictitious revenues or misclassi-fying expenses as assets.7
Using historical data on past performance is a common mechanism for setting next year’sbudget. Unfortunately, it often leads to a perverse incentive called the ratchet effect. Theratchet effect refers to basing next year’s standard of performance on this year’s actualperformance. However, performance targets are usually adjusted in only one direction—upward. A bad year usually does not cause subsequent years’ targets to fall. For example, ifthis year’s sales budget is $1 million and the salesperson sells $1.3 million, next year’s salesbudget becomes $1.3 million. However, if actual sales are only $0.9 million, next year’sbudget is not cut back to $0.9 million.
2. BudgetRatcheting
1. CommunicatingSpecializedKnowledge versusPerformanceEvaluation
zim36725_ch06_229-301.qxd 12/15/09 12:43 PM Page 242

H. J. Heinz, a producer of processed food (best known for its catsup) sets next year’sprofit center budgets at the greater of 115 percent of either last year’s budget or last year’sactual results. For example, if last year’s budgeted earnings were $10 million and actualearnings were $11 million in a particular profit center, next year’s profit for this center wouldbe budgeted at $12.65 million ($11 million � 115%). However, if earnings last year wereonly $9 million, next year’s budget would be $11.5 million ($10 million � 115%). Thus, atHeinz budgeted earnings only increase. One study of a large international conglomeratefound that when the actual earnings of a subsidiary exceed budgeted earnings by, say,$100,000, the next year’s budget is increased by $90,000. However, if actual earnings fallshort of the budget by $100,000, next year’s budget is only reduced by $40,000.8 Hence,favorable budget variances are more likely to lead to larger increases than unfavorablevariances are to lead to decreases.
This “ratcheting up” of budgets causes employees to temper this year’s better-than-budgeted performance to avoid being held to a higher standard in future periods. Manyillustrations of dysfunctional behavior induced by the ratchet effect exist:
• In the former Soviet Union, central planners would set a plant’s production quotabased on past experience. Plant managers meeting their targets received various
Budgeting 243
ManagerialApplication:Budgets Usedfor DecisionManagementand Control
A survey of British financial managers asked them to evaluate the importance of their firm’sbudgets for planning, control, and evaluation. The table below summarizes the results.
Not very Important Important orAlmost or Extremely
Irrelevant (%) Important (%)
Overall 5.1 94.9Planning 2.5 97.5Control 5.0 95.0Co-ordination 17.5 82.5Communication 17.5 82.5Authorisation 10.0 90.0Motivation 37.5 62.5Performance evaluation 12.5 87.5
There are three interesting insights from this survey:• Budgets are important overall.• Budgets are important for decision management (planning and coordination) and
control (control, motivation, and performance evaluation).• While 87.5 percent of the managers believe budgets are important for performance
evaluation, only 62.5 percent report they are important for motivation. This seemsto suggest problems exist in using budgets to motivate people. One possible expla-nation is that managers game their budgets and this reduces the budget’s usefulnessas a motivational tool.
SOURCE: CIMA and ICAEW, “Better Budgeting: A Report on the Better Budgeting Forum,” July 2004.
8 A Leone and S Rock, “Empirical Tests of Budget Ratcheting and Its Effect on Managers’ DiscretionaryAccrual Choices,” Journal of Accounting and Economics, February 2002.
zim36725_ch06_229-301.qxd 12/15/09 12:43 PM Page 243

rewards and those missing the target were punished. This created incentives formanagers to just barely exceed their quota.
• Companies often base a salesperson’s bonus on meeting a sales target that is based onlast year’s sales. If salespeople expect an unusually good year, they will try to defersome sales into the next fiscal year. They may take a customer’s order but delayprocessing it until the next fiscal year.
• In one company, each department’s target was based in part on last year’s performanceplus an increase. This created incentives for managers to defer making big producti-vity improvements in any one year, preferring instead to spread them over severalyears.9
Why do firms ratchet up their budgets given the perverse incentives induced? One pos-sible reason is that even more perverse incentives might arise if they don’t. For example,one simple solution to the dysfunctional incentives arising from the ratchet effect is to elim-inate budget targets completely and simply base salespeople’s salary on actual sales.Assume that budgeted sales next year are $1 million. Instead of paying a commission of10 percent on all sales of more than $1 million, pay a commission of 2 percent on totalsales. Suppose that both commission schemes have the same expected compensation. The10 percent commission gives the employee five times the incentive (10 percent versus2 percent) to make an additional sale. Thus, eliminating the $1 million target reduces thecommission rate and hence the employee’s marginal incentives.
Asking the salespeople to estimate next year’s sales instead of ratcheting up nextyear’s target based on this year’s actual sales eliminates the perverse incentives of theratchet effect. However, this alternative creates another problem. In particular, salespeo-ple will forecast next year’s sales far below what they expect to sell, thereby increasingtheir expected compensation and communicating too low an expected sales forecast tomanufacturing.
Or, instead of ratcheting up to set next year’s budget, a central planning group can pre-pare top-down budgets by using past sales and cost patterns, macroeconomic trends, andcustomer surveys. But this central forecasting group might be more expensive than a sim-ple ratcheting-up budget algorithm. The direct costs of preparing budgets centrally (per-sonnel and occupancy costs) could exceed the indirect costs from dysfunctional decisionmaking induced by the ratchet effect.
244 Chapter 6
9 R Kaplan and A Sweeney, “Peoria Engine Plant (A),” Harvard Business School Case 9-193-082.
ManagerialApplication:Budgeting atBest Buy
At Best Buy, with more than 1,100 retail stores across the United States, Canada, andChina selling consumer electronics, home-office products, entertainment software,appliances, and related services, budgeting was a nightmare. It was time consumingand was not helpful at assembling knowledge. Corporate-level planners made broadassumptions about what each store would sell and the resources needed to meet theirtargets. Best Buy spent four years revamping its budgeting and planning system. First,Best Buy pushed the planning down to the district managers, and then to the stores.The districts and the stores have firsthand knowledge of what the customers want andwhere the opportunities for cost savings lie. A senior finance analyst at Best Buy states,“There is a gap between what the store managers know about their operations and whatcorporate knows.”
SOURCE: D Durfee, “The Last Mile,” CFO, January 2007, pp. 49–55.
zim36725_ch06_229-301.qxd 12/15/09 12:43 PM Page 244

Another way to reduce the problems caused by ratcheting up each year’s performancetargets is more frequent job rotation. If you know that next year someone else has to meetthe sales figures you achieve this year, you will sell more now. However, job rotationdestroys job-specific human capital such as customer-specific relationships.
In summary, while the ratchet effect creates dysfunctional behavior, the alternativesmight prove more costly. In essence, one agency problem is replaced with another one.Depending on the particular situation, senior managers must choose the lesser of thetwo evils.
The trade-off between decision management and decision control is often viewed as atrade-off between bottom-up and top-down budgeting. Bottom-up budgets are those sub-mitted by lower levels of the organization to higher levels and usually imply greater deci-sion management. An example of a bottom-up budget is the field sales offices’ submissionof their forecasts for next year to the marketing department. A top-down budget would bethe marketing department’s use of aggregate data on sales trends to forecast sales for theentire firm and then its disaggregation of this firmwide budget into field office targets.This top-down budget provides greater decision control. Bottom-up budgeting, in whichthe person ultimately being held responsible for meeting the target makes the initial bud-get forecast, is called participative budgeting.
Participative budgeting supposedly enhances the motivation of the lower-level partici-pants by getting them to accept the targets. Whether budgeting is bottom-up or top-downultimately depends in part on where the knowledge is located. If the field salespeople havethe knowledge, this would tend to favor a bottom-up approach to link the knowledge anddecision rights. If the central marketing organization has better knowledge, a top-downbudget is likely to prove better. Which budgeting scheme provides better motivation ulti-mately depends on how the performance measurement and performance reward systemsare designed.
3. ParticipativeBudgeting
Budgeting 245
ManagerialApplication:ImprovingBudgeting
Budgeting is the bane of many executives. About 55 percent of executives say budgetingis too time consuming, 65 percent believe budgets are slow to detect problems, 50 per-cent think they quickly get out of date, and 35 percent see budgets as disrupting coop-eration within their firms. At Nortel, budgets contained up to 100 line items for eachunit and took four to five months to prepare. After streamlining the process by better ty-ing the budget to strategic objectives, Nortel now reports only eight line items on arolling quarterly basis.
Technology is improving budgeting. Web-based software is replacing numerous non-standard spreadsheets submitted by operating divisions that often have to be reentered andconsolidated with other divisions’ spreadsheets. For example, within one company each of28 operating units would e-mail or send on diskette its own spreadsheet, which corporatewould have to rekey or upload to create a consolidated budget. Just making simplechanges delayed the process and maintaining all the spreadsheets cost $100,000 a year.Browser-based budgeting software now allows divisions to enter and revise data remotelyusing a standard format and allows corporate managers access to the consolidated num-bers instantly. Conexant Systems Inc., a supplier of semiconductor products, uses a Web-based budgeting tool to manage 1,200 cost centers that each use up to 500 accounts. Costcenter managers enter their own budget data with less help from financial analysts.
SOURCE: T Reason, “Building Better Budgets,” CFO, December 2000, pp. 91–98; D Dufee, “Alternative Budgeting,” CFO,June 2006, p. 28; and T Libby and M Lindsay, 2007, p. 49.
zim36725_ch06_229-301.qxd 12/15/09 12:43 PM Page 245

A survey of 98 Standard & Poor’s 500 U.S. companies found that these firms use par-ticipative budgeting more frequently when lower-level managers have more knowledgethan central management.10 Participative budgeting is more frequently observed whenmanagers’ rewards are based on the performance against the budget. Likewise, the use ofbudget-based incentives and the extent of specialized knowledge held by lower-level man-agers are positively correlated. This evidence is consistent with budgets and performancereward systems’ being designed to link decision-making rights and specialized knowledge.
Once the budget is set, it becomes the target by which performance is evaluated andrewarded. Some experts argue the budget should be “tight” but achievable. If budgets are tooeasily achieved, they provide little incentive to expend extra effort. If budgets are unachievable,they provide little motivation. As discussed earlier, most budgets are set in a negotiationprocess involving lower- and higher-level managers. Lower-level managers have incentives toset a loose target to guarantee they will meet the budget and be favorably rewarded. Higher-level managers have incentives to set a tight target to motivate the lower-level managers to ex-ert additional effort. A study of 54 profit center managers in 12 corporations found thatbudgeted profits were set so that they were achieved 8 or 9 years out of 10.11 These managersreported that these loose budgets improved resource planning, control, and motivation.
The trade-off between decision management and decision control in budgeting creates ten-sion between the two roles, and these tensions lead to criticism. Budgets are criticized oftenbecause they:
• Are time consuming to construct.
• Add little value.
• Are developed and updated too infrequently.
• Are based on unsupported assumptions and guesswork.
• Constrain responsiveness and act as a barrier to change.
• Are rarely strategically focused and often contradictory.
• Strengthen vertical command and control.
• Concentrate on cost reduction.
• Encourage gaming and perverse behaviors.
• Do not reflect emerging network structures organizations are adopting.
• Reinforce departmental barriers rather than encourage knowledge-sharing.
• Make people feel undervalued.
The widespread dissatisfaction with budgeting arises, in part, because budgets are soubiquitous. If budgeting wasn’t as pervasive, fewer complaints would arise. Many firms areseeking to improve their budgeting process, while others are abandoning it altogether. Onereason firms retain their budgets is because budgets often remain the only central coordi-nating mechanism within the firm.
Two different approaches are proposed to improve the budgeting process.12 Onemethod involves building the budget in two distinct steps. The first step, which involves thelowest levels of the organization, is to construct budgets in operational, not financial terms.
4. NewApproaches to Budgeting
246 Chapter 6
10 M Shields and S Young, “Antecedents and Consequences of Participative Budgeting: Evidence on theEffects of Asymmetrical Information,” Journal of Management Accounting Research, 1993, pp. 265–80.
11 K Merchant and J Manzoni, “The Achievability of Budget Targets in Profit Centers: A Field Study,”Accounting Review 64 (July 1989), pp. 539–58.
12 S Hansen, D Otley, and W Van der Stede, “Practice Developments in Budgeting: An Overview andResearch Perspective,” Journal of Management Accounting Research 15 (2003), pp. 95–116.
zim36725_ch06_229-301.qxd 12/15/09 12:43 PM Page 246

At this step, budgeting requires data about estimated demand for resources and outputsstated in nonfinancial terms such as units of output, hours of various types of labor, andconsumption rates of resources. Operational budgets are in balance when resource con-sumption requirements equal the resources available for each resource required to oper-ate the firm. The second step develops a financial plan based on the operational plansdeveloped in step one. This two-step process makes the budgeting process more repre-sentative of how the organization actually operates by balancing operational require-ments. The first step provides a more sophisticated model for balancing capacity.Lower-level managers more easily understand and communicate information in opera-tional rather than financial terms. Lower-level managers’ specific knowledge is usuallycouched in nonfinancial terms, and the first step of the process utilizes their specificknowledge directly.
However, this approach is more costly than traditional budgets (which are stated infinancial terms only) because the additional detailed information about individualresources must be collected and managed. Also, this approach, at least as described by itsproponents, does not involve a third step whereby the organization iterates between stepsone and two until all the various inconsistencies are resolved. For example, consider apackage delivery company. Assume that a particular resource such as the number ofdelivery vans and the number of orders expected to be delivered are in balance. Duringbudget construction, senior marketing executives learn that the average size of each ship-ment is expected to increase. This increase in the average shipment size must be com-municated to the executive responsible for managing the fleet. With a larger averagepackage size, the firm might not have enough capacity to deliver the same number ofpackages. The firm has to decide whether to increase fleet size, acquire larger trucks,raise the price of deliveries (to reduce the quantity shipped), or some combination of thethree. A cost-benefit trade-off must be made somewhere in the firm. Exactly how and
Budgeting 247
ManagerialApplication:Microsoft’sNewBudgetingSystem
Microsoft Corp., with 60,000 employees in 99 countries, was reorganized into seven dis-tinct businesses. The budgeting system also changed. Prior to the change, Microsoft’scentralized management proved too unwieldy, and its software engineering groups hadlittle responsibility for sales. After the reorganization, each business group had its ownCFO responsible for that group’s strategy, budgeting, and analysis of market perfor-mance and operating expenses. Each of the seven businesses has a budget based on itsown product-development strategy and on the firmwide corporate strategy.
The budget process consists of the following steps:
1. Each business reviews its strategy, proposed changes, and investments at theend of June with the CEO.
2. July involves a “deep midyear review” that examines operational trends bygeography, business lines, and channels. Based on this evaluation the corporateoffice begins setting targets for each group.
3. Once preliminary targets are set by the corporate office, the CEO meets witheach business group about the “ambition” for the next year. “Ambition” is theMicrosoft CEO’s expectation for that business group in terms of revenuegrowth, earnings, and product development.
4. After the CEO and each business group reach a consensus on the overalltargets, then the detailed budgeting begins—roughly an eight-week effort.
SOURCE: T Reason, “Budgeting in the Real World,” CFO, July 2005, pp. 43–48.
zim36725_ch06_229-301.qxd 12/15/09 12:43 PM Page 247

where this analysis and decision occurs is not specified by the proponents of the two-stepapproach to improving budgeting.
A second approach to improve budgeting involves breaking the so-called “annual per-formance trap.” This approach does not use budgets as performance targets. Budgets arestill constructed for financial planning (decision management), but they are not used forperformance evaluation. Rather, firms use relative performance targets of other units orfirms and compare these peer-units’ performance to the actual performance achieved by theunit being judged. First a peer benchmark group is set for each budget unit. The bench-marks are either different units in the same firm or their leading competitors. Then theunit’s actual achieved performance is compared to the actual performance achieved by thebenchmark. Actual rewards are then determined subjectively, taking into account not justthe benchmark’s performance but other financial and nonfinancial performance measures.This approach to improving the budget process decouples financial planning, informationcommunication, and coordination (decision management) from performance evaluationand performance rewards (decision control). Proponents of this approach claim that bydecoupling decision management and decision control, decision management is improvedbecause executives have less incentive to game the initial budget estimates. However, theuse of relative performance evaluations and subjective evaluations are not without prob-lems. Managers still have incentives to game how the benchmarks are chosen. There are noguarantees that the managers making the subjective evaluations will do so in an unbiasedway, and therefore there is no guarantee that the person being evaluated based in part on theperformance of some peer group will accept such an assessment without undue griping orwithout exerting undue influence costs.
No simple “one-size-fits-all” panacea exists for resolving the conflict between decisionmanagement versus decision control when it comes to budgeting. Nor is such a solution everlikely to be found. Budgets perform both decision management and decision control roles,
248 Chapter 6
ManagerialApplication:Why BudgetsAre Bad forBusiness
Budgets are often criticized for controlling the wrong things, like head count, and formissing the right things, such as quality and customer service. Often they erect walls be-tween various parts of the company. Moreover, because a budget was not overspent doesnot mean it was well spent. Budgets are good at tracking spending. But big problemsarise when the budget becomes management's main tool for gauging performance andfor compensating managers.
When managers’ pay is based on meeting their budget, they start doing dumbthings. First, they have strong incentives to distort their budgets to make them easier toachieve. These distortions bias the transmission of information needed to coordinate thedisparate parts of the firm. Second, managers game their actual performance to meetthe current targets or to set more favorable future budgets.
These criticisms fail to recognize that budgeting systems are almost universallyused and have survived. Thus, they must be yielding benefits at least as large as theircosts. The question is whether even more dysfunctional behavior arises when budgetsare not used. The fact that so many firms use budgets suggests that forgoing budgets isan unlikely formula for success.
Budgeting critics rarely address the benefits such systems provide that allow thesesystems to survive. Moreover, most of the dysfunctional behaviors created by budgetscan be resolved by not tying pay to meeting the budget.
SOURCE: M Jensen, “Paying People to Lie: The Truth about the Budgeting Process,” European Financial Management 9(September 2003), pp. 379–406.
zim36725_ch06_229-301.qxd 12/15/09 12:43 PM Page 248

Budgeting 249
13 McKinsey (1922), pp. 44–45.
and each firm must find the solution that best fits its unique circumstances at that pointin time. Budgeting processes (and associated compensation schemes) will evolve as thefirm’s circumstances change.
To manage the trade-off between decision management and decision control, many organi-zations put the chief executive officer in charge of the budgeting process. While the actualcollection of data and preparation of the budget are formal responsibilities of the chieffinancial officer or controller, the president or CEO has the final decision rights. There areseveral reasons for the chief executive to have ultimate control. First, it signals the impor-tance of the budgeting process. Second, the CEO has the specialized knowledge and theoverall view of the entire firm to make the trade-offs needed to resolve disagreementsamong departments regarding key planning assumptions or coordination of activities.McKinsey writes,
[T]he sales department may desire to sell more than the production department thinks it canproduce profitably, or the production department may desire to produce articles which the salesdepartment does not think it can sell, or both the sales and production departments may desireto increase their activities beyond what the financial department thinks can be financed. Obvi-ously the only authority who can decide these questions is the chief executive who is superiorto all executives interested in the controversy.13
In addition to placing the chief executive in charge of the budgeting process, manyfirms use a budget committee consisting of the major functional executives (vice presidentsof sales, manufacturing, finance, and personnel), with the CEO as chair. This committeeseeks to facilitate the exchange of specialized knowledge and reach consensus on the keyplanning assumptions. In essence, no budget or estimate is accepted until the budget com-mittee approves. Then all the various parts of the organization agree to the inherent ex-changes among the various parts of the organization. The budget is the informal set ofcontracts between the various units of the organization.
Q6–8 Why would managers bias their forecasts when preparing abudget?
Q6–9 What is a bottom-up budgeting system?
Q6–10 What is the ratchet effect?
Q6–11 Describe participative budgeting.
C. Resolving Organizational ProblemsAs the three examples in section A illustrate, budgeting systems are an administrative de-vice used to resolve organizational problems. In particular, these systems help (1) linkknowledge with the decision rights and (2) measure and reward performance. The BayView Country Club example illustrates how budgets provide performance measurements.The Eastern University example illustrates the concepts of cost centers and profit centersand how budgets assign decision rights. The Xerox Corporation example illustrates thelinking of knowledge and decision rights. This section further describes various budgetingdevices, such as short-run versus long-run budgets, line-item budgets, budget lapsing, flex-ible budgets, and incremental versus zero-based budgets.
ConceptQuestions
5. Managing theTrade-Off
zim36725_ch06_229-301.qxd 12/15/09 12:43 PM Page 249

250 Chapter 6
ManagerialApplication:Lenders WantFive-YearBudgets
Firms prepare long-run budgets for a variety of reasons. One reason is that their bankers de-mand to see budgets that cover the period of the loans extended to the company. Many bankloans are for three to five years. Bank of America often requires borrowers to produce fore-casts that cover the duration of nearly any loan request: “We’re looking for the cash-flowperspective and how we’re getting paid. We build our loan agreements and covenants onthat information. We’re obviously asking so we understand the risk of a deal.”
One company CFO who finds the process very useful says, “We do five-year plansto give ourselves a longer-term view to achieve long-term growth goals.”
SOURCE: K Frieswick, “The Five-Year Itch,” CFO, February 2003, pp. 68–70.
The budgeting examples in section A described annual budgeting processes. Starting in theprior year, firms develop detailed plans of how many units of each product they expect tosell at what prices, the cost of such sales, and the financing necessary for operations. Thesebudgets then become the internal “contracts” for each responsibility center (cost, profit,and investment center) within the firm. These annual budgets are short-run in the sensethat they project only one year at a time. But most firms also project 2, 5, and sometimes10 years in advance. These long-run budgets are a key feature of the organization’s strate-gic planning process.
Strategic planning refers to the process whereby managers select the firm’s overallobjectives and the tactics to achieve them. It involves deciding what markets to be in, whatproducts to produce, and what price-quality combinations to offer. For example, Time Warnerfaces the strategic question of whether to provide local telephone service in its cable markets.Making this decision requires specialized knowledge of the various technologies Time Warnerand its competitors face, in addition to knowledge of the demand for various future products.Strategic planning also addresses questions of what the organization’s future structure must beto support the strategy, including future R&D and capital spending and the financial structure.
Like short-run budgets, long-run budgets force managers with specialized knowledgeto communicate their forecasts of future expected events under various scenarios. Long-runbudgets contain future capital budgeting forecasts (and thus financing plans) required toimplement the strategy. R&D budgets are long-run plans of the multiyear spendingrequired to acquire and develop the technologies to implement the strategies.
In short-run budgets, the key planning assumptions involve quantities and prices. Allparts of the organization must accept these annual key assumptions. In long-run budgets,the key planning assumptions involve what markets to be in and what technologies toacquire.
Chapter 3 described capital budgeting. Before accepting a new investment, the futurecash flows from that investment are projected. Capital budgets are long-run budgets foreach project.
A typical firm integrates short-run and long-run budgeting into a single process. Asnext year’s budget is being developed, a five-year budget is also produced. Year 1 of thefive-year plan is next year’s budget. Years 2 and 3 are fairly detailed and year 2 becomes thebase to establish next year’s one-year budget. Years 4 and 5 are less detailed but begin tolook at new market opportunities. Each year, the five-year budget is rolled forward one yearand the process begins anew.
The short-run (annual) budget involves both decision management and decision controlfunctions, and as discussed earlier a trade-off arises between these two functions. Long-runbudgets are hardly ever used as a decision control (performance evaluation) device. Rather,
1. Short-Runversus Long-RunBudgets
zim36725_ch06_229-301.qxd 12/15/09 12:43 PM Page 250

long-run budgets are used primarily for decision management. Five- and 10-year budgetsforce managers to think strategically and to communicate the specialized knowledge of theirfuture markets and technologies. Thus, long-run budgets emphasize decision managementmore than decision control because less reliance is placed on using them as a performancemeasurement tool.
Long-run budgets also reduce managers’ focus on short-term performance. Withoutlong-term budgets, managers have an incentive to cut expenditures such as maintenance,advertising, and R&D to improve short-run performance or to balance short-term budgets
Budgeting 251
ManagerialApplication:RollingBudgets
Many companies, such as Cisco, are replacing their static annual budgets with rolling18-month budgets. Static annual budgets often become out of date. At the end of the fis-cal year, when sales targets are missed, massive price discounts are offered to boostsales. Instead of preparing an annual budget that remains static for the year, companiessuch as Cisco produce an 18-month budget and then update the projections every month.So at the end of January, the monthly budgets for the next 17 months are revised andJuly of next year is added. In effect, the whole budget for the remainder of the year andthe first five months of next year is recalculated and a new month 18 is added. Unlikestatic annual budgets, managers are encouraged to react more quickly to changing eco-nomic or business conditions. Rolling budgets force managers to better integrate plan-ning and execution.
SOURCE: R Myers, “Budgets on a Roll,” Journal of Accountancy, December 2001, pp. 41–46; and M Astley, “IntranetBudgeting,” Strategic Finance, May 2003, pp. 30–33.
Exercise 6–2
Two Internet-based, e-commerce companies were started about two years ago and both went
public last month. They have about the same number of employees, but they offer different
services (i.e., they are not competitors). Both firms use a one-year budgeting process, but only
one firm supplements its annual budget with a three-year budget.
Required:
Offer some plausible reasons why one firm uses only an annual budget and the other firm uses
both an annual and a three-year budget.
Solution:
One-year (or short-term) budgets are used as both decision management and decision control
mechanisms. They help assemble knowledge for decision making and are also used as bench-
marks in performance evaluation. Obviously, these two functions involve trade-offs. Three-
year budgets are used almost exclusively as planning documents to help assemble information
for decision making. The executives in the company using both one- and three-year budgets
must believe first that they (and their colleagues) have substantial specialized knowledge of
long-term (three-year) cash flows and trends and second that the benefits of assembling this
knowledge outweighs the costs of preparing the three-year budget. The nature of the knowl-
edge held by the managers in the other company must be of shorter duration.
Also, the company with the three-year budget might be worried that only using a one-year
budget creates short-run incentives for managers to cut spending on R&D and advertising.
zim36725_ch06_229-301.qxd 12/15/09 12:43 PM Page 251

at the expense of the long-term viability of the organization. Budgets that span five yearshelp alert top management and/or the board of directors to the long-term trade-offs beingtaken to accomplish short-run goals.
Some firms use rolling budgets. A rolling budget covers a fixed time period, such asone or two years. A future period is added as the current period concludes. For example,suppose a two-year rolling budget is used with quarterly intervals. When the current quar-ter is concluded, a new quarter (two years ahead) is added. In this way, management isalways looking at a two-year planning horizon.
Line-item budgets refer to budgets that authorize the manager to spend only up to the spec-ified amount on each line item. For example, consider Table 6–3. In this budget, the man-ager is authorized to spend $12,000 on office supplies for the year. If the supplies canbe purchased for $11,000, the manager with a line-item budget cannot spend the $1,000savings on any other category such as additional office equipment. Because the managercannot spend savings from one line item on another line item without prior approval, themanager has less incentive to look for savings. If next year’s line item is reduced by theamount of the savings, managers have even less incentive to search for savings.
Line-item budgets reduce agency problems. Managers responsible for the line-itembudgets cannot reduce spending on one item and divert the savings to items that enhancetheir own welfare. By maintaining tighter control over how much is spent on particularitems, the organization reduces possible managerial opportunism.
Line-item budgets are quite prevalent in governments. They also are used in somecorporations, but with fewer restrictions. Line-item budgets provide more control. Themanager does not have the decision rights to substitute resources among line items as cir-cumstances change. To make such changes during the year requires approval from a higherlevel in the organization.
Line-item budgets illustrate how the budgeting system partitions decision rights,thereby controlling behavior. In particular, a manager given the decision rights to spend upto $3,000 on office equipment does not have the decision rights to substitute office equip-ment for postage.
A survey of large publicly traded firms found that among units reporting directly to theCEO, 23 percent cannot substitute among line items, 24 percent can substitute if they receiveauthorization, 26 percent can make substitutions within specified limits, and 27 percent cansubstitute among line items to improve the unit’s financial objective.14 These findings sug-gest that line-item budgets are prevalent even at fairly high levels in for-profit firms.
2. Line-ItemBudgets
252 Chapter 6
TABLE 6–3 Line-Item Budget Example
Line Item Amount
Salaries $185,000Office supplies 12,000Office equipment 3,000Postage 1,900Maintenance 350Utilities 1,200Rent 900
Total $204,350
14 A Christie, M Joye, and R Watts (2001).
zim36725_ch06_229-301.qxd 12/15/09 12:43 PM Page 252

Governments use encumbrance accounting in addition to line-item budgets. Whencontracts for purchases are signed or purchase orders are issued, even though no legalliability for the goods or services exists until delivery occurs, encumbrance accountingrequires the dollar amounts of such goods and services to be recorded in special encum-brance accounts. When the goods and services are delivered, the encumbrance entry isreversed and the purchase is charged to the appropriate line-item expenditure. By addingthe actual purchases to the outstanding encumbrance, those responsible for monitoring theintegrity of the budget can ensure that line-item spending authority is maintained.15
Another common feature is budget lapsing, in which unspent funds do not carry overto the next year. Budget lapsing creates incentives for managers to spend all their budget.Otherwise, not only do managers lose the benefits from the unspent funds, but next year’sbudget may be reduced by the amount of the underspending.
Budgets that lapse provide tighter controls on managers than budgets that do not lapse.However, the opportunity cost of lapsing budgets can be less-efficient operations. Man-agers devote substantial time at the end of the year spending their remaining budget, evenif it means buying items that have lower value (and a higher cost) than they would purchaseif they could carry the remaining budget over to the next fiscal year. Often the firm incurssubstantial warehousing costs to hold the extra end-of-year purchases. In one example, aNavy ship officer purchased an 18-month supply of paper to spend his remaining budget.The paper weighed so much that it had to be stored evenly around the ship to ensure theship did not list to one side.
In addition, budgets that lapse reduce managers’ flexibility to adjust to changing oper-ating conditions. For example, if managers have expended all of their budget authority andthe opportunity to make a bargain purchase arises, they cannot borrow against next year’sbudget without getting special permission.
Without budget lapsing, managers could build up substantial balances in their budgets.Toward the end of their careers or before taking a new job in the same firm, these managerswould then be tempted to make very large expenditures on perquisites. For example, they couldtake their staff to Hawaii for a “training retreat.” Budget lapsing also prevents risk-averse man-agers from saving their budget for a rainy day. If it is optimum for a manager to spend a certainamount of money on a particular activity, then saving part of that amount as a contingency fundis not optimum. One way to prevent these agency problems is for budgets to lapse.
As in the case of budget ratcheting, the use of budget lapsing (or not) involves a choicebetween two evils. Agency costs can not be driven to zero; they can only be minimized.
All of the examples in this chapter so far have presented static budgets, which do not varywith volume. Each line item is a fixed amount. In contrast, a flexible budget is stated as afunction of some volume measure and is adjusted for changes in volume. Flexible budgetsprovide different incentives than do static budgets.
As an example of flexible budgeting, consider a concert where a band is hired for $20,000plus 15 percent of the gate receipts. The auditorium is rented for $5,000 plus 5 percent of thegate receipts. Security guards costing $80 apiece are hired, one for every 200 people. Adver-tising, insurance, and other fixed costs are $28,000. Ticket prices are $18 each. A flexible bud-get for the concert is presented in Table 6–4.
Each line item in the budget is stated in terms of how it varies with volume (ticket salesin this case). Budgets are then prepared at different volume levels. At ticket sales of 3,000,an $11,000 loss is projected. At sales of 4,000 and 5,000 tickets, $3,000 and $17,000 ofprofits are forecasted, respectively.
4. Static versusFlexible Budgets
3. Budget Lapsing
Budgeting 253
15 S Sunder, Theory of Accounting and Control (Cincinnati, OH: South-Western Publishing, 1997), pp. 196–97.
zim36725_ch06_229-301.qxd 12/15/09 12:43 PM Page 253

Flexible budgets are better than static budgets for gauging the actual performance of aperson or venture after controlling for volume effects—assuming, of course, that the indi-vidual being evaluated is not responsible for the volume changes. For example, 5,000 peo-ple attended the concert. Table 6–5 compares actual results with the flexible budget for5,000 tickets. Total profits were $4,100 less than expected. Most of the difference—$3,000—resulted from not being able to sell all 5,000 tickets at $18 each. To sell 5,000 tick-ets, some were sold at a discount. The actual cost of the auditorium was $9,900 instead of the$9,500 estimated by the flexible budget. The additional $400 was for damage. The budget forthe auditorium is automatically increased to $9,500 due to the 5,000 ticket sales, and the man-ager is not held responsible for volume changes. However, the manager is held responsible forthe $400 difference that resulted from damage. Finally, “other costs” were higher by $700because the promoters underestimated the cost of the rented sound system.
The key question is, Should managers be held responsible for volume changes if the fac-tors that cause the volume changes are outside their control? The initial reaction is no. Man-agers should be held responsible for volume effects only if they have some control overvolume. However, this reasoning is incomplete. Recall the discussion of the controllabilityprinciple in Chapter 5. If the manager’s actions influence the effects of volume changes, thenthe manager should not be insulated from the volume effects. For example, if managers canreduce inventory holdings of perishable inventories during economic downturns, they shouldbe held accountable for the entire inventory amount. This creates an incentive to take actionsthat mitigate or enhance the effect on the organization of the uncontrollable volume.
254 Chapter 6
TABLE 6–4 Concert Operating Results
Ticket Sales
Formula 3,000 4,000 5,000
Revenues $18N* $ 54,000 $ 72,000 $ 90,000Band $20,000 � 0.15(18N ) (28,100) (30,800) (33,500)Auditorium $5,000 � 0.05(18N ) (7,700) (8,600) (9,500)Security $80(N/200) (1,200) (1,600) (2,000)Other costs $28,000 (28,000) (28,000) (28,000)
Profit/(loss) $ (11,000) $ 3,000 $ 17,000
*N is the number of tickets sold.
TABLE 6–5 Concert Operating Results
Flexible Favorable Budget at Actual (Unfavorable)
5,000 Tickets Results Variance
Revenues $90,000 $87,000 $(3,000)Band (33,500) (33,500) 0Auditorium (9,500) (9,900) (400)Security (2,000) (2,000) 0Other costs (28,000) (28,700) (700)
Profit/(loss) $17,000 $12,900 $(4,100)
zim36725_ch06_229-301.qxd 12/15/09 12:43 PM Page 254

Budgeting 255
Exercise 6–3
August Company’s budget for the month just ended called for producing and selling 5,000
units at $8 each. Actual units produced and sold were 5,200, yielding revenue of $42,120.
Variable costs were budgeted at $3 per unit and fixed costs were budgeted at $2 per unit.
Actual variable costs were $3.30 and fixed costs were $12,000.
Required:a. Prepare a performance report for the current month’s operation.
b. Write a short memo analyzing the current month’s performance.
Solution:a. The performance report for the month is given below:
b. The question to address is whether performance should be gauged against a static
budget or a flexible budget. Column III in the above report benchmarks current
performance against the static budget and shows that while revenues were better
than planned, variable costs more than consumed the favorable revenue variance.
When the unfavorable variance in fixed costs is considered, profits were $2,040
(13.6 percent) below budget.
The last two columns in the table take a different perspective. Here the benchmark
is not the static budget at 5,000 units but rather what the results should have been
given the volume of 5,200 units. In this case, profits fell $3,040 (19 percent) short of
the flexible plan. If our cost structure stayed the same, then a volume of 5,200 units
should have generated profits of $16,000. But variable costs per unit rose more than
prices, causing an unfavorable contribution margin variance of $1,040. When the
$2,000 unfavorable fixed cost variance is included, there is an unfavorable variance
in profits from the flexible budget of $3,040.
Therefore, the question is: Should the managers be held accountable for the
volume changes or not?
AUGUST COMPANYPerformance Report
Current Month
I II III IV VFlexible
Static Variance Budget VarianceBudget Actual (II � I) (at 5,200) (II � IV)
Revenue $40,000 $42,120 $2,120F $41,600* $ 520FLess:
Variable costs 15,000 17,160 2,160U 15,600† 1,560U
Contribution margin $25,000 $24,960 $ 40U $26,000 $1,040ULess:
Fixed costs 10,000 12,000 2,000U 10,000 2,000U
Profits $15,000 $12,960 $2,040U $16,000 $3,040U
NOTE: F = Favorable; U = Unfavorable.
* 5,200 � $8† 5,200 � $3
zim36725_ch06_229-301.qxd 12/15/09 12:43 PM Page 255

256 Chapter 6
When should a firm or department use a static budget and when should it use a flexiblebudget? Since static budgets do not adjust for volume effects, volume fluctuations are passedthrough and show up in the variances. Thus, static budgets force managers to be responsiblefor volume fluctuations. If the manager has some control over volume or the consequences ofvolume, then static budgets should be used as the benchmark to gauge performance. Sinceflexible budgets do adjust for volume effects, volume fluctuations are not passed through anddo not show up in the variances. Flexible budgets do not hold managers responsible forvolume fluctuations. Therefore, if the manager does not have any control over either volumeor the consequences of volume, then flexible budgets should be used as the benchmark togauge performance. Flexible budgets reduce the risk of volume changes borne by managers.
ManagerialApplication:Budgetingduring aGlobalEconomicCrisis
The economic meltdown that started in 2008 with the U.S. subprime mortgage and housingmarkets quickly spread to virtually all sectors of the global economy. When asked why theFederal Reserve did not foresee the pending problems, Alan Greenspan, the former Chairmanof the Fed, remarked, “We’re not smart enough as people. We just cannot see events that farin advance.” Greenspan’s comments capture the sentiment of CFOs and their ability to pre-pare accurate forecasts. A survey found that during the 2008–09 recession, 39 percent offinance executives said they can’t forecast more than one quarter out, 15 percent said theycan’t forecast more than two weeks ahead, and an equal number said, “We are in the dark.”
Because preparing accurate one-year-ahead budgets is so difficult, some firms in-corporate scenario modeling, sensitivity analysis, and contingency planning to identifya wide range of potential situations. Scenario planning creates a set of stories that helpmanagers think about plausible, challenging events and how they might respond if blow-ups occur. As one executive stated, “Plan for the worst and hope for the better.”
The Principal Financial Group, a life and health insurer, uses a comprehensive fore-casting process that includes short- and long-term components with stochastic modelingthat generates various random scenarios. It develops 5-quarter, 5-year, and 10-year fore-casts and then introduces variances to these forecasts to understand the impact on earnings,sales, and assets.
Generating timely, reliable financial forecasts via scenario planning requires managersto identify the key drivers of their business. These drivers consist of those operational mea-sures (such as hours of temporary labor required and associated labor rates in a manufactur-ing plant) that capture how changes in the environment affect the firm. Identifying thesedrivers helps executives implement decisions quickly when unexpected events occur. Whileidentifying these drivers sounds simple, it can be quite complicated, because it requires themanagement team to really understand their firm’s business model. For example, the mostimportant driver of satellite service provider Hughes Communication’s profitability is newconsumer subscriptions. Profit and loss and cash flow forecasts depend critically on newconsumer subscriptions. Forecasted new subscriptions affect whether Hughes launches itsown satellite (a $400 million project) or continues to lease transponders on other satellites.
While it is very important for managers to identify and understand the key driversof their business in order to respond to unforeseen events, the problem still remains ofhow to identify all plausible, yet unforeseen scenarios. Computer simulations and sce-nario planning cannot predict totally unexpected events such as the 9/11 terrorist attacksor the 2008 subprime meltdown.
SOURCE: V Ryan, “Future Tense,” CFO, December 2008, pp. 36–42; and N Taleb, The Black Swan: The Impact of theHighly Improbable (New York: Random House, 2007).
zim36725_ch06_229-301.qxd 12/15/09 12:43 PM Page 256

Budgeting 257
Flexible budgets are more widely used in manufacturing departments than in distribu-tion, marketing, or administration. Flexible budgets are more widely used in manufacturingthan other parts of the firm, because volume measures are readily available.
The preceding examples illustrate how budgets can be adjusted for different levels of vol-ume, but flexible budgeting is more general. Budgets can be adjusted for variables other thanvolume levels, such as market share, foreign currency fluctuations, different rates of inflation,or any other variable outside of the manager’s control that can cause the budget to vary.
Most organizations construct next year’s budget by starting with the current year’s budgetand adjusting each line item for expected price and volume changes. Since most budgetingprocesses are bottom up, where the detailed specialized knowledge resides, lower-levelmanagers submit a budget for next year by making incremental changes in each line item.For example, the manager calculates the line item in next year’s budget for “purchases” byincreasing last year’s purchases for inflation and including any incremental expenditures forvolume changes and new programs. Only detailed explanations justifying the incrementsare submitted as part of the budget process. These incremental budgets are reviewed andchanged at higher levels in the organization, but usually only the incremental changes areexamined in detail. The core budget (i.e., last year’s base budget) is taken as given.
Under zero-based budgeting (ZBB), each line item in total must be justified andreviewed annually. Each line item is reset to zero annually and must be justified in total.Departments must defend the entire expenditure (or program expenditure) each year, notjust the changes. In a zero-based budget review, the following questions are usually asked:Should this activity be provided? What will happen if the activity is eliminated? At whatquality and quantity level should the activity be provided? Can the activity be achieved insome other way, such as hiring an outside firm to provide the goods or service (outsourc-ing)? How much are similar companies spending on this activity?
In principle, zero-based budgeting causes managers to maximize firm value by identi-fying and eliminating those expenditures whose total cost exceeds total benefits. Underincremental budgeting, in which incremental changes are added to the base budget, incre-mental expenditures are deleted when their costs exceed their benefits. But inefficient basebudgets can continue to exist.
In practice, ZBB is infrequently used. It is supposed to overcome traditional incre-mental budgeting, but it often deteriorates into incremental budgeting. Under ZBB, thesame rationales and justifications as last year’s are submitted and adjusted for incrementalchanges. Because the volume of detailed reports is substantially larger under ZBB thanunder incremental budgeting, higher-level managers tend to focus on the changes from lastyear. Moreover, firms usually promote people from within the firm rather than hiring fromoutside. Promotions tend to be vertical within the same department or division. Internallypromoted managers bring with them specific knowledge of their previous job, includingknowledge of previous budgets. Thus, managers reviewing detailed lower-level budgetshave substantial knowledge of those operations, having earlier had decision managementrights over at least some of the operations. These managers often already know the basebudgets and now want to know the changes from the base level.
ZBB is most useful in organizations in which considerable turnover exists in middle-and senior-level ranks. Management turnover destroys specialized knowledge. Also, ZBB isuseful in cases where there has been substantial strategic change or high uncertainty. Forexample, a defense contractor shifting into civilian markets might want to use ZBB. In thesecases, rejustifying each line item annually helps to inform managers with decision controlrights of the total costs and benefits of each department or program. However, ZBB issignificantly more costly to perform than incremental budgeting.
5. Incrementalversus Zero-Based Budgets
zim36725_ch06_229-301.qxd 12/15/09 12:43 PM Page 257

258 Chapter 6
ZBB is often used in government budgets. President Carter used it both in Georgiawhen he was governor and in the federal government during the 1970s. In government,managers with decision management rights tend to be career civil servants in the depart-ments and agencies. Decision control rights are vested in elected officials in the executiveand legislative branches. Elected officials have short tenures in monitoring a specificagency and therefore lack detailed specialized knowledge of the department’s functions.Zero-based budgets are useful in helping these elected officials make trade-offs betweenprograms, as opposed to just making trade-offs among increments to programs.
Q6–12 What are short-run and long-run budgets?
Q6–13 What are the advantages and disadvantages of line-itembudgets?
Q6–14 Why do some organizations practice budget lapsing? Whatare the disadvantages?
Q6–15 Define static and flexible budgets. Discuss their advantagesand weaknesses.
Q6–16 Define incremental and zero-based budgeting. Discuss theiradvantages and weaknesses.
D. SummaryBudgets are an important mechanism for resolving firms’ organizational problems. Budgets helppartition decision rights and provide a benchmark against which performance can be measured.By preparing a budget, each unit in the organization implicitly recognizes the decision rights it hasauthority to exercise.
The advantages of budgeting consist of
1. Coordination of sales, production, marketing, finance, and so forth.
2. Formulation of a profitable sales and production program.
3. Coordination of sales and production with finances.
4. Proper control of expenditures.
5. Formulation of a financial program including investment and financing.
6. Coordination of all the activities of the business.
The process of building a budget via a bottom-up, top-down iterative procedure involvesassembling specialized knowledge. Budgeting is a negotiation and consensus-building exercise. Thus,budgeting is part of the decision management process. Budgets are also used in decision control. Inpractice, budgeting involves a trade-off between decision making and control. Ideally, the budget sys-tem helps link specialized knowledge and decision rights, thus improving decision making. But if thebudget is also used for control and incentives are provided for meeting it, then managers will biastheir forecasts during budget preparation to enhance their reported performance relative to their fore-cast. Again, designers of the budgeting and performance evaluation systems must trade off more ac-curate forecasts (transfers of specialized knowledge) for incentive effects (control). We return to theseincentive effects of budgeting and variance analysis again in Chapters 12 and 13.
One way to prevent managers from biasing their budgets is to set the budgets at the top, andone top-down method is referred to as the ratchet effect. Here, next year’s budget is set based on lastyear’s deviation of actual from budget. When last year’s actual results are better than budget, nextyear’s budget increases by more than it would fall were last year’s actual results to fall short of lastyear’s budget. This simple ratcheting up of budgets means that managers no longer need to set theirown budgets, but it creates incentives for them to hold back effort when they are having a good yearto prevent next year’s budget from being too challenging.
ConceptQuestions
zim36725_ch06_229-301.qxd 12/15/09 12:43 PM Page 258

Budgeting 259
Short-run budgets involve both decision management and decision control. Long-run budgets(3 to 10 years) place less emphasis on decision control. Managers are less likely to be held responsiblefor meeting long-term budget targets than short-term budget goals because long-term budgets are usedfor information sharing.
Line-item budgeting and budget lapsing are devices that constrain managers’ decision rights.Line-item budgets prevent managers from shifting resources across different line items in the budget.Budgets that lapse prevent managers from shifting unspent funds from the current year into futureyears. Both line-item budgeting and budget lapsing reduce managers’ incentives to search for costsavings because it is less likely that the manager can spend the savings.
Static budgets hold managers responsible for changes in volume, whereas flexible budgets donot. Even though they might not be able to control volume, managers evaluated under flexible bud-gets have less incentive to control the consequences of volume changes.
Finally, most budgeting processes are incremental in the sense that managers need only justifychanges from last year’s budgets. Under zero-based budgeting, managers must justify the entirebudget. ZBB is most useful when those managers with decision ratification and monitoring rightsover the budget do not have the specific knowledge of the operations. If managers with decisioncontrol rights have the knowledge because they have been promoted from within the organization,ZBB usually becomes incremental budgeting.
Appendix: Comprehensive Master Budget IllustrationChapter 6 discussed the important conceptual issues of budgeting. This appendix illustrates how thevarious departments of a firm communicate their specialized knowledge via a firmwide master bud-get. This example demonstrates how various parts of the organization develop their budgets, theimportance of coordinating the volume of activity across the different parts of the organization, andhow budgets are then combined for the firm as a whole.
NaturApples is an upstate New York apple processor with two products, applesauce and apple pie fill-ing. The applesauce is eaten as is, and the pie filling is used to make apple pies. Two types of applesare purchased from local growers, McCouns and Grannys. They are processed and packed in tin cansas either apple sauce or pie filling. Principal markets are institutional buyers, such as hospitals, pub-lic schools, military bases, and universities. NaturApples is a small processor. Its market is regionaland is serviced by four sales reps who call on customers in a four-state area. A fifth salesperson mar-kets the products to food distributors, who then sell them directly to restaurants.
The firm is organized into two departments: processing and marketing. Each is headed by a vicepresident who reports directly to the president. The vice president of finance is responsible for allfinancial aspects of the firm, including preparing budgets. The three vice presidents and the presidentmake up NaturApples’s executive committee, which oversees the budgeting process.
Apples are harvested in the fall of each year. The firm has long-term contracts with a number oflocal apple growers for their crops. If the local harvest is smaller than expected, additional apples can bepurchased in the spot market. Likewise, if more apples are delivered than NaturApples wants to process,the extra apples can be sold in the spot market. Long-term contracts with local farmers and spot-marketpurchases and sales are the responsibility of the president and the vice president of finance.
Once harvested, the apples are stored either in coolers at NaturApples or in third-party warehousesuntil NaturApples processes them. Processing takes nine months. In October, the plant starts up after athree-month shutdown. Workers first thoroughly clean and inspect all equipment. The apples beginarriving in the middle of October. By the end of November, the apple harvest is in warehouses or startedin production. By June, all of the apples have been processed and the plant shuts down for July, August,and September. NaturApples has a fiscal year starting October 1 and ending September 30.
Each of the two products (applesauce and pie filling) uses a combination of the two types ofapples (McCouns and Grannys). The production process consists of inspection, washing, peeling, andcoring. The apples are either mashed for applesauce or diced for pie filling and then are combinedwith other ingredients such as spices and chemical stabilizers and cooked in vats. Both products areimmediately canned on a single canning line in five-pound tins and packed in cases of 12 cans percase. The product has a two-year shelf life and is inventoried until ordered by the customer. Indepen-dent truckers deliver apples to NaturApples and deliver finished product to customers.
1. Description ofthe Firm:NaturApples
zim36725_ch06_229-301.qxd 12/15/09 12:43 PM Page 259

260 Chapter 6
The budgeting process begins in August for the next fiscal year’s budget, which will begin in14 months. That is, even though the current fiscal year beginning in October has not yet started,the preparation of next year’s budget begins in August. In August, the coming fall harvest is rea-sonably well known. The president and the vice president of finance forecast the following year’scrop harvest under long-term contract. The vice president of marketing begins forecasting salesthat will be made from the harvest a year from this fall. Likewise, the processing vice presidentforecasts production costs and capacity. Every 2 months for the next 14 months, these budgetsare revised with regard to marketing, processing, and apple procurement in light of any newinformation, and all three vice presidents and the president meet for a morning to discuss theirrevisions. In June of each year, the final master budget for the next fiscal year, which beginsOctober 1, is adopted by the executive committee and approved by the board of directors. Theexecutive committee also meets weekly to review current-year operations as compared withbudget and to discuss other operational issues.
Figure 6–3 is a schematic diagram that illustrates the relations among component budgets and theNaturApples master budget. The master budget encompasses the budgeted income statement, budgetedbalance sheet, and budgeted cash flows at the bottom of Figure 6–3. All the other budgets provide thesupporting detail, including the various key planning assumptions underlying the master budget.
Three key pieces in NaturApples’s budgeting process include apple procurement, sales, and pro-duction. These three components must be internally consistent with respect to the amount of each typeof apple purchased and the volume of each product produced and sold. Once these three componentbudgets are determined, the budgeted ending inventory can be calculated. Given the production budget,the direct labor and factory overhead budgets can be generated. These last two budgets and the direct
2. Overview ofthe BudgetingProcess
Appleprocurement
budget
Salesbudget
Endinginventorybudget
Direct materials
budget
Directlabor
budget
Factoryoverheadbudget
Cost-of-goods-sold
budget
Capitalinvestment
budget
Budgetedincome
statement
Productionbudget
Administrationbudget
Budgetedbalance sheet
Budgetedcash flows
Master budget
FIGURE 6–3
Logical flow ofcomponents of themaster budget
zim36725_ch06_229-301.qxd 12/15/09 12:43 PM Page 260

Budgeting 261
TABLE 6–6 NaturApplesBasic Data for Budgeting Example for Fiscal Year Beginning 10/1/11
Cases Cost/Case Total
Beginning InventorySauce 13,500 $57.96 $782,460Pie filling 2,300 $48.81 $112,263
McCoun Granny
Pounds of Apples/CaseSauce 60 40Pie filling 50 30
materials budget (from the apple procurement estimates) determine the cost-of-goods-sold budget. Thebudgeted income statement can then be prepared using these budgets and the budget for administration,which includes senior officer salaries and other administrative expenses not included elsewhere.
Toward the bottom of Figure 6–3 is the capital investment budget, which is based on an analysisof investment proposals. All profitable projects are in the capital investment budget, including thoseprojects started in previous years but not yet completed. The capital investment budget and budgetedincome statement are used to prepare NaturApples’s budgeted balance sheet and then the cash flowbudget. The remainder of this appendix illustrates the preparation of these various component budgets.
NaturApples uses the following accounting conventions:
1. FIFO is used for inventory accounting.
2. Factory overhead is estimated using a flexible budget.
Variable overhead varies with the number of direct labor hours in the plant. Total overhead isthen assigned to product costs using the number of hours of direct labor in the product. Chapter 9 fur-ther explains how overhead is assigned to products.
Table 6–6 provides the basic data for the budgeting illustration. This table contains some primaryoperating data, such as the beginning inventory figures. The bottom half of the table also shows theamount of each type of apple required to make a case of applesauce and a case of pie filling.
By June, the executive committee has agreed on next year’s volumes. The sales budget for the nextfiscal year is given in Table 6–7. These data are examples of the key planning assumptions describedin the chapter. The executive committee agrees that the firm should be able to sell 140,000 cases ofsauce at $68.95 per case and 60,000 cases of pie filling at $53.95 per case. These quantities and priceswere derived after exploring alternative price-quantity combinations. In particular, these price-quantitypoints represent the managers’ best judgment of where profits are maximized. Presumably, higherprices (and thus lower sales) or lower prices (and higher sales) would both result in lower profits thanthe combinations in Table 6–7.
TABLE 6–7 NaturApplesSales Budget for Fiscal Year Beginning 10/1/11
Budgeted Budgeted Budgeted Cases Price/Case Revenue
Sauce 140,000 $68.95 $ 9,653,000Pie filling 60,000 53.95 3,237,000
Total $12,890,000
zim36725_ch06_229-301.qxd 12/15/09 12:43 PM Page 261

262 Chapter 6
Table 6–8 presents the apple procurement budget. Given the harvest projections and the productionplans, NaturApples plans to purchase an additional 50,000 pounds of McCoun apples and sell910,000 pounds of Granny apples. The total cost of apples is projected to be $6,344,200. The averagecost per thousand pounds is $380.32 for McCoun apples and $307.43 for Granny apples. These aver-age cost figures are used later in Table 6–12 to calculate the cost of applesauce and pie filling.
The third major budget component is the production budget presented in Table 6–9. The pro-duction budget, the apple procurement budget, and the sales budget must satisfy the followinginventory-production-sales identity:
Beginning inventory � Production � Sales � Ending inventory
The total units in beginning inventory and this period’s production must be either sold or in endinginventory. The beginning inventory numbers are known in advance. Choosing two of the remainingthree parameters uniquely determines the third. Given the number of apples purchased, the sales budget,and minimum inventory levels, the production budget is derived from the inventory-production-salesidentity as long as the processing department has the capacity.
In the production budget in Table 6–9, notice first that the number of cases budgeted for produc-tion is different from the number of cases budgeted for sales in Table 6–7. Ten thousand fewer cases ofsauce are planned to be produced than sold. Management has decided to reduce the applesauce inven-tory. On the other hand, the inventory of pie filling is being increased by 3,000 cases. The last twocolumns in Table 6–9 display the number of pounds of McCoun and Granny apples needed to producethe budgeted cases. The total pounds of each type of apple (10.95 million of McCouns and 7.09 mil-lion of Grannys) is the same as in the procurement budget in Table 6–8, reflecting the coordinationprocess involved in budgeting. All the various parts of the organization end up agreeing on the volumeof production.
Tables 6–7, 6–8, and 6–9 correspond to the top three boxes in Figure 6–3. Given these three keycomponent budgets, the remainder of the master budget can be prepared. The next budget to compute
3. DepartmentalBudgets
TABLE 6–8 NaturApplesApple Procurement Budget for Fiscal Year Beginning 10/1/11
Pounds (in 000s) Price Cost ($ in 000s)
McCoun Granny McCoun Granny McCoun Granny Total
Long-term contracts 10,900 8,000 $380 $310 $4,142.0 $2,480.0 $6,622.0Market purchases (sales) 50 (910) 450 330 22.5 (300.3) (277.8)
Total 10,950 7,090 $4,164.5 $2,179.7 $6,344.2
Pounds used 10,950 7,090
Cost per thousand pounds $380.32 $307.43
TABLE 6–9 NaturApplesProduction Budget for Fiscal Year Beginning 10/1/11
Budgeted Pounds of Pounds of Cases McCouns Grannys
Sauce 130,000 7,800,000 5,200,000Pie filling 63,000 3,150,000 1,890,000
Total 10,950,000 7,090,000
zim36725_ch06_229-301.qxd 12/15/09 12:43 PM Page 262

Budgeting 263
is the ending inventory budget. This is presented in Table 6–10. The ending inventory of sauce is bud-geted to be 3,500 cases and the ending inventory of pie filling is budgeted at 5,300 cases.
Next is the set of direct labor, direct materials, and factory overhead budgets. These budgets arepresented in Tables 6–11, 6–12, and 6–13, respectively. Direct labor, as opposed to indirect labor, rep-resents the time employees are actually working to produce a particular product. Indirect labor repre-sents the time workers are maintaining machines or are idle. (Chapter 9 explains these distinctions ingreater detail.) Table 6–11 provides the number of direct labor hours needed to perform each of theprocessing functions to produce sauce and pie filling. Sauce requires 0.60 direct labor hours (36 min-utes) per case and pie filling requires 0.54 labor hours (32.4 minutes). Multiplying these hours percase times budgeted cases determines the total number of direct labor hours for each product for nextyear (78,000 for sauce and 34,020 for pie filling).
The direct materials budget in Table 6–12 is a straightforward extension of the procurement bud-get for apples and includes the spices and other ingredients that are added to the sauce and pie filling.The average cost of 1,000 pounds of each type of apple from Table 6–8 is used to cost the quantity ofeach type of apple in sauce and pie filling. To the cost of apples is added the cost of other ingredients:$0.45 per case for sauce and $0.33 per case for pie filling. Management estimates these costs by tak-ing the known quantities of these other ingredients from the recipes and forecasting any pricechanges. The total cost of direct materials for sauce is budgeted at $4,623,632, and the total cost ofdirect materials for pie filling is budgeted at $1,799,841.
TABLE 6–10 NaturApplesEnding Inventory Budget for Fiscal Year Beginning 10/1/11 (Cases)
Sauce Pie Filling
Beginning inventory 13,500 2,300Plus: Production 130,000 63,000
Available for sale 143,500 65,300Less: Cases sold 140,000 60,000
Ending inventory 3,500 5,300
TABLE 6–11 NaturApplesDirect Labor Budget for Fiscal Year Beginning 10/1/11
Direct Labor Hours/Case
Sauce Pie Filling
Inspection, washing, peeling, coring 0.30 0.24
Saucing 0.10 0.00Dicing 0.00 0.04Cooking 0.10 0.16Canning 0.10 0.10
Total hours per case 0.60 0.54� Budgeted cases 130,000 63,000
Budgeted labor hours 78,000 34,020� Budgeted labor rate $8.75 $8.75
Budgeted labor cost $682,500 $297,675
zim36725_ch06_229-301.qxd 12/15/09 12:43 PM Page 263

264 Chapter 6
Table 6–13 presents the factory overhead budget for each product. The top part of Table 6–13provides the flexible budget for factory overhead. Fixed factory overhead, which contains $650,000of depreciation, is budgeted to be $1.3 million and variable overhead is budgeted at $13 per directlabor hour. Chapter 9 expands on how these parameters are forecasted. Given these forecasts and thenumber of direct labor hours from Table 6–11, management calculates the budgeted factory overheadas $2,756,260. This quantity is then divided by the budgeted direct labor hours (112,020 hours) tocompute the budgeted overhead rate per hour of direct labor ($24.61). The $24.61 represents theaverage overhead cost assigned to sauce and pie filling per direct labor hour.
TABLE 6–12 NaturApplesDirect Materials Budget for Fiscal Year Beginning 10/1/11
Sauce Pie Filling
Cost of ApplesThousands of pounds of McCouns 7,800 3,150� Average cost of McCouns $ 380.32 $2,966,496 $380.32 $1,198,008
Thousands of pounds of Grannys 5,200 1,890� Average cost of Grannys $ 307.43 $1,598,636 $307.43 $ 581,043
Total cost of apples $4,565,132 $1,779,051
Cost of Other IngredientsCost per case $ 0.45 $ 0.33� Number of cases 130,000 $ 58,500 63,000 $ 20,790
Total direct materials cost $4,623,632 $1,799,841
TABLE 6–13 NaturApplesFactory Overhead Budget for Fiscal Year Beginning 10/1/11
A. Factory Overhead Flexible BudgetFixed factory overhead $1,300,000Variable overhead per direct labor hour $13Direct labor hours
Sauce 78,000Pie filling 34,020
� Budgeted direct labor hours 112,020
Budgeted variable overhead $1,456,260
Budgeted factory overhead $2,756,260� Budgeted direct labor hours 112,020
Budgeted overhead rate per direct labor hour $ 24.61
B. Factory OverheadSauce Pie Filling
Direct labor hours 78,000 34,020Overhead rate per labor hour � $24.61 � $24.61
Factory overhead cost $1,919,580 $ 837,232
zim36725_ch06_229-301.qxd 12/15/09 12:43 PM Page 264

Budgeting 265
Panel B of Table 6–13 calculates the factory overhead for sauce and pie filling. Since sauce isbudgeted to use 78,000 direct labor hours, sauce is allocated $1,919,580 of factory overhead ($24.61 �78,000 direct labor hours) and pie filling is assigned $837,232 (or $24.61 � 34,020).
Refer to Figure 6–3. Given the direct labor, direct materials, factory overhead, ending inventorybudgets, and beginning inventory levels, management can now prepare the budget for cost of goodssold, as shown in Table 6–14. The beginning inventory cost is from Table 6–6. The direct labor andmaterial and factory overhead costs are taken directly from Tables 6–11, 6–12, and 6–13. Added tothese previous data is the cost of cans and packaging materials, $1.20 per case (see Table 6–14). Thesum of the beginning inventory and the cost of goods processed is the amount available for sale.From this is deducted the ending inventory to arrive at the cost of goods sold. Since the firm usesFIFO, the ending inventory is valued at the cost of the current units processed. The current process-ing cost is the total cost of units processed divided by the units processed. The footnote to Table6–14 indicates that the average cost to process a case of sauce is budgeted at $56.78 and the averagecost to process a case of pie filling is budgeted at $47.78. These unit cost figures are used to valuethe ending inventory.
The administration budget in Table 6–15 contains the remaining operating expenses, includingthe marketing and finance departments’ expenses, trucking costs, and the costs of the president’soffice. The total of all these administrative costs is $1.19 million.
The budgeted income statement in Table 6–16 assembles the various pieces from all the earlier state-ments. The only additional data in Table 6–16 are interest on debt ($380,000) and the provision forcorporate income taxes (a 42 percent combined state and federal rate is used). It projects net incomeafter taxes to be $281,420. Clearly, an important question to ask is whether this budgeted profit ishigh or low, acceptable or unacceptable. To answer this question requires a benchmark for compari-son. As we have seen, last year’s budget and actuals can provide such a benchmark.
Some managers end their budgeting process with the budgeted income statement as in Table 6–16.But this statement does not address the firm’s cash needs. Just because the firm forecasts positive
4. MasterFirmwide Budget
TABLE 6–14 NaturApplesCost-of-Goods-Sold Budget for Fiscal Year Beginning 10/1/11
Sauce Pie Filling
Beginning inventory $ 782,460 $ 112,263Cost of goods processed:
Direct labor cost $ 682,500 $ 297,675Direct materials cost 4,623,632 1,799,841Canning ($1.20/case) 156,000 75,600Factory overhead cost 1,919,580 837,232
Total cost of processing 7,381,712 3,010,348
Available for sale $8,164,172 $3,122,611Less: Ending inventory* (198,738) (253,251)
Cost of goods sold $7,965,434 $2,869,360
*Calculation of ending inventory (costs per case are not rounded for calculating ending inventories):
Sauce Pie Filling
Total cost of processing $7,381,712 $3,010,348� Cases produced 130,000 63,000
Cost per case $ 56.78 $ 47.78� Cases in ending inventory 3,500 5,300
Ending inventory $ 198,730 $ 253,251
zim36725_ch06_229-301.qxd 12/15/09 12:43 PM Page 265

266 Chapter 6
TABLE 6–15 NaturApplesAdministration Budget for Fiscal Year Beginning 10/1/11
Administrative Cost
Marketing $ 470,000Finance 160,000Trucking 380,000President’s office 180,000
Total administration $1,190,000
TABLE 6–16 NaturApplesBudgeted Income Statement for Fiscal Year Beginning 10/1/11
Sauce Pie Filling Total
Revenue $9,653,000 $3,237,000 $12,890,000Less:
Cost of goods sold (7,965,434) (2,869,359) (10,834,793)
Gross margin $1,687,566 $ 367,641 $ 2,055,207Less:
Administration costs (1,190,000)Interest on debt (380,000)
Net income before taxes $ 485,207Taxes (42%) (203,787)
Net income $ 281,420
profits does not mean there will be sufficient cash flow to finance operations. In NaturApples’s case,the cost of apples represents about half of total revenues. The apples are harvested and paid for in thefall, but the revenue from selling the processed apples is received over the next 12 months. Therefore,NaturApples must find a source of operating cash to finance its apple procurement.
Table 6–17 presents the budgeted statement of cash flows by quarter. NaturApples must borrow$3,385,722 in the first quarter to finance operations, including the apple purchases. Its beginningcash balance of $1.5 million is insufficient to finance all the apple purchases and production costs.Of this $1.5 million, $400,000 must be kept as minimum cash reserves, leaving only $1.1 million tofinance operations. In quarter 2, NaturApples repays $1,872,978 of the loan, leaving a balance of$1,512,744 to be repaid in quarter 3. Interest of 3 percent per quarter is paid in quarter 3 on the out-standing balances in quarters 1 and 2 ($101,572 � $45,382). In quarter 4, capital expenditures of$900,000 are budgeted. The budgeted ending cash balance is $2,424,834. The notes to Table 6–17explain the quarterly timing of the various cash flows.
Having completed the budgeted statement of cash flows, NaturApples can prepare the budgetedstatement of financial position (balance sheet) listing all the assets, liabilities, and equities (seeTable 6–18). Cash is budgeted to increase from $1,500,000 to $2,424,834. There is no provision atthis time to budget a dividend to shareholders, which would decrease the budgeted cash amount andthe ending balance in shareholder equity. Budgeted fixed assets are increased by budgeted capitalexpenditures ($900,000) and decreased by depreciation ($650,000), for a net increase of $250,000.Accounts payable is budgeted to increase from $1,300,000 to $1,765,180. Shareholder equity isbudgeted to increase by budgeted net income of $281,420.
zim36725_ch06_229-301.qxd 12/15/09 12:43 PM Page 266

Budgeting 267
TABLE 6–17
NATURAPPLESBudgeted Statement of Cash FlowsFor Fiscal Year Beginning 10/1/11
Quarter 1 Quarter 2 Quarter 3 Quarter 4 Annual
Sales in the quarter $ 3,222,500 $3,222,500 $3,222,500 $3,222,500 $12,890,000
80% collected in this quarter 2,578,000 2,578,000 2,578,000 2,578,000 10,312,00020% collected from last quarter 630,000 644,500 644,500 644,500 2,563,500
Cash from sales $ 3,208,000 $3,222,500 $3,222,500 $3,222,500 $12,875,500
Less:Apple purchases $ 6,344,200 $ 0 $ 0 $ 0 $ 6,344,200Direct labor 326,725 326,725 326,725 0 980,175Other ingredients 26,430 26,430 26,430 0 79,290Variable overhead 485,420 485,420 485,420 0 1,456,260Fixed factory overhead 162,500 162,500 162,500 162,500 650,000Administrative costs 297,500 297,500 297,500 297,500 1,190,000Income taxes 50,947 50,947 50,947 50,947 203,787
Total cash expenses before interest $ 7,693,722 $1,349,522 $1,349,522 $ 510,947 $10,903,712
Cash flows from operations $(4,485,722) $1,872,978 $1,872,978 $2,711,553 $ 1,971,788
Beginning cash balance $ 1,500,000 $ 400,000 $ 400,000 $ 613,290Less: minimum cash reserves 400,000 400,000 400,000 400,000
Cash available for operations $ 1,100,000 $ 0 $ 0 $ 213,280
New short-term borrowings $ 3,385,722 $ 0 $ 0 $ 0
Repayment of loan and interest 0 1,872,978 1,659,698 0Outstanding loan balance $ 3,385,722 $1,512,744 $ 0 $ 0Interest at 3% per quarter $ 101,572 $ 45,382 $ 0 $ 0Capital expenditures $ 0 $ 0 $ 0 $ 900,000Ending cash balance $ 400,000 $ 400,000 $ 613,280 $2,424,833
NOTES:
1. Sales, fixed factory overhead, administrative costs, and income taxes are incurred uniformly over four quarters.
2. Apple purchases are paid in quarter 1.
3. Direct labor, other ingredients, and variable overhead are incurred uniformly over the first three quarters.
4. One-half of the fixed factory overhead is depreciation.
5. 80% of sales are collected in the quarter; the other 20% are collected in the next quarter.
6. There are no uncollectible accounts.
7. $630,000 of accounts receivable from last year, quarter 4, are collected in quarter 1.
8. All interest in the first two quarters is paid in the third quarter.
9. Minimum cash reserves are $400,000.
10. Beginning cash balance is $1.5 million.
11. Interest on short-term borrowing is 3% per quarter.
12. Capital expenditures of $900,000 are paid in quarter 4.
13. Interest expense of $380,000 in Table 6–16 includes interest on short-term borrowing and long-term debt.
zim36725_ch06_229-301.qxd 12/15/09 12:43 PM Page 267

268 Chapter 6
Self-Study ProblemsSelf-Study Problem 1: GAMESS Inc.
GAMESS Inc. develops, markets, packages, and distributes multimedia computer games. GAMESShas outsourced production since it does not believe it can manufacture the games competitively. Itsmost recent development is an interactive adventure game. Since its multimedia games are differentfrom other computer games in both physical size of the package and price, GAMESS established anew profit center for the adventure game and future CD computer games.
GAMESS is in the process of selecting the profit-maximizing price for the new adventure game.Management estimates demand for the new game at various wholesale prices. The retail stores thenset the retail price of the game sold to the public. Estimated demand is shown in Table 1.
The manufacturer of the CDs charges GAMESS $9 per CD produced (assume CDs producedequal CDs sold). Packaging expense is $5 per unit sold. Distribution, which includes the amount paidto distributors for selling the game to retailers, is $3 per unit sold.
Note that although packaging and distribution are estimated to be $5 and $3, respectively, man-agement is not sure how retailers will treat the different packaging size. Advertising contains fixedand variable elements. The fixed portion is $1 million. The variable portion is computed using theratio of $1 advertising expense for each $500 of expected sales. Fixed overhead, which includesadministration and management salaries, is projected at $2.5 million.
Required:
a. Compute the production, packaging, distribution, advertising, and fixed overhead expensesfor the various sales prices and quantities in Table 1. Explain why GAMESS would notconsider selling its adventure game for any price other than $44.
b. Actual data for the year are shown in Table 2. Calculate the budget variances.
c. Provide a possible interpretation for the variances.
TABLE 6–18
NATURAPPLESStatement of Financial Position
Years Ending 9/30/11 and 9/30/12
Year Ending Year Ending 9/30/11 9/30/12
Cash $1,500,000 $2,424,834Accounts receivable 630,000 644,500Inventory:
Sauce 782,460 198,738Pie filling 112,263 253,251
Total inventory 894,723 451,989Fixed assets 2,755,000 3,005,000
Total assets $5,779,723 $6,526,323
Accounts payable $1,300,000 $1,765,180Long-term debt 1,950,000 1,950,000Shareholder equity 2,529,723 2,811,143
Total liabilities $5,779,723 $6,526,323
zim36725_ch06_229-301.qxd 12/15/09 12:43 PM Page 268

Budgeting 269
TABLE 1 Price and Quantity Demanded for Adventure Game
Wholesale sales price $40 $44 $48 $52Sales volume (units) 435,000 389,000 336,000 281,000
TABLE 2 First-Year Operating Results for Adventure Game
Sales price $ 44Sales volume (units) 389,000Revenues $17,116,000Production costs 3,501,000Packaging 1,798,700Distribution 1,633,800Advertising 1,148,232Fixed overhead 2,506,200
Net income $ 6,528,068
Solution:
a. $44 is the profit-maximizing price, as seen in Table 3.
b. The variances from the flexible budget are computed as follows:
Sales price $44Sales volume (units) 389,000
Actual Budgeted Variance
Sales $17,116,000 $17,116,000 $ 0Production 3,501,000 3,501,000 0Packaging 1,798,700 1,945,000 146,300Distribution 1,633,800 1,167,000 (466,800)Advertising 1,148,232 1,034,232 (114,000)Fixed overhead 2,506,200 2,500,000 (6,200)
Net income $ 6,528,068 $ 6,968,768 $(440,700)
c. As displayed in the table above, packaging has a moderately large favorable variance,while distribution and advertising have large unfavorable variances and fixed overhead has a small unfavorable variance. One possible reason for this pattern of variances isthat management cut corners on the packaging of the game. This change in package,combined with the difference in the packaging size between CD games and other computergames, resulted in higher shipping and distribution costs when stores insisted on smallershipments since their shelf space was not designed for GAMESS CDs. The increase inadvertising helped prevent lost sales because of the distribution problems. The fixedoverhead variance is less than 1 percent of budgeted fixed overhead and is likely becauseof random fluctuations.
zim36725_ch06_229-301.qxd 12/15/09 12:43 PM Page 269

270 Chapter 6
Self-Study Problem 2: Sandy Cove Bank
Sandy Cove is a new small commercial bank operating in Sandy Cove, Michigan. The bank limits in-terest rate risk by matching the maturity of its assets to the maturity of its liabilities. By maintaininga spread between interest rates charged and interest rates paid, the bank plans to earn a small income.Management establishes a flexible budget based on interest rates for each department.
The Boat and Car Loan Department offers five-year loans. It matches certificates of deposit(CDs) against car and boat loans. Given all the uncertainty about interest rates, management believesthat five-year savings interest rates could vary between 2 percent and 16 percent for the coming year.The savings rate is the rate paid on CD savings accounts. The loan rate is the rate charged on auto andboat loans. Table 1 shows the expected new demand for fixed-rate, five-year loans and new supply offixed-rate, five-year savings accounts at various interest rates. There are no loans from previous years.Note that the department maintains a 4 percent spread between loan and savings rates to cover pro-cessing, loan default, and overhead.
The amount of new loans granted is always the lesser of the loan demand and loan supply. Forsimplicity, this bank may lend 100 percent of deposits. Although rates are set nationally, the bankmay pay or charge slightly different rates to limit demand or boost supply as needed in its localmarket.
The Boat and Car Loan Department incurs processing, loan default, and overhead expensesrelated to these accounts. The first two expenses vary, depending on the dollar amount of theaccounts. The annual processing expense is budgeted to be 1.5 percent of the loan accounts. Defaultexpense is budgeted at 1 percent of the amount loaned per year. Again, loans and savings would ide-ally be the same. Overhead expenses are estimated to be $30,000 for the year, regardless of theamount loaned.
TABLE 3 Sales Price
$40 $44 $48 $52
Sales volume (units) 435,000 389,000 336,000 281,000Sales $17,400,000 $17,116,000 $16,128,000 $14,612,000Production 3,915,000 3,501,000 3,024,000 2,529,000Packaging 2,175,000 1,945,000 1,680,000 1,405,000Distribution 1,305,000 1,167,000 1,008,000 843,000Advertising 1,034,800 1,034,232 1,032,256 1,029,224Fixed overhead 2,500,000 2,500,000 2,500,000 2,500,000
Net income $ 6,470,200 $ 6,968,768 $ 6,883,744 $ 6,305,776
TABLE 1 Demand and Supply of Five-Year Funds
Loan Rate Loan Demand Savings Rate Savings Supply
6% $12,100,000 2% $ 4,700,0007 10,000,000 3 5,420,0008 8,070,000 4 8,630,0009 6,030,000 5 9,830,000
10 4,420,000 6 11,800,000
zim36725_ch06_229-301.qxd 12/15/09 12:43 PM Page 270

Budgeting 271
Required:
a. Calculate the processing, loan default, and overhead expenses for each possible interest rate.
b. Create an annual budgeted income statement for five-year loans and deposits for the Boatand Car Loan Department given a savings interest rate of 4 percent. Remember to matchsupply and demand.
c. Table 2 shows the actual income statement for the Boat and Car Loan Department.Included are the actual loans and savings for the same period. Calculate the variances andprovide a possible explanation.
Solution:
a. Flexible budget for the Boat and Car Loan Department:
($ in Millions)
Savings Loan Savings New Loan Default Overhead Rate Demand Supply Business Processing Expense Expense
2% $12.10 $ 4.70 $4.70 $ 70,500 $47,000 $30,0003 10.00 5.42 5.42 81,300 54,200 30,0004 8.07 8.63 8.07 121,050 80,700 30,0005 6.03 9.83 6.03 90,450 60,300 30,0006 4.42 11.80 4.42 66,300 44,200 30,000
b. Budgeted income statement, 4 percent savings rate for the Boat and Car Loan Department:
Interest income $645,600*
Interest expense 322,800†
Net interest income $322,800
Fixed overhead 30,000Processing expense 121,050Default expense 80,700
Net income $ 91,050
*$645,600 � $8,070,000 � 8%†$322,800 � $8,070,000 � 4%
TABLE 2 Actual Income Statement of the Boat and Car Loan Department
Interest income $ 645,766Interest expense 314,360
Net interest income $ 331,406Fixed overhead 30,200Processing expense 130,522Default expense 77,800
Net income $ 92,884
Loans $8,062,000Deposits $8,123,000
zim36725_ch06_229-301.qxd 12/15/09 12:43 PM Page 271

272 Chapter 6
c. Variance report:
Budgeted Fav. (Unfav.) Actual @ 4% Variance
Interest income $ 645,766 $ 645,600 $ 166Interest expense 314,360 322,800 8,440
Net interest income $ 331,406 $ 322,800 $ 8,606Fixed overhead 30,200 30,000 (200)Processing expense 130,522 121,050 (9,472)Default expense 77,800 80,700 2,900
Net income $ 92,884 $ 91,050 $ 1,834
Loans $8,062,000 $8,070,000 $ (8,000)Deposits $8,123,000 $8,070,000 $(53,000)
Even though loans were lower and deposits were higher than expected, interestincome was higher and interest expense was lower than expected. The answer can beobtained by calculating the average interest rates earned and paid. On $8,062,000 worthof loans, Sandy Cove earned $645,766 interest, or 8.01 percent (0.01 percent more thanexpected). Similarly, it paid only 3.87 percent (0.13 percent less) on deposits.Therefore, the net interest income variance of $8,606 is a combination of two effects: the variance in the actual loans and deposits (quantity) and the variance in the interestrates (price). The combined effects are a favorable interest income variance, a favorableinterest expense variance, and an overall favorable net interest income variance.
At a savings interest rate of 4 percent, there is an excess supply of deposits overdemand for loans. The Boat and Car Loan Department lowered the interest rate on depositsto stem additional deposits. The increase in the interest rate on loans can be attributed onlyto an increase in the demand for loans, which resulted in the department charging a slightlyhigher average interest rate.
The higher processing expense could be related to the higher number of accountsprocessed and improvements in the default rate. That is, the favorable default expense couldbe attributed to an improved screening process—related to spending more on processing.
Problems
P 6–1: G. Bennett Stewart on Management Incentives
I’ve given a good deal of thought to this issue of how companies . . . go about negotiatingobjectives with their different business units. The typical process in such cases is that once theparent negotiates a budget with a unit, the budget then becomes the basis for the bonus. And theyare also typically structured such that the bonus kicks in when, say, 80 percent of the budgetedperformance is achieved; and the maximum bonus is earned when management reaches, say,120 percent of the budgeted level. There is thus virtually no downside and very limited upside.
Now, because the budget is negotiated between management and headquarters, there is acircularity about the whole process that makes the resulting standards almost meaningless. Be-cause the budget is intended to reflect what management thinks it can accomplish—presumablywithout extraordinary effort and major changes in the status quo—the adoption of the budgetas a standard is unlikely to motivate exceptional performance, especially since the upside is solimited. Instead it is likely to produce cautious budgets and mediocre performance.
So, because of the perverse incentives built into the budgeting process itself, I think it’simportant for a company to break the connection between the budget and planning process onthe one hand and the bonus systems on the other hand. The bonuses should be based upon ab-solute performance standards that are not subject to negotiation.
zim36725_ch06_229-301.qxd 12/15/09 12:43 PM Page 272

Budgeting 273
Required:
Critically evaluate this quotation.SOURCE: B Stewart, “CEO Roundtable on Corporate Structure and Management Incentives,” Journal of Applied Corporate
Finance, Fall 1990, p. 27.
P 6–2: Investment Banks
Rogers Petersen and Cabots are two of the five largest investment banks in the United States. Lastyear there was a major scandal at Cabots involving manipulation of some auctions for governmentbonds. A number of senior partners at Cabots were charged with price fixing in the governmentbond market. The ensuing investigation led four of the eight managing directors (the highest-rank-ing officials at Cabots) to resign. A new senior managing director was brought in from outside torun the firm. This individual recruited three outside managing directors to replace the ones who re-signed. There was then a thorough housecleaning. In the following six months, 15 additional part-ners and over 40 senior managers left Cabots and were replaced, usually with people from outsidethe firm.
Rogers Petersen has had no such scandal, and almost all of its senior executives have beenwith the firm for all of their careers.
Required:
a. Describe zero-based budgeting.
b. Which firm, Rogers Petersen or Cabots, is most likely to be using ZBB? Why?
P 6–3: Ice Storm
In March, a devastating ice storm struck Monroe County, New York, causing millions of dollars ofdamage. Mathews & Peat (M&P), a large horticultural nursery, was hit hard. As a result of the storm,$653,000 of additional labor and maintenance costs were incurred to clean up the nursery, removeand replace damaged plants, repair fencing, and replace glass broken when nearby tree limbs fell onsome of the greenhouses.
Mathews & Peat is a wholly owned subsidiary of Agro Inc., an international agricultural con-glomerate. The manager of Mathews & Peat, R. Dye, is reviewing the operating performance of thesubsidiary for the year. Here are the results for the year as compared with budget:
MATHEWS & PEATSummary of Operating Results for the Current Year ($000s)
Actual Budgeted Actual as Results Results % of Budget
Revenues $32,149 $31,682 101%Less
Labor 13,152 12,621 104Materials 8,631 8,139 106Occupancy costs* 4,234 4,236 100Depreciation 2,687 2,675 100Interest 1,875 1,895 99
Total expenses $30,579 $29,566 103%
Operating profits $ 1,570 $ 2,116 74%
*Includes property taxes, utilities, maintenance and repairs of buildings, and so on.
After thinking about how to present the performance of M&P for the year, Dye decides tobreak out the costs of the ice storm from the individual items affected by it and report the storm
zim36725_ch06_229-301.qxd 12/15/09 12:43 PM Page 273

274 Chapter 6
separately. The total cost of the ice storm, $653,000, consists of additional labor costs of $320,000, ad-ditional materials of $220,000, and additional occupancy costs of $113,000. These amounts are net ofthe insurance payments received due to the storm. The alternative performance statement follows:
MATHEWS & PEATSummary of Operating Results for the Current Year ($000s)
Actual Budgeted Actual as Results Results % of Budget
Revenues $32,149 $31,682 101%Less
Labor 12,832 12,621 102Materials 8,411 8,139 103Occupancy costs 4,121 4,236 97Depreciation 2,687 2,675 100Interest 1,875 1,895 99
Total expenses 29,926 29,566 101%Operating profits before
ice storm costs 2,223 2,116 105%Ice storm costs 653 0
Operating profits after ice storm costs $ 1,570 $ 2,116 74%
Required:
a. Put yourself in Dye’s position and write a short, concise cover memo for the secondoperating statement summarizing the essential points you want to communicate to yoursuperiors.
b. Critically evaluate the differences between the two performance reports as presented.
P 6–4: Budget Lapsing versus Line-Item Budgets
a. What is the difference between budget lapsing and line-item budgets?
b. What types of organizations would you expect to use budget lapsing?
c. What types of organizations would you expect to use line-item budgets?
P 6–5: DMP Consultants
You work in the finance department of a telecommunications firm with a large direct sales forceselling high-speed fiber optics access lines to companies wanting telephone and Internet access.Your firm uses a top-down budget that sets the sales quota for each of its 180 salespeople. The sales-people are compensated based on a commission as well as a bonus whenever actual sales exceedtheir individual budgeted sales quota. Each salesperson’s quota is estimated by senior marketingmanagers in the corporate office based on the size of each customer in that salesperson’s geographicterritory and projected growth of business in that territory.
DMP Consultants specializes in redesigning antiquated budgeting systems. DMP has made apresentation to your finance department after conducting a thorough analysis of your firm’s salesforce budgeting system. DMP Consultants has emphasized that your current budgeting systemdoes not take advantage of what your salespeople know about future sales to their customer
zim36725_ch06_229-301.qxd 12/15/09 12:43 PM Page 274

Budgeting 275
regions. By ignoring this information, your firm does not effectively plan for this growth, and youare at a competitive disadvantage when deciding to add capacity to your fiber optic network in atimely and efficient way. Moreover, DMP points to extensive research documenting that when peo-ple participate in setting budgets that are used to evaluate their performance, these people morereadily accept the budgets and there is an increase in employee morale. That is, “participative bud-geting” (where employees who are judged against the budget participate in setting the budget)results in happier, more motivated employees. DMP Consultants has made a proposal to implementa bottom-up, participative budgeting scheme to replace your top-down system.
You have been asked to write a short memo to the head of the finance department that analyzesthe pros and cons of DMP’s proposal.
P 6–6: Federal Insurance
Two years ago Federal Insurance was charged with making misleading marketing claims about theway it was selling its insurance products. In response to these allegations and subsequent investi-gations, Federal’s board of directors fired the chief executive officer (CEO), the chief financial of-ficer (CFO), and the senior vice presidents of marketing and underwriting. They replaced thesemanagers last year with other managers from within the insurance industry, but from firms otherthan Federal.
A similar insurance firm, Northeast, is about the same size as Federal, operates in the samestates, and writes the same lines of insurance (home, auto, life). Both firms prepare detailed annualbudgets.
Which of the two firms, Federal or Northeast, is more likely to use zero-based budgetingand why?
P 6–7: Golf World
Golf World is a 1,000-room luxury resort with swimming pools, tennis courts, three golf courses, andmany other resort amenities.
The head golf course superintendent, Sandy Green, is responsible for all golf course maintenanceand conditioning. Green also has the final say as to whether a particular course is open or closed dueto weather conditions and whether players can rent motorized riding golf carts for use on a particularcourse. If the course is very wet, the golf carts will damage the turf, which Green’s maintenance crewwill have to repair. Since she is out on the courses every morning supervising the maintenance crews,she knows the condition of the courses.
Wiley Grimes is in charge of the golf cart rentals. His crew maintains the golf cart fleet of over200 cars, cleans them, puts oil and gas in them, and repairs minor damage. He also is responsible forleasing the carts from the manufacturer, including the terms of the lease, the number of carts to lease,and the choice of cart vendor. When guests arrive at the golf course to play, they pay greens fees toplay and a cart fee if they wish to use a cart. If they do not wish to rent a cart, they pay only the greensfee and walk the course.
Grimes and Green manage separate profit centers. The golf cart profit center’s revenue iscomposed of the fees collected from the carts. The golf course profit center’s revenue is from thegreens fees collected. When the results from April were reviewed, golf cart operating profits wereonly 49 percent of budget. Wiley argued that the poor results were due to the unusually heavy rainsin April. He complained that there were several days when, though only a few areas of the coursewere wet, the entire course was closed to carts because the grounds crew was too busy to rope offthese areas.
To better analyze the performance of the golf cart profit center, the controller’s office recentlyimplemented a flexible budget based on the number of cart rentals:
zim36725_ch06_229-301.qxd 12/15/09 12:43 PM Page 275

276 Chapter 6
GOLF WORLDGolf Cart Profit Center
Operating Results—April
Static Actual Variance from Flexible Variance from Budget Results Static Budget Budget Flexible Budget
Number of cart rentals 6,000 4,000 2,000 4,000 0Revenues (@ $25/cart) $150,000 $100,000 $50,000U $100,000 0Labor (fixed cost) 7,000 7,200 200U 7,000 200UGas and oil
(@ $1/rental) 6,000 4,900 1,100F 4,000 900UCart lease (fixed cost) 40,000 40,000 0 40,000 0
Operating profit $ 97,000 $ 47,900 $49,100U $ 49,000 $1,100U
Note: F � Favorable; U � Unfavorable.
Required:
a. Evaluate the performance of the golf cart profit center for the month of April.
b. What are the advantages and disadvantages of the controller’s new budgeting system?
c. What additional recommendations would you make regarding the operations of Golf World?
P 6–8: Coating Department
The coating department of a parts manufacturing department coats various parts with an antirust, zinc-based material. The parts to be processed are loaded into baskets; the baskets are passed through a coat-ing machine that dips the parts into the zinc solution. The machine then heats the parts to ensure that thecoating bonds properly. All parts being coated are assigned a cost for the coating department based on thenumber of hours the parts spend in the coating machine. Prior to the beginning of the year, cost categoriesare accumulated by department (including the coating department). These cost categories are classified aseither fixed or variable and then a flexible budget for the department is constructed. Given an estimate ofmachine hours for the next year, the coating department’s projected cost per machine hour is computed.
Here are data for the last three operating years. Expected coating machine hours for 2012 are16,000 hours.
COATING DEPARTMENTOperating Data
2009 2010 2011
Machine hours 12,500 8,400 15,200Coating materials $ 51,375 $ 34,440 $ 62,624Engineering support 27,962 34,295 31,300Maintenance 35,850 35,930 36,200Occupancy costs (square footage) 27,502 28,904 27,105Operator labor 115,750 78,372 147,288Supervision 46,500 47,430 49,327Utilities 12,875 8,820 16,112
Total costs $317,814 $268,191 $369,956
Required:
a. Estimate the coating department’s flexible budget for 2012. Explicitly state and justify theassumptions used in deriving your estimates.
b. Calculate the coating department’s cost per machine hour for 2012.
zim36725_ch06_229-301.qxd 12/15/09 12:43 PM Page 276
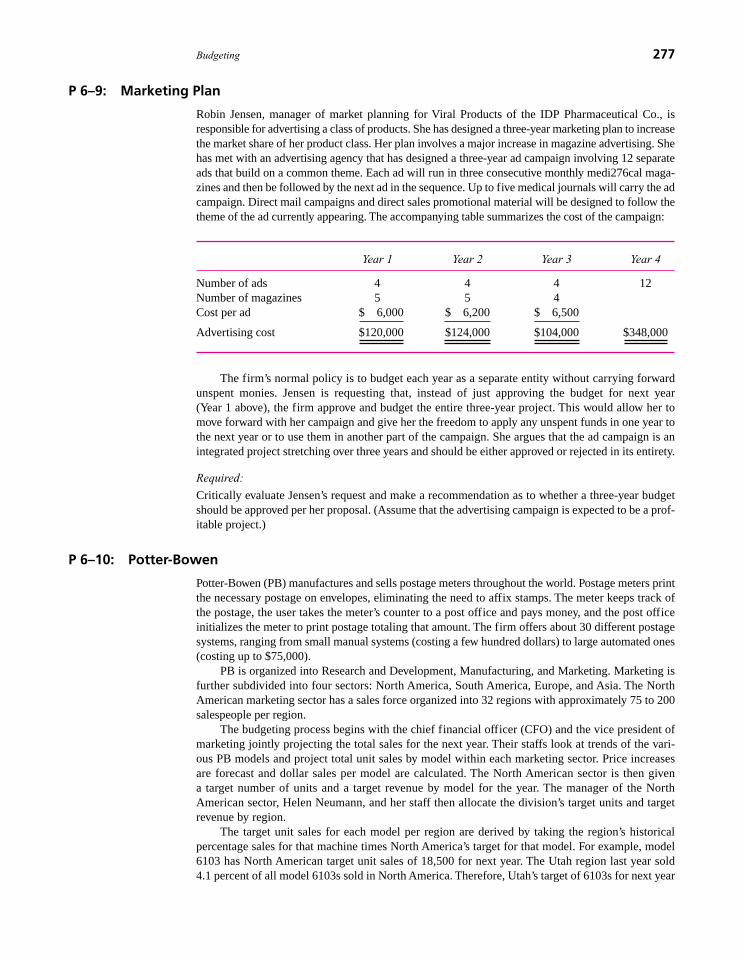
Budgeting 277
P 6–9: Marketing Plan
Robin Jensen, manager of market planning for Viral Products of the IDP Pharmaceutical Co., isresponsible for advertising a class of products. She has designed a three-year marketing plan to increasethe market share of her product class. Her plan involves a major increase in magazine advertising. Shehas met with an advertising agency that has designed a three-year ad campaign involving 12 separateads that build on a common theme. Each ad will run in three consecutive monthly medi276cal maga-zines and then be followed by the next ad in the sequence. Up to five medical journals will carry the adcampaign. Direct mail campaigns and direct sales promotional material will be designed to follow thetheme of the ad currently appearing. The accompanying table summarizes the cost of the campaign:
Year 1 Year 2 Year 3 Year 4
Number of ads 4 4 4 12Number of magazines 5 5 4Cost per ad $ 6,000 $ 6,200 $ 6,500
Advertising cost $120,000 $124,000 $104,000 $348,000
The firm’s normal policy is to budget each year as a separate entity without carrying forwardunspent monies. Jensen is requesting that, instead of just approving the budget for next year(Year 1 above), the firm approve and budget the entire three-year project. This would allow her tomove forward with her campaign and give her the freedom to apply any unspent funds in one year tothe next year or to use them in another part of the campaign. She argues that the ad campaign is anintegrated project stretching over three years and should be either approved or rejected in its entirety.
Required:
Critically evaluate Jensen’s request and make a recommendation as to whether a three-year budgetshould be approved per her proposal. (Assume that the advertising campaign is expected to be a prof-itable project.)
P 6–10: Potter-Bowen
Potter-Bowen (PB) manufactures and sells postage meters throughout the world. Postage meters printthe necessary postage on envelopes, eliminating the need to affix stamps. The meter keeps track ofthe postage, the user takes the meter’s counter to a post office and pays money, and the post officeinitializes the meter to print postage totaling that amount. The firm offers about 30 different postagesystems, ranging from small manual systems (costing a few hundred dollars) to large automated ones(costing up to $75,000).
PB is organized into Research and Development, Manufacturing, and Marketing. Marketing isfurther subdivided into four sectors: North America, South America, Europe, and Asia. The NorthAmerican marketing sector has a sales force organized into 32 regions with approximately 75 to 200salespeople per region.
The budgeting process begins with the chief financial officer (CFO) and the vice president ofmarketing jointly projecting the total sales for the next year. Their staffs look at trends of the vari-ous PB models and project total unit sales by model within each marketing sector. Price increasesare forecast and dollar sales per model are calculated. The North American sector is then givena target number of units and a target revenue by model for the year. The manager of the NorthAmerican sector, Helen Neumann, and her staff then allocate the division’s target units and targetrevenue by region.
The target unit sales for each model per region are derived by taking the region’s historicalpercentage sales for that machine times North America’s target for that model. For example, model6103 has North American target unit sales of 18,500 for next year. The Utah region last year sold4.1 percent of all model 6103s sold in North America. Therefore, Utah’s target of 6103s for next year
zim36725_ch06_229-301.qxd 12/15/09 12:43 PM Page 277

is 758 units (4.1% � 18,500). The average sales price of the 6103 is set at $11,000. Thus, Utah’srevenue budget for 6103s is $8,338,000. Given the total forecasted unit sales, average selling prices,and historical sales of each model in all regions, each region is assigned a unit target and revenue bud-get by model. The region’s total revenue budget is the sum of the individual models’ revenue targets.
Each salesperson in the region is given a unit and revenue target by model using a similarprocedure. If Gary Lindenmeyer (a salesperson in Utah) sold 6 percent of Utah’s 6103s last year,his unit sales target of 6103s next year is 45 units (6% � 758). His total revenue target for 6103sis $495,000 (or 45 � $11,000). Totaling all the models gives each salesperson’s total revenue bud-get. Salespeople are paid a fixed salary plus a bonus. The bonus is calculated based on thefollowing table:
% of Total Revenue Target Achieved Bonus
� 90% No bonus90–100% 5% of salary
101–110 10% of salary111–120 20% of salary121–130 30% of salary131–140 40% of salary141–150 50% of salary
�150% 60% of salary
Required:
Critically evaluate PB’s sales budgeting system and sales force compensation system. Describe anypotential dysfunctional behaviors that PB’s systems are likely to generate.
P 6–11: Feder Purchasing Department
The purchasing department at Feder buys all of its raw materials, supplies, and parts. This departmentis a cost center. It uses a flexible budget based on the number of different items purchased each monthto forecast spending and as a control mechanism.
At the beginning of February, the purchasing department expected to purchase 8,200 differentitems. Given this expected number of purchased items, purchasing calculated its flexible budget forFebruary to be $1,076,400. In reviewing actual spending in February, the purchasing departmentwas over its flexible budget by $41,400 (unfavorable) when calculated using the actual number ofitems purchased. Actual spending in February was $1,175,000, and the department purchased9,300 units.
Budgeted fixed cost and budgeted variable cost per item purchased remained the same in theflexible budgets calculated at the beginning and end of February.
Required:
Calculate the fixed cost and the variable cost per item purchased used in the purchasing department’sflexible budget in February.
P 6–12: Access.Com
Access.Com produces and sells software to libraries and schools to block access to Web sites deemedinappropriate by the customer. In addition, the software also tracks and reports on Web sites visitedand advises the customer of other Web sites the customer might choose to block. Access.Com’s soft-ware sells for between $15,000 and $20,000.
Three account managers (V. J. Singh, A. C. Chen, and P. J. Martinez) sell the software and arepaid a fixed salary plus a percentage of all sales in excess of targeted (budgeted) sales. Vice President
278 Chapter 6
zim36725_ch06_229-301.qxd 12/15/09 12:43 PM Page 278

Budgeting 279
of Marketing S. B. Ro sets the budgeted sales amount for each account manager. The following tablereports actual and budgeted sales for the three account managers for the past five years.
A. C. Chen V. J. Singh P. J. Martinez
Actual Budget Actual Budget Actual Budget
2003 $1.630 $1.470 $2.240 $2.400 $2.775 $2.6952004 1.804 1.614 2.586 2.384 2.995 2.7672005 1.685 1.785 2.406 2.566 2.876 2.9722006 1.665 1.775 2.600 2.550 2.698 2.9632007 1.924 1.764 2.385 2.595 3.107 2.936
Required:
a. Based on the data in the table, describe the process used by Ro to set sales quotas for eachaccount manager.
b. Discuss the pros and cons of Access.Com’s budgeting process for setting accountmanagers’ sales targets.
P 6–13: Videx
Videx is the premier firm in the security systems industry. Martha Rameriz is an account manager atVidex responsible for selling residential systems. She is compensated based on beating a predeter-mined sales budget. The last seven years’ sales budgets and actual sales data follow. Videx sets itssales budgets centrally in a top-down fashion.
Year Budget Actual Difference
1 $850,000 $865,000 $15,0002 862,000 888,800 26,8003 884,000 852,000 �32,0004 884,000 895,000 11,0005 893,000 878,000 �15,0006 893,000 902,000 9,0007 901,000
Average 881,000 880,133 2,467Standard deviation 18,385 18,970 21,715Median 884,000 883,400 10,000
Required:
a. Martha Rameriz sells $908,000 in year 7. What budget will she be assigned for year 8?
b. Suppose Rameriz sells $900,000 of systems in year 7. What budget will she be assigned inyear 8?
P 6–14: New York Fashions
New York Fashions owns 87 women’s clothing stores in shopping malls. Corporate headquarters ofNew York Fashions uses flexible budgets to control the operations of each of the stores. The follow-ing table presents the August flexible budget for the New York Fashions store located in the CrystalLakes Mall:
zim36725_ch06_229-301.qxd 12/15/09 12:43 PM Page 279
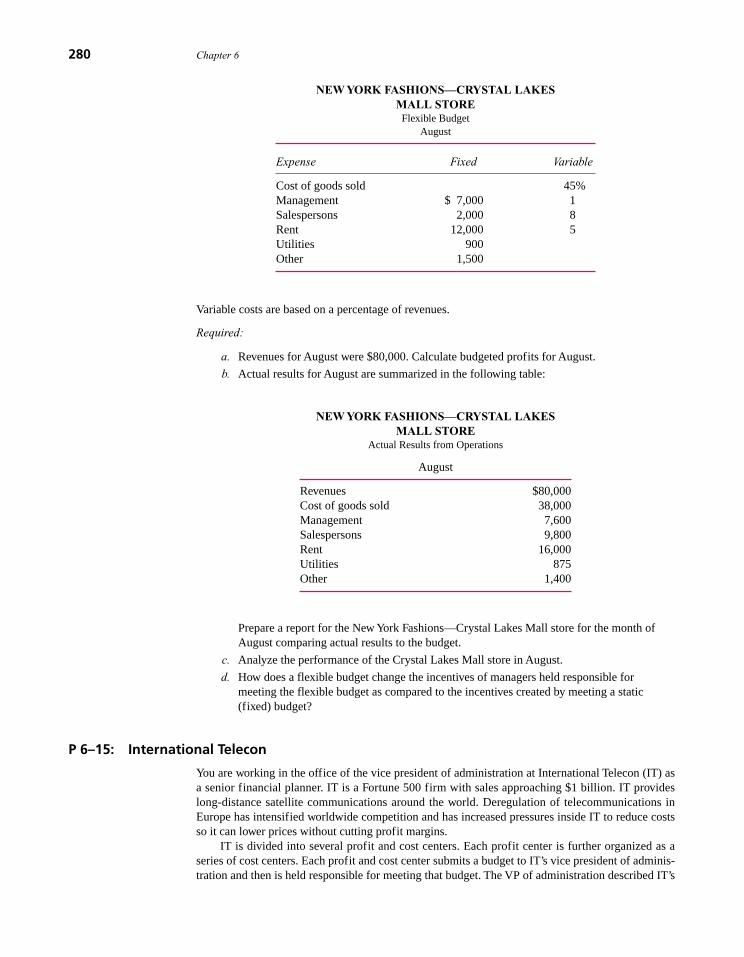
280 Chapter 6
NEW YORK FASHIONS—CRYSTAL LAKES MALL STORE
Flexible BudgetAugust
Expense Fixed Variable
Cost of goods sold 45%Management $ 7,000 1Salespersons 2,000 8Rent 12,000 5Utilities 900Other 1,500
Variable costs are based on a percentage of revenues.
Required:
a. Revenues for August were $80,000. Calculate budgeted profits for August.
b. Actual results for August are summarized in the following table:
NEW YORK FASHIONS—CRYSTAL LAKES MALL STORE
Actual Results from Operations
August
Revenues $80,000Cost of goods sold 38,000Management 7,600Salespersons 9,800Rent 16,000Utilities 875Other 1,400
Prepare a report for the New York Fashions—Crystal Lakes Mall store for the month ofAugust comparing actual results to the budget.
c. Analyze the performance of the Crystal Lakes Mall store in August.
d. How does a flexible budget change the incentives of managers held responsible formeeting the flexible budget as compared to the incentives created by meeting a static(fixed) budget?
P 6–15: International Telecon
You are working in the office of the vice president of administration at International Telecon (IT) asa senior financial planner. IT is a Fortune 500 firm with sales approaching $1 billion. IT provideslong-distance satellite communications around the world. Deregulation of telecommunications inEurope has intensified worldwide competition and has increased pressures inside IT to reduce costsso it can lower prices without cutting profit margins.
IT is divided into several profit and cost centers. Each profit center is further organized as aseries of cost centers. Each profit and cost center submits a budget to IT’s vice president of adminis-tration and then is held responsible for meeting that budget. The VP of administration described IT’s
zim36725_ch06_229-301.qxd 12/15/09 12:43 PM Page 280

Budgeting 281
financial control, budgeting, and reporting system as “pretty much a standard, state-of-the-artapproach where we hold our people accountable for producing what they forecast.”
Your boss has assigned you the task of analyzing firmwide supplies expenditures, with the goalof reducing waste and lowering expenditures. Supplies include all consumables ranging from pencilsand paper to electronic subcomponents and parts costing less than $1,000. Long-lived assets that costunder $1,000 (or the equivalent dollar amount in the domestic currency for foreign purchases) are notcapitalized (and then depreciated) but are categorized as supplies and written off as expenses in themonth purchased.
You first gather the last 36 months of operating data for both supplies and payroll for the entirefirm. The payroll data help you benchmark the supplies data. You divide each month’s payroll andsupplies amount by revenues in that month to control for volume and seasonal fluctuations. Theaccompanying graph plots the two data series.
Payroll fluctuates from 35 to 48 percent of sales, and supplies fluctuate from 13 to 34 percent ofsales. The graph contains the last three fiscal years of supplies and payroll, divided by the verticallines. For financial and budgeting purposes, IT is on a calendar (January–December) fiscal year.
International Telecon monthly payroll and supply expenses, last 36 months
Besides focusing on consolidated firmwide spending, you prepare disaggregated graphs like theone shown, but at the cost and profit center levels. The general patterns observed in the consolidatedgraphs are repeated in general in the disaggregated graphs.
Required:
a. Analyze the time-series behavior of supplies expenditures for IT. What is the likely reasonfor the observed patterns in supplies?
b. Given your analysis in (a), what corrective action might you consider proposing? What areits costs and benefits?
P 6–16: Adrian Power
Adrian Power manufactures small power supplies for car stereos. The company uses flexible bud-geting techniques to deal with the seasonal and cyclical nature of the business. The accounting de-partment provided the accompanying data on budgeted manufacturing costs for the month ofJanuary:
0.5
0.45
0.4
0.35
0.3
0.25
0.2
0.15
0.1
0.05
0
% o
f Rev
enue
s
Jan
Ap
r
Jul
Oct
Jan
Ap
r
Jul
Oct
Jan
Ap
r
Jul
Oct
Payroll
Supplies
Month
zim36725_ch06_229-301.qxd 12/15/09 12:43 PM Page 281

282 Chapter 6
ADRIAN POWERPlanned Level of Production for January
Budgeted production (in units) 14,000
Variable costs (vary with production)Direct materials $140,000Direct labor 224,000Indirect labor 21,000Indirect materials 10,500Maintenance 6,300
Fixed costsSupervision 24,700Other (depreciation, taxes, etc.) 83,500
Total plant costs $510,000
Actual operations for January are summarized as
ADRIAN POWERActual Operations for January
Actual production (in units) 15,400
Actual costs incurredDirect materials $142,400Direct labor 259,800Indirect labor 27,900Indirect materials 12,200Maintenance 9,800Supervision 28,000Other costs (depreciation, taxes, etc.) 83,500
Total plant costs $563,600
Required:
a. Prepare a report comparing the actual operating results with the flexible budget at actualproduction.
b. Write a short memo analyzing the report prepared in (a). What likely managerialimplications do you draw from this report? What are the numbers telling you?
P 6–17: Panarude Airfreight
Panarude Airfreight is an international air freight hauler with more than 45 jet aircraft operating inthe United States and the Pacific Rim. The firm is headquartered in Melbourne, Australia, and is or-ganized into five geographic areas: Australia, Japan, Taiwan, Korea, and the United States. Sup-porting these areas are several centralized corporate function services (cost centers): humanresources, data processing, fleet acquisition and maintenance, and telecommunications. Each re-sponsibility center has a budget, negotiated at the beginning of the year with the vice president of fi-nance. Funds unspent at the end of the year do not carry over to the next fiscal year. The firm is ona January-to-December fiscal year.
After reviewing the month-to-month variances, Panarude senior management became concernedabout the increased spending occurring in the last three months of each fiscal year. In particular, inthe first nine months of the year, expenditure accounts typically show favorable variances (actualspending is less than budget), but in the last three months, unfavorable variances are the norm. In an
zim36725_ch06_229-301.qxd 12/15/09 12:43 PM Page 282

Budgeting 283
attempt to smooth out these spending patterns, each responsibility center is reviewed at the end ofeach calendar quarter and any unspent funds can be deleted from the budget for the remainder of theyear. The accompanying table shows the budget and actual spending in the telecommunications de-partment for the first quarter of this year.
PANARUDE AIRFREIGHT Telecommunications Department: First Quarter
Budget and Actual Spending (Australian Dollars)
Monthly Cumulative Actual Cumulative Monthly Cumulative Budget Budget Spending Spending Variance* Variance*
Jan. $110,000 $110,000 $104,000 $104,000 $6,000 F $6,000 FFeb. 95,000 205,000 97,000 201,000 2,000 U 4,000 FMar. 115,000 320,000 112,000 313,000 3,000 F 7,000 F
*F � Favorable; U � Unfavorable.
At the end of the first quarter, telecommunications’ total annual budget for this year can bereduced by $7,000, the total budget underrun in the first quarter. In addition, the remaining ninemonthly budgets for telecommunications are reduced by $778 (or $7,000 � 9). If, at the end ofthe second quarter, telecommunications’ budget shows an unfavorable variance of, say, $8,000 (afterthe original budget is reduced for the first-quarter underrun), management of telecommunications isheld responsible for the entire $8,000 unfavorable variance. The first-quarter underrun is not restored.If the second-quarter budget variance is also favorable, the remaining six monthly budgets are eachreduced further by one-sixth of the second-quarter favorable budget variance.
Required:
a. What behavior would this budgeting scheme engender in the responsibility center managers?
b. Compare the advantages and disadvantages of the previous budget regime, where any end-of-year budget surpluses do not carry over to the next fiscal year, with the system ofquarterly budget adjustments just described.
P 6–18: Veriplex
Veriplex manufactures process control equipment. This 100-year-old German company hasrecently acquired another firm that has a design for a new proprietary process control system. Akey component of the new system to be manufactured by Veriplex is called the VTrap, a new lineof precision air-flow gauges.
Veriplex uses tight financial budgets linked to annual bonuses to control its manufacturingdepartments. Each manufacturing department is a cost center. The VTrap gauge is being manufac-tured in Veriplex’s gauge department, which also manufactures an existing line of gauges. The gaugedepartment’s budget for the current year consists of two parts: €6.60 million for manufacturing theexisting line of gauges and €0.92 million to develop and manufacture VTrap.
The gauge department is responsible for introducing VTrap, which has been in development inthe gauge department since the beginning of the year. The new gauge will be manufactured usingmuch of the same equipment and personnel as the existing gauges. VTrap is an integral part of theproprietary process control system that Veriplex hopes will give it a sustainable competitive advan-tage. Senior management is heavily committed to this strategy. Senior engineering staff membersare always in the gauge department working with the manufacturing personnel to modify and refineboth the gauges’ design and the production processes to produce them. (Note: Engineering depart-ment costs are not assigned to the gauge department.)
zim36725_ch06_229-301.qxd 12/15/09 12:43 PM Page 283

284 Chapter 6
By the end of the fiscal year, the gauge department had spent €1.30 million on the VTrap pro-gram and €6.39 million on existing gauge production. Both the new and existing gauge lines achievedtheir target production quotas and quality goals for the year.
Required:
a. Prepare a financial statement for the gauge department that details its financialperformance for the fiscal year just completed.
b. Upon further investigation of previous new product introductions, you discover the samepatterns in other departments between new and existing products and their budgets andactual costs. What are some possible reasons why the pattern in the gauge department isnot an isolated occurrence but has occurred with other new product introductions and islikely to occur with future new product introductions?
P 6–19: Madigan Modems
Madigan produces a single high-speed modem. The following table summarizes the current month’sbudget for Madigan’s modem production:
Projected production and sales 4,000 unitsVariable costs $ 640,000Fixed costs $ 480,000Total production budget $1,120,000
Actual production and sales for the month were 3,900 units. Total production costs were$1,114,800, of which $631,800 were variable costs.
Required:
a. Prepare an end-of-month variance report for the production department using thebeginning-of-month static budget.
b. Prepare an end-of-month variance report for the production department using thebeginning-of-month flexible budget.
c. Write a short memo evaluating the performance of the production manager based on thevariance report in (a).
d. Write a short memo evaluating the performance of the production manager based on thevariance report in (b).
e. Which variance report—the one in (a) or (b)—best reflects the performance of theproduction manager? Why?
P 6–20: Webb & Drye
Webb & Drye (WD) is a New York City law firm with over 200 attorneys. WD has a sophisticated setof information technologies—including intranets and extranets, e-mail servers, the firm’s accounting,payroll, and client billing software, and document management systems—that allows WD attorneysand their expert witnesses access to millions of pages of scanned documents that often accompanylarge class action lawsuits. Bev Piccaretto was hired at the beginning of last year to manage WD’s ITdepartment. She and her staff maintain these various systems, but they also act as an internalconsulting group to WD’s professional staff. They help the staff connect to and use the various IT sys-tems and troubleshoot problems the staff may encounter.
zim36725_ch06_229-301.qxd 12/15/09 12:43 PM Page 284
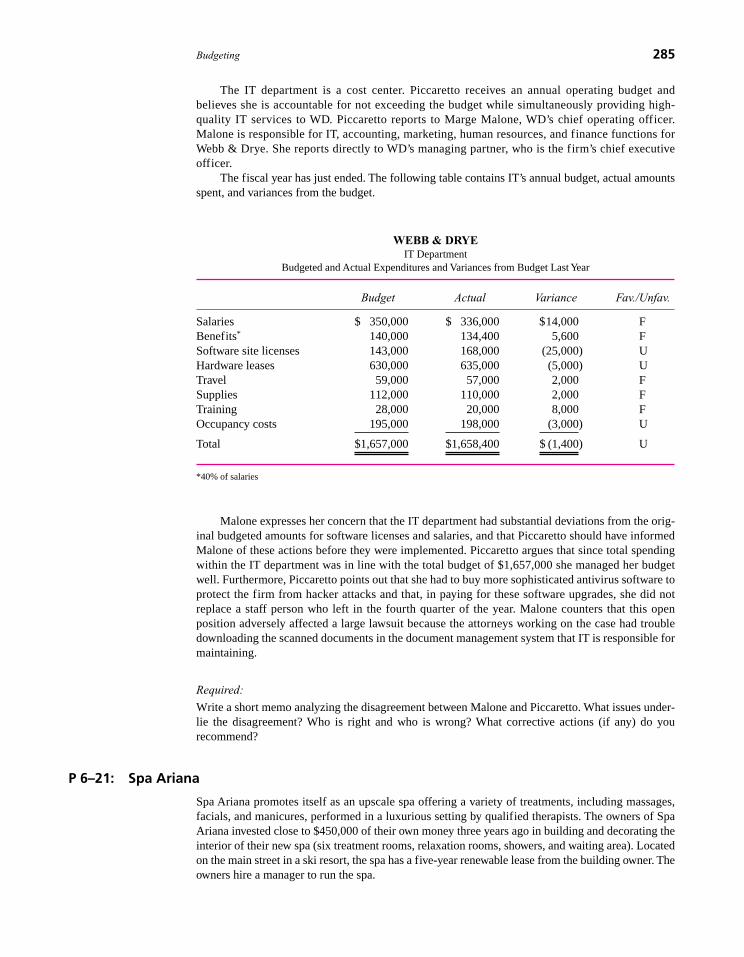
Budgeting 285
The IT department is a cost center. Piccaretto receives an annual operating budget andbelieves she is accountable for not exceeding the budget while simultaneously providing high-quality IT services to WD. Piccaretto reports to Marge Malone, WD’s chief operating officer.Malone is responsible for IT, accounting, marketing, human resources, and finance functions forWebb & Drye. She reports directly to WD’s managing partner, who is the firm’s chief executiveofficer.
The fiscal year has just ended. The following table contains IT’s annual budget, actual amountsspent, and variances from the budget.
WEBB & DRYEIT Department
Budgeted and Actual Expenditures and Variances from Budget Last Year
Budget Actual Variance Fav./Unfav.
Salaries $ 350,000 $ 336,000 $14,000 FBenefits* 140,000 134,400 5,600 FSoftware site licenses 143,000 168,000 (25,000) UHardware leases 630,000 635,000 (5,000) UTravel 59,000 57,000 2,000 FSupplies 112,000 110,000 2,000 FTraining 28,000 20,000 8,000 FOccupancy costs 195,000 198,000 (3,000) U
Total $1,657,000 $1,658,400 $ (1,400) U
*40% of salaries
Malone expresses her concern that the IT department had substantial deviations from the orig-inal budgeted amounts for software licenses and salaries, and that Piccaretto should have informedMalone of these actions before they were implemented. Piccaretto argues that since total spendingwithin the IT department was in line with the total budget of $1,657,000 she managed her budgetwell. Furthermore, Piccaretto points out that she had to buy more sophisticated antivirus software toprotect the firm from hacker attacks and that, in paying for these software upgrades, she did notreplace a staff person who left in the fourth quarter of the year. Malone counters that this openposition adversely affected a large lawsuit because the attorneys working on the case had troubledownloading the scanned documents in the document management system that IT is responsible formaintaining.
Required:
Write a short memo analyzing the disagreement between Malone and Piccaretto. What issues under-lie the disagreement? Who is right and who is wrong? What corrective actions (if any) do yourecommend?
P 6–21: Spa Ariana
Spa Ariana promotes itself as an upscale spa offering a variety of treatments, including massages,facials, and manicures, performed in a luxurious setting by qualified therapists. The owners of SpaAriana invested close to $450,000 of their own money three years ago in building and decorating theinterior of their new spa (six treatment rooms, relaxation rooms, showers, and waiting area). Locatedon the main street in a ski resort, the spa has a five-year renewable lease from the building owner. Theowners hire a manager to run the spa.
zim36725_ch06_229-301.qxd 12/15/09 12:43 PM Page 285

286 Chapter 6
The average one-hour treatment is priced at $100. Ariana has the following cost structure:
Variable Cost/ Fixed Cost/Treatment Month
Therapist $40Supplies/laundry 4Management $ 5,500Utilities 1,600Rent 7 6,000Repairs/upkeep/cleaning 6 1,500
Total $57 $14,600
Assume that all treatments have the same variable cost structure depicted in the table.
Required:
a. Calculate the number of treatments Spa Ariana must perform each month in order to breakeven.
b. In April, the owners of Ariana expect to perform 550 treatments. Prepare a budget for Aprilassuming 550 treatments are given.
c. In April Spa Ariana performs 530 treatments and incurs the following actual costs. Preparea performance report for April comparing actual performance to the static budget in part(b) based on 550 treatments.
Actual Operating Results for April
Revenue $53,000Therapists $21,280Supplies/laundry 1,795Management 5,125Utilities 1,725Rent 9,710Repairs/upkeep/cleaning 5,080 $44,715
Actual profit $ 8,285
d. Prepare a performance report for April comparing actual performance to a flexible budgetbased on the actual number of treatments performed in April of 530.
e. Which of the two performance reports you prepared in parts (c) and (d) best reflect the trueperformance of the Spa Ariana in April? Explain your reasoning.
f. Do the break-even calculation you performed in part (a) and the budgeted and actualprofits computed in parts (a)–(d) accurately capture the true economics of the Ariana Spa?Explain why or why not.
P 6–22: Picture Maker
Picture Maker is a freestanding photo kiosk consumers use to download their digital photos and makeprints. Shashi Sharma has a small business that leases several Picture Makers from the manufacturerfor $120 per month per kiosk, and she places them in high-traffic retail locations. Customers pay$0.18 per print. (The kiosk only makes six- by eight-inch prints.) Sharma has one kiosk located in the
zim36725_ch06_229-301.qxd 12/15/09 12:43 PM Page 286
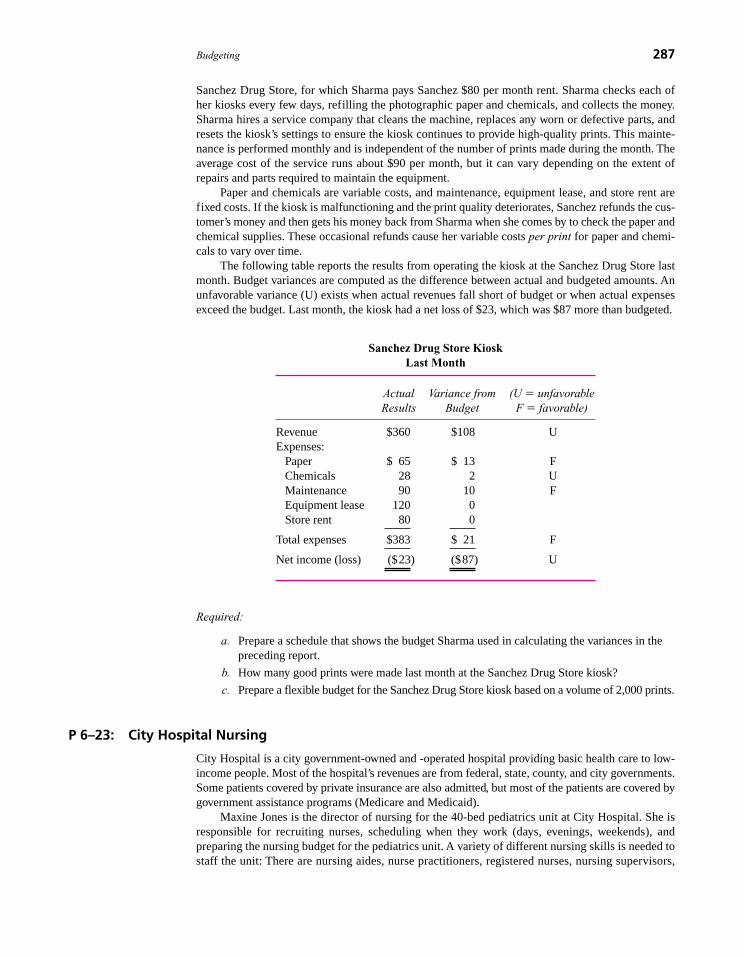
Budgeting 287
Sanchez Drug Store, for which Sharma pays Sanchez $80 per month rent. Sharma checks each ofher kiosks every few days, refilling the photographic paper and chemicals, and collects the money.Sharma hires a service company that cleans the machine, replaces any worn or defective parts, andresets the kiosk’s settings to ensure the kiosk continues to provide high-quality prints. This mainte-nance is performed monthly and is independent of the number of prints made during the month. Theaverage cost of the service runs about $90 per month, but it can vary depending on the extent ofrepairs and parts required to maintain the equipment.
Paper and chemicals are variable costs, and maintenance, equipment lease, and store rent arefixed costs. If the kiosk is malfunctioning and the print quality deteriorates, Sanchez refunds the cus-tomer’s money and then gets his money back from Sharma when she comes by to check the paper andchemical supplies. These occasional refunds cause her variable costs per print for paper and chemi-cals to vary over time.
The following table reports the results from operating the kiosk at the Sanchez Drug Store lastmonth. Budget variances are computed as the difference between actual and budgeted amounts. Anunfavorable variance (U) exists when actual revenues fall short of budget or when actual expensesexceed the budget. Last month, the kiosk had a net loss of $23, which was $87 more than budgeted.
Sanchez Drug Store KioskLast Month
Actual Variance from (U � unfavorableResults Budget F � favorable)
Revenue $360 $108 UExpenses:
Paper $ 65 $ 13 FChemicals 28 2 UMaintenance 90 10 FEquipment lease 120 0Store rent 80 0
Total expenses $383 $ 21 F
Net income (loss) ($23) ($87) U
Required:
a. Prepare a schedule that shows the budget Sharma used in calculating the variances in thepreceding report.
b. How many good prints were made last month at the Sanchez Drug Store kiosk?
c. Prepare a flexible budget for the Sanchez Drug Store kiosk based on a volume of 2,000 prints.
P 6–23: City Hospital Nursing
City Hospital is a city government-owned and -operated hospital providing basic health care to low-income people. Most of the hospital’s revenues are from federal, state, county, and city governments.Some patients covered by private insurance are also admitted, but most of the patients are covered bygovernment assistance programs (Medicare and Medicaid).
Maxine Jones is the director of nursing for the 40-bed pediatrics unit at City Hospital. She isresponsible for recruiting nurses, scheduling when they work (days, evenings, weekends), andpreparing the nursing budget for the pediatrics unit. A variety of different nursing skills is needed tostaff the unit: There are nursing aides, nurse practitioners, registered nurses, nursing supervisors,
zim36725_ch06_229-301.qxd 12/15/09 12:43 PM Page 287

288 Chapter 6
and clinical nurses. Each type of nurse provides different patient care services (care and feeding,drawing blood samples, giving injections, changing dressings, supervising, etc.). Not all types ofnurses can provide all services, and each type of nurse has a different wage rate. Minimum nursestaffing levels per patient must be maintained. If the minimums are violated, new patients cannotbe admitted.
Over 45 full-time nurses are required to staff the pediatrics unit. The number of each typeof nurse is set in the budget (8 nurses aides, 12 nurse practitioners, 14 registered nurses, etc.). Tochange the mix of nurse types or their wage rates during the year requires time-consuming approvalfrom the nursing administration, the hospital administration, and finally the city council. The direc-tor can change the staffing mix and pay scales in the next budget year by submitting a budget withthe revised staffing levels and wage rates and having the budget approved through a lengthy reviewprocess that ultimately requires the city council’s agreement.
In selecting where to work, nurses evaluate working conditions, pay, and amenities, as all em-ployees do. A key working condition for nurses is flexibility in choosing their schedule. Because ofthe shortage of nurses in the community, all hospitals have become competitive in terms of workschedules and hours. Some private hospitals allow nurses to schedule when they want to work andhow many hours a week they are willing to work. City Hospital often finds its nurses being hiredaway by private hospitals. If a nurse practitioner is hired away, Jones must replace her or him withanother nurse practitioner. The private hospitals do not have such a constraint. If a nurse practitionerposition is open, a private hospital will temporarily move a registered nurse with a higher level ofskills into the position until a nurse practitioner can be found.
Required:
a. What type of specialized knowledge does Maxine Jones acquire in preparing the nursingschedule for the upcoming month?
b. What are some of the consequences of the constraints Jones must operate under?
c. Explain why City Hospital does not allow Jones as much freedom in her staffing decisionsas her counterparts in private hospitals.
P 6–24: Madden International
Madden International is a large ($7 billion sales), successful international pharmaceuticals firmoperating in 23 countries with 15 autonomous subsidiaries. The corporate office consists of five vicepresidents who oversee the operations of the subsidiaries. These five vice presidents report to twoexecutive vice presidents, who in turn report to the president of the firm.
The 15 subsidiaries specialize by pharmaceutical type and in some cases by country. The paceof innovation in this industry is very fast. In addition, each country has its own elaborate regulatoryenvironment that controls new drug introduction, pricing, and distribution. Each market has its ownpeculiarities concerning hospital drug purchases. It is an understatement to say that Madden Interna-tional operates in a very complex world that changes daily.
The corporate office requires each subsidiary to maintain an elaborate, detailed budget and con-trol system. The following points summarize the budget and control system in each subsidiary:
• One-, three-, and five-year budgets are prepared each year.
• The vice president overseeing the subsidiary looks for three- and five-year budgets thatstretch the subsidiary’s capabilities. That is, subsidiaries are pushed to devise programs thatincrease value.
• These budgets are developed and approved first at the subsidiary level, then by corporateheadquarters.
• Every three months the subsidiaries must reconcile actual performance to budget and writedetailed reports to the corporate office explaining variances and corrective actions to betaken.
zim36725_ch06_229-301.qxd 12/15/09 12:43 PM Page 288

Budgeting 289
• The corporate vice president assigned to the subsidiary makes quarterly visits for threedays of meetings that involve extensive reviews of the budgets and operating results. Thesemeetings involve all the senior managers in the subsidiary.
• Subsidiary senior managers are not compensated or rewarded for meeting budget targets.Rather, they are evaluated on their ability to develop new markets, solve short-run problems,add value to their organization and to Madden International, and manage and motivate theirsubordinates. These performance evaluation criteria are quite subjective. But the corporatevice presidents have a great deal of in-depth personal contact with each of the senior peoplein their subsidiaries and are able to arrive at suitable performance evaluations.
• Preparing for these meetings with the corporate vice president and developing the budgetsrequires the involvement of all the senior managers in the subsidiary. One managerremarked, “I’d hate to see how much more money we could be making if we didn’t have tospend so much time in budget and financial review meetings.”
It turns out that Madden International is not unique in the amount of senior management timespent on budgeting and financial reviews. A survey of large, publicly traded U.S. firms supports theMadden system. Researchers found that innovative firms in complex environments characterized byhigh uncertainty and change used much more elaborate formal financial control (budgeting) systemsthan did firms in more stable, mature industries. Innovative firms seem to employ more financialcontrols than less-innovative firms.
Required:
a. List the strengths and weaknesses of the budgeting and control system at MaddenInternational.
b. Why might you expect firms like Madden International to rely so heavily on formalfinancial control systems?
P 6–25: Brehm Vineyards
Brehm Vineyards grows a unique white pinot noir grape that they use to produce a white wine that isin high demand. Brehm uses all the grapes they can grow to produce their own white pinot noir wine.Brehm pinot noir wine contains 100 percent Brehm-grown grapes. The company neither buys norsells grapes. Because of the uniqueness and difficulty of growing white pinot grapes, Brehm can onlyproduce 8,000 cases (12 bottles per case) in a normal year. A good growing season might yield10,000 cases, whereas bad weather can cut production to 5,000 cases. In a normal year Brehm expectsto sells its wine to wholesalers for $120 per case.
The following table summarizes how Brehm managers expect their costs to vary with the num-ber of cases produced.
Fixed Cost Variable Cost(per year) (per case)
Grape costs $240,000 $2.10Labor 75,000 2.15Packaging 14.00Selling and administrative costs 36,000Utilities 4,000 0.75
Required:
a. Prepare a flexible budget (including budgeted net income) assuming Brehm produces andsells 8,000 cases of wine.
b. Calculate the breakeven number of cases.
zim36725_ch06_229-301.qxd 12/15/09 12:43 PM Page 289

290 Chapter 6
c. How many cases does Brehm have to produce if they want an after-tax profit of $300,000and the income tax rate is 40 percent?
d. Bad weather this year cut Brehm’s production and sales to only 6,000 cases. The low yielddrove up wholesale prices of the white pinot wine from $120 to $140 per case. Brehm’sactual expenses for the year were:
Actual Costs for the Year
Grape costs $260,000Labor 98,000Packaging 83,000Selling and administrative costs 39,000Utilities 8,800
Design and prepare a table that reports the performance of Brehm for the year.
e. Write a short memo summarizing Brehm’s performance during the past year. Didmanagement do a good or bad job?
P 6–26: Republic Insurance
Republic Insurance has a direct sales force that sells life insurance policies. All salespeople at the be-ginning of the year forecast the number of policies they expect to sell that year. At the end of the year,they are evaluated based on how many policies they actually sell. The compensation scheme is basedon the following formula:
Total compensation � $20,000 � $100B � $20(S � B) if S B
$20,000 � $100B � $400(B � S ) if S � B
where
B � Budgeted number of policies reported by the managerS � Actual number of policies sold
Required:
a. Suppose a particular salesperson expects to sell 100 policies. This salesperson isconsidering reporting budgeted policies of 90, 99, 100, 101, 102, and 110. What level ofbudgeted policy sales should this person report at the beginning of the year?
b. Critically analyze the Republic Insurance compensation scheme.
P 6–27: Old Rosebud Farms
Old Rosebud is a Kentucky horse farm that specializes in boarding thoroughbred breeding maresand their foals. Customers bring their breeding mares to Old Rosebud for delivery of their foalsand after-birth care of the mare and foal. Recent changes in the tax laws brought about a substantialdecline in thoroughbred breeding. As a result, profits declined in the thoroughbred boardingindustry.
Old Rosebud prepared a master budget for the current year by splitting costs into variable costsand fixed costs. The budget was prepared before the extent of the downturn was fully recognized.Table 1 above compares actual with budget for the current year.
Required:
Prepare an analysis of the operating performance of Old Rosebud Farms. Supporting tables or calcu-lations should be clearly labeled.
zim36725_ch06_229-301.qxd 12/15/09 12:43 PM Page 290

Budgeting 291
P 6–28: Troika Toys
Adrian and Pells (AP) is an advertising agency that uses flexible budgeting for both planning andcontrol. One of its clients, Troika Toys, asked AP to prepare an ad campaign for a new toy. AP’s con-tract with Troika calls for paying AP $120 per design hour for between 150 and 200 hours.
AP has a staff of ad campaign designers who prepare the ad campaigns. Customers are billedonly for the time designers work on their project. Partner time is not billed directly to the customer.As part of the planning process, Sue Bent, partner-in-charge of the Troika account, prepared the fol-lowing flexible budget. “Authorized Design Hours” is the estimated range of time AP expects the jobto require and what the client agrees to authorize.
TROIKA TOYSFlexible Budget
Authorized Design HoursFixed Variable
Component Component 150 175 200
Revenues $120 $18,000 $21,000 $24,000Design labor $ 0 45 6,750 7,875 9,000Artwork 1,700 11 3,350 3,625 3,900Office and occupancy costs* 0 6 900 1,050 1,200
Total costs $1,700 $ 62 $11,000 $12,550 $14,100
Budgeted profits $ 7,000 $ 8,450 $ 9,900
*Consists of rent, phone charges, fax costs, overnight delivery, and so on.
TABLE 1
OLD ROSEBUD FARMSIncome Statement for Year Ended 12/31
Budget Formula
(per Mare Master per Day) Actual Budget Variance*
Number of mares 52 60 8Number of boarding days 18,980 21,900 2,920Revenues $25.00 $379,600 $547,500 $167,900 ULess variable expenses
Feed & supplies 5.00 104,390 109,500 5,110 FVeterinary fees 3.00 58,838 65,700 6,862 FBlacksmith fees .30 6,074 6,570 496 F
Total variable expenses 8.30 169,302 181,770 12,468 F
Contribution margin $16.70 $210,298 $365,730 $155,432 U
Less fixed expensesDepreciation & insurance $ 56,000 $ 56,000 $ 0Utilities 12,000 14,000 2,000 FRepairs & maintenance 10,000 11,000 1,000 FLabor 88,000 96,000 8,000 F
Total fixed expenses 166,000 177,000 11,000 F
Net income $ 44,298 $188,730 $144,432 U
*F � Favorable; U � Unfavorable.
zim36725_ch06_229-301.qxd 12/15/09 12:43 PM Page 291

292 Chapter 6
AP’s executive committee reviewed Bent’s budget and approved it and the Troika contract. After somepreliminary work, Troika liked the ideas so much it expanded the authorized time range to be between175 and 250 hours.
Bent and her design team finished the Troika project. Two hundred and twenty design hourswere logged and billed to Troika at the contract price ($120 per hour). Upon completion of the Troikacampaign, the following revenues and costs had been accumulated:
TROIKA TOYSActual Costs Incurred
Revenue ($120 � 220) $26,400Design labor 10,320Artwork 4,350Office and occupancy costs 1,690
Total costs $16,360
Profits $10,040
AP’s accounting manager keeps track of actual costs incurred by AP on each account. AP em-ploys a staff of designers. Their average salary is $45 per hour. New designers earn less than the av-erage; those with more experience earn more. The actual design labor costs charged to each projectare the actual hours times the designer’s actual hourly cost. Artwork consists of both in-house andout-of-house artists who draw up the art for the ads designed by the designers. Office and occupancycosts consist of a charge per designer hour to cover rent, photocopying, and phones, plus actuallong-distance calls, faxes, and overnight delivery services.
Required:
Prepare a table that reports on Sue Bent’s performance on the Troika Toys account and write a shortmemo to the executive committee that summarizes her performance on this project.
P 6–29: Cellular First
The sales department of a cellular phone company pays its salespeople $1,500 per month plus 25 percentof each new subscriber’s first month’s billings. A new subscriber’s first-month bill averages $80.Salespeople work 160 hours a month (four weeks at 40 hours per week). If salespeople work morethan 160 hours per month, they receive $12 per hour for hours in excess of 160.
Sales leads for the sales department are generated in a variety of ways—direct mailings to po-tential customers who then call to speak to a salesperson, lists of prospective customers purchasedfrom outside marketing firms, and so forth. The manager of the sales department reviews potentialleads and assigns them to particular salespeople who contact them. The manager of the salesdepartment is expected to oversee the time spent by each salesperson per assigned lead and to ap-prove overtime requests to work beyond the 40 hours per week. Each new customer added requireson average 2 hours of salesperson time to make the sale.
Last month, the sales department was budgeted for eight full-time salespeople. However, be-cause of a new ad campaign, an additional salesperson was hired and overtime was approved, bring-ing actual hours worked up to 1,580. The department added 725 new customers.
Required:
a. Prepare a performance report comparing actual performance to budgeted performanceusing a static budget based on eight salespeople and no budgeted overtime.
b. Prepare a performance report comparing actual performance to budgeted performanceusing a flexible budget based on nine salespeople selling 725 new accounts.
c. Discuss when you would expect to see the report prepared in (a) used and when you wouldexpect to see the report in (b) used.
zim36725_ch06_229-301.qxd 12/15/09 12:43 PM Page 292

Budgeting 293
P 6–30: Magee Inc.
Magee Inc. pays its sales manager a bonus of $10,000 if the manager meets the sales quota. The salesmanager can exert either high effort or low effort. The additional disutility of the manager in exertinghigh effort relative to low effort to meet the sales quota is $1,500. Management can set a tight quotathat is extremely difficult to achieve even with a great deal of effort, a loose quota that is achievedeasily, or a medium-tight quota. The probability of achieving the sales figure under each quota issummarized in the accompanying table.
Probability of Achieving Quota
Loose Quota Medium-Tight Quota Tight Quota
High effort 0.90 0.60 0.30Low effort 0.60 0.40 0.25
The sales manager can either achieve the sales quota or not. Because each quota affects the to-tal number of units sold and thus the gross margin earned by the firm, the following table outlines thegross margin earned by the firm when each quota is reached and is not reached.
Gross Margin of Achieving Quota
Loose Quota Medium-Tight Quota Tight Quota
Quota achieved $50,000 $70,000 $73,000Quota not achieved 20,000 40,000 43,000
Should management set a loose, medium-tight, or tight quota?SOURCE: R Magee, Advanced Managerial Accounting (New York: Harper & Row, 1986), pp. 286–87.
P 6–31: James Marketing Campaign
James, Inc., a large mail-order catalog firm, is thinking of expanding into Canada. The Buffalo districtoffice would manage the expansion and must decide how much to spend on the advertising campaign.The expansion project will be either successful (S) or unsuccessful (U). The probability of successdepends on the amount spent on the advertising campaign. If the project is successful, the gross profit(before advertising) is $1.4 million. If the project is unsuccessful, the gross profit (before advertising)is $100,000. The accompanying table lists how the probability of success varies with the amount ofspending on the Canadian venture.
Amount of Advertising Probability of Gross Profit (000s)
(000s) Success (S) If Successful If Unsuccessful
$ 10 0.20 $1,400 $10025 0.21 1,400 10040 0.22 1,400 10055 0.23 1,400 10070 0.24 1,400 10085 0.25 1,400 100
100 0.26 1,400 100115 0.27 1,400 100130 0.28 1,400 100145 0.29 1,400 100
zim36725_ch06_229-301.qxd 12/15/09 12:43 PM Page 293

James, Inc., is a publicly traded firm and its senior managers and shareholders wish to maximizeexpected net cash flows from this venture. The Buffalo manager receives a bonus of 10 percent of thenet profit (gross profit less advertising).
The bonus is paid only if the firm has gross profit net of advertising. If gross profit less adver-tising is negative, no bonus is paid. The manager wants to maximize her bonus and has private knowl-edge of how the probability of success varies with advertising.
Required:
a. What advertising level would senior managers choose if they had access to the Buffalomanager’s specialized knowledge?
b. What advertising level will the Buffalo manager select, knowing that senior managers donot have the specialized knowledge of the payoffs?
c. If the advertising levels in (a) and (b) differ, explain why.
CasesCase 6–1: Artisans Shirtcraft
BackgroundArtisans Shirtcraft manufactures and sells hand-painted shirts of original design. The company wasfounded in 1999 by three sisters: Cathy, Linda, and Valerie Montgomery. Shirtcraft started out as ameans of financing a hobby; profits from shirt sales were used to pay the cost of supplies. How-ever, word of the sisters’ appealing products spread quickly, eventually creating strong and wide-spread demand for Shirtcraft shirts. By 2003, the year of Shirtcraft’s incorporation, the companyno longer relied on selling at the occasional crafts fair. It now earned almost all of its revenuesthrough sales to upscale boutiques and department stores. Shirtcraft had grown into a legitimatebusiness, but the hobby mentality remained. The company retained a simple approach that hadserved it well: Buy quality materials when available at a bargain price and produce them intoshirts. At this time, the sisters had a ready market for whatever they could produce.
In 2004, the sisters loosely organized Shirtcraft into three functional areas, each based around atalent at which one of them excelled. Cathy would hunt high and low for the best prices, Linda wouldoversee the painting of the original designs, and Valerie would sell the shirts and deal with the gen-eral annoyances of business administration. No separate departmental financial records were kept.
Demand for Shirtcraft shirts continued to grow. To finance additional production, the companyhad become increasingly dependent upon debt. By 2007, bankers had become an integral part of lifeat Shirtcraft. The sisters were devoting themselves primarily to executive administration, leaving mostday-to-day operations to hired managers.
By the end of 2009, more than 75 employees were on the payroll. However, some of Shirtcraft’screditors began to get cold feet. Given the sluggish economy, some felt that continued investment ina company such as Shirtcraft would be foolish. In light of the scrutiny under which their industrypresently operated, the bankers wondered about the prudence of increased and continued commitmentto a company that was virtually devoid of financial controls. The bankers were particularly concernedby Shirtcraft’s continuing reliance on the bargain purchase strategy. They thought the company wouldinevitably vacillate between periods of incurring excessive inventory holding costs for overpurchasedmaterials and periods of lost sales due to underpurchasing. If Shirtcraft wanted the banks to commitlong term to a rapidly growing credit line, the sisters would have to demonstrate their willingness toestablish organizational structures and controls such as those found in larger companies.
PlanIn April 2010, a plan was established. Three functional areas were organized: purchasing, production,and sales and administration. Purchasing and production would be cost centers, each monitored bycomparisons of actual costs to budgeted costs. Compensation for key personnel of the cost centers
294 Chapter 6
zim36725_ch06_229-301.qxd 12/15/09 12:43 PM Page 294

Budgeting 295
would be tied to the results of this comparison. The sisters would officially be employees of the salesand administrative department, which would hold final responsibility for all executive and corporatedecisions. Key employees of sales and administration would be judged and compensated based onoverall firm profitability.
For the 12 months beginning in September 2010, the sisters expected to sell 192,000 shirts at anaverage price of $23 per shirt. Expenses for the sales and administrative department are estimated at$750,000 for the year. Interest expenses for the period are estimated at $550,000. Incentive pay to thevarious departments is expected to amount to $75,000 per functional area. Under the plan, all ex-penses are charged to the individual department that incurs them, except for interest expenses, taxes,and incentive pay. These are treated as corporate profit and loss items. Taxes are expected to be40 percent of corporate pretax income.
After considerable negotiations between the sisters and the purchasing manager, it was agreedthat direct materials costs should average about $7 per shirt if purchases are made based on pro-duction department demand. Although this approach results in higher direct materials costs than abargain purchase strategy, the demand-based purchase strategy is cheaper when opportunity costssuch as inventory holding costs and contribution margin forgone due to lost sales are considered.Salaries and other overhead for the purchasing department are expected to amount to $150,000 forthe year.
Discussions with the production manager led to estimates that production will use fixed over-head costing $240,000. Production’s variable overhead consists wholly of direct labor. An averageof 1�2 hour of direct labor, at a cost of $6 per hour, is needed for each shirt.
Previously, financial records were kept only on a corporate level. Under the new plan, costrecords, both budgeted and actual, will be kept for each department. Of Shirtcraft’s sales, 40 percentare expected to occur during September, October, November, and December. Sales are dividedequally between months within each group of months. All costs that do not vary with shirt productionare divided equally throughout the year. All monthly purchasing and production are based on thatmonth’s orders and are assumed to be completely sold during that month. Only negligible inventoryis held.
Required:
a. Considering only costs, prepare budgeted annual and monthly financial statements forpurchasing and production. (Assume that production is not responsible for any costsalready assigned to purchasing.) Prepare an annual budgeted income statement for ArtisansShirtcraft for the period September 2010 through August 2011. Annual costs for incomestatement purposes consist of the following:
Cost of goods sold
Administrative expenses
Interest
Taxes
All salaries and overhead for purchasing and production are treated as product costs andassigned to individual units. Therefore, these costs should be included in Shirtcraft’sannual income statement under cost of goods sold.
b. In general terms, consider the changes in Shirtcraft due to growth. How is the companydifferent from an organizational standpoint? What role do budgeting and cost centers havein attempting to meet the challenges presented by this growth?
SOURCE: G Hurst.
Case 6–2: Scion Corp.
Scion Corp. manufactures earth-moving equipment. Department A303 produces a number of smallmetal parts for the equipment, including specialized screw products, rods, frame fittings, and some en-gine parts. Scion uses flexible budgeting. The budget for each line item is based on an estimate of the
zim36725_ch06_229-301.qxd 12/15/09 12:43 PM Page 295

296 Chapter 6
fixed costs and variable costs per unit of volume for that item. The volume measure chosen for eachline item is the one with the greatest cause-and-effect relation to the item. For example, the volumemeasure for utilities is machine hours, whereas the volume measure for supervision is direct laborhours of hourly employees.
At the beginning of the year, the plant is given an annual production quota consisting of thenumber of each piece of earth-moving equipment to produce. These equipment quotas are explodedinto the total number of parts each department must produce, using data about what parts are requiredfor each unit of equipment. Each department has a detailed set of standards, developed over a num-ber of years, that translate each part produced into the number of machine hours, direct labor hours,raw materials, and so on. Table 1 summarizes the operating results of department A303—specifically,the budgeted cost per batch of 100 parts for part number UAV 672.
Given the production quotas and the detailed set of quantities of each input required to produce aparticular part, Department A303’s financial budget for the year can be developed. At the end of theyear, the actual number of each type of part produced times the budgeting standards for each part canbe used to calculate the flexible budget for that line item in the budget. That is, given the actual list ofparts produced in Department A303, the flexible budget in Table 2 reports how much should have beenspent on each line item. Price fluctuations in raw materials are not charged to the production managers.If low-quality materials are purchased and cause the production departments to incur higher costs, thesevariances are not charged to the production departments.
The manager of Department A303 does not have any say over which parts to produce. The man-ager’s major responsibilities include delivering the required number of good parts at the specifiedtime while meeting or bettering the cost targets. The two most important components of the manager’scompensation and bonus depend on meeting delivery schedules and the favorable cost variances fromthe flexible budget.
Senior management of the plant is debating the process used each year to update the variousbudgeting standards. Productivity increases for labor would cause the amount of direct labor per partto fall over time. One updating scheme would be to take the budgeting standards from last year (e.g.,Table 1) and reduce each part’s direct labor standard by an average productivity improvement factorestimated by senior plant management to apply across all departments in the plant. The productivityimprovement factor is a single plantwide number. For example, if the average productivity factor isforecast to be 5 percent, then for part UAV 672 the budgeting standard for “Direct labor, salaried”becomes 2.375 hours (95 percent of 2.5 hours). This is termed “adjusting the budget.”
An alternative scheme, called “adjusting the actual,” takes the actual number of direct laborhours used for each part and applies the productivity improvement factor. For example, suppose partUAV 672 used an average of 2.6 hours of salaried direct labor last year for all batches of the part man-ufactured. The budgeting standard for “Direct labor, salaried” for next year then becomes 2.47 hours(95 percent of 2.6 hours).
Under both schemes, last year’s actual numbers and last year’s budgeted numbers are knownbefore this year’s budget is set.
Required:
Discuss the advantages and disadvantages of the two alternative schemes (adjusting the budget versusadjusting the actual).
TABLE 1 Part Number UAV 672Budgeting Standards per 100 Parts per Batch
Raw materials $26.72Direct labor, salaried 2.5 hoursDirect labor, hourly 3.2 hoursMachine hours 6.3 hours
zim36725_ch06_229-301.qxd 12/15/09 12:43 PM Page 296

Budgeting 297
Case 6–3: LaserFlo
Marti Meyers, vice president of marketing for LaserFlo, was concerned as she reviewed the costs forthe AP2000 laser printer she was planning to launch next month. The AP2000 is a new commercialprinter that LaserFlo designed for medium-size direct mail businesses. The basic system price wasset at $74,500; the unit manufacturing cost of the AP2000 is $46,295, and selling and administrativecost is budgeted at 33 percent of the selling price. The maintenance price she planned to announcewas $85 per hour of LaserFlo technician time. While the $74,500 base price is competitive, $85 perhour is a bit higher than the industry average of $82 per hour. However, Meyers believed shecould live with the $85 price. She is concerned because she has just received a memo from the FieldService organization stating that it was increasing its projected hourly charge for service from$35.05 to $38.25.
The $85 price Meyers was prepared to charge for service was based on last year’s $35.05 servicecost. She thought that using last year’s cost was conservative since Field Service had been downsiz-ing and she expected the cost to go down, not up. The $35.05 cost still did not yield the 60 percentmargin on service that was the standard for other LaserFlo printers, but Meyers had difficulty justi-fying a higher maintenance price given the competition. With a service cost of $38.25, Meyers knowsshe cannot raise the price to the customer enough to cover the higher costs without significantly re-ducing sales. Given the higher cost of the LaserFlo field technicians and the prices charged for main-tenance by the competition, she will not be able to make the profit target in her plan.
BackgroundLaserFlo manufactures, sells, and services its printers throughout the United States using direct salesand service forces. It has been in business for 22 years and is the largest of three manufacturers ofhigh-speed laser printers for direct mailers in the United States. LaserFlo maintains its market lead-ership by innovating new technology. Direct mail marketing firms produce customized letters of so-licitation for bank credit cards, real estate offers, life insurance, colleges and universities, and
TABLE 2 Scion CorporationMachining Department A303 Operating Results for Last Year
Favorable Actual Budget* (Unfavorable)
Last Year Last Year Variance
Volume MeasuresMachine hours 238,654 265,000Direct labor hours 146,400 152,000Parts machined 33,565,268 35,759,000
Departmental Financial PerformanceRaw materials $ 8,326,875 $ 8,150,000 $(176,875)Direct labor, salaried 1,546,729 1,643,000 96,271Direct labor, hourly 1,465,623 1,375,000 (90,623)Supervision 451,597 460,000 8,403Maintenance 315,864 325,000 9,136Engineering 279,780 285,000 5,220Utilities 69,539 82,000 12,461Training 85,750 53,000 (32,750)Factory overhead 188,500 210,000 21,500
Total operating expenses $12,730,257 $12,583,000 $(147,257)
*Budget reflects expected fixed costs plus variable costs per unit volume times actual volume.
zim36725_ch06_229-301.qxd 12/15/09 12:43 PM Page 297

298 Chapter 6
magazine giveaway contests. Personalized letters are printed on high-speed printers attached to com-puters that have the mailing information. The printers print either the entire letter or the address andsalutation (“Dear Mrs. Jeremy McConnell”) on preprinted forms. Direct mail firms have computersystems to manage their address lists and mailings, and LaserFlo printers are attached to the client’scomputer system.
Direct mail laser printers process very high volumes; a single printer commonly addresses75,000 letters a day. Hence, LaserFlo printers for direct mail marketers differ from general-purposehigh-speed printers. In particular, they have specialized paper transfer mechanisms to handle the oftencustom, heavy paper; varying paper sizes; and high-speed paper flows. With such high paper flowrates, these printers require regular adjustments to prevent paper jams and misalignments. LaserFlo’snationwide field service organization of about 500 employees maintains these printers.
The standard LaserFlo sales contract contains two parts: the purchase price of the equipmentand a maintenance contract for the equipment. All LaserFlo printers are maintained by LaserFlo fieldservice personnel, and the maintenance contract specifies the price per hour charged for routine andunscheduled maintenance. Most of LaserFlo’s profits come from printer maintenance. Printers haveabout a 5 to 10 percent markup over manufacturing and selling cost, but the markup on maintenancehas historically averaged about 60 percent.
LaserFlo printers have a substantial amount of built-in intelligence to control the printing and forself-diagnostics. Each printer has its own microcomputer with memory to hold the data to be printed.These internal microcomputers also keep track of printing statistics and can alert the operator toimpending problems (low toner, paper alignment problems, form breaks). When customers changetheir operating system or computer, this often necessitates a LaserFlo service call to ensure that thenew system is compatible with the printer. The standard service contract calls for normal maintenanceafter a fixed number of impressions (pages); for example, the AP2000 requires service after every500,000 pages are printed. Its microcomputer is programmed to call LaserFlo’s central computer toschedule maintenance whenever the machine has produced 375,000 pages since the last servicing.
LaserFlo organizationLaserFlo is organized into engineering, manufacturing, marketing, field service, and administrationdivisions. Engineering designs the new printers and provides consulting services to marketing andfield service regarding system installation and maintenance. Engineering is evaluated as a cost center.
Manufacturing produces the printers, which are assembled from purchased parts and subassem-blies. LaserFlo’s comparative advantage is quality control and design. Manufacturing also providesparts for field service maintenance. Manufacturing is treated as a cost center and evaluated based onmeeting cost targets and delivery schedules. Manufacturing’s unit cost is charged to marketing foreach printer sold.
Marketing, a profit center, is responsible for designing the marketing campaigns, pricing theprinters, and managing the field sales staff. LaserFlo sells six different printers; each has a separatemarketing program manager. The six marketing program managers report to Marti Meyers, vice pres-ident of marketing, who also manages field sales.
Field sales is organized around four regional managers responsible for the sales offices in theirregion. Each of the 27 sales offices has a direct sales force that contacts potential customers and sellsthe six programs. Salespeople receive a salary and a commission depending on the printer and optionssold. The salesperson continues to receive commissions from ongoing revenues paid by the accountfor service. Since ongoing maintenance forms a significant amount of a printer’s total profit, thesalesperson has an incentive to keep the customer with LaserFlo.
Field service contains the technical people who install and maintain the printers. Headed by PhilHansen, vice president of field service, field service usually shares office space with field sales in thecities where they operate. Field service is a cost center, and its direct and indirect costs are chargedto programs when the printers are serviced. The price charged is based on the budgeted rate set atthe beginning of the year. Any difference between the actual amount charged to the programs and thetotal cost incurred by the field service group is charged to a corporate overhead account, not to themarketing programs.
Administration manages human resources, finance, accounting, and field office leases. It han-dles customer billing and collections, payroll, and negotiating office space for the field sales and field
zim36725_ch06_229-301.qxd 12/15/09 12:43 PM Page 298

Budgeting 299
service people. Administration is evaluated as a cost center. While local office space is managed byadministration, the cost of the office space is allocated to the field sales and service groups andincluded in their budgets and monthly operating statements.
Service contractsEach LaserFlo printer sold requires a service contract. The AP2000’s service contract calls for nor-mal maintenance every 500,000 pages at a price of $0.51 per 1,000 pages. Normal maintenance re-quires three hours. The typical AP2000 prints 12 million pages per year. Besides normal maintenance(sometimes called preventive maintenance), unscheduled maintenance occurs due to improper oper-ator setups, paper jams, system upgrades, and harsh usage of the equipment. Past statistical studieshave shown that each normal maintenance hour generates 0.50 unscheduled maintenance hours.Unscheduled maintenance is billed to the customer at the service contract rate of $85 per hour.
When maintenance is performed on a particular machine, the service revenues less field servicecosts are credited to the marketing manager for that program. All the programs’ actual service prof-its are compared with the plan; they form part of Meyers’s performance evaluation. The field sales-person receives a commission based on the total service revenue generated by the account. Inevaluating each new printer program, LaserFlo uses the following procedure. Profits from service areexpected to create an annuity that will last for five years at 18 percent interest. To evaluate a proposednew printer, the one-year maintenance profits are multiplied by 3.127 to reflect the present value ofthe future service profits each printer is expected to generate over its life (about five years).
PartsAny parts used during service are charged directly to the customer and do not flow through field ser-vice budgets or operating statements. LaserFlo purchases most of the printers’ parts from outside sup-pliers, and the customer pays only a token markup. Marketing does not receive any revenue, nor is itcharged any costs when customers use parts in the service process. The reason for not charging cus-tomers a larger markup on parts stems from an antitrust case filed against LaserFlo and other printercompanies six years ago. A third-party service company, Servwell, sued the printer manufacturers forrestraint of trade, claiming they prevented Servwell from maintaining the printers by only sellingreplacement parts at very high prices. To prevent other such claims, LaserFlo sells parts at a smallmarkup over costs. Yet Servwell and other third-party service firms have never been able to penetrateLaserFlo’s service markets because laser printing technology changes rapidly, and an outside com-pany cannot keep a work force trained to fix the latest products. Besides, each printer usually has atleast two engineering modifications each year to fix problems or upgrade the printer or its micro-computer hardware and/or software. An outside service company cannot learn of these changes andprovide the same level of service as LaserFlo.
Recent changes in field serviceLaserFlo field service had two types of technicians: Tech1 and Tech2. Both were trained to repairelectromechanical problems, but Tech2s had more training in electronics and computers to work onthe latest, most sophisticated printers.
Field service had been trying to reduce the size of the service force the last few years throughvoluntary retirements and attrition. As the printers became more sophisticated, they became more re-liable. The newer systems had self-diagnosing software that allowed a service technician to call upa customer’s printer and run a diagnostic program. Often the problem was solved over the phone lineby having a LaserFlo technician make the repair in the software. If a mechanical problem was de-tected, the technician dispatched a repair person (often a Tech1) with the right part. Also, past cus-tomers replaced their older printers with newer ones that required less maintenance. The result wasexcess capacity in the field staff.
The voluntary retirements over the past few years did not produce the reductions necessary toeliminate the excess capacity. In 2010, field service went through a very large involuntary reductionof its workforce. Through attrition, early retirements, and terminations, LaserFlo reduced the numberof technicians by 75, down to 500 budgeted for 2011. The company simultaneously improved the skilllevel of its remaining field force substantially.
zim36725_ch06_229-301.qxd 12/15/09 12:43 PM Page 299

300 Chapter 6
AP2000 sales plan for 2011 Marti Meyers’s 2011 sales plan for the AP2000 calls for 120 placements this year and a programprofit projection of about $2.5 million based on capitalizing the service income using the 3.127annuity factor. If she were to raise the service price much above $0.51 per 1,000 pages, LaserFlowould lose sales, which are already ambitious. She called Phil Hansen and raised her concernswith him.
“Phil,” she began, “explain to me how you downsized your field personnel, cut some office lo-cations, consolidated inventories, and reduced other fixed costs, yet the price I’m being charged forservice increased from $35.05 per hour to $38.25. I thought the whole purpose of the field servicereorganization was to streamline and make us more cost competitive. You know that our servicecosts were out of line with our competitors’. We were planning to charge $85 an hour for theAP2000 service contract. Even at $85 per hour, I would be violating the corporate policy of main-taining a 60 percent markup on service. If I were to follow the 60 percent rule, I would have tocharge $87.63 per hour if you had kept your cost to me at $35.05. But with your cost of $38.25 andmy price at $85, the margin falls to 55 percent. I already had to get special permission to lower themargin to 59 percent with $35.05.”
TABLE 1 Field Service Projected Hourly Rate for 2011
Variable CostsTech1*
Salary & benefits $ 42,800Number � 175
Total direct cost of Tech1 $ 7,490,000Tech2†
Salary & benefits $ 54,800Number � 325
Total direct cost of Tech2 $17,810,000
Total variable cost $25,300,000
Fixed CostsSupervision $1,475,000Occupancy costs 1,864,000Utilities 772,000Insurance 368,000Other 56,000Total fixed cost $ 4,535,000
Total cost $29,835,000Number of Tech1 175Number of Tech2 325
Total technicians 500Number of technician months 6,000Average number of billable hours
per month per technician‡ 130Protected number of billable hours 780,000
Cost per hour projected for 2011 $38.25
Note: Cost per hour in 2010 $35.05
*300 Tech1s in 2010 with salary & benefits of $40,100.†275 Tech2s in 2010 with salary & benefits of $52,900.‡Same in 2010.
zim36725_ch06_229-301.qxd 12/15/09 12:43 PM Page 300

Budgeting 301
Hansen replied, “Well, there are a number of issues that you’ve just raised. Let me respond to afew over the phone now and suggest we meet to discuss this more fully next week when I’m back inthe office. In the meantime, I’ll send you our projected budget for next year that derived the $38.25rate. Regarding the key question as to how our hourly rate could go up after downsizing, it’s reallyquite simple. We had a lot of idle time being built into the numbers. People just pretended to be busy.Had we not downsized, the hourly charge would have gone up even more than it did. For example, onthe AP2000 that you mentioned, we would have used 3.25 hours per normal servicing had we kept ourlabor force mix of Tech1s and 2s the same as in 2010. Had we not downsized, our fixed costs in 2011would have remained the same as they were in 2010, and our variable costs for Tech1s and 2s wouldhave increased to the 2011 amounts because of wage increases and inflation. Let me get you our num-bers so you can see for yourself how much progress we’ve been making.”
That afternoon, Meyers received a fax from Hansen’s office (see Table 1). In trying to decidehow to proceed, Meyers would like you to address the following questions:
a. Calculate the projected five-year profits of an AP2000 using first the $35.05 and then the$38.25 service cost.
b. Why did the field service hourly cost increase? What caused the hourly rate to go from$35.05 to $38.25?
c. Did the reorganization of field service reduce the cost of servicing the AP2000? Calculatewhat the total annual service cost of the AP2000 would have been had the reorganizationnot occurred.
d. Identify the various options Meyers has for dealing with the service cost increase andanalyze them.
e. Why does LaserFlo make more money on servicing printers than selling them? Does sucha policy make sense?
zim36725_ch06_229-301.qxd 12/15/09 12:43 PM Page 301

302
Chapter Seven
Cost Allocation:Theory
Chapter Outline
A. Pervasiveness of Cost Allocations
1. Manufacturing Organizations
2. Hospitals
3. Universities
B. Reasons to Allocate Costs
1. External Reporting/Taxes
2. Cost-Based Reimbursement
3. Decision Making and Control
C. Incentive/Organizational Reasons for CostAllocations
1. Cost Allocations Are a Tax System
2. Taxing an Externality
3. Insulating versus Noninsulating Cost Allocations
D. Summary
zim36725_ch07_302-346.qxd 12/15/09 1:59 PM Page 302

Cost Allocation: Theory 303
A central issue in all internal accounting systems is cost allocation, the assignment ofindirect, common, or joint costs to different departments, processes, or products. The majorproblem in product costing is whether and how indirect costs (overheads) are allocated toproducts. The allocation of corporate headquarters costs and service department costs, suchas information technology and human resources, is in fact a form of transfer pricing withinthe firm and is thus an integral part of the organization’s architecture described in Chapter 4.This chapter presents a general framework for analyzing cost allocations in all organiza-tions, using the earlier framework of costing for decision making (Chapter 2) and costingfor control (Chapter 4).
Consider the following two examples. In the first example, a patient with abdominalpain is admitted to the hospital. After five days, a series of tests, and an operation to removean ulcer, the patient is discharged. During the patient’s stay, she used a variety of services:physicians, nurses, laboratory technicians, food workers, and laundry services. Indirectservices include the hospital’s admitting and billing offices, building maintenance andsecurity, information technology, and senior hospital administrators.What was the cost ofthis patient’s stay in the hospital? One could just examine the incremental (or marginal) costof the patient’s stay or the “full” cost, including all the indirect services. Calculating the fullcost of the patient’s stay requires allocating the costs of food workers, laundry services,hospital administrators, and so forth to patients.
In the second example, the drilling department in a manufacturing plant drills holes inthe sheet-metal chassis that forms the base for a fax machine. Several types of fax machinechassis are drilled in the department, each with its own configuration and sizes of holes.The drilling department costs consist of labor, tools, supplies, space occupancy (utilities,maintenance, accounting, and plant administration), and accounting depreciation of thedrilling machines. Last month, the department drilled 2,100 units of a particular chassismodel. What was the “full” cost of drilling holes in this particular type of chassis? An-swering this question requires allocating the drilling department costs to each chassismodel produced.
Despite different organizational settings, both organizations face a similar problem:allocating a set of costs to a cost object. A cost object is a product, process, department, orprogram that managers wish to cost. In the two examples, a patient and a chassis are thecost objects. Corporate-level R&D expenses are allocated to the Chevrolet division ofGeneral Motors because senior executives at General Motors want to assess the total prof-itability of Chevrolet net of corporate R&D. The Chevrolet division is the cost object.Managers allocate common costs to cost objects for several reasons, including decisionmaking and/or control. The framework developed in Chapters 2 and 4 will be used to illus-trate the trade-off between decision management and decision control in designing costallocations. Since cost allocations are used for multiple purposes, we will again see that nosingle way of allocating costs is always right or always wrong. Trade-offs must be made inchoosing whether and how to allocate a given common cost. As we will see later, exactlyhow the cost allocation is performed depends on what purposes the allocation serves.
Section A in this chapter describes several different institutional settings and organi-zations in which cost allocation takes place. Costs are allocated for a variety of reasons,including taxes, financial reporting, cost-based reimbursement, decision making, and con-trol. The various reasons for allocating costs, including organizational control reasons, aredescribed in section B. The incentive effects of cost allocations are further examined insection C. Allocated costs are intended as proxies for certain hard-to-observe opportunitycosts. While allocated costs measure the opportunity cost with error, they are much lessexpensive to compute than opportunity costs.
zim36725_ch07_302-346.qxd 12/15/09 1:59 PM Page 303

A. Pervasiveness of Cost AllocationsThe vast majority of organizations allocate common costs. A common cost arises when aresource is shared by several users. For example, human resource department costs are acommon cost because all employees in the firm utilize its services. Hospitals allocate thecommon costs of shared medical equipment to departments that use it. Telecommunicationscosts are allocated to users. Purchasing department costs are allocated to products.
Common costs are sometimes called indirect costs because they cannot be directlytraced to units produced or cost objects precisely because such costs are incurred in pro-viding benefits to several different cost objects. Likewise, “overhead” refers to indirect,common costs. Following general practice, we will use the terms common costs, indirectcosts, and overhead interchangeably.
The terms cost allocation, cost assignment, cost apportionment, and cost distributionare synonyms. All describe the process of taking a given common cost and dividing it be-tween various cost objects (patients or fax machine chassis). Direct costs do not have to beallocated because they can be directly traced to the cost object. For example, if the firm’sintranet is used only by the sales department, then the intranet costs are a direct cost of thesales department. However, if both the sales and the manufacturing departments share thesame intranet, the intranet costs are not a direct cost of either department but rather a com-mon cost that must be allocated to the cost objects—the two departments.
Cost allocation requires the following steps:
1. Define the cost objects. The organization must decide what departments, products, orprocesses to cost. For example, intranet users may be defined as cost objects. Thecost object is often a subunit of the organization, such as a cost or profit center. Costsare often allocated to subunits to better evaluate the subunit’s performance and toassess product-line profitability. Or costs are allocated as a control device.
2. Accumulate the common costs to be assigned to the cost objects. Suppose intranetcosts are to be assigned to the intranet users. This step requires the identificationand accumulation of the common costs such as the cost of the hardware, personnelexpenditures, utilities, and software costs of the intranet that will be distributed tothe users.
3. Choose a method for allocating common costs accumulated in step 2 to the costobjects defined in step 1. An allocation base, a measure of activity associated withthe pool of common costs being distributed to the cost objects, must be selected.The allocation base to distribute intranet center costs to users can be time used,computer memory, or some combination of these. As discussed later in this chapter,common costs usually are allocated to cost objects using an allocation base thatapproximates how the cost objects consume the common resources.
For example, to provide e-mail services for its employees a firm incurs expenses of$575,000 per year consisting of a computer lease ($273,000), labor ($195,000), software($78,000), and other costs ($29,000). Four departments use various amounts of disk spacefor e-mail messages measured in terabytes (trillion characters). Table 7–1 shows disk spaceusage for the four departments.
Terabytes of storage are used as the allocation base to distribute the annual e-mailcost of $575,000 to the departments. The allocation rate is $2,875 per terabyte per year($575,000 � 200). Table 7–2 displays the resulting allocated costs to each user.
Most U.S. corporations allocate a significant amount of corporate overhead back totheir profit centers. Frequently allocated costs include research and development, distribu-tion expense, income taxes, and finance and accounting costs.
304 Chapter 7
zim36725_ch07_302-346.qxd 12/15/09 1:59 PM Page 304

Cost Allocation: Theory 305
In a survey of large Canadian firms, 70 percent indicated they allocate costs.1 Of thoseallocating costs, the primary objective of cost allocation was:
Decision control 42%Decision making 32Other purposes:
Cost determination 19Overhead recovery 5Equity or fairness 2
These findings reinforce the relative importance of cost allocations in decision manage-ment and control. In fact, in this survey, decision control is more important than decisionmaking. The next three examples illustrate the prevalence of cost allocations in both profitand nonprofit organizations and another role of cost allocations: cost-based reimbursement.
Cost allocations are quite prevalent in manufacturing. Manufacturers cannot deduct all theirmanufacturing costs for financial reporting and tax purposes. Rather, they must trace theirdirect manufacturing costs and allocate their indirect manufacturing costs between units soldand units remaining in inventory. Hence, for calculating cost of goods sold, net income, andinventories, financial reporting and taxes often mandate that indirect manufacturing costs be
1. ManufacturingOrganizations
TABLE 7–1 E-Mail Users of Disk Space(in Terabytes of Memory)
Terabytes of Users Memory
Manufacturing 40Sales 80Research and development 20Administration 60
Total 200
TABLE 7–2 Allocation of Annual E-Mail Cost to User Departments
Cost per Terabytes of Allocated Users Terabyte Memory Cost
Manufacturing $2,875 40 $115,000Sales 2,875 80 230,000Research and development 2,875 20 57,500Administration 2,875 60 172,500
Total 200 $575,000
1 A Atkinson, Intra-Firm Cost and Resource Allocations: Theory and Practice (Toronto: Canadian AcademicAccounting Association, 1987), p. 5.
zim36725_ch07_302-346.qxd 12/15/09 1:59 PM Page 305

allocated. Cost allocations also arise whenever the firm has a cost-based reimbursable con-tract. In this case, the firm’s revenues depend on reported costs, including allocated costs.For example, certain government defense contracts are cost based. The contractor’s rev-enues are contractually tied to reported costs. In these circumstances, the contractor has anincentive to allocate as much cost to the government work as is permitted under the termsof the contract. Suppose an aircraft company manufactures both military and commercialaircraft. Military aircraft are produced under a cost-based contract. Subject to the contrac-tual stipulations, the firm has an incentive to find the allocation basis that maximizes thefraction of the president’s salary allocated to the military contract.
Hospitals rely on reimbursement by the government and by private medical insurance com-panies. At one time in the United States, these payments depended on the costs reported bythe hospital. In some states, nursing home reimbursement under Medicaid is still based onreported costs. Under cost-based reimbursements, cost allocation becomes an importantdeterminant of revenue. For example, suppose a hospital serves two patient populations:poor elderly cases and affluent maternity cases. Suppose the medical costs for the elderlyare paid by the government at a fixed amount per case, whereas private insurance compa-nies reimburse the hospital for maternity cases at “cost.” Given these patient populationsand reimbursement rules, the hospital administrator has an incentive to choose a costallocation method that loads as much cost as permitted onto the maternity cases in order tomaximize revenues. For example, laundry costs can be assigned using various allocationbases: patient days, floor space, nursing hours, and so on. The hospital administrator wantsto use the allocation base that allocates as much laundry cost as possible to maternitybecause this maximizes hospital revenue.
Today, hospital reimbursement in the United States is less tied to reported costs thanpreviously. Hospitals basically are reimbursed at a flat amount for a given medical proce-dure (diagnostic-related groups, or DRGs). This change in hospital reimbursement ruleshas reduced the opportunity to maximize hospital revenues using cost allocations.2
Universities also allocate costs. A recurring debate at most campuses concerns indirect costpools. Research-oriented universities derive significant revenues from government con-tracts and grants. Grants from organizations such as the National Science Foundation andthe National Institutes of Health pay for basic research. University scientists submit researchproposals to a government funding agency describing their experiments, anticipated con-tribution, and costs of the project. Besides the direct cost of the experiment, the researchgrant is expected to pay for the indirect costs of research such as building occupancy,library facilities, administration, and security. University research proposals include areimbursable cost item for such indirect costs. The university estimates the total cost of allindirect expenses attributable to government-sponsored research as well as the total directcosts of government-sponsored research. The ratio of these estimates is the indirect costrate, which varies from 40 to 75 percent across universities. If a cancer researcher seeks$250,000 of direct cost support for laboratory staff, supplies, and salaries, and the univer-sity has a 50 percent indirect cost rate, the grant proposal includes an additional $125,000of indirect cost recovery.
3. Universities
2. Hospitals
306 Chapter 7
2 Many states regulate hospitals by limiting the total revenues a hospital can receive in a given year. Forexample, the state of Washington places a cap on each hospital’s total revenues based on its projected costs for theyear and adjusted for actual volume. Such a method has been shown to provide hospital administrators withincentives to bias their forecasted costs in order to increase their budget. See G Blanchard, C Chow, and E Noreen,“Information Asymmetry, Incentive Schemes, and Information Biasing: The Case of Hospital Budgeting underRate Regulations,” Accounting Review 61 (January 1986), pp. 1–15.
zim36725_ch07_302-346.qxd 12/15/09 1:59 PM Page 306

Cost Allocation: Theory 307
Universities have an incentive to recover as much indirect cost as possible. StanfordUniversity received about $400 million to support research in 1988, which included about$91 million of overhead costs. A September 14, 1990, Wall Street Journal article reportedthat the federal government claims that Stanford “officials may have engaged in ‘fraudu-lent acts’ and made ‘false claims’ in its billing practices including ‘excessive library costreimbursement’ amounting to $30 million to $40 million from 1983 to 1986.” In 1991, thepresident, provost, and chief financial officer of Stanford resigned. The U.S. governmentreduced Stanford’s indirect cost recovery rate from 78 percent to 55.5 percent, whichreduced government payments to Stanford by $22 million per year. This Stanford example,while an isolated case, illustrates that cost allocations can at times have serious conse-quences for organizations and their leaders.
Cost allocations also affect the resources available to the various colleges and depart-ments. Chapter 6 described a university budget system. If each college within the univer-sity is treated as a profit center, then cost allocations become relevant. If the businessschool must operate within a balanced budget, in which revenues equal expenditures plusallocated costs, then the amount of central administration, library, security, or humanresource department costs allocated to the business school affects its other spending. Acollege within the university with positive net cash flows can be “taxed” and these cashflows used to subsidize colleges within the university with negative net cash flows. This is
ManagerialApplication:The Legacyof the $7Aspirin
Hospitals routinely justify the prices they charge for services and procedures based oncosts. For example, a hospital explains the $7 price for two aspirin tablets as follows:
Two aspirin tablets $0.012Direct labor
Physician 0.500Pharmacist 0.603Nurse 0.111
Indirect labor (recordkeeping and orderly) 0.400Cup 0.020Shared and shifted costs
Unreimbursed Medicare 0.200Indigent care 0.223Malpractice insurance and uncollectible receivables 0.152Excess bed capacity 0.169Other administrative and operating costs 0.242
Product cost $2.632Hospital overhead costs @ 32.98% 0.868
Full cost (incl. overhead) $3.500Profit 3.500
Price (per dose) $7.000
While the $7 price of the aspirin might at first appear ridiculous, this is the amount nec-essary to recover both the direct and indirect costs of prescribing the aspirin, costs thatthe hospital cannot recover from its other patients, and to provide a profit.
SOURCE: D McFadden, “The Legacy of the $7 Aspirin,” Management Accounting, April 1990, pp. 38–41.
zim36725_ch07_302-346.qxd 12/15/09 1:59 PM Page 307

accomplished by allocating more university overhead to the positive cash-flow collegesand less overhead to the negative cash-flow colleges. These overhead allocations absorbsome of the positive cash flows, allowing the president to use other funds that would oth-erwise have been used to pay the overheads to subsidize the negative cash-flow colleges.Cost allocations are no longer an idle academic speculation in such settings; they oftenconsume a considerable amount of the deans’ and central administration’s time.
This discussion is not a thorough listing of all cost allocation situations, but it illus-trates that cost allocations are important in many types of organizations. Cost allocationscan affect real resource utilization and cash flows.
B. Reasons to Allocate CostsMost organizations allocate costs. However, some responsibility accounting proponentsargue that managers should only be allocated a cost if they have some control over that cost.For example, the maintenance department is a cost center. Its budget contains allocatedcosts such as a charge for office space over which the maintenance manager has no control.Why give the budget center manager a budget and then take some of it back via a costallocation? Why not just give the manager a smaller budget?
This section describes three possible reasons why organizations allocate costs: externalreporting (including taxes), cost-based reimbursements, and decision making and control.
External financial reports and tax accounting rules require that inventory be stated at cost,including indirect manufacturing costs. For example, inventory includes not only directlabor and direct material but also a fraction of factory depreciation, property taxes, and thesalaries of security guards at the factory. Overhead costs, including indirect costs, must beallocated to products. This does not require the firm to use cost allocations for internalreports. To avoid the extra bookkeeping costs of a second set of accounts that exclude theallocated costs, firms use the same accounts internally as externally. However, additionalbookkeeping costs would likely be small and offset by the costs of dysfunctional decisionsfrom using the external system for internal operating decisions. Thus, external reportingrequirements are not likely to explain the widespread use of cost allocations for internalreporting, such as divisional performance evaluation.
Exercise 7–1
Network Systems (NS) offers telecommunications design and consulting services to organiza-
tions. The firm offers two types of contracts to its clients: a cost-plus 25 percent contract and
a fixed-fee contract where NS offers a fixed price for the job. For cost-plus contracts, total cost
includes both direct costs and indirect overheads. NS completes 10 cost-plus contracts at a
1. ExternalReporting/Taxes
308 Chapter 7
HistoricalApplication:The Allocationof OverheadHas BeenContentiousfor Decades
The allocation of overhead has received more attention than any other cost accountingtopic and has been a hotly debated problem ever since accountants began recordingindirect expenses. One commentator writing in 1916 described the situation as follows:
Indirect expense is one of the most important of all the accounts appearing on the books ofthe manufacturer. Methods of handling its [allocation] have given rise to more argumentsthan the problem of the descent of man. It is the rock upon which many a ship of industry hasbeen wrecked.
SOURCE: C Thompson, How to Find Factory Costs (Chicago, IL: A. W. Shaw Co., 1916), p. 105. Quoted by P Garner,Evolution of Cost Accounting to 1925 (Montgomery, AL: University of Alabama Press, 1954), pp. 170–71.
continued
zim36725_ch07_302-346.qxd 12/15/09 1:59 PM Page 308

Cost Allocation: Theory 309
total direct cost of $450,000 and 15 fixed-fee contracts. Revenues collected from the fixed-fee
contracts totaled $2,400,000. The total direct cost of the fixed-fee contracts amounted to
75 percent of the collected revenues. NS has indirect overheads of $350,000.
Required:
a. Allocate the indirect overhead of $350,000 to the fixed-fee and cost-plus 25 percent
contracts using direct cost as the overhead allocation base.
b. Allocate the indirect overhead of $350,000 to the fixed-fee and cost-plus 25 percent
contracts using number of contracts as the overhead allocation base.
c. Should NS allocate overhead using direct cost or number of contracts? Explain why.
Solution:
a. Indirect overhead allocated using direct cost as the overhead allocation base.
Fixed Fee Cost-Plus Total
Direct cost $1,800,000* $450,000 $2,250,000% of direct cost 80% 20% 100%Allocated overhead based on direct cost $280,000 $70,000 $350,000
* 75% � $2,400,000.
b. Indirect overhead allocated using contracts as the overhead allocation base.
Fixed Fee Cost-Plus Total
Number of contracts 15 10 25% of contracts 60% 40% 100%Allocated overhead based on number of contracts $210,000 $140,000 $350,000
c. Assuming that (1) the only use of overhead allocations is the computation of total
cost for pricing cost-plus contracts and (2) the total number of cost-plus contracts is
insensitive to the final price, NS should allocate overhead using number of contracts.
Using number of contracts leads to $70,000 ($140,000 � $70,000) more indirect
costs allocated to the cost-plus contracts and hence to $87,500 (1.25 � $70,000) of
additional revenues on these contracts.
Cost-based reimbursement is another reason for cost allocations. Government cost-basedcontracts and medical reimbursements for cost give rise to cost allocations. The U.S.Department of Defense purchases billions of dollars of goods a year under cost-pluscontracts. Most new weapons systems are procured under negotiated contracts in whichthe producer’s revenues are in part a function of reported costs. To help regulate the costallocations contractors use in government contracts, the federal government establishedthe Cost Accounting Standards Board (CASB). The CASB has issued standards coveringthe cost accounting period, capitalization of tangible assets, accounting for insurance andpension costs, and the allocation of direct and indirect costs.
The revenues of public utilities such as electric and gas companies are also tied toreported costs. States often grant public utilities exclusive monopolies over service territories.
2. Cost-BasedReimbursement
zim36725_ch07_302-346.qxd 12/15/09 1:59 PM Page 309

In return, the state regulates the rates the utility can charge customers. In many cases, theregulated prices are based on reported costs, including allocated costs. In public utilityregulation, the major issue is deciding how to allocate the common costs of capacity, suchas the electricity-generating plant, among the different classes of users (residential versusbusiness customers). In many public utility rate-setting cases, cost allocation is the preem-inent issue.
310 Chapter 7
ManagerialApplication:FederalReserveBanks:ReallocatingCosts Due toCost-BasedReimburse-ments
The Federal Reserve banks in the United States provide several services to their mem-ber banks: check-clearing, wire transfers, currency processing, and so forth. The Fed-eral Reserve banks are an agency of the U.S. government, and they are required by lawto charge private banks fees for their services. Moreover, the law mandates that thesefees be based on all direct and allocated costs. Some of the services provided by theFederal Reserve Banks (check-clearing) are also provided by private, for-profit com-petitors. Other Fed services (electronic transfer) face little outside competition.
A study found that the Fed shifted the allocation of costs from competitive servicesand markets to less competitive services. Because the prices charged by the Fed had tobe documented based on costs (both direct and indirect), this reallocation of costs frommore to less competitive services allowed the Fed to justify charging lower prices in itscompetitive services and higher prices in its less competitive services. This is an exam-ple of how cost-based reimbursement contracts create incentives for managers to designcost allocation schemes that maximize total revenues.
SOURCE: K Cavalluzo, C Ittner, D Larcker, “Competition, Efficiency and Cost Allocation in Government Agencies:Evidence on the Federal Reserve System,” Journal of Accounting Research (Spring 1998), pp. 1–32.
HistoricalApplication:IncentiveEffectsof CostAllocations
James McKinsey, founder of the consulting firm bearing his name, wrote
[O]ne of the largest items of expense to be allocated in a department store is advertising. Theusual method of allocating this to the various departments of the store is on the basis of sales.This practice leads to two undesirable results. First, some departments profit more than othersby advertising, since it is devoted to articles sold by some departments much more than toarticles sold by other departments. . . . This gives inaccurate (departmental profit) figures. . . .Secondly, if advertising is distributed on the basis of sales, each department head will try tosecure as much advertising as possible, since he will feel that each of the other departmentsmust pay part of its cost which results in his department’s paying only a small part of the total.He naturally concludes that he must certainly get more benefit from the advertising than itcosts him; therefore he will request and urge it. He will be more apt to do this because heknows every other department is seeking advertising, for which his department must pay itsproportionate part.
After discussing the allocation of expenses, McKinsey concludes
[C]are should be exercised to allocate (costs) in such a manner as to attain two results:
1. Greatest possible accuracy.
2. The fixing of responsibility in such a manner that those responsible for the expensewill desire to decrease and not to increase it.
McKinsey recognized that cost allocations affect managers’ incentives.
SOURCE: J McKinsey, Budgetary Control (New York: Ronald Press, 1922), pp. 283–84.
zim36725_ch07_302-346.qxd 12/15/09 1:59 PM Page 310
Cost Allocation: Theory 311
3 S Sunder, Theory of Accounting and Control (Cincinnati, OH: South-Western Publishing 1997), pp. 55–56.
In firms whose revenues depend on reported costs, cost allocations can have a largeimpact on cash flows. But relatively few firms have revenues contractually based on costs,and cost allocations are prevalent in firms without cost-based revenues. Therefore, thewidespread use of cost allocations cannot be explained by the existence of cost-basedreimbursement contracts.
Decision making and control are the most likely explanation for the prevalence of cost al-locations. Cost allocations are an important part of the organization’s budget system (bywhich resources are allocated within the firm) and an important part of the organization’sperformance evaluation system. Cost allocations change the way decision rights are parti-tioned within the firm.
Cost allocations change managers’ incentives and thus their behavior. For instance, inthe university example discussed earlier, the university president constrains the deans of thecash-rich colleges by allocating more costs to them; they receive fewer resources and, there-fore, fewer decision rights. Hence, the allocation of more costs to one school and less toanother transfers decision rights over the amount of other spending each school can do. Orconsider the following example. You are at an expensive restaurant with four friends. Beforeordering it is agreed that you will split the bill evenly—equal cost allocations. What are yourincentives under this cost allocation method? Overconsumption. With equal cost allocation,you only bear $0.20 of each additional dollar you eat and drink. The other $0.80 of your in-cremental consumption is paid by your colleagues. Likewise, you pay 20 percent for each ofyour friends’ bill. Hence, each of you has an incentive to spend more than you would hadyou agreed upon separate checks. The simple solution is for everyone to pay for only whatthey consume. But this requires either separate bills (which servers dislike) or one of you tocalculate each person’s actual cost. This illustrates that how the bill is allocated affects howthe parties will order. Cost allocations affect behavior.
Consider another example. Suppose a firm is studying installing an expensive infor-mation system that managers throughout the firm will use to help them make better deci-sions and provide better customer service. Neither senior management nor the systemdesigners have the specialized knowledge of each user’s demand or the value to be derivedfrom using the proposed system. The users must reveal this knowledge during the designphase. If users know that before the system is installed they will not be charged for it, theywill request too large a system and overutilize it once it is built.
Once the system is installed and users are allocated the cost of the system based on us-age, they will tend to underutilize the system if it has excess capacity. (Allocated cost is anaverage cost transfer price that is likely above the marginal cost.) So the transfer price thatelicits the efficient use of the system (marginal cost) is less than what the users are charged.Therefore, in deciding whether to use cost allocations for the new information system,managers must balance the efficiency of system acquisition against the efficiency of sys-tem utilization.3
The next section elaborates on the various organizational reasons for allocating costs.
Q7–1 What are some of the reasons for allocating costs?
Q7–2 Describe some ways cost allocations can affect cash flows. ConceptQuestions
3. DecisionMaking andControl
zim36725_ch07_302-346.qxd 12/16/09 8:31 PM Page 311

C. Incentive/Organizational Reasons for Cost Allocations4
Cost allocations act as an internal tax system. Like a tax system, they change behavior. Forexample, consider a computer company with 38 branch offices around the world. Eachbranch is treated as a profit center and is thus evaluated on total sales less expenses. Thebranch manager chooses the number of salespeople and the local advertising and promo-tion budget. The firm incurs substantial R&D, distribution, and administration expenses.Should these costs be allocated to the 38 sales offices?
To understand how cost allocations act as a tax, suppose the branch manager’s decisionis simplified to choosing how much to spend on salespeople and how much to spend onlocal advertising. Table 7–3 summarizes the various combinations of salespeople requiredto sell $10 million of computers per month. Salespeople cost $4,000 per month, and astandard ad costs $2,000. To sell $10 million of computers a month, the manager can hire30 salespeople and buy 182.57 ads or can hire 31 salespeople and buy 179.61 ads. Moresalespeople require fewer ads to produce the same level of sales. Likewise, more adsrequire fewer salespeople to yield the same sales.
To select the combination of salespeople and advertising, the branch manager willchoose the one that minimizes total costs. Therefore the cost of the first combination is
30 � $4,000 � 182.57 � $2,000 � $485,140
Likewise, the cost of the second combination is
31 � $4,000 � 179.61 � $2,000 � $483,220
The cost of the second allocation is less than the first combination, so it is preferred. FromTable 7–3, we see that 40 salespeople and 158.11 ads is the lowest cost combination neededto produce $10 million of sales per month. The calculations so far do not involve any costallocations.
Suppose corporate expense is allocated based on the number of salespeople. In partic-ular, for each salesperson in the branch, that branch is allocated $1,000 of corporate over-head. The branch manager’s reported costs for the first combination now becomes
30 � $4,000 � 182.57 � $2,000 � 30 � $1,000 � $515,140
The first combination is $30,000 more expensive than the earlier one before cost allocations.The “price” the branch manager now “pays” for salespeople includes both the wage
($4,000) and the overhead rate ($1,000). The last column in Table 7–3 calculates the totalcost of each combination including the $1,000 cost allocation per salesperson. With costallocations, the lowest cost combination consists of 34 salespeople and 171.5 ads. Thiscombination has six fewer people but 13.39 more ads. With cost allocations, the branchmanager uses more advertising and fewer salespeople than when there was no overheadallocation. The branch manager uses less of the now relatively more expensive input, sales-people, and more of the relatively cheaper input, advertising.
The overhead rate, $1,000, is a tax on salespeople (labor). Like all taxes on consump-tion items (such as beer, gasoline, and cigarettes), the tax discourages use of the itemlevied with the tax. Overhead rates and cost allocations are de facto tax systems in firms.The factor input used as the allocation base is being taxed (salespeople in the example).The tax also “distorts” the price of the factor input. Instead of viewing the price of labor as
1. CostAllocations Area Tax System
312 Chapter 7
4 This section is based on J Zimmerman, “The Costs and Benefits of Cost Allocations,” Accounting Review54 (July 1979), pp. 504–21.
zim36725_ch07_302-346.qxd 12/15/09 1:59 PM Page 312

Cost Allocation: Theory 313
$4,000 per month, the branch manager sees the price for salespeople as $5,000 ($4,000 �$1,000) per month. If the opportunity cost of salespeople is $4,000, but the branch man-ager is charged $5,000 (including the $1,000 of overhead), the manager will employ toofew salespeople.
There are two important lessons from this example. Compared with no allocations,cost allocations
• Reduce the manager’s reported profits.
• Change the mix of factor inputs; less of the input taxed by the overhead is used(salespeople), and more of the untaxed factor inputs are used (advertising).
Senior managers and their accountants want to distort the price of salespeople byallocating costs if the price of salespeople is not the total cost to the firm of salespersons.Taxing salespeople induces operating managers to use fewer salespeople. Cost allocationsalso change the pattern of other incentives within the firm. Each of these reasons is ex-plored in more detail below.
One reason for taxing the use of salespeople in the computer company example is that thecost of another salesperson is really not $4,000 per month, but something larger: $4,000includes all the direct costs of the salesperson: wages, medical benefits, payroll taxes, pen-sions, and the like. But it does not include the indirect costs of the human resource office,which hires the person, maintains records, and administers benefits. It does not include thelegal costs the firm incurs when employees are injured on the job or sue the firm for otherreasons. Nor does $4,000 per month include the data processing costs, security costs, andother overhead costs required to support the additional salesperson. It does not include theexternalities the sales department imposes on other parts of the organization by hiring anadditional salesperson.
Externalities in economics are costs or benefits imposed on other individuals withouttheir participation in the decision and without compensation for the costs or benefits im-posed on them. The price of an apple compensates the growers and distributors for provid-ing the apple; there are no externalities. But the apple’s price does not pay for the refuse
2. Taxing anExternality
TABLE 7–3 Number of Salespeople and Amount of Advertising before Cost AllocationRequired to Sell $10 Million of Computers per Month
Number of Number of Standard Total Cost Total Cost Salespeople Advertisements (before allocations) (after allocations)
30 182.57 $485,140 $515,14031 179.61 483,220 514,22032 176.78 481,560 513,56033 174.08 480,160 513,16034 171.50 479,000 513,00035 169.03 478,060 513,06036 166.67 477,340 513,34037 164.40 476,800 513,80038 162.22 476,440 514,44039 160.13 476,260 515,26040 158.11 476,220 516,22041 156.17 476,340 517,34042 154.30 476,600 518,600
zim36725_ch07_302-346.qxd 12/16/09 9:05 AM Page 313

collection if the apple core is discarded on the street and someone else has to pay to cart itaway. Similarly, the price paid for a lawnmower does not reflect the annoyance to the neigh-borhood of the noise it makes when in use. Discarding an apple core on the street and us-ing a lawnmower cause externalities. If the apple’s purchase price includes a sales tax thathelps pay the municipality’s cost of street cleaning and refuse collection, then the apple’sdisposal cost has been paid for.
Externalities can be positive or negative. Pollution is a negative externality. Automo-bile exhaust pollutes the air, yet car drivers do not pay for the costs they impose on others bytheir pollution (except via gasoline taxes). The consumers of polluted air are not compen-sated directly for the pollution they consume. Education contains a positive externalityin that people derive benefits from having more educated citizens with whom to interact.Well-manicured lawns of private homes create positive externalities as people pass and enjoythe sight and property values of neighboring homes are increased.
When the computer company branch manager hires an additional salesperson, a nega-tive externality is imposed on the firm. More human resources, security, and legal serviceswill be demanded. Buying another personal computer that sits on a desk imposes few sig-nificant externalities. But adding an additional employee who consumes human resourceand security services and who can sue the firm and steal property imposes externalities thatare not captured in the direct cost (or price) of this newly hired person. Employees’ directcost consists of wages, payroll taxes, and benefits. The opportunity cost externalities arevery difficult to estimate, especially when the employee is hired. But one way to handle thisexternality is to tax it via a cost allocation, like the sales tax on the apple.
Cost allocation can be used to approximate these hard-to-observe externalities. Con-sider the case of the human resource department of a sales division. The human resource de-partment maintains the records and answers employee questions regarding retirement andmedical benefits. The human resource department is represented by the step function in Fig-ure 7–1. Total human resource department costs behave as a step function that depends onthe number of salespeople, S, employed in the sales division. The scale of the human re-source department is added in fixed increments rather than in a smooth, continuous curve.
When the firm is small, it is spending TC0 on the human resource function. Thisspending remains constant until the number of salespeople reaches A. Then a larger humanresource department is required and spending is increased. The human resource departmentis expanded at A because as salespeople are added between 0 and A, the service provided to
314 Chapter 7
Number of salespersons, S
Total cost
a
TC0
TCC
TCB
TCA
b
c
A B C0
FIGURE 7–1
Total cost of humanresource department
zim36725_ch07_302-346.qxd 12/15/09 1:59 PM Page 314

Cost Allocation: Theory 315
each employee is degraded. More employees are sharing a fixed amount of service. Thefirm acquires additional human resource department capacity when the cost of thedegraded service exceeds the cost of the additional capacity.
The total cost of the human resource department is the smooth curve. The cost reportedby the accounting system is the step function. The difference is the opportunity cost of thedegraded service. This service degradation in the human resource department is an exter-ality created by hiring an additional employee. For example, suppose the human resourcedepartment is responsible for advertising openings and screening job applicants. Thedepartment is spending $500,000 a year on these functions, and on average it takes twoweeks to place an ad and identify potential employees. The firm has grown and more posi-tion openings now occur. These additional openings cause the average delay to increase tothree weeks. If the additional week’s delay is imposing opportunity costs on the firm inexcess of the cost of hiring another person to process job openings, another human resourceemployee should be hired. Before hiring the new human resource person, the total cost ofthe human resource department is the reported cost plus the cost of the additional week’sdelay in staffing positions in the firm.
The shape of the total cost varies across departments. The particular shape of the curvedrawn in Figure 7–1 is chosen to illustrate the general analysis and is not intended to rep-resent how overhead costs vary in general.
Focusing only on the accounting costs (the step function in Figure 7–1) would lead to theconclusion that the opportunity cost in the human resource department of an additional sales-person was zero, unless the salesperson just happened to be at a step. But the opportunity costin the human resource department of an additional salesperson is the slope of the smooth
ManagerialApplication:Examples ofExternalitieswithinOrganizations
Positive Externalities
• Customer purchases of particular items are entered into a database by point-of-saleterminals. These data allow market research into customer buying habits and better-designed marketing programs.
• If the group at Microsoft responsible for Vista improves the software, this has apositive effect on the demand for other Microsoft products.
Negative Externalities
• The purchasing department, trying to reduce costs, purchases substandard rawmaterials. More manufacturing labor is required to produce acceptable finalproducts.
• Suppose some managers wish to use Macintosh computers, while others wish touse Microsoft vista PCs. The lack of a uniform standard imposes a series of costson the firm: File exchange is more difficult, helping each other learn to operatenew software/hardware is impeded, and technical service is more costly sinceconsultants must know both operating systems.
• In a law firm, if the lawyer handling a client’s divorce does a poor job, this lowersthe client’s perceived quality of the entire law firm. This negative quality externalityreduces this client’s demand for other law services of this firm (e.g., taxes, wills, andestates) and lowers the demand for the law firm by other clients if the dissatisfiedclient complains to friends.
zim36725_ch07_302-346.qxd 12/15/09 1:59 PM Page 315

curve. The slope of the smooth curve represents the incremental delay cost in the humanresource department imposed on the rest of the firm by adding one more salesperson.
Should human resource department costs be allocated back to the branch manager totax the manager for the externality of degraded service in the human resource departmentcaused by the branch manager’s hiring an additional salesperson? It depends on the exactshape of the total cost curve and where the firm happens to be on the curve. There are threecases to consider.
Case 1 (Figure 7–2)At point c, the overhead rate, Rc, is
MC denotes the marginal cost in the human resource department and is the slope of thesmooth curve. The slope of the line from the origin through point c is the overhead rate atpoint c, Rc. The slope of this line, Rc, is the average cost of the human resource departmentwhen there are C salespeople. The slope of this line is not as steep as the marginal cost lineat point c (solid line). At point c, or whenever R � MC, the cost allocation rate, which isthe average cost, understates the marginal cost of the externality. Whenever the average cost(the cost allocation rate) is less than the marginal cost of the human resource department, us-ing a cost allocation to tax the externality is better than no allocation. With no allocation, thebranch manager will not attach any cost to the externality imposed on other parts of the firmwhen salespeople are hired. Since Rc � MCc, the branch manager does not “pay” the entiremarginal cost of the externality. Nonetheless, some tax is better than no tax. Whenever a ser-vice department’s average cost is less than its marginal cost, allocating the service depart-ment costs strictly dominates not allocating them. Each user should be charged the marginalcost, MC, but the firm does not know this number without special studies. However, averagecost is easily approximated as the ratio of accounting cost divided by salespeople.
Case 2 (Figure 7–3)At point b, the overhead rate, Rb, is
Rb =
TCB
B= MCb
Rc =
TCC
C6 MCc
316 Chapter 7
Number of salespersons, S
Total cost
TCC
Rc
MCc
c
A B C0
FIGURE 7–2
Total cost of humanresource department:Relation betweenoverhead rate andmarginal cost(overhead allocationdominates noallocation)
zim36725_ch07_302-346.qxd 12/15/09 1:59 PM Page 316

Cost Allocation: Theory 317
The slope of the line from the origin through point b is the average cost of the servicedepartment when B salespeople are employed. The slope of this line also happens to be themarginal cost of adding one more employee. At this point the cost allocation rate (the averagecost) and the marginal cost are equal. It is highly unlikely that the firm will be operating atthis point. But if it is, cost allocations perfectly mimic the correct opportunity cost. Clearly, ifthe firm happens to be at point b, it should allocate overhead, because the overhead rate isexactly equal to the marginal cost in the human resource department of hiring one more sales-person. Unfortunately, there is no guarantee that the firm will be at point b.
Case 3 (Figure 7–4)At point a, the overhead rate, Ra, is
The slope of the line from the origin through point a is the overhead rate at point a, Ra.Again, Ra is the average cost of the human resource department when there are A salespeople.
Ra =
TCA
A7 MCa
Number of salespersons, S
Total cost
TCB
Rb
b
A B C0
Rb = MCb
FIGURE 7–3
Total cost of humanresource department:Relation betweenoverhead rate andmarginal cost (costallocation equalsmarginal cost)
Number of salespersons, S
Total cost
aTCA
Ra
A B C0
MCa
FIGURE 7–4
Total cost of humanresource department:Relation betweenoverhead rate andmarginal cost (noallocation maydominate costallocation)
zim36725_ch07_302-346.qxd 12/15/09 1:59 PM Page 317

The slope of this line is steeper than the marginal cost at point a (solid line). At point a, orwherever R � MC, the cost allocation rate overstates the marginal cost of the externality.Taxing the branch manager Ra might cause too large a reduction in salespeople. WheneverR � MC, cost allocations might do more harm than good. For example, suppose the over-head rate, R, on an additional salesperson is $2,000, yet the externality from degraded ser-vice of hiring the person is $100. Suppose the additional profit from hiring the salespersonis $55,500 and her wages and benefits are $55,000. The profit-maximizing sales managerwill not hire the person because the additional profit of $55,500 is less than the reported ac-counting costs of $57,000 (or $55,000 � $2,000). However, the actual opportunity cost of$55,100 is less than the benefits. Therefore (unlike in Case 1, in which the firm should al-ways allocate overhead), we cannot unambiguously demonstrate that human resource costsshould be allocated in Case 3.
The analysis presented in Figures 7–1 through 7–4 demonstrates that situations do existwhere allocating overhead is better than not allocating. Whenever average cost is less thanmarginal cost, the costs allocated are less than the marginal cost incurred by the firm.Although the firm is not allocating enough cost, it is probably better to impose some tax thanno tax on the managers who cause human resource department costs to rise. Unfortunately,a simple rule such as “always allocate” or “never allocate” does not exist. The allocationdecision depends on the exact shape of the cost curve of the overhead department and wherethe firm is on the curve. It also depends on whether other inputs are allocated and the rela-tion among inputs. The only guidance, without more knowledge of the cost structure, is toconsider allocating whenever marginal cost is above average cost; if marginal cost is belowaverage cost, allocating may not be a good idea.
While knowledge of marginal costs is often difficult to obtain without special studies,the following facts hold for all cost curves:
1. Marginal cost equals average cost when average cost is at a minimum (point b).
2. Marginal cost is above average cost when average cost is increasing (point c).
3. Marginal cost is below average cost when average cost is decreasing (point a).5
Given these relations between average and marginal costs, the firm should consider al-locating overhead when average cost is increasing, because in this case we also know thatmarginal cost is always above average cost. Hence, the decision to allocate or not does notrequire knowledge of marginal costs, but of whether the average cost is falling or rising asoutput expands.
To summarize, cost allocations are average costs and are a proxy for difficult-to-observemarginal costs. This is an example of using cost allocations to improve decision making.However, some care should be exercised in using cost allocations as internal taxes. In somesituations, the cost allocation rate can be significantly larger than the marginal cost of theexternality (Case 3). Allocating costs in this case might cause managers to reduce consump-tion of the allocation base (say, direct labor) by too much. Firm profits might fall more ifthey underutilize salespeople than if they overutilize salespeople when there is no allocationof human resource department costs.
The allocation base chosen often determines whether firm value is enhanced or harmedby cost allocation. Suppose a service department’s output can be directly metered to the user
318 Chapter 7
5Consider average and marginal baseball batting averages. If a professional baseball player has a seasonbatting average of .300 and has two at-bats and gets one hit and one strike-out, his marginal batting average thatday is .500 and his season’s batting average rises. If he strikes out both times at bat, his marginal batting averagefor the day is .000 and his seasonal average falls.
zim36725_ch07_302-346.qxd 12/15/09 1:59 PM Page 318

Cost Allocation: Theory 319
in the same way that a power department measures electric consumption using electricmeters. A reasonably accurate “cost” per unit of service can be established. However, themore indirect the measure of consumption, the less useful is the cost allocation because theallocated cost bears less relation to opportunity cost. For example, if power consumption isallocated based on floor space instead of on meter readings, the consuming departmentshave no incentive to conserve electricity, only to reduce square footage.
Often allocation bases are chosen that have the greatest association with the cost beingallocated. Rent is allocated based on square footage. Advertising and data processing areallocated using the time spent on the responsibility center. Allocating advertising and market-ing expense using the time marketing personnel spend on the marketing for the responsibilitycenter reminds the manager of the responsibility center that marketing is not free. Cost alloca-tions also affect managers’ incentives in other ways, which are discussed next.
As discussed at the beginning of this chapter, a common cost arises when some resource—and hence its cost—is shared by several users; human resource department costs are a com-mon cost. Suppose two distinct manufacturing divisions share a common plant location andshare common costs, including property taxes, security costs, grounds and building main-tenance, and human resource department costs. One division manufactures computermodems and the other assembles computer disk drives. Although the two divisions share acommon building, each is treated as a separate profit center.
Two questions arise:
1. Should the common costs be allocated to the two divisions?
2. If so, how should they be allocated?
The following discussion assumes that both profit center managers’ compensation isbased on accounting profits, which have deducted any allocated common cost. That is, costallocations affect the managers’ welfare. If common costs are not allocated, the managers inthe two divisions have less incentive to invest in the specialized knowledge necessary to de-termine the optimum level of the common costs. If the decision rights over the level of com-mon costs do not reside with the managers of the two divisions and the common costs arenot allocated back to the two divisions, the division managers will always be demandingmore common resources. If these managers individually or collectively have the decisionrights over the common resources but are not charged for the common costs, these costs willgrow rapidly as the managers invent ways to substitute off-budget common costs for cur-rently consumed factor inputs that are included in their budget. For example, security guardsare a common cost. Suppose security costs are not charged to either division. The divisionmanagers have an incentive to use security guards to perform maintenance or even operatemachines, thereby reducing the amount of direct labor charged to each division’s budget.
Most firms allocate common costs, presumably to prevent individual divisions fromoverconsuming the common resource. The next task is choosing an allocation base.Choosing an allocation base causes it to be taxed and, as demonstrated earlier, managerswill reduce their consumption of the taxed item. But this creates other incentives. Considerthe following illustration.
Suppose our two manufacturing divisions have a significant amount of interaction:They hire from a common local workforce, they use common shippers, and they deal withthe same set of government officials for building permits, air quality standards, and safetystandards. Ideally, the two division managers should cooperate with each other. However,within their firm, they are probably competitors, vying for the same promotion. If one di-vision does poorly, it might enhance the other manager’s chances when a promotion oppor-tunity arises.
3. InsulatingversusNoninsulatingCost Allocations
zim36725_ch07_302-346.qxd 12/15/09 1:59 PM Page 319

Cost allocations can promote or discourage cooperation between the two managers,depending on the type of allocation method. With an insulating allocation, the costs allo-cated to one division do not depend on the operating performance of the other division. Witha noninsulating allocation, the allocated costs of one division do depend on the other divi-sion’s operating performance. For example, our two divisions share the same factory buildingand both are profit centers. Assume that the common costs of the shared factory space are$1 million per month. In January and February, the computer modem division has profitsof $8 million before allocations. The disk drive division has profits of $8 million in Januaryand $2 million in February. If common costs are allocated using actual profits, then profitsafter cost allocations for one division depend on the performance of the other division, asillustrated in Table 7–4. This is a noninsulating cost allocation.
In part A of Table 7–4, common costs of $1 million per month are allocated based onactual profits. The modem division has the same level of division profits before allocationeach month: $8 million. Yet its profits after cost allocation are smaller by $300,000 inFebruary. This reduction occurs because the modem division is allocated more commoncosts when the disk drive division’s profits fall; at the same time, the disk drive division re-ceives lower allocated costs.
In Table 7–4, part A’s allocation method is noninsulating because each division’sallocation depends on the performance of the other. An insulating allocation method ispresented in part B of Table 7–4 in which common costs are allocated using floor space.The modem division has 60 percent of the floor space and is therefore allocated $600,000of common costs. To the extent that floor space does not vary with performance, at least inthe short run, the performance of one division is not affected by the other division’s perfor-mance. In the long run, if one division expands floor space relative to the other, it willreceive a larger fraction of the common costs. Using floor space to allocate the commoncosts insulates each division’s profits from the performance of the other division.
Noninsulating systems can use sales or head count (employment) instead of profits.Either of these allocation bases will cause one division’s profits to vary with the actual
320 Chapter 7
TABLE 7–4 Noninsulating and Insulating Cost Allocation Methods ($000s)
January February
Modem Disk Drive Modem Disk Drive Division Division Division Division
A. Noninsulating MethodDivision profits before
allocation $8,000 $8,000 $8,000 $2,000Allocated common costs* (500) (500) (800) (200)
Net income $7,500 $7,500 $7,200 $1,800
B. Insulating MethodDivision profits before
allocation $8,000 $8,000 $8,000 $2,000Allocated common costs† (600) (400) (600) (400)
Net income $7,400 $7,600 $7,400 $1,600
*Common costs are allocated based on actual division profits before allocated costs.†Common costs are allocated based on square footage. The modem division has 60 percent of the square footage.
zim36725_ch07_302-346.qxd 12/15/09 1:59 PM Page 320

Cost Allocation: Theory 321
results of the other division. Insulating allocation systems use predetermined allocationrates that do not vary with actual results.
Both insulating and noninsulating methods give the division managers an incentive toeconomize on common costs. The noninsulating method (Table 7–4, part A) provides eachdivision manager with incentives to increase the other division’s profitability, therebyincreasing the other division’s share of the common costs. In this sense, noninsulating allo-cations create incentives for mutual monitoring and cooperation by managers. Noninsulat-ing cost allocations are examples of cost allocations used for control purposes.
The disadvantage of a noninsulating method is that it distorts the performance measureof one division by tying it to another division’s performance. Some argue that managersshould be held responsible for only those cost items over which they have decision rightsand hence control. (This controllability principle was discussed in Chapter 5.) In the aboveexample, the common costs are jointly controllable by both managers. If there is a large in-teraction effect between the two managers in that one can significantly affect the other’sperformance, then each manager is held responsible for the other’s performance through anoninsulating allocation method.
While noninsulating allocations distort the performance measure by basing one divi-sion’s share of overhead on another division’s performance, they can reduce the risk man-agers bear. Suppose two divisions are affected by random events outside their control.Moreover, suppose these random events affecting the two divisions are not perfectly posi-tively correlated. If one division has an unusually unfavorable random shock, the otherdivision is unlikely to have such an adverse shock and will absorb more overhead in thatperiod. The division with the adverse shock will absorb less overhead and will show alarger profit after common costs are allocated than it would if an insulating allocationmethod were used. Likewise, a highly favorable random event in one division is likely tooccur when the other division does not have such a good period. The division with the goodfortune will absorb more overhead, and its performance measure will not be as large as itwould if overhead were allocated using an insulating method.
Noninsulating methods act like shock absorbers for random events and reduce the vari-ability of all managers’ performance measures. If managers were risk-neutral, such risksharing would not matter. Variations in allocated costs due to noninsulating allocationswash out over time. And since a risk-neutral manager does not care about variability, thelower risk imposed by noninsulating cost allocation does not matter. But decreased vari-ability does matter to risk-averse managers. Noninsulating methods reduce the variabilityof their performance measures.6
In the previous example, the two divisions shared common factory resources and con-trolled the level of common costs. Now consider corporate headquarters expenses, such asthe president’s staff expenditures. The divisions do not have decision rights over the level ofcorporate headquarters expenses, but noninsulating allocations still create incentives formutual monitoring. Although they cannot directly control the level of the costs being allo-cated, subordinate managers can pressure senior management to control staff growth.
To summarize the discussion,
1. Common costs should be allocated for decision making and control whenever themarginal cost of a common resource, such as the human resource department, isequal to or greater than the resource’s reported average cost.
6As long as the random events are not perfectly positively correlated, then noninsulating methods diversifysome of the risk managers bear. The analysis is a straightforward application of portfolio theory as to whyrisk-averse investors want to hold a diversified portfolio of securities.
zim36725_ch07_302-346.qxd 12/15/09 1:59 PM Page 321

2. Common costs should be allocated using an allocation base that does not insulatesubunits whenever interactions among the subunits are high and cooperation isimportant. If interaction is unimportant, an allocation base should be chosen thatdoes not fluctuate with other subunits’ performance.
3. Noninsulating cost allocations can reduce the risk managers bear by diversifyingthat risk across other managers.
Q7–3 How do cost allocations act as a tax system?
Q7–4 Define externality and give an example of one.
Q7–5 What is the difference between a positive and a negativeexternality?
Q7–6 How are externalities reduced within a firm?
Q7–7 Describe the three cases to consider when determining ifa cost allocation is beneficial.
Q7–8 Should common costs be allocated?
Q7–9 Describe how a noninsulating allocation promotescooperation among managers and encourages mutualmonitoring.
Q7–10 Why would senior managers want to distort factor pricesby using cost allocations?
D. SummaryCost allocations pervade all organizations. Managers allocate costs for a variety of reasons, includ-ing: financial reporting, taxes, cost-reimbursement contracts, and government regulation. But it ap-pears that many organizations allocate costs for decision making and control. The important lessonsfrom this chapter are
1. Cost allocations act as an internal tax on the factor input being used as the allocation base.And, like taxes in general, cost allocations change managers’ incentives and hence thedecisions they make.
2. Certain inputs, used to produce the firm’s goods or services, notably labor, imposeexternalities on the firm in the sense that when more of that input is used, other costs inthe firm also rise. Managers and their accountants will want to tax that input if its reportedcost does not fully reflect its cost plus the externality it generates. The way to tax theinput is to use it as the allocation base for allocating some other cost to the manager withthe decision rights over the taxed input. For example, labor can be taxed by allocatingcorporate overhead to departments based on the number of employees in each department.
3. Costs can be allocated in ways that increase or decrease managers’ mutual monitoring andcooperation with each other. Noninsulating cost allocations increase mutual monitoringand coordination; insulating methods do the opposite.
4. Noninsulating cost allocations can reduce the risk managers face. For example, if adivision’s profits are unusually low, fewer costs are allocated to this division, therebysoftening the full impact of the lower profits. Hence, noninsulating allocations inducerisk-sharing among managers and can diversify the risk borne by managers.
ConceptQuestions
322 Chapter 7
zim36725_ch07_302-346.qxd 12/15/09 1:59 PM Page 322

Cost Allocation: Theory 323
Self-Study ProblemFitzhugh Investors
Fitzhugh Investors sells, manages, and operates three mutual funds: Money Market, Blue Chip, andFixed Income. Each fund’s prospectus specifies a schedule of fees payable to Fitzhugh Investors forits services. The company derives all of its revenue from two fees. The first fee Fitzhugh receivesfrom each fund is based on the net assets in the fund. The second fee is based on the number of ac-counts. Table 1 itemizes the fee structure for each fund.
Each fund is operated as a separate line of business, incurring avoidable direct expenses for salesand administration, fund management, and transfer agency functions (brokerage fees, maintainingcustomer accounts, and safekeeping securities). Additionally, the funds employ several common cor-porate resources, such as a Web site, computer facilities, telephone representatives, security analysts,and corporate staff. Fitzhugh Investors allocates these corporate expenses to the respective fundsbased on the number of accounts. Corporate expenses total $2,595,000. Management estimates thatclosing any one fund could avoid $125,000 and any two funds $200,000 of the corporate expenses.Table 2 presents the direct expenses for each fund.
Required:
a. Prepare an income statement that shows the direct expenses and the allocated corporateexpenses by mutual fund for Fitzhugh.
b. Fitzhugh’s managers are reviewing the income statement prepared in part (a). Some of thefunds are reporting a loss. What actions should management take?
Solution:
a. Revenues of each fund are composed of the asset-based fee times the net assets plus theper-account fee times the number of accounts. Corporate expenses are allocated based onthe number of accounts.
TABLE 1 Fitzhugh Investors Product Line Summary Data
Money Blue Fixed Total Market Chip Income Funds
Asset-based fees 0.75% 1.75% 1.25% —Per-account fee $25 $8 $9 —Net assets (millions) $1,050 $1,150 $1,824 $4,024Accounts (thousands) 275 110 185 570
TABLE 2 Fitzhugh Investors Direct Expenses by Fund
Money Blue Fixed Market Chip Income
Sales and administration $ 2,696,000 $2,332,000 $ 6,838,000Fund management 1,400,000 2,750,000 1,800,000Transfer agency 10,465,000 7,224,000 18,911,000
zim36725_ch07_302-346.qxd 12/15/09 1:59 PM Page 323

FITZHUGH INVESTORSNet Income by Fund Both Before and After
Allocated Corporate Expenses
Money Market Blue Chip Fixed Income Total Funds
RevenuesAsset-based fees $ 7,875,000 $20,125,000 $22,800,000 $50,800,000Per-account fees 6,875,000 880,000 1,665,000 9,420,000
Direct ExpensesSales and administration 2,696,000 2,332,000 6,838,000 11,866,000Fund management 1,400,000 2,750,000 1,800,000 5,950,000Transfer agency 10,465,000 7,224,000 18,911,000 36,600,000
Gross profit $ 189,000 $ 8,699,000 $ (3,084,000) $ 5,804,000Corporate expense 1,252,000 501,000 842,000 2,595,000
Net income (loss) $(1,063,000) $8,198,000 $(3,926,000) $ 3,209,000
b. Based on the current accounting system, the money market and fixed income funds arereporting losses after allocating corporate expenses. If the money fund is closed, Fitzhughdoes not avoid losing $1,063,000 because this includes allocated corporate expense. Only$125,000 of corporate expense is avoided by closing one fund. The money fund isgenerating $189,000 of gross profit before corporate expenses. If this fund is eliminated,Fitzhugh forgoes $189,000 of cash flow but saves only $125,000. Thus it should noteliminate the money fund.
The fixed income fund is losing over $3 million before any corporate expense isallocated. Therefore it appears that if this fund is closed, Fitzhugh would save this loss pluscorporate expenses of $125,000.
However, the preceding analysis fails to account for the positive externalitiesassociated with having related funds. Exchange privileges between the funds—specifically,the ability to shift money across funds—are valued by investors. Before dropping the fixedincome fund, Fitzhugh must consider how many blue chip and money market accounts suchaction would sacrifice now and in the future. An accounting system such as Fitzhugh’soffers no real way of assessing the impact of such externalities.
ProblemsP 7–1: MRI
Magnetic resonance imaging (MRI) is a noninvasive medical diagnostic device that uses magnets andradio waves to produce a picture of an area under investigation inside the body. A patient is positionedin the MRI and a series of images of the area (say, the knee or abdomen) is generated. Radiologiststhen read the resulting image to diagnose cancers and internal injuries. The MRI at Memorial Hospi-tal has the following projected operating data for next year.
Fixed Cost Variable Cost Total Cost
Equipment lease $350,000 $350,000Supplies $ 97,000 97,000Labor 145,000 182,000 327,000Hospital administration 63,000 63,000Occupancy 48,000 48,000
Total projected costs $606,000 $279,000 $885,000Number of images 33,600Number of hours 2,800
324 Chapter 7
zim36725_ch07_302-346.qxd 12/15/09 1:59 PM Page 324

Cost Allocation: Theory 325
Memorial Hospital serves two types of patients: elderly, whose hospital bills are covered by gov-ernments (state and federal reimbursement), and other patients who are covered by private insurance(such as Blue Cross and Blue Shield). About one-third of Memorial’s patients are elderly. Elderlypatients using MRI services normally require more time per MRI image. The typical elderly patientrequires one hour of MRI time to produce the 10 MRI images needed for the radiologist. Other patientsonly require about 45 minutes per patient to generate the 10 MRI images.
Governments reimburse MRI imaging based on the reported cost by the hospital. Reimbursablecosts include both the fixed and variable costs of providing MRIs. Private insurers reimburse MRIimaging based on a standard fee schedule set by the insurance company. These fee schedules are in-dependent of the hospitals’ cost of providing MRI services.
Required:
a. Calculate Memorial Hospital’s projected cost per MRI image.
b. Calculate Memorial Hospital’s projected cost per hour of MRI time.
c. Suppose a typical elderly patient at Memorial Hospital requires 10 MRI images and takesone hour of MRI time. Calculate the cost of providing this service if Memorial Hospitalcalculates MRI costs based on cost per image.
d. Suppose a typical elderly patient at Memorial Hospital requires 10 MRI images and takesone hour of MRI time. Calculate the cost of providing this service if Memorial Hospitalcalculates MRI costs based on cost per hour of MRI time.
e. Should Memorial Hospital calculate the cost of MRI services based on the cost per imageor the cost per MRI hour? Explain why.
P 7–2: Slawson
Slawson is a publicly traded Argentine company with three operating companies located in Argentina,the United States, and Germany. Slawson’s corporate headquarters in Buenos Aires oversees the threeoperating companies. The annual cost of the corporate headquarters, including office expenses,salaries, and legal and accounting fees, is 2.4 million pesos. The following table summarizes operat-ing details of each of the three operating companies.
Argentina United States Germany
Number of employees 1,500 300 200Net income (loss) in pesos (millions) (100) 400 500
Required:
a. Allocate the 2.4 million pesos corporate headquarters cost to the three operatingcompanies using number of employees in each operating company.
b. Allocate the 2.4 million pesos corporate headquarters cost to the three operatingcompanies using net income of each operating company as the allocation base.
c. Discuss the advantages and disadvantages of allocating corporate headquarters costsusing (1) employees and (2) net income.
P 7–3: The Corporate Jet
A large corporation maintains a fleet of three 30-passenger corporate jets that provide (weatherpermitting) daily scheduled service between Detroit and several cities that are home to its produc-tion facilities. The jets are used for business, not personal, travel. Corporate executives book reser-vations through a centralized transportation office. Because of the limited number of seatsavailable, the planes almost always fly full, at least in the nonwinter months. Excess demand forseats is assigned by executive rank within the firm. The executive’s budget is charged for the flightat the end of the month. The charge is based on the jet’s total operating expenses during the month
zim36725_ch07_302-346.qxd 12/15/09 1:59 PM Page 325

326 Chapter 7
(including fuel, pilot’s salary and fringes, maintenance, licensing fees, landing fees, and 1/12 of theannual accounting depreciation) divided by the actual passenger miles logged in the month. Thisrate per passenger mile is multiplied by each passenger’s mileage flown in the month.
Required:
a. Describe the formula being used to calculate the cost per passenger mile flown.
b. As passenger miles flown increases, what happens to the cost per passenger mile?
c. Describe what causes the monthly charge per passenger mile flown to fluctuate.
d. What other problems are present in the current system and what improvements doyou suggest making?
P 7–4: Massey Electronics
Massey Electronics manufactures heat sinks. Heat sinks are small devices attached to solid-state cir-cuit boards that dissipate the heat from the circuit board components. Made of aluminum, the devicesconsist of many small fins cut in the metal to increase its surface area and hence its ability to dissi-pate the heat. For example, Intel Pentium and Celeron processors are first mounted onto heat sinksand then attached to circuit boards. These processors generate heat that will ultimately destroy theprocessor and other components on the circuit board without a heat sink to disperse the heat.
Massey has two production facilities, one in Texas and the other in Mexico. Both produce a widerange of heat sinks that are sold by the three Massey lines of business: laptops and PCs, servers, andtelecommunications. The three lines of business are profit centers, whereas the two plants are costcenters. Products produced by each plant are charged to the lines of business selling the heat sinks atfull absorption cost, including all manufacturing overheads. Both plants supply heat sinks to each lineof business.
The Texas plant produces more complicated heat sinks that require tighter engineering toler-ances. The Texas workforce is more skilled, but also more expensive. The Mexico plant is larger andemploys more people. Both facilities utilize a set of shared manufacturing resources: a common man-ufacturing IT system that schedules and controls the manufacturing process, inventory control, andcost accounting, industrial engineers, payroll processing, and quality control. These shared manufac-turing overhead resources cost Massey $9.5 million annually.
Massey is considering four ways to allocate this $9.5 million manufacturing overhead cost pool:direct labor hours, direct labor dollars, direct material dollars, or square footage of the two plants. Thefollowing table summarizes the operations of the two plants:
Texas Mexico
Direct labor hours 3,000,000 4,000,000Direct labor dollars $60,000,000 $40,000,000Direct material dollars $180,000,000 $200,000,000Square footage 200,000 300,000
Massey has significant tax loss carryforwards due to prior losses and hence expects no income taxliability in any tax jurisdiction where it operates for the next five years.
Required:
a. Prepare a table showing how the $9.5 million would be allocated using each of the fourproposed allocation schemes (direct labor hours, direct labor dollars, direct materialdollars, and square footage of the two plants).
b. Discuss the advantages and disadvantages of each of the four proposed allocation methods(direct labor hours, direct labor dollars, direct material dollars, and square footage of thetwo plants).
zim36725_ch07_302-346.qxd 12/15/09 1:59 PM Page 326

Cost Allocation: Theory 327
P 7–5: Avid Pharmaceuticals
Avid, a small, privately held biotech pharmaceutical manufacturing firm, specializes in developingand producing a set of drugs for rare classes of cancers. Avid has two divisions that share the samemanufacturing and research facility. The two divisions, while producing and selling two differentclasses of products to different market segments, share a common underlying science and relatedmanufacturing processes. It is not unusual for the divisions to exchange technical know-how, personnel,and equipment. The following table summarizes their most current year’s operating performance:
Division A Division B
Number of employees 80 20Plant square footage (000) 80 120Revenues (000) $2,000 $1,000Operating expenses (000) 600 500
Operating profits (000) $1,400 $ 500
Avid’s corporate overhead amounts to $900,000 per year. Management is debating various waysto allocate the corporate overhead to the two divisions. Allocation bases under consideration include:number of employees, plant square footage, revenues, operating expenses, and operating profits. Eachdivision is treated as a separate profit center with each manager receiving a bonus based on his or herdivision’s net income (operating profits less allocated corporate overhead).
Required:
a. For each of the five proposed allocation bases, compute Division A’s and Division B’s netincome (operating income less allocated corporate overhead).
b. Recommend one of the five methods (or no allocation of corporate overhead) to allocatecorporate overhead to the two divisions. Be sure to justify your recommendation.
P 7–6: Wasley
Wasley has three operating divisions. Each manager of a division is evaluated on that division’s totaloperating income. Managers are paid 10 percent of operating income as a bonus.
The AB division makes products A and B. The C division makes product C. The D division makesproduct D. All four products use only direct labor and direct materials. However, a fixed (unavoidable)$1,784 corporate overhead is applied to each division (or product) based on direct labor dollars. In thefollowing operating income statement for the first quarter of the year all numbers are in 000s.
Income Statement
Product A Product B Product C Product D
Net sales $1,250 $850 $1,250 $1,650Direct labor 450 600 540 640Direct materials 250 0 125 160Corporate overhead
Required:
a. Allocate the corporate overhead and compute divisional operating income (after allocatingcorporate overhead) for each of the three divisions.
b. One day the manager of the AB division, Shirley Chen, announces that starting in thesecond quarter she will be discontinuing product B (replacing it with nothing and letting
zim36725_ch07_302-346.qxd 12/15/09 1:59 PM Page 327

328 Chapter 7
the labor go, cutting all direct costs attributable to the product). She reasons that product Bis losing money for her division and the company. Recompute first-quarter operatingincome for both division AB and the corporation without division AB’s product B (asthough the manager had already dropped product B).
c. Is Shirley Chen, the manager of the AB division, better off this way? Why or why not?
d. Is the corporation better off this way? Why or why not?
e. What problems do you see with the reporting/evaluation/incentive system currently inplace?
SOURCE: Charles Kile.
P 7-7: Hallsite Imaging
Hallsite Imaging produces hardware and software for imaging the structures of the human eye and theoptic nerve. Hallsite systems are in most major medical centers and leading ophthalmology clinics.Hallsite has three divisions: Hardware, Software, and Marketing. All three are profit centers, and thethree divisional presidents are compensated based on their division’s profits. The Hardware Divisionproduces the equipment that captures the images, which are then viewed on desktop PCs. The Soft-ware Division produces the software that runs on both Hallsite imaging equipment and the users’ PCsto view, manipulate, and manage the images. Hallsite hardware only works with the Hallsite software,and the software can only be used for images captured by Hallsite hardware.
The Marketing Division produces the marketing materials and has a direct sales force of 1,000Hallsite people that sells both the hardware and software in the United States (Hallsite operates onlyin the United States). To assess the profits of the Hardware and Software Divisions, the costs of theMarketing Division are allocated back to the Hardware and Software Divisions based on the revenuesof the two divisions. The following table summarizes the divisional sales and divisional expenses (be-fore allocation of Marketing Division costs) for the Hardware and Software Divisions for last quarterand this quarter. (All figures are in millions of dollars.)
Last Quarter This Quarter
Hardware Software Hardware SoftwareDivision Division Division Division
Revenue $500.00 $700.00 $510.00 $400.00Division expenses 315.00 308.00 321.30 176.00
The Marketing Division reported divisional costs of $320 million last quarter and $370 millionthis quarter.
Required:
a. Allocate the Marketing Division’s costs to the Hardware and Software Divisions for lastquarter and this quarter.
b. Calculate the Hardware and Software Divisions’ profits for this quarter and last quarterafter allocating the Marketing Division’s expenses to each division.
c. After receiving her division’s profit report for this quarter (which included the HardwareDivision’s share of the Marketing Division’s costs), the president of the Hardware Divisioncalled Hallsite’s chief financial officer (whose office prepared the report) and said, “Theremust be something wrong with my division’s profit report. Hardware’s sales rose and ourexpenses were in line with what they should have been given last quarter’s operatingmargins. But my profits tanked. Now I know that there was a major problem withSoftware’s new version 7.0 that hurt new sales of upgrades to version 7.0 and required
zim36725_ch07_302-346.qxd 12/15/09 1:59 PM Page 328

Cost Allocation: Theory 329
more Marketing resources to address our customers’ concerns with this new software. Butwhy am I getting hammered? I didn’t cause the software problems. My hardware continuesto sell well because version 6.8 of the software still works great. This is really very unfair.”
Write a memo from Hallsite’s chief financial offer to the Hardware Division presidentexplaining that the Hardware Division’s current quarter profit report (which includes theDivision’s share of the Marketing expenses) is in fact correct and outlining the variousrationales as to why Hallsite allocates the Marketing Division’s expenses to the other twodivisions.
P 7–8: Jolsen International
Jim Shoe, chief executive officer of Jolsen International, a multinational textile conglomerate, hasrecently been evaluating the profitability of one of the company’s subsidiaries, Pride Fashions, Inc.,located in Rochester, New York. The Rochester facility consists of a dress division and a casual weardivision. Daneille’s Dresses produces women’s fine apparel, while the other division, Tesoro’s Casu-als, produces comfortable cotton casual clothing.
Jolsen’s chief financial officer, Pete Moss, has recommended that the casual wear division beclosed. The year-end financials Shoe just received show that Tesoro’s Casuals has been operating at aloss for the past year, while Daneille’s Dresses continues to show a respectable profit. Shoe is puzzledby this fact because he considers both managers to be very capable.
The Rochester site consists of a 140,000-square-foot building where Tesoro’s Casuals andDaneille’s Dresses utilize 70 percent and 30 percent of the floor space, respectively. Fixed over-head costs consist of the annual lease payment, fire insurance, security, and the common costs ofthe purchasing department’s staff. Fixed overhead is allocated based on percentage of floor space.Housing both divisions in this facility seemed like an ideal situation to Shoe because both divi-sions purchase from many of the same suppliers and have the potential to combine materials or-dering to take advantage of quality discounts. Furthermore, each division is serviced by the samemaintenance department. However, the two managers have been plagued by an inability to coop-erate due to disagreements over the selection of suppliers as well as the quantities to purchasefrom common suppliers. This is of serious concern to Shoe as he turns his attention to the reportin front of him.
Tesoro’s Daneille’s Casuals Dresses($000s) ($000s)
Sales revenue $ 500 $1,000Expenses:
Direct materials $(200) $ (465)Direct labor (70) (130)Selling expenses (all variable) (100) (200)
Overhead expenses:Fixed overhead (98) (42)Variable overhead (40) (45)
Net income before taxes $ (8) $ 118
Required:
a. Evaluate Pete Moss’s recommendation to close Tesoro’s Casuals.
b. Should the overhead costs be allocated based on floor space or some other measure?Justify your answer.
SOURCE: R Drake, J Olsen, and J Tesoro.
zim36725_ch07_302-346.qxd 12/15/09 1:59 PM Page 329

330 Chapter 7
P 7–9: Winterton Group
The Winterton Group is an investment advisory firm specializing in high-income investors in upstateNew York. Winterton has offices in Rochester, Syracuse, and Buffalo. Operating as a profit center,each office receives central services, including information technology, marketing, accounting, andpayroll. Winterton has 20 investment advisors, 7 each in Syracuse and Rochester, and 6 in Buffalo.Each investment advisor is paid a fixed salary, a commission based on the revenue generated fromclients, plus 2 percent of regional office profits and 1 percent of firm profits. One of the senior in-vestment advisors in each office is designated as the office manager and is responsible for runningthe office. The office manager receives 8 percent of the regional office profits instead of 2 percent.
Regional office expenses include commissions paid to investment advisors. The following re-gional profits are calculated before the 2 percent profit sharing. Firm profits are the sum of the threeregional office profits.
This table summarizes the current profits per office after allocating central service costs basedon office revenues.
WINTERTON GROUPProfits by Office
Current Year (Millions)
Rochester Syracuse Buffalo
Revenue $16.00 $14.00 $20.00Operating expenses (12.67) (11.20) (16.30)Central services* (1.92) (1.68) (2.40)
$ 1.41 $ 1.12 $ 1.30
*Allocated on the basis of revenue.
The manager of the Buffalo office sent the following e-mail to the other office managers, the presi-dent, and the chief financial officer:
One of the primary criteria by which all cost allocation schemes are to be judged is fairness. Thecosts allocated to those bearing them should view the system as fair. Our current system, whichallocates central services using office revenues, fails this important test of fairness. Receivingmore allocated costs penalizes those offices generating more revenues. A fairer, and hence moredefensible, system would be to allocate these central services based on the number of investmentadvisors in each office.
Required:
a. Recalculate each office’s profits before any profit sharing assuming the Buffalo manager’sproposal is adopted.
b. Do you believe the Buffalo manager’s proposal results in a fairer allocation scheme thanthe current one? Why or why not?
c. Why is the Buffalo manager concerned about fairness?
P 7–10: National Training Institute
Five departments of National Training Institute, a nonprofit organization, share a rented building.Four of the departments provide services to educational agencies and have little or no competition fortheir services. The fifth department, Technical Training, provides educational services to the businesscommunity in a competitive market with other nonprofit and private organizations. Each departmentis a cost center. Revenues received by Technical Training are based on a fee for services, identified astuition.
zim36725_ch07_302-346.qxd 12/15/09 1:59 PM Page 330

Cost Allocation: Theory 331
All five departments have dedicated space as listed in the accompanying table. Common sharedspace, including hallways, restrooms, meeting rooms, and dining areas, is not included in these allo-cations. National Training Institute rents space at $10 per square foot.
Allocation Table
Percentage Department Square Footage of Space Revenue
Administration 13,500 9.0% $ 3,600,000Support services 46,500 31.0 11,000,000Computer services 12,000 8.0 8,800,000Technical training 6,000 4.0 1,900,000Transportation 72,000 48.0 4,700,000
Total allocated 150,000 100.0% $30,000,000
Common space 50,000
In addition to its assigned space, the technical training department offers training during off-hours using many of the areas allocated to other departments. Technical Training also uses off-sitefacilities for the same purpose. About 50 percent of its training activities are in off-site facilities,which have excess capacity, charge no rent, and are available only during off-hours.
John Daniels, the administration department’s business manager, proposed a rental allocationplan based on each department’s percentage of dedicated square footage plus the same percentage ofthe common space. The technical training department would be charged an additional amount for thespace it uses during off-hours that is dedicated to other departments. This additional amount wouldbe based on planned usage per year.
Jane Richards, director of technical training, claims this allocation method will cause herto increase the price of services. As a result, she will lose business to competition. She would rathersee the allocation method use the percentage of department revenue in relation to total revenue.
Required:
Comment on Daniels’s and Richards’s proposed rent allocation plans. Make appropriate recom-mendations.SOURCE: C Lewis, M Dohm, R Bakel, M Mucci, and R Stern.
P 7–11: Encryption, Inc.
Encryption, Inc. (EI), sells and maintains fax encryption hardware and software. EI hardware andsoftware are attached to both sending and receiving fax machines that encode/decode data, prevent-ing anyone from wiretapping the phone line to receive a copy of the fax.
Two EI product groups (Federal Systems and International) manufacture and sell the hardwareand software in different markets. Both are profit centers. Federal Systems contracts with federal gov-ernment agencies to manufacture, install, and service EI products. Existing contracts call for revenuesof $1 million per quarter for the next eight quarters.
International is currently seeking foreign buyers. Expected quarterly revenues will be $1 mil-lion, but with equal likelihood revenues can be $1.5 or $0.5 million in any given quarter.
Federal Systems and International each have their own products that differ in some ways butshare a common underlying technology. Fax encryption is a new technology and offers new markets.Transferring manufacturing and marketing ideas across products and customers provides importantsynergies.
The variable cost of Federal Systems and International is 50 percent of revenues. The only fixedcost in EI is its Engineering Design group.
zim36725_ch07_302-346.qxd 12/15/09 1:59 PM Page 331

Engineering Design is EI’s R&D group. It designs new hardware and software that Federal Sys-tems and International sell. Quarterly expenses for Engineering Design will be $0.60 million for thenext two years. These expenses do not vary with revenues or production costs.
Engineering Design costs are to be included in calculating profits for the Federal Systems andInternational groups. Two ways of assigning the Engineering Design costs to Federal Systems andInternational are (1) group revenues, and (2) an even 50–50 split.
Required:
a. Prepare financial statements for Federal Systems and International illustrating the effectsof the alternative ways of handling Engineering Design costs.
b. Which method of assigning Engineering Design costs do you favor? Why?
P 7–12: Ball Brothers Purchasing Department
The purchasing department of Ball Brothers purchases raw materials and supplies for the variousdivisions in the firm. Most of the purchasing department’s costs are labor costs. The costs of the pur-chasing department depend on the number of items purchased. The manager of the purchasingdepartment estimates how her department’s costs will vary with different levels of demand by thedivisions. The following table provides her estimates of how the costs of purchasing vary with theaggregate number of items purchased by all divisions.
Number of Items Total Cost Purchased per Week per Week
100–199 $1,000200–299 1,100300–399 1,200400–499 1,400500–599 1,700600–699 2,100700–799 2,600800–999 3,200
In deriving this table, the manager of purchasing projects expanding the size of the departmentin order to keep roughly constant the time to purchase an item and the quality of the purchasingdepartment’s services at all levels of demand placed on the department. That is, if the department isprocessing 750 items per week, it will provide the same quality of services given a budget of $2,600as it would processing 250 items per week given a budget of $1,100.
Required:
a. Suppose the purchasing department is currently purchasing 610 items per week. Shouldthe department’s costs of $2,100 per week be allocated back to the divisions, makingthe purchases at a charge of $3.44 per item purchased ($2,100 � 610)? Explain why orwhy not.
b. Suppose the purchasing department is currently purchasing 210 items per week. Should thedepartment’s costs of $1,100 per week be allocated back to the divisions, making thepurchases at a charge of $5.23 per item purchased ($1,100 � 210)? Explain why or why not.
c. Reconcile (explain) why your answers to (a) and (b) are either the same or different.
P 7–13: Telstar Electronics
Telstar Electronics manufactures and imports a wide variety of consumer and industrial electronics,including stereos, televisions, camcorders, telephones, and VCRs. Each line of business (LOB) han-dles a single product group (e.g., televisions) and is organized as a profit center. The delivery of the
332 Chapter 7
zim36725_ch07_302-346.qxd 12/15/09 1:59 PM Page 332

Cost Allocation: Theory 333
product to the wholesaler or retailer is handled by Telstar’s distribution division, a cost center. Previ-ously, Telstar was organized functionally, with manufacturing, marketing, and distribution as separatecost centers. Two years ago, it reorganized to the present arrangement.
Distribution assembles products from the various LOBs into larger shipments to the same geo-graphic area to capture economies of scale. The division is also responsible for inbound shipmentsand storage of imported products. It has its own fleet of trucks, which handles about two-thirds of theshipments, and uses common carriers for the remainder. Currently, the costs of the distribution divi-sion are not allocated to the LOBs, but LOBs do pay the cost for any special rush shipment using anovernight or fast delivery service, such as Federal Express or UPS. For example, if a customer musthave overnight delivery, the LOB ships directly without using Telstar’s distribution center and theLOB is charged for the special delivery.
The corporate controller is mulling over the issue of allocating the costs of distribution. Severalallocation schemes are possible:
1. Allocate all distribution division costs based on gross sales of the LOBs.
2. Allocate all distribution division costs based on LOB profits.
3. Allocate the direct costs of each shipment (driver, fuel, truck depreciation, tolls) using thegross weight of each LOB’s product in the shipment. Then allocate the other costs of thedistribution division (schedulers, management, telephones, etc.) using the total directshipping costs assigned to each LOB.
One argument against allocating is that it will distort relative profitability. The controller says,“Because allocations are arbitrary, the resulting LOB profitabilities become arbitrary.” Another argu-ment is that it is not fair to charge managers for costs they cannot control. LOBs cannot control ship-ping costs. For example, there are savings when two small separate shipments are combined into asingle large shipment. LOBs will tend to avoid opening up new sales territories when other Telstarproducts are not being shipped to that area.
Required:
Write a memo addressing the controller’s concerns. Should Telstar begin allocating distribution coststo the LOBs? If so, which allocation scheme should it use?
P 7–14: Diagnostic Imaging Software
Diagnostic Imaging Software (DIS) is the leading producer of imaging software for the health sci-ences. DIS develops, writes, produces, and sells its software through two direct selling organizations:North America and South America. Each of these direct selling forces is evaluated and rewarded asprofit centers. The remaining world sales of DIS software are handled through independent distribu-tors in Europe, Asia, and Africa. DIS has a software development group that designs, writes, anddebugs the software before turning it over to the direct sales organizations (North and South Amer-ica) and the independent distributors who then sell the software. The cost of designing, writing, anddebugging the software is $12 million this year.
The following table presents the income statements of the two divisions (millions of $) for this year:
North America South America
Revenues $17.800 $6.700Operating expenses* 5.340 3.015
Profit before software development cost $12.460 $3.685
*Does not include any costs of developing, writing, or debugging the software.
Senior management of DIS wants to allocate the software costs to the two direct-selling forces inorder to evaluate and reward their performance.
zim36725_ch07_302-346.qxd 12/16/09 9:05 AM Page 333

334 Chapter 7
Required:
a. Calculate the profits of the two direct selling organizations (North and South America)after allocating the software costs of $12 million based on the relative revenues of the twoorganizations. (Round all decimals to 3 significant digits.)
b. Calculate the profits of the two direct selling organizations (North and South America) afterallocating the software cost of $12 million based on the relative profits before softwaredevelopment cost of the two organizations. (Round all decimals to 3 significant digits.)
c. Calculate the profits of the two direct selling organizations (North and South America) afterallocating the software cost of $12 million where 75 percent of the cost is assigned to NorthAmerica and 25 percent to South America. (Round all decimals to 3 significant digits.)
d. Discuss the advantages and disadvantages of each of the three allocation methods used inparts (a), (b), and (c) above.
P 7–15: Fuentes Systems
Fuentes Systems provides security software to law enforcement agencies. It has a sales force of70 and has plans to add another 10–15 salespeople. Fuentes allocates corporate administrative costsbased on the number of salespeople. The current total administrative cost of $2,184,000 comprisesthe costs of the human resources, payroll, accounting, and information technology departments.
You manage the western region of Fuentes Systems with 18 salespeople and you plan to add oneor two more salespersons. Each salesperson you hire costs $120,000, which includes salary, benefits,and payroll taxes. If you hire one additional salesperson, you expect that person will generate$185,000 of net operating margin for your region. Net operating margin is revenues less cost of salesand less travel and entertainment expenses associated with that salesperson. Net operating margindoes not include the salary, benefits, and payroll taxes of the salesperson. If you hire two salespeople,the combined additional net operating margin added to your region is expected to be $323,000. Youare evaluated and rewarded as a profit center, where profits are calculated as net operating marginless the total salaries, benefits, and payroll taxes of all salespeople employed in the region, plus allo-cated corporate administrative costs.
Required:
a. What is the current allocated administrative cost per salesperson?
b. Assuming that your hiring of additional salespeople does not alter the allocated cost persalesperson, how many salespersons will you hire in the western region?
c. Suppose that Fuentes hires an additional 10 salespeople, and the total corporateadministrative cost rises from $2,184,000 to $2,640,000. Should Fuentes continue toallocate corporate administrative costs to the regions? Explain why or why not.
d. Now suppose that Fuentes hires an additional 10 salespeople and the total corporateadministrative cost rises from $2,184,000 to $2,200,000. Should Fuentes continue toallocate corporate administrative costs to the regions? Explain why or why not.
P 7–16: Vorma
Vorma manufactures two proprietary all-natural fruit antioxidant food additives that are approved bythe U.S. Food and Drug Administration. One is for liquid vitamins (LiqVita) and the other is used bydry cereal producers (Dry). Both of these products are sold only in the United States, and althoughthey both share common chemistry and manufacturing, their end markets are completely separated.Both are produced in the same plant and share common manufacturing processes, such as purchas-ing, quality control, human resources, and so forth. These common fixed overhead costs amount to$1,500,000 per month. Each product also has its own directly traceable fixed costs, such as dedicatedequipment leases used only by one of the two products, dedicated product engineers, and so forth.The following table summarizes the operations of Vorma for a typical month.
zim36725_ch07_302-346.qxd 12/15/09 1:59 PM Page 334

Cost Allocation: Theory 335
LiqVita Dry
Units 200,000 75,000Price per unit $10 $21Variable cost per unit $6 $11Own fixed costs per month $90,000 $110,000
Again, the “Own fixed costs” consist of all fixed costs that can be traced directly to one of the twoproducts (LiqVita and Dry), and these costs do not vary with the number of units produced.
Required:
a. Prepare a typical monthly income statement for LiqVita and Dry after allocating thecommon fixed overhead costs of $1,500,000 per month to the two product lines based onthe relative proportions of total variable costs generated by each product.
b. Which of the two products in part (a) is the most profitable and which is the leastprofitable? NOTE: you are not being asked to analyze or explain the relative profitablities ofLiqVita and Dry.
c. Vorma is planning to introduce a tablet version of its vitamin into China, with a sellingprice of $9 and a variable cost per unit of $7. At a price of $9, Vorma managers believethey will sell 950,000 units per month in China. Introducing the new product (calledChina) will require additional “Own fixed costs” (just for China) of $800,000. As in part(a), prepare monthly income statements, computing the monthly net income for the threeproducts (LiqVita, Dry, and China). Allocate the common fixed overhead of $1,500,000based on the relative proportions of total variable costs generated by each product.
d. As in part (b), list the order of the most profitable to least profitable products. Do not doany analysis.
e. Compare the relative profitability of the two products (LiqVita and Dry) beforeintroducing China (part b) and after introducing China (part d). Analyze and discuss whythe relative profitability of the two preexisting products (LiqVita and Dry) does or does notchange with the introduction of the new product (China).
P 7–17: Bio Labs
Bio Labs is a genetic engineering firm manufacturing a variety of gene-spliced, agricultural-basedseed products. The firm has five separate laboratories producing different product lines. Each lab istreated as a profit center and all five labs are located in the same facility. The wheat seed lab and cornseed lab manufacture two of the five product lines. These two labs are located next to each other andare of roughly equal size in terms of sales. The two departments have close interaction, often sharingequipment and lab technicians. Both use very similar technology and science and usually attend thesame scientific meetings.
Recent discoveries have shown how low-power lasers can be used to significantly improveproduct quality. The wheat seed and corn seed managers are proposing the creation of a laser test-ing department to employ this new technology. Leasing the equipment and hiring the personnel cost$350,000 per year. Supplies, power, and other variable costs are $25 per testing hour. The testingdepartment is expected to provide 2,000 testing hours per year. The wheat seed manager expects touse 700 testing hours per year of the laser testing department and the corn seed manager expects touse 800 testing hours. The remaining 500 hours of testing capacity can be used by the other threelabs if the technology applies or can be left idle for future expected growth of the two departments.Initially, only wheat and corn are expected to use laser testing.
The executive committee of Bio Labs has approved the proposal but is now grappling with howto treat the costs of the laser testing department. The committee wants to charge the costs to the wheatseed and corn seed labs but is unsure of how to proceed.
At the end of the first year of operating the laser, wheat seed used 650 testing hours, corn seedused 900 hours, and 450 hours were idle.
zim36725_ch07_302-346.qxd 12/15/09 1:59 PM Page 335

336 Chapter 7
Required:
a. Design two alternative cost allocation systems.
b. Give numerical illustrations of the charges the corn and wheat seed labs will incur in thefirst year of operations under your two alternatives.
c. Discuss the advantages and disadvantages of each.
P 7–18: World Imports
World Imports buys products from around the world for import into the United States. The firm isorganized into a number of separate regional sales districts that sell the imported goods to retailstores. The eastern sales district is responsible for selling the imports in the northeastern region of thecountry. Sales districts are evaluated as profit centers and have authority over what products they wishto sell and the price they charge retailers. Each sales district employs a full-time direct sales force.Salespeople are paid a fixed salary plus a commission of 20 percent of revenues on what they sell tothe retailers.
The eastern district sales manager, J. Krupsak, is considering selling an Australian T-shirt thatthe firm can import. Krupsak has prepared the following table of his estimated unit sales at variousprices and costs. The cost data of the imported T-shirts were provided by World Imports’s corporateoffices.
WORLD IMPORTSEastern Sales District
Proposed Australian T-ShirtEstimated Demand and Cost Schedules
Quantity Wholesale T-Shirt (000s) Price Imported Cost
10 $6.50 $2.0020 5.50 2.2030 5.00 2.5040 4.75 3.00
The unit cost of the imported shirts rises because the Australian manufacturer has limitedcapacity and will have to add overtime shifts to produce higher volumes. Corporate headquarters ofWorld Imports is considering allocating corporate expenses (advertising, legal, interest, taxes, andadministrative salaries) back to the regional sales districts based on the sales commissions paid inthe districts. It estimates that the corporate overhead allocation rate will be 30 percent of the com-missions (for every $1 of commissions paid in the districts, $0.30 of corporate overhead will beallocated). District sales managers receive a bonus based on net profits in their district. Net profitsare revenues less costs of imports sold, sales commissions, other costs of operating the districts, andcorporate overhead allocations.
The corporate controller, who is proposing that headquarters costs be allocated to the salesregions and included in bonus calculations, argues that all of these costs must ultimately be coveredby the profits of the sales districts. Therefore, the districts should be aware of these costs and mustprice their products to cover the corporate overhead.
Required:
a. Before the corporate expenses are allocated to the sales districts, what wholesale price willKrupsak pick for the Australian T-shirts and how many T-shirts will he sell? Show how youderived these numbers.
b. Does the imposition of a corporate overhead allocation affect Krupsak’s pricing decisionon the Australian T-shirts? If so, how? Show calculations.
zim36725_ch07_302-346.qxd 12/15/09 1:59 PM Page 336

Cost Allocation: Theory 337
c. What are the arguments for and against the controller’s specific proposal for allocatingcorporate overhead to the sales districts?
P 7–19: Painting Department
You are manager of a painting department of a large office complex. The painting department isresponsible for painting the buildings’ exteriors and interiors. Your performance is judged in part onminimizing your department’s operating costs, which consist of paint and labor, while providing ahigh-quality and timely service.
The job of painting the halls of a particular building is being evaluated. Paint and labor aresubstitutes. To provide the quality job demanded, you can use less paint and more labor, or morepaint and less labor. The accompanying table summarizes this trade-off. Paint costs $10 per gallonand labor costs $6.40 per hour.
Paint (Gallons) Labor (Hours)
50 20080 125
100 100125 80200 50
Required:
a. How much paint and how much labor do you choose in order to minimize the total cost ofthe hall painting job? (Show calculations in a neatly labeled exhibit.)
b. The accounting department institutes an overhead allocation on labor. For every dollarspent on labor, $0.5625 of overhead is allocated to the paint department to cover corporateoverhead items, including payroll, human resource, security, legal costs, and so forth. Nowhow much labor and paint do you choose to minimize the total accounting cost of the hallpainting job? (Show calculations in a neatly labeled exhibit.)
c. Explain why your decisions differ between parts (a) and (b).
d. Explain why the accounting department might want to allocate corporate overhead basedon direct labor to your painting department.
P 7–20: Scanners Plus
Scanners Plus manufactures and sells two types of scanners for personal computers, the Home Scan-ner and the Pro Scanner. The Home model is a low resolution model for small office applications.The Pro model is a high resolution model for professional use. The two models are manufactured inseparate facilities and each model is treated as a profit center. This table summarizes the prices andcosts of each model.
Home Scanner Pro Scanner
Selling price to retailers $ 1,600 $ 8,800Variable cost 600 2,800Fixed cost (annual) 800,000 2,400,000
Both models are sold through large office supply and computer stores and through computercatalogs. The marketing department of Scanners Plus sells both models. It has a direct sales forcethat sells to retail stores and an advertising group that prepares and places ads in computer maga-zines and computer catalogs. The annual operating budget of the marketing group is $1,000,000.
zim36725_ch07_302-346.qxd 12/15/09 1:59 PM Page 337

338 Chapter 7
The marketing costs can be allocated to the two profit centers in one of two ways: either on the basisof total revenues or on the basis of 24 percent to the Home model and 76 percent to the Pro model.
At a selling price of $1,600, the Home model division projects the number of units it expects tosell next year to be either 1,000 units or 1,400 units, each equally likely. Similarly, at $8,800, either600 or 800 units of the Pro model are equally likely to be sold. The demand for Pro scanners is inde-pendent of the demand for Home scanners. That is, one can be in high demand while the other onecan be in either low or high demand.
Required:
a. Calculate total revenues under various scenarios for the Home model.
b. Calculate total revenues under various scenarios for the Pro model.
c. Suppose the marketing department costs of $1 million are allocated to Home and Promodels using the predetermined, fixed proportions of 24 percent to Home and 76 percentto Pro. Prepare a table projecting all the various total profits of Home and Pro afterallocating marketing costs using these predetermined rates.
d. Calculate all the possible overhead proportions that can result from allocating the marketingdepartment costs using the revenues in each profit center as the allocation base. (Round alloverhead proportions to two significant digits, e.g., 44.67 percent rounds to 45 percent.)
e. Same as in (c), except calculate profits for the two profit centers using the overhead ratescomputed in (d ).
f. Parts (c) and (e) asked you to compute divisional profits for the Home and Pro modelsusing two different methods for allocating marketing costs. Comment on the relativeadvantages and disadvantages of the two methods.
P 7–21: Giza Farms
Giza Farms in Cairo, Egypt, has a corporate headquarters staff and three operating divisions: con-sulting services, chemicals, and agricultural products. Giza is considering allocating 160 millionEgyptian pounds of corporate overhead (which includes salaries and benefits of corporate headquar-ters staff, advertising, human resources, legal, and so forth) to the three divisions using either divi-sional revenues or divisional earnings before corporate overhead allocations as the allocation base.(One Egyptian pound is worth about $0.30.) The following table describes the revenues and earningsbefore corporate overhead allocations for each of the three operating divisions.
GIZA FARMSDivisional Revenues and Earnings before Corporate Overhead Allocations
(Millions of Egyptian pounds)
Consulting Agricultural Services Chemicals Products Total
Revenue 250 250 500 1,000Earnings before corporate
overhead allocations 80 50 70 200
Required:
a. Calculate divisional earnings after corporate overhead allocations using divisionalrevenues as the allocation base.
b. Calculate divisional earnings after corporate overhead allocations using divisional earningsbefore corporate overhead allocations as the allocation base.
c. Given that overhead will be allocated to the division, should revenue or earnings be theallocation base? Why?
zim36725_ch07_302-346.qxd 12/15/09 1:59 PM Page 338

Cost Allocation: Theory 339
d. After reviewing the data from parts (a) and (b), all three divisional managers were criticalof the decision to allocate corporate overhead, but the manager of agricultural products wasparticularly outspoken. She said, “This is just another hair-brained scheme of the [expletivedeleted]. They have nothing better to do with their time than to push numbers around. We inthe divisions have no control over corporate spending and all these allocations do is createdissension among the divisional managers and distort the true relative profitability of thedivisions.” Respond to the agricultural products manager’s remarks.
P 7–22: Allied Adhesives
Allied Adhesives (AA) manufactures specialty bonding agents for very specialized applications(electronic circuit boards, aerospace, health care, etc.). AA operates a number of small plants aroundthe world, each one specializing in particular products for its niche market. AA has a small plant inSt. Louis that manufactures aerospace epoxy resins and a larger plant in Atlanta that manufacturesepoxies for electronics. Each produces somewhat similar epoxy resins that are sold to differentcustomers. The manufacturing processes of the aerospace and electronic adhesives are quite similar,but the selling processes and the types of customers are very different across the two divisions. TheSt. Louis plant is being closed and moved to Atlanta to economize on duplicative selling, general,and administrative costs (SGA). Aerospace and Electronics will continue to operate as separatedivisions. The following table summarizes the current operations of the two plants:
Aerospace Electronics(St. Louis) (Atlanta)
Revenue $16.800 $42.100Manufacturing cost 8.568 23.155
Manufacturing margin $ 8.232 $18.945SGA–variable 5.376 12.630SGA–fixed 1.900 2.500
Net income $ 0.956 $ 3.815
Return on sales 5.69% 9.06%
NOTE: Costs in millions.
After Aerospace moves to the Atlanta facility, each division continues to operate as a separate profitcenter, and neither Aerospace nor Electronics is expected to have its revenues, manufacturing cost, orvariable SGA impacted. The only change projected from moving Aerospace to Atlanta is the totalfixed SGA will fall from $4.4 million to $3.0 million through elimination of redundant occupancy,administrative, and human resource expenses.
AA evaluates its divisional managers based on return on sales (net income divided by sales).
Required:
a. Prepare separate financial statements reporting net income and return on sales forAerospace and Electronics after the move where the expected lower fixed SGA of $3million is allocated to the two divisions using:(1) Revenues as the allocation base.(2) Manufacturing cost as the allocation base.(3) Manufacturing margin as the allocation base.
(Round all allocations to the nearest $1,000.)
b. Discuss how moving Aerospace into Atlanta affects the relative profitability of theAerospace and Electronics divisions.
c. Which of the three possible allocation schemes in part (a) will each division manager(Aerospace and Electronics) prefer? Why?
zim36725_ch07_302-346.qxd 12/15/09 1:59 PM Page 339

340 Chapter 7
d. Which allocation scheme should AA adopt? Explain why.
e. Should AA be using return on sales as the performance measure for its divisional managers?
P 7–23: Chicago Omni Hotel
The Chicago Omni Hotel is a 750-room luxury hotel offering guests the finest facilities in downtownChicago. The hotel is organized into four departments: lodging, dining, catering, and retail stores.Each of these departments is treated as a profit center. Lodging is the largest profit center and isresponsible for room rental, maids, reservations, main lobby, and bell captains. Dining operates thecoffee shop, room service, and three restaurants out of a single kitchen. Catering services is separatefrom the dining operations. It offers banquet services to large parties, weddings, and business meet-ings through its own kitchen and staff separate from the dining department’s kitchen. However, din-ing and catering coordinate purchasing and staff scheduling. Retail is responsible for leasing spaceoff the lobby to independent store owners (gift shop, car rental agencies, airline ticket counters, jew-elry, flowers, toys, liquor, etc.). There are currently 14 independent stores operating in the hotel. Profitcenter managers are paid a salary and a bonus. The annual bonus depends on a number of factors,including their unit’s profits, customer satisfaction, and employee retention.
The following table presents budgeted operating data for the first year:
Retail Lodging Dining Catering Stores Total
Revenues ($ millions) $39.20 $9.80 $5.80 $1.90 $56.70Separable operating expenses $31.10 $6.20 $3.50 $0.30 $41.10Square footage (1,000s) 625 50 125 80 880Number of employees 1,000 140 35 4 1,179
Besides the separable expenses traced directly to each profit center, the hotel incurs the follow-ing additional expenses:
Occupancy costs (interest, taxes, insurance) $5.6 millionMarketing costs 1.4 millionAdministration (accounting, human resource,
security, maintenance, and senior management) 1.1 million
Total $8.1 million
Profit center performance is part of each profit center manager’s annual bonus. Also, to evalu-ate how each department of the hotel is performing, senior management desires a statement calculat-ing a performance measure.
Required:
a. Design a performance report for the Chicago Omni Hotel. Provide a statement calculatingthe performance of each unit using your performance report format. This statement shouldcalculate for each unit a bottom-line profit/loss, which will be used as part of theperformance evaluation and reward systems.
b. Discuss the rationale underlying the design of the performance report you chose.
c. Using your report, discuss the relative performance of each profit center. Which ones arethe best and which are the worst?
zim36725_ch07_302-346.qxd 12/15/09 1:59 PM Page 340

Cost Allocation: Theory 341
P 7–24: Plastic Chairs
Plastic Chairs manufactures plastic lawn chairs using a combination of new and recycled plastic.Varying amounts of each type of plastic can be used to produce a batch of 100 chairs. The tablebelow lists the various combinations of recycled and new plastic required to produce one batchof 100 chairs.
Pounds of New and Recycled Plastic Required to Manufacture One Batch of 100 Chairs
Pounds of New Pounds of Plastic Recycled Plastic
20 7224 6030 4832 4536 4040 3645 3248 3060 2472 20
New plastic costs $16 per pound and recycled plastic costs $10 per pound. The manager of thechair manufacturing department receives a bonus based on minimizing the cost per batch of 100 chairs.
Required:
a. What combination of new and recycled plastic will the manager of the chair manufacturingdepartment choose?
b. Overhead (including plant administration, utilities, property taxes, and insurance) isallocated to the chair manufacturing department based on the number of pounds ofrecycled plastic used in each batch. For each pound of recycled plastic used, the chairmanufacturing department is charged $30 of plant overhead. What combination of newand recycled plastic will the manager of the chair manufacturing department select if themanager’s bonus is based on minimizing the total cost per batch, which includes new andrecycled plastic and plant overhead?
c. Why are your answers to (a) and (b) either the same or different?
d. Should the plastic chairs manufacturing manager’s bonus be based on minimizing only theplastic costs or should it also be based on minimizing plastic costs plus allocated plantoverhead?
P 7–25: Woodley Furniture
Woodley Furniture is a small boutique manufacturer of high quality contemporary wood tables. Theymake two models: end tables and coffee tables in a variety of different woods and finishes. Current an-nual production of end tables is 8,000 units that sell for $250 and have variable cost of $120 each. Cur-rent annual production of coffee tables is 6,000 units that sell for $475 and have variable cost of $285each. Woodley has fixed costs of $2.4 million. Woodley sells all the tables they produce each year.
Required:
a. Calculate total firmwide profits and product-line profits for the end tables and coffeetables after allocating the fixed costs to the two product lines using sales revenues as theallocation base.
zim36725_ch07_302-346.qxd 12/15/09 1:59 PM Page 341

342 Chapter 7
b. Which of the two products is the most profitable based on total profits (after allocatingfixed costs)? Is Woodley making an adequate profit?
c. Woodley management decides to add a dining table to its product offerings. The plantcurrently has excess capacity, so no additional fixed costs are required to produce thedining tables. The new dining table will not affect the number of units sold or prices of theexisting coffee and end tables. They expect to sell 4,000 dining tables at a price of $620each, and variable cost per table is $500. Calculate total firmwide profits and product-lineprofits for the end tables, coffee tables, and dining tables after allocating the fixed costs tothe three product lines using sales revenues as the allocation base.
d. Analyze the profitability of the three products and firm-wide profits calculated in part (c)compared to the profitability of the two products alone and firmwide profits in part (a).
e. Recalculate your answers to parts (a) and (c), but, instead of allocating the $2.4 million offixed costs using sales revenues as in parts (a) and (c), allocate the $2.4 million of fixed costsusing the total contribution margin of each product (total sales revenue less total variable cost).
f. Discuss the relative advantages and disadvantages of using total contribution margin toallocate the fixed costs in part (e) relative to using sales revenues to allocate the fixedcosts, as in parts (a) and (c).
P 7–26: Transmation
Transmation, with sales of over $2.2 billion, builds and markets several of the world's leading brandsof construction and agricultural equipment. Transmation has three operating divisions that are de-centralized investment centers. While the three divisions produce and sell different lines of equipmentto different customers, they do share a common R&D platform, corporate brand name, and many ofthe same marketing strategies, and operate in many of the same international jurisdictions. Currently,each division president is evaluated and rewarded based on the division’s return on assets, defined asnet income divided by total assets invested in the division. Net income is revenues generated by thedivision less operating expenses incurred by the division. The table below summarizes Transmation’sannual operating results by division ($ millions).
DIV A DIV B DIV C
Operating expenses $300 $ 900 $800Total divisional assets $500 $ 500 $400Revenues $370 $1,050 $950
Required:
a. Calculate each division’s ROA.
b. Each of the three Transmation divisions utilizes substantial corporate office resources.These include legal, marketing, information technology, human resources, and researchand development. In addition to these corporate level services, Transmation incursexpenses for being a publicly traded firm (accounting, taxes, and the cost of corporateofficers and director). These annual corporate-level expenses amount to $270 million, andcurrently each division is not being charged for these corporate expenses. The divisionaloperating expenses in the above table do not include any allocation of the $270 millioncorporate expenses. The corporate chief financial officer (CFO) argues that because eachdivision has roughly equal amounts of total assets, each division should be allocated one-third of the $270 million corporate expenses. Calculate each division’s ROA afterallocating the corporate expenses using the CFO’s proposed scheme.
c. Transmation’s chief executive officer (CEO) likes the CFO’s idea of allocating thecorporate expenses to the divisions, but argues that each division does not consume equalcorporate resources. Rather, each division’s consumption of the various corporateresources is more likely proportional to the division’s operating expenses. The CFO andCEO rule out more elaborate metering systems whereby each corporate resource, such as
zim36725_ch07_302-346.qxd 12/16/09 9:05 AM Page 342

Cost Allocation: Theory 343
HR or IT, would keep track of the time they devote to each division. The CEO and CFO areconvinced that such direct metering would be costly and generate much ill will between thedivisions and the corporate departments. Calculate each division’s ROA after allocating thecorporate expenses using the CEO’s proposed scheme.
d. Briefly describe how the relative profitability of the three divisions changes across thethree scenarios calculated in parts (a), (b), and (c). Do NOT discuss the pros and cons ofthe various scenarios. Just describe how the numbers change.
e. Now describe the pros and cons of the three allocation scenarios [including part (a), wherethere are no allocations].
f. Which of the three allocation schemes would you recommend, or would you propose analternative allocation scheme?
P 7–27: BFR Ship Building
BFR is a ship-building firm that has just won a government contract to build 10 high-speed patrolboats for the Coast Guard for drug interdiction and surveillance. Besides building ships for thegovernment, BFR has a commercial vessel division that designs and manufactures commercialfishing and commuting ships. The commercial division and the government division are the onlytwo divisions of BFR, and the Coast Guard contract is the only work in the government division.
The Coast Guard contract is a cost-plus contract. BFR will be paid its costs plus 5 percent oftotal costs to cover profits. Total costs include all direct materials, direct labor, purchased subassem-blies (engines, radars, radios, etc.), and overhead. Overhead is allocated to the Coast Guard contractbased on the ratio of direct labor expense on the contract to firmwide direct labor.
BFR can either purchase the engines from an outside source or build them internally. Thefollowing table describes the costs of the commercial division and the Coast Guard contract if theengines are built by BFR versus purchased outside.
BFR Cost Structure($ in Millions)
Coast Guard Coast Guard Contract (Engines Contract (Engines
Commercial Manufactured Purchased Division Internally) Externally)
Direct labor $14.600 $22.800 $18.200Direct material 32.900 25.900Purchased engines 0.000 17.000
Overhead for BFR is $83.5 million and does not vary if the engines are purchased outside ormanufactured inside BFR. Overhead consists of corporate-level salaries, building depreciation, prop-erty taxes, insurance, and factory administration costs.
Required:
a. How much overhead is allocated to the Coast Guard contract if(1) The engines are manufactured internally?(2) The engines are purchased outside?
b. Based on the total contract payment to BFR, will the Coast Guard prefer BFR tomanufacture or purchase the engines?
c. What is the difference in net cash flows to BFR of manufacturing versus purchasing theengines?
d. Explain how cost-plus reimbursement contracts in the defense industry affect themake–buy decision for subassemblies.
zim36725_ch07_302-346.qxd 12/16/09 9:05 AM Page 343

344 Chapter 7
CasesCase 7–1: Phonetex
Phonetex is a medium-size manufacturer of telephone sets and switching equipment. Its primary busi-ness is government contracts, especially defense contracts, which are very profitable. The company hastwo plants: Southern and Westbury. The larger plant, Southern, is running at capacity producing aphone system for a new missile installation. Existing government contracts will require Southern tooperate at capacity for the next nine months. The missile contract is a firm, fixed-price contract. Partof the contract specifies that 3,000 phones will be produced to meet government specifications. Theprice paid per phone is $300.
The second Phonetex plant, Westbury, is a small, old facility acquired two years ago to pro-duce residential phone systems. Phonetex feared that defense work was cyclical, so to stabilizeearnings, a line of residential systems was developed at the small plant. In the event that defensework deteriorated, the excess capacity at Southern could be used to produce residential systems.However, just the opposite has happened. The current recession has temporarily depressed the res-idential business. Although Westbury is losing money ($10,000 per month), top management con-siders this an investment. Westbury has developed a line of systems that are reasonably wellreceived. Part of its workforce has already been laid off. It has a very good workforce remaining,with many specialized and competent supervisors, engineers, and skilled craftspeople. Another 20percent of Westbury’s workforce could be cut without affecting output. Current operations aremeeting the reduced demand. If demand does not increase in the next three months, this 20 percentwill have to be cut.
The plant manager at Westbury has tried to convince top management to shift the missile con-tract phones over to his plant. Even though his total cost to manufacture the phones is higher than atSouthern, he argues that this will free up some excess capacity at Southern to add more governmentwork. The unit cost data for the 3,000 phones are as follows:
Southern Westbury
Direct labor cost $ 70 $ 95Direct materials cost 40 55Variable factory overhead* 35 45Fixed factory overhead* 40 80General burden† 10 20
Total unit cost $195 $295
*Based on direct labor costs.†Allocated corporate headquarters expense based on direct labor cost.
Westbury cannot do other government work, because it does not have the required securityclearances. But Westbury can do the work involving the 3,000 phones. And it can complete thisproject in three months. “Besides,” Westbury’s manager argues, “my labor costs are not going to be$95 per phone. We are committed to maintaining employment at Westbury at least for the next threemonths. I can utilize most of my existing people who have slack. I will have to hire back about20 production workers I laid off. For the three months, we are talking about $120,000 of additionaldirect labor.”
Phonetex is considering another defense contract with an expected price of $1.1 million and anexpected profit of $85,000. The work would have to be completed over the next three months, butSouthern does not have the capacity to do the work and Westbury does not have the security clear-ances or capital equipment required by the contract.
Southern’s manager says it isn’t fair to make him carry Westbury. He points out that Westbury’svariable cost, ignoring labor, is 33 percent greater than Southern’s variable costs. Southern’s manager
zim36725_ch07_302-346.qxd 12/15/09 1:59 PM Page 344
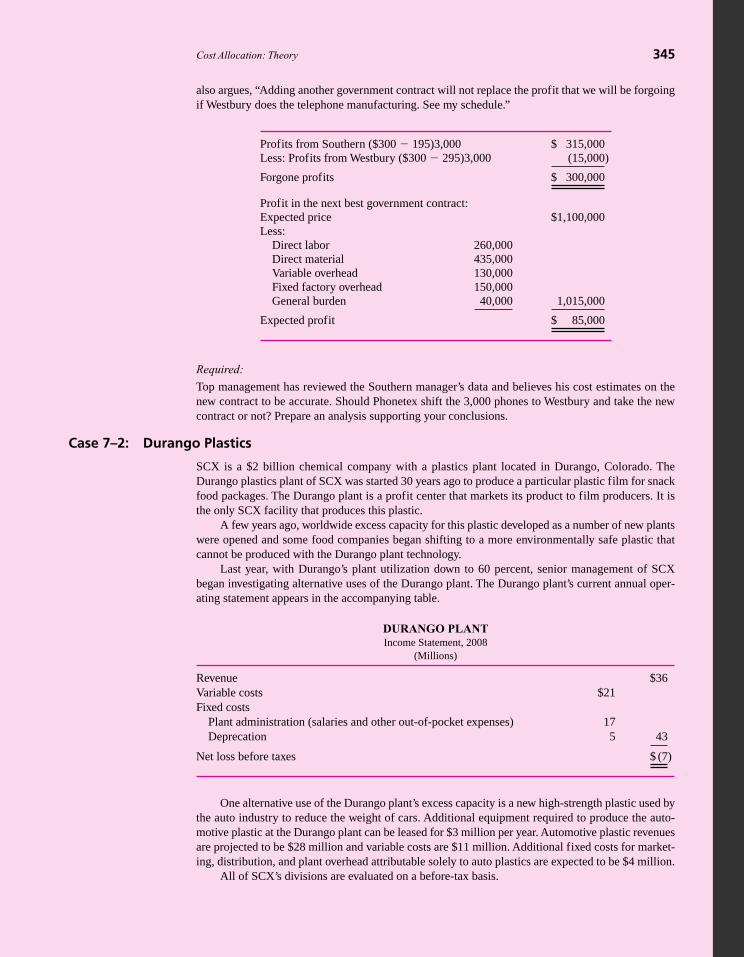
Cost Allocation: Theory 345
also argues, “Adding another government contract will not replace the profit that we will be forgoingif Westbury does the telephone manufacturing. See my schedule.”
Profits from Southern ($300 � 195)3,000 $ 315,000Less: Profits from Westbury ($300 � 295)3,000 (15,000)
Forgone profits $ 300,000
Profit in the next best government contract:Expected price $1,100,000Less:
Direct labor 260,000Direct material 435,000Variable overhead 130,000Fixed factory overhead 150,000General burden 40,000 1,015,000
Expected profit $ 85,000
Required:
Top management has reviewed the Southern manager’s data and believes his cost estimates on thenew contract to be accurate. Should Phonetex shift the 3,000 phones to Westbury and take the newcontract or not? Prepare an analysis supporting your conclusions.
Case 7–2: Durango Plastics
SCX is a $2 billion chemical company with a plastics plant located in Durango, Colorado. TheDurango plastics plant of SCX was started 30 years ago to produce a particular plastic film for snackfood packages. The Durango plant is a profit center that markets its product to film producers. It isthe only SCX facility that produces this plastic.
A few years ago, worldwide excess capacity for this plastic developed as a number of new plantswere opened and some food companies began shifting to a more environmentally safe plastic thatcannot be produced with the Durango plant technology.
Last year, with Durango’s plant utilization down to 60 percent, senior management of SCXbegan investigating alternative uses of the Durango plant. The Durango plant’s current annual oper-ating statement appears in the accompanying table.
DURANGO PLANT Income Statement, 2008
(Millions)
Revenue $36Variable costs $21Fixed costs
Plant administration (salaries and other out-of-pocket expenses) 17Deprecation 5 43
Net loss before taxes $ (7)
One alternative use of the Durango plant’s excess capacity is a new high-strength plastic used bythe auto industry to reduce the weight of cars. Additional equipment required to produce the auto-motive plastic at the Durango plant can be leased for $3 million per year. Automotive plastic revenuesare projected to be $28 million and variable costs are $11 million. Additional fixed costs for market-ing, distribution, and plant overhead attributable solely to auto plastics are expected to be $4 million.
All of SCX’s divisions are evaluated on a before-tax basis.
zim36725_ch07_302-346.qxd 12/15/09 1:59 PM Page 345

346 Chapter 7
Required:
a. Evaluate the auto industry plastic proposal. Compare the three alternatives: (1) closeDurango, (2) produce only film plastic at Durango, and (3) produce both film and autoplastic at Durango. Which of the three do you suggest accepting? (If Durango is closed,additional one-time plant closing costs just offset the proceeds from selling the plant.)
b. Suppose the Durango plant begins manufacturing both film and auto plastic. Prepare aperformance report for the two divisions for the first year, assuming that the initialprojections are realized and the film division’s 2009 revenue and expenses are the same asin 2008. Plant administration ($17 million) and depreciation ($5 million) are commoncosts to both the film and auto plastics divisions. For performance evaluation purposes,these costs are assigned to the two divisions based on sales revenue. All costs incurred forthe Auto Plastics division should be charged to that division.
c. Does the performance report in (b) accurately reflect the relative performance of the twodivisions? Why or why not?
d. In the year 2010, the Durango plant is able to negotiate a $1 million reduction in propertytaxes. Property taxes are included in the “plant administration account.” In addition, theFilm Division is able to add $3 million in additional revenues (with $2.1 of additionalvariable cost) by selling film to European food packagers. Assuming that these are theonly changes at the Durango plant between 2009 and 2010, how does the Auto PlasticsDivision’s performance change between these two years? Allocate the common costsusing the method described in (b).
e. Write a short memo evaluating the performance of the Auto Plastics Division in lightof the events in the year 2010 and describing how these events affect the reportedperformance of the Auto Plastics Division.
zim36725_ch07_302-346.qxd 12/15/09 1:59 PM Page 346

347
Chapter Eight
Cost Allocation:Practices
Chapter Outline
A. Death Spiral
B. Allocating Capacity Costs: Depreciation
C. Allocating Service Department Costs
1. Direct Allocation Method
2. Step-Down Allocation Method
3. Service Department Costs and Transfer Pricing of Direct and Step-Down Methods
4. Reciprocal Allocation Method
5. Recap
D. Joint Costs
1. Chickens
2. Net Realizable Value
3. Decision Making and Control
E. Segment Reporting and Joint Benefits
F. Summary
Appendix: Reciprocal Method for Allocating Service Department Costs
zim36725_ch08_347-408.qxd 12/15/09 2:02 PM Page 347

348 Chapter 8
The previous chapter introduced the topic of cost allocations. Cost allocations arepervasive—most organizations, including profit, nonprofit, service, and manufacturingfirms, allocate costs. Cost allocations serve numerous ends such as taxes, inventory valua-tion, cost-based reimbursements, and decision management and control.
In terms of creating incentives, cost allocations are like internal tax systems that causedecision makers to use less of the allocation base. Thus, the allocation bases chosen (whatto tax) affect how resources are consumed inside the firm. Cost allocations also can createincentives to cooperate. Finally, noninsulating allocation methods help diversify the riskthat managers bear.
This chapter continues the discussion begun in the last chapter by first discussing aproblem arising in most cost allocations—the death spiral—and then describing some spe-cific methods used to allocate costs. Alternative methods for allocating several interactingservice departments’ costs are described in section C. Section D describes joint cost allo-cation, or allocating costs to multiple products produced from a single input. Finally, sec-tion E discusses segment reporting and joint benefits. An appendix describes reciprocalcost allocations for service department costs.
A. Death SpiralOne problem arising when significant amounts of fixed costs are allocated and users havediscretion over using the service being allocated involves the death spiral. For example,consider an internal telecommunications department that provides telephones for insideusers. The department purchases, installs, and maintains a central switch, a phone-mail sys-tem, and individual phone sets. Users are charged for their phones, the options used, andlong-distance charges. There are substantial fixed costs for the central switch, local accesscharges, and maintenance of the phone-mail system.
Suppose the annual fixed costs are $600,000 and the annual cost of each of the 2,000phone lines is $200. Most of the $600,000 represents depreciation of the existing equip-ment, which is largely a sunk cost. To recover all the costs from the users, each phone lineis charged $500 (or $600,000 � 2,000 � $200). Some users have multiple lines for voice,fax, and computer.
A local phone company will install private lines for $325 per year plus long-distancecharges comparable to those available through the internal telecommunications department.Users with multiple lines start switching their fax and computer lines away from thetelecommunications department to the outside phone company. At the end of the first year,500 lines have been converted. To recover its costs, the telecommunications departmentraises its charge for the remaining lines to $600 (or $600,000 � 1,500 � $200). This highercharge causes another 500 users to switch to the outside phone company and the cost risesto $800 per line ($600,000 � 1,000 � $200). The final 1,000 users abandon the telecom-munications department, citing exorbitant fees.
The death spiral results when utilization of a common resource (with significant fixedcosts) falls, creating excess capacity. Average (full) cost transfer pricing charges the users forthe common resource. The fixed costs are borne by the remaining users who have incentiveto reduce utilization, further raising the average cost and causing additional defections.
Notice that the death spiral can occur whenever full cost transfer pricing is used, thereare significant fixed costs, and the user has some discretion over the quantity of the com-mon resource to use. As discussed in Chapter 5, one of the problems with full cost transferpricing is underutilization of the common resource. Too few units are transferred.
There are several solutions to the death spiral. When excess capacity exists, usersshould be charged for only the variable cost of the resource. Alternatively, some of the fixed
zim36725_ch08_347-408.qxd 12/15/09 2:02 PM Page 348

Cost Allocation: Practices 349
costs could be excluded from the transfer price. For example, the $600,000 in fixed costs(accounting depreciation of existing equipment) should be excluded because with excesscapacity the opportunity cost of this equipment is zero.
Exercise 8–1
Clay Sprays produces a line of aerosol sprays for hospitals and clinics, including air freshen-
ers, spot removers, disinfectants, rug cleaners, and polishes. The plant has substantial excess
capacity. The following table presents Clay’s current financial situation:
CLAY SPRAYSNet Income—Current Year
Revenue (1,000,000 units @ $6/unit) $6,000,000Variable costs (1,000,000 units @ $3) (3,000,000)Fixed costs (manufacturing overhead) (2,800,000)
Net income before taxes $ 200,000
Clay Sprays carries no beginning or ending inventories. All the products have the same vari-
able cost of $3 per unit, and the fixed cost of $2.8 million represents manufacturing overhead.continued
ManagerialApplication:Death Spiralat ClopayPlastics
Clopay (Clopay.com) manufactures a variety of plastic products for industrial andhealth care use. One of its U.S. plants manufactures 200 products and has several sup-port departments: shipping, materials management, plant maintenance, and administra-tion. These service departments’ costs are allocated to each production department.Production departments then added their own fixed costs to the fully absorbed supportcosts.
Clopay’s costing system provided a classic example of a death spiral. As volumefell the fixed costs were spread over fewer units, making the average cost per unitlarger.
Another version of the death spiral problem at Clopay involved allocating ma-chine depreciation costs. Similar machines that differed in terms of age and cost haddifferent allocated costs. Products made on the new machine had higher reportedcosts, even though the products made on the old machine were very similar. Hence,products made in departments using old, fully depreciated machines appeared moreprofitable.
To resolve both of these death spiral problems, Clopay excluded certain fixed costssuch as depreciation. This reduced product costs by about 6 percent when compared tothe previous cost system. Instead of charging all of the depreciation to products, someof the depreciation was expensed directly to cost of goods sold.
SOURCE: B Clinton and S Weber, “RCA at Clopay,” Strategic Finance, October 2004, pp. 21–26.
zim36725_ch08_347-408.qxd 12/15/09 2:02 PM Page 349

350 Chapter 8
Wendy Clay, CEO and owner, worries that the low volume is causing the remaining prod-
ucts to absorb more overhead per unit, driving up their costs and thereby making Clay Sprays’
remaining products less competitive than they would be otherwise.
Clay has asked her senior management team to find an acquisition that could add volume
to the plant and thereby improve the overhead absorption problem. After analyzing several
potential acquisition candidates, the team has found the Coronas Company. Also an aerosol
manufacturer, Coronas’s products are targeted at the household consumer. Coronas’s products
are produced by third-party custom-label manufacturers and Coronas has no manufacturing
capacity—only a sales and marketing organization. Coronas, like Clay, is currently selling one
million aerosol cans per year at an average wholesale price of $3 per can. Clay managers project
that the variable cost of producing Coronas’s aerosols will be $3 a can and that all of the Coronas
volume can be handled by Clay’s existing production facility without adding any additional
fixed manufacturing overhead or affecting the current $3 variable cost of Clay’s products.
Although purchasing Coronas and merging its volume into Clay does not add any incre-
mental profits to Clay (since the wholesale price and the variable cost per can are both $3),
Clay’s management team still wants to proceed with the acquisition.
Mark Hendrickson, Clay’s vice president of marketing, argues that Clay’s products should
appeal to its medical clients because of their high quality. But Clay’s clients are switching to
other manufacturers with lower quality and lower prices because hospital budgets are being
squeezed. Clay cannot lower its prices because doing so would erode margins (price less man-
ufacturing cost). Acquiring Coronas, Hendrickson argues, will lower the overhead absorption
by the Clay products, thereby allowing Clay to lower its prices on the medical market’s aerosols
without adversely affecting margins.
Required:
a. Does Clay’s acquisition of Coronas improve overhead absorption?
b. Does Clay’s profitability improve with the Coronas acquisition?
c. Reconcile any apparent inconsistencies between your answers in parts (a) and (b).
d. Is Mr. Hendrickson’s analysis correct?
e. Should Clay acquire Coronas?
f. Why do you think Clay’s management team is recommending the Coronas
acquisition?
Solution:
a. The Coronas acquisition does improve Clay’s overhead absorption. The average cost
of producing Clay’s existing products is:
Following the acquisition of Coronas, this falls to:
continued
$3 +
$2,800,000
2,000,000= $4.40
Average cost = $3 +
$2,800,000
1,000,000= $5.80
zim36725_ch08_347-408.qxd 12/15/09 2:02 PM Page 350

Cost Allocation: Practices 351
The average cost of Clay’s existing products is now lower because the fixed cost of
$2.8 million is spread over more aerosol cans.
b. Clay’s profitability is not improved by the Coronas acquisition. Coronas is selling its
aerosol products at $3 per can, which is variable cost. So Coronas is not adding any
incremental profits to Clay.
Analysis of Clay’s Profitability from Coronas Merger
Clay Coronas Clay and Coronas Alone Alone Combined
Revenue $6,000,000 $3,000,000 $9,000,000Variable cost 3,000,000 3,000,000 6,000,000Fixed cost 2,800,000 — 2,800,000
Net income before taxes $ 200,000 $ 0 $ 200,000
Clay’s profits remain at $200,000 both before and after the acquisition.
c. The answers to parts (a) and (b) appear inconsistent. While overhead absorption
appears to have improved under the acquisition, profits are not higher. The incon-
sistency is easily reconciled by noting the decline in average cost of Clay’s existing
products from $5.80 to $4.40. This decline in average cost does not represent a
reduction in cash outlays. Rather, it represents a shifting of some of the fixed costs to
the Coronas products. Suppose the $2.8 million fixed cost is allocated based on units.
Then the following product line profitability analysis clearly shows the shifting of the
fixed overhead.
CLAY AND CORONAS Product Line Profitability
Pro Forma
Clay Coronas Firm Products Products Total
Revenues $6,000,000 $ 3,000,000 $9,000,000Variable cost 3,000,000 3,000,000 6,000,000Allocated fixed cost (based on units) 1,400,000 1,400,000 2,800,000
Net income (loss) before taxes $1,600,000 $(1,400,000) $ 200,000
The Clay products appear to be more profitable because half the overhead has been
shifted to the Coronas products. But now the Coronas products appear to be losing
$1.4 million. Overall, firm profitability has not changed.
d. Mr. Hendrickson is wrong. We know from economics that profit-maximizing prices
are determined at the quantity where marginal cost equals marginal revenue. Fixed
costs do not enter the pricing decision other than to determine whether or not to
continued
zim36725_ch08_347-408.qxd 12/15/09 2:02 PM Page 351

352 Chapter 8
continue to produce at the optimum price. Mr. Hendrickson should not be setting
Clay’s aerosol prices based on average cost (or some cost-plus markup). To drive
additional volume into the plant, instead of acquiring Coronas, Ms. Clay should
carefully examine her pricing policies. By lowering her price, she will lose revenue
from customers who would have bought at the higher price. But at a lower price, she
will add more new customers. “Marginal revenue” is the difference between the
revenue added from new customers purchasing at the lower price less the revenue lost
from customers who would have paid the higher price. Clay should continue to drop
its price until the marginal revenue from the last penny of price reduction equals $3,
which is Clay’s marginal cost.
e. If the desire to improve Clay’s overhead absorption and hence its profitability is the
only reason to acquire Coronas, then the acquisition makes no economic sense.
Coronas should be acquired at a positive price if real synergies exist. Real synergies
include additional sales of Clay or Coronas aerosols as a result of the expanded
markets or product lines. Or other synergies might arise if, by adding volume to the
plant, operating efficiencies result and the variable cost of $3 per unit can be
reduced.
f. Clay’s management team might be interested in this acquisition because adding
volume to the plant might mean additional job security.
Another way to resolve the death spiral is to use practical capacity instead of actualutilization in calculating the overhead rate. Practical capacity represents the amount ofcapacity the common resource (e.g., the telephone system) was expected to provide whenit was purchased and used under normal operating circumstances. If the phone system waspurchased to provide 2,500 phone lines, then 2,500 lines are practical capacity. With prac-tical capacity of 2,500 lines, each phone is charged $440. This $440 represents $240 ofdepreciation ($600,000 � 2,500) plus $200 of variable cost. If only 1,200 lines are used,and each is charged $240 of the depreciation, then only $288,000 of the $600,000 depreci-ation is recovered ($240 � 1,200). The unused capacity (1,300 lines) of $312,000 is notcharged to the remaining users, but rather is charged to a corporate office expense. Practi-cal capacity reduces the likelihood of a death spiral because the cost of unused capacity(e.g., $312,000) is not imposed on the remaining users of the common resource.1
Exercise 8–1 illustrates another effect of the death spiral. With excess capacity andsubstantial fixed costs, managers are tempted to add new products or services solely tolower the average fixed costs on existing products. The new products or services absorbsome of the fixed costs, thereby lowering the fixed costs assigned to the existing productsor services. However, as demonstrated by Exercise 8–1, this strategy is flawed. New prod-ucts or services should be added only if they increase the firm’s net cash flows after consid-ering the cost of any additional capital necessary to add the new products or services.
1 Chapter 9 introduces the concept of normal volume: the long-run average production volume of a plantor department. Practical capacity and normal volume represent equivalent concepts. They both are designedto cause overhead rates to be calculated using a constant denominator volume that does not vary with actualutilization, thereby preventing overhead rates from rising as actual utilization falls.
zim36725_ch08_347-408.qxd 12/15/09 2:02 PM Page 352

Cost Allocation: Practices 353
B. Allocating Capacity Costs: DepreciationAs seen in the previous section, a death spiral can result when a common resource with sig-nificant fixed costs and excess capacity is allocated to users who have discretion over uti-lization of the resource. In the telecommunications example, depreciation of the existingphone system is the principal fixed cost. One way to solve the death spiral is to not allocatesome (or all) of the fixed cost. For example, allocate only the fixed cost of the capacityactually being used. If there is 40 percent excess capacity, allocate only 60 percent of thedepreciation. However, this solution to the death spiral creates other concerns.
Notice that the death spiral, or underutilization of the common resource, is really aproblem of how to use an existing durable asset. How much of the existing commonresource should each agent use? If there is excess capacity, any charge discourages its use.However, prior to deciding how to allocate the available capacity among existing agents,the firm had to decide how much capacity to acquire. In the previous example, the firm hadto decide how large a phone system to buy (how much phone-mail capacity, how manylines, how fast a switch, and so forth). The current fixed costs of the phone system (includ-ing depreciation) were “variable” costs prior to acquiring the capacity. Accounting depre-ciation (such as straight line) represents the annual historical cost of acquired capacity.Depreciation is the allocation of the asset’s historical cost over time.
How much capacity should the firm acquire? The future users of that capacity usuallyhave specialized, private knowledge of how intensively they will use the common resource.If these users know they will not be charged for their future use because fixed costs are notallocated, they will overstate their future use. If they are not charged for the excess capac-ity, they will still overstate their use if the common resource exhibits economies of scale(average cost declines as acquired capacity increases). Therefore, charging accounting de-preciation is a commitment device.2 Future users, knowing they will be charged for the his-torical cost of a durable asset, have less incentive to overstate their utilization. Allocatingaccounting depreciation to users commits them to recovering at least the historical cost ofthe asset. (Allocating depreciation does not commit them to recovering the opportunity costof capital tied up in the asset.)
In deciding whether to allocate depreciation on the common resource to its users, thefirm makes a trade-off between the efficient investment in the common resource and itsefficient utilization after acquisition. Charging depreciation helps control the overinvest-ment problem, but at the expense of underutilizing the asset after acquisition. Most firmscharge users for depreciation. Thus, control of the overinvestment problem tends to domi-nate decision-making errors involving asset utilization (the death spiral). This is anotherexample of how accounting systems tend to favor control when confronted with a choicebetween control and decision making.
C. Allocating Service Department CostsUp to now, we have discussed allocating a single common cost to multiple users (either di-visions or products). For example, Chapter 7 describes allocating personnel departmentcosts and corporate-level costs to divisions. We now examine a more realistic situation inwhich a number of service departments exist whose costs are allocated to several operating
2 See S Sunder, Theory of Accounting and Control (Cincinnati, OH: South-Western Publishing, 1997),pp. 55–56; and R Ball, S Keating, and J Zimmerman, “Historical Cost as a Commitment Device,” Maandbladvoor Accountancy en Bedriifs-economie (Netherlands), November 2000.
zim36725_ch08_347-408.qxd 12/15/09 2:02 PM Page 353

354 Chapter 8
divisions. Figure 8–1 illustrates the general case of N service departments and M operatingdivisions. In a manufacturing plant, the service departments consist of purchasing, janitor-ial, security, maintenance, information management, engineering, and so forth. The operat-ing divisions might be separate product lines or manufacturing functions such as partsmanufacturing and assembly lines. In order to compute the manufacturing cost of the finalproducts for inventory valuation, the cost of the service departments must be allocated tothe operating divisions. The service departments are like buckets of water that must beemptied into the operating divisions. The arrows indicate the direction of the service flows.Complicating the allocation is the reciprocal use of services among the service depart-ments. Service department S1 not only provides service to operating divisions D1, D2, . . .DM, but it also provides service to the other service departments S2, S3, . . . , SN. For exam-ple, information technology (IT) provides IT service to purchasing, while purchasing isinvolved in buying computer hardware and software for information technology.
To illustrate the allocation of service department costs, consider just two servicedepartments (telecommunications and information technology, IT) and two operating divi-sions (Cars and Trucks). Table 8–1 contains the percentage of each service department’scapacity consumed by the various users.
Telecommunications consumes 10 percent of its own capacity internally and ITconsumes 15 percent of its capacity internally. Also, each service department uses the otherservice department. The goal is to assign the costs of the service departments (telecommu-nications and IT) to the operating divisions (Cars and Trucks). Cars and Trucks make thefinal products, and their cost should include the telecommunications and IT costs.
Service Departments:
Operating Divisions: D1 D2 DM
S1 S2 SN
FIGURE 8–1
N servicedepartments costsallocated to Moperating divisions
ManagerialApplication:CostAllocationsat IBM
During the 1980s and early 1990s, IBM had the policy of allocating costs from one lineof business to another. Managers in those lines of business constantly argued that someof their overhead should be carried by other IBM businesses. IBM also typically allo-cated all of the R&D of a new technology to the line of business first using the technol-ogy, and subsequent users were able to utilize it for free. The cost allocation systemmasked the true profitability of many IBM businesses for years. IBM claimed it wasmaking money in its PC business. But in 1992, “as IBM began to move away from itsfunny allocation system, IBM disclosed that its PC business was unprofitable.” In 2004,IBM sold its PC division to China-based Lenovo Group for $1.75 billion.
SOURCE: P Carroll, “The Failures of Central Planning—at IBM,” The Wall Street Journal, January 28, 1993, p. A14; “IBMSells PC Business to China’s Lenovo,” AP, December 8, 2004.
zim36725_ch08_347-408.qxd 12/15/09 2:02 PM Page 354

Cost Allocation: Practices 355
The following costs of the two service departments are to be allocated to Cars and Trucks:
Telecommunications $2 millionIT 6 million
Total costs $8 million
The $2 million and $6 million costs are out-of-pocket costs incurred by the two depart-ments and do not contain any costs allocated from the other service department.
There are several ways to allocate service department costs to the operating divisions:direct allocation, step-down allocation, and reciprocal allocation. These three methods andtheir advantages and disadvantages are discussed next.
Figure 8–2 illustrates the direct allocation of service department costs. Direct allocation ig-nores each service department’s use of the other service departments. The allocation of S1
is based only on the operating divisions’ utilization of S1. The fact that S2, S3, . . . , SN alsouse S1 is ignored. This greatly simplifies the allocation calculations, although we will seethat inaccurate transfer prices for the services can result.
The divisional utilization rates in Table 8–1 are used to allocate service departmentcosts. That is, the Cars division uses 40 percent of telecommunications and the Trucks divi-sion uses 30 percent. Together they use 70 percent. If 40 percent and 30 percent are used toallocate telecommunication’s $2 million in costs, only $1.4 million of the total $2 millionwill be allocated to Cars and Trucks. The other $0.6 million remains unassigned. Theseresults are shown in Table 8–2.
Allocating service department costs based on the divisions’ actual use of each servicedepartment results in some of the service departments’ costs remaining unallocated:$5 million of service department costs are to be allocated and $3 million remain unas-signed. If all service department costs are to be allocated to Cars and Trucks, then eachdivision’s percentage of the total used by the divisions is the allocation rate. That is, the per-centages are recomputed so that the Cars and Trucks divisions’ shares sum to one. Thismethod is termed direct allocation because the service department costs are allocateddirectly to the operating divisions rather than to the other service departments first and thento the operating divisions. The direct allocations are in Table 8–3.
1. DirectAllocationMethod
TABLE 8–1 Capacity of Service Departments Used
Telecommunications IT Cars Trucks Total
Telecommunications 10% 20% 40% 30% 100%IT 25 15 35 25 100
Service Departments:
Operating Divisions: D1 D2 DM
S1 S2 SN
FIGURE 8–2
Direct allocationmethod
zim36725_ch08_347-408.qxd 12/15/09 2:02 PM Page 355

356 Chapter 8
Since the revised shares in the first part of Table 8–3 sum to one, all the costs intelecommunications and IT are allocated to the two operating divisions and no costs remainunallocated. The allocated service department costs using these shares are in the bottomhalf of Table 8–3. Notice that the total cost of telecommunications and IT, $8 million, isnow allocated to Cars and Trucks. However, this direct allocation method presents a prob-lem in that the opportunity cost per unit of service is likely wrong. While we do not knowthe correct opportunity cost, we do know that the direct allocation method excludes the ser-vice departments’ use of other service departments and therefore incorrectly states theopportunity cost of each service department.
Suppose that the Cars division increases its use of IT. This causes IT costs to rise, or,if the IT department is not expanded, its service is degraded. Since IT uses telecommuni-cations, telecommunications’ costs also rise when the Cars division uses more IT. But thedirect allocation method does not charge IT for any telecommunications costs. Becauseeach service department uses the other service department and the direct allocationmethod ignores these interactions, the cost allocated (i.e., the transfer price) is not the op-portunity cost of the service department.
Another problem with the direct allocation method is that each service department willoveruse the other service departments. Since each service department’s costs are allocatedonly to the manufacturing departments, the other service departments view that servicedepartment as free. They are not charged for their use of other service departments andtherefore have no monetary incentive to limit their use. Accordingly, nonfinancial methods,such as rationing, must be employed to control the excessive use of each service departmentby the other service departments.
TABLE 8–2 Service Department Percentages Used by Cars and Trucks($ in Millions)
Total Total Cost Total Cars Trucks Allocated Incurred Unallocated
Telecommunications $0.8 $0.6 $1.4 $2.0 $0.6(40% � $2) (30% � $2)
IT $2.1 $1.5 $3.6 $6.0 $2.4
(35% � $6) (25% � $6)Total $5.0 $8.0 $3.0
TABLE 8–3 Direct Allocation Method ($ in Millions)
Cars Trucks Total
Revised Shares, Direct Allocation MethodTelecommunications 40/(40 � 30) � 4/7 30/(40 � 30) � 3/7 100%IT 35/(35 � 25) � 7/12 25/(35 � 25) � 5/12 100%
Allocated Costs, Direct Allocation MethodTelecommunications 4/7 � $2 � $1.143 3/7 � $2 � $0.857 $2IT 7/12 � $6 � $3.500 5/12 � $6 � $2.500 $6
Total $4.643 $3.357 $8
zim36725_ch08_347-408.qxd 12/15/09 2:02 PM Page 356

Cost Allocation: Practices 357
The step-down method partially overcomes the problems with direct allocations. The pro-cedure begins by choosing a service department and allocating all of its costs to the remain-ing service departments and operating divisions. Then, a second service department ischosen and all of its costs (including its share of the allocated costs from the first servicedepartment) are allocated to the remaining service departments and operating divisions.This process continues until all service department costs are allocated. In this way, all ser-vice department costs cascade down through the service organizations and eventually areallocated to the operating divisions.
Figure 8–3 illustrates the step-down method. Service department S1 is chosen first andall of its costs are allocated to S2, S3, . . . , SN and D1, D2, . . . , DM. The solid arrows indi-cate the first step of the process. Then all of S2’s costs plus S2’s share of S1’s costs are allo-cated to S3, S4, . . . , SN and D1, D2, . . . , DM. The dashed arrows indicate the allocation ofS2’s costs. This continues until only service department SN remains. All of its costs plus allof the costs allocated to SN from the other service departments are allocated to the operat-ing divisions as represented by the dotted arrows. Notice that half of the flows among ser-vice departments are captured by the step-down method. For example, S2’s use of S1 iscaptured, although S1’s use of S2 is not.
In our numerical example, the first service department to be allocated is telecommu-nications. The allocation shares are in the top half of Table 8–4, and the cost allocations arecomputed in the bottom half of the table. Telecommunications’ costs are allocated to IT,Cars, and Trucks in the first step. Two-ninths of telecommunications are allocated to IT, 4⁄9to Cars, and the remaining 1⁄3 to Trucks. In the first row of the bottom half of Table 8–4,these shares are used to allocate telecommunications’ costs. IT receives $444,000, the Carsdivision receives $889,000, and the Trucks division receives $667,000. All $2 million of thetelecommunications costs are allocated.
In the second step, IT costs plus data processing’s share of the telecommunicationscosts are allocated to Cars and Trucks. Total IT costs to be allocated include IT’s directcosts of $6 million plus the $444,000 allocated in the first step. The total $6,444,000 isallocated to Cars (7⁄12) and Trucks (5⁄12).
Notice that all $8 million of the service department costs are allocated (far right col-umn, last row of Table 8–4). The Cars division receives $4.648 million and the Trucks divi-sion receives $3.352 million. By chance, the costs allocated to each division, Cars andTrucks, are about the same using either the direct method or the step-down method.
2. Step-DownAllocationMethod
Service Departments:
Operating Divisions: D1 D2 DM
S1
S2 SN
SN
FIGURE 8–3
Step-down allocationmethod
zim36725_ch08_347-408.qxd 12/15/09 2:02 PM Page 357

TABLE 8–4 Step-Down Allocation Method—Telecommunications First ($ in Millions)
Information Technology Cars Trucks Total
Telecommunications 20�(20 � 40 � 30) � 2�9 40�90 � 4�9 30�90 � 1�3 100%IT — 35�60 � 7�12 25�60 � 5�12 100%
Using these shares, the allocated costs are as follows:
Costs to Be Information Total Allocated to Allocated Technology Cars Trucks Cars and Trucks
Telecommunications $2 2�9 � $2 � $0.444 4�9 � $2 � $0.889 1�3 � $2 � $0.667 $1.556IT $6 � $0.444 — 7�12 � $6.444 � $3.759 5�12 � $6.444 � $2.685 6.444
$4.648 $3.352 $8.000
TABLE 8–5 Step-Down Allocation Method—Information Technology First ($ in Millions)
Telecommunications Cars Trucks Total
IT 25�(25 � 35 � 25) � 5�17 35�85 � 7�17 25�85 � 5�17 100%Telecommunications — 4�7 3�7 100%
Using these revised shares, the allocated costs are:
Costs to Total Allocated to Be Allocated Telecommunications Cars Trucks Cars and Trucks
IT $6 5�17 � $6 � $1.765 7�17 � $6 � $2.470 5�17 � $6 � $1.765 $4.235Telecommunications $2 � $1.765 — 4�7 � $3.765 � $2.151 3�7 � $3.765 � $1.614 3.765
$4.621 $3.379 $8.000
358
zim36725_ch08_347-408.qxd 12/16/09 9:12 AM Page 358
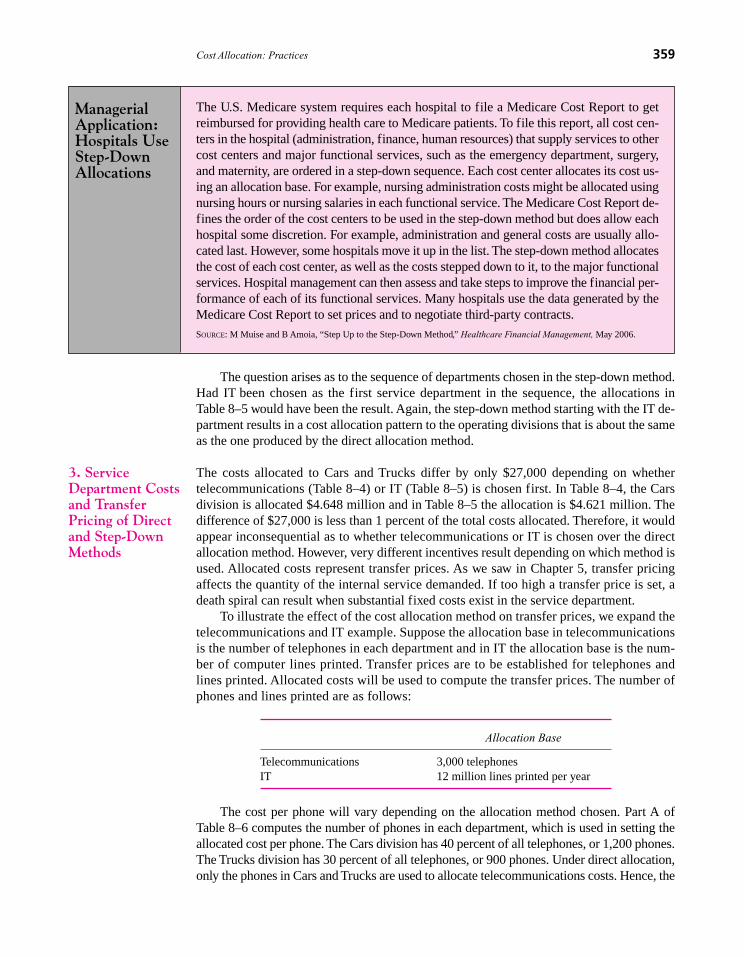
The question arises as to the sequence of departments chosen in the step-down method.Had IT been chosen as the first service department in the sequence, the allocations inTable 8–5 would have been the result. Again, the step-down method starting with the IT de-partment results in a cost allocation pattern to the operating divisions that is about the sameas the one produced by the direct allocation method.
The costs allocated to Cars and Trucks differ by only $27,000 depending on whethertelecommunications (Table 8–4) or IT (Table 8–5) is chosen first. In Table 8–4, the Carsdivision is allocated $4.648 million and in Table 8–5 the allocation is $4.621 million. Thedifference of $27,000 is less than 1 percent of the total costs allocated. Therefore, it wouldappear inconsequential as to whether telecommunications or IT is chosen over the directallocation method. However, very different incentives result depending on which method isused. Allocated costs represent transfer prices. As we saw in Chapter 5, transfer pricingaffects the quantity of the internal service demanded. If too high a transfer price is set, adeath spiral can result when substantial fixed costs exist in the service department.
To illustrate the effect of the cost allocation method on transfer prices, we expand thetelecommunications and IT example. Suppose the allocation base in telecommunicationsis the number of telephones in each department and in IT the allocation base is the num-ber of computer lines printed. Transfer prices are to be established for telephones andlines printed. Allocated costs will be used to compute the transfer prices. The number ofphones and lines printed are as follows:
Allocation Base
Telecommunications 3,000 telephonesIT 12 million lines printed per year
The cost per phone will vary depending on the allocation method chosen. Part A ofTable 8–6 computes the number of phones in each department, which is used in setting theallocated cost per phone. The Cars division has 40 percent of all telephones, or 1,200 phones.The Trucks division has 30 percent of all telephones, or 900 phones. Under direct allocation,only the phones in Cars and Trucks are used to allocate telecommunications costs. Hence, the
3. ServiceDepartment Costsand TransferPricing of Directand Step-DownMethods
ManagerialApplication:Hospitals UseStep-DownAllocations
The U.S. Medicare system requires each hospital to file a Medicare Cost Report to getreimbursed for providing health care to Medicare patients. To file this report, all cost cen-ters in the hospital (administration, finance, human resources) that supply services to othercost centers and major functional services, such as the emergency department, surgery,and maternity, are ordered in a step-down sequence. Each cost center allocates its cost us-ing an allocation base. For example, nursing administration costs might be allocated usingnursing hours or nursing salaries in each functional service. The Medicare Cost Report de-fines the order of the cost centers to be used in the step-down method but does allow eachhospital some discretion. For example, administration and general costs are usually allo-cated last. However, some hospitals move it up in the list. The step-down method allocatesthe cost of each cost center, as well as the costs stepped down to it, to the major functionalservices. Hospital management can then assess and take steps to improve the financial per-formance of each of its functional services. Many hospitals use the data generated by theMedicare Cost Report to set prices and to negotiate third-party contracts.
SOURCE: M Muise and B Amoia, “Step Up to the Step-Down Method,” Healthcare Financial Management, May 2006.
Cost Allocation: Practices 359
zim36725_ch08_347-408.qxd 12/15/09 2:02 PM Page 359

360 Chapter 8
allocation base is 2,100 phones. Under the step-down allocation with telecommunicationschosen first, IT receives a charge for its phones. Thus, the number of phones used to allocatetelecommunications costs rises to include the 600 phones in IT. On the other hand, if IT ischosen first in the step-down method, the number of phones in the allocation base is still2,100 (those in Cars and Trucks), because the IT costs have already been allocated.
Part B of Table 8–6 reports the allocated cost per phone. The first line in part B istelecommunications costs divided by the total number of phones used to allocate costs(from part A). Notice that in the right column of part B, telecommunications costs are$3.765 million, the sum of the $2 million of telecommunications costs and the $1.765 mil-lion allocated to telecommunications when IT is allocated first (see Table 8–5). The lastrow reports the same cost allocations as in Tables 8–3, 8–4, and 8–5. For example, underthe direct allocation method, the Cars division has 1,200 phones and will be charged $1.143million. This is exactly the same charge as computed in Table 8–3. Likewise, the$0.889 million and $2.151 million in the last two columns correspond to the allocationscomputed in Tables 8–4 and 8–5, respectively.
The first row in Part B of Table 8–6 also shows the computation of the transfer price,or cost allocated per telephone, under the three allocation methods. The cost per phonevaries from $741 to $1,793 depending on which allocation scheme is used. The highcost per phone of $1,793 in the right column occurs because some of the $6 million ofIT costs is allocated to telecommunications before the cost per phone is calculated. The ITcosts allocated to telecommunications increase telecommunications’ costs and, ultimately,the allocated cost per phone.
Because the cost per phone (which represents the transfer price) varies dependingon which allocation method is used, the cost allocation scheme affects the decision of eachdepartment to add phones. The sequence of service departments in the step-down methodcan affect decision making because the last service department in the sequence will have a
TABLE 8–6 Allocated Cost per Phone
Step-Down Allocation
Direct Telecommunications Information TechnologyAllocation Chosen First Chosen First
A. Number of Phones
Number of phones:Telecommunications — — —IT — 20% � 3,000 � 600 —Cars 40% � 3,000 � 1,200 40% � 3,000 � 1,200 40% � 3,000 � 1,200Trucks 30% � 3,000 � 900 30% � 3,000 � 900 30% � 3,000 � 900
Phones used to allocate costs 2,100 2,700 2,100
B. Cost per Phone
Cost per phone* $2M/2,100 � $ 952 $2M/2,700 � $ 741 $3.765M/2,100 � $1,793Number of phones
in Cars 1,200 1,200 1,200
Telecommunications charged to Cars $1.143 $0.889 $2.151
*M denotes millions.
zim36725_ch08_347-408.qxd 12/15/09 2:02 PM Page 360

Cost Allocation: Practices 361
larger cost per unit of service. Remember that cost allocations are effectively internal taxschemes. How the taxes are applied will affect the “price” decision makers face in decidingto add or delete phones.
The same conclusions hold for the data processing department. The equivalent compu-tations for the IT department, including the cost per line printed across the various allocationmethods, are in Table 8–7. Again, note the wide variation in cost per line printed. The costvaries from $0.588 per line under the step-down method with IT chosen first to $0.895 underthe step-down method with telecommunications chosen first. Also, note that the total chargedto Cars (the last line) agrees with the previous calculations in Tables 8–3, 8–4, and 8–5.
We saw earlier that the various methods of allocating service department costs resultin a difference of less than 1 percent of the total costs. However, these same methods cancause the cost-based transfer prices to vary by over 140 percent for telephones ([$1,793 �$741] � $741) and over 50 percent for lines printed ([$0.895 � $0.588] � $0.588). Whythe discrepancy? Refer back to Table 8–1. In this example, the Cars division uses roughlyequal fractions of the two service departments (57 percent and 58 percent), and the Trucksdivision uses roughly equal fractions of the service departments (43 percent and 42 per-cent). Because these fractions are roughly the same in both departments, the total costs al-located to the divisions vary little across the various methods. However, the transfer pricesper phone and line printed vary dramatically. In general, the allocation methods can yieldsubstantial differences in amounts allocated. The numbers chosen for this example illustratethat transfer prices can vary greatly even when the cost allocation methods have little effecton the total amounts allocated.
The large variation in the cost-based transfer prices arises because the transfer pricesin this setting are ratios. The numerator of the ratio is the sum of the department’s directcosts and any costs allocated to the service department. The denominator of the ratio is thenumber of units in the remaining allocation base (number of phones or lines printed). Thefirst service department in the step-down sequence has no allocated costs in its numeratorand a large number of users (and hence a large denominator). If this service department
TABLE 8–7 Allocated Cost per Computer Line Printed
Step-Down Allocation
Direct Telecommunications Information TechnologyAllocation Chosen First Chosen First
A. Number of Lines (in Millions)
Number of lines printed:Telecommunications — — 25% � 12 � 3.0IT — — —Cars 35% � 12 � 4.2 35% � 12 � 4.2 35% � 12 � 4.2Trucks 25% � 12 � 3.0 25% � 12 � 3.0 25% � 12 � 3.0
Total lines printed 7.2 7.2 10.2
B. Cost per Line Printed (in Millions except Cost per Line Printed)
Cost per line printed $6�7.2 � $0.833 $6.44�7.2 � $0.895 $6�10.2 � $0.588Number of lines printed
in Cars 4.2 4.2 4.2
IT charged to Cars $3.5 $3.759 $2.470
zim36725_ch08_347-408.qxd 12/15/09 2:02 PM Page 361

362 Chapter 8
gets shifted from the first to the last in the sequence, its cost-based transfer price rises fortwo reasons. First, the ratio’s numerator goes up by all of the other service department costsnow being allocated to it. Second, its denominator goes down because the only users of itsservices that are included in the allocation base are the operating units. The other servicedepartments are excluded from the denominator. Thus, the ratio changes a lot because thenumerator goes up while the denominator goes down. For example, refer to the cost perphone in Table 8–6. With telecommunications first in the step-down sequence, the transferprice is $2M�2,700 � $741. When it is last in the sequence, the cost per phone is$3.765M�2,100 � $1,793. Notice that both the numerator and the denominator change astelecommunications is shifted from first to last in the sequence.
One criticism of the step-down method is that the sequence used is arbitrary and largedifferences can result in the cost per unit of service using different sequences. Also, the step-down method ignores the fact that although departments earlier in the sequence use servicedepartments later in the sequence, earlier departments are not allocated these costs.
The death spiral, described in section A, can be a significant problem with step-downallocations if the service departments contain significant amounts of fixed costs. If trans-fer prices are established for these service department costs, then users have incentives touse less of the high-cost service departments. (The high-cost departments are those last inthe step-down chain.) As usage falls, total costs do not fall proportionately because of thefixed costs. This causes the costs allocated to the remaining users to rise further, and theseusers will seek to replace the inside service with outside vendors that offer lower costs.
Under the step-down method, the transfer price of phones and printed lines can vary dramat-ically depending on the order selected for allocating the service departments’ costs. The thirdallocation method, the reciprocal allocation method, is the most precise way to allocate ser-vice department costs when each service department uses other service departments. It cap-tures all the service flows depicted in Figure 8–1. Under the reciprocal allocation method, asystem of linear equations is constructed, one for each service department. Each equationcontains the use of that department by all other service departments. If there are 20 service de-partments providing services to at least some of the other departments, there will be 20 equa-tions with 20 unknowns. This system of equations is then solved to derive the cost shares foreach operating department and the cost per unit of output in each service department. Theappendix to this chapter illustrates the computations involved in the reciprocal method.
As demonstrated in the appendix, the reciprocal allocation method produces an allo-cated cost per phone of $1,492 and an allocated cost per line printed of $0.676. The follow-ing table compares these allocated costs with those of the direct and step-down allocationmethods.
Charge per Phone Charge per Line Printed
Direct method $ 952 $0.833Step-down:
Telecommunications first $ 741 $0.895IT first $1,793 $0.588
Reciprocal method $1,492 $0.676
The reciprocal allocation method produces neither the highest nor the lowest unit cost.By incorporating one service department’s use of another service department, it avoids thedistortions in unit allocated costs observed in the step-down method.
4. ReciprocalAllocationMethod
zim36725_ch08_347-408.qxd 12/15/09 2:02 PM Page 362

Cost Allocation: Practices 363
The cost per phone of $1,492 and the cost per line printed of $0.676 represent the op-portunity cost of adding one more phone or printing one more line assuming all the costsbeing allocated are variable. The phone charge reflects the fact that the additional phoneuses some additional telecommunications and IT resources. Likewise, the printed linecharge reflects the fact that one more line uses some additional IT and telecommunicationsresources. Therefore, the reciprocal method is more accurate in assessing the opportunitycost of service departments than either the direct or step-down allocations, assuming allservice department costs are variable.
The reciprocal method produces a transfer price that can be compared with an out-side price for the service. If the outside bid is less than the internal price, it should be ac-cepted. This assumes that the inside costs of service (the $2 million and $6 million costof telecommunications and IT, respectively) represent all variable costs. If any of thesecosts contain fixed costs and there is excess capacity, then the reciprocal method does notproduce opportunity cost transfer prices.
In many service departments, fixed and variable costs are not distinguished. Total costsare accumulated and allocated to the operating divisions. Combining fixed costs with vari-able costs in the service departments can compromise the reciprocal method’s ability toproduce marginal cost transfer prices. To take full advantage of the reciprocal method’sability to estimate marginal cost transfer prices, only the variable costs in each service de-partment should be allocated using the system of equations. The fixed costs in each servicedepartment are either not allocated or allocated based on each operating division’s planneduse of the service department’s capacity.
Another critical assumption underlying all three allocation methods is that the utilizationrates do not change with increases or decreases in scale. That is, if the firm doubles in size,will IT continue to utilize 20 percent of telecommunications? If this assumption is violated,then no method based on past utilization rates can yield accurate forecasts of opportunity cost.
While the reciprocal allocation method has certain theoretical advantages, it is notwidely used. Why? First, calculating reciprocal allocations requires substantial computingpower, especially when there are numerous service departments. Until recently, such prob-lems could only be solved with very large computers. Now, most spreadsheet programscan easily handle them. Second, few accountants were trained in solving systems of equa-tions or how to formulate the problem. This conjecture seems implausible since many newinnovations, such as derivative securities, suggest that financial managers have the abilityto quickly adopt new analytic procedures when it is in their interest to do so. Third, it isdifficult (and hence costly) to intuitively explain the reciprocal method to nonfinancialmanagers in the firm. The reciprocal method appears as a “black box,” and the managersbeing asked to bear the allocated costs do not fully understand how the charges were com-puted. This conjecture also seems implausible, especially if the benefits of the reciprocalmethod outweigh the costs. It also relies on the questionable assumption that certaingroups are stupid. One would think that financial managers would be able to devise suit-able tutorials to explain the calculations. Fourth, the dysfunctional aspects of the step-down method can be minimized by ordering the departments in the step-down sequence.That is, by judiciously choosing the order, the step-down method produces allocated coststhat are very similar to those produced by the reciprocal method in terms of the ultimatedecisions managers make using the allocated costs. While simple textbook examples canbe constructed showing large deviations in allocated costs produced by the step-down andreciprocal methods—and therefore, the potential for dysfunctional decision making—wehave little evidence such differences exist in practice.
A final conjecture as to why reciprocal allocations are rarely used, and one consistentwith other observed managerial accounting choices, is that the primary role of cost
zim36725_ch08_347-408.qxd 12/15/09 2:02 PM Page 363

364 Chapter 8
allocations is not decision making. If the primary function were decision making, then, sinceopportunity costs are the basis for decision making (and the reciprocal method approximatesopportunity costs better than the other methods), we should observe fairly frequent use of thereciprocal method. The fact that we observe infrequent use of the reciprocal method suggeststhat internal accounting is not used for decision making, but rather for some other purposesuch as decision control, financial reporting, or taxes. For example, using the step-downmethod affords managers considerable discretion in the resulting allocated costs because theycan select the order of the departments. This discretion can be useful for strategic reasons, forfinancial reporting, to maximize cost-based reimbursements, or to minimize taxes.
There are three reasons to allocate service department costs (independent of which alloca-tion method is chosen):
1. By charging a positive “price,” users reduce their consumption from what it wouldbe under a zero price (no cost allocations). Pricing the internal service helps allocatea scarce resource. At a zero price, demand usually exceeds supply. In the absence ofa price mechanism to allocate department services, senior management will beconfronted with requests to increase the amount of service via larger budgets andmust devise nonprice priority schemes to manage the demand for service.
2. By allocating service department costs, senior management receives informationabout the total demand for the service at the allocated cost. This helpsmanagement to determine the optimum scale of the service department. Forexample, if the users are willing to pay a transfer price that recovers the cost ofproviding the service, then the service department is providing benefits to theusers in excess of its costs.
3. By comparing the internal allocated cost with the outside external price ofcomparable services, senior management can assess the service department’soperating efficiency. Gross inefficiencies are identified when the allocated costper unit of service exceeds the external price.
Q8–1 What is the death spiral and how is it prevented?
Q8–2 What are some reasons to allocate service department costs,independent of which allocation method is chosen?
Q8–3 What is step-down allocation? What are some criticisms ofthis allocation method?
Q8–4 How do the direct allocation and step-down methods differ?
Q8–5 How does the cost per unit of service vary over the sequenceof service departments when the step-down method is used?
D. Joint CostsA special case of cost allocations deals with allocating joint costs. A joint cost is incurredto produce two or more outputs from the same input. Joint products are produced from asingle input. For example, hamburger and liver are joint products from a single joint input,the cow. In a mining operation, gold and silver are joint products from the joint input, ore.Usually, but not always, joint products are produced in fixed proportions, meaning thatmore gold cannot be produced if less silver is produced.
ConceptQuestions
5. Recap
zim36725_ch08_347-408.qxd 12/15/09 2:02 PM Page 364

Cost Allocation: Practices 365
Firms convert one set of resources into another. Production is a process of assemblingvarious factor inputs into a new combination. Many costs are thus common with othercosts. Service department costs discussed in Section C are common costs of the variousproducts manufactured. The fire insurance premium on the factory building used to man-ufacture various products in the plant is a common (and hence) inseparable cost of all theproducts manufactured in the building. Notice that joint costs and common costs are verysimilar in definition. The major distinction between the two is that common costs areincurred in both assembly and disassembly processes, but joint costs are incurred only indisassembly processes. In an assembly process, many inputs are assembled into a few fi-nal outputs. For example, tires, windows, a motor, seats, and more are assembled to pro-duce an automobile. In a disassembly process, a few inputs are disassembled into manyfinal products. For example, a barrel of crude oil is disassembled into gasoline, motor oil,jet fuel, and asphalt. Figure 8–4 illustrates the difference between an assembly and a dis-assembly process.
There are many ways to allocate joint costs to joint products. For example, in an oilrefinery, the cost of each barrel of crude oil can be allocated to the joint products based onphysical weight, physical volume, relative sales value, or net realizable value. Table 8–8
Assembly Process
Labor
Overhead
Manufacturing process
Rawmaterials
Purchasedparts
Product
Jointproducts
Disassembly Process
Labor
Overhead
Manufacturing process
Joint input
FIGURE 8–4 Assembly and disassembly processes
TABLE 8–8 Relative Weight, Physical Volume, Relative Sales Value, and Net Realizable Value
Net Realizable ValueRevenue of
Weight (%) Volume (%) Final Product (%) Costs NRV* (%)
A. Data
Gasoline 60 lbs. (30%) 40 gals. (80%) $60 (40%) $50 $10 50%Motor oil 40 lbs. (20%) 5 gals. (10%) $60 (40%) $54 6 30Jet fuel 100 lbs. (50%) 5 gals. (10%) $30 (20%) $26 4 20
B. Allocated Joint Cost of $20 Barrel of Oil
Gasoline $21 $56 $28 $35Motor oil 14 7 28 21Jet fuel 35 7 14 14
$70 $70 $70 $70
*NRV (net realizable value) � Revenue of final product � Costs. Costs are the additional costs required to produce the final product.
zim36725_ch08_347-408.qxd 12/15/09 2:02 PM Page 365

366 Chapter 8
illustrates these various methods using a barrel of oil that is split into three products: gaso-line, motor oil, and jet fuel. Part A provides the data used to allocate the $70 cost per bar-rel. Part B applies the percentages to allocate the barrel’s $70 cost. Notice the widevariation in allocated costs across the various methods. The allocated cost of gasoline variesfrom $21 to $56. Jet fuel varies from $7 to $35.
Physical measures such as weight and volume are convenient allocation bases becausethey are easily observed. If selling prices are used (relative sales value method), they mustbe recorded; frequent changes in sales prices introduce variability into the allocated costs.The net realizable value method of allocating joint costs uses as the allocation base thedifference between sales revenue and the additional costs (beyond the joint costs) requiredto process the product from the point at which the joint products are split off until they aresold. Net realizable value is described more fully below. When analyzing situations involv-ing joint costs, the fundamental point to remember is that joint cost allocations can causea death spiral. More on this next.
To illustrate the analysis of joint products, consider a chicken processor who buys livechickens and disassembles them into fillets, wings, and drumsticks. Suppose live chickenscost $1.60 each. The variable cost to process the live chicken into parts is $0.40per chicken. The joint cost per chicken is then $2. Once the parts are obtained, separate pro-cessing is necessary to obtain marketable fillets, drumsticks, and wings. Each separate partmust be cleaned, inspected, and packaged, at a cost of $0.80 for fillets, $0.16 for wings, and$0.04 for drumsticks. The split-off point is the point in processing at which all joint costshave been incurred. These data and selling prices are displayed in Table 8–9 along with thejoint cost allocations based on weight.
Part A allocates the $2 joint cost to the chicken parts based on weight. Part B addsthese allocated joint costs to the cost of further processing the chicken parts. The numbersin part B show that a loss of $0.11 per chicken is incurred from further processing of thewings. Based on this report, management’s inclination is to stop processing the wingsbecause they appear to be losing money.
Suppose that wings are no longer processed and sold. Assume that the unprocessedwings are hauled away for free and that eliminating wings has no effect on the revenue for
1. Chickens
TABLE 8–9 Using Weight to Allocate Chicken Costs for Product Line Profitability of Fillets, Drumsticks, and Wings
Total Fillets Drumsticks Wings
A. Cost Allocation Based on Weight
Weight 32 oz. 16 oz. 12 oz. 4 oz.Percentage of weight 100% 50% 37.5% 12.5%Allocated cost $2.00 $1.00 $0.75 $0.25
B. Product Line Profitability, Including Joint Costs
Sales $3.50 $2.40 $0.80 $0.30Costs beyond split-off point (1.00) (0.80) (0.04) (0.16)Joint costs (from above) (2.00) (1.00) (0.75) (0.25)
Profit (loss) per chicken $0.50 $0.60 $0.01 $(0.11)
zim36725_ch08_347-408.qxd 12/15/09 2:02 PM Page 366

Cost Allocation: Practices 367
fillets and drumsticks. Product line profitability after allocating the joint costs among theremaining parts—fillets and drumsticks—is recalculated in Table 8–10.
Total profits have fallen from $0.50 per chicken to $0.36 per chicken, and we arenow losing $0.10 on drumsticks. If we believed the analysis in Table 8–9 and eliminatedthe wings, we must also eliminate the drumsticks because of the analysis in Table 8–10.Table 8–11 presents the profit statement per chicken if we eliminate the drumsticks alongwith the wings.
Now we are losing $0.40 per chicken. (But at least we do not have to worry about al-locating joint costs to joint products, as we have dropped all but one of the joint products.)
What is happening? Recall that joint cost allocations can cause a death spiral. Thenumbers in Tables 8–9 and 8–10 are misleading for decision making. The $2 joint cost ofthe chicken is fixed (sunk) with respect to further processing of the wings. If we no longerprocess and sell wings, we do not gain an additional $0.11 per chicken, as indicated bythe reported loss in Table 8–9. It does not cost us $0.25 to get the wings in the first placebecause the wings are free once the chicken is purchased. It costs us only the additional$0.16 per chicken incurred beyond the split-off point to get the wings.
What is the correct analysis? Apply the concept of opportunity costs from Chapter 2. Whatis the benefit forgone if wings are not processed further? The answer is the revenues of$0.30 less the costs incurred of further processing wings of $0.16, or $0.14. The allocatedjoint costs of the wings have already been incurred when the chicken is purchased andprocessed to the split-off point. The only benefit of further processing is the revenues lesscosts incurred to process further. The joint cost of the chicken is sunk at the time of the de-cision to process the wings.
2. Net RealizableValue
TABLE 8–10 Using Weight to Allocate Chicken Costs for Product Line Profitability of Fillets and Drumsticks (Wings Are Dropped)
Total Fillets Drumsticks
A. Cost Allocation Based on Weight
Weight 28 oz. 16 oz. 12 oz.Percentage of weight 100% 57.14% 42.86%Allocated cost $2.00 $1.14 $0.86
B. Product Line Profitability, Including Joint Costs
Sales $3.20 $2.40 $ 0.80Costs beyond split-off point (0.84) (0.80) (0.04)Joint costs (from above) (2.00) (1.14) (0.86)
Profit (loss) per chicken $0.36 $0.46 $(0.10)
TABLE 8–11 Analysis of Processing Fillets Only
Sales $ 2.40Costs beyond split-off point (0.80)Joint costs (2.00)
Profit (loss) per chicken $(0.40)
zim36725_ch08_347-408.qxd 12/15/09 2:02 PM Page 367

368 Chapter 8
Figure 8–5 illustrates the relation among joint costs, joint products, costs beyond thesplit-off point, and selling prices. Using the data from Table 8–9, Figure 8–5 portrays thejoint products (fillets, drumsticks, and wings) that result from the joint input (the chicken).Once the joint products emerge after the split-off point, further costs are incurred beforethey can be sold. The costs beyond the split-off point are separable from the other jointproduct costs and will be incurred only if the particular joint product is processed further.
Relying on the graphic intuition in Figure 8–5, Table 8–12 presents the analysis usingthe net realizable value (NRV) allocation method. The relative profitability of each jointproduct depends only on its selling price less its costs beyond the split-off point. The dif-ference between selling price and costs beyond the split-off point is called net realizablevalue and is analogous to contribution margin. If a particular joint product has negative netrealizable value, it should not be processed further. However, if the cost of disposing of itis greater than its negative NRV, further processing is the least costly alternative.
Table 8–12 shows that all three chicken parts are yielding incremental revenues inexcess of their opportunity cost. For example, we can sell the wings for $0.30, yet the incre-mental cost (the cost of further processing) is only $0.16. Thus, the net realizable value ofprocessing the wings is $0.14. Allocating joint costs using net realizable value as theallocation base does not distort product line profitability. In the footnote that accompaniesTable 8–12, we see that fillets generate 64 percent of net realizable value and receive 64 per-cent of the joint costs. Wings generate only 5.6 percent of net realizable value and receiveonly 5.6 percent of the joint costs. Therefore, using net realizable value as the allocation basedoes not cause one product to bear a disproportionately larger percentage of joint costs thanit generates in NRV.
After joint costs are allocated, wings show a “profit” of $0.03 per chicken. However,it is incorrect to say, “Wings generate $0.03 of profit per chicken.” The correct statementis “Wings generate $0.14 of net cash flow per chicken if processed further.”
Chicken cost= $2.00
Split-OffPoint
Fillets $0.80 $2.40
Drumsticks $0.04 $0.80
Wings $0.16 $0.30
Costs beyond theSplit-Off Point
SellingPrices
FIGURE 8–5
Joint costs, costsbeyond split-off, andselling prices
TABLE 8–12 Profits from Further Processing (Allocating Joint Costs Using NetRealizable Value)
Total Fillets Drumsticks Wings
Sales $3.50 $2.40 $0.80 $0.30Costs beyond split-off point (1.00) (0.80) (0.04) (0.16)
Net realizable value from further processing $2.50 $1.60 $0.76 $0.14
Less: Joint costs per chicken* (2.00) (1.28) (0.61) (0.11)
Profits $0.50 $0.32 $0.15 $0.03
*Allocated based on net realizable value, as follows:
Net realizable value $2.50 $1.60 $0.76 $0.14
Percentage of net realizable value 100% 64% 30.4% 5.6%
Joint cost $2.00 $1.28 $0.61 $0.11
zim36725_ch08_347-408.qxd 12/15/09 2:02 PM Page 368

Cost Allocation: Practices 369
Net realizable value does not distort product line profits because joint costs are allo-cated based on ability to pay. Products with the greatest contribution margins beyond thesplit-off point bear more of the joint cost. On the other hand, NRV allocation does not pro-vide any additional information for decision making beyond whatever information is al-ready contained in the net realizable value from further processing. That is, if a product iscontributing positive cash flows beyond the split-off point, allocating joint costs to thisproduct will not change the decision to process it further. Therefore, allocating joint costsusing NRV is also irrelevant for product line profitability analysis. NRV allocations will notcause the wrong product line to be dropped, but they do not add anything for decision mak-ing beyond looking at the cash flows after the split-off point.
It is important to emphasize that when net realizable value is calculated, the costs be-yond the split-off point must include only the direct costs associated with processing thejoint product further. If no further processing is performed, then the firm should save all thecosts beyond the split-off point. If costs beyond the split-off point contain any allocatedfixed common costs, the decision to stop processing will not save the fixed common costs.For example, if costs beyond split-off contain allocated factory property taxes (because thefurther processing occupies shared factory space), the decision to stop further processingdoes not save these property taxes.
Exercise 8–2
New View produces two chemicals, V7 and AC, from a decomposition of M68JJ. Each batch
of M68JJ, costing $22,000, yields 300 pounds of V7 and 400 pounds of AC. Each unit of V7
can be sold for $35, and each unit of AC can be sold for $25. Either intermediate product can
be processed further. It costs $2,000 to convert 300 pounds of V7 into 240 pounds of V7HX.
Likewise, it costs $1,500 to convert 400 pounds of AC into 320 pounds of AC92. Each pound
of V7HX can be sold for $50, and each pound of AC92 can be sold for $45. The $22,000–batch
cost is allocated to the two intermediate products using pounds.
Required:
a. Prepare a financial statement assuming V7 and AC are sold and not processed
further. Calculate the profit per batch of each intermediate product that includes the
allocated batch cost.
continued
ManagerialApplication:Joint Costs inSawmills
Processing a sawlog produces joint products: center boards, side boards, chips, and sawdust.The split-off point in sawmilling is where the sawlog is divided into these four joint prod-ucts. A variety of joint cost allocation schemes are used in practice, and each method yieldsdifferent costs for each product. In sawmilling, sales prices at the split-off point are usuallynot available, because the main products (i.e., center boards and side boards) are usually notsold without further processing. Many saw mills use physical measurement methods suchas weight or volume to allocate the joint costs. These joint costs affect a product’s profitabil-ity, transfer pricing decisions, and inventory valuation. For example, in the event of a fire,the loss covered by insurance will depend on the cost allocation method used.
SOURCE: T Tunes, A Nyrud, and B Eikenes, “Joint Cost Allocation in the Sawmilling Industry,” Forest Journal Products,March, 2008.
zim36725_ch08_347-408.qxd 12/15/09 2:02 PM Page 369

370 Chapter 8
V7HX AC92
Total revenue of intermediate product $10,500 $10,000
Selling price of final product $ 50 $ 45Number of final product pounds 240 320
Total revenue of final product $12,000 $14,400Cost of further processing $ 2,000 $ 1,500
Profit of further processing $10,000 $12,900
Incremental profit of further processing versus selling the intermediate product ($ 500) $ 2,900
V7HX AC92 Total
Sales of intermediate product $10,500 $10,500Sales of final product $14,400 14,400Cost of further processing (1,500) (1,500)Joint cost (22,000)
Total profit per batch $ 1,400
b. If neither V7 nor AC is processed further, should New View produce V7 and AC?
c. Should New View further process V7 into V7HX and/or AC into AC92? Justify your
answer with supporting calculations.
Solution:
a. Profits from producing just the intermediate products:
V7 AC
Selling price of intermediate product $ 35 $ 25Number of intermediate pounds � 300 � 400
Total revenue of intermediate product $10,500 $10,000Allocated joint cost* $ 9,429 $12,571
Product line profit (loss) $ 1,071 ($ 2,571)
*$9,429 � $22,000 � (300 � 700); $12,571 � $22,000 � (400 � 700).
b. New View should not produce the intermediate products, because the total revenue of
the two intermediate products ($10,500 � $10,000 � $20,500) is less than the joint
batch cost of $22,000.
c. New View should sell V7 as an intermediate product and further process AC into
AC92. This yields total net cash flow per batch of $1,400 ($10,500 � $14,400 �
$22,000 � $1,500). The table below calculates the incremental cash flow of further
processing each product.
zim36725_ch08_347-408.qxd 12/15/09 2:02 PM Page 370

Cost Allocation: Practices 371
Often, a manufacturing process, besides producing joint products (fillets, drumsticks, andwings), also yields by-products (gizzards and feet). These are joint products that have smallcommercial value or are not the primary products of the joint production process. Since man-agement does not think of the by-products as being a managed part of the business, the salesrevenue derived from them is subtracted from the joint costs. For example, suppose the by-products from each chicken (gizzard and feet) are sold for $0.07 and each chicken costs $1.67.Instead of treating the by-products as joint products and calculating a product line profit mar-gin, management simply subtracts the $0.07 by-product revenue from the gross chicken costof $1.67 to get the net chicken cost of $1.60. The net joint costs are then allocated to the jointproducts. This procedure allows management to focus on the major products being produced.
Managers producing joint products must make two different, but interrelated, decisions:(1) which joint products to further process (and what prices to charge for them) and (2) giventhe answers in (1), whether to process any joint inputs (and how many). In step 1, managersdecide whether to further process each joint product. A joint product should be furtherprocessed if its final sales price exceeds the additional processing cost plus its unprocessedsales value. Chicken wings should be processed further because their selling price of $0.30exceeds the $0.16 additional processing cost (unprocessed wings have no value). Noticethese decisions regarding further processing do not require any costs to be allocated.
In step 2, managers decide how many joint inputs (if any) to process. Here managerswant to continue processing joint inputs (chickens) as long as the sum of the joint products’NRVs exceeds all the costs up to and including the split-off point. The analysis in step 1determines the profit-maximizing mix of joint products. If the sum of the NRVs doesn’tcover the cost of the joint input plus the cost of operating the split-off point, don’t produce.If the cost of chickens increases to $2.55, and the selling prices of the chicken parts remainthe same, then the sum of the NRVs of $2.50 does not cover the cost of the chicken, and nochickens should be processed. Again, notice that cost allocations (even using NRV to allo-cate joint costs) play no role in making this decision.
Managers can make all the decisions regarding joint products without resorting to costallocations. Joint cost allocations are not needed for decision making. Hence, given the per-vasiveness of joint cost allocations, they must be serving other purposes such as inventoryvaluation for taxes and financial reporting or control.
Any joint cost allocation scheme other than net realizable value can lead to erroneousdecisions regarding eliminating joint products. However, this does not mean that NRV isthe best way of allocating joint costs. For the specific decision to eliminate a product, NRVis best because other allocation schemes distort the incremental profitability of the productor division. However, an allocation scheme other than NRV can be better for controllingagency problems. For example, NRV is a noninsulating allocation scheme in which eachjoint product’s profitability depends on the other’s profits (Chapter 7).
3. DecisionMaking andControl
ManagerialApplication:British Rail
After an analysis of profits by the various individual rail lines composing British Rail,management concluded that certain short trunk lines were unprofitable on a fully allo-cated cost basis. But after the unprofitable lines were closed, profits actually fell. Care-ful review of the facts revealed that labor was being charged to each rail line based onthe amount of labor cost used on each line. But labor was a fixed, common cost. Laborunion contracts prevented management from laying off employees when rail lines wereclosed. These employees were reassigned. Therefore, when lines were closed, revenuesfell but the allocated common costs remained.
zim36725_ch08_347-408.qxd 12/15/09 2:02 PM Page 371

372 Chapter 8
Consider the case of an oil refinery producing gasoline and jet fuel, sold by two sepa-rate profit centers. If refinery costs, including the cost of crude oil, are assigned to the twoprofit centers using NRV, the relative profitability of each profit center is not distorted. Sup-pose the airline industry is expanding and the price of jet fuel rises relative to gasoline. Thejet fuel profit center’s NRV increases, as does its share of the joint costs. Likewise, gasoline’sshare of the joint costs falls and the allocated joint cost per gallon of gasoline falls. With alower cost per gallon of gasoline, the gasoline division might try to expand output by lower-ing price. But the opportunity cost of a gallon of gasoline is not lower; in fact, it is likely tobe higher to the extent that the refining process allows some substitution between jet fueland gasoline production. Allocating the joint refinery costs using a physical measure such asgallons or pounds insulates each division from price fluctuations in the other division. Netrealizable value is better for product line profitability decisions but may not be best for otherdecisions such as pricing or control. Management usually must trade off decision makingand control. A single cost allocation procedure is unlikely to be best for both.
The discussion of joint products highlights the problems of assessing product line prof-itability when the profits include allocated joint costs. Only NRV allocations do not distortproduct line profitability. The same cautions apply to assessing product line profits thatcontain allocated common costs. Companies can make major strategic decision errors ifthey focus on product line profits after joint or common costs are allocated using anythingother than net realizable value.
Q8–6 What are joint costs? How do they differ from commoncosts?
Q8–7 Describe some methods for allocating joint costs.
Q8–8 What are the advantages and disadvantages of the netrealizable method of allocating joint costs?
E. Segment Reporting and Joint BenefitsChapter 7 described insulating versus noninsulating allocations within the context ofreporting the profitability of business segments. This section expands on some additionalissues involved in segment reporting.
Consider the modem and disk drive divisions, which share a common cost. Some man-agers and accountants argue that each business segment report should be separated into thoseexpenses that are controllable by the division and those expenses that are not controllable, butrather are allocated to the division. The following table illustrates sigment reporting.
April
Modem Disk Drive Division Division
Division revenues $98,000 $103,000Division controllable expenses 96,000 104,100
Controllable segment margin $ 2,000 $ (1,100)Allocated common costs* (700) (300)
Net income $ 1,300 $ (1,400)
*Allocated based on square footage (70 percent to Modem and 30 percent to Disk Drive).
ConceptQuestions
zim36725_ch08_347-408.qxd 12/15/09 2:02 PM Page 372

Cost Allocation: Practices 373
In this statement the modem division is contributing $2,000 toward covering commoncosts whereas the disk drive division is losing $1,100 before any common costs are allo-cated to the segment. Proponents of separating controllable from noncontrollable segmentexpenses believe this format is more informative of segment performance. Since segmentscannot control common costs, they should not be held responsible for them. If a segment iscontributing a positive contribution toward the common costs, it should be retained. This is,again, another application of the controllability principle. It is similar in spirit to the argu-ment that fixed costs should be ignored in setting transfer prices and that joint costs areirrelevant in assessing product profitability.
Unfortunately, simple rules of thumb like dropping segments with negative controllablesegment margins can be wrong in some situations. Consider the following examples. Sup-pose a segment such as the modem division in the above table has a positive net income af-ter all common cost allocations. Should it be retained? Not necessarily. The modem divisioncould be producing very low-quality modems that are adversely affecting the demand for thedisk drives. Or the modem division might be consuming so much of the attention of seniormanagement that the other segments are suffering. In both of these cases, an apparently prof-itable segment based on its accounting statements should be dropped.
Now consider the example of a segment with a negative controllable segment marginsuch as the disk drive division. It appears this division should be dropped. Should it? Notnecessarily. Suppose that the demand for disk drives and the demand for modems dependon each other because it is cheaper for customers to deal with one supplier of both diskdrives and modems than two separate suppliers. Dropping either product adversely affectsthe demand for the other. The accounting segment report does not capture these interdepen-dencies in demand.
In general, firms produce multiple products because there are synergies—in either pro-duction or demand. In Chapter 4 we argued that firms exist because they lower certaintransactions costs below what it would cost to acquire equivalent goods or services in a se-ries of market transactions. Firms have multiple segments because of synergies among seg-ments. These synergies are “joint benefits” that are usually difficult to quantify, let aloneallocate. Like joint costs, they cannot be allocated to segments in any meaningful way.Firms prepare segment reports as performance measures to help reduce agency costs. Butto the extent there are large interdependencies among segments, these joint benefits makeit very difficult to use the segment reports to decide which segments to drop without fur-ther analysis.
F. SummaryThis chapter continues the cost allocation discussion begun in the previous chapter. Cost allocationscan create a death spiral. The death spiral is a perverse problem that arises when (1) allocated costscontain fixed costs and (2) users reduce their demand for a service department in response to a highallocated cost. As usage falls, total costs do not fall proportionately because of the fixed costs. Thiscauses the costs allocated to the remaining users to rise further, and the remaining users will seek tooutsource the service to less expensive external vendors.
Two specific cost allocation situations are described: multiple service departments and jointcosts. When the costs of several service departments are allocated to operating divisions, wide varia-tions in transfer prices can result depending on how the service department costs are allocated and theorder in which they are allocated if a step-down method is used. These variations in transfer price canthen cause user departments to alter their consumption of service department resources.
Joint costs arise whenever a single joint input such as a barrel of oil is split into several jointproducts such as gasoline, motor oil, and jet fuel. Beware of all product line profitability studies that
zim36725_ch08_347-408.qxd 12/15/09 2:02 PM Page 373

374 Chapter 8
rely on allocated joint or common costs, unless these costs are allocated using net realizable value(revenues less the costs beyond the split-off point).
Chapters 9 through 13 expand the discussion begun in Chapters 7 and 8 by describing how costsare allocated to products. If a plant produces multiple products, the cost of each product must be com-puted for tax, inventory valuation, and decision management and control reasons. Chapters 9 through13, based on the introductory material in Chapters 7 and 8, describe a number of complexities thatarise in product costing within a manufacturing setting.
Appendix: Reciprocal Method for Allocating Service Department CostsSection C of this chapter described various ways of allocating service department costs to operatingdivisions, including the direct allocation and step-down allocation methods. The reciprocal methodwas discussed, but its exact calculation was deferred to this appendix. To simplify the discussion, startby assuming that all costs in the service departments are variable.
When each service department uses the other service departments, the allocation of one servicedepartment’s cost to another service department depends on the simultaneous utilization of eachdepartment. A simultaneous system of equations is needed to account for the reciprocal use amongservice departments. To illustrate the reciprocal method, the example of the telecommunications andinformation technology (IT) departments will be continued. Table 8–13 provides the computations ofthe reciprocal method.
The reciprocal method operates in two steps. The first step focuses on the interactions among theservice departments (ignoring the operating divisions) and develops a total charge for each servicedepartment. The second step takes the total charge and allocates it across the service departments andoperating divisions. The first two lines in Table 8–13 repeat the utilization percentages by usersreported in Table 8–1. These utilization percentages among the service departments are used to forma system of two equations with two unknowns (see the footnote to the table). The total cost, T, ofoperating the telecommunications department includes telecommunication’s own cost ($2.0) plus aproportion of its own cost and IT’s costs and is given by the following equation:
T � Initial cost incurred � 0.10T � 0.25I
The initial cost in the telecommunications department is $2 million, which allows this equation to bewritten as
T � $2.0 � 0.10T � 0.25I
Likewise, the total IT cost assigned, I, is given by the following equation:
I � $6.0 � 0.20T � 0.15I
We have two equations with two unknowns. Using some simple algebra outlined in Table 8–13, wecan solve for the two unknowns:
T � $4.475 million
I � $8.112 million
The second step of the reciprocal method allocates these revised total costs to all the servicedepartments and operating divisions using the utilization rates in Table 8–13. The resulting alloca-tions are also shown in the table. Using these allocations, a charge per phone and cost per line printedare computed. Each department and each division pays the same per phone and line printed.
It is important to understand the relation between the initial cost of the service department and thetotal cost to be assigned using the reciprocal method. Telecommunications incurs costs of $2 million,
zim36725_ch08_347-408.qxd 12/15/09 2:02 PM Page 374

Cost Allocation: Practices 375
yet $4.475 million is being allocated. The reason that more is being allocated than incurred is becausesome of the allocated costs are assigned to the service departments. In order for all $2 million oftelecommunications costs to be allocated to the operating divisions, the total allocated has to be in-creased by the amount that is charged to the service departments.
So far the reciprocal method has been described as a system of two equations with two un-knowns. Solving the two equations was straightforward: One equation was substituted into the other
TABLE 8–13 Reciprocal Method of Allocating Service Department Costs to Operating Divisions ($ in Millions)
Service DepartmentsOperating Divisions
InformationTelecommunications Technology Cars Trucks Total
Department providing service:Telecommunications 10% 20% 40% 30% 100%IT 25% 15% 35% 25% 100%
Department costs before allocation of service costs $ 2.000 $ 6.000 $ 8.000
Service department allocated costs:Telecommunications $(4.475)* $(4.475)
$ 0.448 $ 0.895 $1.790 $1.343 $ 4.475IT $(8.112)* $(8.112)
$ 2.028 $ 1.217 $2.839 $2.028 $ 8.112
Total overhead allocated $ 0.000 $ 0.000 $4.629 $3.371 $ 8.000
Overhead allocations bases:Allocated telecommunications costs $ 0.448 $ 0.895 $1.790 $1.343 $ 4.475� Number of phones 300 600 1,200 900 3,000
Cost per phone $ 1,492 $ 1,492 $1,492 $1,492 $ 1,492
Allocated IT costs $ 2.028 $ 1.217 $2.839 $2.028 $ 8.111� Number of lines printed (millions) 3.0 1.8 4.2 3.0 12.0
Cost per line printed $ 0.676 $ 0.676 $0.676 $0.676 $ 0.676
*Two simultaneous equations with two unknowns must be solved:
LetT � Total cost to be assigned from telecommunicationsI � Total cost to be assigned from information technologyT � Initial cost incurred � 0.10T � 0.25IT � $2.0 � 0.10T � 0.25I (1)I � Initial cost incurred � 0.20T � 0.15II � $6.0 � 0.20T � 0.15I (2)
Solve equations (1) and (2). Start with equation (1) and collect terms:
0.9 T � $2.0 � 0.25 IT � $2.0�.9 � (.25�.9) IT � $2.222 � 0.278I (3)
Now substitute the preceding equation into equation (2) and solve for I:
I � $6.0 � 0.20 ($2.222 � 0.278I) � 0.15II � $6.0 � 0.444 � 0.056I � 0.15I
0.749 I � $6.444I � $8.112
Substitute the value of I � $8.112 into equation (3) and solve for T:
T � $2.222 � 0.278($8.112) (4)T � $2.222 � $2.253T � $4.475
zim36725_ch08_347-408.qxd 12/15/09 2:02 PM Page 375

376 Chapter 8
in order to solve for the remaining unknown. If there are more than three or four service divisions,this simple technique becomes very burdensome. At this point, some matrix algebra becomes quiteuseful. First, rewrite equations (1) and (2) in Table 8–13’s footnote as
�0.90T � 0.25I � 2
�0.20T � 0.85I � 6
Next, express these equations in matrix form:
Solving for the unknown vector gives
The �1 over the two-by-two matrix indicates the inverse matrix. Most spreadsheet programs havefunctions to compute the inverse of a matrix.
Substituting the solution of the inverse into the preceding equation and solving yields the samesolution as in Table 8–13,
The preceding analysis assumes that all the service department costs ($2 million and $6 million)are variable. If the service department costs contain any fixed costs, only the variable cost portion isallocated using the simultaneous solutions method. The fixed costs can be allocated based on plannedusage.
Self-Study ProblemMedical Center
Eastern University has a medical center consisting of a medical school and a hospital. The primaryfunction of the medical school is education. To accomplish this mission, the hospital provides teach-ing opportunities for medical students and residents. In addition, important research is conducted.Attracting top medical school faculty requires resources: good colleagues, good students, good re-search facilities, and competitive salaries. All faculty are expected to teach, conduct research, andprovide medical care to patients. Good teaching requires knowledge of research and how to providequality patient care. Patient care is enhanced by having faculty doing state-of-the-art research. Re-search is stimulated by inquisitive, bright students and actual patient cases. While the mix of activ-ities varies substantially across faculty, a study of their time utilization reported the followingaverages:
BTIR = B4.475
8.112R
B +0.90 -0.25-0.20 +0.85
R-1
= B1.19 0.28
0.351.26R
BTIR = B +0.90 -0.25
-0.20 +0.85R-1
B26R
B +0.90 -0.25
-0.20 +0.85R BT
IR = B2
6R
zim36725_ch08_347-408.qxd 12/15/09 2:02 PM Page 376

Cost Allocation: Practices 377
% of TimeDevoted to
Teaching 30%Patient care 25Research 45
Recent pressures to reduce hospital costs have caused the medical center to take a close look atits cost structure. In particular, hospital administrators have become concerned that they are at a com-petitive disadvantage with nonteaching hospitals that do not provide extensive teaching and researchfacilities. They have collected data on the medical center’s operating revenues and expenses for thelast fiscal year.
Medical Center Operating Revenues and (Expenses), Last Fiscal Year (Millions)
Direct patient care expenditures (nursing, pharmacy, laundry, etc.)* $(297)Direct research expenses (research supplies, lab technicians, etc.)* (50)Faculty salaries and benefits (140)Income from endowment 22Medical school admissions and administration expenditures (33)Medical school tuition 82Occupancy costs (utilities, maintenance, security, etc.)† (80)Patient revenues 370Sponsored research funding 127
*Excludes faculty salaries.†Square footage utilized:
Hospital 250,000
Medical school 50,000
Research labs 100,000
To help offset the high cost of medicine, the medical center solicits donations. The vast major-ity of the donations received are not specifically restricted to teaching, research, or hospital activities.Rather, most of the gifts are for the unrestricted use of the medical center. These contributions are in-vested in an endowment and the annual income from the endowment is a source of operating fundsfor the medical center.
Required:
a. Prepare a financial statement that reports separately the operating performance of teaching,research, and patient care for the medical center. Explain and justify any assumptions youmake in preparing the statement.
b. Evaluate how accurately the report you have prepared reflects the financial performanceof the three functions: teaching, research, and patient care. What inferences do you drawfrom your report in (a)?
Solution:
a. This question illustrates the fundamental problems of trying to draw inferences about theprofitability of joint products. The medical center produces three joint products: teaching,research, and patient care. All three are provided by the same organization rather than threeseparate organizations because synergies exist among the three. In addition to joint costs(faculty salaries), there are joint benefits (endowment income). Any attempt to try toallocate the joint costs (faculty salaries) and joint benefits (endowment income) is likely tolead to misleading inferences.
zim36725_ch08_347-408.qxd 12/15/09 2:02 PM Page 377

378 Chapter 8
One way of evaluating performance is to allocate the faculty salaries based on timeutilization. The occupancy costs are probably not entirely joint or common costs and thesecan be assigned based on square footage. Allocating the endowment income is problematicand arbitrary. There is no completely rational basis for allocating these joint benefits. Theaccompanying table allocates endowment income based on the same percentages used toallocate the faculty salaries. This assumes that what ultimately drives gifts to the medicalcenter is the same as what drives the joint costs.
Medical Center Operating Performance by Function, Last Fiscal Year (Millions)
Teaching Research Hospital Total
Revenue $82 $127 $370 $579Direct expenses 33 50 297 380Faculty salaries 42 63 35 140Occupancy costs 10 20 50 80
Surplus (deficit) before endowment $ (3) $ (6) $ (12) $ (21)Endowment income* 7 10 6 22
Surplus (deficit) $ 4 $ 4 $ (7) $ 1
*Allocated based on faculty salaries. Numbers do not add to total because of rounding.
It is important to note that, after including the endowment income of $22 million, themedical center actually had a surplus of $1 million.
We see from the above table that all three functions are operating at a deficit beforeendowment income. But it appears that the hospital is losing the most money, $12 millionout of the total $21 million deficit. After considering the endowment income, teaching andresearch are both showing a surplus and the hospital is showing a loss.
If the endowment income is allocated based on total revenues, teaching breaks even,research reports a $1 million deficit, and the hospital reports a $2 million surplus. Forpublic relations and fund-raising purposes, the medical center would probably not want thehospital to report a surplus. Thus, endowment income would most likely not be allocatedbased on revenues.
b. One problem with the previous table is that it produces misleading product line profitabilityinformation. Because faculty salaries are a joint cost, any attempt to allocate these costs usingother than net realizable values can be misleading. The following table recasts the precedingtable using NRV as the allocation base for both faculty salaries and endowment income.
Medical Center Operating Performance by Function Net Realizable Value Method, Last Fiscal Year (Millions)
Teaching Research Hospital Total
Revenue $82 $127 $370 $579Direct expenses 33 50 297 380Occupancy costs 10 20 50 80
Net realizable value $39 $ 57 $ 23 $119% NRV 33% 48% 19% 100%Joint costs* 39 57 23 118
Surplus (deficit)† $ 0 $ 0 $ 0 $ 1
*Faculty salaries less endowment income.†Numbers do not add to total because of rounding.
zim36725_ch08_347-408.qxd 12/15/09 2:02 PM Page 378

Cost Allocation: Practices 379
The results in this table indicate that all three activities are contributing cash flowstoward covering the joint costs. Research appears to be providing the most cash flows at$57 million. However, even this table is misleading in one important aspect.
None of the three functions (teaching, research, and patient care) is separable from the others. Unlike the chicken example in the text, where the firm can decide to furtherprocess a chicken part, the medical center does not have this option. Closing the hospitalwill have a large impact on the demand for teaching services. Few top students will attenda medical school that does not offer clinical experience. Since the demand for the threefunctions is interdependent, changing the scale of one function affects the revenues of the others. This would be equivalent to the case in which the demand for chicken filletsdepends on the availability of wings. If supermarkets want to offer their customers bothfillets and wings and will only buy from chicken processors who offer a full product line, then eliminating one chicken part reduces the demand for the other parts. Thisinterdependency among demands is a primary reason that the medical center offers allthree services. It also renders any attempt to disaggregate the firm into separate subunitsfor decision-making purposes a dangerous exercise.
While it is tempting to provide a disaggregated product line performance report, suchan exercise provides very little insight. The medical center is generating a small surplus of$1 million. The source of this surplus cannot be attributable to any one of the threefunctions because demands for the service and the production functions of each service areso highly interdependent.
The financial performance of each function is probably best measured by comparingeach unit’s actual costs and revenues with budgeted costs and revenues estimated prior to thestart of the fiscal year.
ProblemsP 8–1: Step-Down
Critically evaluate the statement:
The step-down method is better than the direct allocation method because at least the step-downmethod captures on average half of the service flows between service departments. By compar-ison, the direct allocation method ignores all the service flows.
P 8–2: Outback Opals
Outback Opals mines and processes opals from its Australian opal mines. The process consists ofremoving large chunks of stones, carefully splitting the stones and removing the opals, and then cut-ting and polishing the stones. Finally, the opals are sorted and graded (I, II, and III). The Grade Iopals are sent to Outback’s U.S. subsidiary for sale in the United States. The Graded II opals are soldthrough Outback’s Hong Kong subsidiary in Hong Kong, and the Grade III opals are sold inAustralia. It costs A$35,000 to mine, cut, polish, and sort a batch of opals. The following table sum-marizes the number of stones in each batch mined, the additional costs to package and sell each stoneafter it is polished and graded, the selling price of each grade of stone (in Australian dollars), and theincome tax rates that apply to any income derived from stones sold in the country of final sale.
Grade I Grade II Grade III
Number of stones per batch 70 105 175Additional costs to package and sell each stone A$250 A$120 A$5Selling price per stone A$800 A$300 A$110Income tax rate 30% 15% 45%Country of final sale U.S. Hong Kong Australia
zim36725_ch08_347-408.qxd 12/15/09 2:02 PM Page 379

380 Chapter 8
Required:
a. Calculate the joint cost per stone of each grade of opal (I, II, and III) using the number ofstones in each batch to allocate the A$35,000 joint mining, cutting, polishing, and sortingcosts. (Round all decimals to four significant digits.)
b. Calculate the joint cost per stone of each grade of opal (I, II, and III) using the net realizablevalue of each grade of stones (before taxes) to allocate the A$35,000 joint mining, cutting,polishing, and sorting costs. (Round all decimals to four significant digits.)
c. Which method of allocating the joint cost of A$35,000 (number of stones or net realizablevalue) should Outback Opals use? Explain why.
P 8–3: Rose Hospital
Rose Hospital has two service departments (building services and food service), and three patientcare units (intensive care, surgery, and general medicine). Building Services provides janitorial, main-tenance, and engineering services as well as space (utilities, depreciation, insurance, and taxes) to alldepartments and patient care units. Food Service provides meals to both patients and staff members.It operates a cafeteria and serves meals to patients in their rooms. Building services costs of $6 millionare allocated based on square footage, and food service costs of $3 million are allocated based onnumber of meals served. The following two tables summarize the annual costs of the two service de-partments and the utilization of each service department by the other departments.
Annual Cost*
(Millions)
Building Services $6.0Food Service 3.0
Total overhead $9.0
*Before allocated service department costs
Utilization Patterns
Allocation Building Food Intensive General Base Services Service Care Surgery Medicine Total
Building SquareServices footage 2,500 15,500 10,000 20,000 40,000 88,000FoodService Meals 12,000 10,000 3,000 4,000 98,000 127,000
The following table summarizes the allocation of service department costs using the step-downmethod with Food Service as the first service department to be allocated:
Step-Down Method(Food Service First)
(Millions)
Intensive General Care Surgery Medicine
Food Service $0.09 $0.09 $2.52Building Services 0.88 1.83 3.59
Total $0.97 $1.92 $6.11
zim36725_ch08_347-408.qxd 12/15/09 2:02 PM Page 380

Required:
(Round all allocation rates and all dollar amounts to two decimal places.)
a. Allocate the two service department costs to the three patient care units using the directmethod of allocating service department costs.
b. Same as (a) except use the step-down allocation method with Building Services as the firstservice department allocated.
c. Write a short, nontechnical memo to management explaining why the sum of the twoservice department costs allocated to each patient care unit in (b) differs from the sum ofthe costs computed using the step-down method starting with Food Service.
P 8–4: Mystic Herbals
Mystic Herbals processes exotic plant materials into various fragrances and biological pastes used byperfume and cosmetic firms. One particular plant material, Xubonic root from the rain forest inAustralia, is processed yielding four joint products: QV3, VX7, HM4, and LZ9. Each of these jointproducts can be sold as is after the joint production process or processed further. The following tabledescribes the yield of each joint product from one batch, the selling prices of the intermediate andfurther processed products, and the costs of further processing each joint product. The joint cost ofprocessing one batch of Xubonic root is $30,000.
QV3 VX7 HM4 LZ9
Number of ounces per batch 100 80 125 195Cost of further processing $2,400 $400 $2,500 $2,800Selling price of unprocessed
intermediate product per ounce $62 $49 $102 $47Selling price of final product after
further processing per ounce $85 $57 $127 $61
Required:
a. Allocate the $30,000 joint cost per batch to each of the joint products based on the numberof ounces in each joint product.
b. To maximize firm value, which of the joint products should be processed further andwhich should be sold without further processing?
c. Based on your analysis in part (b) regarding the decisions to process further or not, shouldMystic Herbals process batches of Xubonic root into the four joint products? Support yourdecision with a quantitative analysis and indicate how much profit or loss Mystic Herbalsmakes per batch.
d. Suppose the joint cost of $30,000 is allocated using the net realizable value of each jointproduct. Calculate the profits (loss) per joint product after allocating the joint cost usingnet realizable value.
e. Explain how the use of joint cost allocations enhances or harms the decision to processjoint products.
P 8–5: Fidelity Bank
Fidelity Bank has five service departments (telecom, information management, building occupancy,training & development, and human resources). The bank uses a step-down method of allocating ser-vice department costs to its three lines of business (retail banking, commercial banking, and creditcards). The following table contains the utilization rates of the five service departments and threelines of business. Also included in this table are the direct operating expenses of the service depart-ments (in millions of dollars). Direct operating expenses of each service department do not contain
Cost Allocation: Practices 381
zim36725_ch08_347-408.qxd 12/15/09 2:02 PM Page 381

382 Chapter 8
any allocated service costs from the other service departments. For example, telecom spent $3.5 mil-lion dollars and provided services to other units within Fidelity Bank. Information management con-sumed 15 percent of telecom’s services. The order in which the service departments are allocated isalso indicated in the table. The telecom department costs are allocated first, followed by informationmanagement, and the costs of the human resources department are allocated last.
FIDELITY BANKUtilization Rates and Direct Operating Expenses of the Service Departments
(Dollars in Millions)
Service Departments Lines of Business
Direct Tele- Info. Building Training Human Retail Comm. CreditOp. Exp. com Mgmt Occ. & Dev. Res. Banking Banking Cards
1. Telecom $3.5 — 0.15 0.05 0.05 0.05 0.20 0.15 0.352. Information Mgmt. 9.8 0.20 — 0.05 0.10 0.10 0.20 0.20 0.153. Building Occupancy 6.4 0.05 0.10 — 0.05 0.10 0.50 0.10 0.104. Training & Dev. 1.3 0.15 0.15 0.05 — 0.05 0.10 0.30 0.205. Human Resources 2.2 0.10 0.10 0.20 0.05 — 0.20 0.20 0.15
Required:
a. Using the step-down method and the order of departments specified in the table, what isthe total allocated cost from information management to credit cards, including all thecosts allocated to information management?
b. Information management costs are allocated based on gigabytes of hard disk storage usedby the other service departments and lines of business. If, instead of being second in thestep-down sequence, information management became fifth in the sequence, would theallocated cost per gigabyte increase or decrease? Explain precisely why it increases ordecreases.
c. If instead of using the step-down method of allocating service department costs, Fidelityuses the direct allocation method, what is the total allocated cost from informationmanagement to credit cards, including all the costs allocated to information management?(Note: Information management remains second in the list.)
P 8–6: Joint Products, Inc.
Joint Products, Inc., produces two joint products, X and V, using a common input. These are producedin batches. The common input costs $8,000 per batch. To produce the final products (X and V),additional processing costs beyond the split-off point must be incurred. There are no beginninginventories. The accompanying data summarize the operations.
Products
X V
Quantities produced per batch 200 lbs. 400 lbs.Additional processing costs per batch
beyond split-off $1,800 $3,400Unit selling prices of completely
processed products $40/lb. $10/lb.Ending inventory 2,000 lbs. 1,000 lbs.
Required:
a. Compute the full cost of the ending inventory using net realizable value to allocate joint cost.
zim36725_ch08_347-408.qxd 12/15/09 2:02 PM Page 382

Cost Allocation: Practices 383
b. If the selling prices at the split-off point (before further processing) are $35 and $1 perpound of X and V, respectively, what should the firm do regarding further processing?Show calculations.
P 8–7: Talor Chemical Company
Talor Chemical Company is a highly diversified chemical processing company. The company manu-factures swimming pool chemicals, chemicals for metal processing companies, specialized chemicalcompounds for other companies, and a full line of pesticides and insecticides.
Currently, the Noorwood plant is producing two derivatives, RNA–1 and RNA–2, from thechemical compound VDB, developed by Talor’s research labs. Each week 1.2 million pounds of VDBare processed, at a cost of $246,000, into 800,000 pounds of RNA–1 and 400,000 pounds of RNA–2.The proportion of these two outputs is fixed. RNA–1 has no market value until it is converted into aproduct with the trade name Fastkil. The cost to process RNA–1 into Fastkil is $240,000 a week.Fastkil wholesales at $50 per 100 pounds.
RNA–2 is sold as is for $80 per 100 pounds. However, Talor has discovered that RNA–2 can beconverted into two new products through further processing, which would require the addition of400,000 pounds of compound LST to the 400,000 pounds of RNA–2. The joint process would yield400,000 pounds each of DMZ–3 and Pestrol, the two new products. The additional raw material andrelated processing costs of this joint process would be $120,000 per week. DMZ–3 and Pestrol wouldeach be sold for $57.50 per 100 pounds. Talor management has decided not to process RNA–2 fur-ther, based on the analysis presented in the following schedule. Talor uses the physical weight methodto allocate the common costs arising from joint processing.
Process Further
RNA–2 DMZ–3 Pestrol Total
Production in pounds 400,000 400,000 400,000
Revenue $320,000 $230,000 $230,000 $460,000
CostsVDB costs $ 82,000 $ 61,500 $ 61,500 $123,000Additional raw materials
(LST) and processingof RNA–2 — 60,000 60,000 120,000
Total costs $ 82,000 $121,500 $121,500 $243,000
Weekly gross profit $238,000 $108,500 $108,500 $217,000
A new staff accountant who was to review the analysis commented that it should be revised andstated, “Product costing of products such as these should be done on the basis of net relative salesvalue, not on a physical volume basis.”
Required:
a. Discuss whether the use of the net relative sales value method would provide data morerelevant for the decision to market DMZ–3 and Pestrol.
b. Critique Talor Company’s analysis and make any revisions that are necessary. Your critiqueand analysis should indicate
(1) Whether Talor has made the correct decision.
(2) The gross savings (loss) per week of Talor’s decision not to process RNA–2 further, ifdifferent from the company-prepared analysis.
SOURCE: CMA adapted.
zim36725_ch08_347-408.qxd 12/15/09 2:02 PM Page 383

384 Chapter 8
P 8–8: Donovan Steel
Donovan Steel has two profit centers: Ingots and Stainless Steel. These profit centers rely on servicessupplied by two service departments: electricity and water. The profit centers’ consumption of theservice departments’ outputs (in millions) is given in the following table:
Service Departments Profit Centers
Service StainlessDepartments Electricity Water Ingots Steel Total
Electricity 2,500 kwh 2,500 kwh 3,000 kwh 2,000 kwh 10,000 kwhWater 1,000 gal. 800 gal. 1,000 gal. 2,000 gal. 4,800 gal.
The total operating costs of the two service departments are
Electricity $ 80 millionWater 60 million
Total cost $140 million
Required:
a. Service department costs are allocated to profit centers using the step-down method. Wateris the first service department allocated. Compute the cost of electricity per kilowatt-hourusing the step-down allocation method.
b. Critically evaluate this allocation method.
P 8–9: Murray Hill’s Untimely Demise
Murray Hill was preparing the monthly report that allocates the three service department’s (A, B, andC) costs to the three operating divisions (D1, D2, and D3) when he choked to death on a stale doublecream-filled donut. You must step in and complete his step-down allocations. The three servicedepartments (A, B, and C) have costs (before any cost allocation) of:
Service Service Department’sDepartment Own Cost
A $600,000B 300,000C 200,000
The following table provides the percentage of utilization of each service department by the otherservice departments and the operating departments:
Service Departments Operating Departments
A B C D1 D2 D3
A 5% 10% 20% 30% 15% 20% 100%B 8 0 15 22 20 35 100C 15 5 7 20 30 23 100
zim36725_ch08_347-408.qxd 12/16/09 9:27 AM Page 384

Cost Allocation: Practices 385
The step-down sequence is A, B, then C.Poor Murray allocated only A’s costs before the donut did him in. His incomplete spreadsheet is:
ServiceDepartment
Service Departments Operating Departments
Cost A B C D1 D2 D3
$600,000 A $0 $63,158 $126,316 $189,474 $94,737 $126,316BC
Required:
a. Do Murray proud and complete the incomplete spreadsheet. Like Murray, round all costallocations to the nearest dollar.
b. If the company wants the cost allocations to most accurately capture the opportunity costof resources consumed by the operating divisions, how should the service departments beordered in the step-down method?
P 8–10: Enzymes
Two genetically engineered enzymes are produced simultaneously from a series of chemical andbiological processes: Q enzyme and Y enzyme. The cost per batch of Q and Y enzymes is $200,000,resulting in 300 grams of Q and 200 grams of Y. Before Q and Y can be sold, they must be processedfurther at costs of $100 and $150 per gram, respectively. Each batch requires one month of process-ing time and only one batch per month is produced.
The monthly demand for Q and Y depends on the price charged. The following table summarizesthe various price-quantity combinations.
Quantity Price per Price per Sold Gram of Q Gram of Y
50 $1,200 $750100 1,100 550150 1,000 350200 900 150250 800 n.a.300 700 n.a.
In the following analysis, the optimum price of Q is $900 per gram and the optimum priceof Y is $750 per gram.
Quantity Price per Revenue Total Cost Total Price per Revenue Total cost Total Sold Q of Q of Q* Profit Y from Y of Y † Profit
50 $1,200 $ 60,000 $ 25,000 $35,000 $750 $37,500 $ 27,500 $10,000100 1,100 110,000 50,000 60,000 550 55,000 55,000 0150 1,000 150,000 75,000 75,000 350 52,500 82,500 (30,000)200 900 180,000 100,000 80,000 150 30,000 110,000 (80,000)250 800 200,000 125,000 75,000 n.a.300 700 210,000 150,000 60,000 n.a.
*Cost per gram of Q � ($200,000/500) � $100 � $500/gram.†Cost per gram of Y � ($200,000/500) � $150 � $550/gram.
zim36725_ch08_347-408.qxd 12/16/09 9:27 AM Page 385

Required:
a. Critically evaluate the analysis underlying the pricing decisions of $900 for Q and $750 forY.
b. What should management do if the cost per batch rises to $225,000?
P 8–11: Sunder Toys
Sunder manufactures hard rubber pet toys.The purple dog chewy has a variable cost of $3.00 per unit. Itis produced on a machine that is leased.The three models of this machine have three different capacities.
Maximum Daily Daily Lease Capacity (Units) Cost
1,000 $10,0001,200 10,8001,400 11,200
The daily market demand for purple dog chewies at various prices is:
Daily Quantity Price Demanded
$16.11 90015.00 1,00014.18 1,10012.83 1,20012.23 1,30011.50 1,400
There is no uncertainty (daily variation) with respect to the daily demand for purple dog chewies.For example, if the price is set at $14.18, 1,100 chewies will be sold every day with certainty.
Required:
a. Given all the data, how many purple dog chewies should Sunder produce and sell? (Showcalculations, neatly labeled.)
b. Suppose Sunder has the policy of not charging fixed costs to products whenever excesscapacity exists. The manager of purple dog chewies receives a bonus based on theaccounting profits from purple dog chewies. This manager has private knowledge ofmachine capacities, lease fees, and the demand for purple dog chewies, as well as thedecision rights over how large a machine to lease. How big a machine will the manager leaseand how many chewies will be produced and sold? (Show calculations, neatly labeled.)
c. Comment on Sunder’s policy of not charging fixed costs to products whenever excesscapacity exists.
P 8–12: WWWeb Marketing
WWWeb Marketing is a decentralized firm specializing in designing and operating Internet market-ing Web sites. The firm is four years old and has been growing rapidly, but it only shows a smallprofit. WWWeb has three profit centers: Design Division, Server Operations, and the CrawlerDivision. The Design Division devises Internet marketing strategies for external clients, includinginnovative Web sites and Web-based marketing strategies. Server Operations maintains the clients’Web sites on WWWeb’s servers. The Crawler Division operates WWWeb’s proprietary search engine
386 Chapter 8
zim36725_ch08_347-408.qxd 12/15/09 2:02 PM Page 386

that clients can use for Internet-based marketing research. In addition to these three profit centers,WWWeb has an IT group that maintains WWWeb’s servers and telecommunication lines to theInternet.
The IT group is a cost center. The current annual IT budget is $548,000 for personnel, hardwareand software leases for the servers, and telecommunication costs. The cost of the IT group is notallocated back to the three divisions. The CEO of WWWeb argues that the IT group is a common(shared) resource and is essentially a fixed cost. Adding another client Web site or performing a Websearch does not generate any additional IT cost to the firm because WWWeb’s IT group has excesscapacity. WWWeb’s CEO argues, “Any charge for IT back to the divisions will cause the divisions toavoid using our IT resources. As long as we have unused capacity on our systems we should beencouraging our people to use that capacity.”
WWWeb currently uses about 80 percent of the capacity of its servers, routers, and fiber optichigh speed lines to the Internet. The high speed lines are the “pipes” through which all client serverWeb traffic flows. These high speed lines are also used by WWWeb’s e-mail traffic and the CrawlerDivisions marketing research Web searches. Currently, the IT systems are performing well andWWWeb users experience few delays and minimal interference from other users. However, the threeprofit center managers are projecting growth in their businesses and expect to reach capacity on theirservers and communication lines within the next 12 months. When this happens, the managers pre-dict that they will experience significant service degradation.
Jose Coronas, head of WWWeb’s IT group, has called a meeting of the three division managersto discuss the terrific deals being offered by telecom companies and hardware providers. Given thecurrent slump in the economy, WWWeb can roughly double the capacity of its servers and high speedaccess lines and lock in these low rates for two years. The incremental cost of doubling the IT group’scapacity is to raise its hardware lease costs and access line costs by 20 percent. IT currently spends$18,000 a month on hardware leases and access lines. If it were to double its existing capacity, thetotal monthly cost would rise to $21,600. Mr. Coronas believes his existing IT personnel can handlethe additional server and line capacity. Coronas and the three division managers recommend thatWWWeb acquire the additional capacity and lock in these attractive rates.
Required:
a. Analyze WWWeb’s current policy of how the three divisions are charged for IT costs andwhether WWWeb should acquire the additional capacity.
b. Should WWWeb change its policy of how it charges IT costs to the divisions? If so,what changes would you recommend?
P 8–13: ITI Technology
ITI Technology designs and manufactures solid-state computer chips. In one of the production depart-ments, employees fabricate a six-inch circular wafer by laying down successive layers of silicon andthen etching the circuits into the layers. Each wafer contains 100 separate solid-state computer chips.After a wafer is manufactured, the 100 chips are cut out of the wafer, tested, mounted into protectivecovers, and attached to electrical leads. Then a final quality control test is performed.
The initial testing process consists of successive stages of heating and cooling the chips and test-ing how they work. If 99 percent of a chip’s circuits work properly after the testing, it is classified asa high-density (HD) chip. If between 75 percent and 99 percent of a chip’s circuits work properly, itis classified as a low-density (LD) chip. If fewer than 75 percent of the circuits work, it is discarded.Twenty wafers are manufactured in a batch. On average, 50 percent of each batch are HD, 20 percentare LD, and 30 percent are discarded. HD chips are sold to defense contractors and LD chips to con-sumer electronics firms. Chips sold to defense contractors require different mountings, packaging,and distribution channels than chips sold to consumer electronics firms. HD chips sell for $30 eachand LD chips sell for $16 each.
Each batch of 20 wafers costs $29,100: $8,000 to produce, test, and sort, and $21,100 for mount-ing, attaching leads, and final inspection and distribution costs ($14,500 for HD chips and $6,600 for
Cost Allocation: Practices 387
zim36725_ch08_347-408.qxd 12/15/09 2:02 PM Page 387

LD chips). The $29,100 total cost per batch consists of direct labor, direct materials, and variableoverhead.
The following report summarizes the operating data per batch:
ITI Technology Operating Summary of HD and LD Chips
Total HD Chips LD Chips Scrap
Percentage of chips 100% 50% 20% 30%Revenue $36,400 $30,000* $6,400† $ 0Total costs 29,100 14,550 5,820 8,730
Profit per batch $ 7,300 $15,450 $ 580 $(8,730)
*$30,000 � 50% � 20 wafers � 100 chips per wafer � $30/chip.†$6,400 � 20% � 20 wafers � 100 chips per wafer � $16/chip.
The cost of scrap is charged to a plantwide overhead account, which is then allocated directly tothe lines of business based on profits in each LOB.
Required:
a. Critically evaluate ITI’s method of accounting for HD and LD chips.
b. What suggestions would you offer ITI’s management?
P 8–14: Metro Blood Bank
Metro Blood Bank, a for-profit firm, collects whole blood from donors, tests it, and then separatesit into two components: platelets and plasma. Three pints of whole blood yield two pints of plateletsand one pint of plasma. The cost of collecting the three pints, testing them, and separating themis $300.
The platelets are sold for $165 per pint. But before they are sold they must be packaged andlabeled. The variable cost of this additional processing is $15 per pint. Plasma is sold for $115 perpint after incurring additional variable processing costs of $45 per pint.
The selling prices of the platelets and plasma are set by competitive market forces. The prices ofplatelets and plasma quoted above are the current market prices, but they vary widely depending onsupply and demand conditions. Metro Blood Bank ships its products nationwide to maximize profits.It has three operating divisions: blood collection and processing, platelets, and plasma. Collection andprocessing is a cost center, and platelets and plasma are profit centers.
Neither platelets nor plasma has any commercial value without further processing.
Required:
a. Prepare two statements showing the profits per pint of platelets and plasma with collectionand processing costs assigned using
(1) The number of pints of platelets and plasma produced from the whole blood.
(2) The net realizable value of platelets and plasma.
b. Discuss the advantages and disadvantages of each of the methods in (a) for assigningcollection and processing costs to the blood products.
P 8–15: Vigdor Wood Products
Vigdor processes cut trees into various wood products, veneers, lumber, wood chips, and so forth.Each of the products can be sold immediately upon processing the trees, or processed further and sold
388 Chapter 8
zim36725_ch08_347-408.qxd 12/15/09 2:02 PM Page 388

Cost Allocation: Practices 389
as a finished product. The following table lists the five products produced from each batch of trees,the tons of each product per batch, and the prices for the intermediate and finished products. The netcash outflow to convert each intermediate product into a finished product is $12 per ton. The net cashoutflow to process one batch of trees into the five separate wood products is $800.
Number Intermediate Finishedof Tons per Sales Sales
Outputs Batch (Price/Ton) (Price/Ton)
A342 1 $75 $88A453 2 68 82B691 4 62 73B722 3 60 71C132 6 40 57
Required:
a. Given that Vigdor processes batches of trees into the five wood products, which of the fivewood products should be sold as intermediate products (i.e., not processed further), andwhich ones should be sold as finished products (i.e., processed further)?
b. If Vigdor’s cost to process trees into the five wood products is $800, should Vigdor processtrees?
c. Assuming that the quantities and prices in the above table do not change, how high can the$800 cost to process one batch rise before Vigdor stops processing trees into the five woodproducts?
d. Assuming that the cost to process trees into the five wood products is $800, and given yourdecisions in part (a), calculate the profit per ton of each of the five wood products afterallocating the $800 processing cost to the five wood products using:
(1) Tons of wood products produced.
(2) Net realizable value of wood products produced.
e. Given the allocations of the $800 cost of processing trees in part (d ), would you want tochange any of your decisions in part (a), assuming your objective is to maximize the netcash flows for Vigdor?
f. Describe how the allocation of the $800 cost of processing trees into the five woodproducts affected your decisions in parts (a) and (b).
P 8–16: Advanced Micro Processors
Advanced Micro Processors (AMP) has designed a new dual-core microprocessor, dubbed DUALxl.DUALxl microprocessors are produced on silicon wafers with 100 chips per wafer. Once fabricated,the wafer is cut into individual microprocessors (also called “chips”). Then each chip is mounted ona base encased in a protective epoxy coating and tested. Because of slight impurities in the silicon andother compounds used in producing the wafers, as well as small perturbations in the manufacturingequipment, 60 microprocessors meet the rigorous testing and can be sold as a DUALxl microproces-sor. Thirty microprocessors have small defects that prevent them from being sold as DUALxl chips.But these microprocessors can be sold as MAXV microprocessors. Of the 100 chips, 10 are of nocommercial value and are scrapped.
Two hundred wafers are produced in each batch that costs $270,000. Each batch of 20,000 chipsyields 12,000 DUALxl’s and 6,000 MAXV’s, and 2,000 chips are scrapped. The $270,000 batch costis entirely variable. That is, producing one additional batch generates an “out-of-pocket” cash outflowof $270,000.
zim36725_ch08_347-408.qxd 12/15/09 2:02 PM Page 389

390 Chapter 8
The following table summarizes AMP’s operations for the current year:
DUALxl MAXV
Chip fabrication cost per unit* $ 15 $ 15Variable selling and distribution costs per unit $ 55 $ 8Fixed selling and distribution costs per unit† $ 6 $ 4Quantity (chips) per batch 12,000 6,000Actual number of batches this year 6 6Actual quantity produced this year 72,000 36,000Selling price $ 120 $ 25Budgeted batches per year 5 5Budgeted units this year 60,000 30,000Fixed selling and distribution costs $360,000 $120,000Units sold 69,000 31,000
*Calculated as $270,000 ÷ (12,000 DUALxl chips + 6,000 MAXV chips).†Based on expected number of DUALxl chips of 60,000 and expected number of MAXV chips of 30,000.
AMP sells the DUALxl chips for $120 and the MAXV chips for $25. The DUALxl and MAXVmicroprocessors are sold through separate selling and distribution channels that are separateorganizations.
Actual fixed selling and distribution costs were the same as budgeted total fixed selling and dis-tribution costs ($360,000 and $120,000); the actual chip fabrication cost was the same as budgetedchip fabrication cost ($270,000); and the actual variable selling costs were the same as the budgetedamounts ($55 and $8). There were no beginning inventories of DUALxl or MAXV microprocessors.
Required:
a. Prepare individual income statements for DUALxl and MAXV microprocessors for thecurrent year.
b. What are the inventory balances of DUALxl and MAXV microprocessors on AMP’sbalance sheet at the end of the current year?
c. Analyze the relative profitability of the DUALxl and MAXV microprocessors basedon their respective income statements prepared in part (a). What advice would you offermanagement?
P 8–17: Jason Rocks
Jason Rocks is small rock quarry that produces five different sizes of stones, from small crushed stones(#1 stones) to large (3-inch) rocks (#5 stones). The stones are first mined and sorted into the fivegrades. Once the stones are mined and sorted, they can be sold to a local distributor either washed orunwashed. Jason Rocks mines and sorts 500 tons of stone each day and is a price taker in the local stonemarket. The following table contains the percentage of each type of stone quarried each day and themarket prices at which Jason Rocks can sell its five types of stones as either washed or unwashed:
Selling Prices (per Ton)% of daily
Type of Stone Production Unwashed Washed
#1 10% $210 $219#2 20 185 192#3 20 150 170#4 35 145 155#5 15 160 165
zim36725_ch08_347-408.qxd 12/16/09 9:27 AM Page 390

The daily cost of mining and sorting the stones is $75,000, which includes the salaries and bene-fits of the employees who quarry and sort the stones, the depreciation on the equipment used in theprocess, the royalty payments to owners of the quarry for the stone removed, and an allocation of theutilities, insurance, property taxes, and administrative costs of the entire quarry operation. Washing anyof the five types of stone costs $8 per ton and delivering the stone to the local distributor costs $7 perton. Jason Rocks allocates the mining and sorting costs based on the tons of each type of stone produced.
Jason Rocks does not have to sell all of the types of stones it produces. Any unsold stones areleft in the quarry at no additional cost after they have been mined and sorted. The owners of JasonRocks want to maximize the quarry’s net cash flows.
Required:
a. For each of the five stone types, calculate the total cost of one ton of unwashed stones ininventory.
b. For each of the five stone types, calculate the total cost of one ton of washed stones ininventory.
c. What is the reported profit per ton of each type of unwashed stone that is sold?
d. What is the reported profit per ton of each type of washed stone that is sold?
e. Which of the five stone types should be sold as washed stones, and which stone typesshould be sold as unwashed stones? Which stone type(s) should not be sold?
f. The owners of Jason Rocks learn that new environmental and safety regulations have beenenacted that will raise its operating costs to $85,000 per day. The owners do not expectthese regulations to affect the selling prices of the washed and unwashed stones, nor dothey expect them to affect the costs of washing and delivering the stones. Given this newinformation, how do your answers in part (e) change?
P 8–18: Bank Service Centers
A bank has three service centers: EDP (electronic data processing), copying, and accounting. Theseservice centers provide services to one another as well as to three operating divisions: A, B, and C.The distribution of each service center’s output as well as its cost (in millions) is given in the accom-panying table.
Fraction of Service Center Output Used
Division Division Division TotalEDP Copying Accounting A B C Cost
EDP 0.15 0.06 0.32 0.19 0.13 0.15 $ 8.90Copy center 0.10 0.00 0.25 0.25 0.22 0.18 1.80Accounting 0.08 0.04 0.12 0.30 0.24 0.22 6.40
$17.10
Required:
Using the reciprocal method, allocate the costs of the service centers to the three operating divisions.
P 8–19: Ferguson Metals
Ferguson Metals is a decentralized mining, smelting, and metals company with three divisions: min-ing, lead, and copper. The mining division owns the ore mine that produces the lead and copper thatoccur in the vein. Mining removes the ore, crushes it, and smelts it to separate the metals from thecrushed rock. It then sells the two products to the other two divisions: lead and copper. Each batchmined yields 50 tons of lead and 25 tons of copper. (One ton is 2,000 pounds.) The metals are trans-ferred from mining to the lead and copper divisions at cost plus a small profit to give mining anincentive to produce.
Cost Allocation: Practices 391
zim36725_ch08_347-408.qxd 12/15/09 2:02 PM Page 391

392 Chapter 8
The current market price for copper is roughly $0.60 per pound; for lead it is $0.30 per pound. Butthese prices are for substantially purer copper and lead than the mining division has the ability to produce.Mining could sell its lead in the market at its current purity level for $0.17 per pound. Since the metal di-visions are currently incurring the cost to refine the metals to the purity levels they require, managementdoes not believe it is equitable to charge the divisions the current market prices for the unrefined metals.If the metals were transferred at market prices, the lead and copper divisions would be paying twice forthe refining process and the mining division would be rewarded for a level of purity it is not providing.
Table 1 shows the mining division’s income statement per batch.The variable mining and smelting costs per ton of lead and copper are based on the fixed yields
of the two metals. Production last year at mining was 100 batches, and both the lead and copperdivisions had no change in inventory levels.
The lead and copper divisions further process the two metals into industrial products. Becauseof increasing foreign competition, the lead division has been showing a negligible return on invest-ment. Table 2 shows income statements for the two metal divisions for last year.
All of the fixed costs in both the lead and copper divisions represent separable annual cashoutflows to maintain current capacity. They are not common costs. Ferguson’s top management hasthe opportunity to invest in what appears to be a highly profitable joint mining venture, whichpromises very high returns. Ferguson’s share of the net present value of the venture is around $30 million, discounted at the firm’s before-tax cost of capital of 12 percent. To finance this pro-ject, the company is considering divestiture of the lead division. A foreign company looking to gaina foothold in the U.S. market has offered $5 million for this division. While Ferguson’s netinvestment in this division is $10 million, management reasons it can use the proceeds to undertakethe joint venture.
TABLE 1 Mining Division Income Statement per Batch
Lead Copper
Revenue $42,000 $21,000Costs:*
Mining 22,000 11,000Smelting 16,000 8,000
Profits per batch $ 4,000 $ 2,000
*Based on a normal volume of 100 batches per year.
TABLE 2 Metal Division Income Statement ($000s)
Lead Copper
Sales $ 6,600 $ 6,700Variable costs:
Metal costs* 5,000 2,200Other costs 500 700
Contribution margin $ 1,100 $ 3,800Fixed costs 800 1,100
Net income before taxes $ 300 $ 2,700
Net investment $10,000 $14,000Return on assets 3% 19%
*The metal costs exceed the costs of the mining division because some metals are purchased on the open market to expandcapacity and to smooth production of the downstream industrial products.
zim36725_ch08_347-408.qxd 12/15/09 2:02 PM Page 392

Cost Allocation: Practices 393
Required:
Should management sell the lead division to the foreign company? Present an analysis supportingyour conclusions.
P 8–20: The Doe Company
The Doe Company sells three products: sliced pineapples, crushed pineapples, and pineapple juice.The pineapple juice is a by-product of sliced pineapple, while crushed pineapples and sliced pineap-ples are produced simultaneously from the same pineapple. Some pineapple slices break, and theseare used to make crushed pineapple.
The production process is as follows:
1. A total of 100,000 pounds of pineapples is processed at a cost of $120,000 inDepartment 1. Twenty percent of the pineapples’ weight is scrap and is discardedduring processing. Twenty percent of the processed pineapple is crushed andtransferred to Department 2. The remaining is transferred to Department 3.
2. In Department 2, a further cost outlay of $15,000 is required to pack the crushedpineapple. Here a further 10 percent is lost in processing. The packed product issold at $3 a pound.
3. In Department 3, the material is processed at a total additional cost of $40,000.Thirty percent of the processed pineapple turns into juice and is sold at $0.50 apound after $3,500 is incurred as selling costs. The remaining 70 percent istransferred to Department 4.
4. Department 4 packs the sliced pineapple into tins. Costs incurred here total $25,000.The cans are then ready for sale at $4.00 a pound.
Required:
Prepare a schedule showing the allocation of the processing cost of $120,000 between crushed andsliced pineapple using the net realizable value method. The net realizable value of the juice is to beadded to the sales value of the sliced pineapples.
P 8–21: RBB Brands
You are working on a special assignment as a financial analyst for the president of householdproducts of RBB Brands. RBB Brands is a large $4 billion diversified consumer products firm.RBB has two divisions, household products and foods, each headed by a president. Each divisionis evaluated as a profit center. The senior managers of each division receive bonuses paid out of apool equal to 1 percent of the division’s accounting profits. Both divisions receive services fromtwo corporate service departments: engineering and maintenance.
The president of household products attended a meeting at which the corporate controller madea presentation proposing that the two divisions’ accounting profits be charged for engineering andmaintenance services. Table 1 summarizes each division’s use of the two service departments as wellas each service department’s use of the other service department (as well as its own use).
The controller then distributed Tables 2 and 3. He explained that each division would be chargedfor the hours of maintenance and engineering it actually used. The charge per hour would be based on
TABLE 1 RBB BrandsSummary of Service Department Utilization (All Numbers, Except Dollars, Are 1,000 Hours)
Service Departments Profit Centers
Service Household Total CostDepartments Engineering Maintenance Products Foods Total (Millions)
Engineering 500 100 900 1,200 2,700 $67.50Maintenance 800 900 1,600 2,900 6,200 $55.80
zim36725_ch08_347-408.qxd 12/15/09 2:02 PM Page 393

394 Chapter 8
TABLE 2 RBB BrandsAllocation of Service Department Costs Using Step-Down Allocation First Department Allocated: Maintenance (Millions of Dollars Except Cost per Hour)
Service Departments Profit Centers
HouseholdService Departments Engineering Maintenance Products Foods Total
Maintenance hoursconsumed 800 1,600 2,900 5,300
Percentage of maintenancecost 15% 30% 55% 100%
Cost per maintenance hour $ 10.53Allocated cost of
maintenance department $ 8.42 $16.85 $30.53 $ 55.80Engineering operating cost 67.50 $ 67.50
Total cost to be allocated $75.92 $ 75.92
Engineering hours consumed 900 1,200 2,100Cost per engineering hour $ 36.15Engineering costs allocated
to profit centers $32.54 $43.38 $ 75.92Maintenance and
engineering costs allocatedto profit centers $49.38 $73.92 $123.30
TABLE 3 RBB BrandsAllocation of Service Department Costs Using Step-Down Allocation First Department Allocated: Engineering (Millions of Dollars Except Cost per Hour)
Service Departments Profit Centers
HouseholdService Departments Engineering Maintenance Products Foods Total
Engineering hoursconsumed 100 900 1,200 2,200
Percentage of cost 4.55% 40.91% 54.55% 100%Engineering operating cost $67.50 $67.50Cost per engineering hour $30.68Allocated cost of
engineering department $ 3.07 $27.61 $36.82 $67.50Maintenance operating cost 55.80 $55.80
Total cost to be allocated $58.87 $58.87
Maintenance hoursconsumed 1,600 2,900 4,500
Cost per maintenance hour $13.08Percentage of maintenance 35.56% 64.44% 100%Maintenance costs allocated
to profit centers $20.93 $37.94 $58.87Maintenance and
engineering costsallocated to profit centers $48.54 $74.76 $123.30
zim36725_ch08_347-408.qxd 12/15/09 2:02 PM Page 394

Cost Allocation: Practices 395
the allocated cost of the service department. Table 2 reports the allocation of service department costsusing the step-down allocation method starting with maintenance costs. Table 3 reports the allocationof service department costs using the step-down allocation method but starting with engineeringcosts. The controller’s office is considering adopting one of these two methods and is seeking inputfrom the divisions.
Required:
Analyze and critically evaluate the controller’s proposal in a position paper to the president of house-hold products. In addition, provide a series of key points that the president can raise at the nextmeeting with the corporate controller and corporate management.
P 8–22: Karsten Mills
Karsten Mills is one of the premier carpet manufacturers in the world. It manufactures carpeting forboth residential and commercial applications. Home sales and commercial sales each account forabout 50 percent of total revenue. The firm is organized into three departments: manufacturing, res-idential sales, and commercial sales. Manufacturing is a cost center and the two sales departments areprofit centers. The full cost of each roll of carpeting produced (including fully absorbed overhead) istransferred to the sales department ordering the carpet. The sales departments are evaluated as profitcenters; the full cost of each roll is the transfer price.
The current manufacturing plant is at capacity. A new plant is being built that will more than dou-ble the capacity. Within two years, management believes that it can grow Karsten’s businesses such thatmost of the excess capacity will be eliminated. When the new plant comes on line, one plant will pro-duce exclusively commercial carpeting and the other will produce exclusively residential carpeting.This change will simplify scheduling, ordering, and inventory control in both plants and will createsome economies of scale through longer mill runs. Nevertheless, it will take a couple of years beforethese economies of scale can be realized.
Each mill produces carpeting in 12-foot-wide rolls of up to 100 yards in length. The outputof each mill is measured in yards produced. Overhead is assigned to carpet rolls using carpet yardsproduced in the mill. The cost structure of each plant is as follows:
Old Plant New Plant
Normal machine hours per year 6,000 5,000Normal carpet yards per hour 1,000 1,400Normal capacity 6 million yards 7 million yardsAnnual manufacturing overhead costs
excluding accounting depreciation $15,000,000 $21,000,000Accounting depreciation per year $ 6,000,000 $21,000,000
Besides being able to run at higher speed, producing more carpet yardage per hour, the new millwill use 15 percent less direct material and direct labor because the new, more automated machinesproduce less scrap and require less direct labor per yard. The cost of a job run at the old mill is
Carpet A6106: (100-Yard Roll)
Direct materials $ 800Direct labor 600
Direct costs $1,400
Although the new mill has lower direct costs of producing carpeting than the old mill, the higheroverhead costs per yard at the new mill have the sales department managers worried. They are alreadylobbying senior management to have the old mill assigned to produce their products. The commercial
zim36725_ch08_347-408.qxd 12/15/09 2:02 PM Page 395
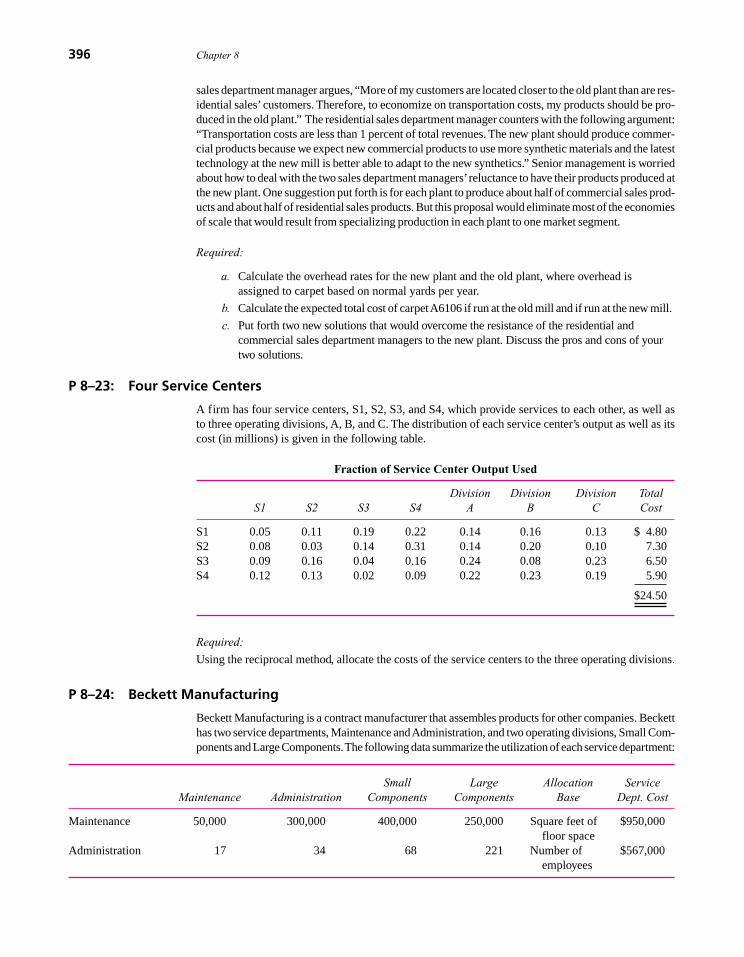
396 Chapter 8
sales department manager argues, “More of my customers are located closer to the old plant than are res-idential sales’ customers. Therefore, to economize on transportation costs, my products should be pro-duced in the old plant.” The residential sales department manager counters with the following argument:“Transportation costs are less than 1 percent of total revenues. The new plant should produce commer-cial products because we expect new commercial products to use more synthetic materials and the latesttechnology at the new mill is better able to adapt to the new synthetics.” Senior management is worriedabout how to deal with the two sales department managers’reluctance to have their products produced atthe new plant. One suggestion put forth is for each plant to produce about half of commercial sales prod-ucts and about half of residential sales products. But this proposal would eliminate most of the economiesof scale that would result from specializing production in each plant to one market segment.
Required:
a. Calculate the overhead rates for the new plant and the old plant, where overhead isassigned to carpet based on normal yards per year.
b. Calculate the expected total cost of carpetA6106 if run at the old mill and if run at the new mill.
c. Put forth two new solutions that would overcome the resistance of the residential andcommercial sales department managers to the new plant. Discuss the pros and cons of yourtwo solutions.
P 8–23: Four Service Centers
A firm has four service centers, S1, S2, S3, and S4, which provide services to each other, as well asto three operating divisions, A, B, and C. The distribution of each service center’s output as well as itscost (in millions) is given in the following table.
Fraction of Service Center Output Used
Division Division Division TotalS1 S2 S3 S4 A B C Cost
S1 0.05 0.11 0.19 0.22 0.14 0.16 0.13 $ 4.80S2 0.08 0.03 0.14 0.31 0.14 0.20 0.10 7.30S3 0.09 0.16 0.04 0.16 0.24 0.08 0.23 6.50S4 0.12 0.13 0.02 0.09 0.22 0.23 0.19 5.90
$24.50
Required:
Using the reciprocal method, allocate the costs of the service centers to the three operating divisions.
P 8–24: Beckett Manufacturing
Beckett Manufacturing is a contract manufacturer that assembles products for other companies. Becketthas two service departments, Maintenance andAdministration, and two operating divisions, Small Com-ponents and Large Components.The following data summarize the utilization of each service department:
Small Large Allocation ServiceMaintenance Administration Components Components Base Dept. Cost
Maintenance 50,000 300,000 400,000 250,000 Square feet of $950,000floor space
Administration 17 34 68 221 Number of $567,000employees
zim36725_ch08_347-408.qxd 12/15/09 2:02 PM Page 396

Square feet of floor space required by each user is the allocation base for allocating the Maintenancedepartment cost of $950,000. Number of employees in each department and division is used to allo-cate the Administration department cost of $567,000. Beckett uses the step-down method of allocat-ing service department costs to the two operating divisions. The $950,000 and $567,000 amountsrepresent the operating costs of the Maintenance and Administration departments, respectively, andthey do not include any cost allocations from the other service departments.
Required:
a. Allocate the two service department costs to the two operating divisions using the step-down method where Maintenance is the first service department allocated and Admin-istration is the second service department allocated.
b. Allocate the two service department costs to the two operating divisions using the step-down method where Administration is the first service department allocated and Main-tenance is the second service department allocated.
c. Calculate the allocated cost per square foot and the allocated cost per employeeresulting from using the step-down method where Maintenance is the first servicedepartment allocated and Administration is the second service department allocated (asin part [a]).
d. Calculate the allocated cost per square foot and the allocated cost per employee resulting fromusing the step-down method where Administration is the first service department allocatedand Maintenance is the second service department allocated (as in part [b]).
e. Describe why the costs per square foot and the costs per employee vary in parts (c) and (d)above.
P 8–25: Littleton Medical Center
Littleton Medical Center (LMC) has three service departments (accounting, human resources, andjanitorial/maintenance) and two patient units: hospital and an outpatient clinic. The following tablesummarizes the operations of LMC for the last fiscal year.
ServiceDepartment
Service Departments Cost (000)
Human resources $1,200Accounting $1,600Janitorial/Maint. $2,400
These department costs are allocated to the two patient units (hospital and clinic). The followingtable summarizes the allocation bases used to allocate each service department and the utilization ofeach allocation base.
Service Departments Patient Units
Service Departments HR Acctg Jan/Maint Clinic Hospital Allocation Base
Human resources 50 150 2,000 3,000 EmployeesAccounting 50 100 6,000 4,000 Transactions(000)Janitorial/Maint. 8,000 9,000 150,000 400,000 Square feet
Cost Allocation: Practices 397
zim36725_ch08_347-408.qxd 12/16/09 9:27 AM Page 397

Required:
a. Allocate the three service departments’ costs (HR, Accounting, and Janitorial/Maintenance) to the two patient units (Clinic and Hospital) using the direct allocationmethod.
b. Allocate the three service departments’ costs (HR, Accounting, andJanitorial/Maintenance) to the two patient units (Clinic and Hospital) using the step-downallocation method. The order of the three departments is: first, HR; second, Accounting;and third, Janitorial/Maintenance.
c. What are the primary advantages of the step-down method compared to the directallocation method?
P 8–26: Aurora Medical Center
Aurora Medical Center (AMC), located outside Phoenix, has an inpatient hospital and outpatientclinic. Because it is located in a retirement area, a substantial fraction of its patients are elderly, andhence their medical insurance is provided through the Medicare program of the federal government.Medicare outpatient clinic care is reimbursed by the federal government at cost. Each clinic withMedicare outpatients submits a reimbursement form to Medicare reporting the costs of treating thesepatients. Medicare inpatient reimbursement is based on predetermined rates depending on the diag-nosis. For example, all Medicare-paid hip replacements in Phoenix are reimbursed at $14,800 perpatient, regardless of the hospital’s cost.
AMC has two administrative departments that provide services to both the hospital and the clinic:accounting and information management (IM). The accompanying tables summarize the service levelsprovided by these two departments:
Administrative Departments
Accounting IM
Total cost $3,800,000 $4,800,000Allocation base Number of transactions Disk space (gigabytes)
Service Levels
Transactions Gigabytes
Accounting 8IM 40,000Hospital 1,100,000 7Clinic 600,000 9
Total 1,740,000 24
Accounting department costs are distributed to users based on the number of transactions postedto the general ledger generated by that user. IM costs are distributed to users based on the gigabytes ofstorage dedicated to the user. Medicare guidelines allow these allocation bases to be used. Medicarealso provides some discretion to hospitals in the methods used to allocate costs, as long as they arereasonable and generally accepted.
Required:
a. Design a report for assigning the accounting and IM costs to the hospital and clinic. Howmuch of the costs of accounting and IM should be allocated to inpatients and outpatients?
b. Justify your design in (a). Explain why AMC should follow your suggestions.
398 Chapter 8
zim36725_ch08_347-408.qxd 12/15/09 2:02 PM Page 398

P 8–27: Grove City Broadcasting
Grove City Broadcasting owns and operates a radio station and a television station in Grove City.Both stations are located in the same building and are operated as separate profit centers with sep-arate managers, who are evaluated based on station profits. Revenues of both the radio and the TVstation are from advertising spots. The price of a standard 30-second ad is based on audience size,which is measured by an independent outside agency. The radio station sells a 30-second ad for$100. (Assume that all 30-second ads sell for $100 regardless of the time of day they air.) The $100price is based on an expected audience size of 20,000 listeners. If the listener audience were todouble, the 30-second ad would sell for $200. In other words, each radio listener is worth $0.005($100 � 20,000) of advertising revenue per 30-second ad. Each TV viewer is worth $0.008 per 30-second ad. The radio station sells 3,550 ads per month, and the TV station sells 3,200 adsper month.
Sports Wire has approached both the radio and television managers about subscribing to its ser-vice, which brings all sports scores, sports news, and sports analyses to the station via an on-linecomputer system over the Internet. The radio and/or TV stations’ sports announcers could downloadscores and news directly into sports scripts and read them over the air. Sports Wire is more compre-hensive and contains more sports stories than the current general news wires that Grove City isreceiving. If one of the two stations buys Sports Wire, the price is $30,000 per month. For an extra$5,000 per month, both the radio and the TV station can use Sports Wire. If both stations use SportsWire, the $5,000 additional fee includes an extra computer terminal that allows two users to be on thesystem at the same time.
Sports Wire will not increase the number of ads each month, just the revenue per ad. The GroveCity radio manager believes that purchasing Sports Wire would increase his audience by 1,500listeners per ad. The television manager believes her audience size would increase by 500 viewersper ad.
Required:
a. If the two managers did not cooperate but rather each made a decision assuming he or shewas the sole user of the system, would either buy Sports Wire? Support your answer withdetailed calculations.
b. If the owner of Grove City Broadcasting had all the facts available to the two managers,would the owner buy Sports Wire?
c. The costs of the current wire services that Grove City purchases are allocated to the twostations based on the number of stories aired each month from the wire services. The ownerof Grove City Broadcasting decides to purchase Sports Wire for both stations and to allocateits $35,000 cost based on the number of Sports Wire stories aired each month. During thefirst month, the radio station uses 826 Sports Wire stories and TV uses 574. Allocate theSports Wire cost to the radio and TV stations.
d. What is the allocated cost per Sports Wire story in the first month?
e. Given the allocation of the Sports Wire cost, what behaviors can you predict from the radioand TV station managers?
f. Design an alternative allocation scheme that will avoid the problems identified in (e).Discuss the advantages and disadvantages of your allocation scheme.
P 8–28: Barry’s Fashions
Barry’s Fashions operates a Downtown Store and a Mall Store. Both department stores use three cen-tralized, corporate service departments (human resources, maintenance, and information manage-ment). The following table summarizes the allocation bases used to allocate each service department,the operating expenses incurred by each service department, and the amount of each allocation baseused by the three service departments and the two stores.
Cost Allocation: Practices 399
zim36725_ch08_347-408.qxd 12/15/09 2:02 PM Page 399

400 Chapter 8
Operating Allocation Expenses Human Info. Downtown Mall
Base (Millions) Resources Maintenance Mgmt. Store Store Total
Human resources Employees $0.4 20 110 30 850 1,200 2,210
Maintenance Square footage (thousands) 0.9 12 18 20 80 130 260
Information Lines printed management (Millions) 1.5 6 2 5 120 90 223
Required: (Round all fractions to three significant digits.)
a. Using the direct allocation method for allocating service department costs, calculate theamount of information management expense allocated to the Mall Store.
b. Using the direct allocation method for allocating service department costs, calculate theallocated cost per line printed for information management services.
c. Using the step-down allocation method for allocating service department costs, calculatethe amount of information management expense allocated to the Mall Store. Note that theorder of the service departments is as indicated in the table.
d. Using the step-down allocation method for allocating service department costs, calculatethe allocated cost per line printed for information management services. Note that theorder of the service departments is as indicated in the table.
e. Compare and contrast your answers in parts (b) and (d ). First, describe why you getdifferent answers. Second, which number would you recommend management use?
P 8–29: Janitorial Services
Janitorial services is one of five service departments in a firm that allocates service department costsusing the step-down allocation method. Janitorial services is currently the third service department(S3) in the step-down process. The following table gives the allocation fractions of the five servicedepartments to the other four service departments and the four operating departments.
Service Departments Operating Departments
Service Departments S1 S2 S3 S4 S5 D1 D2 D3 D4
S1 0.00 0.05 0.05 0.08 0.04 0.20 0.18 0.22 0.18S2 0.03 0.00 0.04 0.02 0.08 0.23 0.20 0.16 0.24S3 (Janitorial Services) 0.04 0.03 0.00 0.02 0.08 0.19 0.24 0.23 0.17S4 0.08 0.07 0.01 0.00 0.11 0.08 0.04 0.18 0.43S5 0.07 0.12 0.14 0.16 0.00 0.13 0.11 0.12 0.15
The costs ($100,000) for each of the service departments before making any cost allocations are:
Total Service Department Cost
S1 $25.00S2 32.00S3 17.00S4 29.00S5 18.00
zim36725_ch08_347-408.qxd 12/15/09 2:02 PM Page 400

The next table details the step-down allocated costs to each service department after making cost al-locations. (In other words, $1.25 is allocated from S1 to S2 and S3, $2.00 to S4, and $1.00 to S5.)
Total Service
S1 S2 S3 S4 S5 Dept. Cost
S1 allocated costs $0.00 $1.25 $1.25 $2.00 $1.00 $25.00S2 allocated costs 0.00 0.00 1.37 0.69 2.74 33.25S3 allocated costs 0.00 0.00 0.00 0.42 1.69 19.62S4 allocated costs 0.00 0.00 0.00 0.00 4.20 32.11S5 allocated costs 0.00 0.00 0.00 0.00 0.00 27.63
Total $0.00 $1.25 $2.62 $3.11 $9.63
Service department S3 provides janitorial services (floor care, window cleaning, rest room san-itation) to the other service departments and the operating divisions. The allocation base used toallocate S3 costs is square footage in the service and operating departments. Total square footage ofS1, S2, S4, S5, D1, D2, D3, and D4 is 650,000 square feet. (Note: All costs are in terms of $100,000.)
Required:
a. Calculate the cost per square foot that janitorial services (S3) is currently charging itscustomers.
b. Suppose that janitorial services (S3) is moved from the third service department in the step-down method to the fifth (last) service department in the step-down process. Calculate the totalcost of janitorial services including all service department costs allocated to janitorial services.
c. What is the cost per square foot that janitorial services will charge its customers if itbecomes the last service department to be allocated in the step-down process?
d. Why might senior (corporate) management move janitorial services from the third servicedepartment to the last service department in the step-down process?
P 8–30: Jones Consortium
At the Hilton Applefest and Trade Expo, James Jones, owner of Jones Orchard, saw a sign displayedin front of a vendor’s booth: I CAN GET YOU PESTICIDES AT $10.00 A GALLON—GUARANTEED IN WRITING!Over a one-year period, the vendor guarantees delivery of between 350,000 and 500,000 gallons ofpesticide at a maximum price of $10 per gallon. Since Jones Orchard is currently paying $11.30 pergallon, the offer is appealing. However, Jones uses only 25,000 gallons and the annual managementfee for this service is a whopping $275,000.
The only way Jones can see to make the offer work is to form a buying consortium with otherfarmers. As long as all of the farmers are located within 10 square miles, the vendor is willing toallow the formation of a consortium. Including Jones Orchard, five farms are within this area. Theirpesticide needs and anticipated costs are as follows:
Gallons Price per Gallon
Jones 25,000 $11.30Gilbert 35,000 11.20Santos 50,000 11.12Singh 100,000 10.90Chen 150,000 10.70
Total 360,000
Cost Allocation: Practices 401
zim36725_ch08_347-408.qxd 12/15/09 2:02 PM Page 401

402 Chapter 8
All of the farmers are willing to participate in the buying consortium as long as there is an an-ticipated cost savings for each farmer. Everyone agrees that each farmer should pay the same amountfor materials. But allocation of the management fee is left entirely up to Jones.
Required:
a. Based upon the numbers provided, demonstrate that this consortium could work.
b. Jones initially considers allocating the management fee either (1) equally between allmembers or (2) based upon each farmer’s percentage of total gallons needed. Would eithermethod work? Show allocation by each method.
c. Jones believes it would make sense to allocate the management fee on an ability-to-pay basis.As the chapter allocates joint costs based upon net realizable value, allocate the managementfee based upon the potential dollar savings opportunity of each farm. Is this method feasible?
d. Consider the issue of private versus public information as it relates to the cost allocationschemes presented in this problem. Address whether the information required to implementeach scheme is essentially held in common by all of the farmers in the consortium orprivately held by each individual farmer. In particular, given that the consortium willallocate the management fee by ability to pay, how might each farmer’s privately held costinformation serve to undermine the consortium’s future existence?
P 8–31: IVAX
IVAX manufactures commercial brushes in two operating divisions (O1 and O2) and has two servicedepartments (Human Resources and Janitorial/Maintenance). The two service departments’ costs areallocated to the two operating departments. Human Resources’ costs of $600,000 are allocated basedon the number of employees, and Janitorial/Maintenance costs of $800,000 are allocated based onsquare footage. The following table summarizes the number of employees and the square footage ineach division and department.
Service Depts.Operating Divs.
Human Janitorial/ AllocationResources Maintenance O1 O2 Total Base
Human Resources 0 50 550 400 1,000 EmployeesSquare footage
Janitorial/Maintenance 10 0 200 390 600 (000s)
Required:
a. Allocate the costs of the two service departments to the two operating divisions using thedirect allocation method.
b. Allocate the costs of the two service departments to the two operating divisions using thestep-down allocation method where Human Resources is allocated first and Janitorial/Maintenance is allocated second.
c. Allocate the costs of the two service departments to the two operating divisions using thestep-down allocation method where Janitorial/Maintenance is allocated first and HumanResources is allocated second.
d. Compute the Human Resource Department cost per employee under the three allocationmethods (direct allocation, step-down allocations where Human Resources is first, and thestep-down method where Janitorial/Maintenance is first).
e. Compute the Janitorial/Maintenance cost per square foot under the three allocationmethods (direct allocation, step-down allocations where Human Resources is first, and thestep-down method where Janitorial/Maintenance is first).
f. Briefly discuss the various factors IVAX management should consider in choosing how toallocate the two service department costs to the two operating divisions.
zim36725_ch08_347-408.qxd 12/15/09 2:02 PM Page 402

Cost Allocation: Practices 403
TABLE 1 Summary of Operations for the Year
Tons of grapes 10,000Average cost per ton $190
Premium Wines Table Wines
Number of cases produced and sold 400,000 70,000Selling price per case $11.00 $7.00Revenues $4,400,000 $490,000Grape costs* 1,650,000 250,000Packaging costs 1,000,000 140,000Labor 200,000 35,000Selling and distribution† 400,000 35,000Manufacturing overhead 400,000 87,500
Operating profit (loss) $ 750,000 $(57,500)
*Grape costs represent the cost of the juice placed into the two product categories and are calculated as
Gallons of Juice Total Grape Grape CostUsed in Each Product % of Juice � Costs � per Product
Premium wines 13,200,000 86.84% $1,900,000 $1,650,000Table wines 2,000,000 13.16 1,900,000 250,000
Total 15,200,000 100.00% $1,900,000
NOTE: A greater quantity of juice is required per case of premium wine than per case of table wine because there is moreshrinkage in the premium wines.†Each product has its own selling and distribution organization. Two-thirds of S&D expenditures vary with cases produced; theremainder of the expenditures do not vary with output.
CasesCase 8–1: Carlos Sanguine Winery
Carlos Sanguine, Inc., makes premium wines and table wines. Grapes are crushed and the free-flowing juice and the first-processing juice are made into premium wines (bottles with corks). Thesecond- and third-processing juices are made into table wines (bottles with screw tops).
Table 1 summarizes operations for the year, and Table 2 breaks down manufacturing overheadexpenses into general winery costs and production facilities costs.
TABLE 2 Manufacturing Overhead by Products
Premium Wines Table Wines Total
General winery costs* $212,800 $37,200 $250,000Production facilities costs†
(depreciation and maintenance) 187,200 50,300 237,500
Manufacturing overhead $400,000 $87,500 $487,500
*General winery costs do not vary with the number of cases or the number of product lines and are allocated based oncases produced.†Premium and table wines have separate production facilities. One-fourth of each of their production facilities costs varies withcases produced. The remainder are fixed costs previously incurred to provide the production capacity.
zim36725_ch08_347-408.qxd 12/15/09 2:02 PM Page 403

404 Chapter 8
TABLE 4 Fixed and Variable Costs per Product and Product Break-Even Points
Premium Wines Table Wines
Sales $11.00 $ 7.00Less variable costs
Grapes $4.13 $3.57Packaging 2.50 2.00Labor 0.50 0.50Selling and distribution 0.66 0.33Manufacturing overhead 0.12* 7.91 0.18† 6.58
Contribution margin $ 3.09 $ 0.42Less unitized fixed costs per unit
Selling and distribution 0.33 0.17Manufacturing overhead 0.88 1.21 1.07 1.24
Profit (loss) $ 1.88 $(0.82)
Break EvenFixed costs (400,000 � $1.21) $484,000 (70,000 � $1.24) $86,800� Contribution margin 3.09 0.42
Number of cases to break even 156,634 206,667
*($187,200 � 25%) � 400,000 cases.†($50,300 � 25%) � 70,000 cases.
TABLE 3 Product Line Cost Structure per Case
Premium Wines Table Wines
Net sales $11.00 $7.00Variable costs
Grapes $4.13 $3.57Packaging 2.50 2.00Labor 0.50 0.50Selling and distribution 1.00 8.13 0.50 6.57
Margin $ 2.87 $ 0.43Less manufacturing
overhead 1.00 1.25
Operating profit (loss) $ 1.87 $(0.82)
Based on Tables 1 and 2, the accounting department prepared the report in Table 3.Management is concerned that the table wines have such a low margin. Some of the
managers urge that these lines be dropped. Competition keeps the price down to $7 per case, whichcauses some managers to question how the competition could afford to sell the wine at this price.
Before making a final decision, top management asked for an analysis of the fixed and variablecosts by product line and their break-even points. When management saw Table 4, the presidentremarked, “Well, this is the final nail in the coffin. We’d have to almost triple our sales of table wines justto break even. But we don’t have that kind of capacity. We’d have to buy new tanks, thereby driving upour fixed costs and break-even points. This looks like a vicious circle. By next month, I want a detailedset of plans on what it’ll cost us to shut down our table wines.” Table 5 summarizes the shutdown effects.
Based on the facts presented in the case, what should management do?
zim36725_ch08_347-408.qxd 12/15/09 2:02 PM Page 404

Cost Allocation: Practices 405
TABLE 5 Effects of Discontinuing Table Wines
1. No effect on the sale of premium wines is expected.2. The juice being used in the table wines can be sold to bulk purchasers to use in fruit
juices for $150,000 per year.3. The table wine production facilities (tanks, refrigeration units, etc.) have no use
in premium wine production. These can be sold for $350,000, net of disposal costs.
Case 8–2: Wyatt Oil
Wyatt Oil owns a major oil refinery in Channelview, Texas. The refinery processes crude oil intovaluable outputs in a two-stage process. First, it distills a barrel of crude oil at a variable cost of$2 per barrel into two types of outputs: light distillates (such as gasoline, jet fuel, diesel fuel, andkerosene) and heavy distillates. The light distillates are sold for $48 per barrel. The heavy distillatescan either be sold for $30 per barrel or fed into a catalytic cracking unit (“cat cracker”) at a variablecost of $3 per barrel to be converted into light distillates and sold, for $48 per barrel. The diagramin Figure 1 illustrates the refining process.
Wyatt’s Channelview refinery can distill 60 million barrels of oil per year and feed 30 millionbarrels of heavy distillate a year into the cat cracker. It can process either light, sweet crude fromTexas (such as West Texas Intermediate) or heavy, sour crude from the Middle East (such as KuwaitExport), depending on the market prices of the two types of crude. More valuable products are dis-tilled from a barrel of light, sweet crude than from a barrel of heavy, sour crude (see Figure 2). Light,sweet crude currently costs $34 per barrel and heavy, sour crude costs $30; however, the price differ-ential is volatile, as noted in Figure 3. The output from 60 million barrels of West Texas Intermediateand 60 million barrels of Kuwait Export is shown in Table 1.
<90°
Temp (°F):
Butane &lighter
ProductRecovered:
Gasprocessing
90°–200° Light straightnaphtha
Gasolineblending
200°–350° Naphtha Catalyticreforming
350°–450°Crude oil Kerosene Hydro-treating
450°–650° Distillate Dist. fuelblending
650°–1000° Heavygas oil
Fluid catalyticcracking
1,000�° Residuum Coking
Unit UseSent to:
Dis
tilla
tion
Col
umn
FIGURE 1
Crude oildistillation: thefirst step
SOURCE: http://www.eia.doe.gov/pub/oil_gas/petroleum/analysis_publications/oil_market_basics/Refining_text.htm#Crude%20Oil%20Quality.
zim36725_ch08_347-408.qxd 12/15/09 2:02 PM Page 405

TABLE 2
Distilling Cracking Crude Oil Heavy Distillates
Variable cost $2 per bbl. $3 per bbl.Annual fixed cost $180 million $90 millionAnnual capacity 60 million bbls. 30 million bbls.
12
10
8
6
4
2
01988 1989 1990 1991 1992 1993 1994 1995 1996 1997 1998 1999 2000 2001
2001
dol
lars
per
bar
rel
FIGURE 3
Price differencebetween light crudeoil and heavycrude oil, 1988–2001
NOTE: Light crude oil isdefined here as having anAPI gravity of 40.1 or greaterand heavy crude oil isdefined as having an APIgravity of 20.1 or less.
SOURCE: http://www.eia.doe.gov/emeu/perfpro/ref_pi2/fig5.html.
406 Chapter 8
100%
80%
60%
40%
20%
0%
LPG
Naphtha
Kerosene
Light gas oil
Intermediate gas oil
Residue
Arab
Light
WTI
FIGURE 2
Product yield fromsimple distillation
NOTE: Arab Light is slightlylighter and sweeter thanKuwait Export. West TexasIntermediate is lighter thanKuwait Export (specificgravity of 40.8 for WTIversus 31.4 for KuwaitExport) and sweeter thanKuwait Export (sulfurpercentage of 0.34% forWTI versus 2.52% forKuwait Export).
SOURCE: http://www.eia.doe.gov/pub/oil_gas/petroleum/analysis_publications/oil_market_basics/Ref_image_Simple.htm.
TABLE 1
West Texas Kuwait Intermediate Export
Light distillates 30 million bbls./year 20 million bbls./yearHeavy distillates 30 million bbls./year 40 million bbls./yearTotal 60 million bbls./year 60 million bbls./year
zim36725_ch08_347-408.qxd 12/15/09 2:02 PM Page 406

Cost Allocation: Practices 407
The fixed and variable costs and capacities associated with distilling crude and cracking theheavy distillates are shown in Table 2.
Until recently, Wyatt’s Channelview refinery processed West Texas Intermediate, but it switchedto Kuwait Export when the price differential between the two reached $3.50 per barrel. Kim Quillen,manager of the refinery, is concerned because the switch to heavy, sour crude has resulted in the re-finery selling only 50 million barrels of light distillates instead of 60 million—because the refineryhas capacity to crack only 30 million barrels of heavy distillates. The refinery’s projected accountingincome for the year is shown below.
Revenue from light distillates $ 960,000,000Revenue from processed heavy distillates 1,440,000,000Revenue from sold heavy distillates 300,000,000Cost of crude oil (1,800,000,000)Variable distilling costs (120,000,000)Variable cracking costs (90,000,000)Fixed distilling costs (180,000,000)Fixed cracking costs (90,000,000)
Net income $ 420,000,000
Buying an additional cat cracker to increase cracking capacity by 10 million barrels would cost$900 million. It would last for 20 years, increasing the refinery’s annual fixed costs by $45 millionper year. Quillen has asked his accountant, John Hanks, to evaluate the investment, and Hanks hascontemptuously dismissed the project. His analysis appears below.
Sales value of light distillates $48.00 per bbl.Cost of heavy distillates* (35.00) per bbl.Additional cat cracker accounting costs** (7.50) per bbl.Capital charge*** (13.50) per bbl.
Residual income (loss) $ (8.00) per bbl.
*
**
***
Hank concludes his evaluation by saying, “What an awful project! Our residual income decreases by$8 on every barrel. Not to mention the possibility that we might switch back to using West TexasIntermediate sometime. Then we would have excess cat cracker capacity, which would just rust awayover time since expanding our distilling capacity is not feasible. There is no way we should pursuethis project.”
Quillen is puzzled, for he knows that many other refineries have been installing additional catcracker capacity in response to the growing price differential between sweet, light crude and sour,heavy crude. Fortunately, he has just hired you to evaluate the capital investment.
Required:
a. Allocate the projected $420 million accounting income of the Channelview refineryamong its three activities—light distillates, processed heavy distillates, and sold heavydistillates—by allocating joint costs on the basis of (1) physical volume and (2) net
$900 million * 15%
10,000,000 bbls.
$45,000,000
$10,000,000 bbls.+ $3 per barrel
$180,000,000
60,000,000 bbls.+ $2 per barrel + $30 per barrel
zim36725_ch08_347-408.qxd 12/15/09 2:02 PM Page 407

realizable value. Compare the ratio of accounting profit to net realizable value of the threeactivities under both methods.
b. Did Quillen make the right decision to switch from West Texas Intermediate to KuwaitExport when the price differential reached $3.50 per barrel? Assuming there are noswitching costs, find the optimal decision rule as a function of the price differential.
c. Would your decision rule be different if you were to expand the cracker capacity to 40 million barrels? Find the optimal switching rule if the refinery can crack 40 millionbarrels of heavy distillates each year.
d. Assume the price differential between West Texas Intermediate crude and Kuwait Exportcrude remains the same at $4 per barrel. Should Quillen expand the refinery’s cat crackingcapacity?
e. Now consider the possibility of changes in the price differential. Suppose that thisyear’s price differential is $4, but next year’s price differential could be anywhere between75 percent and 125 percent of the current year differential (equally likely, so next year’sprice differential can be thought of as a random variable uniformly distributed on theinterval [$3, $5]). Each succeeding year, the price differential follows the same pattern:between 75 percent and 125 percent of the prior year price differential. Should Quillenexpand capacity? Why or why not?
SOURCE: R Sansing.
408 Chapter 8
zim36725_ch08_347-408.qxd 12/15/09 2:02 PM Page 408

409
Chapter Nine
Absorption CostSystems
Chapter Outline
A. Job Order Costing
B. Cost Flows through the T-Accounts
C. Allocating Overhead to Jobs
1. Overhead Rates
2. Over/Underabsorbed Overhead
3. Flexible Budgets to Estimate Overhead
4. Expected versus Normal Volume
D. Permanent versus Temporary VolumeChanges
E. Plantwide versus Multiple Overhead Rates
F. Process Costing: The Extent of Averaging
G. Summary
Appendix A: Process Costing
Appendix B: Demand Shifts, Fixed Costs,and Pricing
zim36725_ch09_409-467.qxd 12/15/09 2:07 PM Page 409

410 Chapter 9
Chapter 1 described the function of the internal accounting system as providing informationfor decision making and control. Chapters 2 and 4 provided the underlying economic frame-work for decision management and decision control. Chapters 7 and 8 introduced the topicof cost allocations and discussed various reasons why firms allocate costs. These reasonsincluded: decision management, decision control, cost-plus pricing contracts, financialreporting, and taxes. This chapter continues the discussion of cost allocations by describinga particular costing system widely used in manufacturing called absorption costing.
Absorption cost systems ensure that all manufacturing costs are directly traced orallocated to the various products made. The cost objects are the products. If it costs $32 mil-lion to operate a factory that manufactures 620,000 pagers (16 different models), includingunits still in inventory, then an absorption cost system either directly traces or allocates the$32 million among the 620,000 pagers. Absorption cost systems display the same trade-offbetween decision making and control, but most of the discussion of this trade-off is deferredto the next two chapters; this chapter focuses on the mechanics of these cost systems.
Absorption cost systems are widely used in financial reporting for calculating the bookvalue of inventory and cost of goods manufactured. These systems evolved in manufactur-ing firms. However, the same concepts have been applied to the service sector, includingfinancial institutions and service firms such as law firms, hospitals, advertising agencies,and telecommunication firms. To keep the chapter focused, absorption cost systems in ser-vice industries are not described, although several problems at the end of this chapter andin other chapters illustrate absorption costing in nonmanufacturing settings. Actually, non-manufacturing accounting systems are simpler in that they do not have work-in-process andfinished goods inventories. On the other hand, defining the “product” to which costs are al-located is often more difficult. For example, in a bank that offers a wide range of servicesfrom loans to bank accounts, many of which involve numerous common costs, the list ofproducts is not always clear cut. Nonetheless, since there are no substantive differences inabsorption costing in manufacturing versus nonmanufacturing settings (except for invento-ries in manufacturing firms), the concepts described in this chapter should be masteredregardless of the actual organizational context.
There are different types of manufacturing processes:
• Job shops (customized production to a customer’s specification).
• Batch manufacturing (standardized products manufactured in batches of given lot sizeseither to meet customer orders or for inventory).
• Assembly processes (finished parts and subassemblies assembled into a finishedproduct).
• Continuous flow processing lines (such as oil refineries and chemical processing plants).
Plants often consist of different production processes. For example, parts may be man-ufactured in batches in one department and assembled into finished products in anotherdepartment. These different production processes usually require different accounting sys-tems to accumulate the costs and assign them to products. There are basically two types ofabsorption systems: job order systems and process cost systems. Job order costing is usedin departments that produce output in distinct jobs (job order production) or batches (batchmanufacturing). Job order costing is also widely used in assembly processes. A job mightconsist of a single unit, such as the construction of an office building, or a batch of units,such as 200 windshield wiper motors for automobiles. In a service organization, a jobmight be handling a client’s lawsuit or processing a loan application at a bank. The cost ofeach job is tracked separately, and job order cost systems accumulate costs by jobs.Alternatively, some assembly processes and continuous flow production processes use
zim36725_ch09_409-467.qxd 12/15/09 2:07 PM Page 410
Absorption Cost Systems 411
ManagerialApplication:Cost Controlin Women’sProfessionalSoccer
After just three seasons, the Women’s United Soccer Association (WUSA) folded.Now Women’s Professional Soccer (WPS) plans to launch a new U.S. league in 2009.At the heart of the new league is a no-nonsense business plan based on tough cost con-trols. The WUSA failed because of high costs, low attendance, and pathetic TV ratings.The league consumed vast sums ($100 million) without making money. Its revenuesfrom corporate sponsorships failed to cover the deficit. However, the WPS businessplan focuses on cost control. The new league will keep player salaries down while tak-ing advantage of new, smaller-venue stadiums that are less costly to rent. This storyillustrates the critical importance of first understanding an organization’s costs, andthen controlling them.
SOURCE: K O’Sullivan, “Going for the Gold,” CFO, July/August 2008, pp. 46–53.
process cost systems. Production in these settings (e.g., soft-drink producers and oilrefining) is continuous and distinct batches do not exist. Costs are assigned to the produc-tion processes and ultimately to the products flowing through the various processes. Witheither system, all manufacturing costs are assigned to the products produced.
In practice, there is great diversity in how firms’ accounting systems assign costs toproducts, jobs, or activities. Even within batch processing departments, no two systems areexactly the same. Many plants use hybrids of job order and process costing. Each accountingsystem is tailored to the peculiarities of the department or plant. However, there are similar-ities across all these systems that are addressed in this chapter. Section A describes job ordercosting. Section B describes how job order costs flow through the manufacturing T-accounts.The central problem addressed in cost systems is how to treat costs that cannot be traceddirectly to the product, job, or service. The allocation of these overhead cost to products/production is often a key design issue in costing systems, and section C describes how over-head is allocated to manufacturing jobs. Section D discusses permanent versus temporaryvolume changes, and section E describes the use of single versus multiple overhead rates forallocating overhead to jobs. Process costing is addressed in section F. Section G summarizesthe chapter. Appendix A provides a more in-depth discussion of the mechanics of processcosting. Appendix B illustrates the relations among volume, average costs, and prices.
A. Job Order CostingTo illustrate job order costing in a manufacturing setting, consider a plant that producesmultiple products. Each product is produced in a batch requiring several different rawmaterial inputs and several different classes of direct labor. Moreover, the products utilizevarious combinations of common resources such as machines, supervisors, engineers, andfactory space. Every job manufactured passes through a common machining process. Thetime spent in this machining center is recorded for each job and used to allocate overheadcosts to the job. Each job has a job order cost sheet that records the costs attached to theproducts produced in the batch and the number of machine hours spent processing the job.A typical job order cost sheet appears in Table 9–1. The job sheet in Table 9–1 is the un-derlying source document in the job order cost system. Prior to computers, manufacturingfirms maintained job order cost sheets manually. Today, job order cost sheets are electronicrecords in computer systems.
The job sheet records all direct materials issued for the job, including the type, quantity,and cost of materials. Each day, factory employees record the time they spent working on
zim36725_ch09_409-467.qxd 12/15/09 2:07 PM Page 411
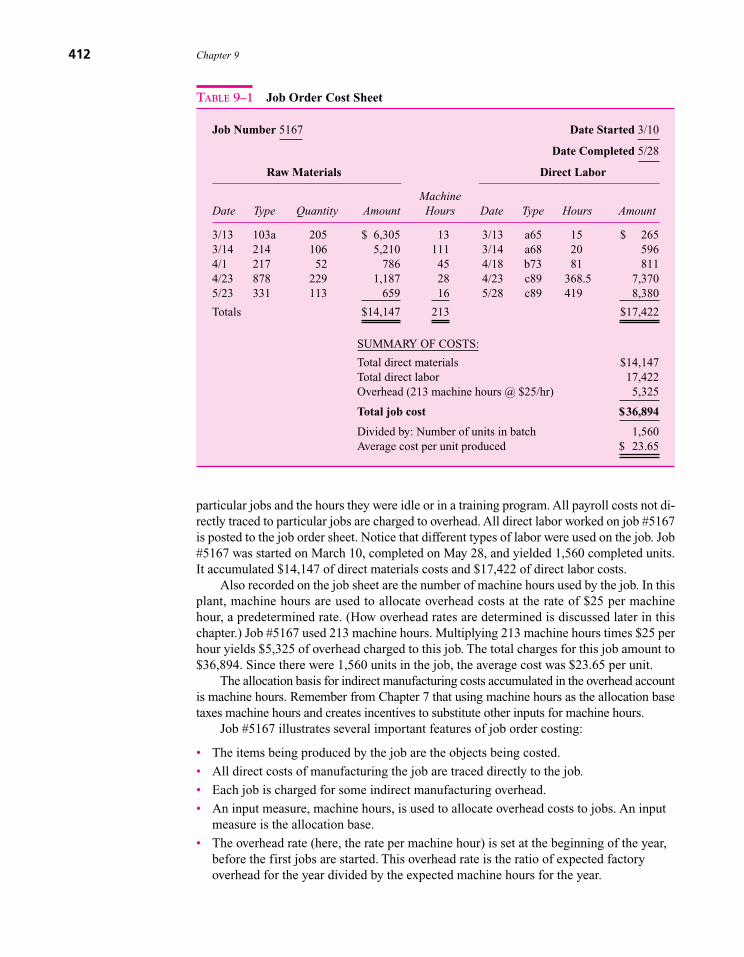
particular jobs and the hours they were idle or in a training program. All payroll costs not di-rectly traced to particular jobs are charged to overhead. All direct labor worked on job #5167is posted to the job order sheet. Notice that different types of labor were used on the job. Job#5167 was started on March 10, completed on May 28, and yielded 1,560 completed units.It accumulated $14,147 of direct materials costs and $17,422 of direct labor costs.
Also recorded on the job sheet are the number of machine hours used by the job. In thisplant, machine hours are used to allocate overhead costs at the rate of $25 per machinehour, a predetermined rate. (How overhead rates are determined is discussed later in thischapter.) Job #5167 used 213 machine hours. Multiplying 213 machine hours times $25 perhour yields $5,325 of overhead charged to this job. The total charges for this job amount to$36,894. Since there were 1,560 units in the job, the average cost was $23.65 per unit.
The allocation basis for indirect manufacturing costs accumulated in the overhead accountis machine hours. Remember from Chapter 7 that using machine hours as the allocation basetaxes machine hours and creates incentives to substitute other inputs for machine hours.
Job #5167 illustrates several important features of job order costing:
• The items being produced by the job are the objects being costed.
• All direct costs of manufacturing the job are traced directly to the job.
• Each job is charged for some indirect manufacturing overhead.
• An input measure, machine hours, is used to allocate overhead costs to jobs. An inputmeasure is the allocation base.
• The overhead rate (here, the rate per machine hour) is set at the beginning of the year,before the first jobs are started. This overhead rate is the ratio of expected factoryoverhead for the year divided by the expected machine hours for the year.
412 Chapter 9
TABLE 9–1 Job Order Cost Sheet
Job Number 5167 Date Started 3/10
Date Completed 5/28
Raw Materials Direct Labor
MachineDate Type Quantity Amount Hours Date Type Hours Amount
3/13 103a 205 $ 6,305 13 3/13 a65 15 $ 2653/14 214 106 5,210 111 3/14 a68 20 5964/1 217 52 786 45 4/18 b73 81 8114/23 878 229 1,187 28 4/23 c89 368.5 7,3705/23 331 113 659 16 5/28 c89 419 8,380
Totals $14,147 213 $17,422
SUMMARY OF COSTS:
Total direct materials $14,147Total direct labor 17,422Overhead (213 machine hours @ $25/hr) 5,325
Total job cost $36,894
Divided by: Number of units in batch 1,560Average cost per unit produced $ 23.65
zim36725_ch09_409-467.qxd 12/15/09 2:07 PM Page 412

Absorption Cost Systems 413
• Reported product costs are average rather than variable or marginal costs. Each job isassigned a portion of the overhead. Since overhead contains both variable and fixedcosts, overhead distributed to jobs contains some fixed costs.
B. Cost Flows through the T-AccountsJob order cost sheets allow the assignment of all factory costs to the jobs flowing throughthe factory. As jobs enter the factory and remain in process, direct labor costs and directmaterials costs are posted to job sheets via the computer system.
Table 9–1 illustrated the job order cost sheet for one job. Modern factories can havehundreds or even thousands of jobs in various stages of completion in the factory at any onetime. The accounting system tracks the costs charged to each job by posting them to ledgeraccounts (T-accounts) via the usual mechanics of double-entry bookkeeping. As costs arecharged to individual jobs, they are also entered in a work-in-process inventory account,which contains all the dollars of jobs in process, including the direct materials, direct labor,and overhead allocations. As raw materials move from the storeroom to the factory floor forindividual jobs, their dollars are transferred out of the raw materials account and into thework-in-process account.
Figure 9–1 diagrams the flow of costs among the various T-accounts. When a job isfinished and transferred to finished goods inventory, the total job cost from the job order costsheet is transferred out of the work-in-process T-account and into the finished goods T-account.Similarly, when the goods are sold, the dollars flow out of the finished goods T-account andinto the cost-of-goods-sold T-account.
The overhead T-account contains all indirect labor (supervisors as well as factory work-ers who are not working on jobs because they are either in training programs, setting up ormaintaining machines, or idle), indirect materials (supplies not directly assignable to partic-ular jobs), and other factory costs. Other factory costs include insurance, property taxes,depreciation, accounting costs, purchasing, security, general factory management, and util-ities. These costs represent the common resources used by all jobs. In a typical plant, directlabor is about 30 percent of total factory costs, direct materials is another 30 percent, andoverhead is 40 percent. However, these percentages can vary widely. Direct labor can be aslow as 1 percent of total manufacturing costs and overhead as high as 80 percent. The
HistoricalApplication:Job OrderCost Sheetsand UnitedStates Steel
In the 1870s, Andrew Carnegie built the Thompson Steel Works in Pittsburgh, whichlater became U.S. Steel. One of Carnegie’s many management innovations and hisobsession was a detailed cost accounting system. Each department in the steel workslisted the amount and cost of labor and materials used by each job as it passed throughthe department. Carnegie received daily reports showing the direct costs of the prod-ucts produced and would repeat, “Watch the costs and the profits will take care ofthemselves.”
Carnegie’s cost sheets were called a marvel of ingenuity and careful accounting. Herequired his people to explain the most minute change in unit costs. Carnegie and hismanagers used these data to evaluate the performance of his people, maintain the qual-ity and mix of raw materials, evaluate improvements in process and product, and priceproducts. New orders would not be accepted until costs had been carefully checked.
SOURCE: A Chandler, The Visible Hand: The Managerial Revolution in American Business (Cambridge, MA: HarvardUniversity Press, 1977), pp. 267–68.
zim36725_ch09_409-467.qxd 12/15/09 2:07 PM Page 413

overhead T-account is a control account. It is used to temporarily accumulate and then dis-tribute the indirect costs to the jobs. At the end of the accounting period, any remaining bal-ance in this account must be charged to a balance sheet or income statement account.
Management must decide which inventory flow assumption to use in making the trans-fers between the various T-accounts. Should the costs follow a first-in, first-out (FIFO);last-in, first-out (LIFO); or specific identification flow? This decision is discussed in fi-nancial accounting, particularly with regard to the tax implications of the LIFO/FIFOchoice. (In periods of rising costs, LIFO reduces reported income and hence taxes by tak-ing the most recent and thus highest costs to the income statement.) However, the inventoryaccounting decision affects both decision making and control. For example, if LIFO isused, the most recent prices flow through the accounts and old prices remain in inventory.LIFO produces more timely (current) information regarding price changes than FIFO. Inparticular, LIFO-based product costs are computed using the most recent raw materialprices and usually more closely reflect replacement costs.
To the extent replacement costs are good proxies for opportunity cost, LIFO is usuallybetter for decision making. However, a LIFO system is usually more costly to implementand operate because more data must be maintained, particularly past prices and inventorylayers. LIFO also creates control problems. Performance evaluation systems based onaccounting profits create incentives for managers close to retirement or with a short hori-zon in the firm to liquidate old LIFO inventory levels, thereby generating large accountingprofits (but also large tax liabilities). The choice of inventory flow assumptions is importantbecause it affects taxes, financial statements (and the external contracts based on them),internal decision making, and control. To simplify the discussion, for the remainder of thistext we assume that the firm uses the specific identification inventory valuation method,unless otherwise stated.
414 Chapter 9
Overhead
Other items:Insurance
TaxesDepreciation
Overheadabsorbed
= OH rate �Machine hours
Labor
Direct labor
Indirect labor
Totalfactory labor
Materials
Indirectmaterials
Directmaterials
All materialsand supplies
Work in process
Cost ofunits
completed
Finished goods
Cost ofunitssold
Cost of goods sold
FIGURE 9–1
Schematic of a job order cost system
zim36725_ch09_409-467.qxd 12/15/09 2:07 PM Page 414

Absorption Cost Systems 415
TABLE 9–2 Income Statement for a Manufacturing Firm
SAMPLE COMPANYIncome Statement
($000s)
Sales $2,200Cost of goods sold:
Finished goods—Jan. 1 $ 217Cost of goods manufactured* 1,337
Cost of goods available for sale 1,554Less finished goods—Dec. 31 (192)
Cost of goods sold (1,362)
Gross profit $ 838Less
Selling and administrative expenseVariable $ 216Fixed 349 (565)
Net income $ 273
*Cost of goods manufactured:
Direct materials
Materials inventory—Jan. 1 $ 13
Purchases 232
Material available for use 245
Less materials inventory—Dec. 31 (20)
Material used $225
Direct labor 480
Manufacturing overhead 665
Total manufacturing costs incurred $1,370
Add work in process—Jan. 1 90
Total in process $1,460
Less work in process—Dec. 31 (123)
Cost of goods manufactured $1,337
Table 9–2 illustrates how the various T-accounts in Figure 9–1 are used in constructing thefirm’s income statement. The cost of goods sold in the income statement consists of the changein finished goods inventory plus the cost of goods manufactured during the period, whichin turn is composed of direct labor, direct materials, and overhead. Table 9–2 shows sales of$2.2 million. The cost of goods sold is $1.362 million, calculated by taking the sum of thebeginning inventory and cost of goods manufactured and deducting the ending inventory.The cost of goods manufactured is calculated in the footnote to Table 9–2. It consists of directmaterials and labor and overhead plus the change in work-in-process inventories.
Q9–1 What are the two distinct absorption systems?
Q9–2 Describe the flow of costs through the T-accounts in a joborder cost system.
Q9–3 Suppose that during the production of a particular job, amachine malfunctions, destroying $2,750 of raw materials.How should the cost of these materials be handled? Shouldthey be charged to the job in process?
ConceptQuestions
zim36725_ch09_409-467.qxd 12/15/09 2:07 PM Page 415

C. Allocating Overhead to JobsThe previous two sections illustrated how a job order cost system accumulates productcosts and how the accounting system tracks manufacturing costs through the ledger ac-counts. This section describes the mechanics of using overhead rates to distribute indirectcosts to jobs. The use of prospective overhead rates (those estimated at the beginning ofthe year) results in over- or underabsorbed overhead at the end of the year, and this sectiondiscusses how this over/underabsorption is treated. The concept of flexible budgeting isreintroduced and applied to calculating overhead rates. This section concludes by describ-ing alternative ways of estimating budgeted volume.
The most interesting aspect of job costing is its treatment of overheads because it involvesmanagement’s judgment and offers managers discretion in product costing and income de-termination. If all resource utilization and factory costs could be traced directly to the prod-ucts consuming those resources, then cost accounting would be nothing more thanarithmetic. The innovation of job order costing is the accumulation of all indirect costs inan overhead account and the subsequent distribution of these costs to individual jobsthrough the use of an overhead rate. An overhead allocation base is chosen to allocate theindirect costs to jobs. Machine hours are used as the overhead allocation base in Table 9–1.As work is performed on the job, overhead is charged to the job based on total machinehours used. A prospective overhead rate, set at the beginning of the year, allows jobs to becosted as they are produced.
Most firms use prospective, not actual, overhead rates. Suppose overhead is charged tojobs based on the total actual machine hours used in the plant for the entire year. Then thetotal cost of each job (including overhead) is unavailable until the end of the year. The over-head costs for the first job cannot be determined until all the jobs are finished. For exam-ple, suppose the first job completed in the year uses 1,000 machine hours and overhead isassigned based on actual machine hours. Overhead on the first job could be 1 percent ofactual overhead if actual total hours for the year end up being 100,000 hours or 2 percent ifthe final number of machine hours is 50,000 hours. Using a prospective overhead rateallows more timely reporting of total costs, including indirect costs.
Notice in Table 9–1 that factory volume is measured in machine hours, not units ofproduction. That is, volume is being measured with an input measure, not an output mea-sure. This practice is common in most plants. Inputs are used to measure volume becausemost plants produce heterogeneous products. If a factory manufactures small pumps andlarge pumps, the number of pumps manufactured can give a misleading measure of plantoutput. Plant volume can actually fall while the total number of pumps increases if there isa shift from large to small pumps. Therefore, volume in plants manufacturing heteroge-neous products is based on an input measure rather than an output measure.
The input measure selected (machine hours, direct material dollars, direct labor hours,direct labor dollars) is usually the one that has the greatest association or cause-and-effectrelation with overhead. That is, the allocation base is the factor input most correlated withoverhead. Overhead consists of both fixed and variable indirect costs. In the long run, fixedcosts can be adjusted to changes in volume.
Most firms, select their allocation base because there was a logical or statistical as-sociation with overhead. For example, as plant output expands, additional supervisorsmust be hired. Therefore, the cost driver of supervision can be either the number of ma-chine hours or the number of direct labor hours. If overhead costs are most closely relatedto direct labor hours, then direct labor hours should be the volume measure. In Chapter 7,overhead rates were shown in certain circumstances to serve as a proxy for hard-to-observe
1. OverheadRates
416 Chapter 9
zim36725_ch09_409-467.qxd 12/15/09 2:07 PM Page 416

Absorption Cost Systems 417
opportunity costs. If the overhead rate (which is the average cost) is less than or equal tothe marginal cost imposed on the firm when output expands by one more unit, allocatingoverhead is better than not allocating it. The factor input used as the volume measurethen becomes “taxed,” and the choice of volume measure becomes, in essence, a decisionregarding which factor input management wishes to tax. Usually, management wants totax the input that imposes externalities on other parts of the organization. Ideally, theoverhead rate provides an estimate of the opportunity cost of using one more unit of theallocation base.
Four points of this discussion and Figure 9–1 are worth noting:
1. The overhead rate equals annual budgeted overhead divided by budgeted volume.This measure averages out seasonal variability in monthly expenditures andvolume. Each completed job can be costed, even though the total overhead andactual volume for the year are not known.
2. Budgeted volume is measured using an input, such as direct labor, instead ofoutput. Typical volume measures are direct labor hours, direct labor dollars, directmaterial dollars, and machine hours.
3. The measure of volume chosen as the allocation base is usually the one that hasthe greatest association with overhead.
4. The choice of the overhead volume measure is critical; because it is the taxedinput, managers will seek to reduce its use.
Point 2 above suggests that direct labor and machine hours are common overheadallocation bases. Most manufacturing firms use direct labor (direct labor hours or directlabor costs) to allocate at least a portion of factory overhead as a way to control laborcosts. Machine hours and direct material dollars are other commonly employed alloca-tion bases. While the predominant overhead allocation base in many plants is direct la-bor, it is not uncommon for manufacturing overhead cost to exceed direct labor cost bya factor of two. Direct labor costs are thus being used to allocate a pool of costs twicethe size of the allocation base. Chapter 11 addresses whether such a scheme makessense.
Suppose a plant manufactures aluminum cans of different sizes. Machine hours in the alu-minum extrusion machine are used to measure volume. At the end of the year, the overheadaccount likely contains a balance amount:
Overhead Account
Actual Totaloverhead overheadincurred absorbed � Budgeted
to units in overhead rateproduction �
Volume measure(machine hours)
Underabsorbed Overabsorbed
Total overhead absorbed is the budgeted overhead rate times the volume produced. Thefirm has 100,000 budgeted machine hours, which is the budgeted volume for the aluminumcan plant for the year. Annual budgeted overhead is $2,500,000. The budgeted overheadrate is thus $25 per machine hour. Suppose that at the end of the year, 103,000 machine
2. Over/UnderabsorbedOverhead
zim36725_ch09_409-467.qxd 12/15/09 2:07 PM Page 417

hours have been used. The amount of overhead absorbed is 103,000 � $25 � $2,575,000.If actual overhead incurred was $2,565,000, then there is $10,000 of overabsorbed over-head in the overhead account.
Overhead Account
Actual Totaloverhead overheadincurred: absorbed:$2,565,000 103,000 � $25
� $2,575,000
$10,000Overabsorbed
The overhead T-account shows a $10,000 overabsorbed balance at the end of the year.Recall that the reason a balance remains in the overhead account is because the overhead rateis set at the beginning of the year—before either the actual overhead or the actual volume areknown. The accounting system charged work in process with $10,000 more overheadthan was actually incurred by the plant. This can arise because actual overhead differs from
418 Chapter 9
ManagerialApplication:Cost Structureby Industry
A survey of overhead rates revealed considerable variation in cost structure acrossindustries. In the figure below, direct materials is only 20 percent of total cost in telecom/media but over 40 percent in retail/consumer goods. Direct labor is about 20 percent inmanufacturing but almost 50 percent in finance/insurance. Operating overhead variesfrom 12 percent in finance/insurance to over 20 percent in manufacturing. Interestingly,SGA (selling, general, and administrative) shows little variation across industries(between 20 and 22 percent).
SOURCE: Ernst & Young and IMA, “State of Management Accounting,” 2003,www.imanet.org/pdf/SurveyofMgtAcctingEY.pdf.
Direct material
Direct labor
SGA overhead
Operating overhead
100
Man
ufac
turin
g
Telec
om/m
edia
Finan
ce/in
sura
nce
Energ
y/ut
ilities
Retail
/con
sum
er g
oods
Pharm
aceu
ticals
80
60
40
20
0
Per
cent
zim36725_ch09_409-467.qxd 12/15/09 2:07 PM Page 418

Absorption Cost Systems 419
budgeted overhead and/or because the volume measure (machine hours) differs from bud-geted volume. Chapter 13 describes how over/underabsorbed overhead is analyzed to deter-mine the cause of the variance.
There are three ways of disposing of the over/underabsorbed balance at year-end.First, write it off to cost of goods sold. Suppose overhead absorbed is $3 million. If actualoverhead incurred is $2.9 million, $100,000 of overhead that was not incurred was stillcharged to work in process (WIP). When this $100,000 of overabsorbed overhead is writ-ten off to cost of goods sold, cost of goods sold is reduced and income rises by $100,000(before taxes). If, on the other hand, actual overhead incurred is $3.2 million, overhead isunderabsorbed by $200,000. In this case, $200,000 of overhead was incurred but notcharged to WIP. Writing off this $200,000 of underabsorbed overhead causes cost of goodssold to increase and income to fall by $200,000 (before taxes).
The second method of disposing of over/underabsorbed overhead is to allocate (pro-rate) it among work-in-process, finished goods, and cost-of-goods-sold T-accounts basedon the amount of overhead in these categories. For example, in the previous example therewas $100,000 of overabsorbed overhead. Suppose that of the $3 million of overheadabsorbed, $0.5 million is still in work in process, $1.0 million remains in finished goodsinventory, and $1.5 million is in cost of goods sold. Then the following illustrates theproration of the $100,000 of overabsorbed overhead:
Work in Finished Cost ofProcess Goods Goods Sold Total
Overhead absorbed $500,000 $1,000,000 $1,500,000 $3,000,000Percentage of overhead absorbed 16.67% 33.33% 50% 100%Overabsorbed overhead prorated $(16,670) $ (33,330) $ (50,000) $ (100,000)Overhead before proration 500,000 1,000,000 1,500,000 3,000,000
Overhead after proration $483,330 $ 966,670 $1,450,000 $2,900,000
HistoricalApplication:Over- andUnderabsorbedOverheadUnderstood by1910
By 1910, most large U.S. manufacturing companies had come to use overhead accountsto accumulate and distribute these costs to products. One writer described the typical ac-counting treatment as follows:
The overhead account is charged each month . . . with the items composing the indirect ex-penses, and is credited through the fixed overhead percentage with the total amount appliedto the various production orders and cost sheets. The balance, if a debit, shows the undistrib-uted portion of the overhead, which means that the fixed percentage added to the labor costwas not sufficient to cover the indirect expenses. When there is a credit balance, however, itshows that the percentage allowed was more than sufficient.
Absorption cost systems, including the use of prospective overhead rates, have survivedover 100 years and been used in a variety of firms, absent government regulations. Thesurvival of those systems in firms that operate in competitive markets is evidence thatabsorption cost systems are providing benefits that exceed their costs.
SOURCE: J Nicholson, Cost Accounting—Theory and Practice (New York: The Ronald Press Co., 1913), p. 197. Quoted by P Garner, Evolution of Cost Accounting to 1925 (Montgomery, AL: University of Alabama Press, 1954), p. 176.
zim36725_ch09_409-467.qxd 12/16/09 9:43 AM Page 419

The third method of disposing of over/underabsorbed overhead is to recalculate the costof each job using actual overhead incurred and actual volume to compute a revised, end-of-year overhead rate. The second and third methods produce similar net income and inventoryvaluations. The third method is the most expensive in terms of bookkeeping and data pro-cessing costs, especially if a large number of jobs have been manufactured and each one is tobe recosted. One reason to choose the third alternative of recosting all jobs is that the firm hascost-plus contracts whereby some of the firm’s revenues are tied to reported costs. In this case,recosting each job can change the amount of overhead assigned to products manufacturedunder cost-plus contracts, thereby changing the firm’s revenues, profits, and cash flows.
Usually the magnitude of the over/underabsorbed overhead is small, and thus disposingof the balance is inconsequential. Writing small balances off to cost of goods sold is expe-dient and senior managers do not concern themselves with such technical accounting issues.However, large balances remaining in the overhead account attract senior managers’ and theexternal auditors’ attention. External auditors have an incentive to be conservative since theyare sued more frequently for overstatements of income than for understatements. The audi-tors are therefore more likely to allow a larger write-off to cost of goods sold of underab-sorbed overhead than of overabsorbed overhead, assuming that these write-offs materiallyaffect reported income. Underabsorbed overhead reduces income, whereas overabsorbedoverhead increases income.
As described previously, most firms use prospective overhead rates, or those estimatedbefore the fiscal year begins. This requires managers to forecast next year’s overheadrate. One way to forecast the overhead rate is to use a flexible budget (Chapter 6). The firststep requires estimating budgeted annual overhead.
Budgeted annual overhead � Fixed overhead � Variable overhead
� FOH � VOH � BV
where
FOH � Fixed overheadVOH � Variable overhead per unit of volume
BV � Budgeted volume
3. FlexibleBudgets toEstimateOverhead
420 Chapter 9
ManagerialApplication:OverheadAllocationsand GAAP
One reason manufacturing overhead is allocated to work in process and therefore toproduct costs is for inventory valuation for external financial reports. Generally ac-cepted accounting principles (GAAP) require:
In keeping with the principle that accounting is primarily based on cost, there is a presump-tion that inventories should be stated at cost. . . . It should also be recognized that the exclu-sion of all overheads from inventory does not constitute an accepted accounting procedure.The exercise of judgment in an individual situation involves a consideration of the adequacyof the procedures of the cost accounting system in use, the soundness of the principlesthereof, and their consistent application.
Thus, GAAP allows management significant discretion. It can either take over/underabsorbed overhead to the income statement by writing it off to cost of goods soldor allocate it among the inventory accounts.
SOURCE: Accounting Research Bulletin No. 43, “Restatement and Revision of Accounting Research Bulletins,” in FinancialAccounting Standards Board, Original Pronouncements (Burr Ridge, IL: Richard D. Irwin, 1992), Chapter 4, paragraph 5,pp. 15–16.
zim36725_ch09_409-467.qxd 12/15/09 2:07 PM Page 420

Absorption Cost Systems 421
Suppose that fixed overhead is projected at $500,000, variable overhead is projected at$20 per machine hour, and 100,000 machine hours are budgeted. Then budgeted annualoverhead is
Budgeted annual overhead � $500,000 � $20 � 100,000 machine hours
� $500,000 � $2,000,000
� $2,500,000
The second step involves calculating the budgeted annual overhead rate:
Budgeted overhead rate �
� $25�machine hour
The advantage of using flexible budgets is the ability to derive an estimate of totaloverhead that varies with volume. Overhead is not treated as a purely fixed cost but ratheras a mixture of fixed and variable costs. Analyzing how total overhead varies with volumeshould lead to a more accurate estimate of budgeted overhead.
Chapter 6 described the budgeting process. One important function of that process isestimating the budgeted overhead rate. This occurs prior to the beginning of the year. Hence,the budgeted overhead rate is a prospective rate. To simplify the terminology, throughout theremainder of this book, whenever the term overhead rate is used, it refers to the “budgetedoverhead rate” unless otherwise specifically stated.
Exercise 9–1
The Rosen Company has two manufacturing departments, production and assembly. Each de-
partment has separate overhead rates. Rosen made the following estimates for its production
and assembly departments for the current calendar year:
Production Assembly
Factory overhead $300,000 $100,000Direct labor cost $1,000,000 $210,000Machine hours 1,500 6,250Direct labor hours 50,000 10,000
The company uses a budgeted overhead rate to apply overheads to orders. Machine hours
are used to allocate overhead in the production department and direct labor hours are used to
allocate overhead in the assembly department.
continued
$2,500,000
100,000 machine hours
HistoricalApplication:Behavior ofOverheadCosts
It has long been recognized that overhead costs contain both a fixed and a variablecomponent:
[Overhead costs] refer to costs that cannot be traced home and attributed to particular units ofbusiness in the same direct and obvious way in which, for example, leather can be traced to theshoes that are made of it. And most of the real problems involve one other fact; namely, thatan increase or decrease in output does not involve a proportionate increase or decrease in cost.
SOURCE: J Clark, Studies in the Economics of Overhead Costs (Chicago: University of Chicago Press, 1923), p. 1.
zim36725_ch09_409-467.qxd 12/15/09 2:07 PM Page 421

Required:
a. Calculate the overhead rate for each department.
b. A summary of job #77 follows:
Production Assembly
Direct materials used $3,000 $2,000Direct labor costs $11,000 $15,500Machine hours 100 250Direct labor hours 500 750
What are overhead costs for job #77?
c. Actual operating results for the current year are:
Production Assembly
Factory overhead $325,000 $ 65,000Direct labor cost $900,000 $230,000Machine hours 1,550 6,250 Direct labor hours 47,000 10,500
Calculate the over/underapplied overhead for each department.
Solution:
a. Overhead rate:
For the Production Department
For the Assembly Department
b. Overhead costs for job 77:
Production Department $200 � 100 machine hours � $20,000
Assembly Department $10 � 750 direct labor hours � $ 7,500
Total overhead cost $27,500
c. The over/underapplied overhead per departments are:
Production Assembly
Actual overhead $325,000 $65,000Overhead applied1,550 � $200/machine hour $310,00010,500 � $10/direct labor hour $105,000
$ 15,000 U $ 40,000 O
NOTE: U � Underapplied; O � Overapplied.
Factory overhead
Direct labor hours
$100,000
10,000� $10.00 per direct labor hour
Factory overhead
Machine hours
$300,000
1,500� $200.00 per machine hour
422 Chapter 9
zim36725_ch09_409-467.qxd 12/15/09 2:07 PM Page 422

Absorption Cost Systems 423
Previous sections have described prospective overhead rates as the ratio of budgeted over-head to budgeted volume. Budgeted volume can be determined in two ways. Budgetedvolume can be estimated as either the volume expected for the coming year (expectedvolume) or the long-run average volume. Long-run average volume is called normalvolume, or the average volume over both upturns and downturns in the economy.
The following example motivates the important difference between expected volumeand normal volume. Fast Change offers automobile oil changes at $30 each. This is the onlyservice provided. The variable cost ($20) of providing an oil change includes both directlabor and supplies (oil and oil filter). The fixed cost of $4,000 per month includes adver-tising, the manager’s salary, rent, utilities, insurance, and so forth. Table 9–3 summarizeslast month’s operations.
Last month Fast Change had net income before taxes of $1,000 on 500 oil changes,and the full (average) cost of an oil change as shown in the table was $28.00 ($20 of vari-able cost plus $8.00 � $4,000 � 500 of fixed cost).
This month, the price of an oil change ($30) remains constant, as does the variable costand fixed cost. However, the number of oil changes falls from 500 to 350. Table 9–4 sum-marizes operations for this month.
Fast Change lost $500 this month. Notice that the average cost of an oil change hasrisen from $28.00 to $31.43 ($20 of variable cost plus $11.43 � $4,000 � 350 of fixedcost). The accounting system reports that the cost of an oil change increased. A manager’snatural tendency when confronted by a cost increase is to raise prices. But in Fast Change’scase, average costs rose because volumes fell. The out-of-pocket costs (the variable cost) ofthe service did not change. The cost of doing one more oil change is still $20. The oppor-tunity cost of an oil service has not changed. Therefore, the price of these services shouldnot be raised. In fact, they probably should be lowered because the demand for oil changeshas dropped. For example, if a new competitor has opened up down the street and is offer-ing oil changes at lower prices, Fast Change will also have to lower its prices. Appendix Billustrates the relations among shifts in demand, changes in fixed costs, and price changes.
The preceding Fast Change example illustrates an important point. Basing overheadrates on short-run fluctuations in volume causes accounting costs, but not opportunitycosts, to rise when volume falls and causes them to fall when volume rises. This occurs be-cause overhead contains some fixed costs. The example demonstrates that overhead costs
4. Expectedversus NormalVolume
TABLE 9–3 Fast Change Summary of Operations Last Month
OilChanges
Price per oil change $30Variable cost per service $20Number of oil changes 500
Revenue $ 15,000Variable cost (10,000)Fixed cost (4,000)
Net income $ 1,000
Total cost $ 14,000Number of oil changes �500
Cost per oil change $ 28.00
zim36725_ch09_409-467.qxd 12/15/09 2:07 PM Page 423

per unit rise when volume declines and vice versa. This sends inappropriate signals tomanagers to raise prices when demand falls and to lower prices when demand rises. Profit-maximizing managers want to do just the opposite. To avoid incorrect pricing decisions,managers should be wary of altering overhead rates due to short-run fluctuations in vol-ume. To calculate an overhead rate that does not fluctuate with volume, use normal volumeas the allocation base. Normal volume is the long-run average volume during good and badyears. Often, normal volume is the volume projected when the plant was built.
Suppose a firm has two identical plants: one in Rochester, Minnesota, and one inChicago. Suppose further that volume falls by half and that management decides to shutdown the Chicago plant. There are ongoing unavoidable fixed costs in the Chicago plant of$1 million per month, including property taxes on the closed plant. In most cases it wouldbe inappropriate to charge these fixed costs of $1 million to the Rochester plant and in-crease the Rochester overhead rate. Now suppose that the two plants are located next toeach other in Rochester and one is closed. It is still inappropriate to charge the remainingplant’s overhead account with the unavoidable $1 million continuing costs. By the samelogic, if there is only one plant and its volume falls by 50 percent, one should not increasethe overhead charge on the remaining production. If volume falls and the overhead rate isallowed to rise, the firm could be creating a death spiral (Chapter 8). If volume falls, the un-allocated overhead costs should be charged directly to profits, not to the remaining prod-ucts produced. This is the logic underlying normal volume. The base volume used in thedenominator to compute the overhead rate should be the long-run normal volume so thatoverhead rates and reported product costs do not vary inversely with volume.
If normal volume and not expected volume is used to set overhead rates, then whenactual volume is less than normal volume, overhead is underabsorbed. Work in process,finished goods, and cost of goods sold, collectively, do not contain all of the overheadincurred. When this underabsorbed overhead is written off to cost of goods sold, cost ofgoods sold rises and net income falls. When actual volume exceeds normal volume, over-absorbed overhead results; more overhead is included in product costs than is actually in-curred. This overabsorbed overhead, when written off, causes cost of goods sold to fall andnet income to rise. However, in both cases the amount of overhead charged to individualproducts remains the same—it is based on normal volume. The costs of individual productsdo not vary inversely with volume.
424 Chapter 9
TABLE 9–4 Fast Change Summary of Operations This Month
OilChanges
Price per oil change $30Variable cost per service $20Number of oil changes 350
Revenue $10,500Variable cost (7,000)Fixed cost (4,000)
Net loss $ (500)
Total cost $11,000Number of oil changes �350
Cost per oil change $ 31.43
zim36725_ch09_409-467.qxd 12/15/09 2:07 PM Page 424

Absorption Cost Systems 425
Using normal volume improves decision management, particularly the pricing decision.For decision control reasons, however, senior managers might not want to use normal volumeand may not want to have over/underabsorbed overhead charged to cost of goods sold. Man-agers responsible for managing the overhead have less incentive to control it if over/underab-sorbed overhead is not charged to product costs. Overhead tends to grow over time and isdifficult to control. When overhead rates vary with expected volume, managers responsiblefor specific overhead items often encounter pressure to reduce overhead growth. Downstreammanagers (e.g., marketing) who receive product costs with overhead included will pressureupstream managers to control their overhead expenditures. There is increased monitoring ofupstream managers by downstream managers. This mutual monitoring is stronger if overheadrates rise when volume falls (i.e., normal volume is not used). However, if volume increases,overhead rates fall and downstream managers have less incentive to monitor overhead costs.
Using normal volume, managers have more discretion in managing earnings becausesetting normal volume is more subjective than setting expected volume. Expected volumecan be compared to current volume, but normal volume is the average over the long term.How long is the long term? Again, normal volume is poorer for decision control.
The choice between using normal volume (long-run average volume) and next year’sexpected volume for calculating overhead rates depends on whether decision managementor decision control is the primary concern. Using normal volume enhances decision man-agement. Using next year’s expected volume enhances decision control. Again, we see thetrade-off between decision management and decision control in making a design choiceabout the internal accounting system. Most firms use expected, not normal, volume. Thus,it appears that decision control is more important than decision management.
Exercise 9–2
Pacemakers Inc. manufactures and distributes a new line of state-of-the-art heart pacemakers
that are implanted into patients to regulate their heart rate. The firm prepares a three-year bud-
get. Included in that budget is the projected overhead rate based on a flexible budget. Overhead
is applied to pacemakers based on direct labor hours. The following table contains manage-
ment’s forecasts of fixed overhead, variable overhead per direct labor hour, and projected an-
nual volume for the next three years, 2010 to 2012. Projected annual volume is estimated by
summing the expected number of each pacemaker to be manufactured in each of the next three
years times the amount of direct labor hours in that pacemaker.
2010 2011 2012
Fixed overhead $2,200 $2,300 $2,500Variable overhead per DLH $ 1.10 $ 1.15 $ 1.20Projected annual volume (DLH) 800 1,200 1,000
DLH � direct labor hours.NOTE: Fixed overhead and projected annual volume in 000s.
Management forecasts that the plant’s average, long-run volume over the next three years
will be 1 million direct labor hours per year.
Required:
a. Calculate the projected overhead rates for 2010 to 2012 using expected volume.
b. Calculate the projected overhead rates for 2010 to 2012 using normal volume.
continued
zim36725_ch09_409-467.qxd 12/15/09 2:07 PM Page 425

c. Even though actual overheads for 2010 to 2012 are not known yet, using your
estimated overhead rate based on expected volume from part (a), forecast
Pacemakers’ over/underabsorbed overhead for 2010 to 2012.
d. Even though actual overheads for 2010 to 2012 are not known yet, using your
estimated overhead rate based on normal volume from part (b), forecast Pacemakers’
over/underabsorbed overhead for 2010 to 2012.
Solution:
a. b.
2010 2011 2012
Fixed overhead $2,200 $2,300 $2,500Variable overhead per DLH $ 1.10 $ 1.15 $ 1.20Projected annual volume (DLH) 800 1,200 1,000Normal annual volume (DLH) 1,000 1,000 1,000
Flexible overhead budget:Based on expected volume $3,080* $3,680 $3,700Based on normal volume $3,300† $3,450 $3,700
*$2,200 � 800 � $1.10.†$2,200 � 1,000 � $1.10.
Projected overhead rate/DLH:Based on expected volume $3.85* $3.07 $3.70Based on normal volume $3.30† $3.45 $3.70
*$3,080 � 800†$3,300 � 1,000
c.
Projected overhead incurred $3,080 $3,680 $3,700Projected over/underabsorbed overhead based on expected volume
Projected overhead absorbedbased on expected volume $3,080 $3,680 $3,700
(Over)/underabsorbed overhead $ 0 $ 0 $ 0
NOTE: Projected overhead incurred is based on the flexible budget � FOH � VOH � Expected volume.
Projected overhead absorbed is based on expected volume � OHR � Expected volume.Where OHR � [FOH � VOH � Expected volume]� Expected volume,Over- or underabsorbed overhead � [FOH � VOH � Expected volume] � OHR �
Expected volume � 0.
d.
Projected overhead incurred $3,080 $3,680 $3,700 Projected over/underabsorbed overhead based on normal volume
Projected overhead absorbedbased on normal volume $2,640* $4,140† $3,700‡
(Over)/underabsorbed overhead $ 440 $(460) $ 0
*$3.30 � 800†$3.45 � 1,200‡$3.70 � 1,000
426 Chapter 9
zim36725_ch09_409-467.qxd 12/15/09 2:07 PM Page 426

Absorption Cost Systems 427
Q9–4 Why would you use a prospective overhead rate toaccumulate the overhead costs of a job?
Q9–5 Give a reason why you might have overabsorbed overhead atthe end of the year.
Q9–6 Give the three ways to eliminate the balance in the overheadaccount at the end of the year.
Q9–7 Why are input measures used in calculating prospectiveoverhead rates?
Q9–8 How are flexible budgets used in absorption cost systems?
D. Permanent versus Temporary Volume ChangesAs discussed previously, basing overhead rates on normal volume (long-run average volume)prevents reported unit costs from falling when volume increases and from rising whenvolume falls. Instead, when actual volume exceeds normal volume, overhead is usuallyoverabsorbed. When this overabsorbed overhead is written off to cost of goods sold, incomeincreases. The opposite usually occurs when normal volume exceeds actual volume. Un-derabsorbed overhead, when written off to cost of goods sold, reduces income.
With normal volume, unit costs do not vary with economic booms and busts. Ac-counting profits will still vary with volume, but accounting product costs do not vary.When the decision is made to acquire physical capacity (e.g., build a plant), implicitassumptions are made regarding normal volume. However, once the capacity is in place,long-run average volume may very well differ from anticipated volume used to justifyacquiring the capacity. For example, managers might underestimate entry by competitors.Suppose a plant is built on the assumption of 100,000 machine hours of output per year for15 years. In the fifth year, a competitor enters the market, lowering normal volume to75,000 machine hours. If managers base the overhead rate on a volume of 75,000 machinehours, unit costs will rise, giving a misleading signal that marginal costs have increased andthat perhaps a price hike is in order. However, this is probably the wrong signal for theaccounting system to send.
If long-run normal volume drops 25 percent (a permanent reduction), then managementmight consider taking a one-time 25 percent write-off of the historical cost of facilities. In ad-dition, they might want to treat 25 percent of the other fixed overhead costs (such as propertytaxes) as a period cost to avoid distorting unit costs. Similarly, if normal volume increases by25 percent (a permanent increase), and the plant has the excess capacity to handle this largervolume, then the depreciable life of the plant and equipment can be shortened. This willincrease the depreciation expense charged to overhead, offsetting the higher volume so thatdepreciation per unit of product does not fall.
While in theory managers can reduce the book value of plant and equipment for perma-nent reductions in volume, thereby reducing the overhead charges, managers are reluctant tomake the write-off for other reasons. Such a write-off is a public admission by the managersthat they overinvested in capacity, which can be damaging to their careers. Moreover, write-offs can provide competitors with useful strategic information to the extent that they areuninformed about the exact amount of the excess capacity.
In summary, temporary changes in volume are assumed to average out overthe business cycle, and no asset write-offs or other accounting changes are necessary.
ConceptQuestions
zim36725_ch09_409-467.qxd 12/15/09 2:07 PM Page 427

However, to prevent dysfunctional pricing decisions, fixed asset write-offs can accom-pany permanent declines in volume, thereby preventing overhead rates and hence unitcosts from rising.
Q9–9 Why should normal volume be used to determine overheadrates?
Q9–10 Why should one-time write-offs of fixed capital be used inabsorption cost systems?
E. Plantwide versus Multiple Overhead RatesThis section describes alternative methods of aggregating overhead costs and allocatingthem to products. Figure 9–2 schematically represents a single, plantwide overhead rate,which is the method used in the examples so far. All of the overhead costs are first accu-mulated in a single overhead account or cost pool, a collection of accounts accumulated forthe purpose of allocating the costs in the pool to activities, products, or processes, and thenallocated to products using a single plantwide overhead rate.
A slightly more complicated way to allocate overhead costs is to use multiple overheadrates for different overhead cost items. In this case, each component of overhead is treatedas a separate cost pool. Figure 9–3 illustrates this method.
ConceptQuestions
428 Chapter 9
ManagerialApplication:CustomerProfitabilityAnalysis
Once the firm has a reliable product costing system that computes accurate productcosts, managers can then analyze individual customer profitability. A profit and lossstatement can be prepared that reports the revenues generated for each customer less thecost of the products sold (from the absorption costing system) less all other costs in-curred to service the customer. These other costs include overnight deliveries, the costof excessive change orders, the extra time spent by engineers or sales people servicingthe customer, the extra costs incurred by purchasing to process short-lead-time orders,and so forth.
One study found that the least profitable 20 percent of customers can reduce profitsby 80 percent, while the most profitable 20 percent of customers can generate 150 per-cent of a company’s profit. Another consultant asserts that 30 percent of customers ofmany firms are not profitable—and two-thirds of those will never be profitable. Hence,it becomes important for firms to identify and take actions to either drop the unprofitablecustomers or convert them into profitable ones (raise prices or cut extra services) andto further cement solid relations with the profitable customers so they don’t leave. Onemanagement consultant advocates creating “customer operating partnerships” to boostbusiness. In these partnerships, suppliers and their profitable customers integrate theirsupply chains together. The supplier operates deep inside the customer’s business. Thiscreates a barrier to entry for potential rivals.
However, at the heart of any customer profitability analysis and customer operatingpartnerships is the firm’s absorption costing system that generates unit costs of the prod-ucts produced and sold to the customers.
SOURCE: J Hyatt, “Future Tense,” CFO, January 2009, pp. 50–54.
zim36725_ch09_409-467.qxd 12/15/09 2:07 PM Page 428

Absorption Cost Systems 429
For example, suppose the overhead account is composed of the following three categories:
Indirect labor $ 750,000Utilities 650,000All other costs 1,100,000
Total overhead $2,500,000
Each category is then allocated to jobs through separate allocation bases. For example,
Overhead Category Allocation Base Budgeted Volume
Indirect labor Direct labor dollars $3 million direct laborUtilities Machine hours 100,000 hoursAll other costs Direct materials dollars $4 million direct materials
A third method of accumulating overhead cost pools and allocating them to productsinvolves developing different overhead rates by departments. Instead of being allocated bycost category, overhead costs are first grouped by departments. Each department is a sepa-rate cost pool. Separate allocation bases are developed for each department, and then over-head costs are allocated to products. Figure 9–4 illustrates this two-step procedure.
Overhead costs
Singleplantwide
overhead rate
PRODUCTS
FIGURE 9–2
Single plantwideoverhead rate
Indirect cost 2(e.g., utilities)
Separateoverhead
rate for eachindirect cost
category
PRODUCTS
Indirect cost 1(e.g., indirect
labor)
All otheroverhead costs
Plantwideoverhead
rate
FIGURE 9–3
Multiple overheadrates based onoverhead categories
zim36725_ch09_409-467.qxd 12/15/09 2:07 PM Page 429

Suppose the factory contains three departments: machining, painting, and assembly.The $2.5 million of total overhead costs is broken down into three different departments:
Department Department Costs Allocation Base
Machining $ 900,000 Machine hoursPainting 750,000 Dollars of paint usedAssembly 850,000 Direct labor dollars
Total overhead $2,500,000
Under this method, all overhead costs are first accumulated by departments. Often,step-down allocations (discussed in Chapter 8) are used to assign service department costs(indirect cost pools) to manufacturing departments. These department costs are thenallocated to jobs based on one of three allocation bases: machine hours for machiningdepartment costs, dollars of paint used for painting department costs, and direct labordollars for assembly department costs.
Whether a single plantwide overhead rate, multiple rates, or departmental rates areused depends on the plant’s organization, the incentive systems in place, management’sdemand for accurate cost data for decision making, and the incremental cost of using morecomplex cost systems. A plantwide overhead rate is acceptable if the plant has a singlehomogeneous production process. In this case, a single plantwide overhead rate likelycaptures the average cause-and-effect relation between volume and overhead.
It is commonly believed that a plantwide rate is a less accurate measure of the cause-and-effect relation in plants composed of several heterogeneous processes. Suppose aplant has three departments (parts fabrication, assembly, and testing) with overhead ratesof $30, $50, and $100 per direct labor hour, respectively. To simplify the example,assume that each department has the same number of total direct labor hours per year.The simple average (the plantwide overhead rate) is $60, or ($30 � $50 � $100) � 3.Suppose a particular job uses 500 direct labor hours in each of the first two departmentsand 2,000 hours in the third department. A plantwide overhead rate would charge this job$180,000 of overhead ($60 � 3,000 hours). Individual department overhead rates would
430 Chapter 9
DepartmentB
Separateoverhead
rate for eachdepartment
PRODUCTS
DepartmentA
DepartmentC
Separateoverhead
rate for eachdepartment
Indirectcost 1
Indirectcost 2
Indirectcost 4
Indirectcost 3
Indirectcost 5
Indirectcost 6
Direct and indirectcost traces to
each department
Direct and indirectcost traces to
each department
FIGURE 9–4
Two-stage allocationof departmentaloverhead rates
zim36725_ch09_409-467.qxd 12/15/09 2:07 PM Page 430

Absorption Cost Systems 431
charge the job $240,000 (or $30 � 500 � $50 � 500 � $100 � 2,000). However, if over-head consists of large amounts of fixed historical costs, such as depreciation, then nei-ther plantwide overhead rates nor individual department rates accurately reflect theopportunity cost of capacity. If the plant is organized into production departments, sepa-rate departmental overhead rates usually are more useful for performance evaluationpurposes.
Most manufacturing firms in the United States or overseas use separate overhead ratesfor manufacturing departments, work centers, or machine cells. But single, plantwide over-head rates are also common.
It is often implicitly assumed that multiple overhead rates for different classes of over-head costs are more accurate estimates of product costs than a single plantwide overheadrate. Using multiple overhead rates requires that each overhead item be analyzed and that thevolume measure most closely associated with the variation in the overhead cost item be usedas the allocation base. That is, the cost driver for each overhead category must be identified.Disaggregating overhead allocations using different allocation bases presumably results inmore accurate estimates of product costs.1 Activity-based costing (ABC), discussed in Chap-ter 11, uses multiple overhead rates to presumably derive more accurate product costs.
No costing system measures opportunity costs perfectly. All cost systems approximatethe opportunity cost of making products. The accuracy of a product costing system dependson how costs vary with various decisions. Varying the production levels of existing productswill cause overhead costs to vary in one particular way. But adding or dropping productlines can cause overheads to vary in a different way. For example, suppose that increasingproduction of an existing product adds 20,000 machine hours in a particular department,which causes overhead costs to increase. But if 20,000 machine hours are added because a
ManagerialApplication:DurironPumps
Duriron Company Pump Division produces centrifugal pumps. Originally, the plant’sproducts were manufactured in traditional production departments that were organizedby function. Parts moved between departments depending on the operations required.When completed, they waited for assembly. Increased competition and new manufactur-ing technology changed the manufacturing process, how it was organized, and the ac-counting systems. A series of “focused factories” was created within the plant. Themachines required for assembling each product were arranged to allow the product toflow from one stage to another. Component parts, produced in highly automated cells,were located around the assembly line to introduce the parts where they were required.Each product class had its own focused factory. Productivity and profitability improved.
The accounting system also changed. Each focused factory allocated its overheadcosts based on the number of units produced in the particular focused factory.
Chapter 1 describes the integral role played by the accounting system in the firm’sorganizational architecture and how the organizational architecture changes in responseto environment shifts in competition and technology. Duriron illustrates how one firm’sorganizational architecture (including its accounting system) adapted to changes in thefirm’s environment.
SOURCE: www.entrepreneur.com/tradejournals/article/16358994_2html.
1 S Datar and M Gupta, “Aggregation, Specification, and Measurement Errors in Product Costing,”Accounting Review 69 (October 1994), pp. 567–92. In this article, the authors demonstrate that adding morecost pools and more overhead rates does not necessarily increase the accuracy of product costs.
zim36725_ch09_409-467.qxd 12/15/09 2:07 PM Page 431

new product line is introduced, overheads in this department will likely be even larger. Moreengineering time, scrap, tooling, and so on are required to add a new product than to increasethe volume of an existing product. Therefore, allocating individual overhead accounts usingseparate cost drivers might give more accurate product costs when volume changes forexisting products. On the other hand, a firmwide overhead rate may be just as accurate forestimating product costs when new products are introduced.
Q9–11 Why will using multiple overhead rates produce moreaccurate estimates of product costs?
Q9–12 There are three general methods of allocating overhead costs:plantwide rates, rates for each expense category, anddepartmental rates. Describe when each is the most useful.
F. Process Costing: The Extent of AveragingJob order cost systems are built around distinct jobs in the factory. But some manufacturingprocesses have continuous flow production. For example, an oil refinery is a continuous flowproduction process with no jobs. Crude oil is fed in and various petroleum products, fromgasoline to asphalt, are produced in (roughly) continuous streams. If the production processdoes not have jobs, how are costs accumulated? In such continuous flow production processes,all costs are averaged via an allocation process, not unlike overhead allocations in a job ordercost system.
All costing systems average costs over products. Job order costing calculates the costof separate jobs whereby all the units in the job are assumed to receive the average amountof direct materials and direct labor. Taking the total direct labor and direct materials in thejob and dividing by the number of units assumes that each unit receives the averageamount of direct labor and materials. Job order cost systems do not track the amount of di-rect labor or materials for each individual unit produced; it is not cost beneficial to collectthis level of detail. Likewise, overhead costs are first allocated to jobs and then assumed tobe incurred uniformly over all the units in the job.
Process costing is an extreme case of averaging. It is job order costing with one job.Since the production process is a continuous flow operation, discrete jobs do not exist. Inprocess costing, costs are assigned to identical products that undergo a series of manufac-turing processes in a continuous flow. These processes are usually organized as separate costcenters. Costs are assigned to products flowing through each process. Total manufacturingcosts must be allocated among units still in work in process as well as units transferred outof the plant to finished goods inventory or cost of goods sold. Appendix A describes themechanics of process costing accounting in greater detail.
Process costing is inherently simpler and less costly to maintain than job order costingbecause one does not have to account for separate jobs. On the other hand, the informationprovided is far more aggregate and often less useful for decision making. In particular,costs for individual jobs are not available and hence cannot be used to evaluate cost trendsacross different jobs of similar products.
Q9–13 What is process costing? Is it useful for decision making?What are its limitations?
ConceptQuestion
ConceptQuestions
432 Chapter 9
zim36725_ch09_409-467.qxd 12/15/09 2:07 PM Page 432

Absorption Cost Systems 433
G. SummaryThis chapter describes the mechanics and logic of absorption costing systems. These widely usedmanufacturing cost systems generally distribute all factory costs to the products produced. Absorp-tion cost systems are also prevalent in service industries. There are two basic types of absorption cost-ing systems: job order cost systems and process cost systems. Job order costing computes an averageunit cost for each batch or job produced, whereas process costing computes an average unit cost foreach product produced in a given time period (week, month, or year). Both systems distribute allfactory costs to units manufactured.
The salient facts about absorption costing systems include the following:
1. Absorption cost systems attach bits of “costs” to units of inventory as these units movethrough the manufacturing process. The historic costs incurred by the factory are attachedto all the units produced in the factory during the period the costs are incurred, except forunder/overabsorbed overhead.
2. Absorption costs are backward-looking in that they track historical costs to individualproducts; they are not necessarily opportunity costs.
3. Indirect (common) costs and other overhead items are assigned to products based on anoverhead cost allocation scheme.
4. The overhead allocation base (volume measure) is usually the one with the greatestassociation with the common costs being allocated. That is, the volume measure selected isusually the most important cost driver of the overhead costs being allocated.
5. An overhead rate is estimated as the ratio of the budgeted overhead expenses to thebudgeted (normal or expected) volume measure.
6. Adjusting overhead rates because of short-run changes in volume can causedysfunctional decisions. If overhead rates are changed in response to short-run changesin volume, overhead rates rise as volume falls and vice versa. These are the wrong costsignals to send throughout the firm as the firm moves through expansionary andrecessionary business cycles.
7. At the end of the year, any over/underabsorbed balance in the overhead account usually iswritten off to cost of goods sold.
8. Instead of using a single plantwide overhead rate, management can develop overhead ratesfor each overhead expenditure category or overhead department in the factory. However,these multiple overhead rates may or may not provide a more accurate estimate ofopportunity cost than a single plantwide rate.
The ability of absorption costing systems to support decision making and control is discussed inthe next two chapters.
Appendix A: Process CostingA process cost system is based on equivalent units. An equivalent unit is the amount of output statedin terms of completed units. For example, if three units are one-third complete, this is equivalent toone complete unit. Or if 200 units of product are in work in process at the end of the month and theseunits are 75 percent complete, then these 200 units represent 150 equivalent units (200 � 75%).
Process cost systems track direct materials and conversion costs (labor and overhead). A majorfunction of all absorption cost systems, including process costing, is to divide total costs incurred intotwo pieces: those costs still in process and those that have completed manufacturing and thus are ineither finished goods inventory or cost of goods sold. Computing the cost of ending work in processand the cost transferred to finished goods requires several distinct calculations. An average cost perequivalent unit of work is computed for materials and conversion costs. These average costs perequivalent unit are used to allocate the material and conversion costs among work-in-process inven-tory, finished goods inventory, and cost of sales.
zim36725_ch09_409-467.qxd 12/15/09 2:07 PM Page 433

434 Chapter 9
Process cost systems view production as consisting of three batches of product: the beginningwork-in-process inventory, units started and finished this period, and the ending work-in-processinventory. Consider the following example.
Cajun Peanut Butter Inc. uses process costing to compute product costs for inventory and costof goods sold. This firm has discovered and patented a peanut butter machine that makes Cajun-flavored peanut butter through a continuous flow process whereby peanuts are dumped into the ma-chine at the beginning of the process and Cajun flavoring is added at the very end. Conversion costsare incurred continuously and evenly throughout the conversion process. The relevant informationfor March is presented in Table 9–5. All conversion costs (labor and overhead) are assumed to beincurred uniformly during the process. To simplify the discussion, we begin the analysis by assumingno beginning inventories (although later we will illustrate the case with beginning inventories).
Table 9–6 decomposes the mechanics of process costing into four steps. Step 1 summarizes thephysical flow of the units and calculates the equivalent units of work in the physical flows. The sum-mary of the physical flows is based on the accounting identity:
Beginning inventory � Units started � Units transferred out � Ending inventory
In step 1, this equation becomes
0 � 20,000 � 18,800 � 1,200
Since the ending inventory is 1,200 pounds and 20,000 pounds were started, 18,800 pounds musthave been finished and transferred. These equations hold under the assumption of no spoilage. Tosimplify the calculations, we assume there is no spoilage or waste at Cajun Peanut Butter Inc.
Costs and the amount of work done are accumulated for each of the two batches: (1) ending work-in-process (WIP) inventory and (2) transferred out in March. Consider the batch of ending work-in-process inventory. In step 1 there are 1,200 pounds of ending WIP inventory, which are 30 percentcomplete with respect to conversion costs. This inventory was started in March. Conversion costswere incurred to produce this level of completion, requiring 360 equivalent units of work (1,200 lbs@ 30 percent). All the peanuts are added at the beginning, so there are 1,200 equivalent units ofpeanuts in the ending WIP inventory. On the other hand, since all the Cajun spices are added at theend of the process, the ending work-in-process inventory contains no equivalent units of spices. Allthe units transferred out (18,800) are complete with respect to conversion, peanuts, and spices, sothere are 18,800 equivalent units of these items.
Step 2 in Table 9–6 computes the cost per equivalent unit for the conversion costs, peanuts, andspices. Total equivalent units are the sum of the equivalent units in the ending WIP inventory andunits transferred out in March. The three cost categories (conversion, peanuts, and Cajun spices) havedifferent equivalent units. For conversion costs, 19,160 equivalent units were produced. Forpeanuts, 20,000 equivalent units were produced. For Cajun spices, 18,800 equivalent units were pro-duced. The cost per equivalent unit is an average cost calculated as the ratio of the total costs incurredin the cost category and the number of equivalent units of work performed in that category. Costs perequivalent unit for conversion, peanuts, and spices are $0.7829, $1.6000, and $0.2128, respectively.
TABLE 9–5 Cajun Peanut Butter Inc. Operating Data for March
There was no beginning inventory in process on March 1. The following summarizes theoperating data for the month of March:
Dollars Quantity
Peanuts purchased and entered in process $32,000 20,000 lbs.Ending inventory in process (30% complete) not available 1,200 lbs.Cajun spices $ 4,000All other factory costs (conversion costs) $15,000
zim36725_ch09_409-467.qxd 12/15/09 2:07 PM Page 434

TABLE 9–6 Cajun Peanut Butter Inc.—Calculation of Ending Work in Process and Cost of Units Transferred Out for March
Equivalent Units
Units Conversion Peanuts Spices Total
Step 1Physical flow:
Units started 20,000
Units to account for 20,000
Ending work in process (30%) 1,200 360 1,200 0Transferred out 18,800 18,800 18,800 18,800
Units accounted for 20,000
Step 2Equivalent units 19,160 20,000 18,800
Costs per unit:Total costs $15,000 $32,000 $ 4,000Cost per equivalent unit $0.7829 $1.6000 $0.2128 $2.5957
Step 3Total costs to account for:
Conversion costs $15,000Peanuts purchased 32,000Cajun spices 4,000
Total costs $51,000
Step 4Ending work in process $ 2,202 $282 $1,920 0
$0.7829 � 360 $1.60 � 1,200 $0.2128 � 0Transferred out (18,800 � $2.5957) 48,798
Total costs $51,000
Absorption Cost Systems 435
The total cost of a complete pound of peanut butter is the sum of the conversion, peanuts, andspice costs ($2.5957).
Step 3 lists all the costs to be assigned to either the ending WIP inventory or the units transferredout, totaling $51,000. Step 4 uses the costs per equivalent unit to value work in process and unitstransferred out. Costs are assigned to the ending WIP inventory by taking the equivalent units in end-ing WIP inventory for each cost category and multiplying by the cost per equivalent unit in the samecost category. These are then summed across categories to get the cost of the ending WIP inventory.For example, the ending WIP inventory of $2,202 is composed of $282 of conversion costs (360equivalent units times $0.7829 per equivalent unit) and $1,920 of peanuts (1,200 equivalent unitstimes $1.60 per equivalent unit). There is no Cajun spice cost in the ending WIP inventory becausethese spices are only added when the process is finished. The cost of the units transferred out is$48,798 (18,800 � 2.5957).
While highly simplified, the preceding example illustrates the key concepts in a process costingsystem. All costs incurred in March, $51,000, are either assigned to WIP or transferred out to finishedgoods. Like job order costing, process costing fully absorbs all manufacturing costs to units producedor in inventory.
We now make the example more realistic and complicated by introducing beginning invento-ries. With beginning inventories comes the decision of whether to use FIFO, weighted average, or
zim36725_ch09_409-467.qxd 12/15/09 2:07 PM Page 435

436 Chapter 9
LIFO. That is, do we assume the beginning inventory costs flow out first (FIFO), are averaged inwith the costs incurred in March (weighted average), or are still in the ending inventory (LIFO)? Theremainder of this appendix illustrates the FIFO and weighted average methods. LIFO is not illus-trated, but it can be calculated by building LIFO layers from the beginning and ending inventories.
Table 9–7 provides the raw data, including the beginning inventory data. All the data are thesame as before, except the beginning inventory of 2,000 pounds is 40 percent complete with respectto conversion costs and has a cost of $3,600.
Table 9–8 illustrates the computations assuming a FIFO cost flow. The first change to notice is thatthe units transferred out are different from those in Table 9–6. From the earlier accounting identity,
Beginning inventory � Units started � Units transferred out � Ending inventory
2,000 lbs. � 20,000 lbs. � Units transferred out � 1,200 lbs.
Solving for units transferred out yields
Units transferred out � 2,000 lbs. � 20,000 lbs. � 1,200 lbs. � 20,800 lbs.
Given the revised transferred out amount, the equivalent units for conversion, peanuts, andspices are calculated in step 1 of Table 9–8. Under FIFO costing, the goal is to compute the cost perequivalent unit of only the work done in March. The equivalent units in the beginning WIP inventory(800 equivalent units of conversion costs) are subtracted out under step 2 to make sure the equivalentunits computed are for work done in March only. The beginning inventory contains equivalent unitsof work done in prior periods.
Step 2 also computes the cost per equivalent unit: $0.7367 for conversion costs, $1.60 forpeanuts, and $0.1923 for spices. Total costs to account for now include the beginning WIP inventory($3,600) plus the costs incurred in March (see step 3). The unit costs from step 2 are used to computethe ending amount of work in process ($2,185) in step 4. Ending WIP inventory ($2,185) is composedof the equivalent units of conversion, peanuts, and spices in the ending WIP inventory multiplied bythe respective cost per equivalent unit of conversion ($0.7367) and peanuts ($1.60). (Remember,since spices are added at the end of the process, WIP contains no spice costs.)
In step 4, the cost of units transferred to finished goods consists of the beginning WIP inventory($3,600), the costs to complete the beginning WIP inventory ($884 of conversion and $385 of spices),and the cost of units started and completed in March ($47,545).
Table 9–8 illustrates the FIFO method. Table 9–9 illustrates the weighted average method. FIFOcalculates an average cost per equivalent unit using only the costs incurred this period and the equiv-alent units produced this period. The weighted average method calculates the average cost per equiv-alent unit using both the beginning inventory and current production. The weighted average costincludes not just the cost of work performed this period but also the costs incurred in previous peri-ods that are still in the beginning inventory. Total equivalent units are the sum of both the beginningWIP inventory equivalent units and the equivalent units worked this period. For example, equivalentunits of peanuts (22,000) consist of 1,200 units in the ending inventory plus 20,800 units transferred
TABLE 9–7 Cajun Peanut Butter Inc.Revised Operating Data for March (Including Beginning Inventories)
Dollars Quantity
Beginning inventory in process (40% complete) $ 3,600* 2,000 lbs.Peanuts purchased and entered in process $32,000 20,000 lbs.Ending inventory in process (30% complete) not available 1,200 lbs.Cajun spices $ 4,000All other factory costs (conversion costs) $15,000
*Composed of $600 conversion cost ($0.75 per equivalent unit � 2,000 lbs. � 40% complete) plus $3,000 peanut cost ($1.50per equivalent unit � $2,000 � 100% complete).
zim36725_ch09_409-467.qxd 12/15/09 2:07 PM Page 436

TABLE 9–8 Cajun Peanut Butter Inc. Revised Calculation of Ending Work in Process and Cost of Units Transferred Out for March(FIFO Cost Flow)
Equivalent Units
Units Conversion Peanuts Spices Total
Step 1Physical flow:
Beginning work inprocess (40%) 2,000
Units started 20,000
Units to account for 22,000
Ending work in process (30%) 1,200 360 1,200 0Transferred out 20,800 20,800 20,800 20,800
Units accounted for 22,000
Step 2Less equivalent units
in beginning WIP (800) (2,000) 0
Equivalent units ofwork done in March 20,360 20,000 20,800
Costs per unit:Total costs incurred in March $15,000 $32,000 $ 4,000Cost per equivalent unit $0.7367 $1.6000 $0.1923 $2.5290
Step 3Total costs to account for:
Beginning work in process $ 3,600Conversion costs 15,000Peanuts purchased 32,000Cajun spices 4,000
Total costs $54,600
Step 4Ending work in process $ 2,185 $265 $1,920 0
$0.7367 � 360 $1.60 � 1,200 $0.1923 � 0Transferred out:
Beginning work in process $ 3,600Cost to complete beginning WIP 884 60% � 2,000 � 0.7367
385 2,000 � 0.1923Started and completed:
20,800 � 2,000 �18,800 � $2.5290 47,545
Total costs $54,600*
*Rounding error.
Absorption Cost Systems 437
zim36725_ch09_409-467.qxd 12/15/09 2:07 PM Page 437

TABLE 9–9 Cajun Peanut Butter Inc. Revised Calculation of Ending Work in Process and Cost of Units Transferred Out for March(Weighted Average Cost Flow)
Equivalent Units
Units Conversion Peanuts Spices Total
Step 1Physical flow:
Beginning work in process (40%) 2,000Units started 20,000
Units to account for 22,000
Ending work in process (30%) 1,200 360 1,200 0Transferred out 20,800 20,800 20,800 20,800
Units accounted for 22,000
Step 2Equivalent units of work done
to date 21,160 22,000 20,800
Costs per unit:Beginning work in process $ 600 $ 3,000Current costs added 15,000 32,000 $ 4,000
Total cost $15,600 $35,000 $ 4,000
Cost per equivalent unit $0.7372 $1.5909 $0.1923 $2.5204
Step 3Total costs to account for:
Beginning work in process $ 3,600Conversion costs 15,000Peanuts purchased 32,000Cajun spices 4,000
Total costs $54,600
Step 4Ending work in process $ 2,174 $265 $1,909 0
$0.7372 � 360 $1.5909 � 1,200 $0.1923 � 0Transferred out:
20,800 � $2.5204 52,424
Total costs $54,600*
*Rounding error.
438 Chapter 9
out. These 22,000 units include the peanuts in the beginning inventory. The total cost in step 3 is thesum of the costs in the beginning WIP inventory and costs incurred this period. Thus, the cost perequivalent unit is a weighted average of the costs in the beginning WIP inventory and those incurredthis period.
Comparing Tables 9–8 and 9–9 reveals that the FIFO and weighted average methods give verysimilar numbers for the ending inventory and transferred-out costs. Whenever the beginning andending inventories are a small fraction of the units started or finished, most of the cost incurred istransferred out.
zim36725_ch09_409-467.qxd 12/15/09 2:07 PM Page 438

Absorption Cost Systems 439
Many continuous flow plants are composed of a series of production stages, each treated as a sep-arate process costing unit. For example, an oil refinery consists of a crude splitter, various distillers,and refractors. Intermediate products flow from one stage to another. Each stage tracks beginning andending work-in-process inventories and transferred-out costs for material and conversion costs. Thecosts of units transferred out of one stage become the transferred-in costs for the next stage down-stream. Thus, stringing together a series of statements similar to Table 9–8 or 9–9 lets managementcompute each stage’s separate costs as well as the entire plant’s costs.
Finally, if the process has considerable scrap or waste, it is often accounted for and reported sep-arately, which adds to the complexity of the calculations. But the conceptual issues remain: Processcost systems assign all costs to units. These systems report average unit costs, which are a mixture offixed and variable costs—not measures of marginal or opportunity costs.
Appendix B: Demand Shifts, Fixed Costs, and PricingThis appendix illustrates that when volumes drop causing average costs to rise, prices usually shouldbe lowered, not raised. A photocopy store owner expects long-run average volume (normal volume)to be 175,000 copies per month. The store is leased for $1,000 per month, employees are paid $2,000per month, and a copier is leased for $500 per month plus $0.005 per copy. Paper costs also are$0.005 per sheet. Each copy requires one page of paper (i.e., there is no two-sided copying). The storelease and employee costs do not vary with copy volume.
The store completes a customer order for 5,000 flyers at $0.04 per page, or $200. Assuming thattaking this job did not require forgoing another job—that is, equipment and labor had excesscapacity—the opportunity cost of this job was $50 (the paper at $0.005 per page and the additionalcopier fee at $0.005 per page). But the accounting cost of this order is $150, which incorporates someallocated overhead. The amount of overhead allocated to this job is the sum of the overhead items(store rental, labor, and copier rental) divided by normal volume for the year, multiplied by the vol-ume for this job, or:
Overhead Costsper Month
Office rental $ 1,000Labor 2,000Copier rental 500
$ 3,500Divided by normal copy volume 175,000
Overhead costs per normal copy $ 0.020Plus: Paper costs 0.005Additional copier charge per page 0.005
Total cost per page $ 0.030Times number of pages in job 5,000
Total job cost $ 150
What does the $0.03 total cost per page represent? It is the long-run average cost. That is, at anormal volume of 175,000 copies per month, the store must charge at least $0.03 per page to breakeven over time. Suppose that copy volume this month falls from 175,000 copies to 100,000 copies.Overhead costs per copy increase to $0.035 (or $3,500 � 100,000). Should prices be increased?
The profit-maximizing price occurs at the quantity that equates marginal cost and marginalrevenue. Has marginal cost changed? No, it is still $0.01 per page. Has marginal revenue changed?Maybe—it depends on how the demand curve has shifted. Actually, it is possible that prices should
zim36725_ch09_409-467.qxd 12/15/09 2:07 PM Page 439

440 Chapter 9
be lowered. Figures 9–5 and 9–6 illustrate the typical case in which price should be lowered whendemand falls.
In Figure 9–5, the demand curve labeled Normal demand corresponds to 175,000 copies beingdemanded at a price of $0.04 per copy. This demand curve has a marginal revenue curve, Normalmarginal revenue. Equating the marginal cost of $0.01 to normal marginal revenue yields the profit-maximizing copy volume (175,000 copies) and price ($0.04).
Suppose that demand has shifted to the Low demand curve in Figure 9–6. At a price of $0.04,there is now demand for only 100,000 copies. (Take the price of $0.04 and move horizontally to theLow demand curve; then move down the vertical line and read off the quantity of 100,000.) In otherwords, if the demand curve shifts down and the price remains at $0.04 per copy, only 100,000 copieswill be sold per month.
If demand is now represented by the Low demand curve in Figure 9–6, what is the profit-maximizing price to charge? Is it higher or lower than $0.04? Remember, profit maximization occursat the quantity where marginal revenue equals marginal cost. Marginal cost has not changed; it is still$0.01 per copy. Marginal revenue for the Low demand curve is the dashed line in Figure 9–6 calledLow marginal revenue. The Low marginal revenue and Marginal cost curves intersect at the outputlevel of 135,000 copies per month. Following this quantity level up to the Low demand curve yields
175,000
$0.01
Number of copies
$
$0.04
Normal demand
Normal marginal revenue
Marginal cost
FIGURE 9–5
Photocopy storeexample
100,000 175,000 135,000
$0.01
Number of copies
$
$0.04$0.034
Normal demand
Low demand
Marginal cost
Low marginalrevenue
FIGURE 9–6
Photocopy storeexample: Reduceprice when demandfalls
zim36725_ch09_409-467.qxd 12/15/09 2:07 PM Page 440

Absorption Cost Systems 441
a price of about $0.034 per copy. Therefore, to maximize profits under the low demand situation, thecopy store must lower the price from $0.04 to $0.034.
Table 9–10 compares total profits at the price of $0.04 and volume of 100,000 copies with theprofits at a price of $0.034 and volume of 135,000 copies. Under both pricing scenarios, the store islosing money. However, the loss is smaller when the price is cut to $0.034 per copy. Notice that inboth cases fixed costs remain constant at $3,500. Since fixed costs do not vary (by definition) be-tween the two pricing scenarios, fixed costs are irrelevant for the pricing decision. But they are notirrelevant when it comes to the shutdown decision. Suppose the store lease and copier rental ($1,500a month) are paid a year in advance but labor ($2,000 a month) is paid at the end of each month. As-suming that the store cannot be sublet, the firm should continue to operate until the current store andcopier leases expire. It should then cease operations unless demand has increased sufficiently. Eventhough the store is not recovering all its fixed costs, fixed costs that have already been paid are sunkcosts. Continuing to operate the store until the fixed costs (lease, copier rental, and labor) arepayable again generates a positive cash flow.
Self-Study ProblemsSelf Study Problem 1: Cost Flows
The following is a job cost sheet for a special product:
TABLE 9–10 Photocopy Store Profits (Loss) at a Price of $0.04 per Copy versus $0.034 per Copy
Price � $0.04 Price � $0.034Copies � 100,000 Copies � 135,000
Revenue $4,000 $4,590Variable costs (1,000) (1,350)Fixed costs (3,500) (3,500)
Loss $ (500) $ (260)
Job Number 711 Date Started 5/26
Date Completed 6/15
Raw Materials Direct Labor
Date Type Cost Qty. Amount Cost/Hr. Hours Amount
5�26 130 $30 6 $180 $18 5 $ 906�15 248 10 20 200 15 10 150
$380 15 240
Total direct materials $380Total direct labor 240Overhead (15 direct labor hours @ $10/hour) 150
Total job cost $770
zim36725_ch09_409-467.qxd 12/15/09 2:07 PM Page 441

442 Chapter 9
Overhead is allocated based on direct labor hours (DLH). The raw materials were in inventorybefore being used on job #711. The product is sold on 7�10. Identify the cost flows on each of thesedates: 5�26, 6�15, and 7�10.
Solution:
Cost flows:On 5�26: $180 from “Raw materials inventory” to “Work in process”
$90 from “Labor” to “Work in process”
$50 from “Overhead” to “Work in process” for overhead-related to direct labor hours (5 DLH � $10�DLH)
On 6�15: $200 from “Raw materials inventory” to “Work in process”
$150 from “Labor” to “Work in process”
$100 from “Overhead” to “Work in process” for overheadrelated to direct labor hours (10 DLH � $10�DLH)
On 6�15: $770 from “Work in process” to “Finished goods”On 7�10: $770 from “Finished goods” to “Cost of goods sold”
Self-Study Problem 2: R&R Chairs, Inc.
R&R Chairs, Inc., manufactures two types of ergonomic chairs (the basic and the executive) in two de-partments (frame fabrication and cushion fabrication). In planning for the coming year, the managerswould like to know the production cost of each chair. The main difference between the two chairs isadditional padding in the executive chair. Budgeted direct costs for each department are as follows:
Budgeted Chair Production and Cost Data
Frame CushionFabrication Fabrication Total
BasicNumber of chairs 225,000Direct labor/chair $ 7.40 $6.40Direct materials/chair 6.70 2.40
Total $14.10 $8.80 $22.90
ExecutiveNumber of chairs 192,000Direct labor/chair $ 7.50 $ 8.70Direct materials/chair 6.80 6.20
Total $14.30 $14.90 $29.20
Currently the company uses a single plantwide overhead rate based on direct labor dollars toassign overhead costs to products. Budgeted overhead costs for the year are shown in the accompa-nying table.
Budgeted Overhead Costs
Rent $1,680,000Indirect labor 1,660,000Indirect materials 1,125,000Equipment lease payments 1,665,000
Total overhead $6,130,000
zim36725_ch09_409-467.qxd 12/15/09 2:07 PM Page 442
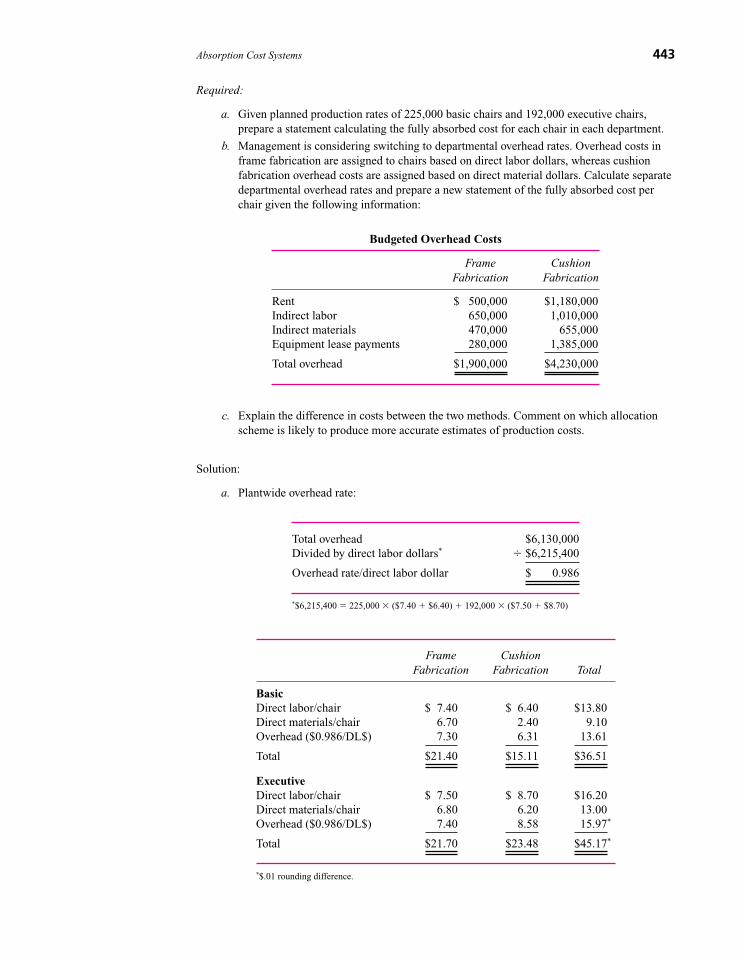
Absorption Cost Systems 443
Required:
a. Given planned production rates of 225,000 basic chairs and 192,000 executive chairs,prepare a statement calculating the fully absorbed cost for each chair in each department.
b. Management is considering switching to departmental overhead rates. Overhead costs inframe fabrication are assigned to chairs based on direct labor dollars, whereas cushionfabrication overhead costs are assigned based on direct material dollars. Calculate separatedepartmental overhead rates and prepare a new statement of the fully absorbed cost perchair given the following information:
Budgeted Overhead Costs
Frame CushionFabrication Fabrication
Rent $ 500,000 $1,180,000Indirect labor 650,000 1,010,000Indirect materials 470,000 655,000Equipment lease payments 280,000 1,385,000
Total overhead $1,900,000 $4,230,000
c. Explain the difference in costs between the two methods. Comment on which allocationscheme is likely to produce more accurate estimates of production costs.
Solution:
a. Plantwide overhead rate:
Total overhead $6,130,000Divided by direct labor dollars* � $6,215,400
Overhead rate/direct labor dollar $ 0.986
*$6,215,400 � 225,000 � ($7.40 � $6.40) � 192,000 � ($7.50 � $8.70)
Frame CushionFabrication Fabrication Total
BasicDirect labor/chair $ 7.40 $ 6.40 $13.80Direct materials/chair 6.70 2.40 9.10Overhead ($0.986/DL$) 7.30 6.31 13.61
Total $21.40 $15.11 $36.51
ExecutiveDirect labor/chair $ 7.50 $ 8.70 $16.20Direct materials/chair 6.80 6.20 13.00Overhead ($0.986/DL$) 7.40 8.58 15.97*
Total $21.70 $23.48 $45.17*
*$.01 rounding difference.
zim36725_ch09_409-467.qxd 12/15/09 2:07 PM Page 443

444 Chapter 9
bb.. Separate departmental overhead rates:
Frame CushionFabrication Fabrication
Total overhead $1,900,000 $4,230,000Total direct labor dollars � $3,105,000*
Total direct material dollars � $1,730,400†
Overhead rate $0.612 $2.445
Frame CushionFabrication Fabrication Total
BasicDirect labor/chair $ 7.40 $ 6.40 $13.80Direct materials/chair 6.70 2.40 9.10Overhead ($0.612/DL$) 4.53 4.53Overhead ($2.445/DM$) 5.87 5.87
Total $18.63 $14.67 $33.30
ExecutiveDirect labor/chair $ 7.50 $ 8.70 $16.20Direct materials/chair 6.80 6.20 13.00Overhead ($0.612/DL$) 4.59 4.59Overhead ($2.445/DM$) 15.16 15.16
Total $18.89 $30.06 $48.95
*$3,105,000 � $7.40 � 225,000 � $7.50 � 192,000.†$1,730,400 � $2.40 � 225,000 � $6.20 � 192,000.
c. Going from a single plant overhead rate to separate department rates causes the basicchair’s expected cost to fall $3.21 per chair and the executive chair’s expected cost to rise$3.78 per chair. The basic chair’s cost falls about 9 percent and the executive chair’s costrises about 8 percent. The reason for these changes is as follows. Cushion fabricationcontains much of the overhead of the factory. Executive chairs contain a higher fraction ofdirect materials cost than direct labor cost. If all the overhead is allocated based on directlabor dollars, basic chairs bear a larger fraction of the overhead costs than if more of theoverhead, in particular the cushion fabrication costs, is assigned to executive chairs. Ifcushion fabrication costs vary more with direct materials than direct labor, then theseparate department overhead rates give a more accurate estimate of product costs than asingle plantwide rate. However, if direct labor is the overhead cost driver in the cushionfabrication department, then a single overhead rate is likely to be more accurate.
ProblemsP 9–1: Equivalent Units (See Appendix A)
Department 100 is the first step in the firm’s manufacturing process. Data for the current quarter’soperations are as follows:
Number of Units
Beginning work in process (70% complete) 30,000Units started this quarter 580,000Units completed this quarter and transferred out 550,000Ending work in process (60% complete) 60,000
zim36725_ch09_409-467.qxd 12/15/09 2:07 PM Page 444

Absorption Cost Systems 445
Required:
Materials are added at the beginning of the process. Conversion costs (labor and capital costs) areincurred uniformly. The firm uses the FIFO method of inventory accounting. How many equivalentunits of conversion cost were used in the current quarter in Department 100?
P 9–2: lPX Packaging
IPX is a specialized packaging company that packages other manufacturers’ products. Other manu-facturers ship their products to IPX in bulk. IPX then packages the products using high-speed, state-of-the-art packaging machines and ships the packaged products to wholesalers. A typical orderinvolves packaging small toys in see-through plastic and cardboard containers.
IPX uses a flexible budget to forecast annual plantwide overhead, which is then allocated tojobs based on machine hours. The annual flexible overhead budget is projected to be $6 millionof fixed costs and $120 per machine hour. The budgeted number of machine hours for the yearis 20,000.
At the end of the year, 21,000 machine hours were used and actual overhead incurred was$9.14 million.
Required:
a. Calculate the overhead rate set at the beginning of the year.
b. Calculate the amount of over/underabsorbed overhead for the year.
c. The company’s policy is to write off any over/underabsorbed overhead to cost of goodssold. Will net income rise or fall this year when the over/underabsorbed overhead is writtenoff to cost of goods sold?
P 9–3: Densain Water
The Densain Water plant in Naples, Florida, bottles purified and flavored waters in a variety of sizes(20, 36, 48, and 64 ounces) for sale through vending machines and retail stores. Volume is measuredas bottled ounces. The plant’s annual budgeted fixed manufacturing overhead amounts to $1.8 mil-lion, and variable manufacturing overhead is projected at $0.005 per bottled ounce. Projectedvolume in the Naples plant next year is 200 million ounces. Actual volume for the year accumulatedto 210 million ounces and total manufacturing overhead incurred (both fixed and variable) was$2.85 million.
Required:
a. Calculate the Densian Naples plant overhead rate.
b. How much overhead was absorbed to products in the Naples plant?
c. Calculate the Densian Naples plant’s over- or underabsorbed overhead.
d. Describe the effect on income when the over- or underabsorbed overhead calculated in(c) is written off to cost of goods sold.
P 9–4: MacGiver Brass
MacGiver Brass is a brass plating firm with sales of $8 million and profits before taxes of $625,000.MacGiver has a loan outstanding at its local bank for working capital purposes. As the loan officerreviewing MacGiver’s loan application, you are charged with making a recommendation as towhether the $608,000 loan should be renewed for another year.
Upon reviewing MacGiver’s most recent annual report, you find the following footnote:
Underabsorbed overhead of $462,000 was prorated to inventories (2⁄3) and cost of goods sold (1⁄3).
zim36725_ch09_409-467.qxd 12/15/09 2:07 PM Page 445

446 Chapter 9
Required:
a. How should you evaluate MacGiver’s annual report in light of this footnote? In particular,how does this footnote affect your recommendation regarding the loan?
b. In preparing for your meeting with MacGiver’s president and chief financial officer, whatquestions do you want to ask regarding this footnote?
P 9–5: Pool Scrubbers
Pool Scrubbers manufactures three different models of swimming pool cleaners (710, 720, and 830).These are sophisticated computer-controlled, programmed cleaners that scrub and vacuum the pool’sbottom, walls, and steps and provide supplemental filtration of pool water. The three models differ intheir capacity and programmability.
Pool Scrubbers uses an absorption costing system that absorbs manufacturing overhead to thethree models based on direct labor hours. The single plantwide manufacturing overhead rate is pre-determined before the beginning of the fiscal year using a flexible manufacturing overhead budget.Variable manufacturing overhead is budgeted to be $3.00 per direct labor hour, and fixed manufac-turing overhead is budgeted to be $1.4 million. Direct labor is budgeted at $25 per direct labor hour.The following table summarizes the budgeted and actual results of operation for the year:
Models
710 720 830
Actual number of units produced 5,100 3,900 2,200Actual DL hours per unit 3.10 4.20 5.90Budgeted wholesale price $550 $750 $1,050Budgeted direct labor hours
per scrubber 3.00 4.00 6.00Budgeted direct materials $95 $125 $175Budgeted production (units) 5,000 4,000 2,000Budgeted DL cost (@ $25 per
DL hour) $75 $100 $150
Required:
a. Calculate the firmwide overhead rate for the year (round to four decimals).
b. A batch of 100 units of model 720 is produced using 405 direct labor hours. How muchoverhead is absorbed by this batch of 100 model 720s?
c. Actual overhead incurred during the year was $1,520,500. Calculate the amount of over- orunderabsorbed overhead for the year.
d. Scrubbers writes off any over-/underabsorbed overhead to cost of goods sold. What is theeffect on earnings of writing off the over-/underabsorbed overhead calculated in part (c)above on net income? In other words, does net income increase or decrease relative to whatnet income was prior to the write-off of the over-/underabsorbed overhead calculated inpart (c) above?
P 9–6: Thermalloy
Thermalloy makes extruded aluminum heat sinks that are small devices that help cool semiconductorsand printed circuit boards. Thermalloy uses an absorption costing system whereby all fixed and vari-able manufacturing overhead is absorbed to manufactured products via a single plantwide overheadrate that is estimated at the beginning of the year using a flexible manufacturing budget. Volume ismeasured in direct labor hours. The following data summarize Thermalloy’s operations for the year:
zim36725_ch09_409-467.qxd 12/15/09 2:07 PM Page 446

Over absorbed overhead $121,402Budgeted variable overhead/DL hour $9.00Actual direct labor hours 183,500Budgeted fixed overhead $3,500,000Actual overhead incurred $5,200,098Budgeted direct labor hours ???
Required:
Calculate Thermalloy’s budgeted direct labor hours.
P 9–7: Lys Wheels
Lys Wheels manufactures high-performance mountain bikes. Lys uses a predetermined overhead ratebased on direct labor hours to absorb overhead to mountain bikes. For the last fiscal year, the firm hadthe following operating data:
Actual direct labor hours 19,000Underabsorbed overhead $ 7,000Actual overhead incurred $197,000Budgeted overhead $210,000
Required:
What was Lys’s budgeted volume last year?
P 9–8: Ware Paper Box
Ware Paper Box manufactures corrugated paper boxes. It uses a job order costing system. Operatingdata for February and March are as follows:
Total TotalDate Date Date Manufacturing Manufacturing
Job Started Finished Sold Cost as of 2�28 Cost in March*
613 1�28 2�5 2�15 $12,500614 2�5 2�17 2�20 17,200615 2�20 2�27 3�5 18,500616 2�25 3�10 3�20 10,100 $13,400734 2�21 3�15 4�1 4,300 8,200735 2�27 4�1 4�9 9,100 2,400736 3�2 3�22 4�19 16,300617 3�15 3�20 3�26 19,200618 3�22 4�5 4�15 14,400
*Manufacturing costs incurred only in March. Does not include any manufacturing costs incurred in prior months.
The factory was closed due to a labor strike prior to January 28, when job #613 was started.There were no other jobs in the plant at that time.
Required:
Calculate the following amounts:
a. Work-in-process inventory as of 2�28.
b. Work-in-process inventory as of 3�31.
c. Finished goods inventory as of 2�28.
d. Finished goods inventory as of 3/31.
Absorption Cost Systems 447
zim36725_ch09_409-467.qxd 12/15/09 2:07 PM Page 447

448 Chapter 9
e. Cost of goods sold for February.
f. Cost of goods sold for March.
P 9–9: DeJure Scents (See Appendix A)
DeJure Scents manufactures an aftershave and uses process costing. All materials are added at the be-ginning of the process and conversion costs are incurred uniformly over time. In May, DeJure started15,000 gallons. There was no beginning inventory. May’s ending inventory of work in process was2,000 gallons, which were 50 percent complete with respect to conversion costs.
In May, conversion costs were $28,000 and materials costs were $45,000.
Required:
a. Calculate the equivalent units of conversion and materials.
b. Calculate the cost per equivalent unit of conversion and materials.
c. Calculate the cost of the ending inventory and the cost transferred to finished goods inventory.
P 9–10: Chemtrex (See Appendix A)
Chemtrex is an agricultural chemical producer. Process costing is used in its mixing department. Atthe beginning of July, Chemtrex had 700,000 gallons 70 percent complete in work in process. DuringJuly, it started another 4,000,000 gallons and produced 3,700,000 gallons. One million gallons ofending work in process were 60 percent complete at the end of July. Conversion costs are incurreduniformly over the mixing process.
Required:
Calculate the number of equivalent units of conversion work performed during July.
P 9–11: Media Designs
Media Designs is a marketing firm that designs and prints customized marketing brochures. The de-sign department designs the brochure and the printing department prints and binds it. Each depart-ment has separate overhead rates. The following estimates for the two departments were made for thecalendar year 2010.
Design Printing
Overhead $800,000 $500,000Direct labor cost $3,250,000 $410,000Direct materials cost $8,500 $250,000Direct labor hours 50,000 10,000
Media Designs uses a budgeted overhead rate to apply overhead to jobs. Direct labor hours areused to allocate overhead in the design department, and direct materials cost is used to allocate over-head in the printing department.
Required:
a. What are the overhead rates for the design and printing departments?
b. A summary of the Matsui job follows:
Design Printing
Direct materials used $3,000 $12,000Direct labor costs $46,200 $28,500Direct labor hours 700 750
What are overhead costs for the Matsui job?
zim36725_ch09_409-467.qxd 12/15/09 2:07 PM Page 448

Absorption Cost Systems 449
c. Actual operating results for 2010 are
Design Printing
Overhead $802,000 $490,000Direct labor cost $3,193,000 $451,500Direct materials cost $11,550 $230,000Direct labor hours 51,500 10,500
Calculate the over/underapplied overhead for each department.
P 9–12: Simple Plant
Simple Plant manufactures DNA test strips. Manufacturing overhead is applied to units producedusing direct labor dollars as the allocation base. The overhead rate is calculated prior to the beginningof the fiscal year that runs January 1 to December 31. Simple Plant has one manufacturing employee,J. Kusic, and one overhead expense besides indirect labor, property taxes. J. Kusic’s salary and fringebenefits for next year are forecast to be $50,000. Kusic is expected to work 2,000 hours at a cost of$25 per hour ($50,000/2,000). Eighty percent of Kusic’s time is budgeted to be direct labor, and theremainder is budgeted to be indirect labor. Property taxes are projected to be $110,000. There was nobeginning balance of work in process on January 1.
Required:
a. Calculate Simple Plant’s overhead rate for next year.
b. On January 2, the first working day of the new fiscal year, Kusic works eight hours(five hours on manufacturing test strips and three hours waiting for raw materials toarrive). Each day Simple Plant posts all entries (transactions) to the accounts. What are thebalances in the Overhead account and the Work-in-Process account at the close of businesson January 2?
c. At the end of the year, Kusic’s salary and benefits are $50,000, with $44,000 of the totalcharged to test strips manufactured. Kusic worked 2,000 hours during the year. Propertytaxes paid during the year amounted to $103,000. What, if any, is the balance in the overheadaccount before an adjusting entry is made to transfer the balance to other accounts?
P 9–13: Rick’s Bags
Rick’s Bags manufactures both golf bags and tennis totes. Fixed manufacturing overhead is budgetedto be $187,200, variable manufacturing overhead is budgeted to be $1.10 per direct labor hour, andfixed selling and administration costs are budgeted to be $346,000. Each golf bag is expected to use2.5 direct labor hours and each tennis tote is expected to use 1.8 direct labor hours. Planned produc-tion consists of 12,000 golf bags and 18,000 tennis totes.
During the year, 34,060 direct labor hours are used to make golf bags and 16,250 direct laborhours are used to make tennis totes. Manufacturing overhead incurred during the year was $207,500.Overhead is absorbed into products using actual direct labor hours.
Required:
a. Calculate the manufacturing overhead rate used to absorb overhead to golf bags andtennis totes.
b. A batch of tennis totes is produced in May. The batch uses 1,900 direct labor hours. Howmuch overhead is charged to this batch of tennis totes?
c. Calculate the amount of over/underabsorbed overhead at the end of the year.
d. Describe in nontechnical terms what the over/underabsorbed overhead calculated inpart (c) means.
zim36725_ch09_409-467.qxd 12/15/09 2:07 PM Page 449

450 Chapter 9
P 9–14: Unknown Company
Compute the unknowns:
Sales $100,000Direct materials used 29,000Direct labor 10,000Variable selling and administration expenses 16,000Fixed manufacturing overhead 30,000Fixed selling and administration expenses 9,000Gross profit ?Opening material inventory 3,000Closing material inventory 10,000Variable manufacturing overhead ?Purchase of direct material ?Cost of goods manufactured ?Net income 1,000
There is no opening or closing finished goods or work-in-process inventory.
P 9–15: Wellington Co.
The following figures were taken from the records of Wellington Co. for the year 2008. At the end ofthe year, two jobs were still in process. Details about the two jobs include:
Job A Job B
Direct labor $10,000 $28,000Direct materials $32,000 $22,000Machine hours 2,000 3,500Direct labor hours 1,000 2,000
Wellington Co. applies overhead at a budgeted rate, calculated at the beginning of the year. Thebudgeted rate is the ratio of budgeted overhead to budgeted direct labor costs. Budgeted figuresfor 2008 were
Budgeted direct labor costs $250,000Budgeted overhead $187,500
Actual figures for 2008 were
Direct labor $350,000Overhead $192,500Finished goods inventory $ 75,000Cost of goods sold $550,000
There were no opening inventories. It is the practice of the company to prorate any over/underabsorption of overhead to finished goods inventory, work in process, and cost of goods soldbased on the total dollars in these categories.
zim36725_ch09_409-467.qxd 12/15/09 2:07 PM Page 450

Absorption Cost Systems 451
Required:
a. Compute the cost of work in process before over/underapplied overheads are prorated.
b. Prepare a schedule of finished goods inventory, work in process, and cost of goods soldafter over/underapplied overheads are prorated.
c. What is the difference in operating income if the over/underapplied overhead is charged tocost of goods sold instead of being prorated to finished goods inventory, work in process,and cost of goods sold?
P 9–16: Building Services Department
Increased global competition has spurred most firms to take a hard look at their costs and become“lean and mean.” Rochco, a large industrial complex, has seen offshore competition erode its marketshare. This industrial site of over 100 functional departments (some cost centers and others profitcenters) has over the past few years undergone several restructuring and labor reduction programs inorder to make the firm more cost competitive.
Five years ago, the many service groups supporting Rochco’s manufacturing operations werebroken up into well-defined business centers. Top management encouraged all divisions to take overmore decentralized decision making and mandated that the service groups provide value to the firmover outside contractors or be shut down. Dennis Flynn, manager of the building services department(BSD), was asked by Jim Corrado, general manager of Rochco operations, to describe how he wouldtake his unit from its then-dismal position vis-à-vis outside cleaning contractors to being the clean-ing service of choice for its customers. An aggressive five-year plan was developed, with break-evento be achieved in the third year. This was not an easy task considering that BSD’s costs exceededcompetitors’ prices by 53 percent. Table 1 outlines the major points of the business plan.
The majority of Rochco properties are cleaned daily by BSD, which runs as a cost centerallocating its expenses at full cost based on the hours of service consumed by site customers. Over80 percent of BSD’s cost is labor (not uncommon for a cleaning service). However, BSD’s wage rateshave historically been higher than competitors’ due to Rochco’s policy of paying in the upper bracketof local industry to attract good people. Flynn’s operating budget two years ago was $17 million.
Labor turnover is higher in BSD than the Rochco average (20 percent versus 5 percent annually).The primary reason is that BSD is one of the few departments to hire labor from outside the company.The manufacturing departments tend to recruit personnel from BSD before looking externally, fortwo reasons: BSD provides basic safety training and Rochco culture orientation to its people, andBSD people have been screened, inspiring confidence from hiring departments that they are good,
TABLE 1 Highlights of BSD’s Five-Year Plan to Improve Service Value to Rochco Customers
• Improve productivity 25 percent in years 1 and 2 via normal transfers of personnel intoother operating departments within the company.
• Freeze wages until competitive with outside firms.• Move from B shift to A shift cleaning (a savings of $0.75�hour shift premium).• Reduce supervisory staff from 28 to 15.• Reduce overhead (vehicles and equipment).• Advise customers regarding layout and construction materials that are easy to maintain.• Formalize the process of screening labor for other departments. This would eventually
transform the department to meet entry-level labor requirements for all other departmentson the site.
• Capability enhancement:—Develop in BSD personnel the motivation and ability to self-manage and problem
solve. (Currently many of the 350 regular full-time personnel have limited reading,writing, and math skills.)
—Improve the value of services via increased training in minor repairs and maintenance.
zim36725_ch09_409-467.qxd 12/15/09 2:07 PM Page 451

452 Chapter 9
reliable employees. The manufacturing departments also use BSD employees to fill in when normalproduction employees are on vacation.
Last year BSD reduced its fully absorbed costs to less than 29 percent over market prices, aheadof the forecast of 37 percent. BSD’s costs are now $15 million annually. There is more pressure thanever on all Rochco managers to reduce costs. In June, J. William Laurri, a manufacturing managerand one of BSD’s largest customers, told Flynn that he was seriously considering going outside forcleaning services based on price. Laurri manages another cost center with challenging cost reductiongoals and represents 50 percent of BSD’s customer base. Flynn is concerned that the loss of Laurri willirreparably damage BSD’s progress toward its five-year break-even goal and raise costs to other de-partments to such an extent that most of his customers will switch to contract cleaners. Although BSDis still uncompetitive at full cost, it is almost competitive (within 2 percent) on a direct cost basis.
Required:
a. Describe the cost accounting and control issues that are driving Flynn, Corrado, and Laurri.
b. Dennis Flynn is confident that his cost-cutting program will succeed by the target date ifBSD keeps its current accounts. Should he discount BSD’s services in order to keep Laurri?
c. Should Jim Corrado insist that managers of the operating units continue to use BSD’sservices? What are the pros and cons of such an order?
SOURCE: S Usiatynski, H Merkel, and M Joyce.
P 9–17: Welding Robots
The frame-welding department of a large automotive company welds car frames as they pass down theassembly line. Four computer-controlled robots make the welds on each frame simultaneously. Wheninstalled last year, each robot was expected to have a five-year useful life before becoming obsolete andbeing replaced by newer, faster models with more advanced electronics. Over its life, each robot isexpected to make 100 million welds. The robots cost $8 million apiece and have no salvage value at theend of their useful lives after the cost of dismantling and removing them is taken into consideration.
The firm has a traditional absorption costing system that costs each frame. The accountingsystem supports decision making and control. Straight-line depreciation is used for both internaland external reporting, and accelerated depreciation is used for taxes. As frames move through thewelding stations, they are charged based on the number of welds made on each frame. Different carframes require different numbers of welds, with some frame models requiring up to 1,000 welds.Welds cost $0.11 each. This charge is set at the beginning of the year by estimating the fixed andvariable costs in the welding department. Accounting determines the expected number of weldsprojected for the year by taking the projected number of frames times the number of welds perframe. The expected number of welds is used to estimate total costs in the welding department. Thecost per weld is then the ratio of the projected welding costs to the expected number of welds.Seventy-two million welds were projected for the current year.
The following statement illustrates the computation of the charge per weld:
Charge per Weld, Current Year
Variable Costs Fixed Total(at 72 Million Welds) Costs Costs
Depreciation* $ 6,400,000 $ 6,400,000Welding rods $ 700,000 700,000Engineering services 300,000 200,000 500,000Electricity 180,000 180,000Factory overhead 85,000 55,000 140,000
Total $ 1,265,000 $ 6,655,000 $ 7,920,000� Expected number of welds 72,000,000 72,000,000 72,000,000
Cost per weld $ 0.0176 $ 0.0924 $ 0.1100
*Depreciation per year � 4 robots � $8 million per robot � 5-year life.
zim36725_ch09_409-467.qxd 12/15/09 2:07 PM Page 452

Absorption Cost Systems 453
After reviewing the above statement, Amy Miller, manager of the body fabricating division(which includes the welding department), made the following remarks:
I know we use straight-line depreciation to calculate the depreciation component of the cost perweld now. But it would seem to make a lot of sense to compute robot depreciation using units-of-production depreciation. Each robot cost $8 million and was expected to perform 100 millionwelds over its useful life. That comes to 8¢ per weld. Thus, we should charge each weld at 8¢plus the remaining fixed and variable costs as calculated on this statement. If I back out the$6.4 million depreciation from the above figures and recompute the fixed costs per weld at72 million welds, I get $255,000 divided by 72 million, or $0.00354. Add this to the variable costper weld of $0.0176 plus the 8¢ depreciation and our cost per weld is $0.1011 per weld, not the11¢ now. This reduces our costs on our complicated frames by as much as $10.
The real advantage of using units-of-production depreciation, in my opinion, is that depreci-ation becomes a variable cost. This has real advantages because, when you lower your fixedcosts, your break-even point is lower. Operating leverage is lower, and thus the company’s over-all risk is reduced.
I think we should go to the plant controller and see if we can convince him to use a morerealistic basis for calculating the depreciation costs of the robots.
Required:
Do you agree with Amy Miller’s proposal?
P 9–18: DigiEar
DigiEar has invented and patented a new digital behind-the-ear hearing aid with adaptive noisereduction and automatic feedback cancellation. DigiEar produces four different models of its DigiEardevice. The following table summarizes the planned production levels, costs, and selling prices forthe four DigiEar devices for this year:
DigiEar Hearing Aid Models
A21 B45 C24 D88
Budgeted production and sales (units) 12,000 8,000 5,000 3,000Selling price $500 $600 $700 $1,000Direct labor (DL) hours per unit 2.0 2.8 3.0 3.5Direct material per unit $110 $120 $130 $150Direct labor cost (wages, benefits,
and payroll taxes) per DL hour $25 $25 $25 $25
DigiEar allocates both fixed and variable manufacturing overhead to the four devices using a singleoverhead rate which includes both fixed and variable manufacturing overhead. The number of directlabor hours in each device is used as the allocation base for assigning overhead to hearing aids. Bud-geted volume measured using direct labor hours is calculated using the budgeted sales of each device.Variable manufacturing overhead is budgeted at $12.00 per direct labor hour and fixed manufactur-ing overhead is budgeted this year at $2,157,000.
Required:
a. Calculate DigiEar’s budgeted manufacturing overhead rate per direct labor hour for this year.
b. Using absorption costing, calculate the budgeted manufacturing cost per unit for each ofDigiEar’s four hearing aid devices.
c. During the year, actual manufacturing overhead incurred (fixed plus variable) was $3,110,000,and the actual number of direct labor hours used producing the four hearing aids was:
A21 B45 C24 D88
Actual direct labor hours 26,000 23,800 18,600 12,250
zim36725_ch09_409-467.qxd 12/16/09 9:43 AM Page 453

454 Chapter 9
Calculate the over- or underabsorbed overhead DigiEar has for this year.
d. Assuming that the entire over- or underabsorbed overhead you calculated in part (c) iswritten off to cost of goods sold, does this write-off increase or decrease net income beforetaxes? Explain.
P 9–19: Specialized Surgical Instruments
Specialized Surgical Instruments (SSI) manufactures four surgical implants. SSI uses an absorptioncosting system to allocate manufacturing overhead to its four products. Direct labor hours are usedas the allocation base. The annual budgeted overhead rate is predetermined using a flexible budget.Fixed overhead is budgeted at $580,000 for the current year. The following table summarizes thebudgeted number of units of each of the four implants, the budgeted number of direct labor hours perimplant, and the actual direct labor hours used to produce each of the four implant models for thecurrent year.
(Current Year)
VX4 VX8 CMA ALX
Budgeted direct labor hours per unit 3 2 4 5Budgeted units 5,000 4,500 3,500 2,400Actual volume (direct labor hours) 13,950 8,500 14,250 10,800
At the end of the current year, actual manufacturing overhead incurred was $1,258,300 and manu-facturing overhead was under absorbed by $184,800.
Required:
What was SSI’s budgeted variable overhead rate per direct labor hour in the current year? (Showcalculations.)
P 9–20: Pebble Beach Sandals
Pebble Beach Sandals has designed and patented a luxury golf sandal for both men and women. Theunique handmade designs include spikes and cleats to prevent the golfer from slipping during theswing. The sandal is made from sheepskin creating comfortable and distinctive footwear sold directlyto wholesalers who then sell them to exclusive golf shops for retail prices starting at $400.
The sandals are manufactured in the United States and sold in the United States and Europethrough two dedicated sales divisions. The United States and EU sales divisions are organized as sep-arate profit centers with decision rights to set prices in their respective geographic territories. TheU.S. factory is a cost center that produces the sandals and transfers them to the two sales divisions.Each sales division is charged the full manufacturing cost of the sandals (direct labor, direct materi-als, and overhead). All the sandals produced, both men’s and women’s styles, and all the various mod-els contain similar amounts of direct labor and direct material. The only difference between the U.S.and EU sandals is the sizing and the size labels stitched into the sandals. Hence, volume in the plantis measured as pairs of sandals manufactured.
This year’s manufacturing cost of Pebble Beach sandals is given by the following table:
Direct labor $38Direct material 44Variable overhead 9Allocated fixed manufacturing overhead* 39
Total cost $130
*Based on expected volume of 17,400 sandals and fixed manufacturing overheadof $678,600.
zim36725_ch09_409-467.qxd 12/15/09 2:07 PM Page 454

Absorption Cost Systems 455
The U.S. plant was built with a capacity to produce between 16,000 and 20,000 sandals per year anda long-run expected volume of 18,000 sandals.
The U.S. sales division faces the following demand curve for sandals:2
Price Quantity
$260 7,200255 7,600250 8,000245 8,400240 8,800235 9,200
Besides paying the manufacturing plant’s transfer cost of the sandals ($130 per pair), the U.S.sales division has its own variable costs of $20 per pair and incurs fixed costs per year of $700,000.
Required:
a. In order to maximize its own profits (after paying the manufacturing plant’s transfer cost of$130), how many pairs of sandals will the U.S. sales division order and expect to sell thisyear? Show calculations.
b. Next year, the U.S. sales division expects its variable costs per pair to remain at $20 andits fixed costs to remain at $700,000 per year. However, due to a sharp reduction in EUdemand caused by a recession, the projected combined demand from the U.S. and EUsales divisions for sandals falls from the current level of 17,400 sandals to 14,200. Theplant’s budgeted direct labor, direct materials, variable overhead, and fixed overhead willremain the same as this year’s amounts, but the allocated fixed overhead per pair ofsandals will rise due to the lower projected volumes. Compute next year’s allocated fixedmanufacturing overhead per pair of sandals and the total cost that will be used as thetransfer cost based on next year’s projected volume. (Round all costs to the nearestdollar.)
c. Using the transfer cost you computed in part (b), how many pairs of sandals will the U.S.sales division order next year? Show calculations.
d. Does the number of pairs of sandals ordered by the U.S. sales division maximize theprofits (net cash flows) of Pebble Beach Sandals? Explain why or why not.
e. What suggestions would you offer management to increase Pebble Beach Sandals’shareholder value?
P 9–21: Jacklin Stampings
Jacklin Stampings allocates overhead to products based on machine hours. It uses a flexible overheadbudget to calculate a predetermined overhead rate at the beginning of the year. This rate is used dur-ing the year to allocate overhead to the various stampings produced. The following table summarizesoperations for the last year:
Budgeted fixed overhead $3,800,000Overabsorbed overhead variance $220,000Actual machine hours 46,000Variable overhead per machine hour $100Actual overhead incurred $8,750,000
2Price � 350 � (1�80) quantity.
zim36725_ch09_409-467.qxd 12/15/09 2:07 PM Page 455

456 Chapter 9
Required:
In setting the overhead rate at the beginning of the year, what budgeted volume of machine hourswas used?
P 9–22: Bartolotta Company
The Bartolotta Company had an overabsorbed overhead balance at year-end. The firm wrote offone-third of it to Cost of Goods Sold, thereby raising net income by $100,000, and the remainderwas charged to inventory accounts. Overhead is allocated to products using direct labor dollars.The firm uses a flexible budget to calculate its overhead rate. Before the year began, the variableoverhead rate and budgeted volume were estimated to be $7.00 per direct labor dollar and $1 mil-lion, respectively. Actual overhead incurred for the year was $9.7 million, and actual direct laborcost was $1,250,000. What budgeted fixed overhead amount did the Bartolotta Company use incalculating the overhead rate?
P 9–23: Kitchen Rite
Kitchen Rite is considering outsourcing the production of a steel chassis that is used in a kitchenappliance. Two thousand chassis are produced per month. An outside vendor will supply an identi-cal chassis for $9.90. The chassis is manufactured in two steps. A stamping press punches out thepart from sheet metal, bends the sides, and cuts holes in it, all in one operation. Then a weldingmachine welds the corners. Both the welding and stamping machines are used to produce only thisone chassis model. The following job order cost sheet summarizes the costs of producing a singlechassis.
Cost per Unit
Steel plate $ 4.75Direct labor:
Stamping ($20�hour) 1.60Welding ($30�hour) 2.50
Overhead:Stamping (depreciation) 3.60Welding (lease payment) 2.15General plant 5.90
$20.50
The stamping machine is old and has little economic value. A used equipment dealer is willingto remove the machine and haul it away at no cost. The stamping machine was purchased 13 years agofor $1,728,000. For both tax and reporting purposes, it is being depreciated using a 20-year life,straight-line method, and it has zero salvage value. The welding machine is leased for $4,300 permonth, and the lease can be canceled at any time and the machine returned. However, an early termi-nation penalty of $1,800 per month for the next 42 months must be paid.
General plant overhead consists primarily of the allocated cost of depreciation on the plant,property taxes, and fire insurance on the plant. Kitchen Rite currently has excess plant space. Themanufacturing space freed up if the chassis is outsourced has no other use.
Employees are unionized and have a clause in their contract that prevents the firm from firingthem if their jobs are eliminated due to outsourcing. The employees working on the stamping ma-chine will be placed on indefinite furlough at 75 percent of their current pay. The employees operat-ing the welding machine can be reassigned to other positions in the firm as job openings occur. Giventhe high demand for welders, these reassignments will occur within a few weeks of outsourcing thechassis.
Kitchen Rite has a tax loss for the current and the previous two years.
zim36725_ch09_409-467.qxd 12/15/09 2:07 PM Page 456

Absorption Cost Systems 457
Required:
Should Kitchen Rite outsource the chassis? Support your recommendation with a clear financialanalysis of the facts.
P 9–24: Frames, Inc.
Frames, Inc., manufactures two types of metal frames: large and small. Steel angle iron is first cut tothe appropriate sizes; the pieces are then welded together to form the frames. The process involves ahigh degree of automation. There is considerable indirect labor by skilled technicians and engineerswho maintain the automated equipment. There are two manufacturing departments: cutting and weld-ing. The following report details the actual costs of production for the year:
FRAMES, INCYear Ending 12/31
Direct Costs
Frame Type Units Produced Direct Labor Direct Materials
Large 10,000 $ 480,000 $950,000Small 30,000 1,140,000 800,000
Overhead Costs by Department
Overhead Costs Cutting Welding Total
Utilities $ 58,000 $174,000 $ 232,000Indirect labor 430,000 480,000 910,000General factory costs 150,000
Total overhead costs $1,292,000
Kilowatt-Hours (000s)
Frame Type Cutting Welding Total
Large 530 1,040 1,570Small 910 1,200 2,110
Total kilowatt-hours 1,440 2,240 3,680
Required:
a. Compute the unit costs of large frames and small frames for the year using a singlefactorywide overhead rate. The factorywide overhead allocation base is direct labor cost.
b. Compute the unit costs of large frames and small frames for the year using differentoverhead rates for utilities, indirect labor, and general factory costs. Utility costs andindirect labor costs are allocated to frames using kilowatt-hours. General factory costs areallocated to frames using direct costs (the sum of direct labor and direct materials).
c. Compute the unit costs of large frames and small frames for the year using departmentaloverhead rates for the cutting and welding departments. General factory overhead costs areevenly divided between the two departments before departmental overhead is allocated tothe frames. Cutting department overhead costs are allocated based on direct materialscosts; welding department overhead costs are allocated based on kilowatt-hours in thewelding department.
d. Analyze why different unit costs result from the different methods of allocating overheadcosts to the products. Which method is best?
zim36725_ch09_409-467.qxd 12/16/09 9:43 AM Page 457

458 Chapter 9
P 9–25: Hurst Mats
Hurst Mats manufactures custom replacement floor mats for automobiles. The floor mats are madeof spun nylon on highly automated, expensive machinery. Hurst manufactures two mat styles: Plushand Deluxe. Hurst’s unionized work force makes it difficult for Hurst to compete on price. So far ithas been able to successfully compete on quality, innovative design, and delivery schedule. However,the leaders of Hurst’s union are aggressive and are seeking additional work-related job guarantees.Hurst management would like to reduce its dependence on unionized labor.
Hurst’s manufacturing process is overhead-driven; most of the overhead arises from the commonmachinery that produces the Plush and Deluxe floor mats. Nonunionized engineers and techniciansmaintain the equipment. Expensive lubricants and filters are required to operate the machines, whichrequire large amounts of electricity and natural gas. Each mat style is produced in batches that con-sist of 10 mats per batch. Plush and Deluxe do not put differential demands on the equipment otherthan through the amount of machine time required to produce each batch of mats. The following tablesummarizes the operating data for each mat style:
Plush Deluxe
Machine minutes per batch of 10 mats 12 9Direct labor per batch of 10 mats $4 $6Direct material per batch of 10 mats $7 $5Number of batches per year 14,000 9,000
Overhead is allocated to the two mat styles using a predetermined overhead rate estimated from aflexible budget at the beginning of the year. Fixed overhead is estimated to be $680,000, and variableoverhead is estimated to be $1.50 per machine minute. Management is debating whether to use machineminutes or direct labor cost as the overhead allocation base to allocate overhead to the two mat styles.
Required:
a. Calculate two overhead rates. The first uses machine minutes as the allocation base, andthe second overhead rate uses direct labor cost as the allocation base. Round both overheadrates to two decimals.
b. Calculate the total product cost per batch of Plush and Deluxe mats using the two overheadrates calculated in (a).
c. Discuss the advantages and disadvantages of using machine minutes or direct labor cost asthe allocation base for assigning overhead to the two mat styles.
P 9–26: Mutual Fund Company
Mutual Fund Company (MFC) is considering centralizing its overnight mail function. Five departmentswithin MFC use overnight mail service: trades processing, trades verifications, securities processing,accounts control, and customer service. Although these departments send different types of packages(weight and content), they often send packages to the same destinations. Currently, each of these de-partments independently contracts for overnight mail service. The five departments’ present rates are:
Present Rates per Package
Number of Pounds in Package
Department 1 2 3 4 5
Trades processing $ 7.25 $ 8.50 $ 9.75 $11.00 $12.25Trades verifications 7.75 8.75 9.75 10.75 11.75Securities processing 8.00 9.50 11.00 12.50 14.00Accounts control 10.00 12.00 14.00 15.50 16.50Customer service 16.00 18.00 20.00 22.00 24.00
zim36725_ch09_409-467.qxd 12/15/09 2:07 PM Page 458

Absorption Cost Systems 459
MFC has requested that each of the five departments submit an estimate of its overnight mail forthe coming year. The departments’ estimates are as follows:
Usage Estimates
Annual AveragePackages Number of Weight per Poundsper Day Packages* Package per Year
Trades processing 100 25,000 5 lbs. 125,000Trades verifications 100 25,000 3 lbs. 75,000Securities processing 100 25,000 2 lbs. 50,000Accounts control 50 12,500 5 lbs. 62,500Customer service 10 2,500 1 lb. 2,500
Total 360 90,000 315,000
*Based on 250 days per year.
Using these volume estimates, MFC was able to negotiate the following corporate rates withEXP Overnight Express:
Corporate Rates per Package
Weight (Pounds) Rate Weight (Pounds) Rate
1 $ 7.75 6 $12.552 8.70 7 13.553 9.65 8 14.504 10.65 9 15.455 11.60 10 16.45
The centralized overnight mail unit would be run as a cost center. All expenses would be chargedback to the five departments. The chargebacks would have two components:
1. The corporate rate per package charged by EXP (based on weight).
2. An overhead allocation per package.
MFC plans to use a prospective overhead rate. Pounds per package will be used as the allocationbase. As each package comes in, overhead will be charged. The rate will be set at the beginning of theyear, allowing the overnight mail service to be costed as it is used. The common costs that make upoverhead are labor, supervision, and other expenses as follows:
Overhead Expenses
3 employees @ $11,000 per person, per year $33,0001 supervisor @ $18,000 per year 18,000Other costs (rent, utilities, etc.) 24,000
Total overhead $75,000
At this time, there is much controversy and skepticism about the centralization of the overnightmail function. The managers of trades processing and trades verifications are most opposed to theproposed system. They claim not only that it is unfair but also that the annual cost savings created bythis centralized system do not justify a change.
zim36725_ch09_409-467.qxd 12/15/09 2:07 PM Page 459

460 Chapter 9
Required:
a. Calculate the overhead allocation rate that would be used with the centralized system.
b. Calculate the estimated overall cost and department cost of MFC’s overnight mail serviceunder both the present system and the proposed centralized system.
c. Discuss why the managers of trades processing and trades verifications are opposed to theproposed centralized system. Do you agree with their criticisms?
d. Evaluate the proposed method of allocating overhead under the centralized system. Is there abetter method for allocating cost? If so, what is it?
e. Do you think the proposed centralized system can be improved? If so, how?SOURCE: A Di Gabriele, M Perez, N Rivera, C Tolomeo, and J Twombly.
P 9–27: Amalfi Texts
Amalfi Texts specializes in printing textbooks for high school science classes. Publishing companieslike McGraw-Hill contract with authors to prepare the manuscript, which is then copyedited and type-set. Amalfi receives the typeset manuscript electronically and then prints and binds the textbook. ThePrinting Department prints the pages and the Binding Department assembles the book and attachesthe cover. Each department has its own overhead rate. Overhead rates in both departments are basedon expected volume. Volume in the Printing Department is measured by the total number of pagesprinted in the year, and volume in the Binding Department is measured by the total number of booksbound in the year. The following table summarizes expected volume, fixed overhead in each depart-ment, and the expected variable overhead per unit of volume in each department.
Printing Binding
Fixed overhead (millions) $3.60 $1.46Volume measure Number of pages Number of booksVariable overhead per unit of volume $0.02 $1.25Expected number of pages 240,000,000Expected number of books 400,000
Required:
a. Calculate the overhead rates Amalfi Texts will use for the year in the Printing and Bindingdepartments.
b. During the year, Amalfi prints and binds 10,000 copies of Zhang’s Modern Biology. Eachcopy of the Zhang text has 550 pages. Direct labor in the Printing and Binding departmentsfor the Zhang book was $13,500 and $19,000, respectively, and direct materials in thePrinting and Binding departments were $61,000 and $21,500, respectively. Calculate thetotal cost of producing the Zhang book.
c. Amalfi’s total production for the year (including the Zhang book) was 410,000 books with250 million pages. Actual overhead incurred in the Printing and Binding departmentsamounted to $8.82 million and $2.185 million, respectively. Calculate the over- or underabsorbed overhead in each department and for the entire firm for the year.
d. Instead of using expected volume, had Amalfi used normal volume (288 million pages and480,000 books), how much over- or underabsorbed overhead would Amalfi have for theyear?
e. Discuss the various factors (reasons) why Amalfi might want to use normal versusexpected volume in calculating its overhead rates.
zim36725_ch09_409-467.qxd 12/15/09 2:07 PM Page 460

Absorption Cost Systems 461
P 9–28: Pyramid Products
Pyramid Products manufactures a large number of home and commercial cleaning products at itsplant in Oshkosh, Wisconsin. This plant, which employs about 450 people, produces floor waxes,cleaners, bathroom and kitchen cleaners, aerosol air fresheners, disinfectants, and laundry detergents.The products are sold under their own brand name (Pyramid) to supermarkets and home and gardencenters. Over time, competition from national brands and price pressure from mass merchandiserssuch as Wal-Mart have eroded Pyramid sales to the point that the Oshkosh plant has substantial ex-cess capacity—approaching 40 percent of the plant’s historical capacity 25 years ago when the plantwas built. Pyramid has tried a variety of strategies to increase sales of its existing products, but so farnone seem to be yielding dramatic effects.
In an effort to build volume in the plant and to increase the demand for its existing products, man-agement has begun an acquisition strategy and engaged an investment banking firm to find suitableacquisition targets. A suitable target would be in the home cleaning industry with products complemen-tary to Pyramid’s, with production that could be shifted to the Oshkosh plant. A complementary prod-uct would not duplicate existing Pyramid products and would have a distribution channel that could beused to enhance the sales of other Pyramid products. The investment banker has identified two candi-dates, Zapp and Kleann. Each produces a branded product for the home cleaning market and both offerPyramid about the same synergies in terms of increasing the demand for Pyramid’s existing products.Both could be acquired for about the same price, but because Pyramid has limited capital and limitedaccess to the capital markets, it can acquire only one of the two companies, not both.
Pyramid’s investment banker has provided the following summary data for both targets:
Zapp Kleann
Price per case $45.00 $37.50 Variable cost per case $33.00 $27.50 Annual volume (cases) 80,000 60,000Direct labor hours per case 0.20 0.60
Besides reviewing the price and variable cost information in the preceding table, the Oshkosh plantmanager and her chief financial officer have visited both Zapp and Kleann. They estimate that theOshkosh plant will have to incur additional fixed annual overhead costs of $600,000 if Zapp is ac-quired and $400,000 if Kleann is acquired. These additional annual fixed costs include such items asadditional leased equipment and additional personnel in quality control, engineering, and purchasing.
The Oshkosh plant uses a single plantwide overhead rate to assign plant overhead to products.Currently, the factory’s fixed overhead is $3 million and its current volume is 50,000 direct laborhours. There is negligible variable factory overhead in the Oshkosh plant. Fixed factory overhead isabsorbed to products based on direct labor hours.
Required:
a. Calculate the Oshkosh plant’s current fixed manufacturing overhead rate (before theacquisition of either Zapp or Kleann).
b. Calculate what the Oshkosh plant’s fixed manufacturing overhead rate will be if Zapp isacquired. Assume that the additional fixed overhead of $600,000 needed to bring Zapp intothe Oshkosh plant is added to the existing plant overhead and the total pool is assigned toall products (including Zapp).
c. Calculate what the Oshkosh plant’s fixed manufacturing overhead rate will be if Kleann isacquired. Assume that the additional fixed overhead of $400,000 needed to bring Kleanninto the Oshkosh plant is added to the existing plant overhead and the total pool is assignedto all products (including Kleann).
d. Pyramid’s management does not know what final negotiated price Pyramid will have topay for each target. The investment banker thinks that both Zapp and Kleann can be
zim36725_ch09_409-467.qxd 12/15/09 2:07 PM Page 461

462 Chapter 9
purchased for about the same price. However, management must decide which one topursue first. The plant manager is most interested in Kleann. She argues that her plant’slargest problem is overhead absorption. The existing products in the plant are bearingan increasingly larger charge for overhead as volume drops. Kleann, she argues, willabsorb more factory overhead than Zapp because it requires three times as much directlabor hours per case and Zapp requires less additional fixed overhead than Kleann.Critically evaluate the plant manager’s argument as to why Pyramid should firstevaluate Kleann rather than Zapp. Assume that both Zapp and Kleann offer Pyramid’sexisting products about the same benefits in terms of new channels of distribution forPyramid’s products.
P 9–29: Magic Floor
Magic Floor produces and sells a complete line of floor care products: wax strippers, floor soaps, andfloor waxes. All of these products are packaged on a new high-speed bottling fill line. Empty bottles(pints, quarts, half gallons, or gallons) are automatically removed from their boxes and placed on theline. The empty bottles are then filled, sealed with a foil closure, capped with a screw, and labeled. Thefilled, sealed, capped, and labeled bottles go to a weigh station to insure each bottle has the correctamount of fill, and the nonrejected packaged bottles are placed in boxes and a bar-coded shipping labelis attached. The fill line requires minimal direct labor once it is programmed for the bottle size, con-tents, and the bar-coded labels. The decision to purchase the fill line in 2010 was justified under theassumption that the line would run 7 hours a day, 5 days a week, and 50 weeks a year.
The 2012 budget for the fill line is:
Maintenance $ 77,000Indirect labor 182,000Depreciation 127,000Utilities 29,000Indirect supplies 27,000
Magic Floor’s 2012 budgeted production is:
Filled Bottles Pints Quarts Half-Gallons Gallons
Wax stripper 40,000 50,000 60,000 47,000Soap 48,000 62,000 79,000 70,000Wax 44,000 55,000 68,000 49,000
Magic Floor allocates the fill line costs to the various bottled products using a predeterminedoverhead absorption rate calculated based on budgeted costs divided by budgeted volume. Budgetedvolume is measured in seconds on the fill line. Pints are filled in 3 seconds, quarts in 5 seconds, half-gallons in 9 seconds, and gallons in 17 seconds.
During 2012, the following times (in seconds) were recorded for filling bottles on the fill line:
Pints Quarts Half-Gallons Gallons
Wax stripper 118,000 246,000 542,000 800,000Soap 145,000 305,000 703,000 1,180,000Wax 130,000 270,000 608,000 840,000
zim36725_ch09_409-467.qxd 12/15/09 2:07 PM Page 462

Absorption Cost Systems 463
Actual overhead costs incurred in 2012 on the fill line are:
Maintenance $ 76,000Indirect labor 179,000Depreciation 127,000Utilities 28,000Indirect supplies 25,000
Required:
a. Calculate the expected volume of the bottling fill line for 2012.
b. Calculate the normal volume of the bottling fill line for 2012.
c. Calculate the overhead absorption rate for the bottling fill line for 2012 based on expectedvolume (round overhead rate to four decimals).
d. Calculate the overhead absorption rate for the bottling fill line for 2012 based on normalvolume (round overhead rate to four decimals).
e. Calculate the over/underabsorbed overhead amount for the bottling fill line for 2012 basedon expected volume.
f. Calculate the over/underabsorbed overhead amount for the bottling fill line for 2012 basedon normal volume.
g. Explain in intuitive terms why your answers in parts (e) and ( f ) differ.
P 9–30: Neweway Plastics (See Appendix A)
Neweway Plastics manufactures an acrylic compound used in automobile bumpers in a continuousflow process. Raw material is added at the beginning of the process and conversion costs are incurreduniformly over the process. The accompanying table summarizes the results of operations for May:
Beginning work in process (units) 6,000Raw materials $2,680Conversion costs (50%)* 892 $3,572
Units completed and transferred out 40,000Units started in May 38,000Ending work in process (units) 4,000 (70%)*
Conversion costs incurred in May $17,512Material costs incurred in May $19,760
*Percentages denote percentage complete.
Required:
Compute the cost of goods transferred out and the ending work in process for the month of May usingboth the weighted average and FIFO methods.
CasesCase 9–1: Heath Metal Products
Chris Maynard, one of Heath Metal Products’s three customer engineers, is reviewing the costs of theradar housings for Lingle Aerospace (LA). LA is one of Maynard’s largest accounts and the radarhousing is a fabricated piece of sheet metal LA uses to assemble an aircraft’s radar system installedin the nose of the plane. In reviewing the detailed cost record for this job, Maynard is concerned thatthe direct labor posted to the job appears too high. He estimated the direct labor in the welding de-partment to be six hours per batch of 130 units. But the job sheet reports that 9.5 hours were used.
zim36725_ch09_409-467.qxd 12/15/09 2:07 PM Page 463

464 Chapter 9
BackgroundHeath Metal Products is a custom machine shop that bids on orders and produces sheet metal parts inbatches. It was founded 30 years ago by two tool and die makers in their mid-30s: Jack Spence andDon Carter. Spence and Carter were previously employed by a national automobile company. Theystarted Heath to make parts for local large manufacturing firms that did not have sufficient capacityto meet short-run production schedules. Now Heath competes by supplying certain types of partsmore cheaply than large companies can produce them internally. It does this by (1) bidding on jobswith run lengths that match Heath’s machine configurations, (2) employing nonunion labor, and(3) avoiding much of the overhead existing in big factories. Heath Metal Products now manufacturessheet metal parts used in a variety of office products, computers, and printers. The firm has grown inrecent years and has benefited from the outsourcing movement whereby large firms seeking to reducetheir manufacturing costs outsource noncritical metal fabricated parts.
Heath’s single plant has a number of sheet metal presses (the largest being a 500-ton press),numerically controlled cutting and drilling machines, lathes, drill presses, and electric arc welders.Engineers contact customers to see if they have parts they are willing to outsource. Usually, the cus-tomer is introducing a new model and has not produced the tools necessary to fabricate the part inter-nally. Heath’s customer engineer works with the client on the manufacturing and design specificationsfor the part and submits a bid to produce and deliver a set number of parts over a given time period ata fixed price. In the process of preparing the bid, the customer engineer forecasts the cost of the job byestimating direct labor, direct material, and machine time required in each factory department.
Due to intense competition from other firms (as large office equipment companies constantlyshift production worldwide to find the lowest-cost, highest-quality producers), shops such as Heathhave high variability in volumes. In response to these volume changes, Heath is always laying off andrehiring employees. If Heath loses a large contract, it often requires six to nine months to replace thework. In the meantime, employees are laid off until new work can be found.
Two hundred employees now work at Heath, including sales, administrative, and factory em-ployees. Besides production workers, Heath has a maintenance and janitorial staff. To improve costcompetitiveness, Spence and Carter have been trying to get production employees to take over moreof the maintenance and clean-up tasks when they have idle time. They would also like to see theworkers cross-trained in more production and maintenance tasks to help better balance work flow inthe factory. These actions will raise productivity and reduce costs. However, the attempts at cross-training have achieved very limited success.
Compensation systemHeath does not have a formal pay-for-performance or bonus system. All employees are paid straightsalary with annual raises. Customer engineers do not receive commissions for sales. In good years,raises are higher. Management has explored incentive pay and piece-rate systems. They have con-cluded that the constantly changing product mix would cause such systems to be very expensive toimplement and maintain.
At a sales staff meeting in February, Phil Matson, Heath’s vice president of operation, mentionedthey were going to award bonuses to the customer engineers if they could achieve their target sales fore-casts. In July, Chris Maynard, whose sales were up 22 percent over the previous year, asked Matsonwhether total sales were ahead of the target needed for the bonus. Matson said that while sales were upfor the year, the plant still had excess capacity and it appeared they would not achieve the forecast.
Accounting systemA job order cost system is used to accumulate direct labor and direct materials to individual jobs. Atthe end of the day, employees fill out a time sheet indicating the jobs they worked on and the time spenton each job. All the indirect costs are accumulated into a separate overhead cost pool for each factorydepartment (pressing, drilling, and welding). The indirect costs for each department include equipmentdepreciation and lease charges, the department supervisor’s salary, employees’ idle time, and allocatedutilities and occupancy charges (property taxes, plant building depreciation). Then, separate overheadrates are set for each department using direct labor hours as the allocation base. When an employeeposts time to a particular job, the overhead rate for the employee’s department multiplied by the em-ployee’s time charged to the job is the amount of overhead for that department charged to the job.
zim36725_ch09_409-467.qxd 12/15/09 2:07 PM Page 464

Absorption Cost Systems 465
Problem with the Lingle Aerospace jobChris Maynard contacts Phil Sanchez, supervisor of the welding department, and asks about the dis-crepancy between Maynard’s estimate of 6.0 hours in the welding department and the 9.5 hours actu-ally charged to the LA contract. Sanchez admits that there were two other jobs in the weldingdepartment at that time and that it is possible the employee had mistakenly charged some time to theLA contract instead of the other jobs.
Maynard then asks Linda Rawlings, supervisor of the drilling department, about the 67 labor hourscharged to LA. Maynard had estimated the drilling time to be 53 hours for the batch. Rawlings saidshe was too busy now to look into the matter but she would contact him later. That was two weeks ago.Maynard is concerned that if the costs charged to the LA contract are too high, Phil Matson will ask LAfor a higher price. If this happens, LA might shift the radar housing from Heath to another supplier.
When Jack Spence learned of the accounting errors on the LA account, he replied, “I don’t seeany problem. As long as the time cards are charged to jobs, our tax returns are right.”
Required:
a. Identify various problems at Heath.
b. What improvements would you suggest Heath implement?
Case 9–2: Portable Phones, Inc.
Portable Phones, Inc., manufactures and sells wireless telephones for residential and commercialuse. Portable Phones’ plant is organized by product line, with five phone assembly departments intotal. Each of these five phone assembly departments is responsible for the complete production ofa particular phone line, including manufacturing some parts, purchasing other parts, and assemblingthe unit.
Each of the five phone assembly department managers reports to a product-line manager whohas profit responsibility for his/her product. These five product-line managers have authority overpricing, marketing, distribution, and production of their product. Each of the five phone assembly de-partments is a cost center within its respective product-line profit center.
A key component of each phone is the circuit board(s) containing the integrated circuit chips.Each phone assembly department purchases from outside vendors the basic boards and chips to be at-tached to its board(s). The board department of the plant receives the boards and chips in kits from eachphone assembly department and assembles them into completed boards ready for assembly into thephones. The board department (with a cost structure that is 80 percent fixed and 20 percent variable)uses a single highly automated assembly line of robotic insertion machines to precisely position eachchip on the board and soldering machines to solder the chips onto the board. The board department isa common resource for the plant; all five of the phone assembly departments use the board departmentto assemble some or all of their boards. Since the board department has a single assembly line, it canonly assemble boards for one type of phone at a time. The assembly departments have authority to seekthe most competitive supplier for all their parts and services, including circuit board assembly.
The board department’s assembly schedule is determined at the beginning of each month. Thefive assembly departments request a time during the month when they plan delivery of particularkits to the board department and specify the number of boards to be assembled. The manager of theboard department then takes these requests and tries to satisfy the assembly departments’ requests.However, the board department manager finds that she has a peak load problem; the assemblydepartments tend to want their boards assembled at the same time. The only way to satisfy these requestsis to work overtime shifts during these peak periods even though the board department has excesscapacity at other times of the month.
The total monthly costs of the board department (equipment depreciation, maintenance, directlabor, supervision, and engineering support) are assigned to the phone assembly departments basedon an hourly rate. The board department’s total monthly costs are divided by the number of hours ofcapacity in the month (e.g., if a particular month has 22 working days, this is equivalent to 352 hoursor 22 days � 2 shifts � 8 hours per shift) to arrive at a charge per hour. To give the phone assemblydepartments incentives to have their kits (boards and chips) delivered to the board department in a
zim36725_ch09_409-467.qxd 12/15/09 2:07 PM Page 465

466 Chapter 9
timely manner, the phone assembly department is charged for the time from when the last job (a batchof boards assembled for a phone assembly department) was finished by the board department untilthe time when the next job is finished. For example, suppose phone assembly department A’s phoneswere finished at 9:00 a.m., and that department B delivered its kits at 1:00 p.m. and they were com-pleted at 7:00 p.m. the same day. Department B would be charged for 10 hours of the board depart-ment’s costs even though the board department was idle for 4 of the 10 hours.
When first installed, the board department was expected to be operating at full capacity, twoshifts per day, six days per week. But due to increased competition and outsourcing of some models,the board department is now operating at about 70 percent of the initial planned capacity.
Required:
a. If you manage a phone assembly department, when during the month would you tend torequest that your phone circuit boards be assembled by the board department (everythingelse being held constant)? Explain why.
b. Identify various dysfunctional behaviors likely to occur among the phone assemblydepartments and the board department.
c. What management changes would you suggest? In particular, what changes would youmake in the accounting system? Explain why each change should be made.
Case 9–3: PortCo Products
PortCo Products is a divisionalized furniture manufacturer. The divisions are autonomous segments,each responsible for its own sales, costs of operations, working capital management, and equipmentacquisition. Each division serves a different market in the furniture industry. Because the markets andproducts of the divisions are so different, there have never been any transfers between divisions.
The commercial division manufactures equipment and furniture that is purchased by the restau-rant industry. The division plans to introduce a new line of counter and chair units that feature acushioned seat for the counter chairs. John Kline, the division manager, has discussed the manufac-turing of the cushioned seat with Russ Fiegel of the office division. They both believe a cushionedseat currently made by the office division for use on its deluxe office stool could be modified foruse on the new counter chair. Consequently, Kline has asked Russ Fiegel for a price for 100-unit lotsof the cushioned seat. The following conversation took place about the price to be charged for thecushioned seats.
FIEGEL: John, we can make the necessary modifications to the cushioned seat easily. The raw materialsused in your seat are slightly different and should cost about 10 percent more than those usedin our deluxe office stool. However, the labor time should be the same because the seat fabri-cation operation basically is the same. I would price the seat at our regular rate—full cost plus30 percent markup.
KLINE: That’s higher than I expected, Russ. I was thinking that a good price would be your variablemanufacturing costs. After all, your capacity costs will be incurred regardless of this job.
FIEGEL: John, I’m at capacity. By making the cushioned seats for you, I’ll have to cut my productionof deluxe office stools. Of course, I can increase my production of economy office stools.The labor time freed by not having to fabricate the frame or assemble the deluxe stool can beshifted to the frame fabrication and assembly of the economy office stool. And you will savethe cost of the framing raw materials. However, I am constrained in terms of the number ofhours I have for cushion fabrication. Fortunately, I can switch my labor force between thesetwo models of stools without any loss of efficiency. As you know, overtime is not a feasiblealternative in our community. I’d like to sell it to you at variable cost, but I have excess de-mand for both products. I don’t mind changing my product mix to the economy model if Iget a good return on the seats I make for you. Here are my budgeted costs for the two stoolsand a schedule of my manufacturing overhead (see the tables that follow).
KLINE: I guess I see your point, Russ, but I don’t want to price myself out of the market. Maybe weshould talk to corporate to see if they can give us any guidance.
zim36725_ch09_409-467.qxd 12/15/09 2:07 PM Page 466

Absorption Cost Systems 467
Office Division Budgeted Costs and Prices
Deluxe EconomyOffice OfficeStool Stool
Raw materialsFraming $ 8.15 $9.76Cushioned seat
Padding 2.40 —Vinyl 4.00 —
Molded seat (purchased) — 6.00Direct labor
Frame fabrication(0.5 � $7.50�DLH*) 3.75 (0.5 � $7.50�DLH) 3.75
Cushion fabrication(0.5 � $7.50�DLH) 3.75 —
Assembly†
(0.5 � $7.50�DLH) 3.75 (0.3 � $7.50�DLH) 2.25Manufacturing
Overhead (1.5 DLH � $12.80�DLH) 19.20 (0.8 DLH � $12.80�DLH) 10.24
Total standard cost $45.00 $32.00
Selling price (30% markup) $58.50 $41.60
*Direct labor hours.†Attaching seats to frames and attaching rubber feet.
Office Division Manufacturing Overhead Budget
Overhead Item Nature Amount
Supplies Variable—at current market prices $ 420,000Indirect labor Variable 375,000Supervision Nonvariable 250,000Power Use varies with activity; rates are fixed 180,000Heat and light Nonvariable—light is fixed regardless of production,
while heat/air conditioning varies with fuel charges 140,000Property taxes and Nonvariable—any change in amounts/rates is
insurance independent of production 200,000Depreciation Fixed dollar total 1,700,000Employee benefits 20% of supervision, direct and indirect labor 575,000
Total overhead $3,840,000Capacity in DLH � 300,000
Overhead rate/DLH $12.80
Required:
a. John Kline and Russ Fiegel ask PortCo corporate management for guidance on anappropriate transfer price. Corporate management suggests they consider using a transferprice based upon opportunity cost. Calculate a transfer price for the cushioned seat basedupon variable manufacturing cost plus forgone profits.
b. Which alternative transfer price system—full cost, variable manufacturing cost, oropportunity cost—would be better as the underlying concept for an intracompany transferprice policy? Explain your answer.
SOURCE: CMA adapted.
zim36725_ch09_409-467.qxd 12/15/09 2:07 PM Page 467

Chapter Ten
Criticisms ofAbsorption CostSystems: Incentiveto Overproduce
Chapter Outline
A. Incentive to Overproduce
1. Example
2. Reducing the Overproduction Incentive
B. Variable (Direct) Costing
1. Background
2. Illustration of Variable Costing
3. Overproduction Incentive under Variable Costing
C. Problems with Variable Costing
1. Classifying Fixed Costs as Variable Costs
2. Ignores Opportunity Cost of Capacity
D. Beware of Unit Costs
E. Summary
468
zim36725_ch10_468-500.qxd 12/11/09 9:43 AM Page 468

Traditional cost data tend to be irrelevant and mischievous. These systems of simple propor-tional divisions followed by allocations and reallocations do not provide data appropriate formanagerial use in planning or controlling operations. Moreover, they tend to put such data as doexist in an inaccessible form. Unless other purposes for such data exist, the systems should bediscontinued to save the clerical costs of operating them.1
The last chapter described traditional absorption cost systems. These systems havebeen widely used for over 100 years, and some elements of them have been traced back tothe beginning of the Industrial Revolution. For as long as these systems have been used,they have been criticized for producing misleading information and creating incentives thatare inconsistent with maximizing the value of the firm. The quotation above is just oneexample of the charges leveled at traditional cost accounting systems. Despite such criti-cism, absorption cost systems persist and remain in wide use today. Moreover, nonmanu-facturing systems are based on elements of absorption cost systems. This chapter and thenext chapter examine some common complaints and present some alternatives to solve the problems.
As described in Chapter 1, cost systems serve numerous functions, including decisionmaking, control, and external reporting. No single system can satisfy all the requirementsof each function, so trade-offs must be made. Costing systems are constantly being revisedand updated as technology and firms’ organizational architecture change. Examining thewell-known problems in costing systems provides a greater appreciation of how to imple-ment them and how to become a more intelligent user of their data. Also, one must be care-ful not to reject a particular type of cost system (e.g., absorption costing) merely because aparticular firm or industry implements it badly.
Section A of this chapter describes how absorption cost systems can create incentivesfor managers to produce more than they sell (the incentive to overproduce). Section B pre-sents an alternative to absorption costing called variable costing that purportedly eliminatesthe incentive to overproduce. However, there are still incentives to overproduce under vari-able costing in some situations. Furthermore, variable costing creates other dysfunctionalincentives, which are described in section C. The lesson of this and the following chapter isdescribed in section D, “Beware of unit costs.” All cost systems generate product costs(average unit costs) that are inaccurate to some extent and inappropriate for some decisionsbecause all cost systems rely on historical costs, not opportunity costs. The degree of inac-curacy varies across products and decisions. The concept of unit cost implies a relationbetween the unit cost figure and volume. When a unit cost figure is reported—say, $5.12—the first reaction is that it will cost $5.12 to produce one more unit. But in many (if notmost) cases, unit costs are mixtures of variable and fixed costs and thus do not represent theincremental cost of producing one more unit.
Chapters 10 and 11 illustrate that all cost systems produce misleading information forsome decisions and that average unit costs are misleading because costs per unit implies thatthese are the variable (or marginal) costs of production. A unit cost figure unlikely measuresboth the opportunity cost of producing one more unit (marginal cost) and the opportunitycost of doubling output. Producing one more unit unlikely requires additional capacity, whiledoubling output most likely requires adding more (costly) capacity. Reported unit costs canbe long-run average costs, short-run marginal costs, or neither. Without detailed knowledgeof the production process and accounting system, it is easy to misinterpret unit cost data.
Criticisms of Absorption Cost Systems: Incentive to Overproduce 469
1 B Goetz, Management Planning and Control: A Managerial Approach to Industrial Accounting (New York:McGraw-Hill, 1949), p. 143.
zim36725_ch10_468-500.qxd 12/11/09 9:43 AM Page 469

A. Incentive to OverproduceAbsorption cost systems include both job order and process cost systems. These systemsare designed to absorb all manufacturing costs into product costs. All costs incurred by thefactory are absorbed by products. Some complaints about these systems arise from theirfull absorption character. In particular, it is claimed that absorption cost systems createincentives to overproduce.
To illustrate the incentive to overproduce, consider a department with $10,000 of fixedcosts and constant variable costs of $5 per unit. Assume that (1) the department produces asingle homogeneous product and (2) actual overhead incurred equals overhead absorbedand actual production is the same as budgeted production. The first assumption allows vol-ume to be measured in units produced. The second assumption ensures that there is noover/underabsorbed overhead. These assumptions greatly simplify the arithmetic of theexample without altering any of the basic conclusions.
The firm sells 2,000 units at $12 per unit but can produce 2,000, 2,200, or 2,400 units.There is no beginning inventory. Table 10–1 shows how reported profits vary with differ-ent production levels.
Sales revenue is constant at $24,000, but production varies from 2,000 units to 2,400units. Variable costs for the 2,000 units sold remain constant at $10,000. Fixed costs areallocated to units sold using overhead absorption:
Fixed costs absorbed to units sold � � Units sold
Notice that the overhead rate is lower when more units are produced. Also, while sales,variable costs per unit, and fixed costs remain constant, profits increase as production (notsales) increases.2 Why? The fixed costs charged off to income for the 2,000 units solddecline from $10,000 to $8,333 at 2,400 units. When more units are produced than sold,some of the fixed costs are inventoried. When the number of units in inventory is increased,the fraction of fixed costs in inventory increases. With more fixed costs in inventory, fewerfixed costs are transferred to the income statement. Absorption costing systems spreadall the costs (including fixed costs) against all the units worked on. When production is
Fixed costs
Units produced
1. Example
470 Chapter 10
2 This example allocates fixed costs to products using actual production instead of expected or normalproduction. Since we are assuming actual and budgeted fixed costs are equal (as are units produced andbudgeted units), using actual data gives the same allocations as using budgeted data.
TABLE 10–1 Reported Profits Increase with Production
Production (Units)
2,000 2,200 2,400
Sales revenue (2,000 @ $12) $24,000 $24,000 $24,000Variable costs (2,000 @ $5) (10,000) (10,000) (10,000)Fixed costs ($10,000�2,000) � 2,000 (10,000)
($10,000�2,200) � 2,000 (9,091)($10,000�2,400) � 2,000 (8,333)
Profit $ 4,000 $ 4,909 $ 5,667
zim36725_ch10_468-500.qxd 12/11/09 9:43 AM Page 470

increased (holding sales constant), average unit costs fall and reported accounting profitper unit sold increases.
Table 10–2 illustrates that as more units are produced with sales held constant, agreater fraction of the fixed costs flows into inventory. The total dollars of fixed costsremain constant; they are just shifted from the income statement to the balance sheet. Theamount added to inventory increases from zero to $3,667 at a production level of 2,400units. However, building inventories to shift fixed costs to the balance sheet is not costless.Additional cash is needed to pay the variable costs. When 2,400 units are produced, thefirm must find financing for the $2,000 variable costs in inventory.
Managers rewarded on total profits calculated using absorption costing can increasereported profits by increasing production (if sales are held constant). A major criticism ofabsorption costing is that it creates incentives for managers to overproduce, thereby build-ing inventories.
This analysis makes the critical assumption that variable cost per unit remains constantas production is increased. If marginal cost (and hence variable cost) per unit rises as pro-duction increases, then average unit costs can actually increase. An increasing marginalcost reduces the incentives of managers to overproduce with absorption costing. Theremainder of this chapter assumes that marginal (and variable) cost per unit is constant asvolume changes.
Criticisms of Absorption Cost Systems: Incentive to Overproduce 471
TABLE 10–2 Fixed and Variable Costs in Inventory
Production (Units)
2,000 2,200 2,400
Units in inventory 0 200 400Fixed costs in inventory: ($10,000�2,000) � 0 $ 0
($10,000�2,200) � 200 $ 909($10,000�2,400) � 400 $ 1,667
Fixed costs charged to profits (from Table 10–1) 10,000 9,091 8,333
Total fixed costs $10,000 $10,000 $10,000
Total inventory:Variable costs (@ $5�unit) $0 $1,000 $2,000Fixed costs (from above) 0 909 1,667
Inventory $0 $1,909 $3,667
Exercise 10–1
Velazquez Designs, a wholly owned subsidiary of Tura Products, manufactures wallpaper.
Managers are paid quarterly bonuses based on net income. Management at Velazquez expects
sales next quarter to be 10,000 rolls of wallpaper at $8 per roll. Velazquez has limited inven-
tory of wallpaper on hand and the managers want to increase the inventory. Velazquez uses a
traditional absorption costing system where product costs contain both fixed and variable
manufacturing costs. The following table shows how costs are expected to behave at various
production levels.continued
zim36725_ch10_468-500.qxd 12/11/09 9:43 AM Page 471

472 Chapter 10
Alternative Production Levels
Production (rolls of wallpaper) 10,000 11,000 12,000 13,000 14,000Fixed manufacturing cost $40,000 $40,000 $40,000 $40,000 $40,000Variable manufacturing cost $30,000 $35,900 $41,600 $48,270 $55,900
Required:
Based on the data, what level of production do you expect management to choose?
Solution:
The following table shows that operating income is maximized at a production level of 13,000
rolls:
Alternative Production Levels
Sales 10,000 10,000 10,000 10,000 10,000Production 10,000 11,000 12,000 13,000 14,000
Revenue $80,000 $80,000 $80,000 $80,000 $80,000Cost of goods sold $70,000 $69,000 $68,000 $67,900 $68,500
Operating margin $10,000 $11,000 $12,000 $12,100 $11,500
Fixed cost $40,000 $40,000 $40,000 $40,000 $40,000Total variable cost $30,000 $35,900 $41,600 $48,270 $55,900Total cost $70,000 $75,900 $81,600 $88,270 $95,900Average variable cost $3.00 $3.26 $3.47 $3.71 $3.99Average fixed cost $4.00 $3.64 $3.33 $3.08 $2.86Average total cost $7.00 $6.90 $6.80 $6.79 $6.85
This exercise illustrates that even though average fixed costs continue to fall as produc-
tion increases, average variable cost starts to increase faster than average fixed cost falls
beyond 13,000 rolls.
There are several ways to mitigate the incentive to overproduce. The first is to chargeinventory holding costs against profits. That is, inventory values are increased by the costof capital plus warehousing costs. Managers oppose this policy because inventory holdingcosts then have to be backed out of profits for external reporting, which increases account-ing and data processing complexity and causes division profits (with the inventory holdingcosts) to be lower than firm profits (without the holding costs). If a manager is evaluatedbased on residual income instead of net income, the effect is to charge managers an inven-tory holding cost. Remember from Chapter 5 that residual income is net income less thefirm’s cost of capital times the amount of investment during the year, including inventories.If the manager overproduces, inventories increase and residual income falls.
For example, consider the example in Tables 10–1 and 10–2. Suppose the manager isevaluated and rewarded based on residual income. Furthermore, assume that the only assetis inventory and the firm’s cost of capital is 20 percent. Table 10–3 illustrates how residualincome varies with production.
2. Reducing theOverproductionIncentive
zim36725_ch10_468-500.qxd 12/11/09 9:43 AM Page 472

Criticisms of Absorption Cost Systems: Incentive to Overproduce 473
We see from Table 10–3 that at a cost of capital of 20 percent, residual income does noteliminate the incentive to overproduce. It does, however, make it less profitable to the man-ager. For example, by producing 2,400 units, the manager raises profits from $4,000 to$5,667. Residual income cuts the gain from overproducing from $1,667 (or $5,667 �$4,000) to $934 (or $4,934 � $4,000).
A second method of reducing the overproduction incentive is a strict senior managementpolicy against building inventories. Compensation plans can contain a clause that bonusestied to net income will not be paid if inventories exceed a certain amount. However, such strictconstraints are cumbersome and generate influence costs. Circumstances can arise underwhich firm value is maximized by increasing inventories (e.g., new product introductions, un-expected market shocks to supply or demand, or growing sales). Therefore, it is difficult toknow at the beginning of the year what upper bound to place on inventory levels.
Third, in a single-plant, publicly traded firm, compensation can be based on stockprices instead of on accounting earnings, which removes the incentive for managers tooverproduce. For example, awarding the plant manager stock or stock options forces themanager to bear the consequences of decisions that do not maximize firm value. However,this method imposes additional risk on managers for general marketwide events. In pub-licly traded firms with many plants, any plant manager’s overproduction has a small effecton the value of the firm. Hence, free-rider problems in multiplant firms decrease the abil-ity of stock-based compensation to eliminate the overproduction incentive.
A fourth possibility is to use just-in-time (JIT) production systems to reduce inventorylevels. (Chapter 14 describes JIT in greater detail.) In a JIT system, manufacturing doesnot typically begin until the part or final product is ordered by a customer. Intermediateproducts flow immediately from one stage of production to another with little work-in-process inventories. If the production schedule is determined by demand, then the plantmanager or product-line manager does not have the discretion to set production levels inexcess of demand. In essence, a JIT system removes from managers the decision rights toset production levels. These decision rights are replaced by demand-driven market orders.JIT systems can reduce inventories and thus the incentive to overproduce in order toincrease reported profits. A final option is to change the costing system. Variable costingsystems, discussed next, reduce the incentive to overproduce.
Q10–1 What is the danger in viewing unit costs as variable costs?
Q10–2 How can managers increase profit artificially when anabsorption cost system is used?
Q10–3 Name four ways to mitigate the incentives for managers to overproduce.
ConceptQuestions
TABLE 10–3 Residual Income and Overproduction
Production (Units)
2,000 2,200 2,400
Profits (from Table 10–1) $4,000 $4,909 $5,667Inventory (from Table 10–2) 0 1,909 3,667Cost of inventories (@ 20%) 0 382 733Residual income 4,000 4,527 4,934
zim36725_ch10_468-500.qxd 12/11/09 9:43 AM Page 473

B. Variable (Direct) CostingVariable costing (sometimes called direct costing) is claimed to eliminate the incentive tobuild inventories, although, as we will see later, it is not entirely successful.
Under variable costing, all fixed costs are written off against income in the year they areincurred. Fixed manufacturing costs are not absorbed into product costs and do not flowthrough the inventory accounts. Product costs contain only the variable components. Fixedmanufacturing costs are treated as period costs and are written off. Thus, the only differ-ence between absorption costing and variable costing is in the treatment of fixed manufac-turing costs: Fixed manufacturing costs are included as part of product costs underabsorption costing and written off as period expenses (and not included in product costs)under variable costing. The purported advantages of variable costing are that it eliminatesdistortions to income and product costs when volume changes, and it reduces the dysfunc-tional incentives to overproduce.
Variable costing attracted much attention in the 1950s and 1960s. A few companiesstill use it. We discuss it here because it helps us to better understand absorption costingsystems. Also, variable cost transfer pricing is similar to variable costing. The transfer priceconsists of only the variable costs. The same weaknesses of variable costing also apply tovariable cost transfer pricing (see Chapter 5).
As an example of variable costing versus absorption costing, consider the data in Table 10–4.The same assumptions made earlier continue to apply: A single homogeneous product is pro-duced, budgeted volume equals actual volume, and variable cost per unit does not increase asproduction is expanded. In Table 10–4, the company sells 10,000 units each year and pro-duces 10,000 units in year 1 and 11,000 units in year 2. Actual overhead costs in both yearsare the same as predicted by the flexible budget ($70,000 in year 1 and $73,000 in year 2).
Table 10–5 provides the absorption costing and variable costing income statementsfor the two years. In part A, net income under absorption costing rises in year 2 eventhough sales are flat, because some of the fixed costs are inventoried.
In part B, all of the fixed overhead of $40,000 is written off each year and net incomeis the same across the two years. All overhead costs are written off to the income statementunder variable costing. Inventoried units are charged for variable overhead costs underboth absorption and variable costing. Only the fixed overhead is treated differently. Undervariable costing, in year 2 only variable overhead of $30,000 is written off to income. Theremaining $3,000 of variable overhead (1,000 units � $3 of variable overhead) remains in
2. Illustration ofVariable Costing
1. Background
474 Chapter 10
TABLE 10–4 Data for Direct Costing and Absorption Costing Example*
Price $11/unit soldDirect materials and labor (all variable) $2/unit producedFlexible overhead budget $40,000 � $3/unit produced
Sales Production Overhead
Year 1: 10,000 units 10,000 units $70,000Year 2: 10,000 units 11,000 units $73,000
*To simplify all examples, assume there are no beginning inventories.
zim36725_ch10_468-500.qxd 12/11/09 9:43 AM Page 474

Criticisms of Absorption Cost Systems: Incentive to Overproduce 475
inventory along with the other $2 of direct cost per unit. Two points should be noted fromthis example:
1. When production and sales are equal, absorption costing and variable costing giveidentical profit amounts (assuming no beginning inventories). When productionand sales are equal, both costing methods write off all fixed costs to income.
2. Absorption cost net income is higher in year 2 than in year 1 because some of thefixed costs in year 2 end up in inventory. In contrast, variable cost net income isconstant over the two years.
HistoricalApplication:A Nineteenth-CenturyExample ofVariableCosting
Two very influential nineteenth-century English accountants, Garcke and Fells, recog-nized the problems of letting fixed costs enter unit costs. Garcke was a managing direc-tor of British Electric Traction Co., and Fells was the general manager of Salt UnionLimited. They argued that fixed overhead charges should be written off to net income:
[Fixed overheads] do not vary proportionately with the volume of business. . . . [They] are,in the aggregate, more or less constant, while the manufacturing costs fluctuate with the costsof labor and the price of materials. To distribute the charges over the articles manufacturedwould, therefore, have the effect of disproportionately reducing the cost of production withevery increase, and the reverse with every diminution of business. Such a result is to bedeprecated.
SOURCE: E Garcke and J Fells, Factory Accounts, 4th ed. (London: Crosby, Lockwood, and Son, 1893), p. 73. Quoted byP Garner, Evolution of Cost Accounting to 1925 (Montgomery: University of Alabama Press, 1954), p. 124.
TABLE 10–5 Absorption Costing and Variable Costing Income Statements for Years 1 and 2
Year 1 Year 2
A.Absorption Costing Net IncomeSales $110,000 $110,000Direct materials and labor (20,000) (20,000)Overhead absorbed:
� 10,000 (70,000) (90,000)
� 10,000 (66,364) (86,364)
Net income $ 20,000 $ 23,636
B. Variable Costing Net IncomeSales $110,000 $110,000Direct materials and labor (20,000) (20,000)Variable overhead (30,000) (30,000)Fixed overhead (40,000) (90,000) (40,000) (90,000)
Net income $ 20,000 $ 20,000
$73,000
11,000
$70,000
10,000
zim36725_ch10_468-500.qxd 12/11/09 9:43 AM Page 475

476 Chapter 10
Exercise 10–2
Matson manufactures a metal dog cage that has variable cost of $50 per cage. Budgeted
and actual fixed manufacturing overhead are $900,000. Cages sell for $60 per cage.
Required:
Calculate variable cost net income and absorption cost net income under each of the following
independent cases:
a. Sales and production are 100,000 cages.
b. Sales are 90,000 cages and production is 100,000 cages.
c. Sales are 100,000 cages and production is 90,000 cages. The beginning inventory
consists of 20,000 units manufactured last year. Last year 100,000 units were
manufactured, 80,000 were sold, variable costs were $50 per cage, and fixed
manufacturing overhead costs were $900,000. For inventory valuation purposes, all
of this year’s production is sold and 10,000 units in the beginning inventory are sold
(LIFO is used to value inventories).
Solution:
a. Sales equal production:
Absorption VariableCosting Costing
Revenue (100,000 @ $60) $6,000,000 $6,000,000Variable cost (100,000 @ $50) 5,000,000 5,000,000Fixed manufacturing overhead 900,000 900,000
Net income $ 100,000 $ 100,000
b. Sales less than production:
Absorption VariableCosting Costing
Revenue (90,000 @ $60) $5,400,000 $5,400,000Variable cost (90,000 @ $50) 4,500,000 4,500,000Fixed manufacturing overhead 900,000
$900,000 � (90,000 � 100,000) 810,000
$ 90,000 $ 0
continued
zim36725_ch10_468-500.qxd 12/11/09 9:43 AM Page 476

In Table 10–5 note that under variable costing, profits do not vary with production volumechanges. Proponents claim that variable costing eliminates the incentives of managers toshow higher profits by overproducing. However, this claim is not entirely accurate. To illus-trate, the example is modified slightly in Table 10–6. Actual overhead incurred is no longerthe same as that predicted by the flexible budget ($70,000 in year 1 and $73,000 in year 2),but rather is $17,000 higher in both years ($87,000 in year 1 and $90,000 in year 2).
The issue becomes whether this $17,000 of additional overhead is a variable cost or afixed cost. At the beginning of the year, the flexible budget is a useful tool to forecast totaloverhead as a function of volume. But at the end of the year, any deviation between actualspending and the flexible budget can be due to changes in fixed costs, changes in the vari-able cost per unit of volume, or both. In the absence of specific knowledge regardingwhether the $17,000 budget variance is a fixed cost or a variable cost, managers can usetheir discretion to manage earnings. If the $17,000 is treated as a variable cost, then evenunder variable costing, managers have an incentive to overproduce. Table 10–6 presents therevised net income numbers with the additional $17,000 of overhead.
As displayed in parts A, B, and C of Table 10–6, net income is always $3,000 whenproduction volume and sales are the same. (See year 1.) When production exceeds sales (asin year 2), absorption costing shows higher income in year 2 than in year 1 (part A). Underabsorption costing, managers can show larger profits by overproducing. In part B, the extra$17,000 is treated as an additional fixed cost under variable costing. These additional dol-lars are written off in both years and net income is the same in both years.
Under variable costing, with the $17,000 of additional overhead treated as a variablecost (part C), the variable overhead per unit is composed of two pieces. There is the original$3 of variable overhead per unit plus the $17,000 of extra overhead (assumed to be variable),which is converted to a per-unit amount by dividing by the number of units produced. Whenunit production exceeds units sold, some of the extra variable overhead is inventoried.
In the preceding example, management has discretion over classifying the additional$17,000 as either a fixed or variable cost. If each component of overhead, such as depreci-ation, utilities, property taxes, or indirect labor, is separately classified as fixed or variable,then at the end of the year management has no discretion to classify the over- or underab-sorbed overhead as either fixed or variable. For example, suppose indirect labor is classi-fied as variable overhead and at the end of the year indirect labor is underabsorbed. Thenmanagement has no discretion in classifying this underabsorbed indirect labor. It is a vari-able cost. However, some overhead components are mixed costs—they contain both fixedand variable elements. For example, utilities contain a fixed amount for turning on the
3. Over-productionIncentive underVariable Costing
Criticisms of Absorption Cost Systems: Incentive to Overproduce 477
c. Sales greater than production:
Absorption VariableCosting Costing
Revenue (100,000 @ $60) $6,000,000 $6,000,000Variable cost (100,000 @ $50) 5,000,000 5,000,000Fixed manufacturing overhead 900,000
90,000 units � ($900,000 � 90,000) 900,00010,000 units � ($900,000 � 100,000) 90,000
Net income $ 10,000 $ 100,000
zim36725_ch10_468-500.qxd 12/11/09 9:43 AM Page 477

lights and heat in the plant and a variable component for operating the machinery. At theend of the year, the total bill for utilities is a mixture of both fixed and variable costs. In thiscase, management can exercise discretion by classifying any budget variance in the totalutility bill as either a fixed or variable cost.
C. Problems with Variable CostingThe principal benefit of variable costing is it eliminates (or reduces) the incentive to overpro-duce as a way to boost reported earnings. However, the preceding example illustrates a poten-tial problem with variable costing. How does one determine which costs are fixed and whichcosts are variable at the end of the year? At the beginning of the year, the fixed and variablecomponents can be estimated. At the end of the year, however, when total overhead is
1. ClassifyingFixed Costs asVariable Costs
478 Chapter 10
TABLE 10–6 Net Income under Absorption Costing and Variable Costing with an Additional $17,000 of Overhead
Year 1 Year 2
A. Absorption CostingSales $110,000 $110,000Direct labor and materials (20,000) (20,000)Overhead absorbed:
$87,000� 10,000 (87,000) (107,000)
10,000
$90,000� 10,000 (81,818) (101,818)
11,000Net income $ 3,000 $ 8,182
B. Variable Costing, with $17,000 Treated as Additional Fixed CostSales $110,000 $110,000Direct labor and materials (20,000) (20,000)Variable overhead (30,000) (30,000)Fixed overhead
($40,000 � $17,000) (57,000) (107,000) (57,000) (107,000)
Net income $ 3,000 $ 3,000
C. Variable Costing, with $17,000 Treated as Additional Variable CostSales $110,000 $110,000Direct labor and materials (20,000) (20,000)Variable overhead:
($3 � ) � 10,000 (47,000)
($3 � ) � 10,000 (45,455)
Fixed overhead (40,000) (40,000)
(107,000) (105,455)
Net income $ 3,000 $ 4,545
$17,00011,000
$17,00010,000
zim36725_ch10_468-500.qxd 12/11/09 9:43 AM Page 478

known and is probably different from that forecast by the flexible budget, it is difficult andtime-consuming to sort out whether the difference is due to a change in fixed costs, vari-able costs, or both. By classifying all of the excess overhead costs as variable, man-agers using variable costing can inventory some of these extra costs by overproducing.
Therefore, even under variable costing, building inventories can result in higherreported profits whenever actual overhead exceeds the flexible budget amount. The use ofvariable costing introduces another element of discretion into the accounting system.Someone must have the decision rights to determine at the end of the year how much of theactual overhead was fixed and how much was variable. This additional discretion, if exer-cised by the individuals being monitored by the accounting system, reduces the system’svalue as a control device. The managers responsible for the day-to-day operations that gen-erate the overhead usually have more information regarding what causes actual overhead toexceed budget than their superiors. These managers can often argue more persuasively thantheir superiors about the causes of the excess overhead and whether it should be classifiedas a fixed or variable cost. Determining the fixed and variable portions of overhead is oftenarbitrary and creates incentives for the people being monitored to manipulate the classifi-cation. While the incentive to overproduce is lessened under variable costing as comparedwith absorption costing, the tendency to build inventories must still be monitored.
Criticisms of Absorption Cost Systems: Incentive to Overproduce 479
Exercise 10–3
Filters Plus manufactures paper filters for swimming pools. It uses an absorption costing sys-
tem and writes off over/underabsorbed overhead to cost of goods sold. Overhead is applied to
products at the rate of $6.30 per direct labor hour (DLH). Total variable overhead is budgeted
at $72,600 and 22,000 hours were expected. The income statement is:
FILTERS PLUSIncome Statement (Absorption Costing)
Year Ending 12/31
Sales $824,500Cost of Goods Sold 571,400
Gross Margin $253,100Selling and Administrative Costs
Variable $172,900Fixed 67,600 240,500
Net Income $ 12,600
Filters Plus had no beginning inventories of filters. The ending inventory as of 12/31 con-
sists of 1,400 filters, each of which required 2 direct labor hours to manufacture.
Required:
What would Filter Plus’s net income be under variable costing? (Show calculations and explain
the logic of your methodology.)
continued
zim36725_ch10_468-500.qxd 12/11/09 9:43 AM Page 479

480 Chapter 10
Solution:
The first step is to calculate the budgeted fixed overhead per direct labor hour (DLH):
Overhead rate � $6.30 � Budgeted fixed overhead�DLH �
Budgeted fixed overhead � $3.00�DLH
Since there are 1,400 filters in inventory and each has 2 DLH, then the total fixed over-
head in inventory is $8,400 (1,400 � 2 DLH � $3/DLH).
Net income under variable costing is lower by the $8,400 of fixed costs included in
inventory under absorption costing, or:
Net income (absorption costing) $12,600Less: fixed cost in inventory (8,400)
Net income variable costing $ 4,200
$72,600
22,000
Another problem with variable costing is that it produces misleading unit cost figures. Theopportunity cost of manufacturing a given product includes the direct costs and theforgone opportunities of using the plant and equipment in other ways. Inside the firm,market prices do not exist to guide the allocation of scarce resources. Management mustdevise alternative accounting and administrative systems to allocate scarce resources. (SeeChapter 4.) Unit cost data are a substitute inside the firm for the lack of market prices. Ifvariable costing is used, unit cost figures do not contain any amount for the opportunitycost of the production capacity. Full absorption costs, while not an exact measure ofopportunity costs, can be a better measure than variable costs especially when the firm iscapacity-constrained. If fixed costs are ignored, managers have incentives to overconsumethe fixed capacity resources.
On the other hand, if the firm has excess capacity, including fixed charges in unitcosts overstates opportunity cost and discourages use of the excess capacity. In extremecases, a death spiral can be induced (Chapter 8). To the extent that the economy is grow-ing and surviving firms in general are growing, firms face capacity constraints. Then,average firms will want to include fixed costs in product costs to proxy for the oppor-tunity cost of capacity. Is variable costing better than absorption costing? EconomicDarwinism (the marmot-and-bear parable) suggests that commonly used proceduressuch as absorption costing probably yield benefits in excess of their costs. Sincevariable costing is not widely used, its benefits are probably less than its costs. Also,variable costing is rarely used for external reporting. Generally accepted accountingprinciples, financial accounting standards, and the U.S. Internal Revenue Servicerequire the allocation of fixed costs to products. If variable costing is used for internalreports and absorption costing is used for external reports, internal and external report-ing systems will produce different numbers. As discussed in Chapter 1, reconciling the
2. IgnoresOpportunity Costof Capacity
zim36725_ch10_468-500.qxd 12/11/09 9:43 AM Page 480
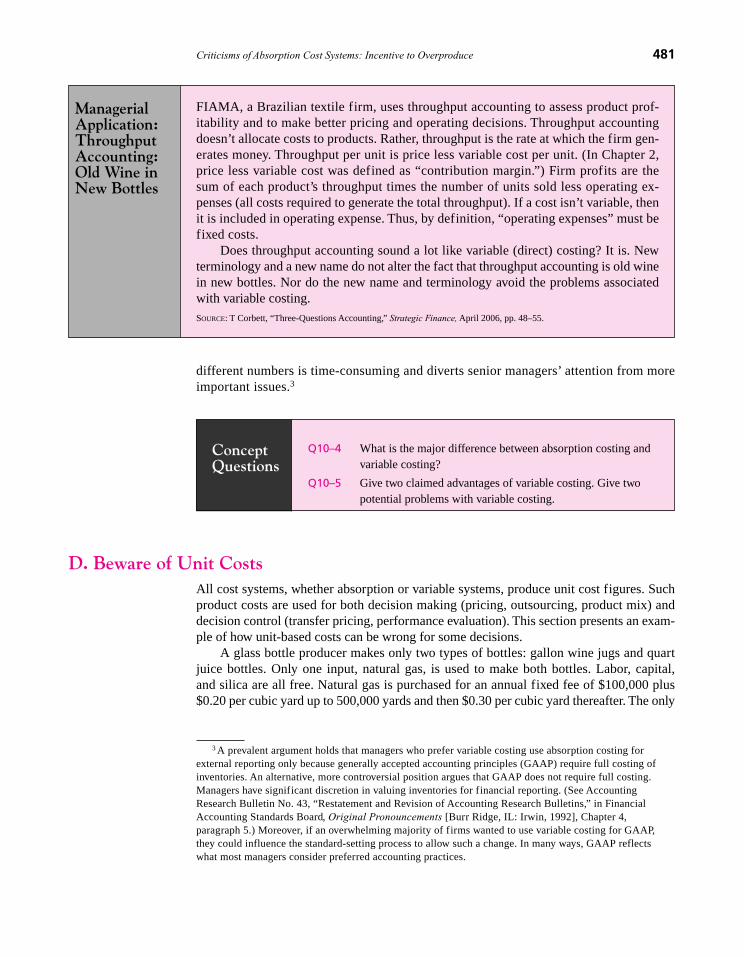
different numbers is time-consuming and diverts senior managers’ attention from moreimportant issues.3
Q10–4 What is the major difference between absorption costing andvariable costing?
Q10–5 Give two claimed advantages of variable costing. Give twopotential problems with variable costing.
D. Beware of Unit CostsAll cost systems, whether absorption or variable systems, produce unit cost figures. Suchproduct costs are used for both decision making (pricing, outsourcing, product mix) anddecision control (transfer pricing, performance evaluation). This section presents an exam-ple of how unit-based costs can be wrong for some decisions.
A glass bottle producer makes only two types of bottles: gallon wine jugs and quartjuice bottles. Only one input, natural gas, is used to make both bottles. Labor, capital,and silica are all free. Natural gas is purchased for an annual fixed fee of $100,000 plus$0.20 per cubic yard up to 500,000 yards and then $0.30 per cubic yard thereafter. The only
ConceptQuestions
Criticisms of Absorption Cost Systems: Incentive to Overproduce 481
ManagerialApplication:ThroughputAccounting:Old Wine inNew Bottles
FIAMA, a Brazilian textile firm, uses throughput accounting to assess product prof-itability and to make better pricing and operating decisions. Throughput accountingdoesn’t allocate costs to products. Rather, throughput is the rate at which the firm gen-erates money. Throughput per unit is price less variable cost per unit. (In Chapter 2,price less variable cost was defined as “contribution margin.”) Firm profits are thesum of each product’s throughput times the number of units sold less operating ex-penses (all costs required to generate the total throughput). If a cost isn’t variable, thenit is included in operating expense. Thus, by definition, “operating expenses” must befixed costs.
Does throughput accounting sound a lot like variable (direct) costing? It is. Newterminology and a new name do not alter the fact that throughput accounting is old winein new bottles. Nor do the new name and terminology avoid the problems associatedwith variable costing.
SOURCE: T Corbett, “Three-Questions Accounting,” Strategic Finance, April 2006, pp. 48–55.
3 A prevalent argument holds that managers who prefer variable costing use absorption costing forexternal reporting only because generally accepted accounting principles (GAAP) require full costing ofinventories. An alternative, more controversial position argues that GAAP does not require full costing.Managers have significant discretion in valuing inventories for financial reporting. (See AccountingResearch Bulletin No. 43, “Restatement and Revision of Accounting Research Bulletins,” in FinancialAccounting Standards Board, Original Pronouncements [Burr Ridge, IL: Irwin, 1992], Chapter 4, paragraph 5.) Moreover, if an overwhelming majority of firms wanted to use variable costing for GAAP,they could influence the standard-setting process to allow such a change. In many ways, GAAP reflectswhat most managers consider preferred accounting practices.
zim36725_ch10_468-500.qxd 12/11/09 9:43 AM Page 481

fixed cost is the $100,000 annual fee to purchase gas for $0.20 per cubic yard up to 500,000cubic yards. The following summarizes how much natural gas is needed to produce the twobottles:
Natural Gas
100 gallon jugs 9 cubic yards100 quart bottles 3 cubic yards
Current production consists of 3 million gallon jugs and 7 million quart bottles.Table 10–7 summarizes production, gas used, and the variable and fixed costs. To
arrive at a full absorption cost per bottle, the fixed gas cost is allocated based on gas used.Gallon jugs use 270,000 � 480,000 or 56.25 percent of the gas, and quart bottles use theremaining 43.75 percent. Allocating the fixed cost of gas in these proportions yields$56,250 assigned to gallon jugs and $43,750 assigned to quart bottles. Table 10–8 summa-rizes the full cost and variable cost of the two bottles.
The full cost per bottle is about twice the variable cost. Both the full and variable costfigures lead to inappropriate conclusions for some decisions. For example, suppose a cus-tomer asks to purchase 1 million additional gallon jugs at $0.022. The variable cost of$0.018 is less than the price. It appears we should accept the offer. However, since we arecurrently using 480,000 cubic yards of gas, the additional production pushes gas purchasesabove the 500,000-cubic-yard limit and we have to purchase additional gas at $0.30 percubic yard instead of $0.20 per cubic yard.
482 Chapter 10
TABLE 10–7 Bottle Production and Gas Utilization
Gallon Jugs Quart Bottles Total
Current production (in bottles) 3,000,000 7,000,000Current production (in 100 units) 30,000 70,000Gas per 100 units 9 3
Gas used (cubic yards) 270,000 210,000 480,000Gas cost:
Fixed cost $100,000Variable cost (@ $0.20/cubic yard) $54,000 $42,000 $ 96,000
TABLE 10–8 Full Cost and Variable Cost per Bottle
Gallon Jugs Quart Bottles
Variable cost $ 54,000 $ 42,000Allocated fixed cost 56,250 43,750
Total cost $ 110,250 $ 85,750� Bottles produced 3,000,000 7,000,000
Full cost/bottle $ 0.03675 $ 0.01225
Variable cost/bottle $ 0.01800 $ 0.00600
zim36725_ch10_468-500.qxd 12/11/09 9:43 AM Page 482

Criticisms of Absorption Cost Systems: Incentive to Overproduce 483
The additional gallon jugs require 90,000 cubic yards of gas (1,000,000 jugs � 100bottle lots � 9 cubic yards per 100-bottle lot). The cost of this gas is
Cost of first 20,000 cubic yards @ $0.20 $ 4,000Cost of last 70,000 cubic yards @ $0.30 21,000
Incremental cost $25,000Number of gallon jugs � 1,000,000
Incremental cost per jug $0.0250
Notice that neither the variable cost nor the full cost figures accurately estimate the oppor-tunity cost of the additional 1 million gallon jugs. The reason is that neither the full cost northe variable cost estimates include the higher gas cost per cubic yard when more than500,000 cubic yards are required. Both full and variable costing rely on historical costs. Ifthe firm expands or contracts into areas of its cost curve where it has not been before, thereis no historical information regarding the level of costs in these unexplored regions.
By now, you should have acquired a healthy skepticism of accounting costs, particu-larly unit costs. One writer summarized absorption costing 50 years ago as follows:
(Accounting) product costs are never actual costs, but leveled, smoothed, or “normal” costs. Itshould be clear, then, that product costs are the result of specific tracing of some cost items(direct costs) plus the assignment of indirect (variable and fixed) costs by the use of average-expected or “normal” indirect cost rates. The unit costs thus computed are technically compiledaverage costs; they are “normal” costs—never actual costs.4
Not only are unit costs not actual costs; they are not marginal costs. Although stated interms of dollars per unit, unit costs do not tell us the cost of producing one more unit.
E. SummaryThis chapter discusses one of the criticisms of traditional absorption costing systems: Absorption costsystems create incentives to overproduce. By producing more units than the firm can sell, some of thefixed costs are absorbed to units in inventory. These fixed costs in inventory are not in the cost ofproducts sold. As long as variable costs per unit do not rise faster than average fixed costs fall as moreunits are produced, then the average full unit cost falls and the profits on these units rise. This createsthe incentive to overproduce.
A firm can reduce (but not eliminate) the incentive to overproduce by adopting variable (direct)costing systems. Variable costing writes off all fixed manufacturing costs as a period cost. As a result,profits cannot be increased by overproducing and thereby spreading these fixed costs over more units.
While variable costing systems reduce the incentives to overproduce, these systems are not gen-erally observed in practice, which suggests that their total costs exceed their total benefits. There arealternative mechanisms for controlling managers’ incentives to overproduce, such as flat prohibitionson increasing inventory levels, charging managers for inventory holding costs, and just-in-time pro-duction scheduling. Moreover, writing off all fixed costs gives managers an additional degree of dis-cretion over their performance evaluation system. They often have discretion over classifyingexpenditures as fixed or variable. Also, if fixed costs are written off, product costs are distorted to theextent that they do not reflect the opportunity cost of the plant’s capacity.
Criticisms of Absorption Cost Systems: Incentive to Overproduce 483
4 W Vatter, Managerial Accounting (New York: Prentice Hall, 1950), p. 402.
zim36725_ch10_468-500.qxd 12/11/09 9:43 AM Page 483

484 Chapter 10
Self-Study ProblemsSelf-Study Problem 1: Dial Cards
A plant with $1 million of fixed overhead costs makes decks of playing cards with a variable costper deck of $1.00. The plant only makes playing cards and allocates all the fixed costs to the prod-uct by the number of decks produced. The firm can sell 200,000 decks a year for $10.00 each.There is no beginning inventory. The plant manager has the opportunity to make 200,000 decks,220,000 decks, or 240,000 decks. Handling excess inventory costs $0.10/deck. Handling costs areexpensed in the year they are incurred. Which production level causes the highest reported incomefor the year?
Solution:
Production Levels
200,000 220,000 240,000
Fixed costs $1,000,000 $1,000,000 $1,000,000Variable costs ($1/unit) 200,000 220,000 240,000
Total costs $1,200,000 $1,220,000 $1,240,000
Average cost per deck $6/deck $5.5454/deck $5.1667/deckRevenues (200,000 decks)($10/deck) $2,000,000 $2,000,000 $2,000,000Cost of goods sold
(200,000 decks)($5.5454/deck) (1,200,000)(200,000 decks)($5.1667/deck) (1,109,080)(240,000 decks)($5.17/deck) (1,033,340)
Excess inventory handling costs 0(220,000 � 200,000)($.10/deck) (2,000)(240,000 � 200,000)($.10/deck) (4,000)
Net income $ 800,000 $ 888,920 $ 962,660
Self-Study Problem 2: Kiddo Inc. (A)
Kiddo Incorporated manufactures running shoes. Recently, it added a new line of pump sneakers.Over the past two years, sales of both the Runner and the Pump have been flat at 5,000,000 and2,400,000 pairs, respectively. However, in anticipation of increased sales, production was increasedfrom 5,140,000 to 5,200,000 for the Runner and from 3,000,000 to 3,564,000 for the Pump from year1 to year 2.
Production costs for the two sneakers are very different. Materials cost $14.00 per Runner and$17.75 per Pump. Labor costs are $4.60 and $5.00 and variable overhead costs are $6.60 and $7.30for the Runner and the Pump, respectively. Fixed overhead costs are $50 million and are allocatedbased on direct labor cost. Kiddo uses LIFO. Round ratios to two decimal digits.
Required:
a. Based on revenues of $32 per Runner and $46 per Pump, prepare an income statement for each year.
b. Explain the change in net profit from year 1 to year 2. Be sure to explain any differencesbetween the Runner and the Pump.
zim36725_ch10_468-500.qxd 12/16/09 9:53 AM Page 484

Solution:
a. Income statements for years 1 and 2:
Runner Pump Total
Year 1Revenue $160,000,000 $110,400,000 $270,400,000Expenses:
Material 70,000,000 42,600,000 112,600,000Labor 23,000,000 12,000,000 35,000,000Variable overhead 33,000,000 17,520,000 50,520,000Fixed overhead* 29,650,000 15,480,000 45,130,000
Net income $ 4,350,000 $ 22,800,000 $ 27,150,000
Year 2Revenue $160,000,000 $110,400,000 $270,400,000Expenses:
Material 70,000,000 42,600,000 112,600,000Labor 23,000,000 12,000,000 35,000,000Variable overhead 33,000,000 17,520,000 50,520,000Fixed overhead† 27,550,000 14,376,000 41,926,000
Net income $ 6,450,000 $ 23,904,000 $ 30,354,000
*Year 1
Runner Pump Total
Direct labor per pair $ 4.60 $ 5.00� Units produced 5,140,000 3,000,000
Direct labor cost $23,644,000 $15,000,000 $38,644,000
Fixed overhead rate per direct labor dollar
($50,000,000�$38,644,000) $1.29
Direct labor per pair $ 4.60 $ 5.00
� Fixed overhead rate 1.29 1.29
Fixed overhead per pair $ 5.93 $ 6.45
� Number of pairs sold 5,000,000 2,400,000
Allocated fixed overhead $29,650,000 $15,480,000 $45,130,000
†Year 2
Direct labor per pair $ 4.60 $ 5.00
� Units produced 5,200,000 3,564,000
Direct labor cost $23,920,000 $17,820,000 $41,740,000
Fixed overhead rate per direct labor dollar
($50,000,000/$41,740,000) $1.20
Direct labor per pair $ 4.60 $ 5.00
� Fixed overhead rate 1.20 1.20
Fixed overhead per pair $ 5.51 $ 5.99
� Number of pairs sold 5,000,000 2,400,000
Allocated fixed overhead $27,550,000 $14,376,000 $41,926,000
b. Net income increased from year 1 to year 2 even though sales were constant. This changeresults from increased production. The fixed costs are allocated based on direct labor cost.
Criticisms of Absorption Cost Systems: Incentive to Overproduce 485
zim36725_ch10_468-500.qxd 12/11/09 9:43 AM Page 485

Increasing production decreases the fixed cost per pair of sneakers, thereby increasingprofits per pair sold. In year 1, 90.26 percent of the $50 million of fixed overhead wasincluded in profits. This fell to 83.85 percent, causing year 2 profits to increase.
ProblemsP 10–1: Federal Mixing
Federal Mixing (FM) is a division of Federal Chemicals, a large diversified chemical company. FMprovides mixing services for both outside customers and other Federal divisions. FM buys or receivesliquid chemicals and combines and packages them according to the customer’s specifications. FMcomputes its divisional net income on both a fully absorbed and variable costing basis. For the yearjust ending, it reported
Net Income
Absorption costing $13,800,000Variable costing 12,600,000
Difference $ 1,200,000
Overhead is assigned to products using machine hours.There is no finished goods inventory at FM, only work-in-process (WIP) inventory. As soon as
a product is completed, it is shipped to the customer. The beginning inventory was valued at $6.3 mil-lion and contained 70,000 machine hours. The ending WIP inventory was valued at $9.9 million andcontained 90,000 machine hours.
Required:
Write a short nontechnical note to senior management explaining why variable costing and absorp-tion costing net income amounts differ.
P 10–2: Xerox
An October 25, 1999, article in BusinessWeek by D. Brady, “Why Xerox Is Struggling,” reported:
President and Chief Executive G. Richard Thoman is a big-picture guy. For the past two years,he has preached a digital revolution at the copier giant. Get down to the detail, though, and it’sclear that the revolution isn’t going as planned: In both copiers and printers, Xerox is losingground. On October 18, the company announced lower than expected earnings and the stockprice tumbled more than 13% on that day. Xerox stock is down 60% from its recent high of $60in July. Xerox blamed the bad news on short-term surprises: sagging productivity in the salesforce after a big reorganization as well as weakness in Brazil. But the sheer scope of bad newsshocked even Thoman, who told investors in a conference call that he was “disappointed and sadabout this quarter.”
Thoman took the top job in April and vowed annual earnings growth in the “mid-to-highteens.”
Beginning November 1, 1999, Xerox factories increased their hours from five eight-hour days aweek to six ten-hour days a week through the end of the year. The factory managers were told to buildinventories in expectation of higher sales in the fourth quarter of 1999. Fourth-quarter sales wereexpected to be higher because of anticipation that the new sales force reorganization would increasesales.
486 Chapter 10
zim36725_ch10_468-500.qxd 12/11/09 9:43 AM Page 486

Required:
Offer an alternative reason(s) for Xerox’s decision to increase output in its factories.
P 10–3: Varilux
Varilux manufactures a single product and sells it for $10 per unit. At the beginning of the year, therewere 1,000 units in inventory. Upon further investigation, you discover that units produced last yearhad $3 of fixed manufacturing costs and $2 of variable manufacturing costs. During the year, Variluxproduced 10,000 units of product. Each unit produced generated $3 of variable manufacturing cost.Total fixed manufacturing cost for the current year was $40,000. Selling and administrative costs con-sisted of $12,000 of variable costs and $18,000 of fixed costs. There were no inventories at the end ofthe year.
Required:
Prepare two income statements for the current year: one on a variable cost basis and the other onan absorption cost basis. Explain any difference between the two net income numbers and providecalculations supporting your explanation of the difference.
P 10–4: Truini Paints
Using the data from Table 10–6, recast the analysis with one change of assumption: Instead ofassuming that an additional $17,000 of overhead was incurred in both years, assume that overheadwas lower each year by $10,000. How do incentives change regarding the treatment of the $10,000savings?
P 10–5: Zipp Cards
Zipp Cards buys baseball cards in bulk from the companies that produce them. Zipp buys sheets of48 cards, then cuts the sheets into individual cards, and sorts and packages them, usually by team.Zipp then sells the packages to large discount stores. The accompanying table provides informationregarding operations for 2010 and 2011.
Zipp Cards—Summary of Operations
2010 2011
Unit sales (of 48 cards)* 50,000 48,000Price $5.00 $4.90Production in units
(budgeted � actual) 50,000 75,000Variable cost $1.00 $1.00Fixed manufacturing overhead $160,000 $160,000
*One unit equals 48 cards.
Volume is measured in terms of 48-card sheets processed. Budgeted production and actual pro-duction in 2010 were both 50,000 units. There were no beginning inventories on January 1, 2010. In2011, budgeted and actual production rose to 75,000 units.
At the beginning of 2012, the president of Zipp was pleasantly surprised when the accountantshowed her the income statement for the year 2011. The president remarked, “I’m surprised we mademore money in 2011 than 2010. We had to cut prices and we didn’t sell as many units, yet we stillmade more money. Well, you’re the accountant and these numbers don’t lie.”
Required:
a. Prepare income statements for 2010 and 2011 using absorption costing.
b. Prepare a statement reconciling the change in net income from 2010 to 2011. Explain tothe president why the firm made more money in 2011 than in 2010.
Criticisms of Absorption Cost Systems: Incentive to Overproduce 487
zim36725_ch10_468-500.qxd 12/11/09 9:43 AM Page 487

P 10–6: TransPacific Bank
You are working as a loan officer at TransPacific Bank and are analyzing a loan request for a clientwhen you come across the following footnote in the client’s annual report:
Inventories are priced at the lower of cost or market of materials plus other direct (variable)costs. Fixed overheads of $4.2 million this year and $3.0 million last year are excluded from in-ventories. Omitting such overhead resulted in a reduction in net income (after taxes) of $720,000for this year. Our tax rate is 40 percent.
In preparing to present the loan application to the bank’s loan committee, write a brief paragraphin nontechnical terms describing what this footnote means and how it affects the bank’s evaluation ofthe financial condition of the borrower.
P 10–7: Zeflax Bottles
Zeflax manufactures insulated plastic bottles for bikes that the company sells for $4.00 per bottle.Last year the company produced 230,000 bottles and sold 200,000 bottles. This year Zeflax produced200,000 bottles and sold 230,000 bottles. In both years Zeflax’s fixed manufacturing cost was$500,000 and its variable manufacturing cost was $1.00 per bottle. The president of Zeflax com-mented, “I don’t understand these crazy financial statements. Our prices and costs didn’t change, wesell more bottles this year, and we show lower income. Something has got to be wrong.”
Required:
a. Prepare income statements for Zeflax for last year and this year using absorption costing.Assume that Zeflax’s only costs are the fixed and variable manufacturing costs given in theproblem.
b. Prepare income statements for Zeflax for last year and this year using variable costing.Assume that Zeflax’s only costs are the fixed and variable manufacturing costs given in theproblem.
c. Explain to the president of Zeflax in nontechnical terms why the financial statementsprepared by the accountant in part (a) are not in error. In other words, explain to thepresident why net income fell this year from last year even though Zeflax sold morebottles.
P 10–8: Alliance Tooling
Alliance Tooling produces a single product in its plant. At the beginning of the year, there were nounits in inventory. During the year, Alliance produced 120,000 units and sold 100,000 units at $26.75per unit. Variable manufacturing costs are $13.50 per unit. Alliance pays $2.70 per unit for salescommissions and shipping. It has fixed costs of $720,000 for selling and administration. Its tax rateis 40 percent.
Required:
a. Prepare an income statement for Alliance Tooling using absorption costing.
b. Prepare an income statement for Alliance Tooling using variable costing.
c. Explain why the net income figures computed in (a) and (b) differ.
P 10–9: Aspen View
Aspen View produces a full line of sunglasses. This year it began producing a new model of sun-glasses, the Peak 32. It produced 5,300 pairs and sold 4,900 pairs. The following table summarizes
488 Chapter 10
zim36725_ch10_468-500.qxd 12/11/09 9:43 AM Page 488

the fixed and variable costs of producing Peak 32 sunglasses. Aspen View uses variable costing tovalue its ending inventory.
Fixed Variable Total Cost Cost Cost
Direct labor $ 3.50 $ 3.50Direct material 7.50 7.50Manufacturing overhead $3.20 4.50 7.70Advertising 1.20 1.70 2.90Distribution .70 .25 .95Selling 1.20 .90 2.10
Total cost $6.30 $18.35 $24.65
Required:
a. What is Aspen View’s ending inventory value of Peak 32 sunglasses?
b. Aspen View is considering switching from variable costing to absorption costing. Wouldthis year’s net income from Peak 32 sunglasses be higher or lower using absorptioncosting? Explain why.
c. Suppose Aspen View uses absorption costing. If, instead of producing 5,300 pairs of Peak32s it produced only 5,000, would net income from Peak 32 sunglasses be higher or lowerfrom the smaller production compared to the larger production? Explain why.
d. Aspen View has an opportunity cost of capital of 20 percent. What is the cost of producing5,300 pairs of Peak 32s instead of 4,900 pairs?
P 10–10: CLIC Lighters
CLIC manufactures two types of cigarette lighters: Basic and Super. A new plant began producingboth lighter models this year. The following variable costing statement summarizes the first year ofoperations:
CLIC LIGHTERSIncome Statement—Manufacturing
For the Year Ended December 31
Products
Basic Super Total
Number of units produced 200,000 160,000Number of units sold 180,000 110,000Selling price $ 0.50 $ 0.70Sales revenue $ 90,000 $ 77,000 $167,000Cost of goods sold 18,000 22,000 40,000
Manufacturing margin $ 72,000 $ 55,000 $127,000
Fixed overhead 103,000
Income from manufacturing $ 24,000
Criticisms of Absorption Cost Systems: Incentive to Overproduce 489
zim36725_ch10_468-500.qxd 12/11/09 9:43 AM Page 489

For internal control purposes, variable costing is used. Management also wants income frommanufacturing calculated using absorption costing. Fixed overhead is allocated to the two lightersusing actual machine minutes. Each Basic lighter requires 1.1 machine minutes and each Superlighter requires 1.2 machine minutes.
Required:
a. Calculate the fixed overhead rate per machine minute.
b. Calculate the plant’s income from manufacturing for both Basic and Super lighters and forthe entire plant using absorption costing.
c. Prepare a table that reconciles the difference in income from manufacturing reported usingvariable costing and absorption costing.
d. Explain in one or two sentences why income from manufacturing differs depending onwhether variable costing or absorption costing is used.
P 10–11: Medford Mug Company
The Medford Mug Company is an old-line maker of ceramic coffee mugs. It imprints company logosand other sayings on mugs for both commercial and wholesale markets. The firm has the capacity toproduce 50 million mugs per year, but the recession has cut production and sales in the current yearto 15 million mugs. The accompanying table shows the operating statement for 2010.
MEDFORD MUG COMPANYIncome Statement
Year Ending 2010 ($ in Millions)
Sales (15 million @ $2) $ 30.0Less costs of goods sold
Variable cost (15 million @ $0.50) (7.5)Fixed cost (20.0) (27.5)
Gross margin $ 2.5Less selling and administration (4.0)
Operating profit $ (1.5)
At the end of 2010, there was no ending inventory of finished goods.The board of directors is very concerned about the $1.5 million operating loss. It hires an out-
side consultant who reports back that the firm suffers from two problems. First, the president of thecompany receives a fixed salary, and since she owns no stock, she has very little incentive to worryabout company profits. The second problem is that the company has not aggressively marketed itsproduct and has not kept up with changing markets. The current president is 64 and the board ofdirectors makes her an offer to retire one year early so that they can hire a new president to turn thefirm around. The current president accepts the offer to retire and the board immediately hires a newpresident with a proven track record as a turnaround specialist.
The new president is hired with an employment contract that pays a fixed wage of $50,000 ayear plus 15 percent of the firm’s operating profits (if any). Operating profits are calculated usingabsorption costing. In 2011, the new president doubles the selling and administration budget to$8 million (which includes the president’s salary of $50,000). He designs a new line of “politicallycorrect” sayings to imprint on the mugs and expands inventory and the number of distributorshandling the mugs. Production is increased to 45 million mugs and sales climb to 18 million mugs at$2 each. Variable costs per mug remain at $.50 and fixed costs at $20 million in 2011.
At the end of 2011, the president meets with the board of directors and announces he has acceptedanother job. He believes he has successfully gotten Medford Mug back on track and thanks the boardfor giving him the opportunity. His new job is helping to turn around another struggling company.
490 Chapter 10
zim36725_ch10_468-500.qxd 12/11/09 9:43 AM Page 490

Required:
a. Calculate the president’s bonus for 2011.
b. Evaluate the performance of the new president in 2011. Did he do as good a job as thenumbers in (a) suggest?
P 10–12: Kothari Inc.
The telecom division of Kothari Inc. produces and sells 100,000 line modulators. Half of the modu-lators are sold externally at $150 per unit, and the other half are sold internally at variable manufac-turing costs plus 10 percent. Kothari uses variable costing to evaluate the telecom division. Thefollowing summarizes the cost structure of the telecom division.
VariableManufacturing
Costs
Materials $27.00Labor 12.00Overhead 4.00
Total manufacturing cost $43.00
Fixed manufacturing overhead $1,700,000Variable period costs (per units) $18.00Fixed period costs $1,900,000
Required:
a. Calculate the net income of the telecom division (before taxes) using variable costing.
b. Telecom can outsource the final assembly of all 100,000 modulators for $9.00 permodulator. If it does this, it can reduce variable manufacturing cost by $1.00 per unit andfixed manufacturing overhead by $700,000. If the managers of the telecom unit arecompensated based on telecom’s net income before taxes, do you expect them to outsourcethe final assembly of the modulators? Show calculations.
c. What happens to the net cash flows of Kothari Inc. if the final assembly of the modulatorsis outsourced?
P 10–13: Mystic Mugs
Sanjog and Rajiv Gupta have started a business that manufactures and sells thermal mugs. Userspersonalize the mugs by plugging them into a laptop and downloading their favorite images from adigital camera. The company makes two mug sizes: 16 and 24 ounce mugs. This is its first year ofbusiness. The following data summarize operations for the first year.
16 oz. mug 24 oz. mug Total
Selling price $9.75 $11.20Direct materials/unit $1.10 $1.45Direct labor/unit $0.60 $0.80Variable overhead/unit $0.30 $0.40Variable selling and distribution/unit $1.65 $1.75Units sold 22,500 16,400Units produced 24,000 16,400Fixed manufacturing overhead $85,000Fixed selling and distribution $148,000
Criticisms of Absorption Cost Systems: Incentive to Overproduce 491
zim36725_ch10_468-500.qxd 12/11/09 9:43 AM Page 491

There were no beginning inventories. Overhead is assigned to products using direct labor dollars.
Required:
a. Calculate Mystic Mugs’s net income before taxes using absorption costing.
b. Calculate Mystic Mugs’s net income before taxes using variable costing.
c. Prepare a table that reconciles any difference between the two net income figurescalculated in parts (a) and (b).
d. Write a short memo explaining in lay terms any difference between the two net incomefigures calculated in parts (a) and (b).
P 10–14: Avant Designs
Avant Designs designs and manufactures polished-nickel fashion bracelets. It offers two bracelets:Aztec and Mayan. The following data summarize budgeted operations for the current year:
AVANT DESIGNSSummary of Budgeted Operations
Current Year
Aztec Mayan
Sales price/unit $12 $15Variable cost/unit $4 $5Units sold 30,000 20,000Machine minutes/unit 2 3Beginning inventory 0 0Ending inventory 3,000 1,000
Budgeted fixed manufacturing overhead for the year was $258,000.
Required:
a. Prepare the budgeted income statement for the year using variable costing.
b. Prepare the budgeted income statement for the year using absorption costing. Budgetedfixed manufacturing overhead is allocated to the two bracelets using machine minutes.
c. Explain the difference in the two net income figures computed in parts (a) and (b). That is,reconcile any difference in earnings and explain why it occurs.
P 10–15: Taylor Chains
Taylor designs and manufactures high-performance bicycle chains for professional racers and seriousamateurs. Two new titanium chain sets, the Challenger and the Tour, sell for €110 and €155, respec-tively. The following data summarize the cost structure for the two chain sets:
Challenger Tour
Number of units budgeted and produced 43,000 55,000Number of units sold 40,000 52,000Direct labor hours per unit 2 3Direct labor cost per hour €22 €22Direct materials per unit €45 €61
492 Chapter 10
zim36725_ch10_468-500.qxd 12/11/09 9:43 AM Page 492
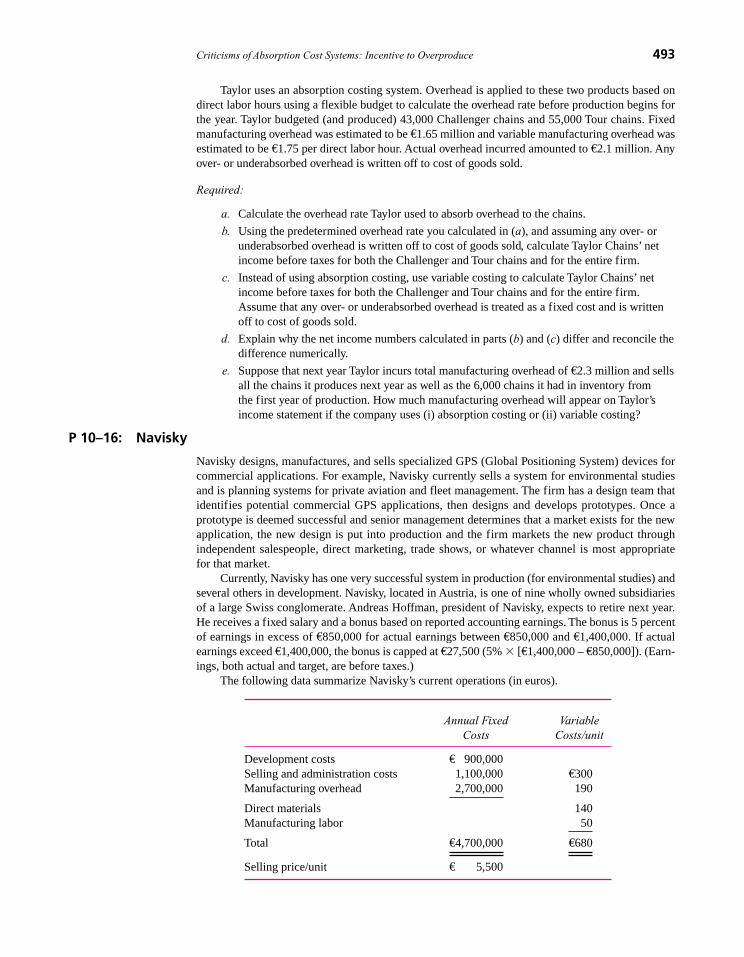
Taylor uses an absorption costing system. Overhead is applied to these two products based ondirect labor hours using a flexible budget to calculate the overhead rate before production begins forthe year. Taylor budgeted (and produced) 43,000 Challenger chains and 55,000 Tour chains. Fixedmanufacturing overhead was estimated to be €1.65 million and variable manufacturing overhead wasestimated to be €1.75 per direct labor hour. Actual overhead incurred amounted to €2.1 million. Anyover- or underabsorbed overhead is written off to cost of goods sold.
Required:
a. Calculate the overhead rate Taylor used to absorb overhead to the chains.
b. Using the predetermined overhead rate you calculated in (a), and assuming any over- orunderabsorbed overhead is written off to cost of goods sold, calculate Taylor Chains’ netincome before taxes for both the Challenger and Tour chains and for the entire firm.
c. Instead of using absorption costing, use variable costing to calculate Taylor Chains’ netincome before taxes for both the Challenger and Tour chains and for the entire firm.Assume that any over- or underabsorbed overhead is treated as a fixed cost and is writtenoff to cost of goods sold.
d. Explain why the net income numbers calculated in parts (b) and (c) differ and reconcile thedifference numerically.
e. Suppose that next year Taylor incurs total manufacturing overhead of €2.3 million and sellsall the chains it produces next year as well as the 6,000 chains it had in inventory fromthe first year of production. How much manufacturing overhead will appear on Taylor’sincome statement if the company uses (i) absorption costing or (ii) variable costing?
P 10–16: Navisky
Navisky designs, manufactures, and sells specialized GPS (Global Positioning System) devices forcommercial applications. For example, Navisky currently sells a system for environmental studiesand is planning systems for private aviation and fleet management. The firm has a design team thatidentifies potential commercial GPS applications, then designs and develops prototypes. Once aprototype is deemed successful and senior management determines that a market exists for the newapplication, the new design is put into production and the firm markets the new product throughindependent salespeople, direct marketing, trade shows, or whatever channel is most appropriatefor that market.
Currently, Navisky has one very successful system in production (for environmental studies) andseveral others in development. Navisky, located in Austria, is one of nine wholly owned subsidiariesof a large Swiss conglomerate. Andreas Hoffman, president of Navisky, expects to retire next year.He receives a fixed salary and a bonus based on reported accounting earnings. The bonus is 5 percentof earnings in excess of €850,000 for actual earnings between €850,000 and €1,400,000. If actualearnings exceed €1,400,000, the bonus is capped at €27,500 (5% � [€1,400,000 – €850,000]). (Earn-ings, both actual and target, are before taxes.)
The following data summarize Navisky’s current operations (in euros).
Annual Fixed Variable Costs Costs/unit
Development costs € 900,000Selling and administration costs 1,100,000 €300Manufacturing overhead 2,700,000 190
Direct materials 140Manufacturing labor 50
Total €4,700,000 €680
Selling price/unit € 5,500
Criticisms of Absorption Cost Systems: Incentive to Overproduce 493
zim36725_ch10_468-500.qxd 12/16/09 9:53 AM Page 493

Senior management at Navisky, including Mr. Hoffman, expects to sell about 1,200 units of theenvironmental GPS device this year. However, they have considerable discretion in setting productionlevels. Their plant has excess capacity and can produce up to 1,500 environmental devices withoutseeing any increase in the variable manufacturing costs per unit.
Navisky uses a traditional absorption costing system to absorb manufacturing overhead intoproduct costs for inventory valuation and to calculate earnings for internal compensation purposes aswell as external reporting. At the beginning of the current fiscal year, there was no beginning inven-tory of the environmental GPS devices.
Required:
a. How many units of the environmental GPS device would Mr. Hoffman like to see Naviskyproduce if he expects to sell 1,200 devices this year?
b. Suppose Mr. Hoffman’s bonus calculation was based on net income after including acharge for inventory holding costs at 20 percent of the ending inventory value. In otherwords, his bonus is 5 percent of net income in excess of €850,000 up to €1,400,000 wherenet income includes a 20 percent inventory holding cost. How many units of theenvironmental GPS device would Mr. Hoffman like to see produced if he expects to sell1,200 devices this year?
c. Explain why your answers in parts (b) and (c) differ, if they do.
d. How many units of the environmental GPS device would Mr. Hoffman like to see producedassuming he expects to sell 1,200 devices this year if Navisky’s net income is calculatedusing variable costing and net income includes a 20 percent inventory holding cost?
P 10-17: DIM
Diagnostic Imaging & Medical (DIM) has introduced a revolutionary new magnetic resonance imag-ing (MRI) device that it sells to hospital radiology departments. Their new device has a much largerchamber that reduces patients’ claustrophobic reactions compared to current machines. The follow-ing table displays how total cost per year varies with annual production. In other words, if DIM pro-duces nine machines, the nine machines have a total manufacturing cost of $2.93 million.
TotalManufacturing
Units Cost
0 $1,000,0001 1,500,0002 1,800,0003 1,950,0004 2,050,0005 2,170,0006 2,314,0007 2,486,0008 2,690,0009 2,930,000
10 3,210,00011 3,534,00012 3,906,00013 4,330,00014 4,810,00015 5,350,000
To simplify the analysis, assume DIM has no period costs, only the product costs in the above table.Management receives a bonus based on reported profits, where profits are calculated using absorp-tion costing.
494 Chapter 10
zim36725_ch10_468-500.qxd 12/11/09 9:43 AM Page 494

Required:
a. At a selling price of $500,000 per MRI, management expects to sell six units next year andplans to produce a few extra machines. The extra units are for training, marketing, andtemporary spare parts in case an installed MRI fails and spare parts are needed.Management has financing and production capacity to vary production between 6 and 10 units. How many MRIs do you expect management to produce? Show your analysis that leads to this conclusion.
b. Instead of expecting to sell six units at $500,000 each as in part (a), management expectsto sell 11 units at $400,000 per unit. With expected sales at 11 units and a price of$400,000, DIM has the resources to produce between 11 and 15 MRIs. How many MRIsdo you expect management to produce if expected sales are 11 units? Show your analysisthat leads to this conclusion.
c. Describe the differences and similarities in your answers to parts (a) and (b). Pay particularattention to the relation between units sold [6 in part (a) and 11 in part (b)] and expectedunits produced, and how this relation differs or does not differ between parts (a) and (b).Also, explain what is causing your answers in parts (a) and (b) to differ or not differ.
d. Provide some plausible explanations of why average costs may increase beyond a certainquantity of production.
P 10–18: Easton Plant
The Easton plant produces sheet metal chassis for television sets. Its customer is General ElectricAppliances. The chassis are manufactured on a computerized, numerically controlled (NC) machinethat cuts, drills, and bends the metal to form the chassis for the television set. Two different chassisare produced: HX–3 and DX–55.
Easton has a single plantwide overhead account. Actual machine minutes on the NC machine areused to distribute overhead to the two products. There were no beginning inventories of work inprocess or finished goods. The following table summarizes the planned and actual production data forthe year:
HX–3 DX–55
Planned unit production 6,500 3,400Budgeted machine minutes per unit � 6.2 � 9.8
Expected machine minutes 40,300 33,320Actual units produced 7,200 3,900Actual volume (machine minutes) 44,640 38,220
The following data summarize the flexible overhead budget:
VariableFixed (per Minute)
Depreciation $695,000Indirect labor $0.80Indirect materials 1.00Property taxes 28,000Utilities 55,000 0.90Other 42,000 0.30
Total $820,000 $3.00
Criticisms of Absorption Cost Systems: Incentive to Overproduce 495
zim36725_ch10_468-500.qxd 12/11/09 9:43 AM Page 495

At the end of the year, the following overhead amounts had been incurred:
Actual
Depreciation $ 695,000Indirect labor 71,288Indirect materials 84,860Property taxes 31,000Utilities 133,074Other 68,858
Total $1,084,080
Any over- or underabsorbed overhead is written off to cost of goods sold. The ending finished goodsinventory consists of 2,000 units of HX–3 and 1,000 units of DX–55, representing 13,400 minutesand 10,300 minutes of actual machine time, respectively.
Required: (Round all dollars, including overhead rates, to two decimal places.)
a. Calculate the overhead absorption rate set at the start of the year.
b. Calculate the over- or underabsorbed overhead for the year.
c. The firm is considering switching to variable costing. What effect would this decision haveon Easton’s reported profit for this year? To implement variable costing at the end of theyear, variable overhead is calculated as $3.00 per machine minute times the actual numberof machine minutes. Fixed overhead is the difference between total actual overhead andvariable overhead.
d. Instead of defining fixed overhead as all overhead in excess of variable overhead as in part(c), assume the following: Fixed overhead is budgeted fixed overhead ($820,000), andvariable overhead is the difference between total actual overhead and budgeted fixedoverhead. What is the difference between absorption net income and variable costingincome given these new assumptions?
P 10–19: Weststar Appliances
Weststar manufactures and distributes a complete line of home appliances worldwide. Lynn Tweedieis the U.S. Space Saver Dishwasher product manager for Weststar Appliances. Her responsibilitiesinclude pricing, planning, and sales of Weststar’s Space Saver dishwasher in the United States. It is theend of the third quarter and Tweedie is deciding how many Space Saver washers to produce in thefourth quarter. Given sales from the first three quarters and orders for the last quarter, she expects totalsales for the year to be 73,000 washers at $200 per unit. There are 12,000 washers in inventory at a(LIFO) cost of $90 per washer. The factory produced 58,000 washers in the first three quarters of thisyear and Tweedie is considering ordering an additional 10,000, 15,000, or 20,000 washers in the fourthquarter. The plant’s capacity can easily accommodate any of these volume levels without affectingfixed costs or variable cost per unit. The variable manufacturing cost of the washer is $75 and the planthas fixed annual costs of $1.3 million. Manufacturing overhead is allocated to dishwashers based onunits. Tweedie’s selling and administrative expenses consist of $15 of variable cost per washer andfixed cost of $2.92 million. The dishwasher division has a 17 percent weighted-average cost of capitaland invested capital (not including inventories) of $18 million. Weststar uses full absorption costing.
Required:
a. Prepare a table showing annual accounting earnings prepared under absorption costing for the Space Saver dishwasher for annual production levels of 68,000, 73,000, and 78,000 washers.
496 Chapter 10
zim36725_ch10_468-500.qxd 12/11/09 9:43 AM Page 496

b. If Lynn Tweedie’s bonus depends on reported accounting earnings from Space Saverdishwashers, what production quantity is she likely to select for the fourth quarter?
c. Prepare a table computing the valuation of the ending inventory (under LIFO) for annualproduction levels of 68,000, 73,000, and 78,000 washers.
d. If Lynn Tweedie’s bonus depends on residual income from Space Saver dishwashers, whatproduction quantity is she likely to select for the fourth quarter?
e. How would your answer change in part (d) if Tweedie’s bonus was based on return on assets?
P 10–20: Blauvelt Products
Blauvelt Products uses a flexible budget to set the overhead rate at the beginning of the year based onunits produced. In year 1 budgeted fixed overhead is $1 million and budgeted variable overhead is $2per unit. Direct material and direct labor together are $5 per unit. Blauvelt sells the completed prod-uct for $30. There is no beginning inventory. Budgeted volume is 80,000 units. Production and salesare 80,000 units. Actual overhead incurred in year 1 is $1,160,000. Any under- or overabsorbed over-head is written off to cost of goods sold.
In year 2, budgeted volume and production are again both 80,000 units. However, only 60,000units are sold. Budgeted fixed overhead is $1 million and budgeted variable overhead is $2 per unit.Direct material and direct labor are $5 per unit. Final selling price remains at $30 per unit. Actualoverhead incurred in year 2 is $1.35 million.
Required:
a. Calculate net income in year 1 first using absorption costing and then using variablecosting. Explain any difference between the two net income numbers.
b. Calculate net income in year 2 using absorption costing, where the overhead rate used toassign overhead to products is based on actual overhead incurred.
c. Calculate net income in year 2 using variable costing, where any difference betweenbudgeted overhead and actual overhead is treated as a fixed cost.
d. Calculate net income in year 2 using variable costing, where any difference betweenbudgeted overhead and actual overhead is treated as a variable cost.
e. Explain why your answers in parts (b), (c), and (d) differ.
P 10–21: UniCom
UniCom produces a wide range of consumer electronics. UniCom’s Newark, New York, plant pro-duces two types of cordless phones: 2.4 GHz and 6.0 GHz. The following table summarizes opera-tions at the Newark UniCom plant for the years 2009 and 2010.
2009 2010
2.4 GHz 6.0 Ghz 2.4 GHz 6.0 Ghz
Units produced 120,000 70,000 90,000 50,000Units sold 100,000 60,000 100,000 60,000Change in inventory (units) 20,000 10,000 �10,000 �10,000Variable manufacturing cost per unit:
Direct labor $7.50 $8.00 $7.50 $8.00Direct material $18.00 $24.00 $18.00 $24.00Variable overhead $2.00 $3.00 $2.00 $3.00
Selling price $45.00 $78.00 $45.00 $78.00
Criticisms of Absorption Cost Systems: Incentive to Overproduce 497
zim36725_ch10_468-500.qxd 12/16/09 9:53 AM Page 497

Fixed manufacturing overhead amounted to $4 million in each year. At the start of 2009, there wereno beginning inventories of either 2.4-GHz or 6.0-GHz cordless phones. UniCom uses FIFO to valueinventories.
Required:
a. Prepare variable costing income statements for 2009 and 2010.
b. Prepare absorption costing income statements for 2009 and 2010. At the end of the year,fixed manufacturing overhead is absorbed to the two phone models using direct material asthe allocation base.
c. Prepare a table that reconciles any differences in variable costing and absorption costingnet incomes for 2009 and 2010.
P 10–22: Sants Brakes Co.
The current year’s income statement for Sants Brakes Co. on a variable costing basis appears in theaccompanying table.
SANTS BRAKES COMPANYIncome Statement—Manufacturing
For the Year Ended December 31 ($000s)
Product Lines
G-226 G-348 G-714 Total
Number of units sold (in thousands) 650 280 120 —
Sales revenue $7,800 $2,240 $1,920 $11,960Cost of goods sold 5,200 840 480 6,520
Manufacturing margin $2,600 $1,400 $1,440 $ 5,440
Fixed overhead 3,600
Income from manufacturing $ 1,840
Inventories of finished stock were increased during the year in anticipation of increases in salesvolume in the current year. Inventories in units of product for the beginning and end of the yearfollow.
Beginning EndingInventory Inventory
G-226 20,000 90,000G-348 50,000 90,000G-714 20,000 50,000
The budgeted operating level for assigning fixed overhead to production is 1.8 million machinehours. One-half hour is required to produce a unit of G-226, two hours are required for a unit of G-348, and four hours are required for a unit of G-714.
Required:
a. Recast the income statement on an absorption costing basis.
b. Explain why the income from manufacturing on the absorption costing statement differsfrom the income on the variable costing statement. Show your computations.
498 Chapter 10
zim36725_ch10_468-500.qxd 12/11/09 9:43 AM Page 498

CaseCase 10–1: Joon
Joon manufactures and sells to retailers a variety of home care and personal care products. Joon hasa single plant that produces all four of its product lines: Stick Goods (brooms and mops), Floor Care(strippers, soaps, and waxes), Brushes (hair brushes and shoe brushes), and Aerosols (room deodor-izers, bug spray, furniture wax). The following statement summarizes Joon’s financial performancefor the most recent fiscal year.
Stick Floor Goods Care Brushes Aerosols Total
Quantity (000 cases) 20 35 15 30Direct labor hours/case 1.5 1 2 1.6
Total direct labor hours (000) 30 35 30 48 143
Manufacturing cost per case:Direct material $ 51.00 $ 21.00 $ 31.00 $ 11.00Variable overhead 5.25 3.50 7.00 5.60Direct labor cost 31.50 21.00 42.00 33.60Fixed overhead 46.50 31.00 62.00 49.60
Total cost per case $ 134.25 $ 76.50 $ 142.00 $ 99.80
Selling price per case $ 165.00 $122.00 $ 189.00 $ 145.00Total revenue (000) 3,300 4,270 2,835 4,350 $14,755.00Operating margin per case 30.75 45.50 47.00 45.20Total operating margin (000) 615 1,592.5 705 1,356 $ 4,268.50Selling, general & administrative (000):
Fixed (1,350.00)Variable (20% of revenues) (2,951.00)
Net income (loss) (000) $ (32.50)
Direct labor costs $21 per hour. Fixed manufacturing overhead of $4.433 million is allocated toproducts based on direct labor hours. Last year, the fixed manufacturing overhead rate was $31 perdirect labor hour ($4.433 million�143,000 direct labor hours). Variable manufacturing overhead is $3.50per direct labor hour. Selling, general, and administrative (SG&A) expenses consist of fixed costs($1.35 million) and variable costs ($2,951 million). The variable SG&A is 20 percent of revenues.
The Joon plant has considerable excess capacity. Senior management has identified a potentialacquisition target, Snuffy, that sells a line of automotive products (car waxes, soaps, brushes, and soforth) that are complementary to Joon’s existing products and that can be manufactured in Joon’splant. Snuffy does not have any manufacturing facilities, but rather outsources the production of itsproducts to contract manufacturers. Snuffy can be purchased for $38 million. The following tablesummarizes Snuffy’s current operating data:
Snuffy Operating DataMost Recent Fiscal Year
Car Care
Quantity (000 cases) 60Direct labor hours per case 1.9Direct material per case $18Selling price per case $138Additional fixed manufacturing overhead $450,000Additional fixed SG&A $400,000
Criticisms of Absorption Cost Systems: Incentive to Overproduce 499
zim36725_ch10_468-500.qxd 12/11/09 9:43 AM Page 499

Senior management argues that the reason Joon is currently losing money is that volumes have fallenin the plant and that the remaining products are having to carry an increasingly larger share of the over-head. This has caused some Joon product managers to raise prices. Senior managers realize that theymust drive more volume into the plant if Joon is to return to profitability. Since organic growth (i.e.,growth from existing products) is difficult due to a very competitive marketplace, management pro-poses to the board of directors the purchase of Snuffy as a way to drive additional volume into the plant.With volume of 60,000 cases and 1.9 direct labor hours per case, Snuffy’s car care product line will add114,000 direct labor hours to the plant and increase volume about 80 percent (114,000/143,000). Thisadditional volume will significantly reduce the overhead the existing products must absorb and allowthe product managers to lower prices. To incorporate Snuffy’s manufacturing and distribution intoJoon’s current operations, Joon will have to incur additional fixed manufacturing overhead of $450,000per year for new equipment, and $400,000 per year for additional SG&A expenses.
Required:
a. Prepare a pro forma financial statement that shows Joon’s financial performance (netincome) for the most recent fiscal year assuming that Joon has already acquired Snuffy’scar care products and has incorporated them into Joon’s manufacturing and SG&Aprocesses. In preparing your analysis, make the following assumptions:
(i) Snuffy’s products have the same fixed and variable cost structure as Joon’s exisitinglines (i.e., variable overhead is $3.50 per direct labor hour and variable SG&A is 20 percent of revenues).
(ii) The addition of Snuffy products does not change the demand for Joon’s existingproducts.
(iii) There are no positive or negative externalities in manufacturing from having theadditional Snuffy volume in the plant.
(iv) There is sufficient excess capacity in the plant and the local labor markets to absorbthe additional Snuffy volume without causing labor rates or raw material prices to rise.
b. Based on your financial analysis in part (a), should Joon acquire Snuffy?
c. Evaluate management’s arguments in favor of acquiring Snuffy.
d. What other advice would you offer Joon’s management?
500 Chapter 10
zim36725_ch10_468-500.qxd 12/15/09 2:50 PM Page 500

501
Chapter Eleven
Criticisms ofAbsorption CostSystems: InaccurateProduct Costs
Chapter Outline
A. Inaccurate Product Costs
B. Activity-Based Costing
1. Choosing Cost Drivers
2. Absorption versus Activity-Based Costing:An Example
C. Analyzing Activity-Based Costing
1. Reasons for Implementing Activity-Based Costing
2. Benefits and Costs of Activity-Based Costing
3. ABC Measures Costs, Not Benefits
D. Acceptance of Activity-Based Costing
E. Summary
zim36725_ch11_501-553.qxd 12/15/09 2:17 PM Page 501

The last chapter described a specific problem with absorption cost systems. Since absorptioncost systems allocate some fixed costs to products, producing extra units causes fixed coststo be spread over more units. As long as variable cost per unit does not increase, average costfalls with higher production levels. Holding sales constant, managers can increase profits byoverproducing. Profit margins increase because some of the fixed cost is now in inventoryand not charged to net income. Variable costing reduces the incentive to overproduce. How-ever, product costs do not contain any fixed costs and hence do not contain any measure ofthe opportunity cost of capacity. Another problem with variable costing involves increasingthe discretion available to managers. Someone must determine which expenditures are fixedand which are variable, giving managers some discretion over product costs and net income.
This chapter describes a second criticism of absorption costing: It can produce mis-leading product costs. In most absorption cost systems, overheads are usually allocatedbased on direct labor or direct material. However, overheads can vary in other ways—forexample, with machine setups. If the cost allocation system does not use allocation basesthat represent the cause-and-effect relations with overhead, then inaccurate product costsare generated. Section A describes this problem in greater detail. Section B presents activity-based costing (ABC) as an alternative to traditional absorption costing.1 Activity-basedcosting seeks to derive more accurate product costs. However, activity-based costing alsocomes with its own limitations. These are described in section C. Section D summarizeshow most firms use activity-based costing.
A. Inaccurate Product CostsOne problem with some cost accounting systems is that they track historical costs insteadof tracking the physical activities that consume resources and generate costs. For example,the accounting system records the labor costs of setting up machines (financial flows). Butin many plants the accounting system does not record the number of setups or what causedthem. The accounting system records the costs incurred in the purchasing department, butnot usually what is driving the costs of purchasing, such as part numbers, number of pur-chases, and inspections.
Consider the following example.2 Procter & Gamble (P&G) has several plants each pro-ducing a number of laundry soaps (Tide, Cheer, and Oxydol, among others). Tide is pro-duced for a few days; then another product is produced. Suppose that P&G has just twoplants. The plants are the same size and have identical equipment. Plant S produces 10 mil-lion pounds per year of a single soap: Tide. Plant M also produces 10 million pounds per year but of multiple brands of soap: 3 million pounds of Tide, 2 million pounds of Cheer,1 million pounds of Oxydol, half a million pounds of private store labels, and numerous spe-cialty soaps. Twenty different brands are produced in plant M over the course of a year. Tosimplify the example and highlight the essential point, assume that the cost of the raw mate-rial in each brand of soap is the same. Moreover, assume that producing a pound of soaprequires the same direct labor and machine hours at both plants. Each pound of soap,regardless of the brand, has direct labor and direct material costs of $0.34.
502 Chapter 11
1 Strictly speaking, activity-based costing (ABC) is not an alternative to absorption costing. ABC, likeabsorption costing, ultimately traces all overhead to cost objects. The difference between traditional absorptionand ABC, as explained later in the chapter, involves the complexity of allocations and how the cost allocationbases are chosen.
2 This example is drawn from M Maloney and R McCormick, “A Theory of Cost and IntermittentProduction,” Journal of Business 56 (April 1983), pp. 139–53. Also, see R Cooper and R Kaplan, “How CostAccounting Systematically Distorts Product Costs,” Management Accounting, April 1988, pp. 20–27.
zim36725_ch11_501-553.qxd 12/15/09 2:17 PM Page 502

Are the plants’ operations the same? That is, could a visitor distinguish between thetwo plants without resorting to looking at the actual soap brands produced? Plant M willhave a larger support staff for scheduling production, inspecting purchased items, purchas-ing and handling different inventory items, and making engineering changes. Plant M ishandling more transactions (purchase orders, inspections, material movements, order track-ing) than plant S. Therefore, plant M will have larger overhead expenditures than plant S.Suppose plant S has total annual factory overhead of $1.4 million and plant M has $1.8 mil-lion of overhead.
Now consider how a traditional absorption costing system will cost the soaps producedin the two factories. Because each pound of soap has the same direct labor, direct materi-als, and machine time, each pound in plant M will have the same reported cost, which willbe higher than the cost reported in plant S. Tide in plant M will show a higher accountingcost than the identical Tide in plant S because of the higher overhead in plant M. Theaccounting cost of the soaps in the two plants is as follows:
Cost of One Pound of Soap in Plants S and M
Plant S Plant M
Direct labor and materials $0.34 $0.34Overhead* 0.14 0.18
Total cost $0.48 $0.52
Plant S Plant M
*Factory overhead (millions) $1.4 $1.8Volume (millions) 10 10
Overhead per pound $0.14 $0.18
Both plants have the same direct costs. If overhead is assigned to soap using directlabor, direct materials, or machine hours, then each pound of soap in both factories willreceive one ten millionth of its plant’s overhead.
A competitive market for laundry soap will drive the price of soap down toward the cost inplant S, which is $0.48. Suppose the market price for soap becomes $0.51. Plant S is makingan accounting profit of $0.03 per pound. Plant M managers, relying on their accounting sys-tem’s reported cost, will appear to be incurring a loss of $0.01 per pound. Assuming that cus-tomers are willing to pay higher prices for specialty products, plant M’s small-volume specialtysoaps can be priced higher and will appear more profitable. Plant M will deemphasize Tide andfurther differentiate its product line by adding more specialty soaps. But doing so will drive upoverhead costs as production becomes more complex with the additional resources required forscheduling, purchasing, and managing even more different soap inventories.
Criticisms of Absorption Cost Systems: Inaccurate Product Costs 503
ManagerialApplication:RockwellInternationalAxle Plant
Rockwell International, now Arvin Meritor, Inc., allocated overhead costs to products inits truck axle plant using direct labor costs. After reviewing its cost allocation scheme,Rockwell concluded that high-volume product costs were approximately 20 percent toohigh and some of the low-volume product costs were 40 percent too low. Since Rockwellbased its prices on fully absorbed product costs, competitors were entering the high-volume market and taking business away by underpricing Rockwell.
SOURCE: F Worthy, “Accounting Bores You? Wake Up,” Fortune, October 12, 1987, pp. 43–53; www.arvinmeritor.com.
zim36725_ch11_501-553.qxd 12/15/09 2:17 PM Page 503

Exercise 11–1
O’Reilly Manufacturing produces three models of a product: Super, Supreme, and Ultra. These
models are basically the same design, but different quality standards are applied in the pro-
duction process. Frequent production line stops, adjustments, and startups cause a certain
amount of scrap costs. Also, scrap occurs when inspectors reject a product for not meeting
specifications. Once rejected, the product has no commercial value and is hauled away. All
costs incurred to produce a scrapped product are charged to a scrap account, which is part of
overhead. The budgeted operating statement for the firm, by product, follows.
O’REILLY MANUFACTURINGBudgeted Operating Statement
Super Supreme Ultra Total
Unit volume 85,000 42,000 13,000Selling price $205 $225 $235 Revenue $17,425,000 $9,450,000 $3,055,000 $29,930,000Less:
Raw materials $ 8,500,000 $4,200,000 $1,300,000 $14,000,000Direct labor* 5,312,500 3,150,000 975,000 9,437,500Overhead† 3,478,245 2,062,395 638,360 6,179,000
Total cost $17,290,745 $9,412,395 $2,913,360 $29,616,500
Profits $ 134,255 $ 37,605 $ 141,640 $ 313,500
*Direct labor cost is $25 per hour.†Overhead costs are allocated to products based on direct labor dollars.
Overheads consist of:
Depreciation $3,500,000Indirect labor 450,000Scrap 1,679,000Other 550,000
Total $6,179,000
Super Supreme Ultra
Direct labor hoursper unit 2.5 hours 3 hours 3 hours
Total scrap $850,000 $504,000 $325,000Profits per unit $1.58 $0.90 $10.90
Management is concerned about the relatively low profit per unit of Supreme as compared to
the Ultra line and is considering a variety of marketing strategies to increase sales of Ultra
since its profit margins are substantially higher.
Required:
Critically analyze management’s conclusion that profits are substantially higher on Ultra.
Present supporting figures to back up your analysis and conclusions.continued
504 Chapter 11
zim36725_ch11_501-553.qxd 12/15/09 2:17 PM Page 504
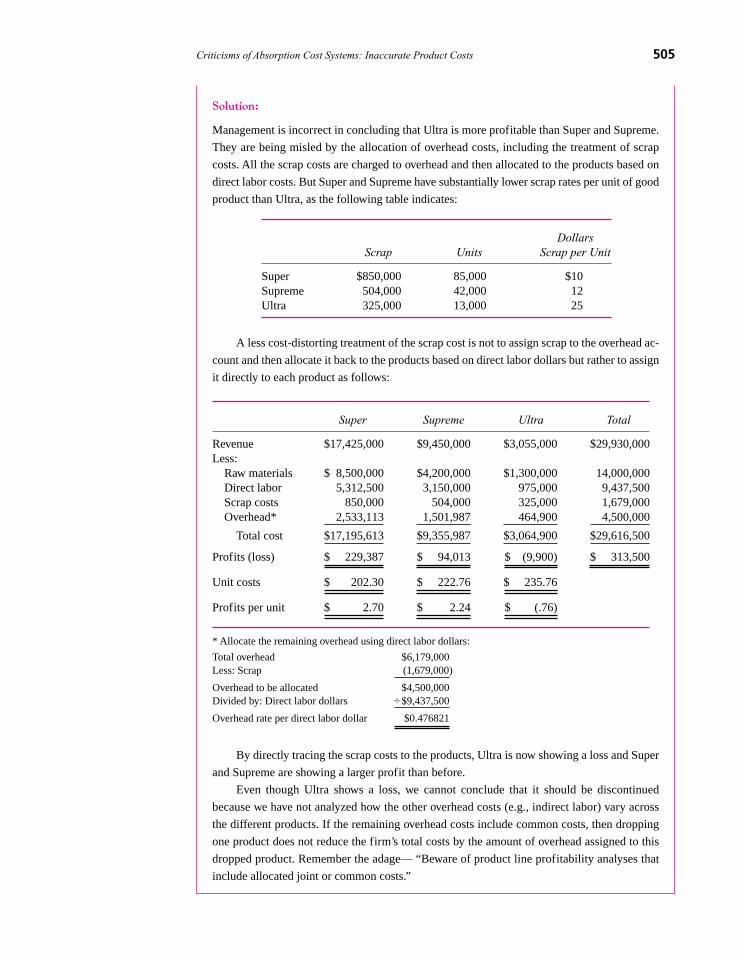
Solution:
Management is incorrect in concluding that Ultra is more profitable than Super and Supreme.
They are being misled by the allocation of overhead costs, including the treatment of scrap
costs. All the scrap costs are charged to overhead and then allocated to the products based on
direct labor costs. But Super and Supreme have substantially lower scrap rates per unit of good
product than Ultra, as the following table indicates:
DollarsScrap Units Scrap per Unit
Super $850,000 85,000 $10Supreme 504,000 42,000 12Ultra 325,000 13,000 25
A less cost-distorting treatment of the scrap cost is not to assign scrap to the overhead ac-
count and then allocate it back to the products based on direct labor dollars but rather to assign
it directly to each product as follows:
Super Supreme Ultra Total
Revenue $17,425,000 $9,450,000 $3,055,000 $29,930,000Less:
Raw materials $ 8,500,000 $4,200,000 $1,300,000 14,000,000Direct labor 5,312,500 3,150,000 975,000 9,437,500Scrap costs 850,000 504,000 325,000 1,679,000Overhead* 2,533,113 1,501,987 464,900 4,500,000
Total cost $17,195,613 $9,355,987 $3,064,900 $29,616,500
Profits (loss) $ 229,387 $ 94,013 $ (9,900) $ 313,500
Unit costs $ 202.30 $ 222.76 $ 235.76
Profits per unit $ 2.70 $ 2.24 $ (.76)
* Allocate the remaining overhead using direct labor dollars:
Total overhead $6,179,000Less: Scrap (1,679,000)
Overhead to be allocated $4,500,000Divided by: Direct labor dollars �$9,437,500
Overhead rate per direct labor dollar $0.476821
By directly tracing the scrap costs to the products, Ultra is now showing a loss and Super
and Supreme are showing a larger profit than before.
Even though Ultra shows a loss, we cannot conclude that it should be discontinued
because we have not analyzed how the other overhead costs (e.g., indirect labor) vary across
the different products. If the remaining overhead costs include common costs, then dropping
one product does not reduce the firm’s total costs by the amount of overhead assigned to this
dropped product. Remember the adage— “Beware of product line profitability analyses that
include allocated joint or common costs.”
Criticisms of Absorption Cost Systems: Inaccurate Product Costs 505
zim36725_ch11_501-553.qxd 12/15/09 2:17 PM Page 505

The problem in plant M is the way the absorption costing system traditionally allocatescosts. Even though producing Tide in both factories uses the same resources, plant M hashigher overhead costs than plant S. Many costs in a plant are driven not so much by the num-ber of units produced as by the number of transactions, such as machine setups, purchaseorders, or shipments. Allocating these transaction-based costs using unit volume causesproducts with large production volumes to be assigned too large a share of these costs.
When managers and accountants speak of inaccurate product costs, they mean that over-head costs are not being tracked to the activities causing the costs (such as setups). Rather,these costs are being combined with other cost pools (such as maintenance) and these overlyaggregated cost pools are then being allocated to products using allocation bases (like directlabor) that do not capture the cause-and-effect relation driving the particular costs in theoverly aggregated cost pool. In the above example, Tide does not really cost more to producein plant M than in plant S. However, the accounting system inaccurately reports this. Over-head costs are higher in plant M because of the additional products produced. If Tide werethe only soap produced in plant M, its cost would be the same as in plant S. Thus, theaccounting system in plant M is inaccurately charging Tide for some overhead costs thatshould be charged to the other products in plant M that are causing the higher costs.
Traditional absorption systems can be modified to provide more accurate product costsin plant M. An activity-based cost system is one such modification. Whether activity-basedsystems are truly alternatives to absorption systems or simply modifications is a legitimatequestion, although such questioning ultimately deteriorates into a semantic debate. The im-portant point, however, is that managers seeking to control costs must manage the cost dri-vers. Controlling costs requires identifying and managing the key factors that generatecosts, not massaging the cost numbers or cost allocation procedures. Activity-based costsystems (described next) are intended to provide more accurate product costs and to givemanagers the data to manage the cost drivers. Activity-based costing recognizes that over-head costs vary not only with volume but also with the range of items manufactured—thatis, their diversity and complexity. Finally, examining activity-based systems furthers ourunderstanding of costing systems in general.
Q11–1 Why does traditional absorption costing often yieldinaccurate product costs?
Q11–2 In a plant producing multiple products, would absorptioncosting overcost or undercost the more complex products?Why?
B. Activity-Based CostingThis section describes a type of absorption costing called activity-based costing (ABC).While a manufacturing setting is chosen to describe activity-based costing, this techniquehas also been applied in insurance and banking institutions, nonprofit organizations, andthe marketing and distribution departments of firms.
Activities are repetitive tasks performed by each specialized group or activity centerwithin the factory. Activity centers are cost centers (see Chapter 5). Costs are assigned toactivities (i.e., cost centers) in the initial step of the process, and then these activity centercosts are either directly traced or allocated to products. In this sense, activity-based costsystems are very similar to the two-stage allocation procedure depicted in Figure 9–4.However, activity-based cost systems differ from more traditional absorption cost systemsin how department/activity center costs are allocated to products.
ConceptQuestions
506 Chapter 11
zim36725_ch11_501-553.qxd 12/15/09 2:17 PM Page 506

An entire vocabulary has developed surrounding activity-based costing, includingactivity-based management, activity drivers, resource drivers, cost driver analysis, andvalue-chain costing. Since the purpose of this section is to introduce the concepts ofactivity-based costing, not to treat the subject comprehensively, the terminology used inthis chapter is simplified from that found in practice.3
Installing an activity-based cost system begins with an analysis of the types of transactionsthat generate costs in each factory support department (e.g., purchasing, engineering, main-tenance, and quality control). Cost analysts examine each factory department to understandwhat drives the costs in that support department. Examples of typical cost drivers are thenumber of inspections or testings, receipts of raw materials and parts, the number of partnumbers in inventory, machine setups, and engineering change orders. For each factorysupport department studied, the primary cost driver is identified.
Once the cost driver is determined, it can be classified into one of four mutually ex-clusive categories: unit level, batch level, product level, or capacity sustaining. Figure 11–1illustrates these four categories in an activity-based costing system. Unit-level costs arisefrom activities that are performed at least once for each unit of product. For example, ma-chining a surface, drilling a hole, or attaching a subassembly must be done for each andevery unit produced. These costs include direct labor and material and variable overhead.
Batch-level costs arise from activities performed once for each batch or lot of prod-ucts. For example, machine setups, cleanup, and moving the batch to the next step in theproduction process depend on the number of batches rather than the number of units ineach batch. Purchase orders and inspections are also examples of batch-level activities.They occur once for each batch, independent of how many units are in the batch.
Product-level costs arise from activities to support the production of the product typeor model. For example, engineering support costs for process modifications and product de-sign depend on the existence of the product line and do not vary with the number of units ornumber of batches produced. Other examples of product-level costs include the costs of en-gineering change orders, product enhancement, and packaging costs unique to the product.
Finally, capacity-sustaining costs arise from all remaining activities required for theoverall productive capacity of the factory. For example, plant security, maintenance,administration, insurance, depreciation, utilities, and property taxes are incurred to maintainthe production capability of the plant and do not depend on the number of units, batches, or
1. Choosing CostDrivers
Criticisms of Absorption Cost Systems: Inaccurate Product Costs 507
3 The interested reader is referred to R Kaplan and S Anderson, Time Driven Activity-Based Costing: A Simplerand More Powerful Path to Higher Profits (Boston: Harvard Business School Publishing, 2007).
Product level
Batch level
Unit-LevelCosts
(e.g., direct labor and materials,energy to run
machines)
Batch-LevelCosts
(e.g., qualityinspectors, machinesetups, purchasing)
Product-LevelCosts
(e.g., engineering costs, product
documentation andtesting, packaging
costs)
Capacity-Sustaining Costs
(e.g., factorymanagement,accounting,
security, depreciation,utilities, property taxes)
Batch level
Product level
Batch level
PRODUCT COSTS
FIGURE 11–1
Activity-based costsystem categorizationand allocation ofindirect costs
zim36725_ch11_501-553.qxd 12/15/09 2:17 PM Page 507

product lines produced. These are common costs, shared by all the products produced.These capacity-sustaining costs are not caused by and hence cannot be tracked to any par-ticular product, batch, or product line.
Some writers suggest splitting out additional levels such as process-level costs, whicharise from the engineering activities necessary to maintain a particular production process,or customer-sustaining costs, which arise from sales or engineering activities required tosupport a particular customer. Conceptually, these are similar to product-level activities. Tosimplify the exposition, only four cost levels are discussed here. (In practice, the number oflevels used by a particular system depend on the firm’s specific circumstances.)
In Figure 11–1, direct costs that are unit-level costs are traced directly to the units pro-duced. Other costs, such as indirect labor to set up machines or to purchase materials foreach batch, cannot be traced directly to units; they depend not on the number of units in thebatch, but only on the number of batches. For example, the work load in the purchasingdepartment usually depends on the number of purchase orders issued, receipt of the order,and inspection of the order. The amount of work is about the same whether 100 units or10,000 units are in the order. Once these batch-level costs are traced to a batch, they can beallocated to the product by dividing by the number of units in the batch.
Product-level costs, such as engineering costs and some maintenance costs, are in-curred only if the particular product line exists. These costs vary with the number of dis-tinct products in the plant, not with the number of batches or units. For example, thenumber of engineers needed to maintain the product line often depends on the complexityof the product, which in turn is a function of the number of different parts in the product.Some firms allocate product-level costs based on the number of different parts in the prod-uct. These costs are then averaged over the number of units produced.
All remaining factory costs that cannot be traced directly to units, batches, or productlines, such as general factory management, accounting department costs, and propertytaxes, are capacity-sustaining costs. They can be allocated to units by first allocating themto product lines, then to batches, and finally to the units in the batches. Alternatively, theycan be allocated directly to units using direct labor or machine hours.
When each cost is segregated into one of these four categories, the factory is brokenup into distinct sets of activities, or identifiable operations that consume resources. Costsare accumulated by activity centers. Cost drivers should accurately reflect the underlyingfactors that cause a particular overhead activity’s costs to vary. Cost drivers (both financialand nonfinancial measures of activity) mimic how products consume resources in activitycenters. ABC attempts to refine the set of internal “tax rates” (Chapter 7) used to tax ex-ternalities inside the firm. Instead of taxing direct materials for purchasing departmentcosts, purchase orders or part numbers are the cost drivers and become the taxed activity.
508 Chapter 11
ManagerialApplication:AT&T andABC
The business billing center of AT&T, with $30 million annual expenses, prints, sorts,and mails invoices to business customers. Its activities include monitoring the billingprocess, editing and checking the data, and correcting errors. It installed ABC to controlcosts. First, a thorough analysis of the process revealed the underlying cost drivers foreach activity (number of customers tested, change requests, service orders, and pagesprinted). Second, costs were assigned to cost objects based on the cost drivers.
Armed with the new cost data, management benchmarked their operations withbilling centers in other companies. In two years, AT&T’s billing center reduced operat-ing expenses 26 percent even though billable minutes increased 46 percent.
SOURCE: T Hobdy, J Thompson, and P Sharman, “Activity-Based Management at AT&T”; www.focusedmanagement.com/knowledge_base/articles/fmi_articles/middle/at&t.htm.
zim36725_ch11_501-553.qxd 12/15/09 2:17 PM Page 508

Exercise 11–2
Southridge is a 200-bed hospital. Southridge has the following cost structure: $250 per bed per
day for nursing care, food, linen, and janitorial services; $50 per bed per day for occupancy
costs such as depreciation, administration, and utilities; and $120 per patient for admission in
the admitting department and social work discharge planning. The bed cost of $250 varies with
the number of bed days. Occupancy cost represents the cost of providing capacity and does not
vary with bed days. The $120 admission cost varies with the number of patients admitted. Each
patient, regardless of the number of days in the hospital, must be admitted and then discharged.
Two years ago the average patient stayed seven days. Now the average patient stays four days.
To simplify the illustration, assume all hospital beds are always occupied. Note that prescrip-
tion drugs and medical procedures such as X-rays and lab tests are billed directly to patients
and are not included in Southridge’s operating costs.
Required:
a. What was the total annual cost of operating Southridge two years ago?
b. What is the total annual cost of operating Southridge today?
c. Describe why total costs increased from two years ago to today.
d. How has the average cost of a patient stay changed?
e. Categorize the three cost categories above using the ABC labels: unit-level,
batch-level, product-level, and capacity-sustaining costs.
Solution:
a. Calculating the total annual cost two years ago first requires determining the number
of admissions per year:
Bed days per year 365Bed days per admission �7
Admissions per bed per year 52.14Number of beds � 200
Admissions per year 10,428
Total cost (millions):Variable bed cost (200 beds � $250 � 365 days) $ 18.25Occupancy cost (200 beds � $50 � 365 days) 3.65Costs of admission (10,428 admissions � $120) 1.25
Total annual cost $ 23.15
b. Total annual cost today:
Bed days per year 365Bed days per admission �4
Admissions per bed per year 91.25Number of beds � 200
Admissions per year 18,250
Total cost (millions):Variable bed cost (200 beds � $250 � 365 days) $18.25Occupancy cost (200 beds � $50 � 365 days) 3.65Costs of admission (18,250 admissions � $120) 2.19
Total annual cost $24.09
continued
Criticisms of Absorption Cost Systems: Inaccurate Product Costs 509
zim36725_ch11_501-553.qxd 12/15/09 2:17 PM Page 509

c. Total operating cost increased about $940,000 (7,822 additional admissions � $120 per
admission) because average length of stay has fallen from seven to four days, and the
number of patients admitted has increased. To service the increased number of
admissions requires more admission and discharge resources.
d. The average cost of a patient stay two years ago was $2,220 ($23.15 million �
10,428 patients). The average cost of a patient stay today is $1,320 ($24.09 million �
18,250 patients). The average cost per patient has decreased because length of stay
(and hence the cost that varies with days) is lower. However, total hospital costs are
higher because Southridge is incurring more costs admitting and discharging the
greater volume of patients.
e. Unit-level costs: The $250 per bed per day cost for nursing and so forth. These costs
vary with the number of patient bed days.
Batch-level costs: The $120 per admission cost. Each patient admitted consumes
some admissions and social work costs, regardless of the patient’s length of stay.
Product-level costs: Lab tests, X-rays, and surgical departments are like production-
sustaining costs. These costs are accumulated in the various service areas, and then
patients are charged for the medical services they use.
Capacity-sustaining costs: The $50 per bed per day occupancy cost. Even though
these costs are being allocated based on bed days, they do not vary with either bed
days or the number of admissions. Occupancy costs provide the basic capacity to
serve the 200 patients per day.
Activity-based systems can be related back to the discussion of cost curves in Chapter 2.Chapter 2 presented a linear cost curve of the form
TC � VC � Q � FC
where
TC � Total costVC � Variable cost per unit
Q � Number of units producedFC � Fixed cost
That is, total cost, TC, can be disaggregated into variable costs, VC � Q, and fixed cost,FC. Fixed costs, by definition, do not vary with Q, units produced.
Under activity-based costing, a more complex cost function is assumed to exist—namely,
TC � VC � Q � BC � B � PC � L � OC
where
TC � Total costVC � Variable cost per unit
Q � Number of units producedBC � Cost per batch
B � Number of batchesPC � Cost per product line
L � Number of product linesOC � All other costs that do not vary with some activity measure
510 Chapter 11
zim36725_ch11_501-553.qxd 12/15/09 2:17 PM Page 510

In addition,
FC � BC � B � PC � L � OC
That is, some fixed costs, FC, that do not vary with units produced do vary with the num-ber of batches and product lines.
The more complex ABC cost function recognizes that costs vary due to more than justchanges in units produced, Q. Costs also vary with the number of batches and the numberof product lines. To the extent batches and product line variables correctly capture howcosts vary in the particular factory under study, ABC will have more explanatory power andwill be more accurate than simple unit-based systems.
While the ABC cost function captures more of the complexity in the factory, it stillmakes a number of simplifying assumptions that potentially reduce its accuracy. For ex-ample, every batch is assumed to cost $BC regardless of the number of units in the batch,the types of products in the batch, and what was produced before the current batch. Alsoeach product line is assumed to cost $PC regardless of the complexity of the productlines.
Activity-based costing tries to identify the factors that drive cost and then use thesefactors to allocate overhead costs. The following exercise illustrates an activity-based costsystem.
Criticisms of Absorption Cost Systems: Inaccurate Product Costs 511
HistoricalApplication:Activity-Based Costingin theRailroads
In the 1870s, the railroads developed a sophisticated unit-cost measure: the cost ofhauling a ton of freight one mile. The accounts were segregated into four groups:
1. Maintenance of the roadway and general management.
2. Station expenses.
3. Movement expenses.
4. Interest on the capital investment.
The first group involves costs that do not vary with volume of traffic. Group 2contains costs that vary with volume of freight. Group 3 contains costs that vary withthe number of trains run. The last group represents interest on the capital investment.Three cost drivers were used to allocate the four cost pools:
• Average number of tons transported over one mile of road per year (groups 1 and 4).
• Length of haul (2).
• Average number of tons of freight in each train (3).
This complex calculation of cost per ton-mile resembles current activity-basedcosting systems that separate costs into unit-level, batch-level, product-level, andcapacity-sustaining-level costs. Unit-level costs are roughly the movement expenses(3). Batch-level costs are like station expenses (2). Product-line costs resemble mainte-nance of roadway expenses (1). And interest on capital investment is required to sustainthe entire system.
SOURCE: A Chandler, The Visible Hand: The Managerial Revolution in American Business (Cambridge: Harvard UniversityPress, 1977), pp. 116–19.
zim36725_ch11_501-553.qxd 12/15/09 2:17 PM Page 511

Exercise 11–3
A tree nursery is considering a change in product mix in its inventory. The manager wants to
estimate the effect of each type of tree on indirect costs. Indirect costs are identified and esti-
mated for the following activities: watering, repotting (transferring trees to larger pots), and
administration. Total estimated annual costs for each activity, the cost driver for each activity,
and the expected annual usage of each cost driver are as follows:
Estimated Estimated UsageActivity Costs Cost Driver of Cost Driver
Watering $100,000 Number of trees 500,000Repotting 200,000 Number of repots 200,000
Administration 45,000 Number of differenttypes of trees 50
Required:
a. What are the application rates for each of the activities?
b. Given the choice of cost driver, determine the activity level (unit-level, batch-level,
product-level, production-sustaining level) of each of the activities.
c. What are the indirect costs of 100 weeping birches, each of which requires repotting
once a year?
Solution:
a. The application rate for each activity is calculated by dividing the estimated costs of
the activity by the estimated usage of its respective cost driver:
Activity Application Rate
Watering $100,000/500,000 $0.20/treeRepotting $200,000/200,000 $1.00/repotAdministration $45,000/50 $900/type of tree
b. Both watering and repotting are unit-level activities because their cost drivers vary
with the number of units. Administration is treated as a product-level activity because
each product receives the same indirect costs.
c. The indirect costs traced to the 100 weeping birches are as follows:
Activity Application Rate Usage Costs
Watering $0.20/tree 100 $ 20Repotting $1.00/repot 100 100Administration $900/type of tree 1 900
Total annual indirect costs $1,020
512 Chapter 11
zim36725_ch11_501-553.qxd 12/15/09 2:17 PM Page 512

Following is an example that compares a single unit-based allocation system and activity-based costing. The term a single unit-based allocation system refers to an absorptioncost system whereby all manufacturing overhead is allocated using a single allocationbase that varies with units produced, such as direct labor, direct material, or machinehours. VBL Co. manufactures a complete line of DVDs in its plant: three DVD playersand two DVD recorders. The players and recorders make up two separate product lines,each with its own engineering department. The five models are manufactured in sepa-rate batches.
The following table contains the production and direct costs for each model.
DVD Models
Players Recorders
105 205 305 801 901
Number of units/year 80,000 100,000 60,000 40,000 20,000Cost/DVD unit
Direct labor $34.00 $35.00 $36.00 $42.00 $44.00Direct material $60.00 $64.00 $65.00 $80.00 $85.00
Number of units/batch 200 100 150 50 50
The plant’s overhead consists of the following items and amounts.
Factory Overhead Costs($ in Millions)
Testing, setups, and supplies $ 9.30Product-line costs:
Four-head models $5.40Six-head models 4.20 9.60
Other factory costs 2.98
Total overhead costs $21.88
The following tables calculate the total manufacturing cost per unit by model using asingle unit-based allocation scheme. Overhead is assigned to models by a plantwide over-head rate using direct labor dollars as the allocation base.
The first step is to calculate the plantwide overhead rate based on direct labor costs.
DVD Models
105 205 305 801 901 Total
Number of DVDs 80,000 100,000 60,000 40,000 20,000Direct labor/unit $34.00 $35.00 $36.00 $42.00 $44.00
Total direct labor cost(millions) $2.72 $3.50 $2.16 $1.68 $0.88 $10.94
Total factory overhead (millions) $21.88
Overhead rate (percentage of direct labor cost) 200%
2. Absorptionversus Activity-Based Costing:An Example
Criticisms of Absorption Cost Systems: Inaccurate Product Costs 513
zim36725_ch11_501-553.qxd 12/15/09 2:17 PM Page 513
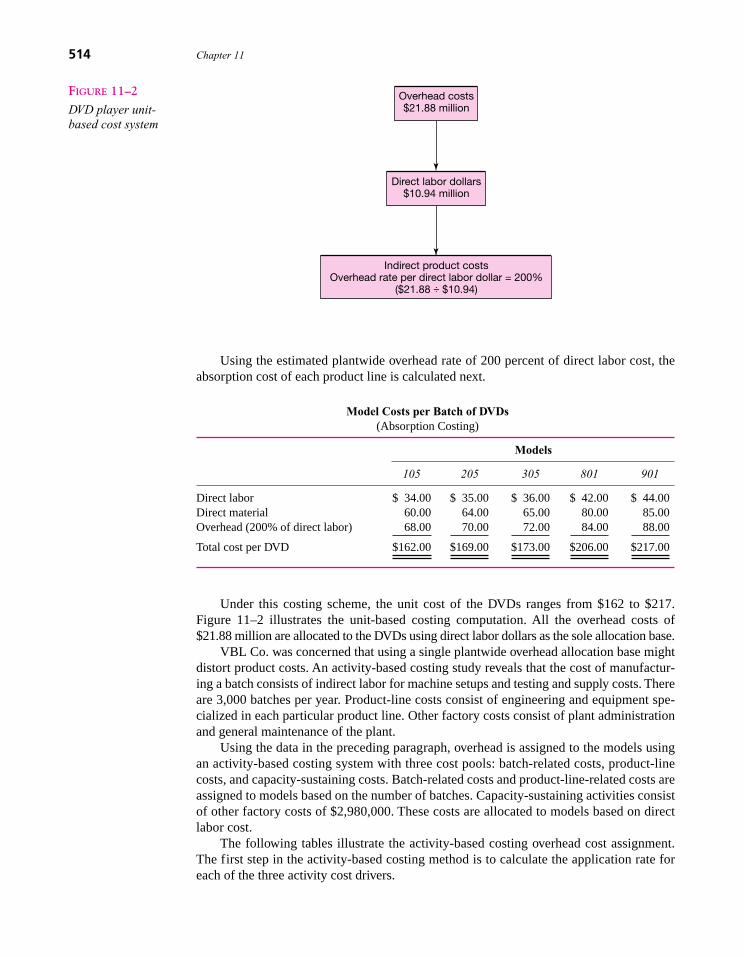
Using the estimated plantwide overhead rate of 200 percent of direct labor cost, theabsorption cost of each product line is calculated next.
Model Costs per Batch of DVDs(Absorption Costing)
Models
105 205 305 801 901
Direct labor $ 34.00 $ 35.00 $ 36.00 $ 42.00 $ 44.00Direct material 60.00 64.00 65.00 80.00 85.00Overhead (200% of direct labor) 68.00 70.00 72.00 84.00 88.00
Total cost per DVD $162.00 $169.00 $173.00 $206.00 $217.00
Under this costing scheme, the unit cost of the DVDs ranges from $162 to $217.Figure 11–2 illustrates the unit-based costing computation. All the overhead costs of$21.88 million are allocated to the DVDs using direct labor dollars as the sole allocation base.
VBL Co. was concerned that using a single plantwide overhead allocation base mightdistort product costs. An activity-based costing study reveals that the cost of manufactur-ing a batch consists of indirect labor for machine setups and testing and supply costs. Thereare 3,000 batches per year. Product-line costs consist of engineering and equipment spe-cialized in each particular product line. Other factory costs consist of plant administrationand general maintenance of the plant.
Using the data in the preceding paragraph, overhead is assigned to the models usingan activity-based costing system with three cost pools: batch-related costs, product-linecosts, and capacity-sustaining costs. Batch-related costs and product-line-related costs areassigned to models based on the number of batches. Capacity-sustaining activities consistof other factory costs of $2,980,000. These costs are allocated to models based on directlabor cost.
The following tables illustrate the activity-based costing overhead cost assignment.The first step in the activity-based costing method is to calculate the application rate foreach of the three activity cost drivers.
514 Chapter 11
Overhead costs$21.88 million
Direct labor dollars$10.94 million
Indirect product costsOverhead rate per direct labor dollar = 200%
($21.88 ÷ $10.94)
FIGURE 11–2
DVD player unit-based cost system
zim36725_ch11_501-553.qxd 12/16/09 10:02 AM Page 514
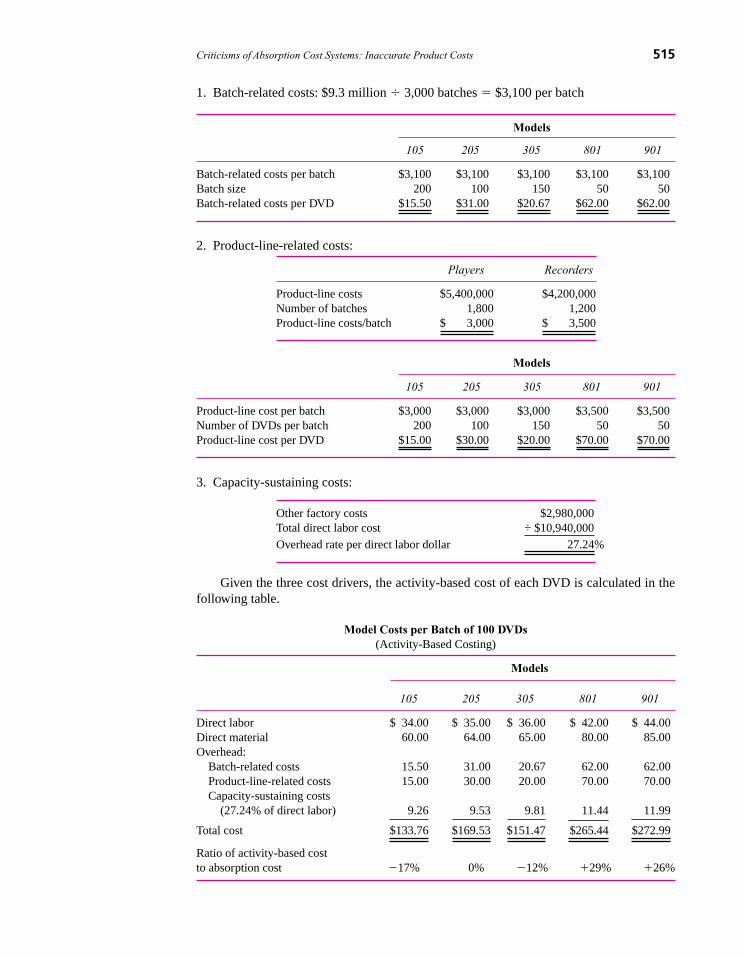
1. Batch-related costs: $9.3 million � 3,000 batches � $3,100 per batch
Models
105 205 305 801 901
Batch-related costs per batch $3,100 $3,100 $3,100 $3,100 $3,100Batch size 200 100 150 50 50Batch-related costs per DVD $15.50 $31.00 $20.67 $62.00 $62.00
2. Product-line-related costs:
Players Recorders
Product-line costs $5,400,000 $4,200,000Number of batches 1,800 1,200Product-line costs/batch $ 3,000 $ 3,500
Models
105 205 305 801 901
Product-line cost per batch $3,000 $3,000 $3,000 $3,500 $3,500Number of DVDs per batch 200 100 150 50 50Product-line cost per DVD $15.00 $30.00 $20.00 $70.00 $70.00
3. Capacity-sustaining costs:
Other factory costs $2,980,000Total direct labor cost ÷ $10,940,000
Overhead rate per direct labor dollar 27.24%
Given the three cost drivers, the activity-based cost of each DVD is calculated in thefollowing table.
Model Costs per Batch of 100 DVDs(Activity-Based Costing)
Models
105 205 305 801 901
Direct labor $ 34.00 $ 35.00 $ 36.00 $ 42.00 $ 44.00Direct material 60.00 64.00 65.00 80.00 85.00Overhead:
Batch-related costs 15.50 31.00 20.67 62.00 62.00Product-line-related costs 15.00 30.00 20.00 70.00 70.00Capacity-sustaining costs
(27.24% of direct labor) 9.26 9.53 9.81 11.44 11.99
Total cost $133.76 $169.53 $151.47 $265.44 $272.99
Ratio of activity-based cost to absorption cost �17% 0% �12% �29% �26%
Criticisms of Absorption Cost Systems: Inaccurate Product Costs 515
zim36725_ch11_501-553.qxd 12/15/09 2:17 PM Page 515

Under activity-based costing, the unit cost of the DVDs ranges from $133.76 to$272.99. Figure 11–3 illustrates the activity-based costing computation.
Notice that all costs are allocated under both unit-based and activity-based costing.There is no distinction between fixed and variable costs. All costs are viewed as being vari-able in the long run and assigned to the products.
Under activity-based costing, the players’ costs are 0 to 17 percent lower than under aplantwide overhead rate, and the recorders costs are 26 to 29 percent higher. The product-line costs under unit-based costing are assigned to models using direct labor costs. Sincethe players require about 77 percent of the direct labor dollars [($2.72 � $3.50 � $2.16) �$10.94], they are assigned 77 percent of the $9.6 million of product-line costs. However,the players account for only 56 percent of the product-line costs ($5.4 � 9.6). Thus, unit-based costing assigns more product-line costs to the players than does activity-basedcosting.
This example illustrates how traditional unit-based costing can overcost high-volumemodels and undercost low-volume models. Since the recorders are more complex, they re-quire more product-line costs per unit than the players. Unit-level allocation bases (e.g., di-rect labor) overcost the less complex products and undercost the more complex, moreresource-consuming products.
516 Chapter 11
Overhead costs$21.88 million
Recorders$4.2 M
Players$5.4 M
Product-level costs$9.6 million
Production-sustainingcosts $2.98 million
Batch-level costs$9.3 million
Number ofbatches3,000
Direct labordollars
$10.94 M
Number ofbatches1,200
Number ofbatches1,800
Overheadrate
$3,100
Overheadrate
27.24%
Overheadrate
$3,500
Overheadrate
$3,000
Individual DVD players
FIGURE 11–3
DVD player plant’sactivity-based costingsystem
zim36725_ch11_501-553.qxd 12/15/09 2:17 PM Page 516

Q11–3 What are the four mutually exclusive categories used inactivity-based cost accounting?
Q11–4 Does activity-based costing allocate more or less total coststo products than unit-based costing?
C. Analyzing Activity-Based CostingHaving described activity-based costing (ABC) and how cost drivers are selected, this sec-tion discusses some of the reasons firms adopt it, why most firms do not, and the costs andbenefits of ABC.
An interesting study compares product costs computed using a traditional unit-basedabsorption costing system with product costs computed using an activity-based system.4
The site is an electronics factory producing over 800 different electrical instruments. Thefactory manufactures the circuit boards and assembles them into a completed instrument,which is then tested. The traditional absorption costing system assigned all overhead coststo one of the two overhead cost pools. One pool was allocated to individual products basedon direct materials and the other pool was allocated based on direct labor. Direct materialsaveraged 65 percent of total product costs, direct labor averaged 2 percent of total productcosts, and overhead averaged 33 percent of product costs. Six-month product volumesrange from 1 to 4,826 units; half of the products have volumes of fewer than 50 units everysix months. Thus, the plant produces both high- and low-volume products.
The factory converted to an activity-based costing system, which identified 14 differ-ent activity centers and accumulated the costs in each center separately. The new systemidentified cost drivers for each activity center such as the number of parts per instrumentand the number of batches. Instead of just two allocation bases (direct labor and direct ma-terials), 14 allocation bases are used to allocate overhead costs.
The traditional absorption cost of each product is compared with its activity-based costby computing the ratio of activity-based cost to absorption cost for each product. Fifty per-cent of the activity-based product costs are within about 10 percent of the traditional ab-sorption costs. Fewer than 20 percent of the product costs vary by more than 50 percent.These data indicate that for most of the products, activity-based costing and traditionalabsorption costing generate roughly comparable product costs. But for a few products,there are dramatic changes in product costs when computed under activity-based costing.One percent of the products has activity-based costs equal to five times their traditionalabsorption-based costs.
The authors of the study find that (1) high-volume products have lower activity-basedunit costs relative to absorption-based unit costs and (2) low-volume products tend to havehigher activity-based costs than absorption costs. Traditional absorption costing systemstend to assign more costs to large-volume jobs relative to small-volume jobs, particularlywhen overhead contains a high fraction of indirect costs that do not vary with units producedbut do vary with batches and product lines. When these batch and product-line costs are al-located to jobs based on a volume measure such as units or direct materials, large-volumejobs bear a high fraction of these costs.
1. Reasons forImplementingActivity-BasedCosting
ConceptQuestions
Criticisms of Absorption Cost Systems: Inaccurate Product Costs 517
4 G Foster and M Gupta, “Implementation of an Activity Accounting System in the Electronics Industry,” inMeasuring Manufacturing Performance, ed. R Kaplan (Boston: Harvard Business School, 1989).
zim36725_ch11_501-553.qxd 12/15/09 2:17 PM Page 517

This study of a plant that converted to an activity-based costing system shows thatactivity-based costing does make a difference in reported product costs, although for mostproducts the unit cost changes are not terribly large.
Activity-based costing systems claim to offer several advantages. ABC increases thepercentage of product costs directly traced to individual products. Also, ABC provides anunderstanding of how costs are consumed by individual products, the activities required toproduce them, the direct and indirect costs in the various activity centers, and how indirectcosts are generated by cost drivers. Activity-based cost systems focus cost control at theactivity level and the product design level. Allocating overhead costs using direct labor en-courages managers to reduce the direct labor content in products. Activity-based systemsfocus managers’ attention on controlling costs in the activity center and reducing the con-tent of the cost drivers in the products.
Activity-based costing systems are promoted as a way to develop more accurate prod-uct or product-line costs. Accuracy means that changes in product volume, batch size, orproduct design characteristics (number of parts, manufacturing complexity, etc.) cause re-ported cost changes to be more highly correlated with changes in opportunity cost. Besidesbeing more accurate, ABC changes the incentives of operating managers. Identifying theunderlying cost drivers allows managers to focus their attention on them. For example,product designers will change the way products are designed and manufactured to reduce
518 Chapter 11
ManagerialApplication:InsteelIndustries
Insteel manufactures and markets concrete-reinforcing products such as industrial wire, fas-teners, nails, and mesh. Its South Carolina plant produced 477 individual products. About20 percent of its products accounted for 85 percent of its revenues, and 20 percent of its cus-tomers accounted for 95 percent of its revenues. Senior managers at this plant formed anABC team that identified 80 cost pools and appropriate cost drivers for these pools. For ex-ample, materials-handling costs were assigned to products based on the number of movesrequired by each product. Based on the new ABC cost data, management at this plant un-dertook a series of profit-enhancing actions: They discontinued unprofitable products, in-creased prices on other unprofitable items, and dropped unprofitable customers. After thesuccess of ABC at its South Carolina plant, Insteel rolled out ABC at its other plants.
SOURCE: V Narayanan and R Sarkar, “The Impact of Activity-Based Costing on Managerial Decisions at InsteelIndustries—A Field Study,” Journal of Economics and Management Strategy, Summer 2002, pp. 257–88.
ManagerialApplication:AcxiomCorporation
Acxiom, a publicly traded firm, provides interactive marketing services to Fortune 500companies. Its services include market databases, mailing list processing, data ware-housing, and facilities management. Acxiom owns InfoBase, the largest consumer data-base in the United States, covering over 125 million households.
Acxiom uses activity-based costing to trace costs to activities and processes. A soft-ware project involves the following activities: planning the project, designing software,writing code, and testing code. Acxiom’s ABC system accumulates the costs of these ac-tivities and assigns them to products, projects, and customers. This allows Acxiom to as-sess customer and product profitability and to hold its people accountable. It also allowsit to further decentralize decision making because lower-level employees, knowledge-able of the firm’s cost structure, can make decisions about changing a project’s specifi-cation without approval by higher-level managers.
SOURCE: www.Acxiom.com.
zim36725_ch11_501-553.qxd 12/15/09 2:17 PM Page 518

the reported ABC costs. ABC systems tax different things (recall the discussion in Chapter 7that cost allocations are defacto internal tax systems). To the extent that the chosen cost dri-vers are in fact associated with the factors that cause costs to change, an activity-based costsystem taxes different activities and hence will cause managers to change their behaviorand thus reduce costs.
But these managers must have the decision rights to alter the levels of the cost driversand there must be a performance evaluation system that gives them incentives to minimizecost. Adopting an activity-based costing system is a change in the performance measure-ment system. For behavior to be changed in the desired way, the other two parts of theorganizational architecture (performance reward and decision-right partitioning) mustencourage the appropriate changes. (Recall from Chapter 4 that all legs of the organiza-tion’s three-legged stool must be coordinated with one another.)
Once the cost system has been converted to ABC, managers presumably have more ac-curate product cost information to make pricing decisions and to improve operating effi-ciencies. Activity-based management (ABM) is a process whereby business activities areidentified and evaluated for potential streamlining or elimination. Using the ABC costs, eachactivity is evaluated based on those that add value to the product and those that don’t addvalue. Value-enhancing activities are improved while activities that do not enhance value areeliminated. The ABC cost data help managers identify those products to produce, the prof-itable customers to retain, and the value-increasing activities to use in producing the productsor servicing the customer.
Most proponents argue that activity-based costing provides more accurate product cost datafor decision making (decision management). A central tenet of activity-based costing is thatmore accurate product costs are always preferable to less accurate product costs and thataccuracy generally increases with the number of cost drivers.
Adding more cost drivers allows more of the factors that cause overhead to vary (suchas the number of batches, the number of part numbers, or the number of product lines) tobe included in the ABC system. This increases the accuracy of the product cost numbersgenerated by the accounting system and, presumably, better operating, pricing, and resourceutilization decisions result. However, adding additional cost pools and cost drivers for thesepools is not free. Separate cost pools for each cost driver must be developed and data oneach cost driver must be collected. At some point, the cost of adding more cost pools andcost drivers exceeds the benefit, in terms of better decisions resulting from the additionalaccuracy. Hence, it is unlikely that the ABC system ever achieves 100 percent accuracy. Thesolid curve in Figure 11–4 depicts the net benefits (benefits less costs) as a function of thenumber of cost drivers. Up to N* cost drivers, the net benefits are increasing. But beyondN*, the net benefits decline.
So far, the analysis has focused exclusively on how the costs and benefits of deci-sion making vary with the number of cost drivers. Now let us introduce decision con-trol. As more cost drivers are introduced, lower-level managers have more discretionover the allocation bases chosen as the “cost drivers” because they usually have spe-cialized knowledge of the factors driving costs in their departments. Increasing thenumber of cost drivers means giving more discretion over the cost system to the man-agers whose performance is being measured by these systems. Increasing the discretionof managers being evaluated by the cost system usually reduces the ability of the systemto monitor their behavior.
The costs of ABC systems include both the direct costs of collecting and reporting dataon the activity levels and the costs incurred from the loss of control arising from less ef-fective monitoring of managers because these managers have more discretion in choosing
2. Benefits andCosts of Activity-Based Costing
Criticisms of Absorption Cost Systems: Inaccurate Product Costs 519
zim36725_ch11_501-553.qxd 12/15/09 2:17 PM Page 519

the cost drivers. Some of this discretion will be exercised opportunistically by these man-agers to manipulate their performance measures. When this second set of costs is included,the net benefits curve is lower and the optimum number of cost drivers, becomes N** inFigure 11–4.
The dashed line in Figure 11–4 suggests that fewer cost drivers, or even inaccurate prod-uct costs, can be desirable. More accurate product cost knowledge is undesirable if it leads topoorer decision control. For example, some firms prefer to bias their costs upward to preventthe sales force from shaving margins by setting prices so low that they cover only variablecosts.5 This is partly a problem with the performance reward system and partly a problemwith how product costs are measured. Nonetheless, some managers are reluctant to reportlower product costs for decision control reasons.
Other companies systematically understate product costs, as in targeting costing, which isdescribed more fully in Chapter 12. Many Japanese firms, in particular, set cost targets basedon what the item should cost in order for the firm to compete. Such target costs are well be-low the costs that the firm can currently achieve. However, low target costs encourage inno-vation and cost improvement. Other incentive-control reasons can cause firms to choose lessaccurate cost systems. Zytec simplified its cost system to just one cost driver: time to man-ufacture the product (cycle time). While such a system produces less accurate product coststhan multiple-cost-driver ABC systems, senior management wanted to focus employee at-tention on what it believed was the single most important cost reduction factor in the firm.
Finally, recall the discussion in Chapter 1 that accounting costs are not necessarily op-portunity costs. Accounting costs are based on the historical cost of past resource acquisi-tion. In particular, accounting depreciation is the periodic write-off of fixed assets acquiredin prior periods. ABC provides an alternative allocation of these historical costs. ABC doesnot allocate opportunity costs. To the extent that these historical costs are reasonableapproximations of opportunity cost, then ABC can improve decision making. However, tothe extent that product costs contain significant amounts of accounting depreciation and theaccounting depreciation grossly misstates the opportunity cost of the capacity, then ABC is
520 Chapter 11
Number of Cost Drivers (Allocation Bases)
Net benefits (decision making only)
Net benefits (decision making and control)
N** N*
$
FIGURE 11–4
Net benefits versusnumber of costdrivers (decisionmaking only anddecision makingand control)
5 K Merchant and M Shields, “When and Why to Measure Costs Less Accurately to Improve DecisionMaking,” Accounting Horizons, June 1993, pp. 76–81.
zim36725_ch11_501-553.qxd 12/15/09 2:17 PM Page 520

no more an accurate estimate of opportunity cost than traditional absorption costing meth-ods. Consider another example. The firm produces a variety of products at a plant site whereit owns the building and land. Accounting depreciation on the building is included in bothABC and traditional absorption costing. However, both systems ignore the opportunity costof the land. If this land is very valuable, both product costing methods understate the op-portunity cost of the products produced at this site.
Hence, an inherent contradiction exists in ABC. ABC is promoted as better for decisionmaking. But decision making requires opportunity costs, not historical costs. However, ABCdoes not measure opportunity costs. It offers a different way to allocate historical cost, whichmay or may not be useful for decision making. Remember the old adage in computer sciencecalled “GIGO” or “garbage in, garbage out.” ABC’s ability to represent opportunity cost isonly as good historical cost (that is being reallocated) is at capturing opportunity cost.
Suppose a firm produces a single product in its only plant. Such a firm is not likely to useABC because all the indirect costs are being incurred to support this single product. Thereis no need to allocate these indirect costs across multiple products. As we have seen, prod-uct costing becomes more challenging in multiproduct plants that produce a variety of low-and high-volume products that place differential demands on the plant’s common resources(purchasing, setup, engineering, etc.). Presumably, ABC provides a more accurate repre-sentation of how each product consumes common factory resources. However, ABC doesnot capture the benefits of producing and selling multiple products.
As discussed in Chapter 4, firms sell multiple products if they can do so more eco-nomically than separate single-product firms. Multiproduct plants can be low-cost pro-ducers due to demand- or supply-side synergies. For example, because product qualityinformation is expensive for consumers to acquire, firms develop brand-name capital thatallows them to offer broad product lines. Toyota can introduce and sell a new small sportsutility vehicle (SUV) at lower cost than can a new start-up company because the market-place already knows the Toyota name and its overall quality reputation. A start-up companywould need to invest billions of dollars to assure the consumer of its SUV’s quality.
Another example of a demand-side benefit of being a multiproduct firm is offeringconsumers one-stop shopping. Catalog companies such as L.L. Bean include many cloth-ing items, often arranged in outfits that allow the consumer to order matching pants, shirt,and sweater. This reduces consumers’ transaction costs of assembling a coordinated outfit.
3. ABC MeasuresCosts, NotBenefits
Criticisms of Absorption Cost Systems: Inaccurate Product Costs 521
ManagerialApplication:The Costs ofABC Exceedthe Benefits atan AgilentTechnologiesPlant
Many Agilent Technologies plants have successfully implemented ABC, but not theColorado Springs Division. This division produced test and measurement equipment.Two finance and four information technology personnel spent one and one-half yearshelping the division design and implement the ABC system. Wages, benefits, occupancycosts, and depreciation were largely fixed and composed 85 percent of total costs. Bytreating these costs as though they were largely variable, the ABC system was not usefulin managing short-term cost fluctuations. The ABC system had numerous cost drivers,one for just about every activity in a process. In pursuit of accurate costs for extremelyheterogeneous products, the system became unwieldy trying to explain the monthlyvariance reports. Employees constantly tweaking the driver rates created an administrative“nightmare” for the accounting system. Finally, the division simplified the accountingsystem by allocating overhead using material dollars, thereby eliminating two people inthe cost accounting function.
SOURCE: S Landry, L Wood, and T Linquist, “Can ABC Bring Mixed Results?” Management Accounting, March 1997,pp. 28–33; www.Agilent.com.
zim36725_ch11_501-553.qxd 12/15/09 2:17 PM Page 521

On the supply side, producing multiple products in the same plant allows the firm tocapture economies of scope, learning curve effects, or smoothing production over time. Forexample, some tire companies produce both snow tires and all-weather tires in the sameplant, since separate plants would be too small to provide low-cost production. Or, if oneplant produced only snow tires, they would have to be inventoried during spring andsummer until they could be sold in fall and winter.
Although ABC systems capture how different products consume resources, they areunable to capture the joint benefits of having multiple products. For example, an ABCanalysis might demonstrate that producing a particular sunglasses model has an ABC costgreater than its price. However, if this sunglasses model is worn by movie stars (whichincreases the sales of the firm’s other sunglasses models), then this “loss leader” providessignificant brand-name marketing benefits.
Likewise, suppose a new product allows the firm to smooth production and utilizeexcess capacity. An ABC analysis might still show this product is unprofitable. Suppose anengineering department requires five engineers to support peak production, which occursover nine months. In the three months that are off peak, two engineers could be let go, butbecause it is too expensive to recruit and train new engineers, they are retained. A newproduct is added to utilize the two engineers and other excess capacity in the off-peakperiod. Three or four years after this product is added, it is unlikely that anyone rememberswhy the product was added to the plant. Hence, an ABC analysis probably charges this newproduct the full cost of the two engineers, which could cause the firm to drop the product.Adding the new product did not increase the number of engineers. The plant had two “extra”engineers in the off-peak period to staff the peak period.
Finally, recall the discussion of joint costs in Chapter 8, which described the futility ofallocating joint costs to joint products. All joint cost allocation schemes, other than netrealizable value, distort product costs for decision making. If the cost of the chicken isallocated to the wings based on weight, the cost of wings is distorted. Wings might bedropped even though they provide incremental net cash flow. Analogously, multiple prod-ucts can yield joint benefits from the demand or supply side. ABC, like all cost allocation
522 Chapter 11
ManagerialApplication:ABC Can BeCostly
A large aerospace company has a centralized procurement department that purchasesparts and material for three product lines. Direct labor dollars and material dollars wereused to allocate procurement costs to the three product lines. However, procurement pro-cessing time was the same whether purchase orders were for higher quantities and moreexpensive parts or for single parts and low dollar parts. After an extensive survey, pur-chase order line items was selected as the best cost driver of procurement time. Pro-curement costs were reassigned using purchase order line items.
Overall reaction to the ABC system was quite negative. The finance group felt thatthe new system was too complicated and would require additional work to forecast thecost drivers. Procurement had misgivings because the cost per purchase order line itemseemed expensive. The product line managers objected. The government contractagency, which audited the contracts for product lines sold to the government, was over-whelmed by the complexity of the system—as were other users of the cost data.
The original ABC system was modified and simplified. Instead of using purchaseorder line items, head count in the procurement department assigned to each productline was used to allocate procurement costs.
SOURCE: D Pattison and C Arendt, “Activity-Based Costing: It Doesn’t Work All the Time,” Management Accounting,April 1994, pp. 55–61.
zim36725_ch11_501-553.qxd 12/15/09 2:17 PM Page 522
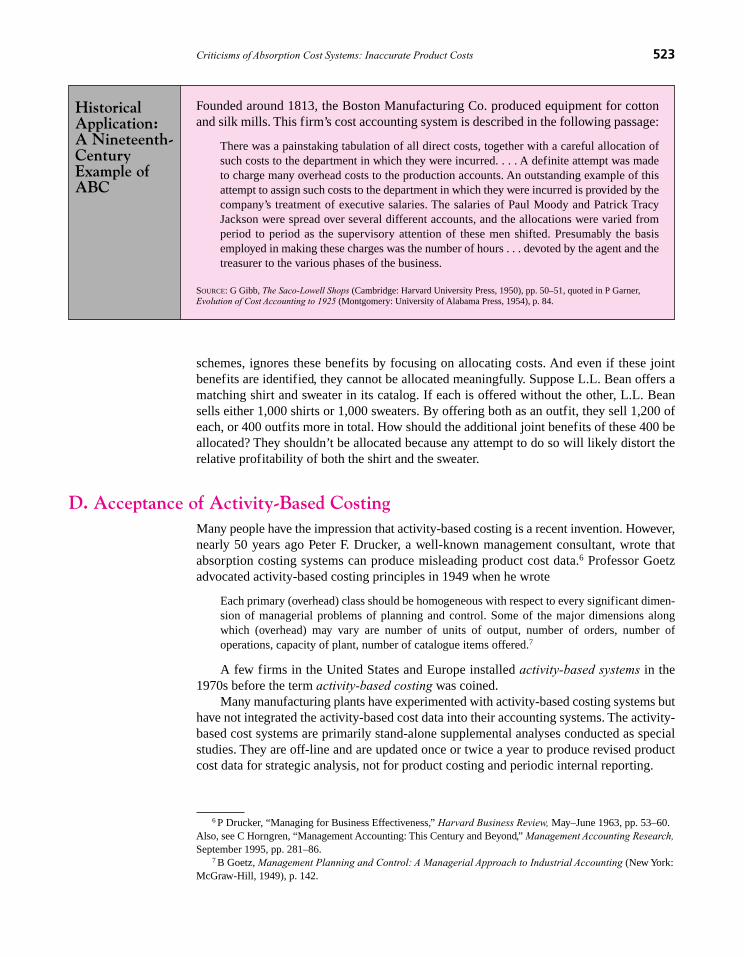
schemes, ignores these benefits by focusing on allocating costs. And even if these jointbenefits are identified, they cannot be allocated meaningfully. Suppose L.L. Bean offers amatching shirt and sweater in its catalog. If each is offered without the other, L.L. Beansells either 1,000 shirts or 1,000 sweaters. By offering both as an outfit, they sell 1,200 ofeach, or 400 outfits more in total. How should the additional joint benefits of these 400 beallocated? They shouldn’t be allocated because any attempt to do so will likely distort therelative profitability of both the shirt and the sweater.
D. Acceptance of Activity-Based CostingMany people have the impression that activity-based costing is a recent invention. However,nearly 50 years ago Peter F. Drucker, a well-known management consultant, wrote thatabsorption costing systems can produce misleading product cost data.6 Professor Goetzadvocated activity-based costing principles in 1949 when he wrote
Each primary (overhead) class should be homogeneous with respect to every significant dimen-sion of managerial problems of planning and control. Some of the major dimensions alongwhich (overhead) may vary are number of units of output, number of orders, number ofoperations, capacity of plant, number of catalogue items offered.7
A few firms in the United States and Europe installed activity-based systems in the1970s before the term activity-based costing was coined.
Many manufacturing plants have experimented with activity-based costing systems buthave not integrated the activity-based cost data into their accounting systems. The activity-based cost systems are primarily stand-alone supplemental analyses conducted as specialstudies. They are off-line and are updated once or twice a year to produce revised productcost data for strategic analysis, not for product costing and periodic internal reporting.
Criticisms of Absorption Cost Systems: Inaccurate Product Costs 523
6 P Drucker, “Managing for Business Effectiveness,” Harvard Business Review, May–June 1963, pp. 53–60.Also, see C Horngren, “Management Accounting: This Century and Beyond,” Management Accounting Research,September 1995, pp. 281–86.
7 B Goetz, Management Planning and Control: A Managerial Approach to Industrial Accounting (New York:McGraw-Hill, 1949), p. 142.
HistoricalApplication:A Nineteenth-CenturyExample ofABC
Founded around 1813, the Boston Manufacturing Co. produced equipment for cottonand silk mills. This firm’s cost accounting system is described in the following passage:
There was a painstaking tabulation of all direct costs, together with a careful allocation ofsuch costs to the department in which they were incurred. . . . A definite attempt was madeto charge many overhead costs to the production accounts. An outstanding example of thisattempt to assign such costs to the department in which they were incurred is provided by thecompany’s treatment of executive salaries. The salaries of Paul Moody and Patrick TracyJackson were spread over several different accounts, and the allocations were varied fromperiod to period as the supervisory attention of these men shifted. Presumably the basisemployed in making these charges was the number of hours . . . devoted by the agent and thetreasurer to the various phases of the business.
SOURCE: G Gibb, The Saco-Lowell Shops (Cambridge: Harvard University Press, 1950), pp. 50–51, quoted in P Garner,Evolution of Cost Accounting to 1925 (Montgomery: University of Alabama Press, 1954), p. 84.
zim36725_ch11_501-553.qxd 12/15/09 2:17 PM Page 523

Most firms adopting ABC use it for decision making outside the accounting function.In one article, the authors conjecture: “Thousands of companies have adopted or exploredthe feasibility of adopting ABC. However, we estimate that no more than 10 percent ofthem now use activity-based management in a significant number of operations. The other90 percent have given up, or their programs are stagnating or floundering.”8 The evidencesuggests that firms implementing ABC use it for decision making, not control, becausefirms rarely incorporate the ABC cost allocation bases into their financial reporting ofinventories and cost of goods sold.
Two studies conducted by consulting firms report that as many as 60 percent of allU.S. organizations have attempted to implement ABC, but only 20 percent have sustainedit. Eight percent continue to use traditional absorption costing methods.9 A U.K. surveyreports that 17.5 percent of the U.K.’s largest firms use ABC and 15.3 percent rejected ABCafter assessing it. Of those firms using ABC, half of them use it in only a few applicableparts of their organization.10 A survey of 2,800 large U.S. firms found that extensive ABCuse is associated with higher quality levels and operating efficiency. However, extensiveABC use had no significant association with return on assets. But since firms adoptingABC also had made other changes, such as new performance measurement systems, qual-ity improvement programs, and just-in-time production methods, one cannot conclude thatABC caused the higher quality and operating efficiencies.11
Several problems exist in implementing ABC.12 First, to implement ABC, cost analystsuse interviews, time logs, and direct observation of the time people spend on various activ-ities to estimate the resource expenses assigned to an activity. Interviewing and surveyingemployees to get their time allocations is time-consuming and costly. One money centerbank required 70,000 employees at over 100 facilities to submit monthly surveys of theirtime. The bank had 14 full-time people managing the ABC data collection and processing.The high cost to maintain the ABC model has caused many firms to update the informationinfrequently, leading to out-of-date activity cost driver rates and inaccurate estimates ofproduct and customer costs. Consequently, most ABC models are often not maintained,their cost estimates soon become obsolete, and the firm abandons ABC.
A second problem involves the complexity of many ABC systems. To generate accu-rate ABC cost estimates, more cost drivers are added to capture the underlying complexityof the various processes performed by the firm. This dramatically increases the demandson the computer model used to store and calculate the cost estimates. One company uses 150activities in its ABC model to cost 600,000 cost objects (products and customers); runningthe model monthly requires data estimates, calculations, and storage for more than 2 billionitems. The company’s computer systems often take days to process one month’s data.
The third problem encountered in ABC is the increased ability of employees andmanagers to game the numbers. To the extent that ABC numbers are used to evaluateperformance or decide which processes or products to outsource, employee welfare isaffected. ABC requires people to estimate how they spend their time and identify specificcost drivers. These are inherently subjective estimates that are difficult to verify objectivelyand can lead to inaccurate estimates of activity-based costs. ABC’s inherent subjectivitymakes it susceptible to gaming and hence lowers its value in decision control.
524 Chapter 11
8 J Ness and T Cucuzza, “Tapping the Full Potential of ABC,” Harvard Business Review, July–August 1995.9 P Sharman, “The Case for Management Accounting,” Strategic Finance, October 2003, pp. 43–47.
10 J Innes, F Mitchell, and D Sinclair, “Activity-Based Costing in the U.K.’s Largest Companies,”Management Accounting Research, 2000, pp. 349–62.
11 C Ittner, W Lanen, and D Larcker, “The Association between Activity-Based Costing and ManufacturingPerformance,” Journal of Accounting Research 40 (June 2002), pp. 711–26.
12 The first two problems are described in Kaplan and Anderson (2007).
zim36725_ch11_501-553.qxd 12/15/09 2:17 PM Page 524

Criticisms of Absorption Cost Systems: Inaccurate Product Costs 525
ManagerialApplication:Time-DrivenActivity-BasedCosting: OldWine in NewBottles
To repair major criticisms of ABC, Robert S. Kaplan and others are promoting “time-driven ABC” as a new and innovative methodology. Under time-driven ABC, firms esti-mate the time required to perform an activity and the cost per unit of time. If resourceconsumption is not time based, but rather volume based (e.g., a distribution center), thecost is allocated via the volume consumed (e.g., cost per cubic foot). Time-based ABCcomputes activity costs at planned capacity and any unused capacity creates a “cost vari-ance” that is not allocated to individual products.
While time-driven ABC has been promoted as simpler, less expensive, less subjec-tive, and more powerful than traditional ABC implementations, it has been criticizedalong the following lines:
1. Time-based ABC is not new. Time- or event-driven ABC has existed in variousforms for decades.
2. Traditional ABC includes the cost of unused capacity, whereas time-driven ABCexcludes unused capacity costs in computing individual product costs. Firms usetheir cost system for a variety of purposes, including taxes. Tracking and identi-fying unused capacity, and how this capacity should be incorporated into reportedcosts, varies from firm to firm. Obviously, whether unused capacity should orshould not be included in product costs depends on each firm’s particular circums-tances, and one-size-fits-all mandates likely are wrong for some firms.
3. The time-driven ABC model is not easier to develop and maintain. ABC, time-driven ABC, and other costing methodologies are prone to error. All costingmethods require updating as processes and costs change. Both ABC methodsrequire resurveying activity costs every time underlying processes, products,and services change.
4. Time-driven ABC does not drive faster, better business decisions. Time-drivenABC focuses on time standards to the exclusion of other cost factors. Focusingon time standards can direct too much attention to reducing the duration andweight of time in the activity cost driver, instead of investigating other, moreeffective cost reduction factors. One manufacturer using time-driven ABC toidentify cost-cutting opportunities spent a lot of time reducing the time standardbefore redesigning the product.
SOURCE: T Adkin, “Five Myths about Time-Driven Activity-Based Costing: The Straight Facts about Traditional and Time-Driven Costing Methodologies,” SASCOM Magazine, 2nd Quarter 2008, www.sas.com/news/sascom/2008q2/feature_abc.html.
Few calls for activity-based costing are based on decision control reasons. The trade-off between decision management and decision control described in Chapter 1 helps topredict some of the observed tendencies:
1. Proponents of activity-based costing are operating managers who want betterinformation for decision making.
2. Most ABC systems are stand-alone off-line systems. Firms are reluctantto change accounting systems, which are primarily for decision control.
3. Most of the resistance to ABC comes from corporate management and the account-ing staff. ABC systems tend to sacrifice decision control for decision management,thereby reducing the usefulness of accounting numbers for decision control.
Activity-based costing systems are most often adopted in plants producing multipleproducts, where product diversity is large, fixed factory overheads are a large fraction of
zim36725_ch11_501-553.qxd 12/15/09 2:17 PM Page 525

526 Chapter 11
product costs, and there is increased pressure from competitors. Product diversity can arisebecause of different production volumes (some products run in large numbers and others insmall volumes) or the products’complexity (some products are simple and others complicatedto manufacture). Simple unit-based cost drivers cannot capture the diversity of plants withdifferent product volumes or manufacturing complexities. If fixed factory overhead is asmall fraction of total product cost, reallocating a small cost pool using more accurate costdrivers does not cause individual product costs to vary. Finally, firms facing little competi-tion are able to price their products above cost, so that inaccurate average unit costs are notas critical as when competition is driving prices down to or even below average cost.Activity-based costing systems will not be adopted everywhere, and the value of ABC isnot the same across all plants.
While much has been written about the benefits of activity-based costing for decisionmanagement, few proponents have gone back to companies that experimented with it tofollow up on the outcomes and understand why the ABC systems were not fully imple-mented. In one firm, activity-based costing was implemented and abandoned after a year.The controller explained that under the old system, with just a few cost drivers, everyoneunderstood the weaknesses of the system and accepted its faults. With the new system,managers were constantly arguing over the appropriate cost drivers, because switching costdrivers changed product costs and the managers’ performance measures. Real resourceswere being dissipated debating the merits of particular cost drivers. To stop the bickering,the controller abandoned ABC.
Many firms have redesigned their products and production processes, thereby con-verting formerly indirect costs into direct costs. These companies set up machines morerapidly. Faster setups mean more setups. These plants have fewer workers associatedwith overhead costs such as moving, storing, inspecting, and expediting. Production ismore of a continuous flow process, eliminating the need for work to stop, start, andwait. With less common costs, activity-based systems are far less valuable. More of thecost is directly traceable to the products. When a high fraction of the total cost of theproduction process is directly traceable to the products, product costs are more accurate.In addition, when multiple products are produced, firms design cost centers around
ManagerialApplication:SimplifyOperationsversus ABC
A small family-owned manufacturing company formed a team of 15 employees toimplement ABC. Two years of study and $200,000 later, the committee discovered thatlow-volume products cause more overhead than high-volume products. However, beforefully implementing ABC, this company was bought by Illinois Tool Works, which had adifferent strategy in mind. Instead of trying to come up with better cost allocations, ITWdecided to simplify and eliminate nonvalue-added activities. Instead of implementingABC, ITW converted the plant to just-in-time (JIT) production, redesigned its productionprocesses, eliminated certain overhead costs, converted indirect costs into direct costs,and dropped low-volume products. The switch to JIT eliminated most setups. The plantadopted a flatter organizational structure by decentralizing more decision-making au-thority to lower levels and eliminating some levels. The plant now uses direct costing andhas eliminated most arbitrary cost allocations. The profitability of the plant has improved.
SOURCE: L Tatikonda, D O’Brien, and R Tatikonda, “Succeeding with 80/20,” Management Accounting, February 1999,pp. 40–44; www.ITW.com.
zim36725_ch11_501-553.qxd 12/15/09 2:17 PM Page 526

Criticisms of Absorption Cost Systems: Inaccurate Product Costs 527
product lines rather than by functions. Costs are then reported by product line, whichavoids allocating costs to individual products within the product line. Activity-basedcosting systems in these settings add little value over simpler traditional absorptioncosting systems.13
Q11–5 What are two purposes for implementing activity-basedcosting?
Q11–6 What are some advantages of activity-based costing systems?
Q11–7 What problems are associated with tracking historical costs?
Q11–8 How does the trade-off between decision management anddecision control affect the form that an absorption costsystem takes within a particular firm?
Q11–9 Under unit-based absorption costing systems, are high- orlow-volume products overcosted? Why?
E. SummaryThis chapter discusses the second of two major criticisms of traditional absorption costing sys-tems: They can, in some circumstances, produce misleading or inaccurate estimates of productcosts. Inaccurate estimates of product costs become especially serious in multiproduct plantsproducing both high- and low-volume products or where products vary in their complexity. Tra-ditional absorption cost systems typically allocate overhead using unit-level allocation bases,such as direct labor or direct materials. However, overhead costs also vary with the number ofbatches, number of customers, and the number of product lines. Products using relatively greaterproportions of batch and product-line costs will be undercosted if unit-level allocation bases arechosen.
Activity-based costing (ABC) attempts to provide more accurate estimates of the resourcesconsumed by the various products manufactured. ABC systems presumably generate more accurateproduct costs by identifying what drives individual indirect cost pools. Overhead costs are groupedinto activity centers (cost pools), and specific overhead cost drivers are chosen that best capture costconsumption in that activity center. These activity-center-specific cost drivers are used to allocate thecosts in the activity center to the products using that activity center.
The primary advantage of ABC systems is more accurate product costs that aid in decisionmaking. However, these activity-based systems are costly to design and implement. They can beprone to gaming by constantly revising the cost pools or cost drivers. Moreover, ABC costs do notcapture any customer-side synergies from producing a variety of products. ABC might better reflectproduct costs, but not product “benefits” that arise from lowering customer transaction costs when acustomer purchases several different products. Finally, ABC systems do not measure opportunitycosts. These systems, like traditional absorption costing, allocate historical costs of plant andequipment (and not land costs) to the products.
Numerous firms have experimented with activity-based costing systems. Yet a minority haveadopted ABC and changed their performance evaluation systems to incorporate the new cost system.
ConceptQuestions
13 See M Sakurai, “The Influence of Factory Automation on Management Accounting Practices: A Studyof Japanese Companies,” in Measuring Manufacturing Performance, ed. R Kaplan (Boston: Harvard BusinessSchool, 1989). “Japanese managers and academics actually prefer simple methods for allocating overhead tothe more complex activity accounting allocation methods advocated by several U.S. academics” (p. 43).
zim36725_ch11_501-553.qxd 12/15/09 2:17 PM Page 527

528 Chapter 11
Self-Study ProblemKiddo Inc. (B)
(For the basic data, refer to Chapter 10 self-study problem Kiddo Inc. [A].) Further analysis ofKiddo’s production process has allowed it to allocate costs using activity-based costing. Engineeringcosts, rework expenses, and equipment maintenance and depreciation were estimated for eachproduction line. Product-line costs for the Runner and Pump sneakers are $5 million and $12 million,respectively. Setup costs for each batch are $2,500. The batch size for the Runner is 1,000 pairs ofsneakers. The batch size for the Pump in year 1 is 500 pairs and 600 pairs for year 2. Remaining fixedoverhead costs total $5,150,000 and were allocated based on direct labor cost.
Required:
a. Prepare a revised income statement for each year using activity-based costing.
b. Explain changes in the net profit between the original cost allocation system and activity-based costing.
Solution:
a. Here are income statements for years 1 and 2 under activity-based costing:
Year 1
Runner Pump Total
Revenue $160,000,000 $110,400,000 $270,400,000Expenses:
Material 70,000,000 42,600,000 112,600,000Labor 23,000,000 12,000,000 35,000,000Variable overhead 33,000,000 17,520,000 50,520,000
Gross margin $ 34,000,000 $ 38,280,000 $ 72,280,000Batch costs* 12,500,000 12,000,000 24,500,000Product-line costs† 4,863,813 9,600,000 14,463,813Fixed overhead‡ 3,065,159 1,599,213 4,664,372
Net profit $ 13,571,028 $ 15,080,787 $ 28,651,815
Runner Pump Total
*Batch CostsCost per batch $ 2,500 $ 2,500� Units sold 5,000,000 2,400,000� Units per batch 1,000 500
Allocated batch costs $12,500,000 $12,000,000
†Product-Line Costs
Total product-line costs $ 5,000,000 $12,000,000� Units produced 5,140,000 3,000,000� Units sold 5,000,000 2,400,000
Allocated line costs $ 4,863,813 $ 9,600,000
‡Fixed Overhead CostsRemaining fixed overhead $ 5,150,000Units produced 5,140,000 3,000,000� Direct labor per pair $4.60 $5.00
Total labor cost $23,644,000 $15,000,000 $38,644,000Fixed overhead per direct labor $ $ 0.1333Direct labor of units sold $23,000,000 $12,000,000Fixed overhead allocated(� $0.1333) $ 3,065,159 $ 1,599,213
zim36725_ch11_501-553.qxd 12/15/09 2:17 PM Page 528

Criticisms of Absorption Cost Systems: Inaccurate Product Costs 529
Year 2
Runner Pump Total
Revenue $160,000,000 $110,400,000 $270,400,000Expenses:
Material 70,000,000 42,600,000 112,600,000Labor 23,000,000 12,000,000 35,000,000Variable overhead 33,000,000 17,520,000 50,520,000
Gross margin $ 34,000,000 $ 38,280,000 $ 72,280,000Batch costs* 12,500,000 10,000,000 22,500,000Product-line costs† 4,807,692 8,080,808 12,888,500Fixed overhead‡ 2,837,805 1,480,594 4,318,400
Net profit $ 13,854,502 $ 18,718,598 $ 32,573,100
Runner Pump Total
*Batch CostsCost per batch $ 2,500 $ 2,500� Units sold 5,000,000 2,400,000� Units per batch 1,000 600
Allocated batch costs $12,500,000 $10,000,000
†Product-Line CostsTotal product-line costs $ 5,000,000 $12,000,000� Units produced 5,200,000 3,564,000� Units sold 5,000,000 2,400,000
Allocated line costs $ 4,807,692 $ 8,080,808
‡Fixed Overhead CostsRemaining fixed overhead $ 5,150,000Units produced 5,200,000 3,564,000� Direct labor per pair $ 4.60 $ 5.00
Total labor cost $23,920,000 $17,820,000 $41,740,000Fixed overhead per direct labor $ $ 0.1234Direct labor of units sold $23,000,000 $12,000,000Fixed overhead allocated
(� $0.1234) $ 2,837,905 $ 1,480,594
b. Profits are higher in both years 1 and 2 under activity-based costing than under traditionalabsorption costing. Under the original allocation system, profits increase in year 2 sincemore of the fixed overhead was inventoried. Now, the $50 million fixed overhead is split sothat a greater portion goes to the Pump line. Since more of the Pump shoes are inventoriedthan the Runner shoes, more of the overhead is also inventoried. Consider the costs per unitfor the two years under both allocation systems:
Per-Unit Summary Runner Pump
Price $32.00 $46.00Material 14.00 17.75Labor 4.60 5.00Variable overhead 6.60 7.30
Gross margin $ 6.80 $15.95
zim36725_ch11_501-553.qxd 12/15/09 2:17 PM Page 529

530 Chapter 11
Per-Unit Summary Runner Pump
Year 1Absorption costing:
Fixed overhead* $ 5.93 $ 6.45
Net profit $ 0.87 $ 9.50
ABC costing:Gross margin $ 6.80 $15.95Batch costs 2.50 5.00Product-line costs 0.97 4.00Fixed costs 0.61 0.67
Total costs $ 4.08 $ 9.67
Net profit $ 2.72 $ 6.28
Year 2Gross margin $6.80 $15.95Absorption costing:
Fixed overhead 5.51 5.99
Net profit $1.29 $ 9.96
ABC costing:Gross margin $6.80 $15.95Batch costs 2.50 4.17Product-line costs 0.96 3.37Fixed costs 0.57 0.62
Total costs $4.03 $ 8.16
Net profit $2.77 $ 7.79
*From Chapter 10, Kiddo Inc. (A)
For both years under both systems, the direct costs and selling price remain constant, providingmargins of $6.80 and $15.95 for the Runner and the Pump, respectively. The fixed overhead in costof goods sold is divided by number of units sold to calculate fixed overhead per unit for both yearsunder the original system. Under that system, net profits increase from $0.87 to $1.29 per Runner and$9.50 to $9.96 per Pump. When the overhead is divided into product-line and batch costs, the coststructure changes significantly. The Runner’s net profits jump to $2.72 and $2.77 for the two years.Profits on the Pump in turn drop to $6.28 and $7.79.
ProblemsP 11–1: The Maui Seminar
Your boss, the vice president of corporate accounting, has just returned from a two-week seminar inMaui on activity-based cost accounting. He says he wants to completely overhaul the company’sexisting absorption-based accounting system. “Activity-based costing is the wave of the futureand will allow us to make better product-line decisions and therefore be more competitive in themarketplace,” he asserts.
He wants you to start implementation immediately, but he would like your comments before youbegin. How do you respond?SOURCE: L McGinn.
zim36725_ch11_501-553.qxd 12/15/09 2:17 PM Page 530

Criticisms of Absorption Cost Systems: Inaccurate Product Costs 531
P 11–2: GAMMA
GAMMA produces over a hundred different types of residential water faucets at its Delta, Florida,plant. This plant uses activity-based costing to calculate product costs. The following tablesummarizes the plant’s overhead for the year and the cost drivers used for each activity center:
Summary of Plant Overhead and Activity Centers
TotalCost Amount Activity Cost
(Millions of Cost per Unit ofActivity Center of Dollars) Cost Driver Driver Cost Driver
Materials handling $20.8 Direct materials $130 million $0.16Purchasing 13.8 Part numbers 800 $17,250Set-up labor 6.8 Batches 500 $13,600Engineering 10.9 Number of products 125 $87,200Occupancy 16.2 Direct labor $90 million $0.18
Total plant overhead $68.5
One faucet model GAMMA manufactures is Explorer. Its total product cost is as follows:
Direct labor $121,700Direct materials 90,500Materials handling $90,500 $0.16 14,480Purchasing 9 17,250 155,250Setup 8 13,600 108,800Engineering 1 87,200 87,200Occupancy $121,700 $0.18 21,906
Total cost $599,836Number of units manufactured 12,500
Product cost per unit $ 47.99
Required:
Calculate the product cost per unit of the Explorer faucet using absorption costing where plantoverhead is assigned to products using direct labor dollars.
P 11–3: ABC and Volume Changes
Required:
a. What differentiates unit-level costs, batch-level costs, product-line costs, and capacity-sustaining costs? Give examples.
b. “One advantage of an activity-based cost system is that it prevents unit costs from risingwhen volumes fall and unit costs from falling as volumes rise.” True or false? Discuss why.
P 11–4: Milan Pasta
At its Lyle Avenue plant, Milan Pasta produces two types of pasta: spaghetti and fettuccine. Thetwo pastas are produced on the same machines, with different settings and slightly different rawmaterials. The fettuccine, being a wider noodle and more susceptible to curling edges, requires
zim36725_ch11_501-553.qxd 12/15/09 2:17 PM Page 531

532 Chapter 11
more inspection time. The total daily cost of inspection is $500. Here are daily production data forthe two products:
Spaghetti Fettuccine
Pounds produced 6,000 2,000Machine minutes per pound 0.20 0.40Inspection hours per product line 8 24
Required:
a. Calculate the inspection cost per pound of pasta using traditional absorption costing withnumber of machine hours as the allocation base.
b. Calculate the inspection cost per pound of pasta using activity-based costing. Assumeinspection time is the cost driver.
c. Analyze why inspection costs differ between the methods used in (a) and (b).
P 11–5: Implementing ABC
Critically discuss the following quotation:
ABC (activity-based cost) information, by itself, does not invoke actions and decisions leadingto improved profits and operating performance. . . . For ABC systems to be effective, everyonein the company—from top management to operating personnel—must view them as costmanagement tools rather than as accounting tools. To achieve this objective, the accounting orfinance department must relinquish ownership of these systems to the users. If accounting orfinance fails to understand this key point, then ABC is unlikely to succeed. . . . While traditionalsystems are the property of accounting and are used to support the financial accounting process,successful ABC systems are owned by the functions and are designed to support the needs ofcost management, not financial accounting. The result is a reduction in the role of accounting inthe management of costs. [M]ost companies that implement ABC systems run them in parallelto their financial accounting systems. Parallel systems remove the risk of compromising the costmanagement capabilities of ABC to accommodate financial accounting rules and regulations.14
P 11–6: Astin Car Stereos
Astin Car Stereos manufactures and distributes four different car stereos. The accompanying tablesummarizes the unit sales, selling prices, and manufacturing costs of each stereo.
ASTIN CAR STEREOSSummary of Operations
Current Fiscal Year
A90 B200 B300 Z7
Sales price $100 $120 $140 $180Manufacturing cost (all variable) $80 $90 $100 $120Units sold 15,000 13,000 12,000 9,000
Selling and distribution (S&D) expenses are $1,270,000. They are treated as a period cost andwritten off to the income statement. To assess the relative profitability of each product, S&Dexpenses are allocated to each product based on sales revenue.
Upon further investigation of the S&D expenses, half are shown to be for marketing and adver-tising. Each product has its own advertising and marketing budget, administered by one of four
14 R Cooper, “Look Out, Management Accountants,” Management Accounting, May 1996, pp. 20–21.
zim36725_ch11_501-553.qxd 12/16/09 10:02 AM Page 532

Criticisms of Absorption Cost Systems: Inaccurate Product Costs 533
marketing managers. Z7, the premier product, is advertised heavily. Forty percent of the marketing andadvertising budget goes toward Z7, 30 percent to B300, 20 percent to B200, and 10 percent to A90.
The remaining S&D expenses consist of distribution and administration costs (25 percent) andselling costs (25 percent). The distribution and administration department is responsible for arrangingshipping and for billing the customers. (Customers pay transportation charges directly to the commoncarrier.) It also handles federal licensing of the car radios. Upon analysis, each product line places equaldemands on the distribution and administration department and each consumes about the same re-sources as the others. Selling costs consist primarily of commissions paid to independent salespeople.The commissions are based on gross margin on the product (sales revenue less manufacturing cost).
Required:
a. Allocate all S&D expenses based only on sales revenue. Identify the most and leastprofitable products.
b. Allocate all S&D expenses based only on the advertising and marketing budget. Identifythe most and least profitable products.
c. Allocate all S&D expenses. Use the advertising and marketing budget for advertisingand marketing costs, the demand for these resources by product for distribution andadministration costs, and commissions for selling costs. Identify the most and leastprofitable products.
d. Discuss the managerial implications of the various schemes. Why do the different schemesresult in different product-line profits? Which product is really the most profitable? Theleast profitable?
P 11–7: DVDS
DVDS manufactures and sells DVD players in two countries. It manufactures two models—Basic andCustom—in the same plant. The Basic DVD has fewer options and provides lower-quality output thanthe Custom DVD. The basic model is sold only in a developing country and the custom model is soldonly in a developed country. DVDS pays income taxes to the country where the final sale of the DVDplayer takes place. The following table summarizes DVDS operations.
DVDSSummary of Operations
Current Year
Basic Custom
Quantity produced and sold 60,000 70,000Price $75 $140Direct labor�unit $15 $30Direct materials�unit $40 $80Income tax rate 15% 35%
Besides direct materials and direct labor, manufacturing overhead amounts to $2 million and iscurrently assigned to products based on direct labor dollars. Manufacturing overhead is a fixed cost(does not vary with the number of units produced).
Required:
a. Calculate the unit manufacturing costs of the Basic and Custom DVD models usingtraditional absorption costing. Manufacturing overhead is allocated based on direct labordollars.
b. DVDS hires a consulting firm to analyze its costing methods. After performing anextensive review, the consultants determine that the vast majority of the $2 million ofoverhead varies with the number of different parts in the two DVD models. The number of
zim36725_ch11_501-553.qxd 12/15/09 2:17 PM Page 533

534 Chapter 11
parts drives purchasing department activities. More engineering time is spent on the morecomplex Custom DVD models. More accounting depreciation of assembly and testingequipment is incurred producing the Custom DVD model than the Basic DVD model. TheBasic DVD has 140 different parts and the Custom DVD model has 160 different parts.Calculate the unit manufacturing costs of the Basic and Custom DVD models usingactivity-based costing.
c. Should DVDS change its costing methodology from its traditional absorption costing toABC? Explain why it should or should not.
P 11–8: True Cost Manufacturing, Inc.
True Cost Manufacturing, Inc., manufactures and sells large business equipment for the office andbusiness markets. The primary function of Manufacturing is to provide components and subassem-blies for the profit centers within the company. To maintain competitiveness, each profit center canpurchase parts either from Manufacturing or from outside firms. Manufacturing operates as a costcenter and charges the profit centers for the full cost of the parts. Costs are computed once a yearusing full absorption costing. The volume of parts used to calculate costs is provided by the profitcenters to Manufacturing in August; the fiscal year begins in January. With these numbers,Manufacturing projects costs per part for the year. These cost estimates are then used throughout theyear to charge the profit centers. Any over/underabsorbed overhead goes directly to the bottom lineof the company, not to any of the profit centers.
Within Manufacturing there is a department called finishing. The finishing department providesa service to other Manufacturing departments and profit centers as well as generating some externalsales. Types of finishing include painting and plating. The facility has large investments in fixed as-sets in both automation and environmental compliance for finishing. The finishing operation believesit provides value to customers through its high quality and its close location to the manufacturingdepartments.
During the past year, the profit centers have begun taking work away from Manufacturing andgiving it to outside vendors with lower quoted costs. Manufacturing then has lower volumes and hasto raise the prices on the products it is producing, causing the profit centers to send even more workout. Manufacturing feels it is caught in a death spiral.
The death spiral situation has affected finishing the most. The finishing department is currentlyoperating at 30 percent of capacity and has facilities that are too large for the low volume of work.Table 1 summarizes the data pertaining to finishing. Fixed costs make up 71 percent of the current coststructure. Other manufacturing departments are beginning to tell finishing that they will be sendingtheir work out to get plating and painting so as not to lose any work because of the high internal costof finishing.
Finishing is trying to attract business from outside True Cost Manufacturing. The external salesguidelines require a 35 percent profit margin applied to the full cost for all external work. With thecurrent low level of work and high fixed costs, finishing cannot attract external sales due to cost.
In an effort to gain control of the true cost drivers of the business, the manager of the finishingoperation has implemented activity-based costing. Tables 2 and 3 project the cost for products andvolumes for one plating operation. The problem that the finishing manager now faces is that the man-ufacturing departments are about to send the 12-inch and 18-inch work to an outside shop due tolower costs.
In implementing activity-based costing, the manager thinks he has truly identified the propersystem. The larger parts tend to run in smaller lot sizes and generate more paperwork. Smaller partstend to be run in larger lot sizes and generate less paperwork.
In a recent meeting with the management of the manufacturing department and profit centers, itwas stated that the installation of activity-based costing is in direct conflict with the change in the mixof work from small parts to large parts and the need to run smaller lot sizes. The manufacturingdepartment and profit centers would like to pursue just-in-time manufacturing and further reduce thelot sizes for both small and large parts. During this meeting, the profit centers and manufacturingdepartments said the implementation of activity-based costing would force them to move their work outof the finishing department to outside shops.
zim36725_ch11_501-553.qxd 12/15/09 2:17 PM Page 534

Required:
a. Analyze the current situation in this company. What should be done?
b. Compare and comment on the costs before and after ABC is implemented.
c. Has finishing management made a mistake by installing activity-based costing?SOURCE: R Bradley, J Buescher, L Campbell, and B Florance.
P 11–9: Friendly Grocer
Friendly Grocer has three departments in its store: beverages, dairy and meats, and canned and pack-aged foods. Each department is headed by a departmental manager. Operating results for the lastmonth (in thousands) are given in the table.
Criticisms of Absorption Cost Systems: Inaccurate Product Costs 535
TABLE 1 Finishing Annual Cost Structure
AnnualCost
Fixed asset depreciation $400,000 $4,000,000 machine purchased 2 years agoTank operations costs 250,000 Cost to operate tanks—fixed cost, not
volume dependentTank material cost 50,000 Cost to operate tanks—$0.007575/inchVariable labor cost 210,000 $10/hour � 21,000 hours of operation
Total $910,000
TABLE 2 Finishing Costs before and after Activity-Based Costing
Volume of Old Cost Activity-Based Cost Outside CostPieces per Year* per Piece per Piece per Piece
3� parts 1,000,000 $0.50 $0.31 $0.306� parts 200,000 1.00 1.00 1.10
12� parts 50,000 1.20 2.00 0.9018� parts 100,000 1.50 3.00 1.20
*This volume of work uses only 30 percent of capacity.
TABLE 3 Forecasted Costs
Old Cost Activity-Based Cost Outside Cost
3� parts $500,000 $310,000 $300,0006� parts 200,000 200,000 220,000
12� parts 60,000 100,000 45,00018� parts 150,000 300,000 120,000
Total per year $910,000 $910,000 $685,000
zim36725_ch11_501-553.qxd 12/15/09 2:17 PM Page 535

536 Chapter 11
Canned andDairy and Packaged
Beverages Meats Foods Total
Sales $250.00 $470.00 $620.00 $1,340.00Direct costs:
Cost of goods sold (COGS) 200.00 329.00 527.00 1,056.00Indirect costs:
SG&A (20% of COGS) 40.00 65.80 105.40 211.20
Operating income $ 10.00 $ 75.20 $ (12.40) $ 72.80
The direct costs consist of the cost of goods sold. Indirect costs consist of selling, general, andadministrative (SG&A) costs and are allocated to each department at the rate of 20 percent of costsof goods sold. Based on the preceding report, beverages had operating income of $10,000, dairy andmeats had operating income of $75,200, and canned and packaged foods lost $12,400.
Senior management is concerned that the allocation of costs might be distorting the relativeprofitability of the three departments. Further analysis of the SG&A account yields the followingbreakdown:
Shelf space costs $ 90.00Handling costs 20.00Coupon costs 15.00Shrinkage 28.00Other indirect costs 58.20
Total $211.20
Shelf space costs consist of store occupancy costs such as depreciation on the building andfixtures, utilities, store maintenance, property taxes, and insurance. Beverages make up 25 percent ofthe shelf space, dairy and meats make up 35 percent of the space, and canned and packaged goodsmake up 40 percent of the shelf space.
Handling costs consist of the labor required to stock the shelves and remove outdated products.The beverage suppliers (Coca-Cola, Pepsi, etc.) provide the labor to shelve their products (i.e., thebeverage delivery people stock their products on the shelf). Dairy and meats’ labor costs for stockingare three-quarters of the handling costs; canned and package foods’ labor and handling costs are one-quarter of the total.
Coupon costs consist of the labor costs to process the redeemed coupons. Dairy and meats donot have any coupons. Twenty percent of the coupons redeemed are for beverages and 80 percent arefor packaged and canned foods.
Shrinkage consists of the cost of products spoiled, broken, and stolen. Shrinkage by productcategory comes to
Beverages $ 1Dairy and meats 21Canned and packaged foods 6
The remaining indirect costs are allocated based on cost of goods sold.
zim36725_ch11_501-553.qxd 12/15/09 2:17 PM Page 536
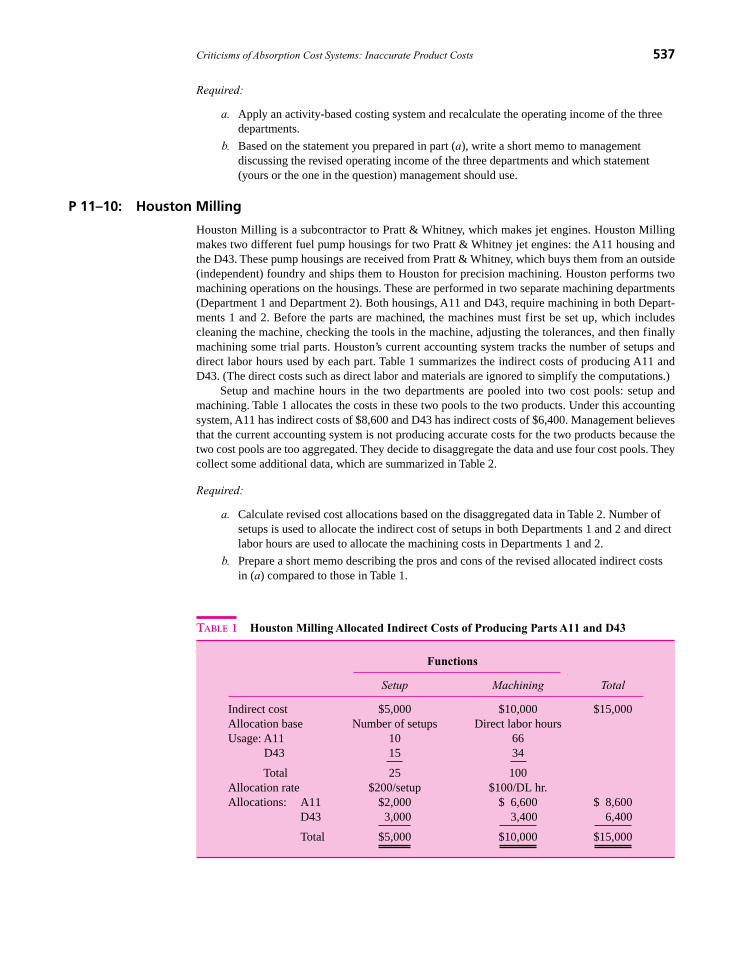
Criticisms of Absorption Cost Systems: Inaccurate Product Costs 537
Required:
a. Apply an activity-based costing system and recalculate the operating income of the threedepartments.
b. Based on the statement you prepared in part (a), write a short memo to managementdiscussing the revised operating income of the three departments and which statement(yours or the one in the question) management should use.
P 11–10: Houston Milling
Houston Milling is a subcontractor to Pratt & Whitney, which makes jet engines. Houston Millingmakes two different fuel pump housings for two Pratt & Whitney jet engines: the A11 housing andthe D43. These pump housings are received from Pratt & Whitney, which buys them from an outside(independent) foundry and ships them to Houston for precision machining. Houston performs twomachining operations on the housings. These are performed in two separate machining departments(Department 1 and Department 2). Both housings, A11 and D43, require machining in both Depart-ments 1 and 2. Before the parts are machined, the machines must first be set up, which includescleaning the machine, checking the tools in the machine, adjusting the tolerances, and then finallymachining some trial parts. Houston’s current accounting system tracks the number of setups anddirect labor hours used by each part. Table 1 summarizes the indirect costs of producing A11 andD43. (The direct costs such as direct labor and materials are ignored to simplify the computations.)
Setup and machine hours in the two departments are pooled into two cost pools: setup andmachining. Table 1 allocates the costs in these two pools to the two products. Under this accountingsystem, A11 has indirect costs of $8,600 and D43 has indirect costs of $6,400. Management believesthat the current accounting system is not producing accurate costs for the two products because thetwo cost pools are too aggregated. They decide to disaggregate the data and use four cost pools. Theycollect some additional data, which are summarized in Table 2.
Required:
a. Calculate revised cost allocations based on the disaggregated data in Table 2. Number ofsetups is used to allocate the indirect cost of setups in both Departments 1 and 2 and directlabor hours are used to allocate the machining costs in Departments 1 and 2.
b. Prepare a short memo describing the pros and cons of the revised allocated indirect costsin (a) compared to those in Table 1.
TABLE 1 Houston Milling Allocated Indirect Costs of Producing Parts A11 and D43
Functions
Setup Machining Total
Indirect cost $5,000 $10,000 $15,000Allocation base Number of setups Direct labor hoursUsage: A11 10 66
D43 15 34
Total 25 100Allocation rate $200/setup $100/DL hr.Allocations: A11 $2,000 $ 6,600 $ 8,600
D43 3,000 3,400 6,400
Total $5,000 $10,000 $15,000
zim36725_ch11_501-553.qxd 12/15/09 2:17 PM Page 537

538 Chapter 11
c. After completing the analysis in (a) and (b), some additional data are collected from aspecial study of setup hours and machine hours in the two departments. These data arepresented in Table 3. In particular, setup hours and machine hours are collected in the twodepartments. Management now believes that setup hours and machine hours moreaccurately reflect the true cause-and-effect relations of setup costs and machining costs inDepartments 1 and 2 than number of setups and direct labor hours, respectively.
Based on the data presented in Table 3, calculate revised cost allocations for A11 andD43. Setup costs in Departments 1 and 2 are to be allocated based on setup hours, andmachining costs in Departments 1 and 2 are to be allocated based on machine hours.
d. Compare the total product costs for A11 and D43 in Table 1 and parts (a) and (c). Whatconclusions can you draw?
P 11–11: Sanchez Gadgets
Sanchez Gadgets purchases innovative home kitchen gadgets from around the world (such as akitchen torch, a pasta maker, and an automatic salad spinner) and sells them to specialty cookingretail stores. Sanchez has a marketing department that locates and purchases the innovative gadgetsand prepares price lists and catalogs for Sanchez’s direct selling force. Sanchez’s salespeople areassigned geographic sales territories and are responsible for all the specialty kitchen stores in theirgeographic territories.
Management at Sanchez is concerned that with over 450 different items it is currently carryingtoo many different SKUs (SKUs are “stock keeping units”). Management is currently looking for amethodology to eliminate unprofitable SKUs. To focus on developing that methodology, assume that
TABLE 2 Houston Milling Disaggregated Cost Pool Data
Setup Machining
Department 1 Department 2 Department 1 Department 2 Total
Total cost $3,000 $2,000 $8,000 $2,000 $15,000Allocation base Number of Number of Direct Direct
setups setups labor hours labor hoursUsage: A11 7 3 32 34
D43 13 2 18 16
Total 20 5 50 50
TABLE 3 Houston Milling Setup Hours and Machine Hours in Departments 1 and 2
Department 1 Department 2
Setup Machining Setup Machining
Total cost $3,000 $8,000 $2,000 $2,000Allocation base Setup hours Machine hours Setup hours Machine hoursUsage: A11 15 115 6 120
D43 15 85 4 80
Total 30 200 10 200
zim36725_ch11_501-553.qxd 12/15/09 2:17 PM Page 538

Criticisms of Absorption Cost Systems: Inaccurate Product Costs 539
Sanchez has just four SKUs: SKU1, SKU2, SKU3, and SKU4. The following data summarize thecurrent sales, selling prices, and cost (purchase price plus freight) for each SKU:
SKU 1 SKU 2 SKU 3 SKU 4
Wholesale price (to retailer) $51.00 $13.00 $85.00 $7.00Cost (including all freight) $29.00 $8.00 $49.00 $5.00Sales volume 12,000 25,000 8,000 30,000
Sanchez purchases items for sale and inventories them. The cost of inventorying each item(including the opportunity cost of financing the item) is 20 percent of the annual cost of the item. Soif 100 units of a gadget are sold each year, and the cost of the item is $4, Sanchez’s inventory holdingcost is $80 (20% � 100 � $4).
The annual cost of the marketing department is $135,000. This amount consists of the salariesand fringe benefits of the employees who purchase the products and prepare the catalogs and pricelists. Management determines that marketing department costs vary with the number of SKUs.
The annual cost of the direct sales force is $350,000. This amount consists of the salaries, fringebenefits, and travel expenses of the salespeople who call on the retail specialty kitchen stores to sellSanchez gadgets. After extensive conversations with the salespeople, management believes that thesalespeople spend their time in proportion to the sales volume of the gadgets. In other words, if aparticular gadget accounts for 10 percent of Sanchez’s total revenue, then the sales force spends about10 percent of its time selling that item.
Required:
a. Design a reporting methodology that identifies possible SKUs that Sanchez shouldconsider dropping from its product mix. Using your methodology, compute theprofitability of each of the four SKUs.
b. Based on your analysis in part (a), which SKUs should Sanchez drop? Which ones shouldSanchez retain?
c. Discuss the critical assumptions underlying your analysis in part (a).
P 11–12: Wedig Diagnostics
Wedig Diagnostics manufactures two laser photometers that are used in preparing DNA tests. TheU.S. model is designed for use in the United States and the EU model is designed to meet the speci-fications in most of the European Union. Both models are manufactured in the United States. The EUmodels are shipped to Wedig’s wholly owned European subsidiary, which sells them. All units man-ufactured are sold. The following table summarizes the selling prices, direct materials and labor, andnumber of units sold.
U.S. Model EU Model
Selling price�unit $2,500 $2,200Direct materials�unit $235 $260Direct labor�unit $560 $500Number of units sold annually 15,000 16,800
The EU units are sold in U.S. dollars. Wedig has total manufacturing overhead of $39 millionannually. This overhead is allocated to both U.S. and EU models using total direct labor dollars.Wedig transfers its EU model to its European subsidiary at full cost (direct materials and labor plus
zim36725_ch11_501-553.qxd 12/15/09 2:17 PM Page 539

540 Chapter 11
allocated overhead). Assume that Wedig pays U.S. taxes only on the profits it makes on sales in theUnited States and the Wedig EU subsidiary pays taxes only on the profits it makes on sales in the EU.The U.S. income tax rate is 30 percent and the Wedig European subsidiary has a tax rate of 15 percent.
Wedig hires a consulting firm to perform an ABC analysis of its overhead costing methodology.This analysis reveals that the $39 million of overhead consists of three cost pools: batch-related costs($12 million), parts-related costs ($9 million), and direct labor-related costs ($18 million). Eachmodel is produced in batches, and batch-related costs consist of engineering, quality control, andmachining costs that vary with the number of batches produced. The U.S. model is produced in45 batches each year and the EU model is produced in 55 batches a year.
The U.S. and EU models differ in terms of the number of different parts in each unit. The U.S.model has 40 different part numbers and the EU model has 80 different part numbers. Parts-relatedcosts consist of the costs of operating the purchasing department (excluding the costs of the partspurchased), inspecting the parts upon arrival, inventorying the parts, and managing the parts inven-tory. Parts-related costs vary with the number of part numbers in each product. Finally, the directlabor-related costs consist of human resources, accounting, and other overhead costs that vary withthe amount of direct labor in each model.
Required:
a. Calculate the unit manufacturing cost of the U.S. and EU models using total direct labordollars to allocate the $39 million of manufacturing overhead.
b. Calculate the unit manufacturing cost of the U.S. and EU models using the ABC analysisto allocate the $39 million of manufacturing overhead.
c. Prepare income statements (including income tax expense) for Wedig and its Europeansubsidiary using the unit manufacturing costs calculated in part (a) (overhead is allocatedusing total direct labor dollars).
d. Prepare income statements (including income tax expense) for Wedig and its Europeansubsidiary using the unit manufacturing costs calculated in part (b) (overhead is allocatedusing the ABC analysis).
e. Discuss the advantages and disadvantages of using direct labor versus ABC to allocate the$39 million of overhead.
P 11–13: Toby Manufacturing
Toby Manufacturing produces three different products in the same plant and uses a job order cost-ing system to estimate product costs. A flexible budget is used to forecast overhead costs. Totalbudgeted fixed factory overhead is $450,000 and variable overhead is 120 percent of direct labordollars.
Projected volumes, selling prices, and direct costs for the three products for the next calendaryear are as follows:
Product Product ProductAAA BBB CCC
Projected number of units 6,000 3,000 1,000Direct materials per unit $22 $25 $30Direct labor per unit $11 $12 $16Selling price $98 $115 $140
Upon closer analysis of the overhead account, warehousing costs are determined to be a majorfraction of overhead. The manufacturing process requires six operations. Between operations, inter-mediate products are moved and warehoused until the next production stage. Each product requires10 days of processing time to complete all six operations. But the products have different total cycletimes because of different waiting times between operations. Cycle time is the total time from when
zim36725_ch11_501-553.qxd 12/15/09 2:17 PM Page 540

Criticisms of Absorption Cost Systems: Inaccurate Product Costs 541
raw materials are ordered until the product is completed and shipped. Product AAA has the shortestcycle time (20 days) because the large volume allows more accurate forecasts and more continuousscheduling of production. Product BBB has a total cycle time of 40 days; product CCC has a totalcycle time of 50 days. Product BBB and CCC have longer warehousing times of work in processbecause of more frequent scheduling changes and supplier delays.
Half of what is currently treated as fixed overhead cost is involved in the warehousing function.
Required:
a. Prepare a pro forma income statement by product line for the year based on full absorptioncosting. Product costs should include overhead assigned on direct labor cost.
b. Prepare a revised pro forma income statement by product line using activity-based costing.
c. Comment on the differences.
P 11–14: Kay Enterprises
Kay Enterprises is a small, family-owned and managed business. It has a patented production processfor manufacturing a digital switch used in large telephone switches. It manufactures two models in itsplant in Atlanta, Georgia. The U.S. model is sold to U.S.-based telephone companies and the Euro-pean switch is transferred to Kay’s wholly owned subsidiary in Ireland, where it is sold to Europeantelephone companies. U.S. switches are sold only in the United States and European switches can besold only in Europe. One brother, Lloyd Kay, manages the U.S. company and his brother, Colin Kay,manages the Irish firm. The two switches share the same proprietary production process but havedifferent design specifications to match the different telephone systems.
All switches manufactured are sold; Kay does not have any work-in-process or finished goodsinventories. Because of the patented nature of the production process, Kay faces very little competi-tion for its switches either in the United States or Europe. This allows the firm to set a relatively highprice above its costs.
The following table summarizes the annual number of U.S. and European switches produced andthe costs of manufacturing each switch. All manufacturing overhead of $24 million is a fixed cost thatdoes not vary with the number of switches produced. Overhead is allocated to units produced basedon direct labor dollars.
Switches
European United States
Units produced (000s) 1,000 900Units transferred (000s) 1,000 N/AFinal selling price* $30 $32Direct labor per unit $2.00 $3.00Direct material per unit $8.00 $9.00
N/A not applicable.*Final selling price to the external market, not to the Irish company.
Because Kay operates in two countries, it must calculate and report income by country. Assumethat the United States has a 35 percent income tax rate on U.S. derived income. Profits of firms inIreland are taxed at 10 percent to encourage foreign investment. In recent years, the U.S. and Irish taxauthorities have scrutinized Kay’s full-cost transfer pricing policy. The tax authorities become suspi-cious if a different transfer price is used for taxes than for other purposes. Kay transfers the Europeanswitches at full accounting cost (direct labor, direct material, and allocated overhead).
Required:
a. Prepare separate income statements for each country for Kay Enterprises for the currentoperating year using direct labor dollars to allocate manufacturing overhead to the switches.
zim36725_ch11_501-553.qxd 12/15/09 2:17 PM Page 541

542 Chapter 11
b. Kay is considering switching to activity-based costing for allocating overhead to the twomodels of switches. Upon analysis of the production process it is determined that most ofthe $24 million of manufacturing overhead varies with the number of batches produced.The equipment is set up between batches; raw materials are ordered and inspected on abatch basis. The quality control department checks five units per batch. Packing andshipping costs vary with the number of batches. After conducting this analysis, Kaydecides to switch to ABC for allocating manufacturing costs. European switches areproduced in batch sizes of 20,000 and U.S. switches are produced in batch sizes of 30,000.Prepare separate income statements for each country for Kay Enterprises for the currentoperating year using ABC to allocate manufacturing overhead to the switches.
c. Which set of income statements (those in part [a] or [b]) should Kay Enterprises use?
P 11–15: Goodstone Tires
Goodstone Tires designs, manufactures, and sells automotive tires through three profit centers (divi-sions): Passenger Vehicles, Industrial Vehicles, and Racing. The Racing Division develops state-of-the-art high-performance racing tires for NASCAR, grand prix, and Indy cars. Racing, while a smallpart of Goodstone’s total revenues and profits, provides much external visibility and a proving groundfor Goodstone’s future generation of passenger and industrial tires. Racing’s motto is “What’s win-ning today is on tomorrow’s cars and trucks.”
The following table summarizes the revenues and variable and fixed expenses (in millions ofdollars) of the three divisions:
Racing Passenger Industrial Total
Revenue $135.00 $2,900.00 $2,400.00 $5,435.00Division variable expenses 81.00 1,160.00 1,200.00 2,441.00Division fixed expenses 13.50 580.00 480.00 1,073.50
Each division operates as a decentralized organization with its own manufacturing, distribution, mar-keting, administrative, and sales organizations. Corporate headquarter costs of $1,400 million areallocated to the three divisions based on divisional sales.
Required:
a. Prepare a report detailing divisional performance based on net income after allocatingcorporate overhead using divisional sales as the allocation base.
b. Discuss the pros and cons of the report you prepared in (a).
c. Upon further reflection, the chief financial officer (CFO) believes that allocating corporateoverhead using divisional revenues is too simplistic. Corporate overhead consists of thefollowing:
R&D $ 420.00Corporate image advertising 330.00Interest 370.00Corporate office 280.00
Corporate overhead $1,400.00
All research and development for the divisions is conducted at the corporate R&D lab. Thelab’s total spending of $420 million is spent on projects directed specifically at one of thethree divisions. As a percentage of total R&D spending, Racing has 50 percent, Passenger30 percent, and Industrial 20 percent.
Corporate image advertising amounts to $330 million. While the content of the adsvaries, each ad contains images of Goodstone’s Racing, Passenger, and Industrial products.
zim36725_ch11_501-553.qxd 12/15/09 2:17 PM Page 542

Criticisms of Absorption Cost Systems: Inaccurate Product Costs 543
The general corporate directive, based on market research, is that each print or televisioncorporate image ad should, on average, contain 60 percent of the images or messages drawnfrom Racing, 30 percent drawn from Passenger, and 10 percent drawn from Industrial.
Corporate borrows to finance the operations (current assets and fixed assets) of thethree divisions. No division seeks long-term external financing. Of the total current andfixed assets financed externally by the corporate office, 30 percent are in Racing, 50 percentare in Passenger, and 20 percent are in Industrial.
Finally, “Corporate Office” of $280 million consists of the CEO, CFO, chief legal coun-sel, chief information officer, chief human resource officer, and their staffs. The CFO polledeach of the senior officers in the Corporate Office asking them how much of their time andtheir staff’s time was devoted to each of the three divisions. Based on the data, the CFO de-cided that Corporate Office expenses should be allocated to the three divisions as follows:40 percent to Racing, 45 percent to Passenger, and 15 percent to Industrial.
Based on the preceding information, prepare a revised divisional performance report thatsatisfies the CFO’s request for a less simplistic, more accurate allocation of corporate overhead.
d. Discuss the pros and cons of the performance report prepared in (c).
e. The corporate strategy of using the Racing Division both as a way to promote Goodstone’sPassenger and Industrial products and also as a way to develop and perfect the nextgeneration of tires was tested when an external consulting firm was hired to estimate theimpact on Passenger and Industrial sales from having the Racing Division. Using bothlongitudinal and cross-sectional data from Goodstone and the tire industry, the consultantconcluded that at the current scale of the Racing Division, Racing increases Passenger andIndustrial revenues by 10 percent and 5 percent, respectively. Moreover, the consultantconcluded that the benefits from corporate image advertising and centralized R&Dpermeate the entire organization and enhance recruiting and retaining personnel. Forexample, the R&D lab can attract better engineers and scientists to work on Passenger andIndustrial projects because they also work on state-of-the-art racing projects. CorporateR&D projects, while directed specifically at a particular division, provide significant spill-over effects for the other divisions. Lab equipment purchased for Passenger or Industrialprojects often is used later on racing projects. And research findings generated on Racingprojects almost always have implications for Passenger and Industrial products. In fact,when choosing among R&D projects the head of the lab selects projects that havemaximum corporatewide benefits.
Based on the findings of the external consultants, prepare another divisionalperformance report for the three operating divisions.
f. Discuss the pros and cons of the report developed in (e).
P 11–16: Hospital Admissions Office
The admissions office of a large hospital has an annual operating budget of $700,000. These costs aredistributed to inpatient departments (surgery, medicine, pediatrics, psychiatry) and to outpatientdepartments (drug treatment, prenatal care, dialysis). In the past, the admissions office’s costs havebeen allocated to inpatients and outpatients based on the number of patients processed. But nowhospital management is seeking some alternative ways to distribute these costs.
The following data for the last 12 months summarize the number of patients, average days perstay, average patient bill, and average number of minutes to register inpatients and outpatients.
Number Average Days Average Patient Average Minutes toof Patients per Patient Stay Bill Register a Patient
Inpatient 25,000 6.50 $8,200 12Outpatient 120,000 1.00 700 8
zim36725_ch11_501-553.qxd 12/15/09 2:17 PM Page 543

Required:
a. Allocate the admissions office’s annual operating budget to inpatient and outpatientcategories based on
(1) Total number of patients.
(2) Total number of patient days.
(3) Total patient billings.
(4) Total minutes used registering.
b. Discuss the managerial implications of these various alternative ways to distribute theadmissions office’s costs. Which method should the hospital adopt?
P 11–17: ABC and Taxes15
A plant manufactures two products, Hi-V and Lo-V. Hi-V is the high-volume product that representsmost of the plant’s revenue. It is produced 10 times per year, inventoried, and shipped to customerstwice a month. Lo-V is a specialty product. It is made to order in small but frequent batches (usuallyonce a week) and shipped immediately to customers. The plant uses an absorption costing system thatassigns manufacturing overhead to products based on direct labor hours.
This table summarizes the annual cost structure and operating data for the plant.
Hi-V Lo-V
Direct materials 4 @ $13 $ 5210 @ $2 $ 20
Direct labor .75 hrs. @ $12 9.25 hrs. @ $12 3
Overhead .75 hrs. @ $40 30.25 hrs. @ $40 10
Total cost per unit $ 91 $ 33
Selling price $ 95 $ 100Ending inventory 700 0Production (units) 12,000 4,000
Setups per year 10 40
Manufacturing overhead:Fixed overhead $390,000Variable overhead per direct labor hour $ 1Budgeted volume:
Hi-V (12,000 � .75) 9,000Lo-V (4,000 � .25) 1,000
Budgeted direct labor hours 10,000� Variable overhead per hour $ 1
Variable overhead $ 10,000Fixed overhead 390,000
Budgeted overhead $400,000� Budgeted volume 10,000
Overhead rate $ 40
544 Chapter 11
15 This problem is based on S Dilley, F Jacobs, and R Marshall, “The Tax Benefits of ABC,” Journal ofAccountancy, March 1997, pp. 34–37.
zim36725_ch11_501-553.qxd 12/15/09 2:17 PM Page 544

A careful analysis of the plant’s fixed overhead reveals that $350,000 of the $390,000 varies withthe number of setups. The remaining $40,000 of fixed overhead will still be allocated to productsbased on direct labor hours.
There were no beginning inventories.
Required:
a. Compute product costs per unit of Hi-V and Lo-V using activity-based costing.
b. Prepare a table that compares the profits of the two product lines using the currentabsorption costing allocation method and activity-based costing.
c. Income taxes are 50 percent. Calculate the plant’s total tax liability under absorptioncosting and under activity-based costing.
d. In general, will switching to activity-based costing lower a firm’s taxes? Describe thegeneral conditions necessary for activity-based costing to lower taxes.
P 11–18: Familia Insurance Company
Familia Insurance Company (FMC) specializes in offering insurance products to the Hispanic com-munity. It has its own direct sales organization of agents that sells three lines of insurance: lifeinsurance, auto insurance, and home insurance. FMC is organized around three profit centers (Life,Auto, and Home) and several cost centers (Sales, Accounting and IT, Human Resources, andUnderwriting and Claims). Each agent sells all three insurance lines. Accounting and IT processesall transactions, including customer billing, claims, payroll, and so forth. Human Resources hiresemployees and manages the employee benefits plans. Underwriting and Claims sets the ratesfor the three types of policies, calculates the insurance premiums for each policy written, andprocesses insurance claims.
The three profit center managers are responsible for designing their marketing materials, train-ing the common sales force to sell their policies, and designing their policies to appeal to their marketdemographics. Each profit center manager is compensated based on net income before taxes in theirprofit center.
The sales strategy of FMC is to heavily market the auto insurance and then sell the customer lifeand home insurance products. The following statement (in millions of dollars) summarizes operationsfor the last fiscal year:
Life Home AutoInsurance Insurance Insurance Total
Premium revenue $ 500.00 $ 900.00 $ 600.00 $ 2,000.00 Investment income 87.50 157.50 105.00 350.00
Total revenue $ 587.50 $1,057.50 $ 705.00 $ 2,350.00
Expenses:Insurance losses and loss adjustments $(300.00) $ (540.00) $(560.00) $(1,400.00)Policy acquisition expenses (112.50) (202.50) (135.00) (450.00)Operating and administrative expenses (100.00) (180.00) (120.00) (400.00)
Net income before taxes $ 75.00 $ 135.00 $(110.00) $ 100.00
Policy premiums are invested in securities and income from these investments is reported as“Investment income.” “Insurance losses and loss adjustments” represent the actual insurance claimspaid plus anticipated losses not yet paid for policies written that year. “Policy acquisition expenses”
Criticisms of Absorption Cost Systems: Inaccurate Product Costs 545
zim36725_ch11_501-553.qxd 12/15/09 2:17 PM Page 545

546 Chapter 11
are the costs of the direct sales force. Operating and administrative expenses (in millions) consist ofthe following:
Operating and Administrative Expenses
Underwriting and claims $ 90.00 Accounting and IT 70.00 Human resources 40.00 Advertising 120.00 Profit center expenses 30.00Corporate office 50.00
Total O&A expenses $400.00
In the statement of operations for last year, “Investment income,” “Policy acquisition expenses,”and “Operating and administrative expenses” are allocated to the three profit centers based on pre-mium revenues. “Insurance losses and loss adjustments” are based on the actual and estimated losseson each policy written as calculated by the actuaries in the Underwriting and Claims department.
Profit center expenses consist of the salaries and benefits of the management and staff operatingthe profit centers and other direct costs incurred by the profit center. The $30 million consists of $6 mil-lion in the Life Insurance profit center, $15 million in the Home Insurance profit center, and $9 millionin the Auto Insurance profit center. Corporate office expense consists of FMC’s senior managers andtheir staff. They oversee all the profit and cost centers and design FMC’s advertising campaigns.
FMC management and the board of directors worry about the large losses being reported in theAuto Insurance profit center and question the methodology being used to allocate both the investmentincome and the expense items. A consultant hired by senior (corporate) management to analyze theseitems finds the following relations:
• Investment income generated by each insurance line depends on the difference betweenpremium revenues and insurance losses and loss adjustments.
• Policy acquisition expenses are driven by the time each agent spends on selling a particularline of insurance. Based on a questionnaire sent to FMC’s agents, the consultant reportsthat on average agents spend 30 percent of their time selling auto policies, 30 percentselling home policies, and 40 percent selling life policies.
• Underwriting and Claims expenses are driven by the number of policies in each area. Thereare 150,000 life policies, 375,000 home policies, and 225,000 auto policies.
• The number of policies in each insurance line is a reasonable approximation of what causesresource consumption in Accounting and IT.
• Human resource costs are driven by the number of employees at FMC. Most of the employeesat FMC are in either “Policy Acquisition expenses” or “Profit Center expenses.” A reasonablyaccurate proxy for human resources consumed by employees is salary and benefit expensesof the direct sales force (policy acquisition expenses) plus the profit center expenses.
• Advertising and Corporate office expenses represent firmwide common resources. AllFMC ads promote the FMC brand and not individual lines of insurance. After muchdiscussion, management agrees the most commonly accepted allocation scheme for thesetwo expense items is premium revenue.
Required:
a. Based on the consultant’s recommendations, prepare a revised statement of operations for thecurrent year that reports revised net income before taxes for each of the three profit centers.
b. Should FMC replace its current methodology for computing net income before taxes withthe statement of operations you prepared in part (a)? Present the advantages anddisadvantages of the two methodologies and make a recommendation.
zim36725_ch11_501-553.qxd 12/15/09 2:17 PM Page 546

Criticisms of Absorption Cost Systems: Inaccurate Product Costs 547
P 11–19: Brickley Chains
Brickley Chains produces five different styles of silver chains, A, B, C, D, and E, in a highly auto-mated batch machining process. The following table summarizes the production and cost data for thefive products.
Direct DirectAnnual Labor Material
Product Volume per Unit per Unit
A 5,000 $2.00 $4.00B 3,000 2.50 4.50C 1,000 3.00 5.00D 800 4.00 6.00E 500 5.00 7.00
Annual overhead is $80,000.
Required:
a. Compute the unit cost of each chain, A–E, using absorption costing. Overhead is assignedto individual products using direct labor cost.
b. Upon further analysis, you discover that the annual overhead of $80,000 consists entirely ofthe highly automated machining process. Each chain type is produced in batches with chainsof the same type. Each batch requires the same amount of machine time. That is, producing abatch of 100 style A chains requires the same amount of machine time as a batch of 25 styleE chains. The following table summarizes the batch size for each type of chain:
BatchProduct Size
A 100B 100C 50D 40E 25
Compute the unit cost of each chain, A–E, using activity-based costing.
c. Prepare a table comparing the activity-based cost and absorption cost of each product.Discuss why the product costs differ between the two costing methods.
CasesCase 11–1: Tilist Golf
Tilist Golf is a premier producer of golf clubs and golf balls. The Ball Division makes two types ofballs: a professional ball (the “Masters”) played by professional and top amateur players, and a mass-market ball (the “Distance”) which targets weekend players. Although most golf balls are very similarin construction and performance, slight differences exist between them. The Masters ball is a littlesofter and allows skilled players to put more spin on the ball for control. The Distance ball is a littleharder with a more durable cover. While the two balls perform similarly, many golfers perceive the
zim36725_ch11_501-553.qxd 12/15/09 2:17 PM Page 547

548 Chapter 11
differences are larger than they really are, especially across ball manufacturers. Most golfers have afavorite brand of ball. Golf ball manufacturers compete over ball design (dimples, cover, corecomposition), price, and marketing. The principal way balls are marketed is through the endorsementsof major professional golfers. Tilist pays professional golfers up to $500,000 per year to wear Tilisthats or shirts during tournaments, to allow Tilist to use their image in commercials, and to play Tilistballs (which are provided free to the professional) in all tournaments.
Tilist’s Ball Division has separate profit centers managing each type of ball. The following tablesummarizes the operations of the Ball Division for last year.
Masters Distance
Price per dozen $26 $7 Variable cost per dozen $12 $3Quantity sold 300,000 25,000,000
In addition, the Ball Division has $61.429 million of overhead, consisting of sponsorships, promo-tions, R&D, and so forth.
Required:
a. Prepare income statements for the two ball types after allocating the $61.429 million ofoverhead based on revenue.
b. Senior management of the Ball Division has undertaken a review of the cost allocationmethodology used in part (a). They hired an ABC consultant and formed an ABC taskforce to design a new allocation scheme that better allocates the $61.429 million overheadto the two ball types. The overhead consists of the following items:
Promotional samples $ 1,075,000 Sponsorships 18,500,000 Advertising 34,837,000 R&D 3,450,000 Ball Division headquarters expenses 3,567,000
Overhead $61,429,000
Promotional samples consist of Tilist balls given away to touring pros under Tilistsponsorships, marketing opportunities, and charity events. $950,000 of Masters and$125,000 of Distance balls comprise the $1,075,000 of promotional samples.
The $18.5 million of sponsorships consists of payments to touring professional golfersexpected to do well in televised tournaments. Sponsored pros are paid to play Tilist ballsand wear the Tilist name on their hats or shirts. Sponsorships are aimed at increasingTilist’s name recognition across all types of golfers. Senior managers and the ABC taskforce believe the sponsorships expenditure is best assigned to the two divisions based onthe number of balls sold.
The advertising expenditure of $34,837,000 covers television and print ads ($1.35million for Masters and $33.487 million for Distance).
Tilist has a research lab where it designs new balls by experimenting with differentdimple patterns, covers, and cores. About one-third of the R&D effort is devoted to improvingthe Masters, and two-thirds of the R&D effort is directed toward improving the Distance.
After an extensive study of the various functions of the Ball Division’s headquartersexpenses, including the time spent by the various personnel in the two ball divisions, theABC task force has agreed that 40 percent of the $3.567 million headquarters expensesshould be allocated to Masters and the remainder to Distance.
Prepare income statements based on the findings of the ABC task force.
zim36725_ch11_501-553.qxd 12/15/09 2:17 PM Page 548

Criticisms of Absorption Cost Systems: Inaccurate Product Costs 549
c. Based on the income statements prepared in part (a) (overhead allocated using revenues)and part (b) (ABC overhead allocations), what conclusions can you draw about the relativeprofitability of the two ball types?
Case 11–2: SnapOn Fasteners
SnapOn makes snap-together button fasteners (a male top and female bottom) for designer clothes.Each top and bottom consists of several metal parts that, when attached to the garment, allow theshirt, jacket, or pants to be closed without the use of a zipper. The top of each button consists of ashiny or painted metal surface, usually embossed with the designer’s logo or design. Fashion designhouses contract with manufacturers to produce their fashion lines. The fashion house specifies theparticular SnapOn fasteners the manufacturer will use. The manufacturer then purchases the top andbottom sections of the fasteners and leases SnapOn attaching machines to attach the fasteners to thegarments. Because each fastener is designed specifically for a particular designer, SnapOn attachingmachines must be tailored to each fastener so that the fastener can be attached to the garment withoutscratching or marring the snap and the machine can operate reliably without jamming. Each machineis specialized to a particular fastener by the tooling in the machines, which have tight tolerances forthe particular fastener shape, size, and finish. This tooling is the materials handling device that movesthe various components of the tops and bottoms through the machine and positions them in thecorrect location so that the machine can then compress the metal parts and fabric together.
SnapOn has achieved a good reputation among top design houses for producing high-quality,unique fasteners and a line of attaching machines that do not jam and do not mar the fastener. SnapOnhas a staff of service technicians who maintain the attaching equipment 24–7. If a machine malfunc-tions, SnapOn guarantees that it will repair it within 24 hours, anywhere in North America. Thisservice is very important to SnapOn’s customers because fashion designers operate on short cycletimes. Once they design their spring, summer, fall, or winter lines and show them to the buyers, thedesigners have eight weeks to produce and deliver the lines. Keeping their designs secret until they arereleased keeps other fashion houses and knock-off producers from copying their designs. The topfashion designers are willing to pay premium prices for high-quality fasteners that can be attachedusing highly reliable equipment.
SnapOn has two product lines (fasteners and attaching machines) and produces both lines in thesame plant. Separate managers are responsible for the two product lines, and each manager receives50 percent of his/her bonus based on reported net income of his/her product line and 50 percent ofhis/her bonus based on SnapOn’s total net income. All manufacturing overhead of $59.615 million isapplied to all products (attaching machines and fasteners) using direct labor dollars. All selling andservice costs of $47.210 million are allocated to fasteners and attaching machines based on revenuedollars generated by each product line. The following table summarizes the operations of SnapOn (inmillions) for the most recent fiscal year.
SNAPON FASTENERSSummary of Operations
Last Fiscal Year
Machines Fasteners
Revenue $95.750 $132.895 Direct labor 22.650 43.680 Direct materials 24.640 21.840
Required:
a. Prepare income statements for SnapOn’s two lines of business (fasteners and attachingmachines) that include manufacturing overhead and selling and service expenses allocatedto each business line using the methodology described previously. Assume there are nobeginning or ending inventories of either attaching machines or fasteners.
zim36725_ch11_501-553.qxd 12/16/09 10:02 AM Page 549

550 Chapter 11
b. Senior management is concerned that its current costing methodology of allocatingmanufacturing overhead based on direct labor dollars is too simplistic and is not producingunit manufacturing costs that accurately reflect the true consumption of indirectmanufacturing overheads. Since manufacturing overhead is about 50 percent of totalmanufacturing cost (direct labor, direct materials, and manufacturing overhead), smallerrors in cost allocations could materially affect the calculated unit manufacturing costs.Some foreign competitors are entering SnapOn’s traditional fashion markets and areoffering fasteners at prices below SnapOn’s unit manufacturing costs. Garmentmanufacturers who use these foreign fasteners have to lease attaching machines from otherU.S. manufacturers as the foreign fastener-makers do not provide their own attachingmachines. SnapOn will not allow non-SnapOn fasteners to be used in SnapOn attachingequipment.
Senior management organizes a task force to study SnapOn’s manufacturing overheadand selling and service costs and asks the task force to devise a better methodology fortracing these costs to individual products and the two lines of business. After three monthsof analysis, the task force presents the following breakdown of last year’s manufacturingoverhead amount:
Manufacturing Overhead Amount Cost Driver
Purchasing $ 9.812 Direct materialsDepreciation of machinery 17.611 Traced directlySupervision 3.665 Direct laborOccupancy 19.873 Square footageEngineering 8.654 Traced directly
Total $59.615
The task force determines that costs in the purchasing department are driven by thedollars spent on direct materials. The depreciation of machinery should be charged to thetwo product lines based on the machinery used by the two product lines. Since attachingmachine production and fastener production use different equipment, the depreciation ofthe manufacturing equipment can be directly traced to the two product lines. Of the$17.611 million of total depreciation, 70 percent is for equipment used to manufacture theattaching machines and 30 percent is for equipment used to manufacture fasteners.Employees are supervised either manufacturing attaching machines or manufacturingfasteners. So direct labor dollars are the cost driver of supervision expenses. Theproduction of attaching machines occupies 75 percent of the total manufacturing space(square footage) and fastener production occupies the remaining 25 percent. Hence,occupancy costs (depreciation of the building, property taxes, property insurance, andutilities) should be assigned to products using square footage as the cost driver. Finally,engineers are assigned exclusively to either attaching machine production (60 percent ofthe engineering costs) or fastener production (40 percent).
The task force also examined the selling and service costs and determined that$11.850 million of the total $47.210 million consisted of service costs for the attachingmachines (salaries, travel, and parts to maintain the attaching machines in the field). Thetask force also determined that selling costs of $35.36 million vary with revenues.
Using the task force’s findings, prepare revised income statements for SnapOn’s twolines of business (attaching machines and fasteners) for the last fiscal year. Assume thereare no beginning or ending inventories of either attaching machines or fasteners.
c. Briefly describe any changes in the relative profitability of the two lines of business afterimplementing the task force’s analysis.
zim36725_ch11_501-553.qxd 12/15/09 2:17 PM Page 550

Criticisms of Absorption Cost Systems: Inaccurate Product Costs 551
d. Should SnapOn stay with its current costing system as portrayed in part (a), or shouldSnapOn convert to the new costing methodology based on the task force’s analysis asportrayed in part (b)? Be sure to justify your recommendation based on the advantages anddisadvantages of each alternative.
Case 11–3: Dyna Golf 16
Joe Bell, president and chief executive officer of Dyna Golf, has called a meeting of the executivecommittee of his board of directors. He is concerned about the price competition and declining salesof his golf wedge line of business. Bell summarizes the current situation by saying,
As you know, we set target prices to maintain a gross margin on sales of 35 percent. On someproducts, such as our drivers, we have been able to achieve the target price. We have been ableto achieve higher prices on our putters than a target 35 percent gross margin would dictate. Butour wedges are a totally different story.
Our factory is among the most efficient in the world. I think that some foreign companiesare dumping wedges in the U.S. market, driving down prices and unit sales. We’ve been reluc-tant to further cut our prices for fear of what this will do to our gross margins. Fortunately,we’ve been able to offset the decline in sales of wedges by significantly raising the price of ourputters. We were pleasantly surprised when our customers readily accepted the price increasesof our putters, and we haven’t experienced much reaction from our competitors on the putterprice increases.
Steve Barber, an outside director on the board, asks:
Joe, I don’t pretend to know a lot about the golf club business, but how confident are you in yourcost data? If your costs are off, won’t your prices be off as well?
Joe Bell responds:
That’s a good point, Steve, and one I’ve been worried about. We’ve been modernizing ourproduction facilities and I’ve asked our controller, Phil Meyers, to look into it and report backafter he has undertaken a thorough analysis. My purpose for calling this meeting was to updateyou on our current situation and let you know what we are doing.
BackgroundDyna Golf has been in business for 15 years. Its one plant manufactures three different types of golfclubs: drivers, wedges, and putters. Dyna does not produce a complete club with a shaft and grip. Itmakes the metal head that is sold to other companies that assemble and market the complete club.Dyna holds four patents on a unique golf club head design that forges together into one club headthree different metals: steel, titanium, and brass. It also has a very distinctive appearance. These threemetals weigh different amounts, and by designing a club head with the three metals, Dyna producesa club with unique swing and feel properties. While the Dyna club is unique and covered by patents,other manufacturers have recently introduced similar technology using comparable manufacturingmethods.
The Dyna driver is sold to a single distributor that adds the shaft and grip and sells the driver toretail golf shops. Dyna first made its reputation with its driver. It became an “instant hit” withamateurs after a professional golfer won a tournament using the Dyna driver. Based on the namerecognition from its driver, Dyna introduced a line of putters and then wedges. The wedges are soldto three different distributors and the putters to six different distributors. Specialty, high-end putterslike Dyna’s have a retail price of $120 to $180 and drivers a retail price of $350 to $500. Golfers liketo experiment with new equipment, especially when they are playing badly. Therefore, it is notuncommon for golfers to own several putters and switch among them during the year. Putter
16 This case is based on J Shank and V Govindarajan, “The Perils of Allocation Based on ProductionVolumes,” Accounting Horizons, December 1988, pp. 71–79.
zim36725_ch11_501-553.qxd 12/15/09 2:17 PM Page 551

552 Chapter 11
manufacturers seek to capitalize on this psychology with aggressive advertising campaigns. It is lesscommon for players to switch among wedges as they do with putters. Since it takes several rounds ofgolf playing with a new wedge to get its feel and distance control, most players don’t experiment asmuch with wedges as with putters, or even drivers.
Production processAll three clubs (drivers, wedges, and putters) use the same manufacturing process. Each of the threeclubs consists of between 5 and 10 components. A component is a precisely machined piece of steel,brass, or titanium that Dyna buys from outside suppliers. The components are positioned in a jig,which is placed in a specially designed computer-controlled machine. This machine first heats thecomponents to a very high temperature that fuses them together, then cools them, and polishes thefinished club.
The factory is organized into five departments: Receiving, Engineering, Setup, Machining, andPacking. Before a production run begins, Receiving issues a separate order for each component com-prising the club head and inspects each order when it arrives. Engineering ensures that the completedclub heads meet the product’s specifications and maintains the operating efficiency of the machines.Because of the preciseness of the production process, Engineering is constantly having to issue En-gineering change orders in response to small differences in purchased components. Setup first cleansout the machine and jigs, adjusts the machine to the correct settings to produce the desired club head,and then makes a few pieces to ensure the settings are correct. Machining contains several machines,any of which can be used to manufacture drivers, wedges, or putters once it is equipped with theproper jigs and tools. Packing is responsible for packaging and shipping completed units.
Table 1 summarizes the basic product information for the three products: production, shipments,target prices, and actual prices. For example, Dyna manufactured all 10,000 drivers in a single pro-duction run and shipped them all out in a single shipment. The 5,000 putters were manufactured in 10separate runs and shipped in 20 shipments. Dyna set a target price for drivers to be $162.61 (whole-sale price) and achieved it. However, it was not able to achieve its target price for wedges ($134.09versus $125.96), but it exceeded its target price for putters ($105.70 versus $81.31).
Accounting systemTable 2 summarizes raw material, setup and run labor, and machine time for each of the three prod-ucts. Each product is produced in the machining department by assembling the metal components.Drivers require 5 components, whereas wedges and putters require 6 and 10 components, respec-tively. Before the production begins, the machine must be set up, requiring setup labor. Then toproduce clubs, operating the machines requires both machine time and run labor time. Both setup andrun labor cost $20 per hour. Machining has a total budget of $700,000 consisting of the depreciationon the machine, electricity, and maintenance. Drivers take more run labor time than machine timebecause several operators are required to operate the machinery when drivers are produced. Duringputter machining, the operator can be operating two machines at once.
Table 3 summarizes the overhead accounts.
TABLE 1 Dyna Golf Basic Product Information
Drivers Wedges Putters
Production 10,000 units 15,000 units 5,000 unitsin 1 run in 3 runs in 10 runs
Shipments 10,000 units 15,000 units 5,000 unitsin 1 in 5 in 20
shipment shipments shipmentsSelling prices:
Target $162.61 $134.09 $ 81.31Actual 162.61 125.96 105.70
zim36725_ch11_501-553.qxd 12/15/09 2:17 PM Page 552

Criticisms of Absorption Cost Systems: Inaccurate Product Costs 553
Phil Meyers, Dyna’s controller, and Joe Bell meet a week after the executive committee meetingof the board of directors. Joe Bell asks Phil to report on what he has found. Phil begins,
Joe, as you know, our current accounting system assigns the direct material costs of the compo-nents and the direct labor for run time to the three products. Then it allocates all overhead costs,including setup time and machine costs, to the three products based on direct run labor dollars.Setup labor is considered an indirect cost and is included in overhead. Based on these procedureswe calculate our product costs for drivers, wedges, and putters to be $105.70, $87.16, and$52.85, respectively.
I’ve been looking at our system and have become worried that our overhead rate is gettingout of line. It’s now over 750 percent of direct labor cost. Since we’ve introduced more auto-mated machines, we’re substituting capital or overhead dollars for labor dollars. The Engineer-ing department schedules its people based on change orders it receives. Drivers are prettystandard and only generate 25 percent of the change orders and wedges about 35 percent. Put-ters are our most complex production process and require the remainder of the change orders.
I’m thinking we should refine our accounting system along the following lines. First, weshould break out setup labor from the general overhead account and assign that directly to eachproduct. We know how much time we are spending setting up each machine for each club-headrun. Second, we should stop allocating receiving costs based on direct labor dollars but rather onraw material dollars. And third, the remaining overhead (excluding setup and receiving) shouldbe allocated based on machine hours. If we make these three changes, I think we’ll get a moreaccurate estimate of our products’ costs.
Joe Bell responded,
These seem to be some pretty major changes in our accounting system. I’ll need some time tomull these over. Let me think about it and I’ll let you know in a few days how to proceed.
Required:
What advice would you offer Joe Bell?
TABLE 2 Dyna Golf Production Information
Drivers Wedges Putters
Raw material 5 components 6 components 10 components@ $4 each � $20 @ $5 each � $30 @ $1 each � $10
Labor ($20�hr.)Setup labor 10 hrs per 10 hrs per 11 hrs per
production run production run production runRun labor 1�2 hr per 1�3 hr per 1�4 hr per
driver wedge putterMachine time 1�4 hr per 1�3 hr per 1�2 hr per
driver wedge putter
TABLE 3 Dyna Golf Overhead
Receiving department $ 300,000Engineering department 500,000Machining department 700,000Packing department 200,000Setup department 3,000
$1,703,000
zim36725_ch11_501-553.qxd 12/15/09 2:17 PM Page 553

554
Chapter Twelve
Standard Costs:Direct Labor andMaterials
Chapter Outline
A. Standard Costs
1. Reasons for Standard Costing
2. Setting and Revising Standards
3. Target Costing
B. Direct Labor and Materials Variances
1. Direct Labor Variances
2. Direct Materials Variances
3. Risk Reduction and Standard Costs
C. Incentive Effects of Direct Labor andMaterials Variances
1. Build Inventories
2. Externalities
3. Discouraging Cooperation
4. Mutual Monitoring
5. Satisficing
D. Disposition of Standard Cost Variances
E. The Costs of Standard Costs
F. Summary
zim36725_ch12_554-591.qxd 12/15/09 2:26 PM Page 554

Standard Costs: Direct Labor and Materials 555
The cost systems described so far report actual (historical) labor and material costs. His-torical costs satisfy financial reporting requirements for valuing inventories (balance sheet)and determining cost of goods sold (income statement). Historical costs can also be auseful starting point for estimating opportunity costs. But historical costs do not tell uswhat costs should be; they only state what the costs actually were. An over- or underab-sorbed overhead number is reported, which conveys information about whether the planthas met expectations with respect to overhead. But there are no benchmarks for whetherdirect labor or direct materials are too high or too low, except by comparing the actualnumbers to the same numbers from prior periods. Historical costs are useful benchmarksonly if future costs are expected to be similar to past costs.
Standard costs are benchmarks. They represent the expected or desired future cost of aproduct, process, or subcomponent. Once standards are set, managers can gauge performanceby comparing actual operating results against the standards. The amount by which actual andstandard costs differ is the standard cost variance. Variances provide useful information forsenior management in gauging whether the production system is in control. Variances are animportant part of the decision control process described in Chapter 4. Variances are attention-getters. They alert senior managers that something is amiss. Variances also provide informa-tion for performance evaluation. In addition to their role in control, standard costs are usefulin making decisions on product pricing, outsourcing, and resource allocation.
This chapter describes the use of standard costs for decision making and control. Thetrade-off between decision management and decision control described in previouschapters also exists with standard costs. Direct labor and direct materials variances aredescribed in this chapter. Overhead variances and marketing variances are described in thenext chapter. This chapter focuses on the costs and benefits of standard cost systems.
A. Standard CostsStandard costs arise from the budgeting process described in Chapter 6. In setting thebudget for the firm for the next year, managers determine the per-unit costs of the goodsmanufactured, the expected volume of production, and the prices to charge for the output.For example, suppose a firm manufactures two products (200GB hard disk drives and500GB drives) and has an assembly department where the units are assembled. Thefollowing table summarizes the key data:
200 500 GB Drive GB Drive Total
Planned production 25,000 14,000Standard cost per drive $ 40 $ 50
Total standard cost $1,000,000 $700,000 $1,700,000
Standard cost is the expected cost that is reasonably required to achieve a givenobjective under specified conditions. In the assembly department, the objective is toassemble 200GB and 500GB drives, and the specified conditions are that 25,000 200GBand 14,000 500GB drives are assembled in the existing department. A standard costrepresents the relation between inputs and outputs. The $40 standard cost of the 200GBdrive in the assembly department states that $40 of both direct and indirect inputs isrequired to assemble each 200GB drive (the output).
zim36725_ch12_554-591.qxd 12/15/09 2:26 PM Page 555

556 Chapter 12
TABLE 12–1 Standard Cost SheetSmith Art Book, 1,000 Copies
Direct Materials Direct Labor
Type Quantity Price Amount Type Hours Wage Amount
Paper 800 lbs. $2 $1,600 Typesetters 80 $15 $ 1,200Covers 2,000 3 6,000 Printers 55 40 2,200Binding 500 lbs. 4 2,000 Binders 70 20 1,400
Total $9,600 $ 4,800
Total direct materials $ 9,600Total direct labor 4,800Total overhead ($100/printer hour) 5,500
Total cost $19,900Number of copies � 1,000
Cost per book $ 19.90
In a standard cost system, each product has a set of standards associated with eachinput. Consider the following example of a book printer. Table 12–1 presents the stan-dard cost sheet for a particular print run. Each type of direct labor and each type of di-rect material has a standard quantity and a standard price per unit of that quantity. Inaddition, the overhead rate (in this example, $100 per printer hour) is set at the begin-ning of the year and is used to estimate the total overhead each printed book will ab-sorb. Producing a particular book requires a set of cost estimates (standards) such asin Table 12–1.
Before publishing the Smith art book, senior managers will assess the book’s ex-pected profitability, which requires projected costs and revenues. The “projected costs”are the standard costs. So for decision management (whether to publish the book) thecompany estimates production costs. These estimates form the standards or benchmarksagainst which the actual costs of producing the book are compared. Comparing actualcosts against standards creates a control system. After the book is produced, senior man-agement can use the variance from standard as a performance measure. This approach isthe same as that in Chapter 6 for developing annual budgets. (For example, recall thecountry club discussion.)
Standard costs are useful for both decision management and decision control. Historicalcosts can often prove misleading if operating conditions have changed, if materials pricesor wages have changed, or if these factors are expected to change. Operating conditions inthe past may have been atypical because new products were introduced or a new manufac-turing process was implemented. Lot sizes may have changed, causing both raw materialsprices and setup labor costs to be different in the future.
Standard costs are used in a wide variety of decision-making contexts: productpricing, contract bidding, outsourcing decisions, and assessing alternative productiontechnologies. As discussed in Chapter 4, market prices do not exist to guide resourceallocations within firms. Instead, administrative devices are used to convey information
1. Reasons forStandard Costing
zim36725_ch12_554-591.qxd 12/15/09 2:26 PM Page 556

Standard Costs: Direct Labor and Materials 557
about alternative uses of scarce resources. Standard costs are part of the internal repetitivecontracting process within the firm.
Chapter 6 described how various parts of the organization must coordinate theiroperating plans for the coming year. Manufacturing and marketing must agree on howmany units of each product to manufacture and sell. A key parameter in this coordinationis the cost per unit. At the beginning of the year, manufacturing and marketing must agreenot only on the number of units but also on their cost. The estimated cost at the beginningof the year is the standard cost. Throughout the year, manufacturing and marketing thenhave an implicit contract to manufacture and sell the agreed-upon number of units at theagreed-upon standard cost. Standard costs often serve as transfer prices for intrafirm trans-fers of goods and services.
The standard cost of a gigabyte of memory on the firm’s e-mail server is a proxy forthe opportunity cost of using one gigabyte of memory. This standard cost per gigabyte ofmemory conveys the opportunity cost of using a gigabyte of memory on the firm’s e-mailserver to other managers throughout the firm. Likewise, the $40 standard cost of assemblinga 200GB drive conveys to other managers an estimate of the opportunity cost of assembling200GB drives.
Standard costs also provide benchmark information for decision control. Large differ-ences between standard and actual costs signal that a particular process or raw materialinput differs significantly from what was expected when the standard was set. In labor stan-dards, variances can be traced to specific processes and individual machine operators.Chapter 6 described how variances can be used as a measure of performance—not the solemeasure of performance, but one measure. Standard cost variances do not necessarilyincorporate information about whether a manager met the production schedule or whetherthe quality of the units produced met or exceeded specifications.
Actual costs and standard costs for individual processes or materials usage are ex-pected to differ. Random variation causes such deviations. But when summed over a day, aweek, or a month, are these deviations in the aggregate positive or negative? Random fluc-tuations will wash out over time. Positive variances will offset negative variances so that theaggregate variance should be about zero if the process is in control. Therefore, the aggre-gate variance, like a large sample, gives supervisors confidence that the variance is not dueto random chance.
Standard costs are pervasive in manufacturing. While standard cost systems are com-mon in manufacturing firms, some managers are questioning their costs and benefits.Some firms are scaling back on their reliance on standard costs, changing how they esti-mate standard costs, or even abandoning their standard cost systems. Section E discussesthese trends and the factors that may be causing managers to change or eliminate standardcost systems.
A standard cost is the product of a standard quantity or usage and a standard price. Stan-dard quantities are usually defined by the technical characteristics of the productionprocess and are often estimated by industrial engineering studies that examine how longa particular manufacturing process takes or how much raw material is required to pro-duce the product. Standard prices are usually forecast at the beginning of the year andare part of the key planning assumptions in the firm’s budgeting process (described inChapter 6).
Standard costs are estimated in manufacturing by taking the bill of materials (the listof all the materials required for the product) and forecasting how much of each materialis required for the product and the expected price for each material. Standard quantitytimes standard price is the standard material cost of the product. Routing sheets contain
2. Setting andRevisingStandards
zim36725_ch12_554-591.qxd 12/15/09 2:26 PM Page 557

information about how much labor time is required in each department to produce eachproduct. The expected labor time from industrial engineering estimates and the expectedwages for each labor process are used to calculate the standard labor cost for the prod-uct. Often, managers determine the standards for next year by taking the current year’s ac-tuals and making adjustments for inflation, productivity changes, and product mixchanges.
No universal method exists for deriving standard costs, and considerable variation anddebate exist in practice. Some experts argue that standard costs (standard quantity multipliedby standard price) should be those that are currently attainable, meaning the cost that isachievable if normal effort and luck prevail. Others argue that standard costs should be thosethat will occur with abnormal effort and/or luck. How tight the standards should be and howmuch weight to place on meeting them in performance evaluation are important issues in de-signing the firm’s organizational architecture, issues that involve trading off the costs andbenefits of tight versus loose standards.1 Most firms set standards based on expected, yetdifficult-to-attain, actual costs or based on average past performance. Very few companiesset standards at the maximum level of efficiency.
Exercise 12–1
Ogwood Company is a small Finnish manufacturer of wooden household items located outside
of Helsinki. The corporate controller plans to implement a standard cost system for Ogwood.
The controller has information from several co-workers that will assist him in developing stan-
dards for Ogwood’s products.
One of Ogwood’s products is a wooden cutting board. Each good cutting board requires
1.25 board feet of lumber and 12 minutes of direct labor time to prepare and cut. The cutting
boards are inspected after they are cut. Because the cutting boards are made of a natural mate-
rial that has imperfections, after cutting one board is normally rejected for each five that are
accepted. Four rubber foot pads are attached to each good cutting board. A total of 15 minutes
of direct labor time is required to attach all four foot pads and finish each cutting board. The
lumber for the cutting boards costs €3.00 per board foot, and each foot pad costs €0.05. Direct
labor is paid at the rate of €8.00 per hour.
Required:
Develop the standard cost for the direct cost components of the cutting board. For each direct
cost component of the cutting board, the standard cost should identify the
1. Standard quantity.
2. Standard rate.
3. Standard cost per unit.
SOURCE: CMA adapted.
558 Chapter 12
1 For a general discussion of the issues and related literature, see C Chow, “The Effects of Job StandardTightness and Compensation Scheme on Performance: An Exploration of Linkages.” Accounting Review 58(October 1983), pp. 667–85.
continued
zim36725_ch12_554-591.qxd 12/15/09 2:26 PM Page 558

Standard Costs: Direct Labor and Materials 559
Solution:
Standard unit cost per cutting board:
Direct materialLumber (1.50 bd. ft.* � €3.00�bd. ft.) €4.50Footpads (4 pads � .05�pd) .20 €4.70
Direct laborPrepare�cut(14.4�60† hrs. � €8.00�hr.) 1.92Assemble�finish(15�60 hrs. � €8.00�hr.) 2.00 3.92
Total standard unit cost €8.62
*
†
Notice that to get five good cutting boards, six must be cut. If each cutting board was 1 foot
long, then each good board requires 1.2 [(5 � 1)�5] feet of lumber to allow for the scrap.
As described in Chapter 6 regarding the budgeting process in general, setting andrevising standards requires gathering specific knowledge about the standards from theindividuals who have the requisite knowledge. Usually managers with the specializedknowledge for updating the standard will be evaluated, at least in part, on the differencebetween their actual performance and the standard. If the standard is to reflect theopportunity cost of the resource, it should contain all of the specific knowledge pertainingto the standard. Standards that accurately capture opportunity costs are the most useful inconveying information within the firm about alternative resource utilization. But theaccuracy of the standard as a measure of opportunity cost is often compromised fordecision control reasons (i.e., to provide managers with incentives to reduce agencyproblems). For example, some firms specifically set standard costs below expected actualcosts. One reason for biasing the standard cost downward is to exert more pressure onmanagers to eliminate waste and other operating inefficiencies. Other firms set standardcosts above expected actual costs in order to prevent setting selling prices too low.
The choice of tight versus loose standards often involves trading off decision control(tight standards) for decision management (loose standards). Decision managementrequires assembling the specialized knowledge that often resides only with the person orunit of the firm that later will be judged by the standard (decision control). For example, thepurchasing department has the specialized knowledge required to set the standard price ofraw materials used in the manufacturing process. But if the purchasing department also hasthe decision rights to set the standard price, then the standard becomes less useful inevaluating the performance of the purchasing department manager. One solution is toseparate decision management (setting the standard) from decision control (ratifying andmonitoring the standard).
Usually, the accounting or industrial engineering departments have the decisionmanagement rights to set or change the standards. The individuals responsible for the
12 min./bd. *
(5 + 1)
5= 14.4 min.
1.25 bd. ft. * (5 + 1)
5= 1.50 bd. ft.
zim36725_ch12_554-591.qxd 12/15/09 2:26 PM Page 559

standard cost variance have some decision ratification rights over the standards. Standardsare then reviewed and revised each year as part of the annual budgeting cycle. Industrialengineering, purchasing, human resources, accounting, top management, and linemanagers with specific cost responsibility usually are involved in the standard setting andrevision process.
Most firms are very reluctant to change standards during the year. Once a standard isset at the beginning of the year, it is rarely revised during the year. Managers are heldaccountable for the standard cost variance. The only exception to this practice occurs whenthere is a large, unexpected change in a standard. For example, oil is an important input inplastics. If oil prices suddenly jump, the standard cost of plastic is too low. If managersinside the firm continue to use the old standard cost of plastic for internal operatingdecisions, they will not respond to relative price changes and decision management will becompromised. However, if standards are revised frequently during the year, operatingmanagers have less incentive to control costs. Unfavorable variances can be avoided bychanging the standards. Therefore the decision to revise standards during the year again
560 Chapter 12
ManagerialApplication:StandardCosting atParker Brass
Parker Brass, a subsidiary of Parker Hannifin Corporation, manufactures tube and brassfittings, valves, hose, and hose fittings. Parker Brass uses its standard costing systemas an important business tool to target problems so it can develop solutions for continu-ous improvement. If a standard cost variance exceeds 5 percent of sales for that businessunit, the manager must explain the cause of the variance and construct a correctiveaction plan to solve the problem. Variance reports are prepared the day after each job isclosed. Variances greater than $1,000 are listed on exception reports. Weekly summaryreports show each variance in dollars as well as by product line and each batch withinproduct line. Managers use the reports to explain to the production employees eachvariance and the earnings statements for each business unit. These meetings educate theproduction people about how their production decisions affect business unit profits.
SOURCE: D Johnsen and P Sopariwala, “Standard Costing Is Alive and Well at Parker Brass,” Management AccountingQuarterly, Winter 2000, pp. 10–20; www.Parker.com/brassprod/.
560 Chapter 12
ManagerialApplication:Target Costingin Practice
Numerous multinational companies such as Boeing, Caterpillar, and Nissan employ tar-get costing. Nissan first determines the target price to attract potential buyers to the newcar model being designed. After deducting the desired profit margin from this targetprice a target cost is derived. An estimating group then decomposes the target cost forthe product as a whole into cost targets for subassemblies and individual componentparts—engine, transmission, sound system, seats, and so forth. This is where the battlebegins. Invariably a “gap” exists between the target cost and cost projections for the newproduct based on current designs and manufacturing capabilities. Closing this gapthrough cost reduction is key to the target costing process. An intense negotiatingprocess begins between the company and its outside suppliers, and among departmentsthat are responsible for different aspects of the product. The sum of the initial estimatesmay exceed the overall target cost by 20 percent or more. By the time the battle is over,compromises and trade-offs by product designers, process engineers, and marketing spe-cialists generally produce a projected cost that is close to the original target.
SOURCE: D Swenson, S Ansari, and J Bell, “Best Practices in Target Costing,” Management Accounting Quarterly, Winter2003, pp. 13–17.
zim36725_ch12_554-591.qxd 12/15/09 2:26 PM Page 560

Standard Costs: Direct Labor and Materials 561
involves the trade-off between decision management and decision control. Frequentrevisions of standards improve decision management but harm decision control.
The traditional approach for deriving standard costs is a bottom-up technique. Usually, themanager who will be held responsible for meeting the standard submits an initial estimate,which is reviewed and ratified by industrial engineers, controllers, and high-level man-agers. Sometimes industrial engineering submits the initial estimate of the standard. In allcases, setting and revising standards involves assembling specialized knowledge fromvarious individuals in the firm. The standard cost of each factor input is estimated and thestandard cost of the complete product is built up from the sum of these individual standardcosts.
Target costing is usually a top-down approach conducted during new product plan-ning. It starts with the long-run price (often estimated by the marketing department)required to achieve a desired market share. From this price, the required return on investment(profit) is subtracted to derive a total target product cost. Or
Target cost � Target price � Target profit
This total target cost is then broken down into subcomponent costs, including selling anddistribution costs. These subcomponent costs become the targets or standards to beachieved if the firm is to meet its goals for market penetration and return on capital. Thetarget costs become part of the performance evaluation system.
For many products, once the product is designed, most of the opportunities to reducethe cost of the product are gone. The only way to reduce the costs is to redesign the product.Unlike traditional cost control systems, which do not control costs until production begins,target costing requires aggressive cost management during planning, product design, andproduction. Target costing focuses management’s attention on cost control during thecritical design stage when most costs are controllable.
Setting standards is similar to the budgeting process (Chapter 6) in that both processesforce the communication of specialized knowledge. Setting and revising the standards arein fact part of budgeting. Consider the example of Nissan’s use of target costing. Setting thetarget cost of all parts comprising the car forces the product designers, manufacturing
3. Target Costing
ManagerialApplication:ChangingOrganizationalArchitectureand TargetCosting
This book emphasizes that successful firms rarely change just one leg of their three-legged organizational stool. When one leg is changed (adopting target costing), otherlegs (decision rights assignment and performance rewards) must also be changed. Con-tinental Teves (formerly ITT Automotive Division), one of the world’s largest suppliersof auto parts, such as antilock brake systems, adopted target costing. The companyformed cross-functional teams (a change in the decision rights assignment) to do valueengineering to reduce costs during design and preproduction stages. The cross-functionalteam consists of members from purchasing, production, engineering, cost targeting, andfinance. The team has decision rights to set the target cost (subject to review and rati-fication by senior management) and is empowered to find the optimal processes, out-sourcing, materials used, tooling, and capital investment. Target costing at ContinentalTeves is a team-oriented approach where the team is held responsible for the targets setand the development of further cost-reducing methods.
SOURCE: G Schmelze, R Geier, and T Buttross, “Target Costing at ITT Automotive,” Management Accounting. December1996, pp. 26–30; D Swenson, S Ansari, and J Bell, “Best Practices in Target Costing,” Management Accounting Quarterly,Winter 2003, pp. 13–17.
zim36725_ch12_554-591.qxd 12/15/09 2:26 PM Page 561

engineers, and marketing people to make trade-offs. In the process of making thesecompromises, specialized knowledge from throughout the firm is shared.
Once standards are set, the variance, or difference between standard and actual cost, isused to judge performance. It is important to keep in mind that the variances described hereare generic to a wide range of applications. Any given department, plant, and company willnot use all of the variances described and will invent others. The variances used will be tai-lored to the organization’s specific requirements and become an important component ofthe firm’s organizational architecture.
Q12–1 Define standard cost.
Q12–2 Name three areas in which standard costs can be used inthe decision-making process.
Q12–3 Can standard costs be viewed as a proxy for opportunitycosts?
Q12–4 How do standard costs illustrate the trade-off betweendecision making and control?
Q12–5 What is target costing? How does it differ from traditionalstandard costing?
ConceptQuestions
562 Chapter 12
B. Direct Labor and Materials VariancesOnce standard costs are estimated, they can be used for decision management and control.This section describes how direct labor and materials cost variances are calculated and howthey are used for decision control. Direct labor and materials variances are very similar.
ManagerialApplication:KaizenCosting
A number of Japanese car companies have adopted an elaborate system of continuouscost improvement called Kaizen costing. Such systems used by Toyota and Daihatsu startwith a companywide cost reduction goal, say 5 percent. This goal applies to the variablecosts (fixed cost reduction goals are set separately). For example, suppose a particular carmodel has a variable cost base of $9,000 and the company sets the goal to reduce this by5 percent next year, to $8,550. Each plant is then assigned a target reduction rate. Someplants may be asked to reduce their variable costs by 6 percent and others by 4 percentdepending on the plant’s particular circumstances. Each plant then disaggregates itsplantwide target rate reduction into individual targets by department, such that if eachdepartment meets its target, the plant will meet its goal. Each department’s annual costreduction target is translated into a monthly goal of usually one-twelfth the annual goal.If a particular department is to reduce its unit variable cost by $18 for the year, January’sgoal is $1.50 (or $18 � 12). Monthly variance reports are prepared for each departmentcomparing actual costs to the cost reduction targets.
Kaizen costing is a very aggressive scheme to reduce costs. It usually follows targetcosting, which is performed while the product is still in development. Once the productis being manufactured, Kaizen costing seeks to continually find further cost reductionopportunities.
SOURCE: Y Monden and J Lee, “How a Japanese Auto Maker Reduces Costs,” Management Accounting, August 1993,pp. 22–26; L Ellram, “The Implementation of Target Costing in the United States: Theory versus Practice,” Journal ofSupply Chain Management, February 2006, pp. 13–26.
zim36725_ch12_554-591.qxd 12/15/09 2:26 PM Page 562

Standard Costs: Direct Labor and Materials 563
The difference between what the direct labor actually costs and what it should have cost(the direct labor variance) can be disaggregated into wage and efficiency variances in thefollowing fashion:
Direct labor variance � Actual cost of labor � Standard cost of labor
� (Actual wage � Actual hours) � (Standard wage � Standard hours)
� (Actual wage � Standard wage) � Actual hours � (Actual hours � Standard hours) � Standard wage
� Wage variance � Efficiency variance
Suppose that in producing the Smith art book (Table 12–1), 85 typesetter hours wereused at a wage of $15.40 per hour. Actual typesetter cost was thus $1,309, instead of the$1,200 standard cost. The typesetting labor had a $109 U variance from standard. Thisvariance can be further disaggregated:
Wage variance ($15.40 � $15.00) � 85 $ 34 UEfficiency variance (85 � 80) � $15.00 75 U
Typesetter labor variance $109 U
This analysis indicates two reasons why typesetter labor costs exceeded standard:(1) $0.40 more per hour was paid than expected, and (2) five more typesetter hours wereused than expected. If management believes that the standards are correct, then the type-setter labor variances indicate that the person responsible for assigning typesetters to theSmith art book assigned typesetters with a higher actual wage rate per hour than expectedand that the person responsible for supervising the typesetters allowed more typesettinghours than expected. The costs of these two “errors” are $34 for paying too much per hourand $75 for using too many hours. Clearly, the ability to draw these inferences depends onwhether the standards represent what the typesetting wage rates should have been and howmany hours of typesetting should have been used.
Notice that the wage and efficiency variances are calculated after the Smith art bookjob is completed. The variances pertain to the entire batch of 1,000 books.
The foregoing analysis is illustrated graphically in Figure 12–1, where W denotes thewage rate, H denotes hours, subscript a denotes actual amounts, and subscript s denotesstandard amounts. The rectangle Ws � Hs represents what the labor should have cost, andthe rectangle Wa � Ha represents what the labor actually cost. The total typesetting laborvariance is the difference between what the typesetting actually cost and what it shouldhave cost, Wa Ha � Ws Hs. This difference is the shaded area in Figure 12–1, which isdisaggregated into a wage variance (the top shaded rectangle) and an efficiency variance(the shaded rectangle on the right).
The total labor variance can be disaggregated algebraically as follows:
Total labor variance: WaHa � WsHs
Wage variance: (Wa � Ws) � Ha
Efficiency variance: (Ha � Hs) � Ws
1. Direct LaborVariances
zim36725_ch12_554-591.qxd 12/15/09 2:26 PM Page 563

564 Chapter 12
Wage per hour, W
Hours of work, H
Wa
Ws
Hs Ha
Wage variance
Efficiency variance
Wa is the actual wage. Ha is the actual hours.Ws is the standard wage. Hs is the standard hours.
Total labor variance = WaHa � WsHs Wage variance = (Wa � Ws) � Ha Efficiency variance = (Ha � Hs) � Ws
FIGURE 12–1
Direct laborvariances
2 Algebraically (Wa � Ws) Ha � (Ha � Hs)Ws � WaHa � WsHa � WsHa � WsHs � WaHa � WsHs.
Notice that the sum of the wage variance and the efficiency variance is the total type-setting labor variance:2
Wage variance � Efficiency variance � Total labor variance
Referring back to the standard cost sheet for the Smith art book (Table 12–1), supposethat 50 hours of printers are used at a cost of $41 per hour. To calculate the printers’ laborvariances, we apply the preceding formulas:
Total printer labor variance:
WaHa � WsHs � ($41 � 50) � ($40 � 55) � $2,050 � 2,200
� �$150 F
Wage variance: (Wa � Ws) � Ha � ($41 � 40) � 50 � $50 U
Efficiency variance: (Ha � Hs) � Ws � (50 � 55) � $40 � �$200 F
Notice that the wage variance is unfavorable since the actual wage rate exceeds thestandard wage rate. However, the efficiency variance is favorable, as denoted by the minussign. Actual printer hours were less than standard. The minus sign occurs because wedefined the variance as the difference between actual and standard. (Had we defined thevariance as the difference between standard and actual, then a minus sign would denote anunfavorable variance. It is arbitrary whether the variance is calculated as the algebraicdifference between actual and standard or as the algebraic difference between standard andactual as long as there is consistency.)
zim36725_ch12_554-591.qxd 12/15/09 2:26 PM Page 564

Standard Costs: Direct Labor and Materials 565
Exercise 12–2
A CPA firm estimates that an audit will require the following work:
Type of Auditor Expected Hours Cost per Hour Standard Costs
Manager 10 $50 $ 500Senior 20 40 800Staff 40 30 1,200
Totals 70 $2,500
The actual hours and costs were as follows:
Type of Auditor Actual Hours Actual Cost per Hour Actual Costs
Manager 9 $52 $ 468Senior 22 38 836Staff 44 30 1,320
Totals 75 $2,624
Required:
Calculate the direct labor, wage rate, and labor efficiency variances for each type of auditor.
Solution:
The direct labor variance for each type of auditor is
Direct LaborType of Auditor Actual Costs Standard Costs Variance
Manager $ 468 $ 500 $(32) FSenior 836 800 36 UStaff 1,320 1,200 120 U
Totals $2,624 $2,500 $124 U
The wage rate variance for each type of auditor is
Manager ($52�hour � $50�hour)(9 hours) $ 18 USenior ($38�hour � $40�hour)(22 hours) (44) FStaff ($30�hour � $30�hour)(44 hours) 0
Total wage rate variance $(26) F
continued
zim36725_ch12_554-591.qxd 12/15/09 2:26 PM Page 565

The labor efficiency variance for each type of auditor is
Manager (9 � 10 hours)($50�hour) $ (50) FSenior (22 � 20 hours)($40�hour) 80 UStaff (44 � 40 hours)($30�hour) 120 U
Total labor efficiency variance $150 U
As a check of the calculations of the wage rate and labor efficiency variances, notice that the
total variance on this audit is $124 U ($2,624 � $2,500). The total wage rate variance ($26 F)
plus the total labor efficiency variance ($150 U) sum to the total variance ($124 U).
Large variances, either favorable or unfavorable, can mean that the system is out ofcontrol. An accounting variance can indicate that either the operating unit deviated from theprescribed standard or that faulty assumptions were used to develop the standard. In the firstcase, supervisors of the direct labor did not operate at the levels assumed in the standards. Inthe second case, the standards were set at a level that could not be attained. If the standardsare set as biased forecasts of future expected wages and labor hours, then future accountingvariances will reflect the extent of the bias built into the standards when they wereestablished.
Just because a large unfavorable variance is reported does not mean that the personresponsible is performing below expectations. The standard could be set at an unrealistic,unattainable level. Also, actuals and standards will deviate due to random causes. Smallvariances (favorable/unfavorable) are probably not worth senior management’s time toinvestigate. If a variance is small, the costs of investigating the variance will probablyexceed the benefits of learning its cause. Clearly, the decision to investigate a variancedepends on the inherent variability (uncertainty) of the item. Variances from standardssubject to greater variability require a greater threshold before they are investigated.
Large favorable variances are not necessarily good news because they could mean thatquality is being reduced. For example, one way to generate favorable labor efficiencyvariances is to use too few labor hours and produce lower-quality products. Likewise,favorable wage variances might mean that less-skilled, lower-paid employees were usedmore than expected; this too can compromise product quality. The human resourcedepartment is held responsible for the wage variance if that department has the decisionrights for hiring employees with given job skills at a given standard wage rate. In othercases, the shop floor supervisor is held responsible for wage variances if the supervisor canschedule different employees with varying skills and wage rates to produce the product. Ifthe supervisor can change the mix of employees and thus the cost of the job by substitutingmore- or less-skilled employees at different wage rates, then he or she is usually assignedthe total direct labor variance and there is no reason to separately compute a wage varianceand an efficiency variance except to provide information about what caused the laborvariance. The extent to which wage and efficiency variances are used to measure perfor-mance and the weight they receive in a manager’s performance evaluation depend on threethings: the reliability of the underlying standards, the inherent variability of the wages andhours due to random fluctuations, and how much of the variance is potentially controllable
566 Chapter 12
zim36725_ch12_554-591.qxd 12/15/09 2:26 PM Page 566

Standard Costs: Direct Labor and Materials 567
by the manager. Some firms place large weight on variances in performance evaluation;other place little or no weight on them.
Direct materials variances are identical to those computed for direct labor, with one excep-tion that will be introduced later. Figure 12–2 portrays the material variances. P denotes theunit price of the material, Q denotes the quantity of the material, and the subscripts a and sagain denote actual and standard amounts, respectively. As with direct labor, the totalmaterials variance can be disaggregated into a price variance and a quantity variance.
The analysis in Figure 12–2 assumes that all purchases are used immediately forproduction; there is no raw materials inventory. (This assumption is relaxed later.)However, in the usual case, raw materials are purchased for inventory and then released toproduction as called for by the production schedule. Only in a just-in-time productionsystem or in custom manufacturing are raw materials received and used simultaneously. InFigure 12–2, the total variance is the difference between what the material actually cost andwhat it should have cost, PaQa � PsQs. As in Figure 12–1, this difference is disaggregatedinto two variances: a price variance and a quantity (usage) variance. The price variance, (Pa � Ps)Qa, is typically reported to the purchasing manager and is one measure of the pur-chasing manager’s performance. Other performance measures for purchasing might includethe percentage of on-time delivery of materials and the quality of materials. The materialsquantity variance, (Qa � Qs)Ps, is the difference between actual and standard quantity timesstandard price. It measures the inefficient or efficient use of materials. The quantityvariance is reported to the manager responsible for the efficient use of materials (usuallythe shop supervisor) and is one performance measure of this manager.
The price variance and quantity variance are often interrelated. For example, ifsubstandard materials are purchased at a price below the standard price, usually anunfavorable materials quantity variance is generated because more materials than standardare used. If a less-expensive exterior house paint is purchased, more of it will probably berequired to provide the same coverage as a higher-quality, higher-priced paint. A variance
2. DirectMaterialsVariances
Price per unitof material, P
Units of material, Q
Pa
Ps
Qs Qa
Price variance
Quantity variance
Ps is the standard price. Qs is the standard quantity.Pa is the actual price. Qa is the actual quantity.
Total materials variance = PaQa � PsQs Price variance = (Pa � Ps) � Qa Quantity variance = (Qa � Qs)� Ps
FIGURE 12–2
Direct materialsvariances (materialsused as purchased)
zim36725_ch12_554-591.qxd 12/15/09 2:26 PM Page 567

in one area is likely to be related to other variances. A favorable price variance might causean unfavorable quantity variance, or a favorable labor quantity variance might be the resultof another unfavorable labor quantity variance if one type of labor is substituted foranother. A favorable materials price variance and a resulting unfavorable materials quantityvariance can cause unfavorable labor efficiency variances if extra material and labor areused due to the substandard materials. A less-expensive exterior house paint requires morelabor to apply the extra coats. Therefore, to assess performance in the manufacturingprocess, all the variances must be analyzed as an integrated whole.
In a standard cost system, materials are recorded in the raw materials inventoryaccount at standard cost. That is, inventory is stated at standard price, not actual price. Theprice variance is recorded in a separate ledger account, which is usually written off to costof goods sold at the end of the year instead of flowing through inventory and product costs.For example, suppose 100 pounds of copper are purchased for $12 per pound when thestandard price is $10 per pound. The purchase is recorded in the raw materials inventoryaccount at $1,000 and the $200 difference is recorded in a separate materials pricevariance account. Future products using this copper are charged $10, not $12, per pound.When the $200 is recorded in a separate materials price variance account and written off tocost of sales directly, the unit costs of the products using the copper are not distorted by the$2-per-pound price variation.
Figure 12–3 depicts the case in which raw material is bought, placed in raw materialsinventory, and then used at a later date. In Figure 12–3, the price variance is removed assoon as the raw material is purchased. The raw materials inventory is then stated at standardcost, Ps. The price variance is reported as soon as the material is bought, not when it is usedat some later date. Once the price variance is removed at purchase, all the remainingwithdrawals from the raw materials account are stated at the same standard cost per unit.
Timely reporting of price variances is important so managers can act quickly tomitigate or capitalize on the price change. For example, if a raw material’s price rises,managers might want to use less of the more expensive material and more of a relativelyless expensive material, if such substitution is possible. Or management might want to raisethe selling price of the final product.
568 Chapter 12
Price per unitof material, P
Units of material, Q
Pa
Ps
Qb
Price variance
Raw materials inventory
Pa is the actual price. Qb is the actual quantity bought.Ps is the standard price.
Price variance = (Pa � Ps) � Qb
FIGURE 12–3
Direct materialsvariances (materialspurchased but notused yet)
zim36725_ch12_554-591.qxd 12/15/09 2:26 PM Page 568

Standard Costs: Direct Labor and Materials 569
Figure 12–4 represents how the raw material purchased is divided up after some of theraw material is used in production. If Qb units are purchased and Qa units are actually usedin production, then Qb � Qa units are left in raw materials inventory. These are valued at Ps , standard cost. Thus, the vertical rectangle on the right-hand side of Figure 12–4, (Qb � Qa)Ps, is the dollar value of the raw material remaining in the raw materials inventoryaccount. Likewise, the dollar amount of raw materials transferred to work in process isPsQs, the standard price at the standard quantity (i.e., the unshaded rectangle).
Notice that Figure 12–4 has three quantity measures on the horizontal axis: standardquantity, actual quantity used in production, and quantity bought. The standard quantity, Qs,is the number of units of output produced times the standard quantity of raw materials thatshould have been used per unit of output. The actual quantity (Qa) is the number of units ofthe raw material actually used to produce the product. The quantity bought (Qb) is the num-ber of units of the raw material actually purchased. Suppose three pounds of fiberglass cordis the standard quantity per automobile tire. In May the plant purchased 98,000 pounds offiberglass cord and manufactured 30,000 tires using 95,000 pounds of fiberglass cord. Thethree quantity measures are as follows:
Standard quantity (30,000 tires � 3 pounds per tire) 90,000 pounds
Actual quantity 95,000 pounds
Quantity bought 98,000 pounds
It is important to understand that the standard quantity of raw materials, 90,000 pounds,is the number of actual tires produced (30,000 tires) times the standard amount of fiber-glass cord per tire (three pounds per tire). Standard quantity is the amount of cord thatshould have been used to produce the 30,000 tires.
Recall that when raw materials are purchased for inventory and then issued intoproduction as needed, the price variance is computed based on the total units bought. InFigures 12–3 and 12–4, the price variance is based on Qb. The price variance is stripped out
Pa is the actual price. Qa is the actual quantity used in production.Ps is the standard price. Qs is the standard quantity used in production. Qb is the actual quantity bought.
Price variance = (Pa � Ps) � Qb Quantity variance = (Qa � Qs) � Ps
Price per unitof material, P
Units of material, Q
Pa
Ps
Qs Qa Qb
Price variance
Quantity variance
Raw materialsinventory
In W-I-P inventory
FIGURE 12–4
Direct materialsvariances (materialspurchased and usedlater)
zim36725_ch12_554-591.qxd 12/15/09 2:26 PM Page 569

of the total amount paid for the raw material, and the raw materials inventory account isstated at the standard price of the raw material.
The total amount paid for the raw materials, PaQb, is disaggregated into four pieces, asillustrated in Figure 12–4: the price variance, the amount transferred to work in process, thequantity variance, and the amount remaining in raw materials inventory. The only differ-ence between Figures 12–4 and 12–2 is that the price variance is calculated based on totalunits bought (Figure 12–4) versus units used (Figures 12–2).
Exercise 12–3
Thirty-six thousand pounds of plastic pellets were purchased for $8,640. These pellets are used
in injection-molding machines to produce plastic parts. The pellets have a standard cost of $0.25
per pound. Thirty thousand pounds of these pellets were used in two jobs. The first job called for
14,000 pounds of pellets but actually used 15,000 pounds.The second job also used 15,000 pounds,
but it called for 15,500 pounds. The company uses a standard cost system, calculates price vari-
ances at purchase, and had no beginning inventory of this plastic pellet.
Required:
At the end of the two jobs and before any more of the plastic pellets are used (and before
prorating or writing off any variances), prepare a table that indicates the financial disposition
of the historical cost of the pellets. (That is, account for the $8,640.)
Solution:
The original purchase price of the pellets, $8,640, represents a purchase price of $0.24
($8,640 � 36,000 pounds). The $8,640 can be broken down into the following pieces:
570 Chapter 12
ManagerialApplication:E-Sourcing toControlPurchasingExpense
To better control purchasing and procurement costs, many companies are turning to“spend management,” a broad category that includes e-sourcing, e-procurement, e-invoicing, and supplier relationship management (SRM) software and services.Spend-analysis software tracks exactly what the firm is buying and from whom. Globalcompanies with decentralized divisions often have multiple suppliers for the sameproduct or have different divisions that unknowingly use the same supplier. By consoli-dating and centralizing purchasing, the firm can capture volume discounts previouslymissed.
The first step involves establishing a comprehensive firmwide supplier data base.MetLife’s procurement head count is 10 percent lower because it now orders 95 percentof goods through self-serve online catalogs. Because suppliers find it easier to do busi-ness with MetLife, they offer better pricing, and the procurement staff has more time forstrategic projects.
This is another example of how technological innovation (e-sourcing and e-procurement) causes firms to change their organizational architecture (decision rightassignments and incentive systems).
SOURCE: Y Ghahremani, “Better Ways to Buy,” CFO, September 2008, pp. 65–70.
continued
zim36725_ch12_554-591.qxd 12/15/09 2:26 PM Page 570

Standard Costs: Direct Labor and Materials 571
Price variance ($0.24 – 0.25) � 36,000 $360FQuantity variances
First job (15,000 – 14,000) � $0.25 250USecond job (15,000 – 15,500) � $0.25 125F
Favorable variances ($235)Pellet cost in W-I-P (14,000 � 15,500) � $0.25 7,375Raw material inventory (36,000 – 30,000) � $0.25 1,500
Total accounted for $8,640
NOTE: F = Favorable; U = Unfavorable.
Insurance and capital markets reduce risk through diversification. Stock options, interestrate swaps, and commodity futures allow investors to hedge risk. Thus, risk reduction is animportant service individuals are willing to buy from financial markets. Standard cost sys-tems also provide a mechanism inside the firm to reduce certain risks managers bear be-cause their compensation is linked to accounting-based performance measures.
Recording labor and materials at standard cost strips out price and quantity(efficiency) deviations and places them into variance accounts. Then downstream users inthe plant see only standard costs. Stripping out price and efficiency fluctuations reduces therisk borne by downstream “purchasers” of the product, such as the marketing department.Downstream users know at the beginning of the year what they will be charged for finalproducts throughout the year. If raw materials prices or wage rates change, or if material orlabor is used more (or less) efficiently than originally planned, downstream managers donot bear the risk of these deviations. Thus, standard costs remove some uncontrollable fac-tors from the performance measures of downstream users. Because they bear less risk,these managers do not have to be paid higher salaries to compensate them for bearing thisadditional risk. Hence, total compensation can be lower.
Q12–6 What are the three sets of standard cost variances producedby most firms?
Q12–7 What are the two components of direct labor variances?
Q12–8 When might large favorable variances be viewed as bad?
Q12–9 What are the components of the direct materials variance?
C. Incentive Effects of Direct Labor and Materials VariancesStandard costs and variances, when used as part of the performance evaluation system,create incentives for managers to control costs; this is one of their intended purposes.Standards are part of the performance evaluation system, as described in Chapter 4.However, if the standard cost system is not designed properly and integrated consistentlywith the other parts of the performance evaluation and reward systems and the decision-partitioning system, then dysfunctional behavior can result. The fault does not lie with thestandard cost system per se but rather in how it is implemented within the particular firm.
ConceptQuestions
3. RiskReduction andStandard Costs
zim36725_ch12_554-591.qxd 12/15/09 2:26 PM Page 571

(Similarly, modern pharmaceuticals are extremely important in treating disease, but theycan be misused as well.)
Standard cost variances create subtle incentive effects. This section describes five: buildinventories, externalities, discouraging cooperation, mutual monitoring, and satisficing.
When purchasing managers are evaluated based on direct materials price variances, theyhave an incentive to build inventories. Price discounts are often granted for volumepurchases. Therefore, one way to generate favorable price variances is to purchase rawmaterials in lots larger than necessary for immediate production and hold these inventoriesuntil they are needed.
Inventory generates warehousing, materials handling, obsolescence, and financingcosts. When purchasing managers are rewarded based on favorable price variances, quan-tity discounts will often lead to buying raw materials in larger-than-optimum lot sizes. Pur-chasing large quantities lowers materials costs, which are included in accounting earnings.However, the opportunity cost of capital tied up in inventory is not included in accountingearnings. Moreover, the costs of warehousing the inventories and insuring them are often ingeneral factory overhead and are neither traced nor allocated to specific inventories.
One way to reduce the incentive to hold large inventories is to charge the purchasingdepartment for inventory holding costs. For example, if the firm’s opportunity cost ofcapital is 13 percent and warehousing and handling costs are 15 percent, then charging thepurchasing department 28 percent of the average dollar balance in raw materials inventoryreduces the incentive to purchase in large lots. In other words, the performance report forthe purchasing department should include the sum of all favorable and unfavorable pricevariances generated during the period as well as the inventory holding costs.
Most firms do not charge purchasing managers for inventory holding costs becausesuch costs then have to be backed out of the various accounts for external reportingpurposes. An alternative mechanism for controlling dysfunctional inventory building is toadopt just-in-time (JIT) purchasing rules. That is, the purchasing department can ordermaterials only as they are needed for production.
Purchasing managers can impose externalities on production by purchasing substandardmaterials. Recall from Chapter 7 that externalities are costs (or benefits) that one depart-ment imposes on another (without being charged). Lower-quality materials often requiremore labor hours and more skilled workers (paid higher wages) to process them. Thesubstandard materials impose costs on the downstream production managers becauseadditional production resources are consumed for rework or machine downtime. To offsetthe purchasing manager’s incentive to acquire low-quality raw materials, purchases areinspected when received, engineering specifications are set for each product, and purchas-ing is not allowed to buy materials that deviate from these standards. Alternatively, part ofthe purchasing manager’s performance evaluation can be tied to the amount of reworkgenerated in production and/or the raw materials quantity variance. In this last case, whenperformance is judged in part on the outcomes in manufacturing, purchasing managers areforced to bear some of the costs they impose on manufacturing when they purchasesubstandard materials. However, the purchasing manager is responsible for only part of anymanufacturing variances. So we would expect to see purchasing managers evaluated basedon manufacturing variances only when purchasing substandard materials can impose alarge cost on manufacturing.
Production managers impose externalities on purchasing by requesting that materialsbe purchased on short lead times and in small lot sizes to reduce the quantity of materialsin storage. By making frequent design changes, engineering can increase the actual price
2. Externalities
1. BuildInventories
572 Chapter 12
zim36725_ch12_554-591.qxd 12/15/09 2:26 PM Page 572

Standard Costs: Direct Labor and Materials 573
of the purchases. These are just a few examples of the types of externalities that purchasingand production can impose on each other.
Evaluating individuals within an organization based on variances can discourage coopera-tive effort. In some firms, employees are evaluated and rewarded based on a laborefficiency variance. Such systems often cause the employees to be reluctant to supportothers if their evaluation reflects only what they produce as an individual.
An alternative is to measure variances for a team or department within the organiza-tion. Team performance measures encourage cooperative effort but can lead to shirking (thefree-rider problem) by some individuals. For example, a group project for a class is given asingle grade that is shared by all the students in the group. Some individuals will take ad-vantage of the group grading system by shirking their duties, because they know other re-sponsible students in the group will complete the group task.
To encourage cooperative effort and reduce shirking, many organizations measureperformance and calculate variances at multiple levels. For example, an individualworker would be evaluated based on an individual labor efficiency variance and a depart-mental labor efficiency variance. Bonuses would be paid for both individual and groupaccomplishments.
The usual method of monitoring behavior within firms is for superiors to monitor subordi-nates. But another important form of monitoring occurs between managers who are not ina direct reporting relationship with each other. Monitoring can occur between managers atthe same level in the same subunit or between managers in different subunits. Sometimesmanagers or employees at the same level monitor each other; this is called mutualmonitoring. (Examples of mutual monitoring via noninsulating cost allocations weredescribed in Chapter 7.)
If the purchasing department manager is held responsible for materials variances(including the quantity variance), then the purchasing manager has the incentive to monitorthe production supervisor’s usage of materials. Likewise, the production supervisor moni-tors the quality of the materials bought by the purchasing manager. Basing the purchasingmanager’s performance evaluation on both the price and quantity variances encourages thepurchasing manager to help devise ways in which the production manager can economizeon materials. The performance evaluation and reward systems can be designed to containmutual monitoring incentives that encourage managers to acquire and use their specializedknowledge to improve the performance of other managers.
If standards are used as a benchmark for evaluating managers, the reward system is oftentied to achieving the standard. If the manager works sufficiently hard to achieve the stan-dard, a bonus is often paid to the manager. The problem with this type of reward system isthat managers have incentives to achieve the standard, but little incentive to go further. Thisis often referred to as satisficing behavior.3 The ratchet effect described in Chapter 6 pro-vides a further disincentive to perform beyond the standard. Next year’s standards are usu-ally based on past performance and therefore will be harder to achieve if they are raised dueto exceptional performance this year. The organization, of course, would like managers tocontinually improve and not stop when the standard is met.
5. Satisficing
4. MutualMonitoring
3. DiscouragingCooperation
3 Technically, satisficing refers to selecting actions that are satisfactory, not optimal, because finding theoptimum is too difficult. Instead of searching for the sharpest needle in the haystack, the haystack is searchedfor a needle sharp enough for sewing. See J March and H Simon, Organizations (New York: John Wiley & Sons,1958).
zim36725_ch12_554-591.qxd 12/15/09 2:26 PM Page 573

Firms must respond to their competitors. If managers focus only on achieving thestandard and ignore competition, the organization will not change to meet new demands.Rewarding managers for simply achieving the standards tends to make the managers thinkthat the status quo is appropriate; it stifles innovation. Therefore, rewarding managers formeeting the standard is less appropriate in industries that are rapidly changing with new,innovative products. The problem is not so much with using standards as performance mea-sures but rather in how the compensation schemes reward performance. Compensationschemes should motivate managers to continuously improve beyond the standard, withhigher payments for greater improvement.
Q12–10 What are some of the incentive effects when standard costvariances are used as part of the performance evaluationsystem?
Q12–11 Describe how price variances create incentives to buildinventories.
Q12–12 Describe some externalities created by standard costvariances.
D. Disposition of Standard Cost VariancesUp to this point, the discussion has focused on the calculation, interpretation, and incentiveeffects of standard cost variances for direct materials and direct labor. We have not dis-cussed what happens to the standard cost variances once they are calculated and recordedin the ledger accounts. Chapter 9 discussed three ways of disposing of over/underabsorbedoverhead: (1) writing it off to cost of goods sold, (2) allocating it among work in process,finished goods, and cost of sales, or (3) recalculating the cost of each job. The same optionsare also available for disposing of the labor and materials variances.
ConceptQuestions
574 Chapter 12
ManagerialApplication:ExternalitiesCreated byStandardCosting
Charles Machine Works, Inc., manufactures a line of underground trenching equipment.Under the old standard cost system, the standard cost variance report promoted a“pounds-in-the-barrel” mentality. Employees tried to beat their standard cost quotaswithout sufficient regard for quality. One worker said, “If I waste time testing for burrs,and if I find one (which requires redeburring and retesting), I’ll be held responsible fornot meeting my quota and for the unfavorable labor variance. If there is a burr, it won’tbe discovered for a long time, and there’s plenty of parts inventory on hand so assemblywon’t be hurt. By not testing for burrs, I can beat my quota and the standard timeallowed.”
To change employees’ incentives, management developed detailed variance controltables that relate quality problems detected later in the production process back to earlierprocesses causing the problem. For example, in step 23 where parts are assembled andtested, if hydraulic fluid leaks, this means that interior surface burrs were not deburredin step 7. The employee producing the bad parts in step 7 is held responsible for thesedefects.
SOURCE: M Thomas and J Mackey, “Activity-Based Cost Variances for Just-in-Time,” Management Accounting, April 1994,pp. 49–54; www.Ditchwitch.com.
zim36725_ch12_554-591.qxd 12/15/09 2:26 PM Page 574

Standard Costs: Direct Labor and Materials 575
Writing off all of the variances to cost of sales prevents the inventory accounts of workin process and finished goods from being affected. Product costs are not changed from stan-dard cost. In many firms, variances are written off to cost of goods sold and hence income.The alternative is to prorate the total amount of the standard cost variances to inventories(work in process and finished goods) and cost of goods sold. Writing off the variances to theincome statement is expedient. Writing off variances to cost of goods sold is easy and doesnot require detailed computations if there are numerous inventory accounts.
Exercise 12–4
Total materials variances for the year were $150,000 U. Total material purchased during the year
at standard cost was $1 million, which is now in the following accounts:
Raw materials inventory $ 100,000Work-in-process inventory 200,000Finished goods inventory 150,000Cost of goods sold 550,000
Total purchases $1,000,000
Required:
Prorate the materials variances to the various accounts.
Solution:
Purchases in Prorated AdjustedAccount % Variance Balance
Raw materials inventory $ 100,000 10% $ 15,000 $ 115,000Work-in-process inventory 200,000 20 30,000 230,000Finished goods inventory 150,000 15 22,500 172,500Cost of goods sold 550,000 55 82,500 632,500
Total $1,000,000 100% $150,000 $1,150,000
Since the total materials variance is unfavorable, too little materials cost was charged to products.
Thus, prorating this variance increases the balances in the inventory and cost-of-goods-sold
accounts. Had the variance been favorable, the account balances would be reduced by prorating.
There are also organizational reasons for writing off all of the variances to cost ofgoods sold and not restating product costs. As discussed in Chapter 9, when volumes fall,average unit costs rise if fixed overheads are allocated based on actual volume. Unfavorablepurchase price variances may occur if smaller lot sizes are purchased. Unfavorable laborefficiency variances usually result as employees are idle. If all of these unfavorable variancesare then prorated back to inventories, the managers responsible for selling these inventoriesare now confronted with higher reported product costs. Their first reaction is to try to raisethe selling price. But as illustrated in Chapter 9, this is usually the wrong thing to do.
zim36725_ch12_554-591.qxd 12/15/09 2:26 PM Page 575
When volumes are higher than normal, dysfunctional decisions can again result.Standard cost variances tend to be favorable, and prorating them to inventories lowersinventory costs. Therefore, one reason not to prorate cost variances is to avoid sendingincorrect signals to managers in the firm that marginal costs have changed when, in fact,they have not.
E. The Costs of Standard CostsStandard cost systems are costly to implement and operate. Not only must detailedstandards be maintained for each labor and material input, but these standards must berevised in a timely fashion. Rapid technological change and continuous improvementefforts (Six Sigma programs) cause standards to become obsolete. Workers tend to anchoron old standards rather than seeking continuous cost reductions. It is also expensive, interms of the opportunity cost of the manager’s time, to investigate cost variances. Managersshould investigate only those variances that indicate that the process is out of control andmanagement intervention is required. Investigating variances caused by random ortemporary fluctuations is usually not a productive use of a manager’s time. Managersusually examine only large variances.
However, there can be some value to investigating variances caused by random ortemporary fluctuations. To the extent that such an investigation creates a better understand-ing of the firm’s environment, the manager creates specialized knowledge. This specializedknowledge, when combined with decision rights, results in higher firm value if themanager is able to exploit some heretofore unrealized profit opportunity.
A large Japanese automobile parts supplier, Atsugi Motor Parts (an affiliate ofNissan), used detailed standard costing systems for over 25 years for cost control butdropped the system.4 Likewise, Toyota has abandoned standard costing. Several reasonsmay explain these changes. As factories become more automated, the fraction of directlabor in product costs falls. Since many standard cost systems were aimed at controllingdirect labor costs, the benefits of a standard cost system are smaller in more highlyautomated factories. Second, highly automated factories are no longer stable productionprocesses. New machines, technologies, and processes can be introduced more quicklybecause of flexible manufacturing systems. Frequent changes in products or processesrequire frequent revisions of the cost standards. For example, suppose a plant manufac-tures 15,000 different parts, and a typical part has 10 separate machining operations.Introducing new computer-controlled machines that perform work on 5 percent of theoperations requires that 7,500 standards be changed (15,000 � 10 � 5 percent), oftennecessitating detailed studies by industrial engineers. As the frequency of productchanges or process changes increases, the costs of maintaining a standard cost systemincrease. Therefore, flexible manufacturing systems appear to be causing some compa-nies to abandon standard cost systems because they increase the costs of standard costsystems and hence lower their value.
While Atsugi and Toyota have moved away from their standard cost systems, a surveyof companies in developing and developed countries concludes that most Japanese firmscontrive to rely on their standard costs.5 The authors conclude that standard costing is stillwidely used throughout the world despite rapid technological changes.
576 Chapter 12
4 M Sakurai, “The Influence of Factory Automation on Management Accounting Practices: A Study ofJapanese Companies,” in Measures for Manufacturing Excellence, ed. R Kaplan (Boston: Harvard BusinessSchool, 1990), pp. 46–48.
5 A De Zoysa and S Herath, “Standard Costing in Japanese Firms: Reexamination of Its Significance in theNew Manufacturing Environment,” Industrial Management & Data Systems 107, no. 2 (2007), pp. 271–83.
zim36725_ch12_554-591.qxd 12/15/09 2:26 PM Page 576

Standard Costs: Direct Labor and Materials 577
One U.S. textile manufacturer, Milliken, substantially revised its standard cost systembut did not eliminate it. The firm upgraded its computer and communication systems toimprove manufacturing productivity by monitoring the production process. Computer-aided manufacturing (CAM) provided detailed data on output per machine, downtime, andthe reason for the downtime. The CAM technology provides managers daily detailed,nonfinancial information such as set-up time. The availability of extensive nonfinancialdata generated by CAM allowed Milliken to simplify the existing variance reports andreduce the number of detailed cost standards estimated by industrial engineers, accoun-tants, and production managers. However, Milliken still relies on standard costs for pricingdecisions and performance evaluation. The experience at Milliken illustrates how account-ing systems are one part of the firm’s decision management and control systems. Whentechnological change allows improvements in other parts of the decision management andcontrol system, these changes are likely to affect the accounting system.6
While some companies may abandon their detailed standard cost systems, they are notlikely to abandon their annual budgeting process. Recall from Chapter 6 that budgeting isan important coordination mechanism for communicating specialized knowledge of prices,quantities, costs, and revenues within the firm. Annual budgets require managers to fore-cast next year’s cost structure. These costs, while not built on detailed standards, are stillaggregate standard costs. That is, instead of deriving the standard cost of a manufacturedpersonal computer as the sum of the detailed standard costs of each part and assemblyprocess, management derives next year’s standard cost by adjusting this year’s actual costsfor price changes and process changes. When firms say that they are abandoning their
6 J Edwards, C Heagy, and H Rakes, “How Milliken Stays on Top,” Journal of Accountancy, April 1989,pp. 63–74; www.milliken.com.
ManagerialApplication:LeanAccountingversusStandardCosting
Many lean accounting promoters contend that standard cost accounting systems nolonger make sense. “Traditional accounting was designed to support mass production.”Under lean manufacturing some nonfinancial measures including lead times, scraprates, and on-time deliveries show significant improvements, yet they aren’t captured bytraditional standard cost systems.
“Lean manufacturing” seeks to achieve the shortest possible production cycle byeliminating waste, reducing inventory, and producing only to meet customer demand.Benefits include lower costs, higher quality, and shorter lead times. “Lean accounting”better reflects the financial performance of a company that has implemented leanmanufacturing processes, including organizing costs by value stream and modifyingfinancial statements to include nonfinancial information.
Also, traditional financial statements treat inventory as an asset until it is sold.Lean manufacturers produce only to meet demand, and hence to significantly reduce in-ventories. Lean proponents argue, “Inventory is not an asset; you have handling costs,it takes up floor space, and it reduces cash flow. Inventory often becomes obsolete be-fore the company can sell it.”
Lean accounting advocates argue that the volumes of standard cost variances in tra-ditional financial statements make them nearly impossible for most nonfinancial peopleto understand. However, lean accounting advocates typically ignore the decision controlrole provided by standard cost variances, and focus almost exclusively on the decisionmanagement role.
SOURCE: K Kroll, “The Lowdown on Lean Accounting,” Journal of Accountancy, July 2004, pp. 69–76.
zim36725_ch12_554-591.qxd 12/15/09 2:26 PM Page 577

standard cost system, they usually mean they are no longer maintaining detailed standardquantities and standard prices for each part and production process. Rather, they are usingstandard costs at a more aggregate subassembly or product level for budgeting andperformance evaluation purposes.
A standard cost system must be designed carefully to maximize firm value. Carelesslydesigned standard cost systems that serve as performance evaluation schemes can lead todysfunctional behavior. For example, if too much emphasis is placed on labor efficiencyvariances, then incentives are created that can lead to large work-in-process inventories andplant scheduling rules that keep employees busy instead of producing products thatmaximize firm profits. In some plants, a few machines or manufacturing cells are thescarce resource or bottleneck. To maximize firm profits, these bottlenecks should be sched-uled to maximize the contribution margin per unit of scarce resource. Keeping nonbottle-necks operating at capacity does not increase throughput of the bottleneck and can actuallydecrease it if the excess inventory waiting to be processed clogs up the smooth flow of thehigh-contribution-margin units at the bottleneck.7
Q12–13 Why are variances usually written off to cost of goods sold?
Q12–14 What are some of the costs and benefits of standard costsystems?
Q12–15 Why are some firms dropping standard cost systems?
F. SummaryStandard costs of parts, processes, and subassemblies are set during the budgeting process before thefiscal year begins. The standard costs of products are then the agreed-upon costs accepted by variousunits of the organization for the repetitive exchanges among parties internal to the firm. Standardcosts and variance analyses are used for several reasons: (1) to provide information to senior man-agers regarding whether the system is in control or not, (2) to provide a basis for the performanceevaluation system, (3) to provide information to other managers in the firm regarding the normal orexpected (opportunity) cost of producing a repetitive activity, part, or product, and (4) for productpricing. Accounting systems using standard costs are an administrative device firms use becausemarket prices do not exist to guide internal production.
When actual costs differ from standard costs, standard cost variances filter out the differences,allowing only standard costs to flow downstream to other internal contracting parties. Thus, a properlydesigned standard cost system acts as a huge filtration mechanism that separates actual costs into theagreed-upon standard costs and variances. However, detailed standard cost systems are costly tomaintain, and industrial engineers are often required to update the numerous standards.
The variances described in this chapter are generic to a wide range of applications. However, nodepartment, plant, or company will use all of the variances described. They will use some of the variances,modify some, and invent others, because firms differ in the trade-offs they face between decision man-agement and control. Variances will be tailored to an organization’s specific requirements.
Standard cost systems can produce dysfunctional decision making if they are improperlydesigned and then used in conjunction with other performance evaluation and reward systems.Standard costs used in a performance reward system create incentives for managers to (1) changebehavior and maximize the performance measure and/or (2) manipulate the standards. The first optionis one purpose of the standard cost system. All too often, however, the second alternative occurs. Whena manager has input into setting a standard, basing the manager’s performance on beating that standard
ConceptQuestions
578 Chapter 12
7 www.wikipedia.org/wiki/Theory of Constraints.
zim36725_ch12_554-591.qxd 12/15/09 2:26 PM Page 578

Standard Costs: Direct Labor and Materials 579
creates incentives for that manager to bias the standard. This is not a failure of the standard cost systembut rather of the performance reward system.
Standard cost systems can produce functional or dysfunctional behavior. Moreover, the incentiveeffects can be very subtle. Building excess inventories, creating quality externalities, discouragingcooperation, mutual monitoring, and satisficing behavior are just some of the subtle behavioralchanges induced by standard costs used in conjunction with performance reward systems.
Standard cost systems are costly to maintain. Without offsetting increases in the systems’benefits, short product life cycles and rapid technological innovation increase the cost of standardcost systems and lower their value.
Self-Study ProblemInjection Molding Department
Injection molding has the following materials and direct labor standards:
Per Finished Lot
Materials 10 pounds @ $3.00/pound $30.00Direct labor 0.5 hour @ $20.00/hour 10.00
Total cost per lot $40.00
The number of finished lots produced for the period totaled 9,810. The following quantities wereused:
Actual materials 97,200 pounds usedActual direct labor 3,950 hours at a total cost of $81,765
During the month, purchases amounted to 100,000 pounds at a total cost of $310,000. Pricevariances are isolated upon purchase.
There were no beginning inventories.
Required:
a. Show computations of all variances.
b. Comment on the likely interpretation of each variance and describe what each means.
Solution:
a. Variances:
Materials Variances Labor Variances
Price variance � (Pa � Ps)Qa $0.10† � 100,000‡ � $10,000U $0.70* � 3,950 � $ 2,765UQuantity variance � (Qa � Qs)Ps 900# � $3 � 2,700F 955§ � $20 � 19,100F
Total $ 7,300U $16,335F
†$310,000 � 100,000 � $3.00.‡100,000 pounds is used to calculate the price variance because this is the amount purchased. If 98,150 pounds is used for the actual quantity, theprice variance is not as timely a performance measure if raw material sits in inventory until it is used.#97,200 � 9,810 � 10.*$81,765 � 3,950 � $20.§3,950 � 9,810 � 0.5.
zim36725_ch12_554-591.qxd 12/15/09 2:26 PM Page 579

b. The price variances represent the difference in what was paid and what should have beenpaid for labor and materials. The quantity variances represent the difference between whatwas used and what should have been used.
The materials variances in total were $7,300 U. This was due primarily to a $10,000 Uprice variance that was partially offset by a favorable quantity variance of $2,700. Thus, itappears that high-quality materials were purchased because fewer-than-expected units ofmaterial were needed to produce the final product. This seems to be reinforced by the laborvariances. The wage rate was slightly higher than expected ($0.70), causing an unfavorablewage variance of $2,765. However, the more highly paid employees, coupled with the better-than-standard materials, caused a $19,100 F labor efficiency variance. That is, the workforcewas much more efficient (in the sense of requiring fewer direct labor hours) in producingthe final output. The overall result was that the final product was produced for $9,035 (or$16,335 � $7,300) less than standard. The higher-quality direct materials and higher-paidemployees more than made up for their higher unit cost.
ProblemsP 12–1: Medical Instruments
Medical Instruments produces a variety of electronic medical devices. Medical Instruments uses astandard cost system and computes price variances at the time of purchase. One product, a thermo-meter, measures patient temperatures orally. It requires a silver lead with a standard length of fiveinches per thermometer. To make the leads, hollow silver tubing is purchased at a standard price of$4 per inch, cut into the required length, and then assembled into the thermometer.
There was no silver tubing in inventory when a batch of 200 thermometers was scheduled forproduction. Twelve hundred inches of silver tubing were purchased for $4,680 by the purchasingdepartment for this 200-unit batch of thermometers, and 1,100 inches were used in production.
Required:
Compute the materials variances for silver tubing and comment on their meaning.
P 12–2: Mickles Ltd.
Mickles Ltd. uses a standard cost system. In June, Mickles’ direct labor efficiency variance was$1,470 U and its direct labor rate variance was $825 F. Mickles manufactured 460 batches of productin June. Actual direct labor hours in June were 980 hours. Each batch calls for two standard direct laborhours per batch.
Required:
Calculate the standard direct labor wage rate used by Mickles in computing its direct labor variancesin June.
P 12–3: Alexander Products
Alexander Products manufactures dental equipment and uses a standard cost system. A new product(HV65) that is being introduced requires a particular type of stainless steel. Alexander purchased aquantity of this stainless steel (in meters). The following data summarize the operations regarding thepurchase and use of this new stainless steel.
Actual price $6.20 per meterActual number of meters used 8,500 metersPrice variance $2,000 URaw material variance $3,000 UEnding raw material inventory $9,000Standard quantity given the
number of HV65 produced 8,000 metersAmount of stainless steel in
work in process inventory $48,000
580 Chapter 12
zim36725_ch12_554-591.qxd 12/15/09 2:26 PM Page 580

Standard Costs: Direct Labor and Materials 581
Required:
Calculate the number of meters of stainless steel purchased and the standard price per meter of thestainless steel Alexander used in its standard cost system.
P 12–4: Oaks Auto Supply
Oaks Auto Supply just acquired a patent on an antifreeze recycler that flushes used antifreeze from acar, filters it, removes dissolved chemicals, and then returns it to the automobile without having todispose of the old antifreeze or use new antifreeze. It is a cheaper and environmentally safer processthan replacing the old antifreeze. The recycler will be sold to garages and auto service shops. Thepatent cost Oaks $2.2 million. The firm will have to invest another $12.6 million in plant, equipment,and working capital. Oaks has a pretax cost of capital of 20 percent. In order to achieve a dominantposition in the recycler market, it must sell 2,960 units the first year. To achieve this level of sales, thefirm forecasts that the sales price cannot exceed $2,500 per recycler. Variable selling commissionswill be $500 per unit. Purchased parts are projected to cost $750 per unit.
Required:
Calculate the target conversion cost (labor and overhead) per recycler if Oaks is to achieve its salesprojections and return on investment objectives.
P 12–5: AN7-X1
A new pharmaceutical drug calls for 4.5 ounces of compound AN7-X1 per batch of 250 tablets. AN7-X1 has a standard price of $2 per ounce. An initial inventory of 8,000 ounces of AN7-X1 is purchasedfor $17,200. The firm produces 1,000 batches of the new drug and uses 4,600 ounces of AN7-X1. Allvariances are calculated as soon as possible.
Required:
Calculate the price and quantity variances for AN7-X1.
P 12–6: Changing Standards
The empirical evidence reveals that very few firms change their standard prices and standard quantitiesduring the fiscal year. Most firms have the following policy, “We set our standards before the fiscalyear begins and we NEVER, NEVER change them during the year (except when we have to).”
Required:
a. Evaluate the “never change” policy. Does it make any sense? Why would firms adopt sucha policy?
b. When would you expect firms to change their standards during the fiscal year?
P 12–7: Standard Cost Systems
Consider the following two separate firms. One firm manufactures flexible packaging films for thesnack, bakery, confectionery, and tobacco industries. Its manufacturing process has been quite stable formany years, with few technological innovations. Moreover, its products have a long life cycle. The otherfirm manufactures complex printed circuit boards, primarily for laptop computers and cell phones. Itdoes contract assembly for original equipment manufacturers. Its products have short life cycles and thefirm itself faces rapid technological change in its manufacturing processes. Both firms have about thesame cost structure; the percentage of unit manufacturing cost that is direct labor is roughly the samefor both firms, as is the percentage of unit manufacturing cost that is direct materials.
Required:
a. Which firm is more likely to use a standard cost system to control labor costs? Explain why.
b. How would you expect the two firms’ compensation plans for their first-line supervisorsto vary? (First-line supervisors manage production employees and are responsible forcontrolling direct labor and direct materials costs.)
zim36725_ch12_554-591.qxd 12/15/09 2:26 PM Page 581

582 Chapter 12
P 12–8: Smythe and Yves
A Swiss firm, Smythe and Yves (S&Y), manufactures toiletries such as hand soaps, shampoo, condi-tioners, and a mouthwash that hotels purchase and place in the rooms for their guests. S&Y uses a stan-dard cost system. One of the fragrances the company inserts in some bath and face soaps uses a particularscent, VBN032, that has a standard price of 600 CHF (Swiss francs) per liter. S&Y purchased 15 liters ofVBN032 for 9,225 CHF. Prior to this purchase, S&Y had no VBN032 in inventory. Immediately upondelivery of VBN032, three jobs (#K8925, #G1342, and #R9823) were started that used VBN032. The fol-lowing table summarizes the actual and standard quantities (in liters) of VBN032 in the three jobs:
Actual StandardQuantity Quantity
#K8925 4.38 4.19#G1342 6.46 6.35#R9823 3.78 3.61
Required:
a. Prepare a table that reports how the 9,225 CHF purchase cost of VBN032 is distributedacross S&Y’s manufacturing accounts after VBN032 has been used in the three jobs.
b. Based on your analysis in part (a), what observations would you offer to management?
P 12–9: Healing Touch
Healing Touch manufactures massage chairs with the following standard cost structure:
Standard Cost Sheet: Massage Chair
Metal tubing 6 meters @ $3 $ 18.00Leather 2 square meters @ $7 14.00Padding 3 kilograms @ $4 12.00Direct labor 4 hours @ $15 60.00
Total standard cost $104.00
During the month 500 chairs are manufactured and the following costs incurred:
Actual Costs Incurred for the Month: Massage Chair
Metal tubing 3,100 meters $ 9,455Leather 1,100 square meters 7,722Padding 1,600 kilograms 6,560Direct labor 1,800 hours 27,270
Total cost $51,007
Required:
a. Calculate all materials and labor variances (including price, quantity, wage rate, and laborefficiency variances).
b. Write a short report summarizing and analyzing the manufacturing operations for the month.
P 12–10: Marian Health Care System
Marian Health Care is a large hospital system outside Chicago that offers both hospital (inpatient)and clinic (outpatient) services. It has a centralized admissions office that admits and registers
zim36725_ch12_554-591.qxd 12/15/09 2:26 PM Page 582

Standard Costs: Direct Labor and Materials 583
clients, some of whom are seeking inpatient hospital services and others outpatient services. Marianuses a standard cost system to control its labor costs. The standard labor time to admit an inpatientis 15 minutes. Outpatient admissions have a standard labor time of 9 minutes. The standard wagerate for admissions agents is $14.50 per hour. During the last week, the admissions office admitted820 inpatients and 2,210 outpatients. Actual hours worked by the admissions agents last week were540 hours, and their total wages paid were $8,235.
Required:
a. Prepare a financial report that summarizes the operating performance (including theefficiency) of the admissions office for last week.
b. Based on the financial report you prepared in (a), write a short memo summarizing yourfindings and conclusions from this report.
P 12–11: Zinc Faucets
The standard cost sheet calls for 80 pounds of zinc per batch of 70 faucets. Zinc has a standard priceof $5.10 per pound. One thousand pounds of zinc are purchased for $5,530. Ten batches of the faucetsare produced, and 840 pounds of zinc are used. There was no beginning zinc inventory. All variancesare calculated as soon as possible.
Required:
Prepare a table that decomposes the total purchase price of the zinc ($5,530) into its various compo-nents as calculated by the standard cost system.
P 12–12: Howard Binding
Howard Binding manufactures two types of notebooks: large and small. The large and small note-books are made of the same cloth cover (direct materials) but in different quantities. The standard costsheet for each follows.
Large Small
Cloth covering 3 feet @ $0.30/foot 2 feet @ $0.30/footRing holder 1 @ $0.12 each 1 @ $0.12 eachDirect labor 0.15 hour @ $6.00/hour 0.10 hour @ $6.00/hour
At the beginning of the month, the purchasing department bought 35,000 feet of cloth for$10,850. There were no beginning inventories. During the month, 5,000 large and 8,000 small note-books were produced. The production records for the month indicate the following actual productionquantities:
Large Small
Cloth covering 16,000 feet 15,500 feetRing holders 5,000 @ $0.12 each 8,000 @ $0.12 eachDirect labor 800 hours @ $5.80/hour 780 hours @ $6.10/hour
Required:
a. Calculate the cloth covering price variance (i) at purchase and (ii) when the materials areactually used.
b. Discuss why the two price variances calculated in (a) differ. Which is superior (and why)?
zim36725_ch12_554-591.qxd 12/15/09 2:26 PM Page 583

584 Chapter 12
P 12–13: Fast Fax
Sue Young sells fax machines for Fast Fax. There are two fax machines: model 700 and model 800.At the beginning of the month, Sue’s sales budget is as follows:
Model 700 Model 800
Budgeted contribution margin per unit $ 200 $ 300Forecasted sales in units 100 100
Budgeted margins $20,000 $30,000
At the end of the month, the number of units sold and the actual contribution margins are as follows:
Model 700 Model 800
Actual contribution margin $ 150 $ 350Number of units sold 150 80
Actual contribution $22,500 $28,000
Contribution margins have changed during the month because the fax machines are importedand foreign exchange rates have changed.
Required:
Design a performance evaluation report that analyzes Sue Young’s performance for the month.
P 12–14: Flower City Cartridges
Flower City Cartridges (FCC) manufactures replacement cartridges for desktop printers. FCC usesstandard costs within a job order cost system. In June, FCC purchased 18 gallons of blue ink for$385.20 and produced the following four different cartridge jobs using the blue ink (and other inks,materials, and direct labor):
Blue Ink, Jobs Gallons Used
CJ120 4.2HP9X2 3.9CN417 3.8XRX776 4.4
All four jobs have a blue ink materials standard that calls for four gallons of blue ink per job. Blueink has a standard cost of $20 per gallon. These were the only jobs calling for blue ink in June. Therewas no beginning blue ink inventory on June 1.
Required:
Prepare a table that indicates the financial disposition of the historical cost of the blue ink purchasedin June. (That is, account for the $385.20 blue ink purchase.)
zim36725_ch12_554-591.qxd 12/15/09 2:26 PM Page 584

Standard Costs: Direct Labor and Materials 585
P 12–15: Great Southern Furniture
Ed Koehler started Great Southern Furniture five years ago to assemble prefabricated bedroom fur-niture for large hotel chains. Hotels purchase furniture (beds, night stands, and chests of drawers)from manufacturers who ship the furniture to the hotels unassembled. Koehler sends a site supervi-sor and a small crew of employees to the hotel. The site supervisor first hires additional local em-ployees to help assemble the furniture and then trains them. The locally hired employees along withthe small crew of Great Southern employees assemble the furniture at the hotel. This significantly re-duces the shipping charges and damage to the furniture. Before sending a crew to the site, Koehlerhas a crew in his office assemble several sets to make sure there are no problems and also to estimatethe expected time required to assemble the particular furniture.
The 500-room Hyatt opens in Tampa and Koehler sends a crew to assemble the 500 bedroomsets. He establishes that 4.5 hours are required to assemble one complete room and the estimatedcost per hour is $22. Upon completing the job, the crew reports they had total wages of $49,693 for2,170 hours worked.
Required:
Write a report evaluating the performance of the crew at the Hyatt in Tampa.
P 12–16: Cibo Leathers
Cibo Leathers manufactures a line of designer purses and handbags, some selling for as much as$1,000 per bag. One particular style requires a hand-stitched shoulder strap of cow leather that hasbeen predyed. Cibo purchases large sheets of predyed leather, cuts them into the desired length andwidth, and then braids the leather strips and sews them to produce the unique shoulder strap. Becauseof blemishes in the leather, there can be considerable waste. Cibo can purchase various qualities ofleather. Very high-quality leather has few blemishes, so only 8 square feet and 5 minutes of cuttinglabor time are required to produce one shoulder strap that has 6 square feet of leather for this leatherquality. However, if very low-quality leather is purchased, 12 square feet are required to yield oneshoulder strap with the required 6 square feet. Moreover, 15 minutes of labor is necessary to cut thevery low-quality leather to produce one strap. Prior to the beginning of Cibo’s current fiscal year,the data in the following table were assembled and present the various leather qualities and labortimes necessary to produce one shoulder strap.
Minutes of Leather Price Square Feet of Labor Required
Leather per Square Leather Required to Cut LeatherQuality Foot for 1 Strap* for 1 Strap*
Very high $1.4375 8 5High 1.0000 9 8Medium 0.7700 10 11Low 0.5909 11 12Very low 0.4583 12 15
* This strap requires 6 square feet of unblemished leather.
Skilled leather craftsmen who cut the leather into strips prior to braiding and stitching areexpected to cost $30 per hour (salary, benefits, and payroll taxes) in the current fiscal year. Cibo’sgoal is to choose the leather quality that maximizes profits. The firm uses a standard cost system.
Required:
a. Calculate the current fiscal year’s standard quantity and standard price for the leather usedin the shoulder strap.
b. Calculate the current fiscal year’s standard labor minutes and standard wage rate per minute.
zim36725_ch12_554-591.qxd 12/15/09 2:26 PM Page 585

586 Chapter 12
c. Seven months into the current fiscal year, a large glut of cattle comes onto the market,drastically lowering the cost of all grades of leather. The following table details the newprices for the various leather qualities:
Leather Leather Price perQuality Square Foot
Very high $1.1500High 0.8000Medium 0.6930Low 0.5318Very low 0.4125
Suppose these prices are expected to persist not only for the remaining five months of thecurrent fiscal year, but also for the next fiscal year. Calculate next fiscal year’s standardquantity and standard price for leather used in shoulder straps, and the standard minutes tocut the leather.
d. Do you expect Cibo to revise the standard quantity and standard price of the shoulder strapleather in the current fiscal year? Explain why or why not.
e. Suppose that Cibo decides that the most efficient (profit-maximizing) leather choice is touse shoulder strap leather of very low quality, whereby 12 square feet of leather are requiredfor each strap which has 6 square feet of leather in it. (The expected cost of this quality ofleather is $0.4583 per square foot.) How does the standard cost system account for the6 square feet of leather scrapped for every shoulder strap?
P 12–17: Software Associates
Software Associates (SA) is a computer software consulting firm that specializes in designing andimplementing integrated marketing database warehousing programs. Humphrey Catalog is a client.In preparing its bid for Humphrey, SA estimates its total labor cost for this project to be $222,500,broken down as follows:
Budgeted Budgeted BudgetedHours Wage Cost
Partner 100 $175 $ 17,500Associate 300 120 36,000Senior analyst 600 90 54,000Analyst 1,000 40 40,000Programmer 3,000 25 75,000
Total $222,500
After completing the Humphrey contract, SA reports the following data.
Actual Hours Actual Cost
Partner 90 $ 15,750Associate 280 35,000Senior analyst 750 63,750Analyst 1,400 49,000Programmer 3,600 82,800
Total $246,300
zim36725_ch12_554-591.qxd 12/15/09 2:26 PM Page 586

Standard Costs: Direct Labor and Materials 587
Required:
a. Prepare a performance report for the Humphrey Catalog project.
b. Offer a plausible explanation for SA’s performance on the Humphrey project.
P 12–18: Starling Coatings
Starling Coatings produces weatherproofing coatings that protect metal from oxidation. One ofStarling’s patented coatings, zurtan, is composed of two inputs, magna45 and zelon. While bothinputs are required, they can be substituted for each other. The following table describes how manygallons of magna45 and zelon are required to produce a single batch of zurtan.
Gallons of Magna45 and Zelon Needed to Make One Batch of Zurtan
Magna45 Zelon
1 30.002 15.003 10.004 7.505 6.006 5.007 4.308 3.759 3.33
10 3.00
In other words, one batch of zurtan can be produced using one gallon of magna45 and 30 gallons ofzelon, or 2 gallons of magna45 and 15 gallons of zelon, or 3 gallons of magna45 and 10 gallons ofzelon, and so forth. Starling has a long-term contract with a defense contractor to supply a fixedquantity of zurtan at a fixed price, neither of which can be altered. The price of zurtan is far above itsmanufacturing cost. Starling uses a standard cost system and at the beginning of the year establishesthe standard quantities of the various raw materials used to manufacture its coatings. Before Starling’sfiscal year begins, management estimates that magna45 will have a standard price of $4 per gallonand zelon will have a standard price of $5 per gallon.
The manager in charge of producing zurtan has decision-making authority to alter the mix ofmagna45 and zelon used to produce zurtan and is evaluated and rewarded based on two criteria: meet-ing delivery schedules of zurtan (including quantities and quality specifications) and materials quan-tity variances of magna45 and zelon.
Required:
a. Before Starling’s fiscal year begins, determine the cost-minimizing (standard) quantitiesof magna45 and zelon per batch of zurtan.
b. Soon after the fiscal year begins, the price of magna45 falls to $3 per gallon and the priceof zelon rises to $7 per gallon. What are the efficient (cost-minimizing) quantities ofmagna45 and zelon that Starling should use to produce a batch of zurtan?
c. Starling has a policy of never changing standards during the year. Standard prices andstandard quantities are changed only before the next fiscal year begins. What quantities ofmagna45 and zelon will the zurtan production manager choose after the price of magna45falls to $3 per gallon and zelon rises to $7 per gallon?
d. Why doesn’t Starling its policy of never changing standards after the fiscal year begins?
zim36725_ch12_554-591.qxd 12/16/09 10:05 AM Page 587

P 12–19: Trevino Golf Balls
Golf ball manufacturer Trevino is generally regarded as the industry leader. It commands a 40 percentmarket share in its targeted channels of distribution and reported net profits of $31.5 million on salesof $171 million in the last fiscal year.
A recent trend in the golf ball industry is the movement toward a 15-ball dozen (a so-calledvalue pack). This value-oriented offering provides the consumer with 15 golf balls for the price of astandard (12-ball) dozen. Using one of its less popular, lower-quality golf ball brands, Trevino enteredthis market in a temporary, special promotion context. The entry was primarily in response to com-petitive pressures from smaller, lower-quality ball manufacturers who were flooding the market withvalue packs.
Initially, Trevino encountered several start-up problems relating to the unorthodox 15-ball pack-aging. Since the packaging machinery had been tooled to accommodate 12-ball dozens, it could notbe converted to run packaging for 15-ball dozens. These 15-ball value packs had to be packed byhand. Nonetheless, as the market developed, the value pack became a permanent product offering.Trevino continued to offer its higher-quality, more popular brands exclusively in a 12-ball dozenconfiguration.
Trevino uses a standard cost system based on cost per 12-ball unit. When the value pack wasintroduced, it was costed at the 12-ball standard. As a result, the standard cost for the value packincludes only the costs associated with the manufacturing of 12 balls. The cost of the remaining threeballs is written off to a value-pack sales promotion account when the balls are manufactured and istreated as a marketing expense for that period. Trevino calculates this written-off amount by takingthe standard cost per golf ball (12-ball standard divided by 12) and multiplying it by three.
The table below, drawn from Trevino’s most recent business plan, displays how the standard costof the value pack did not increase to account for the additional three balls.
Trade Standard Gross GrossProduct Units* List Price Manufacturing Cost Margin $ Margin %
Standard dozen(12 balls) 2 million $17.00 $6.75 $10.25 60.3%
Value pack(15 balls) 1 million 17.00 6.75 10.25 60.3
*A unit is considered a “dozen” package regardless of the actual number of balls in the package.
The senior product manager, defending the use of sales incentives to increase market share inthe value-pack market, commented that increasing value-pack sales was appropriate for a number ofreasons, including the fact that “we’re still making a 60 percent margin on that line, as reflected inthe business plan.” When asked about the value-pack standard cost, a senior financial officer com-mented, “Look, we’re still accounting for the cost, but just doing it somewhere else, so the bottomline isn’t affected. Since we’ve given marketing a bigger budget to account for the balls, everyone ishappy.”
Trevino uses standard units as a means for allocating certain categories of overhead in a FIFOinventory system and uses standard gross margin as a component of the manufacturing group’s com-pensation package. Marketing is treated as a cost center and marketing costs are not traced to theproduct.
Required:
a. What effect is the accounting treatment of the value pack having on Trevino?
b. Why do you think the company implemented such an accounting treatment?
c. Should the accounting treatment of the value pack be changed?SOURCE: D Arvan, A Thomas, D Titus, and C Webber.
588 Chapter 12
zim36725_ch12_554-591.qxd 12/15/09 2:26 PM Page 588

Standard Costs: Direct Labor and Materials 589
CasesCase 12–1: Domingo Cigars
To generate needed foreign exchange, the Cuban government entered into a joint venture withDomingo Cigars of Spain. The joint venture manufactures Domingo Cigars in Cuba using Cubantobacco and employees. Domingo and the Cuban government split all profits evenly. The contractcalls for all financial transactions, including employee salaries, to be in U.S. dollars.
Spanish managers came to Cuba and opened a cigar factory. All cigars are handmade. Domingohires the best Cuban cigar makers, who formerly worked for the Cuban government making cigars.The average cigar roller makes $2.50 per hour in a government factory. Domingo decides to set theeffective wage rate at $3.00 per hour to attract the best employees, but will pay them piece rates.
Domingo makes three types of cigars: panatellas, coronas, and churchills. All three use the sametype of tobacco, but in varying amounts. Among the many management practices installed byDomingo are an employee incentive system and a standard cost system. Because the time to roll eachtype of cigar varies, employees are paid different amounts for each cigar type. The following stan-dards are established for production:
Panatella Corona Churchill
Labor time (minutes) 3 4 6Grams of tobacco per cigar 6 10 20Effective labor rate (hour) $3.00 $3.00 $3.00Tobacco price (per gram) $0.20 $0.20 $0.20
Each cigar roller selects an outer wrapper and inner leaves. These are cut and hand-rolled to thedesired tightness, size, and weight. Then, an outer leaf is rolled on. The cigar is trimmed and placedin a wooden press to provide a symmetric shape. Employees are paid purely on a piece rate for goodcigars produced. Inspectors discard defective cigars and employees are not paid for these cigars.
Employees are assigned each day to one of three rolling rooms: panatella, corona, or churchill.Each room is stocked with tobacco leaves. Each roller selects a batch of outer leaves and inner leavesto use from the common tobacco stocks in the room. Sometimes rollers in the same room will sharea tobacco pile and will often hand each other leftover pieces if they need some additional filler. At thestart of the day, each room is stocked with a preweighed amount of tobacco. At the end of the day, anyunused tobacco is weighed and returned to storage. Thus, management tracks the amount of tobaccoused in each room each day. Cigars not meeting quality standards are sold to a bulk buyer. However,the roller is not paid for these cigars. Scrap tobacco pieces are sold to jobbers for cigarettes.
Domingo buys only the highest-quality tobacco from state communes that grow the tobacco forgovernment-run factories or Domingo. Since Domingo pays more than the government, the com-munes willingly sell their best tobacco to Domingo.
The following table summarizes production for the month of March.
Panatella Corona Churchill
Cigars produced 115,000 125,000 60,000Actual labor hours 4,900 7,000 5,600Actual tobacco used (grams) 740,000 1,360,000 1,400,000
Domingo purchased 3.5 million grams of tobacco for $805,000.
Required:
a. The piece rate for each cigar type is based on the standard labor minutes for each cigar anda $3.00 per hour wage rate. Calculate the piece rate per cigar paid for panatellas, coronas,and churchills.
zim36725_ch12_554-591.qxd 12/15/09 2:26 PM Page 589

590 Chapter 12
b. Calculate the tobacco price variance.
c. Calculate the tobacco quantity variances for each type of cigar.
d. Calculate the labor efficiency variances for each type of cigar.
e. Analyze the quantity and labor efficiency variances calculated in parts (c) and (d) above.What managerial implications do you draw from these variances?
f. What suggested changes would you recommend to Domingo Cigars’s management? Bespecific.
Case 12–2: Rust Belt Mufflers
Dr. Madison, inventor and owner of Madison Corrosion Treatment, has discovered that ordinarymufflers and pipes, when treated with his patented process, will become permanently impervious tocorrosion. To reap the rewards from his ingenuity, he has opened Rust Belt Mufflers, a chain of30 corporate-owned muffler shops. Rust Belt unconditionally warrants all of its muffler and pipeinstallations for the life of the vehicle. From minor adjustments to complete replacement, a Rust Beltcustomer must be a satisfied customer!
Although Rust Belt’s service has become the rage of the Great Lakes, profits have been unim-pressive. Simon, one of Madison’s employees, scolds his boss: “Here you are, with the greatest com-petitive advantage in the history of muffler service, doing no better than any of your rivals.” Madisonretorts, “I’m devoted to science, not business. As long as the enterprise is profitable, I will not inter-fere with my shop managers.” Simon says that the profitability problem is due to squandering ofresources by shop managers. The product’s superior price, strong demand, and Madison’s policyof benign neglect have given managers a virtual blank check when it comes to expenditures. Simonsays that Madison’s solution is to reduce costs by monitoring shop performance via a standard costsystem. Due in large part to early childhood conditioning, Madison does as Simon says.
Each Rust Belt shop provides two services:
1. Replacement of non-Madison mufflers and pipes with modern Madison mufflers and pipes.
2. Warranty replacement of defective Madison mufflers and pipes with new Madisonmufflers and pipes.
These services require materials (including corrosion treatment) and direct labor. Materials pur-chases, installation procedures, and labor allocation are strictly the responsibility of each individualshop manager. Since Madison mufflers and pipes are merely ordinary mufflers and pipes that aretreated with Madison’s corrosion process, shop managers purchase mufflers and pipes from any sup-plier of their choosing. Corrosion treatment is done at each shop.
After careful study, Madison adopts the following cost standards per installation. Actual instal-lations include both original and warranty installations.
Materials $60 per installationDirect labor 1 hour per installationStandard labor rate $11.80
Cost data for the three shops in Buffalo, New York, for the first year of the standard cost systemfollow.
State St. Dewey Ave. Mt. Hope Ave.
Expected installations 15,000 22,500 10,000Actual installations 14,500 22,250 11,500Materials costs $710,500 $1,346,125 $759,000Direct labor hours 11,600 21,138 12,650Actual labor rate $11.00 $12.00 $13.00
zim36725_ch12_554-591.qxd 12/15/09 2:26 PM Page 590

Standard Costs: Direct Labor and Materials 591
Required:
a. Calculate materials and labor variances for each of the three Buffalo shops. Evaluate therelative performance of each shop based on the calculated variances.
b. Madison’s cousin Milty, Rust Belt’s MBA intern, presents the following in his analysis ofthe Buffalo shops under standard costing:
During the standard costing period, 500 of the installations performed by State Street in-volved the originally installed Madison mufflers and pipes being fully replaced under war-ranty with new Madison mufflers and pipes. Work at the Dewey Avenue shop hasproduced 100 original installations requiring full warranty replacement. At the Mt. HopeAvenue shop, only eight installations have required full warranty replacement. This ac-counts for all known warranty work in Buffalo for installations performed under standardcosting. (Warranty replacement services performed before standard costing were notconsidered.)
Has your interpretation changed? In broad terms, is the standard costing system effectivelymeeting its objectives? What general improvements should be made?
zim36725_ch12_554-591.qxd 12/15/09 2:26 PM Page 591

Chapter Thirteen
Overhead andMarketingVariances
Chapter Outline
A. Budgeted, Standard, and Actual Volume
B. Overhead Variances
1. Flexible Overhead Budget
2. Overhead Rate
3. Overhead Absorbed
4. Overhead Efficiency, Volume, and SpendingVariances
5. Graphical Analysis
6. Inaccurate Flexible Overhead Budget
C. Marketing Variances
1. Price and Quantity Variances
2. Mix and Sales Variances
D. Summary
592
zim36725_ch13_592-626.qxd 12/11/09 9:56 AM Page 592

Overhead and Marketing Variances 593
Chapter 12 described standard cost systems. These systems are used for both decision man-agement and decision control. Standard costs provide information regarding the opportu-nity cost of providing a repetitive activity, part, or product. These data are useful forallocating scarce resources within the firm and for external pricing. As part of the budget-ing process (Chapter 6), standard costs also provide benchmarks for judging performance.Hence, standard cost variances can provide performance measures. Two types of standardcost variances (direct labor and direct materials variances) were introduced in Chapter 12.This chapter completes that discussion by describing some additional variances: manufac-turing overhead variances, which help to identify the causes of the over/underabsorbedoverhead calculated in Chapter 9, and marketing variances, which pinpoint why total rev-enues differ from budgeted revenues. Marketing variances illustrate how variance analysiscan be applied to nonmanufacturing settings.
A. Budgeted, Standard, and Actual VolumeBefore describing overhead variances, it is useful to review some concepts and terminologyinvolving the notion of volume. As described in Chapter 9, most plants or departmentswithin plants produce a diverse set of outputs, not a single homogeneous product. Volumeis measured not in terms of output but rather in terms of a common input such as directlabor, machine time, or raw material dollars.
Once an input measure such as machine time is selected as the definition of volume inthe plant or department, there are three different ways to quantify volume: budgeted vol-ume, standard volume, and actual volume. Budgeted volume is sometimes called denom-inator volume. As described in Chapter 9, it is set at the beginning of the year and is usedas the denominator to calculate the overhead rate. There are two ways to estimate budgetedvolume: expected volume (which is based on the projected units to be produced next year)or normal volume (which is the long-run average production). If budgeted volume is basedon forecasted units for next year (expected volume), then budgeted volume falls duringbusiness recessions and rises during business expansions, causing overhead rates to vary in-versely with actual output. If budgeted volume is based on normal volume, overhead ratesdo not vary as the business moves through recessionary and expansionary periods. Bud-geted volume is denoted by the variable BV.
Standard volume is the amount the plant would have generated if each unit of productmanufactured used precisely the standard units of volume allowed. Given the output actuallyproduced, standard volume measures how much input should have been used. For example,suppose direct labor hours are used as the measure of volume. After completing each job, thenumber of units produced times the standard number of direct labor hours per unit is thestandard volume. Standard volume, sometimes called earned or allowed volume, is denotedby the variable SV.
The third volume concept is actual volume, the amount of the volume measure actu-ally incurred (e.g., actual machine hours, actual direct labor hours, or actual direct labordollars). Standard volume focuses on the relation between inputs and outputs. Actual vol-ume just focuses on inputs. Actual volume is denoted by the variable AV.
The three volume measures (budgeted, standard, and actual) differ in terms of whenthey are computed. Budgeted volume is estimated before the fiscal year begins and beforeproduction starts. Both standard and actual volume are computed during the year.
An example illustrates the different volume concepts and how they interrelate. TheToronto Engine Plant of Eastern Corp. manufactures engine blocks for automobiles. Threetypes of engine blocks are produced: four-, six-, and eight-cylinder blocks. An engineblock, a one-piece iron casting, is the basic component of an automobile engine and
zim36725_ch13_592-626.qxd 12/11/09 9:56 AM Page 593

594 Chapter 13
TABLE 13–1 Calculation of Budgeted Volume (Using Expected Volume)—Toronto Engine Plant’s Cylinder Boring Department
Standard Budgeted VolumeExpected � Machine Hours � (Machine
Product Production per Block Hours)
4-cylinder blocks 25,000 blocks 0.50 12,5006-cylinder blocks 40,000 blocks 0.70 28,0008-cylinder blocks 30,000 blocks 0.90 27,000
95,000 blocks
Budgeted volume 67,500
contains the cylinders into which the pistons are fitted. After assembling the block with theheads, pan, pistons, spark plugs, rods, camshafts, and valves, the motor is ready to be fit-ted with the fuel and exhaust systems and installed in the automobile. The cylinders arebored by high-precision, computer-controlled machine tools, and then other machine toolstap and thread the block to attach the other engine components. Cylinder boring is the keyprocess after the engine block is cast.
Overhead is tracked to departments. Volume is measured in the cylinder boring de-partment as machine hours, or the number of hours each block spends in the computer-controlled machine tool having its cylinders bored. The three motor blocks require thefollowing standard machine hours per block:
Four-cylinder block 0.50 machine hours
Six-cylinder block 0.70 machine hours
Eight-cylinder block 0.90 machine hours
Each block requires some set-up time to mount and correctly position the block in thecomputer-controlled machine tool. Hence, an eight-cylinder block does not require twicethe machining time of a four-cylinder block. Also, a cylinder in a four-cylinder block islarger and requires more boring time than does a cylinder in a six- or eight-cylinder block.
Budgeted volume in the engine plant is based on projected production next year. Inother words, expected volume is used in setting budgeted volume. At the beginning of theyear, management forecasts the number of blocks to be manufactured based on the pro-jected unit sales of car models requiring four-, six-, and eight-cylinder engines. Using theprojected number of blocks per product and the number of standard machine hours perblock, management converts the projected number of blocks of each engine into an overallmeasure of projected volume in terms of machine hours. The calculation of budgeted vol-ume is illustrated in Table 13–1. The plant plans to produce 95,000 engine blocks using67,500 machine hours. Notice that the expected volume of 67,500 machine hours is notnormal volume. The budgeted volume measure used in the boring department is based onthe expected number of blocks to be produced next year. If fewer blocks are expected, fewerexpected machine hours are calculated. Overhead rates vary inversely with expected engineproduction in the cylinder boring department.
During the year, production plans change as customer preferences become known. Anunexpected increase in oil prices causes consumers to shift toward smaller, more fuel-efficient
zim36725_ch13_592-626.qxd 12/11/09 9:56 AM Page 594

Overhead and Marketing Variances 595
automobiles with smaller engines. Fewer eight-cylinder engines are made and more four- andsix-cylinder engines are manufactured.Table 13–2 presents the actual operating results for theyear and calculates actual and standard volumes.
Although more blocks were bored (96,000) than were expected at the beginning of theyear (95,000), the standard volume of 67,400 machine hours (which is based on actualblocks produced) was less than the budgeted volume of 67,500 machine hours becausemore four-cylinder blocks were produced. The budgeted volume of 67,500 is based onexpected production, which was set at the beginning of the year using the production quotasof the three engines. During the year, the mix of the three products differed from the fore-casts, causing the plant’s volume to differ from the budgeted amount set at the beginning ofthe year. Given the actual mix of blocks bored, total machine hours should have been67,400 hours (standard volume). In fact, actual boring time was 68,200 machine hours, or800 more than standard. The last column in Table 13–2 provides the actual machine hoursused for each type of block. The four- and six-cylinder blocks used more machine hoursthan standard, whereas the eight-cylinder blocks used slightly fewer machine hours. Uponinvestigation, it was learned that to meet the increased demand for small engines, some ofthe four- and six-cylinder block casting molds were slightly warped and required more bor-ing time to bring the cylinder bore back to specification.
Table 13–3 summarizes the three volume measures for Toronto’s Boring Department.Total budgeted and standard volumes are about the same. However, there has been a shift
TABLE 13–2 Calculation of Actual and Standard Volumes—Toronto Engine Plant’s Cylinder Boring Department
Standard ActualActual Blocks � Machine Hours � Standard Machine
Product Produced per Block Volume Hours
4-cylinder blocks 27,000 0.50 13,500 14,2006-cylinder blocks 41,000 0.70 28,700 29,0008-cylinder blocks 28,000 0.90 25,200 25,000
96,000
Standard (earned) volume (SV ) 67,400
Actual volume (AV ) 68,200
TABLE 13–3 Budgeted, Actual, and Standard Volumes—Toronto Engine Plant’s Cylinder Boring Department
Budgeted Volume Standard Volume Actual Volume
4-cylinder blocks 12,500 13,500 14,2006-cylinder blocks 28,000 28,700 29,0008-cylinder blocks 27,000 25,200 25,000
Total 67,500 67,400 68,200
zim36725_ch13_592-626.qxd 12/11/09 9:56 AM Page 595

596 Chapter 13
in the mix from large to smaller engines. Actual volumes exceeded standard primarily dueto the increased production of four-cylinder blocks.
In the next section, these volume concepts form the basis of the overhead variances.
Q13–1 What are three definitions of volume? Describe each.
Q13–2 Describe the two different ways of estimating budgetedvolume. How do they differ?
B. Overhead VariancesChapter 12 described direct labor and direct materials variances. This section describesoverhead variances. Overhead variances are more complicated than direct labor andmaterials variances, but the following sections based on Chapter 9 clarify the accountingprocess.
At the beginning of the year, the firm estimates its flexible overhead budget for the year,as illustrated in Figure 13–1. The flexible budget consists of fixed overhead, FOH, and vari-able overhead, VOH � V. Or
Flexible overhead budget � FOH � (VOH � V )
where V is the volume measure (e.g., machine hours). Recall that FOH, fixed overhead, is atotal dollar amount per year (e.g., $1,350,000). VOH, the variable overhead rate, is in termsof dollars per unit of the volume measure (e.g., $14 per machine hour). In Figure 13–1, theflexible overhead budget is plotted as a straight line with intercept FOH and slope VOH. Thisstraight line shows how total overhead is expected to vary with the volume measure.
Before the year begins, management also estimates total budgeted volume, BV (e.g.,machine hours), for the year. As described in section A, budgeted volume, BV, can be esti-mated using expected volume (based on next year’s planned production) or normal volume(based on long-run average volume). Given BV, fixed overhead (FOH ), and the variableoverhead rate (VOH), the flexible budget is used to estimate budgeted overhead (BOH):
BOH � FOH � (VOH � BV )
Continuing with the cylinder boring department example from the last section, assumethat the flexible overhead budget is
Fixed overhead $1,350,000
Variable overhead $14 per machine hour
Fixed overhead is composed mainly of the depreciation charges on the computer-controlled machines. Variable overhead is composed mainly of power, lubricants to cool thecutting tools in the machines, maintenance, and replacement of the cutting tools. FromTable 13–1, budgeted volume is 67,500 machine hours. Using these data, budgeted over-head is projected:
BOH � $1,350,000 � ($14 � 67,500 machine hours) � $2,295,000
1. FlexibleOverhead Budget
ConceptQuestions
zim36725_ch13_592-626.qxd 12/11/09 9:56 AM Page 596

Overhead and Marketing Variances 597
Volume (e.g., machine hours), V
BOH
Dollars ofoverhead
FOH
BV
VOH
Flexiblebudget
BOH: Budgeted overhead FOH: Fixed overhead (expected for the year)BV: Budgeted volumeVOH: Variable overhead per unit of volume
FIGURE 13–1
Flexible overheadbudget
Volume (e.g., machine hours), V
BOH
Dollars ofoverhead
FOH
BV
VOH
Flexiblebudget
BOH: Budgeted overhead BV: Budgeted volumeFOH: Fixed overhead (expected for the year)OHR: Overhead rate � [FOH � (VOH � BV )]/BV � BOH/BVVOH: Variable overhead rate per unit of volume
Overheadabsorbed
OHR
FIGURE 13–2
Flexible budget andoverhead absorbed
As described in Chapter 9, budgeted overhead is converted into an overhead absorptionrate, which is used to apply overhead to jobs. Figure 13–2 illustrates the relation betweenthe flexible budget and the overhead rate. Again, BOH is the budgeted overhead for the yearand BV is the budgeted volume (e.g., in machine hours).
As in Chapter 9, the overhead rate, OHR, is calculated as
OHR =
BOH
BV=
FOH + (VOH * BV )
BV=
FOH
BV+ VOH
2. Overhead Rate
zim36725_ch13_592-626.qxd 12/11/09 9:56 AM Page 597

598 Chapter 13
TABLE 13–4 Applying Overhead Based on Standard Volume—Toronto Engine Plant’sCylinder Boring Department
Standard Volume Overhead Rate per OverheadProduct (Machine Hours) � Machine Hour � Absorbed
4-cylinder blocks 13,500 $34 $ 459,0006-cylinder blocks 28,700 34 975,8008-cylinder blocks 25,200 34 856,800
67,400
Total overhead absorbed $2,291,600
OHR is the slope of the line through the origin and the point (BV, BOH). This overheadrate consists of the fixed overhead per budgeted unit of volume, FOH � BV, plus the vari-able overhead per unit of volume, VOH.
The overhead rate in the cylinder boring department is calculated as
As work is done in the factory, overhead is absorbed to product (and entered into the work-in-process account) along the line labeled “Overhead absorbed” in Figure 13–2. The lineshows the quantity of overhead absorbed to product as production occurs. By chance, if theplant ends the year having produced the budgeted volume BV and actual overhead incurredequals budgeted overhead, then overhead absorbed will coincide with budgeted overhead(BOH), and overhead absorbed will just equal total overhead incurred, leaving no over- orunderabsorbed amount in the overhead account.
Overhead is absorbed using SV (standard machine hours, not actual machine hours).Most firms use standard volume to apply overhead to products. This produces job costs andproduct costs based on standard costs. If actual machine hours are used to apply overheadand actual hours differ from standard hours, the overhead charged to each job differs fromwhat the standard cost sheet shows. If work in process and finished goods were chargedoverhead using actual hours, downstream users would receive cost reports with productcosts that differed from standard costs. When all the cost variances are stripped out as theyare incurred, deviations from standard are not transferred to downstream users. Using stan-dard volume to absorb overhead prevents cost variations from being passed downstreambecause of the inefficient use of the input used to measure volume (machine hours).
Table 13–4 illustrates how overhead is absorbed to the engine blocks in the cylinderboring department. Overhead is charged to engine blocks at the rate of $34 per standardmachine hour. It is important that standard machine hours, not actual machine hours, beused to assign overhead in the boring department. In Table 13–2, the four-cylinder blocksused 14,200 actual machine hours, which was 700 hours more than the standard machinehours of 13,500. If actual machine hours were used to apply overhead, then the four-cylinderblocks would be charged an additional $23,800 (or 700 hours � $34) of overhead, and the
3. OverheadAbsorbed
= $34
=
$2,295,000
67,500
OHR =
BOH
BV
zim36725_ch13_592-626.qxd 12/11/09 9:56 AM Page 598

Overhead and Marketing Variances 599
machining inefficiency caused by the warped blocks would be added to the cost of theengines. Instead, standard hours are used and none of the blocks bored is charged for the ex-tra boring time; the additional overhead caused by the extra boring hours is placed into avariance account (described next).
At the end of the accounting period (month, quarter, or year), overhead variances are com-puted. The total overhead variance is
Total overhead variance � Actual overhead costs incurred � Overhead absorbed
This total overhead variance is the same as the over/underabsorbed overhead in the over-head account in Chapter 9. (Often the terms absorbed overhead and applied overhead areused interchangeably.) Alternatively,
The total overhead variance is disaggregated into three variances that sum to the totaloverhead variance (over/underabsorbed):
These three variances sum to the over/underabsorbed overhead amount. In terms of thevariables,
Overhead spending variance � AOH � [FOH � (VOH � AV )]
Overhead efficiency variance � [FOH � (VOH � AV )] � [FOH � (VOH � SV )]
Overhead volume variance � [FOH � (VOH � SV )] � (OHR � SV )
As in Chapter 12, positive variances are unfavorable and negative variances are favor-able. Each of these variances has the following specific interpretation:
Overhead spending variance This variance measures the difference between how muchoverhead was actually incurred versus how much overhead should have been incurred forthe actual volume worked. That is, given the flexible budget (FOH and VOH ) and actualvolume (AV ), the factory should have incurred FOH � (VOH � AV ) of overhead. Instead, thefactory incurred AOH of overhead. The difference indicates to management the accuracy ofthe flexible budget and/or the extent to which more or less overhead was incurred given ac-tual volume. The overhead spending variance captures everything not explained by the ef-ficiency and volume variances. A spending variance can result for a variety of reasons:
• Unexpected changes in the prices of variable overhead items, such as lubricating oilused to cool cutting tools.
• Changes in fixed costs, such as lower-than-expected property tax assessments.
Overhead volume variance =Flexible budget atstandard volume -
Overheadabsorbed
Overhead efficiency variance =Flexible budgetat actual volume -
Flexible budgetstandard volume
Overhead spending variance =Actual overhead
cost incurred -Flexible budget at
actual volume
Over/underabsorbed overhead = AOH - (OHR * SV )
=
Actual overheadcost incurred
(AOH)- £Overhead
rate(OHR)
*
Standardvolume
(SV )≥
Over/underabsorbed overhead =Actual overhead
cost incurred -Overheadabsorbed
4. OverheadEfficiency,Volume, andSpendingVariances
zim36725_ch13_592-626.qxd 12/11/09 9:56 AM Page 599

• Changes in the plant’s production technology. For example, automating a previouslylabor-intensive process causes overhead to vary more closely with machine hours thanthe currently used direct labor hours; the result is that the flexible budget based onlabor hours is less accurate as a predictor of overhead costs than if it were based onmachine hours.
Overhead efficiency variance This variance is the difference in flexible budgets using actualvolume and standard volume:
FOH � (VOH � AV ) � [FOH � (VOH � SV )] � VOH(AV � SV )
That is, because standard volume is different from actual volume, the amount of variableoverhead will differ. In the cylinder boring example, actual volume is 68,200 machinehours instead of 67,400 standard machine hours, indicating that for the actual cylinderblocks bored, 800 too many machine hours were used. These 800 additional machine hourscause additional variable overhead. Since overhead costs are presumed to vary at the rate of$14 per machine hour and machine hours were used inefficiently, additional overhead of$11,200 (or $14 � 800 hours) is incurred primarily because the blocks were warped.
Overhead volume variance This variance is the difference between the flexible budget atstandard volume and overhead absorbed. The volume variance is an estimate of unused oroverused capacity of the facility. From the earlier equation,
Overhead volume variance � [FOH � (VOH � SV )] � (OHR � SV )
Since
we can substitute this equation into the preceding one:
If budgeted volume (BV ) equals standard volume (SV ), the volume variance is zero.Remember, budgeted volume is set at the beginning of the year. Standard volume is thenumber of units produced times the standard volume per unit. If BV � SV, the plant pro-duced work equal to expectations. If SV � BV, the plant produced less work than budgetedand an unfavorable volume variance results. If SV � BV, the plant overproduced and thevolume variance is favorable (a negative number).
Suppose BV � 100,000 machine hours, SV � 80,000 machine hours, and FOH �$2,000,000. The volume variance is
$2,000,000 � � $400,000 U100,000 - 80,000
100,000
= FOH ¢BV - SV
BV≤
= FOH ¢1 -
SV
BV≤
= FOH - ¢FOH *
SV
BV≤
Volume variance = [FOH + (VOH * SV )] - ¢FOH
BV+ VOH≤ * SV
OHR =
FOH + (VOH * BV )
BV=
FOH
BV+ VOH
600 Chapter 13
zim36725_ch13_592-626.qxd 12/11/09 9:56 AM Page 600

TABLE 13–5 Calculating Overhead Variances—Toronto Engine Plant’s Cylinder Boring Department
� �
� [$1,350,000 � ($14 � 68,200)] � [$1,350,000 � ($14 � 67,400)]
� $2,304,800 � $2,293,600
� $11,200 U
� � Overhead absorbed
� [$1,350,000 � ($14 � 67,400)] � ($34 � 67,400)
� $2,293,600 � $2,291,600
� $2,000 U
� �
� $2,300,000 � [$1,350,000 � ($14 � 68,200)]
� $2,300,000 � $2,304,800
� $4,800 F
Summary of overhead variances:Efficiency variance $11,200 UVolume variance 2,000 USpending variance 4,800 F
Underabsorbed overhead $ 8,400 U
Flexible budget atactual volume
Actual overheadcost incurred
Overhead spendingvariance
Flexible budgetat standard volume
Overhead volumevariance
Flexible budget atstandard volume
Flexible budgetat actual volume
Overhead efficiencyvariance
Overhead and Marketing Variances 601
Actual work performed, stated at standard, is 20 percent less than budgeted. The plant’sfixed overhead of $2 million presumably is incurred to provide the firm with capacity of100,000 machine hours. Since the firm used only 80 percent of its capacity, $200,000 of thefixed overhead was wasted. In this sense, the volume variance reflects the cost of deviatingfrom budgeted volume. Likewise, if SV � 115,000 machine hours or 15 percent over bud-get, then a $300,000 F overhead volume variance results.
The volume variance does not measure the opportunity cost of the unused capacity.The opportunity cost is the contribution margin from units that could have been producedand sold but were not. Measuring and rewarding performance using the volume varianceinduces managers to build inventories.
Table 13–5 illustrates the calculation of the three overhead variances for the cylinderboring department of the Toronto Engine Plant. Actual overhead incurred by the depart-ment was $2.3 million. With an overhead rate of $34 per machine hour and 67,400 standardmachine hours, total overhead absorbed to engine blocks was $2,291,600. (See Table 13–4.)The difference between overhead incurred and overhead absorbed is $8,400, representingthe amount of underabsorbed overhead in the cylinder department. Table 13–5 disaggre-gates this total underabsorbed overhead into the three overhead variances.
zim36725_ch13_592-626.qxd 12/11/09 9:56 AM Page 601

In Table 13–5, most of the underabsorbed overhead of $8,400 was caused by the unfa-vorable efficiency variance of $11,200. This $11,200 represents the additional variableoverhead incurred (cooling oil and tools) that resulted from the additional machine time re-quired to correct the warped engine blocks. Because the castings did not conform to speci-fication when they arrived to be bored, additional machine hours were used, whichincreased the consumption of lubricating oil and cutting tools in the cylinder boringdepartment. Upon further investigation, the favorable $4,800 spending variance was causedby a drop in the price of lubricant. The unfavorable $2,000 volume variance reflects the factthat the department operated at slightly below budgeted volume. (Budgeted volume was67,500 hours but standard volume was 67,400.)
To this point, overhead variances have been described both verbally and algebraically.Figure 13–3 depicts the various overhead variances graphically. Figure 13–3 is based onFigure 13–2. In the particular case diagrammed, all three variances are unfavorable. Thespending variance (computed using actual volume, AV ) is the vertical distance betweenpoints C and D on the graph. The vertical height of point C is the amount of actual overheadincurred (AOH ), and the vertical height of point D is the flexible budget at actual volume.
The overhead efficiency variance (computed using the difference between actual andstandard volume, AV � SV, multiplied by the variable overhead rate) is the vertical distancebetween points D and E. In other words, the overhead efficiency variance, DE, is the hori-zontal distance between AV and SV (meaning AV � SV ) multiplied by the slope of the flex-ible budget, VOH.
The volume variance (computed using standard volume, SV ) is the vertical distancebetween points F and B. The height of point F is the flexible budget at standard volume; the
5. GraphicalAnalysis
602 Chapter 13
Volume (e.g., machine hours), V
BOH
Dollars ofoverhead
FOH
SV AV BV
VOH
Flexiblebudget
Overheadabsorbed
OHR
AOH
FD
A C
B
E
BV: Budgeted volumeAV: Actual volume based on inputs usedSV: Volume based on actual output � standard units of volume per unit of output
AOH: Actual overhead incurred for the yearBOH: Budgeted overheadFOH: Fixed overheadVOH: Variable overhead per unit of volumeOHR: Overhead rate � [FOH � (VOH � BV )] � BVSpending variance � Vertical distance between points C and DEfficiency variance � Vertical distance between points D and EVolume variance � Vertical distance between points F and BTotal overhead variance � Vertical distance between points A and B
FIGURE 13–3
Overhead variances
zim36725_ch13_592-626.qxd 12/11/09 9:56 AM Page 602

Overhead and Marketing Variances 603
height of point B is the amount of overhead absorbed. The sum of the three vertical dis-tances, CD � DE � FB, equals the underabsorbed overhead amount, AB.
Exercise 13–1
The milling department uses standard machine hours to allocate overhead to products.
Budgeted volume for the year was 36,000 machine hours. A flexible budget is used to set the
overhead rate. Fixed overhead is budgeted at $720,000 and variable overhead is estimated to be
$10 per machine hour.
During the year, two products are milled. The following table summarizes operations:
Product 1 Product 2
Units milled 10,500 12,000Standard machine hours per unit 2 1Actual machine hours used 23,000 13,000
Actual overhead incurred during the year was $1.1 million.
Required:
Calculate all the relevant overhead variances for the department and write a memo that
describes what each one means.
Solution:
The first step is to calculate the overhead rate:
OHR �
= $30
The next step is to calculate the total overhead absorbed to products using standard and
actual machine hours:
Product 1 Product 2 Total
Units produced 10,500 12,000Standard machine hours � 2 � 1
Standard volume 21,000 12,000 33,000Actual volume 23,000 13,000 36,000
Overhead absorbed: (33,000 hours � $30/hour) = $990,000
Given these calculations, the following variances are computed:
Total overhead variance:Actual overhead incurred $1,100,000– Overhead absorbed 990,000
$ 110,000 U
continued
$720,000 + ($10 * 36,000)
36,000
zim36725_ch13_592-626.qxd 12/11/09 9:56 AM Page 603

Spending variance:Actual overhead incurred $1,100,000– Flexible budget at actual volume ($720,000 + $10 � 36,000) 1,080,000
$ 20,000 U
Efficiency variance:Flexible budget at actual volume ($720,000 + $10 � 36,000) $1,080,000– Flexible budget at standard volume ($720,000 + $10 � 33,000) 1,050,000
$ 30,000 U
Volume variance:Flexible budget at standard volume ($720,000 + $10 � 33,000) $1,050,000– Overhead absorbed ($30 � 33,000) 990,000
$ 60,000 U
The unfavorable spending variance of $20,000 occurred because total overhead was
higher than expected, given the actual number of machine hours (36,000). Fixed and/or
variable overhead estimates in the flexible budget were too low. The unfavorable efficiency
variance of $30,000 reflects the additional cost of 3,000 more machine hours used given the
actual number of units produced. The unfavorable volume variance of $60,000 resulted from
3,000 fewer standard hours used than were budgeted in setting the overhead rate. Thus, not all
the fixed overhead was absorbed. The total variance of $110,000 is the sum of the previous
three variances.
The engine boring example illustrates how a standard cost system assigns responsibilityand estimates the financial costs that one department can impose on the firm. However, theability of the standard cost system to accomplish these goals depends on the accuracy of theflexible budget. For example, one factor affecting the accuracy of the flexible budget iswhether variable overhead per unit, VOH, is invariant to volume changes. Is the flexiblebudget really a straight line? Chapters 1 and 2 described how congestion costs in a planttend to rise as plant utilization increases. Congestion costs include such overhead expensesas the additional materials handlers, expenditures, and rush delivery costs. These conges-tion costs can cause variable overhead per unit of volume to rise as plant utilization in-creases. (That is, the flexible budget is nonlinear.)
If total overhead costs do not vary as captured by the linear flexible budget, then usingthe flexible budget to disaggregate the under- or overabsorbed overhead into three variancesproduces misleading numbers. As performance measures, overhead variances are only asgood as the flexible overhead budget.
Q13–3 Describe the various steps used to determine overheadvariances.
Q13–4 What are the three components of the overhead variance?Describe each.
Q13–5 Give three reasons why a spending variance could occur.
ConceptQuestions
6. InaccurateFlexible OverheadBudget
604 Chapter 13
zim36725_ch13_592-626.qxd 12/11/09 9:56 AM Page 604

ManagerialApplication:UnfavorableOverheadVariancesCited forEarningsDecline
Burnham Holdings, Inc. (www.burnhamholdings.com), in discussing its lower 2006earnings, stated, “The difficult business cycle over the last two years has been challeng-ing for the Burnham group of companies. The net loss for 2006 was $(2.3) million com-pared to income of $3.3 million reported for 2005. This decline was primarily a result ofthe lower residential sales levels and its direct impact on manufacturing throughput.Throughout the year, our production schedules were adjusted to match business levelsand to reduce overall inventory balances. This strategy not only improved the cash flowof the Company during this cycle, but also generated unfavorable overhead variances(unabsorbed fixed costs).”
SOURCE: PR Newswire, March 2, 2007.
Overhead and Marketing Variances 605
C. Marketing VariancesChapter 12 and this chapter described standard costs and variances for a manufacturingfirm. Nonmanufacturing organizations also use standards and variances for decisionmaking and control. This section illustrates how standards and variances are used in a mar-keting organization.
Table 13–6 provides the basic data used to illustrate the marketing application. The contextinvolves a Pepsi-Cola bottler who supplies the Friendly Supermarket with Pepsi in quartbottles and 12-ounce cans. Quarts and cans are sold by the case, and a case of quarts con-tains about the same number of fluid ounces of Pepsi as a case of cans. The bottler projects6,000 cases of quarts and 4,000 cases of cans will be sold to the Friendly Supermarket inMay at prices of $3.80 and $5.40, respectively. However, 6,100 cases of quarts and 4,500cases of cans at $3.81 and $5.38, respectively, were sold. A total favorable variance of$3,051 (or $47,451 � $44,400) occurred.
Disaggregating the total variance of $3,051 into various subcomponents allows thePepsi bottler to better assess customer profitability, design better marketing campaigns, andset more accurate prices. The first breakdown of the total variance is into price and quan-tity variances as introduced in Chapter 12. That is,
Price variance � (Actual price � Standard price) � Actual quantity
Quantity variance � (Actual quantity � Standard quantity) � Standard price
Table 13–7 presents the calculations of the price and quantity variances for the quartsand cans. Both quarts and cans had favorable total variances and most of the total favorablequantity variance of $3,051 at the Friendly Supermarket was due to the favorable quantityvariance of $2,700 on cans. There were small price variances, but most of the favorablevariances resulted from selling more units of both quarts and cans than were budgeted.
Suppose the sales manager sets the prices and the route salesperson stocks the shelves.The price variance can be used to evaluate the sales manager and the quantity variance canbe used to measure the performance of the route salesperson. If the route salesperson getsmore shelf space or sets up special display racks in the store, then the quantity variance re-flects the route salesperson’s efforts.
Instead of reporting price and quantity variances, contribution margins can be used.Price less variable costs can be substituted for price in the preceding calculations. Usingcontribution margin indicates the additional profits instead of additional sales that resultfrom the route salesperson’s efforts. Using price simplifies the example.
1. Price andQuantityVariances
zim36725_ch13_592-626.qxd 12/11/09 9:56 AM Page 605

Based on the data in Table 13–7, the question arises as to what caused the favorable quan-tity variances. Two things happened: More total units of Pepsi (both quarts and cans) weresold and a higher fraction of cans were sold than projected. People bought more Pepsi andthey increased their purchase of cans relative to quarts. Quarts and cans of Pepsi are sub-stitutes. The bottler projected that quarts would be 60 percent of total cases (6,000 �10,000) and cans 40 percent. However, quarts were actually 57.55 percent (6,100 �10,600) of total cases.
Table 13–8 displays a further breakdown of the quantity variances of $380 for quartsand $2,700 for cans into two additional variances: mix variance and sales variance. The for-mulas for these variances are
Mix variance � (Actual mix % � Standard mix %) � Actual units of allproducts sold � Standard price
Sales variance � (Actual units of all products sold � Standard units of all products sold) � Standard mix % � Standard price
2. Mix and SalesVariances
606 Chapter 13
TABLE 13–6 Budgeted and Actual Sales of Quart and 12-Ounce Cans to the Friendly Supermarket, May (Cases)
Quarts 12-Oz. Cans Total
Standard sale price $ 3.80 $ 5.40Standard quantity 6,000 4,000 10,000
Standard revenue $22,800 $21,600 $44,400
Actual sales price $ 3.81 $ 5.38Actual quantity 6,100 4,500 10,600
Actual revenue $23,241 $24,210 $47,451
TABLE 13–7 Price and Quantity Variances of Quarts and 12-Ounce Cans,Friendly Supermarket, May
Quarts 12-Oz. Cans Total
Actual price $3.81 $5.38Standard price 3.80 5.40
Price difference $0.01 F $0.02 UActual quantity � 6,100 � 4,500
Price variance $61 F $90 U $29 U
Actual quantity 6,100 4,500Standard quantity 6,000 4,000
Quantity difference 100 F 500 FStandard price � $3.80 � $5.40
Quantity variance $380 F $2,700 F $3,080 F
Total variance $441 F $2,610 F $3,051 F
zim36725_ch13_592-626.qxd 12/11/09 9:56 AM Page 606

Overhead and Marketing Variances 607
Mix and sales variances are particularly useful when a company sells multiple products thattend to be substitutes. The mix variance captures the effect of substitution among the prod-ucts, whereas the sales variance measures the effect of differences between actual and stan-dard quantities sold.
The mix variances in Table 13–8 show how much of the quantity variance is due to thechange in product mix, holding constant the number of units sold. The higher percentage ofcans sold generated $1,404 of additional can sales but reduced quart sales by $988.
The sales variances show that holding the mix constant at the standard mix percentages(60 percent and 40 percent) generated additional sales of both quarts and cans of $1,368and $1,296, respectively. Therefore, most of the favorable quantity variance of $3,080 re-sulted from the 600 additional cases sold, not from the shift in consumer purchases fromquarts to cans. The analysis in Table 13–8 indicates that consumer demand for Pepsi prod-ucts increased—not that consumers shifted their demand for cans relative to quarts.
TABLE 13–8 Mix and Sales Variances of Quarts and 12-Ounce Cans,Friendly Supermarket, May
Quarts 12-Oz. Cans Total
Actual mix % 57.55% 42.45%Standard mix % 60.00% 40.00%
% difference 2.45% U 2.45% FActual units of all products sold 10,600 10,600
Change in units 260 U 260 FStandard price $ 3.80 $ 5.40
Mix variance $ 988 U $1,404 F $416 F
Actual units of all products sold 10,600 10,600Standard units of all products sold 10,000 10,000
Difference in units sold 600 F 600 FStandard mix % 60% 40%
Additional sales 360 240Standard price $ 3.80 $ 5.40
Sales variance $1,368 F $1,296 F $2,664 F
Quantity variance $ 380 F $2,700 F $3,080 F
ManagerialApplication:UsingVariancesto ManageDistribution
With rising fuel costs Catalyst Paper Corporation (www.catalystpaper.com) has taken aclose look at managing its distribution function. Catalyst, one of North America’s largestpaper companies, produces many quality paper and pulp products. The firm uses com-prehensive variance analysis reporting to control its distribution costs. The company re-ports four primary variance categories: volume, customer mix, distribution mix, andcarrier charges, and it incorporates (a) mix variance calculations where there is morethan one mix factor within a single cost element; (b) the impact of unplanned and unre-alized activities; and (c) multiple nested mix variance calculations.
SOURCE: K Gaffney, V Gladkikh, and R Webb, “A Case Study of a Variance Analysis Framework for Managing DistributionCosts,” Canadian Accounting Perspectives 6, no. 2 (2007), p. 167.
zim36725_ch13_592-626.qxd 12/11/09 9:56 AM Page 607

608 Chapter 13
If a company sells products that are viewed as substitutes, the mix variance is a usefulway to isolate the dollar magnitude of the substitutions. There are other ways to calculatemix and sales variances. The formulas presented above illustrate just one particular way tocalculate the variances. Marketing organizations will tailor their variance reports to providethe most meaningful data for their particular circumstances.
Q13–6 Define four different marketing variances.
Q13–7 Describe what the mix and sales variances measure.
D. SummaryThis chapter extends the discussion in Chapter 12 on standard costs by describing overhead and mar-keting variances. Chapter 9 introduced over- or underabsorbed overhead as the difference between thetotal overhead actually incurred and the amount of overhead absorbed. Over- or underabsorbed over-head, which represents the total overhead variance, can be disaggregated into three variances that helpidentify the reasons for the total overhead variance. The overhead efficiency variance is the amountof variable overhead that results from actual volume differing from standard volume. The overheadvolume variance is the amount of unused or overused fixed capacity. Finally, the overhead spendingvariance measures the difference between how much overhead was actually incurred versus howmuch should have been incurred for the actual volume.
Marketing variances identify why budgeted revenues differ from actual revenues. Price vari-ances calculate the effect of actual prices differing from standard prices. Quantity variances calculatethe effect of actual quantities differing from budgeted quantities. Quantity variances can be furtherdisaggregated into mix variances that show how total revenues changed because customers substi-tuted one product for another and into sales variances that show how total revenues changed becauseactual units sold differed from standard. These marketing variances illustrate how variance analysiscan be used in nonmanufacturing settings.
Self-Study ProblemInjection Molding Department (Continued from Chapter 12)
The injection molding department has the following standards for materials, direct labor, and overhead:
Per Finished Lot
Materials 10 pounds @ $3.00/pound $30.00Direct labor 0.5 hour @ $20.00/hour 10.00Variable overhead 0.5 hour @ $30.00/hour 15.00Fixed overhead 0.5 hour @ $54.00/hour 27.00
Total cost per lot $82.00
Overhead is assigned to products based on standard direct labor hours. The number of finishedlots budgeted for the period was 10,000, but 9,810 lots were actually produced. Actual overhead was$425,000 and actual direct labor hours were 3,950.
There were no beginning inventories. All variances were written off to cost of goods sold.
ConceptQuestions
zim36725_ch13_592-626.qxd 12/11/09 9:56 AM Page 608

Overhead and Marketing Variances 609
Required:
Calculate all overhead variances.
Solution:
The first step is to construct the flexible overhead budget:
($27�lot � 10,000 lots) � $30�hour � $270,000 � $30�hour
Since 10,000 lots are budgeted and each lot requires one-half hour of direct labor, then 5,000 directlabor hours are budgeted. Also, note that the overhead rate is $84 per direct labor hour ($30 variable �$54 fixed). The overhead rate can be computed directly as
Overhead rate � [$270,000 � ($30�hour � 5,000 hours)] � 5,000 hours
� $84�hour
At the end of the year, standard volume is computed as
Standard volume � Actual lots � Standard direct labor hours per lot
� 9,810 lots � 0.50 standard labor hours per lot
� 4,905 standard labor hours
Given the flexible overhead budget and standard volume, the three overhead variances can becalculated:
Spending variance � Actual overhead incurred � Flexible budget @ actual volume
� $425,000 � [$270,000 � ($30 � 3,950)]
� $425,000 � $388,500
� $36,500U
Efficiency variance � Flexible budget @ actual volume � Flexible budget @ standard volume
� $30 � (3,950 � 4,905)
� $28,650F
Volume variance � Flexible budget @ standard volume � Overhead absorbed @ standard volume
� [$270,000 � ($30 � 4,905)] � ($84 � 4,905)
� $417,150 � $412,020
� $5,130U
Summary of variances:Spending variance $36,500 UEfficiency variance 28,650 FVolume variance 5,130 U
Total underabsorbed overhead $12,980 U
zim36725_ch13_592-626.qxd 12/11/09 9:56 AM Page 609

ProblemsP 13–1: On-Call
You work in the Strategy Analysis department of On-Call, a worldwide paging firm offering satellite-based digital communications through sophisticated pagers. On-Call is analyzing the possibility ofacquiring AtlantiCom, an East Coast paging firm in Maine.
AtlantiCom’s latest quarterly report disclosed an unfavorable volume variance of $1.3 million.The engineering staff of On-Call, familiar with AtlantiCom’s network, estimates that AtlantiCom hasquarterly fixed overhead costs of $6.5 million that can deliver 800,000 message packets per quarter.A message packet is the industry standard of delivering a fixed amount of digital information withina given time period.
In valuing AtlantiCom, senior management at On-Call wants to know whether AtlantiCom hasexcess capacity, and, if so, how much.
Required:
As a percentage of AtlantiCom’s current capacity of 800,000 message packets, estimate AtlantiCom’sover- or undercapacity last quarter. Assume that the quarterly fixed overhead costs of $6.5 millionapproximate budgeted fixed overhead and that actual and standard volumes are the same.
P 13–2: Purchasing Department
The purchasing department of Bradley Inc. is responsible for companywide purchasing. Its total costsare assigned to each division based on the number of purchase orders the purchasing departmentprocesses for each division. The purchasing department’s fixed costs are $300,000 per year and itexpects to process 15,000 purchase orders (POs) at a variable cost of $50 per purchase order. Pur-chasing costs do not include the cost of the items purchased.
Purchasing processed 16,000 POs during the year and incurred total costs (excluding the cost ofthe items purchased) of $1,180,000.
Required:
a. Design a performance evaluation report for the purchasing department.
b. Describe what each item in the report measures.
c. Evaluate the performance of the purchasing department.
d. What other performance measures would you want to collect and report for the purchasingdepartment?
P 13–3: Spectra Inc.
Spectra Inc. produces color monitors for personal computers. The firm makes 19-inch monitors withthe following cost structure:
Direct materials $220
Direct labor $150
Because of the rapidly changing market for computer monitors, standard costs, overhead rates,and prices are revised quarterly. While the direct labor component of standard cost has been relativelyconstant over time, direct materials costs, especially the cost of the circuit boards, fluctuate widely.Therefore, for pricing purposes, management reviews costs each quarter and forecasts next quarter’scosts using the current quarter’s cost structure. It also uses this method for revising overhead costseach quarter. Overhead is absorbed to products using direct labor cost. Fixed overhead is incurredfairly uniformly over the year. The overhead rate next quarter is the actual overhead costs incurred thisquarter divided by this quarter’s direct labor cost. Data for the last six quarters are shown.
610 Chapter 13
zim36725_ch13_592-626.qxd 12/11/09 9:56 AM Page 610

Overhead and Marketing Variances 611
2010 2011
Q1 Q2 Q3 Q4 Q1 Q2 Q3
Actual unit sales 200 200 190 180 190 250Total direct labor $30,000 $30,000 $28,500 $27,000 $28,500 $37,500Actual overhead $101,000 $102,000 $98,000 $95,000 $97,000 $118,000Overhead rate $3.35 $3.37 $3.40 $3.43 $3.52 $3.40 $3.15
The president of the company, responding to the auditor’s suggestion that Spectra set standardcosts on an annual basis, replied, “Annual budgeting is fine for more static companies like automo-biles. But the computer industry, especially peripherals, changes day by day. We have to be ahead ofour competitors in terms of changing our product price in response to cost changes. If we waited eightmonths to react to cost changes, we’d be out of business.”
Required:
Do you agree with the president or the auditor? Critically evaluate Spectra’s costing system. Whatchanges would you suggest, and how would you justify them to the president?
P 13–4: Logical Solutions
Logical Solutions reports the following overhead variances for 2010:
Spending variance $100,000 FEfficiency variance $100,000 FVolume variance $300,000 F
In addition, actual overhead incurred in 2010 was $1 million. Overhead is absorbed to productsusing standard direct labor hours. 2010 volume was budgeted to be 40,000 direct labor hours andfixed overhead was budgeted to be $600,000.
Required:
What were actual volume, standard volume, and budgeted variable overhead for 2010?
P 13-5: Oneida Metal
Oneida Metal manufactures stainless steel boxes to house sophisticated communications integratedcircuit boards for the defense industry. Oneida cuts the metal, bends it to form the chassis and top,punches holes, and drills and taps holes for screws. Oneida uses a standard cost system. Manufac-turing overhead is assigned to jobs using standard direct labor hours. Before the year begins, Oneidauses a flexible manufacturing overhead budget and estimates the annual fixed manufacturing over-head and the budgeted variable overhead rate per direct labor hour. In the current year, Oneidastarted and completed four jobs. The following table summarizes the four jobs started and completedthis year.
Standard Direct Actual DirectNumber of Units Labor Hours Labor Hours Used
Job # in the Job per Unit in the Job
1 1,000 2 2,1002 2,000 3 6,2003 1,000 1 9004 2,000 4 8,100
zim36725_ch13_592-626.qxd 12/16/09 10:08 AM Page 611

612 Chapter 13
There were no beginning or ending work-in-process inventories. Budgeted variable overheadwas estimated to be $8 per direct labor hour. The following table summarizes the operating results andstandards for the year:
Actual direct labor wages paid $519,000Annual budgeted direct labor hours 19,000Standard direct labor wage rate per hour $31Actual manufacturing overhead incurred $406,400Manufacturing overhead rate per direct labor hour $20
Required:
Calculate the following:
a. Total direct labor efficiency variance (sum over the four jobs).
b. Total direct labor wage rate variance (aggregate over the four jobs).
c. Budgeted annual fixed manufacturing overhead.
d. Manufacturing overhead spending variance.
e. Manufacturing overhead efficiency variance.
f. Manufacturing overhead volume variance.
P 13–6: Beanie Babies
The Ogden plant makes Beanie Babies, small stuffed toys in a variety of animal shapes. The toys areso popular that they have become collectors’ items. The plant uses a flexible budget and predeter-mined overhead rates to assign overhead costs to the different Beanie Babies produced. Overheadcosts are assigned using direct labor hours. Fixed overhead is budgeted at $2.3 million for the nextyear and variable overhead is predicted to be $3.50 per direct labor hour.
The plant was designed two years ago for 180 production employees (direct labor), each work-ing 2,000 hours per year. With the high demand for Beanie Babies, 240 production workers are pro-jected for next year, each expected to work 2,200 hours per year. At the end of the year, based on theactual number of Beanie Babies produced, standard volume was 480,000 direct labor hours.
Required:
a. Calculate overhead rates using expected and normal volume. Round the overhead rates totwo significant digits.
b. Calculate the volume variance for the year assuming expected volume is used in setting theoverhead rate.
c. Calculate the volume variance for the year assuming normal volume is used in setting theoverhead rate.
d. Write a short memo that non-accounting senior managers can understand interpreting whythe volume variance in part (b) differs from the volume variance in part (c). In other words,why do the numbers in parts (b) and (c) differ and why is this difference relevant to themanagers?
P 13–7: Printers, Inc.
Printers, Inc., manufactures and sells a midvolume color printer (MC) and a high-volume colorprinter (HC). Each MC requires 100 direct labor hours to manufacture and each HC requires 150direct labor hours. At the beginning of the year, 700 MCs are scheduled for production and 500HCs are scheduled. At the end of the year, 720 MCs and 510 HCs were produced. Fourteen hun-dred hours too many were used in producing MCs and 3,000 hours fewer than standard were usedto manufacture HCs. The flexible overhead budget is $2.9 million of fixed costs and $10 per directlabor hour.
zim36725_ch13_592-626.qxd 12/11/09 9:57 AM Page 612

Required:a. Calculate budgeted volume.
b. Calculate standard volume.
c. Calculate actual volume.
d. Calculate the overhead rate.
e. Calculate the overhead volume variance and discuss its meaning.
P 13–8: Galt Electric Motors
Galt Electric Motors (GEM) produces two types of motors, small and large. Standard machine timeto make one small motor is 20 minutes; standard machine time to make one large motor is 30 min-utes. GEM plans to make 30,000 small motors and 20,000 large motors during the year. Budgetedmanufacturing overhead (fixed and variable) for GEM is $1,800,000. During the year, Galt used21,600 machine hours to make 27,000 small motors and 24,000 large motors. Actual overhead in-curred during the year was $1,900,000.
a. What is GEM’s standard overhead rate per machine hour? How much overhead is reflectedin the standard cost of each type of motor?
b. Use your answers in part (a) to verify that GEM’s total overhead variance during the yearwas $10,000. Is this variance favorable or unfavorable?
c. The table below decomposes the $10,000 overhead variance into spending, efficiency, andvolume variances assuming that (1) all overhead is variable and (2) all overhead is fixed.Verify the variances and determine which variances are favorable and which areunfavorable.
(1) (2) Overhead Is Overhead Is
Variance Variable Fixed
Spending $44,000 $100,000Efficiency 54,000 0Volume 0 90,000
Total $10,000 $ 10,000
d. Explain the economic intuition behind these variances. In particular, explain why eventhough in each case the expenditures, inputs, and outputs are the same, (1) the spendingvariances are different, (2) there is no efficiency variance in the “fixed overhead” case, and(3) there is no volume variance in the “variable overhead” case.
SOURCE: R Sansing.
P 13–9: Western Sugar
Western Sugar processes sugar beets into granulated sugar that is sold to food companies. It uses astandard cost system to aid in cost control and performance evaluation. To compute the standardsfor next year, the actual expense incurred by expense category is divided by the bushels of sugarbeets processed to arrive at a standard cost per bushel. These per-bushel standards are then in-creased by the expected amount of inflation forecast for that expense category. This year, WesternSugar processed 63 million bushels of beets. The accompanying table calculates next year’s stan-dard costs.
Overhead and Marketing Variances 613
zim36725_ch13_592-626.qxd 12/11/09 9:57 AM Page 613

WESTERN SUGARStandard Costs
Next Year($000s)
This Year’s Cost per Inflation Standard Cost Cost Bushel Adjustment per Bushel
Direct labor $ 33,000 $0.524 4.0% $0.544Sugar beets 58,000 0.921 3.5 0.953Variable overhead 24,000 0.381 5.0 0.400Fixed overhead 43,000 0.683 2.0 0.696
Total $158,000 $2.509 $2.593
Next year, actual production is 68 million bushels. At the end of next year, the following reportis prepared:
WESTERN SUGARActual Results Compared with Standard
Next Year($000s)
Actual Standard Cost StandardCost per Bushel Cost Variance
Direct labor $ 38,100 $0.544 $ 36,992 $1,108 USugar beets 64,829 0.953 64,804 25 UVariable overhead 28,211 0.400 27,200 1,011 UFixed overhead 45,227 0.696 47,328 2,101 F
Total $176,367 $2.593 $176,324 $ 43 U
Senior management was not surprised at the small variances for labor and sugar beets. The pro-cessing plant has very good operating controls and there had been no surprises in the sugar beet mar-ket or in the labor market. Initial forecasts proved to be good. Management was delighted to see thefavorable total overhead variance ($1,090F � $1,011U � $2,101F). Although variable overhead wasover budget, fixed overhead more than offset it. There was no major change in the plant’s productiontechnology to explain this shift (such as increased automation), so senior management was preparedto attribute the favorable total overhead variance to better internal control by the plant manager.
Required:
a. What do you think is the reason for the overhead variances?
b. Is it appropriate to base next year’s standards on last year’s costs?
P 13–10: Soldering Department
The soldering department of Xtel Circuits solders integrated circuits onto circuit boards. Thedepartment is highly automated. The existing machinery is state of the art, having been installed only15 months ago.
Overhead in the department is allocated based on machine hours. Normal volume is 2,000 ma-chine hours per month. Fixed overhead averages $160,000 per month, and variable overhead is $110per machine hour. Actual volume for the month of March (which just ended) was 2,400 machinehours, and standard volume was 2,200 machine hours.
614 Chapter 13
zim36725_ch13_592-626.qxd 12/11/09 9:57 AM Page 614
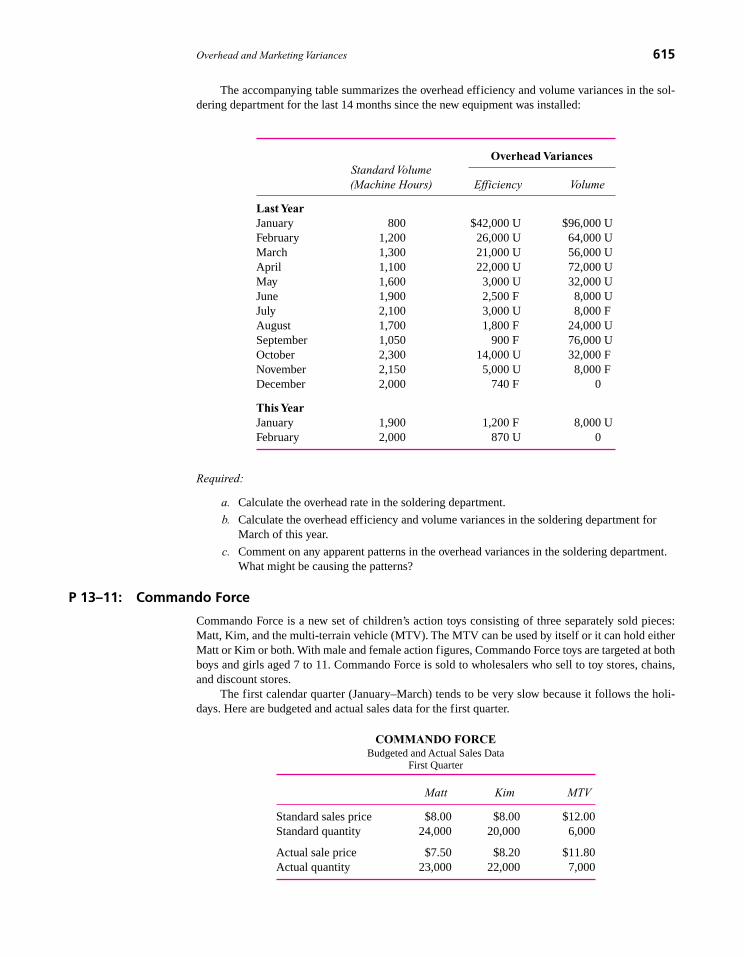
The accompanying table summarizes the overhead efficiency and volume variances in the sol-dering department for the last 14 months since the new equipment was installed:
Standard Volume(Machine Hours) Efficiency Volume
Last YearJanuary 800 $42,000 U $96,000 UFebruary 1,200 26,000 U 64,000 UMarch 1,300 21,000 U 56,000 UApril 1,100 22,000 U 72,000 UMay 1,600 3,000 U 32,000 UJune 1,900 2,500 F 8,000 UJuly 2,100 3,000 U 8,000 FAugust 1,700 1,800 F 24,000 USeptember 1,050 900 F 76,000 UOctober 2,300 14,000 U 32,000 FNovember 2,150 5,000 U 8,000 FDecember 2,000 740 F 0
This YearJanuary 1,900 1,200 F 8,000 UFebruary 2,000 870 U 0
Required:
a. Calculate the overhead rate in the soldering department.
b. Calculate the overhead efficiency and volume variances in the soldering department forMarch of this year.
c. Comment on any apparent patterns in the overhead variances in the soldering department.What might be causing the patterns?
P 13–11: Commando Force
Commando Force is a new set of children’s action toys consisting of three separately sold pieces:Matt, Kim, and the multi-terrain vehicle (MTV). The MTV can be used by itself or it can hold eitherMatt or Kim or both. With male and female action figures, Commando Force toys are targeted at bothboys and girls aged 7 to 11. Commando Force is sold to wholesalers who sell to toy stores, chains,and discount stores.
The first calendar quarter (January–March) tends to be very slow because it follows the holi-days. Here are budgeted and actual sales data for the first quarter.
COMMANDO FORCEBudgeted and Actual Sales Data
First Quarter
Matt Kim MTV
Standard sales price $8.00 $8.00 $12.00Standard quantity 24,000 20,000 6,000
Actual sale price $7.50 $8.20 $11.80Actual quantity 23,000 22,000 7,000
Overhead Variances
Overhead and Marketing Variances 615
zim36725_ch13_592-626.qxd 12/11/09 9:57 AM Page 615

Required:
a. Calculate the price and quantity variances for each separately sold toy and all the toys.
b. Calculate the mix and sales variances for each separately sold toy and all the toys.
c. Write a short memo interpreting to management the variances in (a) and (b).
P 13–12: Wine Distributors
Wine Distributors is a wholesaler of wine, buying from wineries and selling to wine stores. Three dif-ferent white wines are sold: Chablis, Chardonnay, and Riesling. Here are budgeted and actual salesdata for the month of April.
WINE DISTRIBUTORSBudgeted and Actual Sales Data
April
Chablis Chardonnay Riesling Total
Standard sales price $7.00 $8.25 $6.75Standard quantity 10,000 4,000 12,000 26,000
Actual sale price $7.25 $8.10 $7.10Actual quantity 8,000 6,000 11,000 25,000
Required:
Write a short memo to management analyzing the operating performance for April.
P 13–13: Auden Manufacturing
Auden Manufacturing produces a single product with the following standards:
Standard direct labor cost per unit $2.00
Standard direct materials per unit $3.00
Flexible overhead budget $60,000 � $4 per direct labor dollar
Normal production 10,000 units
FIFO inventory costing is used. Normal volume is used as budgeted volume. Actual production,sales, and costs for the year were as follows:
Sales 11,000 units @ $20 per unit
Production 9,000 units
Beginning inventory (composed of $5 variable cost per unit and $14 fixed costs per unit) 2,000 units @ $38,000
Direct labor cost of units produced $18,000
Direct materials cost of units produced $27,000
Total overhead incurred (composed of $60,000 fixed and $75,000 variable overhead) $135,000
Required:
a. Compute the overhead rate used to apply overhead to the product.
b. Calculate all variances.
616 Chapter 13
zim36725_ch13_592-626.qxd 12/11/09 9:57 AM Page 616

c. Calculate net income under absorption costing. (All variances are taken to cost ofgoods sold.)
d. Calculate net income under variable costing. (All variances are taken to cost ofgoods sold.)
e. Reconcile the difference in income between variable costing and absorption costing.
P 13–14: Turow Trailers
Turow Trailers assembles horse trailers. Two models are manufactured: G7 and V8. While labor-intensive, the production process is not very complicated. The single plant produces all the trailerswith 48 work teams of two or three workers. Sixteen supervisors oversee the work teams. Materialshandlers deliver all the parts needed for each trailer to the work team. Human resources, accounting,inspection, purchasing, and tools are the other major overhead departments. Some operating statisticsfor 2010 and 2011 follow.
2010 2011
Budgeted denominator volume (direct labor hours) 1 million 1 millionFlexible budget:
Fixed overhead $2.1 million $2.2 millionVariable overhead per direct labor hour $7 $8
Units produced:G7 11,000 8,000V8 12,000 6,000
Standard direct labor hours per unit of:G7 40 40V8 50 50
Actual overhead incurred $9.0 million $8.1 millionActual direct labor hours 1 million 0.7 million
Required:
a. Calculate all the overhead variances for both 2010 and 2011.
b. Discuss who in the plant should be held responsible for each overhead variance.
P 13–15: Betterton Corporation
Betterton Corporation manufactures automobile headlight lenses and uses a standard cost system.At the beginning of the year, the following standards were established per 100 lenses (a singlebatch).
Input Amount
Direct materials 100 pounds @ $2.00�pound $200Direct labor 5 hours @ $18�hour 90Factory overhead:
Fixed overhead $4 per direct labor hour 20Variable overhead $6 per direct labor hour 30
Total cost per batch of 100 headlight lenses $340
Overhead and Marketing Variances 617
zim36725_ch13_592-626.qxd 12/11/09 9:57 AM Page 617

Expected volume per month is 5,000 direct labor hours for January, and 105,000 headlight lenseswere produced. There were no beginning inventories. The following costs were incurred in January:
Total factory overhead incurred (Fixed � Variable) $ 59,000
Direct labor 5,400 hours $ 99,900
Direct materials used 102,000 pounds
Direct materials purchased 110,000 pounds $209,000
Required:
a. Calculate the following variances:
(1) Overhead spending variance.
(2) Volume variance.
(3) Over/underabsorbed overhead.
(4) Direct materials price variance at purchase.
(5) Direct labor efficiency variance.
(6) Direct materials quantity variance.
b. Discuss how the direct materials price variance computed at purchase differs from the directmaterials price variance computed at use. What are the advantages and disadvantages of each?
P 13–16: UOP
UOP is a manufacturing firm that has depreciation as its only overhead expense (i.e., there are noindirect labor, indirect materials, property taxes, factory insurance, etc.). UOP uses a flexible budgetat the beginning of the year to forecast overhead in calculating the overhead rate. Overhead is assignedto products based on machine hours.
UOP uses units-of-production depreciation to calculate depreciation. A single machine manu-factures all products. Its original cost is $600,000 and it has an estimated useful life of 10,000machine hours.
UOP manufactures two products: A and B. Units-of-production depreciation is based on stan-dard machine hours used. UOP assigns overhead to products based on standard machine hours, notactual machine hours.
The following budgeted data were produced at the beginning of the year:
Products
A B
Forecast production 100 200Standard machine hours�unit 5 3.5
Actual operating data for the year are as follows:
Products
A B
Actual production 110 220Actual machine hours 600 800
Required:
a. Calculate the overhead rate per machine hour and the amount of budgeted overhead forthe year.
618 Chapter 13
zim36725_ch13_592-626.qxd 12/11/09 9:57 AM Page 618

b. Calculate the total overhead absorbed to products during the year.
c. Calculate the over/underabsorbed overhead for the year.
d. Suppose UOP still assigns overhead to products based on standard machine hours, butnow calculates units-of-production depreciation using actual machine hours. How much isthe over/underabsorbed overhead?
e. Explain any difference between your answers to parts (c) and (d) above. What causes thedifference? Why might UOP prefer the accounting treatment described in part (d) overthat in part (c)?
P 13–17: Artco Planters
Artco manufactures fiberglass home and office planters in a variety of decorator colors. Theseplanters, in three sizes, are used to hold indoor plants. Overhead is allocated based on the standardpounds of fiberglass per planter. Here are standards for the three planters:
StandardProduct Pounds/Planter Expected Units
24" planter 2.3 1,20030" planter 3.7 2,10036" planter 4.6 1,400
Artco uses a flexible budget to calculate overhead rates at the beginning of the year. Fixed over-head for the year is budgeted at $593,950, and variable overhead is budgeted at $2.10 per pound offiberglass. Actual overhead incurred is $633,805. The accompanying table summarizes the actualresults for the year.
Pounds of Fiberglass
Product Units Produced Used
24" planter 1,400 3,57030" planter 2,000 7,04036" planter 1,500 7,120
Required:
a. Calculate the total variance (over/underabsorbed) if standard pounds are used to assignoverhead to products.
b. Calculate the total overhead variance (over/underabsorbed) if actual pounds are used toassign overhead to products.
c. Explain why the answers differ in parts (a) and (b).
P 13–18: Shady Tree Manufacturing
Shady Tree produces two products: M1 and M2. There are no beginning inventories or ending work-in-process inventories of either M1 or M2. A single plantwide overhead rate is used to allocate over-head to products using standard direct labor hours. This overhead rate is set at the beginning of theyear based on the following flexible budget: Fixed factory overhead is forecast to be $3 million andvariable overhead is projected to be $20 per direct labor hour. Management expects plant volume to
Overhead and Marketing Variances 619
zim36725_ch13_592-626.qxd 12/11/09 9:57 AM Page 619

be 200,000 standard direct labor hours. Here are the standard direct labor hours for each product:
M1 M2
Standard direct labor hours per unit 3 5
The efficiency and spending overhead variances for the year were zero. The following table sum-marizes operations for the year.
M1 M2
Units produced 30,000 12,000Units sold 20,000 10,000
Required:
a. Calculate the plantwide overhead rate computed at the beginning of the year.
b. Calculate the volume variance for the year.
c. What is the dollar impact on accounting earnings if the volume variance is written offto cost of goods sold?
d. What is the dollar impact on accounting earnings of prorating the volume variance toinventories and cost of goods sold compared with writing it off to cost of sales?
P 13–19: Ultrasonic
Ultrasonic manufactures three ultrasound imaging systems: Avex, AvexII, and Mel. Overhead is allo-cated to each system based on standard direct material dollars in each system. The firm uses a flexibleoverhead budget to calculate the overhead rate for the coming year, where budgeted volume is based onexpected (projected) direct material dollars. The following table summarizes operations for the year:
Avex AvexII Mel
Selling price $7,800 $10,700 $15,750 Projected production (units) 1,200 650 350Standard direct labor per unit $150 $200 $420Standard direct materials per unit $2,600 $3,300 $4,800Actual units produced 1,400 530 410Total direct materials actually used $3,967,600 $1,679,040 $2,027,040
Fixed manufacturing overhead was budgeted at $7.5 million and variable overhead was budgeted at $0.30per direct material dollar. In other words, each dollar spent on direct materials is expected to generate$0.30 of variable manufacturing overhead. Actual overhead incurred during the year was $10.280 million.
Required:
a. Calculate the budgeted overhead rate Ultrasonic will use to absorb overhead to products.Round the overhead rate to two significant digits.
b. Calculate the total amount of over- or underabsorbed overhead Ultrasonic reports for the year.
c. Compute the overhead spending variance, the overhead volume variance, and the overheadefficiency variance.
P 13–20: Megan Corp.
The following data are available for the Megan Corp. finishing department for the current year. Thedepartment makes a single product that requires three hours of labor per unit of finished product.Budgeted volume for the year was 30,000 direct labor hours.
620 Chapter 13
zim36725_ch13_592-626.qxd 12/11/09 9:57 AM Page 620
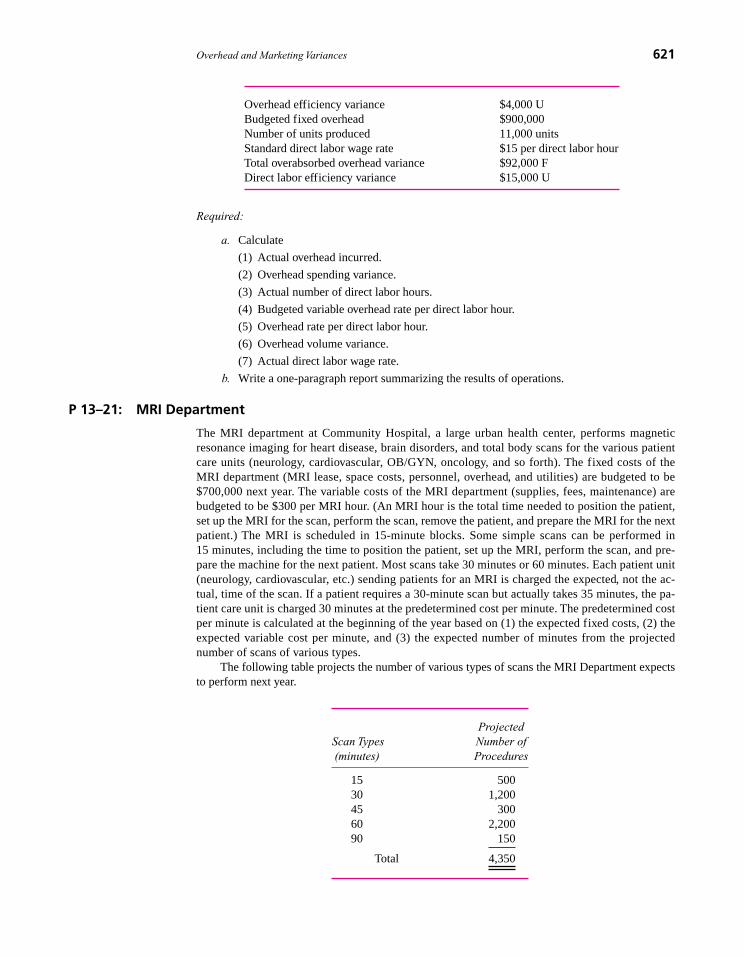
Overhead efficiency variance $4,000 UBudgeted fixed overhead $900,000Number of units produced 11,000 unitsStandard direct labor wage rate $15 per direct labor hourTotal overabsorbed overhead variance $92,000 FDirect labor efficiency variance $15,000 U
Required:
a. Calculate
(1) Actual overhead incurred.
(2) Overhead spending variance.
(3) Actual number of direct labor hours.
(4) Budgeted variable overhead rate per direct labor hour.
(5) Overhead rate per direct labor hour.
(6) Overhead volume variance.
(7) Actual direct labor wage rate.
b. Write a one-paragraph report summarizing the results of operations.
P 13–21: MRI Department
The MRI department at Community Hospital, a large urban health center, performs magneticresonance imaging for heart disease, brain disorders, and total body scans for the various patientcare units (neurology, cardiovascular, OB/GYN, oncology, and so forth). The fixed costs of theMRI department (MRI lease, space costs, personnel, overhead, and utilities) are budgeted to be$700,000 next year. The variable costs of the MRI department (supplies, fees, maintenance) arebudgeted to be $300 per MRI hour. (An MRI hour is the total time needed to position the patient,set up the MRI for the scan, perform the scan, remove the patient, and prepare the MRI for the nextpatient.) The MRI is scheduled in 15-minute blocks. Some simple scans can be performed in15 minutes, including the time to position the patient, set up the MRI, perform the scan, and pre-pare the machine for the next patient. Most scans take 30 minutes or 60 minutes. Each patient unit(neurology, cardiovascular, etc.) sending patients for an MRI is charged the expected, not the ac-tual, time of the scan. If a patient requires a 30-minute scan but actually takes 35 minutes, the pa-tient care unit is charged 30 minutes at the predetermined cost per minute. The predetermined costper minute is calculated at the beginning of the year based on (1) the expected fixed costs, (2) theexpected variable cost per minute, and (3) the expected number of minutes from the projectednumber of scans of various types.
The following table projects the number of various types of scans the MRI Department expectsto perform next year.
Projected Scan Types Number of(minutes) Procedures
15 50030 1,20045 30060 2,20090 150
Total 4,350
Overhead and Marketing Variances 621
zim36725_ch13_592-626.qxd 12/11/09 9:57 AM Page 621

At the end of the year the MRI Department performed the following number of scans and the actualtime spent on each scan:
Actual Actual TimeScan Types Procedures (minutes)
15 400 6,20030 1,300 40,00045 280 13,00060 2,300 139,00090 120 11,000
Total 4,400 209,200
The total cost of operating the MRI Department (fixed and variable costs) was $1,750,000.
Required:
a. Calculate the predetermined cost per minute of MRI scan time.
b. Based on the predetermined cost per minute calculated in (a), what are the total MRIcharges to the patient care units?
c. Prepare a report that analyzes the financial performance of the MRI Department.
d. Write a short report that succinctly summarizes the key findings of your performanceanalysis in part (c).
P 13–22: Anpax, Inc.
Anpax, Inc., manufactures two products: L7 and Q2. Overhead is allocated to products based onmachine hours. Management uses a flexible budget to forecast overhead. For the current year, fixedfactory overhead is projected to be $2.75 million and variable factory overhead is budgeted at $20per machine hour. At the beginning of the year, management developed the following standards foreach product and made the following production forecasts for the year:
ANPAX, INC.Current Year Standards and
Production Forecasts
Products
L7 Q2
Budgeted number of units to produce 25,000 35,000
Production standards:Direct labor per unit 10 hours $15�hour 12 hours $15�hourDirect materials per unit 85 pounds $1�pound 95 pounds $1�poundMachine hours per unit 4 hours 5 hours
There were no beginning or ending inventories. Actual production for the year was 20,000 unitsof L7 and 40,000 units of Q2. Other data summarizing actual operations for the year are:
Direct labor 700,000 hours $9.8 millionDirect materials 5.0 million pounds $5.5 millionMachine hours 270,000 hoursOverhead (both fixed and variable) $8.4 million
622 Chapter 13
zim36725_ch13_592-626.qxd 12/11/09 9:57 AM Page 622

Required:
a. Calculate the overhead rate for the current year.
b. Calculate materials and labor variances. Report quantity (efficiency) variances and pricevariances.
c. Calculate the volume, spending, and efficiency overhead variances.
d. Your boss (a nonaccountant) asks you to explain in nontechnical terms the meaning ofeach overhead variance.
P 13–23: Mopart Division
The Mopart Division produces a single product. Its standard cost system uses a flexible budget to as-sign indirect costs on the basis of standard direct labor hours. At the budgeted volume of 4,000 directlabor hours, the standard cost per unit is as follows:
Selling price $38.00
Direct materials, 3 pounds @ $5 $15.00Direct labor, 0.4 hour @ $20 8.00Variable indirect costs, 0.4 hour @ $6 2.40Fixed indirect costs, 0.4 hour @ $4 1.60
Total cost $27.00
For the month of March, the following actual data were reported:
Units produced 9,000Number of direct labor hours 3,800Actual wage rate $20.50Direct materials used (pounds) 28,000Average price of materials used $5.50Average selling price $38.75Number of units sold 8,800Variable indirect costs $21,500Fixed indirect costs $15,800Variable selling and administrative costs $34,500Fixed selling and administrative costs $28,000
There was no beginning inventory.
Required:
a. Analyze the results of operations for March. Support your analysis.
b. Present two income statements in good format using absorption costing and variablecosting net income.
c. Reconcile any difference in net income between the two statements.
d. What is the opportunity cost of the unused normal capacity?
Overhead and Marketing Variances 623
zim36725_ch13_592-626.qxd 12/11/09 9:57 AM Page 623

CaseCase 13–1: Lancaster Chamber Orchestra
The Lancaster Chamber Orchestra is a small community orchestra that offers two distinct concertseries for its patrons. Series A is devoted entirely to the performance of a classical repertoire and of-fers 10 concerts throughout the year, while Series B consists of six pops concerts and serves tobroaden the audience base of the ensemble.
Since programming needs change from concert to concert, musicians are hired on a per-service basis. (A service is either a rehearsal or a concert.) They are paid at differential averagerates due to instrumental doubling requirements and also due to solo pay for woodwinds, percus-sion, and brass players. After the budget has been set, variances in musician costs are the result ofchanges in programming and rehearsal scheduling. Programming changes can cause different num-bers of musicians to be needed for a particular series of rehearsals and concerts or can change thedoubling requirements. Changes in rehearsal scheduling can alter needs for certain families of in-struments at some rehearsals. For example, one Series A concert usually consists of six services,but not all instruments are required at each service. Programming and rehearsal scheduling are de-cided by the music director, Maestro Fritz Junger, but musician cost constraints are imposed by thedirector of production, Candice Wrightway. Budgeted and actual musician costs for the 2010–2011season follow.
LANCASTER CHAMBER ORCHESTRAMusicians’ Budget
2010–2011
Series ABudget Actual
Average Number of Services per Number of Services perInstrument Family Rate Musicians Musician Musicians Musician
Woodwinds $65�hour 11 60 10 56Brass $62�hour 10 55 12 53Percussion $58�hour 3 50 3 52Strings $55�hour 25 60 28 59
Series BBudget Actual
Average Number of Services per Number of Services perInstrument Family Rate Musicians Musician Musicians Musician
Woodwinds $65�hour 8 21 10 23Brass $62�hour 14 24 12 24Percussion $58�hour 5 24 3 24Strings $55�hour 22 21 28 19
When the budget was prepared at the beginning of the year, Alan Voit, director of marketing, ad-mitted that projected ticket sales for the two series were optimistic, but he believed that his innovativeadvertising campaign would help the orchestra meet its goal. Although pops sales came in almostexactly on target, a devastating ice storm caused the cancellation of one of the classical concerts.
624 Chapter 13
zim36725_ch13_592-626.qxd 12/11/09 9:57 AM Page 624

Unfortunately, rehearsals had already been held and the musicians had been paid for their services.Series sales figures for the three levels of ticket prices follow.
LANCASTER CHAMBER ORCHESTRARevenue Budget
2010–2011
Series A
Capacity per Price Concert Attendance Revenue Attendance Revenue
$12 800 7,500 $90,000 6,030 $72,36015 300 2,800 42,000 2,475 37,12520 150 1,300 26,000 1,260 25,200
Series B
Capacity per Price Concert Attendance Revenue Attendance Revenue
$14 800 4,680 $65,520 4,734 $66,27616 300 1,680 26,880 1,704 27,26425 150 900 22,500 852 21,300
As with any orchestra, ticket sales alone are never enough to totally cover expenses, so thedirector of development, Lydia Givme, is responsible for the coordination of fundraising in thecommunity. Unfortunately, the goals set at the beginning of the year did not anticipate an extendedrecession, with potential private, corporate, and government contributors tightening their fiscalbelts.
Additional expenses include a long-term rental agreement for the hall, a permanent conductor,guest artists, music rental and advertising costs, and variable production costs based on total services.Music rental and advertising are treated as fixed expenses even though their cost may vary during thecourse of the season. Here are budgeted fixed and variable expenses for 2010–2011.
LANCASTER CHAMBER ORCHESTRABudgeted Fixed and Variable Expenses
2010–2011
Series A Series B
Rent $8,000 $4,800Conductors 30,000 12,200Guest artists 18,000 6,000Music rental 450 800Advertising 10,000 6,000Variable production $15�musician service $15�musician service
Actual (6 Concerts)Budget (6 Concerts)
Actual (9 Concerts)Budget (10 Concerts)
Overhead and Marketing Variances 625
zim36725_ch13_592-626.qxd 12/11/09 9:57 AM Page 625

The income statement for 2010–2011 follows.
LANCASTER CHAMBER ORCHESTRAIncome Statement
2010–2011
Budget Actual
Earned incomeTicket revenue $ 272,900 $ 249,525
Operating expensesMusicians 232,322 241,982Hall rental 12,800 12,800Conductors 42,200 42,200Guest artists 24,000 24,000Music rental 1,250 1,100Advertising 16,000 16,200Variable production 59,190 63,953
Total expenses $ 387,762 $ 402,235
Operating income $(114,862) $(152,710)Other income
Private and corporate contributions 100,000 95,000Public funding 25,000 20,000
Total other income $ 125,000 $ 115,000
Net surplus�(deficit) $ 10,138 $ (37,710)
Required:
a. Calculate a flexible budget for the Lancaster Chamber Orchestra’s 2010–2011 season.
b. After calculating the flexible budget, Randall Nobucs, director of finance, found a totalunfavorable variance in net income of $53,158. Account for this unfavorable variance bycalculating
(1) Revenue variances.
(2) Labor efficiency variances.
(3) Overhead efficiency and overhead spending variances.
c. Nobucs is concerned that if the orchestra faces similar problems in the next season, theaccumulated deficit will cause bankruptcy. He argues with Alan Voit that a 15 percentincrease in ticket prices would ensure a balanced budget for the 2010–2011 season.Discuss the feasibility of this strategy.
d. In examining the income statement, CEO Peter Morris is puzzled. He believes that all ofhis senior staff members are superb and is not sure where to lay the blame for theorchestra’s dismal financial performance. Discuss the areas of specialized knowledgeinvolved in the operation. Which person should be held accountable for each variance?
SOURCE: M Ames, J Dallas, R Krebs, W Perdue, and J Ricker.
626 Chapter 13
zim36725_ch13_592-626.qxd 12/11/09 9:57 AM Page 626

627
Chapter Fourteen
ManagementAccounting in a ChangingEnvironment
Chapter Outline
A. Integrative Framework
1. Organizational Architecture
2. Business Strategy
3. Environmental and Competitive ForcesAffecting Organizations
4. Implications
B. Organizational Innovations andManagement Accounting
1. Total Quality Management (TQM)
2. Just-in-Time (JIT) Production
3. Six Sigma and Lean Production
4. Balanced Scorecard
C. When Should the Internal AccountingSystem Be Changed?
D. Summary
zim36725_ch14_627-673.qxd 12/15/09 2:28 PM Page 627

The business sections of bookstores contain a variety of works describing how to makeorganizations function better. They speak of organizational innovations such as bench-marking, Six Sigma, Total Quality Management, reengineering, lean manufacturing, thevirtual corporation, downsizing, just-in-time, and corporate culture. Most of these pre-scriptions are not directed specifically at improving firms’ internal accounting systems.However, if implemented, most of these organizational changes require significant changesin the accounting system because the accounting system is an integral part of most firms’organizational architecture.
This chapter expands on the framework first introduced in Chapter 1 (section E), inwhich those forces that motivate changes in accounting and organizational architecturewere identified. Such a framework is useful for understanding when a particular organiza-tional innovation, such as Total Quality Management (TQM), should be introduced and theaccounting implications of such a change.
Previous chapters of this book described and analyzed management accounting systems.Besides being used for both decision making and control, these accounting systems supportexternal reporting for shareholders, taxes, and government regulations. Thus, one of thecentral themes of this text is that trade-offs arise when the accounting system is designedfor multiple purposes. In addition to providing a better understanding of the internal usesof the accounting system, this book reinforces the importance of viewing the accountingsystem as part of the firm’s organizational architecture. This analytic structure will helpreaders better understand, use, and design future accounting systems as well as othersystems that evaluate and reward performance and partition decision rights.
This final chapter applies the analysis in the previous chapters to some recent internalaccounting system innovations. Section A reviews many of the key points raised in earlierchapters and expands Chapter 1’s integrative framework in which accounting is an integralpart of the firm’s organizational architecture. This framework is used in section B to ana-lyze recent organizational innovations (Total Quality Management, just-in-time production,Six Sigma, lean manufacturing, and the balanced scorecard) and how accounting systemshave responded to them. Section C discusses when accounting systems should be changed.Finally, section D offers a few concluding thoughts.
Over the course of your career, you will see numerous proposals to modify your firm’sinternal accounting system. Successful managers are those who can identify and implementfirm-value-increasing proposals and avoid value-destroying changes. The four organiza-tional innovations discussed in section B are good case studies for applying what has beenlearned thus far. They also help review the strengths and weaknesses of the traditionalaccounting systems studied earlier.
A. Integrative FrameworkAs described in Chapter 4, firms arise because they can produce goods and services morecheaply than single proprietors transferring intermediate products in market transactions.But with firms come agency problems because the employees tend to care more about theirown personal welfare than about the owners’ welfare. Organizational architectures arise tocontrol these agency costs: Decision rights are partitioned and performance is evaluatedand rewarded. A critical task is linking the decision rights with the knowledge required tomake the decision. It may be easier to transfer the decision rights to the person with theknowledge than to transfer knowledge to the person with the decision rights.
Figure 14–1 expands Chapter 1’s integrative framework for understanding how theaccounting system is used in the firm’s organizational architecture. Starting at the top, twoexternal factors (technological innovation and market conditions) affect the firm’s business
628 Chapter 14
zim36725_ch14_627-673.qxd 12/15/09 2:28 PM Page 628

strategy (described below). The business strategy then interacts with the firm’s organiza-tional architecture to provide incentives for managers and employees. These incentivesaffect the actions taken, which in turn affect the value of the firm. Thus, Figure 14–1emphasizes that external factors like technology and market conditions affect investments,organizational architecture, incentives, actions, and ultimately the value of the firm.
The box labeled organizational architecture in Figure 14–1 outlines the three majorelements of the firm’s organizational architecture described in Chapter 4. The first element,decision rights partitioning, consists in part of separating decision management fromcontrol. In particular, each decision is decomposed into the following sequence of requestsand approvals:
Decision Step Control or Management
1. Decision initiation Management2. Decision ratification Control3. Decision implementation Management4. Decision monitoring Control
The individual with the decision rights for decision management usually does not havethe decision rights for control. This separation of decision management from control
1. OrganizationalArchitecture
Management Accounting in a Changing Environment 629
Technologicalinnovation
Marketconditions
Decision rights partitioning• Separation of decision management from
decision control • Centralization/decentralization
Performance evaluation system• Accounting system• Nonfinancial systems
Performance reward and punishment system• Compensation policy• Promotion policy
Organizational Architecture
Business Strategy
Asset structureCustomer base
Nature of knowledge creation
Incentives and actions
Firm value
FIGURE 14–1
The determinants ofbusiness strategy,organizationalarchitecture, andfirm value
zim36725_ch14_627-673.qxd 12/15/09 2:28 PM Page 629

reduces the agency problem in organizations. For example, as described in Chapter 12,standard-setting usually requires input from individuals who will have their performancejudged, at least in part, by these standards. Therefore, the decision rights to set or change thestandards are not all vested in the same people who will be judged by the standards. The costaccounting department, industrial engineering, and senior management retain the decisioncontrol rights to ratify and monitor the standard costs.
In order to make decisions (for either decision management or control), managersrequire information. One would expect the information used for ratifying and monitoring(control) to be qualitatively different from the information used in initiation and imple-mentation (management). Decision control information is likely to be more aggregate, lessdetailed, less timely, and less under the control of the manager being monitored than isdecision management information. In particular, the manager being monitored should haveless discretion to alter the information system being used for control than the managerusing the information for decision management.
Another aspect of decision rights partitioning is deciding what part of the organiza-tion should make a particular decision; this is often referred to as the centralization–decentralization question. The location of decision rights affects the structure of thefirm—whether the firm is organized functionally by marketing, manufacturing, and distri-bution or else by lines of business. In all cases, decision rights must be linked with theknowledge needed for decision making.
The second component of a firm’s organizational architecture in Figure 14–1 is theperformance evaluation system, which includes the accounting system. Besides usingaccounting-based measures of performance, firms also develop nonaccounting-basedmeasures: the firm’s stock price, customer complaints, quality, and percentage of deliver-ies on time.
The third component of a firm’s organizational architecture is the performance rewardsystem. This consists of the firm’s compensation and promotion policies. If performancecan be measured easily and with little error, such as by counting the number of unitsproduced by the employee, then more of the employee’s pay varies directly with perfor-mance (piece rate). Otherwise, more of the employee’s compensation is relatively fixed andis not tied directly to measured performance.
Why do firms have different organizational architectures, including different accountingsystems? What factors cause firms to modify their organizational architectures? The topthree boxes in Figure 14–1, labeled technological innovation, market conditions, and busi-ness strategy, outline the factors affecting a firm’s organizational architecture.
Each firm faces different investment opportunities, which are the investment projectsavailable to the firm today and in the future.1 The investment projects available to andselected by the firm comprise its business strategy. Some firms, such as consumer elec-tronics firms, have large R&D programs that create many new product ideas, some of whichare profitable. Other firms, such as utilities, have very few new investment projects; regula-tory agencies limit the types of services they can provide, and their investment opportunities
2. BusinessStrategy
630 Chapter 14
1 The following papers present evidence regarding the interdependencies among organizational architecture,capital structure, and accounting choice outlined in this section and summarized in Figure 14–1. C Smith andR Watts, “The Investment Opportunity Set and Corporate Financing, Dividend, and Compensation Policies,”Journal of Financial Economics 32 (1992); and J Gaver and K Gaver, “Additional Evidence on the Associationbetween the Investment Opportunity Set and Corporate Financing, Dividend, and Compensation Policy,”Journal of Accounting and Economics 16 (1993), pp. 125–60. Also see J Brickley, C Smith, and J Zimmerman,Managerial Economics and Organizational (Architecture), 5th ed. (New York: McGraw-Hill/Irwin, 2009).
zim36725_ch14_627-673.qxd 12/15/09 2:28 PM Page 630

ManagerialApplication:BusinessStrategy andCustomerBase at Xerox
Xerox’s traditional customer was the manager of the client’s central reprographicsdepartment (CRD). Most large photocopier users had CRDs with high-volume, light-lenscopiers. CRDs were pretty similar with operators feeding hard-copy originals and pro-ducing large copy volumes. But digital technology allows users to network computersdirectly to copiers that can produce both black and white and color prints. The customersof this digital technology are no longer CRD managers but computer centers and infor-mation technology managers. Xerox sales representatives now must have more technicalexpertise in computer systems and networking, and more specialized knowledge of thecustomer’s business and document processing needs. Each Xerox device performs multi-ple functions (scanning, printing, finishing, and faxing). The changing nature of Xerox’scustomers and the increasing complexity of its products compelled Xerox to change howits sales force is organized. Instead of being organized geographically and by size ofcustomer, the sales force is organized along industry lines and products. Some Xeroxsalespeople specialize by client industry (education, law firms, manufacturing) andothers by product line (color specialists, high-volume specialists, and so forth).
ManagerialApplication:Technologyand Banking
Secure Internet connections and computers have made possible automated teller ma-chines (ATMs). ATM networks have reduced the need for numerous local branch banks.Economies of scale in ATM networks and hence the need for fewer branch banks wereone of the reasons for the many U.S. bank mergers in the 1990s. A corporate merger isan example of how companies change their organizational architecture.
consist of maintaining their current power-generating capacity. Public utilities rely onincreases in consumer demand for electricity and heat to grow the utility’s business, andmost of their value derives from their existing assets in place (power plants and distributionsystems). Firms such as consumer electronics firms and pharmaceuticals, however, havesignificant amounts of future growth options because of their R&D investments.
One important existing asset that generates future investment opportunities is thefirm’s brand-name capital, which provides consumer name recognition that lowers theinformation costs of introducing new products. Pepsi is recognized worldwide. When Pepsiintroduced Diet Pepsi, consumers already had an expectation of taste and quality beforesampling the new product. Its existing brand-name capital gives Pepsi a cost advantage thatnew entrants do not have when introducing a new product. Thus, brand-name capital affectsthe types of new investments a firm will undertake.
Business strategy affects the firm’s organizational architecture because it determinesthe firm’s asset structure, its customer base, and the nature of knowledge creation anddissemination within the firm. Each of these in turn affects and is affected by the firm’sorganizational architecture. (Notice the two-way arrow in Figure 14–1.) That is, not only doesthe firm’s business strategy affect how the firm is organized, the organizational architectureaffects the ability of the firm to generate and implement new profitable investment oppor-tunities and hence new business strategies. For example, Corning, a glass companyprimarily making dishes and glassware (Corning Ware and Pyrex) invented fiber opticcable active matrix LCDs and ceramic substrate for automobile catalytic converters. Theseinnovations caused significant changes in Corning’s organizational architecture. Likewise,
Management Accounting in a Changing Environment 631
zim36725_ch14_627-673.qxd 12/15/09 2:28 PM Page 631

632 Chapter 14
ManagerialApplication:Evolving Roleof ManagerialAccounting inChina
In 1979 China replaced its centrally planned economy with a market economy. Underthe old system, the prices of companies’ inputs and outputs, as well as their productiontargets, were set by the government. The cost of firms’ inputs and the price of their out-puts were fixed by the central government, and managers were measured on how muchoutput they could produce. With a market economy, prices are set by markets and firmsdetermine what to produce and in what quantities, and how to produce it in order tomaximize profits.
Before 1979 management accounting did not exist in China. Under a planned econ-omy, accountants were accumulators and reporters of financial data to government centralplanners who set production quotas and prices for each firm’s output. Accountants wereviewed as bookkeepers. Following the reforms, companies eliminated their accountingfunctions that reported financial data to central planners. Management accountants inChina today resemble their Western counterparts. Chinese management accountants nowdescribe their most important functions as providing other managers in their firms withfinancial information for decision making and cost management and control.
This example illustrates how changes in market conditions (replacing a centrallyplanned economy with a market economy) in Figure 14-1 cause firms to change theirstrategy (from maximizing output to maximizing profits) and also change their organiza-tional architectures. The role and decision rights of accountants changed in Chinese firms.
SOURCE: R Lawson, “Moving Ahead: The Evolving Role of the Finance and Accounting Function in China,” StrategicFinance, March 2009, pp. 27–33.
successful organizational architecture generates new investment opportunities that can becommercially exploited.
Business strategy consists of the following:1. Asset structure. The firm’s business strategy determines its asset structure. Pharma-
ceutical company assets are primarily drug patents and brand-name drugs, whereas telephonecompany assets are primarily telephone lines and switching equipment. If the firm’s assetsare in the form of buildings and machinery, the performance evaluation systems are morelikely based on accounting measures. If the firm’s assets are in the form of future growthoptions, as in an oil and gas exploration firm, the firm is more likely to tie executives’ com-pensation to market-based performance such as stock and stock options.
2. Customer base. The business strategy determines the type of customer and the geo-graphic dispersion of customers, which in turn affect how the firm is organized to service thecustomer base. For example, franchised retail stores like fast-food outlets are an alternativeto company-owned stores when the customer base is geographically dispersed. The fran-chised store is operated by an independent owner who has more incentive to acquirespecialized knowledge of the local market and to maximize profits than would an employeeof the parent company. But to monitor the quality of the franchised outlets, the franchiserrequires a field organization to inspect the outlets, which in turn dictates how the franchiseris organized (including performance evaluation and reward systems for the field group).
3. Knowledge creation. The nature of knowledge creation is determined by the busi-ness strategy selected. If the firm is in very stable markets in which knowledge is not cre-ated quickly, a more centralized organizational architecture can be adopted. Certain kinds ofknowledge (like sales figures) can be converted to numerical representation that can easilybe communicated to others in the firm. But other types of knowledge, such as customerpreferences in particular markets, are more difficult to write down and convey to others.
zim36725_ch14_627-673.qxd 12/15/09 2:28 PM Page 632

Easily communicated knowledge allows decision rights to be vested higher in the firm,meaning that lower-level performance evaluation and reward systems can be simpler.Therefore, the investments chosen by the firm determine how and where knowledge isgenerated, which affects the partitioning of decision rights. At Xerox, understanding thecustomer’s document processing needs is much more important with a digital, networkedprinter than with the older, light-lens copier.
The top two boxes in Figure 14–1 indicate that the firm’s business strategy depends ontechnological innovations and changes in market conditions. New technology such as fiberoptics causes relative prices of competing technologies to change, which in turn causessome investment projects to become more valuable and others less valuable. For example,fiber optics helped to create the Internet, which allows e-mail. E-mail, in turn, reduces thedemand for fax and regular postage services (snail mail). Technological change affectsthe costs of transmitting knowledge and monitoring performance. Manufacturing plantsuse beepers and cellular phones to monitor maintenance personnel. Restaurants use vibrat-ing beepers to alert wait staff that orders are ready and to let customers know that their tableis available. Technological change sets off a chain reaction that causes not only the invest-ment opportunities but also the firm’s knowledge base, asset structure, customer base, andorganizational architecture (including its internal accounting systems) to change.
A similar chain reaction is set off when market conditions change. Increased globalcompetition has forced many firms that once enjoyed protected domestic markets tobecome more cost competitive. Instead of making products domestically, firms now sourceparts and subcomponents globally, causing organizational changes. Market conditionschange for a variety of reasons, including changes in government regulations and taxationpolicies. Changes in tax rates cause the profitability (after taxes) of investment opportuni-ties to change, thus affecting which projects are accepted. The North American Free TradeAgreement (NAFTA) reduced tariffs among Canada, Mexico, and the United States. As aresult of NAFTA, companies relocated production sites in search of lower costs. Not onlyhas the flow of trade increased among the three countries, but the geographic dispersion ofcompany operations has changed. Emerging markets in the People’s Republic of China andthe former Soviet Union also have set off chain reactions within firms seeking to expandinto these markets. Their investment opportunities (business strategies) have changed,prompting modifications in organizational architecture.
It is important to emphasize that the preceding discussion and Figure 14–1 do not rep-resent a complete overview of a very complex set of interactions. Many other importantcorporate policies such as capital structure, information technology, and marketing strategyhave been excluded to simplify the discussion. However, the important point should not bemissed—the internal accounting system is related to a larger set of other corporate policies.
Successful firms (and managers) will be those who adapt quickly to changing markets andtechnologies. New profitable investments will appear and some previously profitableinvestments will become unprofitable. Successfully implementing profitable projectsrequires organizational architectures that link decision rights and knowledge and that createincentives for managers to use their knowledge to take actions that capture the value in theinvestments undertaken.
While this book has focused on the firm’s internal accounting system, it is importantto understand the larger setting into which the accounting system fits. Figure 14–1 gives thebig picture and highlights how external shocks to the firm from technological innovationand changing market conditions affect its value by working through the interdependenciesbetween organizational architecture (including the choice of accounting systems) and the
4. Implications
3. Environmentaland CompetitiveForces AffectingOrganizations
Management Accounting in a Changing Environment 633
zim36725_ch14_627-673.qxd 12/15/09 2:28 PM Page 633

firm’s business strategy. Senior managers are constantly trying to adapt to these externalshocks by modifying their business strategy and organizational architecture. Figure 14–1provides two important observations:
1. Alterations in the firm’s organizational architecture, including changes in theaccounting system, are likely to occur in response to changes in the firm’s businessstrategy caused by external shocks from technology and shifting market conditions.
2. Changes in the accounting system rarely occur in a vacuum. Accounting systemchanges generally occur at the same time as changes in the firm’s business strategyand other organizational changes, particularly with regard to the partitioning ofdecision rights and the performance evaluation and reward systems.
Three significant managerial implications are derived from these two observations.First, before implementing an accounting or other organizational change, it is important tounderstand what is driving the change. Second, a new accounting system should not beadopted merely because other firms are doing so; they may be reacting to a different set ofexternal shocks. Third, an accounting system should not be changed without concurrent,consistent changes in the way decision rights are partitioned as well as in the performancereward systems. All three parts of the organization’s architecture must be internally consis-tent and coordinated.
In a study of 40 randomly selected manufacturing plants in the United States, theresearchers report that changes in manufacturing practices cause changes in the performancereporting and control systems. They document that implementation of just-in-time manu-facturing and total quality programs is positively correlated with the amount of informationbeing provided to lower-level managers on the shop floor.2 This study supports the earlierclaim that accounting system changes often occur in conjunction with other changes in afirm’s organizational architecture.
Q14–1 Define the firm’s business strategy.
Q14–2 Describe how the firm’s business strategy affects itsorganizational architecture.
Q14–3 Describe why technological innovation and changes inmarket structure cause firms to change their organizationalarchitecture.
Q14–4 Is it a good idea for managers to copy organizational changesadopted by other firms?
B. Organizational Innovations and Management AccountingA number of organizational innovations have been pursued: Total Quality Management,just-in-time production, Six Sigma, lean manufacturing, and the balanced scorecard. Thissection describes these innovations and their effect on management accounting and illustrateshow to apply the framework presented in Figure 14–1 to better understand the innovationsin terms of what causes firms to adopt them and whether they will be successful.
ConceptQuestions
634 Chapter 14
2 R Banker, G Porter, and R Schroeder, “Reporting Manufacturing Performance Measures to Workers: AnEmpirical Study,” Journal of Management Accounting Research 5 (Fall 1993), pp. 33–55.
zim36725_ch14_627-673.qxd 12/15/09 2:28 PM Page 634

Quality is a major issue in both the profit and nonprofit sectors of the economy. Inattempting to improve quality, managers have had to grapple with what it means. There isconsiderable debate surrounding what constitutes Total Quality Management (TQM) andhow to define quality. Nonetheless, to most experts, TQM encompasses both improving thetangible aspects of product quality (performance, reliability, conformance to specification,durability, serviceability, and perceived quality) and enhancing the efficiency of the orga-nization (lowering costs and increasing productivity). TQM seeks to improve all aspects ofthe company: its products, processes, and services. Managers must also design measure-ment systems to report improvements in quality. This section describes various definitionsof quality, discusses some quality measurement systems, and analyzes these systems withinthe framework presented in Figure 14–1.
While quality can be measured in many ways, the two most common methods involvemeeting customer expectations and reducing defects.
Customers have expectations with respect to all of a product’s attributes, includingdelivery schedules, reliability, operating characteristics, and service. These expectationsinclude means, variances, and options. For example, a customer might expect a servicetechnician to arrive on average within two hours of making the service call with a standarddeviation of one hour. If the service representative arrives within one hour but with a stan-dard deviation of two hours, the firm has met one customer expectation (mean arrival time)but has not met another expectation (arriving dependably within two hours).
Most Total Quality Management (TQM) programs contain the following elements:
• Quality is a firmwide process. Every employee, from the senior managers to thefactory floor employees, must understand the quality work processes. Quality linkscustomers to suppliers. The pursuit of excellence is a prime motivator in the company.
• Quality is defined by the customer.
• Quality requires organizational changes. The organization’s architecture (performancemeasurement and reward and decision rights partitioning) must encourage mutualcooperation and create incentives to improve quality. Senior managers should develophands-on, specialized knowledge of how to improve quality. Workers are empowered(i.e., given decision rights) to make changes that increase quality.
• Quality is designed into the product. Quality must be designed into the product andprocesses from the very beginning of manufacturing through delivery of a qualityproduct to the consumer.
Defining quality as meeting customer expectations requires knowledge of the entire setof customer expectations, the actual realized values, and the importance customers attach toparticular expectations. Each customer views deviations from some expectations to be moreimportant than deviations from other expectations. For example, missed delivery schedulesmight be more important than missed service times for some customers. Preferences overproduct attributes vary across customers. Understanding customer preferences for productattributes is important specialized knowledge to acquire. Customers include external customersfor the firm’s products and services as well as internal customers. For example, the mainte-nance department might not have external customers, but it has internal customers.
The traditional approach to ensuring product quality was extensive inspection of rawmaterials, purchases, and manufactured products. Inspection stations and quality assuranceinspectors were added along the production line to weed out inferior products. Statisticalsampling methods were used to draw random samples from a batch and reject the entire batchif a statistically large number of bad units was detected in the sample. Notice that this processimplicitly defines quality as low variance—meeting a certain set of specifications, which
1. Total QualityManagement(TQM)
Management Accounting in a Changing Environment 635
zim36725_ch14_627-673.qxd 12/15/09 2:28 PM Page 635

636 Chapter 14
might or might not be of interest to the consumer. Sections of the factory stored defects wait-ing to be reworked or scrapped. Firms built into their operating budgets and standard costs anormal allowance for scrap and rework. In some cases, if market demand exceeded produc-tion in a period, marginally defective products were released. Defective products reaching themarket were corrected by the field service organization under warranty arrangements. Mostfirms’ accounting systems ignored the opportunity cost of inferior quality.
By the 1980s, two key factors combined to change the traditional approach to qualityin many industries. First, the cost of detecting problems and monitoring production viacomputer instrumentation fell relative to the cost of maintaining quality via inspectors.The cost of inspectors (including health care benefits) made the cost of manually detectingand correcting errors more expensive relative to performing these tasks electronically.Instead of manually detecting and correcting defects after production, improved instru-mentation allowed earlier detection and correction of problems, often while the productwas in production. Second, worldwide competition expanded to such nonprice forms ofcompetition as quality. Once the Japanese automobile companies gained price competi-tiveness against the American automakers, they turned their attention to achieving qualityadvantages. Both the lower cost of detecting defects and increased global competitionfostered quality improvements. Notice that in terms of Figure 14–1, both technologicalinnovation and changed market conditions created the TQM movement.
ManagerialApplication:ISO 9000
The International Organization of Standards (ISO) establishes quality standards. ItsISO 9000 standard has different levels of certification depending on the complexity ofthe manufacturer’s operations. To become ISO 9000 certified, a manufacturer must doc-ument that it relies on written policies, procedures, and quality methods. Independentexternal registrars then visit the plant requesting ISO 9000 certification to ensure theapplicant has the necessary documentation, quality manuals, and procedures in place(including continual improvements). Semiannual reviews and reaudits every three tofour years are necessary to maintain certification. ISO 9000 does not guarantee thatquality end products are being manufactured; rather, it certifies that policies exist thatallow quality products to be manufactured.
SOURCE: http://en.wikipedia.org/wiki/ISO_9000.
ManagerialApplication:Saia’s XtremeGuarantee
Saia Inc., a U.S. trucking company, seeks to provide total customer satisfaction throughits Xtreme Guarantee. Saia guarantees:
• Pick-Up Performance—Pick up shipment on day promised.
• On-Time Delivery—Delivered on time as posted in our published transit times.
• Claims-Free Service—Delivered without exception.
• Claims under $1,000 Settled within 30 Days—Resolution in writing within 30 daysof a claim.
• Invoicing Accuracy—Accurate invoice the first time.
• Proof of Delivery Turnaround within 5 Minutes.
If the company fails to provide these services, the entire invoice will be refunded.
SOURCE: http://www.saia.com/V2/servicesContent.aspx?c=xtremeguar.
zim36725_ch14_627-673.qxd 12/15/09 2:28 PM Page 636

Management Accounting in a Changing Environment 637
To reduce defects, companies redesigned their products to require fewer vendors,making it easier to maintain tighter controls on the quality of their suppliers. Productdesigners redesigned parts that failed. Production processes were redesigned to reducedefects. Robots and more instrumentation were built into manufacturing to ensuremore uniform production. Firms adopted TQM programs. While many TQM programswere initially started to improve the tangible aspects of product and service quality, TQMprograms have evolved to enhance products, prices, and services for both internal andexternal customers. Major changes in the organization’s architecture also occurred, includ-ing modifying the performance evaluation and reward systems and the partitioning ofdecision rights. Decision rights were pushed down lower in the firm, where the knowledgeof customer preferences and the production process often resides.
With highly competitive world markets, companies now must compete not only onprice but also on delivery schedules, service, and quality. In general, quality has come tomean giving customers what they want. Notice that when firms compete on quality, manydifferent dimensions of quality come into play. TQM programs emphasize the multidimen-sional aspects of quality.
In terms of Figure 14–1, both technological innovations (computer instrumentation)and market conditions have forced companies to change both their business strategy andtheir organizational architecture. Central to TQM programs is knowing what the customerwants and how to produce it at lower cost. If knowledge of customer preferences andproduction processes resides lower down in the organization with the people who havedirect contact with customers, then the theory in Chapter 4 says to place the decisionrights with those employees. Most TQM programs argue for empowering employees toimprove quality. Empowerment is another way of saying that decision rights are trans-ferred to people with the specialized knowledge of customer preferences. Therefore, animportant component of TQM is changing the firm’s organizational architecture bydecentralizing certain decision rights to lower-level managers. Of course, if decision rightsare repartitioned, then performance evaluation and reward systems also must change.
TQM programs also require accounting systems. Defect rates, on-time delivery, andcustomer complaints are easy for managers to understand and easy to measure. Without acorresponding accounting system, however, these diverse measures are difficult to aggre-gate. Managers do not know how to make trade-offs among quality decisions. For example,is it more costly to design and manufacture a product without defects or to focus oninspection and correcting defects from initial production? Is it cheaper to buy a scanningmachine for more accurate inspections or stay with manual inspections? Managers requirecost data to make these comparisons for decision management purposes.
TQM programs start by redesigning the products so that there are fewer parts per prod-uct (fewer parts that can fail) in order to make manufacturing and assembly easier, and tomake the product easier to service in the field. These total quality programs then define aseries of quality measures, including product design (number of new parts, total number ofparts), vendor rating systems (number of defects, on-time delivery), manufacturing (defectrates, scrap, rework, on-time delivery), and customer satisfaction (surveys, warrantyexpense). The framework in Figure 14–1 predicts that if other parts of the organization’sarchitecture are being modified, the accounting system will be too. This is the case in TQM.Besides tracking the nonfinancial measures of quality listed above, some firms report thecost of quality. Quality costs can be categorized into four groups:
1. Prevention costs incurred to eliminate defective units before they are produced(reengineering products or production processes and employee training).
2. Appraisal costs incurred to eliminate defective units before they are shipped(inspecting and testing both raw material and work in process).
zim36725_ch14_627-673.qxd 12/15/09 2:28 PM Page 637

3. Internal failure costs (the costs of defective units in manufacturing).
4. External failure costs, including the cost of returns, warranty work, and productliability claims as well as the opportunity cost of lost sales from reputation effects.3
These various costs are dispersed throughout the firm, usually in numerous overheadaccounts. The purpose of reorganizing and aggregating these costs into a single cost-of-quality report is to bring them to the attention of senior managers. However, the largestcosts of quality are often the opportunity costs of forgone sales caused by a reputation forlow-quality products. These opportunity costs are not captured by the accounting system.
Part of the TQM philosophy is that improved quality can actually be less costly to theorganization. The opportunity cost of selling defective products and not satisfying cus-tomers can be very high. Errors must be corrected and disgruntled customers mollified.Dissatisfied customers will seek other suppliers of the service or product. A reputation forshoddy workmanship is often the death knell for organizations. Even if a defect is discov-ered before being sent to a customer, the cost of handling and fixing the problem can bequite high. In many cases, the defective product cannot be fixed and must be junked.However, as discussed a bit later, “Quality is not free.” Improving the quality of the firm’sproducts or services requires resources; hence enhancing quality is costly. The questionis, “Do the benefits of improving quality exceed the costs?” Figure 14–2 illustrates howquality costs likely behave as the firm seeks to improve quality. As the percentage of defectsincreases, the costs of internal and external failure also increase. However, higher defectrates usually result from low appraisal and prevention costs. Total quality costs will exhibitthe usual U-shape, indicating that there is an optimum quality level. Trying to furtherreduce defect rates below this optimum costs more in prevention and appraisal costs thancan be saved by lower internal and external failure costs.
Although numerous firms initiated quality improvement programs, not all achievedtheir objectives. Studies show that many executives claim that quality is top priority, yetonly one-third claim their programs are effective. Several companies, including McDonnellDouglas aircraft and Florida Power & Light, abandoned their TQM programs. Some60–70 percent of senior managers in one survey believe that their TQM programs have notboosted their ability to compete. Another survey concluded that “many businesses may waste
638 Chapter 14
3 G Wang, Z Gao, and T Lin, “Integrating the Quality Cost Report,” Cost Management, January/February,2007, pp. 42–47.
Co
st
0% Optimum quality level 100%
Percent defects
Internal and external
failure costs
Appraisal andprevention
costs
FIGURE 14–2
Optimum quality cost
zim36725_ch14_627-673.qxd 12/15/09 2:28 PM Page 638

millions of dollars a year on quality-improvement strategies that don’t improve their perfor-mance and may even hamper it.”4 This evidence supports the notion of an optimum level ofinvestment in quality as depicted in Figure 14–2. Firms can over- or underinvest in quality.
The next organizational innovation is just-in-time (JIT) production. In a JIT plant, produc-tion and demand are synchronized because production does not start until an order isreceived. Products are pulled through the plant by customer orders, rather than pushedthrough by a master production schedule designed to keep the plant operating at fullcapacity. The goal of a JIT plant manager is to reduce the time the product spends in theplant. To accomplish this goal, the plant is reorganized so that raw materials and purchasedparts are delivered to the factory right before they are entered into the production process;therefore, there are no intermediate work-in-process inventories. Units flow from oneproduction cell to another with no interruptions and all work is processed continually. Unitsspend time in the factory only when actual work is being expended on them. Of course, thisdescribes an ideal JIT installation. Few actual JIT plants achieve the ideal.
Throughput time is the total time from when a product starts the production processuntil it is ready for sale. Throughput is the sum of processing time, time waiting to bemoved or worked on, time spent in transit, and inspection time. The goal of JIT is to drivethe last three items (waiting, transit, and inspection time) to zero. The sum of the last threeitems is referred to as wasted or non-value-added time. The benefits of reducing through-put time include smaller in-process inventories, leading to
• Lower capital costs of holding inventories.
• Factory and warehouse space and cost savings.
• Reduced overhead costs for material movers and expediters.
• Reduced risk of obsolescence.
• Faster response time to customers and reduced delivery times.
Achieving reduced throughput time requires the following changes:
1. Increase quality. To prevent production downtime, the quality of raw materialsand the quality of the manufacturing process must be improved. Increased materialand process quality eliminates the need to stop processing because of defects.
2. Reduce setup times. If machines can be set up for a new production run veryquickly (or instantaneously), then parts do not have to wait for processing tobegin. Moreover, inventories do not accumulate in front of the machine whileit is being set up.
3. Balance flow rates. The rate of production in the various manufacturing cellsmust be the same or else work-in-process inventories will build up after the cellswith the faster flow rates.
4. Improve factory layout. Redesign the factory to reduce travel time. Do not groupmachines that perform the same function in one department. Instead, organizemachines by how the products are sequenced through them. The factory becomesorganized around dedicated JIT production lines producing a single type ofproduct, sometimes called dedicated flow lines.
2. Just-in-Time(JIT) Production
Management Accounting in a Changing Environment 639
4The Wall Street Journal, October 1, 1992, p. B7; M Beer, “Why Total Quality Management Programs DoNot Persist: The Role of Management Quality and Implications for Leading a TQM Transformation,” DecisionSciences, Fall 2003, p. 623.
zim36725_ch14_627-673.qxd 12/15/09 2:28 PM Page 639

5. Change performance measurement and reward systems. No longer mustemployees be evaluated and rewarded on efficiency measures such as the numberof units produced or whether they keep machines busy. Individuals are no longerrewarded for maximizing flow rates. Efficiency measures encourage workers tobuild inventories and to have inventories in front of their station as buffer stocks.The performance measure in a JIT system is throughput time divided by processtime. As this ratio approaches 1, non-value-added time decreases.
One important aspect of JIT involves redesigning the firm’s relationship with its sup-pliers. In the past, managers believed that having several suppliers of each input increasedcompetition and kept prices down. Firms had policies of dividing total purchases amongseveral sources, which required each arriving order to be inspected to ensure quality. Hav-ing multiple suppliers made it more difficult to coordinate timely delivery of supplies. In aJIT environment, firms have drastically reduced the number of suppliers. The purchasingfirm benefits from lower prices due to volume discounts, lower ordering costs (since onlya single-relationship contract is required), and higher quality ensured by audits of thesupplier’s process rather than inspection of each shipment. Transportation costs are usuallylower because suppliers can use long-term contracts with shippers. Through electronic datainterchange (EDI), buyers and sellers integrate their computer systems so that orders arealso received JIT.
However, sole-sourcing is not a universal panacea. Sourcing from a single supplier andspecializing purchases from a single supplier create incentives for the parties to the contractto behave opportunistically.5 For example, in the early days of General Motors, GM boughtall of its auto bodies from the independent firm of Fisher Body. GM frames and Fisher bod-ies were specialized to each other and there were incentives for one party to try to exploitthe other. The solution was for GM to buy Fisher Body.
Accounting in a JIT production environment becomes much simpler. It takes on manyaspects of a process costing system such as described in Chapter 9. In a JIT organization,job order costing, in which costs are accumulated for each job or batch, is no longer desir-able. Having production employees fill out job order sheets as they work on a product isnon-value-added time. Also, because inventory is in the form of work in process for such ashort time, there is less need to worry about valuing partially completed products. In JITaccounting systems,
• Labor and overhead are combined into a single account (conversion costs).
• As much as possible, general factory overhead is traced directly to dedicated JIT lines(e.g., utilities, machine depreciation, and maintenance are metered directly for eachJIT line).
• Material costs are charged directly to products.
• Conversion costs are assigned based on machine (or cell) time.
• Detailed work-in-process accounting is eliminated because WIP inventories vanish.
• A single inventory account, raw and in-process materials (RIP), is used.
• All raw materials and purchases issued to production are charged to RIP.
• As units are finished, RIP is reduced by the materials costs and finished goodsinventory is charged for the materials.
• Conversion costs are charged directly to finished goods (not RIP).
640 Chapter 14
5 B Klein, R Crawford, and A Alchain, “Vertical Integration, Appropriable Rents, and the CompetitiveContracting Process,” Journal of Law & Economics, October 1978, pp. 297–326.
zim36725_ch14_627-673.qxd 12/15/09 2:28 PM Page 640

Firms adopting RIP accounting systems have significantly reduced the number ofaccounting transactions. Some firms have reduced their journal entry volume twentyfoldbecause detailed payroll posting to jobs has been eliminated and jobs no longer need to betracked through the work-in-process accounts as they move from department to department.
However, JIT also has drawbacks. Holding everything else constant, decreasingthroughput time (like increasing quality or productivity) is unambiguously good because itincreases firm value. However, everything else is not usually held constant. Redesigningthe factory layout, reducing setup times, and requiring suppliers to increase quality andprovide JIT deliveries can potentially increase costs. A sole supplier of a specialized inputhas some monopoly power and can use this position to extract higher prices. Accountingsystems that measure throughput time without charging managers for the costs ofimproving throughput will cause throughput time to fall, but other costs might rise.
Moreover, firms hold inventories to smooth out fluctuations in supply or demand. Ifthere is a labor strike, or bad weather prevents delivery of raw materials, or demand increasesunexpectedly, inventories allow the firm to avoid the opportunity cost of lost sales. Reorga-nizing the factory, improving product and process quality, and changing purchasing rela-tionships with suppliers can smooth out some of the fluctuations in production but cannoteliminate all the shocks to the system. After an earthquake in Kobe, Japan, Toyota’s solesource of brake shoes for its cars could not operate for several weeks, causing Toyota to haltproduction at most of its plants in Japan. Toyota lost production of 20,000 cars, costing itan estimated $200 million in revenue. In another case Toyota had to shut down two-thirdsof its assembly lines after a fire at one of its major suppliers. Random fluctuations outsidemanagement’s control, such as weather-related and demand-related shocks, will cause thefirm to carry some inventories somewhere as a buffer against losing sales.
While much has been written extolling the virtues of JIT and backflushing accounting,other commentators warn of the system’s weaknesses. Few firms have been able tocompletely eliminate raw materials inventory. After JIT was installed at one Hewlett-Packard plant, raw materials inventory ranged from a two-day to a five-day supply on handand finished inventory on hand fell from a 2.8-month supply to a 1.3-month supply. Butsince production tripled, the actual dollar value of inventory on hand increased. The num-ber of accounting entries at this plant fell drastically. However, the accounting system wasno longer able to track inventory levels, which meant that physical counts of inventory(some every six weeks) were required to supply managers with information on specificinventory levels. Inconsistent with the basic JIT philosophy, these inventory counts are non-value-added activities that disrupt the production process by forcing employees to stopproducing and count the inventory.6
Management Accounting in a Changing Environment 641
ManagerialApplication:Does JITWork?
A study of 200 companies adopting JIT found the following results. Compared to amatched sample of 200 non-JIT adopters, inventory turnover ratios increased followingJIT adoption. Moreover, the JIT adopters show improved ROA, relative to their non-adopting counterparts. JIT users’ inventory turnover (cost of sales ÷ average inventory)climbed from 3.5 to 4.4 in the three years following adoption, whereas the nonadopters’inventory turnover remained relatively flat.
SOURCE: M Kinney and W Wempe, “Further Evidence on the Extent and Origins of JIT’s Profitability Effects,” AccountingReview, January 2002, pp. 203–225.
6R Calvasina, E Calvasina, and G Calvasina, “Beware of Accounting Myths,” Management Accounting,December 1989, pp. 41–45.
zim36725_ch14_627-673.qxd 12/15/09 2:28 PM Page 641

Adopting JIT causes the plant to change its organizational and even physical structure.The organizational changes require changes in performance measurement systems, includ-ing the internal accounting systems. Thus, accounting system changes follow and supportchanges in the physical and organizational structure of the plant.
In terms of Figure 14–1, technological advances in instrumentation, computers, andtelecommunications (computer-aided manufacturing) have been one impetus allowingfactories to be redesigned along continuous flow JIT lines. Suppliers’ computers are nowlinked electronically to their customers’ computers, and electronic order processing iscommonplace. These technological advances have made JIT production possible. Likewise,market conditions are changing. Customers are demanding that their purchases be deliveredin continuous, small-order lot sizes, providing further incentives for manufacturers to adoptJIT techniques. Thus, two shocks to the firm’s business strategy have caused changes in thephysical and organizational architecture of plants. Accounting systems, as part of the orga-nizational architecture, are not exempt from these changes and have also been modified, asevidenced by simplified JIT accounting systems described here.
This section explores two recent management innovations: Six Sigma and lean production(sometimes referred to as “lean manufacturing” or just “lean”).
Six SigmaPreviously, Total Quality Management (TQM) was described as a management approach,centered on quality, based on the participation of all the firm’s employees with the goal oflong-term success through customer satisfaction. TQM became fashionable in the 1980sand 1990s in the United States, but it fell out of favor as many companies found that it didnot generate the advertised benefits. In the late 1990s and 2000s, Six Sigma came to re-place TQM. Six Sigma is a set of practices, first popularized by Motorola, to systematically
3. Six Sigma andLean Production7
642 Chapter 14
ManagerialApplication:Harley-Davidsonand JIT
Harley-Davidson manufactures motorcycles. Over the years, direct labor has shrunk toabout 10 percent of a motorcycle’s product cost. In the past, each employee had to keeptrack of every product worked on in the course of the day. For an average employee, thismeant about 20 bikes. Each day, the accounting system had to record 10,000 entries.However, management was not using this information for any decision making. Whendirect labor was a larger fraction of product costs, managers tracked direct labor vari-ances more carefully. After introducing JIT, Harley-Davidson changed the accountingsystem. Direct labor was no longer treated as a direct cost but rather it and overheadwere treated as conversion costs. Conversion costs were assigned to individual productsbased on how many hours the product was in the manufacturing process. This changegreatly simplified the accounting process, because all the individual labor transactionswere no longer entered daily.
SOURCE: W Turk, “Management Accounting Revitalized: The Harley-Davidson Experience,” in Emerging Practices in CostManagement, ed. B Brinker (Boston: Warren, Gorham & Lamont, 1990), pp. 155–66; and J Schinwald, “Case Study:Harley-Davidson,” (7/28/2005), www.webpronews.com/topnews/2005/07/28/case-study-harley-davidson.
7This section is based on the following references: M Holweg, “The Genealogy of Lean Production,”Journal of Operations Management, March 2007, pp. 420–37; http://en.wikipedia.org/; B Morris, “New Rule:Look Out, Not In,” money.cnn.com, July 11 2006; F Rudisill and D Clary, “The Management Accountant’s Rolein Six Sigma,” Strategic Finance, November 2004, pp. 35–39; A van der Merwe and J Thomson, “The Lowdownon Lean Accounting,” Strategic Finance, February 2007, pp. 26–33.
zim36725_ch14_627-673.qxd 12/15/09 2:28 PM Page 642

improve internal processes by eliminating defects and hence the quality of products andservices. The term “Six Sigma” refers to the ability to produce products at defect levels be-low about three defects per million.
Like TQM, Six Sigma involves a structured, project-based approach with an executive-level Six Sigma committee that identifies potential projects such as procurement,manufacturing, logistics, sales, marketing, and distribution. Project teams, led by internalSix Sigma experts (called black belts), are formed and follow a well-developed methodol-ogy of defining the process improvement goals, measuring the current process andcollecting relevant data, analyzing the causal factors, improving the process based on theanalysis, and controlling any variances before they result in defects. Six Sigma is a refinedversion of TQM.
But Six Sigma is not without its critics. Noted quality guru Joseph Juran claims thatSix Sigma is “a basic version of quality improvement,” stating that “there is nothing newthere.” In one study of the 58 large companies that announced Six Sigma programs, 91 percentunderperformed the stock market.
Lean ProductionJIT was described previously as a management approach whereby raw materials andsupplies are delivered to a manufacturing operation just as they are needed to meetdemand. Although JIT was first used by Ford Motor Company in the 1920s and 1930s,it was really the adoption, refinement, and promotion of JIT by Toyota in the 1970sand 1980s that popularized the technique. High land values forced Japanese manufac-turers to reduce inventories, thereby lowering the cost to warehouse finished productsand parts. But like other management fads, JIT failed to provide the overly publicizedpromises.
When JIT fell from favor, it was replaced with lean production. Lean production seeksto eliminate all non-value-added activities from the firm’s value chain. The value chainconsists of all primary and support activities that an organization performs to turn inputsinto value-added outputs for its external customers. Typical activities in a value chaininclude research and development, design and engineering, production, distribution, andcustomer service. Lean production identifies and then eliminates non-value-added activi-ties in demand planning, inventory planning, supply chain planning, and other capabilitiesthat increase customer responsiveness, reduce cycle time, and control costs.
Lean consists of a wide variety of efficiency and cost trimming techniques dating backto the first “efficiency experts” in the early 1900s. In fact, many firms, such as Caterpillarand Textron, employ both Six Sigma and lean techniques to improve quality, cut processingtimes, eliminate waste, and cut costs. The latest term is “Lean Six Sigma.” Consistent withFigure 14–1, lean production has spawned “lean accounting,” whereby the accounting sys-tem is modified to report all revenues and expenses for each of the firm’s value chains inorder to better identify non-value-added activities.
The chapter has described four management innovations: TQM, JIT, Six Sigma, andlean production. Management gurus and consultants refine old concepts and seek todifferentiate their techniques by inventing new terminology. TQM and Six Sigma are man-agement approaches centered on quality that aims to continually lower costs and improvethe provision of services and products to customers. JIT and lean production seek to drivenon-value-added activities (such as inventories) out of the process. Important lessonsemerge from understanding past and current management innovations such as TQM, JIT,Six Sigma, and lean production:
• Firms are always looking for new ways to improve operating efficiencies, cut costs,and improve customer satisfaction.
Management Accounting in a Changing Environment 643
zim36725_ch14_627-673.qxd 12/15/09 2:28 PM Page 643

• Successful management innovations require a careful and coordinated change inthe firm’s organizational architecture (decision rights assignments, performancemeasurement, and performance rewards). Announcing a new program on thecompany’s Web site or in an e-mail rarely provides significant long-run improvements.
• Many new management innovations are fads. They are “new wine in old bottles.” Oncediscredited, the same innovation eventually resurfaces with a refined set of techniquesand a new name.
Beginning in the 1990s many large firms, such as AT&T, KPMG, Bank of Montreal,Allstate, Tenneco, Mobil, and Citicorp, adopted a balanced scorecard. In Figure 14–1,successful firms develop a strategy that delivers goods or services to their customers atprices that exceed the costs of providing these products. The strategy of an organizationprovides a direction for the organization, such as goals for the introduction of new products,customer satisfaction, market share in specific areas, and efficiencies in production. Somecompanies, such as Dell Inc. and McDonald’s, have chosen operational excellence. Othershave chosen customer intimacy (Home Depot) or product leadership (Intel and Sony).Highly successful firms excel at one while maintaining high standards on the other two.
A strategy, however, is seldom specific enough to describe the steps necessary toachieve the goals. A more detailed plan identifying the inputs necessary to implement thestrategy is required. A balanced scorecard translates the strategy into a plan of action thatidentifies specific objectives and performance drivers to help determine if the organizationis moving in the right direction.
A balanced scorecard links the firm’s strategy to performance drivers, thereby provid-ing a comprehensive view of the organization.8 A balanced scorecard relates key perfor-mance indicators, such as on-time deliveries, to those actions required of employeesto successfully achieve the firm’s strategy and hence maximize firm value. In terms ofFigure 14–1, the balanced scorecard is designed to identify those key performanceindicators used to focus on actions required to implement the firm’s strategy.
Most balanced scorecards combine both decision management and decision control.Decision management is provided by identifying the sequence of objectives and the keyperformance indicators that allow the organization to achieve its goals. The balancedscorecard also provides decision control by establishing performance measures and tar-gets for each objective. It articulates the strategy of the organization and communicatesthis strategy in a commonly understood language.
The balanced scorecard derives its name from the balance it attempts to achieve amongthe firm’s strategy (objectives) and key performance indicators. Many observers of corpo-rate culture lament the emphasis on short-term performance measures in corporations.Quarterly earnings announcements appear to have undue influence on the actions of themanagers of a corporation. Focusing on short-term performance measures can reduce thevalue of the organization because of a reluctance to invest in activities that benefit the or-ganization in the long run. Research and development, plant maintenance, and employeetraining are examples of expenditures that harm the short-term financial measures, but ben-efit the organization in the long run. Balanced scorecards tend to include both short- andlong-term performance indicators.
4. BalancedScorecard
644 Chapter 14
8 R Kaplan and D Norton, “The Balanced Scorecard—Measures That Drive Performance,” Harvard BusinessReview, January–February 1992. Also see R Kaplan and D Norton, “Transforming the Balanced Scorecard fromPerformance Measurement to Strategic Management: Parts I and II,” Accounting Horizons, March and June2004, pp 87–104 and 147–60.
zim36725_ch14_627-673.qxd 12/15/09 2:28 PM Page 644

STRATEGY
Innovation and Learning Perspective
How should we sustain our abilityto change and improve?
Internal Business Process Perspective
At what business practicesmust we excel?
Financial Perspective
How should we appear toour shareholders?
Customer Perspective
How should we appear toour customers?
FIGURE 14–3 The balanced scorecard’s four perspectives
The ultimate objective of profit organizations is to generate value for the owners of theorganization. But value for owners is the outcome of satisfying customers, operating effi-ciently, and having the infrastructure necessary to accomplish all of those activities. There-fore, most firms do not rely solely on financial performance indicators. Financialperformance indicators occur periodically and may not be very timely. Clearly, nonfinan-cial performance indicators such as customer satisfaction and employee turnover are alsoimportant performance indicators.
Balanced scorecard’s four perspectivesAdvocates of the balanced scorecard argue that it recognizes the multiple stakeholders ofan organization. These stakeholders include the shareholders or owners, customers, suppli-ers, employees, and society. Balanced scorecard proponents contend that the organization’sobjectives should reflect the interests of these stakeholders. Many corporate mission state-ments mention these stakeholders. Objectives related to the stakeholders are captured in thebalanced scorecard through four perspectives: financial, customer, internal businessprocesses, and innovation and learning. Each of these perspectives has objectives, perfor-mance indicators, targets, and initiatives.
Figure 14–3 illustrates these four perspectives:
Innovation and learning perspective The innovation and learning perspective focuses on theinfrastructure of the organization. To achieve its goals an organization requires the rightpeople and systems as well as facilities to support them. Without learning and innovationin the organization, the organization will not be able to adapt to a dynamic environment. Toadapt, an organization must have ongoing training of employees, requisite technology andinformation systems, and the facilities to meet new customer demands. Performance indicatorsinclude employee training efforts, information system implementations, and equipment andfacility purchases.
Customer perspective The customer perspective of the balanced scorecard is concernedwith adding customer value. Customer value can be achieved through innovative and high-quality products and services and low prices. The balanced scorecard should highlight theorganization’s strategy for adding customer value. Typical performance indicators forthe customer perspective include customer satisfaction surveys and market share, on-timedelivery, and reduced defects.
Financial perspective The financial perspective of the balanced scorecard represents theshareholders/owners of the organization. The objectives from the financial perspective in a
Management Accounting in a Changing Environment 645
zim36725_ch14_627-673.qxd 12/15/09 2:28 PM Page 645

646 Chapter 14
TABLE 14–1 An Insurance Company’s Balanced Scorecard
Objective Performance Indicators Targets
Financial PerspectiveEfficient use of assets Return on assets 17% per yearGrow underwriting Premium growth 4% per year
Innovation and Learning PerspectiveEmployee training Percent of employee 5% per year
hours spent in training
Employee retention Percent employee 6% per yearturnover
Internal Business Process PerspectiveReduce error rates Percent of time 2% per year
employees spend correcting errors
Automate customer inquiries Growth in percent of 18% per yearcustomers logging on to company Web site
Customer PerspectiveGrow market share Increase in number of 3% per year
under-35 insurance buyers
Customer satisfaction Percent of customers 80%saying they are “very satisfied” on customer surveys
Fast response to loss claims Days to process loss 95% of all claims claims processed within three days
profit organization are oriented toward providing shareholders a return on their investment.Typical performance indicators include profit, sales growth, and measures of risk. Nonprofitorganizations would also have financial objective indicators such as balancing revenues andexpenditures.
The objectives of the financial perspective in the balanced scorecard coincide withcreating firm value in the framework of Figure 14–1. Increases in firm value come from theother perspectives: customers, internal business processes, and learning and growth.
Internal business process perspective The objectives of the internal business processperspective deal with issues of efficiency and quality. TQM, information technology, andJIT are processes that support this perspective. Activities should be analyzed to determinewhether they add value and how they can be most efficiently performed. For example,supplier relations are critically important to the success of retail and manufacturing firms.Using business-to-business Internet transactions to speed purchases from suppliersincreases on-time deliveries to customers and improves quality. Typical performanceindicators for the internal business process perspective include number of defects,throughput time, and on-time delivery.
Table 14–1 presents an example of a balanced scorecard for an entire insurance company.For each of the four perspectives, objectives, performance indicators, and targets are speci-fied. Each responsibility center in the organization then derives its own balanced scorecard.
zim36725_ch14_627-673.qxd 12/15/09 2:28 PM Page 646

Relations among perspectives The four perspectives of the balanced scorecard should relateto each other. The strategy of the organization is the starting point and dictates the financialperspective objectives. To achieve the financial perspective objectives, the organizationmust look at its relations with its customers and determine how it can add value to its cus-tomers. Adding value to customers comes from efficient and quality operations of internalprocesses. But processes cannot operate efficiently without the appropriate learning andinnovation within the organization. Identifying these links is critical to implementing a suc-cessful balanced scorecard. For example, an insurance company might determine that im-proving its information systems and training employees lead to faster insurance claimsprocessing for its policyholders. This leads to increased customer satisfaction, more loyalcustomers, and eventually, better financial results.
Assessing the balanced scorecardThe balanced scorecard is consistent with Figure 14–1 because it links the firm’s strat-egy with the cause-and-effect relationships among the various performance indicators.However, many balanced scorecard implementations focus only on identifying thevarious key performance indicators and are silent about how these are linked to com-pensation. Moreover, balanced scorecard advocates do not address changing other partsof the organizational architecture in response to the new strategy. Thus, decision rightsassignments and compensation plan changes are often ignored. While many firms areembracing this approach, there are several conceptual and practical problems withbalanced scorecards.
Telling managers to maximize firm value is like telling a sports team to win. Moreconcrete strategies and objectives are required. Balanced scorecards help communicate to
Management Accounting in a Changing Environment 647
ManagerialApplication:The BalancedScorecardat PhilipsElectronics
Philips Electronics, with more than 250,000 employees in 150 countries, adopted thebalanced scorecard at the direction of corporate management as a way to communicatethe firm’s business strategy and vision throughout the firm. Four critical success factorsare competence (knowledge, technology, leadership, and teamwork); processes (driversfor performance); customers (value propositions); and financial (value, growth, andproductivity). At Philips, the balanced scorecard starts at the corporate level and thencascades down to the divisions and the business units. At the corporate level is thestrategy scorecard. The divisions have operations-review scorecards, and the businessunits have their own scorecards. Each lower-level scorecard must articulate with the nexthigher-level card in the sense that when the lower-level unit achieves its scorecardtargets this furthers the next higher-level unit’s targets. A typical business-unit scorecardcontains the following:
• Financial: Economic profit realized, income from operations, working capital,operational cash flow, inventory turns.
• Customers: Rank in customer survey, market share, repeat order rate, complaints.
• Processes: Percentage reduction in process cycle time, number of engineeringchanges, capacity utilization, order response time, process capability.
• Competence: Leadership, percentage of patent-protect turnover, training days peremployee, quality improvement team participation.
SOURCE: A Gumbus and B Lyons, “The Balanced Scorecard at Philips Electronics,” Strategic Finance, November 2002,pp. 45–49.
zim36725_ch14_627-673.qxd 12/15/09 2:28 PM Page 647

648 Chapter 14
Firm
Val
ue
C*
Customer Satisfaction
FIGURE 14–4
Relation betweencustomer satisfactionand firm value
9 M Jensen, “Value Maximization, Stakeholder Theory, and the Corporate Objective Function,” BusinessEthics Quarterly 12 (January 2001).
10 See Brickley, Smith, and Zimmerman, 2009, p. 468.
managers how to implement value-maximizing strategies. Problems arise when thescorecards are used as performance measures.9 As performance measurement systems,balanced scorecards produce dysfunctional behaviors. Suppose a football quarterback hasa very simple balanced scorecard consisting of number of completed passes, yards gainedby running, and games won. Suppose the quarterback is paid on each measure. Clearly, theobjective of the team is to win. Passing and running contribute to winning. But, if the quar-terback thinks that a passing play has a greater chance of succeeding than a running play,even though the latter might win the game, the quarterback will in some circumstanceschoose the passing play.
Similarly, customer satisfaction is usually related to firm value. More satisfied cus-tomers are more loyal and willing to pay higher prices for the firm’s goods and services.However, how far should managers go in maximizing customer satisfaction? Figure 14–4illustrates the typical relationship between firm value and customer satisfaction. Firm valueincreases up to customer satisfaction level C*. But customer satisfaction levels beyond C*reduce firm value because it costs more to increase customer satisfaction than these moresatisfied customers return in additional revenues. Giving managers balanced scorecardsthat include customer satisfaction (or employee turnover, market share, product quality, andso forth) can cause managers to reduce firm value.
Balanced scorecards often contain 10 to 30 performance indicators. However, you canonly maximize one variable at a time. Telling managers to simultaneously maximize20 balanced scorecard indicators provides that manager with no guidance as to the relativetrade-off among the indicators. It is an impossible task. Suppose you are told to maximizeyour grade in managerial accounting and to maximize your physical fitness. You can’t doboth simultaneously. Because there are only 24 hours in a day, you must make trade-offs.
If managers receive compensation based on numerous balanced scorecard performancemeasures, they will choose those measures easiest to achieve and ignore more difficulttasks.10 Firm value will almost certainly suffer. Balanced scorecards are not balanced in thesense of specifying how managers should make trade-offs between the various performanceindicators. They do not tell managers when to stop producing more customer satisfactionbecause firm value falls beyond that point. Most balanced scorecards suggest that more ofeach performance indicator is preferred to less. Moreover, balanced scorecards are not
zim36725_ch14_627-673.qxd 12/15/09 2:28 PM Page 648

Management Accounting in a Changing Environment 649
ManagerialApplication:A BalancedScorecardFailure*
The U.S. retail banking operations of a leading international bank adopted a balancedscorecard and abandoned it three years later. What went wrong?
The firm has hundreds of branches located throughout North America. Prior to in-stalling the balanced scorecard, each branch manager received a bonus based on achiev-ing specific performance objectives. This bonus system had grown so complex that ittook a 78-page manual to describe it. Upper-level managers were frustrated with the sys-tem because branch managers were gaming the system to earn bonuses without deliv-ering financial results.
A balanced scorecard was introduced with five imperatives: achieving good finan-cial results, delivering for customers, managing costs, managing risk, and having theright people in the right jobs. Extensive training programs accompanied the rollout ofthe scorecard system. Each branch was measured on about 40 different metrics such ascustomer attrition, customer satisfaction, assets under management, training and staffdevelopment, and so forth. But unlike the earlier formula-based bonus system, branchmanagers under the balanced scorecard received subjective performance measures.While proponents of the balanced scorecard provide little guidance on how each metricin the scorecard should be linked to compensation, they usually conjecture that subjec-tive, rather than objective, compensation should be used because it is “easier and moredefensible to administer . . . and also less susceptible to game playing.”†
Under the new subjective performance evaluation scheme introduced as part ofthe balanced scorecard, each branch manager reports directly to an area director who as-sesses the branch manager’s quarterly performance as being “below par,” “at par,” or“above par.” Area directors were allowed to incorporate whatever factors they thoughtwere important into the managers’ performance “par” ratings. The “par” ratings wereused to award the quarterly bonuses after the area directors’ recommendations were dis-cussed among all the region’s area directors and approved by the region’s president.
After analyzing the ratings, the subjectivity in weighting the measures in a balancedscorecard bonus plan allowed supervisors to ignore many performance measures,change criteria from quarter to quarter, ignore measures that predicted future financialperformance, and weight measures that were not predictive of desired results.
After implementing the balanced scorecard, surveys of the branch managersrevealed that the scorecard brought little change in the branch managers’ understandingof the firm’s strategic goals or their connections to the managers’ actions. Only 32 per-cent were satisfied with the scorecard process, while 45 percent were dissatisfied. Manybranch managers felt the process was unfair and did not cover the important aspectsof their job and that their bonuses did not accurately reflect their performance. Onebranch manager wrote, “I hate the new process. Favoritism comes too much into play.”Three years later the balanced scorecard was abandoned in favor of a more objective,commission-style system based on the branch revenues.
One must be careful not to generalize the results of this single balanced scorecardfailure to other settings. This firm might have implemented the scorecard poorly, in thesense of not choosing the appropriate performance indicators or the use of subjective,rather than more objective, compensation schemes. Maybe the area directors receivedinadequate training in assessing “par” performance. Perhaps the regional presidents didnot supervise their area directors. What is clear from this case study is the close linkagebetween performance evaluation (the balanced scorecard) and performance reward (sub-jective evaluation by the area directors) as depicted in Figure 14–1. This firm rolled out
continued
zim36725_ch14_627-673.qxd 12/15/09 2:28 PM Page 649

650 Chapter 14
a balanced scorecard that included both new performance metrics and a new bonus sys-tem. The combined system failed and was replaced. We cannot establish which piececaused the failure. However, we see that the two pieces are really inseparable and thateach must be internally consistent and coordinated with both the decision rights assign-ment and the firm’s strategy.*Based on C Ittner, D Larcker, and M Meyer, “Subjectivity and the Weighting of Performance Measures: Evidence from aBalanced Scorecard,” Accounting Review 78 (July 2003), pp. 725–58.†R Kaplan and D Norton, The Balanced Scorecard: Translating Strategy into Action (Boston: Harvard Business SchoolPress, 1996), p. 220.
scorecards in the usual sense of indicating who is winning and losing. They are statisticalsummaries of the game. They do not provide a single comprehensive measure of perfor-mance like, say, EVA.
One critic claims that many managers embrace the balanced scorecard conceptbecause “it is easier for people to engage in intense value claiming activities at the expenseof value creation.”11 The balanced scorecard gives managers multiple criteria for measur-ing their success and thus reduces their accountability for destroying shareholder value.Some reduction in shareholder value becomes acceptable if some other stakeholder isshown to have benefited.
Q14–5 Describe four different definitions of quality.
Q14–6 If quality is defined as meeting customer expectations, whatdoes measuring quality require?
Q14–7 Total quality costs can be categorized into four groups. Whatare they?
Q14–8 How does cost accounting become easier in a just-in-timeenvironment?
Q14–9 What are some of the problematic aspects of a JITenvironment?
Q14-10 Describe which parts of Figure 14–1 are affected by a firm’sadoption of a balanced scorecard approach.
Q14-11 Describe two criticisms of the balanced scorecard.
C. When Should the Internal Accounting System Be Changed?There is no single ideal management accounting system. Each organization has differentcircumstances that lead to different management accounting systems. Also, accountingmust continually deal with trade-offs among external users wanting information describingfirm performance and internal users wanting information for decision making and control.Surviving organizations must meet the demands of changing technologies and markets byrevising their business strategies and organizational architectures (Figure 14–1). Becausefirms are in a constant state of flux, the accounting system must regularly adapt.
Certain signs indicate that the internal accounting system is not working well. One signis dysfunctional behavior on the part of managers because of poorly chosen performance
ConceptQuestions
11 Jensen, 2001.
ManagerialApplication:A BalancedScorecardFailure*
(Contd.)
zim36725_ch14_627-673.qxd 12/15/09 2:28 PM Page 650

measures. Managers will make decisions to positively influence performance measures. Ifthose performance measures are not consistent with the goals of the organization, managementwill make decisions that do not further the organization’s goals. Another sign of problemswith the accounting system is poor operating decisions. If product mix and pricing decisionsbased on management accounting are not adding to firm value, then the accounting systemis either providing inaccurate estimates of opportunity costs and/or creating dysfunctionalincentives.
Often changes in customers’ organizational architectures cause suppliers to change theirarchitecture (and accounting systems). For example, when the large automakers switched toJIT, firms supplying auto parts switched to JIT. If your major customers are modifying theirorganizational architectures, they are likely responding to technological and market condi-tions. The way in which knowledge is generated and disseminated has probably changed.These changes are likely affecting your firm’s organizational architecture.
Organizations should not necessarily look to the latest management accounting fads togive them direction in changing their management accounting systems. Activity-basedcosting (ABC), for example, is only appropriate for certain types of organizations. Eachorganization must continually evaluate and improve its management accounting system tomeet the challenges of a changing environment and a changing organization.
D. SummaryThe preceding section analyzed several organizational innovations. These innovations illustrate thatinternal accounting systems are an integral part of the organization’s architecture. When managerschange the architecture of their organization by decentralizing decision rights and empoweringemployees via TQM programs because the firm’s business strategy changes, accounting systems arelikewise modified. Similarly, when JIT production systems are installed, accounting system changesfollow. Firms adopt balanced scorecards to better link performance measures to their business strategy.
This text has emphasized the dual role of internal accounting systems for decision making andcontrol. Because the internal accounting system is performing two separate roles (it is also being used
Management Accounting in a Changing Environment 651
As the Chinese have moved from a centrally planned economy to one based on markets,Chinese firms’ objectives have changed from meeting government-set production targetsto profit maximization. Chinese firms’ performance measurement and reward systemshave adjusted to support the changing objectives and strategies of a market-based econ-omy. Virtually all reasonably large Chinese firms now employ a budgeting system as theirprimary means of operational planning and control. Most track raw material usage andcompare it to budgeted amounts on a frequent basis. Other prevalent managementaccounting techniques employed by Chinese firms include responsibility accounting(Chapter 5), incentive compensation, and performance measurement. Some Chinesefirms use a form of target costing (Chapter 12) to reduce production costs and increaseprofitability. Worker performance is often measured (and rewarded) using production,productivity, safety, cost, and profitability metrics. Fixed-variable cost/cost-volumeanalysis also is widely used to better control costs. Consistent with Western evidence,activity-based costing is not widely employed among Chinese firms.
The experience of firms in China supports the view that large shifts in a firm’s en-vironment cause managers to respond by altering all three parts of their firm’s organi-zational architecture (Figure 14–1), including their internal accounting systems.
SOURCE: R Lawson, “Old Meets New,” Strategic Finance, April 2009, pp. 31–36.
ManagerialApplication:ChangingAccountingSystems inChina
zim36725_ch14_627-673.qxd 12/15/09 2:28 PM Page 651

for taxes and financial reporting), trade-offs between these roles must be made. In its decision-makingrole, the accounting system is the first place managers turn to for help in estimating opportunity costs.However, accounting numbers are not forward-looking opportunity costs. Accounting systems recordhistorical costs, which are backward looking. Therefore, accounting numbers are useful for decisionmaking only under very strong assumptions, primarily that the future will look like the past.
Because the same system is being used for decision-making and control functions, it is notsurprising that if the accounting system is used primarily for decision control, operating managersseeking information for decision making will find the accounting data deficient. Likewise, if theaccounting system is being used primarily for decision making (e.g., pricing), then it is likely undergreater control by the manager and will not prove very useful for control (performance evaluation).
As industries restructure in reaction to technological change and changing market conditions viadownsizing, mergers, leveraged buyouts (LBOs), spinoffs, and recapitalizations, alternative organi-zational architectures such as outsourcing are being used to control agency problems. If agency prob-lems are being reduced by these alternative organizational architectures, then internal accountingsystems should move from a decision control function to a decision management function. Becausechanging the organization’s architecture has reduced the agency costs, the internal accounting systembecomes more oriented toward decision making. This may explain why certain firms adopt activity-based costing systems, which are designed primarily to improve decision making, not control. In fact,the analysis in this text predicts that firms changing to agency-cost–reducing organizationalarchitectures such as LBOs are more likely to emphasize decision management rather than decisioncontrol in their management accounting systems.
Self-Study Problem
Self-Study Problem: Gilbert Foods
Gilbert Foods manufactures food seasonings and packaged dry sauce mixes for sales in grocerystores. Gilbert started a quality improvement program in 2008. It expanded its training and qualityassurance programs and began monitoring employee satisfaction and estimating lost sales due toquality problems. The data in the following table summarize the quarterly results of operating itsSix Sigma program over the last two years.
GILBERT FOODSQuality Costs2008–2009(Millions)
2008 2009
Q1 Q2 Q3 Q4 Q1 Q2 Q3 Q4
Customercomplaint dept. $ 3.90 $ 3.45 $ 3.03 $ 2.76 $ 2.50 $ 2.27 $ 2.14 $ 2.01
Inspection 1.40 1.56 1.75 1.95 2.39 2.96 3.63 4.46Lost sales 49.20 40.31 33.11 28.42 24.45 21.08 19.20 17.44Process engineering 2.20 2.46 2.76 3.11 3.87 4.86 6.13 7.58Quality assurance
administration 6.20 6.52 6.86 7.19 7.93 8.74 9.61 10.53Returns 26.90 21.09 16.35 13.53 11.32 9.50 8.43 7.52Rework 15.80 12.65 10.03 8.49 7.25 6.16 5.56 5.00Scrap 17.60 14.48 11.92 10.32 8.92 7.72 7.00 6.34Testing 1.60 1.72 1.85 1.99 2.29 2.62 3.01 3.45Training 13.10 14.39 15.90 17.46 21.12 25.50 30.37 36.35
Required:
a. Prepare a cost-of-quality report that classifies each expense as being in one of fourcategories: appraisal, prevention, internal failure, or external failure.
652 Chapter 14
zim36725_ch14_627-673.qxd 12/15/09 2:28 PM Page 652

b. What conclusions can you draw from the data presented about Gilbert Foods’s Six Sigmaprogram?
Solution:
a. The following table reclassified the cost-of-quality expenses:
GILBERT FOODSQuality Costs2008–2009(Millions)
2008 2009
Q1 Q2 Q3 Q4 Q1 Q2 Q3 Q4
Quality assuranceadministration $ 6.20 $ 6.52 $ 6.86 $ 7.19 $ 7.93 $ 8.74 $ 9.61 $ 10.53
Training 13.10 14.39 15.90 17.46 21.12 25.50 30.37 36.35Process engineering 2.20 2.46 2.76 3.11 3.87 4.86 6.13 7.58
Prevention $ 21.50 $ 23.37 $ 25.52 $ 27.76 $ 32.92 $ 39.10 $ 46.11 $ 54.46
Inspection $ 1.40 $ 1.56 $ 1.75 $ 1.95 $ 2.39 $ 2.96 $ 3.63 $ 4.46Testing 1.60 1.72 1.85 1.99 2.29 2.62 3.01 3.45
Appraisal $ 3.00 $ 3.28 $ 3.60 $ 3.94 $ 4.68 $ 5.58 $ 6.64 $ 7.91
Rework $ 15.80 $ 12.65 $ 10.03 $ 8.49 $ 7.25 $ 6.16 $ 5.56 $ 5.00Scrap 17.60 14.48 11.92 10.32 8.92 7.72 7.00 6.34
Internal failure $ 33.40 $ 27.13 $ 21.95 $ 18.81 $ 16.17 $ 13.88 $ 12.56 $ 11.34
Returns $ 26.90 $ 21.09 $ 16.35 $ 13.53 $ 11.32 $ 9.50 $ 8.43 $ 7.52Customer
complaint dept. 3.90 3.45 3.03 2.76 2.50 2.27 2.14 2.01Lost sales 49.20 40.31 33.11 28.42 24.45 21.08 19.20 17.44
External failure $ 80.00 $ 64.85 $ 52.49 $ 44.71 $ 38.27 $ 32.85 $ 29.77 $ 26.97
Total costs $137.90 $118.63 $103.56 $ 95.22 $ 92.04 $ 91.41 $ 95.08 $100.68
b. From the preceding data we see that prevention and appraisal costs are increasing whileinternal and external failure costs have been decreasing. The following graph plots threeseries: prevention and appraisal costs, failure costs, and total quality costs.
140
120
100
80
60
40
20
0 Q1 Q2 Q3 Q4 Q1 Q2 Q3 Q4
2008 Quarters 2009
Appraisal and prevention cost Failure costs Total quality costs
Cos
t ($
mill
ions
)
Management Accounting in a Changing Environment 653
zim36725_ch14_627-673.qxd 12/15/09 2:28 PM Page 653

A preliminary conclusion from the graph is that Gilbert Foods is probably now spendingtoo much on trying to improve quality. Assuming that the underlying production processeshave not changed over time, quality costs were minimized in the second quarter of 2009.Since then, the additional money spent on appraisal and prevention has yielded smallerinternal- and external-failure cost savings.
ProblemsP 14–1: British Airways
British Airways (BA) has implemented the balanced scorecard. Match the following performanceindicators:
Return on invested capital On-time arrivalsEarnings growth Percent empty seatsLost baggage Employee turnoverEmployee training hours Number of frequent flyers (25,000 miles on BA)
to these four balanced scorecard perspectives:
Financial Innovation and learningCustomer Internal business processes
Note: Performance indicators may be used for more than one perspective.
P 14–2: Chateau Napa
Chateau Napa purchased a small vineyard and is now producing magnum bottles (1.5 liters) ofRedwood Cabernet Sauvignon. This wine is much sought after, and bottling the wine in larger bottlesenhances its quality, prestige, and demand. Because of the limited size of the vineyard, the quantityof wine produced is fixed. The only decision variable is the quality of the wine produced. Quality isa function of a host of factors: the quality of oak barrels used to age the wine, the ability of theoenologist (winemaker), the length of time it is aged, and so forth. In general, the more money spenton quality, the higher the price of the wine. Several experts rate wines, and the Wine Spectator’s ratinghas become the industry standard. The following table summarizes how quality (as measured inexpected Wine Spectator points with a scale of 0–100) varies with the amount of spending on qualityand how various quality levels translate into price:
WholesaleCost Expected Price
of Quality Quality Received
$ 90 90.00 $570.2095 91.08 576.44
100 92.10 582.34105 93.08 588.00110 94.01 593.38115 94.90 598.52120 95.75 603.44125 96.57 608.17130 97.35 612.69135 98.11 617.08140 98.83 621.24145 99.53 625.28
654 Chapter 14
zim36725_ch14_627-673.qxd 12/15/09 2:28 PM Page 654

Note: Magnums are produced in two-bottle sets. So if $115 is spent on enhancing the quality of atwo-bottle set, a quality rating of 94.90 is expected and a final wholesale price Chateau Napa expectsto receive is $598.52 per two-bottle set.
The managers producing and marketing the Redwood Cabernet Sauvignon are evaluated andcompensated based on the balanced scorecard. Just two metrics are used in their scorecard: actualquality achieved and profits per two-bottle set. Half the bonus is based on quality achieved using thefollowing formula:
Quality bonus � Maximum (0, quality achieved – 90) � 5%
In other words, the managers must receive a quality rating of at least 90 points before any bonus is paid.If they achieve a perfect rating of 100 points, they receive 50 percent of their bonus [5% � (100 � 90)].The other 50 percent of their bonus is tied to profits achieved from selling the two-bottle sets. Profitsconsist of the wholesale selling price less quality costs less all other operating costs ($450 per two-bottleset12). The profit bonus is based on the following formula:
Profit bonus � Maximum (0, profit � $30) � 10%
Managers are expected to achieve profits between $30 and $35. For every dollar of profit they gen-erate above $30, they receive 10 percent of their bonus. So if they have profits of $33.15 per set, theyreceive 31.5 percent [10% � ($33.15 � $30)] of their bonus. (All bonus computations are roundedto three significant digits, i.e., 46.7 percent.)
Required:
a. Given the balanced scorecard incentive scheme being used to reward the RedwoodCabernet Sauvignon managers, how much do you expect them to spend on quality? Whatquality level do they expect to achieve? How much profit per two-bottle set do they expectto earn, and what is their expected total bonus (in percent)?
b. To maximize firm value, how much would Chateau Napa want the managers of RedwoodCabernet Sauvignon to spend on quality; what quality level would this spending likelyyield; and how much profit does this quality level produce?
c. Explain why your answers in parts (a) and (b) are either the same or different.
d. Using the setting in the problem, explain what is meant by the saying “You can onlymaximize in one dimension at a time.”
P 14-3: Fiedler International
You work on a team that reports to the chief financial officer of Fiedler International, a consumerproducts company that manages a variety of consumer beauty brands (shampoos, facial soaps,deodorants). Your team evaluates possible acquisitions. You are currently analyzing the possiblepurchase of Lush, a manufacturer of face moisturizers with UV sun blockers. Lush is a small pub-licly traded company that has no single large shareholder. Most of the stock is held by institutionalinvestors and Lush managers hold a small percentage of the stock.
The materials you have received from Lush include information about its senior managementperformance evaluation and incentive compensation plans. Lush uses a balanced scorecard to evalu-ate and reward senior managers. Managers can earn up to 50 percent of their salary as a bonusdepending on four balanced scorecard metrics: customer service, human resources and innovation,operational efficiency, and financial performance. Each of the four metrics is scaled between 0 and 1.Senior managers receive up to 25 percent of their bonus for each metric. If the customer servicemetric is 0.67, and a particular manager’s salary is $400,000, then for customer service, that managerreceives $33,500 (50% � $400,000 � 0.67 � 25%). The compensation committee of Lush’s board
Management Accounting in a Changing Environment 655
12 Other operating cost of $450 per two-bottle set is a constant and does not vary with the amount spent onquality.
zim36725_ch14_627-673.qxd 12/15/09 2:28 PM Page 655

of directors sets the scale for each of the four metrics. For example, the financial performance metricis economic value added, or EVA. Last year’s EVA was $13 million. The compensation committeesets the lower and upper bound of EVA as $12 million and $16 million. Hence, if the current year’sEVA is $12 million, the financial performance metric is 0. If EVA is $15 million, the metric is 0.75[($15 � $12)/($16 � 12)], and the manager earning the $400,000 salary would receive a bonus of$37,500 (50% � $400,000 � 0.75 � 25%).
Fourteen separate metrics are used to compute the four metrics. The following metrics arecomputed and then aggregated to form the four metrics:
Human Customer Resources and Operational Financial Service Innovation Efficiency Performance
Returns New products On-time EVAproduction
Customer Percent of new Unit complaints products manufacturing
developed on costtime and on budget
On-site customer Employee Safety accidentstraining seminars satisfaction
Shipping errors Employee Dollars of scrapturnover
Employee training
Lush has been using the balanced scorecard for three years and the achieved levels of eachmetric for the last three years are:
Human Customer Resources and Operational Financial Service Innovation Efficiency Performance
2009 0.86 0.77 0.76 0.792010 0.92 0.91 0.82 0.732011 0.95 0.94 0.94 0.69
Required:
Write a memo to your acquisition team describing balanced scorecards and the primary reasons theyare used, and the likely affect of Lush’s use of the balanced scorecard in terms of how Fiedler shouldbe evaluating Lush. Specifically: (a) briefly describe balanced scorecards and why firms use themand (b) analyze Lush’s use of the balanced scorecard and how this might affect Fiedler’s evaluation ofLush as a possible takeover target.
P 14–4: Guest Watches
Guest Watches is a division of Guest Fashions, a large, international fashion designer. GuestWatches manufactures highly stylish watches for young adults (age 18 to 30) who are fashionconscious. It is a profit center and its senior management’s compensation is tied closely to the
656 Chapter 14
zim36725_ch14_627-673.qxd 12/15/09 2:28 PM Page 656

reported profits. While Guest Watches has succeeded in capturing the fashion market, productdependability is eroding these gains. A number of retailers have dropped or are threatening todrop the Guest watch line because of customer returns. Guest watches carry a one-year warranty and12 percent are returned, compared with an industry average of 4 percent. Besides high warrantycosts and lost sales due to reputation, Guest Watches has higher-than-industry-average manufactur-ing scrap and rework costs.
Senior management, worried about these trends and the possible erosion of its market dominance,hired a consulting firm to study the problem and make recommendations for reversing the situation.After a thorough analysis of Guest Watches’s customers, suppliers, and manufacturing facilities, theconsultants recommended five possible actions ranging from the status quo to a complete Total QualityManagement, Zero Defects program (level IV). The accompanying table outlines the variousalternatives for Guest Watches. (Dollar figures are in thousands.)
Additional AdditionalTraining Prevention/
Cost* Compliance†
Status quo $ 0 $ 0Level I 80 180Level II 200 240Level III 350 340Level IV 550 490
*Includes the annual costs of training employees in TQM methods.†All annual costs including certifying suppliers, redesigning the product, andinspection costs to reduce defects.
The consultants emphasized that while first-year startup costs are slightly higher than in subse-quent years, management must really view the above cost estimates as annual ongoing costs. Givenemployee turnover and supplier changes, training, prevention, and compliance costs are not likely todecline over time.
The consulting firm and the newly appointed vice president for quality programs estimatedthat under level IV, rework and scrap would be $25,000 and warranty costs zero. Level IV wasneeded to get the firm to zero defects. A task force was convened and after several meetingsgenerated the following estimates of rework/scrap and warranty costs for the various levels of firmcommitment:
TotalTotal Rework/ WarrantyScrap Cost* Costs†
Status quo $500 $350Level I 300 280Level II 150 140Level III 75 80Level IV 25 0
*The costs of manufacturing scrap and rework.†The costs of repairing and replacing products that fail in the hands of customers.
There was considerable discussion and debate about the quantitative impact of increased qualityon additional sales. While no hard and fast numbers could be derived, the consensus view was that the
Management Accounting in a Changing Environment 657
zim36725_ch14_627-673.qxd 12/15/09 2:28 PM Page 657

total net cash flows (contribution margin) from additional sales as retailers and customers learn of thereduced defect rate would be
ContributionMargin on
Additional Sales
Status quo $ 0Level I 600Level II 1,000Level III 1,200Level IV 1,300
Required:
a. Assuming that the data as presented are reasonably accurate, what should Guest Watchesdo about its deteriorating quality situation? Should it maintain the status quo or shouldit adopt the consultants’ recommendation and implement level I, II, III, or IV?
b. Evaluate the analysis underlying your policy recommendation in (a). Will the seniormanagement of the Watch Division make the same decision as the senior managementof Guest Fashions?
P 14–5: Applying TQM in Manufacturing versus Administration
One large company that has been successful in applying Total Quality Management (TQM) principlesin manufacturing reports that it has had less success in applying the same techniques in improvingadministrative functions such as order taking, distribution, and human resources. This company (whichhas won several quality awards and has significantly improved its product quality) used state-of-the-art TQM methods to train all of its employees in how to apply TQM. However, the company has notbeen able to achieve the same cost reductions and service quality enhancements in administrative areasas it has in the manufacturing area. Assuming that this phenomenon extends to other companies, whydo you think that TQM works better in manufacturing than in nonmanufacturing/ service areas?
P 14–6: Old Town Roasters
Old Town Roasters (OTR) owns and operates a chain of 12 coffee shops around town. OTR’s strategyis to provide the highest-quality coffee and baked goods in a warm, friendly environment. Each OTRprovides its customers Internet access and current newspapers. Some shops are open 24 hours a day,especially those located around college campuses. Each shop manager is responsible for decidingthe hours that the store is open, the selection of baked goods to stock, and the number of Internetterminals to provide in the store.
Required:
Design a balanced scorecard to evaluate and reward the manager of each shop.
P 14–7: The Pottery Store
The Pottery Store is a chain of retail stores in upscale malls that sells pottery, woodcarvings, and othercraft items. The typical customer is shopping for a gift and spends between $50 and $200. Buyers inthe corporate office contact artists around the country and buy inventory for the stores. Corporateheadquarters sets the final selling price for each item and determines when to mark them down forsales. Each store manager is responsible for store staffing and layout. Store managers do not haveresponsibility for choosing the merchandise, store hours (set by the mall), or pricing decisions.
Required:
a. Design a balanced scorecard for the store managers.
b. How would your answer to (a) change if the store managers also had decision-makingresponsibilities for both selecting the merchandise to carry in the store and pricing?
658 Chapter 14
zim36725_ch14_627-673.qxd 12/15/09 2:28 PM Page 658

P 14–8: Software Development Inc.
Software Development Inc. (SDI) produces and markets software for personal computers, includingspreadsheet, word processing, desktop publishing, and database management programs. SDI hasannual sales of $800 million.
Producing software is a time-consuming, labor-intensive process. Software quality is anextremely important aspect of success in computer software markets. One aspect of quality is programreliability. Does the software perform as expected? Does it work with other software in terms of datatransfers and interfaces? Does it terminate abnormally? In spite of extensive testing of the software,programs always contain some bugs. Once the software is released, SDI stands behind the productwith phone-in customer service consultants who answer questions and help the customer work aroundproblems in the software. SDI’s software maintenance group fixes bugs and sends out revised versionsof the programs to customers.
SDI tracks the relation between quality costs and quality. The quality measure it uses is thenumber of documented bugs in a software package. These bugs are counted when a customer calls inwith a complaint and the SDI customer service representative determines that this is a new problem.The software maintenance programmers then attempt to fix the program and eliminate the bug. Tomanage quality, SDI tracks quality costs. It has released 38 new packages or major revisions inexisting packages in the last three years. The accompanying table reports the number of defects(bugs) documented in the first six months following release. Also listed in the table are total productcost and quality cost per software package release.
Product costs include all the costs incurred to produce and market the software, excludingthe quality costs in the table. Quality costs consist of three components: training, prevention, andsoftware maintenance and customer service costs. Training costs are expenditures for educatingthe programmers and updating their training. Better-educated programmers produce fewer bugs.Prevention costs include expenditures for testing the software before it is released. Maintenance andcustomer service costs include (1) the programmers charged with fixing the bugs and reissuing therevised software and (2) the customer service representatives answering phone questions. The trainingand prevention costs are measured over the period the software was being developed. The number ofdefects and maintenance and service costs are measured in the first six months following release.
SDI Defects and Quality Costs by Program Release*
SoftwareMaintenance and
Program Number of Product Training Prevention Customer Service TotalRelease Defects Cost Cost Cost Cost Costs
1 66 $3,455 $442 $ 770 $2,160 $6,8272 86 3,959 428 447 2,658 7,4923 14 3,609 417 1,167 687 5,8804 73 3,948 211 655 2,334 7,1485 17 3,104 290 1,013 544 4,9516 48 3,179 253 547 1,556 5,5357 80 3,112 392 508 2,633 6,6458 41 3,529 276 577 1,563 5,9459 50 3,796 557 634 1,666 6,653
10 67 3,444 365 947 2,140 6,89611 42 3,922 453 869 1,444 6,68812 64 3,846 378 1,108 1,942 7,27413 71 3,014 555 762 2,384 6,71514 1 3,884 301 773 423 5,38115 18 3,183 378 1,080 857 5,49816 85 3,475 528 1,010 2,572 7,585
Management Accounting in a Changing Environment 659
(Continued)
zim36725_ch14_627-673.qxd 12/15/09 2:28 PM Page 659

17 17 3,445 357 666 631 5,09918 50 3,203 285 427 1,546 5,46119 22 3,839 239 1,080 891 6,04920 73 3,060 540 1,054 2,309 6,96321 52 3,182 329 1,079 1,867 6,45722 75 3,075 395 832 2,697 6,99923 35 3,456 447 969 1,518 6,39024 53 3,987 355 651 2,042 7,03525 25 3,836 309 1,160 1,036 6,34126 6 3,886 234 794 252 5,16627 78 3,846 418 833 2,800 7,89728 82 3,106 409 1,092 2,871 7,47829 39 3,506 448 899 1,342 6,19530 47 3,545 450 442 1,450 5,88731 30 3,376 456 784 1,260 5,87632 17 3,740 542 420 607 5,30933 67 3,479 411 821 2,018 6,72934 51 3,773 351 1,145 1,873 7,14235 74 3,034 497 671 2,389 6,59136 25 3,768 268 887 1,094 6,01737 14 3,168 356 645 837 5,00638 77 3,561 492 1,167 2,597 7,817
Average 48 $3,509 $390 $ 826 $1,671 $6,395
*Per 100,000 lines of computer code.
All the numbers in the table have been divided by lines of computer code in the particular pro-gram release. Programs with more lines of code cost more and also have more bugs. Prior studies findthat using lines of code is an acceptable way to control for program complexity. Thus, the numbers inthe table are stated in terms of defects and cost per 100,000 lines of code.
The figure below plots the relation between total cost and number of defects. The vice presidentof quality of SDI likes to use it to emphasize that costs and quality are inversely related. She is fond ofsaying, “Quality pays! Our total costs fall as the number of defects declines. The more we spend onquality, the lower our costs.”
SDI total costs by defects
Required:
Critically evaluate the vice president’s analysis.
8,000
7,500
7,000
6,500
6,000
5,500
5,000
4,500
4,000
Tota
l cos
ts
Number of defects100 90 80 70 60 50 40 30 20 10 0
660 Chapter 14
zim36725_ch14_627-673.qxd 12/15/09 2:28 PM Page 660
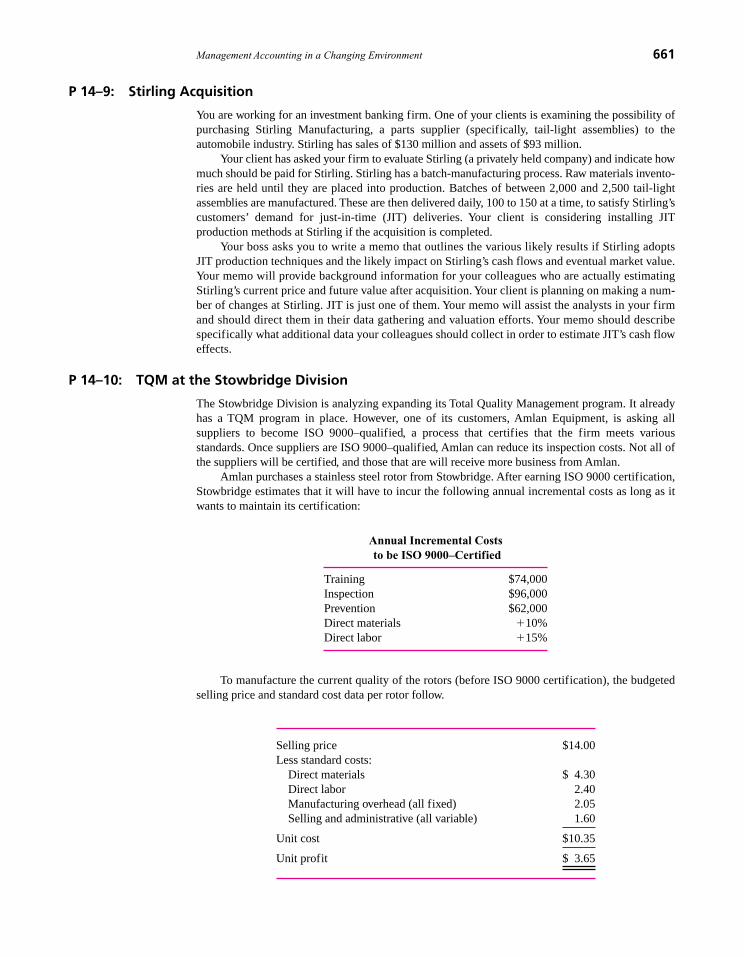
P 14–9: Stirling Acquisition
You are working for an investment banking firm. One of your clients is examining the possibility ofpurchasing Stirling Manufacturing, a parts supplier (specifically, tail-light assemblies) to theautomobile industry. Stirling has sales of $130 million and assets of $93 million.
Your client has asked your firm to evaluate Stirling (a privately held company) and indicate howmuch should be paid for Stirling. Stirling has a batch-manufacturing process. Raw materials invento-ries are held until they are placed into production. Batches of between 2,000 and 2,500 tail-lightassemblies are manufactured. These are then delivered daily, 100 to 150 at a time, to satisfy Stirling’scustomers’ demand for just-in-time (JIT) deliveries. Your client is considering installing JITproduction methods at Stirling if the acquisition is completed.
Your boss asks you to write a memo that outlines the various likely results if Stirling adoptsJIT production techniques and the likely impact on Stirling’s cash flows and eventual market value.Your memo will provide background information for your colleagues who are actually estimatingStirling’s current price and future value after acquisition. Your client is planning on making a num-ber of changes at Stirling. JIT is just one of them. Your memo will assist the analysts in your firmand should direct them in their data gathering and valuation efforts. Your memo should describespecifically what additional data your colleagues should collect in order to estimate JIT’s cash floweffects.
P 14–10: TQM at the Stowbridge Division
The Stowbridge Division is analyzing expanding its Total Quality Management program. It alreadyhas a TQM program in place. However, one of its customers, Amlan Equipment, is asking allsuppliers to become ISO 9000–qualified, a process that certifies that the firm meets variousstandards. Once suppliers are ISO 9000–qualified, Amlan can reduce its inspection costs. Not all ofthe suppliers will be certified, and those that are will receive more business from Amlan.
Amlan purchases a stainless steel rotor from Stowbridge. After earning ISO 9000 certification,Stowbridge estimates that it will have to incur the following annual incremental costs as long as itwants to maintain its certification:
Annual Incremental Coststo be ISO 9000–Certified
Training $74,000Inspection $96,000Prevention $62,000Direct materials �10%Direct labor �15%
To manufacture the current quality of the rotors (before ISO 9000 certification), the budgetedselling price and standard cost data per rotor follow.
Selling price $14.00Less standard costs:
Direct materials $ 4.30Direct labor 2.40Manufacturing overhead (all fixed) 2.05Selling and administrative (all variable) 1.60
Unit cost $10.35
Unit profit $ 3.65
Management Accounting in a Changing Environment 661
zim36725_ch14_627-673.qxd 12/15/09 2:28 PM Page 661

Unless Stowbridge receives ISO 9000 certification, it will lose Amlan’s business of 120,000 unitsper year. Management estimates that the higher quality of the rotor that meets quality criteria willallow Stowbridge to add 14,000 rotors to its existing sales from new and continuing customers. Stow-bridge is currently selling 480,000 rotors per year, including the Amlan sales. The 480,000 currentsales amount to 63 percent of plant capacity. The additional 14,000 units sold can be manufacturedwithout exceeding plant capacity. The higher-quality process after ISO 9000 certification is receivedwould apply to all the rotors produced.
Required:
Should Stowbridge seek ISO 9000 certification? Support your recommendation with an analysis ofthe costs and benefits of certification.
P 14–11: Winter Games
Winter Games manufactures a competitive line of skis and sells its skis to retailers at a price of $225per pair. Based on an annual volume of 5,000 pairs, the cost per pair is $185:
Direct labor ($75 per pair) $375,000Direct materials ($60 per pair) 300,000Overhead
Fixed* $100,000Variable ($0.40 per direct labor dollar) 150,000 250,000
Total costs $925,000Annual volume (pairs) � 5,000
Cost per pair $ 185
*Composed of depreciation, property taxes, charitable contributions, insurance, and so on.
Sports Palace, a discount sporting goods store, currently purchases 500 pairs of skis from Win-ter Games. Sports Palace has asked to purchase 1,000 pairs of skis under a private brand label, at aprice of $200 per pair. The skis would be identical to those normally sold for $225.
Winter Games believes that if it accepts the order, Sports Palace will cancel its usual order of500 pairs. These sales cannot be recouped elsewhere. If this special order is accepted, the direct laborhours for the additional 500 skis would have to be compensated at overtime rates (at 11⁄2 times thebase rate). Analysis shows that variable overhead varies with total direct labor dollars at the rate of$0.40 per direct labor dollar.
Should Winter Games accept the special order from Sports Palace?
P 14–12: Warren City Parts Manufacturing
Warren City, with sales of $2 billion, produces and sells farm equipment. The manufacturing divisionproduces some parts internally and purchases other parts from external suppliers and assembles farmequipment including tractors, combines, and plows. Within the manufacturing division is partsmanufacturing, which fabricates a large variety of parts. Parts manufacturing is further subdividedinto 12 departments, including screw products, metal stamping and fabrication, plastic injectionmolding, and steel castings. Each of these parts departments is headed by a department managerwhose performance is evaluated along several dimensions: meeting budgeted costs, meeting deliveryschedules, improving quality, achieving affirmative action and employee satisfaction goals, andminimizing inventory adjustments.
Inventory adjustments occur twice a year after internal auditors conduct a physical inventory ofthe parts department’s work in process and compare it with the amount of inventory as reported in the
662 Chapter 14
zim36725_ch14_627-673.qxd 12/15/09 2:28 PM Page 662

work-in-process (WIP) account. For example, if on June 30 the auditors take a physical inventorycount and find $130,000 of physical WIP inventory in the steel castings department but the WIPaccount reports an inventory balance of $143,000, then a negative inventory adjustment of �9.1 per-cent (�$13,000 � $143,000) is made. Any inventory adjustment, positive or negative, reflects unfa-vorably on the parts department manager’s performance and results in a reduction in the manager’sbonus. The parts department manager is expected to maintain a tight control of WIP inventories,including ensuring the integrity of his or her department’s accounting reports of WIP. Large inventoryadjustments indicate that the manager does not have good control of WIP.
Four years ago Warren City adopted JIT production procedures. The result has been a drasticreduction of WIP inventories. For example, the following data illustrate the steel castings depart-ment’s WIP account balance before adjustments, inventory adjustment, and throughput for the lastseven years.
Warren City Steel Castings Department
WIP InventoryYear (as of 12/31) Adjustment* Throughput
2002 $1,920,000 12.0% $76,550,0002003 1,780,000 �12.9 82,130,0002004 1,690,000 13.2 69,780,0002005 1,550,000 13.6 73,290,0002006 1,480,000 17.9 88,360,0002007 1,430,000 �17.8 91,080,0002008 1,390,000 19.5 93,960,000
*Deflated by 12�31 WIP.
Throughput is the total dollar cost of parts manufactured in the year. It is the sum of thebeginning inventory plus direct labor and materials and overhead, less ending inventory. Warren Cityuses a standard cost system and all inventories are valued at standard cost. When a batch of partscompletes production, the WIP inventory is reduced by the standard cost of the part times thestandard number of parts in the batch. Each part is manufactured in standard lot sizes.
Inventory adjustments can result for a number of reasons:
1. Different batch sizes. The department manager decides to deviate from standard batchsizes. Unless a special entry is recorded, the accounting system assumes that thenumber of units in the batch is the standard number. Sometimes the manager has someexcess production capacity and decides to increase the standard batch size. In some cases,the manager produces fewer parts than called for by the standard lot size because ofmachine breakdowns or bottlenecks. For example, suppose a certain part calls for astandard batch size of 150 but the manager decides to produce 200 parts, keeps 50 asspares, but fails to update the WIP account for the additional 50 units. The WIP accountcontains only 150 at standard cost but the auditors count 200, causing a positive inventoryadjustment.
2. Timing differences. The accounting system charges some expenses in a different timeperiod than the department manager expects. This causes the dollar amount of the WIPbalance to differ from standard cost.
3. Standard cost revisions. The standard cost of a part is revised and the auditors use adifferent standard cost in valuing the ending WIP inventory than was used in the WIPaccount.
4. Audit mistakes. The internal auditors make mistakes in counting the final physical WIPinventory.
The first two reasons are by far the most prevalent causes of inventory adjustments.
Management Accounting in a Changing Environment 663
zim36725_ch14_627-673.qxd 12/15/09 2:28 PM Page 663

Required:
a. Management is concerned that the magnitude of the inventory adjustment has increasedover time. What are some likely reasons that the absolute value of the inventory adjustmenthas grown?
b. Evaluate the use of the inventory adjustment described above to measure a partsdepartment manager’s performance.
P 14–13: Secure Servers Inc.
Secure Servers Inc. (SSI) is one of the largest software and service providers directed at providinghigh levels of backup and security for computer servers to the financial community, military, andother clients requiring off-site backup and security systems. SSI’s software packages includeencryption, downloading, and data warehousing of large amounts of data to various SSI sites indedicated locations. SSI backup locations are designed to survive virtually all natural disasters andterrorist attacks.
SSI employs 6,000 people in Dayton, Ohio. Being one of Dayton’s largest employers, it has adeep commitment to the community and supports local educational, cultural, and philanthropicactivities. SSI also believes strongly in both customer and employee satisfaction. To achieve theseobjectives, SSI employs a balanced scorecard to evaluate and reward senior managers. One-fourthof each senior executive’s bonus is tied to the following objectively determined performancemeasures:
Community engagement (independent survey of local leaders).
Customer satisfaction (independent survey of customers).
Employee satisfaction (independent survey of employees).
Corporate profit (audited net income before taxes).
The annual surveys of local leaders, customers, and employees are conducted by an independentopinion survey firm that reports directly to the board of directors. Corporate profit is the firm’sreported net income before taxes as audited by an international public accounting firm. SSI’s seniormanagement team believes strongly in the concept of the balanced scorecard and accepts it as a validand productive performance measurement and incentive tool.
Senior management is tasked with determining how much to spend on further improvements incommunity engagement, customer satisfaction, and employee satisfaction. The following tablecaptures the relations among additional spending in each area and the expected improvements fromsuch expenditures (in millions).
Additional Customer Employee CommunityExpenditure Satisfaction Satisfaction Rating
$0.50 60% 75% 40%1.00 75 80 501.50 80 85 602.00 85 90 702.50 90 95 803.00 95 100 90
For example, by spending an additional $3 million on customer service (improved call centers,training, etc.), a 95 percent customer satisfaction can be achieved. Or, by spending an additional$2 million on employee-related activities (improved child care, athletic facilities, fringe benefits), a90 percent employee satisfaction can be achieved. Or spending $1 million on additional communityprojects can raise SSI’s community rating survey to 50 percent.
664 Chapter 14
zim36725_ch14_627-673.qxd 12/15/09 2:28 PM Page 664

Besides raising the satisfaction scores as detailed above, making additional expenditures onthese three areas also generates additional net cash flows to the firm. The following table estimatesthe additional cash flows SSI receives from making the additional expenditures.
Customer EmployeeSatisfaction Satisfaction Community Rating
Additional Additional Additional Additional Cash Cash Cash
Expenditure Index Flow Index Flow Index Flow
$0.5 60% $0.9 75% $0.7 40% $0.751.0 75 1.5 80 1.3 50 1.501.5 80 2.1 85 1.5 60 2.252.0 85 2.7 90 1.8 70 3.002.5 90 3.1 95 2.0 80 4.003.0 95 3.5 100 2.1 90 4.00
For example, spending $3 million for community projects yields a community rating index of90 percent and additional cash flows of $4.0 million, which increases net income before taxes by$1.0 million ($4.0 – $3.0).
To convert audited net income into a percentage index that can be averaged with the other threesurvey metrics, SSI uses the following formula:
Profit index = –3 � 0.05 � Net income
So, if net income is $74 million, the profit index for use in the balanced scorecard is 70 percent[–3 � (0.05 � 74)].
The four indexes are averaged to get an overall index for determining the bonus for eachsenior executive of SSI. For example, the following four indexes yield a balanced scorecard of79.75 percent:
Customer satisfaction 76.00%Employee satisfaction 88.00Community rating 85.00Profit index 70.00
Average 79.75%
SSI expects audited net income before taxes for the year before making any additionalexpenditures on customer satisfaction, employee satisfaction, and community engagement to be$72 million.
Required:
a. What levels of additional spending do you expect the senior management team of SSI willselect for:
(1) Customer satisfaction.
(2) Community engagement.
(3) Employee satisfaction.
Management Accounting in a Changing Environment 665
zim36725_ch14_627-673.qxd 12/15/09 2:28 PM Page 665

Be sure to justify your answers with appropriate analysis.
b. Given the levels of additional spending on the three items you recommended in (a), what isthe expected balanced scorecard index? That is, calculate the average balanced scorecardmanagement expects to generate if they make the expenditure decisions you predict in (a).Show calculations.
c. What level of spending would you expect a profit-maximizing owner of SSI to select for:
(1) Customer satisfaction.
(2) Community engagement.
(3) Employee satisfaction.
What is the expected balanced scorecard resulting from these spending levels?
P 14–14: Kollel Hospital
Kollel is a private hospital that operates in a large metropolitan area. The hospital admits “regular”patients and “private” patients. Regular patients are admitted and treated by staff doctors who are full-time employees of Kollel Hospital. Private patients are admitted and treated by private physicians(physicians in private practice who have admitting privileges to Kollel). To maintain its leadershiprole in the community, Kollel is deeply committed to its Total Quality Management program. Man-agement and staff form multidisciplinary teams to study various hospital functions. This year, oneteam reviewed a hospital unit that exclusively treated a particular type of medical admittance. (All pa-tients of this type of admittance were treated in this unit.) The team found that patients preferred tobe discharged sooner rather than later and that, overall, the patients felt that they were kept in thehospital too long.
The specific unit under review consists of 16 beds. Last year the unit treated 300 patients. Thepatients were heterogeneous with respect to their level of illness. Properly diagnosed and treated,patients should have been discharged in an average of 16 days. Nevertheless, the TQM study showedthat patients remain in the hospital an average of 19 days. Furthermore, research showed that theaverage stay of regular patients was shorter than the average stay of private patients, even though theprivate physicians did not handle more difficult cases at the time of admission. The study found thatprivate doctors took longer to diagnose their patients and spent less time with them during treatment.As a result, these doctors did not promptly recognize whether a treatment was working or whether thepatient was ready to be discharged.
In order to increase the quality of care, hospital management is studying plans to lower theaverage stay of these patients. One alternative being considered is preventing the private doctors, whoare keeping their patients in the unit the longest, from admitting patients into the unit. Some, but notall, of these patients can be replaced by patients admitted by staff doctors. The trade-off between thenumber of patients admitted and the length of a patient’s stay is shown in the following table. Lastyear 150 regular and 150 private patients were admitted. The average stay was 16 days for regularpatients and 22 days for private patients, making an overall average of 19 days per patient.
Admissions as a Function of Reducing Length of Stay
StatusQuo 1 Day 2 Days 3 Days 4 Days
Regular patients’ stays (days) 16 16 16 16 16Regular patients admitted 150 153 160 173 185Private patients’ stays (days) 22 21 20 19 18Private patients admitted 150 145 135 117 95
For this specific type of admittance, the hospital collects $10,000 per stay from the insurancecompanies, regardless of whether the patient is admitted regularly or privately. This amount is used tocover the unit’s fixed cost of $1,752,000 per year (365 days) and a variable cost of $150 per patientper day. Note that the charges for the doctor’s services are handled separately and are not consideredfor purposes of this analysis.
666 Chapter 14
zim36725_ch14_627-673.qxd 12/15/09 2:28 PM Page 666
Required:
a. Calculate the average hospital stay for all patients under each scenario listed in the table.Also, for each case calculate the occupancy rate (percentage of beds filled on average).Discuss the relation between the average length of stay and the occupancy rate.
b. Prepare an income statement showing the net income for each scenario, separating themargin earned on regular and private patients. Where is profit maximized? What are thecomponents of the change in net income?
P 14–15: Tagway 4000
Tagway 4000 is a computer manufacturer based in Montana. One component of the computer is aninternal battery that keeps track of the time and date while the computer is turned off. Tagwayproduces the batteries in-house. The division that produces the batteries (one million each year) istreated as a cost center. The manager of the division is compensated based on her ability to keep totalcosts low and meet quality control measures of numbers of defects and delivery time. She has a basesalary of $144,000. She is eligible for a $34,000 bonus if total costs do not exceed $2 million, notincluding her compensation. She is eligible for a $40,000 bonus if there are 32 or fewer defects perone million units produced. Finally, she is eligible for a $22,000 bonus if she delivers batteries ontime. On time is defined as averaging two days between the order from the assembly department anddelivery to the assembly department.
The basic cost of producing a battery is $1.55. However, current methods have an inherent defectrate of 1,032 defects per million (approximately four standard deviations or 4 sigma). The cost ofimproving the defect rate involves using higher-quality materials and more experienced labor. Downto 32 defects per million (approximately 5 sigma) the costs are linear. (Based on currently availableinputs, improving the defect rate below 32 per million is impossible.) For every additional $450, onedefect per million can be removed. In other words, the cost to reduce defects to the desired level of32 per million is $450,000.
The current production method delivers the batteries in an average of four days. The cost ofovertime necessary to lower the average to three days is $90,000. The cost of speeding up deliveryanother day is $95,000, making the cumulative cost of lowering the average to two days $185,000.The marginal cost of reducing the average delivery a third day is $115,000, making the total cost ofreducing the average delivery time to one day $300,000.
Required:
a. Create a table showing the production costs for defect rates of 1,032; 500; 100; 50; and32 per million and average delivery times of one to four days. Do not include the manager’ssalary. Note the minimum cost.
b. Create a table showing the manager’s compensation for defect rates of 1,032; 500; 100; 50;and 32 and average delivery times of one to four days. Note the maximum compensation level.
c. Comment on the ideal number of defects and delivery times necessary to achieve theminimum costs and the maximum compensation level.
d. Assume that the company as a whole can measure the financial losses related to defectsand late deliveries. The costs would include warranty costs, express delivery charges, lostsales, and lost goodwill. These costs do not affect the manager’s compensation. The costfor each defect is $460. The cost for each day above one-day average delivery is $500,000per day late. That is $0 for one-day average delivery, $500,000 for two days, and so on.Create a table showing the firm’s total costs—including production costs, costs of defects,costs of delays, and the cost of the manager’s compensation (including applicable bonus)—for defect rates of 1,032; 500; 100; 50; and 32 per million and average delivery times ofone to four days. Note the minimum cost.
e. Comment on the optimum delivery times and number of defects necessary to achieve theminimum costs to the firm and the maximum compensation level now that the firm’s totalcosts are considered.
Management Accounting in a Changing Environment 667
zim36725_ch14_627-673.qxd 12/15/09 2:28 PM Page 667

CasesCase 14–1: Global Oil13
In 1995 Global Oil Corporation’s Marketing and Refining (M&R) Division was the fifth largestU.S. refiner with 7,700 Global-branded service stations selling about 23 million gallons per day, or7 percent of the nation’s gasoline. All the service stations are company owned. In 1990, M&R rankedlast among its peers in profitability and was annually draining $500 million of cash from thecorporation.
In 1993, M&R reorganized from a centralized functional organization (Refineries, Transportation,Warehousing, Retail, and Marketing) into 17 geographic business units (sales and distribution) and14 service companies. The functional organization was slow to react to changing market conditionsand the special customer needs that differed across the country. The new decentralized organizationwas designed to better focus on the customer. New marketing strategies could be better tailored tolocal markets by giving local managers more decision-making authority.
A new corporate strategy to focus on the less price-sensitive customer who would not only buyGlobal gas but also shop in its convenience gas-store outlets was implemented simultaneously withthe reorganization. Global’s new strategy was to redesign its convenience stores so they wouldbecome a “destination stop,” offering one-stop shopping for gas and snacks.
The old organization used a variety of functional measures: manufacturing cost, sales margins andvolumes, and health and safety metrics. After changing its corporate strategy and organizational struc-ture, M&R decided to change its performance metrics and began investigating the balanced scorecard.
Balanced scorecard (BSC) at M&RM&R formed project teams of managers to design performance metrics for its operations. Thirty-twodifferent metrics were identified. These included Financial (ROA, cash flow, volume growth, etc.), Cus-tomer (share of segment, mystery shopper, etc.), Internal (safety incidents, refinery ROA, inventorylevel, etc.), and Learning (strategic skills accumulation, quality of information system, etc.). The “mys-tery shopper” is a third-party vendor who purchases gas and snacks at each station monthly. During eachvisit, the mystery shopper rates the station on 23 items related to external appearance, rest rooms, andso forth. A brochure describing the BSC was prepared and distributed to M&R’s 11,000 employees inAugust of 1994. Extensive meetings with employees explained the new metrics and the BSC concept.
Compensation plansAll salaried employees of M&R received up to a 10 percent bonus if Global ranked first among itsseven competitors on ROA and earnings per share (EPS) growth. In addition to this existing plan, anew program was added that awarded bonuses up to 20 percent to managers. The size of the bonusdepends on the average performance of three factors:
• Global’s competitive ranking on ROA and EPS growth.
• M&R’s balanced scorecard metrics.
• Own business unit’s balanced scorecard.
In 1995, M&R generated more income per barrel of oil than the industry average, and its ROAexceeded the industry’s average.
Required:
a. Critically evaluate M&R’s implementation of the balanced scorecard. Identify anystrengths and weaknesses of the program.
b. Was the adoption of the balanced scorecard at M&R responsible for the turnaround in itsfinancial performance?
668 Chapter 14
13 This case is based on R Kaplan, “Mobil USM&R(A): Linking the Balanced Scorecard,” Harvard BusinessSchool Case 9–197–025 (May 7, 1997).
zim36725_ch14_627-673.qxd 12/15/09 2:28 PM Page 668

Case 14–2: Telephone Computer Corporation (TCC)
Telephone Computer Corporation (TCC) manufactures and sells two computerized directory assis-tance computers to telephone companies. The firm has its own sales force that sells directly tothe phone companies. TCC currently sells two computer systems: the Alpha and the Beta. TCC has90 percent of the high-end market (Beta) and 50 percent of the low-end market (Alpha). The Alphasells for $100,000. The Beta sells for $200,000 but has three times the capacity of the Alpha.
TCC has developed a new high-volume machine, Zeta, that has four times the capacity of theBeta and lower operating costs, but a price of $300,000. The unit manufacturing cost is $170,000.Users can connect the Zeta directly to mainframe computers for customer billing as well as to futureexpected telecommunications advancements. If the Zeta is introduced, management expects that itsclosest competition will be from the Beta, so most initial sales of the Zeta will come at the expenseof Beta sales.
Senior management has invested considerable resources in Zeta. It believes that the future of thecompany is tied closely to the success of this project. Next year’s operations of TCC (if the Zeta is notintroduced) are:
Next Year’s Projected Profits by Product without Zeta
Alpha Beta Total
Sales in units 100 50Selling price $ 100,000 $ 200,000
Revenue $10,000,000 $10,000,000 $20,000,000Cost per unit 50,000 80,000Cost of units sold 5,000,000 4,000,000 9,000,000Sales force salaries* 2,000,000 2,000,000 4,000,000Commissions (10% of revenue) 1,000,000 1,000,000 2,000,000
Product-line profits $ 2,000,000 $ 3,000,000 $ 5,000,000
*Assigned based on commissions.
The existing sales force will sell all three types of machines. Salespeople are paid a salaryplus 10 percent of sales. To sell the Zeta, salespeople with more knowledge of telecommu-nications and computer systems will be hired. The additional salary cost of these new employeeswill be $500,000. The existing sales force will still sell the Zeta but will call in these systemexperts to assist with the sale. The Zeta system experts are paid a flat salary, and the existing salesforce’s 10 percent commission incentive will not change with the introduction of the Zeta.
If the Zeta is not introduced, Alpha unit sales are projected to grow at 5 percent per year andBeta unit sales are projected to grow at 10 percent per year. Selling prices will remain constant inreal terms. (Prices and salaries will grow at the inflation rate. To keep the analysis simple, allnumbers should be projected in real, not nominal, terms. That is, do not adjust the numbers forinflation.)
If the Zeta is introduced, Alpha unit sales will not be affected. But Beta unit sales will beaffected: All the Zeta sales will come from the Beta sales in the first year and then Beta unit saleswill grow only 2 percent per year. Zeta sales will grow at 9 percent per year from an initial base of25 machines.
Required:
Management wants to see how the preceding table on product-line profitability will appear when theZeta model is added. In particular, management asks you to project profits for the Alpha, Beta, andZeta for the next five years and to make a recommendation on this project. Discuss how the five-yearproduct-line profitability projections should be presented to senior management.
Management Accounting in a Changing Environment 669
zim36725_ch14_627-673.qxd 12/15/09 2:28 PM Page 669

Case 14–3: Productivity Measures
BackgroundEconomists and managers have long recognized the importance of productivity in determining anorganization’s success. Productivity is the relation between the firm’s output of goods and servicesand the inputs necessary to produce that output. If a firm is able to produce more output with thesame inputs, we say it has improved its productivity. Likewise, if two firms produce the same quantityof goods and services but one firm uses less input, that firm is called more productive. Countries thatproduce more output per person generate more consumable wealth. Economists keep productivitystatistics, and these numbers are reported in the financial press as measuring the competitiveness andwell-being of that country.
In the 1970s many of the largest U.S. firms became interested in productivity and better waysto measure and improve their firms’ productivity. Largely driven by foreign competition, theseAmerican firms were losing market share to Japanese and European rivals. Japanese auto companieswere producing cars with fewer employee hours per car than American companies, thus offeringlower-priced and often higher-quality cars than U.S. automakers. Foreign steel producers were moreproductive than their U.S. counterparts. Concerned about their declining relative productivity in1977, large U.S. firms financed the formation of the American Productivity Center (later theAmerican Productivity and Quality Center). To become more productive, some firms experimentedwith various productivity measures.
In its most basic form, productivity is defined as:
If the firm uses a single input (steel) to produce a single homogeneous product (horseshoes)that never changes over time, then the measure of productivity is the units of output per quantity ofinput, or the number of horseshoes per pound of steel. If steel waste is reduced, more horseshoescan be produced with the same amount of steel. One measure of productivity is the ratio of horse-shoes to steel, in terms of physical volume. Steel is not the only input to making horseshoes. Laboris also an input, and labor is usually the input of most interest to managers. Productivity is usuallythought of as the amount of output per unit of labor. Most managers want to know the numberof horseshoes produced per person and how this number changes over time and compares to thecompetition.
Proponents of productivity measurement systems argue that managers should focus onproductivity instead of accounting profits. A firm can appear profitable but can be experiencingdeclining productivity if selling prices are rising faster than input prices. Productivity measureshelp identify these cases. Managers control the physical aspects of the manufacturing process, suchas the amount of steel scrap in making horseshoes, but they cannot control the price of steel or theprice of horseshoes. For the most part, managers cannot influence prices but must take them as agiven and try to produce more output from a given physical input or the same output using lessphysical input.
Proponents of productivity measures argue that basing managerial performance on productivity,which does not include uncontrollable price changes, yields a better indicator of the manager’sperformance. They argue that traditional accounting measures, such as net income, include manyfactors that managers cannot control and do not focus enough attention on factors that managers cancontrol such as labor productivity. The following example illustrates productivity measurementsystems in more detail.
Measuring productivityIf the firm produces several types of outputs (large and small horseshoes) and the mix of output variesover time, then the productivity measure must somehow aggregate the quantities of outputs into asingle aggregate quantity. Likewise, several inputs must be aggregated to derive a homogeneous inputmeasure. The measure of productivity (outputs/inputs) must aggregate the multiple inputs and themultiple outputs.
Productivity =
Output
Input
670 Chapter 14
zim36725_ch14_627-673.qxd 12/15/09 2:28 PM Page 670
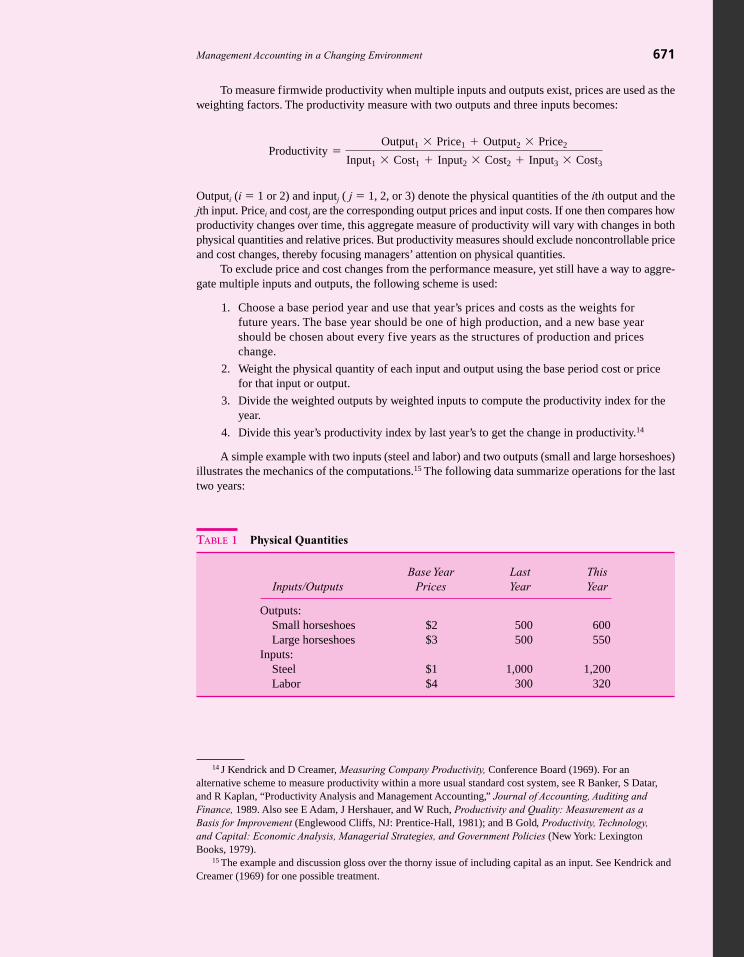
To measure firmwide productivity when multiple inputs and outputs exist, prices are used as theweighting factors. The productivity measure with two outputs and three inputs becomes:
Outputi (i � 1 or 2) and inputj ( j � 1, 2, or 3) denote the physical quantities of the ith output and thejth input. Pricei and costj are the corresponding output prices and input costs. If one then compares howproductivity changes over time, this aggregate measure of productivity will vary with changes in bothphysical quantities and relative prices. But productivity measures should exclude noncontrollable priceand cost changes, thereby focusing managers’ attention on physical quantities.
To exclude price and cost changes from the performance measure, yet still have a way to aggre-gate multiple inputs and outputs, the following scheme is used:
1. Choose a base period year and use that year’s prices and costs as the weights forfuture years. The base year should be one of high production, and a new base yearshould be chosen about every five years as the structures of production and priceschange.
2. Weight the physical quantity of each input and output using the base period cost or pricefor that input or output.
3. Divide the weighted outputs by weighted inputs to compute the productivity index for theyear.
4. Divide this year’s productivity index by last year’s to get the change in productivity.14
A simple example with two inputs (steel and labor) and two outputs (small and large horseshoes)illustrates the mechanics of the computations.15 The following data summarize operations for the lasttwo years:
Productivity =
Output1 * Price1 + Output2 * Price2
Input1 * Cost1 + Input2 * Cost2 + Input3 * Cost3
Management Accounting in a Changing Environment 671
14 J Kendrick and D Creamer, Measuring Company Productivity, Conference Board (1969). For analternative scheme to measure productivity within a more usual standard cost system, see R Banker, S Datar,and R Kaplan, “Productivity Analysis and Management Accounting,” Journal of Accounting, Auditing andFinance, 1989. Also see E Adam, J Hershauer, and W Ruch, Productivity and Quality: Measurement as aBasis for Improvement (Englewood Cliffs, NJ: Prentice-Hall, 1981); and B Gold, Productivity, Technology,and Capital: Economic Analysis, Managerial Strategies, and Government Policies (New York: LexingtonBooks, 1979).
15 The example and discussion gloss over the thorny issue of including capital as an input. See Kendrick andCreamer (1969) for one possible treatment.
TABLE 1 Physical Quantities
Base Year Last This Inputs/Outputs Prices Year Year
Outputs:Small horseshoes $2 500 600Large horseshoes $3 500 550
Inputs:Steel $1 1,000 1,200Labor $4 300 320
zim36725_ch14_627-673.qxd 12/15/09 2:28 PM Page 671

Based on these data, the productivity measures are calculated as:
672 Chapter 14
16 H Armitage and A Atkinson, The Choice of Productivity Measures in Organizations: A Field Study ofPractice in Seven Canadian Firms (Hamilton, Ontario: Society of Management Accountants of Canada, 1990).A Study of U.S. firms reported that fewer than 15 percent used or planned to use total productivity measures(J Kraus, How U.S. Firms Measure Productivity [New York: National Association of Accountants, 1984]).
TABLE 2
Inputs/Outputs Last Year This Year
Outputs:Small horseshoes $1,000 $1,200Large horseshoes 1,500 1,650
Total outputs $2,500 $2,850
Inputs:Steel $1,000 $1,200Labor 1,200 1,280
Total inputs $2,200 $2,480
$2,500 $2,850
Productivity $2,200 $2,480� 1.136 � 1.149
Increase in productivity � 1.1%
Total productivity increased from 1.136 last year to 1.149 this year, or a 1.1 percent increase.Using base period prices, the productivity measure indicates that more output was produced usingrelatively less input.
In a study of productivity systems in Canada, few firms were found to measure aggregatefirmwide productivity as the ratio of firm outputs to firm inputs.16 Instead, firms develop a fewdistinct nonfinancial measures that capture the essential strategic elements of their business. Forexample, a steel company tracks tons of steel shipped divided by tons of iron purchased and tons ofsteel shipped divided by number of employees. In an insurance company, the number of policiesprocessed per employee in a particular department is reported. Other companies measure yield rates,defect rates, and production rates. The study concludes (p. 132), “We believe that productivity mea-sures are operational aids in the strategic process that helps organization members keep track of whatis required for the organization to achieve its long-run goals.”
Required:
a. Critically analyze the productivity calculations in Table 2. Did the managers of thefirm perform better this year compared with last year, as the productivity measuresindicate?
b. Discuss some plausible reasons why comprehensive productivity systems have not beenwidely adopted by organizations.
c. Consider the situation of Burk Wheels. Burk Wheels manufactures aluminumautomobile wheels (onto which rubber tires are mounted). The owner, Gerry Burk, isworried about increased competition from foreign countries (with lower labor costs)and is seeking to increase the productivity of her workers. She decides to implement a
1.149 �1.136
1.136
zim36725_ch14_627-673.qxd 12/16/09 9:45 PM Page 672

Management Accounting in a Changing Environment 673
bonus system for direct line supervisors and department managers to reward them forimproving labor productivity. In particular, supervisors will receive bonuses if theyimprove their department’s labor productivity, defined as Output � Labor hours. Thecasting department is the primary production process whereby molten aluminum ispoured into molds, cooled, and then removed to form the wheels. Operating data for thecasting department for the last two months prior to announcing the labor productivityincentive program are:
March April
Wheels cast 1,680 1,710Direct labor hours 722 701Aluminum used (pounds) 14,616 15,219Direct labor wages/hour $23.10 $23.75Price of aluminum/pound $ 0.92 $ 0.91
Calculate the productivity of direct labor for March and April and discuss how laborproductivity changed between March and April. Gerry Burk asks your opinion of herproposal to increase productivity by rewarding production supervisors and plantdepartmental managers for increasing labor productivity. Write Ms. Burk a memooutlining your views of her plan.
zim36725_ch14_627-673.qxd 12/15/09 2:28 PM Page 673

674
Solutions to Concept Questions
Q1–1: One system cannot be designed to maximize twoconflicting objectives better than two systems each maxi-mizing one objective. If a single system is used for bothdecision management and decision control, trade-offsmust be made to create a balanced system that maximizesprofits for the firm.Q1–2: An internal accounting system provides managersand executives with key cost information regarding theirbusiness. Examples include financial budgets, inventorycosts, product costs, factory costs, and overhead costs.Q1–3:
i. External reports (taxes, financial statements).ii. Performance evaluations. (How well did a manager
meet profit expectations for a given year?) iii. Decision making. (Does continuing to produce a
given product line maximize firm profit?)Q1–4: An internal accounting system should have the
following characteristics:i. It should provide information necessary to identify
the most profitable products and at what volumesthey should be produced.
ii. It should provide information in such a way thatproduction inefficiencies are detected.
iii. In combination with the performance evaluationand reward systems, the internal accountingsystem should create incentives for managers tomaximize firm value.
iv. It must support the financial and tax accountingfunctions.
v. Its cost-to-benefit ratio must be less than 1.Q1–5: Few firms have multiple systems. Typical reasonsinclude:
i. There are additional costs required to maintainmultiple systems, including additional dataprocessing and bookkeeping costs.
ii. There is confusion surrounding different measures.Managers wonder which system has the “right”number. The natural tendency is to reconcile thedifference. Reconciliation is costly in terms oftime.
iii. With one system, the external auditor can also beused to monitor and control the internal reportingsystem at little additional cost.
Q1–6: Surviving firms in competitive industries tend touse administrative procedures whose benefits net of costsare at least as high as their competitors’. In a competitiveworld, if surviving organizations are using some operating
procedure over long periods of time, then it is likely thatthis procedure is yielding benefits in excess of costs.Q1–7: The chief financial officer’s major responsibili-ties involve providing all the accounting reports for bothexternal parties and management, tax administration, bud-geting, treasury including financing, investments, andinternal audit.
Q2–1: The opportunity cost consists of the receipts fromthe most valuable forgone alternative when making a de-cision or choice among many options.Q2–2:
i. Opportunity costs are not necessarily the same aspayments.
ii. Opportunity costs are forward-looking.iii. Opportunity costs can be dated at the moment of
final decision.Q2–3: The $8,325 is an accurate estimate of the oppor-tunity cost if we can resell the material for that amountor we can replace the material and the future price isexpected to be $8,325. In general, historical costs can bereasonably accurate estimates of opportunity costs if thecurrent market price has not changed and there is a readymarket to buy and sell the material.Q2–4: Sunk costs are costs incurred in the past thatcannot be recovered and are therefore irrelevant for futuredecision making. An example of a sunk cost is a firm’s pur-chase of 100 pounds of a material required in a one-timeproject. Sixty pounds are used in this project. The remaining40 pounds have no market value. Using the opportunity costconcept, the historical cost of the remaining 40 pounds issunk and irrelevant for future uses of this material.Q2–5: Avoidable costs are those costs that will not be in-curred if an existing operation is closed or changed.Avoidable costs are the opportunity costs. Unavoidablecosts are costs that will continue to be incurred regardlessof the decision.Q2–6: Mixed costs are cost categories that cannot beclassified as being purely fixed or purely variable. An ex-ample is utilities.Q2–7: A step cost is a cost that is fixed over a givenrange of output level. For example, supervisory personnelcost is a step cost.Q2–8: A fixed cost is a cost that does not vary with thenumber of units produced. Although fixed with respect tovolume changes, fixed costs can still be managed andreduced.
zim36725_solution_674-683.qxd 12/11/09 11:23 AM Page 674

Solutions to Concept Questions 675
Q2–9: A variable cost is the additional cost incurredwhen output is expanded. Labor and materials are usuallytwo variable costs. A variable cost is not necessarily a mar-ginal cost. A marginal cost is the cost of the last unit pro-duced, while variable cost is the portion of the total costthat varies with the quantity produced. If the variable cost islinear, then marginal cost per unit equals variable cost perunit and is constant as volume changes. If variable cost isnot linear, marginal cost will be nonconstant.Q2–10:
i. Price and variable cost per unit must not vary withvolume.
ii. It is a single-period analysis.iii. It assumes a single-product firm.
Q2–11: The major benefit of CVP analysis is that itforces managers to understand how costs and revenuesvary with changes in output. Its limitations include
i. Price and variable cost must not vary with volume.ii. It is a single-period analysis (no time value of
money).iii. It assumes a single-product firm.
Q2–12: Estimating opportunity costs requires the deci-sion maker to formulate all possible alternative actions andthe forgone net receipts from those actions. This is a costlyand time-consuming process. Furthermore, the opportunitycost changes as the set of alternative actions changes.Q2–13: Direct costs are those costs that are worthwhiletracing to the unit being costed. Cost/benefit analysis re-quires one to determine whether tracing the cost has abenefit greater than its costs.Q2–14: Overhead costs include indirect labor andmaterials and other general manufacturing costs that cannotbe directly traced to the units produced. Overhead costs areusually allocated using a base that most closely approximatesthose factors that cause overhead to vary in the long run.Q2–15: Period costs consist of all nonmanufacturingcosts, including selling, distribution, general, and admin-istrative costs. Period costs are not included in the cost ofthe products that are in inventory. Period costs are writtenoff to the income statement when incurred.Q2–16: Motion and time studies break each labor taskdown to its basic movements and then time each move-ment. These studies have two objectives: (1) to estimatedirect labor costs of a particular job and (2) to reducethese costs by redesigning the way employees perform orredesigning the product to reduce labor input.Q2–17: Fixed costs do not directly enter the pricingdecision. Fixed costs (if not incurred yet) only enter thedecision to produce or not produce the good or service.
Q3–1: Even for riskless investments, a dollar today canbe deposited in the bank and start earning interest so thatin the future it will have grown to more than a dollar.
Q3–2: If expenses are paid after they are deducted foraccounting purposes, then the present value of the ex-penses is smaller than the cost recognized on the incomestatement causing an accounting loss. However, if the dis-counted expenses are less than the revenue, then there is aneconomic profit. For example, suppose a product is soldfor $10, costs $9 to manufacture, and has a three-year war-ranty. The expected warranty cost is $1.10, which is ex-pected to be paid at the end of three years. The accountingloss is $0.10 because the warranty expense is recognizedwhen the product is sold, not when the warranty cost ispaid. If the interest rate is 12 percent, then the present valueof the warranty expense is $1.10 � (1.12)3 � $0.78 and theeconomic profit is $0.22 (or $10.00 � 9.00 � $0.78).Q3–3: Present value is the amount of money needed to-day that, when invested at the prevailing interest rate, willgrow to the future amount.Q3–4: Future value is the amount of money available ata future date by taking the present amount and investing itat the prevailing interest rate.Q3–5: Compound interest is the interest earned on moneyinvested including principal and reinvested interest.Q3–6: Perpetuities are infinite streams of equal paymentswhile annuities are finite streams of equal payments.Q3–7: Net present value is the discounted value offuture cash flows minus initial investment.Q3–8: The monthly interest rate compounds interest morefrequently than an annual interest rate. If the monthly inter-est rate is one-twelfth of the annual interest rate, saverswould have more interest at the end of the year with monthlycompounding. So to equate the total interest received undermonthly and annual interest rates, the monthly interest ratemust be smaller than one-twelfth the annual rate.Q3–9: Accounting depreciation is an allowable deduc-tion in calculating taxable income and taxes payable.Being able to depreciate fixed assets reduces taxes and in-creases net cash flows after taxes.Q3–10: The real interest rate is composed of the risk-free rate and a risk premium.Q3–11: The nominal interest rate is composed of therisk-free rate, a risk premium, and an inflation rate.Q3–12: Three flaws with IRR are that (1) it does nottake into account the magnitude of investment (a largerdollar amount earning a lower return may be worth morethan a smaller dollar amount earning a higher return),(2) some projects result in multiple IRRs, making invest-ment decisions unclear, and (3) the IRR method incor-rectly assumes that intermediate cash flows are reinvestedat the project’s internal rate of return.Q3–13: A dollar invested in buildings is depreciated,and thereby lowers taxes and increases cash flows. How-ever, a dollar invested in land or working capital cannot bedepreciated and provides no tax shield.
zim36725_solution_674-683.qxd 12/11/09 11:23 AM Page 675

676 Solutions to Concept Questions
Q3–14: Accounting earnings contain accruals and de-ferrals and as such are not the same as cash flows. Onlycash flows can be invested and earn interest; earnings can-not be invested until cash is realized.
Q4–1: Agency costs are the decline in value resultingfrom agents pursuing their own interests instead of theprincipal’s interests. Differences between risk tolerances,working horizons, and excessive job perquisites all con-tribute to agency costs. Agency costs also arise whenagents seek to manage larger organizations, to increaseeither their job security or their pay. Q4–2: Agency costs are reduced by monitoring andbonding activities. Agency costs are limited by the exis-tence of a labor market for managers, competition fromother firms, and the market for corporate control. Q4–3: Goal incongruence means simply that agents andprincipals have different utility functions. Q4–4: By restructuring the agent’s incentive scheme, theagent’s and principal’s objectives can be made morecongruent. Q4–5: Because knowledge is valuable in decisionmaking, the right to make a decision should reside withthe person who has the specific knowledge for thedecision. Q4–6:
i. Measuring performance.ii. Rewarding and punishing performance.
iii. Partitioning decision rights to their highest-valueduse.
Q4–7: Influence costs consist of the forgone opportuni-ties arising from employees trying to affect decisions bypoliticking and other potentially nonproductive influenceactivities. Influence costs arise when employees wastevaluable time trying to influence decisions.Q4–8: The firm, defined as a locus of contracts, existsbecause each resource owner is better off contracting withthe firm than either contracting separately with all theresource owners individually or not contracting at all.Each resource owner, by contracting with the firm, is im-plicitly contracting with all others contracted with thefirm. The firm economizes on repetitive contracting andtransaction costs are reduced.Q4–9: Decision management refers to those aspects ofthe decision process whereby the manager either initiatesor implements a decision (e.g., a supervisor requesting anadditional employee to make her department run moreefficiently).
Decision control refers to those aspects of the deci-sion process whereby managers either ratify or monitordecisions (e.g., the supervisor’s boss ratifying the decisionand allowing her to hire an additional employee).
Q4–10: All organizations must constructi. Systems that partition decision rights. Decision
rights lie initially with the board of directors.The rights are then assigned throughout theorganization.
ii. Systems that measure performance. The systemdeveloped must measure the performance ofvariables over which the agent has been givendecision rights.
iii. Systems that reward and punish performance. Thesystem must be matched to the performancevariables being measured.
Q4–11: The four steps in the decision process arei. Decision initiation—the beginning of the decision
process. This step is usually performed by theperson with the specific knowledge; a decisionmanagement function.
ii. Decision ratification—reviewing and approvingthe request; a decision control function.
iii. Decision implementation—usually associated withthe individual(s) who initiated the process; adecision management function.
iv. Decision monitoring—evaluating theimplementation; a decision control function.
The separation of management and control helps reduceagency costs. The separation is structured so that the deci-sion makers do not measure their own performance.
Q5–1: Responsibility accounting dictates that decisionrights are linked with the specialized knowledge neces-sary to exercise the decision rights and that the perfor-mance measurement system (e.g., the accounting system)measures the performance of outcomes that depend on thedecision rights assigned to agents.Q5–2: The internal accounting system is most usefulin decision monitoring and is an important part of the sep-aration of decision management and control. Accountingdepartments, being independent of operating manage-ment, are part of the firm’s internal contracting system de-signed to reduce agency costs. Accounting reports are onemeasure of an agent’s performance.Q5–3: Responsibility centers differ in their assigneddecision rights and their performance managementsystem.
• Cost center. This center’s goal is either to maximizeoutput given a fixed amount of resources or tominimize input costs given a fixed output. Theperformance measures are (1) actual versusbudgeted output and (2) actual versus budgetedcost. If measured on total cost, the quality of theoutput may be a problem. If measured on averagecost, the incentive to increase inventory exists.
zim36725_solution_674-683.qxd 12/11/09 11:23 AM Page 676

Solutions to Concept Questions 677
• Profit center. Profit centers are given a fixedamount of capital; they control pricing and theinput mix. The performance measure is the center’sbudgeted versus actual profit. Managers have theincentive to build inventories and request morecapital assets as long as they are not charged theopportunity cost of the assets.
• Investment center. Investment centers have all thedecision rights of profit centers plus some controlover the amount of capital invested. Theperformance measure is either ROI or residualincome. There are two problems with ROI. First,ROI is not a measure of the center’s economic rateof return, creating a potential horizon problem.Second, managers have the incentive to rejectprofitable projects if the expected ROI is less thanthe mean ROI for the center. Residual income alsohas its shortcomings. Primarily, it too suffers fromthe horizon problem. Residual income is anabsolute number and cannot be used to comparecenters of different size.
Q5–4: EVA and residual income are based on the sameformula. EVA might adjust accounting earnings, usesweighted-average cost of capital, and links performancemeasurement (EVA) to compensation.
Q5–5: The controllability principle holds managers re-sponsible for only those decisions they have the authorityto affect. One limitation is that while managers may havelittle control over the likelihood of some event, if they caninfluence the costs (or benefits) of the event, they shouldstill be held accountable. The second limitation is that theperformance of managers can often be better gauged bycomparing it with the performance of others (relative per-formance evaluation) even though the managers beingevaluated may have no control over others’ performance.Q5–6: All performance measurement schemes, includ-ing accounting-based schemes, are likely to produce mis-leading results and induce dysfunctional behavior if usedmechanically and in isolation from other measures. Thesecond point is that no system is perfect. The question toask is this: Is the proposed system better than the nextbest alternative?
Q5–7:i. International taxation.
ii. Incentives and performance measurement of profitor investment centers.
Q5–8:i. Market price: Given a competitive external
market for the good, the transfer price isdetermined by the external market price.
ii. Variable cost: Transfer price is determined bythe variable cost of manufacturing the good.
iii. Full cost: Transfer price is determined by thefull (fixed and variable) cost of manufacturingthe good.
iv. Negotiated price: A negotiated price isdetermined by negotiations between thepurchasing and selling divisions.
Q5–9: No. Changing transfer pricing methods doesmore than shift income among divisions. The method usedcan change the profitability of the firm as a whole becausethe buying/selling division changes its scale of operationsin response to the transfer price.
Q6–1: Budgets are developed using “key planning as-sumptions” or “basic estimating factors.”Q6–2: Key planning assumptions represent those factorsthat are to some extent beyond management control andthat set a limit on the overall activities of the firm. Theymust be forecast based on past experience, field estimates,and/or statistical analysis.Q6–3: A budget variance occurs when actual expensesdo not match budgeted expenses exactly or when bud-geted revenues do not match actual revenues exactly.Q6–4: Budgets are part of both. Most managers are eval-uated in part on how well they are able to meet the bud-geted expectations of their department, division, and soon. Budget variances are indicators of whether managersare meeting expectations. A large unfavorable variancemay cause a manager to be demoted or lose his job.Q6–5: Budgets provide
i. A communication device involving both verticaland horizontal information transfers.
ii. A negotiation and internal contracting procedure.iii. A role in the performance evaluation and reward
system.iv. A role in partitioning decision rights.
Q6–6: Budgets separate decision management from de-cision control. Managers have the decision managementrights (i.e., budget preparation and operating decisions).The board of directors has the decision control rights (i.e.,budget review and approval and financial statementreview).Q6–7: The budgeting process serves as a communica-tion device in a large firm. The process gives managersincentives to share their specific knowledge, thus transmit-ting this knowledge vertically and horizontally throughoutthe firm. Key planning assumptions are shared and devel-oped in this process as well. The information-sharingprocess also serves as a negotiation and contracting proce-dure between different subunits within the firm. Review ofthe prior year’s budget is a part of this process, and there-fore budgeting is part of the performance evaluation and
zim36725_solution_674-683.qxd 12/11/09 11:23 AM Page 677

reward and punishment system. These processes partitiondecision rights within the firm.Q6–8: This is just another example of the trade-offbetween decision making and control. The budget systemtransfers specialized knowledge about key planning as-sumptions. However, if the budget is also used for controland provides incentives for meeting the budget, then man-agers will “shade” their forecasts to enhance their perfor-mance whenever performance is measured by comparingactual results with budget.Q6–9: A bottom-up budgeting system means that lowerlevels in the organization prepare the initial budgets be-cause they have the specialized knowledge, and as thebudget winds its way through the decision ratificationprocess, higher levels in the organization review the bud-get and bring to bear additional knowledge.Q6–10: The ratchet effect refers to basing next year’sbudget on this year’s actual performance if this year’s ac-tual performance exceeds this year’s budget. If, in this yearactual performance falls short of budget, next year’s bud-get is not reduced. Budget ratcheting causes employees toreduce output this year to avoid being held to a higherstandard in future periods.Q6–11: Participative budgeting occurs when the personultimately held responsible for meeting the target makesthe initial budget forecast.Q6–12: A short-run budget is a one-year budget. Likeall budgets, it forces managers with specific knowledge tocommunicate their forecasts and becomes the internalcontract between the manager and the firm. A long-runbudget projects from 2 to 10 years into the future and is akey part of a firm’s strategic planning process. A short-runbudget involves both decision management and decisioncontrol, while a long-run budget is primarily for decisionmanagement.Q6–13: Line-item budgets authorize a manager to spendonly up to a specific amount on each line item. These bud-gets are an extreme form of control; decision rights to sub-stitute resources are denied. The benefit of such control isa reduction of agency costs. The disadvantage of thesebudgets is that managers are disinclined to look for sav-ings because they cannot transfer the savings to anotherline item. If coming in under budget reduces the nextyear’s budget for that line item, then the manager has noincentive to search for savings.Q6–14: Budget lapsing provides tighter controls onmanagers than budgets that do not lapse. The primary pur-pose is to prevent certain agency problems from occur-ring. The opportunity cost of lapsing budgets is usuallyless efficient operations. Managers will devote time atyear-end to ensure that the budget is fully spent, therebyprotecting future budget levels.Q6–15: A static budget is a budget that does not changewith volume, while a flexible budget changes with volume.
The major reason for using flexible budgets is to better mea-sure the actual performance of a person or entity after con-trolling for volume effects, assuming that the person/entitybeing evaluated cannot control the volume changes. How-ever, if a manager can influence the effect of the volumechange, then it is unwise to shield the manager from thevolume changes.Q6–16: With incremental budgeting, each lower-levelmanager submits a budget by making incremental changesto each line item. Detailed explanations justifying the in-cremental changes are submitted and reviewed by the or-ganization. Base budgets are taken as given.
Zero-based budgeting (ZBB) resets each line item inthe budget to zero and the entire amount must be justified.ZBB, in principle, maximizes firm value by identifying andeliminating expenditures whose total costs are greater thantotal benefits, whereas inefficient base budgets can still ex-ist with incremental budgeting. However, ZBB often degen-erates to incremental budgeting. The same justifications aresubmitted to support the incremental changes. The volumeof reports under ZBB is larger than under incremental bud-geting, causing senior managers to focus on changes.
Q7–1: Some of the reasons for allocating costs are taxes,external financial reporting, third-party reimbursement,and solving the organizational problem.Q7–2: Cost allocations can affect cash flows if the firmhas contracts tied to reported costs (e.g., defense contrac-tors using cost-plus contracts). Cost allocations can alsoaffect taxes and thus cash flows. For example, allocatingcosts can affect product costs and thus the amount of costof goods sold.Q7–3: Allocating costs causes an increase in thereported costs of using the resource being allocated. Forexample, if property taxes are allocated using squarefootage, then floor space becomes taxed. These cost allo-cations are like taxes on these resources. Like all taxes onconsumption items, the tax discourages use of the itemlevied with the tax.Q7–4: Externalities are costs or benefits imposed onother individuals without their participation in thedecision-making process and without compensation forthe cost or benefits imposed on them (e.g., air pollution).Q7–5: A negative externality causes others to bear somecost as the result of a decision made that is beyond theircontrol. A positive externality causes others to receivesome benefit as the result of a decision made that is out oftheir control.Q7–6: One way to reduce an externality is to impose atax on the use of the resource or the decision that createsthe externality.Q7–7:
i. Ra, the overhead rate at volume level a, is greaterthan MCa, the marginal cost at a. Under this
678 Solutions to Concept Questions
zim36725_solution_674-683.qxd 12/11/09 11:23 AM Page 678

Solutions to Concept Questions 679
condition, the cost allocation overstates themarginal cost of the externality. Therefore, taxingmight cause more harm than good.
ii. Rb � MCb. Under this condition, the costallocation and the marginal cost are equal. In thiscase the cost allocation perfectly reflects theamount of tax to apply.
iii. Rc � MCc. Under this condition, the costallocation rate is less than the marginal cost ofthe externality. Taxing under this condition isbetter than no tax.
Q7–8: If common costs are not allocated, managers haveless incentive to invest in the specialized knowledge nec-essary to determine the optimal level of the commoncosts. Furthermore, if the decision rights over the level ofthe common costs do not reside with a manager and arenot allocated back to the manager’s department, the man-ager will always demand more common costs.Q7–9: A noninsulating allocation method causes the per-formance measure (e.g., divisional profits) to depend onthe performance of another division. If other divisions im-prove their performance, your division bears fewerallocated costs and hence will show better performance(after receiving allocated costs). Noninsulating allocationmethods create incentives for managers to cooperate andmutually monitor each other to protect their interest.Q7–10: Factor prices do not represent the total cost to thefirm of the input factor. “Distorted” factor prices representan attempt by senior managers to proxy the total cost.
Q8–1: The death spiral can result whenever transferprices include fixed costs and users shift away from the in-ternal common resource. This further increases the fullcost transfer price, causing further users to reduce theirdemand. Death spirals can be avoided by using variablecost transfer pricing and cost allocations.Q8–2:
i. To tax the users with some positive price thatcauses them to reduce their consumption fromwhat it would be under a zero price (no allocation).
ii. By allocating the costs, senior management getsinformation about the total demand for the serviceat the allocated cost.
iii. By comparing the internally allocated cost withthe external market price of comparable services,senior management is able to assess the operatingefficiency of the service department.
iv. Taxing the internal service helps allocate ascarce resource. At a zero price, demand willalmost always exceed supply. In the absence ofa price mechanism to allocate departmentservices, senior management will be confrontedwith complaints to increase the amount of
service via larger budgets and must devisenonprice priority schemes to manage the queuewaiting for service.
Q8–3: Step-down allocation is an allocation method thatrecognizes that service departments use each other’s ser-vices. The process begins by choosing one service depart-ment and allocating its cost to the remaining services andoperating departments. The process is repeated for eachof the remaining service departments. A major criticism ofthe step-down method is that the sequence is arbitrary andlarge differences in the cost per unit of service across dif-ferent sequences are possible. The step-down method alsoignores the fact that departments earlier in the sequenceuse service departments later in the sequence.Q8–4: The direct allocation method ignores service de-partments using each other’s services in allocating costs.The step-down method allocates service department coststo other service departments later in the sequence.Q8–5: The first service department in the step-downsequence has a smaller cost per unit than if it is the lastdepartment in the sequence. The reason is twofold:(1) there are fewer costs to allocate, and (2) there are moreusers over which to allocate the costs.Q8–6: Joint costs are costs incurred in the production oftwo or more outputs from the same production process infixed proportion. Joint products are produced in fixed pro-portions. Common costs arise in production settingswhere there can be substitution among outputs. More ofone output can be produced by reducing the output of an-other product.
Joint costs are associated with disassembly processeswhere a joint input is disassembled into several products.Common costs usually describe assembly processes wherenumerous inputs including some common resources areassembled to form the output.Q8–7: Three common methods to allocate joint costs are(1) physical measures, (2) relative sales value method, and(3) net realizable value method. The fundamental point toremember when analyzing situations involving joint costsis that any joint cost allocated to final products is mean-ingless for assessing product-line profitability.Q8–8: The advantage of NRV is that it does not distortthe relative profitability of product-line costs and hence isbetter for decision making. The disadvantage of NRV isthat it is costly to collect selling prices and costs beyondthe split-off point.
Q9–1:i. Job order costing.
ii. Process costing.Q9–2:
i. Direct labor, direct materials, and overheadallocations are charged to “work in process” whilethe job remains in process.
zim36725_solution_674-683.qxd 12/11/09 11:23 AM Page 679

ii. When a job is finished, the total cost of the job istransferred from “work in process” to “finishedgoods inventory.”
iii. When the goods are sold, the total cost of the jobis transferred from “finished goods inventory” to“cost of goods sold.”
Q9–3: The $2,750 cost of materials should be charged tothe overhead account as indirect materials. Machines occa-sionally malfunction and destroy raw materials. This is notunusual and is a normal part of the manufacturing process.To charge the current job that happens to be in productionat the time overstates the cost of this job. Charging the$2,750 to overhead and then allocating it to all jobs doesnot misrepresent the cost of the current job in production.Q9–4: Using a prospective overhead rate allows moretimely reporting of total costs since actual total overheadcosts cannot be determined until the end of the year.Q9–5: Overabsorbed overhead can be the result ofhigher volume produced during the year than budgeted.Overabsorbed overhead also can result if less overheadcost was incurred than budgeted.Q9–6:
i. Charge it off to cost of goods sold.ii. Allocate it among work in process, finished goods,
and cost of goods sold based on the amount ofoverhead in these categories.
iii. Recalculate the cost of each job using actualoverhead incurred and actual volume to compute arevised overhead rate.
Q9–7: Manufacturing plants produce a wide variety ofproducts that are measured in different units. Input mea-sures, however, are common to any product. Therefore, aninput measure that is common to all manufacturing unitsand has the greatest association with the overhead is usedto calculate the prospective overhead rate.Q9–8: Flexible budgets split overhead into fixed andvariable components as in the formula
Budgeted OH � Fixed OH � Variable OH � EV
Using a flexible formula allows a firm to derive an esti-mate of the total overhead that varies with volume.Q9–9: Absorption costs represent average costs and areoften used in the pricing decision. Fluctuations in salesvolume may or may not cause marginal costs to change.Overhead rates based on normal volumes preventincorrect pricing decisions based on temporary volumefluctuations.Q9–10: Unforeseen circumstances that lower volume donot necessarily increase marginal costs. An increase inunit costs will give a misleading signal to raise prices.Managers make capital investments using assumptions ofnormal volume. Unit costs are also developed using theseassumptions. If these assumptions are incorrect, then thecapital investment should be written off as a period
expense and the unit costs recalculated using the new esti-mate of normal volume.Q9–11: Multiple overhead rates do not necessarilyalways produce more accurate estimates of product costs.It often depends on the particular decision context. Forsome decisions using multiple overhead rates for differentclasses of overhead costs, each overhead item can be ana-lyzed and the most representative cost driver for eachoverhead category can be identified and used as the allo-cation base.Q9–12:
i. Single factorywide overhead rate. This method isuseful when the plant has a single homogeneousproduction process.
ii. Separate overhead rate for each indirect cost item.This method is useful when different productsconsume varying amounts of indirect costs butthe plant is not organized into productiondepartments.
iii. Separate overhead rate for each department. Thismethod is useful when different products consumevarying amounts of indirect costs and the plant isorganized into production departments.
Q9–13: Process costing is used in continuous flow pro-duction processes. Costs are averaged because there are nodiscrete batches. Information is more aggregate in formand therefore not very useful in decision making.
Q10–1: Viewing unit costs as variable costs implies thatthere is causality between unit cost figures and volumeproduced. In many cases unit costs are mixtures of vari-able and fixed costs and thus do not represent the incre-mental cost of producing one more unit.Q10–2: By producing more units than are sold, some ofthe fixed costs are inventoried instead of being assigned tothe income statement.Q10–3:
i. Charge inventory holding costs against profits oradopt variable costing.
ii. Implement rules against adding to or buildinginventories.
iii. Use stock-price-based incentives for managersinstead of accounting numbers for compensation.This will only work in a single-plant, publiclytraded firm.
iv. Use JIT production systems.Q10–4: The major difference is how they treat fixed man-ufacturing overhead. Under absorption costing, overhead istreated as part of the product costs. Using variable costing,fixed overhead is written off as a period expense.Q10–5: Two claimed advantages of variable costing are
i. It eliminates the distortions to income and productcosts when volume changes.
680 Solutions to Concept Questions
zim36725_solution_674-683.qxd 12/11/09 11:23 AM Page 680

Solutions to Concept Questions 681
ii. It reduces the dysfunctional incentives tooverproduce.
Two potential problems with using variable costing arei. Determining which costs are fixed and which are
variable.ii. It produces unit cost figures that contain no
estimate of the opportunity cost of capacity.
Q11–1: Traditional absorption costing can lead to inac-curate product costs if the allocation bases chosen do notcapture the underlying overhead cost drivers. In otherwords, the allocation bases used to allocate overhead toproducts do not accurately reflect the factors that causeoverhead to vary.Q11–2: Complex products are usually undercosted byabsorption cost systems because the factors that cause oneproduct to be more complex than another are not used toallocate overhead. Unless the more complex products useproportionately more direct labor than less complex prod-ucts, then too little overhead is allocated to the more com-plex products.Q11–3:
i. Unit level.ii. Batch level.
iii. Product level.iv. Production-sustaining level.
Q11–4: Both allocate the same total costs to products.Q11–5:
i. To develop more “accurate” product or product-line costs.
ii. To change incentives of operating managers.Q11–6:
i. An increase in the percentage of product costsdirectly traced to individual products.
ii. A better understanding of how costs are consumedby individual products and what activities arerequired to produce individual products.
iii. A better understanding of the direct and indirectcosts in the various activity centers.
iv. A better understanding of how indirect costs aregenerated by the cost drivers.
Q11–7: The physical activities that consume resourcesand generate costs are not tracked through historicalcosts; the cost drivers cannot be discerned from the ac-counting numbers. Managers must be able to identify andmanage the cost drivers to successfully control costs.Q11–8: The form of an absorption system is audiencedependent. If the collected information is to be used for de-cision management, then the form of the absorption systemwill lean toward an ABC system where the underlyingdrivers can be measured. If the information is primarily fordecision control, then ABC is less useful. Multiple systems
are costly; therefore, in choosing a system, trade-offs be-tween decision management and decision control usuallymust be made.Q11–9: High-volume products tend to be overcosted inunit-based absorption costing because much of the factoryoverhead is due to managing the number of products andbatches in the plant. The low-volume products cause justas many transactions to occur in the plant (such as pur-chase orders and setups).
Q12–1: Standard costs are a set of benchmarks usedto measure the performance of the firm with respect tocontrolling costs and for internal repetitive contracting.Q12–2:
i. Product pricing decisions.ii. Make-versus-buy decisions.
iii. Plant resource allocation decisions.Q12–3: Yes. For example, the standard cost of an hourof machine time in the lathe department is a proxy for theopportunity cost of using one hour of lathe time. This stan-dard cost conveys to other managers throughout the firmthe opportunity cost of using lathes.Q12–4: If managers with the specific knowledge forupdating the standard have part of their performanceevaluation based on the difference between actual per-formance and the standard, this creates an incentive forthem to update standards to levels that they feel areachievable.Q12–5: Target costing is a top-down approach. It beginswith a target price established by marketing. The firm’srequired return on investment is subtracted from the targetprice to derive the target product cost. This cost is thenexploded into its subcomponents, which become the stan-dards to be met if the firm is to meet its desired market pen-etration and required return. Traditional standard costing isa bottom-up approach and is less product/market driven.Q12–6:
i. Direct labor variances.ii. Direct materials variances.
iii. Overhead variances.Q12–7:
i. Wage variance.ii. Efficiency variance.
Q12–8: Large favorable variances could be the result ofreplacing the standard-quality material with substandard-quality material, yielding a favorable price variance.Q12–9:
i. Price variance.ii. Quantity variance.
Q12–10:i. Incentive to build inventories and/or lower quality.
ii. Externalities.
zim36725_solution_674-683.qxd 12/11/09 11:23 AM Page 681

iii. Discourage cooperation.iv. Mutual monitoring incentives.v. Satisificing behavior.
Q12–11: In seeking favorable price variances, the pur-chasing department has incentives to buy materials inlarge lot sizes to secure quantity discounts.Q12–12: The purchasing department can impose costson manufacturing by purchasing low-quality materials.Manufacturing can impose costs on the purchasing de-partment by requesting rush deliveries or by changing thespecifications of purchased parts.Q12–13: There are two organizational reasons for writingvariances off to cost of goods sold. First, prorating the vari-ances creates incentives for managers to manipulate re-ported income. Second, prorating variances back toinventories will change the product costs incurred by themanager responsible for selling these inventories. The firstreaction will be to change prices, an action he or she shouldnot take. Of course, marginal costs can and do change, andstandards must be updated to correctly reflect any changes.Q12–14: Standard cost systems are expensive in termsof the opportunity cost of a manager’s time to investigatecost variances and to oversee the development and main-tenance of the standards. The benefit of standard costscomes from the development of specialized knowledgecreated by the manager in his or her investigations.Q12–15: Many cost systems were developed as a meansto measure and control direct labor costs. The fractionof direct labor in modern factories has decreased, thuslowering the benefits of a standard cost system. Also, mod-ern factories have frequent changes in products and/orprocesses. Numerous changes cause the costs of maintain-ing a standard cost system to increase.
Q13–1:i. Budgeted volume. The production volume used in
calculating the overhead rate.ii. Standard volume. The production of volume that
the plant would have generated if each unit ofproduct manufactured used precisely the standardunit of volume allowed.
iii. Actual volume. The actual production volumegenerated.
Q13–2: Budgeted volume can be estimated using eitherthe projected number of units times their standard volumeper unit (expected volume) or the long-run average units ofvolume (normal volume). Expected volume more accu-rately estimates next year’s actual volume, but it causesoverhead rates to vary inversely with volume. Normal vol-ume is likely to cause larger over- or underabsorbed over-head, but overhead rates do not vary with volume.Q13–3:
i. At the beginning of the year, estimate the flexiblebudget for the year.
ii. Convert expected overhead into an overheadabsorption rate.
iii. Apply overhead to production using standard volume.iv. At the end of the year, compute overhead variances.
Q13–4:i. Overhead efficiency variance. The difference in
flexible budgets using actual volume and standardvolume.
ii. Overhead volume variance. The differencebetween the flexible budget at standard volumeand overhead applied.
iii. Overhead spending variance. The differencebetween how much overhead was actually incurredversus how much overhead should have beenincurred for the actual volume worked.
Q13–5:i. Unexpected changes in prices of variable overhead
items.ii. Unexpected changes in fixed costs.
iii. Unexpected changes in the plant’s productiontechnology cause costs to vary in ways differentfrom those captured by the flexible budget.
Q13–6: The difference between budgeted revenues andactual revenues can be disaggregated into a price varianceand a quantity variance. The quantity variance can be fur-ther disaggregated into mix and sales variances.Q13–7: The mix variance reports how much of thequantity variance is due to the change in product mix be-cause of substitution across products, holding constant thenumber of units sold. The sales variance reports howmuch of the quantity variance is due to actual quantitysold differing from budget, holding the mix constant.
Q14–1: The firm’s business strategy is all the invest-ment projects available to the firm today and into the future.The business strategy arises from the nature of the businessthe firm is in and the amount and type of spending on R&D.
Q14–2: Business strategy affects the organizationalstructure in three ways. The types of investments affect theway specialized knowledge is created and thus how deci-sion rights are partitioned. The investments affect thephysical asset structure and how the firm must be orga-nized for decision making and control of these assets.Finally, the investments affect the type and nature of thecustomer base, which again causes the firm to adopt orga-nizational structures to service this customer base.
The organizational structure in turn affects the busi-ness strategy. The ability of the firm to generate profitableinvestment ideas and implement them requires an organi-zational structure with incentives and controls conduciveto maximizing firm value.Q14–3: Technological and market structure changescause firms’ investment opportunities (strategy) to change.
682 Solutions to Concept Questions
zim36725_solution_674-683.qxd 12/11/09 11:23 AM Page 682

Solutions to Concept Questions 683
Some previously profitable projects disappear and newprofitable projects emerge. These changes in invest-ment opportunities prompt changes in organizationalarchitecture.
Q14–4: Maybe. Other firms adopting organizationalchanges are often reacting to a change in either technologyor market conditions. Such changes should cause manage-ment to reexamine its firm’s policies. But to simply mimicthe other changes is not a good idea. Other firms have dif-ferent investment opportunities and different organiza-tional architectures. They may be changing organizationalpolicies not because of some change in technology or mar-ket condition but because they realized their old systemcould be improved. Also, sometimes managers make mis-takes and adopt value-reducing organizational changes,which should certainly not be mimicked.
Q14–5:i. High mean (e.g., Rolls-Royce versus Toyota).
ii. Low variance (McDonald’s hamburgers versuslocal diner).
iii. Larger number of options.iv. Meeting customer expectations.
Q14–6:i. Knowledge of customer expectations.
ii. Measures of actual realized value.iii. Weights to combine the various deviations from
expectations.
Q14–7:i. Prevention costs—incurred to eliminate defective
units before they are produced.ii. Inspection costs—incurred to eliminate defective
units before they are shipped.iii. Scrap/waste costs—the costs of defective units in
manufacturing.iv. Failure costs—costs of returns, costs of warranty
work, and opportunity cost of lost sales fromreputation effects.
Q14–8: JIT takes on many aspects of a process costingsystem; there are no batches or discrete jobs. Instead, sep-arate accounts, labor, and overhead are charged to a con-version costs account, and materials costs are charged toproducts. Finished goods inventory is charged for conver-sion costs and for materials as units are completed. Thematerials charge for completed units is backflushed, re-ducing the raw and in-process inventory account.Q14–9: Decreasing throughputs has some dysfunctionalaspects. Increased costs are incurred in factory redesign,setup time reduction, and JIT delivery of raw material.Accounting systems focused on throughput time do notcharge managers for these costs. Consequently, managersmeasured on throughput will do things that may decreasethroughput but at the expense of firm profits.Q14–10: The balanced scorecard seeks to better link theboxes in Figure 14–1 on business strategy and the perfor-mance evaluation system. A balanced scorecard translatesthe strategy into a plan of action that identifies specificobjectives and performance drivers to help determine ifthe organization is moving in the right direction.Q14–11: Balanced scorecards can be useful if they causemanagers to identify the underlying value drivers that cre-ate firm value and communicate these inside the firm.However, balanced scorecards have several drawbacks.First, balanced scorecards ignore changes in other parts ofthe firm’s organizational architecture, such as decisionrights assignments and compensation plans. Changing justone leg of the three-legged stool can create dysfunctionalresults. Second, telling managers to simultaneously maxi-mize 20 balanced scorecard indicators provides no guid-ance as to the relative trade-off among the indicators. It isan impossible task. You can only maximize one variable ata time. Third, if their pay is based on multiple metrics,managers will choose those measures that are easiest toachieve and ignore more difficult tasks. Fourth, by givingmanagers multiple criteria for measuring their success, thebalanced scorecard reduces their accountability for de-stroying shareholder value.
zim36725_solution_674-683.qxd 12/11/09 11:23 AM Page 683
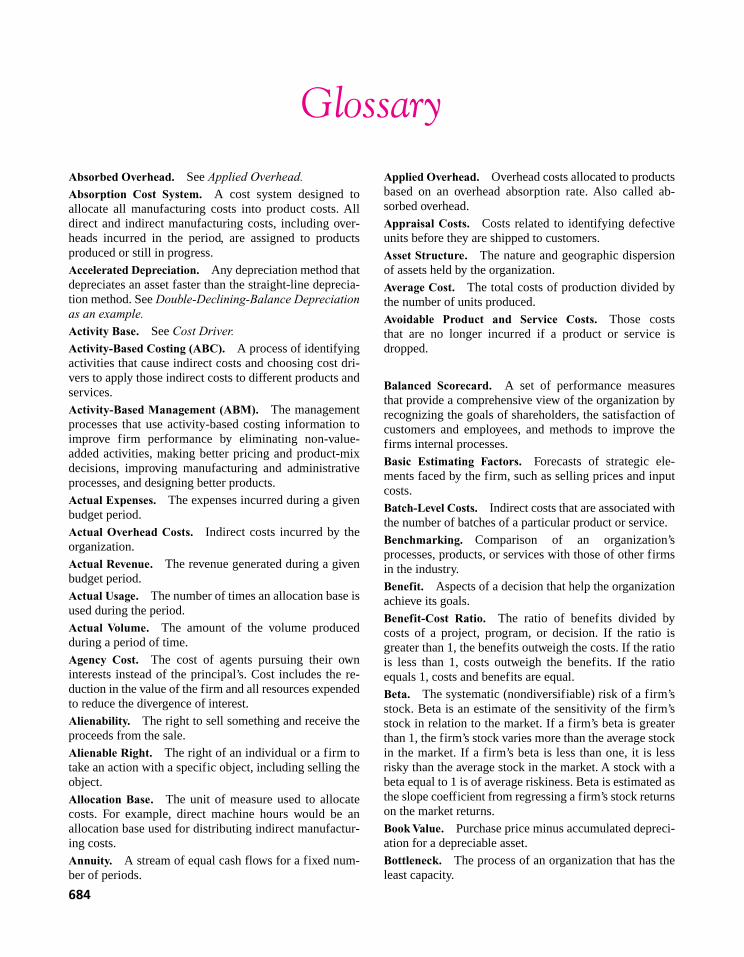
684
Glossary
Absorbed Overhead. See Applied Overhead.Absorption Cost System. A cost system designed toallocate all manufacturing costs into product costs. Alldirect and indirect manufacturing costs, including over-heads incurred in the period, are assigned to productsproduced or still in progress.
Accelerated Depreciation. Any depreciation method thatdepreciates an asset faster than the straight-line deprecia-tion method. See Double-Declining-Balance Depreciationas an example.Activity Base. See Cost Driver.Activity-Based Costing (ABC). A process of identifyingactivities that cause indirect costs and choosing cost dri-vers to apply those indirect costs to different products andservices.
Activity-Based Management (ABM). The managementprocesses that use activity-based costing information toimprove firm performance by eliminating non-value-added activities, making better pricing and product-mixdecisions, improving manufacturing and administrativeprocesses, and designing better products.
Actual Expenses. The expenses incurred during a givenbudget period.
Actual Overhead Costs. Indirect costs incurred by theorganization.
Actual Revenue. The revenue generated during a givenbudget period.
Actual Usage. The number of times an allocation base isused during the period.
Actual Volume. The amount of the volume producedduring a period of time.
Agency Cost. The cost of agents pursuing their owninterests instead of the principal’s. Cost includes the re-duction in the value of the firm and all resources expendedto reduce the divergence of interest.
Alienability. The right to sell something and receive theproceeds from the sale.
Alienable Right. The right of an individual or a firm totake an action with a specific object, including selling theobject.
Allocation Base. The unit of measure used to allocatecosts. For example, direct machine hours would be anallocation base used for distributing indirect manufactur-ing costs.
Annuity. A stream of equal cash flows for a fixed num-ber of periods.
Applied Overhead. Overhead costs allocated to productsbased on an overhead absorption rate. Also called ab-sorbed overhead.
Appraisal Costs. Costs related to identifying defectiveunits before they are shipped to customers.
Asset Structure. The nature and geographic dispersionof assets held by the organization.
Average Cost. The total costs of production divided bythe number of units produced.
Avoidable Product and Service Costs. Those coststhat are no longer incurred if a product or service isdropped.
Balanced Scorecard. A set of performance measuresthat provide a comprehensive view of the organization byrecognizing the goals of shareholders, the satisfaction ofcustomers and employees, and methods to improve thefirms internal processes.
Basic Estimating Factors. Forecasts of strategic ele-ments faced by the firm, such as selling prices and inputcosts.
Batch-Level Costs. Indirect costs that are associated withthe number of batches of a particular product or service.
Benchmarking. Comparison of an organization’sprocesses, products, or services with those of other firmsin the industry.
Benefit. Aspects of a decision that help the organizationachieve its goals.
Benefit-Cost Ratio. The ratio of benefits divided bycosts of a project, program, or decision. If the ratio isgreater than 1, the benefits outweigh the costs. If the ratiois less than 1, costs outweigh the benefits. If the ratioequals 1, costs and benefits are equal.
Beta. The systematic (nondiversifiable) risk of a firm’sstock. Beta is an estimate of the sensitivity of the firm’sstock in relation to the market. If a firm’s beta is greaterthan 1, the firm’s stock varies more than the average stockin the market. If a firm’s beta is less than one, it is lessrisky than the average stock in the market. A stock with abeta equal to 1 is of average riskiness. Beta is estimated asthe slope coefficient from regressing a firm’s stock returnson the market returns.
Book Value. Purchase price minus accumulated depreci-ation for a depreciable asset.
Bottleneck. The process of an organization that has theleast capacity.
zim36725_glos_684-692.qxd 12/11/09 10:10 AM Page 684

Glossary 685
Break-Even Analysis. The process of identifyingthe number of units that must be sold to achieve zeroprofit.
Break-Even Point. The number of units needed to sell inorder for total revenues to equal total costs.
Budget. A forecast of the revenues and/or expenses ex-pected to occur within a future time period. Budgets are anintegral part of the organization’s performance evaluationand decision rights partitioning system.
Budget Lapsing. A type of budgeting that does not allowmanagers to carry over budget surpluses from one yearinto the next year. Under a budget lapsing system, fundsnot spent are lost at the end of the budget period.
Budget Variance. A budget variance occurs when actualexpenses differ from budgeted expenses or when budgetedrevenues differ from actual revenues.
Budgeted Expenses. The forecast of expenses expectedto be incurred in a given time period.
Budgeted Overhead. Total overhead predicted to be in-curred during a period, including fixed and variable over-head at budgeted volume.
Budgeted Overhead Costs. See Budgeted Overhead.
Budgeted Revenue. The forecast of revenue expected tobe generated in a given time period.
Budgeted Volume. The amount of production expectedto occur during the year, usually stated in terms of a com-mon input measure such as direct labor hours. Budgetedvolume can be estimated as expected volume for next yearor normal volume over the long run.
Budgeting. Process of gathering information to assist inmaking forecasts.
Business Strategy. How the firm creates value in termsof products offered, markets served, technology utilized,and the nature of the firm’s asset structure, including theinvestment projects available today and in the future.
By-Product. A joint product of a manufacturing processthat has either little commercial value or is not of suffi-cient interest to management to maintain separate cost andrevenue reports.
Capacity. Maximum output of the operation of anorganization.
Capacity-Sustaining Costs. Costs that arise from sus-taining the overall operation of the factory, such as depre-ciation, utilities, property taxes, and insurance.
Capital Budgeting. The process of choosing an invest-ment project by comparing the future cash flows from theproject with its investment.
Carrying Costs. See Holding Costs.Common Cost. A cost that is shared by two or moreproducts or users.
Compound Interest. Interest earned on money invested,including principal and reinvested interest.
Computer-Aided Manufacturing (CAM). Use of pro-grammable robots and other programmable devices toassist in the manufacturing of products.
Contribution Margin. Revenues less variable costs.
Contribution Margin per Unit. The sales price minus thevariable cost per unit.
Control System. Those procedures that help ensure self-interested agents of the organization maximize the valueof the organization.
Controllability Principle. Holding managers responsiblefor only those decisions for which they are given authority.
Controllable Costs. Costs that are affected by a particu-lar manager’s decisions.
Controller. The person in charge of both managementaccounting and financial accounting in an organization;usually the chief accountant. Also called comptroller.
Conversion Costs. All manufacturing costs other thandirect material costs.
Cost. Cash or other assets that must be surrendered orfuture claims that must be given in order to achieve a spe-cific goal.
Cost Accounting. The calculation and reporting of actualor predicted costs of products, services, or processes.
Cost Allocation. The distribution or assignment of indi-rect, common, or joint costs to different departments,processes, or products within an organization.
Cost Application. The distribution (or assignment) ofindirect, common, or joint costs to different products, asdistinguished from cost allocation, which broadly coversdepartments, activities, or products.
Cost/Benefit Analysis. The process of making decisionsby comparing the costs and benefits of alternative choices.
Cost Center. A type of organizational subunit in whichmanagers have decision rights over a set of costs and areevaluated in part on achieving cost targets.
Cost Driver. The physical measure of activity, such asmachine setups or number of purchase orders, that is mosthighly associated with total costs in the activity center.
Cost Object. A product, process, department, or programthat the organization wishes to cost.
Cost of Capital. The opportunity cost of funds investedin a particular project, or the minimum required rate ofreturn necessary for a potential project to be considered.
Cost of Goods Sold. The historical cost of products soldas reported in the income statement.
Cost of Quality. Cost of preventing, identifying, and cor-recting quality problems. Also includes external costs suchas the cost of lost sales and lost goodwill due to failing tomeet customers’ expectations of quality.
zim36725_glos_684-692.qxd 12/11/09 10:10 AM Page 685

Cost Pools. The accumulation of costs related to anindirect activity.
Cost–Volume–Profit (CVP) Analysis. The process ofestimating profit assuming fixed and variable costs and aconstant price over all rates of output.
Current Cost. The cost of replacing current resourcesusing the prices of identical or similar resources availablein the market.
Customer Base. The type and geographical location ofcustomers.
Death Spiral. A situation occurring when transfer pricesinclude fixed costs and users reduce their use of the inter-nal product or service. This further increases the transferprice (based on average cost) and more users reduce theirdemand.
Decentralization. Assignment of decision-making rightsto lower operating levels of an organization. Decreasescost of transferring specific knowledge needed to makedecisions, but increases the cost of controlling behavior.
Decision Control. Those aspects of the decision processin which managers either ratify or monitor decisions.
Decision Management. Those aspects of the decisionprocess where managers either initiate or implementdecisions.
Decision Model. Methodical routine, such as a mathe-matical formula, for comparing alternative actions.
Decision Rights. The duties that a particular individualin an organization is expected to perform.
Dedicated Flow Line. The factory is organized by prod-uct line, and workers and machines are arranged to pro-duce a single type of product. Products usually are notproduced in batches but rather in single units.
Denominator Volume. The production level used to de-termine the budgeted overhead absorption rate.
Depreciation. The reduction in the historical cost of afixed asset over time.
Depreciation Tax Shield. The reduction in taxes due todepreciation’s reducing taxable income.
Differential Cost. See Incremental Cost.Direct Allocation Method. A method of allocating ser-vice department costs directly to operating departments.This method ignores service departments providing ser-vices to other service departments.
Direct Costing. See Variable Costing.Direct Costs. Costs that can be easily traced or metereddirectly to a product or service.
Direct Labor. Labor costs that can be identified with aspecific product or service.
Direct Labor Variance. Difference between actual laborcost incurred and standard labor cost; a variance that
occurs as the result of a combination of two variances:wage variance and efficiency variance. The wage varianceis the difference between the actual and standard wagemultiplied by the actual number of hours worked. Theefficiency variance is the difference between the actualand standard number of hours worked multiplied by thestandard wage rate.
Direct Materials. Parts and raw materials of a product.
Direct Materials Variance. Difference between actualmaterials cost incurred and standard material cost; a vari-ance that occurs as the result of a combination of twovariances: price variance and quantity variance. The mate-rials price variance is the difference between the actualand standard materials price multiplied by the actual quan-tity of materials. The materials quantity variance is the dif-ference between the actual and standard materials quantitymultiplied by the standard price.
Discount Factor [1�(1 � r)t]. r is the discount rate and tis the number of years until the cash flow is received. Thepresent value of $1 received at a future date.
Discount Rate (r). Interest rate used to calculate the pre-sent or future value of cash flows. See Cost of Capital.Discounted Cash Flow (DCF). Multiplying future cashflows by discount factors to obtain a present value.
Double-Declining-Balance Depreciation. Form of accel-erated depreciation in which the depreciation rate (2/n,where n is the useful life) on the book value in each year isequal to double what the first year’s depreciation ratewould be under straight-line depreciation.
Dysfunctional Decision Making. When the benefits froma decision are smaller than the costs for the firm as a whole.
Economic Darwinism. Differential variations amongfirms’ organizational architectures, decision processes, ortechnologies that affect firms’ chances of survival in acompetitive environment. Natural selection is the processwhereby those differential variations that increase an or-ganization’s chances of survival will tend to be imitatedand become more prevalent in other firms. Managers willnot imitate management practices of failing firms butthose of successful firms.
Economic Order Quantity. The order size that mini-mizes inventory ordering and holding costs.
Economic Value Added (EVA®). A performance measurecalculated by taking adjusted accounting earnings andsubtracting the weighted-average cost of capital times to-tal capital employed. Similar to Residual Income.Electronic Data Interchange (EDI). The direct exchangeof data such as purchase orders and invoices betweenorganizations via computer networks.
Employee Empowerment. The delegation of greater de-cision rights to members of the organization.
686 Glossary
zim36725_glos_684-692.qxd 12/11/09 10:10 AM Page 686

Glossary 687
Encumbrance Accounting. Adding outstanding purchaseorders to expenditures to help ensure that line-item spend-ing authority is maintained.
Engineered Costs. Costs that result as a direct techno-logical relation between inputs and outputs.
Enterprise Resource Planning (ERP). An integrated, au-tomated, computer-based system that tracks production byjob, work center, and activity and then shares the informa-tion enterprisewide in real time.
Equivalent Units. The amount of output stated in termsof complete units. For example, if 200 units of product arein work-in-process at the end of the month and these unitsare 75 percent complete, then these 200 units represent150 equivalent units (200 � 75%).
Ethics. The process of determining standards and proce-dures for dealing with judgmental decisions affectingother people.
Expected Overhead. The fixed overhead plus the vari-able overhead multiplied by the expected volume.
Expected Volume. The amount of production expected tooccur during the period, usually stated in terms of a com-mon input measure such as direct labor hours.
Experience Curve. Theory that production costs per unitdecrease as output increases because workers learn how tomake the product more efficiently.
External Failure Costs. Costs incurred when a customerreceives a defective product.
Externality. Costs or benefits imposed on other individ-uals without their participation in the decision-makingprocess and without compensation for the cost or benefitsimposed on them.
Facility-Related Costs. Indirect costs that are commonto multiple products and services.
Failure Costs. The costs of returns, warranty work, andopportunity cost of lost sales from reputation effects whenthe product fails to meet customer expectations.
Favorable Variances. The amount that budgeted costs aregreater than actual costs or budgeted revenues are lessthan actual revenues.
Financial Accounting. Accounting for the revenues, ex-penses, assets, liabilities, and equities of an organization,concentrating on external users (shareholders, lenders, andgovernment). Constrained by FASB rulings and other gen-erally accepted accounting principles.
Financial Accounting Standards Board (FASB). An in-dependent board that is responsible for the establishmentof generally accepted accounting principles (GAAP) usedin external reporting.
Financial Leverage. The amount of debt in the firm’scapital structure. Measured as the ratio of debt to equity or
debt to total assets. The greater the firm’s financial lever-age, the more variable are the firm’s profits and the morelikely the firm will be forced into bankruptcy for a givendownturn in sales.
Firm. A locus of contracts between individuals and re-source owners.
First-In, First-Out (FIFO). An inventory flow thatassumes that the oldest units in inventory are sold first.
Fixed Cost. The cost of initiating production, which doesnot vary with the number of units produced.
Flexible Budget. A budget that is stated as a function ofsome volume measure, such as units produced. Flexiblebudgets adjust for changes in volume.
Flexible Overhead Budget. The flexible overhead budgetconsists of fixed overhead plus variable overhead multi-plied by volume.
Full Cost. The sum of all costs incurred in the produc-tion of a product or service.
Future Value. Value of cash flows at a future date, takinginto account interest accumulated between when the cashflow occurred and the future date.
Goal Incongruence. When agents of the firm maximizetheir personal utility, not the principal’s. See Agency Cost.Gross Margin. Sales less cost of goods sold, sometimesstated as a percentage of sales.
Historical Costs. The actual costs incurred to acquire re-sources. Accounting systems measure historical costs, notopportunity costs.
Holding Costs. Costs including insurance, labor, intereston capital investment, and storage space necessitated bystoring inventory.
Implementation. The step in the decision process tocarry out the plans of the organization.
Incremental Analysis. Basing a decision on changes incash flows that result from that decision. Also calledincremental approach.Incremental Budgeting. A system whereby only the an-ticipated change in expenditures or revenues over last yearmust be justified to senior management.
Incremental Cost. The cost difference between twoviable alternatives.
Indirect Cost Pool. All costs that cannot be directlytraced to the product and that are similar are combinedinto a single amount and allocated to products or processesusing a single allocation base.
zim36725_glos_684-692.qxd 12/11/09 10:10 AM Page 687

Indirect Costs. Costs that are shared by two or moreproducts or users.
Inflation. Decline in the purchasing power of money dueto the average increase in prices.
Information System. A network, usually within anorganization, by which information is generated andcirculated. This network involves computer systems as wellas other mechanisms, such as payroll records, purchasingdocuments, and managers’ impressions and specificknowledge.
Initiation. The step in the decision process to identifyareas of improvement within the organization.
Inspection Cost. Cost incurred to eliminate defectiveunits before they are shipped; for example, testing costs.
Insulating Allocation. A method allocating costs in sucha way that the performance of one division or subunit ofthe organization is unaffected by the performance ofothers. See Noninsulating Allocation.
Intermediate Product. Product passed from one segmentof an organization to another for further work before it isready for sale. May require transfer price.
Internal Accounting System. The accounting system thatcollects, aggregates, and generates and distributes bud-geted and actual financial and cost information within thefirm for use by executives and managers for both decisionmaking and control.
Internal Auditor. A person within the organization whomonitors various divisions and departments of the organi-zation to determine whether prescribed operational proce-dures are being followed.
Internal Control System. A system of checks and bal-ances within the organization that help the organizationachieve its goals.
Internal Failure Costs. Costs incurred when a defect isdiscovered before being received by a customer.
Internal Rate of Return (IRR). Interest rate that equatesthe present value of future cash flows to the current outlay,or the discount rate that produces a zero net present value.
Internal Revenue Service (IRS). An agency of the U.S.government responsible for administering and collectingtaxes.
Inventoriable Costs. See Product Costs.
Inventory. Depending on classification, direct materials,work in process, or finished goods, includes cost of mate-rials, costs of producing incomplete units, or costs of pro-ducing complete, unsold units.
Inventory Ordering Costs. Handling costs, including thepurchasing department and inspection costs resulting fromordering inventory.
Investment Center. A subunit of the firm that has deci-sion rights over the amount of capital to be invested, the
prices of its products, and the manufacturing process andis usually composed of several profit centers.
Investment Opportunities. All the investment projectsavailable to the firm now and in the foreseeable future.
Job Order Costing. Products are produced in distinctbatches or jobs and the costs of each specific batch aretracked separately using a job order cost sheet.
Job Order System. A system of recording costs for aparticular job, which could be a single unit or a batch.
Joint Cost. The cost of the input and process that yieldstwo or more products in fixed proportions as a result. Forexample, the cost of the barrel of oil and of splitting it intogasoline and motor oil is a joint cost.
Joint Products. Products generated from the splitting ofa single material input.
Just-in-Time Production. A production system in whicheach item on the production line is produced immediatelyas needed by the next step in the process, thereby reducingraw materials and in-process inventories.
Just-in-Time Purchasing. The purchasing departmentcan only order materials as they are needed for production.Usually, the purchasing department has a blanket purchaseorder with the vendor calling for daily deliveries.
Key Performance Indicators. Those actions and activi-ties required for the firm to achieve its strategy and hencemaximize its value.
Key Planning Assumptions. Those factors that are tosome extent beyond management control and that set alimit on the overall activities of the firm. See Basic Esti-mating Factors.
Labor Efficiency Variance. The actual number of hoursworked minus the standard number of hours, multiplied bythe standard wage rate.
Last-In, First-Out (LIFO). An inventory flow that as-sumes that the newest units in inventory are sold first.
Lean Accounting Systems. Lean Accounting primarilyseeks to support lean production and thereby provideinformation to managers that improves all the variousprocesses in the firm. Lean accounting systems are simpleand straight forward and provide data to better understandcustomer value and waste in the current processes. Suchsystems often shun traditional accounting methods suchas variance reporting, standard costs, and ABC as toocomplicated and wasteful.
Lean Production. Consists of a wide variety of effi-ciency and cost-trimming techniques that seek to reduceall non-value activities from the firm’s value chain byidentifying and then eliminating non-value-added activi-ties in demand planning, inventory planning, supply chain
688 Glossary
zim36725_glos_684-692.qxd 12/11/09 10:10 AM Page 688

Glossary 689
planning, and other capabilities that increase customer re-sponsiveness, reduce cycle time, and control costs.
Line Item Budget. A budget that authorizes the managerto spend only up to the specified amount budgeted foreach particular expense item listed in the budget.
Line Personnel. Production supervisors, workers, andother employees with direct responsibility for manufactur-ing (or for another firm objective).
Linear Programming. A mathematical technique forfinding the optimal decision given a linear objective func-tion and multiple linear constraints.
Management Accounting. The accounting system usedwithin the organization to help the organization achieve itsgoals.Management by Exception. The practice of focusing onoperating activities that show results that significantly dif-fer from expected standard results.Managerial (Management) Accounting. The internal useby managers of the accounting system for decision mak-ing and control. Also called Internal Accounting.Marginal Cost. The incremental cost of the last unit pro-duced, which in most cases varies as volume changes.Marginal Revenue. The incremental revenue added by thelast unit sold, which in most cases varies as volume changes.Market Price. The price or value of a good or servicereceived in an exchange between two independent parties.Master Budget. A document that integrates all the esti-mates from the different departments to establish guide-lines and benchmarks for the whole organization.Materials Price Variance. The difference between theactual price and standard price of raw materials times theactual quantity used or purchased.Materials Quantity Variance. The difference betweenthe actual and standard quantity of materials used timesthe standard price.Materials Requirement Planning (MRP). Computerprograms that allow organizations to quickly ascertainresource requirements to make a product.Microeconomics. The study of the behavior of consumersand firms in competitive, oligopolistic, and monopolisticmarkets using the underlying theories of supply and demand.Mix Variance. Captures the effect of substitution amongthe products, holding constant the number of units sold.Mixed Cost. Cost that cannot be classified as beingpurely fixed or purely variable; for example, utilities.Modified Accelerated Cost Recovery System (MACRS).Allowed depreciation expense for tax purposes based on taxregulation that classifies depreciable assets into differentrecovery periods that have various patterns of depreciation.Monitoring. The step in the decision process to makesure that plans are implemented as designed.
Monitoring Cost. The cost of observing members of theorganization directly or indirectly.
Multistage Cost Allocation. The process of allocatingcosts to cost objects followed by the allocation of costsfrom those cost objects to other cost objects.
Mutual Monitoring. When one agent observes and re-ports on dysfunctional/nonoptimal decisions made by an-other agent.
Negative Externality. A cost imposed on individuals thatis the result of a decision that took place without their par-ticipation in the decision-making process and withoutcompensation.
Negotiated Price. A transfer pricing method whereby thetransfer price is determined through negotiations betweenthe purchasing and selling division managers.
Net Income. The excess of all revenues and gains overall expenses and losses for a specific period of time.
Net Present Value (NPV). Discounted value of futurecash flows less initial investment. Method for evaluatingcapital investment projects.
Net Realizable Value. Revenues less direct and separablecosts for each product.
Nominal Interest Rate. Interest rate observed in the mar-ket, composed of two elements: the real interest rate andexpected inflation.
Noninsulating Allocation. A noninsulating method basescost allocations on the performance of all divisions’ actualperformance in aggregate. Therefore, the cost allocated to adivision is, in part, dependent on the performance of theremaining divisions. See Insulating Allocation.Non-Value-Added Cost. Cost of an activity that does notimprove a product or process and may be eliminated with-out changing the level of function, form, or volume of theproduct or process. See Value-Added Cost.Normal Costing. In setting overhead rates, expected vol-ume is set at long-run average volume to prevent productcosts from rising in downturns and falling in upswings.
Normal Volume. The long-run average production vol-ume of a plant or department.
Operating Leverage. The ratio of fixed costs to totalcosts. The higher a firm’s operating leverage, the greaterwill be the variability of profits for a given change in sales.
Opportunity Cost. The receipts from the next most valu-able forgone alternative when making a decision or choiceamong many options.
Opportunity Cost of Capital. The forgone opportunityof using cash for another purpose such as earning interestin a bank account.Organizational Architecture. The structure of an organi-zation. Consists of (1) the assignment of decision rights
zim36725_glos_684-692.qxd 12/11/09 10:10 AM Page 689

within the organization; (2) the methods of rewarding in-dividuals; and (3) the systems to evaluate the performanceof both individuals and business units.
Outlay Cost. A cost that requires a cash disbursement.Also called out-of-pocket cost.Outsourcing. Choosing to have an outside supplierrather than an internal subunit of the organization providea product or service.
Overabsorbed Overhead. The amount of overhead ap-plied is greater than actual overhead cost incurred.
Overhead. All manufacturing costs that cannot be di-rectly traced to a product. Overhead includes indirect laborand materials, plant depreciation, insurance and propertytaxes, plant management salaries, and so forth. See IndirectCost Pool.Overhead Absorbed. The overhead rate multiplied bystandard units of volume.
Overhead Absorption Rate. Budgeted overhead dividedby budgeted volume. Also called overhead application rate.
Overhead Costs. Indirect costs of products or services.
Overhead Efficiency Variance. The difference betweenflexible budgets using actual volume and standard vol-ume. It is an estimate of the additional overhead incurredor saved as a result of the inefficient or efficient use of theplant or department.
Overhead Spending Variance. Actual overhead cost in-curred less the flexible budget at actual volume. It is an es-timate of how much actual overhead incurred differs fromthe amount of overhead that should have been incurredgiven the actual volume in the plant or department.
Overhead Volume Variance. The flexible budget at stan-dard volume less the overhead applied. It is an estimate ofthe unused or overused fixed plant capacity.
Participative Budgeting. Eliciting opinions fromaffected managers in establishing a budget.
Payback Method. Method of evaluating a project bymeasuring the time until the investment is recovered. Al-though very easy to compute, this method ignores timevalue of money and cash flows after payback, making it apoor measure of profitability.
Payback Period. The time required to generate cash in-flows equal to the initial investment.
Performance Measure. Direct or indirect measures ofactions of individuals or groups of individuals within theorganization.
Performance Reports. Evaluation tool used for compar-ing budgeted and actual performance.
Period Costs. Costs that are expensed in the period inwhich they are incurred because they are not part of theproduct’s costs. Includes interest expense, advertising,
selling, administrative, and distribution expenses, and re-search and development costs.
Perpetuity. An infinite stream of equal payments re-ceived each period and invested at a given discount rate.
Physical Measure Method. A procedure of dividingjoint costs based on a physical characteristic of the jointproducts.
Planning. Establishing goals and preparing possiblebudgets to achieve those goals.
Positive Externality. A benefit seen by individuals thatis the result of a decision that took place without theirparticipation in the decision-making process and forwhich they do not pay.
Practical Capacity. The expected output rate the organi-zation can operate when the capacity was purchased andused under normal operating conditions.
Present Value. The amount of money that, if investedtoday, would grow to a designated future amount. Dis-counted value of future cash flows.
Prevention Costs. Costs incurred to prevent defectiveunits before they are produced. For example, reengineer-ing products or production processes.
Pricing Decision. The choice of a price for a product orservice.
Prime Cost. Direct materials plus direct labor costs.
Process Costing. A method of costing products producedin a continuous process in which costs cannot be accumu-lated by the batch or job.
Product Costs. All costs incurred in the manufacturingprocess that can be traced or allocated to a given productand inventoried. Unlike period costs, product costs areaccrued to the period in which they are sold.
Product-Level Costs. Costs associated with a product,but not with a particular unit or batch of the product.
Product Mix Decision. A decision on the types and pro-portions of products and services to offer.
Product or Service Cost. The forgone opportunity ofusing resources to provide a product or service.
Profit Center. A subunit of the firm with the decisionrights over prices and manufacturing processes to maxi-mize profit. Profit centers are evaluated on meeting targetprofits and are composed of several cost centers.
Pro-Forma Financial Statements. Financial statementsbased on forecasted data.
Projected Costs. Costs forecasted for a future time period.
Proration. The process of dividing over- or underab-sorbed overhead into finished inventory, cost of goodssold, and work in process.
Qualitative Factors. Elements that are not measurableusing numerical means.
690 Glossary
zim36725_glos_684-692.qxd 12/11/09 10:10 AM Page 690

Glossary 691
Quality. Measure of a product’s conformance to pre-specified standards for both qualitative and quantitativefactors as perceived by the customer.
Ratification. The step in the decision process to deter-mine whether a proposal is consistent with the goals of theorganization.
Real Interest Rate. Interest rate that would occur with noinflation. The real interest rate is composed of a risk-freeinterest rate plus a risk premium.Reciprocal Allocation Method. A method of allocatingservice costs that explicitly recognizes all interactionsamong the service departments.Relative Performance Evaluation. Instead of basing per-formance on absolute performance, performance is judgedrelative to some benchmark, usually other individuals’ per-formance as a group, to help control for random eventsoutside the control of the manager being evaluated.Relative SalesValue Method. A procedure of dividing jointcosts based on the gross sales value of the joint products.Relevant Range. The range of output levels over whichvariable costs are reasonable approximations of opportu-nity costs.Required Rate of Return. See Cost of Capital.Residual Income. A performance measure for invest-ment centers that subtracts the opportunity cost of theinvestment from the income generated by the assets ofthe investment.Responsibility Accounting. The process of recognizingsubunits within the organization, assigning decision rightsto managers in those subunits, and evaluating the perfor-mance of those managers.Return on Investment (ROI). A performance measurecalculated by dividing the income from an investment bythe size of the investment.Risk Premium. Expected additional return that compen-sates for the uncertainty involved with an investment.Risk-Free Interest Rate. The guaranteed interest ratethat can be earned loaning money to the federal govern-ment. Government securities define the risk-free rate sincethey are the only investments considered to be free ofdefault risk.Robinson-Patman Act. A federal law that prohibitscharging customers different prices if it is injurious tocompetition in the market.
Sales Variance. Captures the effect of quantity sold hold-ing the mix of products sold constant.Satisficing Behavior. Employees seeking to achieve sat-isfactory levels of performance, but not trying to excel.Securities and Exchange Commission (SEC). A federalcommission, established through the Securities Exchange
Act of 1934, which administers the securities laws andregulates purchases and sales of securities, includingfinancial disclosure.Segment. Any part of an organization that can be separatedout for purposes of investment, profit, and/or cost evaluation.See also Cost Center, Investment Center, and Profit Center.Semivariable Cost. See Mixed Cost.Separable Costs. Separable costs are not part of the jointproduction process but rather are beyond the point atwhich the joint costs are incurred. Separable costs can bedirectly traced to individual products.Setup Costs. Costs, including labor and materials, nec-essary to prepare a machine to begin a production run.Shutdown Costs. Costs incurred in shutting down a divi-sion or product line. These costs are only incurred if theshutdown decision is made.Six Sigma. A structured management approach thatidentifies potential projects throughout the organizationand then defines the process improvement goals, measuresthe current process and collects relevant data, analyzes thecausal factors, determines that all factors have been con-sidered, improves the process based upon the analysis, andcontrols any variances before they result in defects.Split-Off Point. The point in processing at which alljoint costs have been incurred.Staff Personnel. The employees of an organization whoprovide services such as purchasing, sales, and mainte-nance to support line personnel.Stakeholders. Parties that are affected by an organization.Standard Costs. Costs that are predetermined on a per-unit basis. Standard costs are used as a benchmark forevaluating performance. These costs are often used in orare the output from the budgeting process.Standard Volume. The amount of volume the plantwould have generated if each unit of product manufac-tured used precisely the standard unit of volume allowed.Static Budgets. Budgets that don’t adjust for volume.Step Cost. A cost that is constant over ranges of produc-tion and increases by discrete amounts as volume in-creases from one interval to the next.Step-Down Method. A method of allocating costswhereby one service department’s cost is allocated to allremaining service departments and operating depart-ments, and so on, until all service department costs areallocated to final products.Straight-Line Depreciation. Depreciation method inwhich the amount taken to depreciation expense each yearis constant and equal to 1�n times the depreciable amount,where n is the depreciable life of the asset.Strategic Planning. The process whereby managers se-lect the firm’s overall objectives and the tactics to achievethose objectives.
zim36725_glos_684-692.qxd 12/11/09 10:10 AM Page 691

Suboptimal Decision Making. See Dysfunctional Deci-sion Making.Sunk Cost. Costs that were incurred in the past, cannotbe recovered, and are therefore irrelevant for decisionmaking.
Target Costing. The process of designing a quality prod-uct at a sufficiently low cost to be able to sell the productat a competitive price and still yield a sufficient profit.
Tax Accounting. The accounting system used to calcu-late taxable income and report to government taxingauthorities.
Theory of Constraints. A process of identifying andmanaging constraints in the making of products or in theprovision of services.
Throughput Time. The total time from when a productstarts the production process until it is ready for sale, in-cluding processing time, time waiting to be moved orworked on, time spent in transit, and inspection time. Alsocalled cycle time.Total Overhead Variance. The difference between totalactual and applied overhead.
Total Quality Management (TQM). A philosophy ofcontinually lowering costs and improving the provisionof services and products to customers.
Transfer Price. The cost charged by one segment of anorganization for a product or service supplied to anothersegment of the same organization.
Transferred-In-Cost. The total cost of production fromprevious processing that is transferred to the next depart-ment in which the product is scheduled for processing.
Treasurer. Manager or officer responsible for cashmanagement.
Tubs on Their Own Bottoms. An expression used to re-fer to operating units in a nonprofit organization in orderto avoid the term “profit center.”
Underabsorbed Overhead. When actual overhead in-curred is higher than overhead assigned to products duringthe year.
Unfavorable Variances. The amount by which budgetedcosts are less than actual costs or by which budgeted rev-enues are greater than actual revenues.
Unit-Level Costs. Costs that arise from activities that areperformed at least once for each unit of product. Directlabor and materials are unit-level costs.
Value Chain. Flow of business functions where value(function, form, or volume) is increased at each stage.Examples would be R&D, Manufacturing, Marketing,Sales, Distribution, and Service.
Value-Added Activities. Activities that provide value tothe customer.
Value-Added Cost. Cost related to an activity thatimproves the function, form, or volume of a product orprocess, and may not be eliminated without changing theproduct or process. See Non-Value-Added Cost.Variable Costing. A cost system that excludes fixedcosts from product costs and writes off all fixed costsagainst income in the year that the costs are incurred. Alsocalled Direct Costing.Variable Costs. Additional costs incurred when unit pro-duction increases. Variable costs per unit usually are as-sumed not to vary with volume.
Variance. The difference between budgeted and actualcosts or standard and actual costs. May relate to price orquantity for labor, materials, or overhead.
Wage Variance. The actual wage per hour minus the stan-dard wage multiplied by the actual number of hours worked.
Waste Costs. The costs of defective units in manufacturing.
Weighted-Average Cost. A per-unit product cost deter-mined by taking the weighted average of the cost of allunits in inventory.
Zero-Based Budgeting. A system in which each bud-geted line item must be justified and reviewed in totaleach year. That is, each year the budget for each line itemis set to zero and the total has to be justified to seniormanagement before the budget is approved.
692 Glossary
zim36725_glos_684-692.qxd 12/11/09 10:10 AM Page 692

Index
693
Page numbers followed by n indicate notes.
ABC. See Activity-based costing (ABC)ABM. SeeActivity-based management (ABM)Absorption cost system, 409–553
ABC, contrasted, 513–516allocating overhead to jobs, 416–426cost flows through T-accounts, 413–415criticisms, 468–553defined, 410demand shifts and pricing, 439–441expected/normal volume, 423–425flexible budget, 420–421inaccurate product costs, 502–506incentive to overproduce, 470–473job order costing, 410, 411–413over/underabsorbed overhead, 417–420overhead rate, 416–417permanent vs. temporary volume
change, 427–428plantwide vs. multiple overhead rates,
428–432process costing, 411, 432, 433–439salient facts, 433types, 410unit costs, 481–483
Academic applicationadverse selection/moral hazard, 141alternative models of behavior, 137cost/profit/investment centers, 176earnings management, 156fixed cost/opportunity cost, 101transfer pricing, 192
Account classification, 50Accounting depreciation, 26–27,
107–108, 353Accounting rate of return, 109–111Activities, 506Activity-based costing (ABC), 506–527
absorption costing, contrasted, 513–516accuracy, 518advantages, 518, 527AT&T, 508benefits/costs, 519–521cost driver, 507costs, not benefits, 521–523decision management/control, 525GIGO, 52119th century example, 523origins, 523problems, 524reasons for, 517–519
time-driven ABC, 525types of costs, 507use of, 524
Activity-based management (ABM), 519Activity measures, 33Actual volume, 593–596Acxiom, 518Adam, E., 671nAdkin, T., 525Advance pricing agreement (APA), 188Adverse selection, 141Agency cost, 138, 140, 141Agency problem, 138, 139Agent, 138Agilent Technologies, 521Akaka, Daniel, 150Alchian, A., 9n, 137n, 640nAllied Van Lines, 159Allocating costs. See Cost allocationAllocating overhead to jobs, 416–426Allocation base, 304Allowed volume, 593Allstate, 644Alternative models of behavior, 137Ames, M., 626Amoia, B., 359Anandarjan, A., 186nAnderson, S., 507n, 524nAnnual performance trap, 248Annuity, 97–98Ansari, S., 560, 561APA, 188Apple Computer, 142Applications. See Academic application;
Historical application; Managerialapplication
Appraisal costs, 637Arendt, C., 522Armitage, H., 672nAspirin, 307Assembly process, 410Asset structure, 632Astley, M., 251Atkinson, A., 305n, 672nATM, 631Atsugi Motor Parts, 576AT&T, 180, 508, 644Austin, J., 156Automated teller machine (ATM), 631Average cost, 29
Bakel, R., 331Baker, G., 183n
Balanced scorecard, 644–650criticisms, 647–650customer perspective, 645example (insurance company), 646financial perspectives, 645innovation and learning perspective, 646internal business process perspective, 646Philips Electronics, 647
Ball, R., 146n, 353nBank of America, 250Bank of Montreal, 644Banker, R., 634n, 671nBarnard, C., 137nBastian, R., 152Batch-level cost, 507, 508Batch manufacturing, 410Bausch & Lomb, 186Beer, M., 639nBell, J., 560, 561Benchmarking, 9Best Buy, 180, 244Bill of materials, 557Black belts, 643Blanchard, G., 306nBonus, 156Book. See TextbookBorrus, A., 138Bottom-up budget, 245Bowen, R., 5nBrady, D., 486Brand name capital, 176, 631Break-even point, 35Brickley, J., 136n, 139, 171n, 630n, 648nBrinker, B., 642British Rail, 371Browning, L., 138Browser-based budgeting software, 245Bruns, W., 149Budget, 230Budget lapsing, 253Budget ratcheting, 242–245Budgeted annual overhead, 420, 421Budgeted overhead rate, 421Budgeted volume, 593Budgeting, 229–301
advantages, 258budget lapsing, 253budget ratcheting, 242–245country club, 231–235criticisms, 246, 248decision management vs. decision
control, 241–249flexible overhead budget, 596–597, 604
zim36725_index_693-704.qxd 12/11/09 10:12 AM Page 693

694 Index
Budgeting (continued )functions, 231GE, 231global economic crisis, 256illustration/example, 259–268incremental budgeting vs. ZBB, 257–258large corporation, 238–241line-item budget, 252–253Microsoft, 247new approaches, 246–249participative budgeting, 245–246private university, 235–238rolling budget, 251, 252short-run vs. long-run budgets, 250–252static vs. flexible budget, 253–257summary/recap, 258–259
Bureaucratic rules, 145Burnham Holdings, 605Busco, C., 231, 239Business strategy, 630–633Buttross, T., 561By-product, 371
Calabro, L., 30Call center operations, 184Calvasina, E., 641nCalvasina, G., 641nCalvasina, R., 641nCAM, 577Capacity costs, 353Capacity-sustaining cost, 507–508Capital budgeting, 100–115
accounting rate of return, 109–111defined, 90depreciation tax shield, 107–108discount cash flows, not accounting
earnings, 102–103financing costs, 103–104inflation, 105–106IRR, 111–114MBA degree, 100–101methods used in practice, 114–115opportunity costs, 103payback, 109risk, 104–105video rental store, 101–102working capital requirements, 103
Carnegie, Andrew, 13, 413Carroll, P., 354Carter, Jimmy, 258CASB, 309Cash-flow return on investment, 180Catalog companies, 521Catalyst Paper, 607Caterpillar, 152, 643Cavalluzo, K., 310Centralization-decentralization
question, 630CEO, 138, 147, 153CFO, 10–12
Champy, J., 150nChandler, A., 13n, 49, 144, 153, 177,
413, 511Chang, J., 164Changing market conditions, 633Charles Machine Works, 574Chase, B., 166Checkout clerks, 14Cheung, S., 146nChicago White Sox, 238Chickens, 366–367Chief executive officer (CEO), 138, 147, 153Chief financial officer (CFO), 10–12China, 632, 651Chow, C., 306n, 558nChristie, A, 7n, 176, 235, 252nCisco, 251Citicorp, 644Clark, J., 7, 51n, 421Clary, D., 642nCline, T., 91Clinton, B., 349Clopay, 349Coal, 144Coase, Ronald, 23, 24n, 143, 192nCoca-Cola, 180Commitment device, 353Common cost, 304, 365Compensation plan, 473Compounding compound interest, 93Computer-aided manufacturing (CAM), 577Concept questions, solutions, 674–683Conexant Systems, 245Conflict of interest, 3Congestion cost, 604Constraints, 136Continental Teves, 561Continuous flow processing lines, 410Contribution margin, 35, 37Control, 3n, 12Control system, 3Controllability principle, 183–185Controllable cost, 183Controllable measures, 183Controller, 4, 10–12Conversion cost, 47Cooper, R., 502nCooperation, 573Corbett, T., 481Corporate jet pilots, 140Cost
agency, 138, 140, 141appraisal, 637average, 29batch-level, 507capacity-sustaining, 507common, 304congestion, 604controllable, 183conversion, 47
defined, 23direct, 47external failure, 638fixed, 28historical, 24, 555indirect, 47, 304influence, 145–146internal failure, 638joint, 364–372marginal, 28, 32, 318mixed, 33opportunity. See Opportunity costperiod, 46prevention, 637pricing decision, and, 51–56product, 46product-level, 507quality, 637–638semivariable, 33setup, 34–35standard, 555step, 32–33sunk, 25target, 561total, 32unit, 481–483unit-level, 507variable, 31, 32
Cost Accounting Standards Board (CASB), 309
Cost allocation, 302–408capacity costs, 353chickens, 366–367cost-based reimbursement, 309–311death spiral, 348–352decision making and control, 311,
371–372defined, 303direct allocation method, 355–356external reporting/taxes, 308hospitals, 306insulating/noninsulating, 319–322joint costs, 364–372manufacturing organizations, 305–306net realizable value (NRV), 367–369pervasiveness, 304reciprocal allocation method, 362–364,
374–376segment reporting, 372–373service department costs, 353–364step-down allocation method, 357–359steps in process, 304synonyms, 304tax system, as, 312–313taxing an externality, 313–319transfer pricing, 359–362universities, 306–308
Cost apportionment, 304Cost assignment, 304Cost-based reimbursement, 309–311
zim36725_index_693-704.qxd 12/11/09 10:12 AM Page 694
Index 695
Cost center, 171–174Cost/costing system
absorption. See Absorption cost systemdesign/use, 4–7direct costing, 474job order costing, 410, 411–413kaizen costing, 562process costing, 411, 432, 433–439standard costing. See Standard costingtarget costing, 561–562variable costing, 474–481
Cost distribution, 304Cost driver, 33, 431Cost estimation, 50Cost flows through T-accounts, 413–415Cost object, 303Cost of capital, 178nCost-plus pricing, 54–56Cost pool, 428Cost structure by industry, 418Cost-volume-profit analysis
break-even point, 35calculations, 36–40copier example, 35limitations, 40multiple products, 40–42operating leverage, 42–43
Costing system. See Cost/costing systemCountry club, 231–235Crawford, R., 640nCreamer, D., 671nCrude oil distillation, 405Cucuzza, T., 524nCuratola, A., 186nCustomer base, 632Customer intimacy, 644Customer operating partnerships, 428Customer satisfaction, 648Customer-sustaining cost, 508
Daihatsu, 562Dallas, J., 626Datar, S., 431n, 671nDavis, A., 91Day, C., 184DCF analysis, 104De Zoysa, A., 576nDeath spiral, 348–352Debasing the firm’s reputation, 176Decentralization-centralization
question, 630Decision control, 151, 242Decision control vs. decision management,
150–152, 241–249Decision initiation, 151Decision making and control, 311, 371–372Decision management, 151, 242Decision management vs. decision control,
150–152, 241–249Decision rights, 14, 142
Decision rights partitioning, 629–630Dedicated flow lines, 639Definitions. See TerminologyDell Computer, 28, 644Demand shifts and pricing, 439–441Demsetz, H., 137nDennis, A., 238Denominator volume, 593Department of Veteran Affairs (VA), 150Depreciation, 26–27, 107–108, 353Depreciation tax shield, 108Desert Storm mail deliveries, 159Desheh, E., 194Dilley, S., 544nDirect allocation method, 355–356Direct cost, 47Direct labor variance, 563–567Direct materials variance, 567–570Directv, 180Discounted cash flow (DCF) analysis, 104Discounting, 96Dohm, M., 331Double-declining-balance depreciation, 108Drake, R., 329Drucker, Peter F., 523DuPont’s ROI method, 177Durfee, D., 244Duriron Pumps, 431
E-mail, 633E-procurement, 570E-sourcing, 570Earned volume, 593Earnings management, 156, 157Eccles, R., 197nEconomic Darwinism, 9, 10, 154Economic profit, 180Economic value added (EVA®), 180–183EDI, 640Education, 314Edwards, C., 175Edwards, J., 577nEfficiency variance, 563, 564, 599,
600, 602Eikenes, B., 369Eisenhower, Dwight D., 230Electronic data interchange (EDI), 640Ellis, Steve, 150Ellram, L., 562Embezzlement, 12Empire building, 138Employee, 138Employee empowerment, 142Employee theft, 12Encumbrance accounting, 253Engine boring example, 593–604Epstein, M., 182EVA®. See Economic value addedEvaluating investment decisions.
See Capital budgeting
Evolution of management accounting,13–14
Excess capacity, 27Executive compensation, 155Expected volume, 423–425, 593External failure costs, 638Externality, 313–315, 572
Fama, E., 141n, 151nFASB, 5Federal Reserve banks, 310Fells, J., 475FIAMA, 481Fiber optics, 633FIFO, 414Financial Accounting Standards Board
(FASB), 5Fink, R., 188Firm, 136, 143, 144Firm value, 648First-in, first-out (FIFO), 414Fisher Body, 640Fixed cost, 28Flexible budget, 253–257, 420–421Flexible overhead budget, 596–597, 604Florida Power & Light, 638Ford Motor Company, 643Foster, G., 205, 517nFree-rider problem, 137, 234nFrieswick, K., 250Frigo, M., 231, 239Full-cost transfer prices, 196, 198Future value, 93–94Future value tables, 133–134
Gaffney, K., 607Gahremani, Y., 570Gaming performance evaluation
systems, 147Gao, Z., 638nGarcke, E., 475Garner, P., 9, 13n, 308, 419Gartrell, K., 19Gaver, J., 156, 630nGaver, K., 156, 630nGeier, R., 561General Electric, 155, 231General Motors, 303, 640Georgia Pacific, 182Gibb, G., 523Giovannoni, E., 231, 239Gladkikh, V., 607GlaxoSmithKline, 188Glossary, 684–692Goal incongruence, 141Goetz, B., 469n, 523nGold, B., 671nGong-fen, 164Gonik, J., 242nGovindarajan, V., 551n
zim36725_index_693-704.qxd 12/11/09 10:12 AM Page 695

696 Index
Graham, J., 114nGreenspan, Alan, 256Gross margin, 153Guidry, F., 156Gumbus, A., 647Gupta, M., 431n, 517n
H. J. Heinz, 243Haier, 148Hammer, M., 150nHansen, D., 20nHansen, S., 246nHarley Davidson, 642Harrell, Wilson, 160Harvey, C., 114nHeagy, C., 577nHealy, P., 156Henderson, D., 166Hendricks, J., 152Herath, S., 576nHershauer, J., 671nHirschey, M., 56nHistorical application
ABC system, 523allocation of overhead, 308difficult costs/different purposes, 7DuPont’s ROI method, 177firms vs. markets, 144incentive effects of cost allocations, 310over-/underabsorbed overhead, 419overhead, 419, 421railroad, 49, 511responsibility accounting, 172retailing, performance measures, 15316th-century cost records, 9variable costing, 475
Historical cost, 24, 555Historical overview, 13–14Hobdy, T., 508Holmstrom, B., 192Holsmstrom, B., 197nHolthausen, R., 156Holweg, M., 642nHome Depot, 644Horan, Scott, 12Horizon problem, 140Horngren, C., 205, 523nHospitals, 306, 359Hughes Communication, 256Hyatt, J., 428
IBM, 354Implementation, 152Inaccurate product costs, 502–506Incentive bonus, 136Incentive compensation reserve, 155Incentive to overproduce, 470–473, 477–478Income-decreasing accounting accruals, 157Incremental budgeting, 257Indirect cost, 47, 304
Indirect labor, 508Inflation, 105–106Influence cost, 145–146Information asymmetry, 138Information system, 2Initiation, 151Inktomi Corp., 45Innes, J., 524nInsteel, 518Insulating allocation, 320–321Integrative framework, 628–634Intel, 175, 644Interest
asset, 27inventory, 25
Interest rate fundamentalsannuity, 97–98future value, 93–94future value tables, 133–134multiple cash flows per year, 98–100perpetuity, 96–97present value, 94–95, 95–96present value tables, 131–132
Internal accounting systemchanging the system, 650–651characteristics, 4–5defined, 2performance measurement system, as, 149purposes, 3
Internal audit, 12Internal control system, 12Internal failure costs, 638Internal rate of return (IRR), 111–114Internal Revenue Service (IRS), 5International taxation, 185–187Inventory, 572Inventory holding costs, 472, 572Inventory turnover, 153Investment center, 172, 175–180Investment decisions. See Capital budgetingIp, G., 45IRR. See Internal rate of returnIRS. See Internal Revenue ServiceISO 9000, 636Ittner, C., 310, 524n, 650
Jacobs, F., 544nJensen, M., 136n, 137n, 138n, 142n, 147n,
151n, 171n, 183n, 248, 648n, 650nJIT, 473, 639–642Job order cost sheet, 412Job order costing, 410, 411–413Job shops, 410Jobs, Steve, 142Johnsen, D., 560Joint benefits, 373Joint costs, 364–372Joye, M., 176, 235, 252nJuran, Joseph, 643Just-in-time (JIT), 473, 639–642
Kaiser Aluminum, 180Kaizen, 240Kaizen costing, 562Kamphuis, R., 7nKaplan, Robert S., 19, 194, 244n, 502n,
507n, 524n, 525, 527n, 576n, 644n,650, 668n, 671n
Keating, S., 353nKendrick, J., 671nKerviel, Jerome, 139Key performance indicators, 644Kinney, M., 641Kirby, A., 242nKlein, B., 640nKnowledge, 142–143Knowledge creation, 632KPMG, 644Kraus, J., 672nKrebs, R., 626Kroll, K., 577Kuehn, K., 11n
Landry, S., 521Lanen, W., 524nLarcker, D., 156, 310, 524n, 650Large corporation, 238–241Last-in, first-out (LIFO), 414Law of one interest rate, 98Law of one price, 91Lawler, E., 147Lawson, R., 632, 651Lean manufacturing, 577Lean Six Sigma, 643Lee, J., 562Lee, W., 143Lehn, K., 7nLeone, A., 156, 243nLewis, C., 331Libby, T., 241n, 242n, 245LIFO, 414Liker, J., 240Limiting discretion, 145Lin, T., 148, 638nLincoln Electric, 148Lindsay, M., 241n, 242n, 245Line-item budget, 252–253Linear approximations, 31–32Linquist, T., 521L.L. Bean, 521Long-run average volume, 423–425Long-run budget, 250–252Loose standards, 559Lyons, B., 647
Machine setups, 34–35Mackey, J., 574Magee, R., 293Magnetic resonance imaging
(MRI), 324Maloney, M., 502n
zim36725_index_693-704.qxd 12/11/09 10:12 AM Page 696

Index 697
Management accountant, 10–12Manager, 138Managerial application
ABC system, 522, 525, 526Acxiom, 518Agilent Technologies, 521Apple Computer, 142aspirin, 307ATM, 631AT&T, 508balanced scorecard, 649–650banking, 631Best Buy, 244British Rail, 371budget/decision management and
control, 243budgeting and global economic
crisis, 256budgeting continuous improvements,
240budgets are bad for business, 248call center operations, 184Caterpillar, 152CFO, 11, 12Chicago White Sox, 238China, 632, 651Clopay, 349controllable measures, 183corporate jet pilots, 140cost structure by industry, 418dual transfer pricing systems, 187Duriron Pumps, 431e-sourcing, 570externalities, 315Federal Reserve banks, 310five-year budget, 250gaming performance evaluation
systems, 147GE, 155, 231Georgia Pacific, 182Haier, 148Harley Davidson, 642hospitals, 359IBM, 354improving, 245Insteel, 518Intel, 175ISO 9000, 636JIT, 641kaizen costing, 562lean accounting, 577legs of stool out of balance, 150Lincoln Electric, 148lost spaceship, 6managers’ view on accounting
systems, 8MBA degree, 91MGM, 30Microsoft, 247Nestlé Waters Division, 239
operating leverage, 45overhead allocations, 420overhead variances, 605Parker Brass, 560performance measures, 149Philips Electronics, 647reviewing budgets, 235Rockwell International, 503rolling budget, 251Saia, 636Sarbanes-Oxley, 26sawmills, 369simplifying operations, 526Skoda, 143Société Générale, 139standard costing/externalities, 574step-down allocation, 359target costing, 560, 561taxicabs, 145Teva, 194throughput accounting, 481time-driven ABC, 525transfer pricing and taxes, 188Universal Corporation, 179U.S. Steel, 413VA, 150variances, 605, 607Women’s Professional Soccer
(WPS), 411Xerox, 631
Manufacturing organizations, 305–306Manufacturing process, 410Manzoni, J., 246nMarch, J., 573nMargin, 56Marginal batting average, 318nMarginal cost, 28, 32, 318Marginal revenue, 36Market-based transfer prices, 191–193, 198Market conditions, 633Market power, 52Marketing, 242Marketing variance, 605–608Markets vs. firms, 143–145Marmot-and-bear parable, 8–9Marshall, R., 544nMaslow, A., 137Materials quantity variance, 567, 569MBA degree, 91McCartney, S., 140McCormick, R., 502nMcDonald’s, 644McDonnell Douglas, 638McFadden, D., 307McGee, J., 8nMcGhee, M., 186nMcKinnon, S., 149McKinsey, James O., 172, 230, 231n,
249, 310Measuring performance, 147
Meckling, W., 136n, 137n, 138n, 142n,147n, 171n
Medicare Cost Report, 359Merchant, K., 3n, 183n, 184n, 246n, 520nMetLife, 570Metro-Goldwyn-Mayer (MGM), 30Meyer, M., 650MGM, 30Microsoft, 247Milliken, 577Mitchell, F., 524nMix variance, 606–608Mixed cost, 33Mobil, 644Monden, Y., 562Monetary rewards, 147Monitoring, 152Moral hazard, 141Morris, B., 642nMotion and time studies, 50Mowen, M., 20nMRI, 324Mucci, M., 331Muise, M., 359Multiple products, 373Multiple role of accounting systems, 5Murphy, K., 155n, 183nMutual monitoring, 573Myers, R., 251
NAFTA, 633Narayanan, V. K., 161n, 518Nath, R., 161nNeely, A., 183Negative externality, 314, 315Negotiated transfer prices, 196, 198Ness, J., 524nNestlé Waters Division, 239Net income, 176Net present value, 96Net present value (NPV) analysis, 109Net realizable value (NRV), 367–369Nicholson, J., 419Nixon, Richard, 230nNominal interest rate, 105Non-value-added time, 639Noninsulating allocation, 320–321Nonlinear cost curve, 29Nonmonetary rewards, 147Nonprofit institutions, 236nNoori, H., 143Noreen, E., 5n, 306nNormal volume, 352n, 423–425, 593Nortel, 245North American Free Trade Agreement
(NAFTA), 633Norton, D., 644n, 650NPV analysis. See Net present value (NPV)
analysisNRV. See Net realizable value
zim36725_index_693-704.qxd 12/11/09 10:12 AM Page 697

698 Index
Nyberg, A., 26Nyrud, A., 369
Objective performance measures, 147O’Brien, D., 526O’Connor, N., 159Oil refinery, 405–408Olsen, J., 329“One Cost System Isn’t Enough”
(Kaplan), 19One-stop shopping, 521Operating leverage, 42–43, 45Operational excellence, 644Opportunity cost
accounting costs, compared, 45–49asset depreciation, 26–27capital, 90–93capital budgeting, 103characteristics, 24defined, 23excess capacity, 27fixed cost, 101interest on inventory, 25labor, 25materials, 24–25product line cannibalization, 28sunk cost, 25
Opportunity cost externalities, 314Opportunity set, 23Optimum quality cost, 638Organization chart, 11Organizational architecture, 14–15, 146–157
accounting’s role, 152–157business strategy, 631decision management vs. decision
control, 150–152defined, 147three-legged stool, 149, 629–630
O’Sullivan, K., 411Otley, D., 246nOutline of text, 18–19Over/underabsorbed overhead, 417–420Overhead, 47Overhead, allocation to jobs, 416–426Overhead absorbed, 598–599Overhead efficiency variance, 599, 600, 602Overhead rate, 416–417, 421, 597–598Overhead spending variance, 599–600, 602Overhead T-account, 413Overhead variance, 596–604
efficiency variance, 599, 600, 602flexible overhead budget, 596–597, 604graphical analysis, 602–603overhead absorbed, 598–599overhead rate, 597–598spending variance, 599–600, 602volume variance, 599, 600–602
Overhead volume variance, 599, 600–602Overproduction incentive, 470–473,
477–478
Paik, Y., 242nPappas, J., 56nParker Brass, 560Participative budgeting, 245–246Partitioning decision rights, 147Pattison, D., 522Patton, Michael, 187Payback, 109Perdue, W., 626Perfect competition, 96Performance evaluation, 147, 630Performance measurement system, 149Performance measures, 15, 147, 149Performance reward system, 630Period cost, 46Permanent vs. temporary volume change,
427–428Perpetuity, 96–97Perpetuity formula, 96Perrow, C., 137, 157n, 158nPhilips Electronics, 647Plant controller, 11Plantwide vs. multiple overhead rates,
428–432Pollack, A., 6Pollution, 314Porter, G., 634nPositive externality, 314, 315PowerBook, 142Practical capacity, 352Pratt & Whitney, 161Present value, 92, 94–95, 95–96Present value tables, 131–132Prevention costs, 637Price taker, 51–52Price variance, 567–569, 605, 606Pricing decision, 51–56Principal-agent problem, 138, 139Principal Financial Group, 256Private university, 235–238Process costing, 411, 432, 433–439Process-level cost, 508Procter & Gamble, 502Product cost, 46Product leadership, 644Product-level cost, 507, 508Product line cannibalization, 28Profit center, 172, 174–175Profit-maximizing pricing, 55
Quality, 635–639Quality cost, 637–638Quantity variance, 567, 569, 605, 606
Railroad, 49, 144, 511Rakes, H., 577nRatchet effect, 242Ratcheting up of budgets, 242–245Ratification, 151Real interest rate, 105
Reason, T., 245, 247Reciprocal allocation method, 362–364,
374–376Regulatory agencies, 5Reichelstein, S., 242nResidual income, 178–180Responsibility accounting, 171–185
controllability principle, 183–185cost center, 171–174defined, 171EVA, 180–183investment center, 172, 175–180profit center, 172, 174–175
Return on investment (ROI), 109–111,177–178
Rewarding performance, 147Rhode, J., 147Riccaboni, A., 231, 239Ricker, J., 626Rights systems, 142Risk, 104–105Robinson-Patman Act, 17Rock, S., 156, 243nRockwell International, 503ROI, 109-111, 177–178Rolling budget, 251, 252Ross, S., 138nRouting sheet, 557Ruch, W., 671nRudisill, F., 642nRyan, V., 12, 256
Saia, 636Sakurai, M., 527n, 576nSales variance, 606–608Salespeople, 242Sansing, R., 408Sarbanes-Oxley Act, 12, 26Sarkar, R., 518Satisficing, 573Sawmills, 369Scapens, R., 231, 239Schinwald, J., 642Schmelze, G., 561Schroeder, R., 634nSecurities and Exchange Commission
(SEC), 5Segment reporting, 372–373Self-interested behavior, 136Semivariable cost, 33Sen, P., 242nService department costs, 353–364Setup cost, 34–35Sexton, T., 152Shank, J., 551nShareholder value added, 180Sharman, P., 508, 524nShields, M., 246n, 520nShort-run budget, 250–252Shutdown decision, 441
zim36725_index_693-704.qxd 12/11/09 10:12 AM Page 698

Index 699
Simon, H., 138n, 573nSinclair, D., 524nSingle unit-based allocation system, 513Six Sigma, 642–643Skoda, 143Sloan, R., 156Smith, Adam, 145Smith, C., 136n, 139, 171n, 630n, 648nSmith, K., 8Société Générale, 139Solomons, D., 180n, 189nSolutions to concept questions, 674–683Sony, 644Sopariwala, P., 560Span of control, 157Spend-analysis software, 570Spend management, 570Spending variance, 599–600, 602Split-off point, 366Springsteel, I., 187Standard cost, 555Standard cost sheet, 556Standard cost variance. See VarianceStandard costing, 555–562
biasing standard cost downward, 559costs of, 576–578definitions, 555loose/tight standards, 559manufacturing, 557reasons for, 556–557risk reduction, 571setting/revising standards, 557–561target costing, 561–562use of, 576–578variance. See Variance
Standard labor cost, 558Standard material cost, 557Standard volume, 593–595Staple products, 56Static budget, 253–257Step cost, 32–33Step-down allocation method, 357–359Stern, R., 331Stewart, B., 180n, 273Stock turn, 153Straight-line approximation of total cost, 32Straight-line depreciation, 26Strategic planning, 250Subjective performance measures, 147Sullivan, A., 8Sunder, S., 3n, 253n, 311n, 353nSunk cost, 25Suskind, R., 31Sweeney, A., 244nSwenson, D., 560, 561Synergy, 373
T-accounts, 413Taleb, N., 256Target cost, 561
Target costing, 560, 561–562Tatikonda, L., 526Tatikonda, R., 526Tax laws, 5nTaxes, 107Taxicabs, 145Team production, 137Technological change, 633Telegraph, 144Temporary vs. permanent volume change,
427–428Tenneco, 644Terminology
benchmarking, 9economic Darwinism, 9glossary, 684–692
Tesoro, J., 329Teva, 194Textbook
applications oriented, 3economic perspective, 4overview, 18–19
Textron, 643Theory X-Theory Y, 161Thomas, M., 574Thompson, C., 308Thompson, J., 508Thomson, J., 642nThree-legged stool, 149Throughput accounting, 481Throughput time, 639Tight standards, 559Time-driven ABC, 525Time studies, 50Time Warner, 250Tirole, J., 192, 197nTop-down budget, 245Total business return, 180Total cost, 32Total quality management (TQM), 635–639Toyota, 240, 521, 562, 576, 643TQM, 635–639Transfer price, 185Transfer pricing, 185–198
asymmetric information, 189cost allocation, 359–362economics of, 187–191full-cost transfer prices, 196, 198international taxation, 185–187market-based transfer prices,
191–193, 198negotiated transfer prices, 196, 198perfect information, 188–189recap/summary, 197–198reorganization, 197, 198taxes, 188variable-cost transfer prices,
193–194, 198Treasury, 10Tredwell, Jay, 187
Tunes, T., 369Turk, W., 642
UMC, 46Under/overabsorbed overhead, 417–420Unit costs, 481–483Unit-level cost, 507Unit manufacturing cost (UMC), 46United Airlines, 28Universal Corporation, 179Universities, 306–308U.S. Steel, 413
VA, 150van der Merwe, A., 642nVan der Stede, W., 246nVancil, R., 7nVariable cost, 31, 32Variable-cost transfer prices, 193–194, 198Variable costing, 474–481
background, 474defined, 474fixed costs, 478–479illustration, 474–47519th century example, 475opportunity cost of capacity, 480–481overproduction incentive, 477–478problems, 478–481
Variancedefined, 555direct labor, 563–567direct materials, 567–570disposition of, 574–576efficiency, 563, 564, 599, 600, 602incentive effects, 571–574large, 566marketing, 605–608mix, 606–608overhead, 596–604price, 567–569, 605–606spending, 599–600, 602volume, 599–600, 602wage, 563, 564
Vatter, W., 483nVice president, 138Volume measures, 593–596Volume variance, 599, 600–602Voluntary financial disclosure, 159Vortec, 15–18
Wage variance, 563, 564Wallace, J., 182nWang, G., 638nWasted time, 639Watts, R., 6n, 129, 143n, 154n, 176, 192n,
235, 252n, 630nWeb-based budgeting, 245Webb, R., 607Weber, S., 349Weiss, D., 194
zim36725_index_693-704.qxd 12/11/09 10:12 AM Page 699

700 Index
Weitzman, M., 242nWelch, Jack, 138Wempe, W., 641Werin, L., 136n, 142nWhirlpool Corp., 180“Why Xerox Is Struggling” (Brady), 486Wijkander, H., 136n, 142nWilliamson, O., 138n
Women’s Professional Soccer(WPS), 411
Wood, L., 521Woodson, B., 166Work sampling, 50Worthy, F., 503
Xerox, 238–239, 486, 631, 633
Yahoo!, 45Young, S., 182, 246n
Zero-based budgeting (ZBB), 257–258Zimmerman, J., 6n, 136n, 139, 154n, 171n,
312n, 353n, 630n, 648nZytec, 520
zim36725_index_693-704.qxd 12/11/09 10:12 AM Page 700