Access to elective surgery in New Zealand: considering equity and the private and public mix
14
Access to elective surgery in New Zealand: considering equity and the private and public mix Sarah Derrett 1 * , Tui H. Bevin 2 , Peter Herbison 3 and Charlotte Paul 3 1 Injury Prevention Research Unit, Department of Preventive and Social Medicine, Dunedin School of Medicine, University of Otago, New Zealand 2 Ophthalmology Section, Dunedin School of Medicine, University of Otago, New Zealand 3 Department of Preventive and Social Medicine, Dunedin School of Medicine, University of Otago, New Zealand SUMMARY New Zealand has a two-tier health system with elective surgery provided by both publicly funded state hospitals and by private hospitals. Issues of equity should be considered across such systems—where the better off can access surgery in private hospitals regardless of relative clinical need. This study evaluated equity of provision of surgery after the introduction of a prioritization system to manage access. Data for people receiving publicly funded elective joint replacement, prostatectomy or cataract surgery between 2000 and 2005 were obtained, as well as most recent data for people receiving privately funded surgery (2001 and 2002). Denominators were derived from the 2001 census for the population of District Health Board regions. NZDep2001, a small-area deprivation index, was used to identify people in poorest deciles. Despite the introduction of a prioritization system aimed at increased equity and fairness, the provision of elective surgery remains inequitable geographically. High private provision was not associated with better access to publicly funded surgery. Moreover, the argument that private provision for the well off reduces the burden on the public system allowing better access for the poor was not supported. Consequences of two-tier health systems, as in New Zealand, need more investigation and public discussion. Copyright # 2009 John Wiley & Sons, Ltd. key words: equity; socioeconomic; geographical; elective surgery; access INTRODUCTION In New Zealand, there is a two-tier health system with elective surgery provided by both state hospitals and private hospitals (Flood et al., 2002). New Zealanders can receive publicly funded surgery at state (public) hospitals if they are determined to have need sufficient to meet prioritization thresholds governing access to surgery. Alternatively, people with sufficient resources can privately purchase their elective surgery at non-state private hospitals or clinics by out-of-pocket payment or through international journal of health planning and management Int J Health Plann Mgmt 2009; 24: 147–160. Published online 25 March 2009 in Wiley InterScience (www.interscience.wiley.com) DOI: 10.1002/hpm.978 * Correspondence to: S. Derrett, IPRU, Department of Preventive and Social Medicine, Dunedin School of Medicine,UniversityofOtago,POBox913,Dunedin,NewZealand. E-mail: [email protected] Copyright # 2009 John Wiley & Sons, Ltd.
-
Upload
independent -
Category
Documents
-
view
2 -
download
0
Transcript of Access to elective surgery in New Zealand: considering equity and the private and public mix

Access to elective surgery in New Zealand:considering equity and the private andpublic mix
Sarah Derrett1*, Tui H. Bevin2, Peter Herbison3 and Charlotte Paul3
1Injury Prevention Research Unit, Department of Preventive and Social Medicine,Dunedin School of Medicine, University of Otago, New Zealand2Ophthalmology Section, Dunedin School of Medicine, University of Otago, New Zealand3Department of Preventive and Social Medicine, Dunedin School of Medicine,University of Otago, New Zealand
SUMMARY
New Zealand has a two-tier health system with elective surgery provided by both publiclyfunded state hospitals and by private hospitals. Issues of equity should be considered acrosssuch systems—where the better off can access surgery in private hospitals regardless ofrelative clinical need. This study evaluated equity of provision of surgery after the introductionof a prioritization system to manage access. Data for people receiving publicly funded electivejoint replacement, prostatectomy or cataract surgery between 2000 and 2005 were obtained, aswell as most recent data for people receiving privately funded surgery (2001 and 2002).Denominators were derived from the 2001 census for the population of District Health Boardregions. NZDep2001, a small-area deprivation index, was used to identify people in poorestdeciles. Despite the introduction of a prioritization system aimed at increased equity andfairness, the provision of elective surgery remains inequitable geographically. High privateprovision was not associated with better access to publicly funded surgery. Moreover, theargument that private provision for the well off reduces the burden on the public systemallowing better access for the poor was not supported. Consequences of two-tier healthsystems, as in New Zealand, needmore investigation and public discussion. Copyright# 2009John Wiley & Sons, Ltd.
key words: equity; socioeconomic; geographical; elective surgery; access
INTRODUCTION
In New Zealand, there is a two-tier health system with elective surgery provided by
both state hospitals and private hospitals (Flood et al., 2002). New Zealanders can
receive publicly funded surgery at state (public) hospitals if they are determined to
have need sufficient to meet prioritization thresholds governing access to surgery.
Alternatively, people with sufficient resources can privately purchase their elective
surgery at non-state private hospitals or clinics by out-of-pocket payment or through
international journal of health planning and management
Int J Health Plann Mgmt 2009; 24: 147–160.
Published online 25 March 2009 in Wiley InterScience
(www.interscience.wiley.com) DOI: 10.1002/hpm.978
*Correspondence to: S. Derrett, IPRU,Department of Preventive and SocialMedicine,Dunedin School ofMedicine,UniversityofOtago,POBox913,Dunedin,NewZealand. E-mail: [email protected]
Copyright # 2009 John Wiley & Sons, Ltd.

private medical insurance (Ministry of Health, 2006). Provision of surgery at private
hospitals tends to have shorter waiting times, and is not determined by the
prioritization thresholds present in the public system. It is commonly believed that
increased availability of privately funded services relieves demand placed on
publicly funded services, thereby freeing up capacity to treat a greater number of
people in need (Duckett, 2005; Canadian Health Services Research Foundation,
2003). Commentators in various countries have long been concerned to explore
empirically issues of equity of access to treatment in such parallel health systems—
where the better off can pay regardless of their relative clinical need (Fougere, 1974;
Blumberg, 2006; Barnett and Lauer, 2003; McLeod et al., 2004; van Doorslaer et al.,
2006).
Research has been undertaken in New Zealand and elsewhere considering overall
and specialty-wide hospital admissions in relation to socioeconomic and geographical
equity (Barnett and Lauer, 2003; Walker et al., 2006; Raymont, 2002; Pearce et al.,
2006; Ministry of Health, 2007). Yet to our knowledge, no one has published
information about the relationship between the public and private provision of specific
elective surgical procedures. This is important in light of New Zealand’s aim for an
equitable health system. Internationally, the management of elective surgery has
focused onmethods for prioritising access to treatment, fairness and waiting times. In
NewZealand, specific concerns were raised about variation between surgeons in their
implicit priority decisions about indications for publicly funded surgery, and patients
not having fair and equitable access to care (Fraser et al., 1993; Hadorn and Holmes,
1997). To help address such concerns a scoring, prioritization and booking systemwas
introduced to explicitly manage referral, assessment and access to publicly funded
elective surgery in the mid 1990s. The new systemwas intended to: develop a fair and
consistent means of defining priority, ensure patients with the greatest need and
potential to benefit received treatment first and provide nationally consistent access to
surgery (National Advisory Committee on Core Health and Disability Support
Services, 1995; Shipley, 1996; Feek, 2000; Anonymous, 2000).
Measures of provision of publicly funded surgery are reported by the New Zealand
health information service (NZHIS). These include the number of procedures,
volume of activity at specialist level (e.g. urology) and standardized (for age, sex and
social deprivation) discharge ratios for each of the 21 District Health Board (DHB)
regions. While these measures are informative, they have limitations in terms of
evaluating whether all New Zealanders really do have fair and equitable access to
elective surgery—either geographically or socioeconomically. Moreover, despite
increases in funding for elective surgery, it is not clear whether access has improved.
The aim of this study was to evaluate the equity of provision of elective surgery in
New Zealand since the establishment of the booking system. We examined four
commonly provided surgical procedures (total hip joint replacement and total knee
joint replacement combined—total joint replacement (TJR), prostatectomy and
cataract surgery) to: (1) identify changes in the rates of elective surgery for these
procedures over a 5 year period; (2) examine geographical variation in the provision
of publicly funded elective surgery; (3) explore the contribution of publicly and
privately funded elective surgery to equity and (4) explore access to elective surgery
provision according to socioeconomic status.
Copyright # 2009 John Wiley & Sons, Ltd. Int J Health Plann Mgmt 2009; 24: 147–160.
DOI: 10.1002/hpm
148 S. DERRETT ET AL.

METHODS
All data (unidentifiable) for people receiving publicly funded elective TJR,
prostatectomy and/or cataract surgery in New Zealand between 1 July 2000 and
30 June 2005 were provided from the National Minimum Data Set by NZHIS. Data
were also provided for people who received privately funded elective surgery
between 1 January 2000 and 31 December 2002; this being the most recent data set
available for private surgery.
Data included ICD-10 procedure codes for the specified surgeries, month and year
of surgery, admission codes, age at discharge, sex, New Zealand residency,
socioeconomic status according to NZDep2001 (a small-area deprivation index
based on nine variables related to material and social deprivation including income,
employment and transportation from the 2001 New Zealand Census; ordinal scale
with 1 being least deprived decile and 10 most deprived) (Salmond and Crampton,
2002), place of residence according to DHB region and classification of surgery
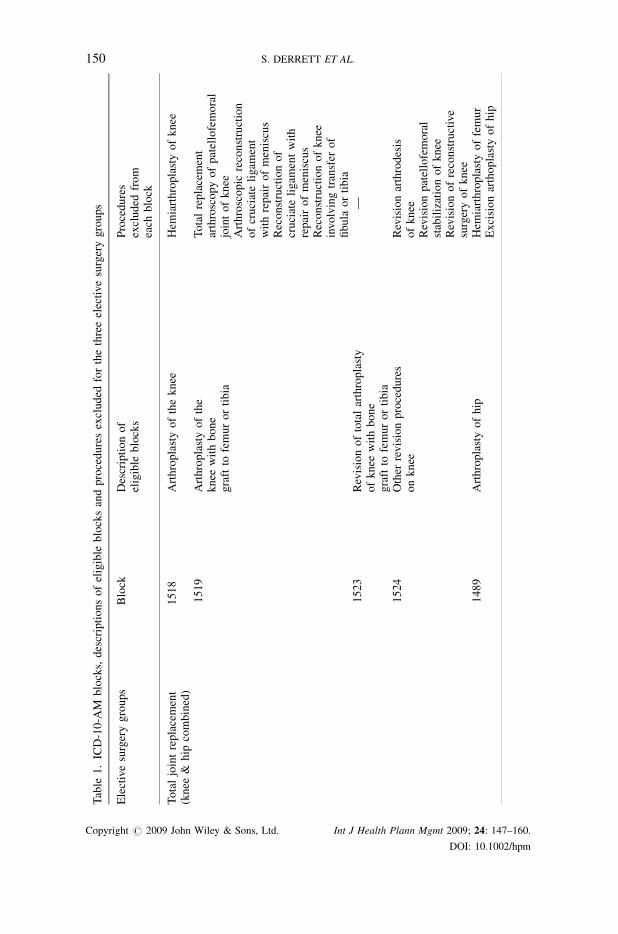
funding (private or public). Eligible ICD-10-AM (National Centre for Classification
in Health, 2002) procedure codes were advised by NZHIS in accordance with
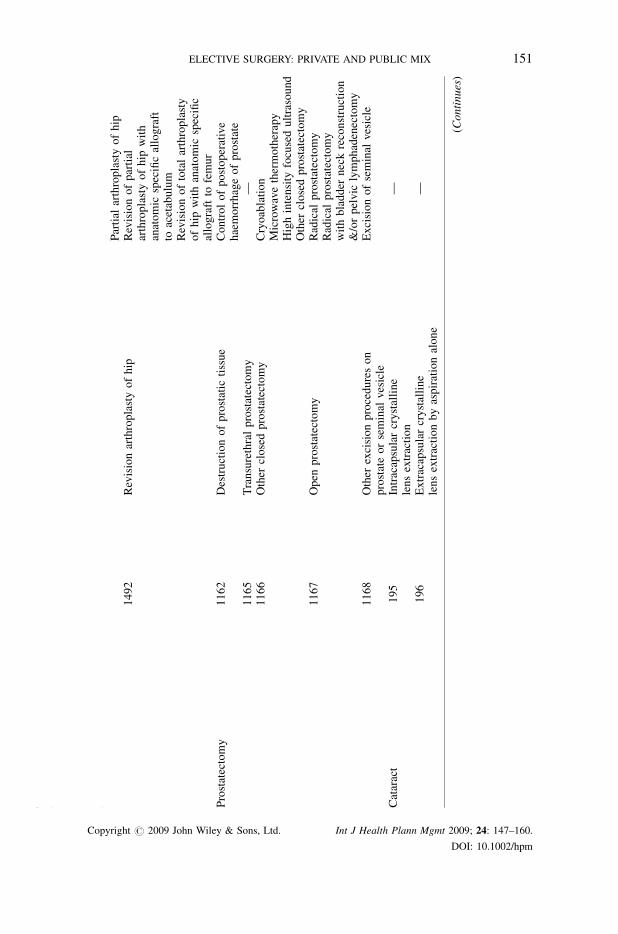
Ministry of Health definitions for the four surgery groups requested (Table 1).
Data from people having ‘acute’ or ‘arranged’ surgery (within seven days of the
decision to operate), people funded by the Accident Compensation Corporation (a
no-fault compensation insurance scheme for injury not funded by general taxation),
non-New Zealand residents and people of no stated sex, ethnicity or place of
residence with an associated DHB were excluded from the analysis in both the
publicly and privately funded surgery groups. Privately funded cataract surgery
reports were not analysed because private hospitals and clinics are not required to
report surgery discharges to NZHIS when patients have been in their care for less
than 3 h (New Zealand Health Information Service, 2003). Different practices
between public and private hospitals in this regard would invalidate comparisons.
Denominators were derived from census data for 2001 for the normally resident
population of each DHB region. Data were entered into SPSS (version 12) and
STATA (version 9) for analysis. Direct age-standardisation (in 5-year age groups)
was carried out using the standardization routine in STATA and using the 2001 New
Zealand census population as the standard. NZDep2001 was used to select people in
three deciles (8, 9 and 10—poorest deciles) to determine the numerator and
denominator to calculate their age-standardized rates of surgery. To examine the
relationship between publicly funded rates in these deciles and privately funded
surgery a correlation coefficient between the rates was calculated both before and
after removing data points that appeared to be obvious outliers.
RESULTS
There were 74 836 elective procedures included in the study. The average age of
people for TJR was 68 (standard deviation (sd) 11), for cataract it was 73 (sd 13) and
for prostate it was 71 (sd 9). Table 2 presents age-standardized rates for surgery over
Copyright # 2009 John Wiley & Sons, Ltd. Int J Health Plann Mgmt 2009; 24: 147–160.
DOI: 10.1002/hpm
ELECTIVE SURGERY: PRIVATE AND PUBLIC MIX 149
Table
1.ICD-10-A
Mblocks,descriptionsofeligible
blocksandproceduresexcluded
forthethreeelectivesurgerygroups
Electivesurgerygroups
Block
Descriptionof
eligible
blocks
Procedures
excluded
from
each
block
Totaljointreplacement
(knee
&hip
combined)
1518
Arthroplastyoftheknee
Hem
iarthroplastyofknee
1519
Arthroplastyofthe
knee
withbone
graftto
femurortibia
Totalreplacement
arthroscopyofpatellofemoral
jointofknee
Arthroscopic
reconstruction
ofcruciateligam
ent
withrepairofmeniscus
Reconstructionof
cruciateligam
entwith
repairofmeniscus
Reconstructionofknee
involvingtransfer
of
fibula
ortibia
1523
Revisionoftotalarthroplasty
ofknee
withbone
graftto
femurortibia
—
1524
Other
revisionprocedures
onknee
Revisionarthrodesis
ofknee
Revisionpatellofemoral
stabilizationofknee
Revisionofreconstructive
surgeryofknee
1489
Arthroplastyofhip
Hem
iarthroplastyoffemur
Excisionarthoplastyofhip
(Continues)
Copyright # 2009 John Wiley & Sons, Ltd. Int J Health Plann Mgmt 2009; 24: 147–160.
DOI: 10.1002/hpm
150 S. DERRETT ET AL.
Table
1.(Continued)
Electivesurgerygroups
Block
Descriptionof
eligible
blocks
Procedures
excluded
from
each
block
Partial
arthroplastyofhip
1492
Revisionarthroplastyofhip
Revisionofpartial
arthroplastyofhip
with
anatomic
specificallograft
toacetabulum
Revisionoftotalarthroplasty
ofhip
withanatomic
specific
allograftto
femur
Prostatectomy
1162
Destructionofprostatic
tissue
Controlofpostoperative
haemorrhageofprostate
1165
Transurethralprostatectomy
—1166
Other
closedprostatectomy
Cryoablation
Microwavethermotherapy
Highintensity
focusedultrasound
Other
closedprostatectomy
1167
Open
prostatectomy
Radical
prostatectomy
Radical
prostatectomy
withbladder
neckreconstruction
&/orpelvic
lymphadenectomy
1168
Other
excisionprocedureson
prostateorseminal
vesicle
Excisionofseminal
vesicle
Cataract
195
Intracapsularcrystalline
lensextraction
—
196
Extracapsularcrystalline
lensextractionbyaspirationalone
—
(Continues)
Copyright # 2009 John Wiley & Sons, Ltd. Int J Health Plann Mgmt 2009; 24: 147–160.
DOI: 10.1002/hpm
ELECTIVE SURGERY: PRIVATE AND PUBLIC MIX 151

Table
1.(Continued)
Electivesurgerygroups
Block
Descriptionof
eligible
blocks
Procedures
excluded
from
each
block
197
Extracapsularcrystallinelens
extractionbyphacoem
ulsification
—
198
Extracapsularcrystalline
lensextractionbymechanical
phacofragmentation
—
199
Other
extracapsular
crystallinelensextraction
—
200
Other
extractionofcrystallinelens
—201
Rem
oval
ofaftercataract
—202
Other
application,insertion
orremoval
proceduresonlens
—
Table
2.Age-standardized
ratesofpubliclyfunded
surgery(per
10000New
Zealandresidents)over
5years(July
2000–June2005)forelectivetotaljoint
replacement,prostatectomyandcataract
surgery
Publicly-funded
electivesurgery
July–Dec
2000
2001
2002
2003
2004
Jan–June2005
TJR
(n)
2612
5092
4665
4702
6060
3512
Standardised
rate
(95%
CI)
14.0
(13.5,14.5)
13.6
(13.3,14.0)
12.5
(12.1,12.8)
12.6
(12.2,12.9)
16.2
(15.8,16.6)
18.8
(18.2,19.4)
Prostate(n)
1102
1975
1916
1944
1935
1002
Standardised
rate
(95%
CI)
12.1
(11.4,12.8)
10.8
(10.4,11.3)
10.5
(10.0,11.0)
10.7
(10.2,11.1)
10.6
(10.1,11.1)
11.0
(10.3,11.7)
Cataract(n)
3879
8004
7589
7111
7752
3984
Standardised
rate
(95%
CI)
20.8
(20.1,21.4)
21.4
(21.0,21.9)
20.3
(19.9,20.8)
19.0
(18.6,19.5)
20.7
(20.3,21.2)
21.3
(20.7,22.0)
Copyright # 2009 John Wiley & Sons, Ltd. Int J Health Plann Mgmt 2009; 24: 147–160.
DOI: 10.1002/hpm
152 S. DERRETT ET AL.

the 5 year study period. The publicly funded rate for TJR increased between 2003
and 2004, otherwise rates did not increase over the 5 years.
Tables 3 and 4 show 2001-02 rates of publicly funded surgery and privately funded
surgery for TJR and prostatectomy respectively, according to the DHB region of
residence. Tables 3 and 4 also present the ratio of public to private provision for each
DHB. This was to investigate whether regions with lower public provision had higher
private provision (demonstrated by a lower ratio). DHBs were ordered according to the
rate of public provision (lowest to highest). Cataract surgery rates are not presented for
each of the DHB regions because privately funded rates were not reliably available.
However, the rate of publicly funded cataract surgery, for 2001 and 2002 combined,
ranged between a low of 14.6 cataract operations per 10 000 people residing in the
Canterbury DHB region to a high of 35.7 per 10 000 in Northland DHB.
In general, the DHB regions with the lowest public provision had the highest private
provision (demonstrated by a lower public/private ratio), for both TJR and
prostatectomy (Tables 3 and 4). There were exceptions: Mid-Central had a relatively
low provision of public prostatectomy and also a low provision of private
prostatectomy. A correlation between the rate of public provision and the ratio of
public to private for TJR weighted by the inverse of the variance of the estimate of the
rate was not significant if using data from all 21 DHBs (r¼ 0.38, p¼ 0.09). However, if
the 2 DHBs with a ratio above 15 were removed (Hawkes Bay and Whanganui) the
correlation was moderate and statistically significant (r¼ 0.74, p¼ 0.0003). Similarly,
the correlationwas not significant for prostatectomy (r¼ 0.29, p¼ 0.2), unless the DHB
with a ratio above 60 (Hawkes Bay) was removed, and the correlation was again
moderate and significant r¼ 0.74, p¼ 0.0002). Tables 3 and 4 also show the age-
standardized rates of people in the poorest three decile groups (NZDep2001 groups 8, 9
and 10) receiving publicly funded surgery in each of the DHB regions. Rates range
between 8.1/10 000 in Auckland and 39.5/10 000 on the West Coast for TJR; and
between 6.6/10 000 in Lakes District and 50.0/10 000 in Southland for prostatectomy.
Cataract surgery rates are not included, as they may not be reliably reported for the
private sector. However, for NZDep2001 groups 8, 9 and 10 there were 16.9 publicly
funded cataract operations per 10 000 people residing in the Southland DHB region to
50.0 per 10 000 in Northland DHB—a three-fold variation.
Figure 1 (a) and (b) illustrate the relationships between private surgery rates and
publicly funded surgery rates for the lowest three NZDep2001 groups (8, 9 and 10).
For TJR, access to publicly-funded surgery for the most deprived three
socioeconomic deciles was poorest in areas with high rates of privately funded
surgery (r¼�0.50, p¼ 0.021). For prostatectomy no trend was apparent in either
direction (r¼ 0.02, p¼ 0.938).
DISCUSSION AND CONCLUSIONS
There was no change in the provision of publicly funded surgery for 2000–2005,
except for TJR which increased significantly in between 2003 and 2004. This was in
a time when New Zealand’s public health expenditure was increasing (Ministry of
Health, 2008). There were wide geographical differences in provision of publicly
funded surgery and, in general, regions with lower rates of publicly funded surgery
Copyright # 2009 John Wiley & Sons, Ltd. Int J Health Plann Mgmt 2009; 24: 147–160.
DOI: 10.1002/hpm
ELECTIVE SURGERY: PRIVATE AND PUBLIC MIX 153

Table
3.Age-standardized
ratesoftotaljointreplacementsurgeryfor2001-02accordingto
DHBofdomicile,
ordered
accordingto
therate
ofpublic
provision,andshowingtheproportionofpeople
residingin
themost
deprived
areasreceivingpubliclyfunded
surgery
DistrictHealth
Boardarea
ofresidence
Agestandardized
rate
per
10000people
(95%
CI)
Ratio:
(public:private)
Agestandardized
rate
ofpublic
surgeryper
10,000
people
inNZDep2001
groups8,9,10(95%
CI)
Publicsurgery
Privatesurgery
Auckland
6.0
(5.4,6.6)
6.2
(5.6,6.8)
1.0
8.1
(6.8,9.4)
Waitemata
8.3
(7.6,8.9)
6.3
(5.8,6.9)
1.3
8.5
(6.9,10.0)
Counties
Manukau
8.7
(8.0,9.5)
4.2
(3.7,4.7)
2.1
12.1
(10.6,13.6)
Canterbury
10.9
(10.2,11.5)
11.4
(10.7,12.1)
1.0
12.4
(10.7,14.0)
South
Canterbury
12.5
(10.7,14.3)
7.8
(6.3,9.3)
1.6
12.5
(8.5,16.6)
Bay
ofPlenty
13.8
(12.7,14.9)
7.8
(6.9,8.6)
1.8
16.2
(14.2,18.2)
Taranaki
14.6
(13.1,16.2)
7.6
(6.5,8.7)
1.9
12.5
(10.1,15.0)
Waikato
14.7
(13.8,15.7)
4.0
(3.5,4.5)
3.7
19.5
(17.7,21.2)
Mid-Central
14.8
(13.5,16.1)
3.0
(2.5,3.6)
4.9
15.5
(13.3,17.6)
Hutt
14.8
(13.3,16.3)
4.1
(3.3,5.0)
3.6
19.0
(15.6,22.2)
Capital
andCoast
14.9
(13.8,16.1)
7.8
(7.0,8.7)
1.9
18.1
(15.2,21.1)
Lakes
District
15.1
(13.3,16.9)
6.4
(5.3,7.6)
2.4
22.6
(19.2,26.0)
Haw
kes
Bay
15.1
(13.8,16.5)
0.9
(0.5,1.2)
16.8
22.4
(19.6,25.2)
Southland
15.3
(13.6,16.9)
9.7
(8.4,11.0)
1.6
18.7
(15.0,22.3)
Northland
16.5
(15.1,17.9)
3.9
(3.3,4.6)
4.2
22.4
(20.0,24.7)
NelsonMarlborough
18.0
(16.5,19.5)
6.0
(5.1,6.9)
3.0
12.3
(9.2,15.4)
Otago
18.3
(17.0,19.6)
7.8
(6.9,8.7)
2.3
13.3
(10.9,15.8)
Whanganui
18.8
(16.6,21.0)
0.4
(0.1,0.7)
47.0
24.5
(20.8,28.2)
Tairawhiti
19.7
(16.7,22.6)
5.3
(3.8,6.9)
3.7
22.6
(18.5,26.8)
Wairarapa
23.2
(20.1,26.3)
8.1
(6.3,9.9)
2.9
18.6
(13.1,24.1)
WestCoast
27.8
(23.9,31.8)
2.5
(1.3,3.6)
11.1
39.5
(32.6,46.5)
National
rates
13.1
(12.8,13.3)
6.3
(6.1,6.4)
2.1
16.1
(15.6,16.6)
Copyright # 2009 John Wiley & Sons, Ltd. Int J Health Plann Mgmt 2009; 24: 147–160.
DOI: 10.1002/hpm
154 S. DERRETT ET AL.

Table
4.Age-standardized
ratesofprostatectomyfor2001-02accordingto
DHB
ofdomicile,
ordered
accordingto
therate
ofpublicprovision,and
showingtheproportionofpeople
residingin
themost
deprived
areasreceivingpubliclyfunded
surgery
DistrictHealthBoard
area
ofresidence
�Agestandardized
rate
per
10000people
(95%
confidence
interval)
Ratio
(public:private)
Agestandardized
rate
ofpublicsurgery
per
10,000people
inNZDep2001groups
8,9,10(95%
CI)
Publicsurgery
Privatesurgery
Lakes
District
4.5
(3.1,5.9)
4.3
(3.0,5.7)
1.0
6.6
(4.0,9.3)
Capital
andCoast
7.0
(5.8,8.1)
7.3
(6.1,8.4)
1.0
10.0
(6.8,13.2)
Counties
Manukau
8.4
(7.3,9.4)
8.9
(7.8,9.9)
0.9
11.9
(9.8,14.0)
Mid-Central
8.8
(7.3,10.2)
1.6
(1.0,2.2)
5.5
8.7
(6.5,11.0)
Auckland
9.0
(7.9,10.1)
9.8
(8.7,10.9)
0.9
11.2
(9.1,13.4)
Taranaki
9.6
(7.8,11.3)
2.5
(1.6,3.4)
3.8
8.9
(6.0,11.8)
Hutt
9.8
(8.0,11.6)
5.5
(4.2,6.9)
1.8
13.5
(9.4,17.6)
Canterbury
10.3
(9.3,11.2)
5.5
(4.8,6.2)
1.9
12.1
(9.7,14.4)
Waitemata
10.5
(9.5,11.5)
9.4
(8.4,10.3)
1.1
11.9
(9.2,14.6)
Tairawhiti
11.3
(8.1,14.5)
3.2
(1.5,4.9)
3.5
13.0
(8.5,17.5)
South
Canterbury
11.3
(8.8,13.7)
2.7
(1.4,3.9)
4.2
10.9
(5.7,16.1)
Waikato
11.9
(10.7,13.1)
3.0
(2.4,3.6)
4.0
11.9
(9.8,14.0)
Wairarapa
12.4
(9.2,15.6)
3.2
(1.6,4.9)
3.9
9.9
(4.0,15.7)
Haw
kes
Bay
12.8
(11.0,14.6)
0.2
(0.0,0.4)
64.0
18.3
(14.6,21.9)
Whanganui
12.8
(10.2,15.4)
2.2
(1.1,3.3)
5.8
19.3
(14.5,24.1)
Northland
13.4
(11.6,15.2)
3.9
(2.9,4.9)
3.4
18.0
(15.1,21.0)
Otago
14.3
(12.6,15.9)
7.0
(5.8,8.2)
2.0
12.8
(9.3,16.3)
NelsonMarlborough
17.1
(15.0,19.2)
3.8
(2.8,4.8)
4.5
12.7
(8.3,17.2)
WestCoast
20.7
(16.0,25.5)
3.6
(1.6,5.5)
5.8
23.8
(16.3,31.3)
Southland
29.4
(26.2,32.7)
6.2
(4.7,7.6)
4.7
50.0
(41.5,58.4)
National
rates
10.7
(10.3,11.0)
5.6
(5.4,5.9)
1.9
13.6
(12.9,14.4)
� PeopleresidingintheBay
ofPlenty
DHBarea
havenotbeenincluded
inthistablebecause
ofanecdotalevidence
from
NZHIS
thatthereweredifficulties
indatacollectionforprostatectomyatthistimeperiodforthisDHBarea.Thereported
publiclyandprivatelyfunded
rateswere1.1(0.7,1.6)and4.7(3.7,
5.6),respectively.
Copyright # 2009 John Wiley & Sons, Ltd. Int J Health Plann Mgmt 2009; 24: 147–160.
DOI: 10.1002/hpm
ELECTIVE SURGERY: PRIVATE AND PUBLIC MIX 155
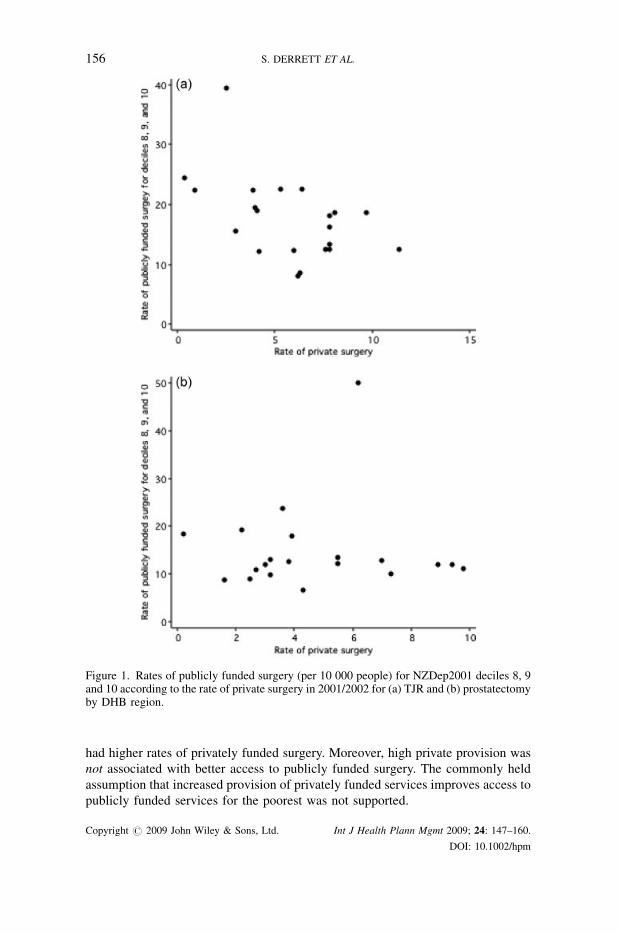
had higher rates of privately funded surgery. Moreover, high private provision was
not associated with better access to publicly funded surgery. The commonly held
assumption that increased provision of privately funded services improves access to
publicly funded services for the poorest was not supported.
Figure 1. Rates of publicly funded surgery (per 10 000 people) for NZDep2001 deciles 8, 9and 10 according to the rate of private surgery in 2001/2002 for (a) TJR and (b) prostatectomyby DHB region.
Copyright # 2009 John Wiley & Sons, Ltd. Int J Health Plann Mgmt 2009; 24: 147–160.
DOI: 10.1002/hpm
156 S. DERRETT ET AL.

There are certain limitations to the study. The latest private surgical operation data
available from NZHIS are for 2002, nevertheless there is no reason to expect the
relationships to differ in later years for prostate surgery, as publicly funded operation
rates have not increased. In 2004, publicly funded rates still ranged between 7.2 per
10 000 (Capital and Coast DHB) and 22.8 (West Coast DHB). For TJR, the provision
of public surgery increased, but the ordering of DHBs according to rate of public
provision remained similar in 2004: rates ranged between 9.8 per 10 000 (Auckland
DHB) and 29.2 (West Coast DHB). For cataract surgery the rate of publicly funded
surgery for 2004 still ranged between 13.3 per 10 000 (Canterbury DHB) and 32.5
(Whanganui DHB). The small size of some DHB regions means that random
fluctuations are likely. Partly to account for this, obvious outliers were removed when
calculating correlation coefficients. The method used to stratify by socioeconomic
status (NZDep2001) uses data on the area of residence and is subject to potential
misclassification, though the NZDep has been shown to be strongly related to
mortality rates (Salmond and Crampton, 2000). Further, we have assumed that there
is a constant need across DHB regions, after adjusting for age. This may not be
justified if there are underlying differences among regions, such as by socioeconomic
status or ethnicity, which affect need. However, when we stratified by socioeconomic
status, regional differences in rates of publicly funded surgery persisted.
In New Zealand people with highest need and ability to benefit are prioritized for
quicker access to publicly funded surgery. Nevertheless in the late 1990s in Otago, a
DHB providing slightly above the mean rate of public surgery for all three
conditions, patients were denied access to elective TJR, prostatectomy and cataract
surgery despite moderate or severe condition-related quality of life problems (Derrett
et al., 2002). Hence rates of publicly funded surgery leave considerable unmet need
in New Zealand, even in better served areas.
Differences in publicly funded surgery rates across New Zealand were larger than
found in England (25–30%) (Dixon et al., 2006). The wide variation in surgery rates
across NewZealand could partly be because of the small population base in someDHB
regions. Yet even for comparisons of the more populous DHB regions: Auckland,
Waikato, Capital and Coast, and Canterbury, major differences remain—for TJR a 2.5
fold difference, prostate (1.7), and cataracts (1.6). We found that, for the larger DHB
regions, the variation in provision of surgery was reduced somewhat by taking into
account the private provision (TJR, 1.9; prostate 1.3). This is in accord with earlier
findings in New Zealand examining specialty-wide rates of access (Raymont, 2002).
Why are public surgery rates low where private surgery rates are high? One possible
explanation is that there is a conflict of interest for surgeons working in both the public
and private sectors, such that it is in their interests to limit provision of services in the
public sector (Spigelman, 2003; Yates, 1995; Coney, 1995). In this regard, a Commerce
Commission investigation identified a conflict between commercial interests and
medical ideals in the provision of cataract surgery in Southland in 1996 (The Commerce
Commission v The Ophthalmological Society of New Zealand incorporated as first
defendant and others, 2004). It is conceivable that similar conflicts could exist in other
areas and specialties in New Zealand (Hayman, 2005). The prioritization and booking
system for surgery should have reduced this problem in the public sector because there
are now explicit criteria determining eligibility for publicly funded services. If the
Copyright # 2009 John Wiley & Sons, Ltd. Int J Health Plann Mgmt 2009; 24: 147–160.
DOI: 10.1002/hpm
ELECTIVE SURGERY: PRIVATE AND PUBLIC MIX 157
systemwas working as it should, major variations in public provision would not exist. A
second possible explanation is that there has been historically poor public provision in
some regions (e.g. Auckland) and that private services have grown to fill the gap.
Conversely, in regions with historically good private provision, there may have been
fewer stimuli for development of the public sector.
Whatever the reasons, the situation is inequitable. People living on meagre
incomes and with identified need should be able to receive surgery in the public
system. Though data reported to NZHIS do not allow identification of the source of
funding for privately funded surgery, it can be estimated that in 2005, 24% of the
New Zealand resident population in aged 65 years and over have some form of
medical insurance (Health Funds Association of New Zealand, 2006; Statistics New
Zealand, 2006). However, medical insurance is limited in its scope; people with
chronic illnesses are generally denied cover for surgery for those conditions. New
Zealand’s largest insurer is reported to have 40–50% of applicants for cover being
subject to exclusions (Blumberg, 2006). Furthermore, people on low incomes are
much less likely to have medical insurance (Blumberg, 2006; Hopkins and
Cumming, 2001), and are therefore more likely to have to pay out-of-pocket, or by
borrowing money, than those in higher socioeconomic groups.
Thewider implication of this research is that an unregulated private sector does not
appear to have a positive effect on the equity of elective surgery provision—either
geographically or for the most socioeconomically deprived. The argument that
private provision for the well off reduces the burden on the public system and allows
better access for the poor is not supported. If it were true, high private provision
should be associated with better access to public surgery for the socioeconomically
deprived, but this was not the case.
It should not be surprising that private provision takes away from public provision,
because there is a limited supply of doctors and nurses (Duckett, 2005; Flood et al.,
2005; Ferrinho et al., 2004). The availability of doctors across countries is the most
significant factor in waiting times (Siciliani and Hurst, 2003). Moreover capacity is
not simply transferred to the private sector. There is no comparable prioritization
system for access to private surgery in New Zealand, and insurance companies
respond to ‘wants’ rather than to relative needs (Bloomfield, 2003). Thus in the
private sector people with lower priority will receive surgery—using up capacity not
available to more needy people who can afford only the public system. Moreover, the
political will to reform the system is hampered by ‘exit’ to the private sector of those
who might otherwise complain (Fougere, 1974). The consequences of this particular
type of public/private mix need more investigation and public discussion.
ACKNOWLEDGEMENTS
We are most grateful to Dr Antony Raymont (Health Services Research Centre,
Victoria University of Wellington) for his helpful comments on an earlier version of
this paper. We also acknowledge the New Zealand Health Information Service
(NZHIS) as a source of much information used in the analysis.
Copyright # 2009 John Wiley & Sons, Ltd. Int J Health Plann Mgmt 2009; 24: 147–160.
DOI: 10.1002/hpm
158 S. DERRETT ET AL.

REFERENCES
Anonymous. 2000. Reduced waiting times for public hospital elective services. GovernmentStrategy, Ministry of Health: Wellington. www.moh.govt.nz/moh.nsf/
Barnett R, Lauer G. 2003. Urban deprivation and public hospital admissions in Christchurch,New Zealand, 1990–1997. Health Soc Care Community 11: 299–313.
Bloomfield A. 2003. New Zealand. In Reasonable Rationing, Ham C, Robert G (eds). OpenUniversity Press: Maidenhead.
Blumberg LJ. 2006. The effect of private health insurance coverage on health servicesutilisation in New Zealand. Fulbright New Zealand: Wellington.
Canadian Health Services Research Foundation. 2003. A parallel private system would reducewaiting times in the public system. J Health Serv Res Policy 8(1): 62–63.
Coney S. 1995. New Zealand doctors’ financial ventures. Lancet 345: 1038.Derrett S, Paul C, Herbison P, Williams H. 2002. Evaluation of explicit prioritisation forelective surgery: a prospective study. J Health Serv Res Policy 7(S1): 14–22.
Dixon T, Shaw ME, Dieppe PA. 2006. Analysis of regional variation in hip and kneejoint replacement rates in England using Hospital Episodes Statistics. Publ Health 120:83–90.
Duckett S. 2005. Private care and public waiting. Aust Health Rev 29(1): 87–93.Feek C. 2000. Rationing health care in New Zealand: the use of clinical guidelines.Med J Aust173: 423–426.
Ferrinho P, Van Lerberghe W, Fronteira I, Hipolito F, Biscaia A. 2004. Dual practice in thehealth sector: review of the evidence. Human Resources for Health 2:14. Available from:http://human-resources-health.com/content/2/1/14
Flood CM, Stabile M, Tuohy CH. 2002. The borders of solidarity: how countries determinethe public/private mix in spending and the impact on health care. Health Matrix 12: 297–356.
Flood CM, Stabile M, Kontic S. 2005. Finding health policy ’arbitary’: the evidence onwaiting, dying, and two-tier systems. In Access to Care, Access to Justice, Flood CM,Roach K, Sossin L (eds). University of Toronto Press: Toronto.
Fougere G. 1974. Exit, voice and the decay of the welfare state provision of hospital care[Thesis] University of Canterbury: Christchurch.
Fraser G, Alley P, Morris R. 1993. Waiting lists and waiting times: their nature andmanagement National Advisory Committee on Core Health and Disability Support Ser-vices: Wellington.
Hadorn DC, Holmes AC. 1997. The New Zealand priority criteria project. part 2: coronaryartery bypass graft surgery. BMJ 314: 135–138.
Hayman K. 2005. Public patients wait as private goals met. The Press 1 December. Available:www.stuff.co.nz/stuff/0,2106,3496903a7144,00.html (accessed 12.2.2006).
Health Funds Association of New Zealand. 2006. Health insurance statistics. Available:www.healthfunds.org.nz/Downloads/Health%20Insurance%20 Statistics%20July%2020061.pdf (accessed 23.5.2007).
Hopkins S, Cumming J. 2001. The impact of changes in private health expenditure on NewZealand households. Health Pol 58: 215–229.
McLeod D, DewK,Morgan S, Dowell A, Cumming J, Cormack D,McKinlay E, Love T. 2004.Equity of access to elective surgery: reflections fromNZ clinicians. J Health Serv Res Policy9(S2): 41–47.
Ministry of Health. 2006. Selected Privately Funded Morbidity Data 2002 New ZealandHealth Information Service, Ministry of Health: Wellington.
Ministry of Health. 2007. Elective Services: Comparative Analysis of DHB InterventionRates for Selected Elective Services 2007. Available: http://www.moh.govt.nz/moh.nsf/UnidPrint/MH6153?OpenDocument (accessed 23.5.2007).
Ministry of Health. 2008. Health Expenditure Trends in New Zealand 1996–2006Ministry ofHealth: Wellington.
Copyright # 2009 John Wiley & Sons, Ltd. Int J Health Plann Mgmt 2009; 24: 147–160.
DOI: 10.1002/hpm
ELECTIVE SURGERY: PRIVATE AND PUBLIC MIX 159

National Advisory Committee on Core Health and Disability Support Services. 1995. FourthAnnual Report to the Minister of Health Honourable Jenny Shipley Core ServicesCommittee: Wellington.
National Centre for Classification in Health. 2002. The Australian Modification of ICD-10Incorporating the Australian Classification of Health Interventions 4th ed National Centrefor Classification in Health: Australia.
New Zealand Health Information Service. 2003. Completing ADF96 Private Hospital Dis-charge Forms. Ministry of Health: Wellington. (www.nzhis.govt.nz/documentation/adf96/adf96intro.html) (accessed 19.04.07).
Pearce J, Dorling D, Wheeler B, Barnett R, Rigby J. 2006. Geographical inequalities in healthin New Zealand, 1980–2001: the gap widens. Aust NZ J Public Health 30: 461–466.
Raymont A. 2002. Evaluation of the Clinical Priority Assessment Criteria Programme: NMDSProject Phase I and II Report. CPAC Consortium: Wellington.
Salmond C, Crampton P. 2000. Chapter 2: deprivation and health. In Social Inequalities inHealth: New Zealand, Howden-Chapman P, Tobias M (eds). 1999. Ministry of Health:Wellington.
Salmond C, Crampton P. 2002. NZDep2001 Index of Deprivations Department of PublicHealth, Wellington School of Medicine and Health Sciences: Wellington.
Shipley J. 1996. Policy Guidelines for Regional Health Authorities 1997/97. Ministry ofHealth: Wellington.
Siciliani L, Hurst J. 2003. Explaining Waiting Times Variations for Elective Surgery AcrossOECD Countries. OECD Health Working Papers No. 7. Available http://www.oecd.org/dataoecd/31/10/17256025.pdf (accessed on 06.03.2007).
Spigelman AD. 2003. Titanic surgical waiting lists: what lies beneath? A NZ J Surg 73: 781.Statistics New Zealand. 2006. National Population Estimates December 2005 quarter.
Statistics New Zealand: Wellington. Available: www.stats.govt.nz/store/2006/02/national-population-estimates-dec05qtr-hotp.htm (accessed 23.5.2007).
The Commerce Commission v The Ophthalmological Society of New Zealand Incorporated asfirst defendant and others. Gendall J, 2004. The high court of New Zealand Wellingtonregistry. Reserved Judgement [1 March 2004] CIV-1997-485-34CP354/97.
van Doorslaer E, Masseria C, Koolman X. 2006. Inequalities in access to medical care byincome in developed countries. CMAJ 174: 177–183.
Walker A, Thurecht L, Harding A. 2006. Changes in hospitalisation rates and costs in NewSouth Wales, 1996-97and 2000–01. Aust Econ Rev 39: 391–408.
Yates J. 1995. Private Eye, Heart and Hip. Churchill Livingstone: Edinburgh.
Copyright # 2009 John Wiley & Sons, Ltd. Int J Health Plann Mgmt 2009; 24: 147–160.
DOI: 10.1002/hpm
160 S. DERRETT ET AL.