Acceptability and characteristics of 124 human bioequivalence studies with active substances...
9
Acceptability and characteristics of 124 human bioequivalence studies with active substances classified according to the Biopharmaceutic Classification System Elena Ramirez, Olga Laosa, Pedro Guerra, Blanca Duque, Beatriz Mosquera, Alberto M. Borobia, Suhua H. Lei, Antonio J. Carcas & Jesus Frias Clinical Pharmacology Service, Hospital Universitario la Paz, School of Medicine, Universidad Autónoma de Madrid, Arzobispo Morcillo s/n, 28029 Madrid, Spain Correspondence Jesus Frias, Clinical Pharmacology Service, Hospital Universitario la Paz, School of Medicine, Universidad Autónoma de Madrid, Arzobispo Morcillo s/n, 28029 Madrid,Spain. Tel.: + 34 9 1497 5334 Fax: + 34 9 1497 5374 E-mail: [email protected] ---------------------------------------------------------------------- Keywords bioequivalence studies, biopharmaceutics classification system ---------------------------------------------------------------------- Received 10 March 2010 Accepted 11 July 2010 WHAT IS ALREADY KNOWN ABOUT THIS SUBJECT • In USA and Europe the classical way to guarantee equivalence between different formulations is the bioequivalence (BE) study based on in vivo bioavailability. • The Biopharmaceutic Classification System (BCS) classifies active substances into four different groups according to their aqueous solubility and intestinal permeability. • Recently the European Medicines Agency (EMA) has released a new bioequivalence guideline for immediate release solid oral dosage forms that includes recommendations on BCS-based biowaivers. WHAT THIS STUDY ADDS • As far as we know this is the first time that the probability of proving BE of more than one hundred BE studies with 80 active substances categorized according to BCS was evaluated. • Despite the usually employed test dissolution methodology proposed as quality control, pharmaceutical products with active substances from the four classes of BCS showed non-BE studies. AIM The aim of this study was to evaluate the acceptability of 124 bioequivalence (BE) studies with 80 active substances categorized according to the Biopharmaceutics Classification System (BCS) in order to establish if there were different probabilities of proving BE between the different BCS classes. METHODS We evaluated the differences between pharmaceutical products with active substances from different BCS classes in terms of acceptability, number of subjects in the study (n), the point estimates, and intra- and inter-subject coefficients of variation data from BE studies with generic products. RESULTS Out of 124 BE studies 89 (71.77%) were performed with pharmaceutical products containing active substances classified by the BCS. In all BCS classes there were non-bioequivalent pharmaceutical products: 4 out of 26 (15.38%) in class 1, 14 out of 28 (50%) in class 2, 3 out of 22 (13.63%) in class 3 and 1 out of 13 (7.69%) in class 4. When we removed those pharmaceutical products in which intra-subject variability was higher than predicted (2 in class 1 active substances, 9 in class 2 and 2 in class 3) there were still non-BE pharmaceutical products in classes 1, 2 and 3. CONCLUSIONS Comparisons between pharmaceutical products with active substances from the four BCS classes have not allowed us to define differential characteristics of each class in terms of n, inter and intra-subject variability for Cmax or AUC. Despite the usually employed test dissolution methodology proposed as quality control, pharmaceutical products with active substances from the four classes of BCS showed non-BE studies. British Journal of Clinical Pharmacology DOI:10.1111/j.1365-2125.2010.03757.x 694 / Br J Clin Pharmacol / 70:5 / 694–702 © 2010 The Authors British Journal of Clinical Pharmacology © 2010 The British Pharmacological Society
-
Upload
independent -
Category
Documents
-
view
5 -
download
0
Transcript of Acceptability and characteristics of 124 human bioequivalence studies with active substances...

Acceptability andcharacteristics of 124 humanbioequivalence studies withactive substances classifiedaccording to theBiopharmaceuticClassification SystemElena Ramirez, Olga Laosa, Pedro Guerra, Blanca Duque,
Beatriz Mosquera, Alberto M. Borobia, Suhua H. Lei,
Antonio J. Carcas & Jesus Frias
Clinical Pharmacology Service, Hospital Universitario la Paz, School of Medicine, Universidad
Autónoma de Madrid, Arzobispo Morcillo s/n, 28029 Madrid, Spain
CorrespondenceJesus Frias, Clinical Pharmacology Service,Hospital Universitario la Paz, School ofMedicine, Universidad Autónoma deMadrid, Arzobispo Morcillo s/n, 28029Madrid,Spain.Tel.: + 34 9 1497 5334Fax: + 34 9 1497 5374E-mail: jesus.frias@uam.es----------------------------------------------------------------------
Keywordsbioequivalence studies, biopharmaceuticsclassification system----------------------------------------------------------------------
Received10 March 2010
Accepted11 July 2010
WHAT IS ALREADY KNOWN ABOUTTHIS SUBJECT• In USA and Europe the classical way to guarantee
equivalence between different formulations isthe bioequivalence (BE) study based on in vivobioavailability.
• The Biopharmaceutic Classification System (BCS)classifies active substances into four differentgroups according to their aqueous solubility andintestinal permeability.
• Recently the European Medicines Agency (EMA)has released a new bioequivalence guideline forimmediate release solid oral dosage forms thatincludes recommendations on BCS-basedbiowaivers.
WHAT THIS STUDY ADDS• As far as we know this is the first time that the
probability of proving BE of more than onehundred BE studies with 80 active substancescategorized according to BCS was evaluated.
• Despite the usually employed test dissolutionmethodology proposed as quality control,pharmaceutical products with active substancesfrom the four classes of BCS showed non-BEstudies.
AIMThe aim of this study was to evaluate the acceptability of 124 bioequivalence(BE) studies with 80 active substances categorized according to theBiopharmaceutics Classification System (BCS) in order to establish if there weredifferent probabilities of proving BE between the different BCS classes.
METHODSWe evaluated the differences between pharmaceutical products with activesubstances from different BCS classes in terms of acceptability, number ofsubjects in the study (n), the point estimates, and intra- and inter-subjectcoefficients of variation data from BE studies with generic products.
RESULTSOut of 124 BE studies 89 (71.77%) were performed with pharmaceuticalproducts containing active substances classified by the BCS. In all BCS classesthere were non-bioequivalent pharmaceutical products: 4 out of 26 (15.38%) inclass 1, 14 out of 28 (50%) in class 2, 3 out of 22 (13.63%) in class 3 and 1 out of13 (7.69%) in class 4. When we removed those pharmaceutical products inwhich intra-subject variability was higher than predicted (2 in class 1 activesubstances, 9 in class 2 and 2 in class 3) there were still non-BE pharmaceuticalproducts in classes 1, 2 and 3.
CONCLUSIONSComparisons between pharmaceutical products with active substances from thefour BCS classes have not allowed us to define differential characteristics of eachclass in terms of n, inter and intra-subject variability for Cmax or AUC. Despite theusually employed test dissolution methodology proposed as quality control,pharmaceutical products with active substances from the four classes of BCSshowed non-BE studies.
British Journal of ClinicalPharmacology
DOI:10.1111/j.1365-2125.2010.03757.x
694 / Br J Clin Pharmacol / 70:5 / 694–702 © 2010 The AuthorsBritish Journal of Clinical Pharmacology © 2010 The British Pharmacological Society

Introduction
In many developed countries, the main purpose of regula-tion related to the manufacture and distribution of medici-nal products for human use is the safeguard of publichealth. In many countries the marketing authorizationprocess for generic drugs is clearly established and relieson the demonstration of bioequivalence (BE). BE is definedas the absence of a significant difference in the availabilityof the active ingredient at the site of drug action [1]. InEurope, the European Medicines Agency (EMA) has statedthat an ‘essentially similar medicinal product’ shall refer toa medicinal product which has the same qualitative andquantitative composition in terms of active substancesand the same pharmaceutical form as the referencemedicinal product,and whose bioequivalence with the ref-erence medicinal product has been demonstrated byappropriate bioavailability studies [2].
In the USA [3] and Europe [4] the classical way to guar-antee equivalence between different formulations is theso-called in vivo equivalence (bioequivalence) based oncomparative in vivo bioavailability using pharmacokineticendpoints.
Other countries have incorporated equivalence regula-tion, with various levels of requirements according to theirspecific national context and depending on many factors,such as the characteristics of the active drug substance, thehealth risk and the availability of resources to carry out aspecific type of study [5]. In many places there is an interestin developing definitions and guidelines on when in vivoequivalence studies are necessary and when in vitrostudies are acceptable. In this context, some countries aretrying to develop regulatory systems to establish equiva-lence between different formulations supported by in vitrotesting and Biopharmaceutics Classification System (BCS)considerations.
The BCS, introduced by Amidon et al. in 1995 [6], classi-fies active substances into four different groups accordingto their aqueous solubility at the highest dose in a volumeof 250 ml and intestinal permeability.The idea is that whena drug formulated as an immediate release solid oraldosage form has an in vivo high solubility into the gas-trointestinal tract and has a high permeability (class 1drugs) the rate and extent of drug absorption is expectedto be equivalent to the in vitro dissolution test, being 85%dissolved in less than 30 min with three different buffers,making in vivo bioequivalence demonstration unneces-sary. This approach has been accepted by the FDA [7] andEMA [4] but is still rarely used, at least in Europe.
Nevertheless the EMA has gone one step further, andhas released new bioequivalence guidelines that includerecommendations on BCS-based [8] biowaivers. Biowaiv-ers would be applicable to products containing BCS class 1drugs which exhibit high solubility, complete absorptionand rapid in vitro dissolution and also to pharmaceuticalproducts containing substances exhibiting high solubility,
limited absorption (BCS class 3) and very rapid in vitro dis-solution, once the product has been previously justifiedfor the biowaiver and has demonstrated other specificrequirements concerning active substances and excipients[9–12]. Also the new EMA guideline said that ‘excipientsthat might affect bioavailability are qualitatively and quan-titatively the same. In general, the use of the same excipi-ents in similar amounts is preferred’. More than that, theWHO [13] had relaxed the solubility ratio and permeabilitycriterion for class 1 and class 3 allowing too some bioex-ceptions in pharmaceutical products containing BCS class2 drugs that are weak acids with dose solubility ratio of250 ml or lower at 37°C over a pH range of 1.2–6.8. Suchwaivers would increase the speed and decrease the cost ofbringing orally administered multisource therapeutics tomarket.
The aim of this study was to evaluate the characteristicsin terms of acceptability, sample size, the point estimates,and intra- and inter-subject coefficients of variation of 80active substances categorized according to the BCS testedin 124 BE studies with generic pharmaceutical products inorder to establish if there were different probabilities ofproving BE between the different BCS classes.
Methods
StudiesOne hundred and twenty-four BE randomized crossoverstudies with 80 active substances were conducted onapproximately 4500 healthy, young volunteers.The studieswere all designed according to the requirements of EMAfor BE studies for immediate release dosage forms [4] anddeveloped in the Department of Pharmacology of theSchool of Medicine. The design and the reference medici-nal product was always the same for each active substancebut the number of subjects was different depending onprevious data. All subjects gave written informed consentfor participation in the BE studies, which were conductedaccording to the Helsinki declaration and the Spanish lawsand were approved by the Ethics Committee of La PazUniversity Hospital. In every case, the BE study was devel-oped after Spanish Medicines Agency approval of the pro-tocol and the dissolution in vitro tests. In compliance withBE European requisites, in each study, the in vitro test dis-solution methodology was in accordance with Europeanpharmacopoeial requirements and EMA regulations. Somedata from 108 of 124 studies presented here have previ-ously been published [14].
Drug classificationThe BCS classification of drugs was obtained from theTherapeutic System Research Laboratories website (http://www.tsrlinc.com/services/bcs/search.cfm) directed byAmidon et al. [15] (Table 1). Active substances in bold (Cmax)or underlined (AUC) were non-BE formulations). In order to
Acceptability and characteristics of BEQ studies with BCS active substances
Br J Clin Pharmacol / 70:5 / 695

classify drugs in BCS categories, we selected the ClogP-based permeability list because it classifies more drugs. Asensitivity analysis was performed excluding all drugs withdiscordant classification in ClogP vs. log P permeabilitymeasurements of Amidon vs. Spanish data from Takagiet al. [16]. The drugs excluded are listed in Table 2.
PharmacokineticsThe pharmacokinetic (PK) analysis was performed usingthe WinNonlin 2.0 program (Pharsight Corporation, Cary,USA) from individual plasma or urine (three studies) con-centration values on a non-compartmental extravascularinput model. PK was expressed in terms of the rate andextent of absorption as characterized by the maximumobserved plasma concentration (Cmax) and area under theconcentration–time curve (AUC(0,•)), or the truncatedAUC as appropriate. In three studies (three alendronic acidformulations) the primary results were the maximumobserved excretion rate (Uratemax) and the accumulatedelimination (Ae(0,•)). Only one analyte per study wasincluded in the analysis, usually the parent drug. In sevenBE studies the pharmaceutical products had two activeingredients and in one study three (isoniazid, pyrazina-
mide and rifampicin). In these cases all active substancewere analyzed independently for BE purposes.
Statistical analysisStandard analysis of bioequivalence Methodology andstatistical notations of BE studies are well described in the
Table 1Biopharmaceutics Classification System (BCS) of active substances (number of studies)
High solubility Low solubility Non-classified
High permeabilityClass 1 Class 2
Amlodipine (2)Bisoprolol (1)Cetirizine (2) *Citalopram/escitalopram (2)Donepezil (1)Doxazosin (1)Enalapril (2)Loratadine (1)Mirtazapine (1)Ondansetron (1)
Pravastatin (1)Quinapril (2)Ramipril (1)Sertraline (1)Sildenafil (1)Sildenafil (1)Terbinafin (2)Tramadol (1)Venlafaxine (1)Zolpidem (1)
Aceclofenac (1)Aceclofenac (1)Carbamazepine (1)Carvedilol (1)Clopidogrel (3)Ebastine (1)Ibuprofen (1+3)Ibuprofen (4)Irbesartan (1)
Irbesartan (1)Lamotrigine (1)Lorazepam (1)Lovastatin (1+2)Mycophenolate mofetil (1)Quetiapine (1)Risperidone (1)Risperidone (1)Simvastatin (1)
Amisulpride (1)Azyithromycin (2)Azythromycin (2)Bromazepam (1)Bromazepam (1)Clarithromycin (1)Clarithromycin (1)Clavulanate (2)Clavulanate (1)Deflazacort (1)
Low permeability Deflazacort (1)Class 3
Alendronic acid (3)†Anastrazole (1)Cefaclor (2)Codeine (1)Codeine (1)Fluconazole (1)Gabapentin (1)Isoniazid (1)Lamivudine (1)Letrozole (1)
Levetiracetam (1)*Levofloxacin (1)Lisinopril (1)Losartan (1)Pyrazinamide (1)Ranitidine (1)Risedronic acid (1)Terazosin (1)Topiramate (1)
Class 4Acetaminophen (1)Amoxicillin (5)Cefixime (1)Cefuroxime axetil (1)Famotidine (2)Hydrochlorothiazide (2)Oxcarbazepine (1)
Dypirone (4)Flutamide (1)Leflunomide (1)Lercanidipine (1)Loperamide (1)Lormetazepam (2)Naproxen (1)Norfloxacine (1)Pentoxifylline (1)Piroxicam (1)Pramipexole (1)Prednisone (1)Repaglinide (2)Rifampicin (1)Ropirinol (1)Torasemide (1)
Classification of drugs according to ClogP permeability of Biopharmaceutics Classification System (BCS) of Therapeutic System Research Laboratories web site (http://www.tsrlinc.com/services/bcs/search.cfm). Drugs in bold for Cmax and underlined for AUC correspond to non-bioequivalent parameters. (*) Therapeutic Equivalence Evaluation AACode of FDA (Rest of codes were AB or none classified). †The primary results were maximum observed excretion rate (Uratemax) and accumulated elimination (Ae(0,•)).
Table 2Drugs excluded in the sensitivity analysis
Drug
Permeability classification
Data of Amidon et al. [15]Spanish data from Takagiet al.[16]
ClogP-based LogP-based ClogP LogP
Amlodipine 1 3 1 3
Amoxicillin 4 4 3 3Loratidine 1 1 2 2
Lorazepam 2 2 1 1Losartan 3 3 1 NC
Ondansetron 1 3 1 3Pravastatin 1 3 1 3
Discordances found in permeability classification between ClogP-based vs. logP-based on Amidon et al. [15] vs. Spanish Data from Takagyi et al [16] of Biophar-maceutics Classification System (BCS).
E. Ramirez et al.
696 / 70:5 / Br J Clin Pharmacol

EMA guidelines [4].These calculations were made with theWinNonlin 2.0 program. From the WinNonlin statisticalanalysis, we calculated the power a posteriori, T : R meanratios, the 90% CI and the mean square error (MSE) ofANOVA on the log scale,
The products were considered bioequivalent if the 90%confidence intervals (CI) of the log means of ratios of Cmax
and AUC (Uratemax and Ae) fell within 80% and 125%.
Calculating the point estimate, inter and intra-subjectvariability We showed the T : R mean ratios as a subtrac-tion from 100, resulting in a point estimate. Inter-subjectvariability (CVInter-subject) was obtained exclusively from thereference formulation. Intrasubject variability (CVIntrasubject)was calculated from the MSE of the corresponding analysisof variance (ANOVA) using the following formula (CVIntra-subject
= SQRT(EXP(si2) - 1), where si2 denotes the residual (intra-subject) variance of the logarithmically transformed char-acteristics data [17].
Recalculation of the sample size In the case of data fromnon-BE studies we recalculated the number of subjects (nr)using the following formula (nr = ((Z1–b + Z1–a)2 2 si
2)/(lnq -ln(1.25)2 [18].
where si2 is the within-subject variability on the logscale and nr is the retrospective number of subjects calcu-lation. Let q=mT/mR where mT and mR denote the meanparameters for test and reference, and let ln denote thenatural logarithm. This equation provides reasonableapproximations of the sample size for mT/mR � 1, as thepower of a study is very sensitive to the assumption aboutthe point estimate. nr was calculated for a type I error of 5%and q = 0.05.
Analysis of BCS groups To analyze possible differencesbetween formulations containing active substances fromdifferent BCS classes we evaluated the study numberof subjects (n), point estimate and CVIntrasubject and theCVInter-subject with respect to Cmax and AUC in BE studies bymeans of a Student’s t-test for two samples with unequalvariances or a Mann-Whitney U-test for non-Gaussian dis-tribution, respectively, using SPSS 15.0 Statistical AnalysisSoftware (SPSS, Chicago, IL, USA).
Results
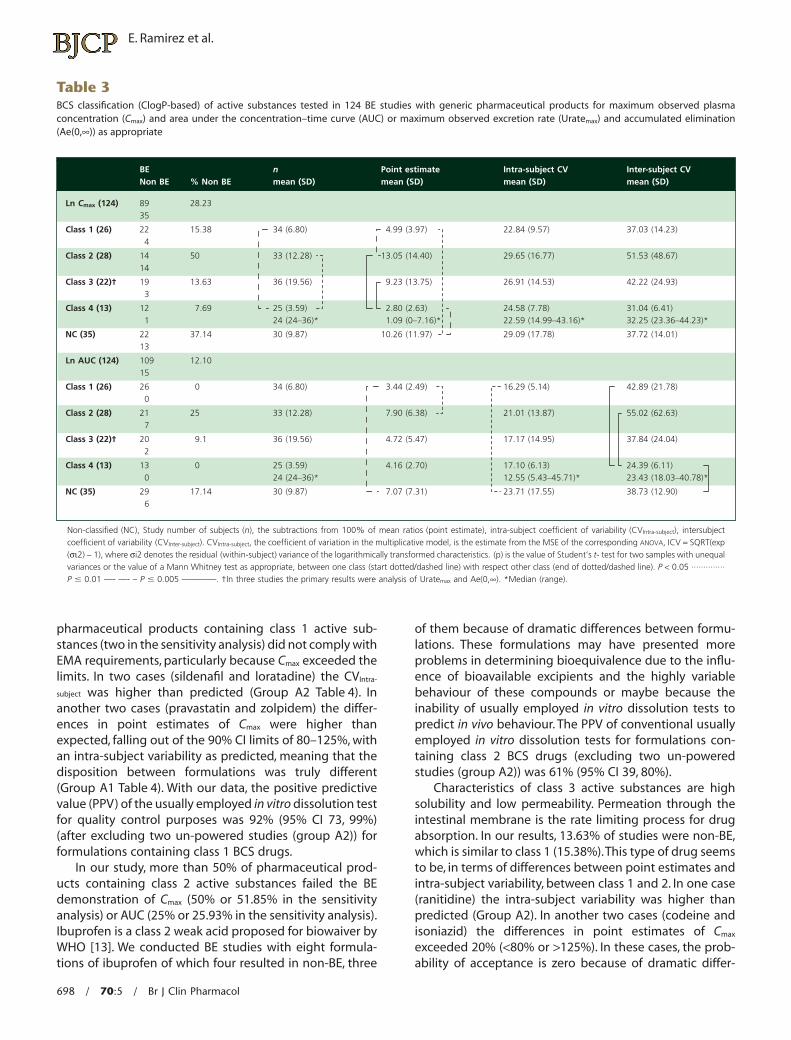
Out of 124 BE studies 89 (71.77%) were performed withactive substances classified by the BCS (Table 1) and 77(62.1%) were classified in the sensitivity analysis describedin the methodology. Table 3 summarizes the number ofproducts that fulfilled BE (for Cmax and AUC) vs. those notfulfilling BE, and it also shows the distribution (mean � SD)of the number of subjects in the study (n), the point esti-mate, the CVIntra-subject and the CVInter-subject for Cmax and AUC ofstudies with active substances grouped by BCS.
In all BCS classes there were non-bioequivalent phar-maceutical products, reaching 50% in class 2. Thirty-fiveout of 124 pharmaceutical products did not fulfil BE criteriabecause Cmax exceeded limits, and 15 did not comply withthe AUC. Comparisons between all classes have showedsome statistical differences (Table 3).
Table 4 shows the results from non-BE pharmaceuticalproducts for Cmax and AUC classified by active substanceaccording to the four categories of BCS. We also havegrouped these non-BE products according to differences<20% of point estimate (Group A) or >20% (Group B)(meaning differences between formulations), and by thepower a posteriori >0.8 (Group 1) or <0.8 (Group 2) (assum-ing the validity of the results).
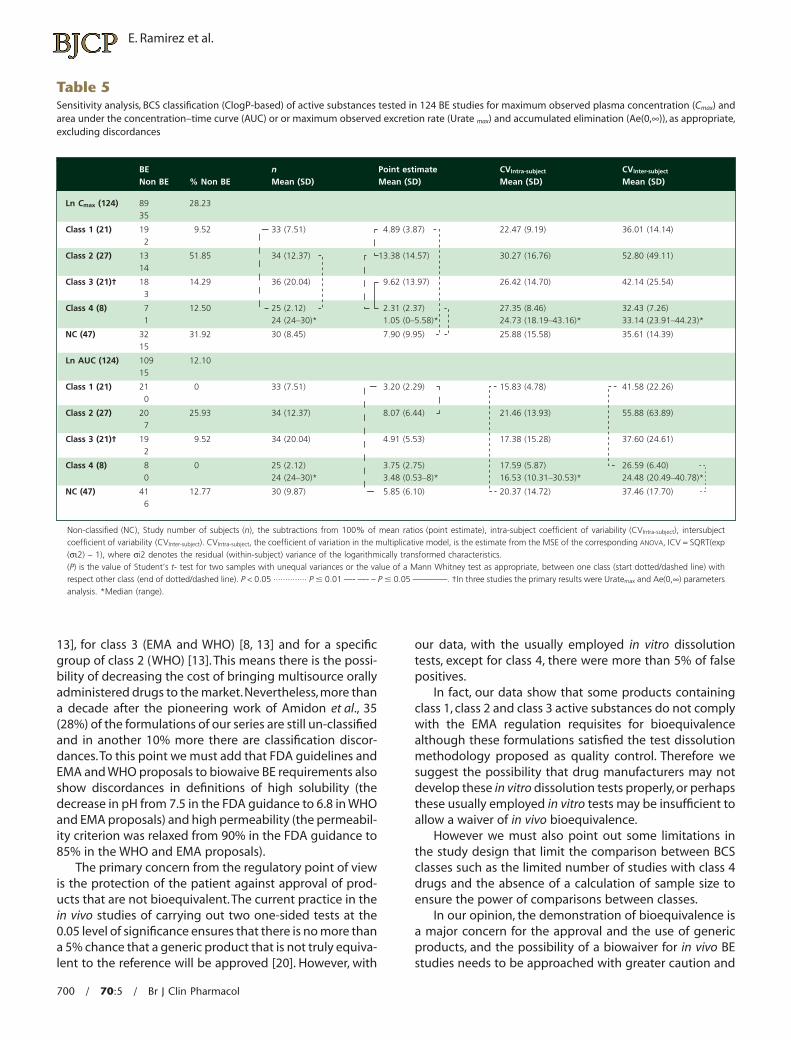
In a sensitivity analysis (Table 5) the removal of fivestudies because of discordances in the classification ofactive substances of the BCS of three BE and two non-BEactive substances of class 1 changed the ratio BE : Totalnumber of studies of products from 15.38% to 9.52% andthe removal of another five BE active substances from class4 improved the ratio from 12.5% to 5.69%. For class 2 and 3only one active substance were excluded, respectively.Nevertheless sample size, point estimates, CVIntra-subject andCVInter-subject between classes continued to show the samesignificant differences, reinforcing our results. Excludingthe three formulations of class 3 active substances wherethe primary results were urine analysis, because of extrabiological variability, differences remained for the pointestimate with respect to class 4 drugs for Cmax and wefound no other significant differences in both analyses.
Moreover, when we removed those studies in whichthe intra-subject variability of formulations was higherthan predicted (Table 4, Group A2, defined as those activesubstances from studies with insufficient power a poste-riori and a point estimate <20%) (two with class 1,nine withclass 2 and two with class 3 active substances), there werenon-BE formulations with active substances from classes 1,2 and 3 (Table 4).
Discussion
Cmax is the cornerstone for the demonstration of bioequiva-lence because almost always it is more variable than AUC.In fact, in our data from 124 formulations 35 did notcomply with BE acceptance criteria because of Cmax and 15because AUC exceeded the limits, and between these 14were also out of limits for Cmax. For class 1, non-BE wasalways due to Cmax, not AUC.
Comparison between all classes showed some statisti-cal differences in terms of study n, the point estimate,CVIntra-subject and the CVInter-subject for Cmax and AUC, but in ouropinion these differences did not define differential char-acteristics between classes.
Although it is believed that class 1 active substancesmay not require in vivo BEQ demonstration, 4 of 26
Acceptability and characteristics of BEQ studies with BCS active substances
Br J Clin Pharmacol / 70:5 / 697
pharmaceutical products containing class 1 active sub-stances (two in the sensitivity analysis) did not comply withEMA requirements, particularly because Cmax exceeded thelimits. In two cases (sildenafil and loratadine) the CVIntra-
subject was higher than predicted (Group A2 Table 4). Inanother two cases (pravastatin and zolpidem) the differ-ences in point estimates of Cmax were higher thanexpected, falling out of the 90% CI limits of 80–125%, withan intra-subject variability as predicted, meaning that thedisposition between formulations was truly different(Group A1 Table 4). With our data, the positive predictivevalue (PPV) of the usually employed in vitro dissolution testfor quality control purposes was 92% (95% CI 73, 99%)(after excluding two un-powered studies (group A2)) forformulations containing class 1 BCS drugs.
In our study, more than 50% of pharmaceutical prod-ucts containing class 2 active substances failed the BEdemonstration of Cmax (50% or 51.85% in the sensitivityanalysis) or AUC (25% or 25.93% in the sensitivity analysis).Ibuprofen is a class 2 weak acid proposed for biowaiver byWHO [13]. We conducted BE studies with eight formula-tions of ibuprofen of which four resulted in non-BE, three
of them because of dramatic differences between formu-lations. These formulations may have presented moreproblems in determining bioequivalence due to the influ-ence of bioavailable excipients and the highly variablebehaviour of these compounds or maybe because theinability of usually employed in vitro dissolution tests topredict in vivo behaviour. The PPV of conventional usuallyemployed in vitro dissolution tests for formulations con-taining class 2 BCS drugs (excluding two un-poweredstudies (group A2)) was 61% (95% CI 39, 80%).
Characteristics of class 3 active substances are highsolubility and low permeability. Permeation through theintestinal membrane is the rate limiting process for drugabsorption. In our results, 13.63% of studies were non-BE,which is similar to class 1 (15.38%).This type of drug seemsto be, in terms of differences between point estimates andintra-subject variability, between class 1 and 2. In one case(ranitidine) the intra-subject variability was higher thanpredicted (Group A2). In another two cases (codeine andisoniazid) the differences in point estimates of Cmax
exceeded 20% (<80% or >125%). In these cases, the prob-ability of acceptance is zero because of dramatic differ-
Table 3BCS classification (ClogP-based) of active substances tested in 124 BE studies with generic pharmaceutical products for maximum observed plasmaconcentration (Cmax) and area under the concentration–time curve (AUC) or maximum observed excretion rate (Uratemax) and accumulated elimination(Ae(0,•)) as appropriate
BENon BE % Non BE
nmean (SD)
Point estimatemean (SD)
Intra-subject CVmean (SD)
Inter-subject CVmean (SD)
Ln Cmax (124) 8935
28.23
Class 1 (26) 224
15.38 34 (6.80) 4.99 (3.97) 22.84 (9.57) 37.03 (14.23)
Class 2 (28) 1414
50 33 (12.28) 13.05 (14.40) 29.65 (16.77) 51.53 (48.67)
Class 3 (22)† 193
13.63 36 (19.56) 9.23 (13.75) 26.91 (14.53) 42.22 (24.93)
Class 4 (13) 12 7.69 25 (3.59) 2.80 (2.63) 24.58 (7.78) 31.04 (6.41))*32.44–63.32(52.23*)61.34–99.41(95.22*)61.7–0(90.1*)63–42(421
NC (35) 2213
37.14 30 (9.87) 10.26 (11.97) 29.09 (17.78) 37.72 (14.01)
Ln AUC (124) 10915
12.10
Class 1 (26) 260
0 34 (6.80) 3.44 (2.49) 16.29 (5.14) 42.89 (21.78)
Class 2 (28) 217
25 33 (12.28) 7.90 (6.38) 21.01 (13.87) 55.02 (62.63)
Class 3 (22)† 202
9.1 36 (19.56) 4.72 (5.47) 17.17 (14.95) 37.84 (24.04)
Class 4 (13) 13 0 25 (3.59) 4.16 (2.70) 17.10 (6.13) 24.39 (6.11))*87.04–30.81(34.32)*17.54–34.5(55.21)*63–42(420
NC (35) 296
17.14 30 (9.87) 7.07 (7.31) 23.71 (17.55) 38.73 (12.90)
Non-classified (NC), Study number of subjects (n), the subtractions from 100% of mean ratios (point estimate), intra-subject coefficient of variability (CVIntra-subject), intersubjectcoefficient of variability (CVInter-subject). CVIntra-subject, the coefficient of variation in the multiplicative model, is the estimate from the MSE of the corresponding ANOVA, ICV = SQRT(exp(si2) - 1), where si2 denotes the residual (within-subject) variance of the logarithmically transformed characteristics. (p) is the value of Student’s t- test for two samples with unequalvariances or the value of a Mann Whitney test as appropriate, between one class (start dotted/dashed line) with respect other class (end of dotted/dashed line). P < 0.05 ··············P � 0.01 —- —- – P � 0.005 ————. †In three studies the primary results were analysis of Uratemax and Ae(0,•). *Median (range).
E. Ramirez et al.
698 / 70:5 / Br J Clin Pharmacol

ences between formulations (Group B1 Table 4).The PPV ofusually employed in vitro dissolution tests is 86% (95% CI70, 99%) (excluding two unpowered studies (Group A2))for formulations containing class 3 BCS drugs. Wu & Benet[19] developed a Biopharmaceutics Drug Disposition Clas-sification System (BDDCS) based on the extent of metabo-lism, instead of permeability or extent of absorption. Theythink it inappropriate to have a biowaiver for this class untilmore is known about the effect of formulation compo-nents on intestinal transport and until there is a validatedmethodology to predict these effects except, perhaps, inthe case of identical excipients [9].
Active substances from class 4 are of low solubility andlow permeability and show significant problems for effec-tive oral delivery. The number of pharmaceutical productsthat fall into this class depends on the precise limit used forthe definition of permeability and solubility. Surprisingly,class 4 has the lowest percentage of non-bioequivalent
formulations (7.69%,0% in the sensitivity analysis). In termsof point estimates, class 4 showed the lowest value, a valuesignificantly lower than class 2 and 3, although this factshould be considered cautiously because of the limitednumber of studies in our series. We note that these com-pounds showed the lowest inter-subject variability in AUCof all four BCS classes, significantly lower than class 1(Table 3), which may be due to the absence of saturation ofintestinal transport and enzymes affected by the inter-subject differences in their function. The PPV of conven-tional in vitro dissolution tests is 100% for formulationscontaining class 4 BCS drugs.
The BCS developed by Amidon et al. [6] with the objec-tive to predict from a more specific in vitro dissolution testthe bioavailability of a drug has produced an importantimpact based on the possibility to waive in vivo bioavail-ability and bioequivalence testing for immediate releasesolid dosage forms for class 1 (FDA, EMA and WHO) [7, 8,
Table 4Results of non-BE formulations (study number of subjects, retrospective sample size calculation) classified by BCS active substances for maximum observedplasma concentration (Cmax) and area under the concentration-time curve (AUC)
Point estimateGroup A (<20%) Group B (>20%)
Power a posteriori
Group 1 (>0.8)
Class 1Cmax: Pravastatin (36,34),Zolpidem (36, 27)
Class 2Cmax: Clopidogrel-2 (82,84),Ibuprofen-2 (36, 9), Irbesartan(35, 23)AUC: Clopidogrel-1 (36, 54),Clopidogrel-2 (82, 51),Risperidone (34, 24)
Class 1 Class 2Cmax: Ibuprofen-1 (24, 15),Ibuprofen-3 (35, 10),Ibuprofen-4 (24, 18),Lovastatin-1 (36,37),Risperidone (34, 27),Simvastatin (36, 43)AUC: Ibuprofen-3 (35, 5),Simvastatin (36, 30)
Class 3 Class 4 Class 3Cmax: Codeine (35, 34),Isoniazid (24, 25)
Class 4
NCCmax: Bromazepam (33, 43), Deflazacort (35, 34),Flutamide (24, 35), Lormetazepam-2 (24, 25),Rifampicin (24, 15)AUC: Bromazepam (33, 26), Clavulanate-2 (24, 18)
NCCmax: Azythromycin-2 (35, 33), Clarithromycin (36, 32)AUC: Pentoxifiline (12, 12)
Group 2 (< 0.8)Class 1
Cmax: Sildenafil (35, 66),Loratadine (35, 69)
Class 2Cmax: Aceclofenac (23, 42),Clopidogrel-1 (36, 137),Clopidogrel-3 (54, 235),Lovastatin-2 (36, 65),Lovastatin-3 (36, 53)AUC: Clopidogrel-3 (54, 88),Lovastatin-1 (36, 63)
Class 1 Class 2
Class 3Cmax: Ranitidine (23, 50)AUC: Lisinopril (24, 52)
Class 4Cmax: Oxcarbazepine (24, 69)
Class 3AUC: Codeine (35, 47)
Class 4
NCCmax: Azythromycin-1 (35, 70), Lercanidipine (35, 97)AUC: Flutamide (24, 35)
NCCmax: Clavulanate-1 (24, 233), Clavulanate-2 (24, 235),Lormetazepam-1 (24, 41), Pentoxifiline (12, 30)AUC: Clarithromycin (24, 32), Clavulanate-1 (24, 170),
Formulation-Number of study with the same drug. Behind formulation appears between parenthesis, two numbers (n, nr), showing the study number of subjects (n) and retrospectivesample size calculation (nr).
Acceptability and characteristics of BEQ studies with BCS active substances
Br J Clin Pharmacol / 70:5 / 699
13], for class 3 (EMA and WHO) [8, 13] and for a specificgroup of class 2 (WHO) [13]. This means there is the possi-bility of decreasing the cost of bringing multisource orallyadministered drugs to the market.Nevertheless, more thana decade after the pioneering work of Amidon et al., 35(28%) of the formulations of our series are still un-classifiedand in another 10% more there are classification discor-dances.To this point we must add that FDA guidelines andEMA and WHO proposals to biowaive BE requirements alsoshow discordances in definitions of high solubility (thedecrease in pH from 7.5 in the FDA guidance to 6.8 in WHOand EMA proposals) and high permeability (the permeabil-ity criterion was relaxed from 90% in the FDA guidance to85% in the WHO and EMA proposals).
The primary concern from the regulatory point of viewis the protection of the patient against approval of prod-ucts that are not bioequivalent. The current practice in thein vivo studies of carrying out two one-sided tests at the0.05 level of significance ensures that there is no more thana 5% chance that a generic product that is not truly equiva-lent to the reference will be approved [20]. However, with
our data, with the usually employed in vitro dissolutiontests, except for class 4, there were more than 5% of falsepositives.
In fact, our data show that some products containingclass 1, class 2 and class 3 active substances do not complywith the EMA regulation requisites for bioequivalencealthough these formulations satisfied the test dissolutionmethodology proposed as quality control. Therefore wesuggest the possibility that drug manufacturers may notdevelop these in vitro dissolution tests properly, or perhapsthese usually employed in vitro tests may be insufficient toallow a waiver of in vivo bioequivalence.
However we must also point out some limitations inthe study design that limit the comparison between BCSclasses such as the limited number of studies with class 4drugs and the absence of a calculation of sample size toensure the power of comparisons between classes.
In our opinion, the demonstration of bioequivalence isa major concern for the approval and the use of genericproducts, and the possibility of a biowaiver for in vivo BEstudies needs to be approached with greater caution and
Table 5Sensitivity analysis, BCS classification (ClogP-based) of active substances tested in 124 BE studies for maximum observed plasma concentration (Cmax) andarea under the concentration–time curve (AUC) or or maximum observed excretion rate (Urate max) and accumulated elimination (Ae(0,•)), as appropriate,excluding discordances
BENon BE % Non BE
nMean (SD)
Point estimateMean (SD)
CVIntra-subject
Mean (SD)CVInter-subject
Mean (SD)
Ln Cmax (124) 8935
28.23
Class 1 (21) 192
9.52 33 (7.51) 4.89 (3.87) 22.47 (9.19) 36.01 (14.14)
Class 2 (27) 1314
51.85 34 (12.37) 13.38 (14.57) 30.27 (16.76) 52.80 (49.11)
Class 3 (21)† 183
14.29 36 (20.04) 9.62 (13.97) 26.42 (14.70) 42.14 (25.54)
Class 4 (8) 7 12.50 25 (2.12) 2.31 (2.37) 27.35 (8.46) 32.43 (7.26)*)32.44–19.32(41.33*)61.34–91.81(37.42*)85.5–0(50.1*)03–42(421
NC (47) 3215
31.92 30 (8.45) 7.90 (9.95) 25.88 (15.58) 35.61 (14.39)
Ln AUC (124) 10915
12.10
Class 1 (21) 210
0 33 (7.51) 3.20 (2.29) 15.83 (4.78) 41.58 (22.26)
Class 2 (27) 207
25.93 34 (12.37) 8.07 (6.44) 21.46 (13.93) 55.88 (63.89)
Class 3 (21)† 192
9.52 34 (20.04) 4.91 (5.53) 17.38 (15.28) 37.60 (24.61)
Class 4 (8) 8 0 25 (2.12) 3.75 (2.75) 17.59 (5.87) 26.59 (6.40))*87.04–94.02(84.42*)35.03–13.01(35.61*)8–35.0(84.3)*03–42(420
NC (47) 416
12.77 30 (9.87) 5.85 (6.10) 20.37 (14.72) 37.46 (17.70)
Non-classified (NC), Study number of subjects (n), the subtractions from 100% of mean ratios (point estimate), intra-subject coefficient of variability (CVIntra-subject), intersubjectcoefficient of variability (CVInter-subject). CVIntra-subject, the coefficient of variation in the multiplicative model, is the estimate from the MSE of the corresponding ANOVA, ICV = SQRT(exp(si2) - 1), where si2 denotes the residual (within-subject) variance of the logarithmically transformed characteristics.(P) is the value of Student’s t- test for two samples with unequal variances or the value of a Mann Whitney test as appropriate, between one class (start dotted/dashed line) withrespect other class (end of dotted/dashed line). P < 0.05 ·············· P � 0.01 —- —- – P � 0.05 ————. †In three studies the primary results were Uratemax and Ae(0,•) parametersanalysis. *Median (range).
E. Ramirez et al.
700 / 70:5 / Br J Clin Pharmacol

careful supervision in order to guarantee the efficacy andsafety of these medicines.
In conclusion, comparisons between pharmaceuticalproducts with active substances from the four BCS classeshave not allowed us to define differential characteristics ofeach class in terms of n, CVIntra-subject and CVInter-subject for Cmax
or AUC. Despite the usually employed test dissolutionmethodology proposed as quality control, pharmaceuticalproducts with active substances from the four classes ofBCS showed non-BE studies. Pharmaceutical products inclasses 1 and 3 were similar but failed to comply with BErequirements in nearly 15% of the cases. Products contain-ing class 2 drugs were the less compliant with BE require-ments, failing in at least 50% of cases. Moreover, once thoseformulations with a CVIntrasubject higher than predicted wereexcluded, there were non-BE products containing drugsfrom classes 1, 2 and 3.
Competing interests
All authors have been working in the Phase I Clinical TrialUnit of the Clinical Pharmacology Service at La Paz Univer-sity Hospital and the School of Medicine, Autonomous Uni-versity of Madrid, Spain.
We would like to acknowledge Dr Alfredo Garcia’s invalu-able advice and help with this study.
Author’s contributions: Elena Ramirez conceived thestudy, participated in the design of the study, conductedthe review of Phase I Clinical Trial Unit studies and theextraction of data, the performance of the statistical analy-sis, the interpretation of the results and the writing of thepaper.Olga Laosa participated in the design of the study, inthe review and interpretation of the results and the writingof the paper. Pedro Guerra participated in the review andinterpretation of the results and the writing of the paper.Blanca Duque participated in the review of Phase I ClinicalTrial Unit studies, the extraction of data, in the review of theresults and the writing of the paper. Beatriz Mosquera par-ticipated in the review of the Phase I Clinical Trial Unitstudies, the extraction of data, in the review of the resultsand the writing of the paper. Alberto M. Borobia partici-pated in the performance of the statistical analysis and inthe review of the results. Suhua H. Lei participated in the inthe performance of the statistical analysis and in thereview of the results. Antonio J. Carcas participated in theinterpretation of the results and the writing of the paper.Jesús Frias participated in the design of the study, in thereview and interpretation of the results and the writing ofthe paper.
REFERENCES
1 FDA. 21CFR320.1 PART 320 – Bioavailability andBioequivalence requirements. 2000. Revised as of April 1,2003.
2 Directive 2004/27/EC of the European Parliament and theCouncil of 31 March 2004 amending Directive 2001/83/ECon the Community code relating to medicinal products forhuman use Official Journal L – 136, 30/04/2004. 34–57.
3 U.S. Food and Drug Administration, Center for DrugEvaluation and Research. Guidance for Industry:Bioavailability and Bioequivalence Studies for OrallyAdministered Drug Products– General Considerations,Office of Training and Communications, Division ofCommunications Management, Drug Information Branch,HFD-210. Rockville MD 20857, March 2003.
4 EMEA/CPMP/EWP/1401/98. Note for guidance on theinvestigation of bioavailability and bioequivalence. EMEA,London, 26 July 2001.
5 Pan American Health Organization. Regional Office of theWorld Health Organization. Science based criteria forbioequivalence in vivo and in vitro, bio-waivers, and strategicframework for implementation. Draft. Available at:http://www.paho.org/english/ad/ths/ev/be-doct-draft-eng.pdf (last accessed 7 March 2010).
6 Amidon GL, Lennernäs H, Shah VP, Crison JR. A theoricalbasis for a biopharmaceutic drug classification: thecorrelation of in vitro drug product dissolution and in vivobioavailability. Pharm Res 1995; 12: 413–20.
7 U.S. Food and Drug Administration, Guidance for Industry.Food and Drug Administration, Rockville MD. 2000. Waiverof in vivo bioavailability and bioequivalence studies forimmediate release solid oral dosage forms based on abiopharmaceutics classification system. Available at:http://www.fda.gov/RegulatoryInformation/Guidances/default.htm (last accessed 7 March 2010).
8 EMEA/CPMP/EWP/QWP/1401/98 Rev.1/Corr*. Guideline onthe investigation of bioequivalence. London, 20 January2010. Available at: http://www.ema.europa.eu/docs/en_GB/document_library/Scientific_guideline/2010/01/WC500070039.pdf (last accessed 7 March 2010).
9 Yu LX, Amidon GL, Polli GL, Zhao H, Mehta MU, Conner DL,Shah VP, Lesko LJ, Chen ML, Lee VHL, Hussain AS.Biopharmaceutics classification system: the scientific basisfor biowaiver extensions. Pharm Res 2002; 19: 921–5.
10 Blume HH, Schug BS. The biopharmaceutics classificationsystem (BCS): class III drugs-better candidate for BA/BEwaiver? Eur J Pharm Sci 1999; 9: 117–21.
11 Polli JE, Yu LX, Cook JA, Amidon GL, Borchardt RT,Burnside BA, Burton PS, Chen ML, Conner DP, Faustino PJ,Hawi AA, Hussain AS, Joshi HN, Kwei G, Lee VHL, Lesko LJ,Lipper RA, Loper AE, Nerurkar SG, Polli JW, Sanvordeker DR,Taneja R, Uppoor RS, Vattikonda CS, Wilding I, Zhang G.Summary workshop report: biopharmaceutics classificationsystem-implementation challenges and extensionopportunities. J Pharm Sci 2004; 93: 1375–81.
12 Cheng CL, Yu LX, Lee HL, Yang CY, Lue CS, Chou CH.Biowaiver extension potential to BCS Class III highsolubility-low permeability drugs: bridging evidence formetformin immediate-release tablet. Eur J Pharm Sci 2004;22: 297–304.
13 Proposal to waive in vivo bioequivalence requirements forWHO Model List of Essential Medicines immediate-release,
Acceptability and characteristics of BEQ studies with BCS active substances
Br J Clin Pharmacol / 70:5 / 701

solid oral dosage forms. Technical Report Series, No 937,40th Report, Annex 8 of WHO Expert committee onspecifications for pharmaceutical preparations. Available at:http://whqlibdoc.who.int/trs/WHO_TRS_937_eng.pdf (lastaccessed 7 March 2010).
14 Ramirez E, Guerra P, Laosa O, Duque B, Tabares B, Lei AS,Carcas AJ, Frias J. The importance of sample size, log-meanratios, and intra-subject variability in the acceptance criteriaof bioequivalence studies. Eur J Clin Pharmacol 2008; 64:783–93.
15 Biopharmaeutics Classification System (BCS). TherapeuticSystem Research Laboratories (TSRL inc.). Available at:http://www.tsrlinc.com/services/bcs/search.cfm.
16 Takagi T, Ramadrasekharan C, Bermejo M, Yamashita S,Yu LX, Amidon LG. A provisional BiopharmaceuticalClassification of the Top 200 oral drugs products in theUnites States, Great Britain, Spain and Japan. Mol Pharm2006; 3: 631–43.
17 Hauschke D, Steinijans VW, Diletti E, Burke M. Sample sizedetermination for bioequivalence assessment using amultiplicative model. J Pharmacokinet Biopharm 1992; 20:557–61.
18 Julious SA. Tutorial in biostatistics. Statistic Med 2004; 23:1921–86.
19 Wu CY, Benet LZ. Predicting drug disposition via applicationof BCS: Transport /absorption /elimination interplay anddevelopment of a biopharmaceutics drug dispositionclassification system. Pharm Res 2005; 22: 11–23.
20 Orange Book Preface, Statistical Criteria for Bioequivalence.Approved Drug Products with Therapeutic EquivalenteEvaluations. 29th Edition. U.S. Food and Drug Administration.Center for Drug Evaluation and Research. 2009-06–18.2009. Available at: http://www.fda.gov/drugs/developmentapprovalprocess/ucm079068.htm.
E. Ramirez et al.
702 / 70:5 / Br J Clin Pharmacol