Accelerated Materials Design of Lithium Superionic Conductors Based on First-Principles Calculations...
6
© 2013 WILEY-VCH Verlag GmbH & Co. KGaA, Weinheim 980 COMMUNICATION wileyonlinelibrary.com www.MaterialsViews.com www.advenergymat.de Koji Fujimura, Atsuto Seko, Yukinori Koyama, Akihide Kuwabara, Ippei Kishida, Kazuki Shitara, Craig A. J. Fisher, Hiroki Moriwake, and Isao Tanaka* Accelerated Materials Design of Lithium Superionic Conductors Based on First-Principles Calculations and Machine Learning Algorithms K. Fujimura, [†] Dr. A. Seko, [†] Dr. Y. Koyama, K. Shitara, Prof. I. Tanaka Department of Materials Science and Engineering Kyoto University Sakyo, Kyoto 606-8501, Japan E-mail: [email protected] K. Fujimura, Dr. A. Kuwabara, Dr. C. A. J. Fisher, Dr. H. Moriwake, Prof. I. Tanaka Nanostructures Research Laboratory Japan Fine Ceramics Center Atsuta, Nagoya 456-8587, Japan Dr. I. Kishida Department of Mechanical Engineering Osaka City University Sumiyoshi, Osaka 558-8585, Japan [†] These authors contributed equally to this work. DOI: 10.1002/aenm.201300060 Concerted efforts continue to be made in the search for supe- rior lithium-ion conducting solids to replace the highly reac- tive liquid electrolytes typically used in rechargeable batteries. LISICON-type materials have been studied extensively over the last few decades, providing abundant experimental data, but to date no overall design principle for achieving high conduc- tivity has been forthcoming. In this communication we present results of systematic sets of first-principles calculations based on the cluster expansion method, as well as first-principles molecular dynamics (FPMD) simulations carried out to cal- culate Li-ion conductivities at high temperature, for a diverse range of compositions. A machine-learning technique is used to combine theoretical and experimental datasets to predict the conductivity of each composition at 373 K. The insights obtained show that an iterative combination of first-principles calculations and focused experiments can greatly accelerate the materials design process by enabling a wide compositional and structural phase space to be examined efficiently. Lithium-conducting oxides in the system LiO 1/2 - AO m/2 - BO n/2 (where m and n denote the formal valences of cations A and B, respectively), known as LISICONs and corresponding to general formula Li 8 −c A a B b O 4 (where c = ma + n b), [1] have been intensively studied since the 1970s. The original LISICON composition, Li 3.5 Zn 0.25 GeO 4 , was reported to exhibit an ionic conductivity of over 10 −1 S cm −1 at 673 K, [2] and stimulated a flurry of new research. Although the conducting properties of many different LISICONs have since been reported by various groups, there are still many compositions that have yet to be synthesized, let alone characterized. In some cases, results from different groups also vary considerably. [2–6] An Arrhenius plot of Li-ion conductivity summarizing previous experimental data is provided as Figure S1 in Supporting Information. Given the urgent need for improved energy storage and power devices, a more efficient means of designing ionic conductors based on a reproducible and systematic methodology is an imperative for future progress in this field. Thanks to astonishing improvements in computer perfor- mance and computational techniques, first-principles calcula- tions based on density functional theory (DFT) are now used routinely for quantitative analysis of ionic conduction in crys- tals. Combination of DFT calculations with high-throughput and machine-learning techniques is now also considered a viable means of searching for novel lithium battery mate- rials. [7–9] For compounds with simple chemistry and structure, the saddle point associated with an ionic jump, from which the activation barrier energy can be extracted in a straightfor- ward manner, is readily calculated. Such methods have already been applied to several Li-battery materials, e.g., LiCoO 2 , [10] LiFePO 4 , [11] TiO 2 -B, [12] and graphite. [13] The nudged elastic band (NEB) method is popular for such a purpose. [9,14–16] The effec- tive frequency term for the ionic jump used in the calculation of ion diffusivity can also be computed from first-principles if desired. [13] When it comes to compounds with more com- plicated structures, such as are typical in LISICON solid elec- trolytes, the search for saddle points along convoluted migra- tion paths, often involving complex migration mechanisms, (e.g, cooperative mechanisms [17,18] ), becomes a non-trivial task. When the compound is a solid solution composed of multiple elements, this becomes even more difficult because of the huge variety of chemical environments that migrating ions encounter. LISICON represents a sobering example of both kinds of complexity. In such cases, the first-principles molecular dynamics (FPMD) approach is an attractive alterna- tive, [11,18–20] since it does not require an a priori specification of the migration pathway or mechanism for the ionic self-diffu- sion to be probed. In the pseudobinary Li 2 ZnGeO 4 -Li 4 GeO 4 phase diagram ( Figure 1a), [21] three structures, viz, α ( l-Li 4 GeO 4 ), β and γ, are known to occur. In all three cases, the oxygen sublattice is hexagonal close packed. Both Ge and Zn ions prefer tetrahe- dral coordination, and thus occupy tetrahedral sites within the oxygen sublattice; [22] the main difference between the three polymorphs is the directions in which the [GeO 4 ] tetrahedra are orientated. [23] Some of the Li ions occupy the remaining Adv. Energy Mater. 2013, 3, 980–985
-
Upload
independent -
Category
Documents
-
view
8 -
download
0
Transcript of Accelerated Materials Design of Lithium Superionic Conductors Based on First-Principles Calculations...
980
CO
MM
UN
ICATI
ON
www.MaterialsViews.comwww.advenergymat.de
Koji Fujimura , Atsuto Seko , Yukinori Koyama , Akihide Kuwabara , Ippei Kishida , Kazuki Shitara , Craig A. J. Fisher , Hiroki Moriwake , and Isao Tanaka *
Accelerated Materials Design of Lithium Superionic Conductors Based on First-Principles Calculations and Machine Learning Algorithms
Concerted efforts continue to be made in the search for supe-rior lithium-ion conducting solids to replace the highly reac-tive liquid electrolytes typically used in rechargeable batteries. LISICON-type materials have been studied extensively over the last few decades, providing abundant experimental data, but to date no overall design principle for achieving high conduc-tivity has been forthcoming. In this communication we present results of systematic sets of fi rst-principles calculations based on the cluster expansion method, as well as fi rst-principles molecular dynamics (FPMD) simulations carried out to cal-culate Li-ion conductivities at high temperature, for a diverse range of compositions. A machine-learning technique is used to combine theoretical and experimental datasets to predict the conductivity of each composition at 373 K. The insights obtained show that an iterative combination of fi rst-principles calculations and focused experiments can greatly accelerate the materials design process by enabling a wide compositional and structural phase space to be examined effi ciently.
Lithium-conducting oxides in the system LiO 1/2 - A O m /2 - B O n /2 (where m and n denote the formal valences of cations A and B , respectively), known as LISICONs and corresponding to general formula Li 8 − c A a B b O 4 (where c = ma + n b ), [ 1 ] have been intensively studied since the 1970s. The original LISICON composition, Li 3.5 Zn 0.25 GeO 4 , was reported to exhibit an ionic conductivity of over 10 − 1 S cm − 1 at 673 K, [ 2 ] and stimulated a fl urry of new research. Although the conducting properties of many different LISICONs have since been reported by various groups, there are still many compositions that have yet to be
© 2013 WILEY-VCH Verlag Gwileyonlinelibrary.com
K. Fujimura,[†] Dr. A. Seko,[†] Dr. Y. Koyama, K. Shitara, Prof. I. Tanaka Department of Materials Science and Engineering Kyoto University Sakyo, Kyoto 606-8501, Japan E-mail: [email protected] K. Fujimura, Dr. A. Kuwabara, Dr. C. A. J. Fisher, Dr. H. Moriwake, Prof. I. Tanaka Nanostructures Research Laboratory Japan Fine Ceramics Center Atsuta, Nagoya 456-8587, Japan Dr. I. Kishida Department of Mechanical Engineering Osaka City University Sumiyoshi, Osaka 558-8585, Japan [†] These authors contributed equally to this work.
DOI: 10.1002/aenm.201300060
synthesized, let alone characterized. In some cases, results from different groups also vary considerably. [ 2–6 ] An Arrhenius plot of Li-ion conductivity summarizing previous experimental data is provided as Figure S1 in Supporting Information. Given the urgent need for improved energy storage and power devices, a more effi cient means of designing ionic conductors based on a reproducible and systematic methodology is an imperative for future progress in this fi eld.
Thanks to astonishing improvements in computer perfor-mance and computational techniques, fi rst-principles calcula-tions based on density functional theory (DFT) are now used routinely for quantitative analysis of ionic conduction in crys-tals. Combination of DFT calculations with high-throughput and machine-learning techniques is now also considered a viable means of searching for novel lithium battery mate-rials. [ 7–9 ] For compounds with simple chemistry and structure, the saddle point associated with an ionic jump, from which the activation barrier energy can be extracted in a straightfor-ward manner, is readily calculated. Such methods have already been applied to several Li-battery materials, e.g., LiCoO 2 , [ 10 ] LiFePO 4 , [ 11 ] TiO 2 -B, [ 12 ] and graphite. [ 13 ] The nudged elastic band (NEB) method is popular for such a purpose. [ 9 , 14–16 ] The effec-tive frequency term for the ionic jump used in the calculation of ion diffusivity can also be computed from fi rst-principles if desired. [ 13 ] When it comes to compounds with more com-plicated structures, such as are typical in LISICON solid elec-trolytes, the search for saddle points along convoluted migra-tion paths, often involving complex migration mechanisms, (e.g, cooperative mechanisms [ 17 , 18 ] ), becomes a non-trivial task. When the compound is a solid solution composed of multiple elements, this becomes even more diffi cult because of the huge variety of chemical environments that migrating ions encounter. LISICON represents a sobering example of both kinds of complexity. In such cases, the fi rst-principles molecular dynamics (FPMD) approach is an attractive alterna-tive, [ 11 , 18–20 ] since it does not require an a priori specifi cation of the migration pathway or mechanism for the ionic self-diffu-sion to be probed.
In the pseudobinary Li 2 ZnGeO 4 -Li 4 GeO 4 phase diagram ( Figure 1 a), [ 21 ] three structures, viz, α ( l -Li 4 GeO 4 ), β and γ , are known to occur. In all three cases, the oxygen sublattice is hexagonal close packed. Both Ge and Zn ions prefer tetrahe-dral coordination, and thus occupy tetrahedral sites within the oxygen sublattice; [ 22 ] the main difference between the three polymorphs is the directions in which the [GeO 4 ] tetrahedra are orientated. [ 23 ] Some of the Li ions occupy the remaining
mbH & Co. KGaA, Weinheim Adv. Energy Mater. 2013, 3, 980–985
CO
MM
UN
ICATIO
N
www.MaterialsViews.comwww.advenergymat.de
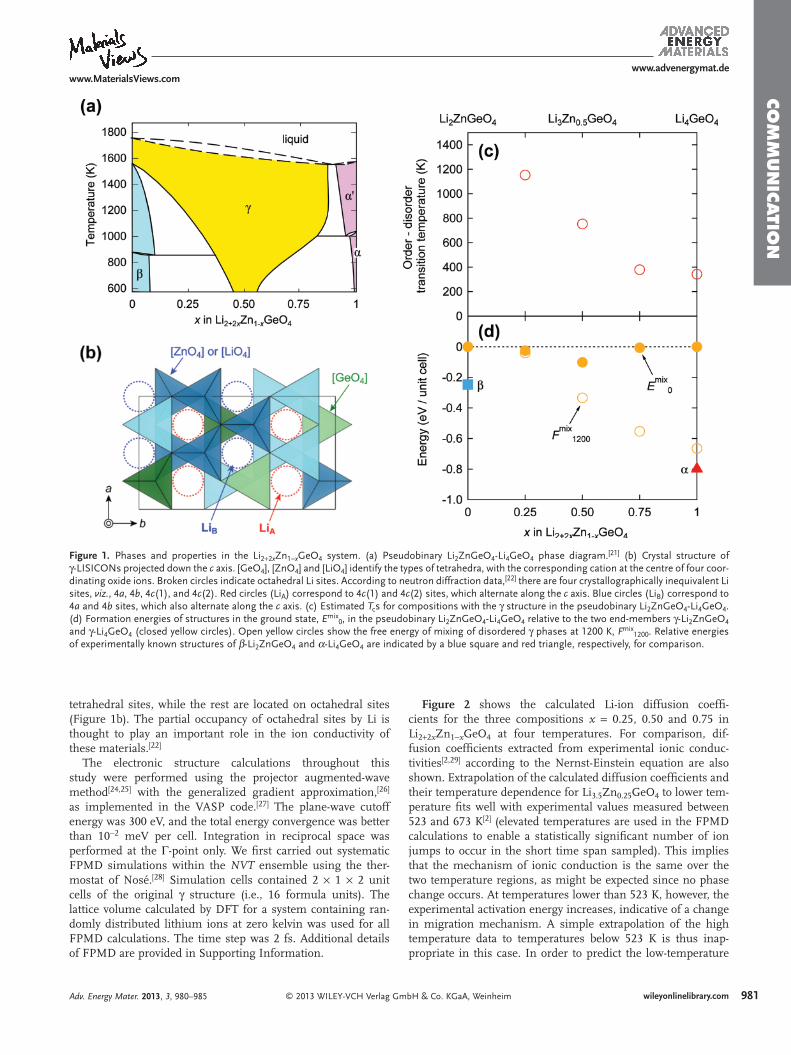
Figure 1 . Phases and properties in the Li 2 + 2 x Zn 1 − x GeO 4 system. (a) Pseudobinary Li 2 ZnGeO 4 -Li 4 GeO 4 phase diagram. [ 21 ] (b) Crystal structure of γ -LISICONs projected down the c axis. [GeO 4 ], [ZnO 4 ] and [LiO 4 ] identify the types of tetrahedra, with the corresponding cation at the centre of four coor-dinating oxide ions. Broken circles indicate octahedral Li sites. According to neutron diffraction data, [ 22 ] there are four crystallographically inequivalent Li sites, viz. , 4 a , 4 b , 4 c (1), and 4 c (2). Red circles (Li A ) correspond to 4 c (1) and 4 c (2) sites, which alternate along the c axis. Blue circles (Li B ) correspond to 4 a and 4 b sites, which also alternate along the c axis. (c) Estimated T c s for compositions with the γ structure in the pseudobinary Li 2 ZnGeO 4 -Li 4 GeO 4 . (d) Formation energies of structures in the ground state, E mix 0 , in the pseudobinary Li 2 ZnGeO 4 -Li 4 GeO 4 relative to the two end-members γ -Li 2 ZnGeO 4 and γ -Li 4 GeO 4 (closed yellow circles). Open yellow circles show the free energy of mixing of disordered γ phases at 1200 K, F mix 1200 . Relative energies of experimentally known structures of β -Li 2 ZnGeO 4 and α -Li 4 GeO 4 are indicated by a blue square and red triangle, respectively, for comparison.
tetrahedral sites, while the rest are located on octahedral sites (Figure 1 b). The partial occupancy of octahedral sites by Li is thought to play an important role in the ion conductivity of these materials. [ 22 ]
The electronic structure calculations throughout this study were performed using the projector augmented-wave method [ 24 , 25 ] with the generalized gradient approximation, [ 26 ] as implemented in the VASP code. [ 27 ] The plane-wave cutoff energy was 300 eV, and the total energy convergence was better than 10 − 2 meV per cell. Integration in reciprocal space was performed at the Γ -point only. We fi rst carried out systematic FPMD simulations within the NVT ensemble using the ther-mostat of Nosé. [ 28 ] Simulation cells contained 2 × 1 × 2 unit cells of the original γ structure (i.e., 16 formula units). The lattice volume calculated by DFT for a system containing ran-domly distributed lithium ions at zero kelvin was used for all FPMD calculations. The time step was 2 fs. Additional details of FPMD are provided in Supporting Information.
© 2013 WILEY-VCH Verlag GAdv. Energy Mater. 2013, 3, 980–985
Figure 2 shows the calculated Li-ion diffusion coeffi -cients for the three compositions x = 0.25, 0.50 and 0.75 in Li 2 + 2 x Zn 1 − x GeO 4 at four temperatures. For comparison, dif-fusion coeffi cients extracted from experimental ionic conduc-tivities [ 2 , 29 ] according to the Nernst-Einstein equation are also shown. Extrapolation of the calculated diffusion coeffi cients and their temperature dependence for Li 3.5 Zn 0.25 GeO 4 to lower tem-perature fi ts well with experimental values measured between 523 and 673 K [ 2 ] (elevated temperatures are used in the FPMD calculations to enable a statistically signifi cant number of ion jumps to occur in the short time span sampled). This implies that the mechanism of ionic conduction is the same over the two temperature regions, as might be expected since no phase change occurs. At temperatures lower than 523 K, however, the experimental activation energy increases, indicative of a change in migration mechanism. A simple extrapolation of the high temperature data to temperatures below 523 K is thus inap-propriate in this case. In order to predict the low-temperature
mbH & Co. KGaA, Weinheim 981wileyonlinelibrary.com

98
CO
MM
UN
ICATI
ON
www.MaterialsViews.comwww.advenergymat.de
Figure 2 . Arrhenius plots of calculated Li-ion diffusion coeffi cients for Li 2 + 2 x Zn 1 − x GeO 4 ( x = 0.25, 0.50 and 0.75). Blue, red and black closed cir-cles are for x = 0.25, 0.50 and 0.75, respectively. Experimental data, shown as open circles [ 2 ] and open triangles, [ 29 ] are provided for comparison. Note that the extension to lower temperatures for x = 0.50 has a slope intermediate to that of x = 0.25 and x = 0.75 and is based on the reported defl ection point of 550 K. [ 6 ]
conductivity for a wide variety of compositions, a more rigorous (or comprehensive) methodology is required. We note in this regard that FPMD has been used recently to predict Li-ion con-ductivity at high temperatures in other structure types, [ 30 ] but not the low temperature conductivity behavior.
In the case of LISICON, the defl ection point in the Arrhe-nius plot of ion conductivity has been ascribed to a phase transition. [ 5 ] However, the structural changes associated with this transition are largely unknown. Here we assume that the defl ection point corresponds to ordering and disordering of Li ions on octahedral sites, since the mechanism of Li-ion conduc-tion via octahedral sites seems to alter at this point. To check whether this is indeed the case, the phase transition tempera-ture, T c , was estimated by determining the point at which the free energies of ordered and disordered phases are equal, based on DFT calculations.
Ordered structures were investigated using a cluster-expan-sion-type method. Distributions of A and B cations were obtained by simulated annealing (SA) with a simplifi ed point-charge model. Details of the SA are provided as Supporting Information. Even when the framework cations are positioned on their experimentally determined sites, a number of different Li confi gurations can be constructed for a given stoichiom-etry. We fi rst identifi ed those ordered structures for which the energy is an extremum (maximum or minimum). [ 31 , 32 ] These structures have correlation functions with large root mean
© 2013 WILEY-VCH Verlag G2 wileyonlinelibrary.com
squares computed within the formalism of the cluster expan-sion method. The minimum energy was taken as the energy of the ground-state confi guration for a given composition. Next, the energy of a disordered structure for a given composition was estimated by averaging the energies of 20 randomly-chosen 2 × 1 × 2 supercells with different octahedral Li ion confi gu-rations. The entropy difference between ordered and disor-dered phases per octahedral site was calculated using the point approximation T Δ S = − k B T [ x ln x + (1 − x )ln (1 − x )], where k B and x are the Boltzmann constant and Li occupancy of octahe-dral sites, respectively. At the transition temperature, T c , Δ E is equal to T c Δ S , where Δ E is the difference between the energy of the disordered structure and the lowest energy of the ordered structures. The formation energy, E mix 0 , and free energy of mixing at 1200 K, F mix 1200 , are the energy of an ordered struc-ture and free energy of the disordered structure, respectively, which are calculated from the energies/free energies of end-member compositions with the γ structure.
Calculated T c s for the γ phase of four compositions in the pseudobinary Li 2 ZnGeO 4 -Li 4 GeO 4 are plotted in Figure 1 c. The estimated T c s are 1150 K for Li 2.5 Zn 0.75 GeO 4 , 750 K for Li 3 Zn 0.5 GeO 4 , and 380 K for Li 3.5 Zn 0.25 GeO 4 , indicating a remarkable decrease with decreasing Zn content. Although it is overly ambitious to expect quantitative reproduction of T c s by such a simple method, the trend is consistent with the experi-mental results in Figure 2 .
The formation energy in the ground state, E mix 0 , is a good measure of whether a chemical system will form a solid solu-tion or not. Values of E mix 0 for the pseudobinary Li 2 ZnGeO 4 -Li 4 GeO 4 system relative to those of the two end-members, γ -Li 2 ZnGeO 4 and γ -Li 4 GeO 4 , are plotted in Figure 1 d. Relative energies of experimentally known structures β -Li 2 ZnGeO 4 [ 33 ] and α -Li 4 GeO 4 [ 34 ] are also included for comparison. Formation energies of different solute confi gurations were computed for both α and β phases. We found that the confi gurations reported in References [ 33 ] and [ 34 ] correspond to the lowest energies.
The results in Figure 1 d imply a preference for phase sepa-ration of β -Li 2 ZnGeO 4 and α -Li 4 GeO 4 at low temperatures, which is consistent with the phase diagram in Figure 1 a. The free energy of mixing for the disordered γ phase at 1200 K, F mix 1200 , is also plotted in Figure 1 d. Here, only the confi gura-tion entropy of Li over octahedral sites in the γ phase is taken into account, which is zero for γ -Li 2 ZnGeO 4 , since Li ions only occupy tetrahedral sites in this case. While the tendency for the disordered γ phase to become more stable at elevated tempera-ture can be understood intuitively, a quantitative estimation of the phase diagram requires more detailed theoretical analysis, such as phonon calculations to estimate vibrational free ener-gies, and a cluster expansion technique to take into account confi guration terms, which are beyond the scope of the present study.
Since most LISICON oxides exhibiting high ionic conduc-tivity are known to have the γ structure, we performed an exten-sive set of calculations of the system γ -Li 8 − c A a B b O 4 (where c = ma + n b ) for A corresponding to divalent Zn and Mg, triva-lent Al and Ga, or pentavalent P and As, and B to tetravalent Si and Ge. Phase relationships between Li 8 − c A a B O 4 , Li 8 − c A O 4 , and Li 4 B O 4 are illustrated in the phase diagrams at the top of Figure 3 . Calculations were performed for two kinds of solid
mbH & Co. KGaA, Weinheim Adv. Energy Mater. 2013, 3, 980–985

© 2013 WILEY-VCH Verlag GmbH & Co. KGaA, Weinheim
CO
MM
UN
ICATIO
N
983wileyonlinelibrary.com
www.MaterialsViews.comwww.advenergymat.de
Figure 3 . Diffusion coeffi cients at 1600 K, D 1600 , transition temperatures, T c , formation free energies of solid solutions at 1600K, Δ F S 1600 , and average volume of disordered structures, V dis as a function of chemical composition. D 1600 was calculated from FPMD simulations, and T c , Δ F S 1600 and V dis from energy minimization calculations. The compositions are taken from tie lines 1 and 2 in the pseudobinary phase diagrams atop each plot for II-IV, III-IV and V-IV type systems. Elements A and B for each composition and their corresponding data markers are shown in the legends at the top of the V dis plots. The change in p Oct with composition is shown in the bottom panel.
Adv. Energy Mater. 2013, 3, 980–985

98
CO
MM
UN
ICATI
ON
www.MaterialsViews.comwww.advenergymat.de
Figure 4 . Predicted ionic conductivities at 373 K, σ 373 , for 72 compositions in the system Li 8 − c A a B b O 4 , where A m + = Zn, Mg, Al, Ga, P or As, and B n + = Ge or Si, and c = ma + nb . Values of σ 373 were obtained by iterative analysis of calculated datasets and experimental datasets.
solutions: the pseudobinary Li 8 − c A a B O 4 -Li 4 B O 4 (tie line 1) in which element A is substituted for Li in Li 4 B O 4 , and pseudobi-nary Li 4 B O 4 -Li 8 − c A O 4 (tie line 2), in which A is substituted for B in Li 4 B O 4 . These permutations result in three different solid solution types, which we label II-IV, III-IV and V-IV based on the valence states of the corresponding A and B ions. FPMD simulations at 1600 K were performed for a total of 92 dif-ferent compositions, and the results summarised in Figure 3 . For Li 8 − c A a B b O 4 with pentavalent A (V-IV), only Li 3 A O 4 -Li 4 B O 4 solid solutions were considered, since substitution of Li by a pentavalent ion is energetically prohibitive. In addition to the FPMD simulations to determine the diffusivity at 1600 K, D 1600 , fi rst-principles calculations were performed systematically to determine T c , the formation free energy of the solid solution at 1600 K, Δ F S 1600 , and the average volume of the disordered structures, V dis . Note that the reference states for Δ F S 1600 are those of the end-members x = 0, y = 1 and x = 1, y = 0 with the lowest energy, in contrast to those in Figure 1 d. T c , Δ F S 1600 and V dis were calculated for 72 compositions, based on the number of permutations possible given the size of the simulation cell used. The total number of fi rst-principles calculations required to estimate T c and Δ F S 1600 was 2684.
Figure 3 shows that D 1600 does not depend strongly on the choice of A and B . D 1600 appears largely independent of V dis , despite the widely held view that diffusivity increases with lattice volume. In γ -Li 8- c A a B b O 4 , the average occupancy of Li ions on octahedral sites, p Oct , can be calculated from p Oct = [(8 − c + a + b ) − 4]/4. p Oct seems to be the principal factor deter-mining the magnitude of the diffusivity for both tie line 1 and tie line 2 compositions when A is pentavalent. However, this does not appear to be the case for tie line 2 when A is divalent or trivalent.
Although high D 1600 and low T c are important factors for predicting good ionic conductivity, the DFT data alone are not yet suffi cient for estimating the ionic conductivity reliably at
© 2013 WILEY-VCH Verlag 4 wileyonlinelibrary.com
low temperatures. Assuming that the theoretical data are com-plementary to and consistent with the experimental data, we applied a machine-learning technique to use both datasets in combination to predict low-temperature conductivities of the various compositions. As experimental data we used 95 con-ductivity measurements at different temperatures, which are plotted in Figure S1 of Supporting Information. The theo-retical dataset was composed of the D 1600 , T c and V dis values reported in Figure 3 . These served as a training dataset in order to predict the ionic conductivity at 373 K, σ 373 , using the support-vector regression (SVR) method with a Gaussian kernel. [ 35 ] The logarithm of ionic conductivity σ was taken as the dependent variable. For the independent variables, D 1600 , T c , V dis and experimental temperature T were used. The signifi -cance values of the variables are given as Supporting Informa-tion. The variance of the Gaussian kernel, the regularization constant and forms of independent variables were optimized by minimizing the prediction error estimated by the bootstrap-ping method. [ 36 ] The prediction error of the optimized SVR for log σ is 0.373. Variation of bootstrapping errors as a function of the independent variables is plotted in Figure S2 of Sup-porting Information.
Figure 4 shows the predicted σ 373 for 72 compositions in which T c and V dis are available from Figure 3 . Even though the theoretical datasets do not contain information about the activa-tion energies explicitly, systems with high D 1600 and low T c tend to have high σ 373 as expected. The conductivity of compounds with low Zn content such as Li 2 + 2 x Zn 1 − x GeO 4 ( x = 0.75) with high D 1600 and low T c are greater than those with high Zn con-tent, such as Li 2 + 2 x Zn 1 − x GeO 4 ( x = 0.25), and high T c . This result explains the trend observed by experimentalists, namely that the original LISICON composition Li 3.5 Zn 0.25 GeO 4 has one of the highest Li-ion conductivities. In this study, Li 4 GeO 4 is pre-dicted to have the highest σ 373 of all 72 compounds. However, it has not yet been synthesized because it generally crystallizes
GmbH & Co. KGaA, Weinheim Adv. Energy Mater. 2013, 3, 980–985

CO
MM
UN
ICATIO
N
www.MaterialsViews.comwww.advenergymat.de
in the α structure rather than γ structure. As seen in Figure 1 d, however, the difference in F mix 1200 for Li 4 GeO 4 between α and γ is not expected to be large. If γ -Li 4 GeO 4 can be successfully synthesised, our calculations predict it to exhibit an ionic conductivity at 373 K a few times higher than LISICON Li 3.5 Zn 0.25 GeO 4 . Besides Li 4 GeO 4 , several other compounds exhibit higher σ 373 than the traditional LISICON with negative Δ F S 1600 values predicted. These are Li 4 SiO 4 , Li 2 + 2 x Zn 1 − x SiO 4 (for x = 0.5, 0.75), Li 3.5 Mg 0.25 SiO 4 , Li 3.25 Al 0.25 SiO 4 , Li 4.25 A 0.25 Si 0.75 O 4 ( A = Al or Ga), Li 3.5 A 0.5 B 0.5 O 4 ( A = P, and B = Si) and Li 3.75 A 0.25 B 0.75 O 4 ( A = P or As, and B = Ge or Si). Focused experiments based on these predictions are currently being performed.
The present study considered pseudobinary solid solutions only. However, the methodology is not limited to such systems. Materials with more complex chemistries and structures can be analysed effi ciently in the same way once a database of results of systematic fi rst-principles calculations is constructed. This method illustrates the potential for rational design of superior Li-ion conductors based on optimization of materials compo-sitions through machine-learning techniques. Our method-ology has the potential to accelerate the development of safer and more environmentally friendly energy storage and power devices.
Supporting Information Supporting Information is available from the Wiley Online Library or from the author.
Acknowledgements This study is supported by a Grant-in-Aid for Challenging Exploratory Research from MEXT, Japan.
Received: January 16, 2013Published online: April 19, 2013
[ 1 ] A. D. Robertson , A. R. West , A. G. Ritchie , Solid State Ionics 1997 , 104 , 1 .
[ 2 ] H. Y.-P. Hong , Mat. Res. Bull. 1978 , 13 , 117 . [ 3 ] U. V. Alpen , M. F. Bell , W. Wichelhaus , Electrochim. Acta 1978 , 23 ,
1395 . [ 4 ] D. Mazumdar , D. N. Bose , M. L. Mukherjee , Solid State Ionics 1984 ,
14 , 143 . [ 5 ] P. G. Bruce , A. R. West , J. Solid State Chem. 1982 , 44 , 354 . [ 6 ] P. G. Bruce , I. Abrahams , J. Solid State Chem. 1991 , 95 , 74 .
© 2013 WILEY-VCH Verlag Adv. Energy Mater. 2013, 3, 980–985
[ 7 ] T. Mueller , G. Hautier , A. Jain , G. Ceder , Chem. Mater. 2011 , 23 , 3854 .
[ 8 ] a) G. Hautier , C. Fischer , V. Ehrlacher , A. Jain , G. Ceder , Inorg. Chem. 2011 , 50 , 656 ; b) G. Hautier , A. Jain , H. Chen , C. Moore , S. P. Ong , G. Ceder , J. Mater. Chem. 2011 , 21 , 17147 .
[ 9 ] R. Jalem , T. Aoyama , M. Nakayama , M. Nogami , Chem. Mater. 2012 , 24 , 1357 .
[ 10 ] A. Van der Ven , G. Ceder , J. Power Sources 2001 , 97-98 , 529 . [ 11 ] C. Ouyang , S. Shi , Z. Wang , X. Huang , L. Chen , Phys. Rev. B 2004 ,
69 , 104303 . [ 12 ] a) D. Panduwinata , J. D. Gale , J. Mater. Chem. 2009 , 19 , 3931 ;
b) C. Arrouvel , S. C. Parker , M. S. Islam , Chem. Mater. 2009 , 21 , 4778 .
[ 13 ] K. Toyoura , Y. Koyama , A. Kuwabara , F. Oba , I. Tanaka , Phys. Rev. B 2008 , 78 , 214303 .
[ 14 ] I. Kishida , Y. Koyama , A. Kuwabara , T. Yamamoto , F. Oba , I. Tanaka , J. Phys. Chem. B 2006 , 110 , 8258 .
[ 15 ] Y. A. Du , N. A. W. Holzwarth , Phys. Rev. B 2007 , 76 , 174302 . [ 16 ] H. Moriwake , A. Kuwabara , C. A. J. Fisher , R. Huang , T. Hitosugi ,
Y. H. Ikuhara , H. Oki , Y. Ikuhara , Adv. Mater. 2013 , 25 , 618 . [ 17 ] M. Salanne , D. Marrocchelli , G. W. Watson , J. Phys. Chem. C 2012 ,
116 , 18618 . [ 18 ] M. Xu , J. Ding , E. Ma , Appl. Phys. Lett. 2012 , 101 , 031901 . [ 19 ] J. Yang , J. S. Tse , J. Phys. Chem. A 2011 , 115 , 13045 . [ 20 ] T. Ikeshoji , E. Tsuchida , T. Morishita , K. Ikeda , M. Matsuo ,
Y. Kawazoe , S. Orimo , Phys. Rev. B 2011 , 83 , 144301 . [ 21 ] P. G. Bruce , A. R. West , Mat. Res. Bull. 1980 , 15 , 379 . [ 22 ] a) I. Abrahams , P. G. Bruce , A. R. West , W. I. F. David , J. Solid State
Chem. 1988 , 75 , 390 ; b) I. Abrahams , P. G. Bruce , W. I. F. David , A. R. West , Acta Cryst. 1989 , B45 , 457 .
[ 23 ] K. Homma , M. Yonemura , T. Kobayashi , M. Nagao , M. Hirayama , R. Kanno , Solid State Ionics 2011 , 182 , 53 .
[ 24 ] P. E. Blöchl , Phys. Rev. B 1994 , 50 , 17953 . [ 25 ] G. Kresse , D. Joubert , Phys. Rev. B 1999 , 59 , 1758 . [ 26 ] J. P. Perdew , K. Burke , M. Ernzerhof , Phys. Rev. Lett. 1996 , 77 , 3865 . [ 27 ] a) G. Kresse , J. Hafner , Phys. Rev. B 1993 , 47 , 558 ; b) G. Kresse ,
J. Furthmüller , J. Phys. Rev. B 1996 , 54 , 11169 . [ 28 ] S. Nosé , J. Chem. Phys. 1984 , 81 , 511 . [ 29 ] S. Takai , K. Kurihara , K. Yoneda , S. Fujine , Y. Kawabata , T. Esaka ,
Solid State Ionics 2004 , 171 , 107 . [ 30 ] a) Y. Mo , S. P. Ong , G. Ceder , Chem. Mater. 2012 , 24 , 15 ;
b) S. P. Ong , Y. Mo , W. D. Richards , L. Miara , H. S. Lee , G. Ceder , Energy Environ. Sci. 2013 , 6 , 148 .
[ 31 ] G. L. W. Hart , Nature Mater. 2007 , 6 , 941 . [ 32 ] A. Seko , I. Tanaka , Phys. Rev. B 2011 , 83 , 224111 . [ 33 ] E. Plattner , H. Völlenkle , A. Wittmann , Monatsh. Chem. 1976 , 107 ,
921 . [ 34 ] H. Völlenkle , A. Wittmann , Naturwissensch. 1967 , 54 , 441 . [ 35 ] C.-C. Chang , C.-J. Lin , ACM Trans. Intell. Syst. Technol. 2011 , 2 , 27 . [ 36 ] B. Efron , R. J. Tibshirani , An Introduction to the Bootstrap , Chapman
& Hall , New York, NY, USA 1993 .
GmbH & Co. KGaA, Weinheim 985wileyonlinelibrary.com